Attached files
UNITED STATES
SECURITIES AND EXCHANGE COMMISSION
Washington, DC 20549
FORM 10-K
|
(X) ANNUAL REPORT PURSUANT TO SECTION 13 OR 15(d) OF THE SECURITIES EXCHANGE ACT OF 1934
|
||||
|
For the fiscal year ended December 31, 2010
|
||||
|
or
|
||||
|
( ) TRANSITION REPORT PURSUANT TO SECTION 13 or 15 (d) OF THE SECURITIES EXCHANGE ACT OF 1934
|
||||
|
For the transition period from ______ to ______
|
||||
|
Commission file number 0-23863
|
||||
|
PEOPLES FINANCIAL SERVICES CORP.
|
||||
|
(Exact name of registrant as specified in its charter)
|
||||
|
PENNSYLVANIA
|
23-2391852
|
|||
|
(State of incorporation)
|
(IRS Employer Identification No.)
|
|||
|
82 FRANKLIN AVENUE, HALLSTEAD, PA
|
18822
|
|||
|
(Address of principal executive offices)
|
(Zip code)
|
|||
|
(570) 879-2175
|
||||
|
(Registrant’s telephone number including area code)
|
||||
|
Securities registered pursuant to Section 12(b) of the Act:
|
||||
|
Title of each class
|
Name of each exchange on which registered
|
|||
|
None
|
None
|
|||
|
Securities registered pursuant to Section 12(g) of the Act:
|
||||
|
COMMON STOCK ($2 Par Value)
|
||||
|
(Title of Class)
|
||||
|
Indicate by check mark if the registrant is a well-known seasoned issuer, as defined in Rule 405 of the Securities Act. Yes __ No X
|
||||
|
Indicate by check mark if the registrant is not required to file reports pursuant to Section 13 or Section 15(d) of the Act. Yes__ No X
|
||||
|
Indicate by check mark whether the registrant (1) has filed all reports required to be filed by Section 13 or 15(d) of the Securities Exchange Act of 1934 during the preceding 12 months or for such shorter period that the registrant was required to file such reports, and (2) has been subject to such filing requirements for the past 90 days Yes X No__
|
||||
|
Indicate by check mark whether the registrant has submitted electronically and posted on its corporate Web site, if any, every Interactive Data File required to be submitted and posted pursuant to Rule 405 of Regulation S-T during the preceding 12 months or for such shorter period that the registrant was required to submit and post such files. Yes __ No__
|
||||
|
Indicate by check mark if disclosure of delinquent filers pursuant to Item 405 of Regulation S-K is not contained herein, and will not be contained, to the best of registrant’s knowledge, in definitive proxy or information statements incorporated by reference in Part III of this Form 10-K or any amendment to this Form 10-K. X
|
||||
|
Indicate by check mark whether the registrant is a large accelerated filer, an accelerated filer, a non-accelerated filer or a smaller reporting company as defined in Rule 12b-2 of the Exchange Act.
|
||||
|
Large accelerated filer ____
|
Accelerated filer X
|
Non-accelerated filer _____
|
Smaller reporting company _____
|
|
|
Indicate by check mark whether the registrant is a shell company as defined in Rule 12b-2 of the Exchange Act. Yes __ No X
|
||||
|
State the aggregate market value of the voting common stock held by non-affiliates based on the closing sale price as of the last business day of the registrant’s most recently completed second fiscal quarter: $77,307,854 at June 30, 2010.
|
||||
|
Indicate the number of shares outstanding of the registrant’s common stock, as of the latest practicable date: 3,142,106 at February 28, 2011.
|
||||
|
DOCUMENTS INCORPORATED BY REFERENCE
|
||||
|
Portions of the registrant’s Annual Report to Stockholders for the year ended December 31, 2010, are incorporated by reference in Part II of this Annual Report. Portions of the registrant’s 2011 Proxy Statement are incorporated by reference in Part III of this Annual Report.
|
||||
|
Page 1 of 87
Exhibit Index on Page 86
|
||||
TABLE OF CONTENTS
|
Page
|
|||
|
Part I
|
Number
|
||
|
Item 1
|
Business
|
3
|
|
|
Item 1A
|
Risk Factors
|
14
|
|
|
Item 1B
|
Unresolved Staff Comments
|
16
|
|
|
Item 2
|
Properties
|
16
|
|
|
Item 3
|
Legal Proceedings
|
16
|
|
|
Item 4
|
(Removed and Reserved)
|
16
|
|
|
Part II
|
|||
|
Item 5
|
Market for Registrant's Common Equity, Related Stockholder Matters and Issuer Purchases of Equity Securities
|
17
|
|
|
Item 6
|
Selected Financial Data
|
19
|
|
|
Item 7
|
Management's Discussion and Analysis of Financial Condition and Results of Operations
|
20
|
|
|
Item 7A
|
Quantitative and Qualitative Disclosures About Market Risk
|
40
|
|
|
Item 8
|
Financial Statements and Supplementary Data
|
41
|
|
|
Item 9
|
Changes In and Disagreements with Accountants on Accounting and Financial Disclosure
|
83
|
|
|
Item 9A
|
Controls and Procedures
|
83
|
|
|
Item 9B
|
Other Information
|
85
|
|
|
Part III
|
|||
|
Item 10
|
Directors, Executive Officers and Corporate Governance
|
85
|
|
|
Item 11
|
Executive Compensation
|
85
|
|
|
Item 12
|
Security Ownership of Certain Beneficial Owners and Management and Related Stockholder Matters
|
85
|
|
|
Item 13
|
Certain Relationships and Related Transactions, and Director Independence
|
85
|
|
|
Item 14
|
Principal Accountant Fees and Services
|
85
|
|
|
Part IV
|
|||
|
Item 15
|
Exhibits and Financial Statement Schedules
|
86
|
|
|
|
Signatures
|
87
|
2
PART I
ITEM 1 BUSINESS
BRIEF HISTORY
Peoples Financial Services Corp. (“PFSC” or the “Company”) was incorporated under the laws of the Commonwealth of Pennsylvania on February 6, 1986, and is a one-bank holding company headquartered in Hallstead, Pennsylvania.
The Company is engaged primarily in commercial and retail banking services and in businesses related to banking services through its subsidiaries, Peoples Neighborhood Bank (“PNB” or the “Bank”), Peoples Wealth Management LLC and Peoples Financial Capital Corporation. The Bank has two wholly-owned subsidiaries, Peoples Financial Leasing, LLC and Peoples Investment Holdings, LLC. PNB was chartered in Hallstead, Pennsylvania in 1905 under the name of The First National Bank of Hallstead. In 1965, the Hop Bottom National Bank merged with The First National Bank of Hallstead to form Peoples National Bank of Susquehanna County. In 2001, the Bank changed its name to Peoples National Bank. Effective December 13, 2010, Peoples National Bank converted its charter to a state non-member bank and changed its name to Peoples Neighborhood Bank. Peoples Wealth Management LLC was formed in 2006 as a member-managed limited liability company for the purpose of providing investment advisory services to the general public. Peoples Financial Leasing, LLC, formed in 2007, provides employee leasing services to the Bank. Formed in 2007, Peoples Investment Holdings, LLC, and Peoples Financial Capital Corporation manage intangible investments and collect and distribute income from such investments or from tangible investments located outside of Delaware.
As of December 31, 2010, the Company had 124 full-time equivalent employees. The Company and PNB are not parties to any collective bargaining agreement and employee relations are considered to be good.
OPERATING SEGMENTS
Peoples Financial Leasing, LLC; Peoples Investment Holdings, LLC; Peoples Wealth Management, LLC and Peoples Financial Capital Corporation did not meet the quantitative thresholds for required segment disclosure in conformity with accounting principles generally accepted in the United States of America (“GAAP”). The Bank’s eleven community banking offices, all similar with respect to economic characteristics, share a majority of the following aggregation criteria: (i) products and services; (ii) operating processes; (iii) customer bases; (iv) delivery systems; and (v) regulatory oversight. Accordingly, they were aggregated into a single operating segment.
CONCENTRATION
Payment risk is a function of the economic climate in which the Bank’s lending activities are conducted. Economic downturns in the economy generally or in a particular sector could cause cash flow problems for customers and make loan payments more difficult. The Bank attempts to minimize this risk by not being dependent on deposits or exposed by loan concentrations to a single customer or to a group of customers, the loss of any one or more of whom would have a materially adverse effect on our financial condition.
SUPERVISION AND REGULATION
The Company and its subsidiaries are extensively regulated under federal and state law. Generally, these laws and regulations are intended to protect depositors, not shareholders. The following is a summary description of certain provisions of law that affect the regulation of bank holding companies and banks. This discussion is qualified in its entirety by reference to applicable laws and regulations. Changes in law and regulation may have a material effect on the business and prospects of the Company.
The Company is a bank holding company within the meaning of the Bank Holding Company Act of 1956, as amended, and is subject to regulation, supervision, and examination by the Federal Reserve Board (“FRB”). The Company is required to file annual and quarterly reports with the FRB and to provide the FRB with such additional information as the FRB may require. The FRB also conducts examinations of the Company.
With certain limited exceptions, the Company is required to obtain prior approval from the FRB before acquiring direct or indirect ownership or control of more than 5% of any voting securities or substantially all of the assets of a bank or bank holding company, or before merging or consolidating with another bank holding company. Additionally, with certain exceptions, any person or entity proposing to acquire control through direct or indirect ownership of 25% or more of any voting securities of the Company is required to give 60 days written notice of the acquisition to the FRB, which may prohibit the transaction, and to publish notice to the public.
3
The Company’s banking subsidiary is regulated by the Pennsylvania State Department of Banking (‘the State”) and the Federal Deposit Insurance Corporation (“FDIC”). The State may prohibit an institution over which it has supervisory authority from engaging in activities or investments that the agency believes constitute unsafe or unsound banking practices. Federal banking regulators have extensive enforcement authority over the institutions they regulate to prohibit or correct activities that violate law, regulation or a regulatory agreement or which are deemed to constitute unsafe or unsound practices.
Enforcement actions may include:
|
·
|
the appointment of a conservator or receiver;
|
|
·
|
the issuance of a cease and desist order;
|
|
·
|
the termination of deposit insurance, the imposition of civil money penalties on the institution, its directors, officers, employees and institution affiliated parties;
|
|
·
|
the issuance of directives to increase capital;
|
|
·
|
the issuance of formal and informal agreements;
|
|
·
|
the removal of or restrictions on directors, officers, employees and institution-affiliated parties; and
|
|
·
|
the enforcement of any such mechanisms through restraining orders or any other court actions.
|
PNB is subject to certain restrictions on extensions of credit to executive officers, directors, principal shareholders or any related interests of such persons which generally require that such credit extensions be made on substantially the same terms as are available to third persons dealing with PNB and not involving more than the normal risk of repayment. Other laws tie the maximum amount that may be loaned to any one customer and its related interests to capital levels of the Bank.
Limitations on Dividends and Other Payments
The Company’s current ability to pay dividends is largely dependent upon the receipt of dividends from its banking subsidiary, PNB. Both federal and state laws impose restrictions on the ability of the Company to pay dividends. The FRB has issued a policy statement that provides that, as a general matter, insured banks and bank holding companies may pay dividends only out of prior operating earnings. According to regulation, PNB’s ability to pay dividends in any calendar year is restricted to the total of its current year’s net profits and the net profits of the last two years. In addition to these specific restrictions, bank regulatory agencies, in general, also have the ability to prohibit proposed dividends by a financial institution that would otherwise be permitted under applicable regulations if the regulatory body determines that such distribution would constitute an unsafe or unsound practice.
Permitted Non-Banking Activities
Generally, a bank holding company may not engage in any activities other than banking, managing, or controlling its bank and other authorized subsidiaries, and providing service to those subsidiaries. With prior approval of the FRB, the Company may acquire more than 5% of the assets or outstanding shares of a company engaging in non-bank activities determined by the FRB to be closely related to the business of banking or of managing or controlling banks. The FRB provides expedited procedures for expansion into approved categories of non-bank activities.
Subsidiary banks of a bank holding company are subject to certain quantitative and qualitative restrictions:
|
·
|
on extensions of credit to the bank holding company or its subsidiaries;
|
|
·
|
on investments in their securities; and
|
|
·
|
on the use of their securities as collateral for loans to any borrower.
|
These regulations and restrictions may limit the Company’s ability to obtain funds from PNB for its cash needs, including funds for the payment of dividends, interest and operating expenses. Further, subject to certain exceptions, a bank holding company and its subsidiaries are prohibited from engaging in certain tie-in arrangements in connection with any extension of credit, lease or sale of property or furnishing of services. For example, PNB may not generally require a customer to obtain other services from itself or the Company, and may not require that a customer promise not to obtain other services from a competitor as a condition to an extension of credit to the customer.
4
Under FRB policy, a bank holding company is expected to act as a source of financial strength to its subsidiary banks and to make capital injections into a troubled subsidiary bank, and the FRB may charge the bank holding company with engaging in unsafe and unsound practices for failure to commit resources to a subsidiary bank when required. A required capital injection may be called for at a time when the holding company does not have the resources to provide it. In addition, depository institutions insured by the FDIC can be held liable for any losses incurred by, or reasonably anticipated to be incurred by, the FDIC in connection with the default of or assistance provided to, a commonly controlled FDIC-insured depository institution. Accordingly, in the event that any insured subsidiary of the company causes a loss to the FDIC, other insured subsidiaries of the company could be required to compensate the FDIC by reimbursing it for the estimated amount of such loss. Such cross guarantee liabilities generally are superior in priority to the obligation of the depository institutions to its stockholders due solely to their status as stockholders and obligations to other affiliates.
Pennsylvania Law
As a Pennsylvania bank holding company, the Company is subject to various restrictions on its activities as set forth in Pennsylvania law. This is in addition to those restrictions set forth in federal law. Under Pennsylvania law, a bank holding company that desires to acquire a bank or bank holding company that has its principal place of business in Pennsylvania must obtain permission from the Pennsylvania Department of Banking.
Interstate Banking Legislation
The Riegle-Neal Interstate Banking and Branching Efficiency Act of 1994 provides that, among other things, substantially all state law barriers to the acquisition of banks by out-of-state bank holding companies were eliminated. The law also permits interstate branching by banks, subject to the ability of states to opt-out completely or to set an earlier effective date.
Financial Institution Reform, Recovery, and Enforcement Act (“FIRREA”)
FIRREA was enacted into law in order to address the financial condition of the Federal Savings and Loan Insurance Corporation, to restructure the regulation of the thrift industry, and to enhance the supervisory and enforcement powers of the federal bank and thrift regulatory agencies. As the primary federal regulator of the Bank, the FDIC, in conjunction with the State is responsible for the supervision of the Bank. When dealing with capital requirements, those regulatory bodies have the flexibility to impose supervisory agreements on institutions that fail to comply with regulatory requirements. The imposition of a capital plan, termination of deposit insurance, and removal or temporary suspension of an officer, director or other institution-affiliated person may cause enforcement actions.
There are three levels of civil penalties under FIRREA.
|
·
|
The first tier provides for civil penalties of up to $5 thousand per day for any violation of law or regulation.
|
|
·
|
The second tier provides for civil penalties of up to $25 thousand per day if more than a minimal loss or a pattern is involved.
|
|
·
|
Finally, civil penalties of up to $1 million per day may be assessed for knowingly or recklessly causing a substantial loss to an institution or taking action that results in a substantial pecuniary gain or other benefit.
|
Criminal penalties are increased to $1 million per violation and may be up to $5 million for continuing violations or for the actual amount of gain or loss. These penalties may be combined with prison sentences of up to five years.
Federal Deposit Insurance Corporation Improvement Act of 1991 (“FDICIA”)
FDICIA provides for, among other things:
|
·
|
publicly available annual financial condition and management reports for financial institutions, including audits by independent accountants;
|
|
·
|
the establishment of uniform accounting standards by federal banking agencies;
|
|
·
|
the establishment of a “prompt corrective action” system of regulatory supervision and intervention, based on capitalization levels, with more scrutiny and restrictions placed on depository institutions with lower levels of capital;
|
|
·
|
additional grounds for the appointment of a conservator or receiver; and
|
|
·
|
restrictions or prohibitions on accepting brokered deposits, except for institutions which significantly exceed minimum capital requirements.
|
FDICIA also provides for increased funding of the FDIC insurance funds and the implementation of risk-based premiums.
5
A central feature of FDICIA is the requirement that the federal banking agencies take “prompt corrective action” with respect to depository institutions that do not meet minimum capital requirements. Pursuant to FDICIA, the federal bank regulatory authorities have adopted regulations setting forth a five-tiered system for measuring the capital adequacy of the depository institutions that they supervise. Under these regulations, a depository institution is classified in one of the following capital categories:
|
·
|
"well capitalized";
|
|
·
|
"adequately capitalized";
|
|
·
|
"under capitalized";
|
|
·
|
"significantly undercapitalized"; and
|
|
·
|
"critically undercapitalized".
|
PNB was categorized as “well capitalized” under the regulatory framework for prompt corrective action at December 31, 2010, based on the most recent notification from the FDIC. An institution may be deemed by the regulators to be in a capitalization category that is lower than is indicated by its actual capital position if, among other things, it receives an unsatisfactory examination rating with respect to asset quality, management, earnings or liquidity.
FDICIA generally prohibits a depository institution from making any capital distribution including payment of a cash dividend or paying any management fees to its holding company, if the depository institution would thereafter be undercapitalized. Undercapitalized depository institutions are subject to growth limitations and are required to submit capital restoration plans. If a depository fails to submit an acceptable plan, it is treated as if it is “significantly undercapitalized”. Significantly undercapitalized depository institutions may be subject to a number of other requirements and restrictions, including orders to sell sufficient voting stock to become adequately capitalized, requirements to reduce total assets and stop accepting deposits from correspondent banks. Critically undercapitalized institutions are subject to the appointment of a receiver or conservator; generally within 90 days of the date such institution is determined to be critically under capitalized.
FDICIA provides the federal banking agencies with significantly expanded powers to take enforcement action against institutions that fail to comply with capital or other standards. Such actions may include the termination of deposit insurance by the FDIC or the appointment of a receiver or conservator for the institution. FDICIA also limits the circumstances under which the FDIC is permitted to provide financial assistance to an insured institution before appointment of a conservator or receiver.
Under FDICIA, each federal banking agency is required to prescribe, by regulation, non-capital safety and soundness standards for institutions under its authority. The federal banking agencies, including the FDIC, have adopted standards covering:
|
·
|
internal controls;
|
|
·
|
information systems and internal audit systems;
|
|
·
|
loan documentation;
|
|
·
|
credit underwriting;
|
|
·
|
interest rate exposure;
|
|
·
|
asset growth; and
|
|
·
|
compensation fees and benefits.
|
Any institution that fails to meet these standards may be required by the agency to develop a plan acceptable to the agency, specifying the steps that the institutions will take to meet the standards. Failure to submit or implement such a plan may subject the institution to regulatory sanctions. The Company, on behalf of PNB, believes that it meets substantially all the standards that have been adopted. FDICIA also imposed new capital standards on insured depository institutions. Before establishing new branch offices, PNB must meet certain minimum capital stock and surplus requirements and must obtain State approval.
Risk-Based Capital Requirements
The federal banking regulators have adopted certain risk-based capital guidelines to assist in the assessment of the capital adequacy of a banking organization’s operations for both transactions reported on the balance sheet as assets and transactions, such as letters of credit, and recourse agreements, which are recorded as off-balance-sheet items. Under these guidelines, nominal dollar amounts of assets and credit-equivalent amounts of off-balance-sheet items are multiplied by one of several risk adjustment percentages, which range from 0% for assets with low credit risk, such as certain US Treasury securities, to 100% for assets with relatively high credit risk, such as business loans.
6
A banking organization’s risk-based capital ratios are obtained by dividing its qualifying capital by its total risk adjusted assets. The regulators measure risk-adjusted assets, which include off-balance-sheet items, against both total qualifying capital the sum of Tier 1 capital and limited amounts of Tier 2 capital, and Tier 1 capital.
|
·
|
"Tier 1", or core capital, includes common equity, perpetual preferred stock and minority interest in equity accounts of consolidated subsidiaries, less goodwill and other intangibles, subject to certain exceptions.
|
|
·
|
"Tier 2", or supplementary capital, includes, among other things, limited life preferred stock, hybrid capital instruments, mandatory convertible securities, qualifying subordinated debt, and the allowance for loan and lease losses, subject to certain limitations and less restricted deductions. The inclusion of elements of Tier 2 capital is subject to certain other requirements and limitations of the federal banking agencies.
|
Banks and bank holding companies subject to the risk-based capital guidelines are required to maintain a ratio of Tier 1 capital to risk-weighted assets of at least 4% and a ratio of total capital to risk-weighted assets of at least 8%. The appropriate regulatory authority may set higher capital requirements when particular circumstances warrant. As of December 31, 2010, PFSC’s ratio of Tier 1 capital to risk-weighted assets stood at 11.72% and its ratio of total capital to risk-weighted assets stood at 12.68%. In addition to risk-based capital, banks and bank holding companies are required to maintain a minimum amount of Tier 1 capital to total assets, referred to as the leverage capital ratio, of at least 4.00%. As of December 31, 2010, the Company’s leverage-capital ratio was 9.19%.
Failure to meet applicable capital guidelines could subject a banking organization to a variety of enforcement actions including:
|
·
|
limitations on its ability to pay dividends;
|
|
·
|
the issuance by the applicable regulatory authority of a capital directive to increase capital, and in the case of depository institutions, the termination of deposit insurance by the FDIC, as well as to the measures described under FDICIA as applicable to under capitalized institutions.
|
In addition, future changes in regulations or practices could further reduce the amount of capital recognized for purposes of capital adequacy. Such a change could affect the ability of PNB to grow and could restrict the amount of profits, if any, available for the payment of dividends to the Company.
Interest Rate Risk
Regulatory agencies include, in their evaluations of a bank’s capital adequacy, an assessment of the bank’s interest rate risk (“IRR”) exposure. The standards for measuring the adequacy and effectiveness of a banking organization’s IRR management includes a measurement of Board of Directors and senior management oversight, and a determination of whether a banking organization’s procedures for comprehensive risk management are appropriate to the circumstances of the specific banking organization. PNB has internal IRR models that are used to measure and monitor IRR. In addition, PNB utilizes an independent consultant to provide a quarterly assessment of its IRR. Finally, regulatory agencies, as part of the scope of their periodic examinations, evaluate the IRR of PNB. For these reasons, the Company does not expect the IRR evaluation in the agencies’ capital guidelines to result in significant changes in capital requirements for PNB.
FDIC Insurance Assessments
As a FDIC member institution, PNB’s deposits are insured to a maximum of $250 thousand per depositor through the Bank Insurance Fund (“BIF”) that is administered by the FDIC and each institution is required to pay semi-annual deposit insurance premium assessments to the FDIC. The Deposit Insurance Funds Act of 1996 recapitalized the Savings Association Insurance Fund (“SAIF”) and provided that BIF deposits would be subject to one-fifth of the assessment to which SAIF deposits are subject for FICO bond payments. Beginning in 2000, BIF deposits and SAIF deposits were subject to the same assessment for FICO bonds. The FICO assessment for PNB for 2010 was $0.0104 for each $100 of BIF deposits.
The FDIC adopted a risk-based deposit insurance assessment system that requires all FDIC-insured institutions to pay quarterly premiums beginning in 2007. Annual premiums range from 12 and 14 basis points of deposits for well-capitalized banks with the highest examination ratings to 50 basis points for undercapitalized institutions. The Bank pays an insurance premium at levels stated for well-capitalized banks. The FDIC assessment for PNB for 2010 was $0.14 for each $100 of BIF deposits.
7
Entering 2011, the Company anticipates deposit insurance premiums of 10 and 14 basis points. The FDIC has also established a program under which it fully guarantees all non-interest bearing transaction accounts in excess of $250 thousand (“TLGP”) and senior unsecured debt of a bank or its holding company. The Bank elected to opt out of the debt guarantee program but opted into the deposit guarantee program. The additional premium paid in 2010 under the TLGP was $.0015 for each $100 of transaction account deposits in excess of $250 thousand.
On November 12, 2009, the FDIC adopted a final rule that required all insured depository institutions to prepay their estimated quarterly risk-based assessments for the fourth quarter of 2009 and for all of 2010, 2011 and 2012. The FDIC also adopted a uniform increase in assessment rates of $0.03 per $100 of assessable deposits effective on January 1, 2011. In 2009, PNB paid $2.2 million in prepaid deposit insurance assessments.
Community Reinvestment Act
The Community Reinvestment Act of 1977, (“CRA”) is designed to create a system for bank regulatory agencies to evaluate a depository institution’s record in meeting the credit needs of its community. The CRA regulations were completely revised as of July 1, 1995, to establish performance-based standards for use in examining for compliance. The Bank had its last CRA compliance examination in 2008 and received a “satisfactory” rating.
Monetary Policy
The earnings of a bank holding company are affected by the policies of regulatory authorities, including the FRB, in connection with the FRB’s regulation of the money supply. Various methods employed by the FRB are:
|
·
|
open market operations in United States Government securities;
|
|
·
|
changes in the discount rate on member bank borrowings; and
|
|
·
|
changes in reserve requirements against member bank deposits.
|
These methods are used in varying combinations to influence overall growth and distribution of bank loans, investments, and deposits, and their use may also affect interest rates charged on loans or paid on deposits. The monetary policies of the FRB have had a significant effect on the operating results of commercial banks in the past and are expected to do so in the future.
RECENT LEGISLATION
USA Patriot Act of 2001
The Patriot Act contains anti-money laundering and financial transparency laws and imposes various regulations, including standards for verifying client identification at account opening, and rules to promote cooperation among financial institutions, regulators and law enforcement entities in identifying parties that may be involved in terrorism or money laundering.
Financial Services Modernization Legislation
The Gramm-Leach-Bliley Act of 1999, or the GLB, repeals provisions of the Glass-Steagall Act which restricted the affiliation of Federal Reserve member banks with firms “engaged principally” in specified securities activities, and which restricted officer, director or employee interlocks between a member bank and any company or person “primarily engaged” in specified securities activities.
The GLB also permits banks to engage in expanded activities through the formation of financial subsidiaries. A bank may have a subsidiary engaged in any activity authorized for banks directly or any financial activity, except for insurance underwriting, insurance investments, real estate investment or development, or merchant banking, which may only be conducted through a subsidiary of a financial holding company. Financial activities include all activities permitted under new sections of the Bank Holding Company Act or permitted by regulation.
To the extent that the GLB permits banks, securities firms and insurance companies to affiliate, the financial services industry may experience further consolidation. The GLB is intended to grant to community banks certain powers as a matter of right that larger institutions have accumulated on an ad hoc basis and which unitary savings and loan holding companies already possess. Nevertheless, the GLB may have the result of increasing the amount of competition that the Company faces from larger institutions and other types of companies offering financial products, many of which may have substantially more financial resources.
Sarbanes-Oxley Act of 2002
The goals of the Sarbanes-Oxley Act (“SOX”) are to increase corporate responsibility, to provide for enhanced penalties for accounting and auditing improprieties at publicly traded companies and to protect investors by improving the accuracy and reliability of corporate disclosures pursuant to the securities laws.
8
The SOX generally applies to all companies, both U.S. and non-U.S., that file or are required to file periodic reports with the Securities and Exchange Commission (the “SEC”) under the Securities Exchange Act of 1934, or the Exchange Act. The legislation includes provisions, among other things, governing the services that can be provided by a public company’s independent auditors and the procedures for approving such services, requiring the chief executive officer and principal accounting officer to certify certain matters relating to the company’s periodic filings under the Exchange Act, requiring expedited filings of reports by insiders of their securities transactions and containing other provisions relating to insider conflicts of interest, increasing disclosure requirements relating to critical financial accounting policies and their application, increasing penalties for securities law violations, and creating a new public accounting oversight board, a regulatory body subject to SEC jurisdiction with broad powers to set auditing, quality control and ethics standards for accounting firms.
Regulation W
Transactions between a bank and its “affiliates” are quantitatively and qualitatively restricted under the Federal Reserve Act. The Federal Deposit Insurance Act applies Sections 23A and 23B to insured nonmember banks in the same manner and to the same extent as if they were members of the Federal Reserve System. The Federal Reserve Board has also recently issued Regulation W, which co-defies prior regulations under Sections 23A and 23B of the Federal Reserve Act and interpretative guidance with respect to affiliate transactions. Regulation W incorporates the exemption from the affiliate transaction rules but expands the exemption to cover the purchase of any type of loan or extension of credit from an affiliate. Affiliates of a bank include, among other entities, the bank’s holding company and companies that are under common control with the bank. The Company is considered to be an affiliate of the Bank. In general, subject to certain specified exemptions, a bank or its subsidiaries are limited in their ability to engage in “covered transactions” with affiliates:
|
·
|
to an amount equal to 10% of the bank's capital and surplus, in the case of covered transactions with any one affiliate; and
|
|
·
|
to an amount equal to 20% of the bank's capital and surplus, in the case of covered transactions with all affiliates.
|
In addition, a bank and its subsidiaries may engage in covered transactions and other specified transactions only on terms and under circumstances that are substantially the same, or at least as favorable to the bank or its subsidiary, as those prevailing at the time for comparable transactions with nonaffiliated companies. A “covered transaction” includes:
|
·
|
a loan or extension of credit to an affiliate;
|
|
·
|
a purchase of, or an investment in, securities issued by an affiliate;
|
|
·
|
a purchase of assets from an affiliate, with some exceptions;
|
|
·
|
the acceptance of securities issued by an affiliate as collateral for a loan or extension of credit to any party; and
|
|
·
|
the issuance of a guarantee, acceptance or letter of credit on behalf of an affiliate.
|
Regulation W generally excludes all non-bank and non-savings association subsidiaries of banks from treatment as affiliates, except to the extent that the Federal Reserve Board decides to treat these subsidiaries as affiliates.
Concurrently with the adoption of Regulation W, the Federal Reserve Board has proposed a regulation which would further limit the amount of loans that could be purchased by a bank from an affiliate to not more than 100% of the bank’s capital and surplus.
Mortgage Lending Acts
On February 18, 2009, the Federal Government implemented the Homeowner Affordability and Stability Plan (“HASP”), a $75.0 billion federal program intended to support recovery in the housing market and ensure that eligible homeowners are able to continue to fulfill their mortgage obligations. HASP includes the following initiatives:
|
•
|
A refinance option for homeowners that are current in their mortgage payments and whose mortgages are owned by the Federal National Mortgage Association (“FNMA”) or the Federal Home Loan Mortgage Corporation (“FHLMC”);
|
|
•
|
A homeowner stability initiative to prevent foreclosures and help eligible borrowers stay in their homes by offering loan modifications that reduce mortgage payments to more sustainable levels; and
|
|
•
|
An increase in U.S. Treasury funding to FNMA and FHLMC to allow them to lower mortgage rates.
|
HASP also offers monetary incentives to mortgage servicers and mortgage holders for certain modifications of at-risk loans and would establish an insurance fund designed to reduce foreclosures.
9
Credit Card Reform
On May 22, 2009, President Obama signed into law The Credit Card Accountability, Responsibility, and Disclosure Act of 2009 (the “Credit Card Act”). The Credit Card Act is comprehensive credit card legislation that aims to establish fair and transparent practices relating to open end consumer credit plans. The first phase of the legislation began in August 2009, under which the payment period with no late fees was extended from 14 to 21 days, the advance warning period for significant changes to credit card accounts was extended from 15 to 45 days, and opt-out provisions were made available to customers. A second phase began in February 2010, which includes provisions governing when rate increases can be applied on late accounts, requirements for clearer disclosures of terms before opening an account, prohibitions on charging over-limit fees and double-cycle billing, and various other restrictions. Additional rules became effective in July 2010, which deal with interest rate reinstatements on former overdue accounts, gift card expiration dates and inactivity fees.
Overdraft Fee Regulation
On November 12, 2009, the Federal Reserve Board issued a final rule amending Regulation E, Electronic Funds Transfers. According to the final rule, beginning July 1, 2010, banks may not charge fees for paying overdrafts on ATM and debit card transactions unless the customer gives consent, or opts in, to the payment of overdrafts for these transactions. Additional federal legislation has been introduced which would limit the number and amount of overdraft fees which banks can charge, prohibit ordering the posting transactions to cause customers to incur higher fees, prohibit insufficient funds fees on ATM or debit card transactions and require banks to provide a customer notice and opportunity to cancel transactions that would trigger an overdraft.
MARKET AREAS
PNB’s principal market area comprises Susquehanna, Wyoming and Lackawanna Counties of northeastern Pennsylvania and Broome County in the southern tier of New York. In addition, parts of Wayne and Bradford Counties in Pennsylvania that border Susquehanna and Wyoming Counties are also considered part of the PNB market area.
Specifically, PNB’s market area is situated between:
|
·
|
the city of Binghamton, Broome County, New York, located to the north;
|
|
·
|
the city of Scranton, Lackawanna County, Pennsylvania, to the south; and
|
|
·
|
Wilkes-Barre, Luzerne County, Pennsylvania, to the southwest.
|
Susquehanna County could best be described as a bedroom county with a high percentage of its residents commuting to work in Broome County, New York, or Lackawanna County, Pennsylvania. The southern part of Susquehanna County tends to gravitate south for both employment and shopping, while the northern part of the county goes north to Broome County, New York. The western part of Susquehanna County gravitates south and west to and through Wyoming County. Wyoming County is home to a Proctor & Gamble manufacturing facility. This is an economic stimulus to Wyoming County and the surrounding areas.
The majority of our offices are located in counties that would be considered sparsely populated, as they are made up of many small towns and villages. The latest population figures show Susquehanna County at approximately 42,000 and Wyoming County at approximately 28,000 residents. Neither county is experiencing growth. Broome County has approximately 201,000. The economy of Broome County has lost many manufacturing jobs in the past twenty to twenty-five years. Fortunately, the new employment centers are in the Town of Conklin and the neighboring Town of Kirkwood, which border Susquehanna County, Pennsylvania. Lackawanna County has approximately 213,000 residents. Interstate 81 runs north and south through the eastern half of Susquehanna County and has brought an influx of people from New Jersey and the Philadelphia area. These people have purchased homes and land to build homes that are used as vacation/recreation retreats and, quite often, become retirement homes.
BUSINESS
Lending Activities
PNB provides a full range of retail and commercial banking services designed to meet the borrowing and depository needs of small and medium sized businesses and consumers in its market areas. A significant amount of PNB’s loans are to customers located within its service areas. PNB has no foreign loans or highly leveraged transaction loans, as defined by the FRB. Although PNB participates in loans originated by other banks, the majority of loans in PNB’s portfolio have been originated by PNB. Policies adopted by the Board of Directors are the basis by which PNB conducts its lending activities. These loan policies grant lending officers authority to make secured and unsecured loans up to their individual lending limits designated by the Board of Directors. Larger loans must be approved by senior officers or by the Board of Directors. PNB’s management information systems and loan review policies are designed to monitor lending to ensure adherence to PNB’s loan policies.
10
The commercial loans offered by PNB include:
|
·
|
commercial real estate loans;
|
|
·
|
working capital;
|
|
·
|
equipment and other commercial loans;
|
|
·
|
construction loans;
|
|
·
|
SBA guaranteed loans; and
|
|
·
|
agricultural loans.
|
PNB’s commercial real estate loans provide financing for retail operations, manufacturing operations, farming operations, multi-family housing units, and churches. These types of loans are generally written for a term of 15 years or less or amortized over a longer period with balloon payments at shorter intervals. Personal guarantees are obtained on nearly all commercial loans. Credit analysis, loan review, and an effective collections process are also used to minimize any potential losses. PNB employs four full-time commercial lending officers. These four people are augmented by branch managers who are authorized to make smaller, less complex, commercial loans.
Payment risk is a function of the economic climate in which PNB’s lending activities are conducted. Economic downturns, in general, or in a particular sector could cause cash flow problems for customers and make loan payments more difficult. PNB attempts to minimize this risk by avoiding concentrations of credit to a single borrower or borrowers in a particular industry. IRR would occur if PNB were to make loans at fixed rates in an environment in which rates were subject to rise thereby preventing PNB from making loans at higher prevailing rates. PNB attempts to mitigate this risk by making adjustable rate commercial loans and by limiting repricing terms to five years or less for customers requiring fixed rate loans. Finally, collateral risk can occur if PNB’s position in collateral taken as security for loan repayment is not adequate. PNB attempts to minimize collateral risk by avoiding loan concentrations to particular borrowers, by perfecting liens on collateral and by obtaining appraisals on property prior to extending loans.
Consumer loans offered by PNB include:
|
·
|
residential real estate loans;
|
|
·
|
automobile loans;
|
|
·
|
manufactured housing loans;
|
|
·
|
personal installment loans secured and unsecured for almost any purpose;
|
|
·
|
student loans;
|
|
·
|
home equity loans, including fixed-rate term and open ended revolving lines of credit; and
|
|
·
|
credit cards.
|
Risks applicable to consumer lending are similar to those applicable to commercial lending. PNB attempts to mitigate payment risk in consumer lending by limiting consumer lending products to a term of five years or less. PNB attempts to mitigate risks associated with extending unsecured loans through obtaining credit checks and borrower history in all transactions.
Residential mortgage products include adjustable rate as well as conventional fixed rate loans. Terms vary from 1, 5, and 10-year adjustable rate loans to 5, 10, 15, 20, and 30-year fully amortized fixed rate loans. Bi-weekly payment plans are also available. Personal secured and unsecured revolving lines of credit with variable interest rates are offered to credit-worthy customers. The largest segment of PNB’s installment loan portfolio is fixed-rate loans. Most are secured either by automobiles, motorcycles, snowmobiles, boats, other personal property, or by liens filed against real estate. These loans are generally available in terms of up to 15 years. Home equity products include both fixed rate term products and adjustable rate open-end revolving line of credit. The maximum loan-to-value ratio is 80% for home equity loans. A special MGIC program now offered through the Bank, allows for loans of up to 95% of the appreciated value for qualified applicants. Credit checks, credit scoring, and debt-to-income ratios within preset parameters are used to qualify borrowers.
Mortgage loans have historically had a longer average life than commercial or consumer loans. Accordingly, payment and interest rate risks are greater in some respects with mortgage loans than with commercial or consumer lending. Deposits, which are used as the primary source to fund mortgage lending, tend to be of shorter duration than the average maturities on residential mortgage loans and are more susceptible to interest rate changes. Historical records indicate that our mortgage loans, no matter what maturity, have an average life of less than seven years. The Bank sells mortgages in the secondary market. Mortgage lending is also subject to economic downturns, in that increases in unemployment could adversely affect the ability of borrowers to repay mortgage loans and decreases in property values could affect the value of the real estate serving as collateral for the loan.
11
Industry standard debt-to-income ratios and credit checks are used to qualify borrowers on all consumer loans. Managers, assistant managers, and customer service officers have retail lending authorities at each of the full-service branch office locations. PNB has centralized loan administration at its operations/administrative offices where mortgage underwriting and loan review and analysis take place.
Loan Approval
Individual loan authorities are established by PNB’s Board of Directors upon recommendation by the chief credit officer. In establishing an individual’s loan authority, the experience of the lender is taken into consideration, as well as the type of lending in which the individual is involved. The President of PNB, along with members of senior management, comprising the officers’ loan committee, has the authority to approve new loans over $250 thousand up to $2 million and all aggregate relationships of $325 thousand to $2.5 million following an analysis and review by credit analysts and commercial lender. The full Board of Directors review on a monthly basis, all loans approved by individual lenders and the officers’ loan committee. All loan requests which are either complex in nature or exceed $2 million or have an aggregate relationship of $2.5 million must be analyzed and reviewed by the officers’ loan committee and be presented with a recommendation to the full Board of Directors for approval or denial.
PNB generally requires that loans secured by first mortgages or real estate have loan-to-value ratios of less than 80% for loans secured by raw land or improved property. In addition, in some instances for qualified borrowers, private mortgage insurance is available for purchase that allows loan-to-value ratios to go as high as 100%. PNB also participates in a guaranteed mortgage insurance program. This allows PNB to make loans on real estate up to 100% of the value of the property.
Investment Portfolio and Activities
PNB’s investment portfolio has several objectives.
|
·
|
A key objective is to provide a balance in PNB's asset mix of loans and investments consistent with its liability structure, and to assist in management of interest rate risk. The investments augment PNB's capital position in the risk-based capital formula, providing the necessary liquidity to meet fluctuations in credit demands of the community and also fluctuations in deposit levels.
|
|
·
|
In addition, the portfolio provides collateral for pledging against public funds, and reduces PNB’s tax liability
|
|
·
|
Finally, the investment portfolio provides income for PNB.
|
Deposit Activities
PNB offers a full range of deposit and banking services including:
|
·
|
commercial accounts such as checking products, cash management services, remote deposit capture (“RDC”), automated clearing house (“ACH”) originations
|
|
·
|
retirement accounts such as Individual Retirement Accounts (“IRA”)
|
|
·
|
consumer interest bearing deposit services such as certificates of deposit, money market accounts, NOW accounts, and savings accounts
|
|
·
|
a variety of ancillary checking account products such as automated teller machines (“ATM’s”), point of sale (“POS”), as well as other miscellaneous services
|
These miscellaneous services would include:
|
·
|
safe deposit boxes;
|
|
·
|
night depository services;
|
|
·
|
merchant credit cards;
|
|
·
|
direct deposit of payroll and other checks;
|
|
·
|
U.S. Savings Bonds;
|
|
·
|
official bank checks; and
|
|
·
|
money orders.
|
The principal sources of funds for PNB are core deposits that include demand deposits, interest bearing transaction accounts, money market accounts, savings deposits, and certificates of deposit. These deposits are solicited from individuals, businesses, non-profit entities, and government authorities. Substantially all of PNB’s deposits are from the local market areas surrounding each of its offices.
12
Investment Products
In 2005, Peoples Financial Services Corp. formed Peoples Wealth Management, LLC, formerly known as Peoples Advisors, LLC (“Advisors”) as a member-managed limited liability company under the laws of the Commonwealth of Pennsylvania, to be a wholly owned subsidiary of the Corporation, for the purpose of providing investment advisory services to the general public. The Company has subsequently changed the name of the member-managed limited liability company to Peoples Wealth Management, effective January 2011.
Competition
PNB operates in a fairly competitive environment, competing for deposits and loans with commercial banks, thrifts, credit unions, and finance and mortgage companies. Some of these competitors possess substantially greater financial resources than those available to PNB. Also, certain of these institutions have significantly higher lending limits than PNB and may provide various services for their customers that are not presently available at PNB. Principal methods of competing for banking permitted nonbanking services and financial activities include price, nature of product, quality of service and convenience of location. PNB is subject to increasing competition from credit unions, finance companies, and mortgage companies that may not be subject to the same regulatory restrictions and taxations as commercial banks.
PNB’s success is based on its ability to remain competitive with interest rates that it charges on its loans and offers on deposits. It also believes that its success has been, and will continue to be, due to its emphasis on community involvement, customer services, and relationships. With consolidation continuing in the financial industry, and particularly in PNB’s markets, smaller profitable banks are gaining opportunities where larger institutions exit markets that are only marginally profitable for them.
Although the Company has not done so, many bank holding companies have elected to become financial holding companies under the GLB, which gives them a broader range of products in order to compete. Although the long-range effects of this development cannot be predicted, most probably it will further narrow the differences and intensify competition among commercial banks, investment banks, insurance firms and other financial services companies.
SEASONALITY
Management does not feel that the deposits or the business of PNB in general are seasonal in nature. However, with the recent interest in natural gas drilling in PNB’s market area, deposit growth patterns have been influenced somewhat by such activities. In addition, deposits may vary with local and national economic conditions but should not have a material effect on planning and policy making.
CRITICAL ACCOUNTING POLICIES
Disclosure of the Company’s significant accounting policies is included in Note 1 to the Consolidated Financial Statements. Some of these policies are particularly sensitive requiring significant judgments, estimates and assumptions to be made by management. Additional information is contained in Management’s Discussion and Analysis for these issues, including the provision and allowance for loan losses, which are located in Note 3 to the Consolidated Financial Statements; the valuation of real estate acquired in connection with foreclosures or in satisfaction of loans; determination of other-than-temporary impairment losses on securities, which is located in Note 2 to the Consolidated Financial Statements; the valuation of deferred tax assets, which is located in Note 9 to the Consolidated Financial Statements; and the potential impairment of restricted stock, which is located in Note 1 to the Consolidated Financial Statements.
AVAILABLE INFORMATION
The Company files reports, proxy and information statements and other information electronically with the SEC. You may read and copy any materials that the Company files with the SEC at the SEC’s Public Reference Room located at 100 F. Street, N.E., Washington, DC 20549 on official business days between the hours of 10:00am and 3:00pm EST. You can obtain information on the operation of the Public Reference Room by calling the SEC at 1-800-SEC-0330. The SEC maintains an Internet site that contains reports, proxy and information statements and other information regarding issuers that file electronically. The SEC’s website address is http://www.sec.gov. Copies of the Company’s Annual Report on Form 10-K, Quarterly Reports on Form 10-Q, Current Reports on Form 8-K and amendments to those reports filed with the SEC may be obtained without charge by writing to Peoples Financial Services Corp., 82 Franklin Avenue, Hallstead, PA 18822, Attn: Investor Relations or through our website at http://www.peoplesnatbank.com.
13
STATISTICAL DISCLOSURES
The following statistical disclosures are included in Management’s Discussion and Analysis, Item 7 hereof, and are incorporated in their entirety by reference under this Item 1:
|
·
|
Interest Rate Sensitivity Analysis;
|
|
·
|
Interest Income and Expense, Volume and Rate Analysis;
|
|
·
|
Investment Portfolio;
|
|
·
|
Loan Maturity and Interest Rate Sensitivity;
|
|
·
|
Loan Portfolio;
|
|
·
|
Allocation of Allowance for Loan Losses;
|
|
·
|
Deposits; and
|
|
·
|
Short-term Borrowings.
|
ITEM 1A RISK FACTORS
Changes in interest rates could reduce our income, cash flows and asset values.
Our income and cash flows and the value of our assets depend to a great extent on the difference between the interest rates we earn on interest-earning assets, such as loans and investment securities, and the interest rates we pay on interest-bearing liabilities such as deposits and borrowings. These rates are highly sensitive to many factors which are beyond our control, including general economic conditions and policies of various governmental and regulatory agencies and, in particular, the FRB. Changes in monetary policy, including changes in interest rates, will influence not only the interest we receive on our loans and investment securities and the amount of interest we pay on deposits and borrowings, but will also affect our ability to originate loans and obtain deposits and the value of our investment portfolio. If the rate of interest we pay on our deposits and other borrowings increases more than the rate of interest we earn on our loans and other investments, our net interest income, and therefore our earnings, could be adversely affected. Our earnings also could be adversely affected if the rates on our loans and other investments fall more quickly than those on our deposits and other borrowings.
Economic conditions either nationally or locally in areas in which our operations are concentrated may adversely affect our business.
Deterioration in local, regional, national or global economic conditions could cause us to experience a reduction in deposits and new loans, an increase in the number of borrowers who default on their loans and a reduction in the value of the collateral securing their loans, all of which could adversely affect our performance and financial condition. Unlike larger banks that are more geographically diversified, we provide banking and financial services locally. Therefore, we are particularly vulnerable to adverse local economic conditions.
Our financial condition and results of operations would be adversely affected if our allowance for loan losses is not sufficient to absorb actual losses or if we are required to increase our allowance.
Despite our underwriting criteria, we may experience loan delinquencies and losses. In order to absorb losses associated with nonperforming loans, we maintain an allowance for loan losses based on, among other things, historical experience, an evaluation of economic conditions, and regular reviews of delinquencies and loan portfolio quality. Determination of the allowance inherently involves a high degree of subjectivity and requires us to make significant estimates of current credit risks and future trends, all of which may undergo material changes. At any time, there are likely to be loans in our portfolio that will result in losses but that have not been identified as non-performing or potential problem credits. We cannot be sure that we will be able to identify deteriorating credits before they become nonperforming assets or that we will be able to limit losses on those loans that are identified. We may be required to increase our allowance for loan losses for any of several reasons. Regulators, in reviewing our loan portfolio as part of a regulatory examination, may request that we increase our allowance for loan losses. Changes in economic conditions affects borrowers, new information regarding existing loans, identification of additional problem loans and other factors, both within and outside of our control, may require an increase in our allowance. In addition, if charge-offs in future periods exceed our allowance for loan losses, we will need additional increases in our allowance for loan losses. Any increase in our allowance for loan losses will result in a decrease in our net income and capital and may materially affect our results of operations in the period in which the allowance is increased.
14
Competition may decrease our growth or profits.
We face substantial competition in all phases of our operations from a variety of different competitors, including commercial banks, credit unions, consumer finance companies, insurance companies and money market funds. There is very strong competition among financial services providers in our principal service area. Our competitors may have greater resources, higher lending limits or larger branch systems than we do. Accordingly, they may be able to offer a broader range of products and services as well as better pricing for those products and services than we can. In addition, some of the financial services organizations with which we compete are not subject to the same degree of regulation as is imposed on federally insured financial institutions. As a result, those non-bank competitors may be able to access funding and provide various services more easily or at less cost than we can, adversely affecting our ability to compete effectively.
We may be adversely affected by government regulation.
The banking industry is heavily regulated. Banking regulations are primarily intended to protect the federal deposit insurance funds and depositors, not shareholders. Changes in the laws, regulations, and regulatory practices affecting the banking industry may increase our cost of doing business or otherwise adversely affect us and create competitive advantages for others. Regulations affecting banks and financial services companies undergo continuous change, and we cannot predict the ultimate effect of these changes, which could have a material adverse effect on our profitability or financial condition.
We rely on our management and other key personnel, and the loss of any of them may adversely affect our operations.
We are, and will continue to be, dependent upon the services of our management team. The unexpected loss of services of any key management personnel could have an adverse effect on our business and financial condition because of their skills, knowledge of our market, years of industry experience and the difficulty of promptly finding qualified replacement personnel.
Environmental liability associated with lending activities could result in losses.
In the course of our business, we may foreclose on and take title to properties securing our loans. If hazardous substances were discovered on any of these properties, we could be liable to governmental entities or third parties for the costs of remediation of the hazard, as well as for personal injury and property damage. Many environmental laws can impose liability regardless of whether we knew of, or were responsible for, the contamination. In addition, if we arrange for the disposal of hazardous or toxic substances at another site, we may be liable for the costs of cleaning up and removing those substances from the site even if we neither own nor operate the disposal site. Environmental laws may require us to incur substantial expenses and may materially limit use of properties we acquire through foreclosure, reduce their value or limit our ability to sell them in the event of a default on the loans they secure. In addition, future laws or more stringent interpretations or enforcement policies with respect to existing laws may increase our exposure to environmental liability.
Failure to implement new technologies in our operations may adversely affect our growth or profits.
The market for financial services, including banking services and consumer finance services, is increasingly affected by advances in technology, including developments in telecommunications, data processing, computers, automation, Internet-based banking and telebanking. Our ability to compete successfully in our markets may depend on the extent to which we are able to exploit such technological changes. However, we can provide no assurance that we will be able to properly or timely anticipate or implement such technologies or properly train our staff to use such technologies. Any failure to adapt to new technologies could adversely affect our business, financial condition or operating results.
An investment in our common stock is not an insured deposit.
Our common stock is not a bank deposit and, therefore, is not insured against loss by the FDIC, or any other deposit insurance fund or by any other public or private entity. Investment in our common stock is subject to the same market forces that affect the price of common stock in any company.
Our legal lending limits are relatively low and restrict our ability to compete for larger customers.
At December 31, 2010, our lending limit per borrower was approximately $7.6 million or approximately 15% of our unimpaired capital. Accordingly, the size of loans that we can offer to potential borrowers, without participation by other lenders, is less than the size of loans that many of our competitors with larger capitalization are able to offer. Our legal lending limit also impacts the efficiency of our lending operation because it tends to lower our average loan size, which means we have to generate a higher number of transactions to achieve the same portfolio volume. We may engage in loan participations with other banks for loans in excess of our legal lending limits. However, there can be no assurance that such participations will be available at all or on terms which are favorable to us and our customers.
15
Market conditions may adversely affect our fee based investment business.
The Company receives fee based revenues from commissions from the sale of securities and investment advisory fees. In the event of decreased stock market activity, the volume of trading facilitated by our Wealth Management subsidiary will in all likelihood decrease resulting in decreased commission revenue on purchases and sales of securities. In addition, investment advisory fees, which are generally based on a percentage of the total value of an investment portfolio, will decrease in the event of decreases in the values of the investment portfolios, for example, as a result of overall market declines.
ITEM 1B UNRESOLVED STAFF COMMENTS
NONE.
ITEM 2 PROPERTIES
PNB has four full-service banking offices in Susquehanna County that are located in:
|
·
|
Borough of Susquehanna Depot;
|
|
·
|
Hallstead Plaza, Great Bend Township;
|
|
·
|
Borough of Hop Bottom; and
|
|
·
|
Montrose, Bridgewater Township.
|
PNB has three full-service banking offices in Wyoming County that are located in:
|
·
|
Borough of Nicholson;
|
|
·
|
Meshoppen Borough; and
|
|
·
|
Tunkhannock Borough.
|
PNB has one full-service banking office in Glenburn Township, Lackawanna County.
PNB has three full-service banking offices in Broome County, New York that are located in:
|
·
|
Town of Conklin;
|
|
·
|
Town of Chenango; and
|
|
·
|
Village of Deposit.
|
The administrative/operations office of the Company and PNB is located at 82 Franklin Avenue, Hallstead, Pennsylvania. The following departments are located at that office:
|
·
|
commercial, mortgage and consumer lending operations;
|
|
·
|
executive offices;
|
|
·
|
marketing department;
|
|
·
|
human resources department;
|
|
·
|
deposit account support services;
|
|
·
|
data processing services; and
|
|
·
|
finance and planning.
|
All offices are owned by PNB with the exception of the Hallstead Plaza and Town of Chenango offices. The Hallstead Plaza office is subject to a ground lease; the Front Street office is subject to a building lease. For additional information with respect to the terms of these leases, refer to Note 4 to the Consolidated Financial Statements filed at Item 8 of this report. Eleven of the twelve offices provide drive-up banking services and ten offices have 24-hour ATM services. All of the Company’s and PNB’s properties are considered suitable and adequate for current and immediate future needs.
ITEM 3 LEGAL PROCEEDINGS
The Company is subject to lawsuits and claims arising out of its business. In the opinion of the Company’s management, after review and consultation with counsel, any proceedings that may arise should not result in judgments, which, in the aggregate, would have a material adverse effect on the Company’s financial condition or operating results.
ITEM 4 (REMOVED AND RESERVED)
16
PART II
ITEM 5 MARKET FOR REGISTRANT'S COMMON EQUITY, RELATED STOCKHOLDER MATTERS AND ISSUER PURCHASES OF EQUITY SECURITIES
The Company’s Common Stock is not listed on an exchange. The Company’s common stock is traded sporadically in the over-the-counter market and, accordingly, there is no established public trading market at this time. The Company’s stock is listed on the OTC Bulletin Board under the symbol PFIS. The cusip number is 711040-10-5. The investment firms of Boenning & Scattergood, Inc. from West Conshohocken, Pennsylvania, and Stifel Nicolaus & Co., Inc. from Livingston, New Jersey, make a limited market in the Company’s common stock. The Company has continuously paid dividends for more than 100 years and it is the intention to pay dividends in the future. However, future dividends must necessarily depend upon earnings, financial condition, appropriate legal restrictions, and other factors at the time that the Board of Directors considers dividend payments. As of December 31, 2010, there were 21,574 outstanding options to purchase the Company’s common stock. See Note 8 of the Consolidated Financial Statements for additional information. As of February 28, 2011, the Company had 1,089 shareholders of record and 3,141,731 shares of Common Stock, par value of $2.00 per share, outstanding.
The following table reflects high and low bid prices for shares of the Company’s Common Stock to the extent such information is available, and the dividends declared with respect thereto during the preceding two years.
|
2010
|
2009
|
|||||||||||||||||||||||
|
Price Range
|
Dividends
|
Price Range
|
Dividends
|
|||||||||||||||||||||
|
Low
|
High
|
Declared
|
Low
|
High
|
Declared
|
|||||||||||||||||||
|
First Quarter
|
$ | 18.05 | $ | 22.00 | $ | .19 | $ | 17.00 | $ | 18.50 | $ | .19 | ||||||||||||
|
Second Quarter
|
21.65 | 26.50 | .20 | 16.75 | 17.40 | .19 | ||||||||||||||||||
|
Third Quarter
|
26.00 | 27.00 | .20 | 16.90 | 17.40 | .19 | ||||||||||||||||||
|
Fourth Quarter
|
$ | 26.60 | $ | 27.40 | $ | .20 | $ | 16.80 | $ | 18.25 | $ | .19 | ||||||||||||
The following table discloses the number of outstanding options, warrants and rights granted by the Company to participants in equity compensation plans, as well as the number of securities remaining available for future issuance under these plans. Securities for future issuance are reserved and issued at the discretion of the Board of Directors on an annual basis. The table provides this information separately for equity compensation plans that have and have not been approved by security holders.
|
Number of securities to be issued upon exercise of outstanding options, warrants and rights
|
Weighted-average exercise price of outstanding options, warrants and rights
|
Number of securities remaining available for future issuance under equity compensation plans
|
||||||||||
|
Equity compensation plans approved by stockholders
|
21,574 | $ | 23.34 | 65,751 | ||||||||
|
Equity compensation plans not approved by stockholders
|
0 | 0 | 0 | |||||||||
|
Total
|
21,574 | $ | 23.34 | 65,751 | ||||||||
On July 2, 2001, the Board of Directors authorized the repurchase of 158,931 shares of the Company’s common stock. There were no purchases made by or on behalf of the Company or any “affiliated purchaser,” as defined in the Exchange Act Rule 10b-18(a) (3), of the Company’s common stock during each of the three months ended December 31, 2010. As of December 31, 2010, there were 65,751 shares available for repurchase under the 2001 Stock Repurchase Program with no expiration date.
17
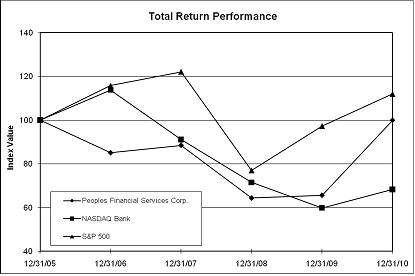
STOCK PERFORMANCE GRAPH
|
Period Ending
|
||||||||||||||||||||||||
|
Index
|
12/31/05
|
12/31/06
|
12/31/07
|
12/31/08
|
12/31/09
|
12/31/10
|
||||||||||||||||||
|
Peoples Financial Services Corp.
|
$ | 100.00 | $ | 85.04 | $ | 88.45 | $ | 64.35 | $ | 65.64 | $ | 99.92 | ||||||||||||
|
NASDAQ Bank
|
$ | 100.00 | $ | 113.82 | $ | 91.16 | $ | 71.52 | $ | 59.87 | $ | 68.34 | ||||||||||||
|
S&P 500
|
$ | 100.00 | $ | 115.79 | $ | 122.16 | $ | 76.96 | $ | 97.33 | $ | 111.99 | ||||||||||||
18
ITEM 6 SELECTED FINANCIAL DATA
|
Consolidated Financial Highlights
|
At and For the Years Ended December 31,
|
|||||||||||||||||||
|
(Dollars In Thousands, except Per Share Data)
|
2010
|
2009
|
2008
|
2007
|
2006
|
|||||||||||||||
|
Financial Position
|
||||||||||||||||||||
|
Total Assets
|
$ | 558,587 | $ | 516,483 | $ | 472,376 | $ | 434,434 | $ | 416,268 | ||||||||||
|
Total Investments
|
121,772 | 130,506 | 107,589 | 109,471 | 107,788 | |||||||||||||||
|
Net Loans
|
386,672 | 332,196 | 313,606 | 288,524 | 269,303 | |||||||||||||||
|
Allowance for Loan Losses
|
4,100 | 3,337 | 3,002 | 2,451 | 1,792 | |||||||||||||||
|
Short-term Borrowings
|
38,724 | 20,439 | 18,432 | 22,848 | 12,574 | |||||||||||||||
|
Long-term Borrowings
|
27,336 | 38,750 | 39,691 | 38,534 | 36,525 | |||||||||||||||
|
Total Deposits
|
438,734 | 410,038 | 371,268 | 327,430 | 323,613 | |||||||||||||||
|
Stockholders' Equity
|
50,516 | 44,970 | 39,720 | 42,805 | 41,240 | |||||||||||||||
|
Financial Performance
|
||||||||||||||||||||
|
Interest Income
|
$ | 25,577 | $ | 24,273 | $ | 25,479 | $ | 24,611 | $ | 22,698 | ||||||||||
|
Interest Expense
|
6,498 | 7,258 | 9,154 | 11,105 | 10,797 | |||||||||||||||
|
Net Interest Income
|
19,079 | 17,015 | 16,325 | 13,506 | 11,901 | |||||||||||||||
|
Provision for Loan Losses
|
2,202 | 1,735 | 713 | 280 | 302 | |||||||||||||||
|
Other Income (Loss)
|
4,290 | 3,082 | (1,809 | ) | 3,308 | 2,790 | ||||||||||||||
|
Other Expense
|
13,245 | 12,390 | 10,677 | 10,566 | 9,488 | |||||||||||||||
|
Income before Income Taxes
|
7,922 | 5,972 | 3,126 | 5,968 | 4,901 | |||||||||||||||
|
Provision for Income Taxes
|
1,437 | 923 | 87 | 1,097 | 772 | |||||||||||||||
|
Net Income
|
6,485 | 5,049 | 3,039 | 4,871 | 4,129 | |||||||||||||||
|
Profitability
|
||||||||||||||||||||
|
Return on Average Assets
|
1.18 | % | 1.07 | % | 0.68 | % | 1.17 | % | 1.03 | % | ||||||||||
|
Return on Average Equity
|
13.87 | % | 12.62 | % | 7.53 | % | 11.85 | % | 10.55 | % | ||||||||||
|
Shareholders' Value
|
||||||||||||||||||||
|
Earnings per Share, Basic
|
$ | 2.07 | $ | 1.61 | $ | 0.97 | $ | 1.55 | $ | 1.31 | ||||||||||
|
Earnings per Share, Diluted
|
2.06 | 1.61 | 0.97 | 1.55 | 1.31 | |||||||||||||||
|
Cash Dividends Declared
|
0.79 | 0.76 | 0.76 | 0.76 | 0.76 | |||||||||||||||
|
Book Value
|
16.07 | 14.34 | 12.69 | 13.64 | 13.16 | |||||||||||||||
|
Market Value
|
26.60 | 18.05 | 18.05 | 26.30 | 26.00 | |||||||||||||||
|
Book Multiple
|
1.66 | 1.26 | 1.42 | 1.93 | 1.98 | |||||||||||||||
|
Earnings Multiple
|
12.85 | 11.21 | 18.61 | 16.97 | 19.85 | |||||||||||||||
|
Dividend Payout Ratio
|
38.24 | % | 47.16 | % | 78.35 | % | 48.92 | % | 57.93 | % | ||||||||||
|
Dividend Yield
|
2.97 | % | 4.21 | % | 4.21 | % | 2.89 | % | 2.94 | % | ||||||||||
|
Safety and Soundness
|
||||||||||||||||||||
|
Stockholders' Equity as a Percentage of Total Assets
|
9.04 | % | 8.71 | % | 8.41 | % | 9.85 | % | 9.91 | % | ||||||||||
|
Allowance for Loan Loss as a Percentage of Loans, Net
|
1.05 | % | 0.99 | % | 0.95 | % | 0.84 | % | 0.66 | % | ||||||||||
|
Net Charge Offs as a Percentage of Total Loans
|
0.37 | % | 0.42 | % | 0.05 | % | (0.13 | %) | 0.33 | % | ||||||||||
|
Allowance for Loan Loss as a Percentage of Nonaccrual Loans
|
62.95 | % | 132.00 | % | 498.67 | % | 620.51 | % | 402.70 | % | ||||||||||
19
ITEM 7 MANAGEMENT'S DISCUSSION AND ANALYSIS OF FINANCIAL CONDITION AND RESULTS OF OPERATIONS
Management’s Discussion and Analysis of Peoples Financial Services Corp. (the “Company”) is intended to assist the reader in evaluating the Company’s performance for the years ending December 31 2010, 2009, and 2008. The information should be read in conjunction with the consolidated financial statements and accompanying notes to those statements.
Forward Looking Statements
When used in this discussion, the words “believes”, “anticipates”, “contemplated”, “expects”, or similar expressions are intended to identify forward looking statements. Such statements are subject to certain risks and uncertainties that could cause actual results to differ materially from those projected. Those risks and uncertainties include changes in interest rates, the ability to control costs and expenses, and general economic conditions. The Company undertakes no obligation to publicly release the results of any revisions to those forward looking statements that may be made to reflect events or circumstances after this date or to reflect the occurrence of unanticipated events.
Critical Accounting Policies
The Company’s financial statements are prepared in accordance with accounting principles generally accepted in the United States of America (“GAAP”). The preparation of financial statements in conformity with GAAP requires management to establish critical accounting policies and make accounting estimates and assumptions that affect the reported amounts of assets and liabilities at the date of the financial statements, as well as the reported amounts of revenues and expenses during those reporting periods.
For a discussion of the recent Accounting Standards Updates (“ASU”) issued by the Financial Accounting Standards Board (“FASB”) refer to the Note 1 entitled “Summary of Significant Accounting Policies — New Accounting Standards,” in the Notes to Consolidated Financial Statements to this Annual Report.
An accounting estimate requires assumptions about uncertain matters that could have a material effect on the financial statements if a different amount within a range of estimates were used or if estimates changed from period to period. Readers of this report should understand that estimates are made considering facts and circumstances at a point in time, and changes in those facts and circumstances could produce results that differ from when those estimates were made. Significant estimates that are particularly susceptible to material change in the next year relate to the allowance for loan losses, other-than-temporary impairment, fair value of financial instruments, the valuations of real estate acquired through foreclosure and deferred tax assets and liabilities. Actual amounts could differ from those estimates.
The Company maintains the allowance for loan losses at a level management believes adequate to absorb probable credit losses related to specifically identified loans, as well as probable incurred losses inherent in the remainder of the loan portfolio as of the balance sheet date. The balance in the allowance for loan losses account is based on past events and current economic conditions.
The allowance for loan losses account consists of an allocated element and an unallocated element. The allocated element consists of a specific portion for the impairment of loans individually evaluated and a formula portion for loss contingencies on those loans collectively evaluated. The unallocated element, if any, is used to cover inherent losses that exist as of the evaluation date, but which have not been identified as part of the allocated allowance using the Company’s impairment evaluation methodology due to limitations in the process.
Management monitors the adequacy of the allocated portion of the allowance quarterly and adjusts the allowance for any deficiencies through normal operations. This ongoing evaluation reduces potential differences between estimates and actual observed losses. The determination of the level of the allowance for loan losses is inherently subjective as it requires estimates that are susceptible to significant revision as more information becomes available. Accordingly, management cannot ensure that charge-offs in future periods will not exceed the allowance for loan losses or that additional increases in the allowance for loan losses will not be required, resulting in an adverse impact on operating results.
20
In determining the requirement to record an other-than-temporary impairment on securities owned by the Company, four main characteristics are considered including: (i) the length of time and the extent to which the fair value has been less than amortized cost; (ii) the financial condition and near-term prospects of the issuer;(iii) whether the market decline was affected by macroeconomic conditions and (iv) whether the entity has the intent to sell the debt security or more likely than not will be required to sell the debt security before its anticipated recovery. The Company believes that the unrealized losses, at December 31, 2010 and 2009 represent temporary impairment of the securities.
Fair values of financial instruments, in cases where quoted market prices are not available, are based on estimates using present value or other valuation techniques which are subject to change.
Real estate acquired in connection with foreclosures or in satisfaction of loans is adjusted to fair value based upon current estimates derived through independent appraisals less cost to sell. However, proceeds realized from sales may ultimately be higher or lower than those estimates.
Deferred tax assets and liabilities are recognized for the estimated future tax effects of temporary differences by applying enacted statutory tax rates to differences between the financial statement carrying amounts and the tax bases of existing assets and liabilities. The amount of deferred tax assets is reduced, if necessary, to the amount that, based on available evidence, will more likely than not be realized. As changes in tax laws or rates are enacted, deferred tax assets and liabilities are adjusted through the provision for income taxes.
For a further discussion of the Company’s critical accounting policies, refer to the note entitled, “Summary of Significant Accounting Policies,” in the Notes to Consolidated Financial Statements to this Annual Report. This note lists the significant accounting policies used by management in the development and presentation of the financial statements. This Management’s Discussion and Analysis, the Notes to the Consolidated Financial Statements and other financial statement disclosures identify and address key variables and other qualitative and quantitative factors that are necessary for the understanding and evaluation of the Company’s financial position, results of operations and cash flows.
REVIEW OF FINANCIAL PERFORMANCE
The Company reported net income of $6.5 million or $2.07 per share in 2010. In comparison, in 2009 the Company reported net income of $5.0 million or $1.61 per share. The improvement in earnings in 2010 was a result of the recognition of higher net interest income and other income offset partially by increases in the provision for loan losses, other expenses and provision for income taxes. Net income in 2008 totaled $3.0 million or $0.97 per share. Return on average assets (“ROA”) measures the Company’s net income in relation to its total assets. The Company’s ROA was 1.18% in 2010, 1.07% in 2009 and 0.68% in 2008. Return on average equity (“ROE”) indicates how effectively the Company can generate net income on the capital invested by its stockholders. The Company’s ROE was 13.87% in 2010, 12.62% in 2009 and 7.53% in 2008.
NET INTEREST INCOME
Net interest income is still the fundamental source of earnings for commercial banks. Moreover, fluctuations in the level of noninterest income can have the greatest impact on net profits. Net interest income is defined as the difference between interest revenue, interest and fees earned on interest earning assets, and interest expense, the cost of interest bearing liabilities supporting those assets. The primary sources of earning assets are loans and investment securities, while interest bearing deposits and other borrowings comprise interest bearing liabilities. Net interest income is impacted by:
|
•
|
Variations in the volume, rate and composition of earning assets and interest bearing liabilities;
|
|
•
|
Changes in general market interest rates; and
|
|
•
|
The level of nonperforming assets.
|
Changes in net interest income are measured by the net interest spread and net interest margin. Net interest spread, the difference between the average yield earned on earning assets and the average rate incurred on interest bearing liabilities, illustrates the effects changing interest rates have on profitability. Net interest margin, net interest income as a percentage of average earning assets, is a more comprehensive ratio, as it reflects not only the spread, but also the change in the composition of interest earning assets and interest bearing liabilities. Tax exempt loans and investments carry pretax yields lower than their taxable counterparts. Therefore, in order to make the analysis of net interest income more comparable, tax exempt income and yields are reported in this analysis on a tax equivalent basis using the prevailing federal statutory tax rate of 34.0%.
21
Similar to all banks, management considers the maintenance of an adequate net interest margin to be of primary concern. The current economic environment has been very challenging for the banking industry. In addition to market rates and competition, rising nonperforming asset levels are of particular concern for the banking industry and may place additional pressure on net interest margins. Nonperforming assets may increase given the downturn in economic growth and softening in labor markets. No assurance can be given as to how general market conditions will change or how such changes will affect net interest income. Therefore, management believes through prudent deposit and loan pricing practices, careful investing, and constant monitoring of nonperforming assets, the Company’s net interest margin will remain strong. The discussion of net interest income should be read in conjunction with Table 1: “Distribution of Assets, Liabilities and Stockholders’ Equity; Interest Rates and Interest Differential”, and Table 2: “Rate/Volume Analysis of Changes in Net Interest Income.”
The average balances of assets and liabilities, corresponding interest income and expense and resulting average yields or rates paid are summarized as follows. Averages for earning assets include nonaccrual loans. Investment averages include available-for-sale securities at amortized cost. Income on investment securities and loans is adjusted to a tax equivalent basis using the prevailing federal statutory tax rate of 34.0%.
22
TABLE 1
Distribution of Assets, Liabilities and Stockholders' Equity
Interest Rates and Interest Differential
(In Thousands)
|
Year Ended
December 31, 2010
|
Year Ended
December 31, 2009
|
Year Ended
December 31, 2008
|
||||||||||||||||||||||||||||||
|
Average
|
Yield/
|
Average
|
Yield/
|
Average
|
Yield/
|
|||||||||||||||||||||||||||
|
ASSETS
|
Balance
|
Interest
|
Rate
|
Balance
|
Interest
|
Rate
|
Balance
|
Interest
|
Rate
|
|||||||||||||||||||||||
|
Loans
|
||||||||||||||||||||||||||||||||
|
Real Estate
|
$ | 118,510 | $ | 6,928 | 5.85 | % | $ | 119,062 | $ | 7,186 | 6.04 | % | $ | 117,635 | $ | 7,602 | 6.46 | % | ||||||||||||||
|
Installment
|
22,006 | 937 | 4.26 | % | 18,236 | 1,116 | 6.12 | % | 16,815 | 1,303 | 7.75 | % | ||||||||||||||||||||
|
Commercial
|
196,432 | 11,509 | 5.86 | % | 161,762 | 10,143 | 6.27 | % | 140,903 | 9,917 | 7.04 | % | ||||||||||||||||||||
|
Tax Exempt (1)
|
26,757 | 1,691 | 6.32 | % | 22,516 | 1,458 | 6.48 | % | 22,913 | 1,523 | 6.65 | % | ||||||||||||||||||||
|
Other
|
563 | 43 | 7.64 | % | 506 | 39 | 7.71 | % | 469 | 44 | 9.38 | % | ||||||||||||||||||||
|
Total Loans (1)
|
364,268 | 21,108 | 5.79 | % | 322,082 | 19,942 | 6.19 | % | 298,735 | 20,389 | 6.83 | % | ||||||||||||||||||||
|
Investment Securities (2)
|
||||||||||||||||||||||||||||||||
|
Taxable
|
82,923 | 2,987 | 3.60 | % | 53,945 | 2,675 | 4.96 | % | 67,897 | 3,771 | 5.55 | % | ||||||||||||||||||||
|
Tax Exempt (1)
|
50,033 | 3,071 | 6.14 | % | 52,326 | 3,209 | 6.13 | % | 42,859 | 2,623 | 6.12 | % | ||||||||||||||||||||
|
Total Securities (1)
|
132,956 | 6,058 | 4.56 | % | 106,271 | 5,884 | 5.54 | % | 110,756 | 6,394 | 5.77 | % | ||||||||||||||||||||
|
Time Deposits With Other Banks
|
654 | 4 | 0.61 | % | 1,408 | 17 | 1.21 | % | 1,186 | 26 | 2.19 | % | ||||||||||||||||||||
|
Fed Funds Sold
|
19,181 | 26 | 0.14 | % | 9,617 | 17 | 0.18 | % | 6,817 | 80 | 1.17 | % | ||||||||||||||||||||
|
Total Earning Assets (1)
|
517,059 | 27,196 | 5.26 | % | 439,378 | 25,860 | 5.89 | % | 417,494 | 26,889 | 6.44 | % | ||||||||||||||||||||
|
Less: Allowance for Loan Losses
|
3,882 | 2,969 | 2,599 | |||||||||||||||||||||||||||||
|
Cash and Due from Banks
|
7,483 | 6,302 | 6,851 | |||||||||||||||||||||||||||||
|
Premises and Equipment, Net
|
7,161 | 6,507 | 6,227 | |||||||||||||||||||||||||||||
|
Other Assets
|
20,662 | 21,642 | 19,741 | |||||||||||||||||||||||||||||
|
Total Assets
|
$ | 548,483 | $ | 470,860 | $ | 447,714 | ||||||||||||||||||||||||||
|
LIABILITIES AND STOCKHOLDERS’ EQUITY
|
||||||||||||||||||||||||||||||||
|
Deposits
|
||||||||||||||||||||||||||||||||
|
Interest Bearing Demand
|
$ | 42,992 | 301 | 0.70 | % | $ | 35,697 | 324 | 0.91 | % | $ | 28,871 | 284 | 0.98 | % | |||||||||||||||||
|
Savings
|
187,007 | 2,017 | 1.08 | % | 130,652 | 1,696 | 1.30 | % | 94,019 | 1,219 | 1.30 | % | ||||||||||||||||||||
|
Money Market Savings
|
36,829 | 277 | 0.75 | % | 32,771 | 343 | 1.05 | % | 33,858 | 600 | 1.77 | % | ||||||||||||||||||||
|
Time
|
90,522 | 2,101 | 2.32 | % | 106,353 | 2,965 | 2.79 | % | 132,313 | 4,923 | 3.72 | % | ||||||||||||||||||||
|
Total Interest Bearing Deposits
|
357,350 | 4,696 | 1.31 | % | 305,473 | 5,328 | 1.74 | % | 289,061 | 7,026 | 2.43 | % | ||||||||||||||||||||
|
Other Borrowings
|
67,481 | 1,802 | 2.67 | % | 59,141 | 1,930 | 3.26 | % | 58,368 | 2,128 | 3.65 | % | ||||||||||||||||||||
|
Total Interest Bearing Liabilities
|
424,831 | 6,498 | 1.53 | % | 364,614 | 7,258 | 1.99 | % | 347,429 | 9,154 | 2.63 | % | ||||||||||||||||||||
|
Net Interest Income/Spread (1)
|
$ | 20,698 | 3.73 | % | $ | 18,602 | 3.90 | % | $ | 17,735 | 3.81 | % | ||||||||||||||||||||
|
Non-Interest Bearing
|
||||||||||||||||||||||||||||||||
|
Demand Deposits
|
72,846 | 63,325 | 56,778 | |||||||||||||||||||||||||||||
|
Accrued Expenses and
|
||||||||||||||||||||||||||||||||
|
Other Liabilities
|
4,037 | 2,916 | 3,173 | |||||||||||||||||||||||||||||
|
Stockholders’ Equity
|
46,769 | 40,005 | 40,334 | |||||||||||||||||||||||||||||
|
Total Liabilities and
|
||||||||||||||||||||||||||||||||
|
Stockholders’ Equity
|
$ | 548,483 | $ | 470,860 | $ | 447,714 | ||||||||||||||||||||||||||
|
Net Interest Margin (1)
|
4.00 | % | 4.23 | % | 4.25 | % | ||||||||||||||||||||||||||
|
Tax Equivalent Adjustments:
|
||||||||||||||||||||||||||||||||
|
Loans
|
$ | 575 | $ | 496 | $ | 518 | ||||||||||||||||||||||||||
|
Investments
|
1,044 | 1,091 | 892 | |||||||||||||||||||||||||||||
|
Total Adjustments
|
$ | 1,619 | $ | 1,587 | $ | 1,410 | ||||||||||||||||||||||||||
|
(1)
|
Yields on tax exempt assets have been calculated on a fully tax equivalent basis assuming a tax rate of 34%.
|
|
(2)
|
Includes investment in restricted stock at cost.
|
23
Management analyzes interest income and interest expense by segregating rate and volume components of earning assets and interest bearing liabilities. The impact changes in the interest rates earned and paid on assets and liabilities, along with changes in the volumes of earning assets and interest bearing liabilities, have on net interest income are summarized as follows. The net change or mix component, attributable to the combined impact of rate and volume changes within earning assets and interest bearing liabilities’ categories, has been allocated proportionately to the change due to rate and the change due to volume.
TABLE 2
Rate/Volume Analysis of Changes in Net Interest Income
(In Thousands)
|
2010 to 2009
|
2009 to 2008
|
|||||||||||||||||||||||
|
Increase (Decrease) Due to
|
Increase (Decrease) Due to
|
|||||||||||||||||||||||
|
Total
|
Rate
|
Volume
|
Total
|
Rate
|
Volume
|
|||||||||||||||||||
|
Interest Income
|
||||||||||||||||||||||||
|
Loans
|
||||||||||||||||||||||||
|
Real Estate
|
$ | (258 | ) | $ | (225 | ) | $ | (33 | ) | $ | (416 | ) | $ | (502 | ) | $ | 86 | |||||||
|
Installment
|
(179 | ) | (339 | ) | 160 | (187 | ) | (274 | ) | 87 | ||||||||||||||
|
Commercial
|
1,366 | (665 | ) | 2,031 | 226 | (1,082 | ) | 1,308 | ||||||||||||||||
|
Tax Exempt
|
233 | (36 | ) | 269 | (65 | ) | (39 | ) | (26 | ) | ||||||||||||||
|
Other
|
4 | 4 | (5 | ) | (8 | ) | 3 | |||||||||||||||||
|
Total Loans
|
1,166 | (1,265 | ) | 2,431 | (447 | ) | (1,905 | ) | 1,458 | |||||||||||||||
|
Investment Securities
|
||||||||||||||||||||||||
|
Taxable
|
312 | (731 | ) | 1,043 | (1,096 | ) | (404 | ) | (692 | ) | ||||||||||||||
|
Tax Exempt
|
(138 | ) | 5 | (143 | ) | 586 | 4 | 582 | ||||||||||||||||
|
Total Securities
|
174 | (726 | ) | 900 | (510 | ) | (400 | ) | (110 | ) | ||||||||||||||
|
Time Deposits with Other Banks
|
(13 | ) | (8 | ) | (5 | ) | (9 | ) | (12 | ) | 3 | |||||||||||||
|
Fed Funds Sold
|
9 | (4 | ) | 13 | (63 | ) | (68 | ) | 5 | |||||||||||||||
|
Total Interest Income
|
1,336 | (2,003 | ) | 3,339 | (1,029 | ) | (2,385 | ) | 1,356 | |||||||||||||||
|
Interest Expense
|
||||||||||||||||||||||||
|
Interest Bearing Demand Deposits
|
(23 | ) | (73 | ) | 50 | 40 | (22 | ) | 62 | |||||||||||||||
|
Regular Savings Deposits
|
321 | (286 | ) | 607 | 477 | 1 | 476 | |||||||||||||||||
|
Money Market Savings Deposits
|
(66 | ) | (96 | ) | 30 | (257 | ) | (246 | ) | (11 | ) | |||||||||||||
|
Time Deposits
|
(864 | ) | (496 | ) | (368 | ) | (1,958 | ) | (1,234 | ) | (724 | ) | ||||||||||||
|
Total Interest Bearing Deposits
|
(632 | ) | (951 | ) | 319 | (1,698 | ) | (1,501 | ) | (197 | ) | |||||||||||||
|
Other Borrowings
|
(128 | ) | (350 | ) | 222 | (198 | ) | (223 | ) | 25 | ||||||||||||||
|
Total Interest Expense
|
(760 | ) | (1,301 | ) | 541 | (1,896 | ) | (1,724 | ) | (172 | ) | |||||||||||||
|
Net Interest Income
|
$ | 2,096 | $ | (702 | ) | $ | 2,798 | $ | 867 | $ | (661 | ) | $ | 1,528 | ||||||||||
For the year ended December 31, 2010, tax equivalent net interest income increased $2.1 million to $20.7 million from $18.6 million in 2009. A positive volume variance, partially offset by a negative rate variance led to the improvement.
Changes in the volumes of earning assets and interest bearing liabilities contributed to an increase of $2.8 million in net interest income. Average earning assets grew $77.7 million to $517.1 million in 2010 from $439.4 million in 2009 and accounted for a $3.3 million increase in tax equivalent interest income. Average loans, net of unearned income, rose $42.2 million or 13.1%, which caused interest income to increase by $2.4 million. In addition, average investments grew $26.7 million or 25.2% comparing 2010 and 2009, which resulted in additional interest income of $900 thousand.
24
Average interest bearing liabilities rose $60.2 million or 16.5% to $424.8 million in 2010 from $364.6 million in 2009. The growth resulted in a net increase in interest expense of $541 thousand. Having the greatest impact was a $49.4 million increase in savings deposits, which caused interest expense to increase $607 thousand. In addition, other borrowings grew $8.3 million, which in aggregate caused a $222 thousand increase in interest expense.
An unfavorable rate variance resulted in a decrease of $702 thousand in tax equivalent net interest income. Reductions in loan and investment yields, more than offset decreases in funding costs. The tax equivalent yield on earning assets decreased 63 basis points to 5.26% in 2010 from 5.89% in 2009, resulting in a reduction in interest income of $2.0 million. Specifically, the tax equivalent yield on the loan portfolio decreased 40 basis points to 5.79% in 2010 from 6.19% in 2009. The decrease in loan yields resulted in a decline in interest income of $1.3 million in 2010. In addition, the yield on the investment portfolio decreased 98 basis points accounting for a $726 thousand decrease in tax equivalent interest income.
The reduction in interest income was partially mitigated by a decrease of $1.3 million in interest expense, which resulted from a 46 basis point decrease in the cost of funds to 1.53% in 2010 from 1.99% in 2009. We experienced significant reductions in the rates paid for both interest bearing transaction accounts as well as time deposits and other borrowings. Specifically, the cost of money market, NOW and savings accounts decreased 30 basis points, 21 basis points and 22 basis points comparing 2010 and 2009. These decreases resulted in reductions in interest expense of $96 thousand, $73 thousand and $286 thousand. With regard to time deposits, the average rate paid for time deposits decreased 47 basis points, which resulted in a $496 thousand decrease in interest expense. The average rate paid on short-term borrowings declined 59 basis points, resulting in a $350 thousand reduction in interest expense.
Comparing 2009 to 2008, tax equivalent net interest income increased $867 thousand to $18.6 million from $17.7 million in 2008. A favorable volume variance, partially offset by an unfavorable rate variance led to the improvement.
Changes in the volumes of earning assets and interest bearing liabilities contributed to an increase of $1.5 million in net interest income. Average earning assets grew $21.9 million to $439.4 million in 2009 from $417.5 million in 2008 and accounted for a $1.4 million increase in tax equivalent interest income. Average loans, net of unearned income, grew $23.3 million or 7.8%, which caused interest income to increase by $1.5 million. Average investments decreased $4.5 million comparing 2009 and 2008, which resulted in a reduction in interest income of $110 thousand. Average interest bearing liabilities rose $17.2 million or 5.0% to $364.6 million in 2009 from $347.4 million in 2008. Having the greatest impact was a $36.7 million increase in savings deposits, which caused interest expense to increase $476 thousand.
An unfavorable rate variance resulted in a decrease of $661 thousand in tax equivalent net interest income. Reductions in loan and investment yields, more than offset decreases in funding costs. The tax equivalent yield on earning assets decreased 55 basis points to 5.89% in 2009 from 6.44% in 2008, resulting in a reduction in interest income of $2.4 million. Specifically, the tax equivalent yield on the loan portfolio decreased 64 basis points to 6.19% in 2009 from 6.83% in 2008. The decrease in loan yields resulted in a decline in interest income of $1.9 million in 2009. In addition, the yield on the investment portfolio decreased 23 basis points accounting for a $400 thousand decrease in tax equivalent interest income.
The reduction in interest income was partially mitigated by a decrease of $1.7 million in interest expense, which resulted from a 64 basis point decrease in the cost of funds to 1.99% in 2009 from 2.63% in 2008. We experienced significant reductions in the rates paid for money market and time deposits. Money markets rates decreased 72 basis points and accounted for a decrease in interest expense of $246 thousand, while time deposits rates decreased 93 basis points causing a decline in interest expense of $1.2 million.
PROVISION FOR LOAN LOSSES
The provision and allowance for loan losses are based on management’s ongoing assessment of the Company’s credit exposure and consideration of other relevant factors. The allowance for loan losses is a valuation reserve that is available to absorb future loan charge-offs. The provision for loan losses is the amount charged to earnings on an annual basis. The factors considered in management’s assessment of the reasonableness of the allowance for loan losses include prevailing and anticipated economic conditions, assigned risk ratings on loan exposures, the results of examinations and appraisals of the loan portfolio conducted by regulatory authorities and an independent loan review firm, the diversification and size of the loan portfolio, the level of and inherent risk in non-performing assets, and any other factors deemed relevant by management.
25
The provision for loan losses was $2.2 million, $1.7 million and $713 thousand for 2010, 2009, and 2008, respectively. Net charge-offs for 2010 and 2009 were $1.4 million. As of December 31, 2010 and 2009, the allowance for loan loss was 1.05% and 0.99% of loans, net. After allocation of reserves to all non-accrual and special-mention loans, as well as applying a percentage to outstanding loans based on the loss history of such loans in each category and other qualitative factors, the opinion of management was that the allowance for loan losses was adequate to provide for losses that can be reasonably anticipated. Management’s periodic evaluation of the adequacy of the allowance is based on the Bank’s past loan loss experience, known or inherent risks in the portfolio, adverse situations that may affect the borrower’s ability to repay, the estimated value of any underlying collateral, composition of the loan portfolio, current economic conditions and other relevant factors. Management believed that certain risks, particularly the prolonged economic downturn, warranted an increase in the allowance for loan losses for the year ended December 31, 2010. The ratio of allowance for loan loss to non-accrual loans was 62.95% at year end 2010 compared to 132.00% at year end 2009 and 498.67% at year end 2008.
OTHER INCOME
The following table analyzes the changes in other income for 2010, 2009 and 2008.
TABLE 3
(In Thousands)
|
Variance
|
||||||||||||||||||||||||||||
|
Year Ended December 31,
|
2010 vs 2009
|
2009 vs 2008
|
||||||||||||||||||||||||||
|
2010
|
2009
|
2008
|
Amount
|
Percent
|
Amount
|
Percent
|
||||||||||||||||||||||
|
Customer Service Fees
|
$ | 2,043 | $ | 1,950 | $ | 2,006 | $ | 93 | 4.77 | % | $ | (56 | ) | (2.79 | %) | |||||||||||||
|
Investment Division Commission Income
|
305 | 341 | 411 | (36 | ) | (10.56 | %) | (70 | ) | (17.03 | %) | |||||||||||||||||
|
Earnings on Investment on Life Insurance
|
322 | 342 | 296 | (20 | ) | (5.85 | %) | 46 | 15.54 | % | ||||||||||||||||||
|
Mortgage Banking Income
|
417 | 438 | 148 | (21 | ) | (4.79 | %) | 290 | 195.95 | % | ||||||||||||||||||
|
Other Income
|
640 | 467 | 458 | 173 | 37.04 | % | 9 | 1.97 | % | |||||||||||||||||||
|
Income from other real estate
|
381 | 242 | 0 | 139 | 57.44 | % | 242 | 100.00 | % | |||||||||||||||||||
|
Gains (Losses) on Security Sales
|
346 | (492 | ) | 128 | 838 | 170.33 | % | (620 | ) | (484.38 | %) | |||||||||||||||||
|
Other than Temporary Impairment
|
(164 | ) | (206 | ) | (5,256 | ) | 42 | 20.39 | % | 5,050 | 96.08 | % | ||||||||||||||||
|
Total Other Income
|
$ | 4,290 | $ | 3,082 | $ | (1,809 | ) | $ | 1,208 | 39.20 | % | $ | 4,891 | 270.37 | % | |||||||||||||
Non-interest income increased $1.2 million or 39.20% in 2010 compared to non-interest income of $3.1 million in 2009. In comparison, non-interest income increased $4.9 million or 270.37% in 2009 compared to a loss of $1.8 million in 2008.
Non-interest income includes items that are not related to interest rates on loans and investments, but rather to services rendered and activities conducted in conjunction with the operation of a commercial bank. Service charges earned on deposit accounts is the largest single item in this category and represents fees related to deposit accounts including overdraft fees, minimum balance fees, and transaction fees. In 2010, service charges and fees increased $93 thousand or 4.77% compared to a decrease of $56 thousand or 2.79% in 2009.
Commissions earned by the Investment Division were $305 thousand in 2010 compared to $341 thousand in 2009, a decrease of $36 thousand or 10.56%. Investing activity continued to be slow in 2010 as customers sought the safety of FDIC insurance offered by bank deposits. In comparison, commissions earned by the Investment Division were $341 thousand in 2009, compared to $411 thousand in 2008, a decrease of $70 thousand, or 17.03%. Financial markets started to fall in late 2008 and investors sought safe alternatives, such as FDIC insured bank deposits throughout 2009.
Earnings on investment in life insurance were $322 thousand in 2010, compared to $342 thousand in 2009, a decrease of $20 thousand or 5.85%. Crediting rates which represent the earnings on BOLI products are expressed in percentage terms and react to market conditions much like interest rates. The crediting rates have declined as a result of the economic downturn much the same as interest rates have declined. In 2009, earnings on investment in life insurance amounted to $342 thousand, compared to $296 thousand in 2008, an increase of $46 thousand, or 15.54%. While there were no additional investments in BOLI, there was a transfer of nearly $2.0 million in BOLI investment to a new carrier in which the crediting rates applied to the insurance increased significantly.
26
Mortgage banking income totaled $417 thousand in 2010, compared to $438 thousand in 2009, a decrease of $21 thousand or 4.79%. In comparison, mortgage banking income amounted to $438 thousand in 2009 while those fees totaled $148 thousand in 2008, an increase of $290 thousand or 195.95%. This was due to a large volume of mortgage loan sales in 2009 at premium levels compared to 2008. Income recognized through mortgage sales increased steadily as more customers were attracted by the rates offered by Fannie Mae.
Other income was $640 thousand in 2010, compared to $467 thousand in 2009, an increase of $173 thousand or 37.04% when compared to 2009. The most significant increase was from the tax exempt cash surrender value received from BOLI in the first quarter of 2010. In comparison, other income was $467 thousand in 2009, compared to $458 thousand in 2008, an increase of $9 thousand or 1.97% compared to 2008.
Income recognized from other real estate totaled $381 thousand in 2010, compared to $242 thousand in 2009, an increase of $139 thousand or 57.44%. This income was generated from the operations of a large commercial enterprise which was taken by the Bank in lieu of foreclosure in 2006. The Bank enlisted the services of a management firm in 2009 and has seen the income from this operation continue to increase. In comparison, income from other real estate was $242 thousand in 2009 while no income was reflected in 2008. This increase was also attributable to the services rendered by the management company in the operation of the same commercial enterprise.
In 2010, the Company had gains of $346 thousand realized through sales of available for sale securities compared to a loss of $492 thousand in 2009, an increase of $838 thousand or 170.33%. Comparing 2009 to 2008, the Company had losses of $492 thousand realized through sales of available for sale securities in 2009 compared to gains of $128 thousand in 2008, a decrease of $620 thousand or 484.38%. The decrease experienced in 2009 was largely due to one corporate security in which a substantial loss was experienced.
In 2010, OTTI charges for three equity positions for $140 thousand and $24 thousand for two preferred equity positions in the FHLMC (“Freddie Mac’s) were charged against income. In 2009, OTTI charges in relation to three equity positions totaled $206 thousand. In 2008, OTTI charges were recorded in relation to five equity positions held by the Company of $387 thousand, two Freddie Mac’s totaling $2.3 million and two corporate bonds in the amount of $2.6 million. The amount of impairment charged against income for the year ended December 31, 2008 was $5.3 million. These, as well as all securities will be monitored in future quarters for any further deterioration.
As a result of the Emergency Economic Stabilization Act of 2008 (“ESSA”) the resulting deferred tax asset created by the OTTI of the Company’s preferred equity holdings in the FHLMC did not require a valuation allowance to be recognized. The loss was determined to be ordinary for tax purposes under the EESA and any future gains realized from selling those FHLMC holdings would also be treated as ordinary for income tax purposes. See Note 9 of the Notes to the Consolidated Financial Statements in this Report on Form 10-K for further discussion of the realization of deferred tax assets, included that portion related to capital losses on equity securities.
27
OTHER EXPENSES
The following table analyzes the changes in other expenses for 2010, 2009 and 2008.
TABLE 4
(In Thousands)
|
Variance
|
||||||||||||||||||||||||||||
|
Year Ended December 31,
|
2010 vs 2009
|
2009 vs 2008
|
||||||||||||||||||||||||||
|
2010
|
2009
|
2008
|
Amount
|
Percent
|
Amount
|
Percent
|
||||||||||||||||||||||
|
Salaries and Employee Benefits
|
$ | 5,498 | $ | 5,532 | $ | 4,831 | $ | (34 | ) | (0.61 | %) | $ | 701 | 14.51 | % | |||||||||||||
|
Occupancy
|
858 | 814 | 733 | 44 | 5.41 | % | 81 | 11.05 | % | |||||||||||||||||||
|
Equipment
|
561 | 546 | 493 | 15 | 2.75 | % | 53 | 10.75 | % | |||||||||||||||||||
|
FDIC Insurance and Assessments
|
787 | 900 | 227 | (113 | ) | (12.56 | %) | 673 | 296.48 | % | ||||||||||||||||||
|
Professional Fees and Outside Services
|
640 | 588 | 520 | 52 | 8.84 | % | 68 | 13.08 | % | |||||||||||||||||||
|
Computer Services and Supplies
|
1,082 | 1,053 | 970 | 29 | 2.75 | % | 83 | 8.56 | % | |||||||||||||||||||
|
Taxes, Other Than Payroll and Income
|
389 | 346 | 400 | 43 | 12.43 | % | (54 | ) | (13.50 | %) | ||||||||||||||||||
|
Amortization Expense-Deposit Premiums
|
258 | 258 | 258 | 0 | 0.00 | % | 0 | 0.00 | % | |||||||||||||||||||
|
Stationery and Printing Supplies
|
379 | 357 | 360 | 22 | 6.16 | % | (3 | ) | (0.83 | %) | ||||||||||||||||||
|
Advertising
|
403 | 297 | 201 | 106 | 35.69 | % | 96 | 47.76 | % | |||||||||||||||||||
|
Penalty Assessment – Long Term Borrowings
|
718 | 0 | 0 | 718 | 100.00 | % | 0 | 0.00 | % | |||||||||||||||||||
|
Other
|
1,672 | 1,699 | 1,684 | (27 | ) | (1.59 | %) | 15 | 0.89 | % | ||||||||||||||||||
|
Total Other Expense
|
$ | 13,245 | $ | 12,390 | $ | 10,677 | $ | 855 | 6.90 | % | $ | 1,713 | 16.04 | % | ||||||||||||||
Total non-interest expense increased from $12.4 million in 2009 to $13.2 million in 2010, an increase of $855 thousand or 6.90%.
Salaries and related benefits decreased $34 thousand or 0.61% in 2010. The full-time equivalent number of employees was 124 as of December 31, 2010, compared to 125 as of December 31, 2009. A reduction in health insurance costs of $126 thousand more than offset any salary increases. 2010 was the first year that the Company recognized funding credits from a self insured health consortium. In comparison, salaries and related benefits increased $701 thousand or 14.51%, comparing 2009 to 2008. The full-time equivalent number of employees was 125 as of December 31, 2009, compared to 120 as of December 31, 2008. Full year employment costs associated with the addition of the Glenburn Township office, as well as annual merit increases, and increased health insurance costs contributed to the overall increase in salary and benefit expenses in 2009. Furthermore, 2009 was a year of transition as a new President and Chief Executive Officer was appointed by the Company. Costs associated with fulfilling contract obligations for the former President and Chief Executive Officer were also accountable for the increase in 2009.
Occupancy expense increased 5.41% or $44 thousand in 2010 compared to 2009. The largest increase in occupancy expenses was depreciation and maintenance related to a new facility in Meshoppen Township. These expenses associated with the new office caused an increase in occupancy expense in 2010 of $20 thousand to $33 thousand, or more than double the amount expended for comparable expenses associated with this office in 2009. In comparison, in 2009 occupancy expense increased 11.05% or $81 thousand compared to fiscal year 2008. The largest increase in occupancy expenses was depreciation expense and maintenance related to the new office in Glenburn Township. Such expenses associated with the new office caused an increase to occupancy expense in 2009 of $60 thousand or 18.75% to $380 thousand compared to $320 thousand for the same period in 2008.
Equipment expense increased in 2010 to $561 thousand from $546 thousand in 2009. The increase in 2010 is also in large part due to additional depreciation and maintenance costs associated with new equipment placed in service at the Meshoppen Township office in 2010. Depreciation and maintenance expense on furniture and equipment increased $19 thousand in 2010 compared to 2009 for this office. In comparison, furniture and equipment expense increased in 2009 to $546 thousand from $493 thousand in 2008. The increase in 2009 was in large part due to additional depreciation costs associated with equipment in service at the Glenburn Township office. Depreciation expense on furniture and equipment was $159 thousand in 2009, compared to $122 thousand in 2008, an increase of $37 thousand or 30.33%.
28
FDIC insurance and assessments were $787 thousand in 2010 compared to $900 thousand in 2009, a decrease of $113 thousand or 12.56%. This decrease is due to the special one-time assessment which was payable on September 30, 2009 in the amount of $210 thousand. There was no comparable charge in 2010. Refer to Part I, Item 1 of this Annual Report on Form 10-K for a discussion of FDIC insurance and assessments. In comparison, FDIC insurance and assessments were $900 thousand in 2009 compared to $227 thousand in 2008, an increase of $673 thousand or 296.48%. The increase was due to the new risk-based deposit assessment system adopted by the FDIC beginning in 2007 whereby assessment rates were increased for all insured institutions. Under this system, all FDIC insured institutions are required to pay deposit premiums. In addition to the increased assessment rates, the FDIC levied a special one-time assessment which was payable on September 30, 2009 in the amount of $210 thousand.
Professional fees and outside services were $640 thousand in 2010 compared to $588 thousand in 2009, an increase of $52 thousand, or 8.84%. This increase is not deemed to be indicative of any trends as expenses were incurred in 2010 relative to various consulting and review engagements. In 2010, the Bank converted from a national charter to a state charter. This, as well as other challenges faced as the Bank grows and expands, requires the assistance of legal and consulting experts which can be difficult to enumerate. In comparison, professional fees and outside services were $588 thousand in 2009 compared to $520 thousand in 2008, an increase of $68 thousand, or 13.08%.
In 2010, computer services and supplies increased $29 thousand, or 2.75%. This increase was in line with budget expectations for 2010 as the Company worked to implement new technologies. In comparison, in 2009, computer services and supplies increased $83 thousand, or 8.56%.
Taxes, other than payroll and income increased in 2010 by $43 thousand, or 12.43%, to $389 thousand, from $346 thousand in 2009. This increase is not considered to be significant and it was noted that shares tax owed to Pennsylvania grew as a proportion of the overall growth in Company assets. The increase was in line with the budgeted amount of $360 thousand for 2010 in light of the considerable growth in total assets in 2010. In comparison, taxes, other than payroll and income, decreased in 2009, to $346 thousand, from $400 thousand in 2008, a decrease of $54 thousand, or 13.50%. This decrease was not considered to be significant and was in line with the budgeted amount of $340 thousand for 2009.
Amortization expense-deposit acquisition premiums was constant at $258,000 in 2010, 2009 and 2008.
Stationery and printing supplies increased by $22 thousand or 6.16%, to $379 thousand from $357 thousand in 2009. The increase was a result of the change in Bank name to Peoples Neighborhood Bank and the conversion to a state charter in 2010. Stationery and printing supplies decreased by $3 thousand or 0.83%, to $357 thousand in 2009 from $360 thousand in 2008.
Advertising expense increased by $106 thousand or 35.69%, to $403 thousand in 2010 compared to $297 thousand in 2009. The increase was a function of incurring additional advertising expenses related to promoting new markets and accounts specific to natural gas drilling. Advertising expense increased by $96 thousand or 47.76%, to $297 thousand in 2009 from $201 thousand in 2008. The increase was attributed to an increase in marketing efforts for new markets.
Penalty assessments totaling $718 thousand were levied on the Company by the FHLB in relation to the early payoff of two separate term borrowing arrangements in 2010. This strategic initiative will have a positive impact on earnings through the recognition of lower interest expense in the future.
In 2010, other expenses decreased $27 thousand or 1.59%. In 2009, other expenses increased $15 thousand or 0.89%.
FEDERAL INCOME TAXES
The provision for income taxes was $1.4 million in 2010, $923 thousand in 2009 and $87 thousand in 2008. The effective tax rate, which is the ratio of income tax expense to income before taxes, was 18% in 2010, 15% in 2009, and 3% in 2008. The tax rate for all periods was substantially less than the federal statutory rate of 34% primarily due to tax-exempt securities and loan income. Please refer to Note 9 of the Notes to Consolidated Financial Statements included as part of this Annual Report on Form 10-K for further analysis of federal income tax expense.
29
REVIEW OF FINANCIAL POSITION
Total assets increased $42.1 million or 8.15% to $558.6 million at December 31, 2010, from $516.5 million at December 31, 2009. For the year ended December 31, 2010, total assets averaged $548.5 million, an increase of $77.6 million or 16.48%, from $470.9 million for the same period of 2009. Total assets amounted to $472.4 million at December 31, 2008 and averaged $447.7 million during 2008. The balance sheet growth was driven by increases in total deposits of $28.7 million in 2010 and $38.7 million in 2009. Total interest bearing deposits increased $26.9 million, while noninterest bearing deposits rose $1.8 million comparing year-end 2010 to 2009. Interest bearing deposits and non-interest bearing deposits grew $22.3 million and $16.5 million, respectively, from December 31, 2008 to December 31, 2009. At December 31, loans, net amounted to $390.8 million in 2010, $335.5 million in 2009 and $316.6 million in 2008. Total stockholders’ equity increased 12.33%, or $5.5 million, from year-end 2009 to $50.5 million at December 31, 2010. Comparing year-end 2009 to 2008, stockholders’ equity increased 13.22% or $5.3 million.
LOAN PORTFOLIO
In 2010, loans to commercial borrowers helped fuel the growth in the loan portfolio. Retail loans, including residential mortgages and consumer loans, increased marginally during 2010. With lower interest rates for 30 years fixed rate loans, most of the residential mortgages originated were sold in the secondary market, causing growth in this part of our loan portfolio to slow.
TABLE 5
Loan Portfolio Distribution
(In Thousands)
|
December 31,
|
||||||||||||||||||||
|
2010
|
2009
|
2008
|
2007
|
2006
|
||||||||||||||||
|
Commercial
|
$ | 112,526 | $ | 82,287 | $ | 71,723 | $ | 63,536 | $ | 60,740 | ||||||||||
|
Real Estate:
|
||||||||||||||||||||
|
Commercial
|
136,910 | 116,294 | 107,084 | 92,705 | 80,605 | |||||||||||||||
|
Residential
|
119,424 | 116,150 | 120,813 | 116,845 | 112,803 | |||||||||||||||
|
Consumer
|
21,912 | 20,802 | 16,988 | 17,889 | 16,947 | |||||||||||||||
|
Loans, net
|
390,772 | 335,533 | 316,608 | 290,975 | 271,095 | |||||||||||||||
|
Less: Allowance for Loan Losses
|
4,100 | 3,337 | 3,002 | 2,451 | 1,792 | |||||||||||||||
|
Net Loans
|
$ | 386,672 | $ | 332,196 | $ | 313,606 | $ | 288,524 | $ | 269,303 | ||||||||||
Loans, net continued to increase in 2010, ending the year at $390.8 million compared to $335.5 million at year-end 2009, an increase of 16.48%. Commercial loans, including commercial and commercial mortgage loans grew 25.61% to close the year at $249.4 million, compared to $198.6 million at year-end 2009. Residential mortgages were up 2.82% to $119.4 million, compared to $116.2 million at December 31, 2009, an increase of $3.2 million. The residential mortgage portfolio increased in 2010, despite the sale of $10.0 million to Fannie Mae and FHLB. The Bank will continue to sell mortgages on the secondary market in order to attract and retain mortgage loans by offering competitive rates and terms. Consumer loans increased $1.1 million or 5.34% to $21.9 million at December 31, 2010, from $20.8 million at the end of 2009.
The continued growth in commercial lending was due, in part, to a concerted effort by management to increase the Bank’s exposure to this lending segment. In addition, consolidations of community banks in our market area and an increase in asset quality issues faced by other local financial institutions increased the Bank’s loan demand. The tax equivalent yield on the loan portfolio was 5.79% in 2010, 6.19% in 2009 and 6.83% in 2008.
30
The following table illustrates the distribution of maturity by major loan type.
TABLE 6
Maturity Distribution
(In Thousands)
|
One Year
|
Over One Year
|
Over
|
Total
|
|||||||||||||
|
Or Less
|
Within Five Years
|
Five Years
|
Loans
|
|||||||||||||
|
Commercial
|
$ | 16,885 | $ | 32,331 | $ | 63,310 | $ | 112,526 | ||||||||
|
Real-Estate:
|
||||||||||||||||
|
Commercial
|
7,445 | 30,668 | 98,797 | 136,910 | ||||||||||||
|
Residential
|
5,181 | 20,936 | 93,307 | 119,424 | ||||||||||||
|
Consumer
|
4,702 | 9,829 | 7,381 | 21,912 | ||||||||||||
|
Total
|
$ | 34,213 | $ | 93,764 | $ | 262,795 | $ | 390,772 | ||||||||
|
Predetermined Interest Rates
|
$ | 20,132 | $ | 45,790 | $ | 43,290 | $ | 109,212 | ||||||||
|
Adjustable Interest Rates
|
14,081 | 47,974 | 219,505 | 281,560 | ||||||||||||
|
Total
|
$ | 34,213 | $ | 93,764 | $ | 262,795 | $ | 390,772 | ||||||||
The Bank has 8.76% of its loans maturing within the next year. Of those maturing within one year, the majority are commercial loans with the remainder split between mortgages and consumer loans. In the one-to-five year maturity range, the Bank has 23.99% of its loan portfolio maturing. The over-five-year maturity group makes up 67.25% of the portfolio. In comparison, at December 31, 2009, the Bank had 9.19% of its loans maturing within one year. In the one-to-five year maturity range, the Bank had 31.95% of its portfolio. The over-five-year maturity group made up 58.86% of the portfolio.
In an attempt to limit IRR and liquidity strains, we continually examine the maturity distribution and interest rate sensitivity of the loan portfolio. For 2010, market interest rates remained at historically low levels. Accordingly, we continued to place emphasis on originating loans with interest rates that have short repricing terms. Upon the threat of rising interest rates, we will increase our emphasis in promoting floating-rate loans that reprice immediately with changes in the prime rate. Adjustable-rate loans represented 72.05% of the loan portfolio at December 31, 2010, compared to 73.06% at the end of 2009.
ASSET QUALITY
Credit quality continued to be of great concern in 2010 to the banking industry and bank regulators given the current state of the economy, characterized by high unemployment and record foreclosure and delinquency rates. As a result, management is committed to developing and maintaining sound, quality assets through employing credit risk management policies and procedures. Credit risk is the risk to earnings or capital which arises from a borrower’s failure to meet the terms of their loan agreement. The Company manages credit risk by diversifying the loan portfolio and applying policies and procedures designed to foster sound lending practices. These policies include certain standards that assist lenders in making judgments regarding the character, capacity, capital structure and collateral of the borrower.
With respect to lending procedures, lenders must determine the borrower’s ability to repay the credit based on prevailing and expected market conditions prior to requesting approval for the loan. The Board of Directors establishes and reviews, at least annually, the lending authority for all loan officers and branch managers. Credits beyond the scope of the loan officers and branch managers are forwarded to the Loan Committee. This Committee, comprised of senior management, attempts to assure the quality of the loan portfolio through careful analysis of credit applications, adherence to credit policies and the examination of outstanding loans and delinquencies. These procedures assist in the early detection and timely follow-up of problem loans. Credits in excess of $2.0 million, or having an aggregate relationship of $2.5 million, are subject to approval by our Board of Directors.
Credit risk is also minimized by quarterly internal and external reviews of the loan portfolio. These reviews aid us in identifying deteriorating financial conditions of borrowers, allowing management to assist customers in remedying these situations.
31
Nonperforming assets consist of nonperforming loans and foreclosed assets. Nonperforming loans include nonaccrual loans, restructured loans and accruing loans past due 90 days or more. For a discussion of the Company’s policy regarding nonperforming assets, refer to the note entitled, “Summary of significant accounting policies — Nonperforming assets,” in the Notes to Consolidated Financial Statements to this Annual Report.
Information concerning nonperforming assets for the past five years is summarized as follows. The table includes credits classified for regulatory purposes and all material credits that cause us to have serious doubts as to the borrower’s ability to comply with present loan repayment terms.
TABLE 7
Distribution of Nonperforming Assets
(In Thousands)
|
December 31,
|
||||||||||||||||||||
|
2010
|
2009
|
2008
|
2007
|
2006
|
||||||||||||||||
|
Non-accrual
|
$ | 6,513 | $ | 2,528 | $ | 829 | $ | 395 | $ | 445 | ||||||||||
|
Restructured
|
0 | 559 | 4,042 | 0 | 0 | |||||||||||||||
|
Accruing Loans Past Due 90 Days or More
|
392 | 239 | 245 | 91 | 275 | |||||||||||||||
|
Total Nonperforming Loans
|
6,905 | 3,326 | 5,116 | 486 | 720 | |||||||||||||||
|
Other Real Estate
|
3,387 | 5,534 | 5,171 | 4,675 | 5,062 | |||||||||||||||
|
Total Nonperforming Assets
|
$ | 10,292 | $ | 8,860 | $ | 10,287 | $ | 5,161 | $ | 5,782 | ||||||||||
|
Nonperforming Loans to Total Loans at Period-end
|
1.77 | % | 0.99 | % | 1.62 | % | 0.17 | % | 0.27 | % | ||||||||||
|
Nonperforming Assets to Period-end Loans and Other Real Estate
|
2.61 | % | 2.60 | % | 3.20 | % | 1.75 | % | 2.10 | % | ||||||||||
Nonperforming assets increased $1.4 million to $10.3 million or 2.61% percent of loans, net and other real estate at December 31, 2010, from $8.9 million or 2.60% at the end of 2009. The deterioration resulted primarily from an increase of $4.0 million in non-accrual loans offset by an improvement of $2.1 million in foreclosed assets. Conversely, nonperforming assets decreased $1.4 million comparing year-end 2008 and 2009. Nonperforming loans totaled $10.3 million or 3.20% percent of loans, net and other real estate at December 31, 2008. Nonperforming loans were $6.9 million, $3.3 million and $5.1 million at December 31, 2010, 2009 and 2008.
Allowance for Loan Losses
Management maintains the allowance for loan losses at a level believed adequate to absorb probable credit losses related to specifically identified loans, as well as probable incurred losses inherent in the remainder of the loan portfolio as of the balance sheet date. The balance in the allowance for loan losses account is based on past events and current economic conditions. We employ the FFIEC Interagency Policy Statement, as amended, and GAAP in assessing the adequacy of the allowance account. Under GAAP, the adequacy of the allowance account is determined based on the provisions of FASB ASC 310 for loans specifically identified to be individually evaluated for impairment and the requirements of FASB ASC 450, for large groups of smaller-balance homogeneous loans to be collectively evaluated for loss contingencies.
We follow our systematic methodology in accordance with procedural discipline by applying it in the same manner regardless of whether the allowance is being determined at a high point or a low point in the economic cycle. Each quarter, our loan review division identifies those loans to be individually evaluated for impairment and those to be collectively evaluated for impairment utilizing standard criteria. Internal loan review grades are assigned quarterly to loans identified to be individually evaluated. A loan’s grade may differ from period to period based on current conditions and events, however, we consistently utilize the same grading system each quarter.
For a further discussion of our accounting policies for determining the amount of the allowance and a description of the systematic analysis and procedural discipline applied, refer to the note entitled, “Summary of significant accounting policies — Allowance for loan losses,” in the Notes to Consolidated Financial Statements to this Annual Report.
32
The following is a summary of loans charged off, recoveries and provisions to the allowance for loan losses for the periods presented.
TABLE 8
Summary of Loan Loss Experience
(In Thousands)
|
Year Ended December 31,
|
||||||||||||||||||||
|
2010
|
2009
|
2008
|
2007
|
2006
|
||||||||||||||||
|
Balance at Beginning of Period
|
$ | 3,337 | $ | 3,002 | $ | 2,451 | $ | 1,792 | $ | 2,375 | ||||||||||
|
Charge Offs
|
||||||||||||||||||||
|
Commercial
|
1,360 | 1,367 | 142 | 0 | 797 | |||||||||||||||
|
Residential Real Estate
|
25 | 46 | 4 | 0 | 21 | |||||||||||||||
|
Consumer
|
104 | 134 | 100 | 73 | 98 | |||||||||||||||
|
Total Charge Offs
|
1,489 | 1,547 | 246 | 73 | 916 | |||||||||||||||
|
Recoveries
|
||||||||||||||||||||
|
Commercial
|
19 | 98 | 44 | 422 | 5 | |||||||||||||||
|
Residential Real Estate
|
0 | 3 | 2 | 3 | 5 | |||||||||||||||
|
Consumer
|
31 | 46 | 38 | 27 | 21 | |||||||||||||||
|
Total Recoveries
|
50 | 147 | 84 | 452 | 31 | |||||||||||||||
|
Net Charge-Offs (Recoveries)
|
1,439 | 1,400 | 162 | (379 | ) | 885 | ||||||||||||||
|
Provision for Loan Losses
|
2,202 | 1,735 | 713 | 280 | 302 | |||||||||||||||
|
Balance at End of Period
|
$ | 4,100 | $ | 3,337 | $ | 3,002 | $ | 2,451 | $ | 1,792 | ||||||||||
|
Allowance for Loan Losses to Period-end Total Loans
|
1.05 | % | 0.99 | % | 0.95 | % | 0.84 | % | 0.66 | % | ||||||||||
|
Allowance for Loan Losses to Non-accrual Loans
|
62.95 | % | 132.00 | % | 498.67 | % | 620.51 | % | 402.70 | % | ||||||||||
|
Net Charge-Offs (Recoveries) to Average Loans
|
0.40 | % | 0.43 | % | 0.05 | % | (0.14 | %) | 0.33 | % | ||||||||||
The allowance for loan losses increased $763 thousand to $4.1 million at December 31, 2010, from $3.3 million at the end of 2009. The increase resulted from a provision for loan losses of $2.2 million exceeding net loans charged-off of $1.4 million. The allowance for loan losses increased $335 thousand or 11.15% comparing year-ends 2009 and 2008. The allowance for loan losses, as a percentage of loans, net of unearned income, was 1.05%, 0.99% and 0.95% at December 31, 2010, 2009 and 2008.
33
The following table details the allocation of the allowance for loan losses to various categories:
TABLE 9
Allocation of Allowance for Loan Losses
(In Thousands)
|
December 31, 2010
|
% of Loan Type to Total Loans
|
December 31, 2009
|
% of Loan Type to Total Loans
|
December 31, 2008
|
% of Loan Type to Total Loans
|
|||||||||||||||||||
|
Commercial
|
$ | 2,448 | 63.83 | % | $ | 1,979 | 59.18 | % | $ | 1,598 | 56.48 | % | ||||||||||||
|
Residential Real Estate Mortgage
|
607 | 30.56 | % | 610 | 34.62 | % | 627 | 38.16 | % | |||||||||||||||
|
Consumer
|
220 | 5.61 | % | 189 | 6.20 | % | 153 | 5.36 | % | |||||||||||||||
|
Non Performing
|
825 | N/A | 559 | N/A | 624 | N/A | ||||||||||||||||||
|
Total Allowance for Loan Losses
|
$ | 4,100 | 100 | % | $ | 3,337 | 100.00 | % | $ | 3,002 | 100.00 | % | ||||||||||||
|
December 31, 2007
|
% of Loan Type
to Total Loans
|
December 31, 2006
|
% of Loan Type
to Total Loans
|
|||||||||||||
|
Commercial
|
$ | 1,428 | 53.70 | % | $ | 1,429 | 52.14 | % | ||||||||
|
Residential Real Estate Mortgage
|
738 | 40.15 | % | 274 | 41.61 | % | ||||||||||
|
Consumer
|
285 | 6.15 | % | 89 | 6.25 | % | ||||||||||
|
Non Performing
|
0 | N/A | 0 | N/A | ||||||||||||
|
Total Allowance for Loan Losses
|
$ | 2,451 | 100.00 | % | $ | 1,792 | 100.00 | % | ||||||||
Management believes the allowance is adequate to cover the inherent risks associated with the loan portfolio. While allocations have been established for particular loan categories, management considers the entire allowance to be available to absorb losses in any category.
SECURITIES
The Company’s securities portfolio is classified, in its entirety, as “available for sale”. Management believes that such classification allows complete flexibility in meeting liquidity and asset liability needs of the Bank. Using this classification, the Company intends to hold these securities for an indefinite amount of time but not necessarily to maturity. Such securities are carried at fair value with the unrealized holding gains or losses, net of taxes, reported in the accumulated other comprehensive income (loss) component of the Company’s stockholders’ equity on the balance sheet. The portfolio is structured to provide a reasonable return on investments while providing a consistent source of liquidity and mitigating the tax burden on the Company.
Available for sale investment securities decreased $8.8 million to $121.8 million at December 31, 2010, from $130.6 million at December 31, 2009. The reduction was a result of strong loan demand in 2010. Available for sale securities increased 22.9 million or 21.28% comparing December 31, 2009 and 2008. Purchases totaled $73.3 million in 2010, $90.5 million in 2009 and $71.6 million in 2008. Repayments of investment securities totaled $19.6 million, $8.3 million and $5.1 million in 2010, 2009 and 2008, respectively. Management sold $64.4 million of securities in 2010 and realized gains on these sales of $346 thousand. Sales of available for sale securities amounted to $62.2 million in 2009 and $58.0 million in 2008. The Company realized a loss of $492 thousand in 2009 and a gain of $128 thousand in 2008 on such sales. At December 31, 2010, the unrealized loss on securities available for sale included in stockholders’ equity totaled $834 thousand, net of tax, compared to unrealized losses of $2.3 million, net of tax, at December 31, 2009. The weighted-average maturity of the securities available for sale portfolio was 12 years at December 31, 2010, with a weighted-average yield of 3.90%.
For additional disclosure with respect to other than temporary impairment on available for sale investment securities refer to Note 2 entitled “Securities” in the Notes to the Consolidated Financial Statements in this Annual Report on Form 10-K.
34
The carrying values of the major classifications of available for sale securities are summarized as follows:
TABLE 10
Securities
(In Thousands)
|
December 31,
|
||||||||||||
|
2010
|
2009
|
2008
|
||||||||||
|
U. S. Government/Agency Obligations
|
$ | 39,118 | $ | 60,465 | $ | 7,958 | ||||||
|
State/Municipal Obligations
|
50,309 | 51,544 | 44,715 | |||||||||
|
Taxable Municipal
|
18,374 | 2,156 | 3,060 | |||||||||
|
Mortgage-backed Securities
|
8,500 | 4,637 | 30,602 | |||||||||
|
Collateralized Mortgage Obligations
|
170 | 203 | 2,163 | |||||||||
|
Corporate/Other
|
4,020 | 10,334 | 16,970 | |||||||||
|
Preferred Equity
|
54 | 85 | 20 | |||||||||
|
Common Equity
|
1,227 | 1,082 | 2,101 | |||||||||
|
Total Securities Available-for-Sale
|
$ | 121,772 | $ | 130,506 | $ | 107,589 | ||||||
The maturity distribution of the amortized cost and weighted-average, tax-equivalent yield of the available for sale portfolio at December 31, 2010, is summarized as follows. The weighted-average yield, based on amortized cost, has been computed for tax exempt state and municipals on a tax-equivalent basis using the prevailing federal statutory tax rate of 34.0 percent. The distributions are based on contractual maturity with the exception of mortgage-backed securities and equity securities. Mortgage-backed securities are presented based upon estimated cash flows, assuming no change in the current interest rate environment. Equity securities with no stated contractual maturities are included in the “Over ten years” maturity distribution. Expected maturities may differ from contractual maturities, or estimated maturities for mortgage-backed securities, because borrowers have the right to call or prepay obligations with or without call or prepayment penalties.
TABLE 11
Securities by Maturities
(In Thousands)
|
1 Year or Less
|
1-5 Years
|
5-10 Years
|
Over 10 Years
|
Total
|
||||||||||||||||||||||||||||||
|
Average
|
Average
|
Average
|
Average
|
Average
|
||||||||||||||||||||||||||||||
|
Balance
|
Yield
|
Balance
|
Yield
|
Balance
|
Yield
|
Balance
|
Yield
|
Balance
|
Yield
|
|||||||||||||||||||||||||
|
Available for Sale
|
||||||||||||||||||||||||||||||||||
|
US Government Agency
|
$ | 0 | 0.00 | % | $ | 7,203 | 2.35 | % | $ | 26,506 | 3.63 | % | $ | 4,424 | 4.20 | % | $ | 38,133 | 3.45 | % | ||||||||||||||
|
State/County/Municipal Obligations
|
0 | 0.00 | % | 6,268 | 3.71 | % | 13,569 | 3.90 | % | 31,952 | 4.13 | % | 51,789 | 4.02 | % | |||||||||||||||||||
|
Taxable Municipals
|
0 | 0.00 | % | 723 | 2.33 | % | 12,435 | 4.96 | % | 5,476 | 5.02 | % | 18,634 | 4.88 | % | |||||||||||||||||||
|
Mortgage-Backed Securities
|
1,805 | 2.61 | % | 3,367 | 2.85 | % | 2,108 | 3.15 | % | 1,240 | 3.24 | % | 8,520 | 2.93 | % | |||||||||||||||||||
|
Collateralized Mortgage Obligations
|
38 | 3.01 | % | 81 | 3.01 | % | 38 | 3.13 | % | 5 | 3.27 | % | 162 | 3.05 | % | |||||||||||||||||||
|
Corporate/Other
|
0 | 0.00 | % | 0 | 0.00 | % | 4,187 | 4.84 | % | 280 | 0.00 | % | 4,467 | 4.54 | % | |||||||||||||||||||
|
Preferred Equity
|
0 | 0.00 | % | 0 | 0.00 | % | 0 | 0.00 | % | 54 | 0.00 | % | 54 | 0.00 | % | |||||||||||||||||||
|
Common Equity
|
0 | 0.00 | % | 0 | 0.00 | % | 0 | 0.00 | % | 1,277 | 2.98 | % | 1,277 | 2.98 | % | |||||||||||||||||||
|
Total Available for Sale
|
$ | 1,843 | 2.62 | % | $ | 17,642 | 2.93 | % | $ | 58,843 | 4.04 | % | $ | 44,708 | 4.16 | % | $ | 123,036 | 3.90 | % | ||||||||||||||
35
DEPOSITS
Table 12 illustrates the Company’s average deposits and other borrowings over the past three years. The table displays both the average balance and the interest rate for each of those periods. The Company experienced significant growth in both 2009 and 2010 with increases of $23.0 million in average deposits in 2009 and $61.4 million in average deposits in 2010. The strength in deposit growth was directly attributable to the continuation of the funds influx from customers receiving lease payments and royalties checks from natural gas companies for drilling rights. The largest increase in both years occurred in the savings account category with $36.6 million in 2009 and $56.4 million in 2010. The Bank experienced a decline in time deposits in both years with a decrease of $26.0 million in 2009 and $15.8 million in 2010. The weighted average interest rate paid on deposits decreased 69 basis points in 2009 and 43 basis points in 2010.
TABLE 12
Deposit Distribution
(In Thousands)
|
2010
|
2009
|
2008
|
||||||||||||||||||||||
|
|
Amount
|
Rate
|
Amount
|
Rate
|
Amount
|
Rate
|
||||||||||||||||||
|
Interest Bearing Demand
|
$ | 42,992 | 0.70 | % | $ | 35,697 | 0.91 | % | $ | 28,871 | 0.98 | % | ||||||||||||
|
Savings Deposits
|
187,007 | 1.08 | % | 130,652 | 1.30 | % | 94,019 | 1.30 | % | |||||||||||||||
|
Money Market Savings
|
36,829 | 0.75 | % | 32,771 | 1.05 | % | 33,858 | 1.77 | % | |||||||||||||||
|
Time Deposits
|
90,522 | 2.32 | % | 106,353 | 2.79 | % | 132,313 | 3.72 | % | |||||||||||||||
|
Total Interest Bearing Deposits
|
357,350 | 1.31 | % | 305,473 | 1.74 | % | 289,061 | 2.43 | % | |||||||||||||||
|
Non-Interest Bearing Demand Deposits
|
72,846 | 63,325 | 56,778 | |||||||||||||||||||||
|
Total
|
$ | 430,196 | $ | 368,798 | $ | 345,839 | ||||||||||||||||||
Table 13 details the maturities of time deposits $100 thousand and more. The table indicates that $7.5 million or 27.46% of these deposits mature within three months. The shorter term category is monitored closely as it relates to short-term liquidity of the Bank. The over twelve month group is the largest portion of these funds accounting for $16.0 million, or 58.63% of the time deposits $100 thousand or more. The steepening of the yield curve has resulted in more deposits in this group. Management controls the risks in liquidity through its monthly monitoring procedures overseen by the ALCO committee.
TABLE 13
Maturity Distribution
(In Thousands)
|
December 31, 2010
|
||||||||
|
Amount
|
Percent
|
|||||||
|
Three Months or Less
|
$ | 7,492 | 27.46 | % | ||||
|
Over Three Months through Six Months
|
1,574 | 5.77 | % | |||||
|
Over Six Months through Twelve Months
|
2,223 | 8.15 | % | |||||
|
Over Twelve Months
|
15,997 | 58.62 | % | |||||
|
Total
|
$ | 27,286 | 100.00 | % | ||||
36
SHORT AND LONG-TERM BORROWINGS
Short-term borrowings, which are overnight or less than 30-day borrowings, consist of securities sold under agreements to repurchase, Federal Home Loan Bank advances, and U.S. Treasury tax and loan notes. Long-term borrowings consist of notes from the Federal Home Loan Bank. These notes are secured under terms of a blanket collateral agreement by a pledge of qualifying investment and mortgage-backed securities, certain mortgage loans and a lien on FHLB stock. For additional information on short and long-term borrowings refer to Notes 6 and 7 of the Notes to Consolidated Financial Statements in this Annual Report on Form 10-K.
CAPITAL ACCOUNTS
Total stockholders’ equity increased 12.33%, or $5.5 million, from year-end 2009 to $50.5 million at December 31, 2010. A common ratio used to determine the effective use of capital is the return on average equity. For the year ended December 31, 2010, this ratio was 13.87%, compared to 12.62% for the year ended December 31, 2009. The Bank’s goal is to maintain a strong capital position as well as to make the best use of capital in the overall growth of the organization. At year-end 2010, the equity-to-assets ratio was 9.04%, compared to 8.71% at year-end 2009.
Comparing year-end 2009 to 2008, stockholders’ equity increased 13.22% or $5.3 million. The return on average equity for the year ended December 31, 2009 ratio was 12.62%, compared to 7.53% for the year ended December 31, 2008. The equity-to-assets ratio was 8.71% and 8.41% comparing year-end 2009 to 2008.
Impacting capital growth in 2010 was net income of $6.5 million, offset by cash dividends of $2.5 million and an improvement in the net unrealized loss on available for sale securities of $1.4 million. Since all securities are available for sale, changes in market values adjusted for taxes are reflected in the equity portion of the balance sheet. A total of $117 thousand in net treasury stock issued increased the capital account to equal the total net change. From time to time, the Company has purchased its stock in the open market or from individuals to leverage the capital account and to provide stock for our dividend reinvestment plan and stock compensation plan. During the year 2010, no shares were purchased in this manner. There were 5,575 shares issued from the treasury stock account by individuals exercising options. The investment banking firms of Boenning & Scattergood Inc. and Stifel Nicolaus & Co., Inc. & Co. make markets in PFSC common stock.
Net income increased capital by $5.0 million in 2009 while dividends reduced it by $2.4 million. The securities portfolio increased in net value by $2.5 million in 2009. A total of $85 thousand in net treasury stock issuance increased the capital account to equal the total net change.
For a discussion of regulatory capital requirements on the Company and Bank, refer to Note 13 entitled, “Regulatory Matters”, in the Notes to Consolidated Financial Statements to this Annual Report on Form 10-K.
INTEREST RATE SENSITIVITY
The operations of the Company do not subject it to foreign currency risk or commodity price risk. The Company does not utilize interest rate swaps, caps, or hedging transactions. In addition, the Company has no market risk sensitive instruments entered into for trading purposes. However, the Company is subject to interest rate risk and employs several different methods to manage and monitor the risk.
Interest rate sensitivity refers to the relationship between market interest rates and the earnings volatility of the Company due to the repricing characteristics of assets and liabilities. The responsibility for monitoring interest rate sensitivity and policy decisions has been given to the Asset/Liability Committee (ALCO) of the Bank. The tools used to monitor sensitivity are the Statement of Interest Sensitivity Gap and Interest Rate Shock Analysis. The Bank uses a software model to measure and analyze interest rate risk. In addition, an independent consulting firm provides a quarterly analysis to validate the findings from our internal analysis. The Statement of Interest Sensitivity Gap is an assessment of the Company’s IRR position and is the primary tool utilized by the ALCO. This report is monitored in an effort to “match” maturities or repricing opportunities of assets and liabilities in order to attain the maximum interest within risk tolerance policy guidelines. Although a credible measuring tool, static gap analysis has inherent limitations in that certain assets and liabilities may react to changes in interest rates in different ways with some categories reacting in advance of changes and some lagging behind the changes. In addition, there are estimates used in determining the actual propensity to change of certain items such as deposits without maturities.
37
The following sets forth the Company’s interest sensitivity analysis as of December 31, 2010:
TABLE 14
Statement of Interest Sensitivity Gap
(In Thousands)
|
Maturity or Repricing In:
|
||||||||||||||||||||
|
3 Months
|
3-6 Months
|
6-12 Months
|
1-5 Years
|
Over 5 Years
|
||||||||||||||||
|
RATE SENSITIVE ASSETS
|
||||||||||||||||||||
|
Interest Bearing Deposits With Other Banks
|
$ | 107 | $ | 0 | $ | 0 | $ | 0 | $ | 0 | ||||||||||
|
Federal Funds Sold
|
11,003 | 0 | 0 | 0 | 0 | |||||||||||||||
|
Securities
|
531 | 374 | 3,707 | 24,121 | 93,039 | |||||||||||||||
|
Loans held for Sale
|
30 | 0 | 0 | 0 | 0 | |||||||||||||||
|
Loans, net
|
63,676 | 20,281 | 51,800 | 189,045 | 65,970 | |||||||||||||||
|
Total Rate Sensitive Assets
|
$ | 75,347 | $ | 20,655 | $ | 55,507 | $ | 213,166 | $ | 159,009 | ||||||||||
|
RATE SENSITIVE LIABILITIES
|
||||||||||||||||||||
|
Interest Bearing Checking
|
$ | 41,471 | $ | 0 | $ | 0 | $ | 0 | $ | 0 | ||||||||||
|
Money Market Deposits
|
36,032 | 0 | 0 | 0 | 0 | |||||||||||||||
|
Regular Savings
|
195,121 | 0 | 0 | 0 | 0 | |||||||||||||||
|
CDs and IRAs
|
22,576 | 9,045 | 9,456 | 49,758 | 1,612 | |||||||||||||||
|
Short-term Borrowings
|
38,724 | 0 | 0 | 0 | 0 | |||||||||||||||
|
Long-term Borrowings
|
236 | 238 | 2,935 | 18,403 | 5,524 | |||||||||||||||
|
Total Rate Sensitive Liabilities
|
$ | 334,160 | $ | 9,283 | $ | 12,391 | $ | 68,161 | $ | 7,136 | ||||||||||
|
Period Gap
|
$ | (258,813 | ) | $ | 11,372 | $ | 43,116 | $ | 145,005 | $ | 151,873 | |||||||||
|
Cumulative Gap
|
$ | (258,813 | ) | $ | (247,441 | ) | $ | (204,325 | ) | $ | (59,320 | ) | $ | 92,553 | ||||||
|
Cumulative RSA to RSL
|
22.55 | % | 27.95 | % | 42.58 | % | 86.01 | % | 121.47 | % | ||||||||||
|
Cumulative Gap to Total Assets
|
(46.33 | %) | (44.30 | %) | (36.58 | %) | (10.62 | %) | 16.57 | % | ||||||||||
The Federal Reserve’s Open Market Committee (FOMC) took no action in 2010 by maintaining the Fed Funds target rate at 0 to 25 basis points. The effect of this has been to generate a steepening in the yield curve throughout 2010. The overall level of market rates is still historically low. The net interest margin in 2010 decreased to 4.00% when compared to 4.23% for the year ended December 31, 2009. The asset side of the Company’s balance sheet has experienced a reduction in yield as variable rate loans have adjusted downward and maturing loans and investments have been reinvested at lower rates. As customers seek more competitive rates on their deposits, the Company has remained diligent in offering deposit alternatives for customers. This has helped to mitigate the loss of deposits to competitors. The net interest margin in 2009 decreased slightly to 4.23% when compared to 4.25% for the year ended December 31, 2008.
LIQUIDITY
Liquidity management is essential to the Company’s continuing operations and enables it to meet financial obligations as they come due, as well as to take advantage of new business opportunities as they arise. Financial obligations include, but are not limited to, the following:
|
•
|
Funding new and existing loan commitments;
|
|
•
|
Payment of deposits on demand or at their contractual maturity;
|
|
•
|
Repayment of borrowings as they mature;
|
|
•
|
Payment of lease obligations; and
|
|
•
|
Payment of operating expenses.
|
The Company’s liquidity position is impacted by several factors which include, among others, loan origination volumes, loan and investment maturity structure and cash flows, demand for core deposits and certificate of deposit maturity structure and retention. These liquidity risks are managed daily, thus enabling the Company to effectively monitor fluctuations in liquidity position and to adapt that position according to market influence and balance sheet trends. Future liquidity needs are forecasted and strategies are developed to ensure adequate liquidity at all times.
38
Historically, core deposits have been the primary source of liquidity because of their stability and lower cost, in general, than other types of funding. Providing additional sources of funds are loan and investment payments and prepayments and the ability to sell both available for sale securities and mortgage loans held for sale. We believe liquidity is adequate to meet both present and future financial obligations and commitments on a timely basis.
On December 23, 2010, the Board of Directors of the Company adopted a Contingency Funding Plan to address liquidity in the event of a funding crisis. Examples of some of the causes of a liquidity crisis include, among others, natural disasters, war, events causing reputational harm and severe and prolonged asset quality problems. The Plan recognizes the need to provide alternative funding sources in times of crisis that go beyond the core deposit base. As a result, a funding program was created that ensures the availability of various alternative wholesale funding sources that can be used whenever appropriate. Identified alternative funding sources include:
|
•
|
FHLB liquidity contingency line of credit;
|
|
•
|
Federal Reserve Bank discount window;
|
|
•
|
Internet certificates of deposit;
|
|
•
|
Brokered deposits;
|
|
•
|
Institutional Deposit Corporation deposits;
|
|
•
|
Repurchase agreements; and
|
|
•
|
Federal funds purchased.
|
Based on the liquidity position of the Company at December 31, 2010, management does not anticipate the need to utilize any of these sources in the near term.
A number of analytical techniques are utilized in assessing the adequacy of our liquidity position. One such technique is the use of ratio analysis to illustrate the Company’s reliance on noncore funds to fund investments and loans maturing after 2010. At December 31, 2010, the net noncore funding dependence ratio, the difference between noncore funds and short-term investments to long-term assets, was 1.77%. The net short-term noncore funding dependence ratio, noncore funds maturing within one year, less short-term investments to long-term assets equaled (0.95%). Comparatively, these ratios equaled (2.41%) and (3.44%), respectively at the end of 2009, which indicates an increase in reliance on noncore funds. The increase in noncore funding reliance resulted primarily from a decrease in short-term investments. Although some reliance on noncore funds is shown, reliance was significantly less than that of our peer group. According to the December 31, 2010, Bank Holding Company Performance Report for our Federal Reserve District, these ratios for our peer group were 22.01% and 10.12%. It is believed that by supplying adequate volumes of short-term investments and implementing competitive pricing strategies on deposits, we can ensure adequate liquidity to support future growth.
The Consolidated Statements of Cash Flows present the change in cash and cash equivalents from operating, investing and financing activities. Cash and cash equivalents consist of cash on hand, cash items in the process of collection, noninterest-bearing deposits with other banks, balances with the Federal Reserve Bank of Philadelphia and the FHLB and federal funds sold. Cash and cash equivalents decreased $919 thousand for the year ended December 31, 2010. Conversely, for the year ended December 31, 2009, cash and cash equivalents increased $382 thousand. During 2010, cash provided by financing and operating activities were offset by cash used in investing activities.
Operating activities provided net cash of $11.2 million in 2010 and $4.2 million in 2009. Net income, adjusted for the effects of noncash transactions such as depreciation and the provision for loan losses is the primary source of funds from operations.
Net cash provided by financing activities equaled $33.2 million in 2010 and $37.5 million in 2009. Deposit gathering, which is the predominant financing activity, increased significantly in both 2010 and 2009. Deposit gathering provided net cash inflows of $28.7 million in 2010 and $38.8 million in 2009. Partially offsetting the cash provided by deposit gathering in 2010 was $2.5 million for the payment of dividends to stockholders. Proceeds received from the issuance of common shares as part of our stock option plan provided us with another source of funds generated by financing activities.
The Company’s primary investing activities involve transactions related to investments and the loan portfolio. Net cash used in investing activities totaled $45.5 million in 2010, an increase of $4.2 million from $41.3 million in 2009. The demand for loans remained steady. Net cash used in lending activities increased $36.6 million to $57.1 million in 2010 from $20.5 million in 2009. Activities related to the investment portfolio provided net cash of $10.8 million in 2010 compared to net cash used of $20.1 million in 2009. Repayments, coupled with sales, of investment securities amounted to $84.0 million in 2010, were offset by purchases of investment securities of $73.2 million. In 2009, repayments of $70.4 million were more than offset by $90.5 million in purchases of investment securities.
39
OFF-BALANCE SHEET ARRANGEMENTS
The financial statements do not reflect various off-balance sheet arrangements that are made in the normal course of business, which may involve some risk. These commitments consist mainly of unfunded loans and letters of credit made under the same standards as on-balance sheet instruments. Unused commitments, at December 31, 2010, totaled $56.0 million. Because these instruments have fixed maturity dates, and because many of them will expire without being drawn upon, they do not generally present any significant liquidity risk. Management believes that any amounts actually drawn upon can be funded in the normal course of operations.
The Company has no investment in or financial relationship with any unconsolidated entities that are even remotely likely to have a material effect on liquidity or the availability of capital resources.
The following table represents the aggregate on-and-off balance sheet contractual obligations to make future payments.
TABLE 15
Contractual Obligations
(In Thousands)
|
December 31, 2010
|
||||||||||||||||||||
|
Less than 1 Year
|
1-3 Years
|
4-5 Years
|
Over 5 Years
|
Total
|
||||||||||||||||
|
Time Deposits
|
$ | 41,077 | $ | 26,500 | $ | 23,259 | $ | 1,611 | $ | 92,447 | ||||||||||
|
Long-term Debt
|
3,409 | 16,633 | 6,777 | 517 | 27,336 | |||||||||||||||
|
Operating Leases
|
104 | 134 | 139 | 92 | 469 | |||||||||||||||
|
Standby Letters of Credit
|
12,615 | 3,320 | 2,235 | 0 | 18,170 | |||||||||||||||
| $ | 57,205 | $ | 46,587 | $ | 32,410 | $ | 2,220 | $ | 138,422 | |||||||||||
The Company is not aware of any known trends or any known demands, commitments, events or uncertainties, which would result in any material increase or decrease in liquidity beyond those already discussed.
SUBSEQUENT EVENTS
NONE.
EFFECTS OF INFLATION
The majority of assets and liabilities of a financial institution are monetary in nature and, therefore, differ greatly from commercial and industrial companies that have significant investments in fixed assets or inventories. The precise impact of inflation upon the Company is difficult to measure. Inflation may affect the borrowing needs of consumers, thereby impacting the growth rate of the Company’s assets. Inflation may also affect the general level of interest rates, which can have a direct bearing on the Company.
Management believes that the most significant impact on financial results is the Company’s ability to react to changes in interest rates. As discussed previously, management is attempting to maintain a position that is within conservative parameters for interest sensitive assets and liabilities in order to be protected against wide interest rate fluctuations.
ITEM 7A QUANTITATIVE AND QUALITATIVE DISCLOSURES ABOUT MARKET RISK
As previously stated in this document, the Federal Reserve Bank continued to hold interest rates at historically low levels in 2010. The Company continues to benefit from lower costs on short term funding coupled with experiencing little or no deterioration to interest income from longer maturity loans. With this being said, the Bank monitors this interest sensitivity on a quarterly basis. The results from the latest simulation model indicate a possible decrease in net interest income of 9.5%, or $2.2 million, in a plus 200 basis point rate shock scenario over a one-year period. A decrease of 2.1% or $416 thousand is shown in the model at a minus 200 basis point rate shock. The Bank will continue to monitor this rate sensitivity going forward. Equity value at risk is monitored regularly and is within established policy limits.
40
ITEM 8 FINANCIAL STATEMENTS AND SUPPLEMENTARY DATA
REPORT OF INDEPENDENT REGISTERED PUBLIC ACCOUNTING FIRM
Board of Directors and Stockholders
Peoples Financial Services Corp.
Hallstead, Pennsylvania
We have audited the accompanying consolidated balance sheets of Peoples Financial Services Corp. and subsidiaries (the “Company”) as of December 31, 2010 and 2009, and the related consolidated statements of income, changes in stockholders’ equity and cash flows for each of the years in the three-year period ended December 31, 2010. The Company’s management is responsible for these consolidated financial statements. Our responsibility is to express an opinion on these consolidated financial statements based on our audits.
We conducted our audits in accordance with the standards of the Public Company Accounting Oversight Board (United States). Those standards require that we plan and perform the audits to obtain reasonable assurance about whether the financial statements are free of material misstatement. An audit includes examining, on a test basis, evidence supporting the amounts and disclosures in the financial statements. An audit also includes assessing the accounting principles used and significant estimates made by management, as well as evaluating the overall financial statement presentation. We believe that our audits provide a reasonable basis for our opinion.
In our opinion, the consolidated financial statements referred to above present fairly, in all material respects, the financial position of Peoples Financial Services Corp. and subsidiaries as of December 31, 2010 and 2009, and the results of their operations and their cash flows for each of the years in the three-year period ended December 31, 2010 in conformity with accounting principles generally accepted in the United States of America.
We also have audited, in accordance with the standards of the Public Company Accounting Oversight Board (United States), the Company’s internal control over financial reporting as of December 31, 2010, based on criteria established in Internal Control-Integrated Framework issued by the Committee of Sponsoring Organizations of the Treadway Commission, and our report dated March 16, 2011, expressed an unqualified opinion on the effectiveness of the Company’s internal control over financial reporting.
/s/ ParenteBeard LLC
Allentown, Pennsylvania
March 16, 2011
41
PEOPLES FINANCIAL SERVICES CORP.
CONSOLIDATED BALANCE SHEETS
(Dollars in thousands, except per share data)
|
December 31,
|
||||||||
|
2010
|
2009
|
|||||||
|
ASSETS
|
||||||||
|
Cash and due from banks
|
$ | 6,731 | $ | 7,259 | ||||
|
Interest bearing deposits in other banks
|
107 | 895 | ||||||
|
Federal funds sold
|
11,003 | 10,761 | ||||||
|
Securities available for sale
|
121,772 | 130,506 | ||||||
|
Loans held for sale
|
30 | 770 | ||||||
|
Loans, net
|
390,772 | 335,533 | ||||||
|
Allowance for loan losses
|
(4,100 | ) | (3,337 | ) | ||||
|
Net loans
|
386,672 | 332,196 | ||||||
|
Investment in restricted stock, at cost
|
2,642 | 2,870 | ||||||
|
Premises and equipment, net
|
8,238 | 7,509 | ||||||
|
Accrued interest receivable
|
3,003 | 2,580 | ||||||
|
Intangible assets
|
1,052 | 560 | ||||||
|
Other real estate owned
|
3,387 | 5,534 | ||||||
|
Bank owned life insurance
|
8,346 | 8,253 | ||||||
|
Other assets
|
5,604 | 6,790 | ||||||
|
Total Assets
|
$ | 558,587 | $ | 516,483 | ||||
|
LIABILITIES
|
||||||||
|
Deposits:
|
||||||||
|
Non-interest bearing
|
$ | 73,663 | $ | 71,835 | ||||
|
Interest bearing
|
365,071 | 338,203 | ||||||
|
Total Deposits
|
438,734 | 410,038 | ||||||
|
Accrued interest payable
|
311 | 446 | ||||||
|
Short-term borrowings
|
38,724 | 20,439 | ||||||
|
Long-term borrowings
|
27,336 | 38,750 | ||||||
|
Other liabilities
|
2,966 | 1,840 | ||||||
|
Total Liabilities
|
$ | 508,071 | $ | 471,513 | ||||
|
STOCKHOLDERS’ EQUITY
|
||||||||
|
Common stock, par value $2 per share; authorized 12,500,000 shares; issued 3,341,251 shares; outstanding 3,141,731 shares and 3,136,156 shares December 31, 2010 and 2009, respectively
|
6,683 | 6,683 | ||||||
|
Capital surplus
|
3,118 | 3,098 | ||||||
|
Retained earnings
|
46,048 | 42,043 | ||||||
|
Accumulated other comprehensive loss
|
(834 | ) | (2,258 | ) | ||||
|
Treasury stock, at cost 199,520 shares and 205,095 shares at December 31, 2010 and 2009, respectively
|
(4,499 | ) | (4,596 | ) | ||||
|
Total Stockholders’ Equity
|
50,516 | 44,970 | ||||||
|
Total Liabilities and Stockholders’ Equity
|
$ | 558,587 | $ | 516,483 | ||||
See notes to consolidated financial statements
42
PEOPLES FINANCIAL SERVICES CORP.
CONSOLIDATED STATEMENTS OF INCOME
(Dollars in thousands, except per share data)
|
Years Ended December 31,
|
||||||||||||
|
2010
|
2009
|
2008
|
||||||||||
|
INTEREST INCOME
|
||||||||||||
|
Loans receivable, including fees
|
$ | 20,533 | $ | 19,446 | $ | 19,871 | ||||||
|
Securities:
|
||||||||||||
|
Taxable
|
2,987 | 2,675 | 3,771 | |||||||||
|
Tax-exempt
|
2,027 | 2,118 | 1,731 | |||||||||
|
Other
|
30 | 34 | 106 | |||||||||
|
Total Interest Income
|
25,577 | 24,273 | 25,479 | |||||||||
|
INTEREST EXPENSE
|
||||||||||||
|
Deposits
|
4,696 | 5,328 | 7,026 | |||||||||
|
Short-term borrowings
|
389 | 315 | 390 | |||||||||
|
Long-term borrowings
|
1,413 | 1,615 | 1,738 | |||||||||
|
Total Interest Expense
|
6,498 | 7,258 | 9,154 | |||||||||
|
Net Interest Income
|
19,079 | 17,015 | 16,325 | |||||||||
|
PROVISION FOR LOAN LOSSES
|
2,202 | 1,735 | 713 | |||||||||
|
Net Interest Income after Provision for Loan Losses
|
16,877 | 15,280 | 15,612 | |||||||||
|
OTHER INCOME (LOSS)
|
||||||||||||
|
Customer service fees
|
2,043 | 1,950 | 2,006 | |||||||||
|
Investment division commission income
|
305 | 341 | 411 | |||||||||
|
Earnings on investment in bank owned life insurance
|
322 | 342 | 296 | |||||||||
|
Mortgage banking income
|
417 | 438 | 148 | |||||||||
|
Other income
|
640 | 467 | 458 | |||||||||
|
Income from other real estate
|
381 | 242 | 0 | |||||||||
|
Net gain (loss) on sales of securities available for sale
|
346 | (492 | ) | 128 | ||||||||
|
Other than temporary security impairments
|
(164 | ) | (206 | ) | (5,256 | ) | ||||||
|
Total Other Income (Loss)
|
4,290 | 3,082 | (1,809 | ) | ||||||||
|
OTHER EXPENSES
|
||||||||||||
|
Salaries and employee benefits
|
5,498 | 5,532 | 4,831 | |||||||||
|
Occupancy
|
858 | 814 | 733 | |||||||||
|
Equipment
|
561 | 546 | 493 | |||||||||
|
FDIC insurance and assessments
|
787 | 900 | 227 | |||||||||
|
Professional fees and outside services
|
640 | 588 | 520 | |||||||||
|
Computer service and supplies
|
1,082 | 1,053 | 970 | |||||||||
|
Taxes, other than payroll and income
|
389 | 346 | 400 | |||||||||
|
Amortization expense – deposit acquisition premiums
|
258 | 258 | 258 | |||||||||
|
Stationery and printing supplies
|
379 | 357 | 360 | |||||||||
|
Advertising
|
403 | 297 | 201 | |||||||||
|
Penalty assessment long term borrowings
|
718 | 0 | 0 | |||||||||
|
Other
|
1,672 | 1,699 | 1,684 | |||||||||
|
Total Other Expenses
|
13,245 | 12,390 | 10,677 | |||||||||
|
Income before Income Taxes
|
7,922 | 5,972 | 3,126 | |||||||||
|
PROVISION FOR INCOME TAX EXPENSE
|
1,437 | 923 | 87 | |||||||||
|
Net Income
|
$ | 6,485 | $ | 5,049 | $ | 3,039 | ||||||
|
PER SHARE DATA
|
||||||||||||
|
Net income - basic
|
$ | 2.07 | $ | 1.61 | $ | 0.97 | ||||||
|
Net income - diluted
|
$ | 2.06 | $ | 1.61 | $ | 0.97 | ||||||
|
Dividends declared
|
$ | 0.79 | $ | 0.76 | $ | 0.76 | ||||||
CONSOLIDATED STATEMENTS OF CHANGES IN STOCKHOLDERS’ EQUITY
(Dollars in thousands, except per share data)
Three years ended December 31, 2010
|
Common Stock
|
Capital Surplus
|
Retained Earnings
|
Accumulated Other Comprehensive Loss
|
Treasury Stock
|
Total
|
|||||||||||||||
|
Balance - December 31, 2007
|
$ | 6,683 | $ | 3,083 | $ | 38,824 | $ | (1,390 | ) | $ | (4,395 | ) | $ | 42,805 | ||||||
|
Cumulative effect of adoption of new accounting principle on January 1, 2008
|
0 | 0 | (71 | ) | 0 | 0 | (71 | ) | ||||||||||||
|
Comprehensive loss:
|
||||||||||||||||||||
|
Net income
|
0 | 0 | 3,039 | 0 | 0 | 3,039 | ||||||||||||||
|
Change in net unrealized gain (loss) on securities available for sale, net of reclassification adjustment and taxes
|
0 | 0 | 0 | (3,365 | ) | 0 | (3,365 | ) | ||||||||||||
|
Total Comprehensive Loss
|
(326 | ) | ||||||||||||||||||
|
Stock option expense
|
0 | 1 | 0 | 0 | 0 | 1 | ||||||||||||||
|
Cash dividends declared, ($0.76 per share)
|
0 | 0 | (2,417 | ) | 0 | 0 | (2,417 | ) | ||||||||||||
|
Shares issued from treasury related to stock purchase plans (12,688 shares)
|
0 | 16 | 0 | 0 | 218 | 234 | ||||||||||||||
|
Purchase of treasury stock (20,000 shares)
|
0 | 0 | 0 | 0 | (506 | ) | (506 | ) | ||||||||||||
|
Balance - December 31, 2008
|
6,683 | 3,100 | 39,375 | (4,755 | ) | (4,683 | ) | 39,720 | ||||||||||||
|
Comprehensive income:
|
||||||||||||||||||||
|
Net income
|
0 | 0 | 5,049 | 0 | 0 | 5,049 | ||||||||||||||
|
Change in net unrealized gain (loss) on securities available for sale, net of reclassification adjustment and taxes
|
0 | 0 | 0 | 2,497 | 0 | 2,497 | ||||||||||||||
|
Total Comprehensive Income
|
7,546 | |||||||||||||||||||
|
Cash dividends declared, ($0.76 per share)
|
0 | 0 | (2,381 | ) | 0 | 0 | (2,381 | ) | ||||||||||||
|
Shares issued from treasury related to stock purchase plans (4,975 shares)
|
0 | (2 | ) | 0 | 0 | 87 | 85 | |||||||||||||
|
Balance - December 31, 2009
|
6,683 | 3,098 | 42,043 | (2,258 | ) | (4,596 | ) | 44,970 | ||||||||||||
|
Comprehensive income:
|
||||||||||||||||||||
|
Net income
|
0 | 0 | 6,485 | 0 | 0 | 6,485 | ||||||||||||||
|
Change in net unrealized gain (loss) on securities available for sale, net of reclassification adjustment and taxes
|
0 | 0 | 0 | 1,424 | 0 | 1,424 | ||||||||||||||
|
Total Comprehensive Income
|
7,909 | |||||||||||||||||||
|
Cash dividends declared, ($0.79 per share)
|
0 | 0 | (2,480 | ) | 0 | 0 | (2,480 | ) | ||||||||||||
|
Shares issued from treasury related to stock purchase plans (5,575 shares)
|
0 | 20 | 0 | 0 | 97 | 117 | ||||||||||||||
|
Balance - December 31, 2010
|
$ | 6,683 | $ | 3,118 | $ | 46,048 | $ | (834 | ) | $ | (4,499 | ) | $ | 50,516 | ||||||
See notes to consolidated financial statements
43
PEOPLES FINANCIAL SERVICES CORP.
CONSOLIDATED STATEMENTS OF CASH FLOWS
(Dollars in thousands, except per share data)
|
Years Ended December 31,
|
||||||||||||
|
2010
|
2009
|
2008
|
||||||||||
|
CASH FLOWS FROM OPERATING ACTIVITIES
|
||||||||||||
|
Net income
|
$ | 6,485 | $ | 5,049 | $ | 3,039 | ||||||
|
Adjustments to reconcile net income to net cash provided by operating activities:
|
||||||||||||
|
Depreciation and amortization
|
977 | 954 | 871 | |||||||||
|
Provision for loan losses
|
2,202 | 1,735 | 713 | |||||||||
|
Net loss (gain) on sale of other real estate owned
|
56 | 0 | (15 | ) | ||||||||
|
Net gain on sales or retirements of equipment
|
0 | (5 | ) | (1 | ) | |||||||
|
Net amortization of securities
|
290 | 227 | 145 | |||||||||
|
Amortization of deferred loan costs
|
261 | 261 | 304 | |||||||||
|
Net loss (gain) on sales of securities available for sale
|
(346 | ) | 492 | (128 | ) | |||||||
|
Other than temporary security impairment
|
164 | 206 | 5,256 | |||||||||
|
Stock option expense
|
0 | 0 | 1 | |||||||||
|
Deferred income tax expense (benefit)
|
(75 | ) | 1,514 | (1,737 | ) | |||||||
|
Proceeds from the sale of loans originated for sale
|
11,042 | 22,010 | 6,556 | |||||||||
|
Net gain on sale of loans originated for sale
|
(289 | ) | (284 | ) | (88 | ) | ||||||
|
Loans originated for sale
|
(10,013 | ) | (23,064 | ) | (6,391 | ) | ||||||
|
Net earnings on investment in life insurance
|
(322 | ) | (342 | ) | (296 | ) | ||||||
|
Gain from investment in life insurance
|
(320 | ) | 0 | 0 | ||||||||
|
Net change in:
|
||||||||||||
|
Accrued interest receivable
|
(423 | ) | (54 | ) | (289 | ) | ||||||
|
Other assets
|
528 | (3,568 | ) | (108 | ) | |||||||
|
Accrued interest payable
|
(135 | ) | (1,203 | ) | 724 | |||||||
|
Other liabilities
|
1,126 | 224 | (347 | ) | ||||||||
|
Net Cash Provided by Operating Activities
|
11,208 | 4,152 | 8,209 | |||||||||
|
CASH FLOWS FROM INVESTING ACTIVITIES
|
||||||||||||
|
Proceeds from sale of available for sale securities
|
64,439 | 62,172 | 57,997 | |||||||||
|
Proceeds from maturities of and principal repayments on available for sale securities
|
19,605 | 8,274 | 5,138 | |||||||||
|
Purchases of available for sale securities
|
(73,261 | ) | (90,505 | ) | (71,624 | ) | ||||||
|
Net increase in loans
|
(57,118 | ) | (20,510 | ) | (26,198 | ) | ||||||
|
Net (increase) decrease in investments in restricted stock
|
228 | (212 | ) | 617 | ||||||||
|
Purchases of premises and equipment
|
(1,448 | ) | (658 | ) | (2,283 | ) | ||||||
|
Proceeds from sale or retirements of equipment
|
0 | 0 | 1 | |||||||||
|
Proceeds from investment in life insurance
|
549 | 0 | 0 | |||||||||
|
Proceeds from sale of other real estate
|
2,270 | 129 | 180 | |||||||||
|
Purchase premium-investment advisory service
|
(750 | ) | 0 | 0 | ||||||||
|
Net Cash Used in Investing Activities
|
(45,486 | ) | (41,310 | ) | (36,172 | ) | ||||||
|
CASH FLOWS FROM FINANCING ACTIVITIES
|
||||||||||||
|
Cash dividends paid
|
(2,480 | ) | (2,381 | ) | (2,417 | ) | ||||||
|
Increase in deposits
|
28,696 | 38,770 | 43,838 | |||||||||
|
Proceeds from long-term borrowings
|
0 | 0 | 5,000 | |||||||||
|
Repayment of long-term borrowings
|
(11,414 | ) | (941 | ) | (3,843 | ) | ||||||
|
Net increase (decrease) in short-term borrowings
|
18,285 | 2,007 | (4,416 | ) | ||||||||
|
Purchase of treasury stock
|
0 | 0 | (506 | ) | ||||||||
|
Issuance of common stock
|
117 | 85 | 234 | |||||||||
|
Net Cash Provided by Financing Activities
|
33,204 | 37,540 | 37,890 | |||||||||
|
Increase (Decrease) in Cash and Cash Equivalents
|
(1,074 | ) | 382 | 9,927 | ||||||||
|
CASH AND CASH EQUIVALENTS - BEGINNING
|
18,915 | 18,533 | 8,606 | |||||||||
|
CASH AND CASH EQUIVALENTS - ENDING
|
$ | 17,841 | $ | 18,915 | $ | 18,533 | ||||||
|
SUPPLEMENTARY CASH FLOWS INFORMATION
|
||||||||||||
|
Interest paid
|
$ | 6,633 | $ | 8,461 | $ | 8,430 | ||||||
|
Income taxes paid
|
$ | 354 | $ | 815 | $ | 2,130 | ||||||
|
SUPPLEMENTARY DISCLOSURES OF NONCASH INVESTING AND FINANCING ACTIVITIES
|
||||||||||||
|
Foreclosed real estate acquired in settlement of loans
|
$ | 179 | $ | 492 | $ | 99 | ||||||
See notes to consolidated financial statements
44
PEOPLES FINANCIAL SERVICES CORP.
NOTES TO CONSOLIDATED FINANCIAL STATEMENTS
(Dollars in thousands, except per share data)
NOTE 1 – SUMMARY OF SIGNIFICANT ACCOUNTING POLICIES
Nature of Operations
Peoples Financial Services Corp., a bank holding company incorporated under the laws of Pennsylvania, provides a full range of financial services through its wholly-owned subsidiaries: Peoples Neighborhood Bank ( the “Bank”), including its subsidiaries, Peoples Financial Leasing, LLC and Peoples Investment Holdings, LLC; Peoples Wealth Management, LLC and Peoples Financial Capital Corporation (collectively, the “Company”). The Company services its individual and commercial customers through eleven full-service community banking offices located within the Lackawanna, Susquehanna and Wyoming counties of Northern Pennsylvania and Broome county of Southern New York.
On December 13, 2010, the Bank converted its charter to a state non-member bank under the jurisdiction of the Pennsylvania Department of Banking and the Federal Deposit Insurance Corporation. The Bank’s primary product is loans to small- and medium-sized businesses. Other lending products include one-to-four family residential mortgages and consumer loans. The Bank primarily funds its loans by offering open time deposits to commercial enterprises and individuals. Other deposit product offerings include certificates of deposits and various demand deposit accounts.
Peoples Financial Leasing, LLC, provides employee leasing services to the Bank. Peoples Investment Holdings, LLC, incorporated under the laws of Delaware, maintains and manages the collection and distribution of income from certain investments of the Bank.
Peoples Wealth Management, LLC, a member managed limited liability company, provides investment advisory services to individuals and small businesses. On December 31, 2010, Peoples Wealth Management, LLC purchased Sterling Wealth Management for $750 which is included in intangible assets. Peoples Financial Capital Corporation, incorporated under the laws of Delaware, maintains and manages the collection and distribution of income from certain investments of the Company.
Peoples Financial Leasing, LLC; Peoples Investment Holdings, LLC; Peoples Wealth Management, LLC and Peoples Financial Capital Corporation did not meet the quantitative thresholds for required segment disclosure in conformity with accounting principles generally accepted in the United States of America (“GAAP”). The Bank’s eleven community banking offices, all similar with respect to economic characteristics, share a majority of the following aggregation criteria: (i) products and services; (ii) operating processes; (iii) customer bases; (iv) delivery systems; and (v) regulatory oversight. Accordingly, they were aggregated into a single operating segment.
The Company faces competition primarily from commercial banks, thrift institutions and credit unions within the Northeastern Pennsylvania market, many of which are substantially larger in terms of assets and capital. In addition, mutual funds and security brokers compete for various types of deposits, and consumer, mortgage, leasing and insurance companies compete for various types of loans and leases. Principal methods of competing for banking and permitted nonbanking services include price, nature of product, quality of service and convenience of location.
The Company is subject to regulations of certain federal and state regulatory agencies and undergoes periodic examinations.
45
PEOPLES FINANCIAL SERVICES CORP.
NOTES TO CONSOLIDATED FINANCIAL STATEMENTS
(Dollars in thousands, except per share data)
NOTE 1 – SUMMARY OF SIGNIFICANT ACCOUNTING POLICIES (CONTINUED)
Basis of Presentation
The consolidated financial statements of the Company have been prepared in conformity with GAAP, Regulation S-X and reporting practices applied in the banking industry. All significant intercompany balances and transactions have been eliminated in consolidation. The Company also presents herein condensed parent company only financial information regarding Peoples Financial Services Corp. (the “Parent Company”). Prior period amounts are reclassified when necessary to conform with the current year’s presentation.
The Company has evaluated events and transactions occurring subsequent to the balance sheet date of December 31, 2010, for items that should potentially be recognized or disclosed in these financial statements. The evaluation was conducted through the date these financial statements were issued.
Estimates
The preparation of financial statements in conformity with GAAP requires management to make estimates and assumptions that affect the reported amounts of assets and liabilities and disclosure of contingent assets and liabilities at the date of the financial statements and the reported amounts of revenues and expenses during the reporting period. Significant estimates that are particularly susceptible to material change in the near term relate to the determination of the allowance for loan losses, fair value of financial instruments, the valuation of real estate acquired in connection with foreclosures or in satisfaction of loans, the valuation of deferred tax assets and liabilities, the potential impairment of restricted stock, and determination of other-than-temporary impairment losses on securities. Actual results could differ from those estimates.
Significant Group Concentrations of Credit Risk
Most of the Company’s activities are with customers located primarily in northern Lackawanna, Susquehanna and Wyoming Counties of Pennsylvania, and Broome County of New York. Note 2 discusses the types of securities in which the Company invests. The concentrations of credit by type of loan are set forth in Note 3. The Company does not have any significant concentrations to any one industry or customer. Although the Company has a diversified loan portfolio, its debtors’ ability to honor their contracts is influenced by the region’s economy. Management does not believe there are any other significant concentrations of credit risk that could affect the securities or loan portfolios.
Presentation of Cash Flows
The Consolidated Statements of Cash Flows are presented using the indirect method. For purposes of cash flow, cash and cash equivalents include cash on hand and amounts due from banks, interest-bearing deposits in other banks and federal funds sold.
46
PEOPLES FINANCIAL SERVICES CORP.
NOTES TO CONSOLIDATED FINANCIAL STATEMENTS
(Dollars in thousands, except per share data)
NOTE 1 – SUMMARY OF SIGNIFICANT ACCOUNTING POLICIES (CONTINUED)
Securities
All of the Company’s securities are classified as available for sale and are intended to be held for an indefinite period of time, but not necessarily to maturity. Any decision to sell a security classified as available for sale would be based on various factors, including significant movements in interest rates, changes in the maturity mix of the Company’s assets and liabilities, liquidity needs, regulatory capital considerations and other circumstances identified by management. Securities available for sale are carried at fair value. Unrealized gains or losses are reported in other comprehensive income, net of the related deferred tax effect. Realized gains or losses, determined on the basis of the cost of the specific securities sold, are included in other income. Premiums and discounts are recognized in interest income using the interest method over the period to maturity.
Declines in the fair value of available for sale securities below their cost that are deemed to be other than temporary are reflected in earnings as realized losses. In estimating other than temporary impairment (“OTTI”) under the rules for accounting for certain debt and equity securities, management considers many factors, including: (i) the length of time and the extent to which the fair value has been less than amortized cost, (ii) the financial condition and near-term prospects of the issuer, (iii) whether the market decline was affected by macroeconomic conditions, and (iv) whether the entity has the intent to sell the debt security or more likely than not will be required to sell the debt security before its anticipated recovery.
Investment in Restricted Stock, at Cost
As a member of the Federal Home Loan Bank of Pittsburgh (“FHLB”), the Company is required to purchase and hold stock in the FHLB to satisfy membership and borrowing requirements. This stock is restricted in that it can only be sold to the FHLB or to another member institution, and all sales of FHLB stock must be at par. As a result of these restrictions, FHLB stock is unlike other investment securities as there is no trading market for FHLB stock and the transfer price is determined by FHLB membership rules and not by market participants. As of December 31, 2010 and December 31, 2009, the majority of our investments in restricted stock consisted of FHLB stock totaling $2,632 and $2,771 respectively.
In December 2008, the FHLB voluntarily suspended dividend payments on its stock, as well as the repurchase of excess stock from members. The FHLB cited a significant reduction in the level of core earnings resulting from lower short-term interest rates, the increased cost of liquidity, and constrained access to the debt markets at attractive rates and maturities as the main reasons for the decision to suspend dividends and the repurchase of excess capital stock. The FHLB last paid a dividend in the third quarter of 2008. The FHLB reported a net profit for the third quarter of 2010 and announced a limited repurchase of excess capital stock. On October 29, 2010, the FHLB redeemed $138 of the Bank’s FHLB capital stock holdings.
47
PEOPLES FINANCIAL SERVICES CORP.
NOTES TO CONSOLIDATED FINANCIAL STATEMENTS
(Dollars in thousands, except per share data)
NOTE 1 – SUMMARY OF SIGNIFICANT ACCOUNTING POLICIES (CONTINUED)
Investment in Restricted Stock, at Cost (Continued)
The Company evaluates OTTI quarterly on restricted stock. The decision of whether impairment exists is a matter of judgment that reflects our view of the FHLB’s long-term performance, which includes factors such as the following:
|
·
|
Its operating performance;
|
|
·
|
The severity and duration of declines in the fair value of its net assets related to its capital stock amount;
|
|
·
|
Its commitment to make payments required by law or regulation and the level of such payments in relation to its operating performance;
|
|
·
|
The impact of legislative and regulatory changes on the FHLB, and accordingly, on the members of FHLB; and
|
|
·
|
Its liquidity and funding position
|
After evaluating all of these considerations, the Company concluded that the par value of its investment in FHLB stock will be recovered. Accordingly, no impairment charge was recorded on these securities for any of the three years ended December 31, 2010.
Loans Held for Sale
Loans held for sale consist of one-to-four family residential mortgages originated and intended for sale in the secondary market. The loans are carried in aggregate at the lower of cost or estimated market value, based upon current delivery prices in the secondary mortgage market. Net unrealized losses are recognized through a valuation allowance by corresponding charges to income. Gains or losses on the sale of these loans are recognized in other income at the time of sale using the specific identification method. Loan origination fees, net of certain direct loan origination costs, are included in net gains or losses upon the sale of the related mortgage loan. All loans are sold without recourse. The aggregate cost of these loans was lower than their estimated market value at December 31, 2010 and 2009, accordingly, no valuation allowance was deemed necessary.
Loans, net
Loans that management has the intent and ability to hold for the foreseeable future or until maturity or payoff are stated at their outstanding unpaid principal balances, net of any deferred fees or costs. Interest income is accrued on the unpaid principal balance. Loan origination fees, net of certain direct origination costs, are deferred and recognized as an adjustment of the yield using the effective interest method. Premiums and discounts on purchased loans are amortized as adjustments to interest income using the effective interest method. Delinquency fees are recognized in income when chargeable, assuming collectability is reasonable assured.
48
PEOPLES FINANCIAL SERVICES CORP.
NOTES TO CONSOLIDATED FINANCIAL STATEMENTS
(Dollars in thousands, except per share data)
NOTE 1 – SUMMARY OF SIGNIFICANT ACCOUNTING POLICIES (CONTINUED)
Nonperforming assets
Nonperforming assets consist of nonperforming loans and other real estate. Nonperforming loans include nonaccrual loans, restructured loans and accruing loans past due 90 days or more. Past due status is based on contractual terms of the loan. Generally, a loan is classified as nonaccrual when it is determined that the collection of all or a portion of interest or principal is doubtful or when a default of interest or principal has existed for 90 days or more, unless the loan is well secured and in the process of collection. When a loan is placed on nonaccrual, interest accruals discontinue and uncollected accrued interest is reversed against income in the current period. Interest collections after a loan has been placed on nonaccrual status are credited to a suspense account until either the loan is returned to performing status or charged-off. The interest accumulated in the suspense account is credited to income if the nonaccrual loan is returned to performing status. However, if the nonaccrual loan is charged-off, the accumulated interest is applied as a reduction to principal at the time the loan is charged-off. A nonaccrual loan is returned to performing status when the loan is current as to principal and interest and has performed according to the contractual terms for a minimum of six months.
Restructured loans are loans with original terms, interest rate, or both, that have been modified as a result of a deterioration in the borrower’s financial condition. Interest income on restructured loans is recognized when earned, using the interest method.
The Company recognizes interest income on impaired loans, including the recording of cash receipts, based on its policy for nonaccrual, restructured loans or accruing loans depending on the status of the impaired loan.
Other real estate owned is comprised of properties acquired through foreclosure proceedings or acceptance of a deed-in-lieu of foreclosure and loans classified as in-substance foreclosures. A loan is classified as in-substance foreclosure when the Company has taken possession of the collateral regardless of whether formal foreclosure proceedings take place. Other real estate owned is recorded at fair value less cost to sell at the time of acquisition. Any excess of the loan balance over the recorded value is charged to the allowance for loan losses. Subsequent declines in the recorded values of the properties prior to their disposal and costs to maintain the assets are included in other expenses. No allowance has been established subsequent to the acquisition of other real estate owned during 2010 or 2009. Any gain or loss realized upon disposal of other real estate owned is included in noninterest income or noninterest expense. The historical average holding period for such properties is less than 12 months.
49
PEOPLES FINANCIAL SERVICES CORP.
NOTES TO CONSOLIDATED FINANCIAL STATEMENTS
(Dollars in thousands, except per share data)
NOTE 1 – SUMMARY OF SIGNIFICANT ACCOUNTING POLICIES (CONTINUED)
Allowance for Loan Losses
The allowance for loan losses consists of the allowance for loan losses for loans originated or purchased and held by the Company and a reserve for unfunded loan commitments. The allowance for loan losses represents management’s estimate of losses inherent in the loan portfolio as of the balance sheet date and is recorded as a reduction to loans. The reserve for unfunded loan commitments represents management’s estimate of losses inherent in its unfunded loan commitments and is recorded in other liabilities on the consolidated balance sheet. The allowance for credit losses is increased by the provision for loan losses, and decreased by charge-offs, net of recoveries. Loans, or portions of loans, determined to be confirmed losses are charged against the allowance account and subsequent recoveries, if any, are credited to the account. A loss is considered confirmed when information available at the financial statement date indicates the loan, or a portion thereof, is uncollectible. Consumer loans are generally charged off no later than 120 days past due on a contractual basis, earlier in the event of bankruptcy, or if there is an amount deemed uncollectible.
Management performs a quarterly evaluation of the adequacy of the allowance. The allowance is based on the Company’s past loan loss experience, known and inherent risks in the portfolio, adverse situations that may affect the borrower’s ability to repay, the estimated value of any underlying collateral, composition of the loan portfolio, current economic conditions and other relevant factors. This evaluation is inherently subjective as it requires material estimates that may be susceptible to significant revision as more information becomes available.
Management maintains the allowance for loan losses at a level it believes adequate to absorb probable credit losses related to specifically identified loans, as well as probable incurred losses inherent in the remainder of the loan portfolio as of the balance sheet dates. The allowance for loan losses account consists of an allocated element and an unallocated element. The allocated element consists of a specific portion for the impairment of loans specifically identified to be individually evaluated under Financial Accounting Standards Board (“FASB”) Accounting Standards Codification (“ASC”) 310, “Receivables,” and a formula portion for loss contingencies on those loans collectively evaluated under FASB ASC 450, “Contingencies.”
50
PEOPLES FINANCIAL SERVICES CORP.
NOTES TO CONSOLIDATED FINANCIAL STATEMENTS
(Dollars in thousands, except per share data)
NOTE 1 – SUMMARY OF SIGNIFICANT ACCOUNTING POLICIES (CONTINUED)
Allowance for Loan Losses (Continued)
The specific portion of the allowance for loan losses relates to loans that are determined to be impaired. A loan is considered impaired when, based on current information and events, it is probable that the Company will be unable to collect all amounts due according to the contractual terms of the loan agreement. All amounts due according to the contractual terms means that both the contractual interest and principal payments of a loan will be collected as scheduled in the loan agreement. Factors considered by management in determining impairment include payment status, ability to pay and the probability of collecting scheduled principal and interest payments when due. Loans that experience insignificant payment delays and payment shortfalls generally are not classified as impaired. Management determines the significance of payment delays and payment shortfalls on a case-by-case basis, taking into consideration all of the circumstances surrounding the loan and the borrower, including the length of the delay, the reasons for the delay, the borrower’s prior payment record, and the amount of the shortfall in relation to the principal and interest owed. Loans considered impaired under FASB ASC 310 are measured for impairment based on the present value of expected future cash flows discounted at the loan’s effective interest rate or the fair value of the collateral if the loan is collateral dependent. If the present value of expected future cash flows discounted at the loan’s effective interest rate or the fair value of the collateral, if the loan is collateral dependent, is less than the recorded investment in the loan, including accrued interest and net deferred loan fees or costs, the Company will recognize the impairment by adjusting the allowance for loan losses account through charges to earnings as a provision for loan losses. For commercial and industrial loans secured by non-real estate collateral, such as accounts receivable, inventory and equipment, estimated fair values are determined based on the borrower’s financial statements, inventory reports, accounts receivable agings or equipment appraisals or invoices. Indications of value from these sources are generally discounted based on the age of the financial information or the quality of the assets.
51
PEOPLES FINANCIAL SERVICES CORP.
NOTES TO CONSOLIDATED FINANCIAL STATEMENTS
(Dollars in thousands, except per share data)
NOTE 1 – SUMMARY OF SIGNIFICANT ACCOUNTING POLICIES (CONTINUED)
Allowance for Loan Losses (Continued)
The formula portion of the allowance for loan losses covers pools of loans by major loan class including commercial loans not considered impaired, as well as smaller balance homogeneous loans, such as residential real estate, home equity and other consumer loans. Loss contingencies for each of the major loan pools are determined by applying a total loss factor to the current balance outstanding for each individual pool. The total loss factor is comprised of a historical loss factor using the loss migration method plus a qualitative factor, which adjusts the historical loss factor for changes in trends, conditions and other relevant factors that may affect repayment of the loans in these pools as of the evaluation date. Loss migration involves determining the percentage of each pool that is expected to ultimately result in loss based on historical loss experience. Historical loss factors are based on the ratio of net loans charged-off to loans, net, for each of the major groups of loans evaluated and measured for impairment under FASB ASC 450. The historical loss factor for each pool is a weighted average of the Company’s historical net charge-off ratio for the most recent rolling twelve quarters. Management adjusts these historical loss factors by a qualitative factor that represents a number of environmental risks that may cause estimated credit losses associated with the current portfolio to differ from historical loss experience. These environmental risks include: (i) changes in lending policies and procedures including underwriting standards and collection, charge-off and recovery practices; (ii) changes in the composition and volume of the portfolio; (iii) changes in national, local and industry conditions, including the effects of such changes on the value of underlying collateral for collateral-dependent loans; (iv) changes in the volume and severity of classified loans, including past due, nonaccrual, troubled debt restructures and other loan modifications; (v) changes in the levels of, and trends in, charge-offs and recoveries; (vi) the existence and effect of any concentrations of credit and changes in the level of such concentrations; (vii) changes in the experience, ability and depth of lending management and other relevant staff; (viii) changes in the quality of the loan review system and the degree of oversight by the board of directors; and (ix) the effect of external factors such as competition and legal and regulatory requirements on the level of estimated credit losses in the current loan portfolio. Each environmental risk factor is assigned a value to reflect improving, stable or declining conditions based on management’s best judgment using relevant information available at the time of the evaluation. Adjustments to the factors are supported through documentation of changes in conditions in a narrative accompanying the allowance for loan loss calculation.
The unallocated element is used to cover inherent losses that exist as of the evaluation date, but which have not been identified as part of the allocated allowance using the above impairment evaluation methodology due to limitations in the process. One such limitation is the imprecision of accurately estimating the impact current economic conditions will have on historical loss rates. Variations in the magnitude of impact may cause estimated credit losses associated with the current portfolio to differ from historical loss experience, resulting in an allowance that is higher or lower than the anticipated level. Management establishes and apportions the unallocated element of the allowance amongst major loan classes by considering a number of environmental risks similar to the ones used for determining the qualitative factors. Management continually monitors trends in historical and qualitative factors, including trends in the volume, composition and credit quality of the portfolio. The reasonableness of the unallocated element is evaluated through monitoring trends in its level to determine if changes from period to period are directionally consistent with changes in the factors giving rise to the change.
52
PEOPLES FINANCIAL SERVICES CORP.
NOTES TO CONSOLIDATED FINANCIAL STATEMENTS
(Dollars in thousands, except per share data)
NOTE 1 – SUMMARY OF SIGNIFICANT ACCOUNTING POLICIES (CONTINUED)
Allowance for Loan Losses (Continued)
Federal regulatory agencies, as an integral part of their examination process, periodically review the Company’s allowance for loan losses and may require the Company to recognize additions to the allowance based on their judgments about information available to them at the time of their examination, which may not be currently available to management. Based on management’s comprehensive analysis of the loan portfolio, management believes the current level of the allowance for loan losses is adequate.
Premises and Equipment, Net
Land is stated at cost. Premises and equipment are stated at cost less accumulated depreciation. Depreciation is computed principally using the straight-line method over the following estimated useful lives of the related assets:
|
Years
|
||||
|
Buildings and improvements
|
7 - 40 | |||
|
Furniture, fixtures and equipment
|
3 - 10 | |||
Maintenance, repairs and minor replacements are expensed when incurred. Gains and losses on routine dispositions are reflected in current operations.
Transfers of Financial Assets
Transfers of financial assets, which include loan participation sales, are accounted for as sales, when control over the assets has been surrendered. Control over transferred assets is deemed to be surrendered when: (i) the assets have been isolated from the Company; (ii) the transferee obtains the right, free of conditions that constrain it from taking advantage of that right, to pledge or exchange the transferred assets and (iii) the Company does not maintain effective control over the transferred assets through an agreement to repurchase them before their maturity.
Intangible Assets
The Bank has core deposit acquisition premiums which are being amortized over an estimated life of fifteen years using the straight-line method. These intangible assets were $1,052 and $561 net of accumulated amortization of $3,585 and $3,327 at December 31, 2010 and 2009, respectively. Amortization expense was $258 in 2010, 2009 and 2008. Amortization expense is estimated to increase to $365 in 2011 due to the purchase of Sterling Wealth Management. In 2012, the expense is expected to decrease to $151 as the premium for the 1997 purchase of two Mellon Branches will be fully amortized. In 2013 through 2017 it is expected that the amortization expense will be $107 each year.
Intangible assets are tested for impairment annually or when circumstances arise indicating impairment has occurred. Any impairment losses arising from such testing are reported in the income statement as a separate line item within operations. There were no impairment losses recognized as a result of periodic impairment testing in 2010, 2009 and 2008.
53
PEOPLES FINANCIAL SERVICES CORP.
NOTES TO CONSOLIDATED FINANCIAL STATEMENTS
(Dollars in thousands, except per share data)
NOTE 1 – SUMMARY OF SIGNIFICANT ACCOUNTING POLICIES (CONTINUED)
Bank Owned Life Insurance
The Company has bank owned life insurance (“BOLI”) as a source of funding for employee benefit expenses. BOLI involves the purchasing of life insurance by the Bank on a chosen group of employees. The Company is the owner and beneficiary of the policies. This life insurance investment is carried at the cash surrender value of the underlying policies.
Fair Value of Financial Instruments
The Company uses fair value measurements to record fair value adjustments to certain assets and liabilities and to determine fair value disclosure under GAAP. Fair value estimates are calculated for existing financial instruments without attempting to estimate the value of anticipated future business and the value of certain assets and liabilities that are not considered financial. Accordingly, such assets and liabilities are excluded from disclosure requirements. For example, no benefit is recorded for the value of low-cost funding subsequently discussed. In addition, the Bank’s Wealth Management Division contributes fee income annually. Assets and liabilities of this Division are not considered financial instruments for this disclosure, and their values have not been incorporated into the fair value estimates.
The Company’s assets that were considered financial instruments approximated 95.3 percent of total assets at December 31, 2010, and 94.5 percent of total assets at December 31, 2009. Liabilities that were considered financial instruments approximated 99.4 percent of total liabilities at December 31, 2010, and 99.6 percent of total liabilities at December 31, 2009.
In accordance with FASB ASC 820, “Fair Value Measurements and Disclosures,” the fair value of a financial instrument is the price that would be received to sell an asset or transfer a liability in an orderly transaction between market participants at the measurement date. Fair value is best determined based upon quoted market prices. In cases where quoted market prices are not available, fair values are based on estimates using present value or other valuation techniques. Those techniques are significantly affected by the assumptions used, including the discount rate and estimates of future cash flows. In that regard, the derived fair value estimates cannot be substantiated by comparison to independent markets. In many cases, these values cannot be realized in immediate settlement of the instrument.
Current fair value guidance provides a consistent definition of fair value, which focuses on exit price in an orderly transaction that is not a forced liquidation or distressed sale between participants at the measurement date under current market conditions. If there has been a significant decrease in the volume and level of activity for the asset or liability, a change in valuation technique or the use of multiple valuation techniques may be appropriate. In such instances, determining the price at which willing market participants would transact at the measurement date under current market conditions depends on the facts and circumstances and requires the use of significant judgment. The fair value is a reasonable point within the range that is most representative of fair value under current market conditions.
In accordance with GAAP, the Company groups its assets and liabilities generally measured at fair value into three levels based on market information or other fair value estimates in which the assets and liabilities are traded or valued and the reliability of the assumptions used to determine fair value. These levels include:
54
PEOPLES FINANCIAL SERVICES CORP.
NOTES TO CONSOLIDATED FINANCIAL STATEMENTS
(Dollars in thousands, except per share data)
NOTE 1 – SUMMARY OF SIGNIFICANT ACCOUNTING POLICIES (CONTINUED)
Fair Value of Financial Instruments (Continued)
|
•
|
Level 1: Unadjusted quoted prices of identical assets or liabilities in active markets that the entity has the ability to access as of the measurement date.
|
|
•
|
Level 2: Significant other observable inputs other than Level 1 prices such as quoted prices for similar assets or liabilities; quoted prices in markets that are not active; or other inputs that are observable or can be corroborated by observable market data.
|
|
•
|
Level 3: Significant unobservable inputs that reflect a reporting entity’s own assumptions about the assumptions that market participants would use in pricing an asset or liability.
|
An asset’s or liability’s level within the fair value hierarchy is based on the lowest level of input that is significant to the fair value measurement.
The following methods and assumptions were used by the Company to construct the summary table in Note 14 containing the fair values and related carrying amounts of financial instruments:
Cash and Cash Equivalents: The carrying values of cash and cash equivalents as reported on the balance sheet approximate fair value.
Securities Available for Sale: The fair value of marketable equity securities are based on quoted market prices from active exchange markets. The fair value of debt securities is based on pricing from a matrix pricing model.
Loans held for sale, net: The fair value of loans held for sale, net, are based on quoted market prices.
Net loans: For adjustable-rate loans that reprice immediately and with no significant credit risk, fair values are based on carrying values. The fair values of other nonimpaired loans are estimated using discounted cash flow analysis, using interest rates currently offered in the market for loans with similar terms to borrowers of similar credit risk. Fair values for impaired loans are estimated using discounted cash flow analysis determined by the loan review function or underlying collateral values, where applicable.
Investment in Restricted Stock: The carrying value of restricted equity securities approximate fair value.
Accrued interest receivable: The carrying value of accrued interest receivable as reported on the balance sheet approximates fair value.
Deposits: The fair value of noninterest-bearing deposits and savings, NOW and money market accounts is the amount payable on demand at the reporting date. The fair value estimates do not include the benefit that results from such low-cost funding provided by the deposit liabilities compared to the cost of borrowing funds in the market. The carrying value of adjustable-rate, fixed-term time deposits approximates their fair value at the reporting date. For fixed-rate time deposits, the present value of future cash flows is used to estimate fair value. The discount rates used are the current rates offered for time deposits with similar maturities.
55
PEOPLES FINANCIAL SERVICES CORP.
NOTES TO CONSOLIDATED FINANCIAL STATEMENTS
(Dollars in thousands, except per share data)
NOTE 1 – SUMMARY OF SIGNIFICANT ACCOUNTING POLICIES (CONTINUED)
Fair Value of Financial Instruments (Continued)
Short-term Borrowings: The carrying value of short-term borrowings at a variable interest rate approximates fair value.
Long-term Borrowings: The fair value of fixed-rate long-term debt is based on the present value of future cash flows. The discount rate used is the current rates offered for long-term debt with the same maturity.
Accrued interest payable: The carrying value of accrued interest payable as reported on the balance sheet approximates fair value.
Off-balance sheet financial instruments: The majority of commitments to extend credit, unused portions of lines of credit and standby letters of credit carry current market interest rates if converted to loans. Because such commitments are generally unassignable by either the Company or the borrower, they only have value to the Company and the borrower. None of the commitments are subject to undue credit risk. The estimated fair values of off-balance sheet financial instruments are based on fees currently charged to enter into similar agreements, taking into account the remaining terms of the agreements and the counterparties’ credit standing. The fair value of off-balance sheet financial instruments was not material at December 31, 2010 and 2009.
Income Taxes
Deferred income taxes are provided on the liability method whereby deferred tax assets are recognized for deductible temporary differences and deferred tax liabilities are recognized for taxable temporary differences. Temporary differences are the differences between the reported amounts of assets and liabilities and their tax basis. Deferred tax assets are reduced by a valuation allowance when, in the opinion of management, it is more likely than not that some portion of the deferred tax assets will not be realized. Deferred tax assets and liabilities are adjusted for the effects of changes in tax laws and rates on the date of enactment. Peoples Financial Services Corp. and its subsidiaries file a consolidated federal income tax return.
The Company has evaluated its tax positions as of January 1, 2008, December 31, 2008, December 31, 2009, and December 31, 2010, respectively. A tax position is recognized as a benefit only if it is “more likely than not” that the tax position would be sustained in a tax examination, with a tax examination being presumed to occur. The amount recognized is the largest amount of tax benefit that has a likelihood of being realized on examination of more than 50 percent. For tax positions not meeting the “more likely than not” test, no tax benefit is recorded. Under the “more-likely-than-not” threshold guidelines, the Company believes no significant uncertain tax positions exist, either individually or in the aggregate, that would give rise to the non-recognition of an existing tax benefit. As of January 1, 2008, December 31, 2008, December 31, 2009, and December 31, 2010, respectively, the Company had no material unrecognized tax benefits or accrued interest and penalties.
As applicable, the Company recognizes accrued interest and penalties assessed as a result of an Internal Revenue Service (“IRS”) examination through income tax expense. The Company files income tax returns in the United States of America and various states’ jurisdictions. The Company is no longer subject to federal and state income tax examinations by taxing authorities for years before 2007.
56
PEOPLES FINANCIAL SERVICES CORP.
NOTES TO CONSOLIDATED FINANCIAL STATEMENTS
(Dollars in thousands, except per share data)
NOTE 1 – SUMMARY OF SIGNIFICANT ACCOUNTING POLICIES (CONTINUED)
Advertising
The Company follows the policy of charging marketing and advertising costs to expense as incurred. Advertising expense for the years ended December 31, 2010, 2009, and 2008 was $403, $297 and $201, respectively.
Earnings per Share
Basic earnings per share represent income available to common stockholders divided by the weighted-average number of common shares outstanding during the period. Diluted earnings per share reflect additional common shares that would have been outstanding if dilutive potential common shares had been issued, as well as any adjustment to income that would result from the assumed issuance. Potential common shares that may be issued by the Company relate solely to outstanding stock options, and are determined using the treasury stock method.
The following table shows the amounts used in computing earnings per share for the years ended December 31, 2010, 2009 and 2008:
|
Income Numerator
|
Common Shares Denominator
|
EPS
|
||||||||||
|
2010:
|
||||||||||||
|
Basic EPS
|
$ | 6,485 | 3,139,606 | $ | 2.07 | |||||||
|
Diluted EPS
|
$ | 6,485 | 3,141,468 | $ | 2.06 | |||||||
|
2009:
|
||||||||||||
|
Basic EPS
|
$ | 5,049 | 3,133,518 | $ | 1.61 | |||||||
|
Diluted EPS
|
$ | 5,049 | 3,133,764 | $ | 1.61 | |||||||
|
2008:
|
||||||||||||
|
Basic EPS
|
$ | 3,039 | 3,128,170 | $ | .97 | |||||||
|
Diluted EPS
|
$ | 3,039 | 3,132,693 | $ | .97 | |||||||
Stock options for 9,779, 22,179, and 10,900 shares of common stock were not considered in computing diluted earnings per share for the years ended December 31, 2010, 2009, and 2008, respectively because they were anti-dilutive.
Other Comprehensive Income (Loss)
Accounting principles generally accepted in the United States of America require that recognized revenue, expenses, gains and losses be included in net income. Although certain changes in assets and liabilities, such as unrealized gains and losses on available-for-sale securities, are reported as a separate component of the equity section of the balance sheet, such items, along with net income, are components of other comprehensive income (loss).
57
PEOPLES FINANCIAL SERVICES CORP.
NOTES TO CONSOLIDATED FINANCIAL STATEMENTS
(Dollars in thousands, except per share data)
NOTE 1 – SUMMARY OF SIGNIFICANT ACCOUNTING POLICIES (CONTINUED)
Other Comprehensive Income (Loss) (Continued)
The components of other comprehensive income (loss) and related tax effects for the years ended December 31, 2010, 2009 and 2008 are as follows:
|
2010
|
2009
|
2008
|
||||||||||
|
Unrealized holding gains (losses) on available for sale securities
|
$ | 2,339 | $ | 3,084 | $ | (10,226 | ) | |||||
|
Reclassification adjustment for (gains) losses realized in net income
|
(346 | ) | 492 | (128 | ) | |||||||
|
Reclassification adjustment for other than temporary impairment charges
|
164 | 206 | 5,256 | |||||||||
|
Income tax expense (benefit) related to other comprehensive income (loss)
|
733 | 1,285 | (1,733 | ) | ||||||||
|
Other Comprehensive Income (loss)
|
$ | 1,424 | $ | 2,497 | $ | (3,365 | ) | |||||
Stock-Based Compensation
As of December 31, 2010 and 2009, all stock options were fully vested and there are no unrecognized compensation costs related to stock options. There were no stock options granted for the years ended December 31, 2010, 2009 and 2008, respectively.
Off-Balance Sheet Financial Instruments
In the ordinary course of business, the Company has entered into off-balance sheet financial instruments consisting of commitments to extend credit and standby letters of credit. Such financial instruments are recorded in the consolidated financial statements when they are funded.
Subsequent Events
Effective April 1, 2009, the Company adopted FASB ASC 855 “Subsequent Events”. This topic establishes general standards for accounting for and disclosure of events that occur after the balance sheet date but before financial statements are issued. This topic sets forth the period after the balance sheet date during which management of a reporting entity should evaluate events or transactions that may occur for potential recognition in the financial statements, identifies the circumstances under which an entity should recognize events or transactions occurring after the balance sheet date in its financial statements, and the disclosures that should be made about events or transactions that occur after the balance sheet date. The adoption of ASC 855 had no effect on the operating results or financial position of the Company.
On February 18, 2011, the Company signed an agreement of sale for a piece of property carried in other real estate owned. The carrying value at December 31, 2010, was $3,247. The agreement of sale is for $4,800.
58
PEOPLES FINANCIAL SERVICES CORP.
NOTES TO CONSOLIDATED FINANCIAL STATEMENTS
(Dollars in thousands, except per share data)
NOTE 1 – SUMMARY OF SIGNIFICANT ACCOUNTING POLICIES (CONTINUED)
New Accounting Standards
Accounting Standards Update (“ASU”) 2011-01
The amendments in this Update temporarily delay the effective date of the disclosures about troubled debt restructurings in Update 2010-20 for public entities. Under the existing effective date in Update 2010-20, public-entity creditors would have provided disclosures about troubled debt restructurings for periods beginning on or after December 15, 2010. The delay is intended to allow the Board time to complete its deliberations on what constitutes a troubled debt restructuring. The effective date of the new disclosures about troubled debt restructurings for public entities and the guidance for determining what constitutes a troubled debt restructuring will then be coordinated. Currently, that guidance is anticipated to be effective for interim and annual periods ending after June 15, 2011. The deferral in this amendment is effective upon issuance. The adoption of the amendments in this Update upon the effective date is not expected to have a material effect on the operating results or financial position of the Company.
ASU 2010-29
The objective of this Update is to address diversity in practice about the interpretation of the pro forma revenue and earnings disclosure requirements for business combinations.
Paragraph 805-10-50-2(h) requires a public entity to disclose pro forma information for business combinations that occurred in the current reporting period. The disclosures include pro forma revenue and earnings of the combined entity for the current reporting period as though the acquisition date for all business combinations that occurred during the year had been as of the beginning of the annual reporting period. If comparative financial statements are presented, the pro forma revenue and earnings of the combined entity for the comparable prior reporting period should be reported as though the acquisition date for all business combinations that occurred during the current year had been as of the beginning of the comparable prior annual reporting period.
In practice, some preparers have presented the pro forma information in their comparative financial statements as if the business combination that occurred in the current reporting period had occurred as of the beginning of each of the current and prior annual reporting periods. Other preparers have disclosed the pro forma information as if the business combination occurred at the beginning of the prior annual reporting period only, and carried forward the related adjustments, if applicable, through the current reporting period.
The amendments in this Update specify that if a public entity presents comparative financial statements, the entity should disclose revenue and earnings of the combined entity as though the business combination(s) that occurred during the current year had occurred as of the beginning of the comparable prior annual reporting period only.
The amendments in this Update also expand the supplemental pro forma disclosures under Topic 805 to include a description of the nature and amount of material, nonrecurring pro forma adjustments directly attributable to the business combination included in the reported pro forma revenue and earnings.
59
PEOPLES FINANCIAL SERVICES CORP.
NOTES TO CONSOLIDATED FINANCIAL STATEMENTS
(Dollars in thousands, except per share data)
NOTE 1 – SUMMARY OF SIGNIFICANT ACCOUNTING POLICIES (CONTINUED)
New Accounting Standards (Continued)
The amendments in this Update are effective prospectively for business combinations for which the acquisition date is on or after the beginning of the first annual reporting period beginning on or after December 15, 2010. The adoption of the amendments in this Update upon the effective date is not expected to have a material effect on the operating results or financial position of the Company.
ASU 2010-28
The amendments in this Update modify Step 1 of the goodwill impairment test for reporting units with zero or negative carrying amounts. For those reporting units, an entity is required to perform Step 2 of the goodwill impairment test if it is more likely than not that a goodwill impairment exists. In determining whether it is more likely than not that a goodwill impairment exists, an entity should consider whether there are any adverse qualitative factors indicating that an impairment may exist. The qualitative factors are consistent with the existing guidance and examples in paragraph 350-20-35-30, which requires that goodwill of a reporting unit be tested for impairment between annual tests if an event occurs or circumstances change that would more likely than not reduce the fair value of a reporting unit below its carrying amount.
These amendments eliminate an entity’s ability to assert that a reporting unit is not required to perform Step 2 because the carrying amount of the reporting unit is zero or negative despite the existence of qualitative factors that indicate the goodwill is more likely than not impaired. As a result, goodwill impairments may be reported sooner than under current practice.
For public entities, the amendments in this Update are effective for fiscal years, and interim periods within those years, beginning after December 15, 2010.
Upon adoption of the amendments, an entity with reporting units that have carrying amounts that are zero or negative is required to assess whether it is more likely than not that the reporting units’ goodwill is impaired. If the entity determines that it is more likely than not that the goodwill of one or more of its reporting units is impaired, the entity should perform Step 2 of the goodwill impairment test for those reporting unit(s). Any resulting goodwill impairment should be recorded as a cumulative-effect adjustment to beginning retained earnings in the period of adoption. Any goodwill impairments occurring after the initial adoption of the amendments should be included in earnings as required by Section 350-20-35. The adoption of the amendments in this Update upon the effective date is not expected to have a material effect on the operating results or financial position of the Company.
60
PEOPLES FINANCIAL SERVICES CORP.
NOTES TO CONSOLIDATED FINANCIAL STATEMENTS
(Dollars in thousands, except per share data)
NOTE 2 – SECURITIES
At December 31, 2010 and 2009, the amortized cost and fair values of securities available-for-sale are as follows:
|
Amortized Cost
|
Gross Unrealized Gains
|
Gross Unrealized Losses
|
Fair Value
|
|||||||||||||
|
December 31, 2010:
|
||||||||||||||||
|
U.S. Government agencies and sponsored enterprises
|
$ | 38,133 | $ | 1,094 | $ | 109 | $ | 39,118 | ||||||||
|
Obligations of state and political subdivisions
|
51,789 | 146 | 1,626 | 50,309 | ||||||||||||
|
Taxable obligations of state and political subdivisions
|
18,634 | 127 | 387 | 18,374 | ||||||||||||
|
Corporate debt securities
|
4,467 | 208 | 655 | 4,020 | ||||||||||||
|
Mortgage-backed securities
|
8,520 | 77 | 97 | 8,500 | ||||||||||||
|
Collateralized mortgage obligation
|
162 | 8 | 0 | 170 | ||||||||||||
|
Preferred equity securities
|
54 | 0 | 0 | 54 | ||||||||||||
|
Common equity securities
|
1,277 | 114 | 164 | 1,227 | ||||||||||||
|
Total
|
$ | 123,036 | $ | 1,774 | $ | 3,038 | $ | 121,772 | ||||||||
|
December 31, 2009:
|
||||||||||||||||
|
U.S. Government agencies and sponsored enterprises
|
$ | 60,989 | $ | 103 | $ | 627 | $ | 60,465 | ||||||||
|
Obligations of state and political subdivisions
|
52,836 | 191 | 1,483 | 51,544 | ||||||||||||
|
Taxable obligations of state and political subdivisions
|
2,219 | 20 | 83 | 2,156 | ||||||||||||
|
Corporate debt securities
|
11,738 | 67 | 1,471 | 10,334 | ||||||||||||
|
Mortgage-backed securities
|
4,427 | 212 | 2 | 4,637 | ||||||||||||
|
Collateralized mortgage obligation
|
198 | 5 | 0 | 203 | ||||||||||||
|
Preferred equity securities
|
78 | 7 | 0 | 85 | ||||||||||||
|
Common equity securities
|
1,442 | 4 | 364 | 1,082 | ||||||||||||
|
Total
|
$ | 133,927 | $ | 609 | $ | 4,030 | $ | 130,506 | ||||||||
61
PEOPLES FINANCIAL SERVICES CORP.
NOTES TO CONSOLIDATED FINANCIAL STATEMENTS
(Dollars in thousands, except per share data)
NOTE 2 – SECURITIES (CONTINUED)
The fair value of securities as of December 31, 2010, by contractual maturity, are shown below. Expected maturities may differ from contractual maturities because borrowers may have the right to prepay obligations with or without any penalties.
|
Fair Value
|
||||
|
Due in one year or less
|
$ | 0 | ||
|
Due after one year through five years
|
9,090 | |||
|
Due after five years through ten years
|
40,040 | |||
|
Due after ten years
|
62,691 | |||
|
Mortgage-backed securities
|
8,500 | |||
|
Collateralized mortgage obligation
|
170 | |||
|
Equity securities
|
1,281 | |||
| $ | 121,772 | |||
Proceeds from sale of available-for-sale securities during 2010, 2009 and 2008 were $64,439, $62,172 and $57,997, respectively. Gross gains realized on these sales were $784, $879, and $412, respectively. Gross losses on these sales were $438, $1,371, and $284, respectively.
Securities with a carrying value of $84,281 and $63,066 at December 31, 2010 and 2009, respectively, were pledged to secure public deposits and repurchase agreements as required or permitted by law.
The following tables show the fair value and unrealized losses of available for sale securities with unrealized losses for which an other than temporary impairment has not been recognized at December 31, 2010 and 2009, aggregated by investment category and length of time that the individual securities have been in a continuous unrealized loss position:
December 31, 2010:
|
Less Than 12 Months
|
12 Months or More
|
Total
|
||||||||||||||||||||||
|
Fair Value
|
Unrealized Losses
|
Fair Value
|
Unrealized Losses
|
Fair Value
|
Unrealized Losses
|
|||||||||||||||||||
|
US Govt./Agency
|
$ | 4,414 | $ | 109 | $ | 0 | $ | 0 | $ | 4,414 | $ | 109 | ||||||||||||
|
Obligations of state and political subdivisions
|
33,643 | 977 | 2,645 | 649 | 36,288 | 1,626 | ||||||||||||||||||
|
Taxable obligations of state and political subdivisions
|
12,576 | 324 | 430 | 63 | 13,006 | 387 | ||||||||||||||||||
|
Corporate debt securities
|
0 | 0 | 2,358 | 655 | 2,358 | 655 | ||||||||||||||||||
|
Mortgage-backed securities
|
3,562 | 97 | 0 | 0 | 3,562 | 97 | ||||||||||||||||||
|
Preferred equity securities
|
54 | 0 | 0 | 0 | 54 | 0 | ||||||||||||||||||
|
Common equity securities
|
0 | 0 | 374 | 164 | 374 | 164 | ||||||||||||||||||
| $ | 54,249 | $ | 1,507 | $ | 5,807 | $ | 1,531 | $ | 60,056 | $ | 3,038 | |||||||||||||
62
PEOPLES FINANCIAL SERVICES CORP.
NOTES TO CONSOLIDATED FINANCIAL STATEMENTS
(Dollars in thousands, except per share data)
NOTE 2 – SECURITIES (CONTINUED)
December 31, 2009:
|
Less Than 12 Months
|
12 Months or More
|
Total
|
||||||||||||||||||||||
|
Fair Value
|
Unrealized Losses
|
Fair Value
|
Unrealized Losses
|
Fair Value
|
Unrealized Losses
|
|||||||||||||||||||
|
US Govt./Agency
|
$ | 49,953 | $ | 627 | $ | 0 | $ | 0 | $ | 49,953 | $ | 627 | ||||||||||||
|
Obligations of state and political subdivisions
|
23,138 | 322 | 8,403 | 1,161 | 31,541 | 1,483 | ||||||||||||||||||
|
Taxable obligations of state and political subdivisions
|
716 | 7 | 417 | 76 | 1,133 | 83 | ||||||||||||||||||
|
Corporate debt securities
|
0 | 0 | 8,809 | 1,471 | 8,809 | 1,471 | ||||||||||||||||||
|
Mortgage-backed securities
|
114 | 0 | 121 | 2 | 235 | 2 | ||||||||||||||||||
|
Common equity securities
|
343 | 7 | 619 | 357 | 962 | 364 | ||||||||||||||||||
| $ | 74,264 | $ | 963 | $ | 18,369 | $ | 3,067 | $ | 92,633 | $ | 4,030 | |||||||||||||
At December 31, 2010, the Company had four (all less than 12 months) U.S. Government Agency securities with unrealized losses of $109, 90 (82 less than 12 months, eight greater than 12 months) obligations of state and political subdivisions with unrealized losses of $2,013, four ( all less than 12 months) mortgage-backed securities with unrealized losses of $97, two (both greater than 12 months) corporate debt securities with unrealized losses of $655, and six ( all greater than 12 months) common equity securities with unrealized losses of $164. Management does not consider the unrealized losses, as a result of changes in interest rates, to be other-than-temporary based on historical evidence that indicates the cost of these securities is recoverable within a reasonable period of time in relation to normal cyclical changes in the market rates of interest. Moreover, because there has been no material change in the credit quality of the issuer or other events or circumstances that may cause a significant adverse impact on the fair value of this security, and management does not intend to sell the security and it is unlikely that the Company will be required to sell the securities before recovery of their amortized cost bases, which may be maturity, the Company does not consider the unrealized losses to be OTTI at December 31, 2010 and 2009.
The Company recorded other than temporary impairments of $164 for the year ended December 31, 2010. These impairments were the result of writing down three common equity securities totaling $140 and taking additional impairment charges of $24 on the two preferred equity securities in the portfolio. These write-downs were measured based on public market prices. In reaching the determination to record these impairments, management reviewed the facts and circumstances available surrounding the securities, including the duration and amount of the unrealized loss, the financial condition of the issuer and the prospects for a change in market value within a reasonable period of time. Based on its assessment, management determined that the impairment was other-than-temporary and that a charge was appropriate for these securities. The entire charge was credit related and was recorded in operations.
None of the Company’s corporate debt securities are private label trust preferred issuances. Rather, this portfolio contains corporate bond issuances in large, national financial institutions. The Company sold a corporate debt security (CIT Group, Inc.) in July 2009 for a $1,229 loss. This security was sold due to a decline in the issuer’s rating which occurred in July 2009.
63
PEOPLES FINANCIAL SERVICES CORP.
NOTES TO CONSOLIDATED FINANCIAL STATEMENTS
(Dollars in thousands, except per share data)
NOTE 2 – SECURITIES (CONTINUED)
Management evaluates securities for OTTI at least on a quarterly basis, and more frequently when economic or market conditions warrant such an evaluation. All of the Company’s investment securities classified as available-for-sale are evaluated for OTTI under the rules for accounting for certain investments in debt and equity securities.
In determining OTTI under the rules for accounting for certain debt and equity securities, management considers many factors, including: (1) the length of time and the extent to which the fair value has been less than amortized cost, (2) the financial condition and near-term prospects of the issuer, (3) whether the market decline was affected by macroeconomic conditions, and (4) whether the entity has the intent to sell the debt security or more likely than not will be required to sell the debt security before its anticipated recovery. The assessment of whether an other-than-temporary decline exists involves a high degree of subjectivity and judgment and is based on information available to management at a point in time. An OTTI is deemed to have occurred if there has been an adverse change in the remaining expected future cash flows.
NOTE 3 - LOANS
The major classifications of loans outstanding, net of deferred loan origination fees and costs at December 31, 2010 and 2009 are summarized as follows. Net deferred loan costs were $523 at December 31, 2010, and $495 at December 31, 2009.
|
December 31,
|
||||||||
|
2010
|
2009
|
|||||||
|
Commercial
|
$ | 112,526 | $ | 82,287 | ||||
|
Real estate:
|
||||||||
|
Commercial
|
136,910 | 116,294 | ||||||
|
Residential
|
119,424 | 116,150 | ||||||
|
Consumer
|
21,912 | 20,802 | ||||||
|
Total
|
$ | 390,772 | $ | 335,533 | ||||
A summary of the transactions in the allowance for loan losses is as follows:
|
Years Ended December 31,
|
||||||||||||
|
2010
|
2009
|
2008
|
||||||||||
|
Balance, beginning
|
$ | 3,337 | $ | 3,002 | $ | 2,451 | ||||||
|
Provision for loan losses
|
2,202 | 1,735 | 713 | |||||||||
|
Recoveries
|
50 | 147 | 84 | |||||||||
|
Loans charged off
|
(1,489 | ) | (1,547 | ) | (246 | ) | ||||||
|
Balance, ending
|
$ | 4,100 | $ | 3,337 | $ | 3,002 | ||||||
Included in the commercial loan category are troubled debt restructurings that were classified as impaired. At December 31, 2010, the balance of these loans was $4,185.
The allocation of the allowance for loan losses is as follows:
|
Years Ended December 31,
|
||||||||||||
|
2010
|
2009
|
2008
|
||||||||||
|
Commercial
|
$ | 2,448 | $ | 1,979 | $ | 1,598 | ||||||
|
Residential Real Estate
|
607 | 610 | 627 | |||||||||
|
Consumer
|
220 | 189 | 153 | |||||||||
|
Nonperforming
|
825 | 559 | 624 | |||||||||
| $ | 4,100 | $ | 3,337 | $ | 3,002 | |||||||
64
PEOPLES FINANCIAL SERVICES CORP.
NOTES TO CONSOLIDATED FINANCIAL STATEMENTS
(Dollars in thousands, except per share data)
NOTE 3 – LOANS (CONTINUED)
The following table presents the classes of the loan portfolio summarized by the aggregate pass rating and the classified ratings of special mention, substandard and doubtful within the Company’s internal risk rating system as of December 31, 2010:
|
Pass
|
Special Mention
|
Substandard
|
Doubtful
|
Total
|
||||||||||||||||
|
Commercial
|
$ | 110,728 | $ | 986 | $ | 181 | $ | 631 | $ | 112,526 | ||||||||||
|
Real estate:
|
||||||||||||||||||||
|
Commercial
|
114,109 | 8,836 | 8,731 | 5,234 | 136,910 | |||||||||||||||
|
Residential
|
118,798 | 0 | 0 | 626 | 119,424 | |||||||||||||||
|
Consumer
|
21,890 | 0 | 0 | 22 | 21,912 | |||||||||||||||
|
Total
|
$ | 365,525 | $ | 9,822 | $ | 8,912 | $ | 6,513 | $ | 390,772 | ||||||||||
The following table presents nonaccrual loans by classes of the loan portfolio as of December 31, 2010:
|
2010
|
||||
|
Commercial
|
$ | 631 | ||
|
Real estate:
|
||||
|
Commercial
|
5,234 | |||
|
Residential
|
626 | |||
|
Consumer
|
22 | |||
|
Total
|
$ | 6,513 | ||
The performance and credit quality of the loan portfolio is also monitored by analyzing the age of the loans receivable as determined by the length of time a recorded payment is past due. The following table presents the classes of the loan portfolio summarized by the past due status as of December 31, 2010:
|
30-59 Days Past Due
|
60-89 Days Past Due
|
Greater than 90 Days
|
Total Past Due
|
Current
|
Total Loans Receivables
|
Loans Receivable > 90 Days and Accruing
|
||||||||||||||||||||||
|
Commercial
|
$ | 192 | $ | 81 | $ | 754 | $ | 1,027 | $ | 111,499 | $ | 112,526 | $ | 123 | ||||||||||||||
|
Real estate:
|
||||||||||||||||||||||||||||
|
Commercial
|
1,431 | 0 | 5,234 | 6,665 | 130,245 | 136,910 | 0 | |||||||||||||||||||||
|
Residential
|
1,260 | 358 | 626 | 2,244 | 117,180 | 119,424 | 0 | |||||||||||||||||||||
|
Consumer
|
293 | 133 | 291 | 717 | 21,195 | 21,912 | 269 | |||||||||||||||||||||
|
Total
|
$ | 3,176 | $ | 572 | $ | 6,905 | $ | 10,653 | $ | 380,119 | $ | 390,772 | $ | 392 | ||||||||||||||
65
PEOPLES FINANCIAL SERVICES CORP.
NOTES TO CONSOLIDATED FINANCIAL STATEMENTS
(Dollars in thousands, except per share data)
NOTE 3 - LOANS (CONTINUED)
The following table summarizes information in regards to impaired loans by loan portfolio class as of December 31, 2010:
|
Recorded Investment
|
Unpaid Principal Balance
|
Related Allowance
|
Average Recorded Investment
|
Interest Income Recognized
|
||||||||||||||||
|
With no related allowance recorded:
|
||||||||||||||||||||
|
Commercial
|
$ | 304 | $ | 304 | $ | 0 | $ | 264 | $ | 12 | ||||||||||
|
Real estate:
|
||||||||||||||||||||
|
Commercial
|
6,263 | 6,263 | 0 | 6,394 | 392 | |||||||||||||||
|
Residential
|
383 | 383 | 0 | 384 | 2 | |||||||||||||||
|
Consumer
|
$ | 16 | $ | 16 | $ | 0 | $ | 20 | $ | 2 | ||||||||||
|
With an allowance recorded:
|
||||||||||||||||||||
|
Commercial
|
$ | 5,612 | $ | 5,612 | $ | 663 | $ | 5,629 | $ | 165 | ||||||||||
|
Real estate:
|
||||||||||||||||||||
|
Commercial
|
2,660 | 2,660 | 122 | 2,714 | 166 | |||||||||||||||
|
Residential
|
291 | 291 | 9 | 292 | 5 | |||||||||||||||
|
Consumer
|
$ | 31 | $ | 31 | $ | 31 | $ | 31 | $ | 0 | ||||||||||
|
Total:
|
||||||||||||||||||||
|
Commercial
|
$ | 5,916 | $ | 5,916 | $ | 663 | $ | 5,893 | $ | 177 | ||||||||||
|
Real estate:
|
||||||||||||||||||||
|
Commercial
|
8,923 | 8,923 | 122 | 9,108 | 558 | |||||||||||||||
|
Residential
|
674 | 674 | 9 | 676 | 7 | |||||||||||||||
|
Consumer
|
$ | 47 | $ | 47 | $ | 31 | $ | 51 | $ | 2 | ||||||||||
The total recorded investment in impaired loans was $3,326 at December 31, 2009. The required allowance for loan losses on these loans was $559 at December 31, 2009. At December 31, 2009, impaired loans of $933 did not require a specific reserve. For the years ended December 31, 2009 and 2008, the average balance of impaired loans was $4,184 and $2,695, respectively.
The recorded investment of impaired loans at December 31, 2010 and 2009 included loans on which the accrual of interest has been discontinued of $6,513, and $2,528 respectively. If interest on impaired loans had been accrued throughout the period, interest income for the years ended December 31, 2010, 2009 and 2008, would have increased approximately $169, $135, and $26 respectively. The amount of interest income on these loans that was included in net income for the years ended December 31, 2010, 2009 and 2008 was $105, $43, and $27, respectively.
66
PEOPLES FINANCIAL SERVICES CORP.
NOTES TO CONSOLIDATED FINANCIAL STATEMENTS
(Dollars in thousands, except per share data)
NOTE 3 - LOANS (CONTINUED)
Loans outstanding to directors, executive officers, principal stockholders or to their affiliates totaled $2,234 and $2,146 at December 31, 2010 and 2009, respectively. Advances and repayments during 2010 totaled $879 and $791 respectively. These loans are made during the ordinary course of business at the Company’s normal credit terms. There were no related party loans that were classified as non-accrual, past due, or restructured or were considered a potential credit risk at December 31, 2010 and 2009.
The Company has signed a participating member agreement to sell residential mortgages to Fannie Mae. The balance of loans sold as of December 31, 2010, to Fannie Mae is $34,654. The Company continues to service loans that were sold to the FHLB of Pittsburgh (“FHLB”). The agreement, with FHLB, included a maximum credit enhancement of $178, which the Company may be required to pay if realized losses on any of the sold mortgages exceed the amount held in the FHLB’s Spread Account. The FHLB is funding the Spread Account at 0.25% of the outstanding balance of loans sold. The balance of loans sold as of December 31, 2010, to FHLB is $5,924. The Company’s historical losses on residential mortgages have been lower than the amount being funded to the Spread Account. As such, the Company does not anticipate recognizing any losses and accordingly, has not recorded a liability for the credit enhancement. As compensation for the credit enhancement, the FHLB is paying the Company 0.10% of the outstanding loan balance in the portfolio on a monthly basis.
The Company retains the servicing on the loans sold to Fannie Mae and FHLB and receives a fee based upon the principal balance outstanding. During the years ended 2010 and 2009, the Company recognized $96 and $242 respectively, of servicing assets and amortized $80 and $76 respectively. The balance outstanding was $301 and $285 at December 31, 2010 and 2009, respectively. The fair value of the servicing assets was $301 and $285 at December 31, 2010 and 2009, respectively, and was based on market quotes for pools of the mortgages stratified by rate and maturity date.
NOTE 4 - PREMISES AND EQUIPMENT
Premises and equipment at December 31, 2010 and 2009 are comprised of the following:
|
2010
|
2009
|
|||||||
|
Land
|
$ | 900 | $ | 805 | ||||
|
Building and improvements
|
8,649 | 8,004 | ||||||
|
Furniture, fixtures and equipment
|
7,480 | 6,784 | ||||||
| 17,029 | 15,593 | |||||||
|
Accumulated depreciation
|
(8,791 | ) | (8,084 | ) | ||||
| $ | 8,238 | $ | 7,509 | |||||
Depreciation expense was $719, $696, and $613 for the years ended December 31, 2010, 2009 and 2008, respectively.
67
PEOPLES FINANCIAL SERVICES CORP.
NOTES TO CONSOLIDATED FINANCIAL STATEMENTS
(Dollars in thousands, except per share data)
NOTE 4 - PREMISES AND EQUIPMENT (CONTINUED)
Pursuant to the terms of non-cancelable lease agreements in effect at December 31, 2010, pertaining to banking premises and equipment, future minimum rent commitments under various operating leases are as follows:
|
Year Ended December 31,
|
Amount
|
|||
|
2011
|
$ | 104 | ||
|
2012
|
66 | |||
|
2013
|
68 | |||
|
2014
|
73 | |||
|
2015
|
66 | |||
|
Thereafter
|
92 | |||
| $ | 469 | |||
The leases contain options to extend for periods from one to ten years. The cost of such rentals is not included above. Total rent expense for the years ended December 31, 2010, 2009, and 2008 amounted to $95, $107, and $84, respectively.
NOTE 5 - DEPOSITS
The composition of deposits at December 31, 2010 and 2009 were as follows:
|
2010
|
2009
|
|||||||
|
Demand:
|
||||||||
|
Non-interest bearing
|
$ | 73,663 | $ | 71,835 | ||||
|
Interest bearing
|
77,503 | 81,132 | ||||||
|
Savings
|
195,121 | 170,981 | ||||||
|
Time:
|
||||||||
|
$100,000 and over
|
27,286 | 20,429 | ||||||
|
Less than $100,000
|
65,161 | 65,661 | ||||||
| $ | 438,734 | $ | 410,038 | |||||
At December 31, 2010, the scheduled maturities of time deposits are as follows:
|
2011
|
$ | 41,077 | ||
|
2012
|
15,995 | |||
|
2013
|
10,505 | |||
|
2014
|
19,280 | |||
|
2015
|
3,979 | |||
|
Thereafter
|
1,611 | |||
| $ | 92,447 |
68
PEOPLES FINANCIAL SERVICES CORP.
NOTES TO CONSOLIDATED FINANCIAL STATEMENTS
(Dollars in thousands, except per share data)
NOTE 5 – DEPOSITS (CONTINUED)
The aggregate amount of deposits reclassified as loans was $82 at December 31, 2010, and $419 at December 31, 2009. Management evaluates transaction accounts that are overdrawn for collectability as part of its evaluation for credit losses. During 2010 and 2009, no deposits were received on terms other than those available in the normal course of business.
NOTE 6 - SHORT-TERM BORROWINGS
Securities sold under agreements to repurchase and FHLB advances generally represent overnight or less than 30-day borrowings. U.S. Treasury tax and loan notes for collections made by the Bank are payable on demand. Short-term borrowings consisted of the following at December 31, 2010, 2009 and 2008:
|
At and for the year ended December 31, 2010
|
||||||||||||||||||||
|
Ending Balance
|
Average Balance
|
Maximum Month-End Balance
|
Weighted Average Rate for the Year
|
Weighted Average Rate at End of the Year
|
||||||||||||||||
|
Securities sold under agreements to repurchase
|
$ | 37,912 | $ | 32,077 | $ | 41,678 | 1.22 | % | 1.02 | % | ||||||||||
|
FHLB
|
0 | 34 | 0 | 0.73 | % | 0.00 | % | |||||||||||||
|
U.S. Treasury tax and loan notes
|
812 | 503 | 1,018 | 0.00 | % | 0.00 | % | |||||||||||||
|
|
$ | 38,724 | $ | 32,614 | $ | 42,696 | 1.20 | % | 1.00 | % | ||||||||||
|
At and for the year ended December 31, 2009
|
||||||||||||||||||||
|
Ending Balance
|
Average Balance
|
Maximum Month-End Balance
|
Weighted Average Rate for the Year
|
Weighted Average Rate at End of the Year
|
||||||||||||||||
|
Securities sold under agreements to repurchase
|
$ | 20,148 | $ | 19,271 | $ | 21,220 | 1.62 | % | 1.55 | % | ||||||||||
|
FHLB
|
0 | 280 | 3,670 | 0.80 | % | 0.00 | % | |||||||||||||
|
U.S. Treasury tax and loan notes
|
291 | 451 | 668 | 0.00 | % | 0.00 | % | |||||||||||||
| $ | 20,439 | $ | 20,002 | $ | 25,558 | 1.57 | % | 1.54 | % | |||||||||||
|
At and for the year ended December 31, 2008
|
||||||||||||||||||||
|
Ending Balance
|
Average Balance
|
Maximum Month-End Balance
|
Weighted Average Rate for the Year
|
Weighted Average Rate at End of the Year
|
||||||||||||||||
|
Securities sold under agreements to repurchase
|
$ | 17,351 | $ | 12,775 | $ | 17,351 | 2.10 | % | 1.54 | % | ||||||||||
|
FHLB
|
0 | 3,575 | 9,950 | 3.16 | % | 0.00 | % | |||||||||||||
|
U.S. Treasury tax and loan notes
|
1,081 | 524 | 1,081 | 1.45 | % | 0.70 | % | |||||||||||||
| $ | 18,432 | $ | 16,874 | $ | 28,382 | 2.30 | % | 1.49 | % | |||||||||||
69
PEOPLES FINANCIAL SERVICES CORP.
NOTES TO CONSOLIDATED FINANCIAL STATEMENTS
(Dollars in thousands, except per share data)
NOTE 6 - SHORT-TERM BORROWINGS (CONTINUED)
The Bank has an agreement with the FHLB which allows for borrowings up to a percentage of qualifying assets. At December 31, 2010, the Bank had a maximum borrowing capacity for short- and long-term advances of approximately $159,493 of which $27,336 was outstanding in short- and long-term borrowings. All advances from FHLB are secured by qualifying assets of the Bank. Interest accrues daily on the FHLB advances based on the FHLB discount notes. This rate resets each day.
Securities sold under repurchase agreements are retained under the Bank’s control at its safekeeping agent. The Bank may be required to provide additional collateral based on the fair value of the underlying securities.
Securities owned by the Company provide collateral for U.S. Treasury tax and loan notes.
The Bank has a $7,000 line of credit for the sale of federal funds with Atlantic Central Bankers Bank of which $0 was outstanding at December 31, 2010 and 2009. These borrowings are unsecured. The Bank also has a $1,723 line of credit available with the Federal Reserve Bank of Philadelphia of which $0 was outstanding at December 31, 2010 and 2009. These borrowings are secured with securities owned by the Bank.
NOTE 7 - LONG-TERM BORROWINGS
Long-term borrowings consisted of advances from the Federal Home Loan Bank under various notes.
|
Due
|
Convertible
|
Strike Rate
|
Current Interest Rate
|
2010
|
2009
|
|||||||||||||||
|
August 2010
|
N/A | N/A | 4.85 | % | $ | 0 | $ | 2,500 | ||||||||||||
|
September 2011
|
N/A | N/A | 5.05 | % | 150 | 341 | ||||||||||||||
|
October 2011
|
January 2011
|
8.0 | % | 4.47 | % | 2,500 | 2,500 | |||||||||||||
|
December 2011
|
N/A | N/A | 4.12 | % | 0 | 3,000 | ||||||||||||||
|
September 2012
|
March 2011
|
8.0 | % | 3.69 | % | 5,000 | 5,000 | |||||||||||||
|
January 2013
|
January 2011
|
N/A | 2.67 | % | 5,000 | 5,000 | ||||||||||||||
|
February 2013
|
February 2011
|
8.0 | % | 3.59 | % | 5,000 | 5,000 | |||||||||||||
|
June 2014
|
N/A | N/A | 4.47 | % | 0 | 5,000 | ||||||||||||||
|
January 2015
|
January 2011
|
8.0 | % | 4.31 | % | 5,000 | 5,000 | |||||||||||||
|
November 2015
|
N/A | N/A | 4.67 | % | 1,209 | 1,423 | ||||||||||||||
|
February 2016
|
N/A | N/A | 4.86 | % | 634 | 740 | ||||||||||||||
|
February 2016
|
N/A | N/A | 4.86 | % | 635 | 740 | ||||||||||||||
|
February 2017
|
N/A | N/A | 4.99 | % | 2,208 | 2,506 | ||||||||||||||
| $ | 27,336 | $ | 38,750 | |||||||||||||||||
70
PEOPLES FINANCIAL SERVICES CORP.
NOTES TO CONSOLIDATED FINANCIAL STATEMENTS
(Dollars in thousands, except per share data)
NOTE 7 - LONG-TERM BORROWINGS (CONTINUED)
On convertible rate notes, the FHLB has the option to convert the notes at rates ranging from the three-month LIBOR (0.30% at December 31, 2010) plus .15% to plus .28% on a quarterly basis, if greater than the applicable strike rate, commencing on the conversion date. If converted, the Bank has the option to repay these advances at each of the option dates without penalty.
Maturities of long-term debt, by contractual maturity, in years subsequent to December 31, 2010 are as follows:
|
2011
|
$ | 3,409 | ||
|
2012
|
5,797 | |||
|
2013
|
10,836 | |||
|
2014
|
878 | |||
|
2015
|
5,899 | |||
|
Thereafter
|
517 | |||
| $ | 27,336 |
The notes are secured under terms of a blanket collateral agreement by a pledge of qualifying investment and mortgage-backed securities, certain mortgage loans and a lien on FHLB stock.
NOTE 8 - STOCK PURCHASE PLANS
The Company has a stock option plan covering non-employee directors and a stock incentive plan for all officers and key employees. The Plan is administered by a committee of the Board of Directors. Under the Plan, 187,500 shares of common stock are reserved for possible issuance. The number of shares available is subject to future adjustment in the event of specified changes in the Company’s capital structure. Under the Plan, the exercise price cannot be less than 100% of the fair market value on the date of grant. The vesting period of options granted is at the discretion of the Board of Directors. There were 65,751 shares available for grant under this stock option plan as of December 31, 2010.
A summary of transactions under this Plan were as follows:
|
2010
|
2009
|
2008
|
||||||||||||||||||||||
|
Options
|
Weighted Average Price
|
Options
|
Weighted Average Price
|
Options
|
Weighted Average Price
|
|||||||||||||||||||
|
Outstanding, beginning of year
|
27,449 | $ | 22.43 | 33,549 | $ | 21.78 | 47,593 | $ | 20.75 | |||||||||||||||
|
Granted
|
0 | 0 | 0 | 0 | 0 | 0 | ||||||||||||||||||
|
Exercised
|
(5,575 | ) | 18.50 | (4,975 | ) | 17.10 | (12,694 | ) | 15.84 | |||||||||||||||
|
Forfeited
|
(300 | ) | 30.78 | (1,125 | ) | 26.63 | (1,350 | ) | 30.78 | |||||||||||||||
|
Outstanding, end of year
|
21,574 | $ | 23.34 | 27,449 | $ | 22.43 | 33,549 | $ | 21.78 | |||||||||||||||
|
Exercisable, end of year
|
21,574 | $ | 23.34 | 27,449 | $ | 22.43 | 33,549 | $ | 21.78 | |||||||||||||||
71
PEOPLES FINANCIAL SERVICES CORP.
NOTES TO CONSOLIDATED FINANCIAL STATEMENTS
(Dollars in thousands, except per share data)
NOTE 8 - STOCK PURCHASE PLANS (CONTINUED)
The weighted-average remaining contractual life of the options outstanding is approximately two years at December 31, 2010. The weighted-average remaining contractual life of options exercisable at December 31, 2010 is approximately two years. Stock options outstanding at December 31, 2010 are exercisable at prices ranging from $16.50 to $34.10 a share. At December 31, 2010, 2009 and 2008, the aggregate intrinsic value of options outstanding was $70, $0 and $0, and the aggregate intrinsic value of options exercisable was $70, $0, and $0, respectively. The aggregate intrinsic value of options exercised was $45, $2, and $96 for the years ended December 31, 2010, 2009, and 2008.
The Company offers its shareholders a Dividend Reinvestment and Stock Purchase Plan. Under the Plan, the Company registered with the Securities and Exchange Commission 100,000 shares of the common stock to be sold pursuant to the Plan. Participation is available to all common stockholders. The Plan provides each participant with a simple and convenient method of purchasing additional common shares without payment of any brokerage commission or other service fees. The Plan may purchase shares on the open market if available or they may be issued from treasury shares. A participant in the Plan may elect to reinvest dividends on all or part of their shares to acquire additional common stock. The Plan permits stockholders participating in the Plan to purchase additional shares of common stock with voluntary cash payments of a minimum of $100 and a maximum of $850 each calendar month. A participant may withdraw from the Plan at any time. As of December 31, 2010, there are 65,751 remaining shares available for issuance under the Dividend Reinvestment and Stock Purchase Plan.
NOTE 9 - INCOME TAXES
The provision for federal income taxes consists of the following:
|
Years Ended December 31,
|
||||||||||||
|
2010
|
2009
|
2008
|
||||||||||
|
Current
|
$ | 1,625 | $ | (591 | ) | $ | 1,824 | |||||
|
Deferred
|
(188 | ) | 1,514 | (1,737 | ) | |||||||
| $ | 1,437 | $ | 923 | $ | 87 | |||||||
72
PEOPLES FINANCIAL SERVICES CORP.
NOTES TO CONSOLIDATED FINANCIAL STATEMENTS
(Dollars in thousands, except per share data)
NOTE 9 - INCOME TAXES (CONTINUED)
The components of the net deferred tax asset at December 31, 2010 and 2009 are as follows:
|
2010
|
2009
|
|||||||
|
Deferred tax asset:
|
||||||||
|
Allowance for loan losses
|
$ | 1,018 | $ | 753 | ||||
|
Deferred loan fees
|
2 | 3 | ||||||
|
Deferred compensation
|
345 | 355 | ||||||
|
Other
|
42 | 92 | ||||||
|
Impairment on securities
|
449 | 413 | ||||||
|
Capital loss carry forward
|
0 | 15 | ||||||
|
Stock option expense
|
1 | 2 | ||||||
|
Alternative minimum tax credit
|
0 | 68 | ||||||
|
Impairment charge—other real estate owned
|
195 | 195 | ||||||
|
Unrealized loss on available for sale securities
|
430 | 1,164 | ||||||
| 2,482 | 3,060 | |||||||
|
Deferred tax liabilities:
|
||||||||
|
Depreciation
|
(399 | ) | (346 | ) | ||||
|
Interest on preferred equity securities
|
(16 | ) | (17 | ) | ||||
|
Section 481 Adjustment-Prepaid Expenses
|
(88 | ) | (68 | ) | ||||
|
Section 481 Adjustment-Deferred Loan Costs
|
(265 | ) | (256 | ) | ||||
| (768 | ) | (687 | ) | |||||
|
Net Deferred Tax Asset
|
$ | 1,714 | $ | 2,373 | ||||
Management believes that future taxable income will satisfy this temporary difference between the current book value of the Company’s assets and their taxable base. Core earnings of the Company have remained strong and will continue to support the recognition of the deferred tax asset based on future growth projections.
A reconciliation of the provision for income taxes and the amount that would have been provided at statutory rates for the years ended December 31 is as follows:
|
2010
|
2009
|
2008
|
||||||||||||||||||||||
|
Amount
|
% of Pretax Income
|
Amount
|
% of Pretax Income
|
Amount
|
% of Pretax Income
|
|||||||||||||||||||
|
Federal income tax at statutory rate
|
$ | 2,693 | 34 | % | $ | 2,030 | 34 | % | $ | 1,063 | 34 | % | ||||||||||||
|
Tax exempt interest
|
(1,064 | ) | (13 | ) | (1,037 | ) | (17 | ) | (938 | ) | (30 | ) | ||||||||||||
|
Non-deductible interest
|
63 | 1 | 80 | 1 | 96 | 3 | ||||||||||||||||||
|
Officers’ life insurance income
|
(217 | ) | (3 | ) | (115 | ) | (2 | ) | (101 | ) | (3 | ) | ||||||||||||
|
Other, net
|
(38 | ) | (1 | ) | (35 | ) | (1 | ) | (33 | ) | (1 | ) | ||||||||||||
| $ | 1,437 | 18 | % | $ | 923 | 15 | % | $ | 87 | 3 | % | |||||||||||||
The income tax provision includes $118, ($167), and $44 in 2010, 2009 and 2008, respectively, of income tax (benefit) expense on net realized securities gains and losses.
73
PEOPLES FINANCIAL SERVICES CORP.
NOTES TO CONSOLIDATED FINANCIAL STATEMENTS
(Dollars in thousands, except per share data)
NOTE 10 - EMPLOYEE BENEFIT PLANS
The Company has an employee stock ownership and profit-sharing plan with 401(k) provisions. The Plan is for the benefit of all employees who meet the eligibility requirements set forth in the Plan. The amount of employer contributions to the plan, including 401(k) matching contributions, is at the discretion of the Board of Directors. Employer ESOP contributions are allocated to participant accounts based on their percentage of total compensation for the Plan year. During 2010, 2009 and 2008, ESOP contributions to the Plan charged to operations were $202, $204, and $151 respectively. During 2010, 2009 and 2008, employer 401(k) matching contributions to the Plan charged to operations were $109, $99, and $94 respectively. At December 31, 2010, 157,326 shares of the Company’s common stock were held in the Plan. In the event a terminated Plan participant desires to sell his or her shares of the Company’s stock, or for certain employees who elect to diversify their account balances, the Company may be required to purchase the shares from the participant at their fair market value.
The Bank has deferred compensation agreements with its chief operating officer and certain current and former directors that provide fixed retirement benefits. The Bank’s deferred compensation liability as of December 31, 2010 and 2009 was $1,014 and $1,043 respectively. Payments to retired directors totaled $90 for each of the years ended December 31, 2010, 2009 and 2008. The cost charged to operations for these deferred compensation plans was $56, $62, and $58 for the years ended December 31, 2010, 2009 and 2008, respectively.
NOTE 11 – CONTINGENCIES
The Company is subject to lawsuits and claims arising out of its business. In the opinion of the Company’s management, after review and consultation with counsel, any proceedings that may arise should not result in judgments, which, in the aggregate, would have a material adverse effect on the Company’s consolidated financial statements.
NOTE 12 - FINANCIAL INSTRUMENTS WITH OFF-BALANCE SHEET RISK
The Company is a party to financial instruments with off-balance sheet risk in the normal course of business to meet the financing needs of its customers. These financial instruments include commitments to extend credit and letters of credit. Those instruments involve, to varying degrees, elements of credit risk in excess of the amount recognized in the consolidated balance sheets.
The Company’s exposure to credit loss in the event of nonperformance by the other party to the financial instrument for commitments to extend credit and letters of credit is represented by the contractual amount of those instruments. The Company uses the same credit policies in making commitments and conditional obligations as it does for on-balance sheet instruments.
74
PEOPLES FINANCIAL SERVICES CORP.
NOTES TO CONSOLIDATED FINANCIAL STATEMENTS
(Dollars in thousands, except per share data)
NOTE 12 - FINANCIAL INSTRUMENTS WITH OFF-BALANCE SHEET RISK (CONTINUED)
The contract or notional amounts at December 31, 2010 and 2009 were as follows:
|
2010
|
2009
|
|||||||
|
Commitments to extend credit
|
$ | 5,617 | $ | 5,714 | ||||
|
Unused portions of lines of credit
|
32,225 | 32,990 | ||||||
|
Standby letters of credit
|
18,170 | 15,691 | ||||||
| $ | 56,012 | $ | 54,395 | |||||
Commitments to extend credit are agreements to lend to a customer as long as there is no violation of any condition established in the contract. Since many of the commitments are expected to expire without being drawn upon, the total commitment amounts do not necessarily represent future cash requirements. Commitments generally have fixed expiration dates or other termination clauses and may require payment of a fee. The Company evaluates each customer’s credit worthiness on a case-by-case basis. The amount of collateral obtained, if deemed necessary by the Company upon extension of credit, is based on management’s credit evaluation. Collateral held varies but may include personal or commercial real estate, accounts receivable, inventory and equipment.
Unused portions of lines of credit, including home equity and overdraft protection agreements, are commitments for possible future extensions of credit to existing customers. Unused portions of home equity lines are collateralized and generally have fixed expiration dates. Overdraft protection agreements are uncollateralized and usually do not carry specific maturity dates. Unused portions of lines of credit ultimately may not be drawn upon to the total extent to which the Company is committed.
Standby letters of credit written are conditional commitments issued by the Company to guarantee the performance of a customer to a third party. The majority of these standby letters of credit expire within the next twelve months. The credit risk involved in issuing letters of credit is essentially the same as that involved in extending other loan commitments. The Company requires collateral supporting these letters of credit as deemed necessary. The maximum undiscounted exposure related to these commitments at December 31, 2010 and 2009 was $18,170 and $15,691 respectively and the approximate value of underlying collateral upon liquidation that would be expected to cover this maximum potential exposure was $15,541 and $12,214, respectively. The current amount of the liability as of December 31, 2010 and 2009 for guarantees under standby letters of credit issued is not material.
NOTE 13 - REGULATORY MATTERS
The Bank is required to maintain average cash reserve balances in vault cash and with the Federal Reserve Bank based on a percentage of deposits. The required reserve balance at December 31, 2010 and 2009 was $840 and $899, respectively.
Dividends are paid by the Company from its assets, which are mainly provided by dividends from the Bank. However, certain restrictions exist regarding the ability of the Bank to transfer funds to the Company in the form of cash dividends, loans or advances. Under such restrictions, the Bank may not, without the prior approval, declare dividends in excess of the sum of its net profit for that year combined with its retained net profits of the preceding two calendar years, less any required transfer to surplus.
75
PEOPLES FINANCIAL SERVICES CORP.
NOTES TO CONSOLIDATED FINANCIAL STATEMENTS
(Dollars in thousands, except per share data)
NOTE 13 - REGULATORY MATTERS (CONTINUED)
The amount of funds available for transfer from the Bank to the Company in the form of loans and other extensions of credit is also limited. Under the provisions of Section 23A of the Federal Reserve Act, transfers to any one affiliate are limited to 10.0 percent of capital and surplus. At December 31, 2010, the maximum amount available for transfer from the Bank to the Company in the form of loans amounted to $4,634. At December 31, 2010 and 2009, there were no loans outstanding, nor were any advances made during 2010 and 2009.
The Company and the Bank are subject to certain regulatory capital requirements administered by the federal banking agencies, which are defined in Section 38 of the Federal Deposit Insurance Corporation Improvement Act of 1991 (“FDICIA”). Failure to meet minimum capital requirements can initiate certain mandatory and possibly additional discretionary actions by regulators that, if undertaken, could have a direct material effect on the Company’s and the Bank’s financial statements. In the event an institution is deemed to be undercapitalized by such standards, FDICIA prescribes an increasing amount of regulatory intervention, including the required institution of a capital restoration plan and restrictions on the growth of assets, branches or lines of business. Further restrictions are applied to the significantly or critically undercapitalized institutions including restrictions on interest payable on accounts, dismissal of management and appointment of a receiver. For well capitalized institutions, FDICIA provides authority for regulatory intervention when the institution is deemed to be engaging in unsafe and unsound practices or receives a less than satisfactory examination report rating. Under capital adequacy guidelines and the regulatory framework for prompt corrective action, the Company and the Bank must meet specific capital guidelines that involve quantitative measures of their assets, liabilities and certain off-balance sheet items as calculated under regulatory accounting practices. The capital amounts and classifications are also subject to qualitative judgments by the regulators about components, risk weightings and other factors. Prompt corrective action provisions are not applicable to bank holding companies.
The Bank was categorized as well capitalized under the regulatory framework for prompt corrective action at December 31, 2010 and 2009, based on the most recent notification from the Federal Deposit Insurance Corporation. To be categorized as well capitalized, the Bank must maintain certain minimum Tier I risk-based, total risk-based and Tier I Leverage ratios as set forth in the following tables. The Tier I Leverage ratio is defined as Tier I capital to total average assets less intangible assets. There are no conditions or events since the most recent notification that management believes have changed the Bank’s category.
76
PEOPLES FINANCIAL SERVICES CORP.
NOTES TO CONSOLIDATED FINANCIAL STATEMENTS
(Dollars in thousands, except per share data)
NOTE 13 - REGULATORY MATTERS (CONTINUED)
The Company and Bank’s actual capital ratios as of December 31, 2010 and 2009, and the minimum ratios required for capital adequacy purposes and to be well capitalized under the prompt corrective action provisions are as follows:
|
Actual
|
Minimum For Capital Adequacy Purposes
|
Minimum to be Well Capitalized under Prompt Corrective Action Provisions
|
|||||||||||||||||||||
|
Amount
|
Ratio
|
Amount
|
Ratio
|
Amount
|
Ratio
|
||||||||||||||||||
|
December 31, 2010:
|
|||||||||||||||||||||||
|
Total capital (to risk-weighted assets):
|
|||||||||||||||||||||||
|
Consolidated
|
$ | 54,398 | 12.68 | % | $ | 34,320 | 8.00 | % | N/A | N/A | |||||||||||||
|
Bank
|
50,717 | 11.86 | 34,214 | 8.00 | $ | 42,767 | 10.00 | % | |||||||||||||||
|
Tier 1 capital (to risk-weighted assets):
|
|||||||||||||||||||||||
|
Consolidated
|
50,298 | 11.72 | 17,160 | 4.00 | N/A | N/A | |||||||||||||||||
|
Bank
|
46,617 | 10.90 | 17,107 | 4.00 | 25,660 | 6.00 | |||||||||||||||||
|
Tier 1 capital (to average assets):
|
|||||||||||||||||||||||
|
Consolidated
|
50,298 | 9.19 | 21,897 | 4.00 | N/A | N/A | |||||||||||||||||
|
Bank
|
$ | 46,617 | 8.53 | % | $ | 21,860 | 4.00 | % | $ | 27,324 | 5.00 | % | |||||||||||
|
December 31, 2009:
|
|||||||||||||||||||||||
|
Total capital (to risk-weighted assets):
|
|||||||||||||||||||||||
|
Consolidated
|
$ | 50,004 | 13.18 | % | $ | 30,358 | 8.00 | % | N/A | N/A | |||||||||||||
|
Bank
|
45,560 | 12.07 | 30,202 | 8.00 | $ | 37,753 | 10.00 | % | |||||||||||||||
|
Tier 1 capital (to risk-weighted assets):
|
|||||||||||||||||||||||
|
Consolidated
|
46,668 | 12.30 | 15,179 | 4.00 | N/A | N/A | |||||||||||||||||
|
Bank
|
42,221 | 11.18 | 15,101 | 4.00 | 22,652 | 6.00 | |||||||||||||||||
|
Tier 1 capital (to average assets):
|
|||||||||||||||||||||||
|
Consolidated
|
46,668 | 9.92 | 18,812 | 4.00 | N/A | N/A | |||||||||||||||||
|
Bank
|
$ | 42,221 | 9.02 | % | $ | 18,720 | 4.00 | % | $ | 23,400 | 5.00 | % | |||||||||||
77
PEOPLES FINANCIAL SERVICES CORP.
NOTES TO CONSOLIDATED FINANCIAL STATEMENTS
(Dollars in thousands, except per share data)
NOTE 14 - FAIR VALUE OF FINANCIAL INSTRUMENTS
Financial assets and liabilities measured at fair value on a nonrecurring basis, by level within the fair value hierarchy used at December 31, 2010 and December 31, 2009 are as follows:
|
Amount
|
(Level 1)
Quoted Prices in Active Markets for Identical Assets
|
(Level 2)
Significant Other Observable Inputs
|
(Level 3)
Significant Unobservable Inputs
|
|||||||||||||
|
December 31, 2010
|
||||||||||||||||
|
Securities available for sale
|
$ | 121,772 | $ | 1,227 | $ | 120,545 | $ | 0 | ||||||||
|
December 31, 2009
|
||||||||||||||||
|
Securities available for sale
|
$ | 130,506 | $ | 1,082 | $ | 129,424 | $ | 0 | ||||||||
Investment securities available for sale reported at fair value using Level 1 inputs include marketable common equity securities trading in active exchange markets. The fair value of investment securities available for sale utilizing Level 2 inputs include debt securities and preferred equity securities with prices based on a matrix pricing model. This method for determining fair value is a mathematical technique widely used in the industry to value debt securities without relying exclusively on quoted prices for the specific securities, but rather by relying on the securities’ relationship to other benchmark quoted securities.
Financial assets and liabilities measured at fair value on a nonrecurring basis, by level within the fair value hierarchy used at December 31, 2010, and December 31, 2009, are as follows:
|
Amount
|
(Level 1)
Quoted Prices in Active Markets for Identical Assets
|
(Level 2)
Significant Other Observable Inputs
|
(Level 3)
Significant Unobservable Inputs
|
|||||||||||||
|
December 31, 2010
|
||||||||||||||||
|
Impaired loans
|
$ | 7,769 | $ | 0 | $ | 0 | $ | 7,769 | ||||||||
|
Other real estate owned
|
$ | 3,387 | $ | 0 | $ | 0 | $ | 3,387 | ||||||||
|
December 31, 2009
|
||||||||||||||||
|
Impaired loans
|
$ | 1,834 | $ | 0 | $ | 0 | $ | 1,834 | ||||||||
|
Other real estate owned
|
$ | 5,534 | $ | 0 | $ | 0 | $ | 5,534 | ||||||||
Impaired loans are those for which the Bank has measured and recorded impairment, generally based on the fair value of the loan’s collateral. Fair value is generally determined based upon independent third-party appraisals of the properties, or discounted cash flows based upon the expected proceeds. These assets are included as Level 3 fair values, based upon the lowest level of input that is significant to the fair value measurements. At December 31, 2010, the fair value consists of the loan balances of $8,594, net of a valuation allowance of $825. At December 31, 2009, the fair value consists of the loan balances of $2,393, net of a valuation allowance of $559.
78
PEOPLES FINANCIAL SERVICES CORP.
NOTES TO CONSOLIDATED FINANCIAL STATEMENTS
(Dollars in thousands, except per share data)
NOTE 14 - FAIR VALUE OF FINANCIAL INSTRUMENTS (CONTINUED)
Fair value of other real estate owned is determined based on independent third-party appraisals of the properties less cost to sell. These assets are included as Level 3 fair values, based upon the lowest level input that is significant to fair value measurements.
The estimated fair values of the Company’s financial instruments were as follows at December 31, 2010 and 2009.
|
December 31, 2010
|
December 31, 2009
|
|||||||||||||||
|
Carrying Amount
|
Fair Value
|
Carrying Amount
|
Fair Value
|
|||||||||||||
|
Financial assets:
|
||||||||||||||||
|
Cash and cash equivalents
|
$ | 17,841 | $ | 17,841 | $ | 18,915 | $ | 18,915 | ||||||||
|
Securities available for sale
|
121,772 | 121,772 | 130,506 | 130,506 | ||||||||||||
|
Loans held for sale
|
30 | 30 | 770 | 770 | ||||||||||||
|
Net loans
|
386,672 | 442,259 | 332,196 | 382,503 | ||||||||||||
|
Investment in restricted stock
|
2,642 | 2,642 | 2,870 | 2,870 | ||||||||||||
|
Accrued interest receivable
|
$ | 3,003 | $ | 3,003 | $ | 2,580 | $ | 2,580 | ||||||||
|
Financial liabilities:
|
||||||||||||||||
|
Deposits
|
$ | 438,734 | $ | 440,529 | $ | 410,038 | $ | 411,043 | ||||||||
|
Short-term borrowings
|
38,724 | 38,724 | 20,439 | 20,439 | ||||||||||||
|
Long-term borrowings
|
27,336 | 27,872 | 38,750 | 39,255 | ||||||||||||
|
Accrued interest payable
|
$ | 311 | $ | 311 | $ | 446 | $ | 446 | ||||||||
79
PEOPLES FINANCIAL SERVICES CORP.
NOTES TO CONSOLIDATED FINANCIAL STATEMENTS
(Dollars in thousands, except per share data)
NOTE 15 - PARENT COMPANY ONLY FINANCIAL INFORMATION
Balance Sheets
|
December 31,
|
||||||||
|
2010
|
2009
|
|||||||
|
ASSETS
|
||||||||
|
Cash
|
$ | 617 | $ | 1,285 | ||||
|
Investment in bank subsidiary
|
40,665 | 35,362 | ||||||
|
Investment in non-bank subsidiary
|
5,500 | 5,472 | ||||||
|
Due from subsidiaries
|
2,633 | 1,694 | ||||||
|
Securities available for sale
|
1,227 | 1,081 | ||||||
|
Other assets
|
75 | 155 | ||||||
|
Total Assets
|
$ | 50,717 | $ | 45,049 | ||||
|
LIABILITIES AND STOCKHOLDERS’ EQUITY
|
||||||||
|
Other liabilities
|
$ | 201 | $ | 79 | ||||
|
Stockholders’ equity:
|
||||||||
|
Common stock
|
6,683 | 6,683 | ||||||
|
Capital Surplus
|
3,118 | 3,098 | ||||||
|
Retained earnings
|
46,048 | 42,043 | ||||||
|
Accumulated other comprehensive loss
|
(834 | ) | (2,258 | ) | ||||
| 55,015 | 49,566 | |||||||
|
Treasury stock
|
(4,499 | ) | (4,596 | ) | ||||
|
Total Stockholders’ Equity
|
50,516 | 44,970 | ||||||
|
Total Liabilities and Stockholders’ Equity
|
$ | 50,717 | $ | 45,049 | ||||
Statements of Income
|
Years Ended December 31,
|
||||||||||||
|
2010
|
2009
|
2008
|
||||||||||
|
Dividends from bank subsidiary
|
$ | 2,480 | $ | 2,381 | $ | 2,729 | ||||||
|
Other income
|
349 | 663 | 492 | |||||||||
|
Other expenses
|
523 | 606 | 817 | |||||||||
| 2,306 | 2,438 | 2,404 | ||||||||||
|
Income tax expense
|
0 | 45 | 0 | |||||||||
| 2,306 | 2,393 | 2,404 | ||||||||||
|
Equity in undistributed net income of subsidiaries
|
4,179 | 2,656 | 635 | |||||||||
|
Net Income
|
$ | 6,485 | $ | 5,049 | $ | 3,039 | ||||||
80
PEOPLES FINANCIAL SERVICES CORP.
NOTES TO CONSOLIDATED FINANCIAL STATEMENTS
(Dollars in thousands, except per share data)
NOTE 15 - PARENT COMPANY ONLY FINANCIAL INFORMATION (CONTINUED)
STATEMENTS OF CASH FLOWS
|
Years Ended December 31,
|
||||||||||||
|
2010
|
2009
|
2008
|
||||||||||
|
CASH FLOWS FROM OPERATING ACTIVITIES
|
||||||||||||
|
Net income
|
$ | 6,485 | $ | 5,049 | $ | 3,039 | ||||||
|
Adjustments to reconcile net income to net cash provided by operating activities:
|
||||||||||||
|
Net realized losses (gains) on sales of securities
|
1 | (263 | ) | 14 | ||||||||
|
Other than temporary security impairment
|
140 | 206 | 388 | |||||||||
|
Stock option expense
|
0 | 0 | 1 | |||||||||
|
Undistributed net income of subsidiaries
|
(4,179 | ) | (2,656 | ) | (635 | ) | ||||||
|
(Increase) decrease in other assets
|
(24 | ) | 0 | 34 | ||||||||
|
Decrease in due from subsidiaries
|
(711 | ) | (716 | ) | (48 | ) | ||||||
|
Net Cash Provided by Operating Activities
|
1,712 | 1,620 | 2,793 | |||||||||
|
CASH FLOWS PROVIDED BY INVESTING ACTIVITIES
|
||||||||||||
|
Proceeds from sale of available for sale securities
|
24 | 1,043 | 298 | |||||||||
|
Purchase of available-for-sale securities
|
0 | 0 | (19 | ) | ||||||||
|
Purchase of premises and equipment
|
(41 | ) | 0 | 0 | ||||||||
|
Net Cash Provided by (Used In) Investing Activities
|
(17 | ) | 1,043 | 279 | ||||||||
|
CASH FLOWS FROM FINANCING ACTIVITIES
|
||||||||||||
|
Cash dividends paid
|
(2,480 | ) | (2,381 | ) | (2,417 | ) | ||||||
|
Proceeds from sale of treasury stock
|
117 | 85 | 234 | |||||||||
|
Purchase of treasury stock
|
0 | 0 | (506 | ) | ||||||||
|
Net Cash Used in Financing Activities
|
(2,363 | ) | (2,296 | ) | (2,689 | ) | ||||||
|
Increase (Decrease) in Cash and Cash Equivalents
|
(668 | ) | 367 | 383 | ||||||||
|
CASH AND CASH EQUIVALENTS - BEGINNING
|
1,285 | 918 | 535 | |||||||||
|
CASH AND CASH EQUIVALENTS - ENDING
|
$ | 617 | $ | 1,285 | $ | 918 | ||||||
81
PEOPLES FINANCIAL SERVICES CORP.
NOTES TO CONSOLIDATED FINANCIAL STATEMENTS
(Dollars in thousands, except per share data)
NOTE 16 - QUARTERLY RESULTS OF OPERATIONS (UNAUDITED)
|
Quarter Ended 2010
|
||||||||||||||||
|
31-Mar
|
30-Jun
|
30-Sep
|
31-Dec
|
|||||||||||||
|
Interest Income
|
$ | 6,250 | $ | 6,481 | $ | 6,340 | $ | 6,506 | ||||||||
|
Interest Expense
|
1,715 | 1,715 | 1,635 | 1,433 | ||||||||||||
|
Net Interest Income
|
4,535 | 4,766 | 4,705 | 5,073 | ||||||||||||
|
Provision for Loan Losses
|
895 | 682 | 445 | 180 | ||||||||||||
|
Securities Gains (Losses)
|
22 | 179 | 22 | 123 | ||||||||||||
|
Other Than Temporary Impairment
|
0 | 0 | (140 | ) | (24 | ) | ||||||||||
|
Other Income
|
1,090 | 1,132 | 1,033 | 853 | ||||||||||||
|
Other Expense
|
3,037 | 3,510 | 3,503 | 3,195 | ||||||||||||
|
Income Before Income Taxes
|
1,715 | 1,885 | 1,672 | 2,650 | ||||||||||||
|
Income Taxes
|
197 | 361 | 272 | 607 | ||||||||||||
|
Net Income
|
$ | 1,518 | $ | 1,524 | $ | 1,400 | $ | 2,043 | ||||||||
|
Basic Earnings per share
|
$ | 0.48 | $ | 0.49 | $ | 0.45 | $ | 0.65 | ||||||||
|
Diluted Earnings per share
|
$ | 0.48 | $ | 0.48 | $ | 0.45 | $ | 0.65 | ||||||||
|
Quarter Ended 2009
|
||||||||||||||||
|
31-Mar
|
30-Jun
|
30-Sep
|
31-Dec
|
|||||||||||||
|
Interest Income
|
$ | 6,184 | $ | 6,108 | $ | 5,929 | $ | 6,052 | ||||||||
|
Interest Expense
|
2,131 | 1,693 | 1,701 | 1,733 | ||||||||||||
|
Net Interest Income
|
4,053 | 4,415 | 4,228 | 4,319 | ||||||||||||
|
Provision for Loan Losses
|
165 | 1,040 | 165 | 365 | ||||||||||||
|
Securities Gains (Losses)
|
179 | 339 | (1,169 | ) | 159 | |||||||||||
|
Other Than Temporary Impairment
|
(76 | ) | (60 | ) | 0 | (70 | ) | |||||||||
|
Other Income
|
808 | 1,010 | 811 | 1,151 | ||||||||||||
|
Other Expense
|
2,921 | 3,218 | 2,942 | 3,309 | ||||||||||||
|
Income Before Taxes (Benefit)
|
1,878 | 1,446 | 763 | 1,885 | ||||||||||||
|
Income Taxes (Benefit)
|
357 | 193 | (23 | ) | 396 | |||||||||||
|
Net Income
|
$ | 1,521 | $ | 1,253 | $ | 786 | $ | 1,489 | ||||||||
|
Basic Earnings per share
|
$ | 0.49 | $ | 0.40 | $ | 0.25 | $ | 0.47 | ||||||||
|
Diluted Earnings per share
|
$ | 0.49 | $ | 0.40 | $ | 0.25 | $ | 0.47 | ||||||||
82
ITEM 9 CHANGES IN AND DISAGREEMENTS WITH ACCOUNTANTS ON ACCOUNTING AND FINANCIAL DISCLOSURE
|
NONE.
|
ITEM 9A CONTROLS AND PROCEDURES
As required under the Securities Exchange Act of 1934, the Company’s management, with the participation of the Company’s principal executive and principal financial officers, evaluated the Company’s disclosure controls and procedures, as defined in Rules 13a-15(e) and 15d-15(e) under the Exchange Act, as of the end of the period covered by this annual report on Form 10-K. Based on this evaluation the Company’s management, including the Chief Executive Officer and Chief Financial Officer, concluded that, as of December 31, 2010, the Company’s disclosure controls and procedures were effective to ensure that information required to be disclosed by the Company in reports that it files or submits under the Exchange Act is recorded, processed, summarized and reported within the time periods specified in SEC rules and forms.
MANAGEMENT'S REPORT ON INTERNAL CONTROLS
We are responsible for the preparation and fair presentation of the accompanying consolidated balance sheets of Peoples Financial Services Corp. and subsidiaries (the “Company”) as of December 31, 2010 and 2009, and the related consolidated statements of income, changes in stockholders’ equity and cash flows for each of the years in the three-year period ended December 31, 2010, in accordance with accounting principles generally accepted in the United States. This responsibility includes: establishing, implementing and maintaining adequate internal controls relevant to the preparation and fair presentation of financial statements that are free from material misstatement, whether due to fraud or error; selecting and applying appropriate accounting policies; and making accounting estimates that are reasonable under the circumstances. We are also responsible for compliance with the laws and regulations relating to safety and soundness that are designated by the Federal Deposit Insurance Corporation, Board of Governors of the Federal Reserve System and the Pennsylvania Department of Banking.
The Company’s internal controls are designed to provide reasonable assurance that assets are safeguarded and transactions are initiated, executed, recorded and reported in accordance with our intentions and authorizations and to comply with applicable laws and regulations. The internal control system includes an organizational structure that provides appropriate delegation of authority and segregation of duties, established policies and procedures and comprehensive internal audit and loan review programs. To enhance the reliability of internal controls, ` recruit and train highly qualified personnel and maintain sound risk management practices. The internal control system is maintained through a monitoring process that includes a program of internal audits.
Under Section 404 of the Sarbanes-Oxley Act of 2002, we are required to assess the effectiveness of the Company’s internal control over financial reporting at the end of each fiscal year and report, based on that assessment, whether the Company’s internal control over financial reporting is effective. Our assessment includes controls over initiating, recording, processing and reconciling account balances, classes of transactions and disclosure and related assertions included in the financial statements. Our assessment also includes controls related to the initiation and processing of non-routine and non-systematic transactions, to the selection and application of appropriate accounting policies and to the prevention, identification and detection of fraud.
There are inherent limitations in any internal control system, including the possibility of human error and the circumvention or overriding of controls. Accordingly, even effective internal controls can provide only reasonable assurance with respect to financial statement preparation.
Furthermore, due to changes in conditions, the effectiveness of internal controls may vary over time. The internal auditor of the Company reviews, evaluates and makes recommendations on policies and procedures, which serves as an integral, but independent, component of our internal control.
ParenteBeard LLC, the independent registered public accounting firm that audited the Company’s consolidated financial statements in accordance with standards of the Public Company Accounting Oversight Board (United States), has issued an attestation report on the effectiveness of the Company’s internal control over financial reporting as of December 31, 2010. The report, which expresses an unqualified opinion on the effectiveness of the Corporation’s internal control over financial reporting as of December 31, 2010, is included in this Item under the heading “Report of Independent Registered Public Accounting Firm” below.
The Company’s financial reporting and internal controls are under the general oversight of the Board of Directors, acting through the Audit Committee. The Audit Committee is composed entirely of independent directors. The independent registered public accounting firm and the internal auditor have direct and unrestricted access to the Audit Committee at all times. The Audit Committee meets periodically with us, the internal auditor and the independent registered public accounting firm to determine that each is fulfilling its responsibilities and to support actions to identify, measure and control risks and augment internal controls.
We assessed the effectiveness of the Company’s internal controls over financial reporting and compliance with designated laws and regulations as of December 31, 2010. In making the assessment, we used the criteria established in Internal Control-Integrated Framework issued by the Committee of Sponsoring Organizations of the Treadway Commission. These criteria are in the areas of control environment, risk assessment, control activities, information and communication, and monitoring. Our assessment included extensive documenting, evaluating and testing the design and operating effectiveness of the Company’s internal control over financial reporting.
Based on our assessment, we believe that the Company’s internal control over financial reporting was effective and that the Company was compliant with all designated laws and regulations as of December 31, 2010.
|
/s/ Alan W. Dakey
|
|
|
Alan W. Dakey
|
|
|
President and Chief Executive Officer
|
|
|
(Principal Executive Officer)
|
|
|
/s/Scott A. Seasock
|
|
|
Senior Vice President and
|
|
|
Chief Financial Officer
|
|
|
(Principal Financial Officer)
|
|
March 16, 2011
83
|
REPORT OF INDEPENDENT REGISTERED PUBLIC ACCOUNTING FIRM
To the Board of Directors and Stockholders
Peoples Financial Services Corp.
Hallstead, Pennsylvania
We have audited Peoples Financial Services Corp. and subsidiaries (the “Company”) internal control over financial reporting as of December 31, 2010, based on criteria established in Internal Control—Integrated Framework issued by the Committee of Sponsoring Organizations of the Treadway Commission (COSO). The Company’s management is responsible for maintaining effective internal control over financial reporting and for its assessment of the effectiveness of internal control over financial reporting included in the accompanying Management’s Report on Internal Control. Our responsibility is to express an opinion on the Company’s internal control over financial reporting based on our audit.
We conducted our audit in accordance with the standards of the Public Company Accounting Oversight Board (United States). Those standards require that we plan and perform the audit to obtain reasonable assurance about whether effective internal control over financial reporting was maintained in all material respects. Our audit of internal control over financial reporting included obtaining an understanding of internal control over financial reporting, assessing the risk that a material weakness exists, and testing and evaluating the design and operating effectiveness of internal control based on the assessed risk. Our audit also included performing such other procedures as we considered necessary in the circumstances. We believe that our audit provides a reasonable basis for our opinion.
A company’s internal control over financial reporting is a process designed to provide reasonable assurance regarding the reliability of financial reporting and the preparation of financial statements for external purposes in accordance with generally accepted accounting principles. A company’s internal control over financial reporting includes those policies and procedures that (1) pertain to the maintenance of records that, in reasonable detail, accurately and fairly reflect the transactions and dispositions of the assets of the company; (2) provide reasonable assurance that transactions are recorded as necessary to permit preparation of financial statements in accordance with generally accepted accounting principles, and that receipts and expenditures of the company are being made only in accordance with authorizations of management and directors of the company; and (3) provide reasonable assurance regarding prevention or timely detection of unauthorized acquisition, use, or disposition of the company’s assets that could have a material effect on the financial statements.
Because of its inherent limitations, internal control over financial reporting may not prevent or detect misstatements. Also, projections of any evaluation of effectiveness to future periods are subject to the risk that controls may become inadequate because of changes in conditions, or that the degree of compliance with the policies or procedures may deteriorate.
In our opinion, the Company maintained, in all material respects, effective internal control over financial reporting as of December 31, 2010, based on criteria established in Internal Control—Integrated Framework issued by the Committee of Sponsoring Organizations of the Treadway Commission (COSO).
We have also audited, in accordance with the standards of the Public Company Accounting Oversight Board (United States), the consolidated balance sheets of Peoples Financial Services Corp. and subsidiaries as of December 31, 2010 and 2009 and the related consolidated statements of income, stockholders’ equity, and cash flows for each of the years in the three year period ended December 31, 2010, and our report dated March 16, 2011, expressed an unqualified opinion.
/s/ PARENTEBEARD LLC
ParenteBeard LLC
Allentown, Pennsylvania
March 16, 2011
|
84
CHANGES IN INTERNAL CONTROL OVER FINANCIAL REPORTING
There have not been any changes in the Company’s internal control over financial reporting, as such term is defined in Rules 13a - 15(f) and 15d - 15(f) under the Securities Exchange Act of 1934, during the quarter ended December 31, 2010, to which this report relates that have materially affected, or are reasonably likely to materially affect, internal control over financial reporting.
ITEM 9B OTHER INFORMATION
|
NONE.
|
PART III
ITEM 10 DIRECTORS, EXECUTIVE OFFICERS AND CORPORATE GOVERANANCE
|
This item is incorporated by reference under Section “Governance of the Company” under the previously submitted document DEF 14A Proxy Statement filed with the SEC.
|
ITEM 11 EXECUTIVE COMPENSATION
|
This item is incorporated by reference under Section “Compensation Discussion and Analysis” under the previously submitted document DEF 14A Proxy Statement filed with the SEC.
|
ITEM 12 SECURITY OWNERSHIP OF CERTAIN BENEFICIAL OWNERS AND MANAGEMENT AND RELATED STOCKHOLDER MATTERS
|
This item is incorporated by reference under Section “Share Ownership of Management and Directors” under the previously submitted document DEF 14A Proxy Statement filed with the SEC.
|
ITEM 13 CERTAIN RELATIONSHIPS AND RELATED TRANSACTIONS, AND DIRECTOR INDEPENDENCE
|
This item is incorporated by reference under Section “Compensation Discussion and Analysis” under the previously submitted document DEF 14A Proxy Statement filed with the SEC.
|
ITEM 14 PRINCIPAL ACCOUNTANT FEES AND SERVICES
|
This item is incorporated by reference under Section “Report of the Audit Committee” under the previously submitted document DEF 14A Proxy Statement filed with the SEC.
|
85
PART IV
ITEM 15 EXHIBITS AND FINANCIAL STATEMENT SCHEDULES
|
(3.1)
|
Articles of Incorporation of Peoples Financial Services Corp. Incorporate by reference to the Corporation’s Registration Statement on Form 10 as filed with the U.S. Securities and Exchange Commission on March 4, 1998;
|
||
|
(3.2)
|
Bylaws of Peoples Financial Services Corp. as amended. Incorporated by reference to the Corporation’s Exhibit 3.2 on Form 10-Q filed with the U.S. Securities and Exchange Commission on November 8, 2004;
|
||
|
(10.4)
|
Termination Agreement dated January 1, 1997, between Debra E. Dissinger and Peoples Financial Services Corp. Incorporated by reference to the Corporation’s Registration Statement on Form 10 as filed with the U.S. Securities and Exchange Commission on March 4, 1998*;
|
||
|
(10.6)
|
Supplemental Executive Retirement Plan Agreement, dated December 3, 2004, for Debra E. Dissinger. Incorporated by reference to the Corporation’s Exhibits 10.6 and 10.7 on Form 10-K filed with the U.S. Securities and Exchange Commission on March 15, 2005*;
|
||
|
(10.7)
|
Supplemental Director Retirement Plan Agreement, dated December 3, 2004, for all Non-Employee Directors of the Company. Incorporated by reference to the Corporation’s Exhibits 10.6 and 10.7 on Form 10-K filed with the U.S. Securities and Exchange Commission on March 15, 2005*;
|
||
|
(10.9)
|
Amendment to Supplemental Executive Retirement Plan Agreement, dated December 30, 2005, for Debra E. Dissinger. Incorporated by reference to the Corporation’s Exhibits 10.9 and 10.10 on Form 10-K filed with the U.S. Securities and Exchange Commission on March 15, 2006*;
|
||
|
(10.10)
|
Amendment to Supplemental Director Retirement Plan Agreement, dated December 30, 2005, for all Non-Employee Directors of the Company. Incorporated by reference to the Corporation’s Exhibits 10.9 and 10.10 on Form 10-K filed with the U.S. Securities and Exchange Commission on March 15, 2006*;
|
||
|
(10.11)
|
Termination Agreement dated January 1, 2007, between Stephen N. Lawrenson and Peoples Financial Services Corp. Incorporated by reference to the Corporation’s Exhibits 10.11 and 10.12 on Form 10-Q filed with the U.S. Securities and Exchange Commission on May 10, 2007*;
|
||
|
(10.12)
|
Termination Agreement dated January 1, 2007, between Joseph M. Ferretti and Peoples Financial Services Corp. Incorporated by reference to the Corporation’s Exhibits 10.11 and 10.12 on Form 10-Q filed with the U.S. Securities and Exchange Commission on May 10, 2007*;
|
||
|
(10.14)
|
Termination Agreement dated October 23, 2009, between Frederick J. Malloy and Peoples Financial Services Corp. Incorporated by reference to the Corporation’s Exhibit 10.14 on Form 8K filed with the U.S. Securities and Exchange Commission on October 27, 2009*;
|
||
|
(10.15)
|
Employment Agreement dated November 30, 2009, between Alan W. Dakey and Peoples Financial Services Corp. Incorporated by reference to the Corporation’s Exhibit 10.15 on Form 8K filed with the U.S. Securities and Exchange Commission on November 17, 2009*;
|
||
|
(10.16)
|
Employment Agreement dated January 18, 2011, between Scott A. Seasock and Peoples Financial Services Corp. Incorporated by reference to the Corporation’s Exhibit 10.16 on Form 8K filed with the U.S. Securities and Exchange Commission on January 18, 2011*;
|
||
|
(11)
|
The statement regarding computation of per-share earnings required by this exhibit is contained in Note 1 to the consolidated financial statements captioned “Earnings Per Share”;
|
||
|
(14)
|
Code of Ethics, as amended. Incorporated by reference to the Corporation’s Exhibit 14 as filed on Form 10Q with the U.S. Securities and Exchange Commission on August 11, 2008;
|
||
|
(21)
|
Subsidiaries of Peoples Financial Services Corp., filed herewith;
|
||
|
(23)
|
Consent of Independent Registered Public Accounting Firm;
|
||
|
(31.1)
|
Certification of Chief Executive Officer pursuant to Rule 13a-14(a)/15d-14(a), filed herewith;
|
||
|
(31.2)
|
Certification of Chief Financial Officer pursuant to Rule 13a-14(a)/15d-14(a), filed herewith;
|
||
|
(32.1)
|
Certification of Chief Executive Officer pursuant to Section 1350 of Sarbanes-Oxley Act of 2002, filed herewith; and
|
||
|
(32.2)
|
Certification of Chief Financial Officer pursuant to Section 1350 of Sarbanes-Oxley Act of 2002, filed herewith.
|
||
|
*
|
Exhibit is compensatory
|
||
86
SIGNATURES
Pursuant to the requirements of the Securities Exchange Act of 1934, the Registrant has duly caused this report to be signed on its behalf by the undersigned, thereunto duly authorized.
PEOPLES FINANCIAL SERVICES CORP.
|
BY:
|
/s/Alan W. Dakey
Alan W. Dakey, President/CEO
(Principal Executive Officer)
|
March 16, 2011
|
|
Pursuant to the requirements of the Exchange Act, this report has been signed below by the following persons on behalf of the Registrant and in the capacities and on the dates indicated.
|
||
|
/s/William E. Aubrey II
William E Aubrey II, Chairman, Board of Directors
|
March 16, 2011
|
|
|
/s/Alan W. Dakey
Alan W. Dakey, President/CEO
Member, Board of Directors
(Principal Executive Officer)
|
March 16, 2011
|
|
|
/s/Debra E. Dissinger
Debra E. Dissinger, Executive Vice President
|
March 16, 2011
|
|
|
/s/Frederick J. Malloy
Frederick J. Malloy, VP/Controller
|
March 16, 2011
|
|
|
/s/Richard S. Lochen, Jr.
Richard S. Lochen, Jr. Member, Board of Directors
|
March 16, 2011
|
|
|
/s/George H. Stover, Jr.
George H. Stover, Jr. Member, Board of Directors
|
March 16, 2011
|
|
|
/s/Ronald G. Kukuchka
Ronald G. Kukuchka, Member, Board of Directors
|
March 16, 2011
|
|
|
/s/Joseph T. Wright, Jr.
Joseph T. Wright, Jr., Member, Board of Directors
|
March 16, 2011
|
|
|
/s/Earle A. Wootton
Earle A. Wootton, Member, Board of Directors
|
March 16, 2011
|
|
|
/s/Scott A. Seasock
Scott A. Seasock, Senior Vice President
(Principal Financial Officer)
|
March 16, 2011
|
|
87