Attached files
| file | filename |
|---|---|
| EX-21.1 - EXHIBIT 21.1 - New Home Co Inc. | exhibit211123114.htm |
| EX-23.1 - EXHIBIT 23.1 - New Home Co Inc. | exhibit231123114.htm |
| EX-31.1 - EXHIBIT 31.1 - New Home Co Inc. | exhibit311123114.htm |
| EX-32.2 - EXHIBIT 32.2 - New Home Co Inc. | exhibit322123114.htm |
| EX-31.2 - EXHIBIT 31.2 - New Home Co Inc. | exhibit312123114.htm |
| EX-32.1 - EXHIBIT 32.1 - New Home Co Inc. | exhibit321123114.htm |
| EXCEL - IDEA: XBRL DOCUMENT - New Home Co Inc. | Financial_Report.xls |
UNITED STATES
SECURITIES AND EXCHANGE COMMISSION
Washington, D.C. 20549
FORM 10-K | ||
(Mark One)
ý | ANNUAL REPORT PURSUANT TO SECTION 13 OR 15(d) OF THE SECURITIES EXCHANGE ACT OF 1934 |
¨ | TRANSITION REPORT PURSUANT TO SECTION 13 OR 15(d) OF THE SECURITIES EXCHANGE ACT OF 1934 |
For the transition period from ______to ______
Commission File Number 001-36283 | ||

The New Home Company Inc.
(Exact Name of Registrant as Specified in Its Charter)
Delaware | 27-0560089 | |
(State or other Jurisdiction of Incorporation or Organization) | (I.R.S. Employer Identification No.) | |
85 Enterprise, Suite 450
Aliso Viejo, California 92656
(Address of principal executive offices) (Zip Code)
Registrant’s telephone number, including area code (949) 382-7800
Securities registered pursuant to Section 12(b) of the Act:
Title of each class | Name of each exchange on which registered | |
Common Stock, par value $0.01 per share | New York Stock Exchange | |
Securities registered pursuant to Section 12(g) of the Act: None
Indicate by check mark if the registrant is a well-known seasoned issuer, as defined in Rule 405 of the Securities Act. Yes ¨ No ý
Indicate by check mark if the registrant is not required to file reports pursuant to Section 13 or Section 15(d) of the Act. Yes ¨ No ý
Indicate by check mark whether the registrant: (1) has filed all reports required to be filed by Section 13 or 15(d) of the Securities Exchange Act of 1934 during the preceding 12 months (or for such shorter period that the registrant was required to file such reports), and (2) has been subject to such filing requirements for the past 90 days. Yes ý No ¨
Indicate by check mark whether the registrant has submitted electronically and posted on its corporate Web site, if any, every Interactive Data File required to be submitted and posted pursuant to Rule 405 of Regulation S-T (§ 232.405 of this chapter) during the preceding 12 months (or for such shorter period that the registrant was required to submit and post such files). Yes ý No ¨
Indicate by check mark if disclosure of delinquent filers pursuant to Item 405 of Regulation S-K is not contained herein, and will not be contained, to the best of registrant’s knowledge, in definitive proxy or information statements incorporated by reference in Part III of this Form 10-K or any amendment to this Form 10-K. ý
Indicate by check mark whether the registrant is a large accelerated filer, an accelerated filer, a non-accelerated filer, or a smaller reporting company. See the definitions of “large accelerated filer,” “accelerated filer” and “smaller reporting company” in Rule 12b-2 of the Exchange Act.
Large accelerated filer | ¨ | Non-accelerated filer (Do not check if smaller reporting company) | ý | Smaller reporting company | ¨ | Accelerated filer | ¨ |
Indicate by check mark whether the registrant is a shell company (as defined in Rule 12b-2 of the Act). Yes ¨ No ý
The aggregate market value of the registrant’s common stock held by non-affiliates of the registrant on June 30, 2014, based on the closing price of $14.13 as reported by the New York Stock Exchange was $126,949,219.
16,522,517 shares of common stock were issued and outstanding as of March 6, 2015.
DOCUMENTS INCORPORATED BY REFERENCE:
Portions from the registrant's Definitive Proxy Statement related to its 2015 Annual Meeting of Stockholders to be filed pursuant to Regulation 14A are incorporated by reference into Part III, Items 10, 11, 12, 13 and 14.
ANNUAL REPORT ON FORM 10-K
FOR THE FISCAL YEAR ENDED DECEMBER 31, 2014
Page Number | ||
Part I | ||
Item 1 | ||
Item 1A | ||
Item 1B | ||
Item 2 | ||
Item 3 | ||
Item 4 | ||
Part II | ||
Item 5 | ||
Item 6 | ||
Item 7 | ||
Item 7A | ||
Item 8 | ||
Item 9 | ||
Item 9A | ||
Item 9B | ||
Part III | ||
Item 10 | ||
Item 11 | ||
Item 12 | ||
Item 13 | ||
Item 14 | ||
Part IV | ||
Item 15 | ||
3
CAUTIONARY NOTE CONCERNING FORWARD-LOOKING STATEMENTS
Various statements contained in this annual report on Form 10-K, including those that express a belief, expectation or intention, as well as those that are not statements of historical fact, are forward-looking statements. These forward-looking statements may include projections and estimates concerning the timing and success of specific projects and our future production, revenues, income and capital spending. Our forward-looking statements are generally accompanied by words such as “estimate,” “project,” “predict,” “believe,” “expect,” “intend,” “anticipate,” “potential,” “plan,” “goal” or other words that convey the uncertainty of future events or outcomes. The forward-looking statements in this report speak only as of the date of this report, and we disclaim any obligation to update these statements unless required by law, and we caution you not to rely on them unduly. We have based these forward-looking statements on our current expectations and assumptions about future events. While our management considers these expectations and assumptions to be reasonable, they are inherently subject to significant business, economic, competitive, regulatory and other risks, contingencies and uncertainties, most of which are difficult to predict and many of which are beyond our control. The following factors, among others, may cause our actual results, performance or achievements to differ materially from any future results, performance or achievements expressed or implied by these forward-looking statements:
• | economic changes either nationally or in the markets in which we operate, including declines in employment, volatility of mortgage interest rates and inflation; |
• | continued or increased downturn in the homebuilding industry; |
• | continued volatility and uncertainty in the credit markets and broader financial markets; |
• | our future operating results and financial condition; |
• | our business operations; |
• | changes in our business and investment strategy; |
• | availability of land to acquire and our ability to acquire such land on favorable terms or at all; |
• | availability, terms and deployment of capital; |
• | continued or increased disruption in the availability of mortgage financing or the number of foreclosures in the market; |
• | shortages of or increased prices for labor, land or raw materials used in housing construction; |
• | delays in land development or home construction resulting from adverse weather conditions or other events outside our control; |
• | issues concerning our joint venture partnerships; |
• | the cost and availability of insurance and surety bonds; |
• | changes in, or the failure or inability to comply with, governmental laws and regulations; |
• | the timing of receipt of regulatory approvals and the opening of projects; |
• | the degree and nature of our competition; |
• | our leverage and debt service obligations; and |
• | availability of qualified personnel and our ability to retain our key personnel. |
• | additional factors discussed in Item 1, "Business;" Item 1A, "Risk Factors;" and Item 7, "Management's Discussion and Analysis of Financial Condition and Results of Operations." |
4
PART 1
Item 1. | Business |
As used in this annual report on Form 10-K, unless the context otherwise requires or indicates, references to “the Company,” “our company,” “we,” “our” and “us” (1) for periods prior to the completion of our formation transactions, refer to The New Home Company LLC and its subsidiaries and affiliates, which we sometimes refer to as “TNHC LLC,” and (2) following the completion of our formation transactions, refer to The New Home Company Inc. and its subsidiaries. On January 30, 2014, The New Home Company LLC was converted into a Delaware corporation and renamed The New Home Company Inc., which we refer to as our formation transaction.
Our Company
We are a new generation homebuilder focused on the design, construction and sale of innovative and consumer-driven homes in major metropolitan areas within select growth markets in California, including coastal Southern California, the San Francisco Bay area and metro Sacramento. We also seek to create unique communities via our significant land development expertise.
Our Company was founded in August 2009, towards the end of an unprecedented downturn in the U.S. homebuilding industry, by our founders, who are also our four most senior executives. Our founders, Larry Webb, Wayne Stelmar, Joseph Davis and Tom Redwitz, have extensive and complementary construction, design, marketing, development and entitlement expertise as well as strong relationships with key land sellers within each of our local markets and have worked together for over 25 years. We believe our founders' diverse and complementary skill sets and extensive careers provide an important competitive advantage for our company. Since our formation, we have grown from our four founders to over 240 employees as of March 2015.
As a "new generation" homebuilder, we are focused on taking advantage of opportunities in select growth markets in California. Our growth strategy is focused on specific markets with high demand, favorable population and employment growth as a result of proximity to job centers or primary transportation corridors. As of December 31, 2014, we and our unconsolidated joint ventures had 22 and 54 communities, respectively, containing 929 and 3,892 lots, respectively, including controlled lots. In addition, we had 10 communities containing 1,105 lots under our fee building arrangements as of December 31, 2014.
Since our formation, we have delivered 1,256 homes (including 465 through our unconsolidated joint venture communities and 546 from our fee building communities). Our management team has long-standing relationships with leading masterplan community developers in each of our core markets and, through these relationships, we are generally invited to participate in new lot offerings. Our product offering (including homes that we are building for our unconsolidated joint ventures) ranges in price from approximately $300,000 to $4.1 million, with home sizes ranging from approximately 800 to 5,400 square feet. Customer-focused community creation and product development, as well as exemplary customer service, are key components of the lifestyle connection we seek to establish with each community and homebuyer.
As of December 31, 2014, we owned 390 lots and controlled 539 lots that are under land option or purchase contracts, including 195 under non-binding letters of intent. Our unconsolidated joint ventures owned 3,657 lots and controlled 235 lots that are under land option or purchase contracts as of December 31, 2014. Additionally, we controlled 1,105 lots through our fee building contracts as of December 31, 2014. The lots described above represent approximately two to three years of supply to support our current growth plan. Our land acquisition strategy has focused on the development of entitled parcels that we can complete within approximately 24 to 48 months from the start of sales in order to reduce development and market cycle risk while maintaining an inventory of owned and controlled lots sufficient for construction of homes over a two to three-year period. We continually evaluate new communities and have an attractive pipeline of land acquisition opportunities that we intend to pursue through direct acquisition and joint venture arrangements.
The Company completed its initial public offering ("IPO") on January 30, 2014. In preparation for the IPO, the Company reorganized from a Delaware limited liability company ("LLC") into a Delaware corporation, issuing 8,636,250 shares of common stock to the former members of the LLC in the Company's formation transactions, and changed its name to The New Home Company Inc. As a result of the IPO, the Company issued and sold 8,984,375 shares of common stock (including 1,171,875 shares sold pursuant to the underwriter's exercise of their option to purchase additional shares from the Company) at the public offering price of $11.00 per share. In accordance with the terms of the IPO, with net proceeds received from the underwriter's exercise of their option to purchase additional shares, the Company repurchased 1,171,875 shares of its
5
common stock issued to a member of the LLC in connection with the Company's formation transactions. The Company received proceeds of $75.8 million, net of the underwriting discount, offering expenses and the repurchase of shares. Upon the close of the IPO and as of December 31, 2014, the Company had 16,448,750 common shares outstanding.
Refer to Part II, Item 6 "Selected Financial Data" and Item 7 "Management's Discussion and Analysis of Financial Condition and Results of Operations" of this annual report on Form 10-K for selected financial and operating data of the Company. These items should be read in conjunction with our consolidated financial statements and the related notes included elsewhere in this annual report on Form 10-K.
Our Competitive Strengths
We believe the following strengths provide us with a significant competitive advantage in implementing our business strategy:
Experienced and Proven Leadership Supported by a Talented Senior Management Team
Our founders have worked together for various periods of up to 26 years and have successful track records of managing and growing homebuilding companies. Their combined real estate industry experience includes land acquisition, entitlement, master-planned community creation, land development, home construction, financing, marketing and sales of single-family detached and attached homes in communities in a variety of markets. Prior to forming our company in 2009, Messrs. Webb and Stelmar worked together for 11 years at John Laing Homes, from its formation in 1998, ultimately serving as its Chief Executive Officer and Chief Financial Officer, respectively. In 2001, Messrs. Webb and Stelmar led the leveraged buyout of John Laing Homes for $190 million (representing a purchase price of approximately 1.0x book value), resulting in GMAC/RFC becoming the majority owner, and successfully orchestrated the timely sale of John Laing Homes in 2006 for $1.05 billion (representing a sale price of approximately 3.4x book value). Mr. Redwitz joined John Laing Homes in 2002 as President of its Laing Luxury Division, having served previously as President of Taylor Woodrow’s Southern California division from 1999 to 2002. In addition, Mr. Davis brings over 40 years of land development and entitlement experience and served for eleven years as President of Irvine Community Development Corporation, a subsidiary of The Irvine Company and developer of the Irvine Ranch, a 125,000 lot master-planned community containing approximately 40 villages located in Orange County, California.
We believe that our founders’ extensive experience, relationships, local market knowledge and reputation provide us with a competitive advantage in being able to acquire land, create masterplans, obtain entitlements, build quality homes and complete projects on budget and on schedule. Our executives are supported by a talented senior management team that was assembled at a time of dislocation in the homebuilding industry and hand-picked to build deep organizational strength designed to ensure execution of management’s business plan.
Significant Land Positions in Our Markets to Support Growth Plan
We believe that we have strong land positions strategically located within our core markets, many of which were acquired during the downturn and are controlled at favorable prices. The prior experience of our founders in the creation of thoughtful land plans and consumer-driven architecture provides us the ability to create unique communities, and enhance the value of our homes. Our Southern California assets are well located along key transportation corridors in major job centers in our submarkets. In the San Francisco Bay area, our assets are located within and around the Silicon Valley, a major employment center. In Sacramento, our assets are located in infill or existing master-planned communities, located near major employment centers, with a concentration of larger technology and medical companies and strong school districts.
Focus on Attractive Growth Markets in California
We are currently focused on identifying unique sites and creating communities that allow us to design, construct and sell consumer-driven single-family detached and attached homes in major metropolitan areas in coastal Southern California, the San Francisco Bay area and metro Sacramento. These markets are generally characterized as infill markets with barriers to entry, job growth and increasing populations, which can create growing demand for new housing.
History of Operational Discipline
Our management team possesses extensive and valuable expertise, including the growth and operation of a much larger homebuilder controlled by a large public company. The perspective gained from this experience has helped shape the strict discipline and hands-on management approach that we believe has been a key component of our initial success. With financial accountability at the project level, our strict operating discipline is a key part of our strategy to increase returns while effectively managing risk. However, like other growing companies, we face challenges in expanding our operations while trying to manage risk and maintaining our disciplined and hands-on approach.
6
We also have strong relationships with several institutional joint venture partners. As of December 31, 2014, we had 12 unconsolidated joint ventures with total assets of $521.6 million. We believe these relationships help maximize our return on equity and provide us the ability to participate in certain unique opportunities. Our 12 unconsolidated joint ventures consisted of eight homebuilding joint ventures and four land development joint ventures.
Absence of Legacy Issues Allows Us to Focus on the Growth of Our Business
Our absence of legacy issues enables us to focus on the growth of our business, as opposed to diverting attention and resources to manage troubled assets or other legacy issues. The majority of our land inventory was accumulated following the close of our IPO in January of 2014. We do not have any existing distressed assets or liabilities to manage, unlike many competitors that were affected by the unprecedented downturn in the real estate markets that resulted from the recession during 2008 and 2009. All of our real estate assets were acquired and are located in markets that we targeted after the downturn commenced.
Our Business Strategy
Our business strategy is focused on creating lasting neighborhoods through exceptional design, craftsmanship and homeowner experiences by people doing the best work of their lives. Our operations are focused on major metropolitan areas located in coastal Southern California, the San Francisco Bay area and metro Sacramento. Our business strategy is driven by the following:
Disciplined Acquisition of Attractive Land Positions
We believe that we have strong land positions strategically located within our core markets, many of which were acquired or that we acquired control over during the downturn in the market. We believe our professional reputation and long-standing relationships with key land sellers, including master plan community developers, brokers and other builders, as well as our institutional investors and joint venture partners, enable us to acquire well-positioned land parcels in our existing markets as well as new target markets. The strength of these relationships often provides us with a first look at acquisition opportunities and allows us to negotiate terms based on our reputation for delivering on our promises.
In addition, we plan to continue to leverage the strength of our land planning and land development expertise in each local market to position us to add value to our land, capture incremental profit opportunities and provide a steady supply of lots to support the significant planned growth of our homebuilding business. The experience and extensive relationships of our land acquisition professionals helps us to achieve entitlements in a timely manner in order to reduce market risk. We only seek to acquire land where we believe our development and entitlement skills can help us earn a risk-adjusted return that is accretive to our overall return on land or that is in excess of existing market opportunities. Furthermore, we have stringent underwriting return criteria that measure entitlement, development, market and financing risks for each proposed acquisition. These risks are quantified and a numeric risk value is determined, which is used to set our minimum required internal rate of return for the proposed acquisition.
We further seek to reduce our exposure to land risk through the use of land options, joint ventures and other flexible land acquisition arrangements. Our joint venture strategy has been instrumental in allowing us to leverage our entity-level capital and establish a homebuilding platform focused on high-growth, land-constrained markets.
Deliver a Diverse, Consumer-Driven Product Offering and a Superior Home Experience
We consider ourselves a local market, consumer-driven homebuilder with expertise across a wide variety of product types and customer segments, including the entry-level, move-up, move-down and luxury-focused customer segments. In addition to understanding the key economic drivers of demand in our markets, we focus on understanding the pool of potential buyers, the product types sought by those buyers and the proper price point for the product types in each market. We perform extensive consumer research that helps us create land plans and design homes that meet the needs and desires of our specific targeted buyers. Our homes are competitively priced, but are not designed to be the lowest cost option in the market. Our core operating philosophy is to provide a positive, memorable experience to our homeowners through active engagement in the building process, tailoring our product to the buyer’s lifestyle needs and enhancing communication, knowledge and satisfaction. Our selling process focuses on the homes’ features, benefits, quality and design. Our customers’ experience is measured by an independent survey company, beginning with the sales process. This customer feedback continues to be measured well after the buyer closes on the sale and is ultimately used to improve and differentiate the quality of our home products, selling experience and service for our customers.
7
A key element of our strategy is to allow all buyers to personalize their homes regardless of the price point. Unlike many homebuilders with centralized locations where buyers must travel to select options and upgrades, each of our communities has an on-site design center with dedicated designers who are knowledgeable about the attributes of the homes offered in the community. The specific options and upgrades, both structural and finishes, available for the community are selected by our buyers as they navigate the buying process. In many cases, options and upgrades selected by our buyers can form a substantial part of the total purchase price of a home and are typically priced with profit margins well in excess of the profit margins on the base home purchase before the options and upgrades. We also believe that the active participation of buyers in selecting options and upgrades results in buyers becoming more personally invested in their homes, which leads to fewer cancellations.
We spend an extensive amount of time studying and designing our products through the selection of architects, consultants and homeowner focus groups for all levels and price points in our target markets. We believe our diversified product strategy enables us to better serve a wide range of buyers, adapt quickly to changing market conditions and improve performance and returns while strategically reducing portfolio risk. We believe these steps improve the selling process, lead to a more satisfied homeowner, increase the number of buyers referred to our communities, and enhance our operating results.
Increase Active Community Count in Our Markets
Our belief that homebuilding is a local market business supports our strategy to pursue significant opportunities to expand our business in our existing markets. We continually review the allocation of capital among our markets, based on both aggregate demographic information and our own operating results. We use the results of these reviews to focus our investments on those markets where we believe we can increase our profitability and return on capital. Additionally, we engage in limited speculative building and proceed with community development in phases where we believe it is economically feasible to do so with the goal of optimizing community design and increasing profits. While our primary growth strategy will focus on increasing our market position in our existing markets, we are considering expansion opportunities through organic growth or acquisitions.
Vigilant Focus on Cost Structure
Cost control throughout our business permeates our corporate culture. Our management team maintains its focus on controlling costs and implementing measures designed to ensure that our organization is efficient. We competitively bid each phase of development while maintaining strong relationships with our trade partners. We manage production schedules closely and, while respecting our valued relationships, require accountability from our vendors and trade partners.
Description of Completed Projects and Communities under Development
Our homebuilding projects usually take approximately 24 to 48 months to complete from the initiation of homebuilding activity. Our land projects usually take approximately 24 to 48 months to complete from the acquisition of land. The following table presents project information relating to each of our markets as of December 31, 2014 and includes information for all completed projects from our inception and current projects under development where we are building and selling homes or lots for our own account or for our unconsolidated joint ventures, and all completed projects from our inception and current projects under development where we are acting as a fee builder.
8
County, Project, City | Year of First Delivery(1) | Total Number of Homes or Lots to Be Built at Completion(2) | Cumulative Homes or Lots Delivered as of December 31, 2014 | Lots as of December 31, 2014 (3) | Backlog at December 31, 2014 (4) | Homes or Lots delivered for the year ended December 31, 2014 | Sales Range (in 000's)(5) | ||||||||||||
Company Projects | |||||||||||||||||||
Southern California | |||||||||||||||||||
Los Angeles County: | |||||||||||||||||||
Canyon Oaks, Calabasas | 2017 | 69 | — | 69 | — | — | $1,000 - $1,400 | ||||||||||||
Orange County: | |||||||||||||||||||
Four Quartets, Irvine | 2011 | 13 | 13 | — | — | — | $370 - $550 | ||||||||||||
Stonetree Manor, Irvine | 2011 | 15 | 15 | — | — | — | $640 - $730 | ||||||||||||
Amelia, Irvine | 2014 | 70 | 6 | 16 | 15 | 6 | $1,800 - $2,450 | ||||||||||||
Trevi, Irvine | 2014 | 37 | 5 | 15 | 18 | 5 | $2,400 - $3,480 | ||||||||||||
Ventura County: | |||||||||||||||||||
Twenty Oaks, Thousand Oaks | 2015 | 20 | — | 20 | — | — | $1,200 - $1,500 | ||||||||||||
Southern California Total | 224 | 39 | 120 | 33 | 11 | ||||||||||||||
Northern California | |||||||||||||||||||
Alameda County: | |||||||||||||||||||
Mission Blvd, Freemont | 2016 | 33 | — | 33 | — | — | $800 - $900 | ||||||||||||
Contra Costa County: | |||||||||||||||||||
Woodbury, Lafayette | 2015 | 56 | — | 56 | — | — | $850 - $1,800 | ||||||||||||
El Dorado County: | |||||||||||||||||||
Blackstone, El Dorado Hills | 2015 | 72 | — | 72 | — | — | $450 - $470 | ||||||||||||
Placer County: | |||||||||||||||||||
Lincoln Crossing, Lincoln | 2011 | 27 | 27 | — | — | — | $290 - $420 | ||||||||||||
Strada, Roseville | 2011 | 5 | 5 | — | — | — | $180 - $200 | ||||||||||||
Granite Bay, Granite Bay | 2012 | 17 | 17 | — | — | — | $670 - $1,140 | ||||||||||||
Olive Ranch, Granite Bay | 2013 | 12 | 12 | — | — | 10 | $1,010 - $1,760 | ||||||||||||
The Grove, Granite Bay | 2014 | 32 | 2 | 8 | 5 | 2 | $990 - $1,420 | ||||||||||||
Sacramento County: | |||||||||||||||||||
Madeira, Elk Grove | 2010 | 34 | 34 | — | — | — | $290 - $400 | ||||||||||||
Marbella, Folsom | 2012 | 5 | 5 | — | — | — | $290 - $330 | ||||||||||||
The Trails, Folsom | 2012 | 79 | 79 | — | — | 8 | $340 - $500 | ||||||||||||
The Meadows, Folsom | 2013 | 40 | 25 | 15 | 3 | 22 | $420 - $560 | ||||||||||||
Candela, Sacramento | 2015 | 10 | — | 10 | — | — | $340 - $370 | ||||||||||||
San Mateo County: | |||||||||||||||||||
Tidelands, San Mateo | 2016 | 76 | — | 76 | — | — | $750 - $1,200 | ||||||||||||
Northern California Total | 498 | 206 | 270 | 8 | 42 | ||||||||||||||
Company Projects Total | 722 | 245 | 390 | 41 | 53 | ||||||||||||||
Unconsolidated Homebuilding Joint Venture Projects(6) | |||||||||||||||||||
Southern California | |||||||||||||||||||
Los Angeles County: | |||||||||||||||||||
Aqua, Villa Metro, Valencia | 2013 | 95 | 72 | 23 | 3 | 61 | $300 - $400 | ||||||||||||
Terra, Villa Metro, Valencia | 2013 | 99 | 55 | 44 | 1 | 46 | $340 - $480 | ||||||||||||
Sol, Villa Metro, Valencia | 2013 | 99 | 60 | 39 | 2 | 49 | $370 - $480 | ||||||||||||
Cielo, Villa Metro, Valencia | 2014 | 22 | 8 | 14 | 10 | 8 | $430 - $500 | ||||||||||||
Village at Calabasas, Calabasas | 2015 | 87 | — | 87 | — | — | $1.100 - $1,400 | ||||||||||||
Orange County: | |||||||||||||||||||
The Field, Lambert Ranch, Irvine | 2012 | 66 | 66 | — | — | 8 | $930 - $1,490 | ||||||||||||
9
County, Project, City | Year of First Delivery(1) | Total Number of Homes or Lots to Be Built at Completion(2) | Cumulative Homes or Lots Delivered as of December 31, 2014 | Lots as of December 31, 2014 (3) | Backlog at December 31, 2014 (4) | Homes or Lots delivered for the year ended December 31, 2014 | Sales Range (in 000's)(5) | ||||||||||||
The Hill, Lambert Ranch, Irvine | 2012 | 45 | 45 | — | — | — | $1,240 - $2,220 | ||||||||||||
The Grove, Lambert Ranch, Irvine | 2012 | 58 | 58 | — | — | 2 | $1,400 - $2,140 | ||||||||||||
Meridian, Newport Beach | 2014 | 79 | 21 | 58 | 17 | 21 | $1,600 - $3,700 | ||||||||||||
Oliva, San Juan Capistrano | 2015 | 40 | — | 40 | — | — | $1,900 - $2,700 | ||||||||||||
Southern California Total | 690 | 385 | 305 | 33 | 195 | ||||||||||||||
Northern California | |||||||||||||||||||
Marin County: | |||||||||||||||||||
Garden House, Rose Lane, Larkspur | 2014 | 29 | 17 | 12 | 11 | 17 | $1,650 - $3,020 | ||||||||||||
Cottages, Rose Lane, Larkspur(7) | 2014 | 14 | 14 | — | — | 14 | $1,040 - $1,410 | ||||||||||||
Terraces, Rose Lane, Larkspur(7) | 2014 | 42 | 27 | 15 | 15 | 27 | $640 - $1,200 | ||||||||||||
Santa Clara County: | |||||||||||||||||||
Row Towns, Orchard Park, San Jose | 2014 | 107 | 9 | 98 | 8 | 9 | $660 - $880 | ||||||||||||
Court Towns, Orchard Park, San Jose | 2014 | 60 | 9 | 51 | 3 | 9 | $680 - $780 | ||||||||||||
Condo Flats, Orchard Park, San Jose | 2014 | 72 | 4 | 68 | 5 | 4 | $690 - $780 | ||||||||||||
Sacramento County: | |||||||||||||||||||
McKinley Village | 2015 | 336 | — | 336 | — | — | $450 - $780 | ||||||||||||
Northern California Total | 660 | 80 | 580 | 42 | 80 | ||||||||||||||
Unconsolidated Homebuilding Joint Venture Projects Total | 1,350 | 465 | 885 | 75 | 275 | ||||||||||||||
Unconsolidated Land Joint Venture Projects(6) | |||||||||||||||||||
Southern California | |||||||||||||||||||
Riverside County: | |||||||||||||||||||
Bedford Ranch, Corona (8) | 2016 | 1,435 | — | 1,200 | — | — | — | ||||||||||||
Southern California Total | 1,435 | — | 1,200 | — | — | ||||||||||||||
Northern California | |||||||||||||||||||
Sacramento County: | |||||||||||||||||||
Russell Ranch, Folsom (8) | 2016 | 870 | — | 870 | — | — | — | ||||||||||||
San Mateo County: | |||||||||||||||||||
Foster Square, Foster (8) | 2014 | 421 | 266 | 155 | 155 | 266 | — | ||||||||||||
Yolo County: | |||||||||||||||||||
Cannery Park (8)(10) | 2015 | 547 | — | 547 | 265 | — | — | ||||||||||||
Northern California Total | 1,838 | 266 | 1,572 | 420 | 266 | ||||||||||||||
Unconsolidated Land Joint Venture Projects Total | 3,273 | 266 | 2,772 | 420 | 266 | ||||||||||||||
10
County, Project, City | Year of First Delivery(1) | Total Number of Homes or Lots to Be Built at Completion(2) | Cumulative Homes or Lots Delivered as of December 31, 2014 | Lots as of December 31, 2014 (3) | Backlog at December 31, 2014 (4) | Homes or Lots delivered for the year ended December 31, 2014 | Sales Range (in 000's)(5) | ||||||||||||
Fee Building Projects | |||||||||||||||||||
Southern California | |||||||||||||||||||
Orange County: | |||||||||||||||||||
Carmel, Irvine | 2011 | 96 | 96 | — | n/a | — | $900 - $1,210 | ||||||||||||
San Marino, Irvine | 2012 | 47 | 47 | — | n/a | — | n/a | ||||||||||||
Toscana, Irvine | 2011 | 86 | 86 | — | n/a | — | n/a | ||||||||||||
Mendocino, Irvine | 2013 | 133 | 126 | 7 | n/a | 31 | n/a | ||||||||||||
The Strand, Dana Point | 2014 | 2 | 2 | — | n/a | 2 | n/a | ||||||||||||
Mendocino Ext., Irvine | 2014 | 114 | 77 | 37 | n/a | 77 | n/a | ||||||||||||
Strada, Irvine | 2014 | 224 | 9 | 215 | n/a | 9 | n/a | ||||||||||||
Laurel, Irvine | 2014 | 120 | 17 | 103 | n/a | 17 | n/a | ||||||||||||
Jasmine, Irvine | 2014 | 102 | 32 | 70 | n/a | 32 | n/a | ||||||||||||
Jasmine Ext., Irvine | 2015 | 126 | — | 126 | n/a | — | n/a | ||||||||||||
Corte Bella, Irvine | 2014 | 118 | 3 | 115 | n/a | 3 | n/a | ||||||||||||
Entrata, Irvine | 2014 | 123 | 14 | 109 | n/a | 14 | n/a | ||||||||||||
Terrazza, Irvine | 2014 | 149 | 10 | 139 | n/a | 10 | n/a | ||||||||||||
Vista Scena, Irvine | 2014 | 195 | 11 | 184 | n/a | 11 | n/a | ||||||||||||
San Diego County: | |||||||||||||||||||
Carlsbad 16, Carlsbad (9) | 2013 | 16 | 16 | — | n/a | — | n/a | ||||||||||||
Southern California Total | 1,651 | 546 | 1,105 | 206 | |||||||||||||||
Fee Building Projects Total | 1,651 | 546 | 1,105 | 206 | |||||||||||||||
(1) | Year of first delivery for future periods is based upon management’s estimates and is subject to change. |
(2) | The number of homes or lots to be built at completion is subject to change, and there can be no assurance that we will build these homes or develop these lots. |
(3) | Consists of owned lots, fee building lots and unconsolidated joint venture lots as of December 31, 2014, including owned lots, fee building lots and unconsolidated joint venture lots in backlog as of December 31, 2014. Of the foregoing lots, there were 17 completed and unsold homes other than those being used as model homes. |
(4) | Backlog consists of homes or lots under sales contracts that had not closed as of December 31, 2014. There can be no assurance that delivery of sold homes or lots will occur. Backlog has not been reduced to reflect our historical cancellation rate. Backlog for fee building projects is not included as we are not responsible for sales activities related to those projects. |
(5) | Sales range reflects actual total price for homes already sold in the respective project and, where sales have not yet commenced for a project, anticipated sales prices for homes to be sold. The actual prices at which our homes are sold in the future may differ. Sales price range is not included for fee building projects where we are not responsible for sales activities. |
(6) | We own economic interests in our unconsolidated joint ventures, which include our capital interests that generally range from 5% to 50% plus, in each case, a share of the distributions from the joint ventures in excess of our capital interest. These economic interests vary among our different joint ventures. |
(7) | Cottages and Terraces have below-market homes as required by the Housing Authority of the County of Marin. The sales price range for these homes is excluded from the table. |
(8) | This project is anticipated to be a lot sale program, in which we may buy lots from the unconsolidated joint venture or sell lots to merchant builders. As such, a sales range is not presented. |
(9) | Planning related tasks for this community were completed during the year ended December 31, 2013 and the contract was terminated by the land owner. No homes were constructed. We had no remaining obligations under this contract as of December 31, 2013. |
(10) | Cannery backlog includes lots sold to the Company. |
11
Owned and Controlled Lots
As of December 31, 2014, we owned or controlled, pursuant to option contracts, purchase contracts or non-binding letters of intent, an aggregate of 929 lots. The following table presents certain information with respect to our, our unconsolidated joint ventures, and our fee building projects owned and controlled lots(1) as of December 31, 2014.
Lots Owned | Lots Controlled(1) | Lots Owned and Controlled(1) | ||||||
Company | ||||||||
Southern California | 120 | 339 | 459 | |||||
Northern California | 270 | 200 | 470 | |||||
Company Total | 390 | 539 | 929 | |||||
Unconsolidated Joint Ventures (2) | ||||||||
Homebuilding | ||||||||
Southern California | 305 | — | 305 | |||||
Northern California | 580 | — | 580 | |||||
Homebuilding Total | 885 | — | 885 | |||||
Land Development | ||||||||
Southern California | 1,200 | 235 | 1,435 | |||||
Northern California | 1,572 | — | 1,572 | |||||
Land Development Total | 2,772 | 235 | 3,007 | |||||
Unconsolidated Joint Ventures Total | 3,657 | 235 | 3,892 | |||||
Fee Building | ||||||||
Southern California | — | 1,105 | 1,105 | |||||
Fee Building Total | — | 1,105 | 1,105 | |||||
(1) | Includes lots that we and our unconsolidated joint ventures control under purchase and sale agreements or under executed non-binding letters of intent that are subject to customary conditions and have not yet closed. There can be no assurance that such acquisitions will occur. |
(2) | We own economic interests in our unconsolidated joint ventures, which include our capital interests that generally range from 5% to 50% plus, in each case, a share of the distributions from the joint ventures in excess of our capital interest. These economic interests vary among our different unconsolidated joint ventures. |
12
Acquisition Process
As of December 31, 2014, we and our unconsolidated joint ventures had 22 and 54 communities, respectively, containing 929 and 3,892 lots, including controlled lots. In addition, we had 10 communities containing 1,105 lots under our fee building arrangements as of December 31, 2014. We believe our current inventory of owned and controlled lots, including lots under land option or purchase contracts, will be adequate to supply our and our unconsolidated joint ventures’ projected deliveries through 2017.
Our land acquisition strategy is differentiated between housing programs and larger lot development programs. For lot development programs, the focus is on developing entitled parcels that we can complete within approximately 24 to 48 months from the date the property is acquired. For housing programs, we focus on controlling development and market cycle risk while maintaining an inventory of owned lots and lots under land option or purchase contracts sufficient for construction of homes over a two- to three-year period from the initiation of homebuilding activity. Our acquisition process generally includes the following steps aimed at reducing development and market cycle risk:
• | review of the status of entitlements and other governmental processing, including title reviews; |
• | identification of target buyer and appropriate housing product; |
• | determination of land plan to accommodate desired housing product; |
• | completion of environmental reviews and third-party market studies; |
• | preparation of detailed budgets for all cost categories; |
• | completion of due diligence on the land parcel prior to committing to the acquisition; |
• | utilization of options, joint ventures and other land acquisition arrangements, if necessary; |
• | limitation on the size of an acquisition to minimize investment levels in any one project, which is generally an amount not to exceed 15% of the Company’s equity; and |
• | employment of centralized control of approval of all acquisitions through an institutionalized approval process. |
Before purchasing a land parcel, we engage and work closely with outside architects and consultants to design our homes and communities.
We acquire land parcels pursuant to purchase agreements that are often structured as option contracts. Such option contracts require us to pay non-refundable deposits, which can vary by transaction, and entitle (but do not obligate) us to acquire the land typically at fixed prices. The term within which we can exercise our option varies by transaction, and our acquisition is often contingent upon the completion of entitlement or other work with regard to the land (such as “backbone” improvements, such as the installation of main roads or utility services). Depending upon the transaction, we may be required to purchase all of the land involved at one time or we may have a right to acquire identified groups of lots over a specified timetable. In some transactions, a portion of the consideration that we pay for the land may be in the form of a share of the profits of a project after we receive an agreed to level of profits from the project. In limited instances, such as where we acquire land from a master developer that is part of a larger project, the seller may have repurchase rights entitling it to repurchase the land from us under circumstances where we do not develop the land by an outside deadline (unless the delay is caused by certain circumstances outside our control), or where we seek to sell the land directly to a third party or indirectly through a change in control of our company. Repurchase rights typically allow the seller to repurchase the land at the price that we paid the seller to acquire the land plus the cost of improvements that we have made to the land and less some specified discount.
Homebuilding, Marketing and Sales Process
The homes that we and our unconsolidated joint ventures are building range in price from approximately $300,000 to $4.1 million, with home sizes ranging from approximately 800 to 5,400 square feet. For the years ended December 31, 2014, 2013 and 2012, the average sales price of homes delivered from our projects was approximately $1.1 million, $435,000 and $457,000, respectively. The average sales price of homes delivered from our unconsolidated joint venture projects was $816,000, $1.2 million and $1.3 million, for the years ended December 31, 2014, 2013 and 2012, respectively.
We typically develop communities in phases based upon projected sales. We seek to control the timing of construction of subsequent phases in the same community based on demand as evidenced by sales of homes in prior phases and the number of qualified potential homebuyers that exist on our priority buyer list. Our construction process is driven by sales contracts that generally precede the start of the construction of homes. The determination that a potential home buyer is qualified to obtain the financing necessary to complete the purchase is an integral part of our process. Once qualified, our on-site design centers, with designers dedicated to a specific community, work with the buyer to tailor the home to meet the buyer’s needs. This practice is designed to enhance the buyers’ design center experience and results in increased option sales.
13
The design of our homes must conform to zoning requirements, building codes and energy efficiency laws. As a result, we contract with a number of architects and other consultants in connection with the design process. Substantially all of our construction work is done by trade partners with us acting as the general contractor. We also enter into contracts as needed with design professionals and other service providers who are familiar with local market conditions and requirements. We do not have long-term contractual commitments with our trade partners, suppliers or laborers. We maintain strong and long-standing relationships with many of our trade partners. We believe that our relationships with trade partners have been enhanced through involving them prior to the start of a new community, maintaining our schedules and making timely payment. By dealing fairly, we believe we are able to keep our key trade partners loyal to us.
Sales and Marketing
In connection with the sale and marketing of our homes, we make extensive use of advertising and other promotional activities, including through our website (www.NWHM.com), social-media, brochures, direct mail and other community-specific collateral materials. The information contained in, or that can be accessed through our website, is not incorporated by reference and is not a part of this annual report on Form 10-K.
We primarily sell our homes through our own sales representatives. Our in-house sales force works from sales offices located in model homes close to, or in each community. Sales representatives assist potential buyers by providing them with floor plan, price and community amenity information, construction timetables and tours of model homes. Sales personnel are licensed by the applicable real estate bodies in their respective markets and generally have had prior experience selling new homes in the local market.
As of December 31, 2014, we owned 33 model homes (23 of which were owned by our unconsolidated joint ventures). Generally, we build model homes at each project and have them professionally decorated to display design features and options available for purchase in the design center. We believe that model homes play a significant role in helping homebuyers understand the efficiencies and value provided by each floor plan type. Interior decorations vary among our models and are selected based upon the lifestyles of our targeted homebuyers. Structural changes in design from the model homes, other than those predetermined, are not generally permitted, but homebuyers may select various other optional construction and design amenities. Our on-site design centers are an integral part of our sales process. Specific options are selected for each community based upon the price of the home and anticipated buyer preferences. Options include structural (room configurations or pre-determined additional square footage), electrical, plumbing and finish options (flooring, cabinets, fixtures). In certain communities, we also offer turn-key landscape options. Each design center is managed by our own designers dedicated to the specific community. We believe this approach enables us to create a strong relationship with our buyers that result in fewer cancellations and increased revenue.
We typically sell homes using sales contracts that include cash deposits by the purchasers. Before entering into sales contracts, we pre-qualify our customers through a preferred mortgage provider. However, purchasers can generally cancel sales contracts if they are unable to sell their existing homes, if they fail to qualify for financing, or under certain other circumstances. Although cancellations can delay the sale of our homes, they have historically not had a material impact on our operating results. For our projects, the cancellation rate, excluding our unconsolidated joint ventures, of buyers who contracted to buy a home but did not close escrow as a percentage of overall orders was 13%, 20% and 16% during the years ended December 31, 2014, 2013 and 2012, respectively. For our unconsolidated joint venture projects, the cancellation rate was 9%, 7% and 5% during the years ended December 31, 2014, 2013 and 2012, respectively. Cancellation rates are subject to a variety of factors beyond our control, such as adverse economic conditions and increases in mortgage interest rates.
Customer Financing
At each of our communities, we seek to assist our homebuyers in obtaining financing by arranging with preferred mortgage lenders to offer qualified buyers a variety of financing options. Most homebuyers utilize long-term mortgage financing to purchase a home, and mortgage lenders will usually make loans only to qualified borrowers.
Quality Control and Customer Service
We pay particular attention to the product design process and carefully consider quality and choice of materials in order to attempt to eliminate building deficiencies. The quality and workmanship of the trade partners we employ are monitored using our personnel and third-party consultants. We make regular inspections and evaluations of our trade partners to seek to ensure that our standards are met.
We maintain a quality control and customer service staff whose role includes providing a positive experience for each customer throughout the pre-sale, sale, building, delivery and post-delivery periods. These employees are also responsible for providing after-sales customer service. Our quality and service initiatives include taking homebuyers on a comprehensive tour
14
of their home during construction and prior to delivery and using a third party, Eliant, to survey our homebuyers in order to improve our standards of quality and customer satisfaction.
We have consistently ranked at the top end of the survey results when compared to the other builders who participate in the Eliant survey.
Warranty Program
Our company currently provides a limited one-year warranty covering workmanship and materials. In addition, our limited warranty, which generally ranges from a minimum of two years up to the period covered by the applicable statute of repose, covers certain defined construction defects. The limited warranty covering construction defects is transferable to subsequent buyers not under direct contract with us and requires that homebuyers agree to the definitions and procedures set forth in the warranty, including the submission of unresolved construction-related disputes to binding arbitration. We generally reserve 1% of the sales price of each home we sell to provide warranty service to our homebuyers. Additionally, we have dedicated customer service staff that work with our homebuyers and coordinate with trade partners, as necessary, during the warranty period. We believe that our reserves are adequate to cover the ultimate resolution of our potential liabilities associated with known and anticipated warranty and construction defect related claims and litigation.
We subcontract our homebuilding work to trade partners who generally provide us with an indemnity prior to receiving payments for their work. Accordingly, claims relating to workmanship and materials are generally the primary responsibility of our trade partners.
We purchase general liability insurance that covers development and construction activity at each of our communities. Our trade partners are usually covered by these programs through an owner-controlled insurance program, or "OCIP."
There can be no assurance, however, that the terms and limitations of the limited warranty will be effective against claims made by homebuyers, that we will be able to renew our insurance coverage or renew it at reasonable rates, that we will not be liable for damages, that we will not incur significant cost of repairs or the expenses of litigation surrounding possible construction defects, soil subsidence or building related claims or that claims will not arise out of uninsurable events or circumstances not covered by insurance and not subject to effective indemnification agreements with our trade partners.
Seasonality
We have experienced seasonal variations in our quarterly operating results and capital requirements. We typically take orders for more homes in the first half of the fiscal year than in the second half, which creates additional working capital requirements in the second and third quarters to build our inventories to satisfy the deliveries in the second half of the year. We expect this seasonal pattern to continue over the long-term, although it may be affected by volatility in the homebuilding industry.
Raw Materials
Typically, all the raw materials and most of the components used in our business are readily available in the United States. Most are standard items carried by major suppliers. However, a rapid increase in new home construction could cause shortages in the availability of such materials or in the price of services, thereby leading to delays in the delivery of homes under construction. We continue to monitor the supply markets to achieve favorable prices.
Joint Ventures
Our joint venture strategy has been instrumental in allowing us to leverage our entity-level capital and establish a homebuilding and land development platform focused on high-growth, land-constrained markets in Southern and Northern California. We own economic interests in our unconsolidated joint ventures, which include our capital interests that generally range from 5% to 50% plus, in each case, a share of the distributions from the joint ventures in excess of our capital interest. These economic interests vary among our different joint ventures. We also earn management and other fees from such joint ventures.
We serve as the administrative member, manager or managing member of each of our eight homebuilding and four land development joint ventures. We do not, however, exercise control over the joint ventures, as the joint venture agreements generally provide our respective partners with the right to consent to certain actions. Under the joint venture agreements, certain major decisions must be approved by the applicable joint venture’s executive committee, which is comprised of both our representatives and representatives of our joint venture partners. In addition, some of our joint venture agreements grant both partners a buy-sell right pursuant to which, subject to certain exceptions, either partner may initiate procedures requiring
15
the other partner to choose between selling its interest to the other partner or buying the other partner’s interest. Additional information on our unconsolidated joint ventures is set forth below.
Entity Name (Project Name) | Location | Percent- age of Capital Contri- buted by Us | Our equity balance as of December 31, 2014 (1)(in 000's) | Opening/Planned Opening(3) | Total Number of Homes/Lots | Cumulative homes or lots delivered as of December 31, 2014 | Backlog as of December 31, 2014(4) | Lots Owned as of December 31, 2014 | Lots Controlled as of December 31, 2014 | ||||||||||||||||
Total Unconsolidated Joint Venture (in 000's) | |||||||||||||||||||||||||
Assets | Debt (2) | Equity (1) | |||||||||||||||||||||||
LR8 Investors, LLC (Lambert Ranch) | Irvine, California | 5% | $ | 612 | $ | 4,517 | $ | — | $ | 2,041 | 2012 | 169 | 169 | — | — | — | |||||||||
Larkspur Land 8 Investors, LLC (Rose Lane) | Larkspur, California | 10% | 2,297 | 38,559 | 11,341 | 22,968 | 2013 | 85 | 58 | 26 | 27 | — | |||||||||||||
TNHC-HW San Jose, LLC (Orchard Park) | San Jose, California | 15% | 7,116 | 77,959 | 25,513 | 47,438 | 2014 | 239 | 22 | 16 | 217 | — | |||||||||||||
TNHC-TCN Santa Clarita LP (Villa Metro) | Santa Clarita, California | 10% | 1,920 | 29,477 | 6,795 | 19,200 | 2013 | 315 | 195 | 16 | 120 | — | |||||||||||||
TNHC Newport LLC (Meridian) | Newport Beach, California | 12% | 7,368 | 92,276 | 21,999 | 60,734 | 2014 | 79 | 21 | 17 | 58 | — | |||||||||||||
Encore McKinley Village, LLC (McKinley Village) | Sacramento, California | 10% | 2,271 | 25,736 | 2,346 | 22,638 | 2015 | 336 | — | — | 336 | — | |||||||||||||
TNHC San Juan LLC (Oliva) | San Juan Capistrano, California | 20% | 9,948 | 25,085 | — | 24,024 | 2015 | 40 | — | — | 40 | — | |||||||||||||
TNHC Russell Ranch LLC (Russell Ranch)(5) | Folsom, California | 35% | 5,972 | 37,538 | 20,000 | 17,066 | 2015 | 870 | — | — | 870 | — | |||||||||||||
TNHC-HW Foster City LLC (Foster Square)(5) | Foster City, California | 35% | 1,307 | 23,010 | — | 2,812 | 2014 | 421 | 266 | 155 | 155 | — | |||||||||||||
Calabasas Village LP (Avanti) | Calabasas, California | 10% | 2,697 | 28,752 | — | 26,968 | 2015 | 87 | — | — | 87 | — | |||||||||||||
TNHC-HW Cannery LLC (Cannery Park)(5)(6) | Davis, California | 35% | 16,601 | 50,249 | — | 47,264 | 2014 | 547 | — | 265 | 547 | — | |||||||||||||
Arantine Hills Holdings LP (Bedford Ranch)(5) | Corona, California | 5% | 2,455 | 88,452 | — | 87,862 | 2016 | 1,435 | — | — | 1,200 | 235 | |||||||||||||
Total Unconsolidated Joint Ventures | $ | 60,564 | $ | 521,610 | $ | 87,994 | $ | 381,015 | 4,623 | 731 | 495 | 3,657 | 235 | ||||||||||||
(1) | Amounts reflect capital contributions, distributions and cumulative net income or loss. |
(2) | Scheduled maturities of the unconsolidated joint venture debt as of December 31, 2014 are as follows: $11.3 million matures in 2015, $40.3 million matures in 2016, $34.0 million matures in 2017, $0 matures in 2018 and $2.3 million matures in 2019. |
(3) | Represents planned year in which model homes will be open for sales at the communities, except for land development joint ventures where it represents expected commencement date of lot sales. |
(4) | Backlog consists of homes or lots under sales contracts that had not yet closed as of December 31, 2014, and there can be no assurance that delivery of sold homes or lots will occur. Backlog has not been reduced to reflect our historical cancellation rate. |
(5) | Land development joint ventures. |
(6) | Cannery backlog includes lots sold to the Company. |
Fee Building Services
Although our primary business focus is building and selling homes for our own account, we also selectively provide construction services to build homes for independent third-party property owners, some of which have been or may be marketed under The New Home Company brand name. We refer to these projects as “fee building projects.” Our services with respect to fee building projects may include design, development, construction and sale of the homes, and we may take a project at any stage of development through its completion and sale. We earn revenue on our fee building projects either as a
16
flat fee for the project or as a percentage of the cost or revenue of the project depending upon the terms of the agreement with our customer.
Segments
For financial information about our segments, see Item 7, "Management's Discussion and Analysis of Financial Condition and Results of Operations" and Note 14 to the Consolidated Financial Statements.
Government Regulation and Environmental Matters
We are subject to numerous local, state, federal and other statutes, ordinances, rules and regulations concerning zoning, development, building design, construction and similar matters, which impose restrictive zoning and density requirements, the result of which is to limit the number of homes that can be built within the boundaries of a particular area. Projects that are not entitled may be subjected to periodic delays, changes in use, less intensive development or elimination of development in certain specific areas due to government regulations. We may also be subject to periodic delays or may be precluded entirely from developing in certain communities due to building moratoriums or “slow-growth” or “no-growth” initiatives that could be implemented in the future. Local governments also have broad discretion regarding the imposition of development fees and exactions for projects in their jurisdiction. Projects for which we have received land use and development entitlements or approvals may still require a variety of other governmental approvals and permits during the development process and can also be impacted adversely by unforeseen health, safety and welfare issues, which can further delay these projects or prevent their development.
We are also subject to a variety of local, state, federal and other statutes, ordinances, rules and regulations concerning the environment. The particular environmental laws which apply to any given homebuilding site vary according to multiple factors, including the site’s location, its environmental conditions and the present and former uses of the site, as well as adjoining properties. Environmental laws and conditions may result in delays, may cause us to incur substantial compliance and other costs, and can prohibit or severely restrict homebuilding activity in environmentally sensitive regions or areas. In addition, in those cases where an endangered or threatened species is involved, environmental rules and regulations can result in the restriction or elimination of development in identified environmentally sensitive areas. From time to time, the EPA and similar federal or state agencies review homebuilders’ compliance with environmental laws and may levy fines and penalties for failure to strictly comply with applicable environmental laws or impose additional requirements for future compliance as a result of past failures. Any such actions taken with respect to us may increase our costs. Further, we expect that increasingly stringent requirements will be imposed on homebuilders in the future. Environmental regulations can also have an adverse impact on the availability and price of certain raw materials such as lumber. California is especially susceptible to restrictive government regulations and environmental laws.
Under various environmental laws, current or former owners of real estate, as well as certain other categories of parties, may be required to investigate and clean up hazardous or toxic substances or petroleum product releases, and may be held liable to a governmental entity or to third parties for related damages, including for bodily injury, and for investigation and clean-up costs incurred by such parties in connection with the contamination. A mitigation system may be installed during the construction of a home if a cleanup does not remove all contaminants of concern or to address a naturally occurring condition such as methane. Some buyers may not want to purchase a home with a mitigation system.
Competition
Competition in the homebuilding industry is intense, and there are relatively low barriers to entry into our business. Homebuilders compete for, among other things, home-buying customers, desirable land parcels, financing, raw materials and skilled labor. Increased competition could hurt our business, as it could prevent us from acquiring attractive land parcels on which to build homes or make such acquisitions more expensive, hinder our market share expansion, and lead to pricing pressures on our homes that may adversely impact our margins and revenues. If we are unable to successfully compete, our business, prospects, liquidity, financial condition and results of operations could be materially and adversely affected. Our competitors may independently develop land and construct homes that are superior or substantially similar to our products. Furthermore, a number of our primary competitors are significantly larger, have a longer operating history and may have greater resources or lower cost of capital than us. Accordingly, they may be able to compete more effectively in one or more of the markets in which we operate. Many of these competitors also have longstanding relationships with trade partners and suppliers in the markets in which we operate. We also compete for sales with individual resales of existing homes and with available rental housing.
17
Employees
As of December 31, 2014, we had 234 employees, 118 of whom were executive, management and administrative personnel located in our offices and 116 were located at our projects. Although none of our employees are covered by collective bargaining agreements, certain of the third party trade partners engaged by us primarily as general contractors are represented by labor unions or are subject to collective bargaining arrangements. We believe that relations with our employees and trade partners are very good. See Item 1A - Risk Factors - "Our business and results of operations depend on the availability and skill of trade partners."
Legal Proceedings
We are not involved in any material litigation nor, to our knowledge, is any material litigation threatened against us. However, in the future we may become involved in various legal proceedings arising in the ordinary course of business or otherwise.
Our Offices
Our principal executive offices are located at 85 Enterprise, Suite 450, Aliso Viejo, California 92656. Our main telephone number is (949) 382-7800. Our internet website is www.NWHM.com. We will make available through our website our annual report on Form 10-K, quarterly reports on Form 10-Q, current reports on Form 8-K, and amendments to these reports filed or furnished pursuant to Section 13(d) or 15(d) of the Securities Exchange Act of 1934 as soon as reasonably practicable after filing with, or furnishing to, the Securities and Exchange Commission. Copies of these reports, and any amendment to them, are available free of charge upon request. The information contained in, or that can be accessed through our website is not incorporated by reference and is not a part of this annual report on Form 10-K.
Executive Officers of the Registrant
The following individuals are our executive officers as of March 6, 2015:
Name | Age | Position |
Mr. H. Lawrence Webb | 66 | Chief Executive Officer and Chairman of our Board of Directors (Class 3 term will expire in 2017) |
Mr. Wayne Stelmar | 60 | Chief Financial Officer, Secretary and Director (Class 2 term will expire in 2016) |
Mr. Joseph D. Davis | 64 | Chief Investment Officer |
Mr. Tom Redwitz | 60 | Chief Operating Officer |
18
Item 1A. | Risk Factors |
You should carefully consider the following risk factors, which address the material risks concerning our business, together with the other information contained in this annual report on Form 10-K. If any of the risks discussed in this annual report on Form 10-K occur, our business, prospects, liquidity, financial condition and results of operations could be materially and adversely affected, in which case the trading price of our common stock could decline significantly and you could lose part or all of your investment. Some statements in this annual report, including statements in the following risk factors, constitute forward-looking statements. Please refer to the initial section of this annual report entitled “Cautionary Note Concerning Forward-Looking Statements.”
Risks Related to Our Business
Our long-term growth depends upon our ability to successfully identify and acquire desirable land parcels for residential buildout.
Our future growth depends upon our ability to successfully identify and acquire attractive land parcels for development of our single-family homes at reasonable prices and with terms that meet our underwriting criteria. Our ability to acquire land parcels for new single-family homes may be adversely affected by changes in the general availability of land parcels, the willingness of land sellers to sell land parcels at reasonable prices, competition for available land parcels, availability of financing to acquire land parcels, zoning and other market conditions. If the supply of land parcels appropriate for development of single-family homes is limited because of these factors, or for any other reason, our ability to grow could be significantly limited, and the number of homes that we build and sell could decline. Additionally, our ability to begin new projects could be impacted if we elect not to purchase land parcels under option contracts. To the extent that we are unable to purchase land parcels timely or enter into new contracts for the purchase of land parcels at reasonable prices, our home sales revenue and results of operations could be negatively impacted.
Adverse changes in general and local economic conditions could reduce the demand for homes and, as a result, could have a material adverse effect on us.
The residential homebuilding industry is cyclical and is highly sensitive to changes in general economic conditions such as levels of employment, consumer confidence and income, availability of financing for acquisitions, construction and permanent mortgages, interest rate levels, inflation and demand for housing. Since early 2006, the U.S. housing market has been negatively impacted by declining consumer confidence, restrictive mortgage standards and large supplies of foreclosures, resales and new homes, among other factors. When combined with a prolonged economic downturn, high unemployment levels, increases in the rate of inflation and uncertainty in the U.S. economy, these conditions have contributed to decreased demand for housing, declining sales prices and increasing pricing pressure. In the event that these economic and business trends continue or decline further, we could experience declines in the market value of our inventory and demand for our homes, which could have a material adverse effect on our business, prospects, liquidity, financial condition and results of operations.
The health of the residential homebuilding industry may also be significantly affected by “shadow inventory” levels. “Shadow inventory” refers to the number of homes with a mortgage that are in some form of distress but that have not yet been listed for sale. Shadow inventory can occur when lenders put properties that have been foreclosed or forfeited to lenders on the market gradually, rather than all at once, or delay the foreclosure process. They may choose to do so because of regulations and foreclosure moratoriums, because of the additional costs and resources required to process and sell foreclosed properties, or because they want to avoid depressing housing prices further by putting many distressed properties up for sale at the same time. A significant shadow inventory in our markets could, were it to be released into our markets, adversely impact home prices and demand for our homes, which could have a material adverse effect on our business, prospects, liquidity, financial condition and results of operations.
In addition, an important segment of our customer base consists of first time and second time “move-up” buyers, who often purchase homes subject to contingencies related to the sale of their existing homes. The difficulties facing these buyers in selling their homes during recessionary periods may adversely affect our sales. Moreover, during such periods, we may need to reduce our sales prices and offer greater incentives to buyers to compete for sales that may result in reduced margins.
19
Our geographic concentration could materially and adversely affect us if the homebuilding industry in our current markets declines.
Our business strategy is focused on the design, construction and sale of innovative single-family detached and attached homes in planned communities in major metropolitan areas in coastal Southern California, the San Francisco Bay area and metro Sacramento and the potential entry into other markets. Because our operations are concentrated in these areas, a prolonged economic downturn in one or more of these areas could have a material adverse effect on our business, prospects, liquidity, financial condition and results of operations, and a disproportionately greater impact on us than other homebuilders with more diversified operations. During the downturn from 2008 to 2010, land values, the demand for new homes and home prices declined substantially in California. In addition, the state of California recently experienced severe budget shortfalls and has raised taxes and increased fees to offset the deficit. If these conditions in California persist or worsen, our business, prospects, liquidity, financial condition and results of operations could materially suffer. If the current, relatively weak buyer demand for new homes in California continues or worsens, home prices could stagnate or continue to decline, which would have a material adverse effect on us.
Because most of our homebuyers finance the purchase of their homes, the terms and availability of mortgage financing can affect the demand for and the ability to complete the purchase of a home, which could materially and adversely affect us.
Our business depends on the ability of our homebuyers to obtain financing for the purchase of their homes. Many of our homebuyers must sell their existing homes in order to buy a home from us. Since 2009, the U.S. residential mortgage market as a whole has experienced significant instability due to, among other things, defaults on subprime and other loans, resulting in the declining market value of such loans. In light of these developments, lenders, investors, regulators and other third parties questioned the adequacy of lending standards and other credit requirements for several loan programs made available to borrowers in recent years. This has led to tightened credit requirements and an increase in indemnity claims for mortgages. Deterioration in credit quality among subprime and other nonconforming loans has caused most lenders to eliminate subprime mortgages and most other loan products that do not conform to Federal National Mortgage Association, or Fannie Mae, Federal Home Loan Mortgage Corporation, or Freddie Mac, Federal Housing Administration, or FHA, or Veterans Administration, or the VA, standards. Fewer loan products and tighter loan qualifications, in turn, make it more difficult for a borrower to finance the purchase of a new home or the purchase of an existing home from a potential “move-up” buyer who wishes to purchase one of our homes. In general, these developments have delayed any general improvement in the housing market. If our potential homebuyers or the buyers of our homebuyers’ existing homes cannot obtain suitable financing, our business, prospects, liquidity, financial condition and results of operations could be materially and adversely affected.
Changes in tax laws can increase the after tax cost of owning a home, and further tax law changes could adversely affect demand for the homes we build.
Under current tax law certain significant expenses of owning a home, including mortgage loan interest costs and real estate taxes, generally are deductible expenses for the purpose of calculating an individual’s federal, and in some cases state, tax liability. However, the American Taxpayer Relief Act of 2012, which was signed into law in January 2013, resulted in higher income tax rates and limits the amount of mortgage interest individuals can deduct in computing their income tax liability. The limit on deductibility of mortgage interest can increase the after-tax cost of owning a home for some individuals.
Any additional increases in personal income tax rates and/or additional tax deduction limits could adversely impact demand for new homes, including homes we build, which could adversely affect our results of operations.
Interest rate increases or changes in federal lending programs or other regulations could lower demand for our homes, which could materially and adversely affect us.
Substantially all purchasers of our homes finance their acquisitions with mortgage financing. Rising interest rates, decreased availability of mortgage financing or of certain mortgage programs, higher down payment requirements or increased monthly mortgage costs may lead to reduced demand for our homes and mortgage loans. Increased interest rates can also hinder our ability to realize our backlog because our home purchase contracts provide customers with a financing contingency. Financing contingencies allow customers to cancel their home purchase contracts in the event that they cannot arrange for adequate financing. As a result, rising interest rates can decrease our home sales. Any of these factors could have a material adverse effect on our business, prospects, liquidity, financial condition and results of operations.
In addition, as a result of the turbulence in the credit markets and mortgage finance industry, the federal government has taken on a significant role in supporting mortgage lending through its conservatorship of Fannie Mae and Freddie Mac, both of which purchase home mortgages and mortgage-backed securities originated by mortgage lenders, and its insurance of mortgages originated by lenders through the FHA and the VA. The availability and affordability of mortgage loans, including
20
interest rates for such loans, could be adversely affected by a curtailment or cessation of the federal government’s mortgage-related programs or policies. The FHA may continue to impose stricter loan qualification standards, raise minimum down payment requirements, impose higher mortgage insurance premiums and other costs, or limit the number of mortgages it insures. Due to federal budget deficits, the U.S. Treasury may not be able to continue supporting the mortgage-related activities of Fannie Mae, Freddie Mac, the FHA and the VA at present levels, or it may revise significantly the federal government’s participation in and support of the residential mortgage market. Because the availability of Fannie Mae, Freddie Mac, FHA and VA-backed mortgage financing is an important factor in marketing and selling many of our homes, any limitations, restrictions or changes in the availability of such government-backed financing could reduce our home sales, which could have a material adverse effect on our business, prospects, liquidity, financial condition and results of operations. In March 2014, a proposal was introduced in the U.S. Senate to overhaul the mortgage market by replacing Fannie Mae and Freddie Mac with a new system of Federally insured mortgage securities. There can be no assurance that such proposal will be enacted or as to the affect on the mortgage market if it is enacted. Such an overhaul may reduce the availability of mortgage loans or increase the cost of such loans to borrowers, which could materially and adversely affect us.
Furthermore, in July 2010, the Dodd-Frank Wall Street Reform and Consumer Protection Act was signed into law. This legislation provides for a number of new requirements relating to residential mortgages and mortgage lending practices, many of which are to be developed further by implementing rules. These include, among others, minimum standards for mortgages and lender practices in making mortgages, limitations on certain fees and incentive arrangements, retention of credit risk and remedies for borrowers in foreclosure proceedings. The effect of such provisions on lending institutions will depend on the rules that are ultimately enacted. However, these requirements, as and when implemented, are expected to reduce the availability of loans to borrowers or increase the costs to borrowers to obtain such loans. Any such reduction could result in a decline of our home sales, which could materially and adversely affect us.
Because of the seasonal nature of our business, our quarterly operating results fluctuate.
As discussed under “Management’s Discussion and Analysis of Financial Condition—Liquidity and Capital Resources—Seasonality” we have experienced seasonal fluctuations in our quarterly operating results and capital requirements that can have a material impact on our results and our consolidated financial statements. We typically experience the highest new home order activity in spring and summer, although this activity also highly depends on the number of active selling communities, timing of new community openings and other market factors. Since it typically takes four to six months to construct a new home, we deliver more homes in the second half of the year as spring and summer home orders convert to home deliveries. Because of this seasonality, home starts, construction costs and related cash outflows have historically been highest in the second and third quarters, and the majority of cash receipts from home deliveries occur during the second half of the year. We expect this seasonal pattern to continue over the long-term, although it may be affected by volatility in the homebuilding industry. We expect the traditional seasonality cycle and its impact on our results to become more prominent if and as the present housing recovery progresses and the homebuilding industry returns to a more normal operating environment, but we can make no assurances as to the degree to which our historical seasonal patterns will occur in 2015 and beyond, if at all.
We may not achieve projected goals and objectives in the time periods that we anticipate or announce publicly, which could have an adverse effect on our business and could cause the price of our common stock to decline.
We set goals and objectives for the timing of certain accomplishments and milestones regarding our business. We have included some of these goals and objectives in this annual report on Form 10-K and may make similar future public statements. For example, this annual report on Form 10-K includes forecasts regarding the timelines for opening sales locations, or beginning development, in various communities or markets and the number of homes in planned future communities. These projections are based on our current expectations and may not accurately reflect specific uncertainties or uncertainties inherent in all forecasts. More specifically, the actual timing of these events can vary dramatically due to a number of factors, including currently unforeseen matters and matters beyond our control. To the extent that we are unable to meet our projected timelines, our revenue and results of operations could be negatively impacted.
If the market value of our land inventory decreases, our results of operations could be adversely affected by impairments and write-downs.
The market value of our land and housing inventories depends on market conditions. We acquire land for expansion into new markets and for replacement of land inventory and expansion within our current markets. There is an inherent risk that the value of the land owned or controlled by us may decline after purchase. The valuation of property is inherently subjective and based on the individual characteristics of each property. We may have acquired options on or bought and developed land at a cost we will not be able to recover fully or on which we cannot build and sell homes profitably. In addition, our deposits for lots controlled under option or similar contracts may be put at risk. Factors such as changes in regulatory requirements and applicable laws (including in relation to building regulations, taxation and planning), political conditions, the condition of
21
financial markets, both local and national economic conditions, the financial condition of customers, potentially adverse tax consequences, and interest and inflation rate fluctuations subject valuations to uncertainty. Moreover, all valuations are made on the basis of assumptions that may not prove to reflect economic or demographic reality. If housing demand decreases below what we anticipated when we acquired our inventory, our results of operations and financial conditions may be adversely affected and we may not be able to recover our costs when we sell and build houses. We regularly review the value of our land holdings and continue to review our holdings on a periodic basis. Material write-downs and impairments in the value of our inventory may be required, and we may in the future sell land or homes at a loss, which could adversely affect our results of operations and financial condition.
Any limitation on, or reduction or elimination of, tax benefits associated with owning a home would decrease the demand for our home products and land, which could be material to our business.
Changes in federal income tax laws may affect the demand for new homes and land suitable for residential development. Current tax laws generally permit significant expenses associated with owning a home, primarily mortgage interest expense and real estate taxes, to be deducted for the purpose of calculating an individual’s federal, and in many cases, state, taxable income. Various proposals have been publicly discussed to limit mortgage interest deductions and to limit the exclusion of gains from the sale of a principal residence. For instance, under the American Taxpayer Relief Act of 2012, which was signed into law in January 2013, the federal government enacted higher income tax rates and limits on the value of tax deductions for certain high-income individuals and households. If the federal government or a state government changes or further changes its income tax laws, as some lawmakers have proposed, by eliminating, limiting or substantially reducing these income tax benefits without offsetting provisions, the after-tax cost of owning a new home would increase for many of our potential customers. Enactment of any such proposal may have an adverse effect on the homebuilding industry in general, as the loss or reduction of homeowner tax deductions could decrease the demand for new homes.
Difficulty in obtaining sufficient capital could prevent us from acquiring land for our developments or increase costs and delays in the completion of our development projects.
The homebuilding and land development industry is capital-intensive and requires significant up-front expenditures to acquire land parcels and begin development. If internally generated funds are not sufficient, we may seek additional capital in the form of equity or debt financing from a variety of potential sources, including additional bank financings or securities offerings. The availability of borrowed funds, especially for land acquisition and construction financing, may be greatly reduced nationally, and the lending community may require increased amounts of equity to be invested in a project by borrowers in connection with both new loans and the extension of existing loans. The credit and capital markets have recently experienced significant volatility. If we are required to seek additional financing to fund our operations, continued volatility in these markets may restrict our flexibility to access such financing. If we are not successful in obtaining sufficient capital to fund our planned capital and other expenditures, we may be unable to acquire land for our housing developments or to develop housing. Additionally, if we cannot obtain additional financing to fund the purchase of land under our option contracts or purchase contracts, we may incur contractual penalties and fees. Any difficulty in obtaining sufficient capital for planned development expenditures could also cause project delays, which could increase our costs. Any one or more of the foregoing events could have a material adverse effect on our business, prospects, liquidity, financial condition and results of operations.
We face potentially substantial risk with respect to our land and lot inventory.
We intend to acquire land parcels for replacement and expansion of land inventory within our current and any new markets. The risks inherent in purchasing and developing land parcels increase as consumer demand for housing decreases. As a result, we may buy and develop land parcels on which homes cannot be profitably built and sold. The market value of land parcels, building lots and housing inventories can fluctuate significantly as a result of changing market conditions, and the measures we employ to manage inventory risk may not be adequate to insulate our operations from a severe drop in inventory values. When market conditions drive land values down, option agreements we have previously entered into may become less desirable, at which time we may elect to forego deposits and pre-acquisition costs and terminate the agreements. Land parcels, building lots and housing inventories are illiquid assets, and we may not be able to dispose of them efficiently or at all if we are in financial distress. In addition, inventory carrying costs can be significant and can result in losses in a poorly performing project or market. In the event of significant changes in economic or market conditions, we may have to sell homes at significantly lower margins or at a loss, if we are able to sell them at all.
Adverse weather and geological conditions may increase costs, cause project delays and reduce consumer demand for housing, all of which could materially and adversely affect us.
As a homebuilder and land developer, we are subject to the risks associated with numerous weather-related and geologic events, many of which are beyond our control. These weather-related and geologic events include but are not limited to
22
droughts, floods, wildfires, landslides, soil subsidence and earthquakes. The occurrence of any of these events could damage our land parcels and projects, cause delays in the completion of our projects, reduce consumer demand for housing and cause shortages and price increases in labor or raw materials, any of which could harm our sales and profitability. Our California markets are in areas which have historically experienced significant earthquake activity and seasonal wildfires. In addition to directly damaging our land or projects, earthquakes, wildfires or other geologic events could damage roads and highways providing access to those projects, thereby adversely affecting our ability to market homes in those areas and possibly increasing the costs of completion.
There are some risks of loss for which we may be unable to purchase insurance coverage. For example, losses associated with landslides, earthquakes and other geologic events may not be insurable, and other losses, such as those arising from terrorism, may not be economically insurable. A sizeable uninsured loss could materially and adversely affect our business, prospects, liquidity, financial condition and results of operations.
Our business and results of operations depend on the availability and skill of trade partners.
Substantially all of our construction work is done by third-party trade partners with us acting as the general contractor. Accordingly, the timing and quality of our construction depend on the availability and skill of our trade partners. We do not have long-term contractual commitments with any trade partners, and there can be no assurance that skilled subcontractors will continue to be available at reasonable rates and in the areas in which we conduct our operations. Certain of the trade partners engaged by us are represented by labor unions or are subject to collective bargaining arrangements that require the payment of prevailing wages that are higher than normally expected on a residential construction site. A strike or other work stoppage involving any of our subcontractors could also make it difficult for us to retain subcontractors for our construction work. In addition, union activity could result in higher costs to retain our subcontractors. The inability to contract with skilled trade partners at reasonable costs on a timely basis could have a material adverse effect on our business, prospects, liquidity, financial condition and results of operations.
In addition, despite our quality control efforts, we may discover that our trade partners were engaging in improper construction practices or installing defective materials in our homes. When we discover these issues, we, generally through our trade partners, repair the homes in accordance with our new home warranty and as required by law. We reserve 1% of the sales price of each home we sell to satisfy warranty and other legal obligations to our homebuyers. These reserves are established based on market practices, our historical experiences and our judgment of the qualitative risks associated with the types of homes built. However, the cost of satisfying our warranty and other legal obligations in these instances may be significantly higher than our reserves, and we may be unable to recover the cost of repair from such trade partners. Regardless of the steps we take, we can in some instances be subject to fines or other penalties, and our reputation may be adversely affected.
Labor and raw material shortages and price fluctuations could delay or increase the cost of home construction, which could materially and adversely affect us.
The residential construction industry experiences serious labor and raw material shortages from time to time, including shortages in qualified tradespeople, and supplies of insulation, drywall, cement, steel and lumber. These labor and raw material shortages can be more severe during periods of strong demand for housing or during periods where the regions in which we operate experience natural disasters that have a significant impact on existing residential and commercial structures. The cost of labor and raw materials may also increase during periods of shortage or high inflation. During the recent economic downturn, a large number of qualified trade partners went out of business or otherwise exited the market. A reduction in available trade partners will likely exacerbate labor shortages when demand for new housing increases. Shortages and price increases could cause delays in and increase our costs of home construction, which in turn could have a material adverse effect on our business, prospects, liquidity, financial condition and results of operations.
New and existing laws and regulations or other governmental actions may increase our expenses, limit the number of homes that we can build or delay the completion of our projects.
We are subject to numerous local, state, federal and other statutes, ordinances, rules and regulations concerning zoning, development, building design, construction and similar matters which impose restrictive zoning and density requirements, which can limit the number of homes that can be built within the boundaries of a particular area. Projects that are not entitled may be subjected to periodic delays, changes in use, less intensive development or elimination of development in certain specific areas due to government regulations. We may also be subject to periodic delays or may be precluded entirely from developing in certain communities due to building moratoriums or “slow-growth” or “no-growth” initiatives that could be implemented in the future. Local governments also have broad discretion regarding the imposition of development fees and exactions for projects in their jurisdiction. Projects for which we have received land use and development entitlements or approvals may still require a variety of other governmental approvals and permits during the development process and can also
23
be impacted adversely by unforeseen health, safety and welfare issues, which can further delay these projects or prevent their development. As a result, home sales could decline and costs could increase, which could have a material adverse effect on our business, prospects, liquidity, financial condition and results of operations.
Our current and future joint venture investments could be adversely affected by a lack of sole decision-making authority and reliance on the financial condition and liquidity of our joint venture partners.
We own interests in projects through 13 joint ventures, 12 of which are unconsolidated. As of December 31, 2014, we had investments in our unconsolidated joint ventures of $60.6 million. We may enter into additional joint ventures in the future, thereby reducing the amount of capital required by us to make investments and diversifying our capital sources for growth. Such joint venture investments involve risks not otherwise present in wholly owned projects, including the following:
• | we do not have exclusive control over the development, financing, management and other aspects of the project or joint venture, which may prevent us from taking actions that are in our best interest but opposed by our partners; |
• | joint venture agreements often restrict the transfer of a partner’s interest or may otherwise restrict our ability to sell the interest when we desire or on advantageous terms; |
• | our existing joint venture agreements contain, and any future joint venture agreements may contain, buy-sell provisions pursuant to which one partner may initiate procedures requiring the other partner to choose between buying the other partner’s interest or selling its interest to that partner; we may not have the capital to purchase our joint venture parties’ interest under these circumstances even if we believe it would be beneficial to do so; |
• | we cannot exercise sole decision-making authority regarding the project or joint venture, which could create the potential risk of creating impasses on decisions, such as acquisitions or sales; |
• | a partner may, at any time, have economic or business interests or goals that are, or that may become, inconsistent with our business interests or goals; |
• | a partner may fail to fund its share of required capital contributions or may become bankrupt, which generally would cause us and any other remaining partners to remain liable for the joint venture’s liabilities; |
• | our relationships with our partners are contractual in nature and may be terminated or dissolved under the terms of the applicable joint venture agreements, and, in such event, we may not continue to own or operate the interests or assets underlying such relationship or may need to purchase such interests or assets at a premium to the market price to continue ownership; |
• | disputes between us and our partners may result in litigation or arbitration that would increase our expenses and prevent our officers and directors from focusing their time and efforts on our business and could result in subjecting the projects owned by the joint venture to additional risk; or |
• | we may be liable for joint venture obligations where the joint venture is a partnership and we serve as a general partner. |
Any of the above might subject a project to liabilities in excess of those contemplated and adversely affect the value of our current and future joint venture investments.
We may be unable to obtain suitable bonding for the development of our housing projects.
We are often required to provide bonds to governmental authorities and others to ensure the completion of our projects. As a result of market conditions, surety providers have been reluctant to issue new bonds and some providers are requesting credit enhancements (such as cash deposits or letters of credit) in order to maintain existing bonds or to issue new bonds. If we are unable to obtain required bonds in the future for our projects, or if we are required to provide credit enhancements with respect to our current or future bonds, our business, prospects, liquidity, financial condition and results of operations could be materially and adversely affected.
We are subject to environmental laws and regulations, which may increase our costs, limit the areas in which we can build homes and delay completion of our projects.
We are subject to a variety of local, state, federal and other statutes, ordinances, rules and regulations concerning the environment. The particular environmental laws which apply to any given property vary according to multiple factors, including the property’s location, its environmental conditions, the present and former uses of the property, the presence or absence of endangered plants or animals or sensitive habitats, as well as conditions at nearby properties. Environmental laws and conditions may result in delays, may cause us to incur substantial compliance and other costs and can prohibit or severely restrict development and homebuilding activity in environmentally sensitive regions or areas. In addition, in those cases where an endangered or threatened species is involved and agency rulemaking and litigation are ongoing, the outcome of such rulemaking and litigation can be unpredictable, and at any time can result in unplanned or unforeseeable restrictions on or even
24
the prohibition of development in identified environmentally sensitive areas. From time to time, the United States Environmental Protection Agency, or the EPA, and similar federal, state or local agencies review land developers’ and homebuilders’ compliance with environmental laws and may levy fines and penalties for failure to strictly comply with applicable environmental laws, including those applicable to control or storm water discharges during construction, or impose additional requirements for future compliance as a result of past failures. Any such actions taken with respect to us may increase our costs and result in project delays. We expect that increasingly stringent requirements will be imposed on land developers and homebuilders in the future. Environmental regulations can also have an adverse impact on the availability and price of certain raw materials such as lumber, and on other building materials.
California is especially susceptible to restrictive government regulations and environmental laws. For example, California imposes notification obligations respecting environmental conditions, sometimes recorded on deeds, and also those required to be delivered to persons accessing property or to home buyers or renters, which may cause some persons, or their financing sources, to view the subject parcels as less valuable or as impaired. California has also enacted so-called “climate change” legislation, which could result in additional costs to achieve energy use or energy efficiency mandates, alter community layouts, meet “green building” standards and impose carbon or other greenhouse gas reductions or offset obligations, and could result in other costs or obligations as well.
Under various environmental laws, current or former owners of real estate, as well as certain other categories of parties, may be required to investigate and clean up hazardous or toxic substances or petroleum product releases, and may be held liable to a governmental entity or to third parties for related damages, including for bodily injury, and for investigation and clean-up costs incurred by such parties in connection with the contamination. A mitigation system may be installed during the construction of a home if a cleanup does not remove all contaminants of concern or to address a naturally occurring condition such as methane. Some buyers may not want to purchase a home with a mitigation system.
Ownership, leasing or occupation of land and the use of hazardous materials carries potential environmental risks and liabilities.
We are subject to a variety of local, state and federal statutes, rules and regulations concerning land use and the protection of health and the environment, including those governing discharge of pollutants to soil, water and air, including asbestos, the handling of hazardous materials and the cleanup of contaminated sites. We may be liable for the costs of removal, investigation or remediation of man-made or natural hazardous or toxic substances located on, under or in a property currently or formerly owned, leased or occupied by us, whether or not we caused or knew of the pollution. The costs of any required removal, investigation or remediation of such substances or the costs of defending against environmental claims may be substantial. The presence of such substances, or the failure to remediate such substances adequately, may also adversely affect our ability to sell the land or to borrow using the land as security. Environmental impacts from historical activities have been identified at some of the projects we have developed in the past and additional projects are located on land that was contaminated by previous use.
The particular impact and requirements of environmental laws that apply to any given community vary greatly according to the community site, the site’s environmental conditions and the present and former uses of the site. We expect that increasingly stringent requirements may be imposed on land developers and homebuilders in the future. Environmental laws may result in delays, cause us to implement time consuming and expensive compliance programs and prohibit or severely restrict development in certain environmentally sensitive regions or areas, such as wetlands. We also may not identify all of these concerns during any pre-acquisition or pre-development review of project sites, and concerns could arise due to post-acquisition changes in laws or agency policies, or the interpretation thereof. Furthermore, we could incur substantial costs, including cleanup costs, fines, penalties and other sanctions and damages from third-party claims for property damage or personal injury, as a result of our failure to comply with, or liabilities under, applicable environmental laws and regulations. In addition, under environmental laws and regulations, third parties, such as environmental groups or neighborhood associations, may challenge the permits and other approvals required for our projects and operations. These matters could adversely affect our business, prospects, liquidity, financial condition and results of operations.
We may be liable for claims for damages as a result of use of hazardous materials.
As a land development and homebuilding business with a wide variety of historic ownership, development, homebuilding and construction activities, we could be liable for future claims for damages as a result of the past or present use of hazardous materials, including building materials or fixtures known or suspected to be hazardous or to contain hazardous materials or due to use of building materials or fixtures which are associated with elevated mold. Many of the agreements pursuant to which we purchase land for development provide that we purchase the land “as is” and that the seller of the land makes no representation as to the existence of any environmental contaminants. Accordingly, we have to rely on our own investigation as to the existence of environmental contaminants, and we may not be able to identify all pre-existing environmental contaminants at the
25
time we purchase the land. Any such claims may adversely affect our business, prospects, liquidity, financial condition and results of operations. Insurance coverage for such claims may be limited or non-existent.
We may become subject to litigation, which could materially and adversely affect us.
In the future we may become subject to litigation, including claims relating to our operations, joint ventures, securities offerings and otherwise in the ordinary course of business or otherwise. Some of these claims may result in significant defense costs and potentially significant judgments against us, some of which are not, or cannot be, insured against. We generally intend to vigorously defend ourselves. However, we cannot be certain of the ultimate outcomes of any claims that may arise in the future. Resolution of these types of matters against us may result in our having to pay significant fines, judgments or settlements, which, if uninsured, or if the fines, judgments and settlements exceed insured levels, could adversely impact our earnings and cash flows, thereby materially and adversely affecting us. Certain litigation or the resolution of certain litigation may affect the availability or cost of some of our insurance coverage, which could materially and adversely impact us, expose us to increased risks that would be uninsured, and materially and adversely impact our ability to attract directors and officers. Furthermore, any litigation, regardless of its outcome, can divert the attention of our management from operating our core business and can harm our reputation, each of which could harm our business.
We may suffer uninsured losses or material losses in excess of insurance limits, and increased insurance costs and reduced insurance coverage may affect our results of operations and increase our potential exposure to liability.
Material losses or liabilities in excess of insurance proceeds may occur in the future. We could suffer physical damage to property and liabilities resulting in losses that may not be fully recoverable by insurance. In addition, certain types of risks, such as personal injury claims, may be, or may become in the future, either uninsurable or not economically insurable, or may not be currently or in the future covered by our insurance policies. In addition, the costs of insuring against construction defect, product liability and director and officer claims are substantial, and the cost of insurance for our operations may rise, deductibles and retentions may increase and the availability of insurance may diminish. Should an uninsured loss or a loss in excess of insured limits occur, we could sustain financial loss or lose capital invested in the affected property as well as anticipated future income from that property. Significant increases in the cost of insurance coverage could also have a material adverse effect on our results of operations and financial condition. In addition, we could be liable to repair damage or meet liabilities caused by uninsured risks.
We may not be able to compete effectively against competitors in the homebuilding industry.
We operate in a very competitive environment which is characterized by competition from a number of other homebuilders in each market in which we operate. Additionally, there are relatively low barriers to entry into our business. We compete with numerous large national and regional homebuilding companies and with smaller local homebuilders and land developers for, among other things, home buyers, desirable land parcels, financing, raw materials and skilled management and labor resources. Our competitors may independently develop land and construct homes that are superior or substantially similar to our products. Increased competition could hurt our business, as it could prevent us from acquiring attractive land parcels on which to build homes or make such acquisitions more expensive, hinder our market share expansion and cause us to increase our selling incentives and reduce our prices. An oversupply of homes available for sale and the heavy discounting of home prices by some of our competitors have adversely affected demand for homes in the market as a whole and could do so again in the future. We also compete with the resale, or “previously owned,” home market which has increased significantly due to the large number of homes that have been foreclosed on or could be foreclosed on due to the recent economic downturn. If we are unable to compete effectively in our markets, our business could decline disproportionately to our competitors, and our results of operations and financial condition could be adversely affected.
We may be at a competitive disadvantage with regard to certain of our large national and regional homebuilding competitors whose operations are more geographically diversified than ours, as these competitors may be better able to withstand any future regional downturn in the housing market. We compete directly with a number of large national and regional homebuilders that may have longer operating histories and greater financial and operational resources than we do. Many of these competitors also have longstanding relationships with subcontractors and suppliers in the markets in which we operate. This may give our competitors an advantage in securing materials and labor at lower prices, marketing their products and allowing their homes to be delivered to customers more quickly and at more favorable prices. This competition could reduce our market share and limit our ability to expand our business as we have planned.
If we are unable to develop our communities successfully or within expected timeframes, our results of operations could be adversely affected.
Before a community generates any revenue, time and material expenditures are required to acquire land, obtain development approvals and construct significant portions of project infrastructure, amenities, model homes and sales facilities.
26
It can take several years from the time we acquire control of a property to the time we make our first home sale on the site. Delays in the development of communities expose us to the risk of changes in market conditions for homes. A decline in our ability to develop and market our communities successfully and to generate positive cash flow from these operations in a timely manner could have a material adverse effect on our business and results of operations and on our ability to service our debt and to meet our working capital requirements.
Increases in our cancellation rate could have a negative impact on our home sales revenue and homebuilding margins.
The cancellation rate of buyers for our owned projects who contracted to buy a home but did not close escrow (as a percentage of overall orders), excluding our unconsolidated joint ventures, was approximately 13%, 20% and 16%, respectively, for the years ended December 31, 2014, 2013 and 2012, respectively. Our cancellation rate for our unconsolidated joint venture projects was 9%, 7% and 5% for the years ended December 31, 2014, 2013 and 2012, respectively. Home order cancellations negatively impact the number of closed homes, net new home orders, home sales revenue and results of operations, as well as the number of homes in backlog. Home order cancellations can result from a number of factors, including declines or slow appreciation in the market value of homes, increases in the supply of homes available to be purchased, increased competition, higher mortgage interest rates, homebuyers’ inability to sell their existing homes, homebuyers’ inability to obtain suitable financing, including providing sufficient down payments, other changes in homebuyers' financial condition, changes in homeowner preferences, and adverse changes in economic conditions. Upon a home order cancellation, the homebuyer’s escrow deposit is returned to the homebuyer (other than with respect to certain design-related deposits, which we retain). An increase in the level of our home order cancellations could have a negative impact on our business, prospects, liquidity, financial condition and results of operations.
We are subject to product liability and warranty claims arising in the ordinary course of business.
As a homebuilder, we are subject to construction defect, product liability and home warranty claims, including moisture intrusion and related claims, arising in the ordinary course of business or otherwise. While we maintain general liability insurance and generally seek to require our subcontractors and design professionals to indemnify us for some portion of the liabilities arising from their work, there can be no assurance that these insurance rights and indemnities will be collectible or adequate to cover any or all construction defect and warranty claims for which we may be liable. For example, contractual indemnities can be difficult to enforce, we are often responsible for applicable self-insured retentions (particularly in markets where we include our subcontractors on our general liability insurance and our ability to seek indemnity for insured claims is significantly limited), certain claims may not be covered by insurance or may exceed applicable coverage limits, and one or more of our insurance carriers could become insolvent. Further, in the United States, and California in particular, the coverage offered and the availability of general liability insurance for construction defects is currently limited and is costly. As a result, an increasing number of our subcontractors may be unable to obtain insurance, particularly in California where we have instituted an “owner controlled insurance program,” under which subcontractors are effectively insured by us. If we cannot effectively recover construction defect liabilities and defense costs from our subcontractors or their insurers, or if we are self-insured, we may suffer losses. Coverage may be further restricted and become even more costly. Such circumstances could adversely affect our business, prospects, liquidity, financial condition and results of operations.
In addition, we conduct all of our business in California, one of the most highly regulated and litigious jurisdictions in the United States, which imposes a ten year, strict liability tail on many construction liability claims. As a result, our potential losses and expenses due to litigation, new laws and regulations may be greater than those of our competitors who have smaller California operations.
We have historically incurred annual losses and may have difficulty maintaining profitability in the future.
Although we achieved profitable operations in 2014 and 2013, we generated net losses of $1.4 million in 2012 and $2.3 million in 2011. We may not be able to sustain or increase profitability on an annual basis going forward. If our revenue grows more slowly than we anticipate, or if our operating expenses exceed our expectations and cannot be adjusted accordingly, our business will be harmed. As a result, the price of our shares of common stock may decline, and you may lose a portion or all of your investment.
27
Our operating performance is subject to risks associated with the real estate industry.
Real estate investments are subject to various risks, fluctuations and cycles in value and demand, many of which are beyond our control. Certain events may decrease cash available for operations, as well as the value of our real estate assets. These events include, but are not limited to:
• | adverse changes in international, national or local economic and demographic conditions; |
• | adverse changes in financial conditions of buyers and sellers of properties, particularly residential homes and land suitable for development of residential homes; |
• | adverse changes in buyer preferences; |
• | competition from other real estate investors with significant capital, including other real estate operating companies and developers and institutional investment funds; |
• | reductions in the level of demand for and increases in the supply of land suitable for development; |
• | fluctuations in interest rates, which could adversely affect our ability, or the ability of homebuyers, to obtain financing on favorable terms or at all; |
• | unanticipated increases in expenses, including, without limitation, insurance costs, development costs, real estate assessments and other taxes and costs of compliance with laws, regulations and governmental policies; and |
• | changes in enforcement of laws, regulations and governmental policies, including, without limitation, health, safety, environmental, zoning and tax laws, governmental fiscal policies and the Americans with Disabilities Act of 1990. |
In addition, periods of economic slowdown or recession, rising interest rates or declining demand for real estate, or the public perception that any of these events may occur, could result in a general decline in the purchase of homes or an increased incidence of home order cancellations. If we cannot successfully implement our business strategy, our business, prospects, liquidity, financial condition and results of operations will be adversely affected.
Because real estate investments are relatively illiquid, our ability to promptly sell one or more properties for reasonable prices in response to changing economic, financial and investment conditions may be limited and we may be forced to hold non-income producing properties for extended periods of time.
Real estate investments are relatively difficult to sell quickly. As a result, our ability to promptly sell one or more properties in response to changing economic, financial and investment conditions is limited and we may be forced to hold non-income producing assets for an extended period of time. We cannot predict whether we will be able to sell any property for the price or on the terms that we set or whether any price or other terms offered by a prospective purchaser would be acceptable to us. We also cannot predict the length of time needed to find a willing purchaser and to close the sale of a property.
Fluctuations in real estate values may require us to write-down the book value of our real estate assets.
The homebuilding and land development industries are subject to significant variability and fluctuations in real estate values. As a result, we may be required to write-down the book value of our real estate assets in accordance with U.S. generally accepted accounting principles, or GAAP, and some of those write-downs could be material. Any material write-downs of assets could have a material adverse effect on our business, prospects, liquidity, financial condition and results of operations.
Inflation could adversely affect our business and financial results.
Inflation could adversely affect us by increasing the costs of land, raw materials and labor needed to operate our business. If our markets have an oversupply of homes relative to demand, we may be unable to offset any such increases in costs with corresponding higher sales prices for our homes. Inflation typically also accompanies higher interests rates, which could adversely impact potential customers’ ability to obtain financing on favorable terms, thereby further decreasing demand. If we are unable to raise the prices of our homes to offset the increasing costs of our operations, our margins could decrease. Furthermore, if we need to lower the price of our homes to meet demand, the value of our land inventory may decrease. Inflation may also raise our costs of capital and decrease our purchasing power, making it more difficult to maintain sufficient funds to operate our business.
A major health and safety incident relating to our business could be costly in terms of potential liabilities and reputational damage.
Building sites are inherently dangerous, and operating in the homebuilding industry poses certain inherent health and safety risks. Due to health and safety regulatory requirements and the number of projects we work on, health and safety performance is critical to the success of all areas of our business. Any failure in health and safety performance may result in penalties for non-compliance with relevant regulatory requirements or litigation, and a failure that results in a major or
28
significant health and safety incident is likely to be costly in terms of potential liabilities incurred as a result. Such a failure could generate significant negative publicity and have a corresponding impact on our reputation, our relationships with relevant regulatory agencies, governmental authorities and local communities, and our ability to win new business, which in turn could have a material adverse effect on our business, prospects, liquidity, financial condition and results of operations.
Acts of war or terrorism may seriously harm our business.
Acts of war, any outbreak or escalation of hostilities between the United States and any foreign power or acts of terrorism may cause disruption to the U.S. economy, or the local economies of the markets in which we operate, cause shortages of building materials, increase costs associated with obtaining building materials, result in building code changes that could increase costs of construction, affect job growth and consumer confidence, or cause economic changes that we cannot anticipate. Each of these events could reduce demand for our homes and adversely impact our business, prospects, liquidity, financial condition and results of operations.
An information systems interruption or breach in security could adversely affect us.
We rely on accounting, financial and operational management information systems to conduct our operations. Any disruption in these systems could adversely affect our ability to conduct our business. Furthermore, any security breach of information systems or data could result in a violation of applicable privacy and other laws, significant legal and financial exposure, damage to our reputation and a loss of confidence in our security measures, which could harm our business.
Poor relations with the residents of our communities could negatively impact sales, which could cause our revenues or results of operations to decline.
Residents of communities we develop rely on us to resolve issues or disputes that may arise in connection with the operation or development of their communities. Efforts made by us to resolve these issues or disputes could be deemed unsatisfactory by the affected residents, and subsequent actions by these residents could adversely affect sales or our reputation. In addition, we could be required to make material expenditures related to the settlement of such issues or disputes or to modify our community development plans, which could adversely affect our results of operations.
We may incur a variety of costs to engage in future growth or expansion of our operations or acquisitions or disposals of businesses, and the anticipated benefits may never be realized.
As a part of our business strategy, we may make acquisitions, or significant investments in or disposals of businesses. We may also expand our operations to new markets. Any future acquisitions, investments, disposals or entry into a new market would be accompanied by risks such as:
• | difficulties in assimilating the operations and personnel of acquired companies or businesses; |
• | potential loss of key employees of the acquired companies or business; |
• | diversion of our management’s attention from ongoing business concerns; |
• | our potential inability to maximize our financial and strategic position through the successful incorporation or disposition of operations; |
• | difficulty in maintaining of uniform standards, controls, procedures and policies; |
• | impairment of existing relationships with employees, contractors, suppliers and customers as a result of the integration of new management personnel and cost-saving initiatives; and |
• | risks associated with entering markets in which we have limited or no direct experience. |
The magnitude, timing and nature of any future acquisition or expansion will depend on a number of factors, including our ability to identify suitable additional markets or acquisition candidates. We cannot guarantee that we will be able to successfully integrate any company or business that we might acquire in the future, or that any expansion into a new market will be successfully executed, and our failure to do so could harm our current business.
In addition, we may not realize the anticipated benefits of these transactions or expansions, and there may be other unanticipated or unidentified effects. While we would seek protection, for example, through warranties and indemnities in the case of acquisitions, significant liabilities may not be identified in due diligence or may come to light after the expiry of warranty or indemnity periods. Additionally, while we would seek to limit our ongoing exposure, for example, through liability caps and period limits on warranties and indemnities in the case of disposals, some warranties and indemnities may give rise to unexpected and significant liabilities. Any claims arising in the future may adversely affect our business, prospects, liquidity, financial condition and results of operations and could lead to a decline in the price of our common stock.
29
Utility shortages or price increases could adversely impact our operations.
Certain of the areas in which we operate, particularly in Southern and Northern California, have experienced power shortages, including mandatory periods without electrical power, as well as significant increases in utility costs. We may incur additional costs and may not be able to complete construction on a timely basis if such power shortages and utility rate increases continue. In addition, power shortages and rate increases may adversely affect the local economies in which we operate, which may reduce demand for housing in our markets.
We are an early-stage company and will rely on significant growth to achieve and sustain profitability. Our business strategy will fail if we are unable to manage our expected growth.
We began operations in the third quarter of 2009, and we sold our first home in 2010. Through December 31, 2014, we have delivered 1,256 homes (including 465 and 546 through our unconsolidated joint venture and fee building projects, respectively), and, subsequent to our IPO, have begun to significantly expand our operations. Our business plan requires us to continue to expand our operations. This expansion has placed, and is expected to continue to place, a significant demand on our management, operational and financial resources. In order to manage our continued growth, we may be required to raise additional capital, improve existing and implement new operational and financial systems, procedures and controls and expand, train and manage a growing employee base. Our current and planned personnel, systems, procedures and controls may not be adequate, and we may be unable to obtain the necessary capital, to support our anticipated growth. If we are unable to manage our growth effectively, our financial position and results of operations may be adversely affected.
Risks Related to Our Indebtedness
We expect to use leverage in executing our business strategy, which may adversely affect the return on our assets.
We expect to employ prudent levels of leverage to finance the acquisition and development of our lots and construction of our homes. Our existing indebtedness is both recourse and non-recourse to us, and we anticipate that future indebtedness will be likewise. As of December 31, 2014, we had approximately $144.0 million in loan commitments, of which $113.8 million was outstanding. We will consider a number of factors when evaluating our level of indebtedness and when making decisions regarding the incurrence of new indebtedness, including the purchase price of assets to be acquired with debt financing, the estimated market value of our assets and the ability of particular assets, and our company as a whole, to generate cash flow to cover the expected debt service costs. As a means of sustaining our long-term financial health and limiting our exposure to unforeseen dislocations in the debt and financing markets, we currently expect to remain conservatively capitalized. However, our board of directors may change our target debt levels at any time without the approval of our stockholders.
Incurring substantial debt could subject us to many risks that, if realized, would adversely affect us, including the risk that:
• | our cash flow from operations may be insufficient to make required payments of principal of and interest on the debt, which is likely to result in acceleration of the maturity of such debt; |
• | our debt may increase our vulnerability to adverse economic and industry conditions with no assurance that investment yields will increase with higher financing costs; |
• | we may be required to dedicate a portion of our cash flow from operations to payments on our debt, thereby reducing funds available for operations and capital expenditures, future investment opportunities or other purposes; and |
• | the terms of any refinancing may not be as favorable as the terms of the debt being refinanced. |
If we do not have sufficient funds to repay our debt at maturity, it may be necessary to refinance the debt through additional debt or additional equity financings. If, at the time of any refinancing, prevailing interest rates or other factors result in higher interest rates on refinancings, increases in interest expense could adversely affect our cash flows and results of operations. If we are unable to refinance our debt on acceptable terms, we may be forced to dispose of our assets on disadvantageous terms, potentially resulting in losses. To the extent we cannot meet any future debt service obligations, we may lose some or all of our assets that may be pledged to secure our obligations to foreclosure. Also, debt agreements may contain specific cross-default provisions with respect to specified other indebtedness, giving the lenders the right to declare a default if we are in default under other loans in some circumstances. Defaults under our debt agreements could have a material adverse effect on our business, prospects, liquidity, financial condition and results of operations.
30
Access to financing sources may not be available on favorable terms, or at all, especially in light of current market conditions, which could adversely affect our ability to increase our returns.
Our growth strategy requires significant additional capital. Our access to additional third-party sources of financing will depend, in part, on:
• | general market conditions; |
• | the market’s perception of our growth potential; |
• | with respect to acquisition or development financing, the market’s perception of the value of the land parcels to be acquired or developed; |
• | our debt levels; |
• | any credit rating assigned to us or our existing debt by a rating agency or any indication that those ratings may be lowered; |
• | our expected results of operations; |
• | our cash flow; and |
• | the market price of our common stock. |
Recently, domestic financial markets have experienced unusual volatility, uncertainty and a tightening of liquidity in both the investment grade debt and equity capital markets. Credit spreads for major sources of capital widened significantly during the U.S. credit crisis as investors demanded a higher risk premium. Given the current volatility and weakness in the capital and credit markets, potential lenders may be unwilling or unable to provide us with financing that is attractive to us or may charge us prohibitively high fees in order to obtain financing. Consequently, there is greater uncertainty regarding our ability to access the credit market in order to attract financing on reasonable terms. Investment returns on our assets and our ability to make acquisitions could be adversely affected by our inability to secure additional financing on reasonable terms, if at all.
Depending on market conditions at the relevant time, we may have to rely more heavily on additional equity financings or on less efficient forms of debt financing that require a larger portion of our cash flow from operations, thereby reducing funds available for our operations, future business opportunities and other purposes. We may not have access to such equity or debt capital on favorable terms at the desired times, or at all.
Our current financing arrangements contain, and our future financing arrangements likely will contain, restrictive covenants relating to our operations.
Our current financing arrangements contain, and the financing arrangements we enter into in the future likely will contain, covenants (financial and otherwise) affecting our ability to incur additional debt, make certain investments, reduce liquidity below certain levels, make distributions to our stockholders and otherwise affect our operating policies. If we fail to meet or satisfy any of these covenants in our debt agreements, we would be in default under these agreements, which could result in a cross-default under other debt agreements, and our lenders could elect to declare outstanding amounts due and payable, terminate their commitments, require the posting of additional collateral and enforce their respective interests against existing collateral. A default also could limit significantly our financing alternatives, which could cause us to curtail our investment activities or dispose of assets when we otherwise would not choose to do so. A default on any of our debt agreements could materially and adversely affect our business, prospects, liquidity, financial condition and results of operations.
Secured indebtedness exposes us to the possibility of foreclosure on our ownership interests in our land parcels.
Incurring mortgage and other secured indebtedness increases our risk of loss of our ownership interests in our land parcels or other assets because defaults thereunder, and the inability to refinance such indebtedness, may result in foreclosure action initiated by lenders.
Interest expense on debt we incur may limit our cash available to fund our growth strategies.
As of December 31, 2014, we had approximately $144.0 million in loan commitments, of which $113.8 million was outstanding. As part of our financing strategy, we may incur a significant amount of additional debt. Our current debt has, and any additional debt we subsequently incur may have, a floating rate of interest. Higher interest rates could increase debt service requirements on our current floating rate debt and on any floating rate debt we subsequently incur, and could reduce funds available for operations, future business opportunities or other purposes. If we need to repay existing debt during periods of rising interest rates, we could be required to refinance our then-existing debt on unfavorable terms or liquidate one or more of our assets to repay such debt at times which may not permit realization of a favorable return on such assets and could result in a
31
loss. The occurrence of either such event or both could materially and adversely affect our business, prospects, liquidity, financial condition and results of operations.
Failure to hedge effectively against interest rate changes may adversely affect us.
We may obtain in the future one or more forms of interest rate protection—in the form of swap agreements, interest rate cap contracts or similar agreements—to hedge against the possible negative effects of interest rate fluctuations on our indebtedness that bears interest at floating rates. However, we cannot assure you that any hedging will adequately relieve the adverse effects of interest rate increases or that counterparties under these hedging agreements will honor their obligations thereunder. In addition, we may be subject to risks of default by hedging counterparties. Increased interest expenses on our floating rate indebtedness that we have not hedged will harm our financial position and results of operations.
Risks Related to Our Organization and Structure
We have a limited operating history and we may not be able to successfully operate our business.
Our company was founded in August 2009, and through the year ended December 31, 2012, we incurred losses. In association with our initial public offering, TNHC LLC was converted from a Delaware limited liability company into a Delaware corporation and renamed The New Home Company Inc. Given our limited operating history, you have limited historical information upon which to evaluate our prospects, including our ability to acquire desirable land parcels, develop such land and market our homes. In addition, we cannot assure you that our past experience will be sufficient to enable us to operate our business successfully or implement our operating policies and business strategies as described in this annual report on Form 10-K and in other public statements and filings made with the Securities and Exchange Commission. Furthermore, we may not be able to generate sufficient operating cash flows to pay our operating expenses or service our indebtedness. You should not rely upon the past performance of our management team, as past performance may not be indicative of our future results.
We depend on key personnel.
Our success depends to a significant degree upon the contributions of certain key personnel including, but not limited to, H. Lawrence Webb, our Chief Executive Officer, Wayne Stelmar, our Chief Financial Officer, Joseph Davis, our Chief Investment Officer, and Thomas Redwitz, our Chief Operating Officer, each of whom would be difficult to replace. Although we have entered into employment agreements with Messrs. Webb, Stelmar, Davis and Redwitz, there is no guarantee that these executives will remain employed with us and we have not adopted a succession plan. If any of our key personnel were to cease employment with us, our operating results could suffer. Our ability to retain our key personnel or to attract suitable replacements should any members of our management team leave depends on the competitive nature of the employment market. The loss of services from key personnel or a limitation in their availability could materially and adversely impact our business, prospects, liquidity, financial condition and results of operations. Further, such a loss could be negatively perceived in the capital markets. Although we are currently considering our coverages, we have not obtained key person life insurance that would provide us with proceeds in the event of death or disability of any of our key personnel.
Termination of the employment agreements with the members of our management team could be costly and prevent a change in control of our company.
The employment agreements we have entered into with H. Lawrence Webb, our Chief Executive Officer, Wayne Stelmar, our Chief Financial Officer, Joseph Davis, our Chief Investment Officer, and Thomas Redwitz, our Chief Operating Officer, each provide that if their employment with us terminates under certain circumstances, we may be required to pay them significant amounts of severance compensation, thereby making it costly to terminate their employment. Furthermore, these provisions could delay or prevent a transaction or a change in control of our company that might involve a premium paid for shares of our common stock or otherwise be in the best interests of our stockholders, which could adversely affect the market price of our common stock.
Failure by our directors, executives or employees to comply with applicable codes of conduct could materially and adversely affect us and the market price of our stock.
We have adopted a Code of Business Conduct and Ethics and a Code of Ethics for senior executives and financial officers. Our adoption of these codes and other standards of conduct is not a representation or warranty that all persons subject to those codes or standards are or will be in complete compliance. The failure of a director, executive or employee to comply with applicable codes or standards of conduct may result in termination of the relationship and/or adverse publicity, either of which could materially and adversely affect us and the market price of our stock.
32
Certain anti-takeover defenses and applicable law may limit the ability of a third-party to acquire control of us.
Our charter and bylaws and Delaware law contain provisions that may delay or prevent a transaction or a change in control of our company that might involve a premium paid for shares of our common stock or otherwise be in the best interests of our stockholders, which could adversely affect the market price of our common stock. Certain of these provisions are described below.
Selected provisions of our charter and bylaws.
Our charter and/or bylaws contain anti-takeover provisions that:
• | divide our directors into three classes, with the term of one class expiring each year, which could delay a change in our control; |
• | authorize our board of directors, without further action by the stockholders, to issue up to 50,000,000 shares of preferred stock in one or more series, and with respect to each series, to fix the number of shares constituting that series and establish the rights and other terms of that series; |
• | require that actions to be taken by our stockholders may be taken only at an annual or special meeting of our stockholders and not by written consent; |
• | specify that special meetings of our stockholders can be called only by our board of directors pursuant to a resolution adopted by a majority of the total number of directors then in office, the chairman of our board of directors or our chief executive officer; |
• | establish advance notice procedures for stockholders to submit nominations of candidates for election to our board of directors and other proposals to be brought before a stockholders meeting; |
• | provide that our bylaws may be amended by our board of directors without stockholder approval; |
• | allow our directors to establish the size of our board of directors by action of our board of directors, subject to a minimum of three members; |
• | provide that vacancies on our board of directors or newly created directorships resulting from an increase in the number of our directors may be filled only by a majority of directors then in office, even though less than a quorum; |
• | do not give the holders of our common stock cumulative voting rights with respect to the election of directors; and |
• | prohibit us from engaging in certain business combinations with any “interested stockholder” unless specified conditions are satisfied as described below under “—Selected provisions of Delaware law.” |
Selected provisions of Delaware law.
We have opted out of Section 203 of the Delaware General Corporation Law, or the DGCL, which regulates corporate takeovers. However, our charter contains provisions that are similar to Section 203 of the DGCL. Specifically, our charter provides that we may not engage in certain “business combinations” with any “interested stockholder” for a three-year period following the time that the person became an interested stockholder, unless:
• | prior to the time that person became an interested stockholder, our board of directors approved either the business combination or the transaction which resulted in the person becoming an interested stockholder; |
• | upon consummation of the transaction which resulted in the person becoming an interested stockholder, the interested stockholder owned at least 85% of the voting stock of the corporation outstanding at the time the transaction commenced, excluding certain shares; or |
• | at or subsequent to the time the person became an interested stockholder, the business combination is approved by our board of directors and by the affirmative vote of at least 66 2/3% of the outstanding voting stock which is not owned by the interested stockholder. |
Generally, a business combination includes a merger, consolidation, asset or stock sale or other transaction resulting in a financial benefit to the interested stockholder. Subject to certain exceptions, an interested stockholder is a person who, together with that person’s affiliates and associates, owns, or within the previous three years owned, 15% or more of our voting stock. This provision could prohibit or delay mergers or other takeover or change in control attempts with respect to us and, accordingly, may discourage attempts to acquire us.
We may change our operational policies, investment guidelines and our business and growth strategies without stockholder consent, which may subject us to different and more significant risks in the future.
Our board of directors will determine our operational policies, investment guidelines and our business and growth strategies. Our board of directors may make changes to, or approve transactions that deviate from, those policies, guidelines
33
and strategies without a vote of, or notice to, our stockholders. This could result in us conducting operational matters, making investments or pursuing different business or growth strategies than those contemplated in this annual report on Form 10-K. Under any of these circumstances, we may expose ourselves to different and more significant risks in the future, which could have a material adverse effect on our business, prospects, liquidity, financial condition and results of operations.
We are subject to taxation as a corporation.
Immediately prior to the completion of our initial public offering, we converted into a Delaware corporation. As a corporation, we are subject to taxation as a corporation under U.S. Federal and state income tax laws.
The obligations associated with being a public company require significant resources and management attention.
As an "emerging growth company" we are not required to maintain internal control over financial reporting in a manner that meets the standards required by Section 404(a) of the Sarbanes-Oxley Act. We anticipate that we will be required to meet these standards in the course of preparing our financial statements in the future. Additionally, once we are no longer an “emerging growth company,” our independent registered public accounting firm will be required to attest to the effectiveness of our internal control over financial reporting on an annual basis. The rules governing the standards that must be met for our management to assess our internal control over financial reporting are complex and require significant documentation, testing and possible remediation.
Internal control over financial reporting is a process designed to provide reasonable assurance regarding the reliability of financial reporting and the preparation of financial statements in accordance with accounting principles generally accepted in the United States, or GAAP. We are currently in the process of reviewing, documenting and testing our internal control over financial reporting, but we are not currently in compliance with, and we cannot be certain when we will be able to implement the requirements of Section 404(a).
We may encounter problems or delays in implementing any changes necessary to make a favorable assessment of our internal control over financial reporting. In addition, we may encounter problems or delays in completing the implementation of any necessary improvements and receiving an unqualified opinion on the effectiveness of the internal controls over financial reporting in connection with the attestation provided by our independent registered public accounting firm. If we cannot favorably assess the effectiveness of our internal control over financial reporting, or if our independent registered public accounting firm is unable to provide an unqualified attestation report on our internal controls, investors could lose confidence in our financial information and the price of our common stock could decline.
These reporting and other obligations will place significant demands on our management, administrative, operational and accounting resources and will cause us to incur significant expenses. We may need to upgrade our systems or create new systems, implement additional financial and management controls, reporting systems and procedures, create or outsource an internal audit function, and hire additional accounting and finance staff. If we are unable to accomplish these objectives in a timely and effective fashion, our ability to comply with the financial reporting requirements and other rules that apply to reporting companies could be impaired. Any failure to maintain effective internal control over financial reporting could have a material adverse effect on our business, prospects, liquidity, financial condition and results of operations.
If we fail to implement and maintain an effective system of internal controls, we may not be able to accurately determine our financial results or prevent fraud. As a result, our stockholders could lose confidence in our financial results, which could materially and adversely affect us.
Effective internal controls are necessary for us to provide reliable financial reports and effectively prevent fraud. In the future, we may discover areas of our internal controls that need improvement. We cannot be certain that we will be successful implementing or maintaining adequate internal control over our financial reporting and financial processes. Furthermore, as we grow our business, our internal controls will become more complex, and we will require significantly more resources to ensure our internal controls remain effective. Additionally, the existence of any material weakness or significant deficiency would require management to devote significant time and incur significant expense to remediate any such material weakness or significant deficiency, and management may not be able to remediate any such material weakness or significant deficiency in a timely manner. The existence of any material weakness or significant deficiency in our internal control over financial reporting could also result in errors in our financial statements that could require us to restate our financial statements, cause us to fail to meet our reporting obligations and cause stockholders to lose confidence in our reported financial information, all of which could materially and adversely affect us.
34
We are an “emerging growth company”, and, as a result of the reduced disclosure and governance requirements applicable to emerging growth companies, our common stock may be less attractive to investors.
We are an “emerging growth company,” as defined in the JOBS Act, and we are eligible to take advantage of certain exemptions from various reporting requirements applicable to other public companies but not to emerging growth companies, including, but not limited to, an exemption from the auditor attestation requirement of Section 404 of the Sarbanes-Oxley Act, reduced disclosure about executive compensation arrangements pursuant to the rules applicable to smaller reporting companies and no requirement to seek non-binding advisory votes on executive compensation or golden parachute arrangements. We have elected to adopt these reduced disclosure requirements. We could be an emerging growth company until the last day of the fiscal year following the fifth anniversary of the completion of our initial public offering, although a variety of circumstances could cause us to lose that status earlier. We cannot predict whether investors will find our common stock less attractive as a result of our taking advantage of these exemptions. If some investors find our common stock less attractive as a result of our choices, there may be a less active trading market for our common stock and our stock price may be more volatile.
In addition, Section 107 of the JOBS Act provides that an “emerging growth company” can take advantage of the extended transition period provided in Section 7(a)(2)(B) of the Securities Act for complying with new or revised financial accounting standards. An emerging growth company can therefore delay the adoption of certain accounting standards until those standards would otherwise apply to private companies. However, we have determined to opt out of such extended transition period, and, as a result, we will comply with new or revised financial accounting standards on the relevant dates on which adoption of such standards is required for non-emerging growth companies. Section 107 of the JOBS Act provides that our decision to opt out of the extended transition period for complying with new or revised financial accounting standards is irrevocable.
Changes in accounting rules, assumptions or judgments could materially and adversely affect us.
Accounting rules and interpretations for certain aspects of our operations are highly complex and involve significant assumptions and judgment. These complexities could lead to a delay in the preparation and dissemination of our financial statements. Furthermore, changes in accounting rules and interpretations or in our accounting assumptions or judgments, such as asset impairments, could significantly impact our financial statements. In some cases, we could be required to apply a new or revised standard retroactively, resulting in restating prior period financial statements. Any of these circumstances could have a material adverse effect on our business, prospects, liquidity, financial condition and results of operations.
Risks Related to Ownership of Our Common Stock
A trading market for our common stock may not be sustained and our common stock prices may be volatile and could decline substantially following our initial public offering.
Prior to our initial public offering in January 2014, there was no market for our equity. Although our common stock is listed on the New York Stock Exchange under the symbol "NWHM," an active trading market for the shares of our common stock may not be sustained. Accordingly, no assurance can be given as to the following:
• | the likelihood that an active trading market for shares of our common stock will be sustained; |
• | the liquidity of any such market; |
• | the ability of our stockholders to sell their shares of common stock; or |
• | the price that our stockholders may obtain for their common stock. |
If an active market is not maintained, the market price of our common stock may decline and you may not be able to sell your shares. The market price of our common stock may be highly volatile and subject to wide fluctuations. Our financial performance, government regulatory action, tax laws, interest rates and market conditions in general could have a significant impact on the future market price of our common stock.
Some of the factors that could negatively affect or result in fluctuations in the market price of our common stock include:
• | actual or anticipated variations in our quarterly operating results; |
• | changes in market valuations of similar companies; |
• | changes in interest rates, mortgage regulations or land and home prices in the areas in which we operate; |
• | adverse market reaction to the level of our indebtedness; |
• | additions or departures of key personnel; |
• | actions by stockholders; |
• | speculation in the press or investment community; |
35
• | general market, economic and political conditions, including an economic slowdown or dislocation in the global credit markets and in California in particular; |
• | our operating performance and the performance of other similar companies; |
• | changes in accounting principles and tax laws; and |
• | passage of legislation or other regulatory developments that adversely affect us or the homebuilding and land development industry. |
If securities or industry analysts do not publish, or cease publishing, research or reports about us, our business or our market, or if they change their recommendations regarding our common stock adversely, our stock price and trading volume could decline.
The trading market for our common stock is influenced by whether industry or securities analysts publish research and reports about us, our business, our market or our competitors and, if any analysts do publish such reports, what they publish in those reports. We may not maintain analyst coverage in the future. Any analysts who do cover us may make adverse recommendations regarding our common stock, adversely change their recommendations from time to time or provide more favorable relative recommendations about our competitors. If any analyst who cover us now or may cover us in the future were to cease coverage of our company or fail to regularly publish reports on us, we could lose visibility in the financial markets, which in turn could cause our stock price or trading volume to decline.
We do not intend to pay dividends on our common stock for the foreseeable future.
We currently intend to retain our future earnings, if any, to finance the development and expansion of our business and, therefore, do not intend to pay cash dividends on our common stock for the foreseeable future. Any future determination to pay dividends will be at the discretion of our board of directors and will depend on our financial condition, results of operations, capital requirements, restrictions contained in any financing instruments and such other factors as our board of directors deems relevant. Accordingly, you may need to sell your shares of our common stock to realize a return on your investment, and you may not be able to sell your shares at or above the price you paid for them.
Future sales of our common stock or other securities convertible into our common stock could cause the market value of our common stock to decline and could result in dilution of your shares.
Our board of directors is authorized, without your approval, to cause us to issue additional shares of our common stock or to raise capital through the issuance of preferred stock, securities (including debt securities) convertible into common stock, options, warrants and other rights, on terms and for consideration as our board of directors in its sole discretion may determine. Sales of substantial amounts of our common stock could cause the market price of our common stock to decrease significantly. We cannot predict the effect, if any, of future sales of our common stock, or other securities on the value of our common stock. Sales of substantial amounts of our common stock by a large stockholder or otherwise, or the perception that such sales could occur, may adversely affect the market price of our common stock.
In connection with our initial public offering, we, our officers and directors, TNHC Partners LLC and our non-management institutional investors and others agreed that for a period of 180 days from January 30, 2014, we and they will not, without the prior written consent of Citigroup Global Markets Inc., dispose of or hedge any shares or any securities convertible into or exchangeable for our common stock, subject to certain exceptions. The restrictions under the lock-up agreements expired, therefore, shares of our common stock are available for resale into the market, subject to applicable law, which could reduce the market price for our common stock.
We entered into a registration rights agreement with the members of TNHC LLC, including the members of our management team and the institutional investors in TNHC LLC, with respect to the shares of our common stock that they received as part of our formation transactions. We refer to these shares collectively as the “registrable shares.” Pursuant to the registration rights agreement, we have granted the members of TNHC LLC and their direct and indirect transferees shelf registration rights requiring us to file a shelf registration statement and to maintain the effectiveness of such registration statement so as to allow sales thereunder from time to time, demand registration rights to have the registrable shares registered for resale, and, in certain circumstances, the right to “piggy-back” the registrable shares in registration statements we might file in connection with any future public offering.
We have filed a registration statement on Form S-8 to register the offer and sale of the total number of shares of our common stock that may be issued under our 2014 Long-Term Incentive Plan, including the restricted stock units to be granted to our officers (other than Messrs. Webb, Stelmar, Davis and Redwitz) employees and directors, as well as the options to purchase shares of our common stock to be granted to the members of our management team, other officers and employees, in each case pursuant to our 2014 Long-Term Incentive Plan.
36
Future offerings of debt securities, which would rank senior to our common stock upon our bankruptcy or liquidation, and future offerings of equity securities that may be senior to our common stock for the purposes of dividend and liquidating distributions, may adversely affect the market price of our common stock.
In the future, we may attempt to increase our capital resources by conducting offerings of debt securities or additional offerings of equity securities. Upon bankruptcy or liquidation, holders of our debt securities and shares of preferred stock and lenders with respect to other borrowings will receive a distribution of our available assets prior to the holders of our common stock. Additional equity offerings may dilute the holdings of our existing stockholders or reduce the market price of our common stock, or both. Our preferred stock, if issued, could have a preference on liquidating distributions or a preference on dividend payments or both that could limit our ability to make a dividend distribution to the holders of our common stock. Our decision to issue securities in any future offering will depend on market conditions and other factors beyond our control. As a result, we cannot predict or estimate the amount, timing or nature of our future offerings, and purchasers of our common stock bear the risk of our future offerings reducing the market price of our common stock and diluting their ownership interest in our company.
Non-U.S. holders may be subject to U.S. federal income tax on gain realized on the sale or disposition of shares of our common stock.
We believe we are and will remain a “United States real property holding corporation”, or USRPHC, for U.S. federal income tax purposes. As a result, a non-U.S. holder (as defined in “Certain Material Federal Income Tax Considerations”) may be subject to U.S. federal income tax on any gain realized on a sale or disposition of shares of our common stock if (i) our common stock is not regularly traded on an established securities market, or (ii) our common stock is regularly traded on an established securities market (such as the New York Stock Exchange) and such non-U.S. holder holds more than 5% of our common stock at any time during the shorter of the five-year period preceding the date of the sale or disposition and the non-U.S. holder’s holding period in such stock. A non-U.S. holder also will be required to file a U.S. federal income tax return for any taxable year in which it realizes a gain from the disposition of our common stock that is subject to U.S. federal income tax under these rules. In addition, if our stock is not treated as publicly traded for purposes of these rules, a purchaser of the stock may be required to withhold and remit to the Internal Revenue Service, or the IRS, 10% of the purchase price, unless an exception applies.
No assurance can be given that our common stock will remain regularly traded in the future. Non-U.S. holders should consult their tax advisors concerning the consequences of disposing of shares of our common stock.
Item 1B. | Unresolved Staff Comments |
Not Applicable.
Item 2. | Properties |
We lease our corporate headquarters in Aliso Viejo, California. The lease on this facility consists of approximately 15,800 square feet and expires in December 2018. In addition, we lease divisional offices in Northern and Southern California, including approximately 6,800 square feet through April 2017 in Roseville, approximately 6,100 square feet through May 2018 in Walnut Creek, and approximately 1,400 square feet through July 2015 in Agoura Hills. For information on land owned and controlled by us for use in our homebuilding activities, please refer to Item 1 - Business.
Item 3. | Legal Proceedings |
None.
Item 4. | Mine Safety Disclosures |
Not Applicable.
PART II
Item 5. | Market for Registrant’s Common Equity, Related Stockholder Matters and Issuer Purchases of Equity Securities |
Our common stock is listed on the New York Stock Exchange under the ticker symbol “NWHM” and began trading on January 31, 2014. The following table sets forth the high and low intra-day sales prices per share of our common stock for the periods indicated, as reported by the NYSE.
2014 | |||
Quarter Ended | High | Low | |
June 30 | $15.21 | $11.50 | |
September 30 | $14.98 | $12.50 | |
December 31 | $15.96 | $12.80 | |
The following performance graph shows a comparison of the cumulative total returns to stockholders of the Company, as compared with the Standard & Poor’s 500 Composite Stock Index and the Dow Jones Industry Group-U.S. Home Construction Index.
37
The performance graph and related information shall not be deemed to be “soliciting material” or to be “filed” with the Securities and Exchange Commission, nor shall such information be incorporated by reference into any filing under the Securities Act of 1933 or Securities Exchange Act of 1934, each as amended, except to the extent that we specifically incorporate it by reference.
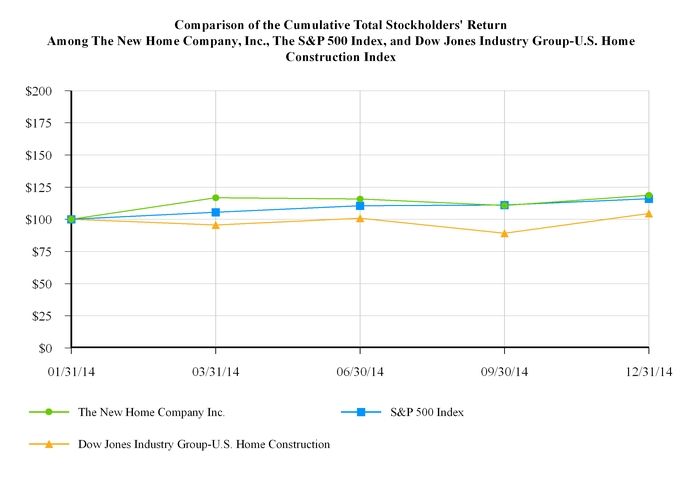
The above graph is based upon common stock and index prices calculated as of the end of each period. The Company’s common stock closing price on December 31, 2014 was $14.48 per share. The stock price performance of the Company’s common stock depicted in the graph above represents past performance only and is not necessarily indicative of future performance.
As of March 6, 2015, we had 8 holders of record of our common stock. We currently intend to retain our future earnings, if any, to finance the development and expansion of our business and, therefore, do not intend to pay cash dividends on our common stock for the foreseeable future. Any future determination to pay dividends will be at the discretion of our board of directors and will depend on our financial condition, results of operations, capital requirements, restrictions contained in any financing instruments and such other factors as our board of directors deems relevant. Accordingly, you may need to sell your shares of our common stock to realize a return on your investment, and you may not be able to sell your shares at or above the price you paid for them. See Item 1A, “Risk Factors—Risks Related to Ownership of Our Common Stock—We do not intend to pay dividends on our common stock for the foreseeable future.”
38
Item 6. | Selected Financial Data |
The following sets forth our selected financial data and other operating data on a historical basis. You should read the following selected financial data in conjunction with our consolidated financial statements and the related notes and with “Management’s Discussion and Analysis of Financial Condition and Results of Operations,” which are included elsewhere in this annual report on Form 10-K.
Our historical consolidated balance sheet information as of December 31, 2014, 2013, 2012 and 2011, and consolidated statement of operations information for the years ended December 31, 2014, 2013, 2012 and 2011 and for the period from August 18, 2010 (inception) through December 31, 2010 and the period from January 1, 2010 through August 17, 2010 have been derived from the historical consolidated financial statements audited by Ernst & Young LLP, independent registered public accounting firm.
As of December 31, | |||||||||||||||
2014 | 2013 | 2012 | 2011 | ||||||||||||
Consolidated Balance Sheet Data | |||||||||||||||
Cash, cash equivalents and restricted cash | $ | 44,340,090 | $ | 9,671,576 | $ | 6,152,048 | $ | 5,523,851 | |||||||
Receivables | 15,826,350 | 7,736,662 | 6,100,836 | 59,317 | |||||||||||
Real estate inventories | 163,564,181 | 45,350,479 | 39,268,764 | 28,890,573 | |||||||||||
Investment in unconsolidated joint ventures | 60,564,033 | 32,269,546 | 12,424,229 | 4,854,584 | |||||||||||
Other assets | 7,663,452 | 3,921,033 | 564,839 | 433,465 | |||||||||||
Total assets | $ | 291,958,106 | $ | 98,949,296 | $ | 64,510,716 | $ | 39,761,790 | |||||||
Notes payable to member | $ | — | $ | — | $ | 1,000,000 | $ | — | |||||||
Notes payable | 113,751,334 | 17,883,338 | 16,721,878 | 9,383,462 | |||||||||||
Accounts payable and accrued expenses | 27,781,087 | 15,538,864 | 11,214,124 | 2,526,739 | |||||||||||
Total liabilities | 141,532,421 | 33,422,202 | 28,936,002 | 11,910,201 | |||||||||||
Stockholders’ equity | 148,083,678 | — | — | — | |||||||||||
Members’ equity | — | 64,355,719 | 35,574,714 | 27,851,589 | |||||||||||
Noncontrolling interest in subsidiary | 2,342,007 | 1,171,375 | — | — | |||||||||||
Total equity | 150,425,685 | 65,527,094 | 35,574,714 | 27,851,589 | |||||||||||
Total liabilities and equity | $ | 291,958,106 | $ | 98,949,296 | $ | 64,510,716 | $ | 39,761,790 | |||||||
39
TNHC Inc. | TNHC LLC | Predecessor | ||||||||||||||||||||||
Year Ended December 31, | Year Ended December 31, | Period From August 18, 2010 (Inception) Through December 31, | Period From January 1, 2010 Through August 17, | |||||||||||||||||||||
2014 | 2013 | 2012 | 2011 | 2010 | 2010 | |||||||||||||||||||
Consolidated Statement of Operations Data: | ||||||||||||||||||||||||
Home sales(1) | $ | 56,094,345 | $ | 35,662,980 | $ | 24,197,956 | $ | 25,624,111 | $ | 5,319,408 | $ | 538,598 | ||||||||||||
Cost of home sales(1) | 47,660,396 | 28,979,493 | 20,779,338 | 21,774,199 | 4,423,236 | 399,995 | ||||||||||||||||||
Homebuilding gross profit | 8,433,949 | 6,683,487 | 3,418,618 | 3,849,912 | 896,172 | 138,603 | ||||||||||||||||||
Fee building | 93,562,485 | 47,565,505 | 28,268,675 | 16,522,946 | 11,494,347 | 12,941,110 | ||||||||||||||||||
Cost of fee building | 89,055,951 | 42,317,737 | 26,505,042 | 16,762,666 | 11,331,286 | 12,764,497 | ||||||||||||||||||
Fee building gross profit (loss) | 4,506,534 | 5,247,768 | 1,763,633 | (239,720 | ) | 163,061 | 176,613 | |||||||||||||||||
Land sales gross margin | — | — | (321,791 | ) | — | — | — | |||||||||||||||||
Abandoned project costs | 753,994 | 874,719 | 408,642 | 128,798 | — | — | ||||||||||||||||||
Selling and marketing | 3,166,142 | 1,771,771 | 1,677,058 | 1,748,430 | 453,799 | 134,002 | ||||||||||||||||||
General and administrative | 12,419,563 | 7,107,518 | 4,474,949 | 3,997,617 | 848,114 | 328,295 | ||||||||||||||||||
(3,399,216 | ) | 2,177,247 | (1,700,189 | ) | (2,264,653 | ) | (242,680 | ) | (147,081 | ) | ||||||||||||||
Equity in net income (loss) of unconsolidated joint ventures | 8,443,136 | 4,735,224 | 349,445 | (38,916 | ) | — | — | |||||||||||||||||
Guaranty fee income | 18,927 | 113,562 | 85,172 | — | — | — | ||||||||||||||||||
Other expense, net | (59,354 | ) | (30,142 | ) | (15,048 | ) | (14,750 | ) | (10,596 | ) | (6,048 | ) | ||||||||||||
Income (loss) before taxes | 5,003,493 | 6,995,891 | (1,280,620 | ) | (2,318,319 | ) | (253,276 | ) | (153,129 | ) | ||||||||||||||
Provision for taxes | (246,422 | ) | (290,386 | ) | (71,255 | ) | (10,149 | ) | — | — | ||||||||||||||
Net income (loss) | 4,757,071 | 6,705,505 | (1,351,875 | ) | (2,328,468 | ) | (253,276 | ) | (153,129 | ) | ||||||||||||||
Net loss attributable to noncontrolling interests | 29,472 | 500 | — | — | — | — | ||||||||||||||||||
Net income (loss) attributable to The New Home Company | $ | 4,786,543 | $ | 6,706,005 | $ | (1,351,875 | ) | $ | (2,328,468 | ) | $ | (253,276 | ) | $ | (153,129 | ) | ||||||||
Earnings (loss) per share attributable to The New Home Company | ||||||||||||||||||||||||
Basic | $ | 0.30 | $ | 0.85 | $ | (0.27 | ) | $ | (0.66 | ) | $ | (0.11 | ) | $ | (0.18 | ) | ||||||||
Diluted | $ | 0.30 | $ | 0.85 | $ | (0.27 | ) | $ | (0.66 | ) | $ | (0.11 | ) | $ | (0.18 | ) | ||||||||
Operating Data - Company Projects | ||||||||||||||||||||||||
Net new home orders | 79 | 72 | 72 | 45 | 15 | 4 | ||||||||||||||||||
New homes delivered | 53 | 82 | 53 | 49 | 8 | — | ||||||||||||||||||
Average sales price of homes delivered | $ | 1,058,000 | $ | 435,000 | $ | 457,000 | $ | 523,000 | $ | 665,000 | $ | — | ||||||||||||
Cancellation rate | 13 | % | 20 | % | 16 | % | 25 | % | 10 | % | — | % | ||||||||||||
Average selling communities | 3.4 | 3.0 | 4.0 | 4.0 | 3.0 | 1.0 | ||||||||||||||||||
Selling communities at end of period | 4 | 3 | 3 | 4 | 3 | 1 | ||||||||||||||||||
Backlog at end of period, number of homes | 41 | 15 | 26 | 7 | 11 | 4 | ||||||||||||||||||
Backlog at end of period, aggregate sales value | $ | 86,711,000 | $ | 11,867,000 | $ | 10,593,000 | $ | 5,074,000 | $ | 3,982,000 | $ | 1,177,000 | ||||||||||||
Average sales price of backlog | $ | 2,115,000 | $ | 791,000 | $ | 407,000 | $ | 725,000 | $ | 362,000 | $ | 294,000 | ||||||||||||
40
Predecessor | ||||||||||||||||||||||||
Year Ended December 31, | Period From August 18, 2010 (Inception) Through December 31, | Period From January 1, 2010 Through August 17, | ||||||||||||||||||||||
2014 | 2013 | 2012 | 2011 | 2010 | 2010 | |||||||||||||||||||
Operating and Financial Data – Unconsolidated Joint Ventures(2) | ||||||||||||||||||||||||
Net income (loss) | $ | 41,174,059 | $ | 35,434,206 | $ | 8,652,751 | $ | (766,819 | ) | $ | — | $ | — | |||||||||||
The Company's equity in net income (loss) of unconsolidated joint ventures | $ | 8,443,136 | $ | 4,735,224 | $ | 349,445 | $ | (38,916 | ) | $ | — | $ | — | |||||||||||
Management fees earned by the Company(3) | $ | 9,582,442 | $ | 8,250,764 | $ | 2,949,365 | $ | 844,411 | $ | — | $ | — | ||||||||||||
Homebuilding | ||||||||||||||||||||||||
Home sales | $ | 224,497,517 | $ | 183,038,268 | $ | 56,018,517 | $ | — | $ | — | $ | — | ||||||||||||
Homebuilding gross profit | $ | 50,195,612 | $ | 49,728,254 | $ | 14,470,281 | $ | — | $ | — | $ | — | ||||||||||||
Net new home orders | 288 | 156 | 96 | — | — | — | ||||||||||||||||||
New homes delivered | 275 | 148 | 42 | — | — | — | ||||||||||||||||||
Average sales price of homes delivered | $ | 816,000 | $ | 1,237,000 | $ | 1,334,000 | $ | — | $ | — | $ | — | ||||||||||||
Cancellation rate | 9 | % | 7 | % | 5 | % | — | — | — | |||||||||||||||
Average selling communities | 8.5 | 3.6 | 3.0 | — | — | — | ||||||||||||||||||
Selling communities at end of period | 8 | 6 | 3 | — | — | — | ||||||||||||||||||
Backlog at end of period, number of homes | 75 | 62 | 54 | — | — | — | ||||||||||||||||||
Backlog at end of period, aggregate home sales value | $ | 114,988,000 | $ | 42,570,000 | $ | 72,921,000 | $ | — | $ | — | $ | — | ||||||||||||
Average home sales price of backlog | $ | 1,533,000 | $ | 687,000 | $ | 1,350,000 | $ | — | $ | — | $ | — | ||||||||||||
Land | ||||||||||||||||||||||||
Land sales | $ | 46,887,847 | $ | — | $ | — | $ | — | $ | — | $ | — | ||||||||||||
Land gross profit | $ | 11,922,364 | $ | — | $ | — | $ | — | $ | — | $ | — | ||||||||||||
Net new lot orders | 686 | — | — | — | — | — | ||||||||||||||||||
New lots delivered | 266 | — | — | — | — | — | ||||||||||||||||||
Backlog at end of period, number of lots | 420 | — | — | — | — | — | ||||||||||||||||||
Backlog at end of period, aggregate land sales value | $ | 89,103,300 | $ | — | $ | — | $ | — | $ | — | $ | — | ||||||||||||
As of December 31, | ||||||||||||||||||||||||
2014 | 2013 | 2012 | 2011 | |||||||||||||||||||||
Balance Sheet Data – Unconsolidated Joint Ventures | ||||||||||||||||||||||||
Total assets, primarily real estate inventories | $ | 521,610,365 | $ | 287,690,268 | $ | 173,255,773 | $ | 92,622,144 | ||||||||||||||||
Total liabilities, primarily accounts payable and notes payable | $ | 140,595,715 | $ | 83,658,411 | $ | 44,673,841 | $ | 21,610,963 | ||||||||||||||||
The Company’s equity | 60,564,033 | 32,269,546 | 12,424,229 | 4,854,584 | ||||||||||||||||||||
Other partners’ equity | 320,450,617 | 171,762,311 | 116,157,703 | 66,156,597 | ||||||||||||||||||||
Total equity | 381,014,650 | 204,031,857 | 128,581,932 | 71,011,181 | ||||||||||||||||||||
Total liabilities and equity | $ | 521,610,365 | $ | 287,690,268 | $ | 173,255,773 | $ | 92,622,144 | ||||||||||||||||
Predecessor | ||||||||||||||||||||||||
Year Ended December 31, | Period From August 18, 2010 (Inception) Through December 31, | Period From January 1, 2010 Through August 17, | ||||||||||||||||||||||
2014 | 2013 | 2012 | 2011 | 2010 | 2010 | |||||||||||||||||||
Operating Data – Fee Building Projects | ||||||||||||||||||||||||
Homes started | 550 | 215 | 114 | 88 | — | 49 | ||||||||||||||||||
Homes delivered | 206 | 194 | 50 | 47 | 37 | 12 | ||||||||||||||||||
Homes under construction at end of period | 470 | 126 | 105 | 41 | — | 37 | ||||||||||||||||||
41
(1) | During the years ended December 31, 2011 and 2010, the Company entered into a fee building services agreement that allowed us to independently operate a design center and directly market upgrade options to the landowners’ homebuyers. We recognized revenue for these option upgrades in accordance with ASC 360-20, "Property, Plant and Equipment, Real Estate Sales", as more fully described in the notes to the consolidated financial statements. During the years ended December 31, 2011 and 2010, we recognized revenue for these option upgrades of $3.2 million and $2.8 million, which is included above in home sales. The cost of these option upgrades, included above in cost of home sales, was $2.5 million and $2.2 million during the years ended December 31, 2011 and 2010, respectively. These revenues and costs were for the delivery of option upgrades on 47 and 49 homes, respectively, which are included in the operating data for fee building services. |
(2) | “Operating and Financial Data – Unconsolidated Joint Ventures” reflects the data for the ventures and not our share thereof. We own economic interests in our unconsolidated joint ventures, which include our capital interests that generally range from 5% to 50% plus, in each case, a share of the distributions from the joint ventures in excess of our capital interest. These economic interests vary among our different joint ventures. A description of such share of distributions in excess of our capital interest for each of our joint ventures is described under “Business—Joint Ventures.” Such financial data is not included in our financial data for GAAP purposes, but is recognized in our results of operations as a component of equity in net income (loss) of unconsolidated joint ventures. We have interests in several unconsolidated joint ventures and this information has been included to provide additional information about the operations and financial condition of our unconsolidated joint ventures. This data is included for informational purposes only. |
(3) | We have entered into agreements with our unconsolidated joint ventures to provide management services related to the underlying projects. Pursuant to the agreements, we receive a management fee based on each project’s revenues. During the years ended December 31, 2014, 2013, 2012 and 2011, we earned $9.6 million, $8.3 million, $2.9 million and $0.8 million, respectively, in management fees, which have been recorded as fee building revenue. |
Item 7. | Management’s Discussion and Analysis of Financial Condition and Results of Operations |
You should read the following in conjunction with the sections of this annual report on Form 10-K entitled “Risk Factors,” “Cautionary Note Concerning Forward-Looking Statements,” “Selected Financial Data” and “Business” and our historical financial statements and related notes thereto included elsewhere in this annual report on Form 10-K. This discussion contains forward-looking statements reflecting current expectations that involve risks and uncertainties. Actual results and the timing of events may differ materially from those contained in these forward-looking statements due to a number of factors, including those discussed in the section entitled “Risk Factors” and elsewhere in this annual report on Form 10-K.
Consolidated Financial Data
Year Ended December 31, | |||||||||||
2014 | 2013 | 2012 | |||||||||
Revenues: | |||||||||||
Home sales | $ | 56,094,345 | $ | 35,662,980 | $ | 24,197,956 | |||||
Fee building, including management fees from unconsolidated joint ventures of $9,582,442, $8,250,764 and $2,949,365, respectively | 93,562,485 | 47,565,505 | 28,268,675 | ||||||||
Land sales | — | — | 2,940,100 | ||||||||
149,656,830 | 83,228,485 | 55,406,731 | |||||||||
Expenses: | |||||||||||
Cost of homes sales | 47,660,396 | 28,979,493 | 20,779,338 | ||||||||
Cost of fee building | 89,055,951 | 42,317,737 | 26,505,042 | ||||||||
Cost of land sales | — | — | 3,261,891 | ||||||||
Abandoned project costs | 753,994 | 874,719 | 408,642 | ||||||||
Selling and marketing | 3,166,142 | 1,771,771 | 1,677,058 | ||||||||
General and administrative | 12,419,563 | 7,107,518 | 4,474,949 | ||||||||
153,056,046 | 81,051,238 | 57,106,920 | |||||||||
Equity in net income of unconsolidated joint ventures | 8,443,136 | 4,735,224 | 349,445 | ||||||||
Guaranty fee income | 18,927 | 113,562 | 85,172 | ||||||||
Other expense, net | (59,354 | ) | (30,142 | ) | (15,048 | ) | |||||
Income (loss) before taxes | 5,003,493 | 6,995,891 | (1,280,620 | ) | |||||||
Provision for taxes | (246,422 | ) | (290,386 | ) | (71,255 | ) | |||||
Net income (loss) | 4,757,071 | 6,705,505 | (1,351,875 | ) | |||||||
Net loss attributable to noncontrolling interests | 29,472 | 500 | — | ||||||||
Net income (loss) attributable to The New Home Company Inc. | $ | 4,786,543 | $ | 6,706,005 | $ | (1,351,875 | ) | ||||
42
Results of Operations
Year Ended December 31, 2014 Compared to Year Ended December 31, 2013
Net New Home Orders and Backlog
Year Ended December 31, | Increase (Decrease) | |||||||||||||
2014 | 2013 | Amount | % | |||||||||||
Net new home orders | 79 | 72 | 7 | 10 | % | |||||||||
Cancellation rate | 13 | % | 20 | % | (7 | )% | (35 | )% | ||||||
Average selling communities | 3.4 | 3.0 | 0.4 | 13 | % | |||||||||
Selling communities at end of period | 4 | 3 | 1 | 33 | % | |||||||||
Backlog (dollar value) | $ | 86,711,000 | $ | 11,867,000 | $ | 74,844,000 | 631 | % | ||||||
Backlog (homes) | 41 | 15 | 26 | 173 | % | |||||||||
Average sales price of backlog | $ | 2,115,000 | $ | 791,000 | $ | 1,324,000 | 167 | % | ||||||
Net new home orders for the year ended December 31, 2014 increased 10% to 79, compared to 72 during the same period in 2013. Our overall “absorption rate” (the rate at which home orders are contracted, net of cancellations) for the year ended December 31, 2014 was 23.2 per average selling community (1.9 monthly), compared to 24.0 per average selling community (2.0 monthly) during the same period in 2013.
Our cancellation rate of buyers who contracted to buy a home, but did not close escrow (as a percentage of overall orders), was approximately 13% for the year ended December 31, 2014 as compared to 20% for the same period in 2013. Our average number of selling communities increased by 0.4 for the year ended December 31, 2014 compared to the same period in 2013.
Backlog reflects the number of homes, net of actual cancellations, for which we have entered into a sales contract with a customer, but for which we have not yet delivered the home. Backlog has not been reduced to reflect our historical cancellation rate. Homes in backlog are generally closed within three to seven months, although we may experience cancellations of sales contracts prior to delivery. The number of homes in backlog as of December 31, 2014 compared to December 31, 2013 increased 173% as a result of increased net new home orders and a decrease of new home deliveries. The dollar value of backlog increased $74.8 million, or 631%, as of December 31, 2014 compared to December 31, 2013 primarily due to the opening of two new communities in Irvine, California with average sales prices of $2.0 million and $2.8 million.
Home Sales Revenue and New Homes Delivered
Year Ended December 31, | Increase (Decrease) | |||||||||||||
2014 | 2013 | Amount | % | |||||||||||
New homes delivered | 53 | 82 | (29 | ) | (35 | )% | ||||||||
Home sales revenue | $ | 56,094,345 | $ | 35,662,980 | $ | 20,431,365 | 57 | % | ||||||
Average sales price of homes delivered | $ | 1,058,000 | $ | 435,000 | $ | 623,000 | 143 | % | ||||||
New home deliveries decreased by 29, or 35%, during the year ended December 31, 2014 compared to the same period in 2013. The decrease in new home deliveries was primarily due to the closeout of one community in Sacramento, California, coupled with the mid-year opening of three new communities.
During the year ended December 31, 2014, home sales revenue increased by $20.4 million, or 57%, from the same period in 2013 due to an increase in the average sales price of homes delivered, offset partially by a decrease in the number of new homes delivered. The increase in average sales price of homes delivered was primarily due to the opening of two new communities in Irvine, California as noted above.
43
Homebuilding
Year Ended December 31, | |||||||||||||
2014 | % | 2013 | % | ||||||||||
Home sales revenue | $ | 56,094,345 | 100.0 | % | $ | 35,662,980 | 100.0 | % | |||||
Cost of home sales | 47,660,396 | 85.0 | % | 28,979,493 | 81.3 | % | |||||||
Homebuilding gross margin | 8,433,949 | 15.0 | % | 6,683,487 | 18.7 | % | |||||||
Add: interest in cost of home sales | 532,286 | 1.0 | % | 549,971 | 1.5 | % | |||||||
Adjusted homebuilding gross margin(1) | $ | 8,966,235 | 16.0 | % | $ | 7,233,458 | 20.2 | % | |||||
Homebuilding gross margin percentage | 15.0 | % | 18.7 | % | |||||||||
Adjusted homebuilding gross margin percentage(1) | 16.0 | % | 20.2 | % | |||||||||
(1) | Non-GAAP financial measure (as discussed below). |
Homebuilding gross margin represents home sales revenue less cost of home sales. Our homebuilding gross margin decreased to 15.0% for the year ended December 31, 2014 as compared to 18.7% for the same period in 2013. During the fourth quarter of 2014, we delivered 11 homes at two communities in Irvine, California. These deliveries generated $27.5 million of home sales revenue and occurred on finished lots purchased from a masterplan community developer. Under the terms of our purchase agreement, we acquire finished lots in these communities under a favorable option structure in exchange for payment of a profit participation and a higher cost of land to the developer. The profit participation and higher cost of land in these two communities were the primary reason homebuilding gross margin percentage decreased.
Excluding interest in cost of home sales, adjusted homebuilding gross margin percentage was 16.0% for the year ended December 31, 2014, compared to 20.2% for the same period in 2013. Adjusted homebuilding gross margin is a non-GAAP financial measure. We believe that by adding interest in cost of home sales back to homebuilding gross margin, investors are able to assess the performance of our homebuilding business excluding our interest cost, allowing a focus on the performance of the underlying homebuilding operations. We believe this information is meaningful as it isolates the impact that leverage has on homebuilding gross margin and permits investors to make better comparisons with our competitors who adjust gross margins in a similar fashion. See the table above reconciling this non-GAAP financial measure to homebuilding gross margin, the nearest GAAP equivalent.
Fee Building
Year Ended December 31, | |||||||||||||
2014 | % | 2013 | % | ||||||||||
Fee building revenues | $ | 93,562,485 | 100.0 | % | $ | 47,565,505 | 100.0 | % | |||||
Cost of fee building | 89,055,951 | 95.2 | % | 42,317,737 | 89.0 | % | |||||||
Fee building gross margin | $ | 4,506,534 | 4.8 | % | $ | 5,247,768 | 11.0 | % | |||||
Fee building revenues include (i) billings to independent third-party land owners for general contracting services, and (ii) management fees from our unconsolidated joint ventures for construction management services. Cost of fee building includes (i) labor, subcontractor, and other indirect costs that are reimbursable by the land owner, and (ii) G&A expenses that are attributable to fee building activities.
Billings to land owners are a function of construction activity and reimbursable costs are incurred as homes are started. The total billings and reimbursable costs are driven by the pace at which the land owner has us execute its development plan. Management fees from our unconsolidated joint ventures are collected over the project's life and increase as homes and lots are delivered. Fee building revenues increased to $93.6 million for the year ended December 31, 2014 compared to $47.6 million for the same period during 2013, primarily due to the increase in construction activity in the fee building communities. Included in fee building revenues were (i) $84.0 million and $39.3 million of billings to land owners for the years ended December 31, 2014 and 2013, respectively, and (ii) $9.6 million and $8.3 million of management fees from our unconsolidated joint ventures for the years ended December 31, 2014 and 2013, respectively.
The Company’s fee building revenues have historically been concentrated in a small number of customers. For the years ended December 31, 2014, 2013 and 2012, one customer comprised 87%, 75% and 95% of fee building revenue, respectively. As of December 31, 2014 and 2013, one customer comprised 98% and 82% of contracts and accounts receivables, respectively.
44
Cost of fee building increased to $89.1 million for the year ended December 31, 2014 compared to $42.3 million for the same period during 2013. The amount of G&A expenses included in cost of fee building were $9.3 million and $5.4 million for the years ended December 31, 2014 and 2013, respectively. The increase in billings to land owners and the related increase in G&A expenses were the primary reasons fee building gross margin percentage decreased to 4.8% from 11.0% for the years ended December 31, 2014 and 2013, respectively.
Abandoned Project Costs
Pre-acquisition costs, which consist primarily of due diligence costs for specific projects, are expensed to abandoned project costs when we determine continuation of the respective project is not probable. During the year ended December 31, 2014, abandoned project costs decreased slightly to $0.8 million from $0.9 million during the year ended December 31, 2013.
Equity in Net Income of Unconsolidated Joint Ventures
As of December 31, 2014 and 2013, we had ownership interests in 12 and 11, respectively, unconsolidated joint ventures. We own economic interests in our unconsolidated joint ventures, which include our capital interests that generally range from 5% to 50% plus, in each case, a share of the distributions from the joint ventures in excess of our capital interest. These economic interests vary among our joint ventures. The unconsolidated joint ventures produced $41.2 million and $35.4 million in net income during the years ended December 31, 2014 and 2013, respectively. The net income of our unconsolidated joint ventures increased primarily due to land sales revenue recognized by one joint venture during the fourth quarter of 2014. Our equity in net income from unconsolidated joint ventures was $8.4 million for the year ended December 31, 2014, compared to equity in net income of $4.7 million for the same period in 2013.
The following sets forth supplemental operational and financial information about our unconsolidated joint ventures. Such information is not included in our financial data for GAAP purposes, but is recognized in our results as a component of equity in net income of unconsolidated joint ventures. This data is included for informational purposes only.
Year Ended December 31, | ||||||||||||||
Increase (Decrease) | ||||||||||||||
2014 | 2013 | Amount | % | |||||||||||
Unconsolidated Joint Ventures - Homebuilding | ||||||||||||||
Net New Home Orders, Revenues and Deliveries | ||||||||||||||
Net new home orders | 288 | 156 | 132 | 85 | % | |||||||||
Cancellation rate | 9 | % | 7 | % | 2 | % | 29 | % | ||||||
Average selling communities | 8.5 | 3.6 | 4.9 | 136 | % | |||||||||
Selling communities at end of period | 8 | 6 | 2 | 33 | % | |||||||||
Backlog (dollar value) | $ | 114,988,000 | $ | 42,570,000 | $ | 72,418,000 | 170 | % | ||||||
Backlog (homes) | 75 | 62 | 13 | 21 | % | |||||||||
Average sales price of backlog | $ | 1,533,000 | $ | 687,000 | $ | 846,000 | 123 | % | ||||||
New homes delivered | 275 | 148 | 127 | 86 | % | |||||||||
Home sales revenue | $ | 224,497,517 | $ | 183,038,268 | $ | 41,459,249 | 23 | % | ||||||
Average sales price of homes delivered | $ | 816,000 | $ | 1,237,000 | $ | (421,000 | ) | (34 | )% | |||||
Net new home orders from unconsolidated joint ventures increased to 288 from 156, or 85%, for the years ended December 31, 2014 and 2013, respectively, primarily due to an increase in the number of average selling communities. The absorption rate for unconsolidated joint ventures for the year ended December 31, 2014 was 33.9 per average selling community (2.8 monthly), compared to 43.3 per average selling community (3.6 monthly) during the same period in 2013.
The cancellation rate of unconsolidated joint venture projects was approximately 9% for the year ended December 31, 2014 as compared to 7% for the same period in 2013. The number of homes in backlog from unconsolidated joint ventures as of December 31, 2014 increased by 13 from December 31, 2013 primarily due to the 85% increase in net new home orders, offset partially by an increase in new home deliveries. The dollar value of backlog as of December 31, 2014 compared to December 31, 2013 increased due to the increase in the number of homes in backlog and the average sales price of backlog. The average sales price of backlog increased by $846,000 primarily due to a change in product mix.
45
New homes delivered from unconsolidated joint ventures increased to 275 from 148, or 86%, for the years ended December 31, 2014 and 2013, respectively, primarily due to an increase in community count. Home sales revenue from unconsolidated joint ventures increased to $224.5 million from $183.0 million, or 23%, during the years ended December 31, 2014 and 2013, respectively, primarily due to the increase in new homes delivered, offset partially by the decrease in average sales price of homes delivered resulting from a change in community mix.
Year Ended December 31, | |||||||||||||
2014 | % | 2013 | % | ||||||||||
Unconsolidated Joint Ventures - Homebuilding | |||||||||||||
Unconsolidated joint ventures home sales revenue | $ | 224,497,517 | 100.0 | % | $ | 183,038,268 | 100.0 | % | |||||
Cost of unconsolidated joint ventures home sales | 174,301,905 | 77.6 | % | 133,310,014 | 72.8 | % | |||||||
Unconsolidated joint ventures homebuilding gross margin | 50,195,612 | 22.4 | % | 49,728,254 | 27.2 | % | |||||||
Add: interest in cost of unconsolidated joint venture home sales | 2,885,249 | 1.2 | % | 3,256,806 | 1.8 | % | |||||||
Adjusted unconsolidated joint ventures homebuilding gross margin (1) | $ | 53,080,861 | 23.6 | % | $ | 52,985,060 | 29.0 | % | |||||
Unconsolidated joint ventures homebuilding gross margin percentage | 22.4 | % | 27.2 | % | |||||||||
Adjusted unconsolidated joint ventures homebuilding gross margin percentage (1) | 23.6 | % | 29.0 | % | |||||||||
(1) | Non-GAAP financial measure (as discussed below). |
Excluding interest in cost of home sales, adjusted unconsolidated joint ventures homebuilding gross margin percentage was 23.6% for the year ended December 31, 2014, compared to 29.0% for the same period in 2013. Adjusted unconsolidated joint ventures homebuilding gross margin is a non-GAAP financial measure. We believe that by adding interest in cost of unconsolidated joint venture home sales back to unconsolidated joint ventures homebuilding gross margin, investors are able to assess the performance of our unconsolidated joint ventures excluding interest cost, allowing a focus on the performance of the underlying unconsolidated joint venture homebuilding operations. We believe this information is meaningful as it isolates the impact that leverage has on unconsolidated joint venture homebuilding gross margin and permits investors to make better comparisons with our competitors who adjust gross margins in a similar fashion. See the table above reconciling this non-GAAP financial measure to unconsolidated joint venture homebuilding gross margin, the nearest GAAP equivalent.
Year Ended December 31, | ||||||||||||||
Increase (Decrease) | ||||||||||||||
2014 | 2013 | Amount | % | |||||||||||
Unconsolidated Joint Ventures - Land | ||||||||||||||
Net New Lot Orders, Revenues and Deliveries | ||||||||||||||
Net new lot orders | 686 | — | 686 | — | % | |||||||||
Backlog (dollar value)(1) | $ | 89,103,300 | $ | — | $ | 89,103,300 | — | % | ||||||
Backlog (lots)(1) | 420 | — | 420 | — | % | |||||||||
New lots delivered | 266 | — | 266 | — | % | |||||||||
Land sales revenue | $ | 46,887,847 | $ | — | $ | 46,887,847 | — | % | ||||||
(1) | Amounts include $33.9 million of backlog dollar value and 145 lots related to purchase contracts between an unconsolidated joint venture and the Company. |
During the year ended December 31, 2014, our Foster City and Cannery Park joint ventures began selling lots and the Foster City joint venture also began delivering lots. No such activity occurred during the year ended December 31, 2013.
46
Year Ended December 31, | |||||||||||||
2014 | % | 2013 | % | ||||||||||
Unconsolidated Joint Ventures - Land | |||||||||||||
Unconsolidated joint ventures land sales revenue | $ | 46,887,847 | 100.0 | % | $ | — | — | % | |||||
Cost of unconsolidated joint ventures land sales | 34,965,483 | 74.6 | % | — | — | % | |||||||
Unconsolidated joint ventures land gross margin | 11,922,364 | 25.4 | % | — | — | % | |||||||
Add: interest in cost of unconsolidated joint venture land sales | 172,976 | 0.4 | % | — | — | % | |||||||
Adjusted unconsolidated joint ventures land gross margin (1) | $ | 12,095,340 | 25.8 | % | $ | — | — | % | |||||
Unconsolidated joint ventures land gross margin percentage | 25.4 | % | — | % | |||||||||
Adjusted unconsolidated joint ventures land gross margin percentage (1) | 25.8 | % | — | % | |||||||||
(1) | Non-GAAP financial measure (as discussed below). |
Excluding interest in cost of land sales, adjusted unconsolidated joint ventures land gross margin percentage was 25.8% for the year ended December 31, 2014, compared to none for the same period in 2013. Adjusted unconsolidated joint ventures land gross margin is a non-GAAP financial measure. We believe that by adding interest in cost of unconsolidated joint venture land sales back to unconsolidated joint ventures land gross margin, investors are able to assess the performance of our unconsolidated joint ventures excluding interest cost, allowing a focus on the performance of the underlying unconsolidated joint venture land operations. We believe this information is meaningful as it isolates the impact that leverage has on unconsolidated joint venture land gross margin and permits investors to make better comparisons with our competitors who adjust gross margins in a similar fashion. See the table above reconciling this non-GAAP financial measure to unconsolidated joint venture land gross margin, the nearest GAAP equivalent.
The table below summarizes lots owned and controlled by our unconsolidated joint ventures as of the dates presented:
December 31, | Increase (Decrease) | ||||||||||
2014 | 2013 | Amount | % | ||||||||
Unconsolidated Joint Ventures - Lots Owned and Controlled | |||||||||||
Homebuilding | |||||||||||
Lots owned | 885 | 824 | 61 | 7 | % | ||||||
Lots controlled (1) | — | 328 | (328 | ) | (100 | )% | |||||
Homebuilding Total | 885 | 1,152 | (267 | ) | (23 | )% | |||||
Land Development | |||||||||||
Lots owned | 2,772 | 870 | 1,902 | 219 | % | ||||||
Lots controlled (1) | 235 | 951 | (716 | ) | (75 | )% | |||||
Land Development Total | 3,007 | 1,821 | 1,186 | 65 | % | ||||||
Total | 3,892 | 2,973 | 919 | 31 | % | ||||||
(1) | Consists of lots that are under purchase and sale agreements. |
Selling, General and Administrative Expenses
Year Ended December 31, | As a Percentage of | ||||||||||||
Home Sales Revenue | |||||||||||||
2014 | 2013 | 2014 | 2013 | ||||||||||
Selling and marketing expenses | $ | 3,166,142 | $ | 1,771,771 | 5.6 | % | 5.0 | % | |||||
General and administrative expenses (“G&A”) | 12,419,563 | 7,107,518 | 22.1 | % | 19.9 | % | |||||||
Total selling, marketing and G&A | $ | 15,585,705 | $ | 8,879,289 | 27.7 | % | 24.9 | % | |||||
47
Selling and marketing expenses incurred during the year ended December 31, 2014 increased to 5.6% of home sales revenue compared to 5.0% for the same period in 2013. The increase in selling and marketing expense during the year ended December 31, 2014 as compared to the same period in 2013 is primarily due to an increase in the number of sales personnel and marketing costs related to three new communities that opened during the second quarter of 2014 that began delivering homes in the fourth quarter of 2014.
During the year ended December 31, 2014, G&A expenses increased to $12.4 million from $7.1 million for the same period in 2013. The increase was primarily attributable to (i) an increase of $1.8 million in stock-based compensation due to new option and restricted share unit awards granted during the first quarter of 2014, (ii) an increase in personnel as a result of the increase in, and level of activity of our projects, and (iii) an increase in outside services, professional fees and board of director costs related to public company requirements, and other costs incurred to support our growth. G&A expenses as a percentage of home sales revenue increased to 22.1% for the year ended December 31, 2014 from 19.9% for the year ended December 31, 2013.
Guaranty Fee Income
During the years ended December 31, 2014 and 2013, we recognized $18,927 and $113,562, respectively, in guaranty fee income from one of our unconsolidated joint ventures for certain loan guaranties provided over a 12-month period by us on behalf of the unconsolidated joint venture, which ended during the first quarter of 2014.
Other Expense, Net
Other expense, net, increased slightly during the year ended December 31, 2014 compared to the same period in 2013 due primarily to an increase in state franchise tax fees, offset partially by interest earned on our cash balances.
Provision for Taxes
During 2013 and for the first 30 calendar days of 2014, we were a Delaware LLC, which was treated as a partnership for income tax purposes and was subject to certain minimal taxes and fees; however, income taxes on taxable income or losses realized by us were the obligation of the members. Federal and state taxes provided during 2013 and the first 30 calendar days of 2014 relate to a subsidiary that is treated as a C Corporation.
On January 30, 2014, the Company completed its IPO and reorganized from a Delaware LLC into a Delaware corporation. For the year ended December 31, 2014, the Company recorded a tax provision of $0.2 million. The effective tax rate for the year ended December 31, 2014 differs from the 35% statutory tax rate due to (i) the recognition of a tax benefit of $1.5 million for cumulative net deferred tax assets resulting from the Company's conversion to a taxable entity, (ii) the recognition of a domestic production activities deduction, (iii) tax credits related to delivering energy efficient homes, and (iv) state income taxes. The net deferred tax asset primarily relates to differences between the financial statement basis and tax basis for investments in unconsolidated joint ventures, accrued warranties and accrued benefits. Additionally, the tax provision was reduced by the exclusion of pre-conversion earnings from taxable income for the three months ended March 31, 2014.
Net Income
As a result of the foregoing factors, net income during the year ended December 31, 2014 was $4.8 million compared to net income of $6.7 million during the same period in 2013.
Interest Incurred
Interest, which was incurred principally to finance land acquisition, land development and home construction, totaled $1.9 million and $1.1 million for the years ended December 31, 2014 and 2013, respectively, all of which was capitalized to real estate inventory. Interest incurred during the year ended December 31, 2014 compared to the year ended December 31, 2013 increased as a result of a higher average outstanding notes payable balance, offset partially by a decrease in the weighted average interest rate.
48
Lots Owned and Controlled
December 31, | Increase (Decrease) | ||||||||||
2014 | 2013 | Amount | % | ||||||||
Lots Owned | |||||||||||
Southern California | 120 | 169 | (49 | ) | (29 | )% | |||||
Northern California | 270 | 217 | 53 | 24 | % | ||||||
Total | 390 | 386 | 4 | 1 | % | ||||||
Lots Controlled (1) | |||||||||||
Southern California | 339 | 254 | 85 | 33 | % | ||||||
Northern California | 200 | 153 | 47 | 31 | % | ||||||
Fee Building Projects (2) | 1,105 | 1,311 | (206 | ) | (16 | )% | |||||
Total | 1,644 | 1,718 | (74 | ) | (4 | )% | |||||
Total Lots Owned and Controlled | 2,034 | 2,104 | (70 | ) | (3 | )% | |||||
(1) | Includes lots that we control under purchase and sale agreements or under executed non-binding letters of intent that are subject to customary conditions and have not yet closed. There can be no assurance that such acquisitions will occur. |
(2) | Subject to agreements with property owners. |
Year Ended December 31, 2013 Compared to Year Ended December 31, 2012
Net New Home Orders and Backlog
Year Ended December 31, | Increase (Decrease) | |||||||||||||
2013 | 2012 | Amount | % | |||||||||||
Net new home orders | 72 | 72 | — | — | % | |||||||||
Cancellation rate | 20 | % | 16 | % | 4 | % | 25 | % | ||||||
Average selling communities | 3.0 | 4.0 | (1.0 | ) | (25 | )% | ||||||||
Selling communities at end of period | 3 | 3 | — | — | % | |||||||||
Backlog (dollar value) | $ | 11,867,000 | $ | 10,593,000 | $ | 1,274,000 | 12 | % | ||||||
Backlog (homes) | 15 | 26 | (11 | ) | (42 | )% | ||||||||
Average sales price of backlog | $ | 791,000 | $ | 407,000 | $ | 384,000 | 94 | % | ||||||
Net new home orders for the years ended December 31, 2013 and 2012 were 72 for both periods. Our overall “absorption rate” (the rate at which home orders are contracted, net of cancellations) for the year ended December 31, 2013 was 24.0 per average selling community (2.0 monthly), compared to 18.0 per average selling community (1.7 monthly) during the same period in 2012.
Our cancellation rate, excluding our unconsolidated joint ventures, of buyers who contracted to buy a home, but did not close escrow (as a percentage of overall orders), was approximately 20% for the year ended December 31, 2013 as compared to 16% for the same period in 2012. Our average number of selling communities decreased by one for the year ended December 31, 2013 compared to the same period in 2012.
Backlog reflects the number of homes, net of actual cancellations, for which we have entered into a sales contract with a customer, but for which we have not yet delivered the home. Backlog has not been reduced to reflect our historical cancellation rate. Homes in backlog are generally closed within three to six months, although we may experience cancellations of sales contracts prior to delivery. The number of homes in backlog as of December 31, 2013 compared to December 31, 2012 decreased 42% as a result of a 55% increase in new home deliveries and no change in net new home orders. The dollar value of backlog increased $1.3 million, or 12%, as of December 31, 2013 compared to December 31, 2012 primarily due to an increase in average sales price of the homes in backlog. The average sales price of backlog increased by $384,000, or 94%, during the year ended December 31, 2013 primarily due to a change in product mix, driven by the introduction of sales in a higher priced community during the same period. The increase in the dollar amount of backlog generally results in an increase in operating revenues in subsequent periods.
49
Home Sales Revenue and New Homes Delivered
Year Ended December 31, | Increase (Decrease) | |||||||||||||
2013 | 2012 | Amount | % | |||||||||||
New homes delivered | 82 | 53 | 29 | 55 | % | |||||||||
Home sales revenue | $ | 35,662,980 | $ | 24,197,956 | $ | 11,465,024 | 47 | % | ||||||
Average sales price of homes delivered | $ | 435,000 | $ | 457,000 | $ | (22,000 | ) | (5 | )% | |||||
New home deliveries increased by 29, or 55%, during the year ended December 31, 2013 compared to the same period in 2012. The increase in new home deliveries was primarily attributable to an increase in deliveries at one community in Northern California to 62, from 9 for the years ended December 31, 2013 and 2012, respectively.
During the year ended December 31, 2013, average sales price of homes delivered decreased $22,000, or 5%, from the same period in 2012. This increase is primarily due to a slight change in product mix.
Homebuilding
Year Ended December 31, | |||||||||||||
2013 | % | 2012 | % | ||||||||||
Home sales | $ | 35,662,980 | 100.0 | % | $ | 24,197,956 | 100.0 | % | |||||
Cost of home sales | 28,979,493 | 81.3 | % | 20,779,338 | 85.9 | % | |||||||
Homebuilding gross margin | 6,683,487 | 18.7 | % | 3,418,618 | 14.1 | % | |||||||
Add: interest in cost of home sales | 549,971 | 1.5 | % | 328,245 | 1.4 | % | |||||||
Adjusted homebuilding gross margin(1) | $ | 7,233,458 | 20.2 | % | $ | 3,746,863 | 15.5 | % | |||||
Homebuilding gross margin percentage | 18.7 | % | 14.1 | % | |||||||||
Adjusted homebuilding gross margin percentage(1) | 20.2 | % | 15.5 | % | |||||||||
(1) | Non-GAAP financial measure (as discussed below). |
Cost of home sales includes the cost of land, land development, home construction, capitalized interest, indirect costs of construction, estimated warranty costs, real estate taxes and direct costs incurred during development and home construction that benefit the project and is dependent upon the number of new home deliveries and the price at which we can acquire land and raw materials. Cost of home sales increased to $29.0 million from $20.8 million during the year ended December 31, 2013 when compared to the same period in 2012. The increase in cost of home sales primarily relates to the 55% increase in new home deliveries.
Cost of home sales as a percentage of home sales revenue decreased to 81.3% from 85.9% for the year ended December 31, 2013 when compared to the same period in 2012, respectively, due to a larger number of new home deliveries from communities with a lower cost of land.
Homebuilding gross margin represents home sales revenue less cost of home sales. Our homebuilding gross margin increased to 18.7% for the year ended December 31, 2013 as compared to 14.1% for the same period in 2012 primarily due to a shift in product mix to higher margin communities and improved overall market conditions.
Excluding interest in cost of home sales, adjusted homebuilding gross margin percentage was 20.2% for the year ended December 31, 2013, compared to 15.5% for the same period in 2012. Adjusted homebuilding gross margin is a non-GAAP financial measure. We believe that by adding interest in cost of home sales back to homebuilding gross margin, investors are able to assess the performance of our homebuilding business excluding our interest cost, allowing a focus on the performance of the underlying homebuilding operations. We believe this information is meaningful as it isolates the impact that leverage has on homebuilding gross margin and permits investors to make better comparisons with our competitors who adjust gross margins in a similar fashion. See the table above reconciling this non-GAAP financial measure to homebuilding gross margin, the nearest GAAP equivalent.
50
Fee Building
Year Ended December 31, | |||||||||||||
2013 | % | 2012 | % | ||||||||||
Fee building revenues | $ | 47,565,505 | 100.0 | % | $ | 28,268,675 | 100.0 | % | |||||
Cost of fee building | 42,317,737 | 89.0 | % | 26,505,042 | 93.8 | % | |||||||
Fee building gross margin | $ | 5,247,768 | 11.0 | % | $ | 1,763,633 | 6.2 | % | |||||
As of December 31, 2013 and 2012, we had 11 and five, respectively, fee building agreements with independent third-party land owners and 11 and four, respectively, construction management agreements with our unconsolidated joint ventures to provide construction management services. Fee building revenue increased to $47.6 million for the year ended December 31, 2013 compared to $28.3 million for the same period during 2012. The increase in fee building revenue and cost is due to the six new fee building agreements with increased construction activity during the year ended December 31, 2013 and the increase in management fees from unconsolidated joint ventures primarily as a result of increased new home deliveries from unconsolidated joint ventures during the year ended December 31, 2013.
We collect management fees from our unconsolidated joint ventures over the life of the project, and these fees increase as homes are delivered. Management fees were $8.3 million and $2.9 million for the years ended December 31, 2013 and 2012, respectively, and are included in fee building revenues. The 186% increase in management fees from unconsolidated joint ventures was the primary reason fee building gross margin percentage increased to 11.0% from 6.2% for the years ended December 31, 2013 and 2012, respectively.
Cost of fee building increased to $42.3 million for the year ended December 31, 2013 compared to $26.5 million for the same period during 2012. Cost of fee building includes overhead expenses that are attributable to the fee building projects and direct labor, subcontractor costs and other indirect project costs that are reimbursed by the independent third-party land owner. The amount of reimbursable labor, subcontractor and indirect project costs are primarily driven by the pace at which the land owner has us execute its development plan. The amount of overhead expenses included in cost of fee building were $5.4 million and $3.1 million for the years ended December 31, 2013 and 2012, respectively.
Abandoned Project Costs
Pre-acquisition costs, which consist primarily of due diligence costs for specific projects, are expensed to abandoned project costs when we determine continuation of the respective project is not probable. During the year ended December 31, 2013, abandoned project costs increased to $0.9 million from $0.4 million during the year ended December 31, 2012, primarily due to the increase in project investigation activity.
Equity in Net Income (Loss) of Unconsolidated Joint Ventures
As of December 31, 2013 and 2012, we had ownership interests in eleven and five, respectively, unconsolidated joint ventures. We own economic interests in our unconsolidated joint ventures, which include our capital interests that generally range from 5% to 50% plus, in each case, a share of the distributions from the joint ventures in excess of our capital interest. These economic interests vary among our joint ventures. The unconsolidated joint ventures produced $35.4 million and $8.7 million in net income during the years ended December 31, 2013 and 2012, respectively. Our equity in net income from unconsolidated joint ventures was $4.7 million for the year ended December 31, 2013, compared to equity in net income of $0.3 million for the same period in 2012. The change was primarily due to the 148 and 42 new home deliveries during the years ended December 31, 2013 and 2012, respectively, partially offset by losses from unconsolidated joint ventures that are not yet delivering homes.
The following sets forth supplemental operational and financial information about our unconsolidated joint ventures. Such information is not included in our financial data for GAAP purposes, but is recognized in our results of operations as a component of equity in net income (loss) of unconsolidated joint ventures. This data is included for informational purposes only.
51
Year Ended December 31, | Increase (Decrease) | |||||||||||||
2013 | 2012 | Amount | % | |||||||||||
Unconsolidated Joint Ventures—Net New Home Orders, Backlog, Revenues and Deliveries | ||||||||||||||
Net new home orders | 156 | 96 | 60 | 63 | % | |||||||||
Cancellation rate | 7 | % | 5 | % | 2 | % | 40 | % | ||||||
Average selling communities | 3.6 | 3.0 | 0.6 | 20 | % | |||||||||
Selling communities at end of period | 6 | 3 | 3 | 100 | % | |||||||||
Backlog (dollar value) | $ | 42,570,000 | $ | 72,921,000 | $ | (30,351,000 | ) | (42 | )% | |||||
Backlog (homes) | 62 | 54 | 8 | 15 | % | |||||||||
Average sales price of backlog | $ | 687,000 | $ | 1,350,000 | $ | (663,000 | ) | (49 | )% | |||||
New homes delivered | 148 | 42 | 106 | 252 | % | |||||||||
Home sales revenue | $ | 183,038,268 | $ | 56,018,517 | $ | 127,019,751 | 227 | % | ||||||
Average sales price of homes delivered | $ | 1,237,000 | $ | 1,334,000 | $ | (97,000 | ) | (7 | )% | |||||
Net new home orders from unconsolidated joint ventures increased to 156 from 96, or 63%, for the years ended December 31, 2013 and 2012, respectively, primarily due to the opening of six new selling communities, offset by the closeout of three selling communities. The absorption rate for unconsolidated joint ventures for the year ended December 31, 2013 was 43.3 per average selling community (3.6 monthly), compared to 32 per average selling community (5.3 monthly) during the same period in 2012.
The cancellation rate of unconsolidated joint venture projects was approximately 7% for the year ended December 31, 2013 as compared to 5% for the same period in 2012. The dollar value and average sales price of backlog as of December 31, 2013 compared to December 31, 2012 decreased due to the closeout of three higher priced communities in Irvine, CA and the increase in net new home orders at four lower priced communities in Santa Clarita, CA during the year ended December 31, 2013. The number of homes in backlog from unconsolidated joint ventures as of December 31, 2013 increased 15% from December 31, 2012 primarily due to the 63% increase in net new home orders, offset partially by an increase in new home deliveries.
New homes delivered from unconsolidated joint ventures increased to 148 from 42, or 252%, for the periods ended December 31, 2013 and 2012, respectively, primarily due to an increase in community count and the 2012 period only having deliveries in the last three months of the year compared to a full year of activity in 2013. The increase in new home deliveries also lead to a significant increase in home sales revenue from unconsolidated joint ventures to $183.0 million from $56.0 million, or 227%, during the years ended December 31, 2013 and 2012, respectively. The average sales price of homes delivered saw a slight decrease during the year ended December 31, 2013 compared to the same period in 2012 due to the introduction of deliveries in a lower priced community in Santa Clarita, CA.
Year Ended December 31, | |||||||||||||
2013 | % | 2012 | % | ||||||||||
Unconsolidated Joint Ventures—Homebuilding | |||||||||||||
Unconsolidated joint ventures home sales | $ | 183,038,268 | 100.0 | % | $ | 56,018,517 | 100.0 | % | |||||
Cost of unconsolidated joint ventures home sales | 133,310,014 | 72.8 | % | 41,548,236 | 74.2 | % | |||||||
Unconsolidated joint ventures homebuilding gross margin | 49,728,254 | 27.2 | % | 14,470,281 | 25.8 | % | |||||||
Add: interest in cost of unconsolidated joint venture home sales | 3,256,806 | 1.8 | % | 1,358,380 | 2.4 | % | |||||||
Adjusted unconsolidated joint ventures homebuilding gross margin (1) | $ | 52,985,060 | 29.0 | % | $ | 15,828,661 | 28.2 | % | |||||
Unconsolidated joint ventures homebuilding gross margin percentage | 27.2 | % | 25.8 | % | |||||||||
Adjusted unconsolidated joint ventures homebuilding gross margin percentage (1) | 29.0 | % | 28.2 | % | |||||||||
(1) | Non-GAAP financial measure (as discussed below). |
Excluding interest in cost of home sales, adjusted unconsolidated joint ventures homebuilding gross margin percentage was 29.0% for the year ended December 31, 2013, compared to 28.2% for the same period in 2012. Adjusted unconsolidated
52
joint ventures homebuilding gross margin is a non-GAAP financial measure. We believe that by adding interest in cost of unconsolidated joint venture home sales back to unconsolidated joint ventures homebuilding gross margin, investors are able to assess the performance of our unconsolidated joint venture business excluding interest cost, allowing a focus on the performance of the underlying unconsolidated joint venture homebuilding operations. We believe this information is meaningful as it isolates the impact that leverage has on unconsolidated joint venture homebuilding gross margin and permits investors to make better comparisons with our competitors who adjust gross margins in a similar fashion. See the table above reconciling this non-GAAP financial measure to unconsolidated joint venture homebuilding gross margin, the nearest GAAP equivalent.
The table below summarizes lots owned and controlled by our unconsolidated joint ventures as of the dates presented:
December 31, | Increase (Decrease) | ||||||||||
2013 | 2012 | Amount | % | ||||||||
Unconsolidated Joint Ventures—Lots Owned and Controlled | |||||||||||
Lots owned | 1,694 | 766 | 928 | 121 | % | ||||||
Lots controlled (1) | 1,279 | 1,042 | 237 | 23 | % | ||||||
Total | 2,973 | 1,808 | 1,165 | 64 | % | ||||||
(1) | Consists of 1,279 lots and 1,042 lots that are under purchase and sale agreements, as of December 31, 2013 and 2012, respectively. |
During the year ended December 31, 2013, the number of lots owned by our unconsolidated joint ventures increased by 928 due to the acquisition of 1,076 lots, offset by 148 new home deliveries.
Selling, General and Administrative Expenses
Year Ended December 31, | As a Percentage of Home Sales Revenue | ||||||||||||
2013 | 2012 | 2013 | 2012 | ||||||||||
Selling and marketing expenses | $ | 1,771,771 | $ | 1,677,058 | 5.0 | % | 6.9 | % | |||||
General and administrative expenses (“G&A”) | 7,107,518 | 4,474,949 | 19.9 | % | 18.5 | % | |||||||
Total selling, marketing and G&A | $ | 8,879,289 | $ | 6,152,007 | 24.9 | % | 25.4 | % | |||||
Selling and marketing expense incurred during the year ended December 31, 2013 decreased to 5.0% of home sales revenue compared to 6.9% for the same period in 2012. The decrease in selling and marketing expense is primarily due to a 47% increase in home sales revenue during the year ended December 31, 2013 as compared to the same period in 2012 and a decrease in the amount of outside broker commission payments during the year ended December 31, 2013.
During the year ended December 31, 2013, G&A expenses increased to $7.1 million from $4.5 million for the same period in 2012, primarily due to a 65% increase in personnel as a result of the increase in, and level of activity of our projects. G&A expenses as a percentage of home sales revenue increased to 19.9% for the year ended December 31, 2013 from 18.5% for the year ended December 31, 2012 also due to the 65% increase in personnel.
Guaranty Fee Income
During the years ended December 31, 2013 and 2012, we recognized $113,562 and $85,172 respectively in guaranty fee income from one of our unconsolidated joint ventures for certain loan guaranties provided over a 12-month period by us on behalf of the unconsolidated joint venture. The loan guaranties were outstanding for a full year in the 2013 period, compared to only nine months in the 2012 period. As a result, guaranty fee income increased slightly during the year ended December 31, 2013 as compared to the same period in 2012.
Other Expense, Net
Other expense, net increased slightly during the year ended December 31, 2013 compared to the same period in 2012 due to an increase in fees paid to state regulatory agencies.
53
Provision For Taxes
We were a limited liability company during the years ended December 31, 2013 and 2012 which is treated as a partnership for income tax purposes and is subject to certain minimal taxes and fees; however, income taxes on taxable income or losses realized by us are the obligation of the members. We have a subsidiary that is treated as a C Corporation, and Federal and state income taxes are provided for this entity.
Provision for income taxes increased to $0.3 million for the year ended December 31, 2013 compared to $71,255 for the year ended December 31, 2012. The increase in provision for income taxes is primarily due to the increase in income from fee building activity during the year ended December 31, 2013 compared to the year ended December 31, 2012.
Net Income (Loss)
As a result of the foregoing factors, net income during the year ended December 31, 2013 was $6.7 million compared to a net loss during the same period in 2012 of $1.4 million.
Interest Incurred
Interest, which was incurred principally to finance land acquisition, land development and home construction, totaled $1.1 million and $0.6 million for the year ended December 31, 2013 and 2012, respectively, all of which was capitalized to real estate inventory. The increase in interest incurred during the year ended December 31, 2013 compared to the year ended December 31, 2012 was primarily attributable to our increase in average outstanding debt balances, which was the result of the increase in the number of projects and the growth in our real estate inventory.
Lots Owned and Controlled
December 31, | Increase (Decrease) | ||||||||||
2013 | 2012 | Amount | % | ||||||||
Lots Owned | |||||||||||
Southern California | 169 | 150 | 19 | 13 | % | ||||||
Northern California | 217 | 219 | (2 | ) | (1 | )% | |||||
Total | 386 | 369 | 17 | 5 | % | ||||||
Lots Controlled (1) | |||||||||||
Southern California | 254 | 107 | 147 | 137 | % | ||||||
Northern California | 153 | 108 | 45 | 42 | % | ||||||
Fee Building Projects (2) | 1,311 | 234 | 1,077 | 460 | % | ||||||
Total | 1,718 | 449 | 1,269 | 283 | % | ||||||
Total Lots Owned and Controlled | 2,104 | 818 | 1,286 | 157 | % | ||||||
(1) | Includes 260 and 183 lots as of December 31, 2013 and 2012, respectively, that are under purchase contracts and 147 and 32 lots that are under non-binding letters of intent as of December 31, 2013 and 2012, respectively. |
(2) | Subject to agreements with property owners. |
Our lots owned increased 5% to 386 as of December 31, 2013 primarily due to the acquisition of three communities containing 101 lots, offset by new home deliveries.
Liquidity and Capital Resources
Overview
Our principal uses of capital for the year ended December 31, 2014 were land purchases, land development, home construction, investments in unconsolidated joint ventures, operating expenses and the payment of routine liabilities. Our principal source of capital for the year ended December 31, 2014 was the sale of common stock in our IPO and secondarily, advances from our unsecured credit facility.
Cash flows for each of our communities depend on their stage in the development cycle, and can differ substantially from reported earnings. Early stages of development or expansion require significant cash outlays for land acquisitions, entitlements and other approvals, and construction of model homes, roads, utilities, general landscaping and other amenities. Because these costs are a component of our real estate inventories and not recognized in our consolidated statement of operations until a home
54
is delivered, we incur significant cash outlays prior to our recognition of earnings. In the later stages of community development, cash inflows may significantly exceed earnings reported for financial statement purposes, as the cash outflow associated with home and land construction was previously incurred. From a liquidity standpoint, we and our unconsolidated joint ventures are actively acquiring and developing lots to increase our lot supply and community count. As we continue to expand our business, we expect cash outlays for land purchases and land development to exceed our cash generated by operations. During the year ended December 31, 2014, we delivered 53 homes and purchased 136 lots. During the year ended December 31, 2013, we delivered 82 homes and purchased 101 lots. During the year ended December 31, 2014, our unconsolidated joint ventures delivered 275 homes, 266 lots, and purchased 2,504 lots. During the year ended December 31, 2013, our unconsolidated joint ventures delivered 148 homes, no lots, and purchased 1,076 lots.
We exercise strict controls and believe we have a prudent strategy for company-wide cash management, including those related to cash outlays for land and inventory acquisition, development and investments in unconsolidated joint ventures. We ended 2014 with $44.1 million of cash and cash equivalents, a $34.5 million increase from December 31, 2013, primarily as a result of $75.8 million in net proceeds from our IPO and net advances from our notes payable of $95.9 million, partially offset by real estate inventory expenditures of $119.6 million and net contributions to unconsolidated joint ventures of $24.0 million. We intend to generate cash from the sale of our inventory, net of loan release payments on our notes payable when applicable, but we intend to redeploy the net cash generated from the sale of inventory to acquire and develop strategic and well-positioned lots that represent opportunities to generate future income.
As of December 31, 2014 and 2013, we had $11.9 million and $6.1 million, respectively, in accounts payable that related to costs incurred under our fee building agreements. Funding to pay these amounts is the obligation of the independent third-party land owner, which is generally funded on a monthly basis. Similarly, contracts and account receivable as of the same dates included $13.2 million and $6.6 million, respectively, related to the payment of the above payables. As of December 31, 2014, we have not experienced any losses from uncollectable contracts and accounts receivable related to our fee building projects.
We intend to employ both debt and equity as part of our ongoing financing strategy, coupled with redeployment of cash flows from continuing operations, to provide us with the financial flexibility to access capital on favorable terms. In that regard, we expect to employ prudent levels of leverage to finance the acquisition and development of our lots and construction of our homes. As of December 31, 2014, we had $144.0 million of aggregate loan commitments, of which $113.8 million was outstanding. We will consider a number of factors when evaluating our level of indebtedness and when making decisions regarding the incurrence of new indebtedness, including the purchase price of assets to be acquired with debt financing, the estimated market value of our assets and the ability of particular assets, and our company as a whole, to generate cash flow to cover the expected debt service. As a means of sustaining our long-term financial health and limiting our exposure to unforeseen dislocations in the debt and financing markets, we currently expect to remain conservatively capitalized. However, our charter does not contain a limitation on the amount of debt we may incur and our board of directors may change our target debt levels at any time without the approval of our stockholders.
We intend to finance future acquisitions and developments with the most advantageous source of capital available to us at the time of the transaction, which may include a combination of common and preferred equity, secured and unsecured corporate level debt, property-level debt and mortgage financing and other public, private or bank debt.
Land Acquisition Notes
During 2012, we entered into a note with a land seller, secured by real estate, which bears interest at 7.0% per annum. The note provides for a commitment of $9.5 million all of which had been funded as of December 31, 2014. During February 2015, we made a principal reduction payment of $2.5 million and extended the maturity date of the note. The note matures on the earlier of (i) 10 days following entitlement approval, or (ii) February 15, 2016 and requires certain mandatory pay downs totaling $1.0 million based on the occurrence of certain project-related events. Interest is payable monthly and the remaining principal is due at maturity.
In March 2014, we acquired real estate with a purchase price of $21.5 million. Concurrent with this transaction we entered into a $17.0 million note with the land seller, secured by real estate, which bore interest at 1.0% per annum. The note matured on June 30, 2014 and was repaid in full.
Secured Revolving Construction Notes
In May 2014, we entered into two secured revolving construction loans with a bank related to model and production homes for a specific project. The loans are secured by real estate and bear interest at the bank's prime rate plus 2.0%, or 5.25% at December 31, 2014. The total commitment under the construction loans is $9.5 million, with funding and repayment requirements based on the project development and sales cycle. As of December 31, 2014, we had $5.7 million available to borrow under the revolving construction loans. The loans mature on November 27, 2016. Interest is payable monthly, with all unpaid principal and interest due at maturity.
55
Senior Unsecured Revolving Credit Facility
As of December 31, 2014, we were party to a senior unsecured revolving credit facility ("Credit Facility") which has a maximum commitment of $125.0 million and matures on June 26, 2017. We may borrow under our Credit Facility in the ordinary course of business for general corporate purposes. Interest on the Credit Facility is paid monthly at a rate of the one-month LIBOR plus a margin ranging from 2.25% to 3.00% depending on our leverage ratio as calculated at the end of each fiscal quarter. As of December 31, 2014, the outstanding principal balance was $100.5 million, the interest rate was 2.41% per annum, and we had $24.5 million of availability under the Credit Facility.
Covenant Compliance
Under our Credit Facility, we are required to comply with certain financial covenants, including but not limited to those set forth in the table below:
Financial Covenant | Actual at December 31, 2014 | Covenant Requirement at December 31, 2014 | |||||
Unencumbered Liquid Assets | $ | 44,057,589 | $ | 5,000,000 | |||
EBITDA to Interest Incurred | 3.9 : 1.0 | > 1.5 : 1.0 | |||||
Tangible Net Worth | $ | 145,421,255 | $ | 108,420,451 | |||
Leverage Ratio | 34 | % | < 75% | ||||
Adjusted Leverage Ratio | 48 | % | < 125% | ||||
As of December 31, 2014 and 2013, we were in compliance with all financial covenants.
We believe that our leverage ratios provide useful information to the users of our financial statements regarding our financial position and cash and debt management. The ratio of debt-to-capital and the ratio of net debt-to-capital are calculated as follows:
December 31, | |||||||
2014 | 2013 | ||||||
Notes payable | $ | 113,751,334 | $ | 17,883,338 | |||
Equity, exclusive of noncontrolling interest | 148,083,678 | 64,355,719 | |||||
Total capital | $ | 261,835,012 | $ | 82,239,057 | |||
Ratio of debt-to-capital (1) | 43.4 | % | 21.7 | % | |||
Notes payable | $ | 113,751,334 | $ | 17,883,338 | |||
Less: cash, cash equivalents and restricted cash | 44,340,090 | 9,671,576 | |||||
Net debt | 69,411,244 | 8,211,762 | |||||
Equity, exclusive of noncontrolling interest | 148,083,678 | 64,355,719 | |||||
Total capital | $ | 217,494,922 | $ | 72,567,481 | |||
Ratio of net debt-to-capital (2) | 31.9 | % | 11.3 | % | |||
(1) | The ratio of debt-to-capital is computed as the quotient obtained by dividing notes payable by the sum of total notes payable plus equity, exclusive of noncontrolling interest. |
(2) | The ratio of net debt-to-capital is computed as the quotient obtained by dividing net debt (which is notes payable less cash to the extent necessary to reduce the debt balance to zero) by total capital, exclusive of noncontrolling interest. The most directly comparable GAAP financial measure is the ratio of debt-to-capital. We believe the ratio of net debt-to-capital is a relevant financial measure for investors to understand the leverage employed in our operations and as an indicator of our ability to obtain financing. We believe that by deducting our cash from our notes payable, we provide a measure of our indebtedness that takes into account our cash liquidity. We believe this provides useful information as the ratio of debt-to-capital does not take into account our liquidity and we believe that the ratio net of cash provides supplemental information by which our financial position may be considered. Investors may also find this to be helpful when comparing our leverage to the leverage of our competitors that present similar information. See the table above reconciling this non-GAAP financial measure to the ratio of debt-to-capital. |
56
Cash Flows — Year Ended December 31, 2014 Compared to Year Ended December 31, 2013
For the year ended December 31, 2014 as compared to the year ended December 31, 2013, the comparison of cash flows is as follows:
• | Net cash used in operating activities was $112.2 million in the 2014 period versus $11.8 million in the 2013 period. The change was primarily a result of an increase in cash outflows for real estate inventories to $119.6 million in the 2014 period compared to $21.8 million in the 2013 period. The increase in real estate inventories resulted primarily from the acquisition of 136 lots and increased development activity at the Company’s existing projects. |
• | Net cash used in investing activities was $24.9 million in the 2014 period compared to $8.5 million in the 2013 period. During the year ended December 31, 2014, our net contributions to unconsolidated joint ventures increased to $24.0 million compared to $8.1 million during the year ended December 31, 2013 and was the primary reason net cash used in investing activities increased. |
• | Net cash provided by financing activities was $171.6 million in the 2014 period versus $23.8 million in the 2013 period. The change was primarily a result of the receipt of proceeds of our IPO of $75.8 million, net of the underwriting discount and offering expenses, compared to contributions from members of $21.6 million in the 2013 period. In addition, net borrowings of notes payable were $95.9 million during the 2014 period versus $2.2 million during the 2013 period. |
As of December 31, 2014, our unrestricted cash balance was $44.1 million. In January 2014, we completed an IPO of our common stock and received proceeds of $75.8 million, net of the underwriting discount and offering expenses. We intend to use the proceeds for the acquisition of land, including the land described under "Off-Balance Sheet Arrangements and Contractual Obligations" and for development, home construction, investment in joint ventures and other related purposes.
Based on the foregoing, we believe we have sufficient cash and sources of financing for at least the next twelve months.
Off-Balance Sheet Arrangements and Contractual Obligations
In the ordinary course of business, we enter into land option contracts in order to procure lots for the construction of our homes. We are subject to customary obligations associated with entering into contracts for the purchase of land and improved lots. These purchase contracts typically require a cash deposit and the purchase of properties under these contracts is generally contingent upon satisfaction of certain requirements by the sellers, including obtaining applicable property and development entitlements. We also utilize option contracts with land sellers as a method of acquiring land in staged takedowns, to help us manage the financial and market risk associated with land holdings, to reduce the use of funds from our corporate financing sources, and to enhance our return on equity. Option contracts generally require a non-refundable deposit for the right to acquire lots over a specified period of time at pre-determined prices. We generally have the right at our discretion to terminate our obligations under both purchase contracts and option contracts by forfeiting our cash deposit with no further financial responsibility to the land seller. As of December 31, 2014, we had $6.1 million of non-refundable cash deposits and no refundable cash deposits pertaining to land option contracts and purchase contracts with an aggregate remaining purchase price of $196.0 million (net of deposits).
Our utilization of land option contracts is dependent on, among other things, the availability of land sellers willing to enter into option arrangements, the availability of capital to financial intermediaries to finance the development of optioned lots, general housing market conditions, and local market dynamics. Options may be more difficult to procure from land sellers in strong housing markets and are more prevalent in certain geographic regions.
As of December 31, 2014, the outstanding principal balance of our Credit Facility was $100.5 million, the interest rate was 2.41% per annum and we had approximately $24.5 million of availability. As of December 31, 2014, the outstanding principal balance of our secured revolving construction loans was $3.8 million, the interest rate was 5.25% per annum and we had approximately $5.7 million of availability under the construction loans.
We expect that the obligations under our Credit Facility and other loan agreements will generally be satisfied in the ordinary course of business and in accordance with applicable contractual terms.
57
Off-Balance Sheet Arrangements
As of December 31, 2014, we held membership interests in 12 unconsolidated joint ventures, eight of which related to homebuilding activities and four related to land development as noted below. We were a party to four loan-to-value maintenance agreements related to unconsolidated joint ventures as of December 31, 2014. The following table reflects certain financial and other information related to our unconsolidated joint ventures as of December 31, 2014 (in thousands):
December 31, 2014 | |||||||||||||||||||||||||
Year Formed | Location | Total Joint Venture | Debt-to-Total Capitalization | Loan-to- Value Maintenance Agreement | Future Capital Commitment(2) | ||||||||||||||||||||
Joint Venture (Project) Name | Assets | Debt(1) | Equity | ||||||||||||||||||||||
(Dollars in 000's) | |||||||||||||||||||||||||
LR8 Investors, LLC (Lambert Ranch) | 2010 | Irvine, Orange County | $ | 4,517 | $ | — | $ | 2,041 | — | % | N/A | $ | — | ||||||||||||
Larkspur Land 8 Investors, LLC (Rose Lane) | 2011 | Larkspur, Marin County | 38,559 | 11,341 | 22,968 | 33 | % | Yes | — | ||||||||||||||||
TNHC-HW San Jose LLC (Orchard Park) | 2012 | San Jose, Santa Clara County | 77,959 | 25,513 | 47,438 | 35 | % | Yes | — | ||||||||||||||||
TNHC-TCN Santa Clarita LP (Villa Metro) (3) | 2012 | Valencia, Los Angeles County | 29,477 | 6,795 | 19,200 | 26 | % | Yes | — | ||||||||||||||||
TNHC Newport LLC (Meridian)(3) | 2013 | Newport Beach, Orange County | 92,276 | 21,999 | 60,734 | 27 | % | Yes | — | ||||||||||||||||
Encore McKinley Village LLC (McKinley Village) (4) | 2013 | Sacramento, Sacramento County | 25,736 | 2,346 | 22,638 | 9 | % | No | 3,380 | ||||||||||||||||
TNHC San Juan LLC (Oliva) | 2013 | San Juan Capistrano, Orange County | 25,085 | — | 24,024 | — | % | N/A | 1,242 | ||||||||||||||||
TNHC Russell Ranch LLC (Russell Ranch) (3)(4)(5) | 2013 | Folsom, Sacramento County | 37,538 | 20,000 | 17,066 | 54 | % | No | 13,166 | ||||||||||||||||
TNHC-HW Foster City LLC (Foster Square)(5) | 2013 | Foster City, San Mateo County | 23,010 | — | 2,812 | — | % | N/A | — | ||||||||||||||||
Calabasas Village LP (Avanti)(3) | 2013 | Calabasas, Los Angeles County | 28,752 | — | 26,968 | — | % | N/A | 220 | ||||||||||||||||
TNHC-HW Cannery LLC (Cannery Park)(5) | 2013 | Davis, Yolo County | 50,249 | — | 47,264 | — | % | N/A | — | ||||||||||||||||
Arantine Hills Holdings LP (Bedford Ranch)(3)(5) | 2014 | Corona, Riverside County | 88,452 | — | 87,862 | — | % | N/A | 2,500 | ||||||||||||||||
Total Unconsolidated Joint Ventures | $ | 521,610 | $ | 87,994 | $ | 381,015 | 19 | % | $ | 20,508 | |||||||||||||||
(1) | Scheduled maturities of the unconsolidated joint venture debt as of December 31, 2014 are as follows: $11.3 million matures in 2015, $40.3 million matures in 2016, $34.0 million matures in 2017, $0 matures in 2018 and $2.3 million matures in 2019. |
(2) | Future capital commitment represents our proportionate share of estimated future contributions to the respective unconsolidated joint ventures as of December 31, 2014. Actual contributions may differ materially. |
(3) | Certain members of the Company's board of directors are affiliated with entities that have an investment in these joint ventures. |
(4) | The debt associated with this joint venture consists of a land seller note. |
(5) | Land development joint ventures. |
As of December 31, 2014, the unconsolidated joint ventures were in compliance with their respective loan covenants, where applicable, and we did not make any loan-to-value maintenance related payments during the year ended December 31, 2014.
58
Contractual Obligations Table
The following table summarized our future estimated cash payments under existing contractual obligations as of December 31, 2014, including estimated cash payments due by period. Our purchase obligations primarily represent commitments for land purchases under purchase and land option contracts with non-refundable deposits and commitments for subcontractor labor and material to be utilized in the normal course of business.
Payments Due By Period | ||||||||||||||||||||
Contractual Obligations | Total | Less than 1 Year | 1-3 Years | 4-5 Years | More than 5 Years | |||||||||||||||
Long-term debt principal payments (1) | $ | 113,751,334 | $ | 888,929 | $ | 112,862,405 | $ | — | $ | — | ||||||||||
Long-term interest payments | 7,233,051 | 3,294,419 | 3,938,632 | — | — | |||||||||||||||
Operating leases | 2,803,021 | 781,861 | 2,021,160 | — | — | |||||||||||||||
Purchase obligations (2)(3) | 215,506,306 | 215,506,306 | — | — | — | |||||||||||||||
Total | $ | 339,293,712 | $ | 220,471,515 | $ | 118,822,197 | $ | — | $ | — | ||||||||||
(1) | Long-term debt represents our senior unsecured revolving credit facility, two construction loans, and a note payable with a land seller. Contractual maturity for the construction loans is in the 1-3 Years category; however, the loans are secured by real estate and are paid down in conjunction with home closings. During the first quarter of 2015, the maturity of the land seller note payable was extended to 2016 in conjunction with a principal reduction payment of $2.5 million. For a more detailed description of our long-term debt, please see Note 8 of the notes to our consolidated financial statements. |
(2) | Includes $196.0 million (net of deposits) of the remaining purchase price for all land option and land purchase contracts and $19.5 million of subcontractor labor and material commitments as of December 31, 2014 for which we are responsible if the subcontractor completes the work as specified in their respective commitments, excluding purchase obligations made on behalf of the owner(s) of fee build projects for which we do not have risk of loss. |
(3) | During the first quarter of 2015, we entered into four new option contracts with one land seller for the acquisition of 195 lots in four communities within Orange County, CA with a total purchase price of $251.8 million. This amount is not reflected above. |
Inflation
Our homebuilding and fee building segments can be adversely impacted by inflation, primarily from higher land, financing, labor, material and construction costs. In addition, inflation can lead to higher mortgage rates, which can significantly affect the affordability of mortgage financing to homebuyers. While we attempt to pass on cost increases to customers through increased prices, when weak housing market conditions exist, we are often unable to offset cost increases with higher selling prices.
Seasonality
Historically, the homebuilding industry experiences seasonal fluctuations in quarterly operating results and capital requirements. We typically experience the highest new home order activity in spring and summer, although this activity is also highly dependent on the number of active selling communities, timing of new community openings and other market factors. Since it typically takes four to seven months to construct a new home, we deliver more homes in the second half of the year as spring and summer home orders convert to home deliveries. Because of this seasonality, home starts, construction costs and related cash outflows have historically been highest in the second and third quarters, and the majority of cash receipts from home deliveries occur during the second half of the year. We expect this seasonal pattern to continue over the long-term, although it may be affected by volatility in the homebuilding industry.
Critical Accounting Policies
See Note 1 to the accompanying notes to consolidated financial statements included in this Annual Report on Form 10-K.
59
Recently Issued Accounting Standards
See Note 1 to the accompanying notes to consolidated financial statements included in this Annual Report on Form 10-K.
Item 7A. | Quantitative and Qualitative Disclosures About Market Risk |
We are exposed to market risks related to fluctuations in interest rates on our outstanding variable rate debt. We did not utilize swaps, forward or option contracts on interest rates or commodities, or other types of derivative financial instruments as of or during the year ended December 31, 2014. We have not entered into and currently do not hold derivatives for trading or speculative purposes. Many of the statements contained in this section are forward looking and should be read in conjunction with our disclosures under the heading “Cautionary Note Concerning Forward-Looking Statements.”
The table below details the principal amount and the average interest rates for the outstanding debt for each category based upon the expected maturity or disposition dates. The fair value of our variable rate debt, which consists of our unsecured revolving credit facility and two secured construction loans, is based on quoted market prices for the same or similar instruments as of December 31, 2014.
Expected Maturity Date | |||||||||||||
2015 | 2016 - 2019 | Thereafter | Total | Estimate Fair Value | |||||||||
Liabilities: | |||||||||||||
Variable rate debt (1) | — | 104,251,334 | — | 104,251,334 | 104,251,334 | ||||||||
Weighted Average Interest Rate | — | % | 2.6 | % | — | % | 2.6 | % | — | % | |||
Based on the current interest rate management policies we have in place with respect to our outstanding debt, we do not believe that the future market rate risks related to the above securities will have a material adverse impact on our financial position, results of operations or liquidity.
Item 8. | Financial Statements and Supplementary Data |
The information required by this item appears beginning on page 66.
Item 9. | Changes in and Disagreements with Accountants on Accounting and Financial Disclosure |
Not Applicable.
Item 9A. | Controls and Procedures |
Our management, under the supervision and with the participation of our chief executive officer and chief financial officer, has reviewed and evaluated the effectiveness of the design and operation of our disclosure controls and procedures, as defined in Securities Exchange Act Rules 13a-15(e) and 15d-15(e), as of the end of the period covered by this Form 10-K (the “Evaluation Date”). Based on such evaluation, management has concluded that our disclosure controls and procedures were effective at the reasonable assurance level as of the Evaluation Date. In designing and evaluating the disclosure controls and procedures, management recognized that any controls and procedures, no matter how well designed and operated, can provide only reasonable assurance of achieving the desired control objectives, and management necessarily was required to apply its judgment in evaluating the cost-benefit relationship of possible controls and procedures.
Our management determined that as of December 31, 2014, there were no changes in our internal control over financial reporting that occurred during the fiscal year then ended that have materially affected, or are reasonably likely to materially affect, our internal control over financial reporting.
This annual report does not include an attestation report of our independent registered public accounting firm due to the exemption provided by the JOBS Act for emerging growth companies.
60
Item 9B. | Other Information |
None.
PART III
Item 10. | Directors, Executive Officers and Corporate Governance |
The information required in response to this item is incorporated by reference from the information contained in our 2015 Proxy Statement under the captions "Board of Directors," "Executive Officers," "Section 16(A) Beneficial Ownership Reporting Compliance," and "Corporate Governance."
Item 11. | Executive Compensation |
The information required in response to this item is incorporated by reference to our 2015 Proxy Statement under the captions "Executive Compensation," and "Corporate Governance - Compensation Committee Interlocks and Insider Participation."
Item 12. | Security Ownership of Certain Beneficial Owners and Management and Related Stockholder Matters |
The information required in response to this item is incorporated by reference to our 2015 Proxy Statement under the captions "Ownership of The New Home Company Stock" and "Equity Compensation Plan Information."
Item 13. | Certain Relationships and Related Transactions, and Director Independence |
The information required in response to this item is incorporated by reference to our 2015 Proxy Statement under the caption "Certain Relationships and Related Party Transactions."
Item 14. | Principal Accounting Fees and Services |
The information required in response to this item is incorporated by reference to our 2015 Proxy Statement under the caption "Audit Committee Matters."
61
PART IV
Item 15. | Exhibits and Financial Statement Schedules |
(a) The following documents are filed as part of this annual report on Form 10-K:
(1) | Financial Statements: |
The New Home Company Inc. | PAGE |
LR8 Investors, LLC (our unconsolidated investee) | PAGE |
Larkspur Land 8 Investors LLC (our unconsolidated investee) | PAGE |
62
TNHC Newport LLC (our unconsolidated lower tier investee) | PAGE |
TNHC Meridian Investors LLC (our unconsolidated investee) | PAGE |
TNHC-HW Foster City LLC (our unconsolidated investee) | PAGE |
(2) | Financial Statement Schedules |
All other schedules have been omitted since the required information is presented in the financial statements and the related notes or is not applicable.
(3) | Exhibits |
The exhibits filed or furnished as part of this annual report on Form 10-K are listed in the Index to Exhibits immediately preceding those exhibits, which Index is incorporated in this Item by reference.
63
REPORT OF INDEPENDENT REGISTERED PUBLIC ACCOUNTING FIRM
The Board of Directors and Stockholders of
The New Home Company Inc.
We have audited the accompanying consolidated balance sheets of The New Home Company Inc. (the "Company") as of December 31, 2014 and 2013, and the related consolidated statements of operations, equity, and cash flows for each of the three years in the period ended December 31, 2014. These financial statements are the responsibility of the Company’s management. Our responsibility is to express an opinion on these financial statements based on our audits.
We conducted our audits in accordance with the standards of the Public Company Accounting Oversight Board (United States). Those standards require that we plan and perform the audit to obtain reasonable assurance about whether the financial statements are free of material misstatement. We were not engaged to perform an audit of the Company’s internal control over financial reporting. Our audits included consideration of internal control over financial reporting as a basis for designing audit procedures that are appropriate in the circumstances, but not for the purpose of expressing an opinion on the effectiveness of the Company’s internal control over financial reporting. Accordingly, we express no such opinion. An audit also includes examining, on a test basis, evidence supporting the amounts and disclosures in the financial statements, assessing the accounting principles used and significant estimates made by management, and evaluating the overall financial statement presentation. We believe that our audits provide a reasonable basis for our opinion.
In our opinion, the financial statements referred to above present fairly, in all material respects, the consolidated financial position of The New Home Company Inc. at December 31, 2014 and 2013, and the consolidated results of its operations and its cash flows for each of the three years in the period ended December 31, 2014, in conformity with U.S. generally accepted accounting principles.
/s/ Ernst & Young LLP
Irvine, California
March 6, 2015
64
THE NEW HOME COMPANY INC.
CONSOLIDATED BALANCE SHEETS
December 31, | |||||||
2014 | 2013 | ||||||
Assets | |||||||
Cash and cash equivalents | $ | 44,057,589 | $ | 9,541,361 | |||
Restricted cash | 282,501 | 130,215 | |||||
Contracts and accounts receivable | 13,163,927 | 7,178,241 | |||||
Due from affiliates | 2,662,423 | 558,421 | |||||
Real estate inventories | 163,564,181 | 45,350,479 | |||||
Investment in unconsolidated joint ventures | 60,564,033 | 32,269,546 | |||||
Property and equipment, net of accumulated depreciation | 983,984 | 481,506 | |||||
Other assets | 6,679,468 | 3,439,527 | |||||
Total assets | $ | 291,958,106 | $ | 98,949,296 | |||
Liabilities and equity | |||||||
Accounts payable | $ | 16,580,629 | $ | 8,687,702 | |||
Accrued expenses and other liabilities | 11,200,458 | 6,851,162 | |||||
Notes payable | 113,751,334 | 17,883,338 | |||||
Total liabilities | 141,532,421 | 33,422,202 | |||||
Commitments and contingencies (Note 10) | |||||||
Equity: | |||||||
Stockholders' equity: | |||||||
Preferred stock, $0.01 par value, 50,000,000 shares authorized, no shares outstanding | — | — | |||||
Common stock, $0.01 par value, 500,000,000 shares authorized, 16,448,750 shares issued and outstanding as of December 31, 2014 | 164,488 | — | |||||
Additional paid-in capital | 143,474,637 | — | |||||
Retained earnings | 4,444,553 | — | |||||
Total The New Home Company Inc. stockholders' equity | 148,083,678 | — | |||||
Members’ equity | — | 64,355,719 | |||||
Noncontrolling interest in subsidiary | 2,342,007 | 1,171,375 | |||||
Total equity | 150,425,685 | 65,527,094 | |||||
Total liabilities and equity | $ | 291,958,106 | $ | 98,949,296 | |||
See accompanying notes to the consolidated financial statements.
65
THE NEW HOME COMPANY INC.
CONSOLIDATED STATEMENTS OF OPERATIONS
Year Ended December 31, | |||||||||||
2014 | 2013 | 2012 | |||||||||
Revenues: | |||||||||||
Home sales | $ | 56,094,345 | $ | 35,662,980 | $ | 24,197,956 | |||||
Fee building, including management fees from unconsolidated joint ventures of $9,582,442, $8,250,764 and $2,949,365, respectively | 93,562,485 | 47,565,505 | 28,268,675 | ||||||||
Land sales | — | — | 2,940,100 | ||||||||
149,656,830 | 83,228,485 | 55,406,731 | |||||||||
Expenses: | |||||||||||
Cost of homes sales | 47,660,396 | 28,979,493 | 20,779,338 | ||||||||
Cost of fee building | 89,055,951 | 42,317,737 | 26,505,042 | ||||||||
Cost of land sales | — | — | 3,261,891 | ||||||||
Abandoned project costs | 753,994 | 874,719 | 408,642 | ||||||||
Selling and marketing | 3,166,142 | 1,771,771 | 1,677,058 | ||||||||
General and administrative | 12,419,563 | 7,107,518 | 4,474,949 | ||||||||
153,056,046 | 81,051,238 | 57,106,920 | |||||||||
Equity in net income of unconsolidated joint ventures | 8,443,136 | 4,735,224 | 349,445 | ||||||||
Guaranty fee income | 18,927 | 113,562 | 85,172 | ||||||||
Other expense, net | (59,354 | ) | (30,142 | ) | (15,048 | ) | |||||
Income (loss) before taxes | 5,003,493 | 6,995,891 | (1,280,620 | ) | |||||||
Provision for taxes | (246,422 | ) | (290,386 | ) | (71,255 | ) | |||||
Net income (loss) | 4,757,071 | 6,705,505 | (1,351,875 | ) | |||||||
Net loss attributable to noncontrolling interests | 29,472 | 500 | — | ||||||||
Net income (loss) attributable to The New Home Company Inc. | $ | 4,786,543 | $ | 6,706,005 | $ | (1,351,875 | ) | ||||
Earnings (loss) per share attributable to The New Home Company Inc. | |||||||||||
Basic | $ | 0.30 | $ | 0.85 | $ | (0.27 | ) | ||||
Diluted | $ | 0.30 | $ | 0.85 | $ | (0.27 | ) | ||||
Weighted average shares outstanding: | |||||||||||
Basic | 15,927,917 | 7,905,757 | 5,044,438 | ||||||||
Diluted | 15,969,199 | 7,905,757 | 5,044,438 | ||||||||
See accompanying notes to the consolidated financial statements.
66
THE NEW HOME COMPANY INC.
CONSOLIDATED STATEMENTS OF EQUITY
Stockholders’ Equity | Members’ Equity | Noncontrolling Interest in Subsidiary | Total Equity | ||||||||||||||||||||||||||||
Number of Common Shares | Common Stock | Additional Paid-in Capital | Retained Earnings | Total Stockholders’ Equity | |||||||||||||||||||||||||||
Balance at December 31, 2011 | — | $ | — | $ | — | $ | — | $ | — | $ | 27,851,589 | $ | — | $ | 27,851,589 | ||||||||||||||||
Net loss | — | — | — | — | — | (1,351,875 | ) | — | (1,351,875 | ) | |||||||||||||||||||||
Contributions from members | — | — | — | — | — | 8,600,000 | — | 8,600,000 | |||||||||||||||||||||||
Equity-based compensation expense | — | — | — | — | — | 475,000 | — | 475,000 | |||||||||||||||||||||||
Balance at December 31, 2012 | — | — | — | — | — | 35,574,714 | — | 35,574,714 | |||||||||||||||||||||||
Net income (loss) | — | — | — | — | — | 6,706,005 | (500 | ) | 6,705,505 | ||||||||||||||||||||||
Contributions from members | — | — | — | — | — | 21,600,000 | — | 21,600,000 | |||||||||||||||||||||||
Noncontrolling interest contribution | — | — | — | — | — | — | 1,171,875 | 1,171,875 | |||||||||||||||||||||||
Equity-based compensation expense | — | — | — | — | — | 475,000 | — | 475,000 | |||||||||||||||||||||||
Balance at December 31, 2013 | — | — | — | — | — | 64,355,719 | 1,171,375 | 65,527,094 | |||||||||||||||||||||||
Net income (loss) | — | — | — | 4,444,553 | 4,444,553 | 341,990 | (29,472 | ) | 4,757,071 | ||||||||||||||||||||||
Noncontrolling interest contribution | — | — | — | — | — | — | 1,252,104 | 1,252,104 | |||||||||||||||||||||||
Noncontrolling interest distribution | — | — | — | — | — | — | (52,000 | ) | (52,000 | ) | |||||||||||||||||||||
Equity-based compensation expense | — | — | 2,005,463 | — | 2,005,463 | 316,667 | — | 2,322,130 | |||||||||||||||||||||||
Conversion of members’ equity into common stock | 8,636,250 | 86,363 | 64,928,013 | — | 65,014,376 | (65,014,376 | ) | — | — | ||||||||||||||||||||||
Issuance of common stock, net of issuance costs | 8,984,375 | 89,844 | 87,710,178 | — | 87,800,022 | — | — | 87,800,022 | |||||||||||||||||||||||
Repurchase of common stock | (1,171,875 | ) | (11,719 | ) | (11,976,562 | ) | — | (11,988,281 | ) | — | — | (11,988,281 | ) | ||||||||||||||||||
Deductible transaction costs and additional contribution of deferred tax assets from IPO | — | — | 807,545 | — | 807,545 | — | — | 807,545 | |||||||||||||||||||||||
Balance at December 31, 2014 | 16,448,750 | $ | 164,488 | $ | 143,474,637 | $ | 4,444,553 | $ | 148,083,678 | $ | — | $ | 2,342,007 | $ | 150,425,685 | ||||||||||||||||
See accompanying notes to the consolidated financial statements.
67
THE NEW HOME COMPANY INC.
CONSOLIDATED STATEMENTS OF CASH FLOWS
Year Ended December 31, | |||||||||||
2014 | 2013 | 2012 | |||||||||
Operating activities: | |||||||||||
Net income (loss) | $ | 4,757,071 | $ | 6,705,505 | $ | (1,351,875 | ) | ||||
Adjustments to reconcile net income (loss) to net cash (used in) provided by operating activities: | |||||||||||
Deferred taxes | (5,818,619 | ) | — | — | |||||||
Amortization of equity based compensation | 2,322,130 | 475,000 | 475,000 | ||||||||
Distributions of earnings from unconsolidated joint ventures | 6,039,606 | 6,930,433 | 451,504 | ||||||||
Equity in net income of unconsolidated joint ventures | (8,443,136 | ) | (4,735,224 | ) | (349,445 | ) | |||||
Depreciation | 380,785 | 200,343 | 138,833 | ||||||||
Abandoned project costs | 753,994 | 874,719 | 408,642 | ||||||||
Net changes in operating assets and liabilities: | |||||||||||
Restricted cash | (152,286 | ) | 13,905 | (67,033 | ) | ||||||
Contracts and accounts receivable | (5,985,686 | ) | (1,128,565 | ) | (5,990,359 | ) | |||||
Due from affiliates | (2,104,002 | ) | (507,261 | ) | (10,611 | ) | |||||
Real estate inventories | (119,605,884 | ) | (21,753,355 | ) | (1,286,833 | ) | |||||
Other assets | 3,386,223 | (3,197,827 | ) | (91,992 | ) | ||||||
Accounts payable | 7,892,927 | 732,669 | 7,512,987 | ||||||||
Accrued expenses and other liabilities | 4,349,296 | 3,592,071 | 1,174,398 | ||||||||
Net cash (used in) provided by operating activities | (112,227,581 | ) | (11,797,587 | ) | 1,013,216 | ||||||
Investing activities: | |||||||||||
Purchases of property and equipment | (883,263 | ) | (358,710 | ) | (218,764 | ) | |||||
Contributions to unconsolidated joint ventures | (34,609,757 | ) | (22,027,797 | ) | (10,431,175 | ) | |||||
Distributions of equity from unconsolidated joint ventures | 10,609,092 | 13,901,067 | 2,759,471 | ||||||||
Net cash used in investing activities | (24,883,928 | ) | (8,485,440 | ) | (7,890,468 | ) | |||||
Financing activities: | |||||||||||
Net proceeds from issuance of common stock | 87,800,022 | — | — | ||||||||
Repurchase of common stock | (11,988,281 | ) | — | — | |||||||
Cash contributions from members | — | 21,600,000 | 8,600,000 | ||||||||
Cash distribution to noncontrolling interest in subsidiary | (52,000 | ) | — | — | |||||||
Proceeds from issuance of unsecured notes to members | — | 1,055,000 | 1,000,000 | ||||||||
Borrowings from notes payable | 111,636,145 | 25,007,720 | 10,828,173 | ||||||||
Repayments of notes payable | (15,768,149 | ) | (23,846,260 | ) | (12,989,757 | ) | |||||
Net cash provided by financing activities | 171,627,737 | 23,816,460 | 7,438,416 | ||||||||
Net increase in cash and cash equivalents | 34,516,228 | 3,533,433 | 561,164 | ||||||||
Cash and cash equivalents – beginning of period | 9,541,361 | 6,007,928 | 5,446,764 | ||||||||
Cash and cash equivalents – end of period | $ | 44,057,589 | $ | 9,541,361 | $ | 6,007,928 | |||||
Supplemental disclosures of cash flow information | |||||||||||
Interest paid, net of amounts capitalized | $ | — | $ | — | $ | — | |||||
Taxes paid | $ | 1,470,000 | $ | 245,014 | $ | 3,380 | |||||
Supplemental disclosures of non-cash transactions | |||||||||||
Purchase of real estate with note payable to land seller | $ | 17,000,000 | $ | — | $ | 9,500,000 | |||||
Note payable with member for equity investment | $ | — | $ | 2,055,000 | $ | — | |||||
Distribution from unconsolidated joint ventures in lieu of cash | $ | — | $ | 1,083,422 | $ | — | |||||
Contribution of real estate to unconsolidated joint ventures | $ | 1,890,292 | $ | 17,052,218 | $ | — | |||||
Contribution of real estate from noncontrolling interest in subsidiary | $ | 1,252,104 | $ | 1,171,875 | $ | — | |||||
Deductible transaction costs and additional contribution of deferred tax assets from IPO | $ | 807,545 | $ | — | $ | — | |||||
See accompanying notes to the consolidated financial statements.
68
1. Organization and Summary of Significant Accounting Policies
Organization
The New Home Company Inc. (the “Company”), a Delaware Corporation, and its subsidiaries are primarily engaged in all aspects of residential real estate development, including acquiring land and designing, constructing and selling homes located in California.
Initial Public Offering
The Company completed its initial public offering ("IPO") on January 30, 2014. In preparation for the IPO, the Company reorganized from a Delaware limited liability company ("LLC") into a Delaware corporation, issuing 8,636,250 shares of common stock to the former members of the LLC in the Company's formation transactions, and changed its name to The New Home Company Inc. As a result of the IPO, the Company issued and sold 8,984,375 shares of common stock (including 1,171,875 shares sold pursuant to the underwriter's exercise of their option to purchase additional shares from the Company) at the public offering price of $11.00 per share. In accordance with the terms of the IPO, with net proceeds received from the underwriters exercise of their option to purchase additional shares, the Company repurchased 1,171,875 shares of its common stock issued to a member of the LLC in connection with the Company's formation transactions. The Company received proceeds of $75.8 million, net of the underwriting discount, offering expenses and the repurchase of shares. Upon the close of the IPO and as of December 31, 2014, the Company had 16,448,750 common shares outstanding.
Basis of Presentation
The consolidated financial statements include the accounts of the Company and its wholly owned subsidiaries. All significant intercompany accounts have been eliminated upon consolidation.
The accompanying financial statements have been prepared in accordance with U.S. generally accepted accounting principles (“GAAP”) as contained within the Financial Accounting Standards Board (“FASB”) Accounting Standards Codification (“ASC”).
Unless the context otherwise requires, the terms “we”, “us”, “our” and “the Company” refer to the Company.
Use of Estimates
The preparation of the Company’s consolidated financial statements in conformity with GAAP requires management to make estimates and assumptions that affect the amounts reported in the accompanying consolidated financial statements and notes. Accordingly, actual results could differ materially from these estimates.
Segment Reporting
ASC 280, "Segment Reporting" (“ASC 280”) established standards for the manner in which public enterprises report information about operating segments. In accordance with ASC 280, we have determined that our homebuilding division and our fee building division are our operating segments. Corporate is a non-operating segment.
Cash and Cash Equivalents and Concentration of Credit Risk
We define cash and cash equivalents as cash on hand, demand deposits with financial institutions, and short term liquid investments with a maturity date of less than three months from the date of purchase. The Company’s cash balances exceed federally insurable limits. The Company monitors the cash balances in its operating accounts and adjusts the cash balances as appropriate; however, these cash balances could be impacted if the underlying financial institutions fail or are subject to other adverse conditions in the financial markets. To date, the Company has not experienced a loss or lack of access to cash in its operating accounts.
Restricted Cash
Restricted cash of $0.3 million and $0.1 million as of December 31, 2014 and 2013, respectively, is held in accounts for payments of subcontractor costs incurred in connection with various fee building projects.
69
Real Estate Inventories and Cost of Sales
We capitalize pre-acquisition, land, development and other allocated costs, including interest, during development and home construction. Pre-acquisition costs, including non-refundable land deposits, are expensed to abandoned project costs when we determine continuation of the respective project is not probable. During the years ended December 31, 2014, 2013 and 2012, the Company reduced its real estate inventory balance by $0.8 million, $0.9 million and $0.4 million, respectively, for projects no longer being pursued. The associated expense is reflected as abandoned project costs in the accompanying consolidated statements of operations.
Land, development and other common costs are typically allocated to real estate inventories using a methodology that approximates the relative-sales-value method. Home construction costs per production phase are recorded using the specific identification method. Cost of sales for homes delivered includes the allocation of construction costs of each home and all applicable land acquisition, land development and related common costs (both incurred and estimated to be incurred) based upon the relative-sales-value of the home within each project. Changes to estimated total development costs subsequent to initial home deliveries in a project are generally allocated on a relative-sales-value method to remaining homes in the project. Inventory is stated at cost, unless the carrying amount is determined not to be recoverable, in which case inventory is written down to fair value. We review our real estate assets at each project on a periodic basis or whenever indicators of impairment exist. Real estate assets include projects actively selling, projects under development, or projects held for future development. Indicators of impairment include, but are not limited to, significant decreases in local housing market values and selling prices of comparable homes, significant decreases in gross margins and sales absorption rates, costs significantly in excess of budget, and actual or projected cash flow losses.
If there are indicators of impairment, we perform a detailed budget and cash flow review of the applicable real estate inventories to determine whether the estimated remaining undiscounted future cash flows of the project are more or less than the asset’s carrying value. If the undiscounted cash flows are more than the asset’s carrying value, no impairment adjustment is required. However, if the undiscounted cash flows are less than the asset’s carrying value, the asset is deemed impaired and is written down to fair value.
When estimating undiscounted cash flows of a project, we make various assumptions, including: (i) expected sales prices and sales incentives to be offered, including the number of homes available, pricing and incentives being offered by us or other builders in other projects, and future sales price adjustments based on market and economic trends; (ii) expected sales pace and cancellation rates based on local housing market conditions, competition and historical trends; (iii) costs expended to date and expected to be incurred including, but not limited to, land and land development costs, home construction costs, interest costs, indirect construction and overhead costs, and selling and marketing costs; (iv) alternative product offerings that may be offered that could have an impact on sales pace, sales price and/or building costs; and (v) alternative uses for the property.
Many assumptions are interdependent and a change in one may require a corresponding change to other assumptions. For example, increasing or decreasing sales absorption rates has a direct impact on the estimated per unit sales price of a home, the level of time sensitive costs (such as indirect construction, overhead and carrying costs), and selling and marketing costs (such as model maintenance costs and advertising costs). Depending on the underlying objective of the project, assumptions could have a significant impact on the projected cash flow analysis. For example, if our objective is to preserve operating margins, our cash flow analysis will be different than if the objective is to increase sales. These objectives may vary significantly from project to project and over time. If assets are considered impaired, impairment is determined by the amount the asset’s carrying value exceeds its fair value. Fair value is determined based on estimated future cash flows discounted for inherent risks associated with real estate assets. These discounted cash flows are impacted by expected risk based on estimated land development; construction and delivery timelines; market risk of price erosion; uncertainty of development or construction cost increases; and other risks specific to the asset or market conditions where the asset is located when assessment is made. These factors are specific to each project and may vary among projects. For the years ended December 31, 2014 and 2013, the projects were reviewed for impairment and no impairment adjustments relating to homebuilding real estate inventories were recorded. During the year ended December 31, 2012, the Company initiated a change in use and sold certain finished lots not under construction in one of its projects in Northern California. This change in use resulted in an impairment of $0.3 million for the related land held for sale, which is reflected in cost of land sales in the accompanying consolidated statement of operations. The remaining finished lots under construction for the same project were completed and sold to the respective homebuyers, including the model homes, during the year ended December 31, 2012.
70
Capitalization of Interest
We follow the practice of capitalizing interest to inventories owned during the period of development and to investments in unconsolidated joint ventures in accordance with ASC 835, "Interest" (“ASC 835”). Homebuilding interest capitalized as a component of cost of real estate inventories is included in cost of home sales as related homes or lots are sold. Interest capitalized to investment in unconsolidated joint ventures is included as a reduction of income from or increase in loss from unconsolidated joint ventures when the related homes or lots are sold to third parties. To the extent our debt exceeds our qualified assets as defined in ASC 835, we expense a portion of the interest incurred by us. Qualified assets represent projects that are actively selling or under development as well as investments in unconsolidated joint ventures accounted for under the equity method until such equity investees begin their principal operations.
Revenue Recognition
Home Sales and Profit Recognition
In accordance with ASC 360, "Property, Plant, and Equipment", revenues from home sales and other real estate sales are recorded and a profit is recognized when the respective homes are closed. Home sales and other real estate sales are closed when all conditions of escrow are met, including delivery of the home or other real estate asset, title passage, appropriate consideration is received and collection of associated receivables, if any, is reasonably assured. Sales incentives are a reduction of revenues when the respective home is closed. When it is determined that the earnings process is not complete, the sale and the related profit are deferred for recognition in future periods. The profit we record is based on the calculation of cost of sales, which is dependent on our allocation of costs, as described in more detail above in the section entitled “Real Estate Inventories and Cost of Sales.”
Fee Building
The Company enters into fee building agreements to provide services whereby it will build homes on behalf of independent third-party property owners. The independent third-party property owner funds all project costs incurred by the Company to build and sell the homes. The Company primarily enters into cost plus fee contracts where it charges independent third-party property owners for all direct and indirect costs plus a negotiated management fee. For these types of contracts, the Company recognizes revenue based on the actual total costs it has expended plus the applicable management fee. The management fee is typically a fixed fee based on a percentage of the cost or home sales revenue of the project depending on the terms of the agreement with the independent third-party property owner. In accordance with ASC 605, "Revenue Recognition" ("ASC 605"), revenues from fee building services are recognized over a cost-to-cost approach in applying the percentage-of-completion method. Under this approach, revenue is earned in proportion to total costs incurred, divided by total costs expected to be incurred. The total estimated cost plus the management fee represents the total contract value. The Company recognizes revenue based on the actual labor and other direct costs incurred, plus the portion of the management fee it has earned to date. In the course of providing its services, the Company routinely subcontracts for services and incurs other direct costs on behalf of its clients. These costs are passed through to clients and, in accordance with industry practice and GAAP, are included in the Company’s revenue and cost of revenue. Under certain agreements, the Company is eligible to receive additional incentive compensation as certain financial thresholds defined in the agreement are achieved. The Company recognizes revenue for any incentive compensation when such financial thresholds are probable of being met and such compensation is deemed to be collectible, generally at the date the amount is communicated to us by the independent third-party property owner.
The Company also enters into fee building and management contracts with third parties and its unconsolidated joint ventures where it provides construction supervision services, as well as sales and marketing services, and does not bear financial risks for any services provided. In accordance with ASC 605, revenues from these services are recognized over a proportional performance method or completed performance method. Under this approach, revenue is earned as services are provided in proportion to total services expected to be provided to the client or on a straight line basis if the pattern of performance cannot be determined while costs are recognized as incurred. Revenue recognition for any portion of the fees earned from these services that are contingent upon a financial threshold or specific event is deferred until the threshold is achieved or the event occurs.
The Company’s fee building revenues have historically been concentrated in a small number of customers. For the years ended December 31, 2014, 2013 and 2012, one customer comprised 87%, 75% and 95% of fee building revenue, respectively. As of December 31, 2014 and 2013, one customer comprised 98% and 82% of contracts and accounts receivables, respectively.
71
Variable Interest Entities
The Company accounts for variable interest entities in accordance with ASC 810, "Consolidation" (“ASC 810”). Under ASC 810, a variable interest entity (“VIE”) is created when: (a) the equity investment at risk in the entity is not sufficient to permit the entity to finance its activities without additional subordinated financial support provided by other parties, including the equity holders; (b) the entity’s equity holders as a group either (i) lack the direct or indirect ability to make decisions about the entity, (ii) are not obligated to absorb expected losses of the entity or (iii) do not have the right to receive expected residual returns of the entity; or (c) the entity’s equity holders have voting rights that are not proportionate to their economic interests, and the activities of the entity involve or are conducted on behalf of the equity holder with disproportionately few voting rights. If an entity is deemed to be a VIE pursuant to ASC 810, the enterprise that has both (i) the power to direct the activities of a VIE that most significantly impact the entity’s economic performance and (ii) the obligation to absorb the expected losses of the entity or right to receive benefits from the entity that could be potentially significant to the VIE is considered the primary beneficiary and must consolidate the VIE.
Under ASC 810, a non-refundable deposit paid to an entity may be deemed to be a variable interest that will absorb some or all of the entity’s expected losses if they occur. Our land purchase and lot option deposits generally represent our maximum exposure to the land seller if we elect not to purchase the optioned property. In some instances, we may also expend funds for due diligence, development and construction activities with respect to optioned land prior to takedown. Such costs are classified as real estate inventories, which we would have to write off should we not exercise the option. Therefore, whenever we enter into a land option or purchase contract with an entity and make a non-refundable deposit, a VIE may have been created.
As of December 31, 2014 and 2013, the Company was not required to consolidate any VIEs. In accordance with ASC 810, we perform ongoing reassessments of whether we are the primary beneficiary of a VIE.
Noncontrolling Interest
During 2013, the Company entered into a joint venture agreement with a third-party property owner. In accordance with ASC 810, the Company analyzed this arrangement and determined that it was not a variable interest entity; however, the Company determined it was required to consolidate the joint venture as it is the managing member with the powers to direct the major decisions of the entity. As of December 31, 2014 and 2013, the third-party owner had made contributions of $2.3 million and $1.2 million, respectively, net of losses and distributions.
Investments in Unconsolidated Joint Ventures
We first analyze our homebuilding and land development joint ventures to determine if they are variable interest entities under the provisions of ASC 810 (as discussed above) when determining whether the entity should be consolidated. If we conclude that our homebuilding and land development joint ventures are not variable interest entities, then, in accordance with the provisions of ASC 810, limited partnerships or similar entities must be further evaluated under the presumption that the general partner, or the managing member in the case of a limited liability company, is deemed to have a controlling interest and therefore must consolidate the entity unless the limited partners or non-managing members have: (1) the ability, either by a single limited partner or through a simple majority vote, to dissolve or liquidate the entity, or kick-out the managing member/general partner without cause, or (2) substantive participatory rights that are exercised in the ordinary course of business. Under the provisions of ASC 810, we may be required to consolidate certain investments in which we hold a general partner or managing member interest.
As of December 31, 2014 and 2013, the Company concluded that some of its joint ventures were variable interest entities. The Company concluded that it was not the primary beneficiary of the variable interest entities and accounted for these entities under the equity method of accounting.
Under the joint venture operating agreements, future capital contributions are determined based on the operating budgets and needs of the joint venture, which will likely vary throughout the life of each joint venture based on the circumstances unique to the project. In addition to required contributions, the Company selectively provides guaranties for debt held by certain of its unconsolidated joint ventures. Such guarantees facilitated the financing of our joint ventures' development projects and arose in the ordinary course of business. As of December 31, 2014 and 2013, our unconsolidated joint ventures had outstanding debt secured by financial guaranties of $61.4 million and $39.1 million, respectively, of which 12.6% and 11.5% respectively, was guaranteed by the Company. The guarantees will remain in place through the repayment of the notes, which mature at various dates through 2017. Payments under the guarantees are triggered by events of default, as defined in the various credit facilities. As of December 31, 2014, there were no events of default that would require payments under the guarantees.
72
Investments in our unconsolidated joint ventures are accounted for under the equity method of accounting. Under the equity method, we recognize our proportionate share of earnings and losses generated by the joint venture upon the delivery of lots or homes to third parties. Our proportionate share of intra-entity profits and losses are eliminated until the related asset has been sold by the unconsolidated joint venture to third parties. Our ownership interests in our unconsolidated joint ventures vary, but are generally less than or equal to 50%. The unconsolidated joint ventures accounting policies are generally consistent with those of the Company.
We review real estate inventory held by our unconsolidated joint ventures for impairment, consistent with our real estate inventories. We also review our investments in unconsolidated joint ventures for evidence of other-than-temporary declines in value. To the extent we deem any portion of our investment in unconsolidated joint ventures as not recoverable, we impair our investment accordingly. For the years ended December 31, 2014, 2013 and 2012, no impairments related to investment in unconsolidated joint ventures were recorded.
Selling and Marketing Expense
Selling and marketing costs incurred to sell real estate projects are capitalized if they are reasonably expected to be recovered from the sale of the project or from incidental operations, and are incurred for tangible assets that are used directly through the selling period to aid in the sale of the project or services that have been performed to obtain regulatory approval of sales. All other selling and marketing costs are expensed in the period incurred.
Warranty Reserves
We offer warranties on our homes that generally cover various defects in workmanship or materials, or to cover structural construction defects for one-year periods. Estimated future direct warranty costs are accrued and charged to cost of sales in the period when the related homebuilding revenues are recognized. Amounts are accrued based upon the Company’s historical rates. Due to the Company’s limited history related to homebuilding sales, the Company also considers the historical experience of its peers in determining the amount of its warranty reserve. In addition, the Company receives warranty payments from its clients for certain of its fee building projects where it has the contractual risk of construction. These payments are recorded as warranty reserve accruals. Indirect warranty overhead salaries and related costs are charged to the reserve in the period incurred. We assess the adequacy of our warranty accrual on a quarterly basis and adjust the amounts recorded if necessary. Our warranty accrual is included in accrued expenses and other liabilities in the accompanying consolidated balance sheets.
Contracts and Accounts Receivable
Contracts and accounts receivable primarily represent the fees earned but not collected and reimbursable project costs incurred in connection with fee building agreements. The Company periodically evaluates the collectability of its contracts receivable, and, if it is determined that a receivable might not be fully collectible, an allowance is recorded for the amount deemed uncollectible. This allowance for doubtful accounts is estimated based on management’s evaluation of the contracts involved and the financial condition of its clients. Factors considered in evaluations include, but are not limited to:
• | client type; |
• | historical contract performance; |
• | historical collection and delinquency trends; |
• | client credit worthiness; and |
• | general economic conditions. |
As of December 31, 2014 and 2013, no allowance was recorded related to contracts and accounts receivable.
Property and Equipment
Property and equipment are recorded at cost and depreciated using the straight-line method over their estimated useful lives ranging from three to five years. Leasehold improvements are stated at cost and are amortized using the straight-line method over the shorter of either their estimated useful lives or the probable term of the lease. For the years ended December 31, 2014, 2013 and 2012, the Company incurred depreciation expense of $0.4 million, $0.2 million and $0.1 million, respectively.
73
Income Taxes
Income taxes are accounted for in accordance with ASC 740, "Income Taxes" (“ASC 740”). As a result of the conversion from an LLC to a taxable entity in connection with the Company's IPO, the Company recognized a cumulative net deferred tax asset of $1.5 million related to the difference between the financial statement basis and tax basis of the assets and liabilities as of January 30, 2014. Subsequent to the conversion, the consolidated provision for, or benefit from, income taxes are calculated using the asset and liability method, under which deferred tax assets and liabilities are recorded based on the difference between the financial statement and tax basis of assets and liabilities using enacted tax rates in effect for the year in which the differences are expected to reverse.
Deferred tax assets are evaluated on a quarterly basis to determine if adjustments to the valuation allowance are required. In accordance with ASC 740, we assess whether a valuation allowance should be established based on the consideration of all available evidence using a “more likely than not” standard with respect to whether deferred tax assets will be realized. The ultimate realization of deferred tax assets depends primarily on the generation of future taxable income during the periods in which the differences become deductible. The value of our deferred tax assets will depend on applicable income tax rates. Judgment is required in determining the future tax consequences of events that have been recognized in our consolidated financial statements and/or tax returns. Differences between anticipated and actual outcomes of these future tax consequences could have a material impact on our consolidated financial statements.
ASC 740 defines the methodology for recognizing the benefits of uncertain tax return positions as well as guidance regarding the measurement of the resulting tax benefits. These provisions require an enterprise to recognize the financial statement effects of a tax position when it is more likely than not (defined as a likelihood of more than 50%), based on the technical merits, that the position will be sustained upon examination. In addition, these provisions provide guidance on derecognition, classification, interest and penalties, accounting in interim periods, disclosure, and transition. The evaluation of whether a tax position meets the more-likely-than-not recognition threshold requires a substantial degree of judgment by management based on the individual facts and circumstances. Actual results could differ from estimates.
Stock-Based Compensation
We account for share-based awards in accordance with ASC 718, "Compensation – Stock Compensation" (“ASC 718”). ASC 718 requires that the cost resulting from all share-based payment transactions be recognized in the financial statements. ASC 718 requires all entities to apply a fair-value-based measurement method in accounting for share-based payment transactions with employees except for equity instruments held by employee share ownership plans.
Recently Issued Accounting Standards
The Company qualifies as an “emerging growth company” pursuant to the provisions of the Jumpstart Our Business Startups Act of 2012, or the JOBS Act, enacted on April 5, 2012. Section 102 of the JOBS Act provides that an “emerging growth company” can take advantage of the extended transition period provided in Section 7(a)(2)(B) of the Securities Act of 1933, as amended, for complying with new or revised accounting standards. As previously disclosed, the Company has chosen, irrevocably, to “opt out” of such extended transition period, and as a result, will comply with new or revised accounting standards on the relevant dates on which adoption of such standards is required for non-emerging growth companies.
In May 2014, the Financial Accounting Standards Board ("FASB") and International Accounting Standards Board issued their converged standard on revenue recognition, Accounting Standards Update ("ASU") 2014-09, “Revenue from Contracts with Customers” ("ASU 2014-09"). This standard outlines a single comprehensive model for companies to use in accounting for revenue arising from contracts with customers and supersedes most current revenue recognition guidance, including industry-specific guidance. The core principle of the revenue model is that revenue is recognized when a customer obtains control of a good or service. A customer obtains control when it has the ability to direct the use of and obtain the benefits from the good or service. Transfer of control is not the same as transfer of risks and rewards, as it is considered in current guidance. The Company will need to apply the new guidance to determine whether revenue should be recognized over time or at a point in time. This standard will be effective for the first interim period within annual reporting periods beginning after December 15, 2016, with no early adoption permitted, and the Company can choose to apply this standard retrospectively for each prior reporting period presented or retrospectively with the cumulative effect of initially applying the standard recognized at the date of the initial application in retained earnings. The Company is in the process of evaluating the effects of ASU 2014-09 on its revenue recognition.
In June 2014, the FASB issued ASU No. 2014-12, Accounting for Share-Based Payments When the Terms of an Award Provide That a Performance Target Could Be Achieved after the Requisite Service Period (“ASU 2014-12”), which requires that a performance target that affects vesting and that could be achieved after the requisite service period be treated as
74
a performance condition. A reporting entity should apply existing guidance in ASC 718, Compensation - Stock Compensation, as it relates to awards with performance conditions that affect vesting to account for such awards. The amendments in ASU 2014-12 are effective for interim and annual periods beginning after December 15, 2015. Early adoption is permitted. Our adoption of ASU 2014-12 is not expected to have a material effect on our consolidated financial statements or disclosures.
In August 2014, the FASB issued ASU No. 2014-15, Disclosure of Uncertainties About an Entity's Ability to Continue as a Going Concern, (“ASU 2014-15”), which requires management to perform interim and annual assessments on whether there are conditions or events that raise substantial doubt about the entity's ability to continue as a going concern within one year of the date the financial statements are issued and to provide related disclosures, if required. The amendments in ASU 2014-15 are effective for the annual period ending after December 15, 2016, and for annual and interim periods thereafter. Early adoption is permitted. Our adoption of ASU 2014-15 is not expected to have a material effect on our consolidated financial statements or disclosures.
2. Computation of Earnings (Loss) Per Share
Basic and diluted earnings (loss) per share for the years ended December 31, 2014, 2013 and 2012 give effect to the conversion of the Company’s members’ equity into common stock on January 30, 2014 as though the conversion had occurred as of the beginning of the reporting period or the original date of issuance, if later. The number of shares converted was based on the actual IPO price of $11.00 per share.
Because their effect is anti-dilutive, the Company excludes stock options from the calculation of diluted earnings per share when the combined exercise price, unrecognized stock-based compensation and assumed excess tax benefits upon exercise are greater than the average market price for the Company's common stock. As a result, 796,864 stock options were not included in the calculation of diluted earnings per share for the year ended December 31, 2014.
The following table sets forth the components used in the computation of basic and diluted earnings (loss) per share for the years ended December 31, 2014, 2013 and 2012:
Year Ended December 31, | |||||||||||
2014 | 2013 | 2012 | |||||||||
Numerator: | |||||||||||
Net income (loss) attributable to The New Home Company Inc. | $ | 4,786,543 | $ | 6,706,005 | $ | (1,351,875 | ) | ||||
Denominator: | |||||||||||
Basic weighted-average shares outstanding | 15,927,917 | 7,905,757 | 5,044,438 | ||||||||
Effect of dilutive shares: | |||||||||||
Unvested restricted stock units | 41,282 | — | — | ||||||||
Stock options | — | — | — | ||||||||
Diluted weighted-average shares outstanding | 15,969,199 | 7,905,757 | 5,044,438 | ||||||||
Basic earnings (loss) per share attributable to The New Home Company Inc. | $ | 0.30 | $ | 0.85 | $ | (0.27 | ) | ||||
Diluted earnings (loss) per share attributable to The New Home Company Inc. | $ | 0.30 | $ | 0.85 | $ | (0.27 | ) | ||||
75
3. Contracts and Accounts Receivable
Contracts and accounts receivable consist of the following:
December 31, | |||||||
2014 | 2013 | ||||||
Contracts receivable: | |||||||
Costs incurred on fee building projects | $ | 89,055,951 | $ | 42,317,737 | |||
Estimated earnings | 4,506,534 | 5,247,768 | |||||
93,562,485 | 47,565,505 | ||||||
Less: amounts collected during the period | (80,404,464 | ) | (40,945,938 | ) | |||
$ | 13,158,021 | $ | 6,619,567 | ||||
Contracts receivable: | |||||||
Billed | $ | 1,957 | $ | 230,642 | |||
Unbilled | 13,156,064 | 6,388,925 | |||||
13,158,021 | 6,619,567 | ||||||
Other receivables: | |||||||
Escrow receivables | — | 436,862 | |||||
Other receivables | 5,906 | 121,812 | |||||
$ | 13,163,927 | $ | 7,178,241 | ||||
Billed contracts receivable represent amounts billed to clients that have yet to be collected. Unbilled contracts receivable represents the contract revenue recognized but not yet billable pursuant to contract terms or administratively not invoiced. All unbilled receivables as of December 31, 2014 and 2013 are expected to be billed and collected within twelve months. Accounts payable at December 31, 2014 and 2013 includes $11.9 million and $6.1 million, respectively, related to costs incurred under the Company’s fee building contracts.
4. Real Estate Inventories and Capitalized Interest
Real estate inventories are summarized as follows:
December 31, | |||||||
2014 | 2013 | ||||||
Deposits and pre-acquisition costs | $ | 9,348,650 | $ | 4,912,563 | |||
Land held and land under development | 48,989,673 | 29,063,591 | |||||
Homes completed or under construction | 87,072,326 | 10,221,069 | |||||
Model homes | 18,153,532 | 1,153,256 | |||||
$ | 163,564,181 | $ | 45,350,479 | ||||
All of our deposits and pre-acquisition costs are non-refundable, except for $0 and $50,000 as of December 31, 2014 and 2013, respectively.
Model homes, homes completed, and homes under construction include all costs associated with home construction, including land, development, indirects, permits, materials and labor. Land held and land under development includes costs incurred during site development such as land, development, indirects, and permits.
76
Interest is capitalized to inventory during development and other qualifying activities. Interest capitalized as cost of inventory is included in cost of sales as related homes are closed. For the years ended December 31, 2014, 2013 and 2012 interest incurred, capitalized and expensed was as follows:
Year Ended December 31, | |||||||||||
2014 | 2013 | 2012 | |||||||||
Interest incurred | $ | 1,856,781 | $ | 1,059,875 | $ | 639,103 | |||||
Interest capitalized | (1,856,781 | ) | (1,059,875 | ) | (639,103 | ) | |||||
Interest expensed | $ | — | $ | — | $ | — | |||||
Capitalized interest in beginning inventory | $ | 1,003,390 | $ | 493,486 | $ | 182,628 | |||||
Interest capitalized as a cost of inventory | 1,856,781 | 1,059,875 | 639,103 | ||||||||
Interest previously capitalized as cost of inventory, included in cost of sales | (532,286 | ) | (549,971 | ) | (328,245 | ) | |||||
Capitalized interest in ending inventory | $ | 2,327,885 | $ | 1,003,390 | $ | 493,486 | |||||
5. Unconsolidated Joint Ventures
As of December 31, 2014 and 2013, the Company had ownership interests in 12 and 11, respectively, unconsolidated joint ventures with ownership percentages that generally range from 5% to 50%. The condensed combined balance sheets for our unconsolidated joint ventures accounted for under the equity method are as follows:
December 31, | |||||||
2014 | 2013 | ||||||
Cash and cash equivalents | $ | 45,036,567 | $ | 15,292,035 | |||
Restricted cash | 14,981,059 | 4,357,945 | |||||
Real estate inventories | 459,770,310 | 266,316,859 | |||||
Other assets | 1,822,429 | 1,723,429 | |||||
Total assets | $ | 521,610,365 | $ | 287,690,268 | |||
Accounts payable and accrued liabilities | $ | 52,601,452 | $ | 15,064,068 | |||
Notes payable | 87,994,263 | 68,594,343 | |||||
Total liabilities | 140,595,715 | 83,658,411 | |||||
The Company's equity | 60,564,033 | 32,269,546 | |||||
Other partners' equity | 320,450,617 | 171,762,311 | |||||
Total equity | 381,014,650 | 204,031,857 | |||||
Total liabilities and equity | $ | 521,610,365 | $ | 287,690,268 | |||
77
The condensed combined statements of operations for our unconsolidated joint ventures accounted for under the equity method are as follows:
Year Ended December 31, | |||||||||||
2014 | 2013 | 2012 | |||||||||
Revenues | $ | 271,385,364 | $ | 183,710,268 | $ | 56,018,517 | |||||
Cost of sales | 209,267,388 | 133,982,014 | 41,548,236 | ||||||||
Gross profit | 62,117,976 | 49,728,254 | 14,470,281 | ||||||||
Operating expenses | 20,943,917 | 14,294,048 | 5,817,530 | ||||||||
Net income of unconsolidated joint ventures | $ | 41,174,059 | $ | 35,434,206 | $ | 8,652,751 | |||||
Equity in net income of unconsolidated joint ventures reflected in the accompanying consolidated statements of operations | $ | 8,443,136 | $ | 4,735,224 | $ | 349,445 | |||||
The Company has entered into agreements with its unconsolidated joint ventures to provide management services related to the underlying projects (collectively referred to as the “Management Agreements”). Pursuant to the Management Agreements, the Company receives a management fee based on each project’s revenues from its unconsolidated joint ventures. For the years ended December 31, 2014, 2013 and 2012, the Company earned $9.6 million, $8.3 million, and $2.9 million, respectively, in management fees, which have been recorded as fee building revenues in the accompanying consolidated statements of operations.
6. Other Assets
Other assets consist of the following:
December 31, | |||||||
2014 | 2013 | ||||||
Deferred tax asset | $ | 5,840,516 | $ | — | |||
Prepaid loan fees | 307,197 | — | |||||
Prepaid expenses | 500,422 | 101,809 | |||||
Other assets | 31,333 | 87,718 | |||||
Offering costs | — | 3,250,000 | |||||
$ | 6,679,468 | $ | 3,439,527 | ||||
As a result of the conversion from an LLC to a taxable entity in connection with the Company's IPO, the Company recognized a cumulative net deferred tax asset of $1.5 million related to the difference between the financial statement basis and tax basis of the assets and liabilities as of January 30, 2014 (See Note 13).
78
7. Accrued Expenses and Other Liabilities
Accrued expenses and other liabilities consist of the following:
December 31, | |||||||
2014 | 2013 | ||||||
Warranty reserve | $ | 1,577,937 | $ | 1,074,298 | |||
Employee benefits | 1,051,325 | 659,978 | |||||
Accrued payroll | 479,741 | 1,007,591 | |||||
Accrued interest | 267,916 | 86,496 | |||||
Completion reserve | 219,081 | 471,870 | |||||
Incentive compensation | 3,148,861 | 1,770,230 | |||||
Accrued professional fees | 413,677 | 1,403,183 | |||||
Income taxes payable | 3,929,708 | 120,315 | |||||
Deferred fees from unconsolidated joint ventures | — | 111,583 | |||||
Other accrued expenses | 112,212 | 145,618 | |||||
$ | 11,200,458 | $ | 6,851,162 | ||||
During the years ended December 31, 2014 and 2013, the Company elected to institute a fully discretionary employee incentive compensation plan to various non-executive employees. As of December 31, 2014 and 2013, the accrual for incentive compensation is $3.1 million and $1.8 million, respectively, of which $1.2 million and $0.5 million was reimbursable by our joint ventures and fee building projects.
Completion reserves relate to liabilities for completed subcontractor work on delivered homes for which invoices have not been remitted as of the balance sheet date.
Changes in our warranty accrual are detailed in the table set forth below:
Year Ended December 31, | |||||||||||
2014 | 2013 | 2012 | |||||||||
Beginning warranty liability for homebuilding projects | $ | 810,088 | $ | 464,449 | $ | 260,483 | |||||
Warranty provision for homebuilding projects | 561,935 | 359,512 | 214,777 | ||||||||
Warranty payments for homebuilding projects | (95,077 | ) | (13,873 | ) | (10,811 | ) | |||||
Ending warranty liability for homebuilding projects | 1,276,946 | 810,088 | 464,449 | ||||||||
Beginning warranty liability for fee building projects | 264,210 | 295,391 | 830,440 | ||||||||
Warranty provision for fee building projects | 61,962 | — | — | ||||||||
Warranty efforts for fee building projects | (25,181 | ) | (31,181 | ) | (84,572 | ) | |||||
Adjustment to warranty accrual for fee building projects | — | — | (450,477 | ) | |||||||
Ending warranty liability for fee building projects | 300,991 | 264,210 | 295,391 | ||||||||
Total ending warranty liability | $ | 1,577,937 | $ | 1,074,298 | $ | 759,840 | |||||
As a result of an assessment of historical and anticipated rates of warranty costs related to fee building projects, management reduced the reserve by $0.5 million during the year ended December 31, 2012, which has been included in fee building revenue in the accompanying consolidated statements of operations.
79
8. Notes Payable
Notes payable consisted of the following:
December 31, | |||||||
2014 | 2013 | ||||||
Senior unsecured revolving credit facility | $ | 100,473,560 | $ | — | |||
Secured revolving credit facility | — | 8,215,720 | |||||
Note payable with land seller | 9,500,000 | 9,500,000 | |||||
Construction loans | 3,777,774 | 167,618 | |||||
$ | 113,751,334 | $ | 17,883,338 | ||||
On June 26, 2014, the Company entered into a senior unsecured revolving credit facility (the "Unsecured Facility") with a bank to borrow up to $125.0 million, limited by borrowing base provisions and financial covenants. Any outstanding principal is due upon maturity, which is June 26, 2017, with the potential for a one-year extension of the term of the loan, subject to specified conditions and the payment of an extension fee. The Company may repay advances at any time without premium or penalty. Interest is payable monthly and is charged at a rate of 1-month LIBOR plus a margin ranging from 2.25% to 3.00% depending on the Company’s leverage ratio as calculated at the end of each fiscal quarter. As of December 31, 2014, the availability under the facility was $24.5 million and the interest rate was 2.41%. In connection with the agreement, the Company is required to maintain certain financial covenants, including (i) a minimum tangible net worth, as defined; (ii) leverage ratios, as defined; (iii) a minimum liquidity covenant; (iv) a minimum fixed charge coverage ratio based on EBITDA to interest incurred; and (v) from and after January 1, 2015, a speculative unit limitation. As of December 31, 2014, the Company was in compliance with all financial covenants.
On September 26, 2013, the Company entered into a secured revolving credit facility with a bank to borrow up to $30.0 million. The secured revolving credit facility was repaid in full with proceeds from the Unsecured Facility. Prior to repayment, the secured revolving credit facility bore interest at a rate of 1-month LIBOR plus a margin ranging from 3.25% to 4.25%, depending on leverage ratios.
In March 2014, the Company acquired real estate with a purchase price of $21.5 million. Concurrent with the acquisition, it entered into a $17.0 million note with the land seller, secured by real estate, which bore interest at 1.0% per annum. The note matured on June 30, 2014 and was repaid in full. In 2012, the Company entered into a $9.5 million note with a land seller, secured by real estate, which bears interest at 7.0% per annum. During February 2015, we made a principal reduction payment of $2.5 million and extended the maturity date of the note. The note matures on the earlier of (i) 10 days following entitlement approval, or (ii) February 15, 2016 and requires certain mandatory pay downs totaling $1.0 million based on the occurrence of certain project-related events. Interest is payable monthly and the remaining principal is due at maturity.
In May 2014, the Company entered into two construction loans with a bank related to model and production homes for a specific project. The loans are secured by real estate and bear interest at the bank's prime rate plus 2.0%, or 5.25% at December 31, 2014. The total commitment under the construction loans is $9.5 million. As of December 31, 2014, the Company had $5.7 million available to borrow under the construction loans. The loans mature on November 27, 2016. Interest is payable monthly with all unpaid principal and interest due at maturity. As of December 31, 2013, the Company had one construction loan related to model homes, which was repaid during the first quarter of 2014 and the remaining commitment was closed.
Notes payable have stated maturities as follows for the years ending December 31:
2015 | $ | — | |
2016 | 13,277,774 | ||
2017 | 100,473,560 | ||
$ | 113,751,334 | ||
9. Fair Value Disclosures
ASC 820, "Fair Value Measurements and Disclosures," defines fair value as the price that would be received for selling an asset or paid to transfer a liability in an orderly transaction between market participants at measurement date and requires assets and liabilities carried at fair value to be classified and disclosed in the following three categories:
80
• | Level 1 – Quoted prices for identical instruments in active markets |
• | Level 2 – Quoted prices for similar instruments in active markets; quoted prices for identical or similar instruments in markets that are inactive; and model-derived valuations in which all significant inputs and significant value drivers are observable in active markets at measurement date |
• | Level 3 – Valuations derived from techniques where one or more significant inputs or significant value drivers are unobservable in active markets at measurement date |
Fair Value of Financial Instruments
The accompanying consolidated balance sheets include the following financial instruments: cash and cash equivalents, restricted cash, contracts and accounts receivable, due from affiliates, accounts payable, accrued expenses and other liabilities, and notes payable.
The Company considers the carrying value of cash and cash equivalents, restricted cash, contracts and accounts receivable, accounts payable, and accrued expenses and other liabilities to approximate the fair value of these financial instruments based on the short duration between origination of the instruments and their expected realization. The fair value of amounts due from affiliates is not determinable due to the related party nature of such amounts. As of December 31, 2014 and 2013, the fair value of the Company's notes payable approximated the carrying value. The Company has determined that its notes payable are classified as Level 3 within the fair value hierarchy. Estimated fair values of the outstanding notes payable at December 31, 2014 and 2013 were based on cash flow models discounted at market interest rates that considered underlying risks of the debt.
Non-Recurring Fair Value Adjustments
Nonfinancial assets and liabilities include items such as inventory and long lived assets that are measured at cost when acquired and adjusted for impairment to fair value, if deemed necessary. During the years ended December 31, 2014 and 2013, the Company did not record any fair value adjustments to those nonfinancial assets and liabilities remeasured at fair value on a nonrecurring basis.
10. Commitments and Contingencies
Legal Matters
The Company is a defendant in various lawsuits related to its normal course of business. We are also subject to local, state and federal laws and regulations related to land development activities, house construction standards, sales practices, employment practices and environmental protection. As a result, we are subject to periodic examinations or inquiry by agencies administering these laws and regulations.
We record a reserve for potential legal claims and regulatory matters when they are probable of occurring and a potential loss is reasonably estimable. We accrue for these matters based on facts and circumstances specific to each matter and revise these estimates when necessary.
In view of the inherent difficulty of predicting outcomes of legal claims and related contingencies, we generally cannot predict their ultimate resolution, related timing or eventual loss. If our evaluations indicate loss contingencies that could be material are not probable, but are reasonably possible, we will disclose their nature with an estimate of possible range of losses or a statement that such loss is not reasonably estimable. At December 31, 2014 and 2013, the Company did not have any accruals for asserted or unasserted matters.
As an owner and developer of real estate, the Company is subject to various environmental laws of federal, state and local governments. The Company is not aware of any environmental liability that could have a material adverse effect on its financial condition or results of operations. However, changes in applicable environmental laws and regulations, the uses and conditions of real estate in the vicinity of the Company’s real estate and other environmental conditions of which the Company is unaware with respect to the real estate could result in future environmental liabilities.
Performance Bonds
We obtain surety bonds in the normal course of business to ensure completion of certain infrastructure improvements of our projects. At December 31, 2014 and 2013, the Company had outstanding surety bonds totaling $12.2 million and $2.7 million, respectively. The beneficiaries of the bonds are various municipalities and other organizations. In the unlikely event that any such surety bond issued by a third party is called because the required improvements are not completed, the Company could be obligated to reimburse the issuer of the bond.
81
Leases
We lease our corporate headquarters in Aliso Viejo, California. The lease on this facility consists of approximately 15,800 square feet and expires in December 2018. In addition, we lease divisional offices in Northern and Southern California, including approximately 6,800 square feet through April 2017 in Roseville, approximately 6,100 square feet through May 2018 in Walnut Creek, and approximately 1,400 square feet through July 2015 in Agoura Hills. As of December 31, 2014, future minimum lease payments under non-cancelable operating lease agreements are as follows:
2015 | $ | 781,861 | |
2016 | 789,763 | ||
2017 | 698,836 | ||
2018 | 532,561 | ||
2019 | — | ||
Thereafter | — | ||
$ | 2,803,021 | ||
For the years ended December 31, 2014, 2013 and 2012, rental expense was $0.7 million, $0.5 million and $0.2 million, respectively, and is included in general and administrative expenses.
11. Related Party Transactions
During the years ended December 31, 2014, 2013 and 2012, the Company incurred construction-related costs on behalf of its unconsolidated joint ventures totaling $8.0 million, $5.4 million and $2.2 million, respectively. As of December 31, 2014 and 2013, $1.1 million and $0.3 million, respectively, are included in due from affiliates in the accompanying consolidated balance sheets.
The Company has entered into agreements with its unconsolidated joint ventures to provide management services related to the underlying projects. Pursuant to the Management Agreements, the Company receives a management fee based on each project’s revenues. During the years ended December 31, 2014, 2013 and 2012, the Company earned $9.6 million, $8.3 million, and $2.9 million, respectively, in management fees, which have been recorded as fee building revenue in the accompanying consolidated statements of operations. As of December 31, 2014 and 2013, $1.6 million and $0.2 million, respectively, of management fees are included in due from affiliates in the accompanying consolidated balance sheets.
The Company has entered into loan guaranties on behalf of certain of its unconsolidated joint ventures in order to secure performance under the loans and maintain certain loan-to-value ratios. The Company has also entered into agreements with its partners in each of the unconsolidated joint ventures whereby the Company and the partners are apportioned liability under the guaranties according to their respective capital interest. In addition, the agreements provide the Company, to the extent the partner has an unpaid liability under the guaranties, the right to receive distributions from the unconsolidated joint venture that would otherwise be made to the partner. The loans underlying the guaranties comprise acquisition and development loans, construction revolvers and model loans, and the guaranties remain in force until the loans are satisfied, which is expected to occur over a period between March 2015 and May 2017. Due to the nature of the loans, the outstanding balance at any given time is subject to a number of factors including the status of site improvements, the mix of horizontal and vertical development underway, the timing of phase build outs, and the period necessary to complete the escrow process for homebuyers. With respect to guaranties regarding specific performance, the Company is not generally subject to financial liability, but is only required to complete the project with funds provided by the beneficiary of the guaranty. As of December 31, 2014 and 2013, $61.4 million and $39.1 million, respectively, was outstanding under the loans, of which 12.6% and 11.5%, respectively was guaranteed by the Company. In connection with providing the loan guaranties, the Company recognized $18,927, $113,562 and $85,172 during the years ended December 31, 2014, 2013 and 2012, respectively, as guaranty fee income in the accompanying consolidated statements of operations. As of December 31, 2014 and 2013, $0 and $85,172, respectively, were included in due from affiliates related to guaranty fee income.
Berchtold Capital Partners, an entity owned by Mr. Michael Berchtold, one of the Company's non-employee directors, served as an advisor to the Company, providing general advice and guidance in connection with the Company's IPO, as well as assisting with the selection of the members of the Company's board of directors, the selection of and interacting with the Company's compensation consultant and advising the executives and board of managers regarding governance and compensation matters. The Company paid Berchtold Capital Partners $562,500 for these services, including $500,000 upon completion of our IPO. Amounts paid to Berchtold are included in offering expenses and were offset against the proceeds of our IPO.
82
As of December 31, 2014, the Company had investments in certain unconsolidated joint ventures totaling $20.4 million. Certain members of the Company's board of directors are affiliated with entities that also had an investment in these joint ventures and are owners of more than 10% of the outstanding common stock of the Company.
TL Fab LP, an affiliate of Mr. Paul Heeschen, one of the Company's non-employee directors, was engaged by the Company and some of its unconsolidated joint ventures as a trade contractor to provide metal fabrication services. The Company and its unconsolidated joint ventures incurred $1.2 million for these services for the year ended December 31, 2014, of which $147,277 was due to TL Fab LP at December 31, 2014. These amounts were capitalized to real estate inventories by the Company and its unconsolidated joint ventures and will be included in cost of home sales at the time of home deliveries.
12. Stock-Based Compensation
On August 18, 2010, the Company granted equity based units to certain members of management valued on the date of grant at $1.9 million with a four year vesting period. Recipients of the equity based units had the right to receive certain distributions, if any, from the Company following return of capital to its equity members. The share based units vested upon completion of the IPO, and the remaining unrecognized compensation expense of $316,667 was recognized during the first quarter of 2014, and is included in general and administrative expense in the accompanying consolidated statement of operations.
The 2014 Long-Term Incentive Plan (“2014 Incentive Plan”), was adopted by our board of directors in January 2014. The 2014 Incentive Plan provides for the grant of equity-based awards, including options to purchase shares of common stock, stock appreciation rights, restricted and unrestricted stock awards, restricted stock units and performance awards. The 2014 Incentive Plan will automatically expire on the tenth anniversary of its effective date. Our board of directors may terminate or amend the 2014 Incentive Plan at any time, subject to any requirement of stockholder approval required by applicable law, rule or regulation and provided that the rights of a holder of an outstanding award may not be impaired without the consent of the holder.
The number of shares of our common stock that may be issued under the 2014 Incentive Plan is 1,644,875 shares. To the extent that shares of the Company's common stock subject to an outstanding option, stock appreciation right, stock award or performance award granted under the 2014 Incentive Plan or any predecessor plan are not issued or delivered by reason of the expiration, termination, cancellation or forfeiture of such award or the settlement of such award in cash, then such shares of common stock generally shall again be available under the 2014 Incentive Plan.
The Company has issued stock option and restricted stock unit awards under the 2014 Incentive Plan. The exercise price of stock-based awards may not be less than the market value of the Company's common stock on the date of grant. The fair value for stock options is established at the date of grant using the Black-Scholes model for time-based vesting awards. The Company's stock option and restricted stock awards typically vest over a one to three year period and expire ten years from the date of grant.
A summary of the Company’s common stock option activity as of and for the year ended December 31, 2014 is presented below:
Options Outstanding | ||||||
Weighted-Average | ||||||
Number of Shares | Exercise Price per share | |||||
Options outstanding at December 31, 2013 | — | — | ||||
Options granted | 872,683 | $ | 11.00 | |||
Options forfeited | (25,809 | ) | $ | 11.00 | ||
Options outstanding at December 31, 2014 | 846,874 | $ | 11.00 | |||
Options exercisable at December 31, 2014 | — | — | ||||
83
A summary of the Company’s restricted stock units as of and for the year ended December 31, 2014 is presented below:
Restricted Stock Units Outstanding | ||||||
Weighted-Average | ||||||
Grant-Date | ||||||
Number of Shares | Fair Value per Share | |||||
Balance outstanding at December 31, 2013 | — | — | ||||
Restricted stock units granted | 118,937 | $ | 11.34 | |||
Restricted stock units forfeited | (6,704 | ) | $ | 11.00 | ||
Balance outstanding at December 31, 2014 | 112,233 | $ | 11.36 | |||
The expense related to the Company's stock-based compensation programs, included in general and administrative expense in the accompanying consolidated statements of operations, was as follows:
Year Ended December 31, | |||||||||||
2014 | 2013 | 2012 | |||||||||
Expense related to: | |||||||||||
Equity based incentive units | $ | 316,667 | $ | 475,000 | $ | 475,000 | |||||
Stock options | 1,128,021 | — | — | ||||||||
Restricted stock units | 877,442 | — | — | ||||||||
$ | 2,322,130 | $ | 475,000 | $ | 475,000 | ||||||
The following table presents details of the assumptions used to calculate the weighted-average grant date fair value of common stock options granted by the Company:
Year Ended | |||
December 31, 2014 | |||
Expected term (in years) | 4.3 | ||
Expected volatility | 49.0 | % | |
Risk-free interest rate | 1.2 | % | |
Expected dividends | — | ||
Weighted-average grant date fair value per share | $ | 4.43 | |
We used the "simplified method" to establish the expected term of the common stock options granted by the Company. Our restricted stock awards are valued based on the closing price of our common stock on the date of grant. At December 31, 2014, the amount of unearned stock-based compensation currently estimated to be expensed through 2017 related to unvested common stock options and restricted stock units is $3.0 million, net of estimated forfeitures. The weighted-average period over which the unearned stock-based compensation is expected to be recognized is 2.0 years . If there are any modifications or cancellations of the underlying unvested awards, the Company may be required to accelerate, increase or cancel any remaining unearned stock-based compensation expense.
84
13. Income Taxes
As discussed in Note 1, during 2013 and for the first 30 calendar days of 2014, the Company was a Delaware LLC which was treated as partnership for income tax purposes and was subject to certain minimal taxes and fees; however, income taxes on taxable income or losses realized by the Company were the obligation of the members.
The (provision) benefit for income taxes includes the following:
Year Ended December 31, | |||||||||||
2014 | 2013 | 2012 | |||||||||
Current provision for income taxes: | |||||||||||
Federal | $ | 4,721,599 | $ | 195,564 | $ | 110,300 | |||||
State | 1,343,442 | 55,777 | — | ||||||||
Total | 6,065,041 | 251,341 | 110,300 | ||||||||
Deferred (benefit) provision for income taxes: | |||||||||||
Federal | (4,599,967 | ) | — | — | |||||||
State | (1,218,652 | ) | 39,045 | (39,045 | ) | ||||||
Total | (5,818,619 | ) | 39,045 | (39,045 | ) | ||||||
Provision for income taxes | $ | 246,422 | $ | 290,386 | $ | 71,255 | |||||
The effective tax rate differs from the federal statutory rate of 35% due to the following items:
Year Ended December 31, | |||||||||||
2014 | 2013 | 2012 | |||||||||
Income (loss) before income taxes | $ | 5,003,493 | $ | 6,995,891 | $ | (1,280,620 | ) | ||||
Less: Non-taxable entities income (loss) | — | 6,364,925 | (1,571,334 | ) | |||||||
Income before taxes of taxable entities | $ | 5,003,493 | $ | 630,966 | $ | 290,714 | |||||
Provision for income taxes at federal statutory rate | $ | (1,751,223 | ) | $ | (214,528 | ) | $ | (98,842 | ) | ||
(Increases) decreases in tax resulting from: | |||||||||||
State income taxes, net of federal benefit | (292,765 | ) | (36,813 | ) | — | ||||||
Manufacturing deduction | 224,526 | — | — | ||||||||
Deferred tax assets upon conversion to a corporation | 1,494,992 | — | — | ||||||||
Tax rate change | 100,000 | — | — | ||||||||
Return to provision difference | (93,091 | ) | — | — | |||||||
State tax credits | — | (39,045 | ) | — | |||||||
Other | 71,139 | — | 27,587 | ||||||||
Provision for income taxes | $ | (246,422 | ) | $ | (290,386 | ) | $ | (71,255 | ) | ||
Effective tax rate | 5 | % | 46 | % | 25 | % | |||||
85
The Company accounts for income taxes in accordance with ASC 740, which requires an asset and liability approach for measuring deferred taxes based on temporary differences between the financial statements and tax bases of assets and liabilities existing at each balance sheet date using enacted tax rates for the years in which taxes are expected to be paid or recovered. The components of our deferred income tax asset are as follows:
December 31, | |||||||
2014 | 2013 | ||||||
State tax | $ | 405,142 | $ | — | |||
Reserves and accruals | 1,095,556 | — | |||||
Intangible assets | 312,835 | — | |||||
Share based compensation | 817,145 | — | |||||
Inventory | 2,468,191 | — | |||||
Investments in joint ventures | 882,643 | — | |||||
Depreciation | (140,996 | ) | — | ||||
Net deferred tax asset | $ | 5,840,516 | $ | — | |||
Each quarter we assess our deferred tax asset to determine whether all or any portion of the asset is more likely or not unrealizable under ASC 740. We are required to establish a valuation allowance for any portion of the asset we conclude is more likely or not unrealizable. Our assessment considers, among other things, the nature, frequency and severity of prior cumulative losses, forecasts of future taxable income, the duration of statutory carryforward periods, our utilization experience with operating loss and tax credit carryforwards and the planning alternatives, to the extent these items are applicable.
The Company classifies any interest and penalties related to income taxes assessed by jurisdiction as part of income tax expense. The Company has concluded that there were no significant uncertain tax positions requiring recognition in its financial statements, nor has the Company been assessed interest or penalties by any major tax jurisdictions related to any open tax periods.
14. Segment Information
The Company’s operations are organized into two reportable segments: homebuilding and fee building. In accordance with ASC 280, in determining the most appropriate reportable segments, we considered similar economic and other characteristics, including product types, average selling prices, gross profits, production processes, suppliers, subcontractors, regulatory environments, land acquisition results, and underlying demand and supply.
The reportable segments follow the same accounting policies as our consolidated financial statements described in Note 1. Operational results of each reportable segment are not necessarily indicative of the results that would have been achieved had the reportable segment been an independent, stand-alone entity during the periods presented. Financial information relating to reportable segments was as follows:
Year Ended December 31, | |||||||||||
2014 | 2013 | 2012 | |||||||||
Revenues | |||||||||||
Homebuilding | $ | 56,094,345 | $ | 35,662,980 | $ | 27,138,056 | |||||
Fee building | 93,562,485 | 47,565,505 | 28,268,675 | ||||||||
Total | $ | 149,656,830 | $ | 83,228,485 | $ | 55,406,731 | |||||
Gross profit | |||||||||||
Homebuilding | $ | 8,433,949 | $ | 6,683,487 | $ | 3,096,827 | |||||
Fee building | 4,506,534 | 5,247,768 | 1,763,633 | ||||||||
Total | $ | 12,940,483 | $ | 11,931,255 | $ | 4,860,460 | |||||
86
December 31, | |||||||
2014 | 2013 | ||||||
Assets | |||||||
Homebuilding | $ | 275,611,173 | $ | 91,519,281 | |||
Fee building | 16,346,933 | 7,430,015 | |||||
Total | $ | 291,958,106 | $ | 98,949,296 | |||
15. Pro Forma Net Income (Loss) and Earnings (Loss) per Share (Unaudited)
The pro forma amounts reflect the income tax provision as if the Company was a taxable corporation as of the beginning of the period, and assume the Company filed a consolidated tax return for the periods presented. Accordingly, the historical net income from the Company's sole taxable subsidiary would have been offset by losses from other entities, resulting in the elimination of income tax expense recorded for the year ended December 31, 2012.
For the year ended December 31, 2014, the pro forma tax provision assumes the Company's taxable income for the year would have included pre-tax income earned between January 1, 2014 and January 30, 2014, prior to the conversion to a taxable corporation. In addition, a net deferred income tax asset of $1.5 million was recognized as a result of the conversion to a taxable entity during the first quarter of 2014. However, the pro forma results exclude the effect of the conversion adjustment because of its nonrecurring nature.
Basic and diluted earnings per share and pro forma basic and diluted earnings per share give effect to the conversion of the Company's members' equity into common stock on January 30, 2014 as though the conversion had occurred as of the beginning of the reporting period or the original date of issuance, if later. See Note 2.
Year Ended December 31, | |||||||||||
2014 | 2013 | 2012 | |||||||||
Income (loss) before taxes | $ | 5,003,493 | $ | 6,995,891 | $ | (1,280,620 | ) | ||||
Pro forma income tax provision to reflect the conversion to a C Corporation | (1,648,323 | ) | (1,016,219 | ) | — | ||||||
Pro forma net income (loss) | 3,355,170 | 5,979,672 | (1,280,620 | ) | |||||||
Net loss attributable to noncontrolling interests | 29,472 | 500 | — | ||||||||
Pro forma net income (loss) attributable to The New Home Company Inc. | $ | 3,384,642 | $ | 5,979,172 | $ | (1,280,620 | ) | ||||
Pro forma basic earnings (loss) per share attributable to The New Home Company Inc. | $ | 0.21 | $ | 0.76 | $ | (0.25 | ) | ||||
Pro forma diluted earnings (loss) per share attributable to The New Home Company Inc. | $ | 0.21 | $ | 0.76 | $ | (0.25 | ) | ||||
87
16. Results of Quarterly Operations (Unaudited)
The following table presents our unaudited quarterly financial data. In our opinion, this information has been prepared on a basis consistent with that of our audited consolidated financial statements and all necessary material adjustments, consisting of normal recurring accruals and adjustments, have been included to present fairly the unaudited quarterly financial data. Our quarterly results of operations for these periods are not necessarily indicative of future results of operations:
First Quarter | Second Quarter | Third Quarter | Fourth Quarter | Total | |||||||||||||||
2014 | |||||||||||||||||||
Total revenues | $ | 25,563,406 | $ | 22,503,891 | $ | 28,604,713 | $ | 72,984,820 | $ | 149,656,830 | |||||||||
Cost of homes sales and fee building | 23,433,605 | 20,940,911 | 26,311,168 | 66,030,663 | 136,716,347 | ||||||||||||||
Gross margin | $ | 2,129,801 | $ | 1,562,980 | $ | 2,293,545 | $ | 6,954,157 | $ | 12,940,483 | |||||||||
Net income (loss) attributable to The New Home Company Inc. | $ | 1,571,211 | $ | (1,045,355 | ) | $ | (1,058,955 | ) | $ | 5,319,642 | $ | 4,786,543 | |||||||
Basic earnings (loss) per share attributable to The New Home Company Inc. (1) | $ | 0.11 | $ | (0.06 | ) | $ | (0.06 | ) | $ | 0.32 | $ | 0.30 | |||||||
Diluted earnings (loss) per share attributable to The New Home Company Inc. (1) | $ | 0.11 | $ | (0.06 | ) | $ | (0.06 | ) | $ | 0.32 | $ | 0.30 | |||||||
2013 | |||||||||||||||||||
Total revenues | $ | 18,139,081 | $ | 19,114,584 | $ | 21,171,278 | $ | 24,803,542 | $ | 83,228,485 | |||||||||
Cost of homes sales and fee building | 16,668,440 | 16,943,129 | 17,438,654 | 20,247,007 | 71,297,230 | ||||||||||||||
Gross margin | $ | 1,470,641 | $ | 2,171,455 | $ | 3,732,624 | $ | 4,556,535 | $ | 11,931,255 | |||||||||
Net income attributable to The New Home Company Inc. | $ | 187,682 | $ | 625,288 | $ | 2,103,161 | $ | 3,789,874 | $ | 6,706,005 | |||||||||
Basic earnings per share attributable to The New Home Company Inc. (1) | $ | 0.03 | $ | 0.07 | $ | 0.24 | $ | 0.44 | $ | 0.85 | |||||||||
Diluted earnings per share attributable to The New Home Company Inc. (1) | $ | 0.03 | $ | 0.07 | $ | 0.24 | $ | 0.44 | $ | 0.85 | |||||||||
(1) | Some amounts do not add to our full year results presented on our consolidated statement of operations due to rounding differences in quarterly and annual weighted average share calculations | |
88
Report of Independent Auditors
The Members
LR8 Investors, LLC
We have audited the accompanying consolidated financial statements of LR8 Investors, LLC, which comprise the consolidated balance sheets as of December 31, 2014 and 2013, and the related consolidated statements of operations, members’ capital, and cash flows for each of the three years in the period ended December 31, 2014, and the related notes to the consolidated financial statements.
Management’s Responsibility for the Financial Statements
Management is responsible for the preparation and fair presentation of these financial statements in conformity with U.S. generally accepted accounting principles; this includes the design, implementation, and maintenance of internal control relevant to the preparation and fair presentation of financial statements that are free of material misstatement, whether due to fraud or error.
Auditor’s Responsibility
Our responsibility is to express an opinion on these financial statements based on our audits. We conducted our audits in accordance with auditing standards generally accepted in the United States. Those standards require that we plan and perform the audit to obtain reasonable assurance about whether the financial statements are free of material misstatement.
An audit involves performing procedures to obtain audit evidence about the amounts and disclosures in the financial statements. The procedures selected depend on the auditor’s judgment, including the assessment of the risks of material misstatement of the financial statements, whether due to fraud or error. In making those risk assessments, the auditor considers internal control relevant to the entity’s preparation and fair presentation of the financial statements in order to design audit procedures that are appropriate in the circumstances, but not for the purpose of expressing an opinion on the effectiveness of the entity’s internal control. Accordingly, we express no such opinion. An audit also includes evaluating the appropriateness of accounting policies used and the reasonableness of significant accounting estimates made by management, as well as evaluating the overall presentation of the financial statements.
We believe that the audit evidence we have obtained is sufficient and appropriate to provide a basis for our audit opinion.
89
Opinion
In our opinion, the financial statements referred to above present fairly, in all material respects, the consolidated financial position of LR8 Investors, LLC at December 31, 2014 and 2013, and the consolidated results of its operations and its cash flows for each of the three years in the period ended December 31, 2014, in conformity with U.S. generally accepted accounting principles.
/s/ Ernst & Young LLP
February 27, 2015
90
LR8 Investors, LLC | ||||||||
(A Delaware Limited Liability Company) | ||||||||
Consolidated Balance Sheets | ||||||||
December 31 | ||||||||
2014 | 2013 | |||||||
Assets | ||||||||
Cash | $ | 4,311,732 | $ | 4,342,142 | ||||
Restricted cash | – | 752,032 | ||||||
Real estate inventories | – | 6,375,364 | ||||||
Other assets | 205,113 | 613,928 | ||||||
Total assets | $ | 4,516,845 | $ | 12,083,466 | ||||
Liabilities and members’ capital | ||||||||
Accounts payable | $ | 21,148 | $ | 1,433,663 | ||||
Accrued expenses and other liabilities | 2,435,995 | 2,402,063 | ||||||
Due to affiliates | 18,795 | 275,711 | ||||||
Notes payable | – | 3,150,326 | ||||||
2,475,938 | 7,261,763 | |||||||
Commitments and contingencies (Note 7) | ||||||||
Members’ capital | 2,040,907 | 4,821,703 | ||||||
Total liabilities and members’ capital | $ | 4,516,845 | $ | 12,083,466 | ||||
See accompanying notes. | ||||||||
91
LR8 Investors, LLC | ||||||||||
(A Delaware Limited Liability Company) | ||||||||||
Consolidated Statements of Operations | ||||||||||
Year Ended December 31 | ||||||||||
2014 | 2013 | 2012 | ||||||||
Revenues: | ||||||||||
Home sales | $ | 12,246,011 | $ | 151,912,433 | $ | 49,821,399 | ||||
Design studio option sales | 1,935,856 | 19,704,104 | 6,197,118 | |||||||
14,181,867 | 171,616,537 | 56,018,517 | ||||||||
Cost of sales: | ||||||||||
Cost of home sales | 7,982,505 | 111,015,455 | 37,113,105 | |||||||
Cost of design studio option sales | 1,526,821 | 13,241,592 | 4,435,131 | |||||||
9,509,326 | 124,257,047 | 41,548,236 | ||||||||
Gross profit | 4,672,541 | 47,359,490 | 14,470,281 | |||||||
Legal expenses | 534,415 | – | – | |||||||
Selling and marketing expenses | 94,957 | 2,437,766 | 1,361,282 | |||||||
Selling and marketing expenses | ||||||||||
incurred from affiliates | 189,768 | 1,041,592 | 750,090 | |||||||
Guaranty fees to affiliates | 18,927 | 113,562 | 85,172 | |||||||
Overhead fees to affiliates | 229,321 | 3,791,914 | 2,468,337 | |||||||
Net income | $ | 3,605,153 | $ | 39,974,656 | $ | 9,805,400 | ||||
See accompanying notes. | ||||||||||
92
LR8 Investors, LLC | ||||||||||
(A Delaware Limited Liability Company) | ||||||||||
Consolidated Statements of Members’ Capital | ||||||||||
Years Ended December 31, 2014, 2013 and 2012 | ||||||||||
The New Home | ||||||||||
Company | ||||||||||
Southern | MFCI8 LR, | |||||||||
California LLC | LLC | Total | ||||||||
Balance at December 31, 2011 | $ | 2,244,734 | $ | 42,649,947 | $ | 44,894,681 | ||||
Contributions | 1,050,100 | 19,951,900 | 21,002,000 | |||||||
Distributions | (1,325,000 | ) | (25,175,000 | ) | (26,500,000 | ) | ||||
Net income | 490,270 | 9,315,130 | 9,805,400 | |||||||
Balance at December 31, 2012 | 2,460,104 | 46,741,977 | 49,202,081 | |||||||
Distributions | (6,930,433 | ) | (77,424,601 | ) | (84,355,034 | ) | ||||
Net income | 5,678,264 | 34,296,392 | 39,974,656 | |||||||
Balance at December 31, 2013 | 1,207,935 | 3,613,768 | 4,821,703 | |||||||
Distributions | (1,677,190 | ) | (4,708,759 | ) | (6,385,949 | ) | ||||
Net income | 1,081,546 | 2,523,607 | 3,605,153 | |||||||
Balance at December 31, 2014 | $ | 612,291 | $ | 1,428,616 | $ | 2,040,907 | ||||
See accompanying notes. | ||||||||||
93
LR8 Investors, LLC | ||||||||||
(A Delaware Limited Liability Company) | ||||||||||
Consolidated Statements of Cash Flows | ||||||||||
Year Ended December 31 | ||||||||||
2014 | 2013 | 2012 | ||||||||
Operating activities | ||||||||||
Net income | $ | 3,605,153 | $ | 39,974,656 | $ | 9,805,400 | ||||
Adjustments to reconcile net income | ||||||||||
to net cash provided by (used in) operating activities: | ||||||||||
Amortization | – | – | 85,172 | |||||||
Net changes in operating assets and liabilities: | ||||||||||
Real estate inventories | 6,375,364 | 72,814,795 | (13,434,325 | ) | ||||||
Other assets | 408,815 | 114,369 | (677,269 | ) | ||||||
Accounts payable | (1,412,515 | ) | (3,083,200 | ) | 2,459,905 | |||||
Due to affiliates | (256,916 | ) | 1,352,563 | (1,952,949 | ) | |||||
Accrued expenses and other liabilities | 33,932 | (156,037 | ) | 397,680 | ||||||
Net cash provided by (used in) operating activities | 8,753,833 | 111,017,146 | (3,316,386 | ) | ||||||
Financing activities | ||||||||||
Proceeds from issuance of notes payable | – | 39,702,252 | 72,620,866 | |||||||
Cash collateral on notes payable, net | 752,032 | 4,496,968 | (5,249,000 | ) | ||||||
Repayments of secured notes | (3,150,326 | ) | (67,689,266 | ) | (57,483,526 | ) | ||||
Members’ capital contributions | – | – | 21,002,000 | |||||||
Members’ capital distributions | (6,385,949 | ) | (84,355,034 | ) | (26,500,000 | ) | ||||
Net cash provided by (used in) financing activities | (8,784,243 | ) | (107,845,080 | ) | 4,390,340 | |||||
Net (decrease) increase in cash | (30,410 | ) | 3,172,066 | 1,073,954 | ||||||
Cash at beginning of year | 4,342,142 | 1,170,076 | 96,122 | |||||||
Cash at end of year | $ | 4,311,732 | $ | 4,342,142 | $ | 1,170,076 | ||||
Supplemental disclosures of cash flow | ||||||||||
information | ||||||||||
Interest paid, net of amounts capitalized | $ – | $ – | $ – | |||||||
See accompanying notes. | ||||||||||
94
LR8 Investors, LLC
(A Delaware Limited Liability Company)
Notes to Consolidated Financial Statements
December 31, 2014
1. Organization and Summary of Significant Accounting Policies
LR8 Investors, LLC (“Investors”), a Delaware limited liability company, was formed with an effective date of September 22, 2010, for the purpose of acquiring and owning 100% of LR8 Owner, LLC (“Owner”, and together with Investors, the “Company”), a Delaware limited liability company.
Owner was formed with an effective date of September 22, 2010 to acquire approximately 51 acres of land for the development and sale of 169 homes in a community known as Lambert Ranch, located in Irvine, California (the “Project”). As of December 31, 2014, all homes had been sold and closed.
As of December 31, 2014, the members of Investors (individually, the “Member”, and collectively, the “Members”) and their respective percentage interests are as follows:
The New Home Company Southern California LLC (“TNHC”) 5%
MFCI8 LR, LLC (“MFCI8”) 95%
Investors is scheduled to terminate on December 31, 2060, unless sooner terminated by the provisions provided for in the limited liability company agreement (the “Agreement”).
Distributions, income and losses are to be allocated in accordance with the provisions of the Agreement.
The liability of each Member is limited to the amount of capital contributions required to be made by such Member in accordance with the provisions of the Agreement.
Basis of Presentation
The accompanying consolidated financial statements have been prepared in accordance with U.S. generally accepted accounting principles (“GAAP”) as contained within the Financial Accounting Standards Board (“FASB”) Accounting Standards Codification (“ASC”). This basis of accounting contemplates the recovery of the Company’s assets and the satisfaction of its liabilities in the normal course of business.
Principles of Consolidation
The consolidated financial statements include the accounts of LR8 Investors, LLC and its wholly owned and controlled subsidiary. The accounting policies of the subsidiary are substantially the same as those of Investors. All significant intercompany accounts and transactions have been eliminated in consolidation.
95
Use of Estimates
The preparation of the Company’s consolidated financial statements in conformity with GAAP requires management to make estimates and assumptions that affect the reported amounts of assets, liabilities, revenues and expenses, and the disclosure of commitments and contingencies. Actual results could differ materially from those estimates.
Cash
The Company considers all highly liquid investments that are readily convertible to cash, with original maturity dates of three months or less, to be cash and cash equivalents. Financial instruments that potentially subject the Company to significant concentrations of credit risk consist principally of cash deposited with financial institutions in excess of amounts insured by the Federal Deposit Insurance Corporation. The Company has not experienced any losses related to uninsured cash balances.
Restricted Cash
Restricted cash of $0 and $752,032 as of December 31, 2014 and 2013, respectively, is held in various accounts and serves as additional collateral for certain notes payable.
Real Estate Inventories and Cost of Sales
Real estate inventories are carried at cost. Development costs, including land, land development, direct costs of construction, indirect costs, interest, and property taxes incurred during the development period, are capitalized. Capitalization of development costs ends when the assets are substantially complete and ready for sale.
Costs of home sales are allocated based on specific identifications, or relative sales value, depending on the nature of the costs. Project-specific costs are amortized to cost of sales as homes are closed based upon a method that approximates relative sales value. A provision for warranty costs is included in cost of home sales at the time the sale of a home is recorded. Selling and marketing costs are expensed in the period incurred.
Real estate inventories are stated at cost, unless the carrying amount is determined not to be recoverable, in which case the inventories are written down to fair value in accordance with ASC 360, Property, Plant, and Equipment. ASC 360 requires that real estate assets be tested for impairment whenever events or changes in circumstances indicate that their carrying amounts may not be recoverable.
Impairment of assets is measured by comparing the carrying amount of an asset to the undiscounted future net cash flows expected to be generated by the asset. These evaluations for impairment are significantly impacted by estimates of the amounts and timing of revenues, costs and expenses, and other factors. If real estate assets are considered to be impaired, the impairment to be recognized is measured by the amount by which the carrying value of the assets exceeds the fair value of the assets. Fair value is determined based on estimated future cash flows discounted for inherent risks associated with the real estate assets, or other valuation techniques.
As of December 31, 2014 and 2013, the Company determined that the carrying amounts of its real estate inventories were not impaired based upon undiscounted future cash flow of the underlying Project.
96
Revenue Recognition
In accordance with ASC 360, revenues from home sales and other real estate sales are recorded and a profit is recognized when the respective units are closed. Home sales and other real estate sales are closed when all conditions of escrow are met, including delivery of the home, title passage, appropriate consideration is received and collection of associated receivables, if any, is reasonably assured. Sales incentives are a reduction of revenues when the respective unit is closed. When it is determined that the earnings process is not complete, the sale and the related profit are deferred for recognition in future periods.
Income Taxes
As a limited liability company, the Company is subject to certain minimal taxes and fees; however, income taxes on income reported by the Company are the obligation of the Members.
The Company applies the provisions of ASC 740, Accounting for Uncertainty in Income Taxes. Based on its evaluation, under ASC 740, the Company has concluded that there are no significant uncertain tax positions requiring recognition in its financial statements, nor has the Company been assessed interest or penalties by any major tax jurisdictions. The Company’s evaluation was performed for the tax years ended December 31, 2014, 2013, and 2012.
2. Real Estate Inventories
Real estate inventories consisted of the following:
December 31 | ||||||
2014 | 2013 | |||||
Construction in progress | $ | — | $ | 5,347,470 | ||
Model homes | — | 1,027,894 | ||||
$ | — | $ | 6,375,364 | |||
Construction in progress consists primarily of construction costs for homes and common area facilities, which are in various stages of development.
The Company incurred, capitalized, and amortized interest costs as follows:
Year Ended December 31 | |||||||||
2,014 | 2,013 | 2,012 | |||||||
Interest included in beginning real estate inventories | $ | 66,386 | $ | 1,962,533 | $ | 1,340,495 | |||
Interest incurred and capitalized | 18,113 | 1,216,333 | 1,980,418 | ||||||
Interest amortized to cost of sales | (84,499 | ) | (3,112,480 | ) | (1,358,380 | ) | |||
Interest included in ending real estate inventories | $ | — | $ | 66,386 | $ | 1,962,533 | |||
3. Other Assets
Other assets consisted of the following:
97
December 31 | ||||||
2014 | 2013 | |||||
Cash collateral - performance bonds | $ | 180,113 | $ | 588,928 | ||
Refundable deposits | 25,000 | 25,000 | ||||
$ | 205,113 | $ | 613,928 | |||
4. Accrued Expenses and Other Liabilities
Accrued expenses and other liabilities consisted of the following:
December 31 | ||||||
2014 | 2013 | |||||
Warranty reserve | $ | 2,175,003 | $ | 2,190,108 | ||
Completion reserve | 260,992 | 192,291 | ||||
Interest payable | — | 19,664 | ||||
$ | 2,435,995 | $ | 2,402,063 | |||
The Company offers warranties on its homes that generally cover various defects in workmanship, materials, or to cover structural construction defects. Estimated future direct warranty costs are accrued and charged to cost of sales in the period when the related homebuilding revenues are recognized. The Company assesses the adequacy of its warranty accrual on a quarterly basis and adjusts the amounts recorded if necessary. The Company’s warranty accrual is included in accrued expenses and other liabilities in the accompanying consolidated balance sheets.Changes in the Company’s warranty liability are as follows:
Year Ended December 31 | |||||||||
2014 | 2013 | 2012 | |||||||
Beginning warranty liability | $ | 2,190,108 | $ | 560,206 | $ | — | |||
Warranty provision | 141,825 | 1,716,200 | 560,206 | ||||||
Warranty payments | (156,930 | ) | (86,298 | ) | — | ||||
Ending warranty liability | $ | 2,175,003 | $ | 2,190,108 | $ | 560,206 | |||
The completion reserve includes project costs for homes that have closed but for which invoices from vendors have not yet been received. The Company periodically assesses the adequacy of its completion reserve and adjusts the amounts as necessary.
98
5. Due to Affiliates and Related-Party Transactions
Due to affiliates consisted of the following:
December 31 | ||||||
2014 | 2013 | |||||
Accrued payroll | $ | 18,795 | $ | 162,009 | ||
Accrued overhead fees to affiliates | — | 28,530 | ||||
Accrued loan guarantees to affiliates | — | 85,172 | ||||
$ | 18,795 | $ | 275,711 | |||
During the years ended December 31, 2014, 2013, and 2012, TNHC incurred construction-related costs on the Company’s behalf of $788,760, $2,284,409 and $1,718,734, respectively. The Company capitalized $598,992, $1,242,817 and $1,070,738 of these amounts to real estate inventories and charged the remaining $189,768, $1,041,592 and $750,090 to selling and marketing expenses incurred from affiliates in the accompanying consolidated statements of operations. As of December 31, 2014 and 2013, $18,795 and $162,009, respectively, is included in due to affiliates in the accompanying consolidated balance sheets.
Pursuant to the Development Management Agreement as referenced in the operating agreement, TNHC shall receive an overhead fee from the Company in an amount equal to 3.0% of the Project’s revenues. This amount will be paid as follows:
1 | 0.75% of the projected gross sales revenue of the Project, paid in equal monthly installments beginning with the commencement of grading work, based upon a 23-month period; |
2 | 0.75% of the projected gross sales revenue of the Project, paid in equal monthly installments beginning with the commencement of construction of the model homes, based upon a 28-month period; |
3 | 0.75% of the gross sales revenue from each home sold, payable upon the close of escrow; |
4 | 0.75% of the gross sales revenue from each home sold, payable upon each Member having reached a 15% IRR on its capital contributions. |
During the years ended December 31, 2014, 2013, and 2012, TNHC earned $229,321, $3,791,914 and $2,468,337, respectively, in overhead fees, which have been recorded by the Company as overhead fees to affiliates in the accompanying consolidated statements of operations. As of December 31, 2014 and 2013, $0 and $28,530, respectively, was due to TNHC for such fees and has been included in due to affiliates in the accompanying consolidated balance sheets.
During the years ended December 31, 2014, 2013, and 2012, the Company incurred $120,000 in project coordination fees due to an affiliate of MFCI8. The Company has capitalized these amounts to real estate inventories. As of December 31, 2014 and 2013, no amounts were due to this affiliate.
During the years ended December 31, 2014, 2013, and 2012, the Company incurred $18,927, $113,562 and $85,172, respectively, for certain loan guaranties provided to the Company by TNHC, which were recorded by the Company as guaranty fees to affiliates in the accompanying consolidated statements of operations. As of December 31, 2014 and 2013, $0 and $85,172, respectively, was due to TNHC.
6. Notes Payable
The Company had notes payable secured by real estate outstanding as follows:
99
December 31 | ||||||
2014 | 2013 | |||||
Construction note payable | $ | — | $ | 3,150,326 | ||
$ | — | $ | 3,150,326 | |||
The Company repaid all outstanding principal and interest due on the note payable as of March 31, 2014.
7. Commitments and Contingencies
The Company’s commitments and contingencies include the usual obligations and litigation incurred by real estate developers in the normal course of business. In the opinion of management, there are no material loss contingencies.
The Company obtains performance bonds in the normal course of business to ensure completion of the infrastructure of the Project. As of December 31, 2014 and 2013, the Company had $1,670,694 and $5,697,236, respectively, in performance bonds outstanding with various cities, governmental entities, and others, for which the Company had disbursed $180,113 and $588,928, respectively, in cash collateral to third parties.
8. Subsequent Events
The Company has evaluated subsequent events through February 27, 2015, the date the consolidated financial statements were available for issuance.
100
Report of Independent Auditors
The Members
Larkspur Land 8 Investors, LLC
We have audited the accompanying consolidated financial statements of Larkspur Land 8 Investors, LLC, which comprise the consolidated balance sheets as of December 31, 2014 and 2013, and the related consolidated statements of operations, members’ capital, and cash flows for each of the three years in the period ended December 31, 2014, and the related notes to the consolidated financial statements.
Management’s Responsibility for the Financial Statements
Management is responsible for the preparation and fair presentation of these financial statements in conformity with U.S. generally accepted accounting principles; this includes the design, implementation, and maintenance of internal control relevant to the preparation and fair presentation of financial statements that are free of material misstatement, whether due to fraud or error.
Auditor’s Responsibility
Our responsibility is to express an opinion on these financial statements based on our audits. We conducted our audits in accordance with auditing standards generally accepted in the United States. Those standards require that we plan and perform the audit to obtain reasonable assurance about whether the financial statements are free of material misstatement.
An audit involves performing procedures to obtain audit evidence about the amounts and disclosures in the financial statements. The procedures selected depend on the auditor’s judgment, including the assessment of the risks of material misstatement of the financial statements, whether due to fraud or error. In making those risk assessments, the auditor considers internal control relevant to the entity’s preparation and fair presentation of the financial statements in order to design audit procedures that are appropriate in the circumstances, but not for the purpose of expressing an opinion on the effectiveness of the entity’s internal control. Accordingly, we express no such opinion. An audit also includes evaluating the appropriateness of accounting policies used and the reasonableness of significant accounting estimates made by management, as well as evaluating the overall presentation of the financial statements.
We believe that the audit evidence we have obtained is sufficient and appropriate to provide a basis for our audit opinion.
101
Opinion
In our opinion, the financial statements referred to above present fairly, in all material respects, the consolidated financial position of Larkspur Land 8 Investors, LLC at December 31, 2014 and 2013, and the consolidated results of its operations and its cash flows for each of the three years in the period ended December 31, 2014, in conformity with U.S. generally accepted accounting principles.
/s/ Ernst & Young LLP
February 27, 2015
102
Larkspur Land 8 Investors, LLC | |||||||||||||
(A Delaware Limited Liability Company) | |||||||||||||
Consolidated Balance Sheets | |||||||||||||
December 31 | |||||||||||||
2014 | 2013 | ||||||||||||
Assets | |||||||||||||
Cash | $ | 4,072,468 | $ | 854,949 | |||||||||
Restricted cash | 4,251,585 | 1,660,075 | |||||||||||
Real estate inventories | 28,741,391 | 54,289,644 | |||||||||||
Other assets | 1,493,417 | 716,025 | |||||||||||
Total assets | $ | 38,558,861 | $ | 57,520,693 | |||||||||
Liabilities and members’ capital | |||||||||||||
Accounts payable | $ | 3,249,658 | $ | 1,983,775 | |||||||||
Due to affiliates | 254,282 | 1,136 | |||||||||||
Accrued expenses and other liabilities | 745,752 | 4,947 | |||||||||||
Notes payable | 11,340,718 | 21,099,441 | |||||||||||
15,590,410 | 23,089,299 | ||||||||||||
Commitments and contingencies (Note 7) | |||||||||||||
Members’ capital | 22,968,451 | 34,431,394 | |||||||||||
Total liabilities and members’ capital | $ | 38,558,861 | $ | 57,520,693 | |||||||||
See accompanying notes. | |||||||||||||
103
Larkspur Land 8 Investors, LLC | |||||||||||||||
(A Delaware Limited Liability Company) | |||||||||||||||
Consolidated Statements of Operations | |||||||||||||||
Year Ended December 31 | |||||||||||||||
2014 | 2013 | 2012 | |||||||||||||
Revenues: | |||||||||||||||
Home sales | $ | 66,048,338 | $ | — | $ | — | |||||||||
Design studio option sales | 4,632,357 | — | — | ||||||||||||
70,680,695 | — | — | |||||||||||||
Cost of sales: | |||||||||||||||
Cost of home sales | 52,663,079 | — | — | ||||||||||||
Cost of design studio option sales | 3,252,694 | — | — | ||||||||||||
55,915,773 | — | — | |||||||||||||
Gross profit | 14,764,922 | — | — | ||||||||||||
Selling and marketing expenses | 894,571 | 185,803 | 16,406 | ||||||||||||
Selling and marketing expenses incurred | |||||||||||||||
from affiliates | 931,950 | 106,480 | — | ||||||||||||
Overhead fees to affiliates | 601,344 | 931,774 | 516,643 | ||||||||||||
Net income (loss) | $ | 12,337,057 | $ | (1,224,057 | ) | $ | (533,049 | ) | |||||||
See accompanying notes. | |||||||||||||||
104
Larkspur Land 8 Investors, LLC | |||||||||||||||
(A Delaware Limited Liability Company) | |||||||||||||||
Consolidated Statements of Members’ Capital | |||||||||||||||
Years Ended December 31, 2014, 2013 and 2012 | |||||||||||||||
The New Home | |||||||||||||||
Company | MFCI8 | ||||||||||||||
Northern | Larkspur | ||||||||||||||
California LLC | Land, LLC | Total | |||||||||||||
Balance at December 31, 2011 | $ | 2,609,850 | $ | 23,506,650 | $ | 26,116,500 | |||||||||
Contributions | 859,000 | 7,713,000 | 8,572,000 | ||||||||||||
Distributions | (370,000 | ) | (3,330,000 | ) | (3,700,000 | ) | |||||||||
Net loss | (53,305 | ) | (479,744 | ) | (533,049 | ) | |||||||||
Balance at December 31, 2012 | 3,045,545 | 27,409,906 | 30,455,451 | ||||||||||||
Contributions | 520,000 | 4,680,000 | 5,200,000 | ||||||||||||
Net loss | (122,406 | ) | (1,101,651 | ) | (1,224,057 | ) | |||||||||
Balance at December 31, 2013 | 3,443,139 | 30,988,255 | 34,431,394 | ||||||||||||
Contributions | 50,000 | 450,000 | 500,000 | ||||||||||||
Distributions | (2,430,000 | ) | (21,870,000 | ) | (24,300,000 | ) | |||||||||
Net income | 1,233,706 | 11,103,351 | 12,337,057 | ||||||||||||
Balance at December 31, 2014 | $ | 2,296,845 | $ | 20,671,606 | $ | 22,968,451 | |||||||||
See accompanying notes. | |||||||||||||||
105
Larkspur Land 8 Investors, LLC | |||||||||||||||
(A Delaware Limited Liability Company) | |||||||||||||||
Consolidated Statements of Cash Flows | |||||||||||||||
Year Ended December 31 | |||||||||||||||
2014 | 2013 | 2012 | |||||||||||||
Operating activities: | |||||||||||||||
Net income (loss) | $ | 12,337,057 | $ | (1,224,057 | ) | $ | (533,049 | ) | |||||||
Adjustments to reconcile net income (loss) to net cash | |||||||||||||||
provided by (used in) operating activities: | |||||||||||||||
Net changes in operating assets and liabilities: | |||||||||||||||
Real estate inventories | 25,548,253 | (18,638,678 | ) | (9,738,514 | ) | ||||||||||
Other assets | (777,392 | ) | (388,500 | ) | (327,525 | ) | |||||||||
Accounts payable | 1,265,883 | 1,151,908 | 314,379 | ||||||||||||
Due to affiliates | 253,146 | 1,136 | — | ||||||||||||
Accrued expenses and other liabilities | 740,805 | (104,296 | ) | 109,243 | |||||||||||
Net cash provided by (used in) operating activities | 39,367,752 | (19,202,487 | ) | (10,175,466 | ) | ||||||||||
Financing activities: | |||||||||||||||
Cash collateral on notes payable | (2,591,510 | ) | (1,660,075 | ) | — | ||||||||||
Proceeds from issuance of notes payable | 31,831,975 | 20,813,005 | 5,584,436 | ||||||||||||
Repayments of secured notes | (41,590,698 | ) | (5,298,000 | ) | — | ||||||||||
Members’ capital contributions | 500,000 | 5,200,000 | 8,572,000 | ||||||||||||
Members’ capital distributions | (24,300,000 | ) | — | (3,700,000 | ) | ||||||||||
Net cash (used in) provided by financing activities | (36,150,233 | ) | 19,054,930 | 10,456,436 | |||||||||||
Net increase (decrease) in cash | 3,217,519 | (147,557 | ) | 280,970 | |||||||||||
Cash at beginning of year | 854,949 | 1,002,506 | 721,536 | ||||||||||||
Cash at end of year | $ | 4,072,468 | $ | 854,949 | $ | 1,002,506 | |||||||||
Supplemental disclosure of cash flow information | |||||||||||||||
Interest paid, net of amounts capitalized | $ | — | $ | — | $ | — | |||||||||
See accompanying notes. | |||||||||||||||
106
Larkspur Land 8 Investors, LLC
(A Delaware Limited Liability Company)
Notes to Consolidated Financial Statements
December 31, 2014
1. Organization and Summary of Significant Accounting Policies
Larkspur Land 8 Investors, LLC (“Investors”), a Delaware limited liability company, was formed on June 23, 2011, for the purpose of acquiring and owning 100% of Larkspur Land 8 Owner, LLC (“Owner”, and together with Investors, the “Company”), a Delaware limited liability company.
Owner was formed on June 23, 2011 to acquire approximately 17 acres of land for the development and sale of 85 homes in a community known as Rose Lane, located in Larkspur, California (the “Project”).
As of December 31, 2014, the members of Investors (individually, the “Member”, and collectively, the “Members”) and their respective percentage interests are as follows:
The New Home Company Northern California LLC (“TNHC”) | 10% |
MFCI8 Larkspur Land, LLC (“MFCI8”) | 90% |
Investors will terminate on December 31, 2061, unless sooner terminated pursuant to the provisions of the limited liability company agreement (the “Agreement”).
Distributions, income and losses are to be allocated in accordance with the provisions of the Agreement.
The liability of each Member is limited to the amount of capital contributions required to be made by such Member in accordance with the provisions of the Agreement.
Basis of Presentation
The accompanying consolidated financial statements have been prepared in accordance with U.S. generally accepted accounting principles (“GAAP”) as contained within the Financial Accounting Standards Board (“FASB”) Accounting Standards Codification (“ASC”). This basis of accounting contemplates the recovery of the Company’s assets and the satisfaction of its liabilities in the normal course of business.
Principles of Consolidation
The consolidated financial statements include the accounts of Larskpur Land 8 Investors, LLC and its wholly owned and controlled subsidiary. The accounting policies of the subsidiary are substantially the same as those of Investors. All significant intercompany accounts and transactions have been eliminated in consolidation.
107
Use of Estimates
The preparation of the Company’s consolidated financial statements in conformity with GAAP requires management to make estimates and assumptions that affect the reported amounts of assets, liabilities, revenues and expenses, and the disclosure of commitments and contingencies. Actual results could differ materially from those estimates.
Cash
The Company considers all highly-liquid investments that are readily convertible to cash, with original maturity dates of three months or less, to be cash and cash equivalents. Financial instruments that potentially subject the Company to significant concentrations of credit risk consist principally of cash deposited with financial institutions in excess of amounts insured by the Federal Deposit Insurance Corporation. The Company has not experienced any losses related to uninsured cash balances.
Restricted Cash
As of December 31, 2014 and 2013, restricted cash of $4,251,585 and $1,660,075, respectively, is held in a separate account and serves as additional collateral for certain notes payable.
Real Estate Inventories and Cost of Sales
Real estate inventories are carried at cost. Development costs, including land, land development, direct costs of construction, indirect costs, interest and property taxes incurred during the development period, are capitalized. Capitalization of development costs ends when the assets are substantially complete and ready for sale.
Costs of home sales are allocated based on specific identification, or relative sales value, depending on the nature of the costs. Project specific costs are amortized to cost of sales as homes are closed based upon a method that approximates relative sales value. A provision for warranty costs is included in cost of homes sold at the time the sale of a home is recorded. Selling and marketing costs are expensed in the period incurred.
Real estate inventories are stated at cost, unless the carrying amount is determined not to be recoverable, in which case the inventories are written down to fair value in accordance with ASC 360, Property, Plant and Equipment. ASC 360 requires that real estate assets be tested for impairment whenever events or changes in circumstances indicate that their carrying amounts may not be recoverable.
Impairment of assets is measured by comparing the carrying amount of an asset to the undiscounted future net cash flows expected to be generated by the asset. These evaluations for impairment are significantly impacted by estimates of the amounts and timing of revenues, costs and expenses, and other factors. If real estate assets are considered to be impaired, the impairment to be recognized is measured by the amount by which the carrying value of the assets exceeds the fair value of the assets. Fair value is determined based on estimated future cash flows discounted for inherent risks associated with the real estate assets, or other valuation techniques.
As of December 31, 2014 and 2013, the Company determined that the carrying amounts of its real estate inventories were not impaired based upon undiscounted future cash flows of the underlying Project.
108
Revenue Recognition
In accordance with ASC 360, revenues from home sales and other real estate sales are recorded and a profit is recognized when the respective units are closed. Home sales and other real estate sales are closed when all conditions of escrow are met, including delivery of the home, title passage, appropriate consideration is received and collection of associated receivables, if any, is reasonably assured. Sales incentives are a reduction of revenues when the respective unit is closed. When it is determined that the earnings process is not complete, the sale and the related profit are deferred for recognition in future periods.
Income Taxes
As a limited liability company, the Company is subject to certain minimal taxes and fees; however, income taxes on income reported by the Company are the obligation of the Members.
The Company applies the provisions of ASC 740, Accounting for Uncertainty in Income Taxes. Based on its evaluation, under ASC 740, the Company has concluded that there are no significant uncertain tax positions requiring recognition in its financial statements, nor has the Company been assessed interest or penalties by any major tax jurisdictions. The Company’s evaluation was performed for the tax years ended December 31, 2014, 2013, and 2012.
2. Real Estate Inventories
Real estate inventories consisted of the following:
December 31 | ||||||
2014 | 2013 | |||||
Land and land development | $ | — | $ | 35,356,632 | ||
Construction in progress | 25,578,588 | 14,569,407 | ||||
Finished homes | 826,736 | — | ||||
Model homes | 2,336,067 | 4,363,605 | ||||
$ | 28,741,391 | $ | 54,289,644 | |||
Construction in progress consists primarily of construction costs for homes and common area facilities, which are in various stages of development.
The Company incurred, capitalized and amortized interest costs as follows:
Year Ended December 31 | |||||||||
2014 | 2013 | 2012 | |||||||
Interest included in beginning real estate inventories | $ | 822,438 | $ | 15,662 | $ | — | |||
Interest incurred and capitalized | 1,315,541 | 806,776 | 15,662 | ||||||
Interest amortized to cost of sales | (1,338,677 | ) | — | — | |||||
Interest included in ending real estate inventories | $ | 799,302 | $ | 822,438 | $ | 15,662 | |||
109
3. Other Assets
Other assets consisted of the following:
December 31 | ||||||
2014 | 2013 | |||||
Cash collateral - performance bonds | $ | 1,285,009 | $ | 716,025 | ||
Receivables | 208,408 | — | ||||
$ | 1,493,417 | $ | 716,025 | |||
Receivables are amounts related to overpayments made to and due from trade partners during the year ended December 31, 2014.
4. Accrued Expenses and Other Liabilities
Accrued expenses and other liabilities consisted of the following:
December 31 | ||||||
2014 | 2013 | |||||
Warranty reserve | $ | 676,946 | $ | — | ||
Completion reserve | 37,336 | — | ||||
Interest payable | 31,470 | 4,947 | ||||
$ | 745,752 | $ | 4,947 | |||
The Company offers warranties on its homes that generally cover various defects in workmanship or materials or to cover structural construction defects. Estimated future direct warranty costs are accrued and charged to cost of sales in the period when the related homebuilding revenues are recognized. The Company assesses the adequacy of its warranty reserve on a quarterly basis and adjusts the amounts recorded if necessary. The Company’s warranty reserve is included in accrued expenses and other liabilities on the accompanying consolidated balance sheets.
Changes in the Company’s warranty reserve are as follows:
Year Ended December 31 | |||||||||
2014 | 2013 | 2012 | |||||||
Beginning warranty reserve | $ | — | $ | — | $ | — | |||
Warranty provision | 707,268 | — | — | ||||||
Warranty payments | (30,322 | ) | — | — | |||||
Ending warranty reserve | $ | 676,946 | $ | — | $ | — | |||
The completion reserve includes project costs for homes that have closed but for which invoices from vendors have not yet been received. The Company periodically assesses the adequacy of its completion reserve and adjusts the amounts as necessary.
110
5. Due to Affiliates and Related-Party Transactions
Due to affiliates consisted of the following:
December 31 | ||||||
2014 | 2013 | |||||
Accrued payroll | $ | 121,125 | $ | 1,136 | ||
Accrued overhead fees to affiliates | 102,344 | — | ||||
Commissions payable | 30,813 | — | ||||
$ | 254,282 | $ | 1,136 | |||
During the years ended December 31, 2014, 2013, and 2012, TNHC incurred construction-related costs on the Company’s behalf of $1,820,028, $711,671 and $298,468, respectively. The Company has capitalized $888,078, $605,191 and $298,468 of these amounts to real estate inventories and charged the remaining $931,950, $106,480 and $0 to selling and marketing expenses incurred from affiliates in the accompanying consolidated statements of operations. As of December 31, 2014 and 2013, $151,948 and $1,136, respectively, is included in due to affiliates in the accompanying consolidated balance sheets.
Pursuant to the Development Management Agreement as referenced in the operating agreement, TNHC shall receive an overhead fee from the Company in an amount equal to 3.0% of the Project revenues. This amount will be paid as follows:
1) | 1.0% of the projected gross sales revenue of the Project, paid in equal monthly installments beginning with the commencement of grading work, based upon a 25-month period; |
2) | 1.0% of the projected gross sales revenue of the Project, paid in equal monthly installments beginning with the commencement of the construction of the model homes, based upon a 27-month period; |
3) | 1.0% of the gross sales revenue from each home sold, payable upon each Member having reached a 15% IRR on its capital contributions. |
During the years ended December 31, 2014, 2013, and 2012, the Company incurred $601,344, $931,774 and $516,643, respectively in overhead fees payable to TNHC, which have been recorded by the Company as overhead fees to affiliates in the accompanying consolidated statements of operations. As of December 31, 2014 and 2013, $102,344 and $0, respectively, was due to TNHC for such fees and has been reflected in due to affiliates in the accompanying consolidated balance sheets.
The Company is provided certain loan guaranties by the Members on its construction note payable in order to secure performance under the loan and maintain certain loan-to-value ratios. Each of the Members is apportioned liability under the guaranties according to their respective percentage interest. As of December 31, 2014 and 2013, $11,340,718 and $11,761,791, respectively, was outstanding under the loan.
During the years ended December 31, 2014, 2013, and 2012, the Company incurred $120,000 in project coordination fees due to an affiliate of MFCI8. The Company has capitalized these amounts to real estate inventories. At December 31, 2014 and 2013, no amounts were due to this affiliate.
111
6. Notes Payable
The Company had notes payable secured by real estate outstanding as follows:
December 31 | ||||||
2014 | 2013 | |||||
Acquisition and development note payable; paid in full as of June 18, 2014 | $ | — | $ | 9,337,650 | ||
Construction note payable with a total commitment of $36,000,000; matures March 2015 and bears interest at a rate of 1-month LIBOR plus 5.5% (5.69% at December 31, 2014). At December 31, 2014, $24,659,282 was available to be drawn under the note. | 11,340,718 | 11,761,791 | ||||
$ | 11,340,718 | $ | 21,099,441 | |||
7. Commitments and Contingencies
The Company’s commitments and contingencies include the usual obligations incurred by real estate developers in the normal course of business. In the opinion of management, there are no material loss contingencies.
The Company obtains performance bonds in the normal course of business to ensure completion of the infrastructure of the Project. As of December 31, 2014 and 2013, the Company had $19,823,991 and $6,644,864, respectively, in performance bonds outstanding with various cities, governmental entities, and others, for which the Company had disbursed $1,285,009 and $716,025, respectively, in cash collateral to third parties.
8. Subsequent Events
The Company has evaluated subsequent events through February 27, 2015, the date the financial statements were available for issuance.
112
Report of Independent Auditors
The Members
TNHC Newport LLC
We have audited the accompanying financial statements of TNHC Newport LLC, which comprise the balance sheets as of December 31, 2014 and 2013, and the related statements of operations, members’ capital, and cash flows for the year ended December 31, 2014, and the period from March 1, 2013 (inception) to December 31, 2013, and the related notes to the financial statements.
Management’s Responsibility for the Financial Statements
Management is responsible for the preparation and fair presentation of these financial statements in conformity with U.S. generally accepted accounting principles; this includes the design, implementation, and maintenance of internal control relevant to the preparation and fair presentation of financial statements that are free of material misstatement, whether due to fraud or error.
Auditor’s Responsibility
Our responsibility is to express an opinion on these financial statements based on our audits. We conducted our audits in accordance with auditing standards generally accepted in the United States. Those standards require that we plan and perform the audit to obtain reasonable assurance about whether the financial statements are free of material misstatement.
An audit involves performing procedures to obtain audit evidence about the amounts and disclosures in the financial statements. The procedures selected depend on the auditor’s judgment, including the assessment of the risks of material misstatement of the financial statements, whether due to fraud or error. In making those risk assessments, the auditor considers internal control relevant to the entity’s preparation and fair presentation of the financial statements in order to design audit procedures that are appropriate in the circumstances, but not for the purpose of expressing an opinion on the effectiveness of the entity’s internal control. Accordingly, we express no such opinion. An audit also includes evaluating the appropriateness of accounting policies used and the reasonableness of significant accounting estimates made by management, as well as evaluating the overall presentation of the financial statements.
We believe that the audit evidence we have obtained is sufficient and appropriate to provide a basis for our audit opinion.
113
Opinion
In our opinion, the financial statements referred to above present fairly, in all material respects, the financial position of TNHC Newport LLC at December 31, 2014 and 2013, and the results of its operations and its cash flows for the year ended December 31, 2014, and the period from March 1, 2013 (inception) to December 31, 2013, in conformity with U.S. generally accepted accounting principles.
/s/ Ernst & Young LLP
February 13, 2015
114
TNHC Newport LLC | |||||||
(A Delaware Limited Liability Company) | |||||||
Balance Sheets | |||||||
December 31 | |||||||
2014 | 2013 | ||||||
Assets | |||||||
Cash | $ | 10,925,677 | $ | 2,939,844 | |||
Restricted cash | 500,000 | 500,000 | |||||
Real estate inventories | 79,688,329 | 50,562,447 | |||||
Total assets | $ | 91,114,006 | $ | 54,002,291 | |||
Liabilities and members’ capital | |||||||
Accounts payable | $ | 8,083,611 | $ | 3,572,179 | |||
Accrued expenses and other liabilities | 1,214,572 | 12,251 | |||||
Due to affiliate | 168,924 | 16,615 | |||||
Note payable | 17,730,943 | 4,676,105 | |||||
Note payable to member | 4,268,291 | – | |||||
31,466,341 | 8,277,150 | ||||||
Commitments and contingencies (Note 6) | |||||||
Members’ capital | 59,647,665 | 45,725,141 | |||||
Total liabilities and members’ capital | $ | 91,114,006 | $ | 54,002,291 | |||
See accompanying notes. | |||||||
115
TNHC Newport LLC | |||||||
(A Delaware Limited Liability Company) | |||||||
Statements of Operations | |||||||
March 1, 2013 | |||||||
Year Ended | (Inception) to | ||||||
December 31, | December 31, | ||||||
2014 | 2013 | ||||||
Revenues: | |||||||
Home sales | $ | 56,601,330 | $ – | ||||
Design studio option sales | 3,557,220 | – | |||||
60,158,550 | – | ||||||
Cost of sales: | |||||||
Cost of home sales | 42,001,484 | – | |||||
Cost of design studio option sales | 2,668,840 | – | |||||
44,670,324 | – | ||||||
Gross profit | 15,488,226 | – | |||||
Selling and marketing expenses | 467,156 | 5,391 | |||||
Selling and marketing expenses | |||||||
incurred from affiliates | 731,575 | 21,618 | |||||
Overhead fees to affiliates | 2,866,971 | 1,247,850 | |||||
Net income (loss) | $ | 11,422,524 | $ | (1,274,859 | ) | ||
See accompanying notes. | |||||||
116
TNHC Newport LLC | |||||||||
(A Delaware Limited Liability Company) | |||||||||
Statements of Members’ Capital | |||||||||
Year Ended December 31, 2014, and Period From | |||||||||
March 1, 2013 (Inception) to December 31, 2013 | |||||||||
TNHC | NB | ||||||||
Meridian | Residences, | ||||||||
Investors LLC | LLC | Total | |||||||
Balance at March 1, 2013 (inception) | $ – | $ – | $ – | ||||||
Contributions | 21,068,808 | 30,550,000 | 51,618,808 | ||||||
Distributions | (4,618,808 | ) | – | (4,618,808 | ) | ||||
Net loss | (446,201 | ) | (828,658 | ) | (1,274,859 | ) | |||
Balance at December 31, 2013 | 16,003,799 | 29,721,342 | 45,725,141 | ||||||
Contributions | 350,000 | 5,150,000 | 5,500,000 | ||||||
Distributions | (999,880 | ) | (2,000,120 | ) | (3,000,000 | ) | |||
Net income | 3,885,517 | 7,537,007 | 11,422,524 | ||||||
Balance at December 31, 2014 | $ | 19,239,436 | $ | 40,408,229 | $ | 59,647,665 | |||
See accompanying notes. | |||||||||
117
TNHC Newport LLC | |||||||
(A Delaware Limited Liability Company) | |||||||
Statements of Cash Flows | |||||||
March 1, 2013 | |||||||
Year Ended | (Inception) to | ||||||
December 31, | December 31, | ||||||
2014 | 2013 | ||||||
Operating activities | |||||||
Net income (loss) | $ | 11,422,524 | $ | (1,274,859 | ) | ||
Adjustments to reconcile net income (loss) to net cash | |||||||
used in operating activities: | |||||||
Net changes in operating assets and liabilities: | |||||||
Restricted cash | – | (500,000 | ) | ||||
Real estate inventories | (29,125,882 | ) | (43,318,639 | ) | |||
Accounts payable | 4,511,432 | 3,572,179 | |||||
Accrued expenses and other liabilities | 1,202,321 | 12,251 | |||||
Due to affiliate | 152,309 | 16,615 | |||||
Net cash used in operating activities | (11,837,296 | ) | (41,492,453 | ) | |||
Financing activities | |||||||
Proceeds from issuance of note payable to member | 4,268,291 | – | |||||
Proceeds from issuance of note payable | 13,054,838 | 4,676,105 | |||||
Members’ capital contributions | 5,500,000 | 44,375,000 | |||||
Members’ capital distributions | (3,000,000 | ) | (4,618,808 | ) | |||
Net cash provided by financing activities | 19,823,129 | 44,432,297 | |||||
Net increase in cash | 7,985,833 | 2,939,844 | |||||
Cash at beginning of period | 2,939,844 | – | |||||
Cash at end of period | $ | 10,925,677 | $ | 2,939,844 | |||
Supplemental disclosures of cash flow information | |||||||
Interest paid, net of amounts capitalized | $ – | $ – | |||||
Supplemental disclosures of noncash transactions | |||||||
Land contributed in lieu of cash for members’ capital | $ – | $ | 7,243,808 | ||||
See accompanying notes. | |||||||
118
TNHC Newport LLC
(A Delaware Limited Liability Company)
Notes to Financial Statements
December 31, 2014
1. Organization and Summary of Significant Accounting Policies
TNHC Newport LLC, a Delaware limited liability company (the “Company”), was formed with an effective date of March 1, 2013. The Company was capitalized through cash and asset contributions by TNHC Meridian Investors LLC (“TNHC”) and NB Residences, LLC (“NB Residences”) (collectively, “the Members”). On April 1, 2013, the Company purchased 4.25 acres of land located in Newport Beach, California, for the development and sale of 79 homes in a community known as Meridian (“the Project”).
Subject to the operating agreement, distributions of net cash flow to the Members shall be in the following order of priority:
1) | To the Members in proportion to their respective accrued and unpaid First Priority Preference Amount, as defined; then |
2) | To the Members in proportion to their respective Undistributed First Priority Capital Amount, as defined; then |
3) | To the Members in proportion to their respective accrued and unpaid Second Priority Preference Amount, as defined; then |
4) | To the Members in proportion to their respective Undistributed Second Priority Capital Amount, as defined; then |
5) | To the Members in proportion to their respective Percentage Interests, as defined (TNHC 50% and NB Residences 50%). |
Upon the formation of the Company, TNHC received a distribution of $4,618,808 from the Company in order to bring contribution percentages of each Member in line with the operating agreement, which was 35% for TNHC and 65% for NB Residences. During 2014, the Members amended the operating agreement to allow NB Residences to make a contribution of $4,500,000 without the requirement for TNHC to make a corresponding contribution. This contribution was designated as an increase to NB Residences Undistributed Second Priority Capital.
Subject to the operating agreement, income and loss are allocated to the Members generally in the same manner as distributions of net cash flow.
Pursuant to the operating agreement, the preferred return on First Priority Capital, as defined, for both Members is 20% per annum, compounded monthly. No First Priority Capital contributions have been made through December 31, 2014. The preferred return on Second Priority Capital, as defined, for both Members is 12% per annum, compounded monthly. As the payment for the preferred return is not guaranteed, it is not currently accrued on the financial statements.
119
The following is a summary of the preferred returns for the Members as of December 31, 2014:
TNHC | NB Residences | Total | |||||||
Cumulative First Priority preferred return | $ | — | $ | — | $ | — | |||
Cumulative First Priority preferred distributions | — | — | — | ||||||
Cumulative Second Priority preferred return | 3,608,400 | 7,004,880 | 10,613,280 | ||||||
Cumulative Second Priority preferred distributions | (999,880 | ) | (2,000,120 | ) | (3,000,000 | ) | |||
Remaining undistributed preferred return | $ | 2,608,520 | $ | 5,004,760 | $ | 7,613,280 | |||
Basis of Presentation
The accompanying financial statements have been prepared in accordance with U.S. generally accepted accounting principles (“GAAP”) as contained within the Financial Accounting Standards Board (“FASB”) Accounting Standards Codification (“ASC”). This basis of accounting contemplates the recovery of the Company’s assets and the satisfaction of its liabilities in the normal course of business. Management believes the Company has sufficient cash and access to capital to fund its operations.
Use of Estimates
The preparation of the Company’s financial statements in conformity with GAAP requires management to make estimates and assumptions that affect the reported amounts of assets, liabilities, revenues and expenses, and the disclosure of commitments and contingencies. Actual results could differ materially from those estimates.
Cash
The Company considers all highly liquid investments that are readily convertible to cash, with original maturity dates of three months or less, to be cash and cash equivalents. Financial instruments that potentially subject the Company to significant concentrations of credit risk consist principally of cash deposited with financial institutions in excess of amounts insured by the Federal Deposit Insurance Corporation. The Company has not experienced any losses related to uninsured cash balances.
Restricted Cash
Restricted cash of $500,000 as of December 31, 2014 and 2013, is held in a single account and serves as collateral for a letter of credit for certain performance bonds.
Real Estate Inventories and Cost of Sales
Real estate inventories are carried at cost. Development costs, including land, land development, direct costs of construction, indirect costs, interest, and property taxes incurred during the development period, are capitalized. Capitalization of development costs ends when the assets are substantially complete and ready for sale.
Costs of home sales are allocated based on specific identification or relative sales value, depending on the nature of the costs. Project-specific costs are amortized to cost of sales as homes are closed based upon a
120
method that approximates relative sales value. A provision for warranty costs is included in cost of homes sold at the time the sale of a home is recorded. Selling and marketing costs are expensed in the period incurred.
Real estate inventories are stated at cost, unless the carrying amount is determined not to be recoverable, in which case the inventories are written down to fair value in accordance with ASC 360, Property, Plant and Equipment. ASC 360 requires that real estate assets be tested for impairment whenever events or changes in circumstances indicate that their carrying amounts may not be recoverable.
Impairment of assets is measured by comparing the carrying amount of an asset to the undiscounted future net cash flows expected to be generated by the asset. These evaluations for impairment are significantly impacted by estimates of the amounts and timing of revenues, costs and expenses, and other factors. If real estate assets are considered to be impaired, the impairment to be recognized is measured by the amount by which the carrying value of the assets exceeds the fair value of the assets. Fair value is determined based on estimated future cash flows discounted for inherent risks associated with the real estate assets, or other valuation techniques.
As of December 31, 2014 and 2013, the Company determined that the carrying amounts of its real estate inventories were not impaired based upon undiscounted future cash flow of the underlying Project.
Revenue Recognition
In accordance with ASC 360, revenues from home sales and other real estate sales are recorded and a profit is recognized when the respective units are closed. Home sales and other real estate sales are closed when all conditions of escrow are met, including delivery of the home, title passage, appropriate consideration is received and collection of associated receivables, if any, is reasonably assured. Sales incentives are a reduction of revenues when the respective unit is closed. When it is determined that the earnings process is not complete, the sale and related profit are deferred for recognition in future periods.
Income Taxes
As a limited liability company, the Company is subject to certain minimal taxes and fees; however, income taxes on income reported by the Company are the obligation of the Members.
The Company applies the provisions of ASC 740, Accounting for Uncertainty in Income Taxes. Based on its evaluation, under ASC 740, the Company has concluded that there are no significant uncertain tax positions requiring recognition in its financial statements, nor has the Company been assessed interest or penalties by any major tax jurisdictions. The Company’s evaluation was performed for the tax years ended December 31, 2014 and 2013.
121
2. Real Estate Inventories
Real estate inventories consisted of the following:
December 31 | ||||||
2014 | 2013 | |||||
Land and land development | $ | 8,869,985 | $ | 37,251,289 | ||
Construction in progress | 68,454,324 | 13,311,158 | ||||
Model homes | 2,364,020 | — | ||||
$ | 79,688,329 | $ | 50,562,447 | |||
Construction in progress consists primarily of construction costs for homes and common area facilities, which are in various stages of development.
The Company incurred, capitalized and amortized interest costs as follows:
Year Ended December 31, 2014 | March 1, 2013 (Inception) to December 31, 2013 | |||||
Interest included in beginning real estate inventories | $ | 12,251 | $ | — | ||
Interest incurred and capitalized | 1,313,753 | 12,251 | ||||
Interest amortized to cost of sales | (749,309 | ) | — | |||
Interest included in ending real estate inventories | $ | 576,695 | $ | 12,251 | ||
3. Accrued Expenses and Other Liabilities
Accrued expenses and other liabilities consisted of the following:
December 31 | ||||||
2014 | 2013 | |||||
Accrued interest | $ | — | $ | 12,251 | ||
Completion reserve | 607,615 | — | ||||
Other liabilities | 5,955 | — | ||||
Warranty reserve | 601,002 | — | ||||
$ | 1,214,572 | $ | 12,251 | |||
The Company offers warranties on its homes that generally cover various defects in workmanship, materials, or to cover structural construction defects. Estimated future direct warranty costs are accrued and charged to cost of sales in the period when the related homebuilding revenues are recognized. The Company assesses the adequacy of its warranty accrual on a quarterly basis and adjusts the amounts recorded if necessary. The Company’s warranty accrual is included in accrued expenses and other liabilities in the accompanying balance sheets.
122
Changes in the Company’s warranty liability are as follows:
Year Ended December 31, 2014 | March 1, 2013 (Inception) to December 31, 2013 | |||||
Beginning warranty liability | $ | — | $ | — | ||
Warranty provision | 602,432 | — | ||||
Warranty payments | (1,430 | ) | — | |||
Ending warranty liability | $ | 601,002 | $ | — | ||
The completion reserve includes project costs for homes that have closed but for which invoices from vendors have not yet been received. The Company periodically assesses the adequacy of its completion reserve and adjusts the amounts as necessary.
4. Due to Affiliates and Related Party Transactions
Amounts due to affiliates consisted of the following:
December 31 | ||||||
2014 | 2013 | |||||
Accrued interest | $ | 2,050 | $ | — | ||
Accrued payroll | 166,874 | 16,615 | ||||
$ | 168,924 | $ | 16,615 | |||
During the year ended December 31, 2014, and the period from March 1, 2013 (inception) to December 31, 2013, TNHC incurred construction-related costs on the Company’s behalf totaling $1,274,951 and $281,535, respectively. The Company capitalized $543,376 and $280,917 of these amounts to real estate inventories for the year ended December 31, 2014, and the period from March 1, 2013 (inception) to December 31, 2013, respectively, and charged the remaining $731,575 and $21,618, respectively, to selling and marketing expenses incurred from affiliates in the accompanying statements of operations. As of December 31, 2014 and 2013, $166,874 and $16,615, respectively, was due to TNHC and is reflected in the accompanying balance sheets as due to affiliates.
Pursuant to the operating agreement, TNHC and NB Residences shall receive an overhead fee from the Company in an amount equal to 3.0% and 1.0%, respectively, of the Project revenues. This amount will be paid as follows:
1) | 1.5% of the projected gross sales revenue of the Project to TNHC and 0.5% of the projected gross sales revenue of the Project to NB Residences, paid in equal monthly installments on or about the first day of each month over the projected life of the project, beginning April 1, 2013. |
2) | 1.5% of the projected gross sales revenue from each home sold to TNHC and 0.5% of the projected gross sales revenue from each home sold to NB Residences, payable upon the first day of the month following close of escrow. |
During the year ended December 31, 2014, and the period from March 1, 2013 (inception) to December 31, 2013, TNHC earned $1,248,000 and $936,000, respectively, and NB Residences earned $415,800 and
123
$311,850, respectively, in monthly management fees, which have been recorded by the Company as overhead fees to affiliates in the accompanying statements of operations. During the year ended December 31, 2014, and the period from March 1, 2013 (inception) to December 31, 2013, TNHC earned $902,378 and $0, respectively, and NB Residences earned $300,793 and $0, respectively, in overhead fees earned from homes sold, which have also been recorded by the Company as overhead fees to affiliates in the accompanying statements of operations. As of December 31, 2014 and 2013, no amounts were outstanding for such fees.
TNHC provides certain loan guaranties related to the Company’s construction note payable (Note 5). In the event that these guaranties are called upon, they would be considered a cost of the Company and would be allocated appropriately to the Members in accordance with the operating agreement.
5. Notes Payable
The Company had notes payable outstanding as follows:
December 31 | ||||||
2014 | 2013 | |||||
Construction note payable | $ | — | $ | 4,676,105 | ||
Construction note payable with a total commitment of $105,000,000 secured by real estate inventories | 17,730,943 | — | ||||
Unsecured note payable to Member with a total commitment of $6,500,000 | 4,268,291 | — | ||||
$ | 21,999,234 | $ | 4,676,105 | |||
During the year ended December 31, 2014, the Company repaid, in full, all outstanding principal and interest associated with the initial construction note payable. The note bore interest at a rate of 8% and was repaid on June 27, 2014.
The Company has an additional construction note payable with a total commitment of $105,000,000, which is secured by the underlying project real estate inventories. The note matures in June 2016 and bears interest at a base prime rate with options at one-month LIBOR plus 3.25% (combined rate of 3.4% at December 31, 2014). As of December 31, 2014, $45,155,457 was available to be drawn under the note.
The Company has an unsecured note payable to a Member with a total commitment of $6,500,000. The note matures in September 2016 and bears interest at a rate of one-month LIBOR plus 3.25% (3.4% at December 31, 2014). As of December 31, 2014, $0 was available to be drawn under the note.
Notes payable have stated maturities as follows for the years ending December 31:
2015 | $ | — | |
2016 | 21,999,234 | ||
$ | 21,999,234 | ||
As of December 31, 2014, the Company had accrued interest of $2,050 related to the note payable to Member, which has been reflected in due to affiliates in the accompanying balance sheets. As of December 31, 2013, the Company had accrued interest of $12,251 related to the construction note, which has been reflected in accrued interest in the accompanying balance sheets.
124
6. Commitments and Contingencies
The Company’s commitments and contingencies include the usual obligations and litigation incurred by real estate developers in the normal course of business. In the opinion of management, there are no material loss contingencies.
The Company obtains performance bonds in the normal course of business to ensure completion of the infrastructure of the Project. As of December 31, 2014 and 2013, the Company had $4,933,386 and $3,000,000, respectively, in performance bonds outstanding with the city of Newport Beach, governmental entities, and others.
7. Subsequent Events
The Company has evaluated subsequent events through February 13, 2015, the date the financial statements were available for issuance.
125
Report of Independent Auditors
The Members
TNHC Meridian Investors LLC
We have audited the accompanying financial statements of TNHC Meridian Investors LLC, which comprise the balance sheets as of December 31, 2014 and 2013, and the related statements of operations, members’ capital, and cash flows for the year ended December 31, 2014, and the period from August 20, 2013 (inception) to December 31, 2013, and the related notes to the financial statements.
Management’s Responsibility for the Financial Statements
Management is responsible for the preparation and fair presentation of these financial statements in conformity with U.S. generally accepted accounting principles; this includes the design, implementation, and maintenance of internal control relevant to the preparation and fair presentation of financial statements that are free of material misstatement, whether due to fraud or error.
Auditor’s Responsibility
Our responsibility is to express an opinion on these financial statements based on our audits. We conducted our audits in accordance with auditing standards generally accepted in the United States. Those standards require that we plan and perform the audit to obtain reasonable assurance about whether the financial statements are free of material misstatement.
An audit involves performing procedures to obtain audit evidence about the amounts and disclosures in the financial statements. The procedures selected depend on the auditor’s judgment, including the assessment of the risks of material misstatement of the financial statements, whether due to fraud or error. In making those risk assessments, the auditor considers internal control relevant to the entity’s preparation and fair presentation of the financial statements in order to design audit procedures that are appropriate in the circumstances, but not for the purpose of expressing an opinion on the effectiveness of the entity’s internal control. Accordingly, we express no such opinion. An audit also includes evaluating the appropriateness of accounting policies used and the reasonableness of significant accounting estimates made by management, as well as evaluating the overall presentation of the financial statements.
We believe that the audit evidence we have obtained is sufficient and appropriate to provide a basis for our audit opinion.
126
Opinion
In our opinion, the financial statements referred to above present fairly, in all material respects, the financial position of TNHC Meridian Investors LLC at December 31, 2014 and 2013, and the results of its operations and its cash flows for the year ended December 31, 2014, and the period from August 20, 2013 (inception) to December 31, 2013, in conformity with U.S. generally accepted accounting principles.
/s/ Ernst & Young LLP
March 5, 2015
127
TNHC Meridian Investors LLC | |||
(A Delaware Limited Liability Company) | |||
Balance Sheets | |||
December 31 | |||
2014 | 2013 | ||
Assets | |||
Cash | $ 1,162,032 | $ 94,199 | |
Investment in unconsolidated joint venture | 19,482,073 | 16,246,436 | |
Total assets | $20,644,105 | $16,340,635 | |
Liabilities and members' capital | |||
Due to affiliate | $ 75,198 | $ – | |
Commitments and contingencies (Note 3) | |||
Members' capital | 20,568,907 | 16,340,635 | |
Total liabilities and members' capital | $20,644,105 | $16,340,635 | |
See accompanying notes. | |||
128
TNHC Meridian Investors LLC | |||
(A Delaware Limited Liability Company) | |||
Statements of Operations | |||
Period From | |||
August 20, | |||
2013 | |||
Year Ended | (Inception) to | ||
December 31, | December 31, | ||
2014 | 2013 | ||
Revenues: | |||
Management fee revenues from affiliates | $ 2,150,378 | $ 416,000 | |
Expenses: | |||
Overhead fees to the Members | 2,150,378 | 416,000 | |
General and administrative expenses | 7,245 | 90,800 | |
Equity in net (income) loss of unconsolidated joint venture | (3,885,517) | 203,564 | |
Net income (loss) | $ 3,878,272 | $ (294,364) | |
See accompanying notes. | |||
129
TNHC Meridian Investors LLC | |||||||||
(A Delaware Limited Liability Company) | |||||||||
Statements of Members' Capital | |||||||||
Year Ended December 31, 2014 and Period | |||||||||
From August 20, 2013 (Inception) to December 31, 2013 | |||||||||
The New Home | |||||||||
Company | IHP | ||||||||
Southern | Meridian | ||||||||
California LLC | LLC | Total | |||||||
Balance at August 20, 2013 (Inception) | $ | — | $ | — | $ | — | |||
Contributions | 14,369,677 | 10,480,049 | 24,849,726 | ||||||
Distributions | (8,214,727 | ) | — | (8,214,727 | ) | ||||
Net loss | (147,182 | ) | (147,182 | ) | (294,364 | ) | |||
Balance at December 31, 2013 | 6,007,768 | 10,332,867 | 16,340,635 | ||||||
Contributions | 129,500 | 220,500 | 350,000 | ||||||
Net income | 1,473,227 | 2,405,045 | 3,878,272 | ||||||
Balance at December 31, 2014 | $ | 7,610,495 | $ | 12,958,412 | $ | 20,568,907 | |||
See accompanying notes. | |||||||||
130
TNHC Meridian Investors LLC | |||
(A Delaware Limited Liability Company) | |||
Statements of Cash Flows | |||
Period From | |||
August 20, | |||
2013 | |||
Year Ended | (Inception) to | ||
December 31, | December 31, | ||
2014 | 2013 | ||
Operating activities: | |||
Net income (loss) | $ 3,878,272 | $ (294,364) | |
Adjustments to reconcile net income (loss) to net cash | |||
provided by (used in) operating activities: | |||
Distributions of earnings from unconsolidated joint venture | 999,880 | – | |
Equity in net (income) loss of unconsolidated joint venture | (3,885,517) | 203,564 | |
Net changes in operating assets and liabilities: | |||
Due to affiliate | 75,198 | – | |
Net cash provided by (used in) operating activities | 1,067,833 | (90,800) | |
Investing activities: | |||
Contributions to unconsolidated joint venture | (350,000) | (8,029,558) | |
Distributions of equity from unconsolidated joint venture | – | 4,618,808 | |
Net cash used in investing activities | (350,000) | (3,410,750) | |
Financing activities: | |||
Members' capital contributions | 350,000 | 11,810,476 | |
Members' capital distributions | – | (8,214,727) | |
Net cash provided by financing activities | 350,000 | 3,595,749 | |
Net increase in cash | 1,067,833 | 94,199 | |
Cash at beginning of period | 94,199 | – | |
Cash at end of period | $ 1,162,032 | $ 94,199 | |
Supplemental disclosures of noncash transactions | |||
Real estate contributed in lieu of cash for members' capital | $ – | $13,039,250 | |
See accompanying notes. | |||
131
TNHC Meridian Investors LLC
(A Delaware Limited Liability Company)
Notes to Financial Statements
December 31, 2014
1. Organization and Summary of Significant Accounting Policies
TNHC Meridian Investors LLC, a Delaware limited liability company (the “Company”), was formed with an effective date of February 20, 2013. The Company was initially capitalized through cash and asset contributions by The New Home Company Southern California LLC (“TNHC”). Effective August 20, 2013, TNHC Meridian Investors LLC amended and restated its limited liability agreement and concurrently admitted IHP Meridian LLC (“IHP”) as a member (TNHC and IHP, collectively, are referred to herein as the “Members”). The Company holds an interest in one unconsolidated joint venture, TNHC Newport LLC (the “Unconsolidated Joint Venture”).
Subject to the operating agreement, distributions of net cash flow to the Members shall be in the following order of priority:
1) | To the Members in proportion and up to the difference between their respective aggregate Special Preferred Return, as defined, and the aggregate amounts distributed previously; then |
2) | To the Members in proportion to their respective Unreturned Special Capital Contributions, as defined; then |
3) | To the Members in proportion and up to the difference between their respective aggregate Preferred Return, as defined, and the aggregate amounts distributed previously; then |
4) | If there is a Controllable Cost Overrun, as defined, and a Profit Shortfall, as defined, an amount equal to 50% of the lesser of such Controllable Cost Overrun or such Profit Shortfall shall be distributed to the Members in the following proportion: 75% to IHP and 25% to TNHC; then |
5) | To the Members in proportion and up to each Member’s Unreturned Capital Contribution, as defined; then |
6) | To the Members in proportion to their respective Percentage Interests, as defined (TNHC 50% and IHP 50%). |
Subject to the operating agreement, income and losses are allocated to the Members generally in the same manner as distributions of net cash flow.
Pursuant to the operating agreement, the Special Preferred Return on Unreturned Special Capital Contributions, as defined, for both Members is 20% per annum, compounded monthly. The preferred return on Unreturned Capital Contributions for both Members is 12% per annum, compounded monthly. As the payment for the preferred returns is not guaranteed, it is not currently accrued on the financial statements.
132
The following is a summary of the preferred returns for the Members as of December 31, 2014:
TNHC | IHP | Total | ||||||||
Cumulative Special Preferred Return | $ | — | $ | — | $ | — | ||||
Cumulative Special Preferred distributions | — | — | — | |||||||
Cumulative Preferred Return | 1,068,620 | 1,819,530 | 2,888,150 | |||||||
Cumulative Preferred distributions | — | — | — | |||||||
Remaining undistributed preferred return | $ | 1,068,620 | $ | 1,819,530 | $ | 2,888,150 | ||||
Basis of Presentation
The accompanying financial statements have been prepared in accordance with U.S. generally accepted accounting principles (“GAAP”) as contained within the Financial Accounting Standards Board (“FASB”) Accounting Standards Codification (“ASC”). This basis of accounting contemplates the recovery of the Company’s assets and the satisfaction of its liabilities in the normal course of business. Management believes the Company has sufficient cash and access to capital to fund its operations.
Use of Estimates
The preparation of the Company’s financial statements in conformity with GAAP requires management to make estimates and assumptions that affect the reported amounts of assets, liabilities, revenues and expenses, and the disclosure of commitments and contingencies. Actual results could differ materially from those estimates.
Cash
The Company considers all highly-liquid investments that are readily convertible to cash, with original maturity dates of three months or less, to be cash and cash equivalents. Financial instruments that potentially subject the Company to significant concentrations of credit risk consist principally of cash deposited with financial institutions in excess of amounts insured by the Federal Deposit Insurance Corporation. The Company has not experienced any losses related to uninsured cash balances.
Variable Interest Entities
The Company accounts for variable interest entities in accordance with ASC 810, Consolidation. Under ASC 810, a variable interest entity (“VIE”) is created when: (a) the equity investment at risk in the entity is not sufficient to permit the entity to finance its activities without additional subordinated financial support provided by other parties, including the equity holders; (b) the entity’s equity holders as a group either (i) lack the direct or indirect ability to make decisions about the entity, (ii) are not obligated to absorb expected losses of the entity or (iii) do not have the right to receive expected residual returns of the entity; or (c) the entity’s equity holders have voting rights that are not proportionate to their economic interests, and the activities of the entity involve or are conducted on behalf of the equity holder with disproportionately few voting rights. If an entity is deemed to be a VIE pursuant to ASC 810, the enterprise that has both (i) the power to direct the activities of a VIE that most significantly impact the entity’s economic performance and (ii) the obligation to absorb the expected losses of the entity or right to receive benefits from the entity that could be potentially significant to the VIE is considered the primary beneficiary and must consolidate the VIE.
133
As of December 31, 2014 and 2013, the Company was not required to consolidate any VIEs. In accordance with ASC 810, the Company performs ongoing reassessments of whether it is the primary beneficiary of a VIE.
The Company first analyzes the Unconsolidated Joint Venture to determine if it is a variable interest entity under the provisions of ASC 810 (as discussed above) when determining whether the entity should be consolidated.
Investment in Unconsolidated Joint Venture
If the Company concludes that the Unconsolidated Joint Venture is not a variable interest entity, then, in accordance with the provisions of ASC 810, limited partnerships or similar entities must be further evaluated under the presumption that the general partner, or the managing member in the case of a limited liability company, is deemed to have a controlling interest and therefore must consolidate the entity unless the limited partners or non-managing members have: (1) the ability, either by a single limited partner or through a simple majority vote, to dissolve or liquidate the entity, or kick-out the managing member/general partner without cause, or (2) substantive participatory rights that are exercised in the ordinary course of business. Under the provisions of ASC 810, the Company may be required to consolidate certain investments in which it holds a general partner or managing member interest.
As of December 31, 2014 and 2013, the Company concluded that the Unconsolidated Joint Venture was not a variable interest entity and accounted for this entity under the equity method of accounting. Under the Unconsolidated Joint Venture operating agreement, future capital contributions are determined based on the operating budgets and needs of the Unconsolidated Joint Venture, which will likely vary throughout the life of the Unconsolidated Joint Venture based on the circumstances unique to the Unconsolidated Joint Venture.
As of December 31, 2014, the Company had an ownership interest in one unconsolidated joint venture, with an ownership percentage of 32%. Investment in the Unconsolidated Joint Venture is accounted for under the equity method of accounting. Under the equity method, the Company recognizes its proportionate share of earnings and losses generated by the Unconsolidated Joint Venture upon the delivery of lots or homes to third parties. The Company’s proportionate share of profits and losses are eliminated until the related asset has been sold by the Unconsolidated Joint Venture to third parties.
The Company reviews the real estate inventory held by the Unconsolidated Joint Venture for impairments whenever events or changes in circumstances indicate that carrying amounts may not be recoverable. The Company also reviews its investment in the Unconsolidated Joint Venture for evidence of other-than-temporary declines in value.
To the extent the Company deems any portion of its investment in the Unconsolidated Joint Venture as not recoverable, the Company impairs its investment accordingly. As of December 31, 2014 and 2013, the Company determined that no portion of its investment in the Unconsolidated Joint Venture was impaired.
134
The balance sheets for the Unconsolidated Joint Venture are as follows:
December 31 | ||||||
2014 | 2013 | |||||
Cash | $ | 10,925,677 | $ | 2,939,844 | ||
Restricted cash | 500,000 | 500,000 | ||||
Real estate inventories | 79,688,329 | 50,562,447 | ||||
Total assets | $ | 91,114,006 | $ | 54,002,291 | ||
Accounts payable | $ | 8,083,611 | $ | 3,572,179 | ||
Accrued expenses and other liabilities | 1,214,572 | 12,251 | ||||
Due to affiliate | 168,924 | 16,615 | ||||
Note payable | 17,730,943 | 4,676,105 | ||||
Note payable to member | 4,268,291 | — | ||||
Total liabilities | 31,466,341 | 8,277,150 | ||||
The Company’s equity | 19,239,436 | 16,003,799 | ||||
Other member’s equity | 40,408,229 | 29,721,342 | ||||
Total equity | 59,647,665 | 45,725,141 | ||||
Total liabilities and equity | $ | 91,114,006 | $ | 54,002,291 | ||
During the period from March 1, 2013 to August 20, 2013, TNHC recognized $242,637 in losses related to the Unconsolidated Joint Venture prior to the admittance of IHP as a member in the Company. This amount is reflected as a difference between the Company’s equity in the Unconsolidated Joint Venture and the Company’s investment in the Unconsolidated Joint Venture as shown in the accompanying balance sheets.
The condensed statements of operations for the Unconsolidated Joint Venture are as follows:
Year Ended December 31, | March 1, 2013 (Inception) to December 31, | |||||
2014 | 2013 | |||||
Revenues | $ | 60,158,550 | $ | — | ||
Cost of sales and expenses | 48,736,026 | 1,274,859 | ||||
Income (loss) of unconsolidated joint venture | $ | 11,422,524 | $ | (1,274,859 | ) | |
Income (loss) from unconsolidated joint venture reflected in the accompanying statements of operations | $ | 3,885,517 | $ | (203,564 | ) | |
Income Taxes
As a limited liability company, the Company is subject to certain minimal taxes and fees; however, income taxes on income reported by the Company are the obligation of the Members.
135
The Company applies the provisions of ASC 740, Accounting for Uncertainty in Income Taxes. Based on its evaluation, under ASC 740, the Company has concluded that there are no significant uncertain tax positions requiring recognition in its financial statements, nor has the Company been assessed interest or penalties by any major tax jurisdictions. The Company’s evaluation was performed for the tax years ended December 31, 2014 and 2013.
2. Due to Affiliate and Related Party Transactions
Pursuant to the operating agreement of the Unconsolidated Joint Venture, the Company receives a management fee from the Unconsolidated Joint Venture in an amount equal to 3.0% of Unconsolidated Joint Venture revenues. During the year ended December 31, 2014 and the period from August 20, 2013 (inception) to December 31, 2013, the Company earned $2,150,378 and $416,000, respectively, in management fees which have been recorded by the Company as management fee revenues from affiliates in the accompanying statements of operations.
Pursuant to the operating agreement, TNHC shall receive an overhead fee from the Company in an amount equal to 3.0%, less $500,000, of the Unconsolidated Joint Venture revenues. This amount will be paid as follows:
1) | 1.5% of the projected gross sales revenue of the Unconsolidated Joint Venture, less $500,000, paid in equal monthly installments beginning on April 1, 2013, based upon a 33 month development period. |
2) | 1.5% of the projected gross sales revenue from each home sold, payable upon the first day of the month following close of escrow. |
Pursuant to the operating agreement, IHP shall receive an overhead fee from the Company in an amount equal to $500,000. This amount will be in installments equal to one twelfth (1/12th) of any portion of the overhead fee received by TNHC. During the year ended December 31, 2014, and the period from August 20, 2013 (inception) to December 31, 2013, TNHC earned $1,143,600 and $381,200, respectively, and IHP earned $104,400 and $34,800, respectively, in monthly overhead fees, which have been recorded by the Company as overhead fees to the Members in the accompanying statements of operations. As of December 31, 2014 and 2013, no amounts were due to TNHC or IHP for such fees.
During the year ended December 31, 2014 and the period from August 20, 2013 (inception) to December 31, 2013, TNHC earned and received $827,180 and $0, respectively, and IHP earned $75,198 and $0, respectively, in overhead fees earned from homes sold, which have been recorded by the Company as overhead fees to the Members in the accompanying statements of operations. As of December 31, 2014, no amounts were due to TNHC and $75,198 was due to IHP and has been included in due to affiliate in the accompanying balance sheets. As of December 31, 2013, no amounts were due to TNHC and IHP for such fees.
3. Commitments and Contingencies
The Company’s commitments and contingencies include the usual obligations and litigation incurred by real estate developers in the normal course of business. In the opinion of management, there are no material loss contingencies.
4. Subsequent Events
The Company has evaluated subsequent events through March 5, 2015, the date the financial statements were available for issuance.
136
Report of Independent Auditors
The Members
TNHC-HW Foster City LLC
We have audited the accompanying financial statements of TNHC-HW Foster City LLC, which comprise the balance sheets as of December 31, 2014 and 2013, and the related statements of operations, members’ capital, and cash flows for the year ended December 31, 2014, and the period from July 2, 2013(inception) to December 31, 2013, and the related notes to the financial statements.
Management’s Responsibility for the Financial Statements
Management is responsible for the preparation and fair presentation of these financial statements in conformity with U.S. generally accepted accounting principles; this includes the design, implementation, and maintenance of internal control relevant to the preparation and fair presentation of financial statements that are free of material misstatement, whether due to fraud or error.
Auditor’s Responsibility
Our responsibility is to express an opinion on these financial statements based on our audits. We conducted our audits in accordance with auditing standards generally accepted in the United States. Those standards require that we plan and perform the audit to obtain reasonable assurance about whether the financial statements are free of material misstatement.
An audit involves performing procedures to obtain audit evidence about the amounts and disclosures in the financial statements. The procedures selected depend on the auditor’s judgment, including the assessment of the risks of material misstatement of the financial statements, whether due to fraud or error. In making those risk assessments, the auditor considers internal control relevant to the entity’s preparation and fair presentation of the financial statements in order to design audit procedures that are appropriate in the circumstances, but not for the purpose of expressing an opinion on the effectiveness of the entity’s internal control. Accordingly, we express no such opinion. An audit also includes evaluating the appropriateness of accounting policies used and the reasonableness of significant accounting estimates made by management, as well as evaluating the overall presentation of the financial statements.
We believe that the audit evidence we have obtained is sufficient and appropriate to provide a basis for our audit opinion.
137
Opinion
In our opinion, the financial statements referred to above present fairly, in all material respects, the financial position of TNHC-HW Foster City LLC at December 31, 2014 and 2013, and the results of its operations and its cash flows for the year ended December 31, 2014, and the period from July 2, 2013 (inception) to December 31, 2013, in conformity with U.S. generally accepted accounting principles.
/s/ Ernst & Young LLP
February 13, 2015
138
TNHC-HW Foster City LLC | |||||||
(A Delaware Limited Liability Company) | |||||||
Balance Sheets | |||||||
December 31 | |||||||
2014 | 2013 | ||||||
Assets | |||||||
Cash | $ | 12,134,090 | $ | 249,945 | |||
Restricted cash | 2,809,331 | — | |||||
Real estate inventories | 8,066,506 | 3,849,911 | |||||
Total assets | $ | 23,009,927 | $ | 4,099,856 | |||
Liabilities and members’ capital | |||||||
Accounts payable | $ | 918,816 | $ | 130,675 | |||
Due to affiliates | 1,480,450 | 4,422 | |||||
Deferred revenue | 16,598,154 | — | |||||
Accrued expenses and other liabilities | 1,200,099 | — | |||||
20,197,519 | 135,097 | ||||||
Commitments and contingencies (Note 5) | |||||||
Members’ capital | 2,812,408 | 3,964,759 | |||||
Total liabilities and members’ capital | $ | 23,009,927 | $ | 4,099,856 | |||
See accompanying notes. | |||||||
139
TNHC-HW Foster City LLC | |||||||
(A Delaware Limited Liability Company) | |||||||
Statements of Operations | |||||||
Period From | |||||||
July 2, 2013 | |||||||
Year Ended | (Inception) to | ||||||
December 31, | December 31, | ||||||
2014 | 2013 | ||||||
Land sales | $ | 46,887,846 | $ – | ||||
Cost of land sales | 34,965,482 | – | |||||
Gross profit | 11,922,364 | – | |||||
Selling and marketing expenses | 499,715 | – | |||||
Overhead fees to affiliates | 1,968,000 | 264,241 | |||||
Net income (loss) | $ | 9,454,649 | $ | (264,241 | ) | ||
See accompanying notes. | |||||||
140
TNHC-HW Foster City LLC | |||||||||
(A Delaware Limited Liability Company) | |||||||||
Statements of Members’ Capital | |||||||||
Year Ended December 31, 2014 and Period From | |||||||||
July 2, 2013 (Inception) to December 31, 2013 | |||||||||
TNHC Land | HWFC | ||||||||
Company LLC | Project, LLC | Total | |||||||
Balance at July 2, 2013 (Inception) | $ – | $ – | $ – | ||||||
Contributions | 2,872,300 | 2,114,500 | 4,986,800 | ||||||
Distributions | (757,800 | ) | – | (757,800 | ) | ||||
Net loss | (132,120 | ) | (132,121 | ) | (264,241 | ) | |||
Balance at December 31, 2013 | 1,982,380 | 1,982,379 | 3,964,759 | ||||||
Contributions | 4,403,200 | 9,989,800 | 14,393,000 | ||||||
Distributions | (9,466,507 | ) | (15,533,493 | ) | (25,000,000 | ) | |||
Net income | 4,387,853 | 5,066,796 | 9,454,649 | ||||||
Balance at December 31, 2014 | $ | 1,306,926 | $ | 1,505,482 | $ | 2,812,408 | |||
See accompanying notes. | |||||||||
141
TNHC-HW Foster City LLC | |||||||
(A Delaware Limited Liability Company) | |||||||
Statements of Cash Flows | |||||||
Period From | |||||||
July 2, 2013 | |||||||
Year Ended | (Inception) to | ||||||
December 31, | December 31, | ||||||
2014 | 2013 | ||||||
Operating activities | |||||||
Net income (loss) | $ | 9,454,649 | $ | (264,241 | ) | ||
Adjustments to reconcile net income (loss) to net cash | |||||||
provided by (used in) operating activities: | |||||||
Net changes in operating assets and liabilities: | |||||||
Restricted Cash | (2,809,331 | ) | – | ||||
Real estate inventories | (4,216,595 | ) | (1,717,111 | ) | |||
Accounts payable | 788,141 | 130,675 | |||||
Due to affiliates | 1,476,028 | 4,422 | |||||
Deferred revenue | 16,598,154 | – | |||||
Accrued expenses and other liabilities | 1,200,099 | – | |||||
Net cash provided by (used in) operating activities | 22,491,145 | (1,846,255 | ) | ||||
Financing activities | |||||||
Members’ capital contributions | 14,393,000 | 2,854,000 | |||||
Members’ capital distributions | (25,000,000 | ) | (757,800 | ) | |||
Net cash (used in) provided by financing activities | (10,607,000 | ) | 2,096,200 | ||||
Net increase in cash | 11,884,145 | 249,945 | |||||
Cash at beginning of period | 249,945 | – | |||||
Cash at end of period | $ | 12,134,090 | $ | 249,945 | |||
Supplemental disclosure of noncash transactions | |||||||
Real estate inventories contributed for members’ capital | $ – | $ | 2,132,800 | ||||
Purchase of real estate with note payable to land seller | $ | 21,000,000 | $ – | ||||
Supplemental disclosure of cash flow information | |||||||
Interest paid, net of amounts capitalized | $ – | $ – | |||||
See accompanying notes. | |||||||
142
TNHC-HW Foster City LLC
(A Delaware Limited Liability Company)
Notes to Financial Statements
December 31, 2014
1. Organization and Summary of Significant Accounting Policies
TNHC-HW Foster City LLC, a Delaware limited liability company (the “Company”), was formed with an effective date of July 2, 2013. The Company was capitalized through cash and asset contributions by TNHC Land Company LLC (“TNHC”) and HWFC Project, LLC (“Hillwood”) (collectively referred to herein as the “Members”). On October 3, 2014, the Company purchased approximately 15 acres of land located in Foster City, California for the development and sale of lots planned for 200 residential dwellings, 221 assisted and independent living apartments, a retail space, and a public use space, in a site known as Foster Square (the “Project”).
Subject to the operating agreement, distributions of net cash flow to the Members shall be in the following order of priority (taking into account, as applicable, each Member’s then existing preferred return amount and contribution account balances, and subject to any other applicable provisions of the operating agreement):
1. | To the Members in proportion to their respective accrued and unpaid First Priority Preference Amount, as defined; then |
2. | To the Members in proportion to their respective Undistributed First Priority Capital Amount, as defined; then |
3. | To the Members in proportion to their respective accrued and unpaid Second Priority Preference Amount, as defined; then |
4. | To the Members in proportion to their respective Undistributed Second Priority Capital Amount, as defined; then |
5. | To the Members in proportion to their respective Percentage Interests (TNHC 46.47% and Hillwood 53.53%). |
Upon formation of the Company, TNHC received a distribution from the Company of $757,800 in order to bring the contribution percentages of each Member in line with the operating agreement, which at the time was 50% for TNHC and 50% for Hillwood. Upon acquisition of fee title to the Project site on October 3, 2014, the contribution percentages of the Members were adjusted, pursuant to the operating agreement, to 35% for TNHC and 65% for Hillwood.
Subject to the operating agreement, income and loss is allocated to the Members generally in the same manner as distributions of net cash flow.
Pursuant to the operating agreement, the preferred return on First Priority Capital, as defined, for both Members is 20% per annum, compounded monthly. The preferred return on Second Priority Capital, as defined, for both Members is 12% per annum, compounded monthly. As the payment for the preferred return is not guaranteed, it is not currently accrued on the financial statements. As of December 31, 2014, no contributions had been made that qualify as a First Priority Capital Amount, as defined.
143
The following is a summary of the preferred returns for the Members as of December 31, 2014:
TNHC | Hillwood | Total | |||||||
Cumulative First Priority preferred return | $ | — | $ | — | $ | — | |||
Cumulative First Priority preferred distributions | — | — | — | ||||||
Cumulative Second Priority preferred return | 487,970 | 594,490 | 1,082,460 | ||||||
Cumulative Second Priority preferred distributions | (487,970 | ) | (594,490 | ) | (1,082,460 | ) | |||
Remaining undistributed preferred return | $ | — | $ | — | $ | — | |||
Basis of Presentation
The accompanying financial statements have been prepared in accordance with U.S. generally accepted accounting principles (“GAAP”) as contained within the Financial Accounting Standards Board (“FASB”) Accounting Standards Codification (“ASC”). This basis of accounting contemplates the recovery of the Company’s assets and the satisfaction of its liabilities in the normal course of business.
Use of Estimates
The preparation of the Company’s financial statements in conformity with GAAP requires management to make estimates and assumptions that affect the reported amounts of assets, liabilities, revenues and expenses, and the disclosure of commitments and contingencies. Actual results could differ materially from those estimates.
Cash
The Company considers all highly-liquid investments that are readily convertible to cash, with original maturity dates of three months or less, to be cash and cash equivalents. Financial instruments that potentially subject the Company to significant concentrations of credit risk consist principally of cash deposited with financial institutions in excess of amounts insured by the Federal Deposit Insurance Corporation. The Company has not experienced any losses related to uninsured cash balances.
Restricted Cash
Restricted cash of $2,809,331 at December 31, 2014, includes $700,052 that serves as collateral for a letter of credit for certain performance bonds and $2,109,279 that serves as collateral for the construction costs related to a portion of the Project sold to a third party in December 2014. See discussion of post-closing development activities, as described in more detail in Note 1 under the caption entitled “Revenue Recognition.” The Company did not have restricted cash as of December 31, 2013.
Real Estate Inventories and Costs of Sales
Real estate inventories are carried at cost. Development costs including land, land development, direct costs of construction, indirect costs, interest, and property taxes incurred during the development period, are capitalized. Capitalization of development costs ends when the assets are substantially complete and ready for sale. Costs of land sales are allocated based on relative sales value. Selling and marketing costs are expensed in the period incurred.
144
Real estate inventories are stated at cost, unless the carrying amount is determined not to be recoverable, in which case the inventories are written down to fair value in accordance with ASC 360, Property, Plant, and Equipment. ASC 360 requires that real estate assets be tested for impairment whenever events or changes in circumstances indicate that their carrying amounts may not be recoverable.
Impairment of assets is measured by comparing the carrying amount of an asset to the undiscounted future net cash flows expected to be generated by the asset. These evaluations for impairment are significantly impacted by estimates of the amounts and timing of revenues, costs and expenses, and other factors. If real estate assets are considered to be impaired, the impairment to be recognized is measured by the amount by which the carrying value of the assets exceeds the fair value of the assets. Fair value is determined based on estimated future cash flows discounted for inherent risks associated with the real estate assets, or other valuation techniques.
As of December 31, 2014 and 2013, the Company determined that the carrying amounts of its real estate inventories were not impaired based upon undiscounted future cash flows of the underlying Project.
Revenue Recognition
In accordance with ASC 360, revenues from land sales are recorded and a profit is recognized when the respective lots are closed. Land sales are closed when all conditions of escrow are met, including delivery of the real estate asset, title passage, appropriate consideration is received and collection of associated receivables, if any, is reasonably assured. Sales incentives are a reduction of revenues when the respective lot is closed. When it is determined that the earnings process is not complete, the sale and the related profit are deferred for recognition in future periods.
During the year ended December 31, 2014, the Company sold land from the Project to two parties for a total of $71,250,000. Under the terms of the contracts, the Company is obligated to perform certain development activities after the close of escrow, including grading of property, utilities, backbone improvements, and improvement plans and permits. Due to this continuing involvement, the Company has recognized the land sale under the percentage-of-completion method, whereby revenue is recognized in proportion to total costs incurred divided by total costs expected to be incurred. As of December 31, 2014, $16,598,154 of revenue and $6,194,665 of profit remains deferred and will be recognized as development progresses.
Income Taxes
As a limited liability company, the Company is subject to certain minimal taxes and fees; however, income taxes on income reported by the Company are the obligation of the Members.
The Company applies the provisions of ASC 740, Accounting for Uncertainty in Income Taxes. Based on its evaluation, under ASC 740, the Company has concluded that there are no significant uncertain tax positions requiring recognition in its financial statements, nor has the Company been assessed interest or penalties by any major tax jurisdictions. The Company’s evaluation was performed for the tax years ended December 31, 2014 and 2013.
145
2. Real Estate Inventories
Real estate inventories consist of the following:
December 31 | ||||||
2014 | 2013 | |||||
Land and land under development | $ | 8,066,506 | $ | 3,849,911 | ||
The Company incurred, capitalized and amortized interest costs as follows:
Year Ended | Period Ended | |||||
December 31 | December 31 | |||||
2014 | 2013 | |||||
Interest included in beginning real estate inventories | $ | — | $ | — | ||
Interest incurred and capitalized | 212,877 | — | ||||
Interest amortized to cost of sales | (172,976 | ) | — | |||
Interest included in ending real estate inventories | $ | 39,901 | $ | — | ||
3. Due to Affiliates and Related-Party Transactions
Amounts due to affiliates consist of the following:
December 31 | ||||||
2014 | 2013 | |||||
Accrued payroll | $ | 55,450 | $ | 4,422 | ||
Accrued overhead fees to affiliates | 1,425,000 | — | ||||
$ | 1,480,450 | $ | 4,422 | |||
During the year ended December 31, 2014 and the period from July 2, 2013 (inception) to December 31, 2013, TNHC incurred construction-related costs on the Company’s behalf of $353,090 and $93,460, respectively. The total amounts were capitalized as real estate inventories for both periods.
Pursuant to the operating agreement, TNHC and Hillwood shall receive an overhead fee from the Company in an amount equal to 3.0% and 1.0%, respectively, of the Project’s gross sales revenue. This amount will be paid as follows:
1) | 1.5% of the projected gross sales revenue of the Project to TNHC and 0.5% of the projected gross sales revenue of the Project to Hillwood, payable in equal monthly installments on or about the first day of the each month over the projected life of the project, beginning July 1, 2013; |
2) | 1.5% of the gross sales price of all or any portion of the Project site to TNHC and 0.5% of the gross sales price of all or any portion of the Project site to Hillwood, payable upon the first day of the month following closing of the sale. |
146
During the year ended December 31, 2014 and the period from July 2, 2013 (inception) to December 31, 2013, TNHC earned $406,000 and $198,494 in monthly overhead fees and Hillwood earned $137,000 and $65,747 in monthly overhead fees, respectively, which have been recorded by the Company as overhead fees to affiliates in the accompanying statements of operations. During the year ended December 31, 2014 and the period from July 2, 2013 (inception) to December 31, 2013, TNHC earned $1,068,750 and $0 and Hillwood earned $356,250 and $0, respectively, in overhead fees from lots sold, which have also been recorded by the Company as overhead fees from affiliates in the accompanying statements of operations. As of December 31, 2014, $1,068,750 and $356,250 were due to TNHC and Hillwood, respectively, for overhead fees earned from lots sold and are reflected in the accompanying balance sheets as due to affiliates. As of December 31, 2014 and 2013, all monthly fees were paid in full.
4. Accrued Expenses and Other Liabilities
Accrued expenses and other liabilities of $1,200,099 at December 31, 2014, consist of initial cash deposits from a buyer to purchase lots from the Company. The Company did not have accrued expenses and other liabilities as of December 31, 2013.
5. Commitments and Contingencies
The Company’s commitments and contingencies include the usual obligations and litigation incurred by real estate developers in the normal course of business. In the opinion of management, there are no material loss contingencies.
The Company obtains performance bonds in the normal course of business to ensure completion of the infrastructure of the Project. As of December 31, 2014 and 2013, the Company had $5,680,620 and $0, respectively, in performance bonds outstanding with various cities, governmental entities, and others, for which the Company had distributed $700,052 and $0, respectively, in cash collateral to third parties.
6. Subsequent Events
The Company has evaluated subsequent events through February 13, 2015, the date the financial statements were available for issuance.
147
Exhibit Number | Exhibit Description | |
3.1 | Amended and Restated Certificate of Incorporation of The New Home Company Inc. (incorporated by reference to Exhibit 3.1 of the Company's Annual Report on Form 10-K for the year ended December 31, 2013) | |
3.2 | Bylaws of The New Home Company Inc. (incorporated by reference to Exhibit 3.2 of the Company's Annual Report on Form 10-K for the year ended December 31, 2013) | |
4.1 | Specimen Common Stock Certificate of The New Home Company Inc. (incorporated by reference to Exhibit 4.1 of the Company’s Registration Statement on Form S-1 (Amendment No. 10, filed on January 24, 2014)) | |
4.2 | Investor Rights Agreement among The New Home Company Inc., TNHC Partners LLC, IHP Capital Partners VI, LLC, WATT/TNHC LLC, TCN/TNHC LP and collectively H. Lawrence Webb, Wayne J. Stelmar, Joseph D. Davis and Thomas Redwitz (incorporated by reference to Exhibit 4.2 of the Company's Annual Report on Form 10-K for the year ended December 31, 2013) | |
10.1 | Revolving Credit Agreement by and among The New Home Company Northern California LLC and U.S. Bank National Association, dated as of Sept. 26, 2013 (incorporated by reference to Exhibit 10.22 of the Company’s Registration Statement on Form S-1 (Amendment No. 6, filed December 17, 2013)) | |
10.2 | Registration Rights Agreement among The New Home Company Inc., TNHC Partners LLC, IHP Capital Partners VI, LLC, WATT/TNHC LLC, and TCN/TNHC LP (incorporated by reference to Exhibit 10.2 of the Company's Annual Report on Form 10-K for the year ended December 31, 2013) | |
10.3† | The New Home Company Inc. 2014 Long-Term Incentive Plan (incorporated by reference to Exhibit 10.3 of the Company's Annual Report on Form 10-K for the year ended December 31, 2013) | |
10.4† | The New Home Company Inc. Executive Incentive Compensation Plan (incorporated by reference to Exhibit 10.4 of the Company's Annual Report on Form 10-K for the year ended December 31, 2013) | |
10.5† | Employment Agreement between The New Home Company Inc. and H. Lawrence Webb (incorporated by reference to Exhibit 10.5 of the Company's Annual Report on Form 10-K for the year ended December 31, 2013) | |
10.6† | Employment Agreement between The New Home Company Inc. and Wayne Stelmar (incorporated by reference to Exhibit 10.6 of the Company's Annual Report on Form 10-K for the year ended December 31, 2013) | |
10.7† | Employment Agreement between The New Home Company Inc. and Joseph Davis (incorporated by reference to Exhibit 10.7 of the Company's Annual Report on Form 10-K for the year ended December 31, 2013) | |
10.8† | Employment Agreement between The New Home Company Inc. and Thomas Redwitz (incorporated by reference to Exhibit 10.8 of the Company's Annual Report on Form 10-K for the year ended December 31, 2013) | |
148
10.9† | Form of Indemnification Agreement between The New Home Company Inc. and each of its directors and officers (incorporated by reference to Exhibit 10.9 of the Company's Annual Report on Form 10-K for the year ended December 31, 2013) | |
10.10† | The New Home Company Inc. 2014 Long-Term Incentive Plan form of Option Award and Stock Option Agreement (incorporated by reference to Exhibit 10.10 of the Company's Annual Report on Form 10-K for the year ended December 31, 2013) | |
10.11† | The New Home Company Inc. 2014 Long-Term Incentive Plan form of Restricted Stock Unit Award Agreement (incorporated by reference to Exhibit 10.11 of the Company's Annual Report on Form 10-K for the year ended December 31, 2013) | |
10.12† | The New Home Company Inc. 2014 Long-Term Incentive Plan form of Restricted Stock Unit Award Agreement for Nonemployee Directors (incorporated by reference to Exhibit 10.12 of the Company's Annual Report on Form 10-K for the year ended December 31, 2013) | |
10.13 | Credit Agreement, dated June 26, 2014, among The New Home Company Inc. and U.S. Bank National Association (incorporated by reference to Exhibit 10.1 of the Company's Current Report on Form 8-K filed July 2, 2014) | |
10.14+ | Agreement of Limited Partnership of Arantine Hills Holdings LP (incorporated by reference to Exhibit 10.1 of the Company's Quarterly Report on Form 10-Q for the quarter ended September 30, 2014) | |
21.1* | List of subsidiaries of The New Home Company Inc. | |
23.1* | Consent of Independent Registered Public Accounting Firm, Ernst & Young LLP | |
31.1* | Chief Executive Officer Section 302 Certification of Periodic Report dated March 6, 2015 | |
31.2* | Chief Financial Officer Section 302 Certification of Periodic Report dated March 6, 2015 | |
32.1** | Chief Executive Officer Section 906 Certification of Periodic Report dated March 6, 2015 | |
32.2** | Chief Financial Officer Section 906 Certification of Periodic Report dated March 6, 2015 | |
† | Management Contract or Compensatory Plan or Arrangement |
+ | Confidential treatment was requested with respect to omitted portions of this Exhibit, which portions have been filed separately with the U.S. Securities and Exchange Commission. |
* | Filed herewith |
** | The information in Exhibits 32.1 and 32.2 shall not be deemed "filed" for purposes of Section 18 of the Securities and Exchange Act of 1934, as amended (the "Exchange Act"), or otherwise subject to the liabilities of that section, nor shall they be deemed incorporated by reference in any filing under the Securities Act of 1933, as amended, or the Exchange Act (including this Report), unless the Registrant specifically incorporates the foregoing information into those documents by reference. |
149
SIGNATURES
Pursuant to the requirements of Section 13 or 15(d) of the Securities Exchange Act of 1934, the registrant has duly caused this report to be signed on its behalf by the undersigned, thereunto duly authorized.
The New Home Company Inc. | ||
By: | /s/ H. Lawrence Webb | |
H. Lawrence Webb | ||
Chief Executive Officer and Chairman | ||
Pursuant to the requirements of the Securities Exchange Act of 1934, this report has been signed below by the following persons on behalf of the registrant and in the capacities and on the dates indicated:
Signature | Title | Date | ||
/s/ H. Lawrence Webb | Chief Executive Officer and Chairman of the Board (Principal Executive Officer) | March 6, 2015 | ||
H. Lawrence Webb | ||||
/s/ Wayne Stelmar | Chief Financial Officer, Secretary and Director (Principal Financial and Accounting Officer) | March 6, 2015 | ||
Wayne Stelmar | ||||
/s/ Sam Bakhshandehpour | Director | March 6, 2015 | ||
Sam Bakhshandehpour | ||||
/s/ Michael Berchtold | Director | March 6, 2015 | ||
Michael Berchtold | ||||
/s/ David Berman | Director | March 6, 2015 | ||
David Berman | ||||
/s/ Paul Heeschen | Director | March 6, 2015 | ||
Paul Heeschen | ||||
/s/ Gregory P. Lindstrom | Director | March 6, 2015 | ||
Gregory P. Lindstrom | ||||
/s/ Cathey S. Lowe | Director | March 6, 2015 | ||
Cathey S. Lowe | ||||
/s/ Douglas C. Neff | Director | March 6, 2015 | ||
Douglas C. Neff | ||||
/s/ Nadine Watt | Director | March 6, 2015 | ||
Nadine Watt | ||||
/s/ William A. Witte | Director | March 6, 2015 | ||
William A. Witte | ||||
150