Attached files
| file | filename |
|---|---|
| EX-32.2 - EXHIBIT 32.2 - New Home Co Inc. | exhibit322123116.htm |
| EX-32.1 - EXHIBIT 32.1 - New Home Co Inc. | exhibit321123116.htm |
| EX-31.2 - EXHIBIT 31.2 - New Home Co Inc. | exhibit312123116.htm |
| EX-31.1 - EXHIBIT 31.1 - New Home Co Inc. | exhibit311123116.htm |
| EX-23.2 - EXHIBIT 23.2 - New Home Co Inc. | exhibit232123116.htm |
| EX-23.1 - EXHIBIT 23.1 - New Home Co Inc. | exhibit231123116.htm |
| EX-21.1 - EXHIBIT 21.1 - New Home Co Inc. | exhibit211123116.htm |
UNITED STATES
SECURITIES AND EXCHANGE COMMISSION
Washington, D.C. 20549
FORM 10-K | ||
(Mark One)
ý | ANNUAL REPORT PURSUANT TO SECTION 13 OR 15(d) OF THE SECURITIES EXCHANGE ACT OF 1934 |
¨ | TRANSITION REPORT PURSUANT TO SECTION 13 OR 15(d) OF THE SECURITIES EXCHANGE ACT OF 1934 |
For the transition period from ______to ______
Commission File Number 001-36283 | ||

The New Home Company Inc.
(Exact Name of Registrant as Specified in Its Charter)
Delaware | 27-0560089 | |
(State or other Jurisdiction of Incorporation or Organization) | (I.R.S. Employer Identification No.) | |
85 Enterprise, Suite 450
Aliso Viejo, California 92656
(Address of principal executive offices) (Zip Code)
Registrant’s telephone number, including area code (949) 382-7800
Securities registered pursuant to Section 12(b) of the Act:
Title of each class | Name of each exchange on which registered | |
Common Stock, par value $0.01 per share | New York Stock Exchange | |
Securities registered pursuant to Section 12(g) of the Act: None
Indicate by check mark if the registrant is a well-known seasoned issuer, as defined in Rule 405 of the Securities Act. Yes ¨ No ý
Indicate by check mark if the registrant is not required to file reports pursuant to Section 13 or Section 15(d) of the Act. Yes ¨ No ý
Indicate by check mark whether the registrant: (1) has filed all reports required to be filed by Section 13 or 15(d) of the Securities Exchange Act of 1934 during the preceding 12 months (or for such shorter period that the registrant was required to file such reports), and (2) has been subject to such filing requirements for the past 90 days. Yes ý No ¨
Indicate by check mark whether the registrant has submitted electronically and posted on its corporate Web site, if any, every Interactive Data File required to be submitted and posted pursuant to Rule 405 of Regulation S-T (§ 232.405 of this chapter) during the preceding 12 months (or for such shorter period that the registrant was required to submit and post such files). Yes ý No ¨
Indicate by check mark if disclosure of delinquent filers pursuant to Item 405 of Regulation S-K is not contained herein, and will not be contained, to the best of registrant’s knowledge, in definitive proxy or information statements incorporated by reference in Part III of this Form 10-K or any amendment to this Form 10-K. ¨
Indicate by check mark whether the registrant is a large accelerated filer, an accelerated filer, a non-accelerated filer, or a smaller reporting company. See the definitions of “large accelerated filer,” “accelerated filer” and “smaller reporting company” in Rule 12b-2 of the Exchange Act.
Large accelerated filer | ¨ | Accelerated filer | ý | Non-accelerated filer | ¨ | Smaller reporting company | ¨ |
Indicate by check mark whether the registrant is a shell company (as defined in Rule 12b-2 of the Act). Yes ¨ No ý
The aggregate market value of the registrant’s common stock held by non-affiliates of the registrant on June 30, 2016, based on the closing price of $9.54 as reported by the New York Stock Exchange was $130,169,999.
There were 20,718,453 shares of the registrant's common stock issued and outstanding as of February 17, 2017.
DOCUMENTS INCORPORATED BY REFERENCE:
The information required by Part III of this Report, to the extent not set forth herein, is incorporated herein by reference from the registrant’s definitive proxy statement relating to the Annual Meeting of Stockholders to be held in 2017, which definitive proxy statement shall be filed with the Securities and Exchange Commission within 120 days after the end of the fiscal year to which this Report relates.
ANNUAL REPORT ON FORM 10-K
FOR THE FISCAL YEAR ENDED DECEMBER 31, 2016
Page Number | ||
Part I | ||
Item 1 | ||
Item 1A | ||
Item 1B | ||
Item 2 | ||
Item 3 | ||
Item 4 | ||
Part II | ||
Item 5 | ||
Item 6 | ||
Item 7 | ||
Item 7A | ||
Item 8 | ||
Item 9 | ||
Item 9A | ||
Item 9B | ||
Part III | ||
Item 10 | ||
Item 11 | ||
Item 12 | ||
Item 13 | ||
Item 14 | ||
Part IV | ||
Item 15 | ||
Item 16 | Form 10-K Summary (Not Applicable) | — |
3
CAUTIONARY NOTE CONCERNING FORWARD-LOOKING STATEMENTS
This annual report on Form 10-K and other materials we have filed or will file with the Securities and Exchange Commission (the "SEC") (as well as information included in oral statements or other written statements made or to be made by us) contains or may contain forward-looking statements within the meaning of the Private Securities Litigation Reform Act of 1995, Section 27A of the Securities Act of 1933, as amended and Section 21E of the Securities Exchange Act, as amended. All statements contained in this annual report on Form 10-K other than statements of historical fact, including statements regarding our future results of operations and financial position, our business strategy and plans, and our objectives for future operations, are forward-looking statements. These forward-looking statements are frequently accompanied by words such as “believe,” “may,” “will,” “estimate,” “continue,” “anticipate,” “intend,” “expect,” “goal,” "could," "can," "might," "should," “plan” and similar expressions. We have based these forward-looking statements largely on our current expectations and projections about future events and trends that we believe may affect our financial condition, results of operations, business strategy, short-term and long-term business operations and objectives, and financial needs. Such statements may include, but are not limited to information related to: anticipated operating results; home deliveries; the ability to acquire land and pursue real estate opportunities; the ability to gain approvals and open new communities; the ability to sell homes and properties; the ability to deliver homes from backlog; the ability to secure materials and subcontractors; joint ventures in which we are involved; anticipated results from our investments in unconsolidated entities; the ability to produce the liquidity and obtain capital necessary to expand and take advantage of opportunities; financial resources and condition; changes in revenues; changes in profitability; changes in margins; changes in accounting treatment; cost of revenues; selling, general and administrative expenses; interest expense; inventory write-downs; home warranty claims and reserves; unrecognized tax benefits; anticipated tax refunds; seasonality; dividends; sales paces and prices; effects of home buyer cancellations; growth and expansion; and legal proceedings, claims and reserves.
From time to time, forward-looking statements also are included in other reports on Forms 10-Q and 8-K, in press releases, in presentations, on our website and in other materials released to the public. Any or all of the forward-looking statements included in this report and in any other reports or public statements made by us are not guarantees of future performance and may turn out to be inaccurate. This can occur as a result of incorrect assumptions or as a consequence of known or unknown risks and uncertainties. Many factors mentioned in this report or in other reports or public statements made by us, such as market conditions, government regulation and the competitive environment, will be important in determining our future performance. New risks emerge from time to time. It is not possible for our management to predict all risks, nor can we assess the impact of all factors on our business or the extent to which any factor, or combination of factors, may cause actual results to differ materially from those contained in any forward-looking statements we may make. Consequently, actual results may differ materially from those that might be anticipated from our forward-looking statements.
Forward-looking statements speak only as of the date they are made, and we undertake no obligation to revise or publicly release any revision to these forward-looking statements, except as required by law. Given these risks and uncertainties, readers are cautioned not to place undue reliance on such forward-looking statements.
For a discussion of factors that we believe could cause our actual results to differ materially from expected and historical results, see “Item 1A - Risk Factors” and Part II, Item 7, “Management's Discussion and Analysis of Financial Condition and Results of Operations” in this annual report on Form 10-K. This discussion is provided as permitted by the Private Securities Litigation Reform Act of 1995, and all of our forward-looking statements are expressly qualified in their entirety by the cautionary statements contained or referenced in this section.
4
PART 1
Item 1. | Business |
As used in this annual report on Form 10-K, unless the context otherwise requires or indicates, references to “the Company,” “our company,” “we,” “our” and “us” (1) for periods prior to the completion of our formation transactions, refer to The New Home Company LLC and its subsidiaries and affiliates, which we sometimes refer to as “TNHC LLC,” and (2) following the completion of our formation transactions, refer to The New Home Company Inc. and its subsidiaries. The New Home Company LLC was formed on June 25, 2009 as a Delaware limited liability company. On January 30, 2014, in connection with our initial public offering, The New Home Company LLC was converted into a Delaware corporation and renamed The New Home Company Inc., which we refer to as our formation transaction. You should read the following in conjunction with the section titled "Rick Factors", which is included in Part I, Item 1A in this annual report on Form 10-K.
Our Company
We are a new generation homebuilder focused on the design, construction and sale of innovative and consumer-driven homes in major metropolitan areas within select growth markets in California and Arizona, including coastal Southern California, the San Francisco Bay area, metro Sacramento and the greater Phoenix area. We also seek to create unique communities via our significant land development expertise.
We were founded in August 2009, towards the end of an unprecedented downturn in the U.S. homebuilding industry. In January 2014, we completed our initial public offering of shares of our common stock. We believe our management team has extensive and complementary construction, design, marketing, development and entitlement expertise, as well as strong relationships with key land sellers within each of our local markets, and a reputation for quality building, which provide a competitive advantage in being able to acquire land, participate in and create masterplans, obtain entitlements and build quality homes.
On February 16, 2017, the Company announced the retirement of Wayne Stelmar from his role as Chief Investment Officer. Effective February 17, 2017, Mr. Stelmar was retained by the Company as a consultant on a part time basis. The Company has also executed an employment agreement with Leonard Miller, pursuant to which he will be hired and appointed as our Chief Operating Officer, effective March 13, 2017. Mr. Miller was most recently California Regional President for Richmond American Homes, an affiliate of M.D.C. Holdings, Inc., where he served since 2004. Concurrent with Mr. Miller’s appointment, Tom Redwitz, our current Chief Operating Officer, will transition to the role of Chief Investment Officer.
We employ a local market, consumer-driven approach to designing differentiated homes to meet the unique lifestyle needs of homebuyers across a variety of demographics. We believe our approach to market research and construction expertise across an extensive product offering allows us the flexibility to pursue a wide array of land acquisition opportunities and appeals to a broad range of potential homebuyers, including entry-level, move-up, move-down and luxury customers. The homes that we and our unconsolidated joint ventures build range in price from approximately $300,000 to over $9 million, with home sizes ranging from approximately 800 to 6,200 square feet. We believe that customer-focused community creation and product development, as well as exemplary customer service, are key components of the lifestyle connection we seek to establish with each homebuyer.
Additionally, we strive to enhance the home-buying experience and buyers’ personal investment in their homes by actively engaging them in the selection of design options and upgrades. We believe that our on-site design studios, which allow buyers to personalize our home offerings, are a key source of competitive differentiation and often contribute to greater profitability. In addition to our on-site design studios, we also believe our emphasis on customer care provides us a competitive advantage. In 2013, 2014 and 2015 we were awarded the Eliant Homebuyers’ Choice Award for Best Overall Customer Care Experience. Our commitment to customer satisfaction is a key element of company culture, which fosters an environment where team members can innovate. We believe our reputation for high quality, differentiated architecture and design, as well as high customer satisfaction and company culture, enhances our overall financial performance and generates increased customer loyalty.
Our Business
For financial reporting, we are organized into two reportable segments: homebuilding and fee building. Our homebuilding operations are comprised of divisions in Northern California, Southern California and our newest division in Arizona, which was established during 2015 through the purchase of lots in an unconsolidated joint venture. Although our primary business focus is building and selling homes for our own account, we also have a meaningful fee building business. We believe our fee building business complements our homebuilding business in what we believe to be among the most attractive
5
masterplan communities in coastal Southern California. One of our wholly owned subsidiaries is usually the general contractor for our and our unconsolidated joint ventures’ projects and retains subcontractors for home construction and land development. For financial information about our segments, see Item 7, "Management's Discussion and Analysis of Financial Condition and Results of Operations" and Note 14 to the Consolidated Financial Statements.
The following table shows the percentage of each segment's revenue in relation to our consolidated total revenues for the years ended December 31, 2016, 2015 and 2014. For additional information related to geographic location of our homebuilding revenues, see Item 7, "Management's Discussion and Analysis of Financial Condition and Results of Operations."
Year Ended December 31, | ||||||||||||||||||||
(dollars in thousands) | ||||||||||||||||||||
2016 | % of Total Revenues | 2015 | % of Total Revenues | 2014 | % of Total Revenues | |||||||||||||||
Homebuilding | $ | 507,949 | 73 | % | $ | 280,209 | 65 | % | $ | 56,094 | 37 | % | ||||||||
Fee building | 186,507 | 27 | % | 149,890 | 35 | % | 93,563 | 63 | % | |||||||||||
Total revenues | $ | 694,456 | 100 | % | $ | 430,099 | 100 | % | $ | 149,657 | 100 | % | ||||||||
We are currently focused on identifying unique sites and creating communities that allow us to design, construct and sell consumer-driven single-family detached and attached homes in major metropolitan areas in coastal Southern California, the San Francisco Bay area, metro Sacramento and the greater Phoenix area. We seek sites where we are rewarded for thoughtful land planning and architecture, and additional defining characteristics of our markets include barriers to entry, job growth, high employment to building permit ratios and increasing populations, which can create growing demand for new housing. Moreover, our management team has deep local market knowledge of the California homebuilding and the land planning and development business. We consider ourselves a local market, consumer-driven homebuilder with expertise across a wide variety of product types and customer segments, including entry-level, move-up, move-down and luxury customer segments. We perform extensive consumer research that helps us create land plans and design homes that meet the needs and desires of our targeted buyers. A key element of our strategy is to allow buyers to personalize their homes regardless of the price point. Each of our communities has an on-site design center with dedicated designers who are knowledgeable about the attributes of the homes offered in the community. We believe that the active participation of buyers in selecting options and upgrades results in buyers becoming more personally invested in their homes, which leads to fewer cancellations.
We seek to maximize returns and reduce exposure to land risk through the use of land options, joint ventures and other flexible land acquisition arrangements. We believe our lot option and joint venture strategy is a key factor in allowing us to leverage our entity-level capital and returns on equity, participate in and develop larger masterplan communities, and establish a homebuilding platform focused on high-growth, land-constrained markets. In addition, we believe that our professional reputation and long-standing relationships with key land sellers, including masterplan community developers, brokers and other builders, as well as our institutional investors and joint venture partners, enable us to acquire well-positioned land parcels in our existing markets as well as new target markets.
6
Summary of Owned and Controlled Lots
As of December 31, 2016, we owned or controlled an aggregate of 1,576 lots, plus another 935 lots pursuant to our fee building contracts. The following table presents certain information with respect to our wholly owned and fee building lots as of December 31, 2016. See Item 7, "Management's Discussion and Analysis of Financial Condition and Results of Operations - Lots Owned and Controlled" for further detail.
December 31, | ||||||||||||||||||||
Change | Change | |||||||||||||||||||
2016 | Amount | % | 2015 | Amount | % | 2014 | ||||||||||||||
Lots Owned | 590 | 178 | 43 | % | 412 | 22 | 6 | % | 390 | |||||||||||
Lots Controlled(1) | 986 | 80 | 9 | % | 906 | 367 | 68 | % | 539 | |||||||||||
Lots Owned and Controlled - Wholly Owned | 1,576 | 258 | 20 | % | 1,318 | 389 | 42 | % | 929 | |||||||||||
Fee Building(2) | 935 | (487 | ) | (34 | )% | 1,422 | 317 | 29 | % | 1,105 | ||||||||||
Total Lots Owned and Controlled | 2,511 | (229 | ) | (8 | )% | 2,740 | 706 | 35 | % | 2,034 | ||||||||||
(1) | Includes lots that we control pursuant to option contracts, purchase contracts or non-binding letters of intent that are subject to customary conditions and have not yet closed. There can be no assurance that such acquisitions will occur. |
(2) | Lots owned by third party property owners for which we perform general contracting services. |
Acquisition Process
Our land acquisition strategy focuses on purchasing entitled finished, or partially improved land sufficient for construction of homes over a two- to three-year period from the initiation of homebuilding activity. We also selectively acquire parcels that require land development activities. Our acquisition process generally includes the following steps aimed at reducing development and market cycle risk:
• | review of the status of entitlements and other governmental processing, including title reviews; |
• | identification of target buyer and appropriate housing product; |
• | determination of land plan to accommodate desired housing product; |
• | completion of environmental reviews and third-party market studies; |
• | preparation of detailed budgets for all cost categories; |
• | completion of due diligence on the land parcel prior to committing to the acquisition; |
• | utilization of options, joint ventures and other land acquisition arrangements, if necessary; |
• | limitation on the size of an acquisition relative to the Company's pro forma capitalization; and |
• | centralized acquisition approval process through a tiered Corporate and Executive Committee. |
Before purchasing a land parcel, we engage and work closely with outside architects and consultants to design our homes and communities.
We also differentiate our acquisition strategy based on whether the land is in a masterplan community, or part of a larger development. For land which is not part of a larger development or masterplan, we generally enter into a purchase agreement with the land owner and deliver a deposit, which becomes non-refundable upon the expiration of a specified due diligence period. The closing is generally tied to the date on which we have obtained development entitlements for the land. For land which is part of a larger development being developed by a master developer, we generally enter into a purchase agreement with the master developer and pay a deposit that becomes non-refundable upon expiration of the due diligence period. The closing in master developments is generally tied to the issuance of final land development entitlements and completion of certain infrastructure and other improvements by the master developer. In master developments we may acquire all of the land at the closing or we may acquire the land in “phases”. In master developments we may be required to (a) pay to the master developer a share of our net profit in excess of a specified margin and/or (b) grant the master developer the right to repurchase the land if we fail to develop the land in accordance with applicable development requirements or wish to sell the land in bulk. Our acquisition-development financing is generally obtained using one or more of the following: (i) through unsecured lines of credit; (ii) secured acquisition-development loans; (iii) equity obtained from joint venture partners and/or (iv) land bank arrangements with providers who take title to the land at closing subject to agreements which obligate us to perform all development activities with respect to the land and provide us with an option to purchase the land.
7
Homebuilding, Marketing and Sales Process
The homes that we and our unconsolidated joint ventures are building range in price from approximately $300,000 to over $9 million, with home sizes ranging from approximately 800 to 6,200 square feet. Homebuilding revenue contributed to 73%, 65% and 37% of total revenue for the years ended December 31, 2016, 2015 and 2014, respectively. For the years ended December 31, 2016, 2015 and 2014, the average sales price of homes delivered from our communities was approximately $2.0 million, $1.9 million and $1.1 million, respectively.
We typically develop communities in phases based upon projected sales. We seek to control the timing of construction of subsequent phases in the same community based on sales demand in prior phases and the number of qualified potential homebuyers that exist on our priority buyer list. Our construction process is driven by sales contracts that generally precede the start of the construction of homes. The determination that a potential home buyer is qualified to obtain the financing necessary to complete the purchase is an integral part of our process. Once qualified, our on-site design centers, with designers dedicated to a specific community, work with the buyer to tailor the home to meet the buyer’s needs. This practice is designed to enhance the buyers’ connection to the home and we believe leads to increased option sales.
The design of our homes must conform to zoning requirements, building codes and energy efficiency laws. As a result, we contract with a number of architects and other consultants in connection with the design process. Substantially all of our construction work is done by subcontractors and trade partners with us acting as the general contractor. We also enter into contracts as needed with design professionals and other service providers who are familiar with local market conditions and requirements. We do not have long-term contractual commitments with our subcontractors trade partners, suppliers or laborers. We maintain strong and long-standing relationships with many of our subcontractors and trade partners. We believe that our relationships with subcontractors and trade partners have been enhanced through involving them prior to the start of a new community, maintaining our schedules and making timely payment. By dealing fairly, we believe we are able to keep our key subcontractors and trade partners loyal to us.
Sales and Marketing
In connection with the sale and marketing of our homes, we make extensive use of advertising and other promotional activities, including through our website (www.NWHM.com), social-media, brochures, direct mail and other community-specific collateral materials. The information contained in, or that can be accessed through our website, is not incorporated by reference and is not a part of this annual report on Form 10-K.
We primarily sell our homes through our own sales representatives. Our in-house sales force works from sales offices located in model homes or sales centers close to, or within each community. Sales representatives assist potential buyers by providing them with floor plan, price and community amenity information, construction timetables and tours of model homes. Sales personnel are licensed by applicable real estate bodies in their respective markets and generally have had prior experience selling new homes in the local market.
Generally, we build model homes at each project and have them professionally decorated and landscaped to display design features and options available for purchase in the design center. We believe that model homes play a significant role in helping homebuyers understand the efficiencies and value provided by each floor plan type. Interior decorations vary among our models and are selected based upon the lifestyles of our targeted homebuyers. Structural changes in design from the model homes, other than those predetermined, are not generally permitted, but homebuyers may select various other optional construction and design amenities. Our on-site design centers are an integral part of this process. Specific options are selected for each community based upon the price of the home and anticipated buyer preferences. Options include structural (room configurations or pre-determined additional square footage), electrical, plumbing and finish options (flooring, cabinets, fixtures). In certain communities, we also offer turn-key landscape options. Each design center is managed by our own designers dedicated to the specific community. We believe this approach enables us to create a strong relationship with our buyers that results in fewer cancellations and increased revenue.
We typically sell homes using sales contracts that include cash deposits by the purchasers. Before entering into sales contracts, we pre-qualify our customers through a preferred mortgage provider. However, purchasers can generally cancel sales contracts if they are unable to sell their existing homes, if they fail to qualify for financing, or under certain other circumstances. Although cancellations can delay the sale of our homes, they have historically not had a material impact on our operating results. For our communities, the cancellation rate of buyers who contracted to buy a home but did not close escrow as a percentage of overall orders was 12%, 10% and 13% during the years ended December 31, 2016, 2015 and 2014, respectively. Cancellation rates are subject to a variety of factors, including those beyond our control, such as adverse economic conditions and increases in mortgage interest rates.
8
Customer Financing
At each of our communities, we seek to assist our homebuyers in obtaining financing by arranging with preferred mortgage lenders to offer qualified buyers a variety of financing options. Most homebuyers utilize long-term mortgage financing to purchase a home, and mortgage lenders will usually make loans only to qualified borrowers.
Quality Control and Customer Service
We pay particular attention to the product design process and carefully consider quality and choice of materials in order to attempt to eliminate building deficiencies. The quality and workmanship of the subcontractors and trade partners we employ are monitored using our personnel and third-party consultants. We make regular inspections and evaluations of our subcontractors and trade partners to seek to ensure that our standards are met.
We maintain a quality control and customer service staff whose role includes providing a positive experience for each customer throughout the pre-sale, sale, building, delivery and post-delivery periods. These employees are also responsible for providing after-sales customer service, including the coordination of warranty requests. Our quality and service initiatives include taking homebuyers on a comprehensive tour of their home during construction and prior to delivery. In addition, we use a third party, Eliant, to survey our homebuyers in order to improve our standards of quality and customer satisfaction.
Insurance and Warranty Program
We provide a limited one-year warranty to our homeowners covering workmanship and materials. In addition, we generally provide a more limited warranty, which generally ranges from a minimum of two years up to the period covered by the applicable statute of repose, that covers certain defined construction defects. The limited warranty covering construction defects is transferable to subsequent buyers and provides for the resolution of unresolved construction-related disputes through binding arbitration. Additionally, we have dedicated customer service staff that work with our homebuyers and coordinate with subcontractors and trade partners, as necessary, during the warranty period. We believe that our reserves are adequate to cover the ultimate resolution of our potential liabilities associated with known and anticipated warranty and construction defect related claims and litigation. While our subcontractors who perform our homebuilding work generally provide us with an indemnity for claims relating to their workmanship and materials, we also purchase general liability insurance that covers development and construction activity at each of our communities. Our subcontractors are usually covered by these programs through an owner-controlled insurance program, or "OCIP." Consultants such as engineers and architects are generally not covered by the OCIP but are required to maintain their own insurance. In general, we maintain insurance, subject to deductibles and self-insured amounts, to protect us against various risks associated with our activities, including, among others, general liability, “all-risk” property, construction defects, workers’ compensation, automobile, and employee fidelity. Our warranty reserves include expected costs associated with the deductibles and self-insured amounts.
Seasonality
We have experienced seasonal variations in our quarterly operating results and capital requirements in each of our reportable segments. We typically take orders for more homes in the first half of the fiscal year than in the second half, which creates additional working capital requirements in the second and third quarters to build our inventories to satisfy the deliveries in the second half of the year. We expect this seasonal pattern to continue over the long-term, although it may be affected by volatility in the homebuilding industry.
Backlog
At December 31, 2016 and 2015, homes under contract, but not yet delivered (“backlog”) totaled 79 and 67, respectively, with an estimated sales value of $187.3 million and $166.6 million, respectively. We expect to deliver all of the homes in backlog at December 31, 2016 during 2017 under their existing home order contracts or through the replacement of an existing contract with a new home order contract. The estimated backlog sales value at December 31, 2016 may be impacted by, among other things, subsequent home order cancellations, incentives provided, and/or options and upgrades selected.
Labor and Raw Materials
Typically, all the raw materials and most of the components used in our business are readily available in the United States. Most are standard items carried by major suppliers. Increases in the cost of building materials and subcontracted labor may reduce gross margins from home sales to the extent that market conditions prevent the recovery of increased costs through higher home sales prices. From time to time and to varying degrees, we may experience shortages in the availability of building materials and/or labor in each of our markets. These shortages and delays may result in delays in the delivery of homes under construction, reduced gross margins from home sales, or both. We continue to monitor the supply markets to achieve favorable prices.
9
Joint Ventures
Our joint venture strategy has been instrumental in leveraging our entity-level capital and establishing a homebuilding and land development platform focused on high-growth, land-constrained markets. We own interests in our unconsolidated joint ventures that generally range from 5% to 35%. We also earn management fees from such joint ventures.
We serve as the administrative member, manager or managing member of each of our nine homebuilding and four land development joint ventures. We do not, however, exercise control over the joint ventures, as the joint venture agreements generally provide our respective partners with the right to consent to certain actions. Under most joint venture agreements, certain major decisions must be approved by the applicable joint venture’s executive committee, which is comprised of both our representatives and representatives of our joint venture partners. In addition, some of our joint venture agreements grant both partners a buy-sell right pursuant to which, subject to certain exceptions, either partner may initiate procedures requiring the other partner to choose between selling its interest to the other partner or buying the other partner’s interest. Additional information related to our unconsolidated joint ventures is set forth in Item 7, "Management's Discussion and Analysis of Financial Condition and Results of Operations - Off-Balance Sheet Arrangements and Contractual Obligations."
Fee Building Services
Although our primary business focus is building and selling homes for our own account, we also selectively provide general contracting services to build homes for independent third-party property owners. We refer to these projects as “fee building projects.” For the year ended December 31, 2016, 96% of our fee building revenue represents fee building billings and 4% represents management fees from unconsolidated joint ventures. Our services with respect to fee building projects may include design, development, construction and sale of the homes. We earn revenue on our fee building projects either as a flat fee for the project or as a percentage of the cost or revenue of the project depending upon the terms of the agreement with our customer. For the years ended December 31, 2016, 2015 and 2014, fee building revenue contributed to 27%, 35% and 63%, respectively, of total revenue. The Company’s fee building revenues have historically been concentrated with a small number of customers. We have several fee building agreements with Irvine Pacific, LP and revenues from this customer totaled 26%, 32%, and 55% of our total consolidated revenues for the years ended December 31, 2016, 2015 and 2014, respectively. Our billings to this customer are dependent upon such customer’s decision to proceed with construction and the agreements can be canceled at any time. We cannot predict whether these agreements will continue in the future or the current pace of construction, and the loss of these billings could have a material adverse effect on our results of operations. See Item 7, "Management's Discussion and Analysis of Financial Condition and Results of Operations - Fee Building" and Note 1 "Revenue Recognition - Fee Building" to the Consolidated Financial Statements for further discussion of this revenue concentration.
Government Regulation and Environmental Matters
We are subject to numerous local, state and federal statutes, ordinances, rules and regulations concerning zoning, development, building design, construction and similar matters, which impose restrictive zoning and density requirements, the result of which is to limit the number of homes that can be built within the boundaries of a particular area. Communities that are not entitled may be subjected to periodic delays, changes in use, less intensive development or elimination of development in certain specific areas due to government regulations. We may also be subject to periodic delays or may be precluded entirely from developing in certain communities due to building moratoriums or “slow-growth” or “no-growth” initiatives that could be implemented in the future. Local governments also have broad discretion regarding the imposition of development fees and exactions for communities in their jurisdiction. Communities for which we have received land use and development entitlements or approvals may still require a variety of other governmental approvals and permits during the development process and can also be impacted adversely by unforeseen health, safety and welfare issues, which can further delay these communities or prevent their development.
We are also subject to a variety of local, state and federal statutes, ordinances, rules and regulations concerning the environment. The particular environmental laws which apply to any given homebuilding site vary according to multiple factors, including the site’s location, its environmental conditions and the present and former uses of the site, as well as adjoining properties. Environmental laws and conditions may result in delays, may cause us to incur substantial compliance and other costs, and can prohibit or severely restrict homebuilding activity in environmentally sensitive regions or areas. In addition, in those cases where an endangered or threatened species is involved, environmental rules and regulations can result in the restriction or elimination of development in identified environmentally sensitive areas. Legislation related to climate change and energy efficiency can impose stricter building standards, which may increase our cost to build. From time to time, the EPA and similar federal or state agencies review homebuilders’ compliance with environmental laws and may levy fines and penalties for failure to strictly comply with applicable environmental laws or impose additional requirements for future compliance as a result of past failures. Any such actions taken with respect to us may increase our costs. Further, we expect that increasingly stringent requirements will be imposed on homebuilders in the future. Environmental regulations can also have an
10
adverse impact on the availability and price of certain raw materials such as lumber. California is especially susceptible to restrictive government regulations and environmental laws.
Under various environmental laws, current or former owners of real estate, as well as certain other categories of parties, may be required to investigate and clean up hazardous or toxic substances or petroleum product releases, and may be held liable to a governmental entity or to third parties for related damages, including for bodily injury, and for investigation and clean-up costs incurred by such parties in connection with the contamination. A mitigation system may be installed during the construction of a home if a cleanup does not remove all contaminants of concern or to address a naturally occurring condition such as methane. Some buyers may not want to purchase a home with a mitigation system.
Competition
We believe our on-site design studios, emphasis on customer care, and reputation for high quality, differentiated architecture and design provides us a competitive advantage; however, competition in the homebuilding industry is intense, and there are relatively low barriers to entry into our business. We compete with numerous homebuilders of varying sizes. A number of our primary competitors are significantly larger, have a longer operating history and may have greater resources or lower cost of capital than us. Accordingly, they may be able to compete more effectively in one or more of the markets in which we operate. Homebuilders compete for, among other things, home-buying customers, desirable land parcels, financing, raw materials and skilled labor. Our competitors may independently develop land and construct homes that are superior or substantially similar to our products. We also compete for sales with individual resales of existing homes and with available rental housing. Increased competition could hurt our business, as it could prevent us from acquiring attractive land parcels on which to build homes or make such acquisitions more expensive, hinder our market share expansion, and lead to pricing pressures on our homes that may adversely impact our revenues and margins. If we are unable to successfully compete, our business, prospects, liquidity, financial condition and results of operations could be materially and adversely affected.
Employees
As of December 31, 2016, we had 289 employees, 114 of whom were executive, management and administrative personnel located in our offices, 60 of whom were sales and marketing personnel and 115 were involved in field construction. Although none of our employees are covered by collective bargaining agreements, certain of the third party subcontractors and trade partners engaged by us are represented by labor unions or are subject to collective bargaining arrangements. We believe that relations with our employees, subcontractors and trade partners are good.
Our Offices and Available Information
Our principal executive offices are located at 85 Enterprise, Suite 450, Aliso Viejo, California 92656. Our main telephone number is (949) 382-7800. Our internet website is www.NWHM.com. We will make available through the “Investors” section of our website our annual report on Form 10-K, quarterly reports on Form 10-Q, current reports on Form 8-K, and amendments to these reports filed or furnished pursuant to Section 13(d) or 15(d) of the Securities Exchange Act of 1934 as soon as reasonably practicable after filing with, or furnishing to, the SEC. Copies of these reports, and any amendment to them, are available free of charge upon request. We provide information about our business and financial performance, including our corporate profile, on our Investor Relations website. Additionally, we webcast our earnings calls and certain events we participate in with members of the investment community on our Investor Relations website. Further corporate governance information, including our code of ethics and business conduct, corporate governance guidelines, and board committee charters, is also available on our Investor Relations website. The information contained in, or that can be accessed through our website is not incorporated by reference and is not part of this annual report on Form 10-K.
In addition, we file annual, quarterly and current reports, proxy statements and other information with the SEC. These filings are available over the internet at the SEC’s website at http://www.sec.gov. All of the documents we file with the SEC may also be read and copied at the SEC’s public reference room located at 100 F Street, NE, Washington, DC 20549. Please call the SEC at 1-800-SEC-0330 for further information on the public reference room.
11
Item 1A. | Risk Factors |
You should carefully consider the following risk factors, which address the material risks concerning our business, together with the other information contained in this annual report on Form 10-K. If any of the risks discussed in this annual report on Form 10-K occur, our business, prospects, liquidity, financial condition and results of operations could be materially and adversely affected, in which case the trading price of our common stock could decline significantly and you could lose part or all of your investment. Some statements in this annual report, including statements in the following risk factors, constitute forward-looking statements. Please refer to the initial section of this annual report entitled “Cautionary Note Concerning Forward-Looking Statements.”
Risks Related to Our Business
Our geographic concentration could materially and adversely affect us if the homebuilding industry or the availability of land parcels in our current markets declines.
Our current business involves the design, construction and sale of innovative single-family detached and attached homes in planned communities in major metropolitan areas in coastal Southern California, the San Francisco Bay area, metro Sacramento and the greater Phoenix area. Because our operations are concentrated in these areas, a prolonged economic downturn affecting one or more of these areas, or affecting any sector of employment on which the residents of such area are dependent, could have a material adverse effect on our business, prospects, liquidity, financial condition and results of operations, and a disproportionately greater impact on us than other homebuilders with more diversified operations. During the downturn from 2008 to 2011, land values, the demand for new homes and home prices declined substantially in California. In addition, the state of California recently experienced severe budget shortfalls and has raised taxes and increased building permits and development fees to offset the deficit. Accordingly, our sales, results of operations, financial condition and business could be negatively impacted by a decline in the economy, one or more significant job sectors or the homebuilding industry in the Western U.S. regions in which our operations are concentrated.
In addition, our ability to acquire land parcels for new single-family homes may be adversely affected by changes in the general availability of land parcels, the willingness of land sellers to sell land parcels at reasonable prices, competition for available land parcels, availability of financing to acquire land parcels, zoning and other market conditions. The availability of land parcels in our California markets at reasonable prices is limited. If the supply of land parcels appropriate for development of single-family homes is limited because of these factors, or for any other reason, our ability to grow could be significantly limited, and the number of homes that we build and sell could decline.
The homebuilding industry is cyclical and affected by changes in general economic, real estate and other business conditions that could reduce the demand for new homes and, as a result, adversely impact our results of operations, financial condition and cash flows.
The residential homebuilding industry is cyclical and is highly sensitive to changes in general economic, real estate and other business conditions such as levels of employment, consumer confidence and income, availability of mortgage financing for homebuyers, interest rate levels, demographic trends, homebuyer preferences for specific designs or locations, real estate taxes, inflation and supply of and demand for new and existing homes. The foregoing conditions, among others, are complex and interrelated. Periods of prolonged economic downturn, high unemployment levels, increases in the rate of inflation and uncertainty in the U.S. economy, have contributed to decreased demand for housing, declining sales prices and increasing pricing pressure. In the event that one or more of such economic and business conditions occur, we could experience declines in the market value of our inventory and demand for our homes, which could have a material adverse effect on our business, prospects, liquidity, financial condition and results of operations. Adverse economic conditions outside the U.S., such as Asia or Canada, may also adversely affect the demand for our homes to the extent such conditions impact the amount of potential homebuyers from such regions in our markets.
In addition, an important segment of our customer base consists of first and second “move-up” buyers, who often purchase homes contingent upon the sale of their existing homes. During recessionary periods, these buyers may face difficulties selling their homes, which may in turn adversely affect our sales. Moreover, during such periods, we may need to reduce our sales prices and offer greater incentives to buyers to compete for sales that may result in reduced margins.
12
Our long-term growth depends upon our ability to successfully identify and acquire desirable land parcels for residential buildout for reasonable prices.
Our future growth depends upon our ability to successfully identify and acquire attractive land parcels for development of our single-family homes at reasonable prices and with terms that meet our underwriting criteria. Our ability to acquire land parcels for new single-family homes may be adversely affected by changes in the general availability of land parcels, the willingness of land sellers to sell land parcels at reasonable prices, competition for available land parcels, availability of financing to acquire land parcels, zoning and other market conditions. We currently depend primarily on the California markets and availability of land parcels in that market at reasonable prices is limited. If the supply of land parcels appropriate for development of single-family homes is limited because of these factors, or for any other reason, our ability to grow could be significantly limited, and the number of homes that we build and sell could decline. Additionally, our ability to begin new projects could be impacted if we elect not to purchase land parcels under option contracts. To the extent that we are unable to purchase land parcels timely or enter into new contracts for the purchase of land parcels at reasonable prices, our home sales revenue and results of operations could be adversely impacted.
Labor and raw material shortages and price fluctuations could delay or increase the cost of home construction, which could materially and adversely affect us.
The residential construction industry experiences serious labor and raw material shortages from time to time, including shortages in qualified tradespeople, and supplies of insulation, drywall, cement, steel and lumber. These labor and raw material shortages can be more severe during periods of strong demand for housing or during periods where the regions in which we operate experience natural disasters that have a significant impact on existing residential and commercial structures. The cost of labor and raw materials may also increase during periods of shortage or high inflation. During the downturn in 2008 to 2011, a large number of qualified trade partners went out of business or otherwise exited the market into new fields. According to the National Association of Homebuilders, as of September 2016, there were approximately 200,000 unfilled construction jobs in the United States, up 81% in the last two years. A reduction in available trade partners exacerbates labor shortages as demand for new housing increases. Shortages and price increases could cause delays in and increase our costs of home construction, which we may not be able to recover by raising home prices due to market demand and because the price for each home is typically set months prior to its delivery pursuant to the agreement of sale with the home buyer, which in turn could have a material adverse effect on our business, prospects, liquidity, financial condition and results of operations.
Our business and results of operations depend on the availability and skill of subcontractors.
Substantially all of our construction work is done by third-party subcontractors with us acting as the general contractor. Accordingly, the timing and quality of our construction depend on the availability and skill of our subcontractors. We do not have long-term contractual commitments with any subcontractors, and there can be no assurance that skilled subcontractors will continue to be available at reasonable rates and in the areas in which we conduct our operations. Certain of the subcontractors engaged by us are represented by labor unions or are subject to collective bargaining arrangements that require the payment of prevailing wages that are higher than normally expected on a residential construction site. A strike or other work stoppage involving any of our subcontractors could also make it difficult for us to retain subcontractors for our construction work. In addition, union activity could result in higher costs to retain our subcontractors. The inability to contract with skilled subcontractors at reasonable costs on a timely basis could have a material adverse effect on our business, prospects, liquidity, financial condition and results of operations.
In addition, despite our quality control efforts, we may discover that our subcontractors were engaging in improper construction practices or installing defective materials in our homes. When we discover these issues, we, generally through our subcontractors, repair the homes in accordance with our new home warranty and as required by law. Reserves are established based on market practices, our historical experiences and our judgment of the qualitative risks associated with the types of homes built. However, the cost of satisfying our warranty and other legal obligations in these instances may be significantly higher than our reserves, and we may be unable to recover the cost of repair from such subcontractors. Regardless of the steps we take, we can in some instances be subject to fines, litigation, or other penalties, and our reputation and our financial condition may be adversely affected.
If the market value of our land or housing inventory decreases, our results of operations could be adversely affected due to the illiquid nature of real estate investments and by impairments.
The market value of our land and housing inventories depends on market conditions. We acquire land for expansion into new markets and for replacement of land inventory and expansion within our current markets. There is an inherent risk that
13
the value of the land owned or controlled by us may decline after purchase. The risks inherent in purchasing and developing land parcels increase as consumer demand for housing decreases. As a result, we may buy and develop land parcels on which homes cannot be profitably built and sold. The valuation of property is inherently subjective and based on the individual characteristics of each property. When market conditions drive land values down, land we have purchased or option agreements we have previously entered into may become less desirable because we may not be able to build and sell homes profitably, at which time we may elect to sell the land or, in the case of options contracts, to forego pre-acquisition costs and deposits and terminate the agreements. Factors such as changes in regulatory requirements and applicable laws (including in relation to building regulations, taxation and planning), political conditions, the condition of financial markets, both local and national economic conditions, the financial condition of customers, potentially adverse tax consequences, and interest and inflation rate fluctuations subject the market value of land owned, controlled or optioned by us to uncertainty. Moreover, all valuations are made on the basis of assumptions that may not prove to reflect economic or demographic reality. If housing demand decreases below what we anticipated when we acquired our inventory, our results of operations and financial conditions may be adversely affected and we may not be able to recover our costs when we sell and build houses. Land parcels, building lots and housing inventories are illiquid assets, and we may not be able to dispose of them efficiently or at all if we or the housing market and general economy are in financial distress. In addition, inventory carrying costs can be significant and can result in losses in a poorly performing project or market. We regularly review the value of our land holdings and continue to review our holdings on a periodic basis. Material impairments in the value of our inventory may be required, and we may in the future sell land or homes at significantly lower margins or at a loss, if we are able to sell them at all, which could adversely affect our results of operations and financial condition.
We may not be able to compete effectively against competitors in the homebuilding industry.
We operate in a very competitive environment which is characterized by competition from a number of other homebuilders in each market in which we operate. Additionally, there are relatively low barriers to entry into our business. We compete with numerous large national and regional homebuilding companies and with smaller local homebuilders and land developers for, among other things, home buyers, desirable land parcels, financing, raw materials and skilled management and labor resources. Our competitors may independently develop land and construct homes that are superior or substantially similar to our products. Increased competition could hurt our business, as it could prevent us from acquiring attractive land parcels on which to build homes or make such acquisitions more expensive, hinder our market share expansion and cause us to increase our selling incentives or reduce our prices. An oversupply of homes available for sale and the heavy discounting of home prices by some of our competitors have adversely affected demand for homes in the market as a whole and could do so again in the future. We also compete with the resale, or “previously owned,” home market. If we are unable to compete effectively in our markets, our business could decline disproportionately to our competitors, and our results of operations and financial condition could be adversely affected.
We may be at a competitive disadvantage with regard to certain of our large national and regional homebuilding competitors whose operations are more geographically diversified than ours, as these competitors may be better able to withstand any future regional downturn in the housing market. We compete directly with a number of large national and regional homebuilders that may have longer operating histories and greater financial and operational resources than we do. Many of these competitors also have longstanding relationships with subcontractors, local governments and suppliers in the markets in which we operate or in which we may operate in the future. This may give our competitors an advantage in securing materials and labor at lower prices, marketing their products and allowing their homes to be delivered to customers more quickly and at more favorable prices. This competition could reduce our market share and limit our ability to expand our business as we have planned.
If we are unable to develop our communities successfully or within expected timeframes, our results of operations could be adversely affected.
Before a community generates any revenue, time and material expenditures are required to acquire land, obtain development approvals and construct significant portions of project infrastructure, amenities, model homes and sales facilities. It can take several years from the time we acquire control of a property to the time we make our first home sale on the site. Delays in the development of communities expose us to the risk of changes in market conditions for homes. A decline in our ability to develop and market our communities successfully and to generate positive cash flow from these operations in a timely manner could have a material adverse effect on our business and results of operations and on our ability to service our debt and to meet our working capital requirements.
14
Increases in our cancellation rate could have a negative impact on our home sales revenue and homebuilding margins.
In connection with the sale of a home we collect a deposit from the homebuyer that is a small percentage of the total purchase price. Upon a home order cancellation, the homebuyer’s escrow deposit is returned to the homebuyer (other than with respect to certain design-related deposits, which we retain). Home order cancellations can result from a number of factors, including declines or slow appreciation in the market value of homes, increases in the supply of homes available to be purchased, increased competition, higher mortgage interest rates, and changes in homebuyers' financial condition or personal circumstances. Home order cancellations negatively impact our financial and operating results due to a negative impact on the number of homes closed, net new home orders, home sales revenue and results of operations, as well as the number of homes in backlog.
A large proportion of our fee building revenue is from one customer.
The Company’s fee building revenues have historically been concentrated with a small number of customers. We have several fee building agreements with Irvine Pacific, LP and our billings to this customer are dependent upon such customer’s decision to proceed with construction and the agreements can be canceled at any time. We cannot predict whether these agreements will continue in the future or the current pace of construction, and the loss of these billings could have a material adverse effect on our results of operations. See Item 7, "Management's Discussion and Analysis of Financial Condition and Results of Operations - Fee Building" and Note 1 "Revenue Recognition - Fee Building" to the accompanying notes to consolidated financial statements included in this annual report on Form 10-K for further discussion of this revenue concentration.
We are subject to product liability and warranty claims arising in the ordinary course of business.
As a homebuilder, we are subject to construction defect, product liability and home warranty claims, arising in the ordinary course of business or otherwise. While we maintain general liability insurance and generally seek to require our subcontractors and design professionals to indemnify us for some portion of the liabilities arising from their work, there can be no assurance that these insurance rights and indemnities will be collectible or adequate to cover any or all construction defect and warranty claims for which we may be liable. We may not be able to renew our insurance coverage or renew it at reasonable rates and may incur significant costs or expenses (including repair costs and litigation expenses) surrounding possible construction defects, soil subsidence or building related claims. Some claims may arise out of uninsurable events or circumstances not covered by insurance not subject to effective indemnification agreements with our trade partners.
In addition, we conduct all of our business in California, one of the most highly regulated and litigious jurisdictions in the United States, which imposes a ten year, strict liability tail on many construction liability claims. As a result, our potential losses and expenses due to litigation, new laws and regulations may be greater than those of our competitors who have smaller California operations.
Adverse weather and geological conditions may increase costs, cause project delays and reduce consumer demand for housing, all of which could materially and adversely affect us.
As a homebuilder and land developer, we are subject to the risks associated with numerous weather-related and geologic events, many of which are beyond our control. These weather-related and geologic events include but are not limited to droughts, floods, wildfires, landslides, soil subsidence and earthquakes. The occurrence of any of these events could damage our land parcels and projects, cause delays in the completion of our projects, reduce consumer demand for housing and cause shortages and price increases in labor or raw materials, any of which could harm our sales and profitability. Our California markets are in areas which have historically experienced significant earthquake activity and seasonal wildfires. In addition to directly damaging our land or projects, earthquakes, floods, landslides, wildfires or other geologic events could damage roads and highways providing access to those projects, thereby adversely affecting our ability to market homes in those areas and possibly increasing the costs of completion.
There are some risks of loss for which we may be unable to purchase insurance coverage. For example, losses associated with landslides, earthquakes and other geologic events may not be insurable, and other losses, such as those arising from terrorism, may not be economically insurable. A sizeable uninsured loss could materially and adversely affect our business, prospects, liquidity, financial condition and results of operations.
15
Because of the seasonal nature of our business, our quarterly operating results fluctuate.
As discussed under “Management’s Discussion and Analysis of Financial Condition-Liquidity and Capital Resources-Seasonality” we have experienced seasonal fluctuations in our quarterly operating results and capital requirements that can have a material impact on our results and our consolidated financial statements. We typically experience the highest new home order activity in spring and summer, although this activity also highly depends on the number of active selling communities, timing of new community openings and other market factors. Since it typically takes four to ten months to construct a new home, we deliver more homes in the second half of the year as spring and summer home orders convert to home deliveries. Because of this seasonality, home starts, construction costs and related cash outflows have historically been highest in the second and third quarters, and the majority of cash receipts from home deliveries occur during the second half of the year. We expect this seasonal pattern to continue over the long-term, although it may be affected by volatility in the homebuilding industry. We expect the traditional seasonality cycle and its impact on our results to become more prominent if and as the present housing recovery progresses and the homebuilding industry returns to a more normal operating environment, but we can make no assurances as to the degree to which our historical seasonal patterns will occur in 2017 and beyond, if at all.
We may be unable to obtain suitable bonding for the development of our housing projects.
We are often required to provide bonds to governmental authorities and others to ensure the completion of our projects. As a result of market conditions, surety providers have been reluctant to issue new bonds and some providers are requesting credit enhancements (such as cash deposits or letters of credit) in order to maintain existing bonds or to issue new bonds. If we are unable to obtain required bonds in the future for our projects, or if we are required to provide credit enhancements with respect to our current or future bonds, our business, prospects, liquidity, financial condition and results of operations could be materially and adversely affected.
Inflation could adversely affect our business and financial results.
Inflation could adversely affect us by increasing the costs of land, raw materials and labor needed to operate our business. If our markets have an oversupply of homes relative to demand, we may be unable to offset any such increases in costs with corresponding higher sales prices for our homes. Inflation typically also accompanies higher interests rates, which could adversely impact potential customers’ ability to obtain financing on favorable terms, thereby further decreasing demand. If we are unable to raise the prices of our homes to offset the increasing costs of our operations, our margins could decrease. Furthermore, if we need to lower the price of our homes to meet demand, the value of our land inventory may decrease. Inflation may also raise our costs of capital and decrease our purchasing power, making it more difficult to maintain sufficient funds to operate our business.
A major health and safety incident relating to our business could be costly in terms of potential liabilities and reputational damage.
Building sites are inherently dangerous, and operating in the homebuilding industry poses certain inherent health and safety risks to those working at such sites. Due to health and safety regulatory requirements and the number of projects we work on, health and safety performance is critical to the success of all areas of our business. Any failure in health and safety performance may result in penalties for non-compliance with relevant regulatory requirements or litigation, and a failure that results in a major or significant health and safety incident is likely to be costly in terms of potential liabilities incurred as a result. Such a failure could generate significant negative publicity and have a corresponding impact on our reputation, our relationships with relevant regulatory agencies, governmental authorities and local communities, and our ability to win new business, which in turn could have a material adverse effect on our business, prospects, liquidity, financial condition and results of operations.
Negative publicity or poor relations with the residents of our communities could negatively impact sales, which could cause our revenues or results of operations to decline.
Unfavorable media related to our industry, company, brands, marketing, personnel, operations, business performance, or prospects may affect our stock price and the performance of our business, regardless of its accuracy or inaccuracy. Our success in maintaining, extending and expanding our brand image depends on our ability to adapt to a rapidly changing media environment. Adverse publicity or negative commentary on social media outlets, such as blogs, websites or newsletters, could hurt operating results, as consumers might avoid or protest brands that receive bad press or negative reviews. Negative publicity may result in a decrease in our operating results.
16
In addition, residents of communities we develop may look to us to resolve issues or disputes that may arise in connection with the operation or development of their communities. Efforts made by us to resolve these issues or disputes could be deemed unsatisfactory by the affected residents, and subsequent actions by these residents could adversely affect sales or our reputation.
An information systems interruption or breach in security could adversely affect us.
Privacy, security, and compliance concerns have continued to increase as technology has evolved. We rely on accounting, financial and operational management information systems to conduct our operations. Any disruption in these systems could adversely affect our ability to conduct our business. Furthermore, as part of our normal business activities, we collect and store certain confidential information, including information about employees, vendors and suppliers. This information is entitled to protection under a number of regulatory regimes. We may share some of this information with vendors who assist us with certain aspects of our business. Our failure to maintain the security of the data which we are required to protect, including via the penetration of our network security and the misappropriation of confidential and personal information, could result in business disruption, damage to our reputation, financial obligations to third parties, fines, penalties, regulatory proceedings and private litigation with potentially large costs, and also result in deterioration in customers confidence in us and other competitive disadvantages, and thus could have a material adverse impact on our financial condition and results of operations.
We may incur a variety of costs to engage in future growth or expansion of our operations or acquisitions of businesses, and the anticipated benefits may never be realized.
As a part of our business strategy, we may consider growth or expansion of our operations in our current markets or in other areas of the country. For example, in 2016 we expanded or operations to the Phoenix metro area. Any such growth or expansion would be accompanied by risks such as:
• | difficulties in assimilating the operations and personnel of acquired companies or businesses; |
• | potential loss of key employees of the acquired companies or business; |
• | diversion of our management’s attention from ongoing business concerns; |
• | our potential inability to maximize our financial and strategic position through the successful expansion or acquisition; |
• | impairment of existing relationships with employees, contractors, suppliers and customers as a result of the integration of new management personnel and cost-saving initiatives; and |
• | risks associated with entering markets in which we have limited or no direct experience. |
The magnitude, timing and nature of any future acquisition or expansion will depend on a number of factors, including our ability to identify suitable additional markets or acquisition candidates. We cannot guarantee that any expansion into a new market will be successfully executed, and our failure to do so could harm our current business.
Water shortages or price increases could adversely impact our operations.
Certain of the areas in which we operate, particularly in Southern California and Northern California, have experienced significant increases in water costs due to drought. In addition, our communities in these locations are susceptible to government regulations and laws that restrict our water usage or increase our costs. These restrictions and costs may significantly restrict our business activities and cause us to incur significant liabilities and operating expenses. In addition, water restrictions, drought conditions and rate increases may adversely affect the local economies in which we operate, which may reduce demand for housing in our markets.
A reduction in our sales absorption levels may force us to incur and absorb additional community-level costs.
We incur certain overhead costs associated with our communities, such as indirect construction costs, marketing expenses and costs associated with the upkeep and maintenance of our model and sales complexes. If our sales absorptions pace decreases and the time required to close out our communities is extended, we would likely incur additional overhead costs, which would negatively impact our financial results. Additionally, we incur various land development improvement costs for a community prior to the commencement of home construction. Such costs include infrastructure, utilities, taxes and other related expenses. Reduction in home absorption rates increases the associated holding costs and extends our time to recover such costs. Declines in the homebuilding market may also require us to evaluate the recoverability of costs relating to land acquired more recently.
17
Future terrorist attacks against the United States or increased domestic or international instability could have an adverse effect on our operations.
Future terrorist attacks against the United States or any foreign country or increased domestic or international instability could cause consumer unease, which could significantly reduce the number of new contracts signed, increase the number of cancellations of existing contracts, and/or increase our operating expenses, which could adversely affect our business.
Risks Related to Laws and Regulations
Mortgage financing, interest rate increases or changes in federal lending programs or other regulations could lower demand for or impact homebuyers’ ability to purchase our homes, which could materially and adversely affect us.
Substantially all purchasers of our homes finance their acquisitions with mortgage financing. Rising interest rates, decreased availability of mortgage financing or of certain mortgage programs, higher down payment requirements, increased monthly mortgage costs, tightened credit requirements and underwriting standards, and an increase in indemnity claims for mortgages may lead to reduced demand for our homes and mortgage loans. Deterioration in credit quality among subprime and other nonconforming loans has caused most lenders to eliminate subprime mortgages and most other loan products that do not conform to Federal National Mortgage Association, or Fannie Mae, Federal Home Loan Mortgage Corporation, or Freddie Mac, Federal Housing Administration, or FHA, or Veterans Administration, or the VA, standards. In addition, as a result of the turbulence in the credit markets and mortgage finance industry during the last downturn, in July 2010, the Dodd-Frank Wall Street Reform and Consumer Protection Act was signed into law. This legislation provides for a number of new requirements relating to residential mortgages and mortgage lending practices that reduce the availability of loans to borrowers or increase the costs to borrowers to obtain such loans. Fewer loan products and tighter loan qualifications, in turn, make it more difficult for a borrower to finance the purchase of a new home or the purchase of an existing home from a potential “move-up” buyer who wishes to purchase one of our homes. The foregoing may also hinder our ability to realize our backlog because our home purchase contracts provide customers with a financing contingency. Financing contingencies allow customers to cancel their home purchase contracts in the event that they cannot arrange for adequate financing. As a result, rising interest rates, stricter underwriting standards, and a reduction of loan products, among other similar factors, can decrease our home sales. Any of these factors could have a material adverse effect on our business, prospects, liquidity, financial condition and results of operations.
The federal government has also taken on a significant role in supporting mortgage lending through its conservatorship of Fannie Mae and Freddie Mac, both of which purchase home mortgages and mortgage-backed securities originated by mortgage lenders, and its insurance of mortgages originated by lenders through the FHA and the VA. The availability and affordability of mortgage loans, including interest rates for such loans, could be adversely affected by a curtailment or cessation of the federal government’s mortgage-related programs or policies. The FHA may continue to impose stricter loan qualification standards, raise minimum down payment requirements, impose higher mortgage insurance premiums and other costs, or limit the number of mortgages it insures. Due to federal budget deficits, the U.S. Treasury may not be able to continue supporting the mortgage-related activities of Fannie Mae, Freddie Mac, the FHA and the VA at present levels, or it may revise significantly the federal government’s participation in and support of the residential mortgage market. Because the availability of Fannie Mae, Freddie Mac, FHA and VA-backed mortgage financing is an important factor in marketing and selling many of our homes, any limitations, restrictions or changes in the availability of such government-backed financing could reduce our home sales, which could have a material adverse effect on our business, prospects, liquidity, financial condition and results of operations.
Changes in tax laws can increase the after tax cost of owning a home, and further tax law changes or government fees could adversely affect demand for the homes we build or increase our costs.
Under current tax law certain significant expenses of owning a home, including mortgage loan interest costs and real estate taxes, generally are deductible expenses for the purpose of calculating an individual’s federal, and in some cases state, tax liability. However, the American Taxpayer Relief Act of 2012, which was signed into law in January 2013, resulted in higher income tax rates and limits the amount of mortgage interest individuals can deduct in computing their income tax liability. The limit on deductibility of mortgage interest can increase the after-tax cost of owning a home for some individuals.
Any additional increases in personal income tax rates and/or additional tax deduction limits could adversely impact demand for new homes, including homes we build, which could adversely affect our results of operations. Furthermore, increases in real estate taxes and other local government fees, such as fees imposed on developers to fund schools, open space, and road improvements, and/or provide low- and moderate-income housing, could increase our costs and have an adverse effect on our
18
operations. In addition, increases in local real estate taxes could adversely affect our potential home buyers, who may consider those costs in determining whether to make a new home purchase and decide, as a result, not to purchase one of our homes.
New and existing laws and regulations or other governmental actions may increase our expenses, limit the number of homes that we can build or delay the completion of our projects.
We are subject to numerous local, state, federal and other statutes, ordinances, rules and regulations concerning zoning, development, building design, construction and similar matters which impose restrictive zoning and density requirements, which can limit the number of homes that can be built within the boundaries of a particular area. Projects that are not entitled may be subjected to periodic delays, changes in use, less intensive development or elimination of development in certain specific areas due to government regulations. We may also be subject to periodic delays or may be precluded entirely from developing in certain communities due to building moratoriums or “slow-growth” or “no-growth” initiatives that could be implemented in the future. Local governments also have broad discretion regarding the imposition of development fees, assessments and exactions for projects in their jurisdiction. Projects for which we have received land use and development entitlements or approvals may still require a variety of other governmental approvals and permits during the development process and can also be impacted adversely by unforeseen health, safety and welfare issues, which can further delay these projects or prevent their development. As a result, home sales could decline and costs could increase, which could have a material adverse effect on our business, prospects, liquidity, financial condition and results of operations.
We are subject to environmental laws and regulations, which may increase our costs, limit the areas in which we can build homes and delay completion of our projects.
We are subject to a variety of local, state, federal and other statutes, ordinances, rules and regulations concerning the environment. The particular environmental laws which apply to any given property vary according to multiple factors, including the property’s location, its environmental conditions and geographic attributes, the present and former uses of the property, the presence or absence of endangered plants or animals or sensitive habitats, as well as conditions at nearby properties. Environmental laws and conditions may result in delays, may cause us to incur substantial compliance and other costs and can prohibit or severely restrict development and homebuilding activity in environmentally sensitive regions or areas. For example, under certain environmental laws and regulations, third parties, such as environmental groups or neighborhood associations, may challenge the permits and other approvals required for our projects and operations. Any such claims may adversely affect our business, prospects, liquidity, financial condition and results of operations. Insurance coverage for such claims may be limited or non-existent.
In addition, in those cases where an endangered or threatened species is involved and agency rulemaking and litigation are ongoing, the outcome of such rulemaking and litigation can be unpredictable, and at any time can result in unplanned or unforeseeable restrictions on or even the prohibition of development in identified environmentally sensitive areas. From time to time, the EPA and similar federal, state or local agencies review land developers’ and homebuilders’ compliance with environmental laws and may levy fines and penalties for failure to strictly comply with applicable environmental laws, including those applicable to control or storm water discharges during construction, or impose additional requirements for future compliance as a result of past failures. Any such actions taken with respect to us may increase our costs and result in project delays. We expect that increasingly stringent requirements will be imposed on land developers and homebuilders in the future. Environmental regulations can also have an adverse impact on the availability and price of certain raw materials such as lumber, and on other building materials.
California is especially susceptible to restrictive government regulations and environmental laws. For example, California imposes notification obligations respecting environmental conditions, sometimes recorded on deeds, and also those required to be delivered to persons accessing property or to home buyers or renters, which may cause some persons, or their financing sources, to view the subject parcels as less valuable or as impaired. California has also enacted so-called “climate change” legislation, which could result in additional costs to achieve energy use or energy efficiency mandates, alter community layouts, meet “green building” standards and impose carbon or other greenhouse gas reductions or offset obligations, and could result in other costs or obligations as well.
Under various environmental laws, current or former owners of real estate, as well as certain other categories of parties, may be required to investigate and clean up hazardous or toxic substances or petroleum product releases, and may be held liable to a governmental entity or to third parties for related damages, including for bodily injury, and for investigation and clean-up costs incurred by such parties in connection with the contamination. A mitigation system may be installed during the construction of a home if a cleanup does not remove all contaminants of concern or to address a naturally occurring condition such as methane. Some buyers may not want to purchase a home with a mitigation system. Many of the agreements pursuant to which we purchase land for development provide that we purchase the land “as is” and that the seller of the land makes no representation as to the existence of any environmental contaminants. Accordingly, we have to rely on our own investigation as
19
to the existence of environmental contaminants, and we may not be able to identify all pre-existing environmental contaminants at the time we purchase the land.
Legislation relating to energy and climate change could increase our costs to construct homes.
There is a variety of new legislation being enacted, or considered for enactment at the federal, state and local level relating to energy and climate change. This legislation relates to items such as carbon dioxide emissions control and building codes that impose energy efficiency standards. New building code requirements that impose stricter energy efficiency standards could significantly increase our cost to construct homes. As climate change concerns continue to grow, legislation and regulations of this nature are expected to continue and become more costly to comply with. Similarly, energy-related initiatives affect a wide variety of companies throughout the United States and the world and because our operations are heavily dependent on significant amounts of raw materials, such as lumber, steel, and concrete, they could have an indirect adverse impact on our operations and profitability to the extent the manufacturers and suppliers of our materials are burdened with expensive cap and trade and similar energy-related regulations.
Risks Related to Financing and Indebtedness
Difficulty in obtaining sufficient capital could prevent us from acquiring land for our developments or increase costs and delays in the completion of our development projects.
The homebuilding and land development industry is capital-intensive and requires significant up-front expenditures to acquire land parcels and complete development. We cannot assure you that we will maintain cash reserves and generate sufficient cash flow from operations in an amount to enable us to service our debt or to fund other liquidity needs. Additionally, while we have a $260 million unsecured revolving credit facility designed to provide us with a source of liquidity, our ability and capacity to borrow under the facility is limited by our ability to meet the covenants of the facility. If our credit facility and internally generated funds are insufficient to cover our liquidity needs, we may seek additional capital in the form of equity or debt financing from a variety of potential sources, including additional bank financings, formation of joint venture relationships or securities offerings. The availability of borrowed funds, especially for land acquisition and construction financing, may be greatly reduced nationally, and the lending community may require increased amounts of equity to be invested in a project by borrowers in connection with both new loans and the extension of existing loans. If we are required to seek additional financing to fund our operations, continued volatility in these markets may restrict our flexibility to access such financing. If we are not successful in obtaining sufficient capital to fund our planned capital and other expenditures, we may be unable to acquire land for our housing developments or to develop the land and construct homes. Additionally, if we cannot obtain additional financing to fund the purchase of land under our option contracts or purchase contracts, we may incur contractual penalties and fees. Any difficulty in obtaining sufficient capital for planned development expenditures could also cause project delays, which could increase our costs. Furthermore, if additional funds are raised through the issuance of stock, dilution to stockholders could result. If additional funds are raised through the incurrence of debt, we will incur increased debt servicing costs and may become subject to additional restrictive financial and other covenants. We can give no assurance as to the terms or availability of additional capital. If we are not successful in obtaining or refinancing capital when needed, it could adversely impact our ability to operate our business effectively, which could reduce our sales and earnings, and adversely impact our financial position.
Our level of indebtedness may adversely affect our financial position and prevent us from fulfilling our debt obligations.
Due to the capital-intensive nature of the homebuilding business, we incur substantial indebtedness to finance our homebuilding activities. As of December 31, 2016, we had approximately $260.0 million in loan commitments, of which $118.0 million was outstanding. There can be no assurance we would be able to obtain such additional capital on terms acceptable to us, if at all.
Incurring substantial debt could subject us to many risks that, if realized, would adversely affect us, including the risk that:
• | our cash flow from operations may be insufficient to make required payments of principal of and interest on the debt, which is likely to result in acceleration of the maturity of such debt; |
• | our debt may increase our vulnerability to adverse economic and industry conditions with no assurance that investment yields will increase with higher financing costs; |
• | we would be required to dedicate a portion of our cash flow from operations to payments on our debt, thereby reducing funds available for other purposes such as land and lot acquisition, development and construction activities; and |
20
• | we may be put at a competitive disadvantage and reduce our flexibility in planning for, or responding to, changing conditions in our industry, including increased competition. |
We expect to pay our expenses and to pay the principal and interest on our indebtedness with cash flow from operations or from existing working capital. Our ability to meet our expenses depends, to a large extent, on our future performance, which will be affected by financial, business, economic and other factors. We will not be able to control many of these factors, such as economic conditions in the markets where we operate and pressure from competitors. If we do not have sufficient funds, we may be required to refinance all or part of our existing debt, sell assets or borrow additional funds. We cannot guarantee that we will be able to do so on terms acceptable to us, if at all. If we are unable to refinance our debt on acceptable terms, we may be forced to dispose of our assets on disadvantageous terms, potentially resulting in losses. To the extent we cannot meet any future debt service obligations, we may lose some or all of our assets that may be pledged to secure our obligations to foreclosure. Also, debt agreements may contain specific cross-default provisions with respect to specified other indebtedness, giving the lenders the right to declare a default if we are in default under other loans in some circumstances. Defaults under our debt agreements could have a material adverse effect on our business, prospects, liquidity, financial condition and results of operations.
We currently have significant amounts invested in unconsolidated joint ventures with independent third parties in which we have less than a controlling interest. These investments are highly illiquid and have significant risks due to, in part, a lack of sole decision-making authority and reliance on the financial condition and liquidity of our joint venture partners.
We own interests in various joint ventures and as of December 31, 2016, our investments in and advances to our unconsolidated joint ventures was $50.9 million. We have entered into joint ventures in order to acquire attractive land positions, to manage our risk profile and to leverage our capital base. We may enter into additional joint ventures in the future, thereby reducing the amount of capital required by us to make investments and diversifying our capital sources for growth. Such joint venture investments involve risks not otherwise present in wholly owned projects, including the following:
• | Control and Partner Dispute Risk. We do not have exclusive control over the development, financing, management and other aspects of the project or joint venture, which may prevent us from taking actions that are in our best interest but opposed by our partners. We cannot exercise sole decision-making authority regarding the project or joint venture, which could create the potential risk of creating impasses on decisions, such as acquisitions or sales. Disputes between us and our partners may result in litigation or arbitration that would increase our expenses and prevent our officers and directors from focusing their time and efforts on our business and could result in subjecting the projects owned by the joint venture to additional risk. Our existing joint venture agreements contain, and any future joint venture agreements may contain, buy-sell provisions pursuant to which one partner may initiate procedures requiring the other partner to choose between buying the other partner’s interest or selling its interest to that partner; we may not have the capital to purchase our joint venture parties’ interest under these circumstances even if we believe it would be beneficial to do so. |
• | Covenant Compliance Risk. Our Senior Unsecured Revolving Credit Facility prohibits us from making investments in and advances to joint ventures when we are unable to meet certain financial covenants, including the adjusted leverage ratio. If we become unable to fund our joint venture obligations this could result in, among other things, defaults under our joint venture operating agreements, loan agreements, and credit enhancements. And, our failure to satisfy our joint venture obligations could also affect our joint venture's ability to carry out its operations or strategy which could impair the value of our investment in the joint venture. |
• | Development Risk. Typically, we serve as the administrative member, managing member, or general partner of our joint ventures and one of our subsidiaries acts as the general contractor while our joint venture partner serves as the capital provider. Due to our respective role in these joint ventures, we may become liable for obligations beyond our proportionate equity share. In addition, the projects we build through joint ventures are often larger and have a longer time horizon than the typical project developed by our wholly owned homebuilding operations. Time delays associated with obtaining entitlements, unforeseen development issues, unanticipated labor and material cost increases, higher carrying costs, and general market deterioration and other changes are more likely to impact larger, long-term projects, all of which may negatively impact the profitability of these ventures and our proportionate share of income. |
• | Financing Risk. There are generally a limited number of sources willing to provide acquisition, development and construction financing to land development and homebuilding joint ventures. During difficult market conditions, it may be difficult or impossible to obtain financing for our joint ventures on commercially reasonable terms, or to refinance existing joint venture borrowings as such borrowings mature. In addition, a partner may fail to fund its share of required capital contributions or may become bankrupt, which generally would cause us and any other remaining partners to remain liable for the joint venture’s liabilities, As a result, we may be required to contribute our corporate |
21
funds to the joint venture to finance acquisition and development and/or construction costs following termination or step-down of joint venture financing that the joint venture is unable to restructure, extend, or refinance with another third party lender. In addition, our ability to contribute our funds to or for the joint venture may be limited if we do not meet the credit facility conditions discussed above.
• | Contribution Risk. Under credit enhancements that we typically provide with respect to joint venture borrowings, we and our partners could be required to make additional unanticipated investments in and advances to these joint ventures, either in the form of capital contributions or loan repayments, to reduce such outstanding borrowings. We may have to make additional contributions that exceed our proportional share of capital if our partners fail to contribute any or all of their share. While in most instances we would be able to exercise remedies available under the applicable joint venture documentation if a partner fails to contribute its proportional share of capital, our partner's financial condition may preclude any meaningful cash recovery on the obligation. See Item 7, “Management’s Discussion and Analysis of Financial Condition and Results of Operations-Liquidity and Capital Resources-Off-Balance Sheet Arrangements and Contractual Obligations” and Note 11 to the Consolidated Financial Statements for more information on LTV maintenance agreements and completion guaranties. |
• | Completion Risk. We often sign a completion agreement in connection with obtaining financing for our joint ventures. Under such agreements, we may be compelled to complete a project even if we no longer have an economic interest in the joint venture or the joint venture no longer has an interest in the property. |
• | Illiquid Investment Risk. We lack a controlling interest in our joint ventures and therefore are generally unable to compel our joint ventures to sell assets, return invested capital, require additional capital contributions or take any other action without the vote of at least one or more of our venture partners. This means that, absent partner agreement, we may not be able to liquidate our joint venture investments to generate cash. |
• | Consolidation Risk. The accounting rules for joint ventures are complex and the decision as to whether it is proper to consolidate a joint venture onto our balance sheet is fact intensive. If the facts concerning an unconsolidated joint venture were to change and a triggering event under applicable accounting rules were to occur, we might be required to consolidate previously unconsolidated joint ventures onto our balance sheet which could adversely impact our leverage and other financial conditions or covenants. |
Any of the above might subject a project to liabilities in excess of those contemplated and adversely affect the value of our current and future joint venture investments.
Our current financing arrangements contain, and our future financing arrangements likely will contain, restrictive covenants relating to our operations.
Our current financing arrangements contain, and the financing arrangements we enter into in the future likely will contain, covenants (financial and otherwise) affecting our ability to incur additional debt, make certain investments or acquisitions, reduce liquidity below certain levels, make distributions to our stockholders, deviate from our core business and operating policies. If we fail to meet or satisfy any of these covenants in our debt agreements, we would be in default under these agreements, which could result in a cross-default under other debt agreements, and our lenders could elect to declare outstanding amounts due and payable, terminate their commitments, require the posting of additional collateral and enforce their respective interests against existing collateral. A default also could limit significantly our financing alternatives, which could cause us to curtail our investment activities or dispose of assets when we otherwise would not choose to do so. A default on any of our debt agreements could materially and adversely affect our business, prospects, liquidity, financial condition and results of operations.
Interest expense on debt we incur may limit our cash available to fund our growth strategies.
As of December 31, 2016, we had approximately $260.0 million in loan commitments, of which $118.0 million was outstanding. As part of our financing strategy, we may incur a significant amount of additional debt. Our current debt has, and any additional debt we subsequently incur may have, a floating rate of interest. In addition, we may incur fixed rate debt in the future which may be at a higher interest rate than our floating rate debt. Higher interest rates could increase debt service requirements on our current floating rate debt and on any floating or fixed rate debt we subsequently incur, and could reduce funds available for operations, future business opportunities or other purposes. If we need to repay existing debt during periods of rising interest rates, we could be required to refinance our then-existing debt on unfavorable terms or liquidate one or more of our assets to repay such debt at times which may not permit realization of a favorable return on such assets and could result in a loss. The occurrence of either such event or both could materially and adversely affect our business, prospects, liquidity, financial condition and results of operations.
22
Risks Related to Our Organization and Structure
We have a limited operating history and we may not be able to successfully operate our business.
Our company was founded in August 2009, and through the year ended December 31, 2012, we incurred losses. In connection with our initial public offering, TNHC LLC was converted from a Delaware limited liability company into a Delaware corporation and renamed The New Home Company Inc. Given our limited operating history, you have limited historical information upon which to evaluate our prospects, including our ability to acquire desirable land parcels, develop such land and market our homes. In addition, we cannot assure you that our past experience will be sufficient to enable us to operate our business successfully or implement our operating policies and business strategies as described in this annual report on Form 10-K and in other public statements and filings made with the Securities and Exchange Commission. Furthermore, we may not be able to generate sufficient operating cash flows to pay our operating expenses or service our indebtedness. You should not rely upon the past performance of our management team, as past performance may not be indicative of our future results.
We are and will continue to be dependent on key personnel and certain members of our management team.
Our success depends to a significant degree upon the contributions of certain key personnel including, but not limited to, our Chief Executive Officer, Chief Operating Officer, Chief Financial Officer and Chief Investment Officer each of whom would be difficult to replace. Although we have entered into employment agreements with our executive officers, there is no guarantee that these executives will remain employed with us. If any of our key personnel were to cease employment with us, our operating results could suffer. Our ability to retain our key personnel or to attract suitable replacements should any members of our management team leave depends on the competitive nature of the employment market. The loss of services from key personnel or a limitation in their availability could materially and adversely impact our business, prospects, liquidity, financial condition and results of operations. Further, such a loss could be negatively perceived in the capital markets. We have not obtained key person life insurance that would provide us with proceeds in the event of death or disability of any of our key personnel.
Our charter, bylaws, stockholders' rights agreement and debt covenants could prevent a third party from acquiring us or limit the price that investors might be willing to pay for shares of our common stock.
Provisions of the Delaware General Corporation Law, our certificate of incorporation and our bylaws could have the effect of making it more difficult for a third party to acquire, or of discouraging a third party from attempting to acquire, control of us. These provisions could delay or prevent a change in control of and could limit the price that investors might be willing to pay in the future for shares of our common stock.
Our Board of Directors is divided into three classes, with the term of one class expiring each year, which could delay a change in our control. Our certificate of incorporation also authorizes our Board of Directors to issue new series of common stock and preferred stock without stockholder approval. Depending on the rights and terms of any new series created, and the reaction of the market to the series, rights of existing stockholders could be negatively affected. For example, subject to applicable law, our Board of Directors could create a series of common stock or preferred stock with preferential rights to dividends or assets upon liquidation, or with superior voting rights to our existing common stock. The ability of our Board of Directors to issue these new series of common stock and preferred stock could also prevent or delay a third party from acquiring us, even if doing so would be beneficial to our stockholders.
We are also subject to the anti-takeover provisions of Section 203 of the Delaware General Corporation Law, which prohibits Delaware corporations from engaging in business combinations specified in the statute with an interested stockholder, as defined in the statute, for a period of three years after the date of the transaction in which the person first becomes an interested stockholder, unless the business combination is approved in advance by a majority of the independent directors or by the holders of at least two-thirds of the outstanding disinterested shares. The application of Section 203 of the Delaware General Corporation Law could also have the effect of delaying or preventing a change of control of us.
The obligations associated with being a public company require significant resources and management attention.
Section 404 of the Sarbanes-Oxley Act of 2002, or the Sarbanes Oxley Act, requires annual management assessments of the effectiveness of our internal control over financial reporting and generally requires in the same report a report by our independent registered public accounting firm on the effectiveness of our internal control over financial reporting. However, under the recently enacted JOBS Act, our independent registered public accounting firm will not be required to attest to the effectiveness of our internal control over financial reporting pursuant to Section 404 of the Sarbanes-Oxley Act until we are no longer an "emerging growth company." We could be an "emerging growth company" until the end of our 2019 fiscal year. The
23
rules governing the standards that must be met for our management to assess our internal control over financial reporting are complex and require significant documentation, testing and possible remediation.
We may encounter problems or delays in completing the implementation of any necessary improvements and receiving an unqualified opinion on the effectiveness of the internal controls over financial reporting in connection with the attestation provided by our independent registered public accounting firm. If we cannot favorably assess the effectiveness of our internal control over financial reporting, or if our independent registered public accounting firm is unable to provide an unqualified attestation report on our internal controls, investors could lose confidence in our financial information and the price of our common stock could decline.
As we transition from our status as “an emerging growth company,” we may need to upgrade our systems or create new systems, implement additional financial and management controls, reporting systems and procedures, create or outsource an internal audit function, and hire additional accounting and finance staff. If we are unable to accomplish these objectives in a timely and effective fashion, our ability to comply with the financial reporting requirements and other rules that apply to reporting companies could be impaired. Any failure to maintain effective internal control over financial reporting could have a material adverse effect on our business, prospects, liquidity, financial condition and results of operations.
Failure of our internal control over financial reporting could adversely affect our business and financial results.
Our management is responsible for establishing and maintaining effective internal control over financial reporting under Section 404 of the Sarbanes-Oxley Act. Internal control over financial reporting is a process to provide reasonable assurance regarding the reliability of financial reporting for external purposes in accordance with GAAP. Because of its inherent limitations, internal control over financial reporting is not intended to provide absolute assurance that we would prevent or detect a misstatement of our financial statements or fraud. Any failure to maintain an effective system of internal control over financial reporting could limit our ability to report our financial results accurately and timely or to detect and prevent fraud. The identification of a material weakness could indicate a lack of controls adequate to generate accurate financial statements that, in turn, could cause a loss of investor confidence and decline in the market price of our common stock. We cannot assure you that we will be able to timely remediate any material weaknesses that may be identified in future periods or maintain all of the controls necessary for continued compliance. Likewise, we cannot assure you that we will be able to retain sufficient skilled finance and accounting personnel, especially in light of the increased demand for such personnel among publicly traded companies.
We are an “emerging growth company”, and, as a result of the reduced disclosure and governance requirements applicable to emerging growth companies, our common stock may be less attractive to investors.
We are an “emerging growth company,” as defined in the JOBS Act, and we are eligible to take advantage of certain exemptions from various reporting requirements applicable to other public companies but not to emerging growth companies, including, but not limited to, an exemption from the auditor attestation requirement of Section 404 of the Sarbanes-Oxley Act, reduced disclosure about executive compensation arrangements pursuant to the rules applicable to smaller reporting companies and no requirement to seek non-binding advisory votes on executive compensation or golden parachute arrangements. We have elected to adopt these reduced disclosure requirements. We could be an emerging growth company until the last day of the fiscal year following the fifth anniversary of the completion of our initial public offering, although a variety of circumstances could cause us to lose that status earlier. We cannot predict whether investors will find our common stock less attractive as a result of our taking advantage of these exemptions. If some investors find our common stock less attractive as a result of our choices, there may be a less active trading market for our common stock and our stock price may be more volatile.
Risks Related to Ownership of Our Common Stock
The price of our Common Stock is subject to volatility and our trading volume is relatively low.
The market price of our common stock may be highly volatile and subject to wide fluctuations. Compared to other public homebuilders, we believe we have relatively low trading volume. Because of this limited trading volume, purchases and sales of large numbers of our shares may cause rapid price swings in our stock. In addition, our financial performance, government regulatory action, tax laws, additions or departures of key personnel, interest rates and market conditions in general could have a significant impact on the future market price of our common stock.
24
If securities or industry analysts do not publish, or cease publishing, research or reports about us, our business or our market, or if they change their recommendations regarding our common stock adversely, our stock price and trading volume could decline.
The trading market for our common stock is influenced by whether industry or securities analysts publish research and reports about us, our business, our market or our competitors and, if any analysts do publish such reports, what they publish in those reports. Any analysts who do cover us may make adverse recommendations regarding our common stock, adversely change their recommendations from time to time or provide more favorable relative recommendations about our competitors. If any analyst who cover us now or may cover us in the future were to cease coverage of our company or fail to regularly publish reports on us, we could lose visibility in the financial markets, which in turn could cause our stock price or trading volume to decline.
We do not intend to pay dividends on our common stock for the foreseeable future.
We currently intend to retain our future earnings to finance the development and expansion of our business and, therefore, do not intend to pay cash dividends on our common stock for the foreseeable future. Any future determination to pay dividends will be at the discretion of our board of directors and will depend on our financial condition, results of operations, capital requirements, restrictions contained in any financing instruments, applicable legal requirements and such other factors as our board of directors deems relevant. Accordingly, stockholders may need to sell their shares of our common stock to realize a return on investment, and may not be able to sell shares at or above the price paid for them.
Certain stockholders have rights to cause our Company to undertake securities offerings. Future sales of our common stock or other securities convertible into our common stock could cause the market value of our common stock to decline and could result in dilution of your shares.
Our board of directors is authorized, without stockholder approval, to cause us to issue additional shares of our common stock or to raise capital through the issuance of preferred stock, securities (including debt securities) convertible into common stock, options, warrants and other rights, on terms and for consideration as our board of directors in its sole discretion may determine. Sales of substantial amounts of our common stock could cause the market price of our common stock to decrease significantly. We cannot predict the effect, if any, of future sales of our common stock, or other securities on the value of our common stock. Sales of substantial amounts of our common stock by a large stockholder or otherwise, or the perception that such sales could occur, may adversely affect the market price of our common stock.
We entered into a registration rights agreement with the members of TNHC LLC, including the members of our management team and the institutional investors in TNHC LLC, with respect to the shares of our common stock that they received as part of our formation transactions. We refer to these shares collectively as the “registrable shares.” Pursuant to the registration rights agreement, we have granted the members of TNHC LLC and their direct and indirect transferees shelf registration rights requiring us to file a shelf registration statement and to maintain the effectiveness of such registration statement so as to allow sales thereunder from time to time, demand registration rights to have the registrable shares registered for resale, and, in certain circumstances, the right to “piggy-back” the registrable shares in registration statements we might file in connection with any future public offering.
Future offerings of debt securities, which would rank senior to our common stock upon our bankruptcy or liquidation, and future offerings of equity securities that may be senior to our common stock for the purposes of dividend and liquidating distributions, may adversely affect the market price of our common stock.
In the future, we may attempt to increase our capital resources by conducting offerings of debt securities or additional offerings of equity securities. Upon bankruptcy or liquidation, holders of our debt securities and shares of preferred stock and lenders with respect to other borrowings will receive a distribution of our available assets prior to the holders of our common stock. Additional equity offerings may dilute the holdings of our existing stockholders or reduce the market price of our common stock, or both. Our preferred stock, if issued, could have a preference on liquidating distributions or a preference on dividend payments or both that could limit our ability to make a dividend distribution to the holders of our common stock. Our decision to issue securities in any future offering will depend on market conditions and other factors beyond our control. As a result, we cannot predict or estimate the amount, timing or nature of our future offerings, and purchasers of our common stock bear the risk of our future offerings reducing the market price of our common stock and diluting their ownership interest in our company.
25
Item 1B. | Unresolved Staff Comments |
Not Applicable.
Item 2. | Properties |
We lease our corporate headquarters in Aliso Viejo, California. The lease on this facility consists of approximately 18,700 square feet and expires in November 2020. In addition, we lease divisional offices in Northern California, Southern California and Arizona, including approximately 4,800 square feet through May 2020 in Roseville, approximately 7,700 square feet through September 2021 in Walnut Creek, approximately 1,400 square feet through July 2018 in Agoura Hills and approximately 2,000 square feet through January 2018 in Scottsdale. For information on land owned and controlled by us and our joint ventures for use in our homebuilding activities, please refer to Item 7, "Management's Discussion and Analysis of Financial Condition and Results of Operations - Lots Owned and Controlled", "- Equity in Net Income of Unconsolidated Joint Ventures" and "- Off-Balance Sheet Arrangements and Contractual Obligations - Joint Ventures".
Item 3. | Legal Proceedings |
We are involved in various claims and litigation arising in the ordinary course of business. We do not believe that any such claims and litigation will have a material adverse effect upon our results of operations or financial position.
Item 4. | Mine Safety Disclosures |
Not Applicable.
PART II
Item 5. | Market For Registrant’s Common Equity, Related Stockholder Matters and Issuer Purchases of Equity Securities |
Our common stock is listed on the New York Stock Exchange under the ticker symbol “NWHM” and began trading on January 31, 2014. The following table sets forth the high and low intra-day sales prices per share of our common stock for the periods indicated, as reported by the NYSE.
High | Low | ||
Fiscal Year 2016 | |||
First Quarter | $12.78 | $7.51 | |
Second Quarter | $12.79 | $8.62 | |
Third Quarter | $11.28 | $8.85 | |
Fourth Quarter | $12.55 | $9.45 | |
Fiscal Year 2015 | |||
First Quarter | $16.49 | $12.91 | |
Second Quarter | $17.88 | $14.03 | |
Third Quarter | $17.97 | $12.59 | |
Fourth Quarter | $16.55 | $11.95 | |
The following performance graph shows a comparison of the cumulative total returns to stockholders of the Company’s common stock from January 31, 2014 (the date of our initial public offering, using the price of which our shares of common stock were initially sold to the public) to December 31, 2016, as compared with the Standard & Poor’s 500 Composite Stock Index and the Dow Jones Industry Group-U.S. Home Construction Index. The comparison assumes $100 was invested
26
in our common stock on January 31, 2014 and in each of the forgoing indices on January 31, 2014 and assumes the reinvestment of dividends.
The performance graph and related information shall not be deemed to be “soliciting material” or to be “filed” with the Securities and Exchange Commission, nor shall such information be incorporated by reference into any filing under the Securities Act of 1933 or Securities Exchange Act of 1934, each as amended, except to the extent that we specifically incorporate it by reference.
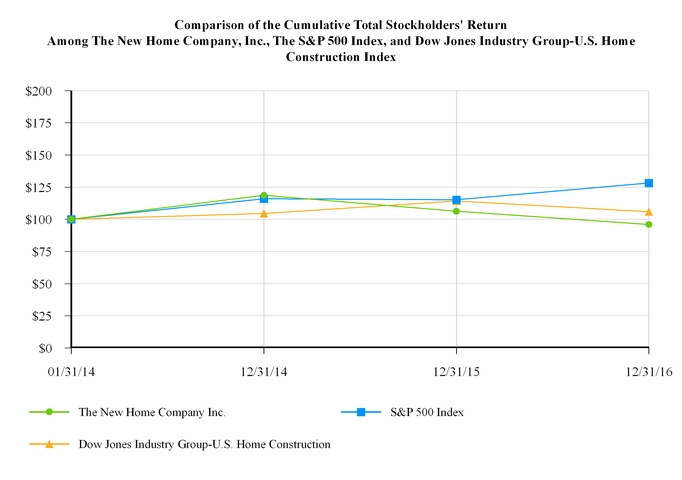
The above graph is based upon common stock and index prices calculated as of the end of each period. The stock price performance of the Company’s common stock depicted in the graph above represents past performance only and is not necessarily indicative of future performance.
As of February 17, 2017, we had 16 holders of record of our common stock. The number of holders of record is based upon the actual numbers of holders registered at such date and does not include holders of shares in "street name" or persons, partnerships, associates, corporations or other entities in security position listings maintained by depositories.
Dividends
We currently intend to retain our future earnings to finance the development and expansion of our business and, therefore, do not intend to pay cash dividends on our common stock for the foreseeable future. Any future determination to pay dividends will be at the discretion of our board of directors and will depend on our financial condition, results of operations, capital requirements, compliance with Delaware law, restrictions contained in any financing instruments, including but not limited to, our unsecured credit facility, and such other factors as our board of directors deem relevant.
Issuer Share Repurchases
We had no share repurchases during the year ended December 31, 2016.
Recent Sales of Unregistered Securities
We did not sell any unregistered securities during the year ended December 31, 2016.
27
Item 6. | Selected Financial Data |
The following sets forth our selected financial data and other operating data on a historical basis. You should read the following selected financial data in conjunction with our consolidated financial statements and the related notes, “Risk Factors” and with “Management’s Discussion and Analysis of Financial Condition and Results of Operations,” which are included elsewhere in this annual report on Form 10-K. The historical results presented below are not necessarily indicative of the results to be expected for any future period.
Year Ended December 31, | |||||||||||||||||||
2016 | 2015 | 2014 | 2013(1) | 2012(1) | |||||||||||||||
(Dollars in thousands, except per share amounts) | |||||||||||||||||||
Income Statement Data | |||||||||||||||||||
Home sales revenue | $ | 507,949 | $ | 280,209 | $ | 56,094 | $ | 35,663 | $ | 24,198 | |||||||||
Fee building revenue, including management fees | 186,507 | 149,890 | 93,563 | 47,565 | 28,269 | ||||||||||||||
Land sales revenue | — | — | — | — | 2,940 | ||||||||||||||
Total revenues | $ | 694,456 | $ | 430,099 | $ | 149,657 | $ | 83,228 | $ | 55,407 | |||||||||
Pretax income (loss): | |||||||||||||||||||
Homebuilding | $ | 25,546 | $ | 23,698 | $ | 497 | $ | 1,748 | $ | (3,045 | ) | ||||||||
Fee building | 8,404 | 10,213 | 4,506 | 5,248 | 1,764 | ||||||||||||||
Pretax income (loss) | $ | 33,950 | $ | 33,911 | $ | 5,003 | $ | 6,996 | $ | (1,281 | ) | ||||||||
Net income (loss) attributable to the Company | $ | 21,022 | $ | 21,688 | $ | 4,787 | $ | 6,706 | $ | (1,352 | ) | ||||||||
Basic earnings (loss) per share | $ | 1.02 | $ | 1.29 | $ | 0.30 | $ | 0.85 | $ | (0.27 | ) | ||||||||
Diluted earnings (loss) per share | $ | 1.01 | $ | 1.28 | $ | 0.30 | $ | 0.85 | $ | (0.27 | ) | ||||||||
Weighted Average Common Shares Outstanding: (2) | |||||||||||||||||||
Basic | 20,685,386 | 16,767,513 | 15,927,917 | 7,905,757 | 5,044,438 | ||||||||||||||
Diluted | 20,791,445 | 16,941,088 | 15,969,199 | 7,905,757 | 5,044,438 | ||||||||||||||
Balance Sheet Data | |||||||||||||||||||
Cash and cash equivalents | $ | 30,496 | $ | 45,874 | $ | 44,058 | $ | 9,541 | $ | 6,008 | |||||||||
Real estate inventories (3) | $ | 286,928 | $ | 200,636 | $ | 157,629 | $ | 44,088 | $ | 38,619 | |||||||||
Investment in and advances to unconsolidated joint ventures | $ | 50,857 | $ | 60,572 | $ | 60,564 | $ | 32,270 | $ | 12,424 | |||||||||
Total assets | $ | 419,136 | $ | 351,270 | $ | 291,958 | $ | 98,949 | $ | 64,511 | |||||||||
Total debt | $ | 118,000 | $ | 83,082 | $ | 113,751 | $ | 17,883 | $ | 16,722 | |||||||||
Stockholders’ equity (4) | $ | 244,523 | $ | 220,775 | $ | 148,084 | $ | 64,356 | $ | 35,575 | |||||||||
Stockholders' equity per common share outstanding | $ | 11.81 | $ | 10.75 | $ | 9.00 | $ | 7.45 | $ | 6.44 | |||||||||
Cash dividends declared per share | $ | — | $ | — | $ | — | $ | — | $ | — | |||||||||
Operating Data (excluding unconsolidated JVs) | |||||||||||||||||||
Net new home orders | 253 | 174 | 79 | 72 | 72 | ||||||||||||||
New homes delivered | 250 | 148 | 53 | 82 | 53 | ||||||||||||||
Average sales price of homes delivered | $ | 2,032 | $ | 1,893 | $ | 1,058 | $ | 435 | $ | 457 | |||||||||
Selling communities at end of year | 15 | 10 | 4 | 3 | 3 | ||||||||||||||
Backlog at end of year, number of homes | 79 | 67 | 41 | 15 | 26 | ||||||||||||||
Backlog at end of year, dollar value | $ | 187,296 | $ | 166,567 | $ | 86,711 | $ | 11,867 | $ | 10,593 | |||||||||
Average sales price of homes in backlog | $ | 2,371 | $ | 2,486 | $ | 2,115 | $ | 791 | $ | 407 | |||||||||
Operating Data – Fee Building Projects | |||||||||||||||||||
Homes started | 784 | 513 | 550 | 215 | 114 | ||||||||||||||
Homes delivered | 644 | 537 | 206 | 194 | 50 | ||||||||||||||
Homes under construction at end of period | 586 | 446 | 470 | 126 | 105 | ||||||||||||||
28
(1) | The Company completed its initial public offering ("IPO") on January 30, 2014. Data presented for the years prior to 2014 represent our results operating as TNHC LLC, a private company. |
(2) | The Company completed a follow-on offering on December 9, 2015 issuing and selling 4,025,000 shares of common stock at a price of $12.50 per share. |
(3) | Effective July 1, 2016, certain capitalizable selling and marketing costs were reclassified to other assets from real estate inventories. Prior year periods have been reclassified to conform to current year presentation. $9.3 million, $5.9 million, $1.3 million, $0.7 million was reclassified from real estate inventories to other assets for the years ended December 31, 2015, 2014, 2013 and 2012, respectively. For further detail, see Note 1 of the notes to our consolidated financial statements. |
(4) | For the years ended December 31, 2012 and 2013 (prior to the Company's IPO), amounts represent members' equity in TNHC LLC. |
29
Item 7. | Management’s Discussion and Analysis of Financial Condition and Results of Operations |
You should read the following in conjunction with the sections of this annual report on Form 10-K entitled “Risk Factors,” “Cautionary Note Concerning Forward-Looking Statements,” “Selected Financial Data” and “Business” and our historical financial statements and related notes thereto included elsewhere in this annual report on Form 10-K. This discussion contains forward-looking statements reflecting current expectations that involve risks and uncertainties. Actual results and the timing of events may differ materially from those contained in these forward-looking statements due to a number of factors, including those discussed in the section entitled “Risk Factors” and elsewhere in this annual report on Form 10-K.
Consolidated Financial Data
Year Ended December 31, | |||||||||||
2016 | 2015 | 2014 | |||||||||
(Dollars in thousands) | |||||||||||
Revenues: | |||||||||||
Home sales | $ | 507,949 | $ | 280,209 | $ | 56,094 | |||||
Fee building, including management fees from unconsolidated joint ventures of $8,202, $12,426 and $9,582, respectively | 186,507 | 149,890 | 93,563 | ||||||||
694,456 | 430,099 | 149,657 | |||||||||
Cost of Sales: | |||||||||||
Home sales | 433,559 | 235,232 | 46,843 | ||||||||
Home sales impairments | 2,350 | — | — | ||||||||
Land sales impairment | 1,150 | — | — | ||||||||
Fee building | 178,103 | 139,677 | 89,057 | ||||||||
615,162 | 374,909 | 135,900 | |||||||||
Gross Margin: | |||||||||||
Homes sales | 72,040 | 44,977 | 9,251 | ||||||||
Land sales | (1,150 | ) | — | — | |||||||
Fee building | 8,404 | 10,213 | 4,506 | ||||||||
79,294 | 55,190 | 13,757 | |||||||||
Homes sales | 14.2 | % | 16.1 | % | 16.5 | % | |||||
Fee building | 4.5 | % | 6.8 | % | 4.8 | % | |||||
Selling and marketing expenses | (26,744 | ) | (13,741 | ) | (3,983 | ) | |||||
General and administrative expenses | (25,882 | ) | (20,278 | ) | (12,420 | ) | |||||
Equity in net income of unconsolidated joint ventures | 7,691 | 13,767 | 8,443 | ||||||||
Other expense, net | (409 | ) | (1,027 | ) | (794 | ) | |||||
Income before income taxes | 33,950 | 33,911 | 5,003 | ||||||||
Provision for income taxes | (13,024 | ) | (12,533 | ) | (246 | ) | |||||
Net income | 20,926 | 21,378 | 4,757 | ||||||||
Net loss attributable to noncontrolling interest | 96 | 310 | 30 | ||||||||
Net income attributable to The New Home Company Inc. | $ | 21,022 | $ | 21,688 | $ | 4,787 | |||||
Overview
During 2016, the Company continued to make substantial progress in expanding its wholly owned business by increasing its ending active community count by 50% and growing its net new home orders by 45%. This solid growth in community count and order activity, combined with increased construction activity from our fee building business, resulted in a 61% year-over-year increase in our consolidated revenues to $695 million. Home sales revenue was up 81% over last year and was driven by strong delivery volume growth and higher average home prices. The higher average sales prices were largely influenced by our highly successful coastal Southern California luxury communities. We finished the year strong with over 50% of our homes sales revenue delivered in the fourth quarter and generated record pretax income of $34.0 million, which
30
was after the impact of $3.5 million in pretax inventory impairment charges. Net income attributable to the Company for 2016 was $21.0 million, or $1.01 per diluted share, compared to $21.7 million, or $1.28 per diluted share in the year earlier period. The slight decline in net income was largely due to the inventory impairment charges noted above, which represented $0.10 per diluted share on an after-tax basis, a $6.1 million reduction in our share of joint venture income, and a $4.2 million decrease in management fees from unconsolidated joint ventures. These items were substantially offset by a 61% increase in total revenues and a 170 basis point improvement in the Company’s selling, general and administrative ("SG&A") expenses as a percentage of home sales revenues.
At the same time, the Company ended the year with a solid balance sheet with a total debt-to-capital ratio of 32.5% and liquidity of approximately $173 million in the form of cash and capacity under its unsecured revolving credit facility. The Company also grew the number of lots owned and controlled by its wholly owned operations by 20% to approximately 1,600 lots, of which approximately 63% were controlled through option contracts.
We ended the year with $187.3 million in backlog value, the highest in the Company’s year-end history, and anticipate opening approximately 12 new communities in 2017. We believe this solid backlog, along with the expected new community openings scheduled throughout 2017, positions the Company well for 2017 and beyond.
While we expect 2017 will be a transition year for our company as we diversify our product portfolio with new communities at lower price points, our commitment to being the category leader in each of our product niches remains the same. As a result of this transition, we expect an increase in the number of new home deliveries and a decrease in the average selling price of our homes. We continue to be presented with attractive opportunities in California and other markets that fit into our returns-focused model, and we believe that we are poised to take advantage of these opportunities and create long-term value for our shareholders.
Results of Operations
Net New Home Orders
Year Ended December 31, | ||||||||||||||||||||
Change | Change | |||||||||||||||||||
2016 | Amount | % | 2015 | Amount | % | 2014 | ||||||||||||||
Net new home orders | ||||||||||||||||||||
Southern California | 141 | 55 | 64 | % | 86 | 42 | 95 | % | 44 | |||||||||||
Northern California | 112 | 24 | 27 | % | 88 | 53 | 151 | % | 35 | |||||||||||
Total net new home orders | 253 | 79 | 45 | % | 174 | 95 | 120 | % | 79 | |||||||||||
Selling communities at end of period | ||||||||||||||||||||
Southern California | 8 | 4 | 100 | % | 4 | 2 | 100 | % | 2 | |||||||||||
Northern California | 7 | 1 | 17 | % | 6 | 4 | 200 | % | 2 | |||||||||||
Total selling communities | 15 | 5 | 50 | % | 10 | 6 | 150 | % | 4 | |||||||||||
Monthly sales absorption rate per community | 1.7 | (0.2 | ) | (11 | )% | 1.9 | — | — | % | 1.9 | ||||||||||
Cancellation rate | 12 | % | 2 | % | NA | 10 | % | (3 | )% | NA | 13 | % | ||||||||
Net new home orders for the year ended December 31, 2016 increased 45% compared to the same period in 2015. The increase was primarily driven by an increase in the number of selling communities, which was partially offset by a slightly slower monthly sales absorption rate. Monthly sales absorption represents the number of net new home orders divided by the number of average selling communities for the period.
Net new home orders for the year ended December 31, 2015 increased 120% compared to the same period in 2014 primarily due to an increase in the number of selling communities. Our monthly sales absorption rate per community for the year ended December 31, 2015 was flat with the prior year at 1.9 per month.
The Company continued to experience a fairly modest cancellation rate in 2016 that was relatively consistent with the prior two years. We believe our cancellation rate is one of the lower rates in the industry due to many factors, including the high level of personalized options that our homebuyers select, which creates emotional attachment, and a higher proportion of affluent buyers with strong credit profiles.
31
Backlog
Year Ended December 31, | ||||||||||||||||||||||||||||||
2016 | 2015 | % Change | ||||||||||||||||||||||||||||
Homes | Dollar Value | Average Price | Homes | Dollar Value | Average Price | Homes | Dollar Value | Average Price | ||||||||||||||||||||||
(Dollars in thousands) | ||||||||||||||||||||||||||||||
Southern California | 48 | $ | 162,599 | $ | 3,387 | 45 | $ | 149,405 | $ | 3,320 | 7 | % | 9 | % | 2 | % | ||||||||||||||
Northern California | 31 | 24,697 | 797 | 22 | 17,162 | 780 | 41 | % | 44 | % | 2 | % | ||||||||||||||||||
Total | 79 | $ | 187,296 | $ | 2,371 | 67 | $ | 166,567 | $ | 2,486 | 18 | % | 12 | % | (5 | )% | ||||||||||||||
Year Ended December 31, | ||||||||||||||||||||||||||||||
2015 | 2014 | % Change | ||||||||||||||||||||||||||||
Homes | Dollar Value | Average Price | Homes | Dollar Value | Average Price | Homes | Dollar Value | Average Price | ||||||||||||||||||||||
(Dollars in thousands) | ||||||||||||||||||||||||||||||
Southern California | 45 | $ | 149,405 | $ | 3,320 | 33 | $ | 79,575 | $ | 2,411 | 36 | % | 88 | % | 38 | % | ||||||||||||||
Northern California | 22 | 17,162 | 780 | 8 | 7,136 | 892 | 175 | % | 140 | % | (13 | )% | ||||||||||||||||||
Total | 67 | $ | 166,567 | $ | 2,486 | 41 | $ | 86,711 | $ | 2,115 | 63 | % | 92 | % | 18 | % | ||||||||||||||
Backlog reflects the number of homes, net of cancellations, for which we have entered into a sales contract with a customer, but for which we have not yet delivered the home. The dollar value of backlog was up 12% to $187.3 million primarily due to a 18% increase in the number of homes in backlog, partially offset by a 5% reduction in the average selling price of homes in backlog. The higher backlog dollar value in Southern California as compared to Northern California was due to higher community counts in Southern California combined with higher-priced communities, particularly in Newport Coast where we have two coastal luxury communities where average home prices in backlog are in excess of $5 million. The increase in the number of homes in backlog as of December 31, 2016 compared to the prior year period was the result of increased net new home orders.
The number of homes in backlog as of December 31, 2015 compared to December 31, 2014 increased 63% as a result of increased net new orders due largely to a significant increase in the number of selling communities. As a result of the increase in net new orders and an 18% higher average sales price in backlog, the dollar value of backlog as of December 31, 2015 increased $79.9 million, or 92% compared to the prior year. The year-over-year increase in average sales price in backlog was driven primarily by Southern California orders from a high-priced community in Newport Coast, CA that opened during 2015. This increase offset the average sales price decrease for Northern California attributable to a higher concentration of sales in more moderately-priced homes in the Sacramento area compared to the prior period.
32
Lots Owned and Controlled
December 31, | ||||||||||||||||||||
Change | Change | |||||||||||||||||||
2016 | Amount | % | 2015 | Amount | % | 2014 | ||||||||||||||
Lots Owned | ||||||||||||||||||||
Southern California | 290 | 167 | 136 | % | 123 | 3 | 3 | % | 120 | |||||||||||
Northern California | 300 | 11 | 4 | % | 289 | 19 | 7 | % | 270 | |||||||||||
Total | 590 | 178 | 43 | % | 412 | 22 | 6 | % | 390 | |||||||||||
Lots Controlled(1) | ||||||||||||||||||||
Southern California | 721 | (33 | ) | (4 | )% | 754 | 415 | 122 | % | 339 | ||||||||||
Northern California | 265 | 113 | 74 | % | 152 | (48 | ) | (24 | )% | 200 | ||||||||||
Total | 986 | 80 | 9 | % | 906 | 367 | 68 | % | 539 | |||||||||||
Lots Owned and Controlled - Wholly Owned | 1,576 | 258 | 20 | % | 1,318 | 389 | 42 | % | 929 | |||||||||||
Fee Building(2) | 935 | (487 | ) | (34 | )% | 1,422 | 317 | 29 | % | 1,105 | ||||||||||
Total Lots Owned and Controlled | 2,511 | (229 | ) | (8 | )% | 2,740 | 706 | 35 | % | 2,034 | ||||||||||
(1) | Includes lots that we control under purchase and sale agreements or option agreements subject to customary conditions and have not yet closed. There can be no assurance that such acquisitions will occur. |
(2) | Lots owned by third party property owners for which we perform general contracting services. |
Consistent with our focus to grow our wholly owned business, the Company increased the number of wholly owned lots owned and controlled by 20% and 42% year-over-year for the years ending December 31, 2016 and 2015, respectively. The decrease in fee building lots at December 31, 2016 compared to 2015 was attributable to delivering 644 homes during 2016 and not being awarded as many new fee building contracts from our largest customer during the year.
Home Sales Revenue and New Homes Delivered
Year Ended December 31, | ||||||||||||||||||||||||||||||
2016 | 2015 | % Change | ||||||||||||||||||||||||||||
Homes | Dollar Value | Average Price | Homes | Dollar Value | Average Price | Homes | Dollar Value | Average Price | ||||||||||||||||||||||
(Dollars in thousands) | ||||||||||||||||||||||||||||||
Southern California | 147 | $ | 422,041 | $ | 2,871 | 74 | $ | 205,815 | $ | 2,781 | 99 | % | 105 | % | 3 | % | ||||||||||||||
Northern California | 103 | 85,908 | 834 | 74 | 74,394 | 1,005 | 39 | % | 15 | % | (17 | )% | ||||||||||||||||||
Total | 250 | $ | 507,949 | $ | 2,032 | 148 | $ | 280,209 | $ | 1,893 | 69 | % | 81 | % | 7 | % | ||||||||||||||
Year Ended December 31, | ||||||||||||||||||||||||||||||
2015 | 2014 | % Change | ||||||||||||||||||||||||||||
Homes | Dollar Value | Average Price | Homes | Dollar Value | Average Price | Homes | Dollar Value | Average Price | ||||||||||||||||||||||
(Dollars in thousands) | ||||||||||||||||||||||||||||||
Southern California | 74 | $ | 205,815 | $ | 2,781 | 11 | $ | 27,494 | $ | 2,499 | 573 | % | 649 | % | 11 | % | ||||||||||||||
Northern California | 74 | 74,394 | 1,005 | 42 | 28,600 | 681 | 76 | % | 160 | % | 48 | % | ||||||||||||||||||
Total | 148 | $ | 280,209 | $ | 1,893 | 53 | $ | 56,094 | $ | 1,058 | 179 | % | 400 | % | 79 | % | ||||||||||||||
Home sales revenue for the year ended December 31, 2016 increased 81% to $507.9 million compared to $280.2 million in the prior year period. The increase in home sales revenue was driven primarily by a 69% increase in deliveries and a 7% increase in the average selling price of homes to $2.0 million. The increase in deliveries was the result of a higher number of homes in beginning backlog to start the year and a 45% increase in net new home orders during the year. The increase in our
33
average selling price was due to a 99% increase in deliveries from our Southern California operations, which had a significantly higher average selling price than our Northern California operations due to a higher concentration of luxury homes in coastal locations.
New home deliveries increased 179% to 148 for the year ended December 31, 2015 compared to 2014, primarily due to the increase in net new home orders and the number of actively selling communities. For the year ended December 31, 2015, home sales revenue increased 400% compared to the prior year, primarily due to a 179% increase in the number of homes delivered and a 79% increase in the average sales price of homes delivered. The year-over-year increase in average sales price was due primarily to a shift to higher-priced homes in coastal Southern California and to a lesser extent, a 48% increase in average sales price for Northern California due to initial deliveries from a luxury condominium community in the Bay Area.
Homebuilding Gross Margin
Homebuilding gross margin percentage for the year ended December 31, 2016 was 14.2%, which included $2.4 million in non-cash inventory impairments related to two active homebuilding communities, compared to 16.1% for 2015. Homebuilding gross margin before impairments for 2016 was 14.6% versus 16.1% in the prior year period. Homebuilding gross margin before impairments is a non-GAAP measure. See the table below reconciling this non-GAAP financial measure to homebuilding gross margin, the nearest GAAP equivalent. The 150 basis point decline in homebuilding gross margin before impairments as compared to the prior year was due primarily to a change in mix, including lower margins in masterplan communities located in Irvine and lower margins in the Bay Area. These decreases were partially offset by higher margins from the initial deliveries in our Crystal Cove communities in Newport Coast, CA, and to a lesser extent, a 20 basis point benefit from a warranty accrual adjustment made during the 2016 third quarter that increased homebuilding gross margin by $1.1 million. In order to reflect more comparable gross margin and SG&A percentage metrics with other homebuilders, effective January 1, 2016, we started amortizing certain capitalizable selling and marketing costs associated with model set-up to selling and marketing expenses versus through cost of home sales. As a result of this change, we reclassified $4.8 million in capitalizable selling and marketing costs for the year ended December 31, 2015 out of cost of home sales to selling and marketing expenses to conform with current year presentation.
Homebuilding gross margin percentage for the year ended December 31, 2015 declined 40 basis points to 16.1% as compared to 16.5% for the same period in 2014. The year-over-year decrease was largely due to lower margins generated from Sacramento close-out communities in 2015 that required higher incentives. As a result of the change noted above regarding the classification of certain capitalizable selling and marketing costs, we reclassified $4.8 million and $0.8 million in capitalizable selling and marketing costs for the years ended December 31, 2015 and 2014, respectively, out of cost of home sales to selling and marketing expenses to conform with current year presentation.
Excluding home sales impairments and interest in cost of home sales, adjusted homebuilding gross margin percentage for the years ended December 31, 2016, 2015 and 2014 were 15.7%, 16.9% and 17.4%, respectively. See the table below reconciling this non-GAAP financial measure to homebuilding gross margin, the nearest GAAP equivalent.
Year Ended December 31, | ||||||||||||||||||||
2016 | % | 2015 | % | 2014 | % | |||||||||||||||
(Dollars in thousands) | ||||||||||||||||||||
Home sales revenue | $ | 507,949 | 100.0 | % | $ | 280,209 | 100.0 | % | $ | 56,094 | 100.0 | % | ||||||||
Cost of home sales | 435,909 | 85.8 | % | 235,232 | 83.9 | % | 46,843 | 83.5 | % | |||||||||||
Homebuilding gross margin | 72,040 | 14.2 | % | 44,977 | 16.1 | % | 9,251 | 16.5 | % | |||||||||||
Add: Home sales impairments | 2,350 | 0.4 | % | — | — | % | — | — | % | |||||||||||
Homebuilding gross margin before impairments (1) | 74,390 | 14.6 | % | 44,977 | 16.1 | % | 9,251 | 16.5 | % | |||||||||||
Add: interest in cost of home sales | 5,331 | 1.1 | % | 2,511 | 0.8 | % | 532 | 0.9 | % | |||||||||||
Adjusted homebuilding gross margin(1) | $ | 79,721 | 15.7 | % | $ | 47,488 | 16.9 | % | $ | 9,783 | 17.4 | % | ||||||||
(1) | Homebuilding gross margin before impairments and adjusted homebuilding gross margin are non-GAAP financial measures. We believe this information is meaningful as it isolates the impact that home sales impairments and leverage have on homebuilding gross margin and permits investors to make better comparisons with our competitors who also break out and adjust gross margins in a similar fashion. |
34
Land Sales
During the fourth quarter of 2016, the company recorded a non-cash, land sale impairment charge of $1.2 million related to land under development in Northern California that the Company intends to sell.
Fee Building
Year Ended December 31, | ||||||||||||||||||||
2016 | % | 2015 | % | 2014 | % | |||||||||||||||
(Dollars in thousands) | ||||||||||||||||||||
Fee building revenue | $ | 186,507 | 100.0 | % | $ | 149,890 | 100.0 | % | $ | 93,563 | 100.0 | % | ||||||||
Cost of fee building | 178,103 | 95.5 | % | 139,677 | 93.2 | % | 89,057 | 95.2 | % | |||||||||||
Fee building gross margin | $ | 8,404 | 4.5 | % | $ | 10,213 | 6.8 | % | $ | 4,506 | 4.8 | % | ||||||||
Our fee building revenues include (i) billings to independent third-party land owners for general contracting services, and (ii) management fees from our unconsolidated joint ventures for construction management services. Cost of fee building includes (i) labor, subcontractor, and other indirect construction and development costs that are reimbursable by the land owner, and (ii) general and administrative, or G&A, expenses that are attributable to fee building activities and joint venture management overhead. Besides allocable G&A expenses, there are no other material costs associated with management fees from our unconsolidated joint ventures.
Billings to land owners are a function of construction activity and reimbursable costs are incurred as homes are started. The total billings and reimbursable costs are driven by the pace at which the land owner has us execute its development plan. Management fees from our unconsolidated joint ventures are collected over the project's life and increase as homes and lots are delivered.
For the year ended December 31, 2016, fee building revenues increased 24% from the prior year period due to an increase in fee building activity resulting from a higher number of homes under construction during the year. The increase in number of homes under construction was due to an increased number of homes started during the year, at the direction of the land owner, offset partially by an increase in the number of homes completed and delivered. Included in fee building revenues for the years ended December 31, 2016 and December 31, 2015 were (i) $178.3 million and $137.5 million of billings to land owners for general contracting services for 2016 and 2015, respectively, and (ii) $8.2 million and $12.4 million of management fees from our unconsolidated joint ventures for 2016 and 2015, respectively. The decrease in management fees from JVs was primarily the result of fewer deliveries and lower home sales revenue from JV communities, which is consistent with the Company’s strategic shift to emphasize wholly owned operations.
For the year ended December 31, 2015, fee building revenue increased 60% year-over-year to $149.9 million from $93.6 million due to an increase in construction activity in the fee building communities and higher joint venture management fees. Included in fee building revenue were (i) $137.5 million and $84.0 million of billings to land owners for the years ended December 31, 2015 and 2014, respectively, and (ii) $12.4 million and $9.6 million of management fees from our unconsolidated joint ventures for the years ended December 31, 2015 and 2014, respectively.
Our fee building revenue has historically been concentrated with a small number of customers. For the years ended December 31, 2016, 2015 and 2014, one customer comprised 96%, 92% and 87% of fee building revenue, respectively.
For the year ended December 31, 2016, cost of fee building increased due to the increase in fee building revenues, compared to the same period during 2015. The amount of G&A expenses included in cost of fee building was $8.8 million for each year ended December 31, 2016 and 2015. Fee building gross margin percentage decreased from 6.8% to 4.5% for the year ended December 31, 2016 compared to the prior year period. The reduction in fee building gross margin percentage was largely due to a decrease in management fees received from joint ventures, partially offset by a slightly higher fee rate with our largest customer on certain fee building communities.
For the year ended December 31, 2015, cost of fee building increased to $139.7 million compared to $89.1 million for the same period during 2014. The amount of G&A expenses included in cost of fee building were $8.8 million and $9.3 million for the years ended December 31, 2015 and 2014, respectively. Fee building gross margin percentage increased to 6.8% from 4.8% for the years ended December 31, 2015 and 2014, respectively, primarily due to the increase in management fees from our unconsolidated joint ventures.
35
Selling, General and Administrative Expenses
Year Ended December 31, | As a Percentage of Home Sales Revenue | |||||||||||||||||||
2016 | 2015 | 2014 | 2016 | 2015 | 2014 | |||||||||||||||
(Dollars in thousands) | ||||||||||||||||||||
Selling and marketing expenses | $ | 26,744 | $ | 13,741 | $ | 3,983 | 5.3 | % | 4.9 | % | 7.1 | % | ||||||||
General and administrative expenses (“G&A”) | 25,882 | 20,278 | 12,420 | 5.1 | % | 7.2 | % | 22.1 | % | |||||||||||
Total selling, marketing and G&A expenses (“SG&A”) | $ | 52,626 | $ | 34,019 | $ | 16,403 | 10.4 | % | 12.1 | % | 29.2 | % | ||||||||
SG&A expenses for the year ended December 31, 2016 were up year-over-year, consistent with the 81% increase in our homebuilding revenues and 50% increase in wholly owned community count at December 31, 2015. However, our SG&A operating leverage improved significantly resulting in a 170 basis point reduction in our SG&A expense ratio for the year ended December 31, 2016. The improvement was largely attributable to the increase in home sales revenue, which was driven by a significant increase in new home deliveries and higher average selling prices due to a heavier Southern California mix. Selling and marketing expenses as a percentage of home sales revenue for 2016 was up 40 basis points year-over-year to 5.3% due to higher amortization of capitalizable marketing costs and increased model operating costs associated with higher-priced, luxury homes in Southern California.
SG&A expenses for the year ended December 31, 2015 were $34.0 million, compared to $16.4 million in the prior year period. The increase in SG&A expenses resulted from higher selling and marketing expenses due to a 400% increase in home sales revenue and increased G&A related to higher personnel and professional fees to support our growth. As a percentage of home sales revenue, SG&A for the year ended December 31, 2015 was 12.1% versus 29.2% in the prior year period. The year-over-year improvement in the SG&A percentage for the period was driven by stronger operating leverage from higher home sales revenue.
Effective January 1, 2016, certain capitalizable selling and marketing expenses were amortized to selling and marketing expenses rather than cost of home sales. Prior year periods have been reclassified to conform with current year presentation. The reclassification caused an increase to selling and marketing expenses of approximately $4.8 million and $0.8 million for the years ended December 31, 2015 and 2014, respectively, or 1.7% and 1.5% of home sales revenue, respectively, and a corresponding increase to homebuilding gross margin by the same amount.
Equity in Net Income of Unconsolidated Joint Ventures
As of December 31, 2016 and 2015, we had ownership interests in 13 and 14, respectively, unconsolidated joint ventures. We own interests in our unconsolidated joint ventures that generally range from 5% to 35%. These interests vary among our different unconsolidated joint ventures.
The Company's share of joint venture income was $7.7 million for the year ended December 31, 2016 as compared to $13.8 million for the year ended December 31, 2015. The reduction in joint venture income was driven by a 47% decrease in total JV home sales revenues resulting from a 29% decrease in our JV average selling price and a 26% decrease in JV home deliveries. This decline was partially offset by a one-time gain related to the close-out of one joint venture. During the second quarter of 2016, the Company closed out one of its unconsolidated joint ventures known as "LR8" and received an income allocation of $0.5 million from a reserve reduction prior to the close out. As part of this transaction, the Company also recognized a gain of $1.1 million due to the purchase of our JV partner's interest for less than its carrying value as part of a negotiated transaction which included an agreement to indemnify our joint venture partner for future liability associated with the project.
For the year ended December 31, 2015, our share of joint venture income was $13.8 million, compared to $8.4 million for 2014. The increase in our share of joint venture income was primarily attributable to a 51% increase in total JV revenues and a $1.6 million gain related to the cash distribution of capital we received in excess of the book value of our land basis that was contributed to a joint venture.
36
The following sets forth supplemental operational and financial information about our unconsolidated joint ventures. Such information is not included in our financial data for GAAP purposes, but is reflected in our results as a component of equity in net income of unconsolidated joint ventures. This data is included for informational purposes only.
Year Ended December 31, | |||||||||||||||||||||||||
Change | Change | ||||||||||||||||||||||||
2016 | Amount | % | 2015 | Amount | % | 2014 | |||||||||||||||||||
(Dollars in thousands) | |||||||||||||||||||||||||
Unconsolidated Joint Ventures—Homebuilding | |||||||||||||||||||||||||
Operational Data | |||||||||||||||||||||||||
Net new home orders | 159 | (140 | ) | (47 | )% | 299 | 11 | 4 | % | 288 | |||||||||||||||
Monthly sales absorption rate per community | 2.3 | (0.3 | ) | (12 | )% | 2.6 | (0.2 | ) | (7 | )% | 2.8 | ||||||||||||||
Cancellation rate | 11 | % | 3 | % | NA | 8 | % | (1 | )% | NA | 9 | % | |||||||||||||
New homes delivered | 197 | (68 | ) | (26 | )% | 265 | (10 | ) | (4 | )% | 275 | ||||||||||||||
Home sales revenue | $ | 177,544 | $ | (157,971 | ) | (47 | )% | $ | 335,515 | $ | 111,017 | 49 | % | $ | 224,498 | ||||||||||
Average sales price of homes delivered | $ | 901 | $ | (365 | ) | (29 | )% | $ | 1,266 | $ | 450 | 55 | % | $ | 816 | ||||||||||
Selling communities at end of period | 9 | 1 | 13 | % | 8 | — | — | % | 8 | ||||||||||||||||
Backlog (dollar value) | $ | 55,414 | $ | (62,522 | ) | (53 | )% | $ | 117,936 | $ | 2,948 | 3 | % | $ | 114,988 | ||||||||||
Backlog (homes) | 62 | (47 | ) | (43 | )% | 109 | 34 | 45 | % | 75 | |||||||||||||||
Average sales price of homes in backlog | $ | 894 | $ | (188 | ) | (17 | )% | $ | 1,082 | $ | (451 | ) | (29 | )% | $ | 1,533 | |||||||||
Year Ended December 31, | |||||||||||||||||||||||||
Change | Change | ||||||||||||||||||||||||
2016 | Amount | % | 2015 | Amount | % | 2014 | |||||||||||||||||||
(Dollars in thousands) | |||||||||||||||||||||||||
Unconsolidated Joint Ventures—Land | |||||||||||||||||||||||||
Operational Data | |||||||||||||||||||||||||
Land sales revenue | $ | 55,675 | $ | (18,691 | ) | (25 | )% | $ | 74,366 | $ | 27,478 | 59 | % | $ | 46,888 | ||||||||||
Backlog (dollar value) (1) | $ | — | $ | (33,534 | ) | (100 | )% | $ | 33,534 | $ | (55,569 | ) | (62 | )% | $ | 89,103 | |||||||||
(1) | For the year ended December 31, 2014, amount includes $33.9 million of backlog dollar value related to purchase contracts between an unconsolidated joint venture and the Company. |
37
The tables below summarizes lots owned and controlled by our unconsolidated joint ventures as of the dates presented:
December 31, | ||||||||||||||||||||
Change | Change | |||||||||||||||||||
2016 | Amount | % | 2015 | Amount | % | 2014 | ||||||||||||||
Unconsolidated Joint Ventures—Lots Owned and Controlled | ||||||||||||||||||||
Homebuilding | ||||||||||||||||||||
Lots owned | 513 | (168 | ) | (25 | )% | 681 | (204 | ) | (23 | )% | 885 | |||||||||
Lots controlled (1) | 72 | 4 | 6 | % | 68 | 68 | — | % | — | |||||||||||
Homebuilding Total | 585 | (164 | ) | (22 | )% | 749 | (136 | ) | (15 | )% | 885 | |||||||||
Land Development | ||||||||||||||||||||
Lots owned | 2,180 | (160 | ) | (7 | )% | 2,340 | (432 | ) | (16 | )% | 2,772 | |||||||||
Lots controlled (1) | 235 | — | — | % | 235 | — | — | % | 235 | |||||||||||
Land Development Total | 2,415 | (160 | ) | (6 | )% | 2,575 | (432 | ) | (14 | )% | 3,007 | |||||||||
Total | 3,000 | (324 | ) | (10 | )% | 3,324 | (568 | ) | (15 | )% | 3,892 | |||||||||
(1) | Includes lots controlled under purchase and sale agreements or option agreements subject to customary conditions and have not yet closed. There can be no assurance that such acquisitions will occur. |
Provision for Taxes
For the year ended December 31, 2016, the Company recorded a provision for income taxes of $13.0 million. Included in this provision is an allocation of income of $0.5 million from LR8 and a $1.1 million gain from the closeout of our LR8 joint venture, which resulted in a provision for income taxes of $0.6 million for the year December 31, 2016 and did not impact our effective tax rate. The effective tax rate for 2016 differs from the 35% federal statutory tax rate, primarily due to state income taxes, offset partially by the benefit from production activities and energy efficient credits.
For the year ended December 31, 2015, we recorded a provision for income taxes of $12.5 million. The effective tax rate for the year ended December 31, 2015 differs from the 35% statutory tax rate due to state income taxes, offset partially by the benefit from production activities and energy efficient credits.
For the first 30 calendar days of 2014, we were a Delaware LLC, which was treated as a partnership for income tax purposes and was subject to certain minimal taxes and fees; however, income taxes on taxable income or losses realized by us were the obligation of the members. Federal and state taxes provided during the first 30 calendar days of 2014 relate to a subsidiary that is treated as a C Corporation. On January 30, 2014, we completed our IPO and reorganized from a Delaware LLC into a Delaware corporation. For the year ended December 31, 2014, we recorded a tax provision of $0.2 million. The effective tax rate for the year ended December 31, 2014 differs from the 35% statutory tax rate primarily due to the differences between the financial statement basis and tax basis of certain assets upon conversion to a taxable entity at the time of our IPO, resulting in a net deferred tax asset. Additionally, the effective tax rate was reduced by the exclusion of pre-conversion earnings from taxable income for the three months ended March 31, 2014, and the tax benefit of production activities, partially offset by state income taxes.
38
Liquidity and Capital Resources
Overview
Our principal uses of capital for the year ended December 31, 2016 were land purchases, land development, home construction, repayments on our credit facility, contributions and advances to our unconsolidated joint ventures, operating expenses and the payment of routine liabilities. Our principal sources of capital for the year ended December 31, 2016 were advances from our credit facility, cash generated from home sales activities, distributions from our unconsolidated joint ventures and management fees from our fee building agreements.
Cash flows for each of our communities depend on their stage in the development cycle, and can differ substantially from reported earnings. Early stages of development or expansion require significant cash outlays for land acquisitions, entitlements and other approvals, and construction of model homes, roads, utilities, general landscaping and other amenities. Because these costs are a component of our real estate inventories and not recognized in our consolidated statement of operations until a home is delivered, we incur significant cash outlays prior to our recognition of earnings. In the later stages of community development, cash inflows may significantly exceed earnings reported for financial statement purposes, as the cash outflow associated with home and land construction was previously incurred. From a liquidity standpoint, we are actively acquiring and developing lots to increase our lot supply and community count. As we continue to expand our business, we expect cash outlays for land purchases, land development and home construction to exceed our cash generated by operations.
We exercise strict controls and believe we have a prudent strategy for companywide cash management, including those related to cash outlays for land and inventory acquisition, development and investments in and advances to unconsolidated joint ventures. We ended 2016 with $30.5 million of cash and cash equivalents, a $15.4 million decrease from December 31, 2015, primarily as a result of decreased distributions from our unconsolidated joint ventures. We expect to generate cash from the sale of our inventory, but intend to redeploy the net cash generated from the sale of inventory to acquire and develop strategic, well-positioned lots that represent opportunities to generate future income and cash flows.
As of December 31, 2016 and 2015, we had $22.8 million and $16.7 million, respectively, in accounts payable that related to costs incurred under our fee building agreements. Funding to pay these amounts is the obligation of the independent third-party land owner, which is generally funded on a monthly basis. Similarly, contracts and accounts receivable as of the same dates included $24.3 million and $17.8 million, respectively, related to the payment of the above payables.
We intend to utilize both debt and equity as part of our ongoing financing strategy, coupled with redeployment of cash flows from continuing operations, to provide us with the financial flexibility to operate our business. In that regard, we expect to employ prudent levels of leverage to finance the acquisition and development of our lots and construction of our homes. As of December 31, 2016, we had outstanding borrowings of $118.0 million. We will consider a number of factors when evaluating our level of indebtedness and when making decisions regarding the incurrence of new indebtedness, including the purchase price of assets to be acquired with debt financing, the estimated market value of our assets and the ability of particular assets, and our company as a whole, to generate cash flow to cover the expected debt service. In addition, our senior unsecured revolving credit facility contains certain financial covenants that limits the amount of leverage we can maintain.
We intend to finance future acquisitions and developments with what we believe to be the most advantageous source of capital available to us at the time of the transaction, which may include unsecured corporate level debt, property-level debt and mortgage financing and other public, private or bank debt, or common and preferred equity. Additionally, we have an existing effective shelf registration statement that allows us to issue equity, debt or hybrid securities up to $349.7 million as of December 31, 2016.
Land Acquisition Note
In December 2016, the Company retired a term loan with a land seller. The loan was secured by real estate, and bore interest at 7.0% per annum. Immediately prior to payoff, the principal balance of $4.0 million was reduced $250,000 by the land seller in exchange for the immediate payoff of the note. The Company paid off the new principal balance of $3.75 million and recognized a $250,000 gain, which is included in other expense, net, in the accompanying consolidated statements of operations.
Secured Construction Notes
In May 2014, we entered into two secured construction loans with a bank related to model and production homes for a specific project. The project closed out during 2016 and the associated loans were paid off.
39
Senior Unsecured Revolving Credit Facility
We have a senior unsecured revolving credit facility (the "Credit Facility") with a bank group. In May 2016, we increased the commitment under the Credit Facility from $200 million to $260 million with an accordion feature that allows the facility size thereunder to be increased up to an aggregate of $350 million, subject to certain conditions, including the availability of bank commitments, and extended the maturity date by one year to April 30, 2019. As of December 31, 2016, we had $118.0 million outstanding under the credit facility and $142.0 million in availability. We may repay advances at any time without premium or penalty. Interest is payable monthly and is charged at a rate of 1-month LIBOR plus a margin ranging from 2.25% to 3.00% depending on the Company’s leverage ratio as calculated at the end of each fiscal quarter. As of December 31, 2016, the interest rate under the facility was 3.52%.
Under our Credit Facility, we are required to comply with certain financial covenants, including but not limited to those summarized in the table below, and as described and defined further in the Credit Facility:
December 31, 2016 | |||||||
Financial Covenants | Actual | Covenant Requirement | |||||
(Dollars in thousands) | |||||||
Unencumbered Liquid Assets | $ | 30,496 | $ | 7,484 | |||
EBITDA to Interest Incurred | 6.1 : 1.0 | > 1.5 : 1.0 | |||||
Tangible Net Worth | $ | 244,523 | $ | 175,918 | |||
Leverage Ratio | 28 | % | < 65% | ||||
Adjusted Leverage Ratio (1) | 32 | % | < 50% | ||||
(1) Adjusted Leverage Ratio is computed as total joint venture debt divided by total joint venture equity.
As of December 31, 2016 and 2015, we were in compliance with all financial covenants.
Debt-to-Capital Ratios
We believe that debt-to-capital ratios provide useful information to the users of our financial statements regarding our financial position and leverage. Net debt-to-capital ratio is a non-GAAP financial measure. See the table below reconciling this non-GAAP measure to debt-to-capital ratio, the nearest GAAP equivalent. The ratio of debt-to-capital and the ratio of net debt-to-capital are calculated as follows:
December 31, | |||||||
2016 | 2015 | ||||||
(Dollars in thousands) | |||||||
Unsecured revolving credit facility and other notes payable | $ | 118,000 | $ | 83,082 | |||
Equity, exclusive of noncontrolling interest | 244,523 | 220,775 | |||||
Total capital | $ | 362,523 | $ | 303,857 | |||
Ratio of debt-to-capital (1) | 32.5 | % | 27.3 | % | |||
Unsecured revolving credit facility and other notes payable | $ | 118,000 | $ | 83,082 | |||
Less: cash, cash equivalents and restricted cash | 31,081 | 46,254 | |||||
Net debt | 86,919 | 36,828 | |||||
Equity, exclusive of noncontrolling interest | 244,523 | 220,775 | |||||
Total capital | $ | 331,442 | $ | 257,603 | |||
Ratio of net debt-to-capital (2) | 26.2 | % | 14.3 | % | |||
(1) | The ratio of debt-to-capital is computed as the quotient obtained by dividing the unsecured revolving credit facility and other notes payable by the sum of the unsecured revolving credit facility and other notes payable plus equity, exclusive of noncontrolling interest. |
(2) | The ratio of net debt-to-capital is computed as the quotient obtained by dividing net debt (which is the unsecured revolving credit facility and other notes payable less cash to the extent necessary to reduce the debt balance to zero) by total capital, exclusive of noncontrolling interest. The most directly comparable GAAP financial measure is the ratio of debt-to-capital. We believe the ratio of net debt-to-capital is a relevant financial measure for investors to understand the leverage employed in our operations and as an indicator of our ability to obtain financing. We believe that by deducting |
40
our cash from our debt, we provide a measure of our indebtedness that takes into account our cash liquidity. We believe this provides useful information as the ratio of debt-to-capital does not take into account our liquidity and we believe that the ratio net of cash provides supplemental information by which our financial position may be considered. Investors may also find this to be helpful when comparing our leverage to the leverage of our competitors that present similar information. See the table above reconciling this non-GAAP financial measure to the ratio of debt-to-capital.
Cash Flows — Year Ended December 31, 2016 Compared to Year Ended December 31, 2015
For the year ended December 31, 2016 as compared to the year ended December 31, 2015, the comparison of cash flows is as follows:
• | Net cash used in operating activities was $42.4 million in 2016 versus $32.3 million in 2015. The change was primarily the result of a reduction of distributions of earnings from unconsolidated joint ventures to $3.7 million in 2016 from $18.5 million and an increase in cash outflows for real estate inventories to $71.4 million in 2016 compared to $65.9 million in 2015. Cash inflows for distributions of earnings from unconsolidated joint ventures decreased due to the reduction of total revenues of the unconsolidated joint ventures during the same periods. Despite a 43% increase in net wholly owned lots year-over-year, we were able to continue utilizing favorable lot option takedown structures that defrayed a portion of the upfront capital required to acquire land. In addition, we delivered more homes in 2016 as compared to the prior year, which partially offset increased land acquisition and construction costs capitalized to inventory as compared to the prior year. |
• | Net cash provided by investing activities was $1.8 million in 2016 compared $16.6 million in 2015. For the year ended December 31, 2016, our net distributions of capital from unconsolidated joint ventures was $0.2 million compared to net distributions of $17.0 million during the year ended December 31, 2015 and was the primary reason net cash provided by investing activities decreased. The decrease in distributions related to the decrease in total revenues of the unconsolidated joint ventures. The decrease in distributions was partially offset by the assumption of $2.0 million in cash as a result in the change in control in our LR8 Investors LLC unconsolidated joint venture during 2016. The Company assumed the joint venture's cash, accounts receivable. accounts payable, and accrued liabilities upon the exit of our joint venture partner. |
• | Net cash provided by financing activities was $25.2 million in 2016 versus $17.5 million in 2015. The increase primarily related to an increase in net borrowings, offset partially by the issuance of common stock in the 2015 period. Cash inflows for net borrowings from the unsecured credit facility and other notes payable was $27.8 million for the year ending December 31, 2016 compared to net paydowns on the unsecured credit facility and other notes payable of $27.2 million for the year ended December 31, 2015. Additionally, 2015 included the follow-on issuance of common stock, which generated $47.3 million in net cash proceeds while 2016 did not include any net proceeds from the issuance of common stock. |
41
Off-Balance Sheet Arrangements and Contractual Obligations
Option Contracts
In the ordinary course of business, we enter into land option contracts in order to procure lots for the construction of our homes. We are subject to customary obligations associated with entering into contracts for the purchase of land and improved lots. These purchase contracts typically require a cash deposit and the purchase of properties under these contracts is generally contingent upon satisfaction of certain requirements by the sellers, including obtaining applicable property and development entitlements. We also utilize option contracts with land sellers as a method of acquiring land in staged takedowns, to help us manage the financial and market risk associated with land holdings, to reduce the use of funds from our corporate financing sources, and to enhance our return on equity. Option contracts generally require a non-refundable deposit for the right to acquire lots over a specified period of time at pre-determined prices. We generally have the right, at our discretion, to terminate our obligations under both purchase contracts and option contracts by forfeiting our cash deposit with no further financial responsibility to the land seller. In some instances, we may also expend funds for due diligence and development activities with respect to our option contracts prior to purchase which we would have to write off should we not purchase the land. As of December 31, 2016, we had $33.9 million of non-refundable and $4.1 million of refundable cash deposits pertaining to land option contracts and purchase contracts with an estimated aggregate remaining purchase price of $463.4 million (net of deposits). These cash deposits are included as a component of our real estate inventories on the consolidated balance sheets.
Our utilization of land option contracts is dependent on, among other things, the availability of land sellers willing to enter into option arrangements, the availability of capital to financial intermediaries to finance the development of optioned lots, general housing market conditions, and local market dynamics. Options may be more difficult to procure from land sellers in strong housing markets and are more prevalent in certain geographic regions.
Joint Ventures
We enter into land development and homebuilding joint ventures from time to time as means of:
• | leveraging our capital base |
• | accessing larger or highly desirable lot positions |
• | expanding our market opportunities |
• | managing financial and market risk associated with land holdings |
• | establishing strategic alliances |
These joint ventures have historically obtained secured acquisition, development and/or construction financing which reduces the use of funds from our corporate financing sources.
The Company has provided credit enhancements in connection with joint venture borrowings in the form of loan-to-value ("LTV") maintenance agreements in order to secure the joint venture's performance under the loans and maintenance of certain LTV ratios. The Company has also entered into agreements with its partners in each of the unconsolidated joint ventures whereby the Company and its partners are apportioned liability under the LTV maintenance agreements according to their respective capital interest. In addition, the agreements provide the Company, to the extent its partner has an unpaid liability under such credit enhancements, the right to receive distributions from the unconsolidated joint venture that would otherwise be made to the partner. However, there is no guarantee that such distributions will be made or will be sufficient to cover the share of the liability apportioned to us. The loans underlying the LTV maintenance agreements comprise acquisition and development loans, construction revolvers and model home loans, and the agreements remain in force until the loans are satisfied. Due to the nature of the loans, the outstanding balance at any given time is subject to a number of factors including the status of site improvements, the mix of horizontal and vertical development underway, the timing of phase build outs, and the period necessary to complete the escrow process for homebuyers. As of December 31, 2016 and 2015, $56.0 million and $74.1 million, respectively, was outstanding under the loans and credit enhanced by the Company through LTV maintenance agreements. Under the terms of the joint venture agreements, the Company's proportionate share of LTV maintenance agreement liabilities was $8.6 million and $22.5 million, respectively, as of December 31, 2016 and December 31, 2015. In addition, the Company has provided completion agreements regarding specific performance for certain projects whereby the Company is required to complete the given project with funds provided by the beneficiary of the agreement. If there are not adequate funds available under the specific project loans, the Company would then be subject to financial liability under such completion guaranties. Typically, under such terms of the joint venture agreements, the Company has the right to apportion the
42
respective share of any costs funded under such completion guaranties to its partners. However, there is no guarantee that we will be able to recover against our partners for such amounts owed to us under the terms of such joint venture agreements.
As of December 31, 2016, we held membership interests in 13 unconsolidated joint ventures, nine of which related to homebuilding activities and four related to land development as noted below. We were a party to five loan-to-value maintenance agreements related to unconsolidated joint ventures as of December 31, 2016. The following table reflects certain financial and other information related to our unconsolidated joint ventures as of December 31, 2016:
December 31, 2016 | ||||||||||||||||||||||
Year Formed | Location | Total Joint Venture | Debt-to-Total Capital- ization | Loan-to- Value Maintenance Agreement | Future Capital Commitment (2) | Lots Owned and Controlled | ||||||||||||||||
Joint Venture (Project Name) | Ownership % | Assets | Debt(1) | Equity | ||||||||||||||||||
(Dollars in 000's) | ||||||||||||||||||||||
Larkspur Land 8 Investors, LLC (Rose Lane) | 2011 | Larkspur, CA | 10% | $ | 2,114 | $ | — | $ | 1,149 | — | % | N/A | $ | — | — | |||||||
TNHC-HW San Jose LLC (Orchard Park) | 2012 | San Jose, CA | 15% | 15,133 | 1,105 | 11,005 | 9 | % | Yes | — | 14 | |||||||||||
TNHC-TCN Santa Clarita LP (Villa Metro)(3) | 2012 | Santa Clarita, CA | 10% | 2,044 | — | 983 | — | % | N/A | — | — | |||||||||||
TNHC Newport LLC (Meridian)(3) | 2013 | Newport Beach, CA | 12% | 4,555 | — | 1,648 | — | % | N/A | — | — | |||||||||||
Encore McKinley Village LLC (McKinley Village) | 2013 | Sacramento, CA | 10% | 78,127 | 17,667 | 56,601 | 24 | % | Yes | 1,950 | 327 | |||||||||||
TNHC Russell Ranch LLC (Russell Ranch)(3) (4) (5) | 2013 | Folsom, CA | 35% | 48,441 | 20,000 | 28,262 | 41 | % | No | 18,191 | 870 | |||||||||||
TNHC-HW Foster City LLC (Foster Square)(5) | 2013 | Foster City, CA | 35% | 7,099 | — | 4,029 | — | % | N/A | — | — | |||||||||||
Calabasas Village LP (Avanti)(3) | 2013 | Calabasas, CA | 10% | 53,545 | 13,315 | 38,580 | 26 | % | Yes | 50 | 51 | |||||||||||
TNHC-HW Cannery LLC (Cannery Park)(5) | 2013 | Davis, CA | 35% | 16,057 | — | 9,865 | — | % | N/A | — | 110 | |||||||||||
Arantine Hills Holdings LP (Bedford Ranch) (3) (5) | 2014 | Corona, CA | 5% | 101,467 | — | 99,623 | — | % | N/A | 753 | 1,435 | |||||||||||
TNHC Tidelands LLC (Tidelands) | 2015 | San Mateo, CA | 20% | 47,645 | 23,947 | 21,231 | 53 | % | Yes | — | 55 | |||||||||||
TNHC Mountain Shadows LLC (Mountain Shadows) | 2015 | Paradise Valley, AZ | 25% | 52,320 | 21,630 | 29,252 | 43 | % | Yes | — | 66 | |||||||||||
DMB/TNHC LLC (Sterling at Silverleaf) | 2016 | Scottsdale, AZ | 50% | 1,661 | — | 1,610 | 561 | — | % | N/A | 1,000 | 72 | ||||||||||
Total Unconsolidated Joint Ventures | $ | 430,208 | $ | 97,664 | $ | 303,838 | 24 | % | $ | 21,944 | 3,000 | |||||||||||
(1) | Scheduled maturities of the unconsolidated joint venture debt as of December 31, 2016 are as follows: $72.1 million matures in 2017, $17.7 million matures in 2018 and $7.8 million matures in 2019. |
(2) | Estimated future capital commitment represents our proportionate share of estimated future contributions to the respective unconsolidated joint ventures as of December 31, 2016. Actual contributions may differ materially. |
(3) | Certain members of the Company's board of directors are affiliated with entities that have an investment in these joint ventures. |
(4) | The debt associated with this joint venture consists of a land seller note. |
(5) | Land development joint venture. |
As of December 31, 2016, the unconsolidated joint ventures were in compliance with their respective loan covenants, where applicable, and we were not required to make any loan-to-value maintenance related payments during the year ended December 31, 2016.
43
Contractual Obligations Table
The following table summarizes our future payment obligations under existing contractual obligations as of December 31, 2016 including payment obligations due by period. Our purchase obligations primarily represent commitments for land purchases under purchase and land option contracts with non-refundable deposits and commitments for subcontractor labor and material to be utilized in the normal course of business.
Payments Due By Period | ||||||||||||||||||||
Contractual Obligations | Total | Less than 1 Year | 1-3 Years | 4-5 Years | More than 5 Years | |||||||||||||||
(Dollars in thousands) | ||||||||||||||||||||
Long-term debt principal payments (1) | $ | 118,000 | $ | — | $ | 118,000 | $ | — | $ | — | ||||||||||
Long-term interest payments (2) | 9,697 | 4,156 | 5,541 | — | — | |||||||||||||||
Operating leases | 5,819 | 2,274 | 2,182 | 1,363 | — | |||||||||||||||
Purchase obligations (3) | 477,729 | 292,784 | 184,945 | — | — | |||||||||||||||
Total | $ | 611,245 | $ | 299,214 | $ | 310,668 | $ | 1,363 | $ | — | ||||||||||
(1) | For a more detailed description of our long-term debt, please see Note 8 of the notes to our consolidated financial statements. |
(2) | Future interest payments based on senior unsecured credit facility outstanding balance of $118.0 million and interest rate of 3.52% at December 31, 2016. |
(3) | Includes $420.3 million (net of deposits) of the remaining purchase price for land option and land purchase contracts where deposits are nonrefundable and $56.4 million of subcontractor labor and material commitments as of December 31, 2016 for which we are responsible if the subcontractor completes the work as specified in their respective commitments. Excluded from this number is $73.7 million in purchase obligations made on behalf of the owner(s) of fee build projects for which we are reimbursed per our fee building agreements. |
Inflation
Our homebuilding and fee building segments can be adversely impacted by inflation, primarily from higher land, financing, labor, material and construction costs. In addition, inflation can lead to higher mortgage rates, which can significantly affect the affordability of mortgage financing to homebuyers. While we attempt to pass on cost increases to customers through increased prices, when weak housing market conditions exist, we may be unable to offset cost increases with higher selling prices.
Seasonality
Historically, the homebuilding industry experiences seasonal fluctuations in quarterly operating results and capital requirements. We typically experience the highest new home order activity in spring and summer, although this activity is also highly dependent on the number of active selling communities, timing of new community openings and other market factors. Since it typically takes five to nine months to construct a new home, we deliver more homes in the second half of the year as spring and summer home orders convert to home deliveries. Because of this seasonality, home starts, construction costs and related cash outflows have historically been highest in the second and third quarters, and a higher level of cash receipts from home deliveries occurs during the second half of the year. We expect this seasonal pattern to continue over the long-term, although it may be affected by volatility in the homebuilding industry.
Critical Accounting Policies
The preparation of financial statements in conformity with accounting policies generally accepted in the United States of America requires management to make estimates and assumptions that affect the reported amounts of assets and liabilities at the date of the consolidated financial statements and the reported amounts of revenue and expenses during the reporting period. Management bases its estimates and judgments on historical experience and on various other factors that are believed to be reasonable under the circumstances, the results of which form the basis for making judgments about the carrying value of assets and liabilities that are not readily apparent from other sources. Management evaluates such estimates and judgments on an on-going basis and makes adjustments as deemed necessary. Actual results could differ from these estimates if conditions are significantly different in the future.
44
Real Estate Inventories
We capitalize pre-acquisition, land, development and other allocated costs, including interest, property taxes and indirect construction costs to real estate inventories. Land, development and other common costs are typically allocated to real estate inventories using a methodology that approximates the relative-sales-value method. Home construction costs per production phase are recorded using the specific identification method. Inventory is stated at cost, unless the carrying amount is determined not to be recoverable, in which case inventory is written down to fair value.
We review our real estate assets at each project (including unconsolidated joint venture real estate projects) on a periodic basis or whenever indicators of impairment exist. Real estate assets include projects actively selling and projects under development or held for future development. Indicators of impairment include, but are not limited to, significant decreases in local housing market values and selling prices of comparable homes, significant decreases in gross margins and sales absorption rates, costs significantly in excess of budget, and actual or projected cash flow losses.
If there are indicators of impairment, we perform a detailed budget and cash flow review of the applicable real estate inventories to determine whether the estimated remaining undiscounted future cash flows of the project are more or less than the asset’s carrying value. If the undiscounted cash flows are more than the asset’s carrying value, no impairment adjustment is required. However, if the undiscounted cash flows are less than the asset’s carrying value, the asset is deemed impaired and is written down to fair value.
When estimating undiscounted cash flows of a project, we make various assumptions, including: (i) expected sales prices and sales incentives to be offered, including the number of homes available, pricing and incentives being offered by us or other builders in other projects, and future sales price adjustments based on market and economic trends; (ii) expected sales pace and cancellation rates based on local housing market conditions, competition and historical trends; (iii) costs expended to date and expected to be incurred including, but not limited to, land and land development costs, home construction costs, interest costs, indirect construction and overhead costs, and selling and marketing costs; (iv) alternative product offerings that may be offered that could have an impact on sales pace, sales price and/or building costs; and (v) alternative uses for the property.
Many assumptions are interdependent and a change in one may require a corresponding change to other assumptions. For example, increasing or decreasing sales absorption rates has a direct impact on the estimated per unit sales price of a home, the level of time sensitive costs (such as indirect construction, overhead and carrying costs), and selling and marketing costs (such as model maintenance costs and advertising costs). Depending on the underlying objective of the project, assumptions could have a significant impact on the projected cash flow analysis. For example, if our objective is to preserve operating margins, our cash flow analysis will be different than if the objective is to increase sales. These objectives may vary significantly from project to project and over time. If assets are considered impaired, impairment is determined by the amount the asset’s carrying value exceeds its fair value. Fair value is determined based on either a land residual value analysis or a discounted cash flow analysis. Under the land residual value analysis, we estimate what a willing buyer would pay and what a willing seller would sell a parcel of land for (other than in a forced liquidation) in order to generate a market rate operating margin and return. Under the discounted cash flow method, the fair value is determined by calculating the present value of future cash flows using a risk adjusted discount rate. Critical assumptions that are included as part of these analyses include estimating future housing revenues, sales absorption rates, land development, construction and related carrying costs (including future capitalized interest), and all direct selling and marketing costs. This evaluation and the assumptions used by management to determine future estimated cash flows and fair value require a substantial degree of judgment, especially with respect to real estate projects that have a substantial amount of development to be completed, have not started selling or are in the early stages of sales, or are longer in duration. Actual revenues, costs and time to complete and sell a community could vary from these estimates which could impact the calculation of fair value of the asset and the corresponding amount of impairment that is recorded in our results of operations.
Home Sales Revenue and Cost of Home Sales
Homebuilding revenue and cost of sales are recognized after construction is completed, a sufficient down payment has been received, title has transferred to the homebuyer, collection of the purchase price is reasonably assured and we have no continuing involvement. Cost of sales is recorded based upon total estimated costs to be allocated to each home within a community. Any changes to the estimated costs are allocated to the remaining undelivered lots and homes within their respective community. The estimation and allocation of these costs requires a substantial degree of judgment by management.
The estimation process involved in determining relative sales or fair values is inherently uncertain because it involves estimating future sales values of homes before sale and delivery. Additionally, in determining the allocation of costs to a particular land parcel or individual home, we rely on project budgets that are based on a variety of assumptions, including
45
assumptions about construction schedules and future costs to be incurred. It is common that actual results differ from budgeted amounts for various reasons, including construction delays, increases in costs that have not been committed or unforeseen issues encountered during construction that fall outside the scope of existing contracts, or costs that come in less than originally anticipated. While the actual results for a particular construction project are accurately reported over time, a variance between the budget and actual costs could result in the understatement or overstatement of costs and have a related impact on gross margins between reporting periods. To reduce the potential for such variances, we have procedures that have been applied on a consistent basis, including assessing and revising project budgets on a periodic basis, obtaining commitments from subcontractors and vendors for future costs to be incurred, and utilizing the most recent information available to estimate costs. We believe that these policies and procedures provide for reasonably dependable estimates for purposes of calculating amounts to be relieved from inventories and expensed to cost of sales in connection with the delivery of homes.
Fee Building
The Company enters into fee building agreements to provide services whereby it will build homes on behalf of independent third-party property owners. Under our typical arrangement, the independent third-party property owner funds all project costs incurred by the Company to build and sell the homes. The Company primarily enters into cost plus fee contracts where it charges independent third-party property owners for all direct and indirect costs, plus a negotiated management fee. For these types of contracts, the Company recognizes revenue based on the actual total costs it has expended plus the applicable management fee. The management fee is typically a fixed fee based on a percentage of the cost or home sales revenue of the project depending on the terms of the agreement with the independent third-party property owner. In accordance with ASC 605, Revenue Recognition (“ASC 605”), revenues from fee building services are recognized over a cost-to-cost approach in applying the percentage-of-completion method. Under this approach, revenue is earned in proportion to total costs incurred, divided by total costs expected to be incurred. The total estimated cost plus the management fee represents the total contract value. The Company recognizes revenue based on the actual labor and other direct costs incurred, plus the portion of the management fee it has earned to date. In the course of providing its services, the Company routinely subcontracts for services and incurs other direct costs on behalf of its customers. These costs are passed through to customers and, in accordance with industry practice and GAAP, are included in the Company’s revenue and cost of revenue. Under certain agreements, the Company is eligible to receive additional incentive compensation as certain financial thresholds defined in the agreement are achieved. The Company recognizes revenue for any incentive compensation when such financial thresholds are probable of being met and such compensation is deemed to be collectible, generally at the date the amount is communicated to us by the independent third-party property owner.
The Company also enters into fee building and management contracts with third parties and its unconsolidated joint ventures where it provides construction supervision services, as well as sales and marketing services, and does not bear financial risks for any services provided. In accordance with ASC 605, revenue from these services are recognized over a proportional performance method or completed performance method. Under this approach, revenue is earned as services are provided in proportion to total services expected to be provided to the customer or on a straight line basis if the pattern of performance cannot be determined while costs are recognized as incurred. Revenue recognition for any portion of the fees earned from these services that are contingent upon a financial threshold or specific event is deferred until the threshold is achieved or the event occurs.
Variable Interest Entities
The Company accounts for variable interest entities in accordance with ASC 810, Consolidation (“ASC 810”). Under ASC 810, a variable interest entity (“VIE”) is created when: (a) the equity investment at risk in the entity is not sufficient to permit the entity to finance its activities without additional subordinated financial support provided by other parties, including the equity holders; (b) the entity’s equity holders as a group either (i) lack the direct or indirect ability to make decisions about the entity, (ii) are not obligated to absorb expected losses of the entity or (iii) do not have the right to receive expected residual returns of the entity; or (c) the entity’s equity holders have voting rights that are not proportionate to their economic interests, and the activities of the entity involve or are conducted on behalf of the equity holder with disproportionately few voting rights. If an entity is deemed to be a VIE pursuant to ASC 810, the enterprise that has both (i) the power to direct the activities of a VIE that most significantly impact the entity’s economic performance and (ii) the obligation to absorb the expected losses of the entity or right to receive benefits from the entity that could be potentially significant to the VIE is considered the primary beneficiary and must consolidate the VIE. In accordance with ASC 810, we perform ongoing reassessments of whether an enterprise is the primary beneficiary of a VIE.
46
Investments in and Advances to Unconsolidated Joint Ventures
We use the equity method to account for investments in homebuilding and land development joint ventures that qualify as VIEs where we are not the primary beneficiary and other entities that we do not control but have the ability to exercise significant influence over the operating and financial policies of the investee. The Company also uses the equity method when we function as the managing member or general partner and our venture partner has substantive participating rights or where we can be replaced by our venture partner as managing member without cause.
Under the equity method, we recognize our proportionate share of earnings and losses generated by the joint venture upon the delivery of lots or homes to third parties. Our proportionate share of intra-entity profits and losses are eliminated until the related asset has been sold by the unconsolidated joint venture to third parties. Our ownership interests in our unconsolidated joint ventures vary, but are generally less than or equal to 35%. The accounting policies for our unconsolidated joint ventures are consistent with those of the Company.
We review real estate inventory held by our unconsolidated joint ventures for impairment, consistent with our real estate inventories. We also review our investments in and advances to unconsolidated joint ventures for evidence of other-than-temporary declines in value. To the extent we deem any portion of our investment in and advances to unconsolidated joint ventures as not recoverable, we impair our investment accordingly.
In addition, the Company has provided credit enhancements in connection with joint venture borrowings such as LTV maintenance agreements, construction completion agreements, and environmental indemnities. In many cases, we share these obligations with our joint venture partners, and in some cases, we are solely responsible for such obligations. Through December 31, 2016, the Company has not made any payments related to these credit enhancements. For further discussion regarding these credit enhancements, please see Item 7, “Management’s Discussion and Analysis of Financial Condition and Results of Operations—Liquidity and Capital Resources—Off-Balance Sheet Arrangements and Contractual Obligations” and Note 10 to the Consolidated Financial Statements.
Warranty Accrual
We offer warranties on our homes that generally cover various defects in workmanship or materials, or structural construction defects for one year. Estimated future direct warranty costs are accrued and charged to cost of sales in the period when the related homebuilding revenues are recognized. Amounts are accrued based upon the Company’s historical rates. In addition, the Company receives warranty payments from its customers for certain of its fee building projects where it has the contractual risk of construction. These payments are recorded as warranty accruals. We assess the adequacy of our warranty accrual on a quarterly basis and adjust the amounts recorded if necessary. Although we consider the warranty accruals reflected in our consolidated balance sheet to be adequate, actual future costs could differ significantly from our currently estimated amounts.
Income Taxes
Income taxes are accounted for in accordance with ASC 740, Income Taxes (“ASC 740”). This statement requires an asset and a liability approach for measuring deferred taxes based on temporary differences between the financial statement and tax bases of assets and liabilities existing at each balance sheet date using enacted tax rates for years in which taxes are expected to be paid or recovered.
Deferred tax assets are evaluated on a quarterly basis to determine if adjustments to the valuation allowance are required. In accordance with ASC 740, we assess whether a valuation allowance should be established based on the consideration of all available evidence using a “more likely than not” standard with respect to whether deferred tax assets will be realized. The ultimate realization of deferred tax assets depends primarily on the generation of future taxable income during the periods in which the differences become deductible. The value of our deferred tax assets will depend on applicable income tax rates. Judgment is required in determining the future tax consequences of events that have been recognized in our consolidated financial statements and/or tax returns. Differences between anticipated and actual outcomes of these future tax consequences could have a material impact on our consolidated financial statements. Changes in existing tax laws and tax rates also affect actual tax results and the valuation of deferred tax assets over time.
ASC 740 defines the methodology for recognizing the benefits of uncertain tax return positions as well as guidance regarding the measurement of the resulting tax benefits. These provisions require an enterprise to recognize the financial statement effects of a tax position when it is more likely than not (defined as a likelihood of more than 50%), based on the technical merits, that the position will be sustained upon examination. In addition, these provisions provide guidance on
47
derecognition, classification, interest and penalties, accounting in interim periods, disclosure, and transition. The evaluation of whether a tax position meets the more-likely-than-not recognition threshold requires a substantial degree of judgment by management based on the individual facts and circumstances. Changes in the recognition or measurement of uncertain tax positions could result in material increases or decreases in our income tax expense in the period in which we make the change.
Stock-Based Compensation
We account for share-based awards in accordance with ASC 718, Compensation – Stock Compensation (“ASC 718”) and ASC 505-50, Equity – Equity Based Payments to Non-Employees (“ASC 505-50”).
ASC 718 requires that the cost resulting from all share-based payment transactions be recognized in a company's financial statements. ASC 718 requires all entities to apply a fair-value-based measurement method in accounting for share-based payment transactions with employees except for equity instruments held by employee share ownership plans.
ASC 505-50 requires that if an employee becomes a non-employee and continues to vest in a share-based award pursuant to the award's original terms, the award be treated as an award to a non-employee prospectively, provided the individual is required to continue providing services to the employer (such as consulting services). These awards are to be accounted for prospectively, such that the fair value of the award will be re-measured at each reporting date until the earlier of (a) the performance commitment date or (b) the date the services required under the agreement have been completed. ASC 505-50 requires that compensation cost ultimately recognized in the Company's financial statements be the sum of (a) the compensation cost recognized during the period of time the individual was an employee (based on the grant-date fair value) plus (b) the fair value of the award determined on the measurement date determined in accordance with ASC 505-50 for the pro-rata portion of the vesting period in which the individual was a non-employee.
The determination of the fair value of share-based awards at the grant date, or subsequent remeasurement dates under ASC 505-50, requires judgment in developing assumptions and involves a number of variables. These variables include, but are not limited to: expected stock-price volatility over the term of the awards and expected stock option exercise behavior. Additionally, judgment is required in the case of performance share awards in estimating the level of performance that will be achieved and the number of shares that will be earned. If actual results differ significantly from these estimates, stock-based compensation expense and our consolidated results of operations could be significantly impacted.
Recently Issued Accounting Standards
See Note 1 to the accompanying notes to consolidated financial statements included in this annual report on Form 10-K.
JOBS Act
We qualify as an "emerging growth company" pursuant to the provisions of the JOBS Act. For as long as we are an "emerging growth company," we may take advantage of certain exemptions from various reporting requirements that are applicable to other public companies that are not "emerging growth companies," including, but not limited to, not being required to comply with the auditor attestation requirements of Section 404(b) of the Sarbanes-Oxley Act, reduced disclosure obligations regarding executive compensation in our periodic reports and proxy statements, exemptions from the requirements of holding advisory "say-on-pay" votes on executive compensation, shareholder advisory votes on golden parachute compensation and the extended transition period for complying with the new or revised accounting standards.
In addition, Section 107 of the JOBS Act also provides that an "emerging growth company" can take advantage of the extended transition period provided in Section 7(a)(2)(B) of the Securities Act for complying with new or revised accounting standards. An "emerging growth company" can therefore delay the adoption of certain accounting standards until those standards would otherwise apply to private companies. However, we have chosen to "opt out" of such extended transition period and, as a result, we will comply with new or revised accounting standards on the relevant dates on which adoption of such standards is required for non-emerging growth companies. Section 107 of the JOBS Act provides that our decision to opt out of the extended transition period for complying with new or revised accounting standards is irrevocable.
48
Item 7A. | Quantitative and Qualitative Disclosures About Market Risk |
We are exposed to market risks related to fluctuations in interest rates on our outstanding variable rate debt. We did not utilize swaps, forward or option contracts on interest rates or commodities, or other types of derivative financial instruments as of or during the year ended December 31, 2016. We have not entered into and currently do not hold derivatives for trading or speculative purposes. Many of the statements contained in this section are forward looking and should be read in conjunction with our disclosures under the heading “Cautionary Note Concerning Forward-Looking Statements.”
The table below details the principal amount and the average interest rates for the outstanding debt for each category based upon the expected maturity or disposition dates. The fair value of our variable rate debt consists of the balance of our senior unsecured revolving credit facility (the "Credit Facility"). Based on the short-term duration of LIBOR rates, the fair value of debt under the Credit Facility approximates the carrying value.
Expected Maturity Date | |||||||||||||||||||
2017 | 2018 - 2021 | Thereafter | Total | Estimated Fair Value | |||||||||||||||
(Dollars in thousands) | |||||||||||||||||||
Liabilities: | |||||||||||||||||||
Variable rate debt | $ | — | $ | 118,000 | $ | — | $ | 118,000 | $ | 118,000 | |||||||||
Weighted Average Interest Rate | — | % | 3.5 | % | — | % | 3.5 | % | — | % | |||||||||
We do not believe that the future market rate risks related to the above securities will have a material adverse impact on our financial position, results of operations or liquidity.
Item 8. | Financial Statements and Supplementary Data |
The information required by this item is set forth beginning on page 56.
Item 9. | Changes in and Disagreements with Accountants on Accounting and Financial Disclosure |
None.
Item 9A. | Controls and Procedures |
Evaluation of Disclosure Controls and Procedures
We maintain disclosure controls and procedures that are designed to ensure that information required to be disclosed in our Exchange Act reports is recorded, processed, summarized and reported within the time periods specified by the SEC's rules and forms is communicated to the our management, including our Chief Executive Officer and Chief Financial Officer as appropriate, to allow timely decisions regarding required disclosure based on the definition of “disclosure controls and procedures” in Rules 13a-15(e) and 15d-15(e) of the Exchange Act. Our disclosure controls and procedures are designed to provide a reasonable level of assurance of reaching our desired disclosure control objectives. In designing controls and procedures specified in the SEC's rules and forms, and that such information is accumulated and evaluating the disclosure controls and procedures, management recognizes that any controls and procedures, no matter how well designed and operated, can provide only reasonable assurance of achieving the desired control objectives, and management necessarily was required to apply its judgment in evaluating the cost-benefit relationship of possible controls and procedures. Because of the inherent limitations in all control systems, no evaluation of controls can provide absolute assurance that all control issues and instances of fraud, if any, have been detected. These inherent limitations include the realities that judgments in decision-making can be faulty and that breakdowns can occur because of simple error and mistake. Additionally, controls can be circumvented by the individual acts of some persons, by collusion of two or more people or by management override of controls.
At the end of the period being reported upon, we carried out an evaluation, under the supervision and with the participation of our management, including our Chief Executive Officer and Chief Financial Officer, of the effectiveness of the design and operation of our disclosure controls and procedures. Based on the foregoing, our Chief Executive Officer and Chief Financial Officer concluded that our disclosure controls and procedures were effective at the reasonable assurance level as of December 31, 2016.
49
Management's Report on Internal Control over Financial Reporting
Our management is responsible for establishing and maintaining adequate internal control over financial reporting, as defined in Rules 13a-15(f) and 15d-15(f) of the Exchange Act. Our management, with the participation of our Chief Executive Officer and Chief Financial Officer, conducted an assessment of the effectiveness of our internal control over financial reporting as of December 31, 2016 based on the framework established in Internal Control-Integrated Framework issued by the Committee of Sponsoring Organizations (COSO) of the Treadway Commission (2013 Framework). Based on this framework, our management concluded that our internal control over financial reporting was effective as of December 31, 2016.
This annual report on Form 10-K does not include an attestation report of our independent registered public accounting firm, because as an "emerging growth company" under the JOBS Act our independent registered public accounting firm is not required to issue such an attestation report.
Changes in Internal Controls
There was no change in the Company’s internal control over financial reporting that occurred during our most recent fiscal quarter that has materially affected, or is reasonably likely to materially affect, our internal control over financial reporting.
Item 9B. | Other Information |
None.
PART III
Item 10. | Directors, Executive Officers and Corporate Governance |
Information required by Item 10 of Part III is included in our Proxy Statement relating to our 2017 Annual Meeting of Shareholders and is incorporated herein by reference.
Item 11. | Executive Compensation |
Information required by Item 11 of Part III is included in our Proxy Statement relating to our 2017 Annual Meeting of Shareholders and is incorporated herein by reference.
Item 12. | Security Ownership of Certain Beneficial Owners and Management and Related Stockholder Matters |
Information required by Item 12 of Part III is included in our Proxy Statement relating to our 2017 Annual Meeting of Shareholders and is incorporated herein by reference.
Item 13. | Certain Relationships and Related Transactions, and Director Independence |
Information required by Item 13 of Part III is included in our Proxy Statement relating to our 2017 Annual Meeting of Shareholders and is incorporated herein by reference.
Item 14. | Principal Accounting Fees and Services |
Information required by Item 14 of Part III is included in our Proxy Statement relating to our 2017 Annual Meeting of Shareholders and is incorporated herein by reference.
50
PART IV
Item 15. | Exhibits and Financial Statement Schedules |
(a) The following documents are filed as part of this annual report on Form 10-K:
(1) | Financial Statements: |
The New Home Company Inc. | PAGE |
TNHC Meridian Investors LLC (our unconsolidated investee) | PAGE |
TNHC Newport LLC (our unconsolidated lower tier investee) | PAGE |
51
LR8 Investors, LLC (our unconsolidated investee) | PAGE |
Larkspur Land 8 Investors LLC (our unconsolidated investee) | PAGE |
TNHC-HW Foster City LLC (our unconsolidated investee) | PAGE |
(2) | Financial Statement Schedules |
All other schedules have been omitted since the required information is presented in the financial statements and the related notes or is not applicable.
(3) | Exhibits |
The exhibits filed or furnished as part of this annual report on Form 10-K are listed in the Index to Exhibits immediately preceding those exhibits, which Index is incorporated in this Item by reference.
52
REPORT OF INDEPENDENT REGISTERED PUBLIC ACCOUNTING FIRM
The Board of Directors and Stockholders of
The New Home Company Inc.
We have audited the accompanying consolidated balance sheets of The New Home Company Inc. (the "Company") as of December 31, 2016 and 2015, and the related consolidated statements of operations, equity and cash flows for each of the three years in the period ended December 31, 2016. These financial statements are the responsibility of the Company’s management. Our responsibility is to express an opinion on these financial statements based on our audits.
We conducted our audits in accordance with the standards of the Public Company Accounting Oversight Board (United States). Those standards require that we plan and perform the audit to obtain reasonable assurance about whether the financial statements are free of material misstatement. We were not engaged to perform an audit of the Company’s internal control over financial reporting. Our audits included consideration of internal control over financial reporting as a basis for designing audit procedures that are appropriate in the circumstances, but not for the purpose of expressing an opinion on the effectiveness of the Company’s internal control over financial reporting. Accordingly, we express no such opinion. An audit also includes examining, on a test basis, evidence supporting the amounts and disclosures in the financial statements, assessing the accounting principles used and significant estimates made by management, and evaluating the overall financial statement presentation. We believe that our audits provide a reasonable basis for our opinion.
In our opinion, the financial statements referred to above present fairly, in all material respects, the consolidated financial position of The New Home Company Inc. at December 31, 2016 and 2015, and the consolidated results of its operations and its cash flows for each of the three years in the period ended December 31, 2016, in conformity with U.S. generally accepted accounting principles.
/s/ Ernst & Young LLP
Irvine, California
February 22, 2017
53
THE NEW HOME COMPANY INC.
CONSOLIDATED BALANCE SHEETS
December 31, | |||||||
2016 | 2015 | ||||||
(Dollars in thousands, except per share amounts) | |||||||
Assets | |||||||
Cash and cash equivalents | $ | 30,496 | $ | 45,874 | |||
Restricted cash | 585 | 380 | |||||
Contracts and accounts receivable | 27,833 | 23,960 | |||||
Due from affiliates | 1,138 | 979 | |||||
Real estate inventories | 286,928 | 200,636 | |||||
Investment in and advances to unconsolidated joint ventures | 50,857 | 60,572 | |||||
Other assets | 21,299 | 18,869 | |||||
Total assets | $ | 419,136 | $ | 351,270 | |||
Liabilities and equity | |||||||
Accounts payable | $ | 33,094 | $ | 26,371 | |||
Accrued expenses and other liabilities | 23,418 | 19,827 | |||||
Due to affiliates | — | 293 | |||||
Unsecured revolving credit facility | 118,000 | 74,924 | |||||
Other notes payable | — | 8,158 | |||||
Total liabilities | 174,512 | 129,573 | |||||
Commitments and contingencies (Note 10) | |||||||
Equity: | |||||||
Stockholders' equity: | |||||||
Preferred stock, $0.01 par value, 50,000,000 shares authorized, no shares outstanding | — | — | |||||
Common stock, $0.01 par value, 500,000,000 shares authorized, 20,712,166 and 20,543,130, shares issued and outstanding as of December 31, 2016 and 2015, respectively | 207 | 205 | |||||
Additional paid-in capital | 197,161 | 194,437 | |||||
Retained earnings | 47,155 | 26,133 | |||||
Total The New Home Company Inc. stockholders' equity | 244,523 | 220,775 | |||||
Noncontrolling interest in subsidiary | 101 | 922 | |||||
Total equity | 244,624 | 221,697 | |||||
Total liabilities and equity | $ | 419,136 | $ | 351,270 | |||
See accompanying notes to the consolidated financial statements.
54
THE NEW HOME COMPANY INC.
CONSOLIDATED STATEMENTS OF OPERATIONS
Year Ended December 31, | |||||||||||
2016 | 2015 | 2014 | |||||||||
(Dollars in thousands, except per share amounts) | |||||||||||
Revenues: | |||||||||||
Home sales | $ | 507,949 | $ | 280,209 | $ | 56,094 | |||||
Fee building, including management fees from unconsolidated joint ventures of $8,202, $12,426 and $9,582, respectively | 186,507 | 149,890 | 93,563 | ||||||||
694,456 | 430,099 | 149,657 | |||||||||
Cost of Sales: | |||||||||||
Home sales | 433,559 | 235,232 | 46,843 | ||||||||
Home sales impairments | 2,350 | — | — | ||||||||
Land sales impairment | 1,150 | — | — | ||||||||
Fee building | 178,103 | 139,677 | 89,057 | ||||||||
615,162 | 374,909 | 135,900 | |||||||||
Gross Margin: | |||||||||||
Homes sales | 72,040 | 44,977 | 9,251 | ||||||||
Land sales | (1,150 | ) | — | — | |||||||
Fee building | 8,404 | 10,213 | 4,506 | ||||||||
79,294 | 55,190 | 13,757 | |||||||||
Selling and marketing expenses | (26,744 | ) | (13,741 | ) | (3,983 | ) | |||||
General and administrative expenses | (25,882 | ) | (20,278 | ) | (12,420 | ) | |||||
Equity in net income of unconsolidated joint ventures | 7,691 | 13,767 | 8,443 | ||||||||
Other expense, net | (409 | ) | (1,027 | ) | (794 | ) | |||||
Income before income taxes | 33,950 | 33,911 | 5,003 | ||||||||
Provision for income taxes | (13,024 | ) | (12,533 | ) | (246 | ) | |||||
Net income | 20,926 | 21,378 | 4,757 | ||||||||
Net loss attributable to noncontrolling interest | 96 | 310 | 30 | ||||||||
Net income attributable to The New Home Company Inc. | $ | 21,022 | $ | 21,688 | $ | 4,787 | |||||
Earnings per share attributable to The New Home Company Inc.: | |||||||||||
Basic | $ | 1.02 | $ | 1.29 | $ | 0.30 | |||||
Diluted | $ | 1.01 | $ | 1.28 | $ | 0.30 | |||||
Weighted average shares outstanding: | |||||||||||
Basic | 20,685,386 | 16,767,513 | 15,927,917 | ||||||||
Diluted | 20,791,445 | 16,941,088 | 15,969,199 | ||||||||
See accompanying notes to the consolidated financial statements.
55
THE NEW HOME COMPANY INC.
CONSOLIDATED STATEMENTS OF EQUITY
Stockholders’ Equity | Members’ Equity | Noncontrolling Interest in Subsidiary | Total Equity | ||||||||||||||||||||||||||||
Number of Shares of Common Stock | Common Stock | Additional Paid-in Capital | Retained Earnings | Total Stockholders’ Equity | |||||||||||||||||||||||||||
(Dollars in thousands) | |||||||||||||||||||||||||||||||
Balance at December 31, 2013 | — | $ | — | $ | — | $ | — | $ | — | $ | 64,356 | $ | 1,171 | $ | 65,527 | ||||||||||||||||
Net income (loss) | — | — | — | 4,445 | 4,445 | 342 | (30 | ) | 4,757 | ||||||||||||||||||||||
Noncontrolling interest contribution | — | — | — | — | — | — | 1,253 | 1,253 | |||||||||||||||||||||||
Noncontrolling interest distribution | — | — | — | — | — | — | (52 | ) | (52 | ) | |||||||||||||||||||||
Stock-based compensation expense | — | — | 2,005 | — | 2,005 | 317 | — | 2,322 | |||||||||||||||||||||||
Conversion of members’ equity into common stock | 8,636,250 | 86 | 64,929 | — | 65,015 | (65,015 | ) | — | — | ||||||||||||||||||||||
Issuance of common stock, net of issuance costs | 8,984,375 | 90 | 87,710 | — | 87,800 | — | — | 87,800 | |||||||||||||||||||||||
Repurchase of common stock | (1,171,875 | ) | (12 | ) | (11,977 | ) | — | (11,989 | ) | — | — | (11,989 | ) | ||||||||||||||||||
Deductible transaction costs and additional contribution of deferred tax assets from IPO | — | — | 808 | — | 808 | — | — | 808 | |||||||||||||||||||||||
Balance at December 31, 2014 | 16,448,750 | 164 | 143,475 | 4,445 | 148,084 | — | 2,342 | 150,426 | |||||||||||||||||||||||
Net income (loss) | — | — | — | 21,688 | 21,688 | — | (310 | ) | 21,378 | ||||||||||||||||||||||
Noncontrolling interest contribution | — | — | — | — | — | — | 1,301 | 1,301 | |||||||||||||||||||||||
Noncontrolling interest distribution | — | — | — | — | — | — | (2,411 | ) | (2,411 | ) | |||||||||||||||||||||
Stock-based compensation expense | — | — | 3,884 | — | 3,884 | — | — | 3,884 | |||||||||||||||||||||||
Shares net settled with the Company to satisfy minimum employee personal income tax liabilities resulting from share based compensation plans | — | — | (248 | ) | — | (248 | ) | — | — | (248 | ) | ||||||||||||||||||||
Excess tax benefits from stock-based compensation | — | — | 97 | — | 97 | — | — | 97 | |||||||||||||||||||||||
Shares issued through stock plans | 69,380 | 1 | 16 | — | 17 | — | — | 17 | |||||||||||||||||||||||
Issuance of common stock, net of issuance costs | 4,025,000 | 40 | 47,213 | — | 47,253 | — | — | 47,253 | |||||||||||||||||||||||
Balance at December 31, 2015 | 20,543,130 | 205 | 194,437 | 26,133 | 220,775 | — | 922 | 221,697 | |||||||||||||||||||||||
Net income (loss) | — | — | — | 21,022 | 21,022 | — | (96 | ) | 20,926 | ||||||||||||||||||||||
Noncontrolling interest distribution | — | — | — | — | — | — | (725 | ) | (725 | ) | |||||||||||||||||||||
Stock-based compensation expense | — | — | 3,471 | — | 3,471 | — | — | 3,471 | |||||||||||||||||||||||
Shares net settled with the Company to satisfy minimum employee personal income tax liabilities resulting from share based compensation plans | — | — | (648 | ) | — | (648 | ) | — | — | (648 | ) | ||||||||||||||||||||
Excess tax provision from stock-based compensation | — | — | (97 | ) | — | (97 | ) | — | — | (97 | ) | ||||||||||||||||||||
Shares issued through stock plans | 169,036 | 2 | (2 | ) | — | — | — | — | — | ||||||||||||||||||||||
Balance at December 31, 2016 | 20,712,166 | $ | 207 | $ | 197,161 | $ | 47,155 | $ | 244,523 | $ | — | $ | 101 | $ | 244,624 | ||||||||||||||||
See accompanying notes to the consolidated financial statements.
56
THE NEW HOME COMPANY INC.
CONSOLIDATED STATEMENTS OF CASH FLOWS
Year Ended December 31, | |||||||||||
2016 | 2015 | 2014 | |||||||||
(Dollars in thousands) | |||||||||||
Operating activities: | |||||||||||
Net income | $ | 20,926 | $ | 21,378 | $ | 4,757 | |||||
Adjustments to reconcile net income to net cash used in operating activities: | |||||||||||
Deferred taxes | (918 | ) | (1,675 | ) | (5,819 | ) | |||||
Amortization of equity based compensation | 3,471 | 3,884 | 2,322 | ||||||||
Excess income tax provision/(benefit) from stock-based compensation | 97 | (97 | ) | — | |||||||
Inventory impairments | 3,500 | — | — | ||||||||
Gain from notes payable principal reduction | (250 | ) | — | — | |||||||
Distributions of earnings from unconsolidated joint ventures | 3,742 | 18,477 | 6,040 | ||||||||
Equity in net income of unconsolidated joint ventures | (7,691 | ) | (13,767 | ) | (8,443 | ) | |||||
Deferred profit from unconsolidated joint ventures | 646 | (1,603 | ) | — | |||||||
Depreciation | 511 | 473 | 381 | ||||||||
Abandoned project costs | 580 | 635 | 754 | ||||||||
Net changes in operating assets and liabilities: | |||||||||||
Restricted cash | 396 | (97 | ) | (153 | ) | ||||||
Contracts and accounts receivable | (3,737 | ) | (10,796 | ) | (5,986 | ) | |||||
Due from affiliates | (344 | ) | 1,683 | (2,104 | ) | ||||||
Real estate inventories | (71,388 | ) | (65,942 | ) | (114,932 | ) | |||||
Other assets | (756 | ) | (3,651 | ) | (1,285 | ) | |||||
Accounts payable | 6,171 | 9,790 | 7,893 | ||||||||
Accrued expenses and other liabilities | 2,921 | 8,712 | 4,349 | ||||||||
Due to affiliates | (293 | ) | 293 | — | |||||||
Net cash used in operating activities | (42,416 | ) | (32,303 | ) | (112,226 | ) | |||||
Investing activities: | |||||||||||
Purchases of property and equipment | (439 | ) | (418 | ) | (883 | ) | |||||
Cash assumed from joint venture at consolidation | 2,009 | — | — | ||||||||
Contributions and advances to unconsolidated joint ventures | (15,088 | ) | (15,028 | ) | (34,610 | ) | |||||
Distributions of capital from unconsolidated joint ventures | 15,307 | 32,026 | 10,609 | ||||||||
Net cash provided by (used in) investing activities | 1,789 | 16,580 | (24,884 | ) | |||||||
Financing activities: | |||||||||||
Net proceeds from issuance of common stock | — | 47,253 | 87,800 | ||||||||
Repurchase of common stock | — | — | (11,989 | ) | |||||||
Cash distributions to noncontrolling interest in subsidiary | (725 | ) | (2,411 | ) | (52 | ) | |||||
Borrowings from credit facility | 223,050 | 99,450 | 100,474 | ||||||||
Repayments of credit facility | (179,974 | ) | (125,000 | ) | — | ||||||
Borrowings from other notes payable | 343 | 3,552 | 11,162 | ||||||||
Repayments of other notes payable | (15,636 | ) | (5,171 | ) | (15,768 | ) | |||||
Payment of debt issuance costs | (1,064 | ) | — | — | |||||||
Minimum tax withholding paid on behalf of employees for stock awards | (648 | ) | (248 | ) | — | ||||||
Excess income tax (provision)/benefit from stock-based compensation | (97 | ) | 97 | — | |||||||
Proceeds from exercise of stock options | — | 17 | — | ||||||||
Net cash provided by financing activities | 25,249 | 17,539 | 171,627 | ||||||||
Net increase (decrease) in cash and cash equivalents | (15,378 | ) | 1,816 | 34,517 | |||||||
Cash and cash equivalents – beginning of period | 45,874 | 44,058 | 9,541 | ||||||||
Cash and cash equivalents – end of period | $ | 30,496 | $ | 45,874 | $ | 44,058 | |||||
See accompanying notes to the consolidated financial statements.
57
1. Organization and Summary of Significant Accounting Policies
Organization
The New Home Company Inc. (the “Company”), a Delaware Corporation, and its subsidiaries are primarily engaged in all aspects of residential real estate development, including acquiring land and designing, constructing and selling homes in California and Arizona.
Initial Public and Follow-On Offerings
The Company completed its initial public offering (“IPO”) on January 30, 2014. In preparation for the IPO, the Company reorganized from a Delaware limited liability company (“LLC”) into a Delaware corporation, issuing 8,636,250 shares of common stock to the former members of the LLC in the Company's formation transactions, and changed its name to The New Home Company Inc. As a result of the IPO, the Company issued and sold 8,984,375 shares of common stock (including 1,171,875 shares sold pursuant to the underwriters' exercise of their option to purchase additional shares from the Company) at the public offering price of $11.00 per share. In accordance with the terms of the IPO, with net proceeds received from the underwriters' exercise of their option to purchase additional shares, the Company repurchased 1,171,875 shares of its common stock issued to a member of the LLC in connection with the Company's formation transactions. The Company received proceeds of $75.8 million, net of the underwriting discount, offering expenses and the repurchase of shares. Upon the close of the IPO, the Company had 16,448,750 common shares outstanding.
On December 9, 2015, the Company completed a follow-on equity offering, issuing and selling 4,025,000 shares of common stock (including 525,000 shares sold pursuant to the underwriter's exercise of their option to purchase additional shares from the Company) at a public offering price of $12.50 per share. The Company received proceeds of $47.3 million, net of the underwriting discount and offering expenses. After the closing of the follow-on offering, the Company had 20,541,546 common shares outstanding.
Basis of Presentation
The consolidated financial statements include the accounts of the Company and its wholly owned subsidiaries. All significant intercompany accounts have been eliminated upon consolidation.
The accompanying financial statements have been prepared in accordance with U.S. generally accepted accounting principles (“GAAP”) as contained within the Financial Accounting Standards Board (“FASB”) Accounting Standards Codification (“ASC”).
Unless the context otherwise requires, the terms “we”, “us”, “our” and “the Company” refer to the Company and its wholly owned subsidiaries, on a consolidated basis.
Use of Estimates
The preparation of the Company’s consolidated financial statements in conformity with GAAP requires management to make estimates and assumptions that affect the amounts reported in the accompanying consolidated financial statements and notes. Accordingly, actual results could differ materially from these estimates.
Reclassifications
Certain items in prior year consolidated financial statements related to capitalized selling and marketing expenses have been reclassified to conform with current year presentation. Effective January 1, 2016, these costs were amortized to selling and marketing expenses rather than cost of home sales in the accompanying consolidated statements of operations. Effective July 1, 2016, capitalized selling and marketing costs were reclassified to other assets from real estate inventories in the accompanying consolidated balance sheets. Prior year amounts have been reclassified to conform to the current period presentation. Please see "Selling and Marketing Expense" below for more information.
Segment Reporting
Accounting Standards Codification ("ASC") 280, Segment Reporting (“ASC 280”) established standards for the manner in which public enterprises report information about operating segments. In accordance with ASC 280, we have determined that our homebuilding division and our fee building division are our operating segments. Corporate is a non-operating segment.
58
Cash and Cash Equivalents
We define cash and cash equivalents as cash on hand, demand deposits with financial institutions, and short term liquid investments with a maturity date of less than three months from the date of purchase.
Restricted Cash
Restricted cash of $0.6 million and $0.4 million as of December 31, 2016 and 2015, respectively, is held in accounts for payments of subcontractor costs incurred in connection with various fee building projects.
Real Estate Inventories and Cost of Sales
We capitalize pre-acquisition, land, development and other allocated costs, including interest, property taxes and indirect construction costs. Pre-acquisition costs, including non-refundable land deposits, are expensed to other expense, net, if we determine continuation of the prospective project is not probable.
Land, development and other common costs are typically allocated to real estate inventories using a methodology that approximates the relative-sales-value method. Home construction costs per production phase are recorded using the specific identification method. Cost of sales for homes closed includes the estimated total construction costs of each home at completion and an allocation of all applicable land acquisition, land development and related common costs (both incurred and estimated to be incurred) based upon the relative-sales-value of the home within each project. Changes in estimated development and common costs are allocated prospectively to remaining homes in the project.
In accordance with Accounting Standards Codification ("ASC") 360, Property, Plant and Equipment (“ASC 360”), inventory is stated at cost, unless the carrying amount is determined not to be recoverable, in which case inventory is written down to its fair value. We review each real estate asset on a periodic basis or whenever indicators of impairment exist. Real estate assets include projects actively selling and projects under development or held for future development. Indicators of impairment include, but are not limited to, significant decreases in local housing market values and selling prices of comparable homes, significant decreases in gross margins and sales absorption rates, costs significantly in excess of budget, and actual or projected cash flow losses.
If there are indicators of impairment, we perform a detailed budget and cash flow review of the applicable real estate inventories to determine whether the estimated remaining undiscounted future cash flows of the project are more or less than the asset’s carrying value. If the undiscounted estimated future cash flows are more than the asset’s carrying value, no impairment adjustment is required. However, if the undiscounted estimated future cash flows are less than the asset’s carrying value, the asset is deemed impaired and is written down to fair value.
When estimating undiscounted estimated future cash flows of a project, we make various assumptions, including: (i) expected sales prices and sales incentives to be offered, including the number of homes available, pricing and incentives being offered by us or other builders in other projects, and future sales price adjustments based on market and economic trends; (ii) expected sales pace and cancellation rates based on local housing market conditions, competition and historical trends; (iii) costs expended to date and expected to be incurred including, but not limited to, land and land development costs, home construction costs, interest costs, indirect construction and overhead costs, and selling and marketing costs; (iv) alternative product offerings that may be offered that could have an impact on sales pace, sales price and/or building costs; and (v) alternative uses for the property.
Many assumptions are interdependent and a change in one may require a corresponding change to other assumptions. For example, increasing or decreasing sales absorption rates has a direct impact on the estimated per unit sales price of a home, the level of time sensitive costs (such as indirect construction, overhead and carrying costs), and selling and marketing costs (such as model maintenance costs and advertising costs). Depending on the underlying objective of the project, assumptions could have a significant impact on the projected cash flow analysis. For example, if our objective is to preserve operating margins, our cash flow analysis will be different than if the objective is to increase the velocity of sales. These objectives may vary significantly from project to project and over time.
If real estate assets are considered impaired, the impairment adjustments are calculated by determining the amount the asset's carrying value exceeds its fair value. We calculate the fair value of real estate projects under either a land residual value analysis or a discounted cash flow analysis. Under the land residual value analysis, we estimate what a willing buyer would pay and what a willing seller would sell a parcel of land for (other than in a forced liquidation) in order to generate a market rate operating margin and return. Under the discounted cash flow method, the fair value is determined by calculating the present value of future cash flows using a risk adjusted discount rate. Critical assumptions that are included as part of these analyses include estimating future housing revenues, sales absorption rates, land development, construction and related carrying costs
59
(including future capitalized interest), and all direct selling and marketing costs. This evaluation and the assumptions used by management to determine future estimated cash flows and fair value require a substantial degree of judgment, especially with respect to real estate projects that have a substantial amount of development to be completed, have not started selling or are in the early stages of sales, or are longer in duration. Actual revenues, costs and time to complete and sell a community could vary from these estimates which could impact the calculation of fair value of the asset and the corresponding amount of impairment that is recorded in our results of operations.
Capitalization of Interest
We follow the practice of capitalizing interest to real estate inventories during the period of development and to investments in unconsolidated joint ventures, when applicable, in accordance with ASC 835, Interest (“ASC 835”). Interest capitalized as a component of cost of real estate inventories is included in cost of home sales as related homes or lots are sold. To the extent interest is capitalized to investment in unconsolidated joint ventures, it is included as a reduction of income from unconsolidated joint ventures when the related homes or lots are sold to third parties. To the extent our debt exceeds our qualified assets as defined in ASC 835, we expense a portion of the interest incurred by us. Qualified assets represent projects that are actively selling or under development as well as investments in unconsolidated joint ventures accounted for under the equity method until such equity investees begin their principal operations.
Revenue Recognition
Home Sales and Profit Recognition
In accordance with ASC 360, revenue from home sales and other real estate sales are recorded and a profit is recognized when the respective homes are closed under the full accrual method. Home sales and other real estate sales are closed when all conditions of escrow are met, including delivery of the home or other real estate asset, title passes, appropriate consideration is received and collection of associated receivables, if any, is reasonably assured. Sales incentives are a reduction of revenues when the respective home is closed. When it is determined that the earnings process is not complete, the sale and related profit are deferred for recognition in future periods. The profit we record is based on the calculation of cost of sales, which is dependent on our allocation of costs, as described in more detail above in the section entitled “Real Estate Inventories and Cost of Sales.”
Fee Building
The Company enters into fee building agreements to provide services whereby it builds homes on behalf of independent third-party property owners. The independent third-party property owner funds all project costs incurred by the Company to build and sell the homes. The Company primarily enters into cost plus fee contracts where it charges independent third-party property owners for all direct and indirect costs, plus a negotiated management fee. For these types of contracts, the Company recognizes revenue based on the actual total costs it has expended plus the applicable management fee. The management fee is typically a fixed fee based on a percentage of the cost or home sales revenue of the project depending on the terms of the agreement with the independent third-party property owner. In accordance with ASC 605, Revenue Recognition (“ASC 605”), revenues from fee building services are recognized using a cost-to-cost approach in applying the percentage-of-completion method. Under this approach, revenue is earned in proportion to total costs incurred, divided by total costs expected to be incurred. The total estimated cost plus the management fee represents the total contract value. The Company recognizes revenue based on the actual labor and other direct costs incurred, plus the portion of the management fee it has earned to date. In the course of providing its services, the Company routinely subcontracts for services and incurs other direct costs on behalf of the property owners. These costs are passed through to the property owners and, in accordance with industry practice and GAAP, are included in the Company’s revenue and cost of revenue. The Company recognizes revenue for any incentive compensation when such financial thresholds are probable of being met and such compensation is deemed to be collectible, generally at the date the amount is communicated to us by the independent third-party property owner.
The Company also enters into fee building and management contracts with third parties and its unconsolidated joint ventures where it provides construction supervision services, as well as sales and marketing services, and does not bear financial risks for any services provided. In accordance with ASC 605, revenues from these services are recognized over a proportional performance method or completed performance method. Under ASC 605, revenue is earned as services are provided in proportion to total services expected to be provided to the customer or on a straight line basis if the pattern of performance cannot be determined. Costs are recognized as incurred. Revenue recognition for any portion of the fees earned from these services that are contingent upon a financial threshold or specific event is deferred until the threshold is achieved or the event occurs.
60
The Company’s fee building revenues have historically been concentrated with a small number of customers. For the years ended December 31, 2016, 2015 and 2014, one customer comprised 96%, 92% and 87% of fee building revenue, respectively. The balance of the fee building revenues represented management fees earned from unconsolidated joint ventures. As of December 31, 2016 and 2015, one customer comprised 87% and 74% of contracts and accounts receivables, respectively.
Variable Interest Entities
The Company accounts for variable interest entities in accordance with ASC 810, Consolidation (“ASC 810”). Under ASC 810, a variable interest entity (“VIE”) is created when: (a) the equity investment at risk in the entity is not sufficient to permit the entity to finance its activities without additional subordinated financial support provided by other parties, including the equity holders; (b) the entity’s equity holders as a group either (i) lack the direct or indirect ability to make decisions about the entity, (ii) are not obligated to absorb expected losses of the entity or (iii) do not have the right to receive expected residual returns of the entity; or (c) the entity’s equity holders have voting rights that are not proportionate to their economic interests, and the activities of the entity involve or are conducted on behalf of the equity holder with disproportionately few voting rights. If an entity is deemed to be a VIE pursuant to ASC 810, the enterprise that has both (i) the power to direct the activities of a VIE that most significantly impact the entity’s economic performance and (ii) the obligation to absorb the expected losses of the entity or right to receive benefits from the entity that could be potentially significant to the VIE is considered the primary beneficiary and must consolidate the VIE.
Under ASC 810, a non-refundable deposit paid to an entity may be deemed to be a variable interest that will absorb some or all of the entity’s expected losses if they occur. Our land purchase and lot option deposits generally represent our maximum exposure to the land seller if we elect not to purchase the optioned property. In some instances, we may also expend funds for due diligence, development and construction activities with respect to optioned land prior to takedown. Such costs are classified as real estate inventories, which we would have to write off should we not exercise the option. Therefore, whenever we enter into a land option or purchase contract with an entity and make a non-refundable deposit, a VIE may have been created.
As of December 31, 2016 and 2015, the Company was not required to consolidate any VIEs. In accordance with ASC 810, we perform ongoing reassessments of whether we are the primary beneficiary of a VIE.
Noncontrolling Interest
During 2013, the Company entered into a joint venture agreement with a third-party property owner. In accordance with ASC 810, the Company analyzed this arrangement and determined that it was not a VIE; however, the Company determined it was required to consolidate the joint venture as the Company has a controlling financial interest with the powers to direct the major decisions of the entity. As of December 31, 2016 and 2015, the third-party investor had an equity balance of $0.1 million and $0.9 million, respectively.
Investments in and Advances to Unconsolidated Joint Ventures
We use the equity method to account for investments in homebuilding and land development joint ventures that qualify as VIEs where we are not the primary beneficiary and other entities that we do not control but have the ability to exercise significant influence over the operating and financial policies of the investee. The Company also uses the equity method when we function as the managing member or general partner and our venture partner has substantive participating rights or where we can be replaced by our venture partner as managing member without cause.
As noted above, as of December 31, 2016 and 2015, the Company concluded that some of its joint ventures were VIEs. The Company concluded that it was not the primary beneficiary of the variable interest entities and, accordingly, accounted for these entities under the equity method of accounting.
Under the equity method, we recognize our proportionate share of earnings and losses generated by the joint venture upon the delivery of lots or homes to third parties. Our proportionate share of intra-entity profits and losses are eliminated until the related asset has been sold by the unconsolidated joint venture to third parties. We classify cash distributions received from equity method investees using the cumulative earnings approach. Our ownership interests in our unconsolidated joint ventures vary, but are generally less than or equal to 35%. The accounting policies of our joint ventures are consistent with those of the Company.
We review real estate inventory held by our unconsolidated joint ventures for impairment, consistent with our real estate inventories. We also review our investments in and advances to unconsolidated joint ventures for evidence of other-than-
61
temporary declines in value. To the extent we deem any portion of our investment in and advances to unconsolidated joint ventures as not recoverable, we impair our investment accordingly. For the years ended December 31, 2016, 2015 and 2014, no impairments related to investment in and advances to unconsolidated joint ventures were recorded.
The Company selectively provides loan-to-value (“LTV”) maintenance agreements and completion agreements for debt owed by its unconsolidated joint ventures. Such arrangements facilitate the financing of our joint ventures' development projects and arise in the ordinary course of business. Refer to Note 10 for more information discussing the LTV maintenance agreements and completion agreements.
Selling and Marketing Expense
Selling and marketing costs incurred to sell real estate projects are capitalized if they are reasonably expected to be recovered from the sale of the project or from incidental operations, and are incurred for tangible assets that are used directly through the selling period to aid in the sale of the project or services that have been performed to obtain regulatory approval of sales. These capitalizable selling and marketing costs include, but are not limited to, model home design, model home decor and landscaping, and sales office/design studio setup. Effective January 1, 2016, these costs were amortized to selling and marketing expenses rather than cost of home sales. Prior year periods have been reclassified to conform with current year presentation. The reclassification caused homebuilding gross margin to increase by approximately $4.8 million and $0.8 million, respectively, for the years ended December 31, 2015 and 2014, respectively, or 1.7% and 1.5% of home sales revenue, respectively, and a corresponding increase to selling and marketing expenses by the same amount. All other selling and marketing costs, such as commissions and advertising, are expensed in the period incurred and included in selling and marketing expense in the accompanying consolidated statements of operations. Effective July 1, 2016, these capitalized costs were reclassified to other assets from real estate inventories. Prior year periods have been reclassified to conform to current year presentation including $9.3 million reclassified from real estate inventories to other assets in the accompanying consolidated balance sheet as of December 31, 2015.
Warranty Accrual
We offer warranties on our homes that generally cover various defects in workmanship or materials, or structural construction defects for one year. Estimated future direct warranty costs are accrued and charged to cost of sales in the period when the related homebuilding revenues are recognized. Amounts are accrued based upon the Company’s historical rates. In addition, the Company has received warranty payments from third-party property owners for certain of its fee building projects that have since closed-out where the Company has the contractual risk of construction. These payments are recorded as warranty accruals. We assess the adequacy of our warranty accrual on a quarterly basis and adjust the amounts recorded if necessary. Our warranty accrual is included in accrued expenses and other liabilities in the accompanying consolidated balance sheets and adjustments to our warranty accrual are recorded through cost of sales.
Contracts and Accounts Receivable
Contracts and accounts receivable primarily represent the fees earned, but not collected, and reimbursable project costs incurred in connection with fee building agreements. The Company periodically evaluates the collectability of its contracts receivable, and, if it is determined that a receivable might not be fully collectible, an allowance is recorded for the amount deemed uncollectible. This allowance for doubtful accounts is estimated based on management’s evaluation of the contracts involved and the financial condition of its customers. Factors considered in such evaluations include, but are not limited to: (i) customer type; (ii) historical contract performance; (iii) historical collection and delinquency trends; (iv) customer credit worthiness; and (v) general economic conditions. In addition to contracts receivable, escrow receivables are included in contracts and accounts receivable in the accompanying consolidated balance sheets. As of December 31, 2016 and 2015, no allowance was recorded related to contracts and accounts receivable.
Property and Equipment
Property and equipment are recorded at cost and included in other assets in the accompanying consolidated balance sheets and depreciated using the straight-line method over their estimated useful lives ranging from three to five years. Leasehold improvements are stated at cost and are amortized using the straight-line method over the shorter of either their estimated useful lives or the term of the lease. For the years ended December 31, 2016, 2015 and 2014, the Company incurred depreciation expense of $0.5 million, $0.5 million and $0.4 million, respectively.
62
Income Taxes
Income taxes are accounted for in accordance with ASC 740, Income Taxes (“ASC 740”). As a result of the conversion from an LLC to a taxable entity in connection with the Company's IPO, the Company recognized a cumulative net deferred tax asset of $1.5 million related to the difference between the financial statement basis and tax basis of the assets and liabilities as of January 30, 2014. Subsequent to the conversion, the consolidated provision for, or benefit from, income taxes are calculated using the asset and liability method, under which deferred tax assets and liabilities are recorded based on the difference between the financial statement and tax basis of assets and liabilities using enacted tax rates in effect for the year in which the differences are expected to reverse.
Deferred tax assets are evaluated on a quarterly basis to determine if adjustments to the valuation allowance are required. In accordance with ASC 740, we assess whether a valuation allowance should be established based on the consideration of all available evidence using a “more likely than not” standard with respect to whether deferred tax assets will be realized. The ultimate realization of deferred tax assets depends primarily on the generation of future taxable income during the periods in which the differences become deductible. The value of our deferred tax assets will depend on applicable income tax rates. Judgment is required in determining the future tax consequences of events that have been recognized in our consolidated financial statements and/or tax returns. Differences between anticipated and actual outcomes of these future tax consequences could have a material impact on our consolidated financial statements.
ASC 740 defines the methodology for recognizing the benefits of uncertain tax return positions as well as guidance regarding the measurement of the resulting tax benefits. These provisions require an enterprise to recognize the financial statement effects of a tax position when it is more likely than not (defined as a likelihood of more than 50%), based on the technical merits, that the position will be sustained upon examination. In addition, these provisions provide guidance on derecognition, classification, interest and penalties, accounting in interim periods, disclosure, and transition. The evaluation of whether a tax position meets the more-likely-than-not recognition threshold requires a substantial degree of judgment by management based on the individual facts and circumstances.
Stock-Based Compensation
We account for share-based awards in accordance with ASC 718, Compensation – Stock Compensation (“ASC 718”) and ASC 505-50, Equity – Equity Based Payments to Non-Employees (“ASC 505-50”).
ASC 718 requires that the cost resulting from all share-based payment transactions be recognized in a company's financial statements. ASC 718 requires all entities to apply a fair-value-based measurement method in accounting for share-based payment transactions with employees except for equity instruments held by employee share ownership plans.
On June 26, 2015, the Company entered into an agreement that transitioned Joseph Davis' role within the Company from Chief Investment Officer to a non-employee consultant to the Company. Per the agreement, Mr. Davis' outstanding restricted stock units and stock option equity awards will continue to vest in accordance with their original terms. Under ASC 505-50, if an employee becomes a non-employee and continues to vest in an award pursuant to the award's original terms, that award will be treated as an award to a non-employee prospectively, provided the individual is required to continue providing services to the employer (such as consulting services). Based on the terms and conditions of Mr. Davis' consulting agreement noted above, we account for Mr. Davis' share-based awards in accordance with ASC 505-50.
ASC 505-50 requires that Mr. Davis' award be accounted for prospectively, such that the fair value of the award will be re-measured at each reporting date until the earlier of (a) the performance commitment date or (b) the date the services required under the transition agreement with Mr. Davis have been completed. ASC 505-50 requires that compensation cost ultimately recognized in the Company's financial statements be the sum of (a) the compensation cost recognized during the period of time the individual was an employee (based on the grant-date fair value) plus (b) the fair value of the award determined on the measurement date determined in accordance with ASC 505-50 for the pro-rata portion of the vesting period in which the individual was a non-employee. Mr. Davis' outstanding awards fully vest during January 2017 and at that time, the award will be re-measured for the pro-rata portion of the vesting period in which he was a non-employee and the award will be fully expensed.
63
Recently Issued Accounting Standards
The Company qualifies as an “emerging growth company” pursuant to the provisions of the Jumpstart Our Business Startups Act of 2012 (the “JOBS Act”). Section 102 of the JOBS Act provides that an “emerging growth company” can take advantage of the extended transition period provided in Section 7(a)(2)(B) of the Securities Act of 1933, as amended, for complying with new or revised accounting standards. As previously disclosed, the Company has chosen, irrevocably, to “opt out” of such extended transition period, and as a result, will comply with new or revised accounting standards on the relevant dates on which adoption of such standards is required for non-emerging growth companies.
In May 2014, the Financial Accounting Standards Board (“FASB”) issued Accounting Standards Update (“ASU”) No. 2014-09, Revenue from Contracts with Customers (“ASU 2014-09”), which supersedes existing accounting literature relating to how and when a company recognizes revenue. Under ASU 2014-09, a company will recognize revenue when it transfers promised goods or services to customers in an amount that reflects the consideration to which the company expects to be entitled in exchange for those goods and services. In August 2015, the FASB issued ASU No. 2015-14, Revenue from Contracts with Customers (Topic 606): Deferral of the Effective Date, which delayed the effective date of ASU 2014-09 by one year. As a public company, ASU 2014-09 is effective for our interim and annual reporting periods beginning after December 15, 2017, and at that time, we expect to adopt the new standard under the modified retrospective approach. We do not believe the adoption of ASU 2014-09 will have a material impact on the amount or timing of our home building revenues. Although we are still evaluating the accounting for marketing costs under the new standard, there is a possibility that the adoption of ASU 2014-09 will impact the timing of recognition and classification in our consolidated financial statements of certain capitalized selling and marketing costs we incur to obtain sales contracts from our customers. Currently, these selling and marketing costs are capitalized to other assets and amortized to selling and marketing expenses as homes are delivered. Under the new guidance, some of these costs may need to be expensed immediately. We are continuing to evaluate the impact the adoption may have on other aspects of our business and on our consolidated financial statements and disclosures.
In June 2014, the FASB issued ASU No. 2014-12, Accounting for Share-Based Payments When the Terms of an Award Provide That a Performance Target Could Be Achieved after the Requisite Service Period (“ASU 2014-12”), which requires that a performance target that affects vesting and that could be achieved after the requisite service period be treated as a performance condition. A reporting entity should apply existing guidance in ASC 718, as it relates to awards with performance conditions that affect vesting to account for such awards. The Company adopted ASU 2014-12 for the annual period ending December 31, 2016 with no material effect on our consolidated financial statements and related disclosures as the Company has no outstanding share-based awards subject to performance targets.
In February 2015, the FASB issued Accounting Standards Update ASU No. 2015-02, Amendments to the Consolidation Analysis (“ASU 2015-02”), which changes the analysis that a reporting entity must perform to determine whether it should consolidate certain types of legal entities. Our adoption of ASU 2015-02 for the annual period ended December 31, 2016 resulted in no material effect on our consolidated financial statements and related disclosures.
In April 2015, the FASB issued Accounting Standards Update ASU No. 2015-03, Simplifying the Presentation of Debt Issuance Costs (“ASU 2015-03”), which requires that debt issuance costs related to a recognized debt liability be presented in the balance sheet as a direct deduction from the carrying amount of that debt liability, consistent with debt discounts. We adopted ASU 2015-03 for the annual period ending December 31, 2016 and it did not have any effect on our consolidated financial statements and related disclosures as the treatment of the Company's current debt issuance costs is covered under ASU No. 2015-15, Presentation and Subsequent Measurement of Debt Issuance Costs Associated with Line-of-Credit Arrangements – Amendments to SEC Paragraphs Pursuant to Staff Announcement at June 18, 2015 EITF Meeting, discussed below.
In August 2015, the FASB issued ASU No. 2015-15, Presentation and Subsequent Measurement of Debt Issuance Costs Associated with Line-of-Credit Arrangements – Amendments to SEC Paragraphs Pursuant to Staff Announcement at June 18, 2015 EITF Meeting (“ASU 2015-15”), which clarifies the treatment of debt issuance costs from line-of-credit arrangements after the adoption of ASU 2015-03. In particular, ASU 2015-15 clarifies that the SEC staff would not object to an entity deferring and presenting debt issuance costs as an asset and subsequently amortizing the deferred debt issuance costs ratably over the term of the line-of-credit arrangement, regardless of whether there are any outstanding borrowings on the line-of-credit arrangement. Under ASU 2015-15, debt issuance costs from our unsecured revolving credit facility are capitalized to other assets and subsequently amortized over the term of the borrowing agreement.
In February 2016, the FASB issued ASU No. 2016-02, Leases (Topic 842) (“ASU 2016-02”). ASU 2016-02 will require organizations that lease assets (referred to as “lessees”) to recognize on the balance sheet the assets and liabilities for the rights and obligations created by those leases. Under ASU 2016-02, a lessee will be required to recognize assets and liabilities for leases with lease terms of more than 12 months. Lessor accounting remains substantially similar to current
64
GAAP. In addition, disclosures of leasing activities are to be expanded to include qualitative along with specific quantitative information. ASU 2016-02 is effective for fiscal years beginning after December 15, 2018, including interim periods within those fiscal years. ASU 2016-02 mandates a modified retrospective transition method. This guidance is not expected to have a material impact on our consolidated financial statements.
In March 2016, the FASB issued ASU No. 2016-09, Compensation - Stock Compensation (Topic 718): Improvements to Employee Share-Based Payment Accounting (“ASU 2016-09”). ASU 2016-09 simplifies several aspects of the accounting for share-based payment transactions, including the income tax consequences, classification of awards as either equity or liabilities, and classification on the statement of cash flows. The Company will adopt ASU 2016-09 for the annual period ending December 31, 2017. The adoption is not expected to have a material impact on our consolidated financial statements as the Company has no existing APIC pools at December 31, 2016 to absorb future excess tax deficiencies from share-based payment awards.
In August 2016, the FASB issued ASU No. 2016-15, Statement of Cash Flows (Topic 230): Classification of Certain Cash Receipts and Cash Payments ("ASU 2016-15"). ASU 2016-15 provides guidance on how certain cash receipts and cash payments are to be presented and classified in the statement of cash flows. ASU 2016-15 is effective for annual periods and interim periods within those annual periods beginning after December 15, 2017, and early adoption is permitted. We are currently evaluating the impact adoption will have on our financial statements. We do not expect the adoption of ASU 2016-15 to have a material effect on our consolidated financial statements and disclosures.
In November 2016, the FASB issued ASU No. 2016-18, Statement of Cash Flows (Topic 230): Restricted Cash ("ASU 2016-18"). ASU 2016-16 requires that a statement of cash flows explain the change during the period in the total of cash, cash equivalents, and amounts generally described as restricted cash or restricted cash equivalents. Therefore, amounts generally described as restricted cash and restricted cash equivalents should be included with cash and cash equivalents when reconciling the beginning-of-period and end-of-period total amounts shown on the statement of cash flows. ASU 2016-18 is effective for fiscal years beginning after December 15, 2017, and interim periods within those fiscal years. Early adoption is permitted. The guidance is not expected to have a material impact on our consolidated financial statements.
65
2. Computation of Earnings Per Share
Basic and diluted earnings per share for the years ended December 31, 2016, 2015 and 2014 give effect to the conversion of the Company’s members’ equity into common stock on January 30, 2014 as though the conversion had occurred as of the beginning of the reporting period or the original date of issuance, if later. The number of shares converted was based on the actual IPO price of $11.00 per share.
The following table sets forth the components used in the computation of basic and diluted earnings per share for the years ended December 31, 2016, 2015 and 2014:
Year Ended December 31, | |||||||||||
2016 | 2015 | 2014 | |||||||||
(Dollars in thousands, except per share amounts) | |||||||||||
Numerator: | |||||||||||
Net income attributable to The New Home Company Inc. | $ | 21,022 | $ | 21,688 | $ | 4,787 | |||||
Denominator: | |||||||||||
Basic weighted-average shares outstanding | 20,685,386 | 16,767,513 | 15,927,917 | ||||||||
Effect of dilutive shares: | |||||||||||
Stock options and unvested restricted stock units | 106,059 | 173,575 | 41,282 | ||||||||
Diluted weighted-average shares outstanding | 20,791,445 | 16,941,088 | 15,969,199 | ||||||||
Basic earnings per share attributable to The New Home Company Inc. | $ | 1.02 | $ | 1.29 | $ | 0.30 | |||||
Diluted earnings per share attributable to The New Home Company Inc. | $ | 1.01 | $ | 1.28 | $ | 0.30 | |||||
Antidilutive stock options and unvested restricted stock units not included in diluted earnings per share | 849,977 | 7,414 | 796,864 | ||||||||
3. Contracts and Accounts Receivable
Contracts and accounts receivable consist of the following:
December 31, | |||||||
2016 | 2015 | ||||||
(Dollars in thousands) | |||||||
Contracts receivable: | |||||||
Costs incurred on fee building projects | $ | 178,103 | $ | 139,677 | |||
Estimated earnings | 8,404 | 10,213 | |||||
186,507 | 149,890 | ||||||
Less: amounts collected during the period | (162,203 | ) | (132,109 | ) | |||
Contracts receivable | $ | 24,304 | $ | 17,781 | |||
Contracts receivable: | |||||||
Billed | $ | — | $ | — | |||
Unbilled | 24,304 | 17,781 | |||||
24,304 | 17,781 | ||||||
Accounts receivable: | |||||||
Escrow receivables | 3,385 | 6,179 | |||||
Other receivables | 144 | — | |||||
Contracts and accounts receivable | $ | 27,833 | $ | 23,960 | |||
66
Billed contracts receivable represent amounts billed to customers that have yet to be collected. Unbilled contracts receivable represents the contract revenue recognized but not yet billable pursuant to contract terms or administratively not invoiced. All unbilled receivables as of December 31, 2016 and 2015 are expected to be billed and collected within 90 days. Accounts payable at December 31, 2016 and 2015 includes $22.8 million and $16.7 million, respectively, related to costs incurred under the Company’s fee building contracts.
4. Real Estate Inventories and Capitalized Interest
Real estate inventories are summarized as follows:
December 31, | |||||||
2016 | 2015 | ||||||
(Dollars in thousands) | |||||||
Deposits and pre-acquisition costs | $ | 38,723 | $ | 17,133 | |||
Land held and land under development | 98,596 | 57,659 | |||||
Homes completed or under construction | 93,628 | 100,523 | |||||
Model homes | 55,981 | 25,321 | |||||
$ | 286,928 | $ | 200,636 | ||||
All of our deposits and pre-acquisition costs are non-refundable, except for $4.1 million and $0.5 million as of December 31, 2016 and 2015, respectively.
Land held and land under development includes costs incurred during site development such as land, development, indirects, and permits. Homes completed or under construction and model homes (except for capitalized selling and marketing costs, which have been classified in other assets) include all costs associated with home construction, including land, development, indirects, permits, materials and labor.
In accordance with Accounting Standards Codification ("ASC") 360, Property, Plant and Equipment (“ASC 360”), inventory is stated at cost, unless the carrying amount is determined not to be recoverable, in which case inventory is written down to its fair value. We review each real estate asset at the community-level, on a quarterly basis or whenever indicators of impairment exist. For the year ended December 31, 2016, the Company recognized real estate-related impairments of $3.5 million in cost of sales resulting in a decrease of the same amount to income before income taxes for our homebuilding segment. Fair value for homebuilding projects impaired during 2016 was calculated using a land residual value analysis and under a discounted cash flow model. The project cash flows were discounted at rates ranging from 10-14%. Fair value for the land sales project impaired during 2016 was determined using the land purchase price included in the executed sales agreement, less the Company's cost to sell. The following table summarizes inventory impairments recorded during the years ended December 31, 2016, 2015 and 2014:
Year Ended December 31, | |||||||||||
2016 | 2015 | 2014 | |||||||||
(Dollars in Thousands) | |||||||||||
Inventory impairments: | |||||||||||
Home sales | $ | 2,350 | $ | — | $ | — | |||||
Land sales | 1,150 | — | — | ||||||||
Total inventory impairments | $ | 3,500 | $ | — | $ | — | |||||
Remaining carrying value of inventory impaired at year end | $ | 30,225 | $ | — | $ | — | |||||
Number of projects impaired during the year | 3 | — | — | ||||||||
Total number of projects subject to periodic impairment review during the year (1) | 27 | 18 | 14 | ||||||||
(1) | Represents the peak number of real estate projects that we had during each respective year. The number of projects outstanding at the end of each year may be less than the number of projects listed herein. |
67
The home sales impairments of $2.4 million related to land under development and homes completed or under construction for two active homebuilding communities. These communities were experiencing slow monthly sales absorption rates, and the Company determined that additional incentives were required to sell the remaining homes and lots at estimated aggregate sales prices that would be lower than its previous carrying values. One community is located in Southern California and the other is located in Northern California. The land sales impairments of $1.2 million related to land under development in Northern California that the Company intends to sell once certain improvements are complete.
Interest is capitalized to inventory during development and other qualifying activities. Interest capitalized as a cost of inventory is included in cost of sales as related homes are closed. For the years ended December 31, 2016, 2015 and 2014 interest incurred, capitalized and expensed was as follows:
Year Ended December 31, | |||||||||||
2016 | 2015 | 2014 | |||||||||
(Dollars in thousands) | |||||||||||
Interest incurred | $ | 7,484 | $ | 4,722 | $ | 1,857 | |||||
Interest capitalized | (7,484 | ) | (4,722 | ) | (1,857 | ) | |||||
Interest expensed | $ | — | $ | — | $ | — | |||||
Capitalized interest in beginning inventory | $ | 4,190 | $ | 2,328 | $ | 1,003 | |||||
Interest capitalized as a cost of inventory | 7,484 | 4,722 | 1,857 | ||||||||
Contribution to unconsolidated joint ventures | (1 | ) | (264 | ) | — | ||||||
Previously capitalized interest included in cost of sales | (5,331 | ) | (2,511 | ) | (532 | ) | |||||
Interest previously capitalized as a cost of inventory, included in other expense | — | (85 | ) | — | |||||||
Capitalized interest in ending inventory | $ | 6,342 | $ | 4,190 | $ | 2,328 | |||||
Capitalized interest as a percentage of inventory | 2.2 | % | 2.1 | % | 1.5 | % | |||||
Interest included in cost of sales as a percentage of home sales revenue | 1.0 | % | 0.9 | % | 0.9 | % | |||||
Contribution to unconsolidated joint ventures relates to interest capitalized as a cost of inventory, which was then contributed by the Company to unconsolidated joint ventures formed in each of 2016 and 2015.
68
5. Investments in and Advances to Unconsolidated Joint Ventures
As of December 31, 2016 and 2015, the Company had ownership interests in 13 and 14, respectively, unconsolidated joint ventures with ownership percentages that generally range from 5% to 35%. The condensed combined balance sheets for our unconsolidated joint ventures accounted for under the equity method are as follows:
December 31, | |||||||
2016 | 2015 | ||||||
(Dollars in thousands) | |||||||
Cash and cash equivalents | $ | 33,683 | $ | 53,936 | |||
Restricted cash | 8,374 | 12,279 | |||||
Real estate inventories | 386,487 | 415,730 | |||||
Other assets | 1,664 | 3,972 | |||||
Total assets | $ | 430,208 | $ | 485,917 | |||
Accounts payable and accrued liabilities | $ | 28,706 | $ | 57,813 | |||
Notes payable | 97,664 | 94,890 | |||||
Total liabilities | 126,370 | 152,703 | |||||
The New Home Company's equity | 46,857 | 60,572 | |||||
Other partners' equity | 256,981 | 272,642 | |||||
Total equity | 303,838 | 333,214 | |||||
Total liabilities and equity | $ | 430,208 | $ | 485,917 | |||
Debt-to-capitalization ratio | 24.3 | % | 22.2 | % | |||
Debt-to-equity ratio | 32.1 | % | 28.5 | % | |||
As of December 31, 2016 and 2015, the Company had advances outstanding of approximately $4.0 million and $0, respectively, to these unconsolidated joint ventures, which were included in the notes payable balances of the unconsolidated joint ventures in the table above.
The condensed combined statements of operations for our unconsolidated joint ventures accounted for under the equity method are as follows:
Year Ended December 31, | |||||||||||
2016 | 2015 | 2014 | |||||||||
(Dollars in thousands) | |||||||||||
Revenues | $ | 233,219 | $ | 409,881 | $ | 271,385 | |||||
Cost of sales and expenses | 207,028 | 344,687 | 230,211 | ||||||||
Net income of unconsolidated joint ventures | $ | 26,191 | $ | 65,194 | $ | 41,174 | |||||
Equity in net income of unconsolidated joint ventures reflected in the accompanying consolidated statements of operations | $ | 7,691 | $ | 13,767 | $ | 8,443 | |||||
The Company has entered into agreements with its unconsolidated joint ventures to provide management services related to the underlying projects (collectively referred to as the “Management Agreements”). Pursuant to the Management Agreements, the Company receives a management fee from its unconsolidated joint ventures based on each project’s revenues. For the years ended December 31, 2016, 2015 and 2014, the Company earned $8.2 million, $12.4 million, and $9.6 million, respectively, in management fees, which have been recorded as fee building revenues in the accompanying consolidated statements of operations.
On January 15, 2016, the Company entered into an assignment and assumption of membership interest agreement (the “Buyout Agreement”) for its partner's interest in the TNHC San Juan LLC unconsolidated joint venture. Per the terms of the Buyout Agreement, the Company contributed $20.6 million to the joint venture, and the joint venture made a liquidating cash distribution to our partner for the same amount in exchange for its membership interest. Prior to the buyout, the Company accounted for its investment in TNHC San Juan LLC as an equity method investment. After the buyout, TNHC San Juan LLC is now a wholly owned subsidiary of the Company.
69
During June 2016, our LR8 Investors LLC unconsolidated joint venture (LR8) made its final distributions, allocated $0.5 million of income to the Company from a reduction in reserves, and our outside equity partner exited the joint venture. Upon the change in control, we were required to consolidate this venture as a wholly owned subsidiary and the Company assumed the cash, accounts receivable, accounts payable, and accrued liabilities, including warranty reserve, of the joint venture. As part of this transaction, and in accordance with ASC 805, Business Combinations, the Company also recognized a gain of $1.1 million due to the purchase of our JV partner's interest for less than its carrying value.
On October 31, 2016, the Company entered into a $4.0 million unsecured promissory note with Encore McKinley Village, LLC, an unconsolidated joint venture. As of December 31, 2016, the amount of outstanding principal was $4.0 million. The note matures on August 31, 2017, with the right to extend to August 31, 2018, and bears interest at 10% per annum. The $4.0 million outstanding principal is included in investments in and advances to unconsolidated joint ventures in the accompanying consolidated balance sheets.
6. Other Assets
Other assets consist of the following:
December 31, | |||||||
2016 | 2015 | ||||||
(Dollars in thousands) | |||||||
Capitalized selling and marketing costs (1) | $ | 10,101 | $ | 9,282 | |||
Deferred tax asset, net | 8,434 | 7,516 | |||||
Property and equipment, net of accumulated depreciation | 857 | 929 | |||||
Prepaid expenses | 1,907 | 1,127 | |||||
Other assets | — | 15 | |||||
$ | 21,299 | $ | 18,869 | ||||
(1) | The Company amortized $9.2 million and $4.8 million of capitalized selling and marketing project costs to selling and marketing expenses during the years ended December 31, 2016 and 2015, respectively. |
7. Accrued Expenses and Other Liabilities
Accrued expenses and other liabilities consist of the following:
December 31, | |||||||
2016 | 2015 | ||||||
(Dollars in thousands) | |||||||
Warranty accrual | $ | 4,931 | $ | 4,181 | |||
Accrued compensation and benefits | 6,786 | 5,106 | |||||
Accrued interest | 648 | 453 | |||||
Completion reserve | 1,355 | 1,168 | |||||
Income taxes payable | 7,147 | 6,780 | |||||
Deferred profit from unconsolidated joint ventures | 957 | 1,603 | |||||
Other accrued expenses | 1,594 | 536 | |||||
$ | 23,418 | $ | 19,827 | ||||
70
Changes in our warranty accrual are detailed in the table set forth below:
Year Ended December 31, | |||||||||||
2016 | 2015 | 2014 | |||||||||
(Dollars in thousands) | |||||||||||
Beginning warranty accrual for homebuilding projects | $ | 3,846 | $ | 1,277 | $ | 810 | |||||
Warranty provision for homebuilding projects | 1,921 | 2,802 | 562 | ||||||||
Warranty assumed from joint venture at consolidation | 469 | — | — | ||||||||
Warranty payments for homebuilding projects | (563 | ) | (233 | ) | (95 | ) | |||||
Adjustment to warranty accrual | (1,065 | ) | — | — | |||||||
Ending warranty accrual for homebuilding projects | 4,608 | 3,846 | 1,277 | ||||||||
Beginning warranty accrual for fee building projects | 335 | 301 | 264 | ||||||||
Warranty provision for fee building projects | — | 57 | 62 | ||||||||
Warranty efforts for fee building projects | (12 | ) | (23 | ) | (25 | ) | |||||
Ending warranty accrual for fee building projects | 323 | 335 | 301 | ||||||||
Total ending warranty accrual | $ | 4,931 | $ | 4,181 | $ | 1,578 | |||||
During the third quarter of 2016, we recorded an adjustment of $1.1 million to our warranty accrual primarily due to lower than expected warranty related expenditures. The corresponding adjustment was included as a reduction to cost of home sales in the accompanying consolidated statements of operations.
8. Unsecured Revolving Credit Facility and Other Notes Payable
Notes payable consisted of the following:
December 31, | |||||||
2016 | 2015 | ||||||
(Dollars in thousands) | |||||||
Senior unsecured revolving credit facility | $ | 118,000 | $ | 74,924 | |||
Note payable to land seller | — | 6,000 | |||||
Construction loans | — | 2,158 | |||||
$ | 118,000 | $ | 83,082 | ||||
We have a senior unsecured revolving credit facility (the "Credit Facility") with a bank group. As of December 31, 2015, the total commitment under such Credit Facility was $200.0 million of which $74.9 million was outstanding. In May 2016, we increased the commitment under the Credit Facility from $200 million to $260 million with an accordion feature that allows borrowings thereunder to be increased up to an aggregate of $350 million, subject to certain conditions, including the availability of bank commitments, and extended the maturity date by one year to April 30, 2019. As of December 31, 2016, we had $118.0 million outstanding under the credit facility and $142.0 million in availability. We may repay advances at any time without premium or penalty. Interest is payable monthly and is charged at a rate of 1-month LIBOR plus a margin ranging from 2.25% to 3.00% depending on the Company’s leverage ratio as calculated at the end of each fiscal quarter. As of December 31, 2016, the interest rate under the facility was 3.52%. Pursuant to the Credit Facility, the Company is required to maintain certain financial covenants as defined in the Credit Facility, including (i) a minimum tangible net worth; (ii) maximum leverage ratios; (iii) a minimum liquidity covenant; and (iv) a minimum fixed charge coverage ratio based on EBITDA (as detailed in the Credit Facility) to interest incurred. As of December 31, 2016, the Company was in compliance with all financial covenants.
In December 2016, the Company retired a term loan with a land seller. The loan was secured by real estate, and bore interest at 7.0% per annum. Immediately prior to payoff, the land seller reduced the principal balance of $4.0 million by $250,000 in exchange for the immediate payoff of the note. The Company paid off the new principal balance of $3.75 million and recognized the $250,000 principal reduction as a gain in other expense, net, in the accompanying consolidated statements of operations.
In May 2014, we entered into two secured construction loans with a bank related to model and production homes for a specific project. The project closed out during 2016 and the associated loans were paid off.
71
Notes payable have stated maturities as follows for the years ending December 31 (dollars in thousands):
2017 | $ | — | |
2018 | — | ||
2019 | 118,000 | ||
$ | 118,000 | ||
9. Fair Value Disclosures
ASC 820, Fair Value Measurements and Disclosures, defines fair value as the price that would be received for selling an asset or paid to transfer a liability in an orderly transaction between market participants at measurement date and requires assets and liabilities carried at fair value to be classified and disclosed in the following three categories:
• | Level 1 – Quoted prices for identical instruments in active markets |
• | Level 2 – Quoted prices for similar instruments in active markets; quoted prices for identical or similar instruments in markets that are inactive; and model-derived valuations in which all significant inputs and significant value drivers are observable in active markets at measurement date |
• | Level 3 – Valuations derived from techniques where one or more significant inputs or significant value drivers are unobservable in active markets at measurement date |
Fair Value of Financial Instruments
The accompanying consolidated balance sheets include the following financial instruments: cash and cash equivalents, restricted cash, contracts and accounts receivable, due from affiliates, accounts payable, accrued expenses and other liabilities, due to affiliates, unsecured revolving credit facility and other notes payable.
The Company considers the carrying value of cash and cash equivalents, restricted cash, contracts and accounts receivable, accounts payable, and accrued expenses and other liabilities to approximate the fair value of these financial instruments based on the short duration between origination of the instruments and their expected realization. The fair value of amounts due from affiliates and due to affiliates is not determinable due to the related party nature of such amounts. As of December 31, 2016 and 2015, the fair value of the Company's unsecured revolving credit facility and other notes payable approximated the carrying value. The Company determined that the fair value estimates of its unsecured revolving credit facility and other notes payable are classified as Level 3 within the fair value hierarchy. The estimated fair value of the outstanding revolving credit facility balance at December 31, 2016 and 2015 approximated the carrying value due to the short-term nature of LIBOR contracts. The estimated fair value of other notes receivable at December 31, 2015 was based on a cash flow model discounted at market interest rates that considered underlying risks of the debt.
Non-Recurring Fair Value Adjustments
Nonfinancial assets and liabilities include items such as inventory and long-lived assets that are measured at cost when acquired and adjusted for impairment to fair value, if deemed necessary. For the year ended December 31, 2016, the Company recognized real estate-related impairment adjustments of $3.5 million. Of this amount, $2.4 million related to two active homebuilding communities and $1.2 million related to land the Company has under development and intends to sell. These impairment adjustments were made using Level 3 inputs and assumptions. The fair value of the real estate inventories subject to the impairment adjustments was $30.2 million at December 31, 2016.
During the years ended December 31, 2015 and 2014, the Company did not record any fair value adjustments to those nonfinancial assets and liabilities remeasured at fair value on a nonrecurring basis.
10. Commitments and Contingencies
The Company is a defendant in various lawsuits related to its normal course of business. We record a reserve for potential legal claims and regulatory matters when they are probable of occurring and a potential loss is reasonably estimable. We accrue for these matters based on facts and circumstances specific to each matter and revise these estimates when necessary.
In view of the inherent difficulty of predicting outcomes of legal claims and related contingencies, we generally cannot predict their ultimate resolution, related timing or eventual loss. If our evaluations indicate loss contingencies that could be material are not probable, but are reasonably possible, we will disclose their nature with an estimate of possible range of losses or a statement that such loss is not reasonably estimable. As of December 31, 2016 and 2015, the Company did not have any accruals for asserted or unasserted matters.
72
As an owner and developer of real estate, the Company is subject to various environmental laws of federal, state and local governments. The Company is not aware of any environmental liability that could have a material adverse effect on its financial condition or results of operations. However, changes in applicable environmental laws and regulations, the uses and conditions of real estate in the vicinity of the Company’s real estate and other environmental conditions of which the Company is unaware with respect to the real estate could result in future environmental liabilities.
The Company has provided credit enhancements in connection with joint venture borrowings in the form of LTV maintenance agreements in order to secure the joint venture's performance under the loans and maintenance of certain LTV ratios. The Company has also entered into agreements with its partners in each of the unconsolidated joint ventures whereby the Company and its partners are apportioned liability under the LTV maintenance agreements according to their respective capital interest. In addition, the agreements provide the Company, to the extent its partner has an unpaid liability under such credit enhancements, the right to receive distributions from the unconsolidated joint venture that would otherwise be made to the partner. However, there is no guarantee that such distributions will be made or will be sufficient to cover the share of the liability apportioned to us. The loans underlying the LTV maintenance agreements comprise acquisition and development loans, construction revolvers and model home loans, and the agreements remain in force until the loans are satisfied. Due to the nature of the loans, the outstanding balance at any given time is subject to a number of factors including the status of site improvements, the mix of horizontal and vertical development underway, the timing of phase build outs, and the period necessary to complete the escrow process for homebuyers. As of December 31, 2016 and 2015, $56.0 million and $74.1 million, respectively, was outstanding under the loans and credit enhanced by the Company through LTV maintenance agreements. Under the terms of the joint venture agreements, the Company's proportionate share of LTV maintenance agreement liabilities was $8.6 million and $22.5 million, respectively, as of December 31, 2016 and December 31, 2015. In addition, the Company has provided completion agreements regarding specific performance for certain projects whereby the Company is required to complete the given project with funds provided by the beneficiary of the agreement. If there are not adequate funds available under the specific project loans, the Company would then be subject to financial liability under such completion agreements. Typically, under such terms of the joint venture agreements, the Company has the right to apportion the respective share of any costs funded under such completion agreements to its partners. However, there is no guarantee that we will be able to recover against our partners for such amounts owed to us under the terms of such joint venture agreements.
In connection with providing credit enhancements, the Company recognized $0, $0 and $18,927 in guaranty fee income during the years ended December 31, 2016, 2015 and 2014, respectively, in other expense, net, in the accompanying consolidated statements of operations.
We obtain surety bonds in the normal course of business to ensure completion of certain infrastructure improvements of our projects. As of December 31, 2016 and 2015, the Company had outstanding surety bonds totaling $44.0 million and $33.6 million, respectively. The estimated remaining costs to complete of such improvements was $15.7 million and $17.0 million, respectively. The beneficiaries of the bonds are various municipalities and other organizations. In the event that any such surety bond issued by a third party is called because the required improvements are not completed, the Company could be obligated to reimburse the issuer of the bond.
On May 6, 2015, the Company entered into a letter of credit facility agreement that allows the Company and certain affiliated unconsolidated joint ventures to issue up to $5.0 million in letters of credit. The agreement includes an option to increase this amount to $7.5 million, subject to certain conditions. As of December 31, 2016, our affiliated unconsolidated joint ventures had $3.6 million in outstanding letters of credit issued under this facility.
We lease our corporate headquarters in Aliso Viejo, California. The lease on this facility consists of approximately 18,700 square feet and expires in November 2020. In addition, we lease divisional offices in Northern California, Southern California and Arizona, including approximately 4,800 square feet through May 2020 in Roseville, approximately 7,700 square feet through September 2021 in Walnut Creek, approximately 1,400 square feet through July 2018 in Agoura Hills and approximately 2,000 square feet through January 2018 in Scottsdale. As of December 31, 2016, the future minimum lease payments under non-cancelable operating leases, primarily associated with our office facilities, are as follows (dollars in thousands):
2017 | $ | 2,274 | |
2018 | 1,048 | ||
2019 | 1,134 | ||
2020 | 1,080 | ||
2021 | 283 | ||
Thereafter | — | ||
$ | 5,819 | ||
73
For the years ended December 31, 2016, 2015 and 2014, rent expense was $1.1 million, $0.9 million, and $0.7 million, respectively, and is included in general and administrative expenses.
11. Related Party Transactions
During the years ended December 31, 2016, 2015 and 2014, the Company incurred construction-related costs on behalf of its unconsolidated joint ventures totaling $9.4 million, $11.3 million and $8.0 million, respectively. As of December 31, 2016 and 2015, $0.2 million and $0.3 million, respectively, are included in due from affiliates in the accompanying consolidated balance sheets.
The Company has entered into Management Agreements with its unconsolidated joint ventures to provide management services related to the underlying projects. Pursuant to the Management Agreements, the Company receives a management fee based on each project’s revenues. During the years ended December 31, 2016, 2015 and 2014, the Company earned $8.2 million, $12.4 million and $9.6 million, respectively, in management fees, which have been recorded as fee building revenue in the accompanying consolidated statements of operations. As of December 31, 2016 and 2015, $0.6 million and $0.7 million, respectively, of management fees are included in due from affiliates in the accompanying consolidated balance sheets.
One member of the Company's board of directors beneficially owns more than 10% of the Company's outstanding common stock through an affiliated entity and is also affiliated with an entity that has investments in two of the Company's unconsolidated joint ventures. As of December 31, 2016, the Company's investment in these two unconsolidated joint ventures totaled $10.2 million.
TL Fab LP, an affiliate of Paul Heeschen, one of the Company's non-employee directors, was engaged by the Company and some of its unconsolidated joint ventures as a trade contractor to provide metal fabrication services. For the years ended December 31, 2016, 2015 and 2014, the Company incurred $0.3 million, $0.1 million and $0.1 million, respectively, for these services. The Company's unconsolidated joint ventures incurred $0.6 million, $0.8 million and $1.1 million, respectively, for these services for the years ended December 31, 2016, 2015 and 2014. Of these costs, $33,000 and $45,000 was due to TL Fab LP from the Company at December 31, 2016 and 2015, respectively, and $14,000 and $120,000 was due to TL Fab LP from the Company's unconsolidated joint ventures at December 31, 2016 and 2015, respectively.
On June 29, 2015, the Company formed a new unconsolidated joint venture and received capital credit in excess of our contributed land basis. As a result, the Company recognized $1.6 million in equity in net income of unconsolidated joint ventures and deferred $0.4 million in profit from unconsolidated joint ventures related to this transaction for the year ended December 31, 2015. During 2016, $0.1 million of the previously deferred revenue was recognized as equity in net income of unconsolidated joint ventures and at December 31, 2016, $0.3 million remained unrecognized and included in accrued expenses and other liabilities in the accompanying consolidated balance sheets.
In its ordinary course of business, the Company enters into agreements to purchase lots from unconsolidated land development joint ventures of which it is a member. For the years ended December 31, 2016 and December 31, 2015, the company purchased $6.5 million and $20.2 million, respectively, of land from unconsolidated land development joint ventures. In accordance with ASC 360-20, Property, Plant and Equipment - Real Estate Sales ("ASC 360-20"), the Company defers its portion of the underlying gain from the joint venture's sale of these lots. When the Company purchases lots directly from the joint venture, the deferred gain is recorded as a reduction to the Company's land basis on the purchased lots. In certain instances, a third party may purchase lots from our unconsolidated joint ventures with the intent to finish the lots. Then, the Company has an option to acquire these finished lots from the third party. In these instances, the Company defers its portion of the underlying gain and records the deferred gain as deferred profit from unconsolidated joint ventures included in accrued expenses and other liabilities in the accompanying consolidated balance sheets. Once the lot is purchased by the Company, the pro-rata share of the previously deferred profit is recorded as a reduction to the Company's land basis in the purchased lots. In both instances, the gain is ultimately recognized when the Company delivers lots to third-party home buyers at the time of the home closing. At December 31, 2016 and 2015, $0.6 million and $1.2 million, respectively, of deferred gain from lot sale transactions is included in accrued expenses and other liabilities in the accompanying consolidated balance sheets as deferred profit from unconsolidated joint ventures. In addition, at December 31, 2016 and 2015, $0.7 million and $1.1 million, respectively, of deferred gain from lot sale transactions remained unrecognized and included as a reduction to land basis in the accompanying consolidated balance sheets.
The Company’s land purchase agreement with one of its unconsolidated joint ventures, TNHC-HW Cannery LLC, requires profit participation payments due upon the closing of each home. Payment amounts are calculated based upon a percentage of estimated net profits and are due every 90 days after the first home closing. As of December 31, 2016, no profit participation was due to TNHC-HW Cannery LLC, and due to a change in estimates, the Company was owed a refund of $0.2 million from TNHC-HW Cannery LLC for profit participation overpayments. Also per the purchase agreement, the Company is due $0.1 million in fee credits from TNHC-HW Cannery LLC at December 31, 2016. Both amounts are included in due
74
from affiliates in the accompanying consolidated balance sheets. As of December 31, 2015, $0.3 million of profit participation was due to TNHC-HW Cannery LLC, which is included in due to affiliates in the accompanying consolidated balance sheets.
On January 15, 2016, the Company entered into an assignment and assumption of membership interest agreement (the “Buyout Agreement”) for its partner's interest in the TNHC San Juan LLC unconsolidated joint venture. Per the terms of the Buyout Agreement, the Company contributed $20.6 million to the joint venture, and the joint venture made a liquidating cash distribution to our partner for the same amount in exchange for its membership interest. Prior to the buyout, the Company accounted for its investment in TNHC San Juan LLC as an equity method investment. After the buyout, TNHC San Juan LLC is now a wholly owned subsidiary of the Company.
During June 2016, our LR8 Investors LLC unconsolidated joint venture (LR8) made its final distributions, allocated $0.5 million of income to the Company from a reduction in warranty reserves, and our outside equity partner exited the joint venture. Upon the change in control, we were required to consolidate this venture as a wholly owned subsidiary, and the Company assumed the cash, accounts receivable, accounts payable, and accrued liabilities, including warranty reserve, of the joint venture. As part of this transaction, and in accordance with ASC 805, Business Combinations, the Company also recognized a gain of $1.1 million due to the purchase of our JV partner's interest for less than its carrying value.
12. Stock-Based Compensation
On August 18, 2010, the Company granted equity-based units to certain members of management valued on the date of grant at $1.9 million with a four year vesting period. Recipients of the equity-based units had the right to receive certain distributions, if any, from the Company following return of capital to its equity members. The share-based units vested upon completion of the IPO, and the remaining unrecognized compensation expense of $316,667 was recognized during the first quarter of 2014, and is included in general and administrative expense in the accompanying consolidated statements of operations.
The 2014 Long-Term Incentive Plan (the “2014 Incentive Plan”), was adopted by our board of directors in January 2014. The 2014 Incentive Plan provides for the grant of equity-based awards, including options to purchase shares of common stock, stock appreciation rights, restricted and unrestricted stock awards, restricted stock units and performance awards. The 2014 Incentive Plan will automatically expire on the tenth anniversary of its effective date.
The number of shares of our common stock that are authorized to be issued under the 2014 Incentive Plan is 1,644,875 shares. To the extent that shares of the Company's common stock subject to an outstanding option, stock appreciation right, stock award or performance award granted under the 2014 Incentive Plan or any predecessor plan are not issued or delivered by reason of the expiration, termination, cancellation or forfeiture of such award or the settlement of such award in cash, then such shares of common stock generally shall again be available under the 2014 Incentive Plan.
The Company has issued stock option and restricted stock unit awards under the 2014 Incentive Plan. As of December 31, 2016, 15,497 shares remain available for grant under the 2014 Incentive Plan. The exercise price of stock-based awards may not be less than the market value of the Company's common stock on the date of grant. The fair value for stock options is established at the date of grant using the Black-Scholes model for time-based vesting awards. The Company's stock option and restricted stock awards typically vest over a one to three year period and the stock options expire ten years from the date of grant.
At our 2016 Annual Meeting of Shareholders on May 24, 2016, our shareholders approved the 2016 Incentive Award Plan (the "2016 Incentive Plan"). The 2016 Incentive Plan provides for the grant of stock options, stock appreciation rights, restricted stock, restricted stock units and other stock- or cash-based awards. Non-employee directors of the Company and employees and consultants of the Company, or any of its subsidiaries, are eligible to receive awards under the 2016 Incentive Plan. The 2016 Incentive Plan authorizes the issuance of 800,000 shares of common stock, subject to certain limitations. The 2016 Incentive Plan will expire on February 23, 2026. At December 31, 2016, no awards had been granted from the 2016 Incentive Plan.
75
A summary of the Company’s common stock option activity as of and for the year ended December 31, 2016, 2015 and 2014 is presented below:
Year Ended December 31, | ||||||||||||||||||||
2016 | 2015 | 2014 | ||||||||||||||||||
Number of Shares | Weighted-Average Exercise Price per Share | Number of Shares | Weighted-Average Exercise Price per Share | Number of Shares | Weighted-Average Exercise Price per Share | |||||||||||||||
Outstanding Stock Option Activity | ||||||||||||||||||||
Outstanding, beginning of period | 840,298 | $ | 11.00 | 846,874 | $ | 11.00 | — | $ | — | |||||||||||
Granted | — | $ | — | — | $ | — | 872,683 | $ | 11.00 | |||||||||||
Exercised | — | $ | — | (1,584 | ) | $ | 11.00 | — | $ | — | ||||||||||
Forfeited | (4,512 | ) | $ | 11.00 | (4,992 | ) | $ | 11.00 | (25,809 | ) | $ | 11.00 | ||||||||
Outstanding, end of period | 835,786 | $ | 11.00 | 840,298 | $ | 11.00 | 846,874 | $ | 11.00 | |||||||||||
Exercisable, end of period | 42,042 | $ | 11.00 | 23,133 | $ | 11.00 | — | $ | — | |||||||||||
A summary of the Company’s restricted stock units activity as of and for the year ended December 31, 2016, 2015 and 2014 is presented below:
Year Ended December 31, | ||||||||||||||||||||
2016 | 2015 | 2014 | ||||||||||||||||||
Number of Shares | Weighted-Average Grant-Date Fair Value per Share | Number of Shares | Weighted-Average Grant-Date Fair Value per Share | Number of Shares | Weighted-Average Grant-Date Fair Value per Share | |||||||||||||||
Restricted Stock Units Activity | ||||||||||||||||||||
Outstanding, beginning of period | 308,386 | $ | 14.20 | 112,233 | $ | 11.36 | — | $ | — | |||||||||||
Granted | 414,045 | $ | 10.05 | 294,355 | $ | 14.46 | 118,937 | $ | 11.34 | |||||||||||
Vested | (231,633 | ) | $ | 14.22 | (85,386 | ) | $ | 11.48 | — | $ | — | |||||||||
Forfeited | (15,809 | ) | $ | 11.62 | (12,816 | ) | $ | 13.44 | (6,704 | ) | $ | 11.00 | ||||||||
Outstanding, end of period | 474,989 | $ | 10.66 | 308,386 | $ | 14.20 | 112,233 | $ | 11.36 | |||||||||||
The expense related to the Company's stock-based compensation programs, included in general and administrative expense in the accompanying consolidated statements of operations, was as follows:
Year Ended December 31, | |||||||||||
2016 | 2015 | 2014 | |||||||||
(Dollars in thousands) | |||||||||||
Expense related to: | |||||||||||
Equity based incentive units | $ | — | $ | — | $ | 317 | |||||
Stock options | 1,054 | 1,184 | 1,128 | ||||||||
Restricted stock units | 2,417 | 2,700 | 877 | ||||||||
$ | 3,471 | $ | 3,884 | $ | 2,322 | ||||||
76
The following table presents details of the assumptions used to calculate the weighted-average grant date fair value of common stock options granted by the Company:
Year Ended December 31, | |||||||||||
2016 | 2015 | 2014 | |||||||||
Expected term (in years) | 4.3 | 4.3 | 4.3 | ||||||||
Expected volatility | 49.0 | % | 49.0 | % | 49.0 | % | |||||
Risk-free interest rate | 1.2 | % | 1.2 | % | 1.2 | % | |||||
Expected dividends | — | — | — | ||||||||
Weighted-average grant date fair value per share | $ | 4.43 | $ | 4.43 | $ | 4.43 | |||||
The following table presents details of the assumptions used to calculate the re-measurement date fair value of common stock options granted to Mr. Davis by the Company in accordance with ASC 505-50 as discussed in Note 1:
Year Ended December 31, | |||||||
2016 | 2015 | ||||||
Expected term (in years) | 1.1 | 2.1 | |||||
Expected volatility | 36.7 | % | 28.2 | % | |||
Risk-free interest rate | 0.9 | % | 1.1 | % | |||
Expected dividends | — | — | |||||
Re-measurement date fair value per share | $ | 2.14 | $ | 3.21 | |||
We used the "simplified method" to establish the expected term of the common stock options granted by the Company. Our restricted stock awards are valued based on the closing price of our common stock on the date of grant. At December 31, 2016, the amount of unearned stock-based compensation currently estimated to be expensed through 2019 related to common stock options and restricted stock unit awards is $3.3 million, net of estimated forfeitures. The weighted-average period over which the unearned stock-based compensation is expected to be recognized is 1.9 years. If there are any modifications or cancellations of the underlying unvested awards, the Company may be required to accelerate, increase or cancel any remaining unearned stock-based compensation expense.
13. Income Taxes
As discussed in Note 1, for the first 30 calendar days of 2014, the Company was a Delaware LLC which was treated as partnership for income tax purposes and was subject to certain minimal taxes and fees; however, income taxes on taxable income or losses realized by the Company were the obligation of the members.
The provision for income taxes includes the following:
Year Ended December 31, | |||||||||||
2016 | 2015 | 2014 | |||||||||
(Dollars in thousands) | |||||||||||
Current provision for income taxes: | |||||||||||
Federal | $ | 10,321 | $ | 10,822 | $ | 4,722 | |||||
State | 3,375 | 3,386 | 1,343 | ||||||||
13,696 | 14,208 | 6,065 | |||||||||
Deferred benefit for income taxes: | |||||||||||
Federal | (506 | ) | (1,522 | ) | (4,600 | ) | |||||
State | (166 | ) | (153 | ) | (1,219 | ) | |||||
(672 | ) | (1,675 | ) | (5,819 | ) | ||||||
Provision for income taxes | $ | 13,024 | $ | 12,533 | $ | 246 | |||||
The effective tax rate differs from the federal statutory rate of 35% due to the following items:
Year Ended December 31, | |||||||||||
2016 | 2015 | 2014 | |||||||||
(Dollars in thousands) | |||||||||||
Income before taxes of taxable entities | $ | 33,950 | $ | 33,911 | $ | 5,003 | |||||
Provision for income taxes at federal statutory rate | $ | (11,883 | ) | $ | (11,869 | ) | $ | (1,751 | ) | ||
(Increases) decreases in tax resulting from: | |||||||||||
State income taxes, net of federal benefit | (1,977 | ) | (1,979 | ) | (293 | ) | |||||
Manufacturing deduction | 1,142 | 1,274 | 225 | ||||||||
Deferred tax assets upon conversion to a corporation | — | — | 1,495 | ||||||||
Tax rate change | — | — | 100 | ||||||||
Other | (306 | ) | 41 | (22 | ) | ||||||
Provision for income taxes | $ | (13,024 | ) | $ | (12,533 | ) | $ | (246 | ) | ||
Effective tax rate | 38.4 | % | 37.0 | % | 4.9 | % | |||||
The Company accounts for income taxes in accordance with ASC 740, which requires an asset and liability approach for measuring deferred taxes based on temporary differences between the financial statements and tax bases of assets and liabilities existing at each balance sheet date using enacted tax rates for the years in which taxes are expected to be paid or recovered.
The components of our deferred income tax asset are as follows:
December 31, | |||||||
2016 | 2015 | ||||||
(Dollars in thousands) | |||||||
State taxes | $ | 1,229 | $ | 1,300 | |||
Reserves and accruals | 2,407 | 2,128 | |||||
Intangible assets | 359 | 548 | |||||
Share based compensation | 2,118 | 1,999 | |||||
Inventory | 1,150 | 868 | |||||
Investments in joint ventures | 1,290 | 822 | |||||
Depreciation | (119 | ) | (149 | ) | |||
Deferred tax asset, net | $ | 8,434 | $ | 7,516 | |||
Each quarter we assess our deferred tax asset to determine whether all or any portion of the asset is more likely than not unrealizable under ASC 740. We are required to establish a valuation allowance for any portion of the asset we conclude is more likely than not unrealizable. Our assessment considers, among other things, the nature, frequency and severity of prior cumulative losses, forecasts of future taxable income, the duration of statutory carryforward periods, our utilization experience with operating loss and tax credit carryforwards and the planning alternatives, to the extent these items are applicable.
The Company classifies any interest and penalties related to income taxes assessed as part of income tax expense. The Company has concluded that there were no significant uncertain tax positions requiring recognition in its financial statements, nor has the Company been assessed interest or penalties by any major tax jurisdictions related to any open tax periods. We are subject to U.S. federal income tax examination for calendar tax years ending 2014 through 2016 and various state income tax examinations for 2014 through 2016 calendar tax years. Our 2014 U.S. federal income tax return is currently under examination.
14. Segment Information
The Company’s operations are organized into two reportable segments: homebuilding and fee building. In determining the most appropriate reportable segments, we considered similar economic and other characteristics, including product types, average selling prices, gross margins, production processes, suppliers, subcontractors, regulatory environments, land acquisition results, and underlying demand and supply in accordance with ASC Topic 280, Segment Reporting.
Our homebuilding operations acquire and develop land and construct and sell single-family attached and detached homes. Our fee building operations build homes and manage construction related activities on behalf of third-party property owners and our joint ventures. Corporate is a non-operating segment that develops and implements strategic initiatives and supports our operating segments by centralizing key administrative functions such as accounting, finance and treasury,
77
information technology, insurance and risk management, litigation, marketing and human resources. A portion of the expenses incurred by Corporate are allocated to the fee building segment primarily based on their respective percentage of revenues. The assets of our fee building segment primarily consist of cash, restricted cash and accounts receivable. The majority of our Corporate personnel and resources are primarily dedicated to activities relating to our homebuilding segment, and, therefore, the balance of any unallocated Corporate expenses and assets are included in our homebuilding segment.
The reportable segments follow the same accounting policies as our consolidated financial statements described in Note 1. Operational results of each reportable segment are not necessarily indicative of the results that would have been achieved had the reportable segment been an independent, stand-alone entity during the periods presented. Financial information relating to reportable segments was as follows:
Year Ended December 31, | |||||||||||
2016 | 2015 | 2014 | |||||||||
(Dollars in thousands) | |||||||||||
Revenues: | |||||||||||
Homebuilding | $ | 507,949 | $ | 280,209 | $ | 56,094 | |||||
Fee building, including management fees | 186,507 | 149,890 | 93,563 | ||||||||
Total | $ | 694,456 | $ | 430,099 | $ | 149,657 | |||||
Income before income taxes: | |||||||||||
Homebuilding | $ | 25,546 | $ | 23,698 | $ | 497 | |||||
Fee building, including management fees | 8,404 | 10,213 | 4,506 | ||||||||
Total | $ | 33,950 | $ | 33,911 | $ | 5,003 | |||||
December 31, | |||||||
2016 | 2015 | ||||||
(Dollars in thousands) | |||||||
Assets: | |||||||
Homebuilding | $ | 393,095 | $ | 331,697 | |||
Fee building | 26,041 | 19,573 | |||||
Total | $ | 419,136 | $ | 351,270 | |||
78
15. Pro Forma Net Income and Earnings per Share (Unaudited)
The pro forma amounts reflect the income tax provision as if the Company was a taxable corporation as of the beginning of the period, and assume the Company filed a consolidated tax return for the periods presented.
For the year ended December 31, 2014, the pro forma tax provision assumes the Company's taxable income for the year would have included pretax income earned between January 1, 2014 and January 30, 2014, prior to the conversion to a taxable corporation. In addition, a net deferred income tax asset of $1.5 million was recognized as a result of the conversion to a taxable entity during the first quarter of 2014. However, the pro forma results exclude the effect of the conversion adjustment because of its nonrecurring nature.
Basic and diluted earnings per share and pro forma basic and diluted earnings per share give effect to the conversion of the Company's members' equity into common stock on January 30, 2014 as though the conversion had occurred as of the beginning of the reporting period or the original date of issuance, if later. See Note 2.
Year Ended December 31, | |||
2014 | |||
Income before taxes | $ | 5,003 | |
Pro forma income tax provision to reflect the conversion to a C Corporation | (1,648 | ) | |
Pro forma net income | 3,355 | ||
Net loss attributable to noncontrolling interests | 30 | ||
Pro forma net income attributable to The New Home Company Inc. | $ | 3,385 | |
Pro forma basic earnings per share attributable to The New Home Company Inc. | $ | 0.21 | |
Pro forma diluted earnings per share attributable to The New Home Company Inc. | $ | 0.21 | |
79
16. Results of Quarterly Operations (Unaudited)
The following table presents our unaudited quarterly financial data. In our opinion, this information has been prepared on a basis consistent with that of our audited consolidated financial statements and all necessary material adjustments, consisting of normal recurring accruals and adjustments, have been included to present fairly the unaudited quarterly financial data. Our quarterly results of operations for these periods are not necessarily indicative of future results of operations.
First Quarter | Second Quarter | Third Quarter | Fourth Quarter | Total | |||||||||||||||
(Dollars in thousands, except per share amounts) | |||||||||||||||||||
2016 | |||||||||||||||||||
Home sales revenue | $ | 42,303 | $ | 78,836 | $ | 125,142 | $ | 261,668 | $ | 507,949 | |||||||||
Cost of home sales | 36,670 | 69,390 | 105,799 | 221,700 | 433,559 | ||||||||||||||
Home sales impairments | — | — | — | 2,350 | 2,350 | ||||||||||||||
Homebuilding gross margin | $ | 5,633 | $ | 9,446 | $ | 19,343 | $ | 37,618 | $ | 72,040 | |||||||||
Land sale impairment | $ | — | $ | — | $ | — | $ | 1,150 | $ | 1,150 | |||||||||
Land sales gross margin | $ | — | $ | — | $ | — | $ | (1,150 | ) | $ | (1,150 | ) | |||||||
Fee building revenue | $ | 42,937 | $ | 30,028 | $ | 52,761 | $ | 60,781 | $ | 186,507 | |||||||||
Cost of fee building | 40,914 | 28,317 | 50,832 | 58,040 | 178,103 | ||||||||||||||
Fee building gross margin | $ | 2,023 | $ | 1,711 | $ | 1,929 | $ | 2,741 | $ | 8,404 | |||||||||
Income (loss) before income taxes | $ | (1,111 | ) | $ | 3,939 | $ | 9,042 | $ | 22,080 | $ | 33,950 | ||||||||
Net (loss) income attributable to The New Home Company Inc. | $ | (814 | ) | $ | 2,509 | $ | 5,547 | $ | 13,780 | $ | 21,022 | ||||||||
Basic earnings (loss) per share attributable to The New Home Company Inc.(1) | $ | (0.04 | ) | $ | 0.12 | $ | 0.27 | $ | 0.67 | $ | 1.02 | ||||||||
Diluted earnings (loss) per share attributable to The New Home Company Inc.(1) | $ | (0.04 | ) | $ | 0.12 | $ | 0.27 | $ | 0.66 | $ | 1.01 | ||||||||
2015 | |||||||||||||||||||
Home sales revenue | $ | 56,235 | $ | 19,202 | $ | 57,878 | $ | 146,894 | $ | 280,209 | |||||||||
Cost of home sales | 47,408 | 16,598 | 48,741 | 122,485 | 235,232 | ||||||||||||||
Homebuilding gross margin | $ | 8,827 | $ | 2,604 | $ | 9,137 | $ | 24,409 | $ | 44,977 | |||||||||
Fee building revenue | $ | 46,630 | $ | 26,429 | $ | 29,099 | $ | 47,732 | $ | 149,890 | |||||||||
Cost of fee building | 43,777 | 25,209 | 27,028 | 43,663 | 139,677 | ||||||||||||||
Fee building gross margin | $ | 2,853 | $ | 1,220 | $ | 2,071 | $ | 4,069 | $ | 10,213 | |||||||||
Income before income taxes | $ | 7,431 | $ | 415 | $ | 6,594 | $ | 19,471 | $ | 33,911 | |||||||||
Net income attributable to The New Home Company Inc. | $ | 4,569 | $ | 449 | $ | 4,444 | $ | 12,226 | $ | 21,688 | |||||||||
Basic earnings per share attributable to The New Home Company Inc. (1) | $ | 0.28 | $ | 0.03 | $ | 0.27 | $ | 0.70 | $ | 1.29 | |||||||||
Diluted earnings per share attributable to The New Home Company Inc. (1) | $ | 0.28 | $ | 0.03 | $ | 0.27 | $ | 0.69 | $ | 1.28 | |||||||||
(1) | Some amounts do not add to our full year results presented on our consolidated statement of operations due to rounding differences in quarterly and annual weighted average share calculations. |
80
17. Supplemental Disclosure of Cash Flow Information
The following table presents certain supplemental cash flow information:
Year Ended December 31, | |||||||||||
2016 | 2015 | 2014 | |||||||||
(Dollars in thousands) | |||||||||||
Supplemental disclosures of cash flow information | |||||||||||
Interest paid, net of amounts capitalized | $ | — | $ | — | $ | — | |||||
Income taxes paid | $ | 13,670 | $ | 11,261 | $ | 1,470 | |||||
Supplemental disclosures of non-cash transactions | |||||||||||
Purchase of real estate with note payable to land seller | $ | — | $ | — | $ | 17,000 | |||||
Purchase of real estate with notes payable to affiliate | $ | — | $ | 747 | $ | — | |||||
Contribution of real estate to unconsolidated joint ventures | $ | 798 | $ | 18,828 | $ | 1,890 | |||||
Contribution of real estate from noncontrolling interest in subsidiary | $ | — | $ | 1,301 | $ | 1,252 | |||||
Deductible transaction costs and additional contribution of deferred tax assets from IPO | $ | — | $ | — | $ | 808 | |||||
Assets assumed from unconsolidated joint ventures | $ | 46,811 | $ | — | $ | — | |||||
Liabilities and equity assumed from unconsolidated joint ventures | $ | 47,197 | $ | — | $ | — | |||||
81
Report of Independent Auditors
The Members
TNHC Meridian Investors LLC
We have audited the accompanying financial statements of TNHC Meridian Investors LLC, which comprise the balance sheets as of December 31, 2016 and 2015, and the related statements of operations, members’ capital, and cash flows for the three year period ended December 31, 2016, and the related notes to the financial statements.
Management’s Responsibility for the Financial Statements
Management is responsible for the preparation and fair presentation of these financial statements in conformity with U.S. generally accepted accounting principles; this includes the design, implementation and maintenance of internal control relevant to the preparation and fair presentation of financial statements that are free of material misstatement, whether due to fraud or error.
Auditor’s Responsibility
Our responsibility is to express an opinion on these financial statements based on our audits. We conducted our audits in accordance with auditing standards generally accepted in the United States. Those standards require that we plan and perform the audit to obtain reasonable assurance about whether the financial statements are free of material misstatement.
An audit involves performing procedures to obtain audit evidence about the amounts and disclosures in the financial statements. The procedures selected depend on the auditor’s judgment, including the assessment of the risks of material misstatement of the financial statements, whether due to fraud or error. In making those risk assessments, the auditor considers internal control relevant to the entity’s preparation and fair presentation of the financial statements in order to design audit procedures that are appropriate in the circumstances, but not for the purpose of expressing an opinion on the effectiveness of the entity’s internal control. Accordingly, we express no such opinion. An audit also includes evaluating the appropriateness of accounting policies used and the reasonableness of significant accounting estimates made by management, as well as evaluating the overall presentation of the financial statements.
We believe that the audit evidence we have obtained is sufficient and appropriate to provide a basis for our audit opinion.
Opinion
In our opinion, the financial statements referred to above present fairly, in all material respects, the financial position of TNHC Meridian Investors LLC at December 31, 2016 and 2015, and the results of its operations and its cash flows for the three year period ended December 31, 2016, in conformity with U.S. generally accepted accounting principles.
/s/ Ernst & Young LLP
Irvine, California
February 22, 2017
82
TNHC Meridian Investors LLC | ||||||
(A Delaware Limited Liability Company) | ||||||
Balance Sheets | ||||||
December 31 | ||||||
2016 | 2015 | |||||
Assets | ||||||
Cash | $ | 9,255 | $ | 54,177 | ||
Investment in unconsolidated joint venture | 826,072 | 4,500,755 | ||||
Total assets | $ | 835,327 | $ | 4,554,932 | ||
Liabilities and members’ capital | ||||||
Accounts payable | $ | 13,000 | $ | 26,000 | ||
Commitments and contingencies (Note 3) | ||||||
Members’ capital | 822,327 | 4,528,932 | ||||
Total liabilities and members’ capital | $ | 835,327 | $ | 4,554,932 | ||
See accompanying notes. | ||||||
83
TNHC Meridian Investors LLC | ||||||||||
(A Delaware Limited Liability Company) | ||||||||||
Statements of Operations | ||||||||||
Year Ended December 31 | ||||||||||
2016 | 2015 | 2014 | ||||||||
Revenues: | ||||||||||
Management fee revenues from affiliates (Note 2) | $ | 79,166 | $ | 4,071,046 | $ | 2,150,378 | ||||
Expenses: | ||||||||||
Overhead fees to the Members (Note 2) | 79,166 | 4,071,046 | 2,150,378 | |||||||
General and administrative expenses | 31,922 | 58,777 | 7,245 | |||||||
111,088 | 4,129,823 | 2,157,623 | ||||||||
Net operating loss | (31,922 | ) | (58,777 | ) | (7,245 | ) | ||||
Equity in net (loss) income of unconsolidated joint venture | (459,073 | ) | 16,319,542 | 3,885,517 | ||||||
Net (loss) income | $ | (490,995 | ) | $ | 16,260,765 | $ | 3,878,272 | |||
See accompanying notes. | ||||||||||
84
TNHC Meridian Investors LLC | |||||||||
(A Delaware Limited Liability Company) | |||||||||
Statements of Members' Capital | |||||||||
Years Ended December 31, 2016, 2015 and 2014 | |||||||||
The New Home | |||||||||
Company | IHP | ||||||||
Southern | Meridian | ||||||||
California LLC | LLC | Total | |||||||
Balance at December 31, 2013 | $ | 6,007,768 | $ | 10,332,867 | $ | 16,340,635 | |||
Contributions | 129,500 | 220,500 | 350,000 | ||||||
Net income | 1,473,227 | 2,405,045 | 3,878,272 | ||||||
Balance at December 31, 2014 | 7,610,495 | 12,958,412 | 20,568,907 | ||||||
Distributions | (13,326,079 | ) | (18,974,661 | ) | (32,300,740 | ) | |||
Net income | 7,980,050 | 8,280,715 | 16,260,765 | ||||||
Balance at December 31, 2015 | 2,264,466 | 2,264,466 | 4,528,932 | ||||||
Distributions | (1,480,121 | ) | (1,492,852 | ) | (2,972,973 | ) | |||
Net loss | (251,863 | ) | (239,132 | ) | (490,995 | ) | |||
TNHC basis adjustment | (242,637 | ) | — | (242,637 | ) | ||||
Balance at December 31, 2016 | $ | 289,845 | $ | 532,482 | $ | 822,327 | |||
See accompanying notes. | |||||||||
85
TNHC Meridian Investors LLC | |||||||||||
(A Delaware Limited Liability Company) | |||||||||||
Statements of Cash Flows | |||||||||||
Year Ended December 31 | |||||||||||
2016 | 2015 | 2014 | |||||||||
Operating activities | |||||||||||
Net (loss) income | $ | (490,995 | ) | $ | 16,260,765 | $ | 3,878,272 | ||||
Adjustments to reconcile net (loss) income to net cash | |||||||||||
provided by operating activities: | |||||||||||
Distributions of earnings from unconsolidated joint venture | 2,972,973 | 14,500,860 | 999,880 | ||||||||
Equity in net loss (income) of unconsolidated joint venture | 459,073 | (16,319,542 | ) | (3,885,517 | ) | ||||||
Net changes in operating assets and liabilities: | |||||||||||
Accounts payable | (13,000 | ) | 26,000 | — | |||||||
Due to affiliates | — | (75,198 | ) | 75,198 | |||||||
Net cash provided by operating activities | 2,928,051 | 14,392,885 | 1,067,833 | ||||||||
Investing activities | |||||||||||
Contributions to unconsolidated joint venture | — | — | (350,000 | ) | |||||||
Distributions of equity from unconsolidated joint venture | — | 16,800,000 | — | ||||||||
Net cash provided by (used in) investing activities | — | 16,800,000 | (350,000 | ) | |||||||
Financing activities | |||||||||||
Members’ capital contributions | — | — | 350,000 | ||||||||
Members’ capital distributions | (2,972,973 | ) | (32,300,740 | ) | — | ||||||
Net cash (used in) provided by financing activities | (2,972,973 | ) | (32,300,740 | ) | 350,000 | ||||||
Net (decrease) increase in cash | (44,922 | ) | (1,107,855 | ) | 1,067,833 | ||||||
Cash at beginning of year | 54,177 | 1,162,032 | 94,199 | ||||||||
Cash at end of year | $ | 9,255 | $ | 54,177 | $ | 1,162,032 | |||||
Supplemental disclosures of cash flow information | |||||||||||
Interest paid, net of amounts capitalized | $ | — | $ | — | $ | — | |||||
See accompanying notes. | |||||||||||
86
TNHC Meridian Investors LLC
(A Delaware Limited Liability Company)
Notes to Financial Statements
December 31, 2016, 2015 and 2014
1. Organization and Summary of Significant Accounting Policies
TNHC Meridian Investors LLC, a Delaware limited liability company (the “Company”), was formed with an effective date of February 20, 2013. The Company was initially capitalized through cash and asset contributions by The New Home Company Southern California LLC (“TNHC”). Effective August 20, 2013, TNHC Meridian Investors LLC amended and restated its limited liability agreement and concurrently admitted IHP Meridian LLC (“IHP”) as a member (TNHC and IHP, collectively, are referred to herein as the “Members”). The Company holds an interest in one unconsolidated joint venture, TNHC Newport LLC (the “Unconsolidated Joint Venture”).
Subject to the operating agreement, distributions of net cash flow to the Members shall be in the following order of priority:
1) | To the Members in proportion and up to the difference between their respective aggregate Special Preferred Return, as defined, and the aggregate amounts distributed previously; then |
2) | To the Members in proportion to their respective Unreturned Special Capital Contributions, as defined; then |
3) | To the Members in proportion and up to the difference between their respective aggregate Preferred Return, as defined, and the aggregate amounts distributed previously; then |
4) | If there is a Controllable Cost Overrun, as defined, and a Profit Shortfall, as defined, an amount equal to 50% of the lesser of such Controllable Cost Overrun or such Profit Shortfall shall be distributed to the Members in the following proportion: 75% to IHP and 25% to TNHC; then |
5) | To the Members in proportion and up to each Member’s Unreturned Capital Contribution, as defined; then |
6) | To the Members in proportion to their respective Percentage Interests, as defined (TNHC 50% and IHP 50%). |
Subject to the operating agreement, income and losses are allocated to the Members generally in the same manner as distributions of net cash flow.
Pursuant to the operating agreement, the Special Preferred Return on Unreturned Special Capital Contributions, as defined, for both Members is 20% per annum, compounded monthly. The preferred return on Unreturned Capital Contributions for both Members is 12% per annum, compounded monthly. During 2015, the Unreturned Capital Contributions and all associated preferred return have been returned to the partners, as such, no additional preferred return distributions are expected as of December 31, 2015.
The following is a summary of the preferred returns for the Members as of December 31, 2016:
TNHC | IHP | Total | |||||||
Cumulative Special Preferred Return | $ | — | $ | — | $ | — | |||
Cumulative Special Preferred distributions | — | — | — | ||||||
Cumulative Preferred Return | 1,772,031 | 3,017,243 | 4,789,274 | ||||||
Cumulative Preferred distributions | (1,772,031 | ) | (3,017,243 | ) | (4,789,274 | ) | |||
Remaining undistributed preferred return | $ | — | $ | — | $ | — | |||
87
Basis of Presentation
The accompanying financial statements have been prepared in accordance with U.S. generally accepted accounting principles (“GAAP”) as contained within the Financial Accounting Standards Board (“FASB”) Accounting Standards Codification (“ASC”). This basis of accounting contemplates the recovery of the Company’s assets and the satisfaction of its liabilities in the normal course of business. Management believes the Company has sufficient cash and access to capital to fund its operations.
Use of Estimates
The preparation of the Company’s financial statements in conformity with GAAP requires management to make estimates and assumptions that affect the reported amounts of assets, liabilities, revenues and expenses, and the disclosure of commitments and contingencies. Actual results could differ materially from those estimates.
Cash
The Company considers all highly-liquid investments that are readily convertible to cash, with original maturity dates of three months or less, to be cash and cash equivalents. Financial instruments that potentially subject the Company to significant concentrations of credit risk consist principally of cash deposited with financial institutions in excess of amounts insured by the Federal Deposit Insurance Corporation. The Company has not experienced any losses related to uninsured cash balances.
Variable Interest Entities
The Company accounts for variable interest entities in accordance with ASC 810, Consolidation. Under ASC 810, a variable interest entity (“VIE”) is created when: (a) the equity investment at risk in the entity is not sufficient to permit the entity to finance its activities without additional subordinated financial support provided by other parties, including the equity holders; (b) the entity’s equity holders as a group either (i) lack the direct or indirect ability to make decisions about the entity, (ii) are not obligated to absorb expected losses of the entity or (iii) do not have the right to receive expected residual returns of the entity; or (c) the entity’s equity holders have voting rights that are not proportionate to their economic interests, and the activities of the entity involve or are conducted on behalf of the equity holder with disproportionately few voting rights. If an entity is deemed to be a VIE pursuant to ASC 810, the enterprise that has both (i) the power to direct the activities of a VIE that most significantly impact the entity’s economic performance and (ii) the obligation to absorb the expected losses of the entity or right to receive benefits from the entity that could be potentially significant to the VIE is considered the primary beneficiary and must consolidate the VIE.
As of December 31, 2016, 2015, and 2014, the Company was not required to consolidate any VIEs. In accordance with ASC 810, the Company performs ongoing reassessments of whether it is the primary beneficiary of a VIE. The Company first analyzes the Unconsolidated Joint Venture to determine if it is a variable interest entity under the provisions of ASC 810 (as discussed above) when determining whether the entity should be consolidated.
Investment in Unconsolidated Joint Venture
We use the equity method to account for investments in homebuilding and land development joint ventures that qualify as VIEs where we are not the primary beneficiary and other entities that we do not control but have the ability to exercise significant influence over the operating and financial policies of the investee. The Company also uses the equity method when we function as the managing member or general partner and our venture partner has substantive participating rights or where we can be replaced by our venture partner as managing member without cause.
As of December 31, 2016, 2015 and 2014, the Company concluded that the Unconsolidated Joint Venture was not a variable interest entity and it did not control the entity, therefore the Company accounted for this entity under the equity method of accounting. Under the Unconsolidated Joint Venture operating agreement, capital contributions are determined based on the operating budgets and needs of the Unconsolidated Joint Venture, which vary throughout the life of the Unconsolidated Joint Venture based on the circumstances unique to the Unconsolidated Joint Venture.
As of December 31, 2016, the Company had an ownership and percentage interest in one unconsolidated joint venture, with an ownership percentage of 32% and a percentage interest of 50%. Investment in the Unconsolidated Joint Venture is accounted for under the equity method of accounting. Under the equity method, the Company recognizes its proportionate share of earnings and losses generated by the Unconsolidated Joint Venture upon the delivery of lots or homes to third parties.
88
The Company reviews the real estate inventory held by the Unconsolidated Joint Venture for impairments whenever events or changes in circumstances indicate that carrying amounts may not be recoverable. The Company also reviews its investment in the Unconsolidated Joint Venture for evidence of other-than-temporary declines in value.
To the extent the Company deems any portion of its investment in the Unconsolidated Joint Venture as not recoverable, the Company impairs its investment accordingly. As of December 31, 2016 and 2015, the Company determined that no portion of its investment in the Unconsolidated Joint Venture was impaired.
The balance sheets for the Unconsolidated Joint Venture are as follows:
December 31 | ||||||
2016 | 2015 | |||||
Cash | $ | 4,545,757 | $ | 12,021,389 | ||
Restricted cash | — | 500,000 | ||||
Real estate inventories | — | 3,694,238 | ||||
Total assets | $ | 4,545,757 | $ | 16,215,627 | ||
Accounts payable | $ | 66,952 | $ | 4,573,627 | ||
Accrued expenses and other liabilities | 2,823,598 | 3,076,484 | ||||
Due to affiliate | 3,063 | 49,280 | ||||
Total liabilities | 2,893,613 | 7,699,391 | ||||
The Company’s equity | 826,072 | 4,258,118 | ||||
Other member’s equity | 826,072 | 4,258,118 | ||||
Total equity | 1,652,144 | 8,516,236 | ||||
Total liabilities and equity | $ | 4,545,757 | $ | 16,215,627 | ||
The condensed statements of operations for the Unconsolidated Joint Venture are as follows:
Years Ended December 31 | |||||||||
2016 | 2015 | 2014 | |||||||
Revenues | $ | 5,250,000 | $ | 175,610,776 | $ | 60,158,550 | |||
Cost of sales and expenses | 6,114,092 | 140,742,205 | 48,736,026 | ||||||
Income (loss) of unconsolidated joint venture | $ | (864,092 | ) | $ | 34,868,571 | $ | 11,422,524 | ||
Income (loss) from unconsolidated joint venture reflected in the accompanying statements of operations | $ | (459,073 | ) | $ | 16,319,542 | $ | 3,885,517 | ||
Income Taxes
As a limited liability company, the Company is subject to certain minimal taxes and fees; however, income taxes on income reported by the Company are the obligation of the Members.
The Company applies the provisions of ASC 740, Accounting for Uncertainty in Income Taxes. Based on its evaluation, under ASC 740, the Company has concluded that there are no significant uncertain tax positions requiring recognition in its financial statements, nor has the Company been assessed interest or penalties by any major tax jurisdictions. The Company’s evaluation was performed for the tax years ended December 31, 2016, 2015 and 2014.
89
New Accounting Pronouncements
In May 2014, the FASB issued Accounting Standards Update (“ASU”) No. 2014-09, Revenue from Contracts with Customers (“ASU 2014-09”), which supersedes existing accounting literature relating to how and when a company recognizes revenue. Under ASU 2014-09, a company will recognize revenue when it transfers promised goods or services to customers in an amount that reflects the consideration to which the company expects to be entitled in exchange for those goods and services. In August 2015, the FASB issued ASU No. 2015-14, Revenue from Contracts with Customers (Topic 606): Deferral of the Effective Date, which delayed the effective date of ASU 2014-09 by one year. As a non-public company, ASU 2014-09 is effective for our interim and annual reporting periods beginning after December 15, 2018, and at that time, we expect to adopt the new standard under the modified retrospective approach. We do not believe the adoption of ASU 2014-09 will have a material impact on the amount or timing of our home building revenues. We are continuing to evaluate the impact the adoption may have on other aspects of our business and on our financial statements and disclosures.
In February 2015, the FASB issued Accounting Standards Update ASU No. 2015-02, Amendments to the Consolidation Analysis (“ASU 2015-02”), which changes the analysis that a reporting entity must perform to determine whether it should consolidate certain types of legal entities. The amendments in ASU 2015-02 are effective for interim and annual periods beginning after December 15, 2015. Early adoption is permitted. The adoption of ASU 2015-02 for the annual period ended December 31, 2016 resulted in no material effect on the Company's financial statements and related disclosures.
In November 2016, the FASB issued ASU No. 2016-18, Statement of Cash Flows (Topic 230): Restricted Cash ("ASU 2016-18"). ASU 2016-16 requires that a statement of cash flows explain the change during the period in the total of cash, cash equivalents, and amounts generally described as restricted cash or restricted cash equivalents. Therefore, amounts generally described as restricted cash and restricted cash equivalents should be included with cash and cash equivalents when reconciling the beginning-of-period and end-of-period total amounts shown on the statement of cash flows. ASU 2016-18 is effective for fiscal years beginning after December 15, 2017, and interim periods within those fiscal years. Early adoption is permitted. The guidance is not expected to have a material impact on the Company's financial statements.
2. Due to Affiliates and Related Party Transactions
Pursuant to the operating agreement of the Unconsolidated Joint Venture, the Company receives a management fee from the Unconsolidated Joint Venture in an amount equal to 3.0% of Unconsolidated Joint Venture revenues. During the years ended December 31, 2016, 2015, and 2014 the Company earned $79,166, $4,071,046 and $2,150,378, respectively, in management fees which have been recorded by the Company as management fee revenues from affiliates in the accompanying statements of operations.
Pursuant to the operating agreement, TNHC shall receive an overhead fee from the Company in an amount equal to 3.0%, less $500,000, of the Unconsolidated Joint Venture revenues. This amount will be paid as follows:
1) | 1.5% of the projected gross sales revenue of the Unconsolidated Joint Venture, less $500,000, paid in equal monthly installments on or about the first day of the month over the projected life of the project. |
2) | 1.5% of the gross sales revenue from each home sold, payable upon the first day of the month following close of escrow. |
Pursuant to the operating agreement, IHP shall receive an overhead fee from the Company in an amount equal to $500,000, which has been paid in full. During the years ended December 31, 2016, 2015 and 2014, TNHC earned $0, $1,335,700, and $1,143,600, respectively, and IHP earned $0, $109,300, and $104,400, respectively, in monthly overhead fees, which have been recorded by the Company as overhead fees to the Members in the accompanying statements of operations. As of December 31, 2016 and 2015, no amounts were due to TNHC or IHP for such fees.
During the years ended December 31, 2016, 2015, and 2014 TNHC earned and received $79,166, $2,449,744 and $827,180 respectively, and IHP earned $0, $176,302 and $75,198, respectively, in overhead fees earned from homes sold, which have been recorded by the Company as overhead fees to the Members in the accompanying statements of operations. As of December 31, 2016 and 2015, no amounts were due to TNHC and IHP for such fees.
90
3. Commitments and Contingencies
The Company’s commitments and contingencies include the usual obligations and litigation incurred by real estate developers in the normal course of business. In the opinion of management, there are no material loss contingencies.
As an owner of a developer of real estate, the Company is subject to various environmental laws of federal, state and local governments. The Company is not aware of any environmental liability that could have a material adverse effect on its financial condition or results of operations. However, changes in applicable environmental laws and regulations, the uses and conditions of real estate in the vicinity of the Company’s real estate and other environmental conditions of which the Company is unaware with respect to the real estate could result in future environmental liabilities.
4. Subsequent Events
The Company has evaluated subsequent events through February 22, 2017, the date the financial statements were available for issuance.
91
Report of Independent Auditors
The Members
TNHC Newport LLC
We have audited the accompanying financial statements of TNHC Newport LLC, which comprise the balance sheets as of December 31, 2016 and 2015, and the related statements of operations, members’ capital, and cash flows for the three year period ended December 31, 2016, and the related notes to the financial statements.
Management’s Responsibility for the Financial Statements
Management is responsible for the preparation and fair presentation of these financial statements in conformity with U.S. generally accepted accounting principles; this includes the design, implementation and maintenance of internal control relevant to the preparation and fair presentation of financial statements that are free of material misstatement, whether due to fraud or error.
Auditor’s Responsibility
Our responsibility is to express an opinion on these financial statements based on our audits. We conducted our audits in accordance with auditing standards generally accepted in the United States. Those standards require that we plan and perform the audit to obtain reasonable assurance about whether the financial statements are free of material misstatement.
An audit involves performing procedures to obtain audit evidence about the amounts and disclosures in the financial statements. The procedures selected depend on the auditor’s judgment, including the assessment of the risks of material misstatement of the financial statements, whether due to fraud or error. In making those risk assessments, the auditor considers internal control relevant to the entity’s preparation and fair presentation of the financial statements in order to design audit procedures that are appropriate in the circumstances, but not for the purpose of expressing an opinion on the effectiveness of the entity’s internal control. Accordingly, we express no such opinion. An audit also includes evaluating the appropriateness of accounting policies used and the reasonableness of significant accounting estimates made by management, as well as evaluating the overall presentation of the financial statements.
We believe that the audit evidence we have obtained is sufficient and appropriate to provide a basis for our audit opinion.
Opinion
In our opinion, the financial statements referred to above present fairly, in all material respects, the financial position of TNHC Newport LLC at December 31, 2016 and 2015, and the results of its operations and its cash flows for the three year period ended December 31, 2016, in conformity with U.S. generally accepted accounting principles.
/s/ Ernst & Young LLP
Irvine, California
February 22, 2017
92
TNHC Newport LLC | ||||||
(A Delaware Limited Liability Company) | ||||||
Balance Sheets | ||||||
December 31 | ||||||
2016 | 2015 | |||||
Assets | ||||||
Cash | $ | 4,545,757 | $ | 12,021,389 | ||
Restricted cash | — | 500,000 | ||||
Real estate inventories | — | 3,650,099 | ||||
Other assets | — | 44,139 | ||||
Total assets | $ | 4,545,757 | $ | 16,215,627 | ||
Liabilities and members’ capital | ||||||
Accounts payable | $ | 66,952 | $ | 4,573,627 | ||
Accrued expenses and other liabilities | 2,823,598 | 3,076,484 | ||||
Due to affiliate (Note 5) | 3,063 | 49,280 | ||||
2,893,613 | 7,699,391 | |||||
Commitments and contingencies (Note 6) | ||||||
Members’ capital | 1,652,144 | 8,516,236 | ||||
Total liabilities and members’ capital | $ | 4,545,757 | $ | 16,215,627 | ||
See accompanying notes. | ||||||
93
TNHC Newport LLC | |||||||||
(A Delaware Limited Liability Company) | |||||||||
Statements of Operations | |||||||||
Year Ended December 31 | |||||||||
2016 | 2015 | 2014 | |||||||
Revenues: | |||||||||
Home sales | $ | 4,803,954 | $ | 161,728,995 | $ | 56,601,330 | |||
Design studio option sales | 446,046 | 13,881,781 | 3,557,220 | ||||||
5,250,000 | 175,610,776 | 60,158,550 | |||||||
Cost of sales: | |||||||||
Cost of home sales | 5,469,778 | 121,020,740 | 41,538,023 | ||||||
Cost of design studio option sales | 297,062 | 10,191,160 | 2,668,840 | ||||||
5,766,840 | 131,211,900 | 44,206,863 | |||||||
Gross (loss) profit | (516,840 | ) | 44,398,876 | 15,951,687 | |||||
Selling and marketing expenses | 150,941 | 2,859,369 | 930,617 | ||||||
Selling and marketing expenses incurred from affiliates (Note 5) | 90,749 | 1,242,532 | 731,575 | ||||||
Overhead fees to affiliates (Note 5) | 105,562 | 5,428,404 | 2,866,971 | ||||||
Net (loss) income | $ | (864,092 | ) | $ | 34,868,571 | $ | 11,422,524 | ||
See accompanying notes. | |||||||||
94
TNHC Newport LLC | |||||||||
(A Delaware Limited Liability Company) | |||||||||
Statements of Members' Capital | |||||||||
Years Ended December 31, 2016, 2015 and 2014 | |||||||||
TNHC | NB | ||||||||
Meridian | Residences, | ||||||||
Investors LLC | LLC | Total | |||||||
Balance at December 31, 2013 | $ | 16,003,799 | $ | 29,721,342 | $ | 45,725,141 | |||
Contributions | 350,000 | 5,150,000 | 5,500,000 | ||||||
Distributions | (999,880 | ) | (2,000,120 | ) | (3,000,000 | ) | |||
Net income | 3,885,517 | 7,537,007 | 11,422,524 | ||||||
Balance at December 31, 2014 | 19,239,436 | 40,408,229 | 59,647,665 | ||||||
Distributions | (31,300,860 | ) | (54,699,140 | ) | (86,000,000 | ) | |||
Net income | 16,319,542 | 18,549,029 | 34,868,571 | ||||||
Balance at December 31, 2015 | 4,258,118 | 4,258,118 | 8,516,236 | ||||||
Distributions | (2,972,973 | ) | (3,027,027 | ) | (6,000,000 | ) | |||
Net loss | (459,073 | ) | (405,019 | ) | (864,092 | ) | |||
Balance at December 31, 2016 | $ | 826,072 | $ | 826,072 | $ | 1,652,144 | |||
See accompanying notes. | |||||||||
95
TNHC Newport LLC | |||||||||||
(A Delaware Limited Liability Company) | |||||||||||
Statements of Cash Flows | |||||||||||
Year Ended December 31 | |||||||||||
2016 | 2015 | 2014 | |||||||||
Operating activities | |||||||||||
Net (loss) income | $ | (864,092 | ) | $ | 34,868,571 | $ | 11,422,524 | ||||
Adjustments to reconcile net (loss) income to net cash | |||||||||||
(used in) provided by operating activities: | |||||||||||
Net changes in operating assets and liabilities: | |||||||||||
Real estate inventories | 3,650,099 | 74,758,196 | (29,589,343 | ) | |||||||
Other assets | 44,139 | 1,235,895 | 463,461 | ||||||||
Accounts payable | (4,506,675 | ) | (3,509,984 | ) | 4,511,432 | ||||||
Accrued expenses and other liabilities | (252,886 | ) | 1,861,912 | 1,202,321 | |||||||
Due to affiliate | (46,217 | ) | (119,644 | ) | 152,309 | ||||||
Net cash (used in) provided by operating activities | (1,975,632 | ) | 109,094,946 | (11,837,296 | ) | ||||||
Financing activities | |||||||||||
Restricted cash | 500,000 | — | — | ||||||||
Proceeds from issuance of note payable to member | — | — | 4,268,291 | ||||||||
Repayment of note payable to member | — | (4,268,291 | ) | — | |||||||
Proceeds from issuance of note payable | — | 35,961,943 | 13,054,838 | ||||||||
Repayment of note payable | — | (53,692,886 | ) | — | |||||||
Members’ capital contributions | — | — | 5,500,000 | ||||||||
Members’ capital distributions | (6,000,000 | ) | (86,000,000 | ) | (3,000,000 | ) | |||||
Net cash (used in) provided by financing activities | (5,500,000 | ) | (107,999,234 | ) | 19,823,129 | ||||||
Net (decrease) increase in cash | (7,475,632 | ) | 1,095,712 | 7,985,833 | |||||||
Cash at beginning of year | 12,021,389 | 10,925,677 | 2,939,844 | ||||||||
Cash at end of year | $ | 4,545,757 | $ | 12,021,389 | $ | 10,925,677 | |||||
Supplemental disclosures of cash flow information | |||||||||||
Interest paid, net of amounts capitalized | $ | — | $ | — | $ | — | |||||
See accompanying notes. | |||||||||||
96
TNHC Newport LLC
(A Delaware Limited Liability Company)
Notes to Financial Statements
December 31, 2016, 2015 and 2014
1. Organization and Summary of Significant Accounting Policies
TNHC Newport LLC, a Delaware limited liability company (the “Company”), was formed with an effective date of March 1, 2013. The Company was capitalized through cash and asset contributions by TNHC Meridian Investors LLC (“TNHC”) and NB Residences, LLC (“NB Residences”) (collectively, “the Members”). On April 1, 2013, the Company purchased 4.25 acres of land located in Newport Beach, California, for the development and sale of 79 homes in a community known as Meridian (“the Project”). Subject to the operating agreement, distributions of net cash flow to the Members shall be in the following order of priority:
1) | To the Members in proportion to their respective accrued and unpaid First Priority Preference Amount, as defined; then |
2) | To the Members in proportion to their respective Undistributed First Priority Capital Amount, as defined; then |
3) | To the Members in proportion to their respective accrued and unpaid Second Priority Preference Amount, as defined; then |
4) | To the Members in proportion to their respective Undistributed Second Priority Capital Amount, as defined; then |
5) | To the Members in proportion to their respective Percentage Interests, as defined (TNHC 50% and NB Residences 50%). |
Upon the formation of the Company, TNHC received a distribution of $4,618,808 from the Company in order to bring contribution percentages of each Member in line with the operating agreement, which was 35% for TNHC and 65% for NB Residences. During 2014, the Members amended the operating agreement to allow NB Residences to make a contribution of $4,500,000 without the requirement for TNHC to make a corresponding contribution. This contribution was designated as an increase to NB Residences Undistributed Second Priority Capital.
Subject to the operating agreement, income and loss are allocated to the Members generally in the same manner as distributions of net cash flow.
Pursuant to the operating agreement, the preferred return on First Priority Capital, as defined, for both Members is 20% per annum, compounded monthly. The preferred return on Second Priority Capital, as defined, for both Members is 12% per annum, compounded monthly. During 2015, the First Priority Capital, Second Priority Capital and all preferred returns associated were returned to the partners, as such, no additional preferred return distributions are expected as of December 31, 2015 and 2016.
The following is a summary of the preferred returns for the Members as of December 31, 2016:
TNHC | NB Residences | Total | |||||||
Cumulative First Priority preferred return | $ | — | $ | — | $ | — | |||
Cumulative First Priority preferred distributions | — | — | — | ||||||
Cumulative Second Priority preferred return | 5,532,742 | 11,085,315 | 16,618,057 | ||||||
Cumulative Second Priority preferred distributions | (5,532,742 | ) | (11,085,315 | ) | (16,618,057 | ) | |||
Remaining undistributed preferred return | $ | — | $ | — | $ | — | |||
Basis of Presentation
The accompanying financial statements have been prepared in accordance with U.S. generally accepted accounting principles (“GAAP”) as contained within the Financial Accounting Standards Board (“FASB”) Accounting Standards Codification (“ASC”). This basis of accounting contemplates the recovery of the Company’s assets and the satisfaction of its liabilities in the normal course of business. Management believes the Company has sufficient cash and access to capital to fund its operations. Certain
97
items in prior year financial statements related to capitalized selling and marketing expenses have been reclassified to conform with current year presentation.
Use of Estimates
The preparation of the Company’s financial statements in conformity with GAAP requires management to make estimates and assumptions that affect the reported amounts of assets, liabilities, revenues and expenses, and the disclosure of commitments and contingencies. Actual results could differ materially from those estimates.
Cash
The Company considers all highly liquid investments that are readily convertible to cash, with original maturity dates of three months or less, to be cash and cash equivalents. Financial instruments that potentially subject the Company to significant concentrations of credit risk consist principally of cash deposited with financial institutions in excess of amounts insured by the Federal Deposit Insurance Corporation. The Company has not experienced any losses related to uninsured cash balances.
Restricted Cash
Restricted cash of $0 and $500,000 as of December 31, 2016 and 2015 served as collateral for a letter of credit for certain performance bonds. As of December 31, 2016, the collateral requirement was no longer in place.
Real Estate Inventories and Cost of Sales
Real estate inventories are carried at cost. Development costs, including land, land development, direct costs of construction, indirect costs, interest, and property taxes incurred during the development period, are capitalized. Capitalization of development costs ends when the assets are substantially complete and ready for sale.
Costs of home sales are allocated based on specific identification or relative sales value, depending on the nature of the costs. Project-specific costs are amortized to cost of sales as homes are closed based upon a method that approximates relative sales value. A provision for warranty costs is included in cost of homes sold at the time the sale of a home is recorded. Selling and marketing costs are expensed in the period incurred.
Real estate inventories are stated at cost, unless the carrying amount is determined not to be recoverable, in which case the inventories are written down to fair value in accordance with ASC 360, Property, Plant and Equipment ("ASC 360"). ASC 360 requires that real estate assets be tested for impairment whenever events or changes in circumstances indicate that their carrying amounts may not be recoverable.
Impairment of assets is measured by comparing the carrying amount of an asset to the undiscounted future net cash flows expected to be generated by the asset. These evaluations for impairment are significantly impacted by estimates of the amounts and timing of revenues, costs and expenses, and other factors. If real estate assets are considered to be impaired, the impairment to be recognized is measured by the amount by which the carrying value of the assets exceeds the fair value of the assets. Fair value is determined based on estimated future cash flows discounted for inherent risks associated with the real estate assets, or other valuation techniques.
As of December 31, 2016 and 2015, the Company determined that the carrying amounts of its real estate inventories were not impaired based upon the undiscounted future cash flows of the underlying Project.
Revenue Recognition
In accordance with ASC 360, revenues from home sales and other real estate sales are recorded and a profit is recognized when the respective units are closed. Home sales and other real estate sales are closed when all conditions of escrow are met, including delivery of the home, title passage, appropriate consideration is received and collection of associated receivables, if any, is reasonably assured, and other applicable criteria are met. Sales incentives are a reduction of revenues when the respective unit is closed. When it is determined that the earnings process is not complete, the sale and related profit are deferred for recognition in future periods.
98
Income Taxes
As a limited liability company, the Company is subject to certain minimal taxes and fees; however, income taxes on income reported by the Company are the obligation of the Members.
The Company applies the provisions of ASC 740, Accounting for Uncertainty in Income Taxes ("ASC 740"). Based on its evaluation, under ASC 740, the Company has concluded that there are no significant uncertain tax positions requiring recognition in its financial statements, nor has the Company been assessed interest or penalties by any major tax jurisdictions. The Company’s evaluation was performed for the tax years ended December 31, 2016, 2015 and 2014.
New Accounting Pronouncements
In May 2014, the FASB issued Accounting Standards Update (“ASU”) No. 2014-09, Revenue from Contracts with Customers (“ASU 2014-09”), which supersedes existing accounting literature relating to how and when a company recognizes revenue. Under ASU 2014-09, a company will recognize revenue when it transfers promised goods or services to customers in an amount that reflects the consideration to which the company expects to be entitled in exchange for those goods and services. In August 2015, the FASB issued ASU No. 2015-14, Revenue from Contracts with Customers (Topic 606): Deferral of the Effective Date, which delayed the effective date of ASU 2014-09 by one year. As a non-public company, ASU 2014-09 is effective for our interim and annual reporting periods beginning after December 15, 2018, and at that time, we expect to adopt the new standard under the modified retrospective approach. We do not believe the adoption of ASU 2014-09 will have a material impact on the amount or timing of our home building revenues. Although we are still evaluating the accounting for marketing costs under the new standard, there is a possibility that the adoption of ASU 2014-09 will impact the timing of recognition and classification in our financial statements of certain capitalized selling and marketing costs we incur to obtain sales contracts from our customers. Currently, these selling and marketing costs are capitalized to real estate inventories and amortized to cost of sales as homes are delivered. Under the new guidance, some of these costs may need to be expensed immediately. We are continuing to evaluate the impact the adoption may have on other aspects of our business and on our financial statements and disclosures.
In February 2015, the FASB issued Accounting Standards Update ASU No. 2015-02, Amendments to the Consolidation Analysis (“ASU 2015-02”), which changes the analysis that a reporting entity must perform to determine whether it should consolidate certain types of legal entities. The amendments in ASU 2015-02 are effective for interim and annual periods beginning after December 15, 2015. Early adoption is permitted. The adoption of ASU 2015-02 for the annual period ended December 31, 2016 resulted in no material effect on the Company's financial statements and related disclosures.
In November 2016, the FASB issued ASU No. 2016-18, Statement of Cash Flows (Topic 230): Restricted Cash ("ASU 2016-18"). ASU 2016-16 requires that a statement of cash flows explain the change during the period in the total of cash, cash equivalents, and amounts generally described as restricted cash or restricted cash equivalents. Therefore, amounts generally described as restricted cash and restricted cash equivalents should be included with cash and cash equivalents when reconciling the beginning-of-period and end-of-period total amounts shown on the statement of cash flows. ASU 2016-18 is effective for fiscal years beginning after December 15, 2017, and interim periods within those fiscal years. Early adoption is permitted. The guidance is not expected to have a material impact on the Company's financial statements.
2. Real Estate Inventories
Real estate inventories consisted of the following:
December 31 | ||||||
2016 | 2015 | |||||
Construction in progress | $ | — | $ | 3,650,099 | ||
Construction in progress consists primarily of construction costs for homes and common area facilities, which are in various stages of development.
99
The Company incurred, capitalized and amortized interest costs as follows:
Year Ended December 31 | |||||||||
2016 | 2015 | 2014 | |||||||
Interest included in beginning real estate inventories | $ | 49,241 | $ | 576,695 | $ | 12,251 | |||
Interest incurred and capitalized | — | 1,037,939 | 1,313,753 | ||||||
Interest amortized to cost of sales | (49,241 | ) | (1,565,393 | ) | (749,309 | ) | |||
Interest included in ending real estate inventories | $ | — | $ | 49,241 | $ | 576,695 | |||
3. Other Assets
Other assets consisted of the following:
December 31 | ||||||
2016 | 2015 | |||||
Capitalized selling and marketing costs | $ | — | $ | 44,139 | ||
4. Accrued Expenses and Other Liabilities
Accrued expenses and other liabilities consisted of the following:
December 31 | ||||||
2016 | 2015 | |||||
Completion reserve | $ | 685,992 | $ | 813,038 | ||
Accrued expenses | 17,500 | — | ||||
Warranty reserve | 2,120,106 | 2,263,446 | ||||
$ | 2,823,598 | $ | 3,076,484 | |||
The completion reserve includes project costs for homes that have closed but for which invoices from vendors have not yet been received. The Company periodically assesses the adequacy of its completion reserve and adjusts the amounts as necessary.
The Company offers warranties on its homes that generally cover various defects in workmanship, materials, or to cover structural construction defects. Estimated future direct warranty costs are accrued and charged to cost of sales in the period when the related homebuilding revenues are recognized. The Company assesses the adequacy of its warranty accrual on a quarterly basis and adjusts the amounts recorded if necessary.
Changes in the Company’s warranty liability are as follows:
Year Ended December 31 | |||||||||
2016 | 2015 | 2014 | |||||||
Beginning warranty liability | $ | 2,263,446 | $ | 601,002 | $ | — | |||
Warranty provision | 52,500 | 1,756,030 | 602,432 | ||||||
Warranty payments | (195,840 | ) | (93,586 | ) | (1,430 | ) | |||
Ending warranty liability | $ | 2,120,106 | $ | 2,263,446 | $ | 601,002 | |||
5. Due to Affiliates and Related Party Transactions
Amounts due to affiliates consisted of the following:
December 31 | ||||||
2016 | 2015 | |||||
Accrued payroll | $ | 3,063 | $ | 49,280 | ||
100
During the years ended December 31, 2016, 2015 and 2014, TNHC incurred construction-related costs on the Company’s behalf totaling $354,183, $2,120,294, and $1,274,951, respectively. The Company capitalized $263,434, $877,762, and $543,376 of these amounts to real estate inventories for the years ended December 31, 2016, 2015 and 2014 and charged the remaining $90,749, $1,242,532 and $731,575, respectively, to selling and marketing expenses incurred from affiliates in the accompanying statements of operations. As of December 31, 2016 and 2015, $3,063 and $49,280, respectively, was due to TNHC and is reflected in the accompanying balance sheets as due to affiliates.
Pursuant to the operating agreement, TNHC and NB Residences shall receive an overhead fee from the Company in an amount equal to 3.0% and 1.0%, respectively, of the Project revenues. This amount will be paid as follows:
1) | 1.5% of the projected gross sales revenue of the Project to TNHC and 0.5% of the projected gross sales revenue of the Project to NB Residences, paid in equal monthly installments on or about the first day of each month over the projected life of the project, which began April 1, 2013. |
2) 1.5% of the gross sales revenue from each home sold to TNHC and 0.5% of the gross sales revenue from each home sold to NB Residences, payable upon the first day of the month following close of escrow.
During the years ended December 31, 2016, 2015 and 2014, TNHC earned $0, $1,445,000, and $1,248,000, respectively, and NB Residences earned $0, $482,000, and $415,800, respectively, in monthly overhead fees, which have been recorded by the Company as overhead fees to affiliates in the accompanying statements of operations. During the years ended December 31, 2016, 2015, and 2014, TNHC earned $79,166, $2,626,046, and $902,378, respectively, and NB Residences earned $26,396, $875,358, and $300,793, respectively, in overhead fees earned from homes sold, which have also been recorded by the Company as overhead fees to affiliates in the accompanying statements of operations. As of December 31, 2016 and 2015, no amounts were outstanding for such fees.
6. Commitments and Contingencies
The Company’s commitments and contingencies include the usual obligations and litigation incurred by real estate developers in the normal course of business. In the opinion of management, there are no material loss contingencies.
The Company obtains performance bonds in the normal course of business to ensure completion of the infrastructure of the Project. At December 31, 2016 and 2015, the Company had $0 and $5,157,470, respectively, in performance bonds outstanding with various cities, governmental entities, and others. The estimated remaining costs to complete such improvements was $0 and $4,935,627, respectively. In the unlikely event that any such surety bond issued by a third party is called because the required improvements are not completed, the Company could be obligated to reimburse the issuer of the bond.
As an owner and developer of real estate, the Company is subject to various environmental laws of federal, state and local governments. The Company is not aware of any environmental liability that could have a material adverse effect on its financial condition or results of operations. However, changes in applicable environmental laws and regulations, the uses and conditions of real estate in the vicinity of the Company’s real estate and other environmental conditions of which the Company is unaware with respect to the real estate could result in future environmental liabilities.
7. Subsequent Events
The Company has evaluated subsequent events through February 22, 2017, the date the financial statements were available for issuance.
101
Report of Independent Auditors
The Members
LR8 Investors, LLC
We have audited the accompanying consolidated financial statements of LR8 Investors, LLC, which comprise the related consolidated statements of operations, members’ capital, and cash flows for the year ended December 31, 2014, and the related notes to the consolidated financial statements.
Management’s Responsibility for the Financial Statements
Management is responsible for the preparation and fair presentation of these financial statements in conformity with U.S. generally accepted accounting principles; this includes the design, implementation and maintenance of internal control relevant to the preparation and fair presentation of financial statements that are free of material misstatement, whether due to fraud or error.
Auditor’s Responsibility
Our responsibility is to express an opinion on these financial statements based on our audit. We conducted our audit in accordance with auditing standards generally accepted in the United States. Those standards require that we plan and perform the audit to obtain reasonable assurance about whether the financial statements are free of material misstatement.
An audit involves performing procedures to obtain audit evidence about the amounts and disclosures in the financial statements. The procedures selected depend on the auditor’s judgment, including the assessment of the risks of material misstatement of the financial statements, whether due to fraud or error. In making those risk assessments, the auditor considers internal control relevant to the entity’s preparation and fair presentation of the financial statements in order to design audit procedures that are appropriate in the circumstances, but not for the purpose of expressing an opinion on the effectiveness of the entity’s internal control. Accordingly, we express no such opinion. An audit also includes evaluating the appropriateness of accounting policies used and the reasonableness of significant accounting estimates made by management, as well as evaluating the overall presentation of the financial statements.
We believe that the audit evidence we have obtained is sufficient and appropriate to provide a basis for our audit opinion.
Opinion
In our opinion, the financial statements referred to above present fairly, in all material respects, the results of its operations and its cash flows for the year ended December 31, 2014, in conformity with U.S. generally accepted accounting principles.
/s/ Ernst & Young LLP
Irvine, California
February 27, 2015
102
LR8 Investors, LLC | ||||||
(A Delaware Limited Liability Company) | ||||||
Consolidated Balance Sheets | ||||||
(Unaudited) | ||||||
June 1 | December 31 | |||||
2016 | 2015 | |||||
Assets | ||||||
Cash | $ | 2,009,317 | $ | 2,305,705 | ||
Other assets | 137,602 | 137,858 | ||||
Total assets | $ | 2,146,919 | $ | 2,443,563 | ||
Liabilities and members' capital | ||||||
Accounts payable | $ | 15,550 | $ | 19,601 | ||
Accrued expenses and other liabilities | 509,675 | 2,218,271 | ||||
525,225 | 2,237,872 | |||||
Commitments and contingencies (Note 5) | ||||||
Members' capital | 1,621,694 | 205,691 | ||||
Total liabilities and members' capital | $ | 2,146,919 | $ | 2,443,563 | ||
See accompanying notes. | ||||||
103
LR8 Investors, LLC | |||||||||
(A Delaware Limited Liability Company) | |||||||||
Consolidated Statements of Operations | |||||||||
Period Ended | Year Ended December 31 | ||||||||
June 1, 2016 | 2015 | 2014 | |||||||
(Unaudited) | (Unaudited) | ||||||||
Revenues: | |||||||||
Home sales | $ | — | $ | — | $ | 12,246,011 | |||
Design studio option sales | — | — | 1,935,856 | ||||||
— | — | 14,181,867 | |||||||
Cost of sales: | |||||||||
Home sales | (1,744,680 | ) | (22,943 | ) | 7,705,283 | ||||
Design studio option sales | — | — | 1,526,821 | ||||||
(1,744,680 | ) | (22,943 | ) | 9,232,104 | |||||
Gross profit | 1,744,680 | 22,943 | 4,949,763 | ||||||
Selling and marketing expenses | — | 1,199 | 372,179 | ||||||
Selling and marketing expenses incurred from affiliates | — | — | 189,768 | ||||||
Guaranty fee to affiliates | — | — | 18,927 | ||||||
Overhead fees to affiliates | — | — | 229,321 | ||||||
Legal expenses | — | 336,960 | 534,415 | ||||||
Net income (loss) | $ | 1,744,680 | $ | (315,216 | ) | $ | 3,605,153 | ||
See accompanying notes. | |||||||||
104
LR8 Investors, LLC | |||||||||
(A Delaware Limited Liability Company) | |||||||||
Consolidated Statements of Members' Capital | |||||||||
Period Ended June 1, 2016 (Unaudited) and | |||||||||
Years Ended December 31, 2015 (Unaudited) and 2014 | |||||||||
The New Home | |||||||||
Company | |||||||||
Southern | MFCI8 LR, | ||||||||
California LLC | LLC | Total | |||||||
Balance at December 31, 2013 | $ | 1,207,935 | $ | 3,613,768 | $ | 4,821,703 | |||
Distributions | (1,677,190 | ) | (4,708,759 | ) | (6,385,949 | ) | |||
Net income | 1,081,546 | 2,523,607 | 3,605,153 | ||||||
Balance at December 31, 2014 | 612,291 | 1,428,616 | 2,040,907 | ||||||
Distributions | (456,000 | ) | (1,064,000 | ) | (1,520,000 | ) | |||
Net loss | (94,565 | ) | (220,651 | ) | (315,216 | ) | |||
Balance at December 31, 2015 (Unaudited) | 61,726 | 143,965 | 205,691 | ||||||
Distributions | (98,603 | ) | (230,074 | ) | (328,677 | ) | |||
Net income | 523,404 | 1,221,276 | 1,744,680 | ||||||
Balance at June 1, 2016 (Unaudited) | $ | 486,527 | $ | 1,135,167 | $ | 1,621,694 | |||
See accompanying notes. | |||||||||
105
LR8 Investors, LLC | |||||||||
(A Delaware Limited Liability Company) | |||||||||
Consolidated Statements of Cash Flows | |||||||||
Period Ended | Year Ended December 31 | ||||||||
June 1, 2016 | 2015 | 2014 | |||||||
(Unaudited) | (Unaudited) | ||||||||
Operating activities | |||||||||
Net income (loss) | $ | 1,744,680 | $ | (315,216 | ) | $ | 3,605,153 | ||
Adjustments to reconcile net income (loss) to net cash | |||||||||
(used in) provided by operating activities: | |||||||||
Net changes in operating assets and liabilities: | |||||||||
Real estate inventories | — | — | 6,098,142 | ||||||
Other assets | 256 | 67,255 | 686,037 | ||||||
Accounts payable | (4,051 | ) | (1,547 | ) | (1,412,515 | ) | |||
Due to affiliates | — | (18,795 | ) | (256,916 | ) | ||||
Accrued expenses and other liabilities | (1,708,596 | ) | (217,724 | ) | 33,932 | ||||
Net cash (used in) provided by operating activities | 32,289 | (486,027 | ) | 8,753,833 | |||||
Financing activities | |||||||||
Cash collateral on notes payable | — | — | 752,032 | ||||||
Repayments of notes payable | — | — | (3,150,326 | ) | |||||
Members' capital distributions | (328,677 | ) | (1,520,000 | ) | (6,385,949 | ) | |||
Net cash used in financing activities | (328,677 | ) | (1,520,000 | ) | (8,784,243 | ) | |||
Net decrease in cash | (296,388 | ) | (2,006,027 | ) | (30,410 | ) | |||
Cash at beginning of period | 2,305,705 | 4,311,732 | 4,342,142 | ||||||
Cash at end of period | $ | 2,009,317 | $ | 2,305,705 | $ | 4,311,732 | |||
Supplemental disclosures of cash flow information | |||||||||
Interest paid, net of amounts capitalized | $ | — | $ | — | $ | — | |||
See accompanying notes. | |||||||||
106
LR8 Investors, LLC
(A Delaware Limited Liability Company)
Notes to Consolidated Financial Statements
For the period ended June 1, 2016 (Unaudited)
and the years ended December 31, 2015 (Unaudited) and 2014
1. Organization and Summary of Significant Accounting Policies
LR8 Investors, LLC, a Delaware limited liability company (the “Company”), was formed with an effective date of September 22, 2010. The Company was capitalized through cash contributions by The New Home Company Southern California LLC (“TNHC”) and MFCI8 LR, LLC (“Westbrook”) (collectively, the “Members”). On December 22, 2010, the Company, through a wholly owned subsidiary, acquired approximately 51 acres of land located in Irvine, California for the development and sale of 169 homes in a community known as Lambert Ranch (the “Project”). As of December 31, 2014, all homes had been sold and closed.
Subject to the operating agreement, distributions of net cash flow to the Members shall be in the following order of priority:
1. | To the Members in proportion to their respective Percentage Interests (Westbrook 95% and TNHC 5%), until each Member has received aggregate distributions necessary to provide each Member with a 15% IRR on its capital contributions; |
2. | To the Members in the following proportion: 85% to Westbrook and 15% to TNHC, until each Member has received aggregate distributions necessary to provide each Member with a 20% IRR and a 1.5x multiple on its capital contributions; |
3. | To the Members in the following proportion: 80% to Westbrook and 20% to TNHC, until each Member has received aggregate distributions necessary to provide each Member with a 25% IRR and a 1.65x multiple on its capital contributions; and |
4. | To the Members, in the following proportion: 70% to Westbrook and 30% to TNHC. |
Subject to the operating agreement, income and loss is allocated to the Members in the same manner as distributions of net cash flow.
Effective May 31, 2016, the Members entered into an agreement to redeem Westbrook’s ownership interest in the Company for a nominal amount. On June 1, 2016, the Company made final distributions to the Members. Upon the change in control, TNHC acquired the remaining assets, liabilities and equity of the Company, including Westbrook’s ending basis of $1.1 million.
Basis of Presentation
The accompanying consolidated financial statements have been prepared in accordance with U.S. generally accepted accounting principles (“GAAP”) as contained within the Financial Accounting Standards Board (“FASB”) Accounting Standards Codification (“ASC”). This basis of accounting contemplates the recovery of the Company’s assets and the satisfaction of its liabilities in the normal course of business. Management believes the Company has sufficient cash and access to capital to fund its operations. Certain items in prior year financial statements related to capitalized selling and marketing expenses have been reclassified to conform with current year presentation.
Principles of Consolidation
The consolidated financial statements include the accounts of the Company and its wholly owned and controlled subsidiary. The accounting policies of the subsidiary are substantially the same as those of the Company. All significant intercompany accounts and transactions have been eliminated in consolidation.
Use of Estimates
The preparation of the Company’s consolidated financial statements in conformity with GAAP requires management to make estimates and assumptions that affect the reported amounts of assets, liabilities, revenues and expenses, and the disclosure of commitments and contingencies. Actual results could differ materially from those estimates.
Cash
The Company considers all highly-liquid investments that are readily convertible to cash, with original maturity dates of three months or less, to be cash and cash equivalents. Financial instruments that potentially subject the Company to significant
107
concentrations of credit risk consist principally of cash deposited with financial institutions in excess of amounts insured by the Federal Deposit Insurance Corporation. The Company has not experienced any losses related to uninsured cash balances.
Income Taxes
As a limited liability company, the Company is subject to certain minimal taxes and fees; however, income taxes reported by the Company are the obligation of the Members.
The Company applies the provisions of ASC 740, Accounting for Uncertainty in Income Taxes (ASC 740). Based on its evaluation, under ASC 740, the Company has concluded that there are no significant uncertain tax positions requiring recognition in its financial statements, nor has the Company been assessed interest or penalties by any major tax jurisdictions. The Company’s evaluation was performed for the tax period ended June 1, 2016 and the tax years ended December 31, 2015, and 2014.
New Accounting Pronouncements
In May 2014, the FASB issued Accounting Standards Update (“ASU”) No. 2014-09, Revenue from Contracts with Customers (“ASU 2014-09”), which supersedes existing accounting literature relating to how and when a company recognizes revenue. Under ASU 2014-09, a company will recognize revenue when it transfers promised goods or services to customers in an amount that reflects the consideration to which the company expects to be entitled in exchange for those goods and services. In August 2015, the FASB issued ASU No. 2015-14, Revenue from Contracts with Customers (Topic 606): Deferral of the Effective Date, which delayed the effective date of ASU 2014-09 by one year. As a result, for public and non-public companies, ASU 2014-09 will be effective for interim and annual reporting periods beginning after December 15, 2017 and December 15, 2018, respectively, and is to be applied either with a full retrospective or modified retrospective approach, with early application permitted. The guidance is not expected to have a material impact on the Company's financial statements.
In February 2015, the FASB issued Accounting Standards Update ASU No. 2015-02, Amendments to the Consolidation Analysis (“ASU 2015-02”), which changes the analysis that a reporting entity must perform to determine whether it should consolidate certain types of legal entities. The amendments in ASU 2015-02 are effective for interim and annual periods beginning after December 15, 2015. Early adoption is permitted. The adoption of ASU 2015-02 for the annual period ended December 31, 2016 resulted in no material effect on the Company's financial statements and related disclosures.
In November 2016, the FASB issued ASU No. 2016-18, Statement of Cash Flows (Topic 230): Restricted Cash ("ASU 2016-18"). ASU 2016-16 requires that a statement of cash flows explain the change during the period in the total of cash, cash equivalents, and amounts generally described as restricted cash or restricted cash equivalents. Therefore, amounts generally described as restricted cash and restricted cash equivalents should be included with cash and cash equivalents when reconciling the beginning-of-period and end-of-period total amounts shown on the statement of cash flows. ASU 2016-18 is effective for fiscal years beginning after December 15, 2017, and interim periods within those fiscal years. Early adoption is permitted. The guidance is not expected to have a material impact on the Company's financial statements.
2. Other Assets
Other assets consisted of the following:
June 1 | December 31 | |||||
2016 | 2015 | |||||
(Unaudited) | ||||||
Cash collateral - performance bonds | $ | 137,602 | $ | 137,858 | ||
108
3. Accrued Expenses and Other Liabilities
Accrued expenses and other liabilities consisted of the following:
June 1 | December 31 | |||||
2016 | 2015 | |||||
(Unaudited) | ||||||
Warranty reserve | $ | 468,675 | $ | 2,110,358 | ||
Completion reserve | — | 86,913 | ||||
Other accrued expenses | 41,000 | 21,000 | ||||
$ | 509,675 | $ | 2,218,271 | |||
The Company offers warranties on its homes that generally cover various defects in workmanship, materials, or to cover structural construction defects. Estimated future direct warranty costs are accrued and charged to cost of sales in the period when the related homebuilding revenues are recognized. The Company assessed the adequacy of its warranty reserve as of June 1, 2016 and reduced the amount recorded by $1.6 million. This change in estimate primarily related to the absence of any significant claims following the second anniversary of the project’s final deliveries and the exoneration of a significant amount of improvement bonds during the second quarter of 2016. The Company’s warranty reserve is included in accrued expenses and other liabilities in the accompanying consolidated balance sheet.
The completion reserve includes project costs for completed work on homes that have closed but invoices from vendors have not yet been received. The Company periodically assesses the adequacy of its completion reserve and adjusts the amounts as necessary.
Changes in the Company’s warranty reserve are as follows:
June 1 | December 31 | ||||||||
2016 | 2015 | 2014 | |||||||
(Unaudited) | (Unaudited) | ||||||||
Beginning warranty reserve | $ | 2,110,358 | $ | 2,175,003 | $ | 2,190,108 | |||
Warranty provision | — | — | 141,825 | ||||||
Warranty adjustment | (1,621,694 | ) | — | — | |||||
Warranty payments | (19,989 | ) | (64,645 | ) | (156,930 | ) | |||
Ending warranty reserve | $ | 468,675 | $ | 2,110,358 | $ | 2,175,003 | |||
4. Due to Affiliates and Related Party Transactions
During the period ended June 1, 2016 and the years ended December 31, 2015 and 2014, TNHC incurred construction-related costs on the Company’s behalf of $0, $42,000 and $788,760 respectively. The Company capitalized $0, $42,000 and $588,992 of these amounts to real estate inventories and charged the remaining $0, $0 and $189,768 to selling and marketing expenses incurred from affiliates in the accompanying consolidated statements of operations. As of June 1, 2016 and December 31, 2015, no construction-related costs were included in due to affiliates in the accompanying consolidated balance sheets.
During the period ended June 1, 2016 and the years ended December 31, 2015 and 2014, the Company incurred $0, $0 and $30,000, respectively, in project coordination fees due to Sunbrook Partners, LLC, an affiliate of Westbrook. The Company capitalized these amounts to real estate inventories. As of June 1, 2016, no amounts remained outstanding.
5. Commitments and Contingencies
The Company’s commitments and contingencies include the usual obligations and litigation incurred by real estate developers in the normal course of business. In the opinion of management, there are no material loss contingencies.
The Company obtains performance bonds in the normal course of business to ensure completion of the infrastructure of the Project. As of June 1, 2016 and December 31, 2015, the Company had $15,200 and $1,497,694, respectively, in performance bonds outstanding with various cities, governmental entities, and others.
109
6. Subsequent Events
The Company has evaluated subsequent events through February 22, 2017, the date the financial statements were available for issuance.
110
Report of Independent Auditors
The Members
Larkspur Land 8 Investors, LLC
We have audited the accompanying consolidated financial statements of Larkspur Land 8 Investors, LLC, which comprise the related consolidated statements of operations, members’ capital, and cash flows for the year ended December 31, 2014, and the related notes to the consolidated financial statements.
Management’s Responsibility for the Financial Statements
Management is responsible for the preparation and fair presentation of these financial statements in conformity with U.S. generally accepted accounting principles; this includes the design, implementation and maintenance of internal control relevant to the preparation and fair presentation of financial statements that are free of material misstatement, whether due to fraud or error.
Auditor’s Responsibility
Our responsibility is to express an opinion on these financial statements based on our audit. We conducted our audit in accordance with auditing standards generally accepted in the United States. Those standards require that we plan and perform the audit to obtain reasonable assurance about whether the financial statements are free of material misstatement.
An audit involves performing procedures to obtain audit evidence about the amounts and disclosures in the financial statements. The procedures selected depend on the auditor’s judgment, including the assessment of the risks of material misstatement of the financial statements, whether due to fraud or error. In making those risk assessments, the auditor considers internal control relevant to the entity’s preparation and fair presentation of the financial statements in order to design audit procedures that are appropriate in the circumstances, but not for the purpose of expressing an opinion on the effectiveness of the entity’s internal control. Accordingly, we express no such opinion. An audit also includes evaluating the appropriateness of accounting policies used and the reasonableness of significant accounting estimates made by management, as well as evaluating the overall presentation of the financial statements.
We believe that the audit evidence we have obtained is sufficient and appropriate to provide a basis for our audit opinion.
Opinion
In our opinion, the financial statements referred to above present fairly, in all material respects, the results of its operations and its cash flows for the year ended December 31, 2014, in conformity with U.S. generally accepted accounting principles.
/s/ Ernst & Young LLP
Irvine, California
February 27, 2015
111
Larkspur Land 8 Investors, LLC | ||||||
(A Delaware Limited Liability Company) | ||||||
Consolidated Balance Sheets (Unaudited) | ||||||
December 31 | ||||||
2016 | 2015 | |||||
Assets | ||||||
Cash | $ | 2,028,273 | $ | 2,982,780 | ||
Due from affiliate (Note 5) | — | 2,021 | ||||
Other assets | 85,743 | 61,067 | ||||
Total assets | $ | 2,114,016 | $ | 3,045,868 | ||
Liabilities and members’ capital | ||||||
Accounts payable | $ | — | $ | 230,723 | ||
Accrued expenses and other liabilities | 965,017 | 1,666,536 | ||||
965,017 | 1,897,259 | |||||
Commitments and Contingencies (Note 6) | ||||||
Members’ capital | 1,148,999 | 1,148,609 | ||||
Total liabilities and members’ capital | $ | 2,114,016 | $ | 3,045,868 | ||
See accompanying notes. | ||||||
112
Larkspur Land 8 Investors, LLC | |||||||||
(A Delaware Limited Liability Company) | |||||||||
Consolidated Statements of Operations | |||||||||
Year Ended December 31 | |||||||||
2016 | 2015 | 2014 | |||||||
(Unaudited) | (Unaudited) | ||||||||
Revenues: | |||||||||
Home sales | $ | — | $ | 42,436,069 | $ | 66,048,338 | |||
Design studio option sales | — | 4,183,262 | 4,632,357 | ||||||
— | 46,619,331 | 70,680,695 | |||||||
Cost of sales: | |||||||||
Cost of home sales | — | 33,205,364 | 51,419,309 | ||||||
Cost of design studio option sales | — | 2,757,082 | 3,252,694 | ||||||
— | 35,962,446 | 54,672,003 | |||||||
Gross profit | — | 10,656,885 | 16,008,692 | ||||||
Selling and marketing expenses | (390 | ) | 944,526 | 2,138,341 | |||||
Selling and marketing expenses incurred from affiliates | — | 435,961 | 931,950 | ||||||
Overhead fees to affiliates | — | 296,240 | 601,344 | ||||||
Net income | $ | 390 | $ | 8,980,158 | $ | 12,337,057 | |||
See accompanying notes. | |||||||||
113
Larkspur Land 8 Investors, LLC | |||||||||
(A Delaware Limited Liability Company) | |||||||||
Consolidated Statements of Members' Capital | |||||||||
Years Ended December 31, 2016 (Unaudited), 2015 (Unaudited) and 2014 | |||||||||
The New Home | |||||||||
Company | MFCI8 | ||||||||
Northern | Larkspur | ||||||||
California LLC | Land, LLC | Total | |||||||
Balance at December 31, 2013 | $ | 3,443,139 | $ | 30,988,255 | $ | 34,431,394 | |||
Contributions | 50,000 | 450,000 | 500,000 | ||||||
Distributions | (2,430,000 | ) | (21,870,000 | ) | (24,300,000 | ) | |||
Net income | 1,233,706 | 11,103,351 | 12,337,057 | ||||||
Balance at December 31, 2014 | 2,296,845 | 20,671,606 | 22,968,451 | ||||||
Distributions | (3,080,000 | ) | (27,720,000 | ) | (30,800,000 | ) | |||
Net income | 898,017 | 8,082,141 | 8,980,158 | ||||||
Balance at December 31, 2015 (Unaudited) | 114,862 | 1,033,747 | 1,148,609 | ||||||
Net income | 39 | 351 | 390 | ||||||
Balance at December 31, 2016 (Unaudited) | $ | 114,901 | $ | 1,034,098 | $ | 1,148,999 | |||
See accompanying notes. | |||||||||
114
Larkspur Land 8 Investors, LLC | |||||||||
(A Delaware Limited Liability Company) | |||||||||
Consolidated Statements of Cash Flows | |||||||||
Year Ended December 31 | |||||||||
2016 | 2015 | 2014 | |||||||
(Unaudited) | (Unaudited) | ||||||||
Operating activities | |||||||||
Net income | $ | 390 | $ | 8,980,158 | $ | 12,337,057 | |||
Adjustments to reconcile net income to net cash (used in) provided by operating activities: | |||||||||
Real estate inventories | — | 28,162,395 | 24,304,483 | ||||||
Due from affiliate | 2,021 | (2,021 | ) | — | |||||
Other assets | (24,676 | ) | 2,011,346 | 466,378 | |||||
Accounts payable | (230,723 | ) | (3,018,935 | ) | 1,265,883 | ||||
Due to affiliate | — | (254,282 | ) | 253,146 | |||||
Accrued expenses and other liabilities | (701,519 | ) | 920,784 | 740,805 | |||||
Net cash (used in) provided by operating activities | (954,507 | ) | 36,799,445 | 39,367,752 | |||||
Financing activities | |||||||||
Cash collateral on notes payable | — | 4,251,585 | (2,591,510 | ) | |||||
Proceeds from issuance of note payable | — | 3,331,822 | 31,831,975 | ||||||
Repayment of secured notes | — | (14,672,540 | ) | (41,590,698 | ) | ||||
Members' capital contributions | — | — | 500,000 | ||||||
Members' capital distributions | — | (30,800,000 | ) | (24,300,000 | ) | ||||
Net cash used in financing activities | — | (37,889,133 | ) | (36,150,233 | ) | ||||
Net (decrease) increase in cash | (954,507 | ) | (1,089,688 | ) | 3,217,519 | ||||
Cash at beginning of period | 2,982,780 | 4,072,468 | 854,949 | ||||||
Cash at end of period | $ | 2,028,273 | $ | 2,982,780 | $ | 4,072,468 | |||
Supplemental disclosures of cash flow information | |||||||||
Interest paid, net of amounts capitalized | $ | — | $ | — | $ | — | |||
See accompanying notes. | |||||||||
115
Larkspur Land 8 Investors, LLC
(A Delaware Limited Liability Company)
Notes to Consolidated Financial Statements
December 31, 2016, 2015 and 2014
1. Organization and Summary of Significant Accounting Policies
Larkspur Land 8 Investors, LLC (“Investors”), a Delaware limited liability company, was formed on June 23, 2011, for the purpose of acquiring and owning 100% of Larkspur Land 8 Owner, LLC (“Owner”, and together with Investors, the “Company”), a Delaware limited liability company.
Owner was formed on June 23, 2011 to acquire approximately 17 acres of land for the development and sale of 85 homes in a community known as Rose Lane, located in Larkspur, California (the “Project”).
As of December 31, 2016, the members of Investors (individually, the “Member”, and collectively, the “Members”) and their respective percentage interests are as follows:
The New Home Company Northern California LLC (“TNHC”) | 10% |
MFCI8 Larkspur Land, LLC (“MFCI8”) | 90% |
Investors will terminate on December 31, 2061, unless sooner terminated pursuant to the provisions of the limited liability company agreement (the “Agreement”). Distributions, income and losses are to be allocated in accordance with the provisions of the Agreement. The liability of each Member is limited to the amount of capital contributions required to be made by such Member in accordance with the provisions of the Agreement.
Basis of Presentation
The accompanying consolidated financial statements have been prepared in accordance with U.S. generally accepted accounting principles (“GAAP”) as contained within the Financial Accounting Standards Board (“FASB”) Accounting Standards Codification (“ASC”). This basis of accounting contemplates the recovery of the Company’s assets and the satisfaction of its liabilities in the normal course of business. Certain items in prior year financial statements related to capitalized selling and marketing expenses have been reclassified to conform with current year presentation.
Principles of Consolidation
The consolidated financial statements include the accounts of Larkspur Land 8 Investors, LLC and its wholly owned and controlled subsidiary. The accounting policies of the subsidiary are substantially the same as those of Investors. All significant intercompany accounts and transactions have been eliminated in consolidation.
Use of Estimates
The preparation of the Company’s consolidated financial statements in conformity with GAAP requires management to make estimates and assumptions that affect the reported amounts of assets, liabilities, revenues and expenses, and the disclosure of commitments and contingencies. Actual results could differ materially from those estimates.
Cash
The Company considers all highly-liquid investments that are readily convertible to cash, with original maturity dates of three months or less, to be cash and cash equivalents. Financial instruments that potentially subject the Company to significant concentrations of credit risk consist principally of cash deposited with financial institutions in excess of amounts insured by the Federal Deposit Insurance Corporation. The Company has not experienced any losses related to uninsured cash balances.
116
Real Estate Inventories and Cost of Sales
Real estate inventories are carried at cost. Development costs, including land, land development, direct costs of construction, indirect costs, interest and property taxes incurred during the development period, are capitalized. Capitalization of development costs ends when the assets are substantially complete and ready for sale.
Costs of home sales are allocated based on specific identification, or relative sales value, depending on the nature of the costs. Project specific costs are amortized to cost of sales as homes are closed based upon a method that approximates relative sales value. A provision for warranty costs is included in cost of homes sold at the time the sale of a home is recorded. Selling and marketing costs are expensed in the period incurred.
Real estate inventories are stated at cost, unless the carrying amount is determined not to be recoverable, in which case the inventories are written down to fair value in accordance with ASC 360, Property, Plant and Equipment ("ASC 360"). ASC 360 requires that real estate assets be tested for impairment whenever events or changes in circumstances indicate that their carrying amounts may not be recoverable.
Impairment of assets is measured by comparing the carrying amount of an asset to the undiscounted future net cash flows expected to be generated by the asset. These evaluations for impairment are significantly impacted by estimates of the amounts and timing of revenues, costs and expenses, and other factors. If real estate assets are considered to be impaired, the impairment to be recognized is measured by the amount by which the carrying value of the assets exceeds the fair value of the assets. Fair value is determined based on estimated future cash flows discounted for inherent risks associated with the real estate assets, or other valuation techniques.
Revenue Recognition
In accordance with ASC 360, revenues from home sales and other real estate sales are recorded and a profit is recognized when the respective units are closed. Home sales and other real estate sales are closed when all conditions of escrow are met, including delivery of the home, title passage, appropriate consideration is received and collection of associated receivables, if any, is reasonably assured. Sales incentives are a reduction of revenues when the respective unit is closed. When it is determined that the earnings process is not complete, the sale and the related profit are deferred for recognition in future periods.
Income Taxes
As a limited liability company, the Company is subject to certain minimal taxes and fees; however, income taxes on income reported by the Company are the obligation of the Members.
The Company applies the provisions of ASC 740, Accounting for Uncertainty in Income Taxes ("ASC 740"). Based on its evaluation, under ASC 740, the Company has concluded that there are no significant uncertain tax positions requiring recognition in its financial statements, nor has the Company been assessed interest or penalties by any major tax jurisdictions. The Company’s evaluation was performed for the tax year ended December 31, 2016, 2015 and 2014.
New Accounting Pronouncements
In May 2014, the FASB issued Accounting Standards Update (“ASU”) No. 2014-09, Revenue from Contracts with Customers (“ASU 2014-09”), which supersedes existing accounting literature relating to how and when a company recognizes revenue. Under ASU 2014-09, a company will recognize revenue when it transfers promised goods or services to customers in an amount that reflects the consideration to which the company expects to be entitled in exchange for those goods and services. In August 2015, the FASB issued ASU No. 2015-14, Revenue from Contracts with Customers (Topic 606): Deferral of the Effective Date, which delayed the effective date of ASU 2014-09 by one year. As a non-public company, ASU 2014-09 is effective for our interim and annual reporting periods beginning after December 15, 2018, and at that time, we expect to adopt the new standard under the modified retrospective approach. We do not believe the adoption of ASU 2014-09 will have a material impact on the amount or timing of our home building revenues. Although we are still evaluating the accounting for marketing costs under the new standard, there is a possibility that the adoption of ASU 2014-09 will impact the timing of recognition and classification in our consolidated financial statements of certain capitalized selling and marketing costs we incur to obtain sales contracts from our customers. Currently, these selling and marketing costs are capitalized to real estate inventories and amortized to cost of sales as homes are delivered. Under the new guidance, some of these costs may need to be expensed immediately. We are continuing to evaluate the impact the adoption may have on other aspects of our business and on our consolidated financial statements and disclosures.
117
In February 2015, the FASB issued Accounting Standards Update ASU No. 2015-02, Amendments to the Consolidation Analysis (“ASU 2015-02”), which changes the analysis that a reporting entity must perform to determine whether it should consolidate certain types of legal entities. The amendments in ASU 2015-02 are effective for interim and annual periods beginning after December 15, 2015. Early adoption is permitted. The adoption of ASU 2015-02 for the annual period ended December 31, 2016 resulted in no material effect on the Company's financial statements and related disclosures.
In November 2016, the FASB issued ASU No. 2016-18, Statement of Cash Flows (Topic 230): Restricted Cash ("ASU 2016-18"). ASU 2016-18 requires that a statement of cash flows explain the change during the period in the total of cash, cash equivalents, and amounts generally described as restricted cash or restricted cash equivalents. Therefore, amounts generally described as restricted cash and restricted cash equivalents should be included with cash and cash equivalents when reconciling the beginning-of-period and end-of-period total amounts shown on the statement of cash flows. ASU 2016-18 is effective for fiscal years beginning after December 15, 2017, and interim periods within those fiscal years. Early adoption is permitted. The guidance is not expected to have a material impact on the Company's financial statements.
2. Real Estate Inventories
The Company incurred, capitalized and amortized interest costs as follows:
Year Ended December 31 | |||||||||
2016 | 2015 | 2014 | |||||||
(Unaudited) | (Unaudited) | ||||||||
Interest included in beginning real estate inventories | $ | — | $ | 799,302 | $ | 822,438 | |||
Interest incurred and capitalized | — | 196,343 | 1,315,541 | ||||||
Interest amortized to cost of sales | — | (995,645 | ) | (1,338,677 | ) | ||||
Interest included in ending real estate inventories | $ | — | $ | — | $ | 799,302 | |||
3. Other Assets
Other assets consisted of the following:
December 31 | ||||||
2016 | 2015 | |||||
(Unaudited) | ||||||
Cash collateral - performance bonds | $ | 61,067 | $ | 61,067 | ||
Reimbursements due from trade partners | 24,676 | — | ||||
$ | 85,743 | $ | 61,067 | |||
4. Accrued Expenses and Other Liabilities
Accrued expenses and other liabilities consisted of the following:
December 31 | ||||||
2016 | 2015 | |||||
(Unaudited) | ||||||
Warranty reserve | $ | 398,170 | $ | 644,817 | ||
Completion reserve | 566,847 | 1,021,719 | ||||
$ | 965,017 | $ | 1,666,536 | |||
The Company offers warranties on its homes that generally cover various defects in workmanship or materials or to cover structural construction defects. Estimated future direct warranty costs are accrued and charged to cost of sales in the period when the related homebuilding revenues are recognized. The Company assesses the adequacy of its warranty reserve on a quarterly basis and adjusts
118
the amounts recorded if necessary. The Company’s warranty reserve is included in accrued expenses and other liabilities on the accompanying consolidated balance sheets.
The completion reserve includes project costs for homes that have closed, but for which invoices from vendors have not yet been received. The Company periodically assesses the adequacy of its completion reserve and adjusts the amounts, as necessary.
Changes in the Company’s warranty reserve are as follows:
Year Ended December 31 | |||||||||
2016 | 2015 | 2014 | |||||||
(Unaudited) | (Unaudited) | ||||||||
Beginning warranty liability | $ | 644,818 | $ | 676,946 | $ | — | |||
Warranty provision | — | 466,357 | 707,268 | ||||||
Warranty payments | (246,648 | ) | (498,485 | ) | (30,322 | ) | |||
Ending warranty liability | $ | 398,170 | $ | 644,818 | $ | 676,946 | |||
5. Due From Affiliates and Related Party Transactions
As of December 31, 2016 and 2015, $0 and $2,021, respectively, was due from an affiliate related to payroll reimbursements.
During the years ended December 31, 2016, 2015 and 2014, TNHC incurred construction-related costs on the Company’s behalf of $63,264, $883,625 and $1,820,028, respectively. The Company has recorded $63,264, $447,664 and $888,078 of these amounts to completion reserve and charged the remaining $0, $435,961 and $931,950 to selling and marketing expenses incurred from affiliates in the accompanying consolidated statements of operations. As of December 31, 2016 and 2015, $0 and $2,021 is included in due from affiliates in the accompanying consolidated balance sheets.
Pursuant to the Development Management Agreement as referenced in the operating agreement, TNHC shall receive an overhead fee from the Company in an amount equal to 3.0% of the Project revenues. This amount will be paid as follows:
1) 1.0% of the projected gross sales revenue of the Project, paid in equal monthly installments beginning with the commencement of grading work, based upon a 25-month period;
2) 1.0% of the projected gross sales revenue of the Project, paid in equal monthly installments beginning with the commencement of the construction of the model homes, based upon a 27-month period;
3) 1.0% of the gross sales revenue from each home sold, payable upon each Member having reached a 15% IRR on its capital contributions.
During the years ended December 31, 2016, 2015 and 2014, the Company incurred $0, $296,240 and $601,344, respectively in overhead fees payable to TNHC, which have been recorded by the Company as overhead fees to affiliates in the accompanying consolidated statements of operations. As of December 31, 2016 and 2015, no amounts were due to TNHC for such fees.
During the years ended December 31, 2016, 2015 and 2014, the Company incurred $0, 80,000, and $120,000, respectively, in project coordination fees due to an affiliate of MFCI8. The Company has capitalized these amounts to real estate inventories. At December 31, 2016 and 2015, no amounts were due to this affiliate.
6. Commitments and Contingencies
The Company’s commitments and contingencies include the usual obligations incurred by real estate developers in the normal course of business. In the opinion of management, there are no material loss contingencies.
The Company obtains performance bonds in the normal course of business to ensure completion of the infrastructure of the Project. As of December 31, 2016 and 2015, the Company had $70,320 and $406,840, respectively, in performance bonds outstanding with various cities, governmental entities, and others. The estimated remaining costs to complete of such improvements was
119
$70,320 and $396,840. In the unlikely event that any such surety bond issued by a third party is called because the required improvements are not completed, the Company could be obligated to reimburse the issuer of the bond.
As an owner and developer of real estate, the Company is subject to various environmental laws of federal, state and local governments. The Company is not aware of any environmental liability that could have a material adverse effect on its financial condition or results of operations. However, changes in applicable environmental laws and regulations, the uses and conditions of real estate in the vicinity of the Company’s real estate and other environmental conditions of which the Company is unaware with respect to the real estate could result in future environmental liabilities.
7. Subsequent Events
The Company has evaluated subsequent events through February 22, 2017, the date the financial statements were available for issuance.
120
Report of Independent Auditors
The Members
TNHC-HW Foster City LLC
We have audited the accompanying financial statements of TNHC-HW Foster City LLC, which comprise the balance sheets as of December 31, 2016 and 2015, and the related statements of operations, members’ capital, and cash flows for the three year period ended December 31, 2016, and the related notes to the financial statements.
Management’s Responsibility for the Financial Statements
Management is responsible for the preparation and fair presentation of these financial statements in conformity with U.S. generally accepted accounting principles; this includes the design, implementation and maintenance of internal control relevant to the preparation and fair presentation of financial statements that are free of material misstatement, whether due to fraud or error.
Auditor’s Responsibility
Our responsibility is to express an opinion on these financial statements based on our audits. We conducted our audits in accordance with auditing standards generally accepted in the United States. Those standards require that we plan and perform the audit to obtain reasonable assurance about whether the financial statements are free of material misstatement.
An audit involves performing procedures to obtain audit evidence about the amounts and disclosures in the financial statements. The procedures selected depend on the auditor’s judgment, including the assessment of the risks of material misstatement of the financial statements, whether due to fraud or error. In making those risk assessments, the auditor considers internal control relevant to the entity’s preparation and fair presentation of the financial statements in order to design audit procedures that are appropriate in the circumstances, but not for the purpose of expressing an opinion on the effectiveness of the entity’s internal control. Accordingly, we express no such opinion. An audit also includes evaluating the appropriateness of accounting policies used and the reasonableness of significant accounting estimates made by management, as well as evaluating the overall presentation of the financial statements.
We believe that the audit evidence we have obtained is sufficient and appropriate to provide a basis for our audit opinion.
Opinion
In our opinion, the financial statements referred to above present fairly, in all material respects, the financial position of TNHC-HW Foster City LLC at December 31, 2016 and 2015, and the results of its operations and its cash flows for the three year period ended December 31, 2016, in conformity with U.S. generally accepted accounting principles.
/s/ Ernst & Young LLP
Irvine, California
February 22, 2017
121
TNHC-HW Foster City LLC | ||||||
(A Delaware Limited Liability Company) | ||||||
Balance Sheets | ||||||
December 31 | ||||||
2016 | 2015 | |||||
Assets | ||||||
Cash | $ | 5,569,181 | $ | 8,076,087 | ||
Restricted cash | 700,415 | 1,717,726 | ||||
Due from affiliates (Note 3) | 15,289 | — | ||||
Real estate inventories | — | 4,900,884 | ||||
Other assets | 813,937 | 12,022 | ||||
Total assets | $ | 7,098,822 | $ | 14,706,719 | ||
Liabilities and members’ capital | ||||||
Accounts payable | $ | 1,636,169 | $ | 3,356,352 | ||
Accrued expenses and other liabilities | 526,000 | 100 | ||||
Due to affiliates (Note 3) | — | 7,024 | ||||
Deferred revenue | 907,784 | 11,233,363 | ||||
3,069,953 | 14,596,839 | |||||
Commitments and contingencies (Note 6) | ||||||
Members’ capital | 4,028,869 | 109,880 | ||||
Total liabilities and members’ capital | $ | 7,098,822 | $ | 14,706,719 | ||
See accompanying notes. | ||||||
122
TNHC-HW Foster City LLC | |||||||||
(A Delaware Limited Liability Company) | |||||||||
Statements of Operations | |||||||||
Year Ended December 31 | |||||||||
2016 | 2015 | 2014 | |||||||
Land sales | $ | 26,071,784 | $ | 13,779,791 | $ | 46,887,846 | |||
Cost of land sales | 20,780,666 | 11,822,338 | 34,858,177 | ||||||
Gross profit | 5,291,118 | 1,957,453 | 12,029,669 | ||||||
Selling and marketing expenses | 245,782 | 12,681 | 607,020 | ||||||
Overhead fees to affiliates (Note 3) | 626,347 | 647,300 | 1,968,000 | ||||||
Net income | $ | 4,418,989 | $ | 1,297,472 | $ | 9,454,649 | |||
See accompanying notes. | |||||||||
123
TNHC-HW Foster City LLC | |||||||||
(A Delaware Limited Liability Company) | |||||||||
Statements of Members' Capital | |||||||||
Years Ended December 31, 2016, 2015 and 2014 | |||||||||
TNHC Land | HWFC | ||||||||
Company LLC | Project, LLC | Total | |||||||
Balance at December 31, 2013 | $ | 1,982,380 | $ | 1,982,379 | $ | 3,964,759 | |||
Contributions | 4,403,200 | 9,989,800 | 14,393,000 | ||||||
Distributions | (9,466,507 | ) | (15,533,493 | ) | (25,000,000 | ) | |||
Net income | 4,387,853 | 5,066,796 | 9,454,649 | ||||||
Balance at December 31, 2014 | 1,306,926 | 1,505,482 | 2,812,408 | ||||||
Distributions | (1,858,800 | ) | (2,141,200 | ) | (4,000,000 | ) | |||
Net income | 602,936 | 694,536 | 1,297,472 | ||||||
Balance at December 31, 2015 | 51,062 | 58,818 | 109,880 | ||||||
Distributions | (215,867 | ) | (284,133 | ) | (500,000 | ) | |||
Net income | 2,036,646 | 2,382,343 | 4,418,989 | ||||||
Balance at December 31, 2016 | $ | 1,871,841 | $ | 2,157,028 | $ | 4,028,869 | |||
See accompanying notes. | |||||||||
124
TNHC-HW Foster City LLC | |||||||||
(A Delaware Limited Liability Company) | |||||||||
Statements of Cash Flows | |||||||||
Year Ended December 31 | |||||||||
2016 | 2015 | 2014 | |||||||
Operating activities | |||||||||
Net income | $ | 4,418,989 | $ | 1,297,472 | $ | 9,454,649 | |||
Adjustments to reconcile net income to net cash (used in) | |||||||||
provided by operating activities: | |||||||||
Net changes in operating assets and liabilities: | |||||||||
Restricted cash | 1,017,311 | 1,091,605 | (2,809,331 | ) | |||||
Due from affiliates | (15,289 | ) | — | — | |||||
Other assets | (801,915 | ) | 12,673 | 107,305 | |||||
Real estate inventories | 4,900,884 | 3,140,927 | (4,323,900 | ) | |||||
Accounts payable | (1,720,183 | ) | 2,437,536 | 788,141 | |||||
Accrued expenses and other liabilities | 525,900 | (1,199,999 | ) | 1,200,099 | |||||
Due to affiliates | (7,024 | ) | (1,473,426 | ) | 1,476,028 | ||||
Deferred revenue | (10,325,579 | ) | (5,364,791 | ) | 16,598,154 | ||||
Net cash (used in) provided by operating activities | (2,006,906 | ) | (58,003 | ) | 22,491,145 | ||||
Financing activities | |||||||||
Members' capital contributions | — | — | 14,393,000 | ||||||
Members' capital distributions | (500,000 | ) | (4,000,000 | ) | (25,000,000 | ) | |||
Net cash used in financing activities | (500,000 | ) | (4,000,000 | ) | (10,607,000 | ) | |||
Net (decrease) increase in cash | (2,506,906 | ) | (4,058,003 | ) | 11,884,145 | ||||
Cash at beginning of year | 8,076,087 | 12,134,090 | 249,945 | ||||||
Cash at end of year | $ | 5,569,181 | $ | 8,076,087 | $ | 12,134,090 | |||
Supplemental disclosures of noncash transactions | |||||||||
Purchase of real estate with note payable to land seller | $ | — | $ | — | $ | 21,000,000 | |||
Supplemental disclosures of cash flow information | |||||||||
Interest paid, net of amounts capitalized | $ | — | $ | — | $ | — | |||
See accompanying notes. | |||||||||
125
TNHC-HW Foster City LLC
(A Delaware Limited Liability Company)
Notes to Financial Statements
December 31, 2016, 2015 and 2014
1. Organization and Summary of Significant Accounting Policies
TNHC-HW Foster City LLC, a Delaware limited liability company (the “Company”), was formed with an effective date of July 2, 2013. The Company was capitalized through cash and asset contributions by TNHC Land Company LLC (“TNHC”) and HWFC Project, LLC (“Hillwood”) (collectively referred to herein as the "Members"). On October 3, 2014, the Company purchased approximately 15 acres of land located in Foster City, California for the development and sale of lots planned for 200 residential dwellings, 221 assisted and independent living apartments, a retail space, and a public use space, in a site known as Foster Square (the "Project").
Subject to the operating agreement, distributions of net cash flow to the Members shall be in the following order of priority (taking into account, as applicable, each Member's then existing preferred return amount and contribution account balances, and subject to any other applicable provisions of the operating agreement):
1) | To the Members in proportion to their respective accrued and unpaid First Priority Preference Amount, as defined; then |
2) | To the Members in proportion to their respective Undistributed First Priority Capital Amount; as defined; then |
3) | To the Members in proportion to their respective accrued and unpaid Second Priority Preference Amount, as defined; then |
4) | To the Members in proportion to their respective Undistributed Second Priority Capital Amount, as defined; then |
5) | To the Members in proportion to their respective Percentage Interests (TNHC 46.47% and Hillwood 53.53%). |
Upon formation of the Company, TNHC received a distribution from the Company of $757,800 in order to bring the contribution percentages of each Member in line with the operating agreement, which at the time was 50% for TNHC and 50% for Hillwood. Upon acquisition of fee title to the Project site on October 3, 2014, the contribution percentages of the Members were adjusted, pursuant to the operating agreement, to 35% for TNHC and 65% for Hillwood.
Subject to the operating agreement, income and loss is allocated to the Members generally in the same manner as distributions of net cash flow.
Pursuant to the operating agreement, the preferred return on First Priority Capital, as defined, for both Members is 20% per annum, compounded monthly. The preferred return on Second Priority Capital, as defined, for both Members is 12% per annum, compounded monthly. As the payment for the preferred return is not guaranteed, it is not currently accrued on the financial statements. As of December 31, 2016, no contributions had been made that qualify as a First Priority Capital Amount, as defined.
The following is a summary of the preferred returns for the Members as of December 31, 2016:
TNHC | Hillwood | Total | |||||||
Cumulative First Priority preferred return | $ | — | $ | — | $ | — | |||
Cumulative First Priority preferred distributions | — | — | — | ||||||
Cumulative Second Priority preferred return | 561,978 | 715,212 | 1,277,190 | ||||||
Cumulative Second Priority preferred distributions | (561,978 | ) | (715,212 | ) | (1,277,190 | ) | |||
Remaining undistributed preferred return | $ | — | $ | — | $ | — | |||
126
Basis of Presentation
The accompanying financial statements have been prepared in accordance with U.S. generally accepted accounting principles (“GAAP”) as contained within the Financial Accounting Standards Board (“FASB”) Accounting Standards Codification (“ASC”). This basis of accounting contemplates the recovery of the Company’s assets and the satisfaction of its liabilities in the normal course of business. Certain items in prior year financial statements related to capitalized selling and marketing expenses have been reclassified to conform with current year presentation.
Use of Estimates
The preparation of the Company's financial statements in conformity with GAAP requires management to make estimates and assumptions that affect the reported amounts of assets, liabilities, revenues and expenses, and the disclosure of commitments and contingencies. Actual results could differ materially from those estimates.
Cash
The Company considers all highly-liquid investments that are readily convertible to cash, with original maturity dates of three months or less, to be cash and cash equivalents. Financial instruments that potentially subject the Company to significant concentrations of credit risk consist principally of cash deposited with financial institutions in excess of amounts insured by the Federal Deposit Insurance Corporation. The Company has not experienced any losses related to uninsured cash balances.
Restricted Cash
Restricted cash of $700,415 and $1,717,726 as of December 31, 2016 and 2015, respectively, includes $700,415 and $700,209 that serves as collateral for a letter of credit for certain performance bonds and $0 and $1,017,517 that serves as collateral for the construction costs related to a portion of the Project sold to a third party in December 2014. See discussion of post-closing development activities, as described in more detail in Note 1 under the caption entitled "Revenue Recognition."
Real Estate Inventories and Costs of Sales
Real estate inventories are carried at cost. Development costs, including land, land development, direct costs of construction, indirect costs, interest, and property taxes incurred during the development period, are capitalized. Capitalization of development costs ends when the assets are substantially complete and ready for sale. Costs of land sales are allocated based on relative sales value. Selling and marketing costs are expensed in the period incurred.
Real estate inventories are stated at cost, unless the carrying amount is determined not to be recoverable, in which case the inventories are written down to fair value in accordance with ASC 360, Property, Plant, and Equipment ("ASC 360"). ASC 360 requires that real estate assets be tested for impairment whenever events or changes in circumstances indicate that their carrying amounts may not be recoverable.
Impairment of assets is measured by comparing the carrying amount of an asset to the undiscounted future net cash flows expected to be generated by the asset. These evaluations for impairment are significantly impacted by estimates of the amounts and timing of revenues, costs and expenses, and other factors. If real estate assets are considered to be impaired, the impairment to be recognized is measured by the amount by which the carrying value of the assets exceeds the fair value of the assets. Fair value is determined based on estimated future cash flows discounted for inherent risks associated with the real estate assets, or other valuation techniques.
As of December 31, 2016 and 2015, the Company determined that the carrying amounts of its real estate inventories were not impaired based upon the undiscounted future cash flows of the underlying Project.
Revenue Recognition
In accordance with ASC 360, revenues from land sales are recorded and a profit is recognized when the respective lots are closed. Land sales are closed when all conditions of escrow are met, including delivery of the real estate asset, title passage, appropriate consideration is received and collection of associated receivables, if any, is reasonably assured, and other applicable criteria are met.
127
Sales incentives are a reduction of revenues when the respective lot is closed. When it is determined that the earnings process is not complete, the sale and the related profit are deferred for recognition in future periods.
During the year ended December 31, 2016, the Company sold land from the Project to a third party buyer for a total of $7,982,205. During the year ended December 31, 2015 the Company sold land from the Project to a third party buyer for a total of $8,415,000. During the year ended December 31, 2014, the Company sold land from the Project to two third party buyers for a total of $71,250,000. Under the terms of these contracts, the Company is obligated to perform certain development activities after the close of escrow, including grading of property, installation of utilities, and backbone improvements, and improvement plans and permits. Due to this continuing involvement, the Company has recognized the land sale under the percentage-of-completion method, whereby revenue is recognized in proportion to total costs incurred divided by total costs expected to be incurred. As of December 31, 2016 and 2015, the Company had deferred revenue of $907,784 and $11,233,363, including $200,377 and $4,342,334 of profit, respectively. The Company will recognize these amounts as development progresses.
Income Taxes
As a limited liability company, the Company is subject to certain minimal taxes and fees; however, income taxes on income reported by the Company are the obligation of the Members.
The Company applies the provisions of ASC 740, Accounting for Uncertainty in Income Taxes ("ASC 740"). Based on its evaluation, under ASC 740, the Company has concluded that there are no significant uncertain tax positions requiring recognition in its financial statements, nor has the Company been assessed interest or penalties by any major tax jurisdictions. The Company's evaluation was performed for the tax years ended December 31, 2016 and 2015 and 2014.
New Accounting Pronouncements
In May 2014, the FASB issued Accounting Standards Update (“ASU”) No. 2014-09, Revenue from Contracts with Customers (“ASU 2014-09”), which supersedes existing accounting literature relating to how and when a company recognizes revenue. Under ASU 2014-09, a company will recognize revenue when it transfers promised goods or services to customers in an amount that reflects the consideration to which the company expects to be entitled in exchange for those goods and services. In August 2015, the FASB issued ASU No. 2015-14, Revenue from Contracts with Customers (Topic 606): Deferral of the Effective Date, which delayed the effective date of ASU 2014-09 by one year. As a non-public company, ASU 2014-09 is effective for our interim and annual reporting periods beginning after December 15, 2018, and at that time, we expect to adopt the new standard under the modified retrospective approach. We do not believe the adoption of ASU 2014-09 will have a material impact on the amount or timing of our land sale revenues. Although we are still evaluating the accounting for marketing costs under the new standard, there is a possibility that the adoption of ASU 2014-09 will impact the timing of recognition and classification in our financial statements of certain capitalized selling and marketing costs we incur to obtain sales contracts from our customers. Currently, these selling and marketing costs are capitalized to real estate inventories and amortized to cost of sales as homes are delivered. Under the new guidance, some of these costs may need to be expensed immediately. We are continuing to evaluate the impact the adoption may have on other aspects of our business and on our financial statements and disclosures.
In November 2016, the FASB issued ASU No. 2016-18, Statement of Cash Flows (Topic 230): Restricted Cash ("ASU 2016-18"). ASU 2016-18 requires that a statement of cash flows explain the change during the period in the total of cash, cash equivalents, and amounts generally described as restricted cash or restricted cash equivalents. Therefore, amounts generally described as restricted cash and restricted cash equivalents should be included with cash and cash equivalents when reconciling the beginning-of-period and end-of-period total amounts shown on the statement of cash flows. ASU 2016-18 is effective for fiscal years beginning after December 15, 2017, and interim periods within those fiscal years. Early adoption is permitted. The guidance is not expected to have a material impact on the Company's financial statements.
2. Real Estate Inventories
Real estate inventories consisted of the following:
December 31 | ||||||
2016 | 2015 | |||||
Land and land under development | $ | — | $ | 4,900,884 | ||
128
The Company incurred, capitalized and amortized interest costs as follows:
Year Ended December 31 | ||||||
2016 | 2015 | |||||
Interest included in beginning real estate inventories | $ | 1,976 | $ | 39,901 | ||
Interest incurred and capitalized | — | — | ||||
Interest amortized to cost of sales | (1,976 | ) | (37,925 | ) | ||
Interest included in ending real estate inventories | $ | — | $ | 1,976 | ||
In October 2014 the Company acquired real estate with a purchase price of $30,000,000. Concurrent with the acquisition, it entered into a $21,000,000 note with the land seller, secured by the underlying real estate, which bore interest at 5% per annum. The note and all outstanding interest was repaid in full on December 15, 2014.
3. Due From/To Affiliates and Related Party Transactions
As of December 31, 2016 and 2015, $15,289 and $0, respectively was due from affiliates related to payroll reimbursements.
During the years ended December 31, 2016, 2015 and 2014, TNHC incurred construction-related costs on the Company's behalf of $392,287, $138,405, and $353,090 respectively. The Company capitalized these amounts in real estate inventories for all periods. As of December 31, 2016 and 2015, $0 and $7,024, respectively, was due to TNHC and is reflected in the accompanying balance sheets as due to affiliates.
Pursuant to the operating agreement, TNHC and Hillwood shall receive an overhead fee from the Company in an amount equal to 3.0% and 1.0%, respectively, of the Project's gross sales revenue. This amount will be paid as follows:
1) | 1.5% of the projected gross sales revenue of the Project to TNHC and 0.5% of the projected gross sales revenue of the Project to Hillwood, payable in equal monthly installments on or about the first day of each month over the projected life of the project, beginning July 1, 2013; |
2) | 1.5% of the gross sales price of all or any portion of the Project site to TNHC and 0.5% of the gross sales price of all or any portion of the Project site to Hillwood, payable upon the first day of the month following closing of the sale. |
During the years ended December 31, 2016, 2015 and 2014, TNHC earned $351,214, $359,000 and $406,000 in monthly overhead fees and Hillwood earned $115,490, $120,000 and $137,000 in monthly overhead fees, respectively, which have been recorded by the Company as overhead fees to affiliates in the accompanying statements of operations. During the years ended December 31, 2016, 2015, and 2014, TNHC earned $119,733, $126,225 and $1,068,750 and Hillwood earned $39,910, $42,075 and $356,250, respectively, in overhead fees from lots closed, which have also been recorded by the Company as overhead fees to affiliates in the accompanying statements of operations. As of December 31, 2016 and 2015, all monthly fees and overhead fees earned from lots closed were paid in full.
4. Other Assets
Other assets consisted of the following:
December 31 | ||||||
2016 | 2015 | |||||
Escrow receivable from land sale | $ | 813,937 | $ | — | ||
Capitalized selling and marketing costs | — | 12,022 | ||||
$ | 813,937 | $ | 12,022 | |||
129
5. Accrued Expenses and Other Liabilities
Accrued expenses and other liabilities consisted of the following:
December 31 | ||||||
2016 | 2015 | |||||
Completion reserve | $ | 508,000 | $ | — | ||
Accrued expenses | 18,000 | 100 | ||||
$ | 526,000 | $ | 100 | |||
6. Commitments and Contingencies
The Company's commitments and contingencies include the usual obligations and litigation incurred by real estate developers in the normal course of business. In the opinion of management, there are no material loss contingencies.
The Company obtains performance bonds in the normal course of business to ensure completion of the infrastructure of the Project. As of December 31 , 2016 and 2015, the Company had $5,680,620 in performance bonds outstanding with various cities, governmental entities, and others. The estimated remaining costs to complete such improvements was $482,331 and $3,539,130, respectively. In the unlikely event that any such performance bond issued by a third party is called because the required improvements are not complete, the Company could be obligated to reimburse the issuer of the bond.
As an owner and developer of real estate, the Company is subject to various environmental laws of federal, state and local governments. The Company is not aware of any environmental liability that could have a material adverse effect on its financial condition or results of operations. However, changes in applicable environmental laws and regulations, the uses and conditions of real estate in the vicinity of the Company’s real estate and other environmental conditions of which the Company is unaware with respect to the real estate could result in future environmental liabilities.
7. Subsequent Events
The Company has evaluated subsequent events through February 22, 2017, the date the financial statements were available for issuance.
130
Exhibit Number | Exhibit Description | |
3.1 | Amended and Restated Certificate of Incorporation of The New Home Company Inc. (incorporated by reference to Exhibit 3.1 of the Company's Annual Report on Form 10-K for the year ended December 31, 2013) | |
3.2 | State of Delaware Certificate of Change of Registered Agent and/or Registered Office (incorporated by reference to Exhibit 3.1 of the Company's Current Report on From 8-K filed on August 1, 2016) | |
3.3 | Amended and Restated Bylaws of The New Home Company Inc. (incorporated by reference to Exhibit 3.2 of the Company’s Current Report on Form 8-K filed on August 1, 2016) | |
4.1 | Specimen Common Stock Certificate of The New Home Company Inc. (incorporated by reference to Exhibit 4.1 of the Company’s Registration Statement on Form S-1 (Amendment No. 10, filed on January 24, 2014)) | |
4.2 | Investor Rights Agreement among The New Home Company Inc., TNHC Partners LLC, IHP Capital Partners VI, LLC, WATT/TNHC LLC, TCN/TNHC LP and collectively H. Lawrence Webb, Wayne J. Stelmar, Joseph D. Davis and Thomas Redwitz (incorporated by reference to Exhibit 4.2 of the Company's Annual Report on Form 10-K for the year ended December 31, 2013) | |
10.1 | Revolving Credit Agreement by and among The New Home Company Northern California LLC and U.S. Bank National Association, dated as of Sept. 26, 2013 (incorporated by reference to Exhibit 10.22 of the Company’s Registration Statement on Form S-1 (Amendment No. 6, filed December 17, 2013)) | |
10.2 | Registration Rights Agreement among The New Home Company Inc., TNHC Partners LLC, IHP Capital Partners VI, LLC, WATT/TNHC LLC, and TCN/TNHC LP (incorporated by reference to Exhibit 10.2 of the Company's Annual Report on Form 10-K for the year ended December 31, 2013) | |
10.3† | The New Home Company Inc. 2014 Long-Term Incentive Plan (incorporated by reference to Exhibit 10.3 of the Company's Annual Report on Form 10-K for the year ended December 31, 2013) | |
10.4† | The New Home Company Inc. Executive Incentive Compensation Plan (incorporated by reference to Exhibit 10.4 of the Company's Annual Report on Form 10-K for the year ended December 31, 2013) | |
10.5† | Employment Agreement between The New Home Company Inc. and H. Lawrence Webb (incorporated by reference to Exhibit 10.5 of the Company's Annual Report on Form 10-K for the year ended December 31, 2013) | |
10.6† | Employment Agreement between The New Home Company Inc. and Wayne Stelmar (incorporated by reference to Exhibit 10.6 of the Company's Annual Report on Form 10-K for the year ended December 31, 2013) | |
10.6(a)† | Amendment to Employment Agreement, dated May 29, 2015, by and between The New Home Company Inc. and Wayne Stelmar (incorporated by reference to Exhibit 10.5 of the Company's Quarterly Report on Form 10-Q for the quarter ended June 30, 2015) | |
10.7† | Employment Agreement between The New Home Company Inc. and Thomas Redwitz (incorporated by reference to Exhibit 10.8 of the Company's Annual Report on Form 10-K for the year ended December 31, 2013) | |
131
10.8† | Employment Agreement, dated May 29, 2015, between The New Home Company Inc. and John Stephens (incorporated by reference to Exhibit 10.4 of the Company's Quarterly Report on Form 10-Q for the quarter ended June 30, 2015) | |
10.9† | Form of Indemnification Agreement between The New Home Company Inc. and each of its directors and officers (incorporated by reference to Exhibit 10.9 of the Company's Annual Report on Form 10-K for the year ended December 31, 2013) | |
10.10† | The New Home Company Inc. 2014 Long-Term Incentive Plan form of Option Award and Stock Option Agreement (incorporated by reference to Exhibit 10.10 of the Company's Annual Report on Form 10-K for the year ended December 31, 2013) | |
10.10(a)† | The New Home Company Inc. 2014 Long-Term Incentive Plan form of Restricted Stock Unit Award Agreement (incorporated by reference to Exhibit 10.11 of the Company's Annual Report on Form 10-K for the year ended December 31, 2013) | |
10.10(b)*† | The New Home Company Inc. 2014 Long-Term Incentive Plan form of Restricted Stock Unit Award Agreement for Nonemployee Directors (incorporated by reference to Exhibit 10.11(a) of the Company's Annual Report on Form 10-K for the year ended December 31, 2015) | |
10.11*† | The New Home Company Inc. Non-Employee Director Compensation Program (incorporated by reference to Exhibit 10.12 of the Company's Annual Report on Form 10-K for the year ended December 31, 2015) | |
10.12 | Amended and Restated Credit Agreement, dated May 10, 2016, among The New Home Company Inc., U.S. Bank National Association d/b/a Housing Capital Company, as Administrative Agent, and the other lenders party thereto (incorporated by reference to Exhibit 10.1 of the Company's Current Report on Form 8-K filed May 11, 2016) | |
10.13+ | Agreement of Limited Partnership of Arantine Hills Holdings LP (incorporated by reference to Exhibit 10.1 of the Company's Quarterly Report on Form 10-Q for the quarter ended September 30, 2014) | |
10.14† | The New Home Company Inc. 2016 Incentive Award Plan (incorporated by reference to Exhibit 10.1 to the Company’s Current Report on Form 8-K filed on May 24, 2016)ϔ | |
10.15† | The New Home Company Inc. 2016 Incentive Award Plan form of Restricted Stock Unit Award Agreement (incorporated by reference to Exhibit 10.3 to the Company’s Form 10-Q for the quarter ended June 30, 2016) | |
21.1* | List of subsidiaries of The New Home Company Inc. | |
23.1* | Consent of Independent Registered Public Accounting Firm, Ernst & Young LLP | |
23.2* | Consent of Independent Auditors, Ernst & Young LLP | |
31.1* | Chief Executive Officer Section 302 Certification of Periodic Report dated February 22, 2017 | |
31.2* | Chief Financial Officer Section 302 Certification of Periodic Report dated February 22, 2017 | |
32.1** | Chief Executive Officer Section 906 Certification of Periodic Report dated February 22, 2017 | |
32.2** | Chief Financial Officer Section 906 Certification of Periodic Report dated February 22, 2017 | |
132
101* | The following materials from The New Home Company Inc.’s Annual Report on Form 10-K for the year ended December 31, 2016, formatted in eXtensible Business Reporting Language (XBRL): (i) Consolidated Balance Sheets, (ii) Consolidated Statements of Operations, (iii) Consolidated Statement of Equity, (iv) Consolidated Statements of Cash Flows, and (v) Notes to Audited Consolidated Financial Statements. | |
† | Management Contract or Compensatory Plan or Arrangement |
+ | Confidential treatment was requested with respect to omitted portions of this Exhibit, which portions have been filed separately with the U.S. Securities and Exchange Commission. |
* | Filed herewith |
** | The information in Exhibits 32.1 and 32.2 shall not be deemed "filed" for purposes of Section 18 of the Securities and Exchange Act of 1934, as amended (the "Exchange Act"), or otherwise subject to the liabilities of that section, nor shall they be deemed incorporated by reference in any filing under the Securities Act of 1933, as amended, or the Exchange Act (including this Report), unless the Registrant specifically incorporates the foregoing information into those documents by reference. |
133
SIGNATURES
Pursuant to the requirements of Section 13 or 15(d) of the Securities Exchange Act of 1934, the registrant has duly caused this report to be signed on its behalf by the undersigned, thereunto duly authorized.
The New Home Company Inc. | ||
By: | /s/ H. Lawrence Webb | |
H. Lawrence Webb | ||
Chief Executive Officer and Chairman | ||
Pursuant to the requirements of the Securities Exchange Act of 1934, this report has been signed below by the following persons on behalf of the registrant and in the capacities and on the dates indicated:
Signature | Title | Date | ||
/s/ H. Lawrence Webb | Chief Executive Officer and Chairman of the Board (Principal Executive Officer) | February 22, 2017 | ||
H. Lawrence Webb | ||||
/s/ John M. Stephens | Chief Financial Officer (Principal Financial Officer and Principal Accounting Officer) | February 22, 2017 | ||
John M. Stephens | ||||
/s/ Sam Bakhshandehpour | Director | February 22, 2017 | ||
Sam Bakhshandehpour | ||||
/s/ Michael Berchtold | Director | February 22, 2017 | ||
Michael Berchtold | ||||
Director | February 22, 2017 | |||
David Berman | ||||
/s/ Paul Heeschen | Director | February 22, 2017 | ||
Paul Heeschen | ||||
/s/ Gregory P. Lindstrom | Director | February 22, 2017 | ||
Gregory P. Lindstrom | ||||
/s/ Cathey S. Lowe | Director | February 22, 2017 | ||
Cathey S. Lowe | ||||
/s/ Douglas C. Neff | Director | February 22, 2017 | ||
Douglas C. Neff | ||||
/s/ Wayne Stelmar | Director | February 22, 2017 | ||
Wayne Stelmar | ||||
/s/ Nadine Watt | Director | February 22, 2017 | ||
Nadine Watt | ||||
/s/ William A. Witte | Director | February 22, 2017 | ||
William A. Witte | ||||
134