Attached files
| file | filename |
|---|---|
| EX-23 - EXHIBIT 23 - FOSTER L B CO | d860671dex23.htm |
| EX-21 - EXHIBIT 21 - FOSTER L B CO | d860671dex21.htm |
| EXCEL - IDEA: XBRL DOCUMENT - FOSTER L B CO | Financial_Report.xls |
| EX-31.1 - EXHIBIT 31.1 - FOSTER L B CO | d860671dex311.htm |
| EX-32.0 - EXHIBIT 32.0 - FOSTER L B CO | d860671dex320.htm |
| EX-31.2 - EXHIBIT 31.2 - FOSTER L B CO | d860671dex312.htm |
Table of Contents
UNITED STATES SECURITIES AND EXCHANGE COMMISSION
Washington, D.C. 20549
FORM 10-K
(Mark One)
| þ | Annual Report Pursuant to Section 13 or 15 (d) of the Securities Exchange Act of 1934 |
For the fiscal year ended December 31, 2014
Or
| ¨ | Transition Report Pursuant to Section 13 or 15(d) of the Securities Exchange Act of 1934 |
For the transition period from to
Commission File Number 0-10436
L.B. FOSTER COMPANY
(Exact name of registrant as specified in its charter)
| Pennsylvania | 25-1324733 | |
| (State of Incorporation) | (I.R.S. Employer Identification No.) | |
| 415 Holiday Drive, Pittsburgh, Pennsylvania | 15220 | |
| (Address of principal executive offices) | (Zip Code) |
Registrant’s telephone number, including area code:
(412) 928-3400
Securities registered pursuant to Section 12(b) of the Act:
| Title of Each Class | Name of Each Exchange On Which Registered | |
| Common Stock, Par Value $0.01 | NASDAQ Global Select Market | |
| Preferred Stock Purchase Rights | NASDAQ Global Select Market |
Securities registered pursuant to Section 12(g) of the Act:
None
Indicate by check mark if the registrant is a well-known seasoned issuer, as defined in Rule 405 of the Securities Act. ¨ Yes x No
Indicate by check mark if the registrant is not required to file reports pursuant to Section 13 or 15(d) of the Exchange Act. ¨ Yes x No
Indicate by check mark whether the registrant (1) has filed all reports required to be filed by Section 13 or 15(d) of the Securities Exchange Act of 1934 during the preceding 12 months (or for such shorter period that the registrant was required to file such reports) and (2) has been subject to such filing requirements for the past 90 days. x Yes ¨ No
Indicate by check mark whether the registrant has submitted electronically and posted on its corporate Web site, if any, every Interactive Data File required to be submitted and posted pursuant to Rule 405 of Regulation S-T (section 232.405 of this chapter) during the preceding 12 months (or for shorter period that the registrant was required to submit and post such files). x Yes ¨ No
Indicate by check mark if disclosure of delinquent filers pursuant to Item 405 of Regulation S-K is not contained herein, and will not be contained, to the best of registrant’s knowledge, in definitive proxy or information statements incorporated by reference in Part III of this Form 10-K or any amendment to this form 10-K. ¨
Indicate by check mark whether the registrant is a large accelerated filer, an accelerated filer, a non-accelerated filer, or a smaller reporting company. See the definitions of “large accelerated filer,” “accelerated filer” and “smaller reporting company” in Rule 12b-2 of the Exchange Act. (Check one):
| Large accelerated filer ¨ |
Accelerated filer x | Non-accelerated filer ¨ | Smaller reporting company ¨ | |||
| (Do not check if a smaller reporting company) | ||||||
Indicate by check mark whether the registrant is a shell company (as defined in Rule 12b-2 of the Exchange Act). ¨ Yes x No
The aggregate market value of the voting and non-voting common equity held by non-affiliates computed by reference to the price at which the common equity was last sold, or the average bid and asked price of such common equity, as of the last business day of the registrant’s most recently completed second fiscal quarter was $526,238,000.
Indicate the number of shares outstanding of each of the registrant’s classes of common stock, as of the latest practicable date.
| Class | Outstanding at February 25, 2015 | |
| Common Stock, Par Value $0.01 | 10,360,334 shares |
Documents Incorporated by Reference:
Portions of the Proxy Statement prepared for the 2015 Annual Meeting of Shareholders are incorporated by reference in Items 10, 11, 12, 13 and 14 of Part III of this Form 10-K. The 2015 Proxy Statement will be filed with the U.S. Securities and Exchange Commission within 120 days after the end of the fiscal year to which this report relates.
Table of Contents
| PART I | ||||||
| Item 1. | 4 | |||||
| Item 1A. | 11 | |||||
| Item 1B. | 15 | |||||
| Item 2. | 16 | |||||
| Item 3. | 16 | |||||
| Item 4. | 16 | |||||
| PART II | ||||||
| Item 5. | Market for Registrant’s Common Equity, Related Stockholder Matters and Issuer Purchases of Equity Securities | 17 | ||||
| Item 6. | 20 | |||||
| Item 7. | Management’s Discussion and Analysis of Financial Condition and Results of Operations |
21 | ||||
| Item 7A. | 40 | |||||
| Item 8. | 41 | |||||
| Item 9. | Change in and Disagreements with Accountants on Accounting and Financial Disclosure |
81 | ||||
| Item 9A. | 81 | |||||
| Item 9B. | 83 | |||||
| PART III | ||||||
| Item 10. | 83 | |||||
| Item 11. | 83 | |||||
| Item 12. | Security Ownership of Certain Beneficial Owners and Management and Related Stockholder Matters | 83 | ||||
| Item 13. | Certain Relationships and Related Transactions, and Director Independence |
83 | ||||
| Item 14. | 83 | |||||
| PART IV | ||||||
| Item 15. | 84 | |||||
| 86 | ||||||
2
Table of Contents
Forward-Looking Statements
This Annual Report on Form 10-K contains “forward looking” statements within the meaning of Section 21E of the Securities Exchange Act of 1934, as amended, and Section 27A of the Securities Act of 1933, as amended. Many of the forward-looking statements are located in “Management’s Discussion and Analysis of Financial Condition and Results of Operations”. Forward-looking statements provide current expectations of future events based on certain assumptions and include any statement that does not directly relate to any historical or current fact. Sentences containing words such as “believe,” “intend,” “may,” “expect,” “should,” “could,” “anticipate,” “plan,” “estimate,” “predict,” “project,” or their negatives, or other similar expressions generally should be considered forward-looking statements. Forward-looking statements in this Annual Report on Form 10-K may concern, among other things, the Company’s expectations regarding our strategy, goals, projections and plans regarding our financial position, liquidity and capital resources, the outcome of litigation and product warranty claims, results of operations, decisions regarding our strategic growth strategies, market position, and product development, all of which are based on current estimates that involve inherent risks and uncertainties. The Company cautions readers that various factors could cause the actual results of the Company to differ materially from those indicated by forward-looking statements. Accordingly, investors should not place undue reliance on forward-looking statements as a prediction of actual results. Among the factors that could cause the actual results to differ materially from those indicated in the forward-looking statements are risks and uncertainties related to: general business conditions, the risk of doing business in international markets, our ability to effectuate our strategy including evaluation of potential opportunities such as strategic acquisitions, joint ventures, and other initiatives, and our ability to effectively integrate new businesses and realize anticipated benefits, a decrease in freight or passenger rail traffic, sustained declines in energy prices, a lack of state or federal funding for new infrastructure projects, the timeliness and availability of material from major suppliers, labor disputes, the impact of competition, variances in current accounting estimates and their ultimate outcomes, the seasonality of the Company’s business, the adequacy of internal and external sources of funds to meet financing needs, the Company’s ability to curb its working capital requirements, domestic and international income taxes, foreign currency fluctuations, inflation, the impact of new regulations including regarding conflict minerals, the ultimate number of concrete ties that will have to be replaced pursuant to product warranty claims, an overall resolution of the related contract claims as well as the outcome of a lawsuit filed by Union Pacific Railroad, risk inherent in litigation, and domestic and foreign governmental regulations. Should one or more of these risks or uncertainties materialize, or should the assumptions underlying the forward-looking statements prove incorrect, actual outcomes could vary materially from those indicated. The risks and uncertainties that may affect the operations, performance, and results of the Company’s business and forward-looking statements include, but are not limited to, those set forth under Item 1A, “Risk Factors” and elsewhere in this Annual Report on Form 10-K.
The forward looking statements in this report are made as of the date of this report and we assume no obligation to update or revise any forward looking statement, whether as a result of new information, future developments, or otherwise, except as required by securities laws.
3
Table of Contents
PART I
| ITEM 1. | BUSINESS |
(Dollars in thousands, except share data unless otherwise noted)
Summary Description of Businesses
Formed in 1902, L.B. Foster Company is a Pennsylvania corporation with its principal office in Pittsburgh, PA. L.B. Foster Company is a leading manufacturer, fabricator, and distributor of products and services for the rail, construction, energy and utility markets. As used herein, “Foster”, the “Company”, “we”, “us”, and “our” or similar references refer collectively to L.B. Foster Company and its divisions and subsidiaries, unless the context otherwise requires. The Company classifies its activities into three business segments: Rail Products, Construction Products, and Tubular Products. Financial information concerning these segments is set forth in Part II, Item 8, Note 2 to the financial statements included herein, which is incorporated by reference into this Item 1.
Business Developments
On July 7, 2014, the Company acquired Carr Concrete Corporation (Carr) for $12,480. Carr is a provider of pre-stressed and precast concrete products located in Waverly, WV. The transaction was funded with cash on hand. The results of Carr’s operations from the acquisition date through December 31, 2014 are included in our Construction Products segment and were not material to the periods presented.
On October 29, 2014, the Company acquired FWO, a business of Balfour Beatty Rail GmbH for $1,103 in non-domestic cash. The German business provides track lubrication and switch roller equipment for international railway applications. The results of FWO are included within the Rail Products segment from the acquisition date through December 31, 2014 and were not material to the periods presented.
On December 30, 2014, the Company acquired Chemtec Energy Services, L.L.C. (Chemtec) for $66,719, net of cash received, which is inclusive of a $1,867 preliminary working capital adjustment. Located in Willis, TX, Chemtec is a manufacturer and turnkey provider of blending, injection, and metering equipment for the oil and gas industry. The results of operations of this acquired business are included within our Tubular Products segment from the acquisition date through December 31, 2014 and were not material to the periods presented.
Subsequent to year end, on January 13, 2015, the Company acquired the stock of Tew Holdings, LTD (Tew) for approximately $26,600, subject to the finalization of net debt and net working capital adjustments. Headquartered in Nottingham, UK, Tew provides application engineering solutions primarily to the rail market and other major industries. The transaction was funded with non-domestic cash.
More information regarding acquisitions is set forth in Part II, Item 8, Note 3 to the Consolidated Financial Statements included herein, which is incorporated by reference into this Item 1.
Rail Products
L.B. Foster Company’s Rail Products segment is comprised of several manufacturing and distribution businesses that provide a variety of products for railroads, transit authorities, industrial companies, and mining applications throughout North America and Europe. Our Rail Products segment has sales offices throughout the United States, Canada, and Europe and frequently bids on rail projects where it can offer products manufactured by the Company or sourced from numerous suppliers. These products may be provided as a package to rail lines, transit authorities, and construction contractors which reduces the customer’s procurement efforts and provides value added, just in time delivery. The segment is composed of the following business units: rail manufacturing and distribution, Rail Technologies, and pre-stressed CXT Concrete Tie products.
Rail manufacturing and distribution
The rail manufacturing and distribution business sells heavy and light new rail mainly to transit authorities, industrial companies, and rail contractors for railroad sidings, plant trackage, and other carrier and material handling applications. Rail accessories include trackwork, track spikes, bolts, angle bars, and other products required
4
Table of Contents
to install or maintain rail lines. These products are sold to railroads, rail contractors, industrial customers, and transit agencies and are manufactured by the Company or purchased from other manufacturers.
The Company’s Allegheny Rail Products (ARP) division engineers and markets insulated rail joints and related accessories for the railroad and mass transit industries. Insulated joints are manufactured at the Company’s facilities in Pueblo, CO and Niles, OH.
The Company’s Transit Products division supplies power rail, direct fixation fasteners, coverboards, and special accessories primarily for mass transit systems. Most of these products are manufactured by subcontractors and are usually sold by sealed bid to transit authorities or to rail contractors worldwide.
The Company’s Trackwork division sells trackwork for industrial and export markets. The Company also has two facilities that design, test, and fabricate rail products in Atlanta, GA and Niles, OH.
Rail Technologies
L.B. Foster Rail Technologies, Corp. (Rail Technologies) engineers, manufactures, and assembles friction management products, railway wayside data collection and management systems, and related products. It also engineers and manufactures stick friction modifiers and related application systems. The Company’s friction management products control the friction at the rail/wheel interface, helping to lower fuel usage and improve train-operating efficiency, extend the life of operating assets such as rail and wheels, reduce track stresses, and lower related maintenance and operating costs for customers. Friction management products include mobile and wayside application systems that distribute lubricants and solid and liquid friction modifiers. Friction management products are designed, engineered, manufactured, and assembled in the United States and by certain wholly-owned subsidiaries located in Burnaby, British Columbia, Canada, Sheffield, United Kingdom, and Dusseldorf, Germany.
The Rail Technology business also manufactures a variety of track component products at our manufacturing facilities in St. Jean, Quebec, Canada and the United Kingdom. In Canada, these products primarily include rail anchors and rail spikes, which are products that are used to secure rails to wooden ties to restrain the movement of the rail. These products are sold primarily to Canadian railroads, with some products exported to the United States and to other international customers. In the United Kingdom, we design and manufacture a complete line of rail joints including epoxy insulated rail joints and nylon-encapsulated insulated joints, and also distribute a complete line of track fasteners to the United Kingdom railways and to other international customers.
Our 2014 acquisition of the railroad tuning unit, FWO, a business of Balfour Beatty Rail GmbH enhances our offerings to provide track lubrication and switch roller equipment for international railway applications.
Pre-stressed CXT Concrete Ties
The concrete products business, through the Company’s subsidiary, CXT Incorporated, manufactures engineered concrete railroad ties for the railroad and transit industries at its facilities in Spokane, WA and Tucson, AZ.
Construction Products
The Construction products segment is composed of the following business units: Piling Products, Fabricated Bridge Products, and precast concrete buildings and products.
Piling Products
Sheet piling products are interlocking structural steel sections that are generally used to provide lateral support at construction sites. Bearing piling products are steel H-beam sections which are driven into the ground for support of structures such as bridge piers and high-rise buildings. Piling is often used in water and land applications including cellular cofferdams and OPEN CELL® structures in inland river systems and ports.
Piling products are sourced from various manufacturers and either sold or rented to project owners and contractors. The piling division, via a sales force deployed throughout the United States, markets and sells piling
5
Table of Contents
domestically and internationally. This division offers its customers various types and dimensions of structural beam piling, sheet piling, and pipe piling. The Company is the primary distributor of domestic steel sheet piling for its primary supplier.
Fabricated Bridge Products
The fabricated products facility in Bedford, PA manufactures a number of fabricated steel and aluminum products primarily for the highway, bridge, and transit industries including concrete reinforced grid deck, open steel grid deck, aluminum bridge railing, and stay-in-place bridge forms.
Concrete Products
The CXT concrete buildings unit manufactures concrete buildings primarily for national, state, and municipal parks. This unit manufactures restrooms, concession stands, and other protective storage buildings available in multiple designs, textures, and colors. The Company is a leading high-end supplier in terms of volume, product options, and capabilities. The buildings are manufactured in Spokane, WA and Hillsboro, TX. The Company’s 2014 acquisition of Carr Concrete enhances our presence in the concrete buildings market while increasing our product portfolio to include burial vaults, bridge beams, box culverts, and other pre-stressed and precast concrete products. Carr Concrete products are distributed from the Company’s Waverly, WV facility.
Sales of the Company’s construction products are partly dependent upon the level of activity in the construction industry. Accordingly, sales of these products have traditionally been somewhat higher during the second and third quarters than during the first and fourth quarters of each year.
Tubular Products
The Tubular products segment has three discrete business units: Coated Pipe, Threaded Products, and measurement products and systems.
Coated Pipe
There are two pipeline services locations that make up our Coated Pipe business unit. Our Birmingham, AL facility coats the outside diameter and, to a lesser extent, the inside diameter of pipe primarily for oil & gas transmission pipelines. This location partners with its primary customer, a pipe manufacturer, to market fusion bonded epoxy coatings, abrasion resistant coatings, and internal linings for a wide variety of pipe diameters for pipeline projects throughout North America. The second location (Ball Winch), acquired on November 7, 2013, is located in Willis, TX. The Willis facility applies specialty outside and inside diameter coatings for oil & gas transmission, mining, and waste water pipelines. This location also provides custom coatings for specialty fittings and field service connections.
Threaded Products
The Threaded Products unit, located in Magnolia, TX, cuts, threads, and paints pipe primarily for water well applications for the agriculture industry and municipal water authorities. This location also provides threading services for the Oil Country Tubular Goods markets.
Measurement Products and Systems
Our December 30, 2014 acquisition of Chemtec enhanced the Tubular product offering into an adjacent market to include the manufacturing and provision of blending, injection, and metering equipment for the oil and gas industry.
L.B. Pipe Joint Venture
The Company is a member of a joint venture, LB Pipe & Coupling Products, LLC (LB Pipe JV), in which it maintains a 45% ownership interest. The LB Pipe JV manufactures, markets, and sells various precision couplings and other tubular products for the energy, utility, and construction markets and is scheduled to terminate on June 30, 2019. The Company has made all of its mandatory capital contributions under the JV agreement, totaling $3,000. More information concerning the JV is set forth in Part II, Item 8, Note 9 to the Consolidated Financial Statements included herein, which is incorporated by reference into this Item 1.
6
Table of Contents
Geographic and Segment Information
The following table shows, for the last three fiscal years, the net sales generated by each of the current business segments as a percentage of total net sales.
| Percentage of Net Sales |
||||||||||||
| 2014 | 2013 | 2012 | ||||||||||
| Rail Products |
62 | % | 61 | % | 63 | % | ||||||
| Construction Products |
29 | 32 | 29 | |||||||||
| Tubular Products |
9 | 7 | 8 | |||||||||
|
|
|
|
|
|
|
|||||||
| 100 | % | 100 | % | 100 | % | |||||||
|
|
|
|
|
|
|
|||||||
Information concerning the Company’s liquidity and capital resources and the Company’s working capital requirements can be found in Part II, Item 7, Management’s Discussion and Analysis of Financial Condition and Results of Operations.
Marketing and Competition
L.B. Foster Company generally markets its rail, construction, and tubular products directly in all major industrial areas of the United States, Canada, and Europe through a sales force of approximately 80 people. The Company also utilizes a network of agents across Europe, South America, and Asia to supplement its internal sales force to reach current customers and cultivate potential customers in these areas. For the years ended 2014, 2013, and 2012, approximately 18%, 17%, and 18%, respectively, of the Company’s total sales were outside the United States.
The major markets for the Company’s products are highly competitive. Product availability, quality, service, and price are principal factors of competition within each of these markets. No other company provides the same product mix to the various markets the Company serves. However, there are one or more companies that compete with the Company in each product line. Therefore, the Company faces significant competition from different groups of companies.
During 2014, 2013, and 2012, no single customer accounted for more than 10% of the Company’s consolidated net sales.
Raw Materials and Supplies
Most of the Company’s inventory is purchased in the form of finished or semi-finished product. The Company purchases the majority of its inventory from domestic and foreign steel producers. The Company has an agreement with a steel mill to distribute steel sheet piling in North America. Should sheet piling from its present supplier not be available for any reason, the Company risks not being able to provide product to its customers.
The Company’s purchases from foreign suppliers are subject to the usual risks associated with changes in international conditions and to United States laws which could impose import restrictions on selected classes of products and for anti-dumping duties if products are sold in the United States below certain prices.
Backlog
The dollar amount of firm, unfilled customer orders at December 31, 2014 and 2013 by business segment is as follows:
| December 31, | ||||||||
| 2014 | 2013 | |||||||
| Rail Products |
$ | 104,821 | $ | 121,853 | ||||
| Construction Products |
65,843 | 53,483 | ||||||
| Tubular Products |
13,686 | 7,775 | ||||||
|
|
|
|
|
|||||
| Total from Continuing Operations |
$ | 184,350 | $ | 183,111 | ||||
|
|
|
|
|
|||||
7
Table of Contents
Approximately 2% of the December 31, 2014 backlog is related to projects that will extend beyond 2015. Backlog from businesses acquired during 2014 represented 6% of the total.
Research and Development
Expenditures for research and development approximated $3,096, $3,154, and $2,926 in 2014, 2013, and 2012, respectively. These expenditures were predominately associated with the Company’s Rail Technologies business.
Patents and Trademarks
The Company owns a number of United States, Canadian, and European patents and trademarks. The Company has several patents on its Rail Technologies products, such as the Protector® IV application system, along with a significant number of patents related to its friction modifier product lines at Rail Technologies, which are of material importance to the business as a whole. We believe that, in the aggregate, our patents and trademarks give us a competitive advantage. We also rely on a combination of trade secrets and other intellectual property laws, non-disclosure agreements, and other protective measures to establish and protect our proprietary rights in intellectual property.
Environmental Disclosures
It is not possible to predict the outcome of actions regarding environmental matters, particularly for future remediation and other compliance efforts. The Company has recorded its estimate of the outcome of certain environmental matters. In the opinion of management, compliance with current environmental protection laws will not have a material adverse effect on the financial condition, competitive position, or capital expenditures of the Company. However, the Company’s efforts to comply with stringent environmental regulations may have an adverse effect on the Company’s future earnings.
See Item 3, Legal Proceedings included herein, for information regarding the Company’s environmental reserves which is incorporated by reference into this Item I.
Employees and Employee Relations
As of December 31, 2014, the Company had approximately 1,113 employees, 118 of whom were located in Canada, 70 of whom were located in Europe, with the remaining employees located in the United States. There were 591 hourly production workers and 522 salaried employees. Of the hourly production workers, approximately 190 are represented by unions. The Company has not suffered any major work stoppages during the past five years and considers its relations with its employees to be satisfactory. No significant collective bargaining agreements expire prior to 2017.
Substantially all of the Company’s hourly paid employees are covered by one of the Company’s noncontributory, defined benefit plans or defined contribution plans. Substantially all of the Company’s salaried employees are covered by defined contribution plans.
Financial Information about Geographic Areas
Financial information about geographic areas is set forth in Part II, Item 8, Note 2 to the Consolidated Financial Statements included herein, which is incorporated by reference into this Item 1.
Financial Information about Segments
Financial information about segments is set forth in Part II, Item 8, Note 2 to the Consolidated Financial Statements included herein, which is incorporated by reference into this Item 1.
8
Table of Contents
Executive Officers of the Registrant
Information concerning the executive officers of the Company is set forth below.
| Name |
Age |
Position | ||||
| Robert P. Bauer |
56 | President and Chief Executive Officer | ||||
| Merry L. Brumbaugh |
57 | Vice President — Tubular Products | ||||
| Samuel K. Fisher |
62 | Vice President — Rail Distribution | ||||
| Patrick J. Guinee |
45 | Vice President, General Counsel and Secretary | ||||
| John F. Kasel |
49 | Senior Vice President — Rail Products | ||||
| Brian H. Kelly |
55 | Vice President — Human Resources and Administration | ||||
| Gregory W. Lippard |
46 | Vice President — Rail Sales and Products | ||||
| Konstantinos Papazoglou |
62 | Vice President — Rail Technologies | ||||
| David J. Russo |
56 | Senior Vice President, Chief Financial Officer and Treasurer | ||||
| David R. Sauder |
44 | Vice President — Global Business Development | ||||
| Christopher T. Scanlon |
39 | Controller and Chief Accounting Officer | ||||
Mr. Bauer was elected President and Chief Executive Officer upon joining the Company in February 2012. Prior to joining the Company, Mr. Bauer previously served from June 2011 as President of the Refrigeration Division of the Climate Technologies business of Emerson Electric Company, a diversified global manufacturing and technology company. From January 2002 until May 2011, Mr. Bauer served as President of Emerson Network Power’s Liebert Division.
Ms. Brumbaugh was elected Vice President — Tubular Products in November 2004, having previously served as General Manager, Coated Products since 1996. Ms. Brumbaugh has served in various capacities with the Company since her initial employment in 1980.
Mr. Fisher’s was elected Vice President — Rail Distribution effective January 2011, as part of organizational changes within the Rail Products segment, having previously served as Senior Vice President — Rail since October 2002. From June 2000 until October 2002, Mr. Fisher served as Senior Vice President — Product Management. From October 1997 until June 2000, Mr. Fisher served as Vice President — Rail Procurement. Prior to October 1997, Mr. Fisher served in various other capacities with the Company since his employment in 1977.
Mr. Guinee was elected Vice President, General Counsel and Secretary in February 2014. Prior to joining the Company, Mr. Guinee served as Vice President — Securities & Corporate and Assistant Secretary at Education Management Corporation from July 2013 to February 2014, and was employed by H. J. Heinz Company from November 1997 to June 2013, last serving as Vice President — Corporate Governance & Securities and Assistant Secretary. He began his career as an attorney in private practice in Pittsburgh, PA in 1994.
Mr. Kasel was elected Senior Vice President — Rail Products in August 2012 having previously served as Senior Vice President — Operations and Manufacturing since May 2005 and Vice President — Operations and Manufacturing since April 2003. Mr. Kasel served as Vice President of Operations for Mammoth, Inc., a Nortek company from 2000 to 2003. His career also included General Manager of Robertshaw Controls and Operations Manager of Shizuki America prior to 2000.
Mr. Kelly was elected Vice President — Human Resources and Administration in August 2012 having previously served as Vice President, Human Resources since October 2006 after joining the organization in September 2006. Prior to joining the Company, Mr. Kelly headed Human Resources for 84 Lumber Company from June 2004. Previously, he served as a Director of Human Resources for American Greetings Corp. from June 1994 to June 2004, and he began his career with Nabisco in 1984, serving in progressively responsible generalist human resources positions in both plants and headquarters.
Mr. Lippard was elected Vice President — Rail Sales and Products in August 2012 having previously served as Vice President — Rail Product Sales since June 2000. Prior to re-joining the Company in 2000,
9
Table of Contents
Mr. Lippard served as Vice President — International Trading for Tube City, Inc. from June 1998. Mr. Lippard served in various other capacities with the Company since his initial employment in 1991.
Mr. Papazoglou was elected Vice President — Rail Technologies in August 2012 having previously served as Vice President — Friction Management since March 2011. Prior to joining the Company in December 2010, Mr. Papazoglou served as Executive Vice President and Chief Operating Officer for Portec Rail Products, Inc. from October 2006. Mr. Papazoglou served in various other capacities with Portec since his initial employment in 1978.
Mr. Russo is the Senior Vice President, Chief Financial Officer and Treasurer having resigned as Chief Accounting Officer in August 2012 upon the appointment of Mr. Scanlon as Controller and Chief Accounting Officer in August 2012. Mr. Russo was previously elected Senior Vice President, Chief Financial and Accounting Officer and Treasurer in March 2010 having served previously as Senior Vice President, Chief Financial Officer and Treasurer since December 2002. From July 2002 to December 2002, Mr. Russo served as Vice President and Chief Financial Officer. Mr. Russo was Corporate Controller of WESCO International Inc. from 1999 until joining the Company in 2002. Prior to 1999, Mr. Russo served as Corporate Controller of Life Fitness Inc.
Mr. Sauder was elected Vice President — Global Business Development upon joining the Company in November 2008. Prior to joining the Company, Mr. Sauder was Director, Global Business Development at Joy Mining Machinery where he was responsible for leading mergers and acquisitions and new business initiatives from December 2007. Prior to that, he was Manager, Business Development for Eaton Corporation from April 2006 to December 2007. He previously held various positions of increasing responsibility at Duquesne Light Company from August 1998 to April 2006 and PNC Bank from February 1993 to August 1998.
Mr. Scanlon was elected Controller and Chief Accounting Officer in August 2012 after joining the Company in July 2012. Prior to joining the Company, Mr. Scanlon served as the Online Higher Education Division Controller of Education Management Corporation from November 2009 to July 2012. Mr. Scanlon served as Manager of Central Accounting Services for Bayer Corporation, from May 2007 until November 2009. From April 2005 until May 2007, Mr. Scanlon served as a financial reporting analyst for Respironics, Inc.
Officers are elected annually at the organizational meeting of the Board of Directors following the annual meeting of stockholders.
Code of Ethics
L.B. Foster Company has a legal and ethical conduct policy applicable to all directors and employees, including its Chief Executive Officer, Chief Financial Officer and Controller. This policy is posted on the Company’s website, www.lbfoster.com. The Company intends to satisfy the disclosure requirement regarding certain amendments to, or waivers from, provisions of its policy by posting such information on the Company’s website. In addition, our ethics hotline can also be used by employees and others for the anonymous communication of concerns about financial controls, human resource concerns, and other reporting matters.
Available Information
The Company makes certain filings with the Securities and Exchange Commission (SEC), including its Annual Report on Form 10-K, Quarterly Reports on Form 10-Q, Current Reports on Form 8-K, and all amendments and exhibits to those reports, available free of charge through its website, www.lbfoster.com, as soon as reasonably practicable after they are filed with the SEC. These filings are also available at the SEC’s Public Reference Room at 100 F Street N.E. Washington, D.C. 20549 or by calling 1-800-SEC-0330. These filings are also available on the internet at www.sec.gov. The Company’s press releases and recent investor presentations are also available on its website.
10
Table of Contents
| ITEM 1A. | RISK FACTORS |
Risks and Uncertainties
We operate in a changing environment that involves numerous known and unknown risks and uncertainties that could have a material adverse effect on our business, financial condition, and results of operations. The following risks highlight some of the more significant factors that have affected us and could affect us in the future. We may also be affected by unknown risks or risks that we currently believe are immaterial. If any such events actually occur, our business, financial condition, and results of operations could be materially adversely affected. You should carefully consider the following factors and other information contained in this Annual Report on Form 10-K before deciding to invest in our common stock.
We intend to pursue acquisitions, joint ventures, and strategic alliances that involve a number of inherent risks, any of which may cause us not to realize anticipated benefits.
We evaluate acquisition opportunities that have the potential to support and strengthen our business. We can give no assurances that the opportunities will be consummated or that financing will be available. In addition, acquisitions involve inherent risks that the acquired business will not perform in accordance with our expectations. We may not be able to achieve the synergies and other benefits we expect from the integration as successfully or rapidly as projected, if at all. Our failure to integrate newly-acquired operations could prevent us from realizing our expected rate of return on an acquired business and could have a material or adverse effect on our results of operations and financial condition.
Prolonged unfavorable economic and market conditions could adversely affect our business.
We could be adversely impacted by prolonged negative changes in economic conditions affecting either our suppliers or customers as well as the capital markets. Negative changes in government spending may result in delayed or permanent deferrals of existing or potential projects. No assurances can be given that we will be able to successfully mitigate various prolonged uncertainties including materials cost variability, delayed or reduced customer orders and payments, and access to available capital resources outside of operations.
In addition, current volatile market conditions and significant fluctuations in energy prices may continue for an extended period, negatively affecting our business prospects. The oil and gas markets are currently very volatile, and we cannot predict future oil and natural gas prices. Historically, oil and natural gas prices have been volatile and are subject to fluctuations in response to changes in supply and demand, market uncertainty, and a variety of additional factors that are beyond our control. Any prolonged substantial decline in the price of oil and natural gas will likely have a material adverse effect on our operations, and financial condition.
Concentration of Credit Risk
The Company has financial instruments that are exposed to concentrations of credit risk and consist primarily of cash and cash equivalents and trade accounts receivable. The Company routinely maintains cash and temporary cash investments at certain financial institutions in amounts substantially in excess of Federal Deposit Insurance Corporation (“FDIC”) and other jurisdictions insurance limits. Management believes that these financial institutions are of high quality and the risk of loss is minimal.
Our ability to maintain or improve our profitability could be adversely impacted by cost pressures as well as fluctuations in interest rates and foreign currency exchange rates.
Our profitability is dependent upon the efficient use of our resources. Rising inflation, labor costs, labor disruptions, and other increases in costs in the geographies where we operate could have a significant adverse impact on our profitability and results of operations.
The majority of our products and services are sold in the United States, Canada, and Europe. Fluctuations in the relative values of the United States dollar, Canadian dollar, British pound, and Euro will require adjustments in reported earnings and operations to reflect exchange rate translation in our Canadian and European sales and operations. If the United States dollar strengthens in value as compared to the value of the Canadian dollar,
11
Table of Contents
British pound, or Euro, our reported earnings in dollars from sales in those currencies will be unfavorable. Conversely, a favorable result will be reported if the United States dollar weakens in value as compared to the value of the Canadian dollar, British pound, or Euro.
Our business operates in highly competitive industries and a failure to react to changing market conditions could adversely impact our business.
We face strong competition in each of the markets in which we participate. A slow response to competitor pricing actions and new competitor entries into our product lines could negatively impact our overall pricing. Efforts to improve pricing could negatively impact our sales volume in all product categories. We may be required to invest more heavily to maintain and expand our product offerings. There can be no assurance that new product offerings will be widely accepted in the markets we serve. Significant negative developments in any of these areas could adversely affect our financial results and condition.
If we are unable to protect our intellectual property and prevent its improper use by third parties, our ability to compete may be harmed.
We own a number of patents and trademarks under the intellectual property laws of the United States, Canada, Europe, and other countries where product sales are possible. However, we have not perfected patent and trademark protection of our proprietary intellectual property for all products in all countries. The decision not to obtain patent and trademark protection in other countries may result in other companies copying and marketing products that are based upon our proprietary intellectual property. This could impede growth into new markets where we do not have such protections and result in a greater supply of similar products in such markets, which in turn could result in a loss of pricing power and reduced revenue.
We are subject to cybersecurity risks and may incur increasing costs in an effort to minimize those risks.
Our business employs systems and websites that allow for the storage and transmission of proprietary or confidential information regarding our customers, employees, job applicants, and other parties, including financial information, intellectual property, and personal identification information. Security breaches and other disruptions could compromise our information, expose us to liability, and harm our reputation and business. The steps we take to deter and mitigate these risks may not be successful. We may not have the resources or technical sophistication to anticipate or prevent current or rapidly evolving types of cyber-attacks. Data and security breaches can also occur as a result of non-technical issues, including intentional or inadvertent breach by our employees or by persons with whom we have commercial relationships. Any compromise or breach of our security could result in a violation of applicable privacy and other laws, legal and financial exposure, negative impacts on our customers’ willingness to transact business with us, and a loss of confidence in our security measures, which could have an adverse effect on our results of operations and our reputation.
We are dependent upon key customers.
We could be adversely affected by changes in the business or financial condition of a customer or customers. A significant decrease in capital spending by our railroad customers could negatively impact our product revenue. Our CXT concrete rail products division and ARP division are dependent on the Union Pacific Railroad (UPRR) for a significant portion of their business. No assurances can be given that a significant downturn in the business or financial condition of a customer, or customers, would not impact our results of operations and/or financial condition.
An adverse outcome in any pending or future litigation or pending or future warranty claims against the Company or its subsidiaries or our determination that a customer has a substantial product warranty claim could negatively impact our financial results and/or our financial condition.
We are party to various legal proceedings. In addition, from time to time our customers assert claims against us relating to the warranties which apply to products we sell. There is the potential that a result materially adverse to us or our subsidiaries in pending or future legal proceedings or pending or future product warranty claims could materially exceed any accruals we have established and adversely affect our financial results and/or
12
Table of Contents
financial condition. In January 2015 the UPRR filed a lawsuit against the Company asserting that we were in material breach of our 2012 amended supply agreement with the UPRR due to claimed failures to provide warranty ties to replace alleged defective concrete ties. UPRR seeks various types of relief including incidental, consequential, and other damages in amounts to be determined at trial under various legal theories. See “Executive Level Overview” for additional information regarding the UPRR’s lawsuit. We continue to work with UPRR in an attempt to reach a resolution on this matter. However, we cannot predict that such discussions will be successful, the results of litigation, or whether any settlement or judgment amounts will be within the range of our estimated accruals for loss contingencies. Consequently, while we believe the claims in the UPRR lawsuit case are without merit, and we intend to vigorously defend ourselves, an adverse outcome could result in a substantial judgment against us that could have a material adverse effect on our financial condition. No assurances can be given that our current estimate of the number of defective concrete ties that need to be replaced will not increase and result in our having to take additional charges, or that UPRR will not terminate the 2012 amended supply agreement and recover damages under its lawsuit, which events could have a material adverse effect on our financial statements, results of operations, liquidity, and capital resources.
A portion of our sales are derived from our international operations, which exposes us to certain risks inherent in doing business on an international level.
Doing business outside the United States subjects the Company to various risks, including changing economic climate and political conditions, work stoppages, exchange controls, currency fluctuations, armed conflicts, and unexpected changes in United States and foreign laws relating to tariffs, trade restrictions, transportation regulations, foreign investments, and taxation. Increasing sales to foreign countries exposes the Company to increased risk of loss from foreign currency fluctuations and exchange controls as well as longer accounts receivable payment cycles. We have little control over most of these risks and may be unable to anticipate changes in international economic and political conditions and, therefore, unable to alter its business practices in time to avoid the adverse effect of any of these possible changes.
Violations of foreign governmental regulations, including the U.S. Foreign Corrupt Practices Act and similar worldwide anti-corruption laws could result in fines, penalties, and criminal sanctions against the Company, its officers or both and could adversely affect our business.
Our foreign operations are subject to governmental regulations in the countries in which we operate as well as U.S. laws. These include regulations relating to currency conversion, repatriation of earnings, taxation of our earnings and the earnings of our personnel, and the increasing requirement in some countries to make greater use of local employees and suppliers, including, in some jurisdictions, mandates that provide for greater local participation in the ownership and control of certain local business assets.
The U.S. Foreign Corrupt Practices Act and similar other worldwide anti-corruption laws, such as the U.K. Bribery Act, prohibit improper payments for the purpose of obtaining or retaining business. Although we have established an internal control structure, corporate policies, compliance, and training processes to reduce the risk of violation, we cannot ensure that these procedures will protect us from violations of such policies by our employees or agents. Failure to comply with applicable laws or regulations could subject us to fines and penalties and suspension or debarment from contracting. Events of non-compliance could harm our reputation, reduce our revenues and profits, and subject us to criminal and civil enforcement actions. Violations of such laws or allegations of violation could disrupt our business and result in material adverse results to our operating results or future profitability.
Certain divisions of our business depend on a small number of suppliers. The loss of any such supplier could have a material adverse effect on our business, financial condition, and result of operations.
In our rail and piling distributed products businesses, we rely on a limited number of suppliers for key products that we sell to our customers. No assurances can be given that a significant downturn in the business of one or more of these suppliers, a disruption in their manufacturing operations, an unwillingness to continue to sell to us, or a disruption in the availability of existing and new piling and rail products would not adversely impact our financial results.
13
Table of Contents
Fluctuations in the price, quality, and availability of the primary raw materials used in our business could have a material adverse effect on our operations and profitability.
Most of our businesses utilize steel as a significant product component. The steel industry is cyclical and prices and availability are subject to these cycles as well as to international market forces. We also use significant amounts of cement and aggregate in our concrete railroad tie and our precast concrete products businesses. No assurances can be given that our financial results would not be adversely affected if prices or availability of these materials were to change in a significantly unfavorable manner.
Labor disputes may have a material adverse effect on our operations and profitability.
Four of our manufacturing facilities are staffed by employees represented by labor unions. Approximately 190 employees employed at these facilities are currently working under three separate collective bargaining agreements.
In March 2014, we negotiated the renewal of the collective bargaining agreement with our Bedford, PA workforce represented by the Shopman’s Local Union Number 527. This agreement, covering approximately 50 employees, expires in March 2017.
In September 2014, we negotiated the renewal of the collective bargaining agreement with our Spokane, WA workforce represented by the United Steelworkers Local Number 338. This agreement, covering approximately 110 employees, expires in September 2017.
The bargaining unit in our St. Jean, Quebec, Canada workforce is represented by the Canadian Steel Workers Union Local Number 9443. This agreement, covering approximately 30 employees, was finalized in November 2013. A five year agreement was ratified that will expire in August 2018.
These collective bargaining agreements forbid the respective labor organizations from endorsing any work stoppage during the life of the agreements.
Our success is highly dependent on the continued service and availability of qualified personnel.
Much of our future success depends on the continued availability and service of key personnel, including our Chief Executive Officer, the executive team, and other highly skilled employees. Changes in demographics, training requirements, and the availability of qualified personnel could negatively affect our ability to compete and lead to a reduction in our profitability.
Our future performance and market value could cause write-downs of intangible assets in future periods.
We are required under U.S. generally accepted accounting principles to review intangible assets for impairment when events or changes in circumstances indicate the carrying value may not be recoverable. Goodwill is required to be tested for impairment at least annually. Factors that may be considered to be a change in circumstances indicating that the carrying value of our intangible assets may not be recoverable include, but are not limited to, a decline in stock price and market capitalization, a significant decrease in the market value of an asset, or a significant decrease in operating or cash flow projections. No assurances can be given that we will not be required to record a significant adverse charge to earnings during the period in which any impairment of its goodwill or intangible assets occurs.
We may not foresee or be able to control certain events that could adversely affect our business.
Unexpected events including fires or explosions at our facilities, natural disasters, armed conflicts, unplanned outages, equipment failures, failure to meet product specifications, or a disruption in certain of our operations may cause our operating costs to increase or otherwise impact our financial performance.
Shifting federal, state, local, and foreign regulatory policies impose risks to our operations.
We are subject to regulation from federal, state, local, and foreign regulatory agencies. We are required to comply with numerous laws and regulations and to obtain numerous authorizations, permits, approvals, and certificates from governmental agencies. Compliance with emerging regulatory initiatives, delays, discontinuations, or reversals of existing regulatory policies in the markets in which we operate could have an adverse effect on our business, results of operations, cash flows, and financial condition.
14
Table of Contents
A substantial portion of our operations are heavily dependent on governmental funding of infrastructure projects. Many of these projects have “Buy America” or “Buy American” provisions. Significant changes in the level of government funding of these projects could have a favorable or unfavorable impact on our operating results. Additionally, government actions concerning “Buy America” provisions, taxation, tariffs, the environment, or other matters could impact our operating results.
We may be impacted by new regulations related to conflict minerals.
The SEC, as directed in The Dodd-Frank Wall Street Reform and Consumer Protection Act, adopted new rules establishing disclosure and reporting requirements regarding the use of certain minerals referred to as “conflict minerals” in products. These new rules require us to determine, disclose, and report whether or not such conflict minerals originate from the Democratic Republic of the Congo or adjoining countries. The requirements could affect the sourcing, availability, and cost of minerals used in the manufacture of certain of the products we sell, including some that we contract to manufacture. In addition, our customers may require that our products be free of conflict minerals and our revenues may be harmed if we are unable to procure conflict-free minerals at a reasonable price. We may face reputation challenges with our customers and other stakeholders if we are unable to verify sufficiently the origins of all minerals used in our products.
| ITEM 1B. | UNRESOLVED STAFF COMMENTS |
None.
15
Table of Contents
| ITEM 2. | PROPERTIES |
The location and general description of the principal properties which are owned or leased by L.B. Foster Company, together with the segment of the Company’s business using such properties, are set forth in the following table:
| Location |
Function |
Acres |
Business |
Lease | ||||||
| Bedford, PA |
Bridge component fabricating plant. | 16 | Construction | Owned | ||||||
| Birmingham, AL |
Pipe coating facility. | 32 | Tubular | 2017 | ||||||
| Burnaby, British Columbia, Canada |
Friction management products plant. | N/A | Rail | 2021 | ||||||
| Columbia City, IN |
Rail processing facility and yard storage. | 22 | Rail | Owned | ||||||
| Hillsboro, TX |
Precast concrete facility. | 9 | Construction | Owned | ||||||
| Leicester, United Kingdom |
Material handling manufacturing plant. | N/A | Rail | 2019 | ||||||
| Magnolia, TX |
Threading facility and joint venture manufacturing facility. | 35 | Tubular | Owned | ||||||
| Niles, OH |
Rail fabrication, friction management products, and yard storage. | 35 | Rail | Owned | ||||||
| Petersburg, VA |
Piling storage facility. | 35 | Construction | Owned | ||||||
| Pueblo, CO |
Rail joint manufacturing. | 9 | Rail | Owned | ||||||
| Saint-Jean-sur-Richelieu, Quebec, Canada |
Rail anchors and track spikes manufacturing plant. | 17 | Rail | Owned | ||||||
| Sheffield, United Kingdom |
Track component and friction management products facility. | N/A | Rail | 2019 | ||||||
| Spokane, WA |
CXT concrete tie plant. | 13 | Rail | 2015* | ||||||
| Spokane, WA |
Precast concrete facility. | 5 | Construction | 2015* | ||||||
| Tucson, AZ |
CXT concrete tie plant. | 19 | Rail | 2017 | ||||||
| Waverly, WV |
Precast concrete facility. | 85 | Construction | Owned | ||||||
| Willis, TX (2) |
Pipe coating and measurement products and services facilities. | 84 | Tubular | Owned | ||||||
Included in the table above are certain facilities leased by the Company for which there is no acreage included in the lease. For these properties a “N/A” has been included in the “Acres” column.
*- Spokane lease is expected to be renewed during 2015.
Including the properties listed above, the Company has a total of 27 sales offices, including its headquarters in Pittsburgh, PA and 22 warehouses, plant, and yard facilities located throughout the United States, Canada, and Europe. The Company’s facilities are in good condition and suitable for the Company’s business as currently conducted and as currently planned to be conducted.
| ITEM 3. | LEGAL PROCEEDINGS |
Information regarding the Company’s legal proceedings and other commitments and contingencies is set forth in Part II, Item 8, Note 20 to the Consolidated Financial Statements included herein, which is incorporated by reference into this Item 3.
| ITEM 4. | MINE SAFETY DISCLOSURES |
This item is not applicable to the Company.
16
Table of Contents
PART II
| ITEM 5. | MARKET FOR REGISTRANT’S COMMON EQUITY, RELATED STOCKHOLDER MATTERS AND ISSUER PURCHASES OF EQUITY SECURITIES |
Stock Market Information
The Company had 375 common shareholders of record on February 25, 2015. Common stock prices are quoted daily through the NASDAQ Global Select Market quotation service (Symbol: FSTR). The following table sets forth the range of high and low sales prices per share of our common stock for the periods indicated:
| 2014 | 2013 | |||||||||||||||||||||||
| Quarter |
High | Low | Dividends | High | Low | Dividends | ||||||||||||||||||
| First |
$ | 48.41 | $ | 40.09 | $ | 0.03 | $ | 45.43 | $ | 37.97 | $ | 0.03 | ||||||||||||
| Second |
54.68 | 44.82 | 0.03 | 46.45 | 39.63 | 0.03 | ||||||||||||||||||
| Third |
56.72 | 45.93 | 0.03 | 47.91 | 39.14 | 0.03 | ||||||||||||||||||
| Fourth |
54.41 | 43.81 | 0.04 | 50.00 | 42.71 | 0.03 | ||||||||||||||||||
Dividends
The Company’s September 23, 2014 credit facility permits it to pay dividends and distributions and make redemptions with respect to its stock providing no event of default or potential default (as defined in the facility agreement) has occurred prior to or after giving effect to the dividend, distribution, or redemption. Dividends, distributions, and redemptions are capped at $25,000 per year when funds are drawn on the facility. If no drawings on the facility exist, dividends, distributions, and redemptions in excess of $25,000 per year are subjected to a limitation of $75,000 in the aggregate. The $75,000 aggregate limitation also permits certain loans, strategic investments, and acquisitions.
In October 2014, the Company’s Board of Directors authorized an increase to the regular quarterly dividend to $0.04 per share.
17
Table of Contents
Performance Graph
In 2014, the Company changed its peer group to align it with the Company’s comparator group as used by the Company’s compensation committee to evaluate the Company’s compensation practices. The Company’s new peer group (2014 Peer Group) consists of Accuride Corporation, Alamo Group, Inc., AM Castle & Co., American Railcar Industries, Inc., CIRCOR International, Inc., Columbus McKinnon Corporation, Furmanite Corporation, Gibraltar Industries, Inc., Houston Wire & Cable Company, Insteel Industries Inc., Lindsay Corporation, Lydall Inc., MYR Group, Inc., NN Inc., Northwest Pipe Co., Olympic Steel Inc., Orion Marine Group, Inc., Quanex Building Products Corporation, Raven Industries Inc., and Sterling Construction Co. Inc.
Prior to 2014, the Company’s old peer group (2013 Peer Group) consisted of Alamo Group, Inc., AM Castle & Co., American Railcar Industries, Inc., CIRCOR International, Inc., DXP Enterprises, Inc., Greenbrier Cos., Inc., Haynes International Inc., Houston Wire & Cable Company, Insteel Industries Inc., Lawson Products Inc., NN Inc., Olympic Steel Inc., RBC Bearings Inc., Skyline Corp., Sterling Construction Co. Inc., and Synalloy Corp.
The following tables compare total shareholder returns for the Company over the last five years to the NASDAQ Composite Index and the peer groups assuming a $100 investment made on December 31, 2009. Each of the four measures of cumulative total return assumes reinvestment of dividends. The stock performance shown on the graph below is not necessarily indicative of future price performance.
COMPARISON OF 5 YEAR CUMULATIVE TOTAL RETURN*
Among L.B. Foster Company, the NASDAQ Composite Index,
2013 Peer Group, and 2014 Peer Group
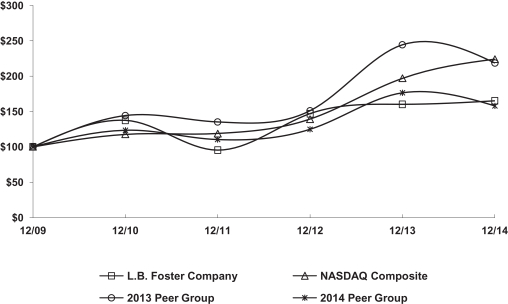
| * | $100 invested on 12/31/09 in stock or index, including reinvestment of dividends. Fiscal year ending December 31. |
| 12/09 | 12/10 | 12/11 | 12/12 | 12/13 | 12/14 | |||||||||||||||||||
| L.B. Foster Company |
$100.00 | $137.34 | $95.22 | $146.67 | $160.11 | $164.88 | ||||||||||||||||||
| NASDAQ Composite |
100.00 | 117.61 | 118.70 | 139.00 | 196.83 | 223.74 | ||||||||||||||||||
| 2013 Peer Group |
100.00 | 144.08 | 135.09 | 150.81 | 244.08 | 218.48 | ||||||||||||||||||
| 2014 Peer Group |
100.00 | 123.58 | 110.11 | 124.66 | 176.21 | 157.97 | ||||||||||||||||||
18
Table of Contents
Securities Authorized for Issuance Under Equity Compensation Plans
The following table sets forth information as of December 31, 2014 with respect to compensation plans under which equity securities of the Company are authorized for issuance.
| Plan Category | Number of securities to be issued upon exercise of outstanding options, warrants, and rights |
Weighted-average exercise price of outstanding options, warrants, and rights |
Number of securities remaining available for future issuance under equity compensation plans (excluding securities to be issued upon exercise of outstanding options, warrants, or rights) |
|||||||||
| Equity compensation plans approved by shareholders |
7,500 | $ | 9.08 | 469,840 | ||||||||
| Equity compensation plans not approved by shareholders |
— | — | — | |||||||||
|
|
|
|
|
|
|
|||||||
| Total |
7,500 | $ | 9.08 | 469,840 | ||||||||
|
|
|
|
|
|
|
|||||||
Under the 2006 Omnibus Incentive Plan, non-employee directors are automatically awarded up to 3,500 shares of the Company’s common stock as determined by the Board of Directors at each annual shareholder meeting at which such non-employee director is elected or re-elected, commencing May 24, 2006. Through December 31, 2014, there were 110,642 fully vested shares issued under the 2006 Omnibus Incentive Plan to non-employee directors. Additionally, pursuant to the 2006 Omnibus Incentive Plan, during 2014 and 2012 the Company issued approximately 14,000 and 34,000 fully-vested shares in lieu of a cash payment earned under separate three year incentive plans, respectively.
The Company grants eligible employees Restricted Stock and Performance Unit Awards under the 2006 Omnibus Plan. The forfeitable Restricted Stock Awards generally time-vest after a four year holding period, unless indicated otherwise by the underlying Restricted Stock Agreement. Performance Unit Awards are offered annually under separate three-year long-term incentive programs. Performance units are subject to forfeiture and will be converted into common stock of the Company based upon the Company’s performance relative to performance measures and conversion multiples as defined in the underlying program.
The 1998 Plan expired by its terms in 2008 and no awards may be granted under that Plan, which currently has outstanding stock option awards that expire in 2015.
The Company will withhold or employees may tender shares of restricted stock when issued to pay for withholding taxes. During 2014, 2013, and 2012, the Company withheld 21,676, 16,166, and 23,562 shares, respectively, for this purpose. The value of the shares withheld were $985, $708 and $669 in 2014, 2013, and 2012, respectively.
Issuer Purchases of Equity Securities
The Company’s purchases of equity securities for the three-month period ended December 31, 2014 were as follows:
| Total number of shares purchased(1) |
Average price paid per share |
Total number of shares purchased as part of publicly announced plans or programs(2) |
Approximate dollar value of shares that may yet be purchased under the plans or programs (in thousands) |
|||||||||||||
| October 1, 2014 — October 31, 2014 |
— | $ | — | — | $ | 15,000 | ||||||||||
| November 1, 2014 — November 30, 2014 |
— | — | — | 15,000 | ||||||||||||
| December 1, 2014 — December 31, 2014 |
1,375 | 48.40 | — | 15,000 | ||||||||||||
|
|
|
|
|
|
|
|
|
|||||||||
| Total |
1,375 | $ | 48.40 | — | $ | 15,000 | ||||||||||
|
|
|
|
|
|
|
|
|
|||||||||
| (1) | Reflects shares withheld by the Company to pay taxes upon vesting of restricted stock. |
| (2) | On December 4, 2013, the Board of Directors authorized the repurchase of up to $15,000 of the Company’s common shares until December 31, 2016. This authorization became effective January 1, 2014. |
19
Table of Contents
The Company did not purchase any common shares under the share repurchase authorization, however, the Company withheld shares for employee tax payments during the year. During the first quarter of 2014, the Company withheld 17,045 shares at an average price of $43.86. During the second quarter of 2014, the Company withheld 3,256 at an average price of $52.55. There were no share withholdings during the third quarter of 2014.
| ITEM 6. | SELECTED FINANCIAL DATA |
The following selected financial data has been derived from our audited financial statements. The financial data presented below should be read in conjunction with the information contained in “Management’s Discussion and Analysis of Financial Condition and Results of Operations” and the Consolidated Financial Statements of the Company and the Notes thereto included elsewhere in this Annual Report on Form 10-K.
| Year Ended December 31, | ||||||||||||||||||||
| Income Statement Data |
2014(1) | 2013(2) | 2012(3) | 2011(4) | 2010(5) | |||||||||||||||
| Net sales |
$ | 607,192 | $ | 597,963 | $ | 588,541 | $ | 575,337 | $ | 467,058 | ||||||||||
|
|
|
|
|
|
|
|
|
|
|
|||||||||||
| Operating profit |
$ | 37,082 | $ | 41,571 | $ | 22,657 | $ | 30,812 | $ | 31,217 | ||||||||||
|
|
|
|
|
|
|
|
|
|
|
|||||||||||
| Income from continuing operations, net of tax |
$ | 25,654 | $ | 29,276 | $ | 14,764 | $ | 22,067 | $ | 20,006 | ||||||||||
| Income from discontinued operations, net of tax |
2 | 14 | 1,424 | 828 | 486 | |||||||||||||||
|
|
|
|
|
|
|
|
|
|
|
|||||||||||
| Net income |
$ | 25,656 | $ | 29,290 | $ | 16,188 | $ | 22,895 | $ | 20,492 | ||||||||||
|
|
|
|
|
|
|
|
|
|
|
|||||||||||
| Basic earnings per common share: |
||||||||||||||||||||
| Continuing operations |
$ | 2.51 | $ | 2.88 | $ | 1.46 | $ | 2.16 | $ | 1.96 | ||||||||||
| Discontinued operations |
0.00 | 0.00 | 0.14 | 0.08 | 0.05 | |||||||||||||||
|
|
|
|
|
|
|
|
|
|
|
|||||||||||
| Basic earnings per common share |
$ | 2.51 | $ | 2.88 | $ | 1.60 | $ | 2.24 | $ | 2.01 | ||||||||||
|
|
|
|
|
|
|
|
|
|
|
|||||||||||
| Diluted earnings per common share: |
||||||||||||||||||||
| Continuing operations |
$ | 2.48 | $ | 2.85 | $ | 1.44 | $ | 2.14 | $ | 1.93 | ||||||||||
| Discontinued operations |
0.00 | 0.00 | 0.14 | 0.08 | 0.05 | |||||||||||||||
|
|
|
|
|
|
|
|
|
|
|
|||||||||||
| Diluted earnings per common share |
$ | 2.48 | $ | 2.85 | $ | 1.58 | $ | 2.22 | $ | 1.98 | ||||||||||
|
|
|
|
|
|
|
|
|
|
|
|||||||||||
| Dividends paid per common share |
$ | 0.13 | $ | 0.12 | $ | 0.10 | $ | 0.10 | $ | — | ||||||||||
|
|
|
|
|
|
|
|
|
|
|
|||||||||||
Operating profit represents the gross profit less selling and administrative expenses and amortization expense.
| (1) | 2014 includes CXT Concrete Tie warranty charges of $9,374 within the Rail Products segment. The 2014 results include the acquisitions of Carr Concrete (July 7), FWO (October 29), and Chemtec Energy Services, L.L.C. (December 30). More information about the warranty charges and acquisition activity can be found in Part II Item 8, Note 20 and Note 3, respectively, to the consolidated financial statements included herein, which is incorporated by reference into this Part II Item 6. |
| (2) | 2013 includes the results of L.B. Foster Ball Winch, Inc., which was formed for the purpose of acquiring assets of Ball Winch, LLC, beginning on November 7, 2013. |
| (3) | 2012 includes a $22,000 warranty charge and a pre-tax gain of $3,193, from the dispositions of SSD and Precise, in income from discontinued operations, net of tax. |
| (4) | 2011 includes a pre-tax gain of $577 associated with the early termination of the operating lease associated with the Company’s sale-leaseback transaction for our threaded products facility, formerly located in Houston, TX. |
| (5) | 2010 includes the results of Rail Technologies, beginning on December 15, 2010. |
| December 31, | ||||||||||||||||||||
| Balance Sheet Data |
2014 | 2013 | 2012 | 2011 | 2010 | |||||||||||||||
| Total assets |
$ | 495,121 | $ | 413,654 | $ | 406,122 | $ | 379,894 | $ | 378,402 | ||||||||||
| Working capital |
138,908 | 171,885 | 184,423 | 155,261 | 142,303 | |||||||||||||||
| Long-term debt |
25,752 | 25 | 27 | 51 | 2,399 | |||||||||||||||
| Stockholders’ equity |
335,888 | 316,397 | 287,575 | 269,815 | 255,747 | |||||||||||||||
20
Table of Contents
| ITEM 7. | MANAGEMENT’S DISCUSSION AND ANALYSIS OF FINANCIAL CONDITION AND RESULTS OF OPERATIONS |
(Dollars in thousands, except share data unless otherwise noted)
Executive Level Overview
Recent Acquisitions by Segment
Construction Products Acquisition
On July 7, 2014, the Company acquired Carr Concrete Corporation (Carr) for $12,480. Carr is a provider of pre-stressed and precast concrete products located in Waverly, WV and the transaction was funded with cash on hand.
Rail Products Acquisitions
On October 29, 2014, the Company acquired FWO, a business of Balfour Beatty Rail GmbH for $1,103. The German business provides track lubrication and switch roller equipment for international railway applications.
Subsequent to year end, on January 13, 2015, the Company acquired the stock of Tew Holdings, LTD (Tew) for approximately $26,600, subject to the finalization of net debt and net working capital adjustments. Headquartered in Nottingham, UK, Tew provides application engineering solutions primarily to the rail market and other major industries. The transaction was funded with non-domestic cash.
Tubular Products Acquisition
On December 30, 2014, the Company acquired Chemtec Energy Services, L.L.C. (Chemtec) for $66,719, net of cash received, which is inclusive of a $1,867 preliminary working capital adjustment. Located in Willis, TX, Chemtec is a manufacturer and turnkey provider of blending, injection, and metering equipment for the oil and gas industry.
2014 Developments
In addition to the acquisitions, 2014 included many developments that will provide efficiencies and opportunities to expand our product lines. During 2014, we:
| Ÿ | Generated $66,616 in cash flows from operations to fund current year acquisitions and strategic capital investments. |
| Ÿ | Completed the centralization of our friction management operations to increase our product offerings while reducing our overhead costs. |
| Ÿ | Entered into the completion phase of our facility upgrades at our Birmingham, AL facility which will lead to increased production capacity and efficiency. |
| Ÿ | Completed a track expansion in the Columbia City, IN yard to significantly increase efficiency. |
| Ÿ | Purchased an additional facility in Bedford, PA to support growth in our corrugated bridge business. |
| Ÿ | Amended our credit agreement from a maximum credit line of $125,000 with a $50,000 accordion feature to a maximum credit line of $200,000 with a $100,000 accordion feature. |
| Ÿ | Increased the quarterly dividend 33% to $0.04 per share during the fourth quarter. |
| Ÿ | Selected an enterprise resource planning system and acquired the software to begin the implementation. |
Union Pacific Railroad (UPRR) Product Warranty Claim
On July 12, 2011, the UPRR notified (UPRR Notice) the Company and its subsidiary, CXT Incorporated (CXT), of a warranty claim under CXT’s 2005 supply contract relating to the sale of pre-stressed concrete railroad ties to the UPRR. The UPRR asserted that a significant percentage of concrete ties manufactured in 2006
21
Table of Contents
through 2011 at CXT’s Grand Island, NE facility failed to meet contract specifications, had workmanship defects and were cracking and failing prematurely. Of the 3.0 million ties manufactured between 1998 and 2011 from the Grand Island, NE facility, approximately 1.6 million ties were sold during the period the UPRR had claimed nonconformance. The 2005 contract called for each concrete tie which failed to conform to the specifications or had a material defect in workmanship to be replaced with 1.5 new concrete ties, provided, that UPRR within five years of the sale of a concrete tie, notified CXT of such failure to conform or such defect in workmanship. The UPRR Notice did not specify how many ties manufactured during this period were defective nor the exact nature of the alleged workmanship defect.
Following the UPRR Notice, the Company worked with material scientists and pre-stressed concrete experts to test a representative sample of Grand Island, NE concrete ties and assess warranty claims for certain concrete ties made in its Grand Island, NE facility between 1998 and 2011. The Company discontinued manufacturing operations in Grand Island, NE in early 2011.
2012
During 2012, the Company completed sufficient testing and analysis to further understand this matter. Based upon testing results and expert analysis, the Company believed it discovered conditions, which largely related to the 2006 to 2007 manufacturing period, that can shorten the life of the concrete ties produced during this period. During the fourth quarter of 2012 and first quarter of 2013, the Company reached agreement with the UPRR on several matters including a process for the Company and the UPRR to work together to identify, prioritize, and replace defective ties that meet the criteria for replacement. This process applies to the ties the Company shipped to the UPRR from its Grand Island, NE facility from 1998 to 2011. During most of this period the Company’s warranty policy for UPRR carried a 5 year warranty with a 1.5:1 replacement ratio for any defective ties. In order to accommodate the UPRR and other customer concerns, the Company also reverted to a previously used warranty policy providing a 15 year warranty with a 1:1 replacement ratio. This change provided an additional 10 years of warranty protection. In the amended 2005 supply agreement, the Company and the UPRR also extended the supply of Tucson ties by five years and agreed on a cash payment of $12,000 to the UPRR as compensation for concrete ties already replaced by the UPRR during the investigation period.
During 2012, as a result of testing the Company conducted on concrete ties manufactured at its former Grand Island, NE facility and of the related developments of the UPRR and other customer matters, the Company recorded pre-tax warranty charges of $22,000 in “Cost of Goods Sold” within its Rail Products segment based on the Company’s estimate of the number of defective concrete ties that will ultimately require replacement during the applicable warranty periods.
2013
Throughout 2013, at the UPRR’s request and under the terms of the amended 2005 supply agreement, the Company provided warranty replacement concrete ties for use across certain UPRR subdivisions. The Company attempted to reconcile the quantity of warranty claims for ties replaced and obtain supporting detail for the ties removed. The Company believes that the UPRR did not replace concrete ties in accordance with the amended agreement and has not furnished adequate documentation throughout the replacement process in these subdivisions to support its full warranty claim. Based on the information received by the Company to date, the Company believes that a significant number of ties which the UPRR replaced in these subdivisions did not meet the criteria to be covered as warranty replacement ties under the amended 2005 supply agreement. The disagreement related to the 2013 warranty replacement activity includes approximately 170,000 ties where the Company provided detailed documentation supporting our position with reason codes that detail why these ties are not eligible for a warranty claim.
In late November 2013, the Company received notice from the UPRR asserting a material breach of the amended 2005 supply agreement. The UPRR’s notice asserted that the failure to honor its claims for warranty ties in these subdivisions was a material breach. Following receipt of this notice, the Company provided information to the UPRR to refute the UPRR’s claim of breach and included the reconciliation of warranty claims supported by substantial findings from the Company’s track observation team, all within the 90 day cure
22
Table of Contents
period. The Company also proposed further discussions to reach agreement on reconciliation for 2013 replacement activities and future replacement activities and a recommended process that will ensure future replacement activities are done with appropriate documentation and per the terms of the amended 2005 supply agreement.
2014
During the first quarter of 2014, the Company further responded within the 90 day cure period to the UPRR’s claim and presented a reconciliation for the subdivisions at issue. This proposed reconciliation was based on empirical data and visual observation from Company employees that were present during the replacement process for a substantial majority of the concrete ties replaced. The Company has spent considerable time documenting facts related to concrete tie condition and track condition to assess whether the ties replaced met the criteria to be eligible for replacement under the terms of the amended 2005 supply agreement.
During the second quarter of 2014, the Company increased its accrual by an additional $4,000 based on revised estimates of ties to be replaced. The Company continued to work with UPRR to identify, replace, and reconcile defective ties related to the warranty claim in accordance with the amended 2005 supply agreement. The Company and UPRR met during the third quarter of 2014 to evaluate each other’s position in an effort to work towards agreement on the unreconciled 2013 and 2014 replacement activity as well as the standards and practices to be implemented for future replacement activity and warranty tie replacement. No agreement was reached and the Company continues to endeavor to reconcile the replaced warranty ties with UPRR.
As of December 31, 2014, the Company and the UPRR have not been able to reconcile the disagreement related to the 2013 and 2014 warranty replacement activity. The disagreement relating to the 2014 warranty replacement activity includes approximately 90,100 ties that the Company believes are not warranty-eligible.
As a result of the current year replacement activity and related discussions with the UPRR, during the fourth quarter of 2014 the Company recognized a $4,766 charge to increase the warranty obligation to reflect the Company’s current expectations of tie failures, based upon scientific testing and other analysis, adjusted for ties already provided to the UPRR. The accrued concrete tie warranty reserve of $10,331 as of December 31, 2014 is the best estimate of the expected value of defective ties that will be replaced as a result of our observation and analysis of ties in track. While the Company believes this is a reasonable estimate of these potential warranty claims, these estimates could change due to the receipt of new information and future events. In the event the UPRR continues to replace ties and assert warranty claims in future years in the same manner as 2013 and 2014, we are likely to have a disagreement in those future years relating to the number of ties eligible for warranty claim.
In November and December of 2014, the Company received additional notices from the UPRR asserting that ties manufactured in 2000 were defective and again asserting material breaches of the amended 2005 supply agreement relating to warranty tie replacements as well as certain new ties provided to the UPRR being out of specification. The Company again responded to the UPRR that it was not in material breach of the amended 2005 supply agreement relating to warranty tie replacements and that new ties being manufactured complied with the specifications provided by the UPRR.
Although the Company has denied it is in material breach of the amended 2005 supply agreement, this dispute could jeopardize our amended 2005 supply agreement. For the years ended December 31, 2014, 2013, and 2012, sales to the UPRR from our Tucson, AZ facility were approximately $15,297, $12,664, and $25,441, respectively. Additionally, as of December 31, 2014 we had long-lived assets with a net book value of approximately $978 associated with the Tucson, AZ facility.
On January 23, 2015, the UPRR filed a Complaint and Demand for Jury Trial in the District Court for Douglas County, NE against the Company and its subsidiary, CXT Incorporated, asserting among other matters that the Company breached its express warranty, breached an implied covenant of good faith and fair dealing, anticipatorily repudiated its warranty obligations, and that UPRR’s exclusive and limited remedy provisions in the supply agreement have failed of their essential purpose which entitles UPRR to recover all incidental and consequential damages. The complaint seeks to cancel all duties of UPRR under the contracts, to adjudge the Company as having no remaining rights under the contracts, and to recover damages in an amount to be determined at trial for the value of unfulfilled warranty replacement ties and ties likely to become warranty eligible, for costs of
23
Table of Contents
cover for replacement ties and for various incidental and consequential damages. The amended 2005 supply agreement provides that UPRR’s exclusive remedy is to receive a replacement tie that meets the contract specifications for each tie that failed to meet the contract specifications or otherwise contained a material defect provided that the Company receives written notice of such failure or defect within 15 years after that tie was produced. The amended 2005 supply agreement continues to provide that the Company’s warranty does not apply to ties that (a) have been repaired or altered without the Company’s written consent in such a way as to affect the stability or reliability thereof, (b) have been subject to misuse, negligence or accident, or (c) have been improperly maintained or used contrary to the specifications for which such ties were produced. The amended 2005 supply agreement also continues to provide that the Company’s warranty is in lieu of all other express or implied warranties and that neither party shall be subject to or liable for any incidental or consequential damages to the other party. The dispute is largely based on (1) claims submitted which the Company believes are for ties inaccurately rated that are not the responsibility of the Company and claims that do not meet the criteria of a warranty replacement and (2) UPRR’s assertion, which the Company vigorously disputes, that UPRR in future years will be entitled to warranty replacement ties for virtually all of the Grand Island ties. Many thousands of Grand Island ties have been performing in track for over ten years. In addition, a significant amount of Grand Island ties were rated by both parties in the excellent category of the rating system. The Company believes UPRR’s claims are without merit and intends to vigorously defend itself.
The Company continues to engage in discussions in an effort to resolve this matter, however, we cannot predict that such discussions will be successful, the results of the litigation with UPRR, or whether any settlement or judgment amounts will be within the range of our estimated accruals for loss contingencies. Future potential costs pertaining to UPRR’s claims and the outcome of the UPRR litigation could result in a material adverse effect on our results of operations, financial condition, and cash flows.
24
Table of Contents
Quarterly Results of Continuing Operations
| Three Months
Ended December 31, |
Percent of Total Net Sales Three Months Ended December 31, |
Percent Increase/(Decrease) |
||||||||||||||||||
| 2014 | 2013 | 2014 | 2013 | 2014 vs. 2013 | ||||||||||||||||
| Net Sales: |
||||||||||||||||||||
| Rail Products |
$ | 91,530 | $ | 85,824 | 56.8 | % | 54.8 | % | 6.6 | % | ||||||||||
| Construction Products |
59,747 | 61,923 | 37.1 | 39.6 | (3.5 | ) | ||||||||||||||
| Tubular Products |
9,872 | 8,711 | 6.1 | 5.6 | 13.3 | |||||||||||||||
|
|
|
|
|
|
|
|
|
|
|
|||||||||||
| Total net sales |
$ | 161,149 | $ | 156,458 | 100.0 | % | 100.0 | % | 3.0 | % | ||||||||||
|
|
|
|
|
|||||||||||||||||
| Three Months Ended December 31, |
Gross Profit Percentage Three Months Ended December 31, |
Percent Increase/(Decrease) |
||||||||||||||||||
| 2014 | 2013 | 2014 | 2013 | 2014 vs. 2013 | ||||||||||||||||
| Gross Profit: |
||||||||||||||||||||
| Rail Products |
$ | 18,920 | $ | 18,840 | 20.7 | % | 22.0 | % | 0.4 | % | ||||||||||
| Construction Products |
10,565 | 9,973 | 17.7 | 16.1 | 5.9 | |||||||||||||||
| Tubular Products |
1,981 | 2,218 | 20.1 | 25.5 | (10.7 | ) | ||||||||||||||
| LIFO income / (expense) |
238 | (262 | ) | 0.1 | (0.2 | ) | ** | |||||||||||||
| Other |
(99 | ) | (158 | ) | (0.1 | ) | (0.1 | ) | (37.3 | ) | ||||||||||
|
|
|
|
|
|
|
|
|
|
|
|||||||||||
| Total gross profit |
$ | 31,605 | $ | 30,611 | 19.6 | % | 19.6 | % | 3.2 | % | ||||||||||
|
|
|
|
|
|||||||||||||||||
| Three Months Ended December 31, |
Percent of Total Net Sales Three Months Ended December 31, |
Percent Increase/(Decrease) |
||||||||||||||||||
| 2014 | 2013 | 2014 | 2013 | 2014 vs. 2013 | ||||||||||||||||
| Expenses: |
||||||||||||||||||||
| Selling and administrative expenses |
$ | 21,546 | $ | 18,628 | 13.4 | % | 11.9 | % | 15.7 | % | ||||||||||
| Amortization expense |
1,191 | 1,010 | 0.7 | 0.6 | 17.9 | |||||||||||||||
| Interest expense |
137 | 109 | 0.1 | 0.1 | 25.7 | |||||||||||||||
| Interest income |
(99 | ) | (165 | ) | (0.1 | ) | (0.1 | ) | (40.0 | ) | ||||||||||
| Equity in income of nonconsolidated investments |
(459 | ) | (424 | ) | (0.3 | ) | (0.3 | ) | 8.3 | |||||||||||
| Other income |
(377 | ) | (101 | ) | (0.2 | ) | (0.1 | ) | ** | |||||||||||
|
|
|
|
|
|
|
|
|
|
|
|||||||||||
| Total expenses |
$ | 21,939 | $ | 19,057 | 13.6 | % | 12.2 | % | 15.1 | % | ||||||||||
|
|
|
|
|
|||||||||||||||||
| Income from continuing operations before income taxes |
$ | 9,666 | $ | 11,554 | 6.0 | % | 7.4 | % | (16.3 | )% | ||||||||||
| Income tax expense |
3,628 | 4,279 | 2.3 | 2.7 | (15.2 | ) | ||||||||||||||
|
|
|
|
|
|
|
|
|
|
|
|||||||||||
| Income from continuing operations |
$ | 6,038 | $ | 7,275 | 3.7 | % | 4.6 | % | (17.0 | )% | ||||||||||
|
|
|
|
|
|||||||||||||||||
** Results of calculation are not considered meaningful for presentation purposes.
25
Table of Contents
Fourth Quarter 2014 Compared to Fourth Quarter 2013 — Company Analysis
Net sales for the three month period ended December 31, 2014 increased by $4,691, or 3.0%, which was attributable to a 13.3% and 6.6% increase in the Tubular and Rail Products segments, respectively, partially offset by a 3.5% reduction in the Construction Products segment.
The gross profit margin for the 2014 and 2013 periods was 19.6%. The fourth quarter 2014 gross profit was diluted by the impact of a $4,766 warranty charge related to CXT concrete ties manufactured in our former Grand Island, NE facility which was closed in January 2011. Excluding the charge1, the gross profit margin would have been 22.6%. The adjusted increase over prior year was primarily generated within the Rail Products business and was attributable to a favorable sales mix and operational cost reduction programs.
Selling and administrative expense increased by $2,918, or 15.7%, in the 2014 fourth quarter and was primarily attributable to increased personnel related costs associated with salaried headcount, costs related to the preparation for and identification of a new enterprise resource planning system, and a quarter over quarter increase of $1,373 in acquisition related costs. Included within the increased personnel expense are costs related to acquired businesses.
The Company’s effective income tax rate from continuing operations in the 2014 fourth quarter was 37.5%, compared to 37.0% in the prior year quarter. The increase in the Company’s effective tax rate compared to the prior year quarter was primarily due to increased nondeductible acquisition-related expenses in the current year quarter.
Net income from continuing operations for the 2014 fourth quarter was $6,038, or $0.58 per diluted share, compared to income from continuing operations of $7,275, or $0.71 per diluted share, in the prior year quarter.
Results of Continuing Operations — Segment Analysis
Rail Products
| Three Months
Ended December 31, |
Increase (Decrease) |
Percent Increase/ (Decrease) |
||||||||||||||
| 2014 | 2013 | 2014 vs. 2013 | 2014 vs. 2013 | |||||||||||||
| Net Sales |
$ | 91,530 | $ | 85,824 | $ | 5,706 | 6.6 | % | ||||||||
|
|
|
|
|
|
|
|
|
|||||||||
| Gross Profit |
$ | 18,920 | $ | 18,840 | $ | 80 | 0.4 | % | ||||||||
|
|
|
|
|
|
|
|
|
|||||||||
| Gross Profit Percentage |
20.7 | % | 22.0 | % | (1.3 | )% | (5.9 | )% | ||||||||
|
|
|
|
|
|
|
|
|
|||||||||
Fourth Quarter 2014 Compared to Fourth Quarter 2013
The Rail Products sales increase was due principally to volume growth in the Rail Distribution, CXT concrete tie, and Rail Technologies businesses. Partially offsetting this increase were reductions in our Transit Products division primarily related to the Honolulu, HI elevated transit project as it nears completion.
The Rail Products segment experienced a 28.7% decrease in new orders compared to the prior year quarter. The reduction primarily related to the Concrete Tie division which was driven by several large transit orders that were booked late in 2013.
The gross profit percentage declined due to a $4,766 warranty charge recognized during the fourth quarter of 2014 related to concrete ties manufactured at our former Grand Island, NE facility. Excluding the impact of the charge, the gross profit percentage would have been 25.9%. The adjusted margin compared to the prior year relates to improvements in each of the Rail Products divisions with the exception of CXT concrete ties. During the fourth quarter 2014, the Company benefited from an overall favorable product mix and the ongoing impact of lower costs driven by internal cost reduction efforts.
| 1 | All results excluding warranty charges are non-GAAP measures used for management reporting purposes. Management believes that these measures provide useful information to investors because it is a profitability measure used to evaluate earnings performance on a comparable year-over-year basis. |
26
Table of Contents
Construction Products
| Three Months
Ended December 31, |
(Decrease) Increase |
Percent (Decrease)/Increase |
||||||||||||||
| 2014 | 2013 | 2014 vs. 2013 | 2014 vs. 2013 | |||||||||||||
| Net Sales |
$ | 59,747 | $ | 61,923 | $ | (2,176 | ) | (3.5 | )% | |||||||
|
|
|
|
|
|
|
|
|
|||||||||
| Gross Profit |
$ | 10,565 | $ | 9,973 | $ | 592 | 5.9 | % | ||||||||
|
|
|
|
|
|
|
|
|
|||||||||
| Gross Profit Percentage |
17.7 | % | 16.1 | % | 1.6 | % | 9.9 | % | ||||||||
|
|
|
|
|
|
|
|
|
|||||||||
Fourth Quarter 2014 Compared to Fourth Quarter 2013
Construction Products segment sales declined by $2,176, or 3.5%, compared to the prior year quarter. The reduction principally relates to a 16.1% decrease in Piling Products revenues driven by reduced volumes in the 2014 quarter. The decline in Piling was largely offset by increases within the Fabricated Bridge and concrete products businesses. Included within concrete product sales were revenues related to the Company’s July 2014 acquisition of Carr Concrete.
The Construction Products segment experienced a 21.3% increase in new orders compared to the prior year quarter. New orders from the 2014 acquisition of Carr Concrete represented 9.0% of current quarter orders.
The gross profit percentage increased by 158 basis points due primarily to a favorable shift in product mix compared to the prior year period. Gross profit generated by the Fabricated Bridge Products and Piling divisions led to the increase over the prior year quarter.
Tubular Products
| Three Months
Ended December 31, |
Increase (Decrease) |
Percent Increase/(Decrease) |
||||||||||||||
| 2014 | 2013 | 2014 vs. 2013 | 2014 vs. 2013 | |||||||||||||
| Net Sales |
$ | 9,872 | $ | 8,711 | $ | 1,161 | 13.3 | % | ||||||||
|
|
|
|
|
|
|
|
|
|||||||||
| Gross Profit |
$ | 1,981 | $ | 2,218 | $ | (237 | ) | (10.7 | )% | |||||||
|
|
|
|
|
|
|
|
|
|||||||||
| Gross Profit Percentage |
20.1 | % | 25.5 | % | (5.4 | )% | (21.2 | )% | ||||||||
|
|
|
|
|
|
|
|
|
|||||||||
Fourth Quarter 2014 Compared to Fourth Quarter 2013
Tubular Products segment sales increased by $1,161, or 13.3% was due to the effect of a full quarter of sales for the November 7, 2013 acquisition of Ball Winch. Partially offsetting the increase was a reduction in the Birmingham, AL coating facility sales as a result of a three week shutdown in December to upgrade the facility to improve efficiency, quality, and capacity at the plant.
During the 2014 fourth quarter, the Tubular Products business experienced a reduction of 36.6% in order input relative to the prior year quarter. The reduction in orders was driven by declines in the Coated Products business.
Gross profit declined 540 basis points as a result of the previously mentioned shutdown at the Birmingham, AL facility and to a lesser extent, costs incurred to develop additional infrastructure within the Coated Products field service market.
27
Table of Contents
Year-to-date Results of Continuing Operations
| Twelve Months
Ended December 31, |
Percent of Total Net Sales Twelve Months Ended December 31, |
Percent Increase/(Decrease) |
||||||||||||||||||||||||||||||
| 2014 | 2013 | 2012 | 2014 | 2013 | 2012 | 2014 vs. 2013 | 2013 vs. 2012 | |||||||||||||||||||||||||
| Net Sales: |
||||||||||||||||||||||||||||||||
| Rail Products |
$ | 374,615 | $ | 363,667 | $ | 370,322 | 61.7 | % | 60.8 | % | 62.9 | % | 3.0 | % | (1.8 | )% | ||||||||||||||||
| Construction Products |
178,847 | 191,751 | 169,253 | 29.5 | 32.1 | 28.8 | (6.7 | ) | 13.3 | |||||||||||||||||||||||
| Tubular Products |
53,730 | 42,545 | 48,966 | 8.8 | 7.1 | 8.3 | 26.3 | (13.1 | ) | |||||||||||||||||||||||
|
|
|
|
|
|
|
|
|
|
|
|
|
|
|
|
|
|||||||||||||||||
| Total net sales |
$ | 607,192 | $ | 597,963 | $ | 588,541 | 100.0 | % | 100.0 | % | 100.0 | % | 1.5 | % | 1.6 | % | ||||||||||||||||
|
|
|
|
|
|
|
|||||||||||||||||||||||||||
| Twelve Months Ended December 31, |
Gross Profit Percentage Twelve Months Ended December 31, |
Percent Increase/(Decrease) |
||||||||||||||||||||||||||||||
| 2014 | 2013 | 2012 | 2014 | 2013 | 2012 | 2014 vs. 2013 | 2013 vs. 2012 | |||||||||||||||||||||||||
| Gross Profit: |
||||||||||||||||||||||||||||||||
| Rail Products |
$ | 77,235 | $ | 74,986 | $ | 52,533 | 20.6 | % | 20.6 | % | 14.2 | % | 3.0 | % | 42.7 | % | ||||||||||||||||
| Construction Products |
32,391 | 29,224 | 25,080 | 18.1 | 15.2 | 14.8 | 10.8 | 16.5 | ||||||||||||||||||||||||
| Tubular Products |
11,722 | 12,278 | 15,189 | 21.8 | 28.9 | 31.0 | (4.5 | ) | (19.2 | ) | ||||||||||||||||||||||
| LIFO income |
738 | 37 | 1,118 | 0.1 | — | 0.2 | ** | (96.7 | ) | |||||||||||||||||||||||
| Other |
(495 | ) | (586 | ) | (1,651 | ) | (0.1 | ) | (0.1 | ) | (0.3 | ) | (15.5 | ) | (64.5 | ) | ||||||||||||||||
|
|
|
|
|
|
|
|
|
|
|
|
|
|
|
|
|
|||||||||||||||||
| Total gross profit |
$ | 121,591 | $ | 115,939 | $ | 92,269 | 20.0 | % | 19.4 | % | 15.7 | % | 4.9 | % | 25.7 | % | ||||||||||||||||
|
|
|
|
|
|
|
|||||||||||||||||||||||||||
| Twelve Months Ended December 31, |
Percent of Total Net Sales Twelve Months Ended December 31, |
Percent Increase/(Decrease) |
||||||||||||||||||||||||||||||
| 2014 | 2013 | 2012 | 2014 | 2013 | 2012 | 2014 vs. 2013 | 2013 vs. 2012 | |||||||||||||||||||||||||
| Expenses: |
||||||||||||||||||||||||||||||||
| Selling and administrative expenses |
$ | 79,814 | $ | 71,256 | $ | 66,651 | 13.1 | % | 11.9 | % | 11.3 | % | 12.0 | % | 6.9 | % | ||||||||||||||||
| Amortization expense |
4,695 | 3,112 | 2,961 | 0.8 | 0.5 | 0.5 | 50.9 | 5.1 | ||||||||||||||||||||||||
| Interest expense |
512 | 485 | 542 | 0.1 | 0.1 | 0.1 | 5.6 | (10.5 | ) | |||||||||||||||||||||||
| Interest income |
(530 | ) | (659 | ) | (452 | ) | (0.1 | ) | (0.1 | ) | (0.1 | ) | (19.6 | ) | 45.8 | |||||||||||||||||
| Equity in income of nonconsolidated investments |
(1,282 | ) | (1,316 | ) | (837 | ) | (0.2 | ) | (0.2 | ) | (0.1 | ) | (2.6 | ) | 57.2 | |||||||||||||||||
| Other income |
(674 | ) | (1,054 | ) | (426 | ) | (0.1 | ) | (0.2 | ) | (0.1 | ) | (36.1 | ) | ** | |||||||||||||||||
|
|
|
|
|
|
|
|
|
|
|
|
|
|
|
|
|
|||||||||||||||||
| Total expenses |
$ | 82,535 | $ | 71,824 | $ | 68,439 | 13.6 | % | 12.0 | % | 11.6 | % | 14.9 | % | 4.9 | % | ||||||||||||||||
|
|
|
|
|
|
|
|||||||||||||||||||||||||||
| Income from continuing operations before income taxes |
$ | 39,056 | $ | 44,115 | $ | 23,830 | 6.4 | % | 7.4 | % | 4.0 | % | (11.5 | )% | 85.1 | % | ||||||||||||||||
| Income tax expense |
13,402 | 14,839 | 9,066 | 2.2 | 2.5 | 1.5 | (9.7 | ) | 63.7 | |||||||||||||||||||||||
|
|
|
|
|
|
|
|
|
|
|
|
|
|
|
|
|
|||||||||||||||||
| Income from continuing operations |
$ | 25,654 | $ | 29,276 | $ | 14,764 | 4.2 | % | 4.9 | % | 2.5 | % | (12.4 | )% | 98.3 | % | ||||||||||||||||
|
|
|
|
|
|
|
|||||||||||||||||||||||||||
** Results of calculation are not considered meaningful for presentation purposes.
28
Table of Contents
The Year 2014 Compared to the Year 2013 — Company Analysis
Net sales for the year increased by $9,229, or 1.5%, which was attributable to a 26.3% and 3.0% improvement in Tubular and Rail Products segment sales, respectively, partially offset by 6.7% reduction in Construction Products sales. Approximately 1.8%, 0.8% and 0.1% of the sales related to revenues from acquired businesses within the Tubular, Construction and Rail Products segments, respectively.
The gross profit margin for 2014 was 20.0% compared to 19.4% in the prior year period. Excluding the current year warranty charges, the Company would have generated a gross profit margin of 21.6%.
Selling and administrative costs increased $8,558, or 12.0%, compared to the prior year. Current year increases were due to a variety of business developments including a sizeable increase to employee headcount. Excluding current year acquisitions, the Company headcount increased by approximately 6.3% over the prior year. The increase impacted personnel related costs associated with salaried headcount and travel. Additionally, the Company incurred costs in 2014 related to the preparation for and identification of a new enterprise resource planning system. Lastly, acquisition related cost increases of $2,058 as well as recurring selling and administrative costs related to businesses acquired in the current year impacted the increase.
Other income for the twelve months ended 2014 decreased to $674 compared to $1,054 during 2013. The decrease related principally to a prior year recovery of escrowed funds related to a 2005 real estate transaction which was previously written off as uncollectible.
The Company’s effective income tax rate from continuing operations for 2014 was 34.3%, compared to 33.6% in the prior year. The increase in the Company’s effective tax rate was due to increased nondeductible acquisition-related expenses in the current year and the recognition of uncertain state tax positions during the prior year, offset by greater U.S. domestic production activities deductions and a more favorable global mix of income.
Income from continuing operations for 2014 was $25,654, or $2.48 per diluted share, which compares to income from continuing operations for 2013 of $29,276, or $2.85 per diluted share. Included in our 2014 results were $9,374 in pre-tax charges related to concrete ties manufactured at our former Grand Island, NE facility which was closed in January 2011.
The Year 2013 Compared to the Year 2012 — Company Analysis
Net sales for 2013 increased by $9,422, or 1.6%, which was attributable to a 13.3% improvement in Construction Product segment sales, partially offset by 1.8% and 13.1% reductions in Rail Products and Tubular Products sales, respectively.
The gross profit margin for 2013 was 19.4% compared to 15.7% in 2012. Excluding the 2012 warranty charge, the Company would have generated a gross profit margin of 19.4%.
Selling and administrative costs increased $4,605, or 6.9%, over the 2012 period primarily due to increases in personnel related costs associated with salaried headcount and travel partially offset by a reduction in concrete tie testing costs.
Other income for the twelve months ended 2013 increased to $1,054 compared to $426 during 2012. The increase related to fluctuations in realized foreign currency transaction gains in the current year compared to losses in 2012 as well as the recovery of escrowed funds related to a 2005 real estate transaction which was previously written off as uncollectible.
The effective income tax rate from continuing operations for 2013 was 33.6% compared to 38.0% in the prior year. The 2013 income tax rate from continuing operations was favorably impacted by the resolution of certain state income tax matters while the 2012 rate was negatively affected by certain discrete tax items and their pronounced impact on comparatively lower pretax income in 2012.
Income from continuing operations for 2013 was $29,276, or $2.85 per diluted share, which compares to income from continuing operations for 2012 of $14,764, or $1.44 per diluted share. Included in the 2012 results were charges related to concrete ties manufactured at our Grand Island, NE facility of $22,000.
29
Table of Contents
Results of Continuing Operations — Segment Analysis
Rail Products
| Twelve Months
Ended December 31, |
Increase | (Decrease) /Increase |
Percent Increase |
Percent (Decrease) /Increase |
||||||||||||||||||||||||
| 2014 | 2013 | 2012 | 2014 vs. 2013 | 2013 vs. 2012 | 2014 vs. 2013 | 2013 vs. 2012 | ||||||||||||||||||||||
| Net Sales |
$ | 374,615 | $ | 363,667 | $ | 370,322 | $ | 10,948 | $ | (6,655 | ) | 3.0 | % | (1.8 | )% | |||||||||||||
|
|
|
|
|
|
|
|
|
|
|
|
|
|
|
|||||||||||||||
| Gross Profit |
$ | 77,235 | $ | 74,986 | $ | 52,533 | $ | 2,249 | $ | 22,453 | 3.0 | % | 42.7 | % | ||||||||||||||
|
|
|
|
|
|
|
|
|
|
|
|
|
|
|
|||||||||||||||
| Gross Profit Percentage |
20.6 | % | 20.6 | % | 14.2 | % | — | % | 6.4 | % | — | % | 45.1 | % | ||||||||||||||
|
|
|
|
|
|
|
|
|
|
|
|
|
|
|
|||||||||||||||
The Year 2014 Compared to the Year 2013
Rail Products sales increased $10,948, or 3.0%, compared to the prior year. The 2014 performance was highlighted by significant sales growth within the Rail Technologies business and to a lesser extent increases within the Allegheny Rail Products and CXT Concrete Tie businesses. Partially offsetting these improvements were declines in the Rail Distribution and Transit Products businesses.
Compared to the prior year, the Rail Products segment generated a 7.1% increase in new orders.
During 2014, the Rail segment incurred $9,374 in warranty charges related to our former Grand Island, NE concrete tie facility. The charge adversely impacted our Rail Products segment gross profit. Without the charge, Rail Products’ gross profit margins would have been 23.1% for the period ended December 31, 2014. The profit increase largely relates to favorable sales mix.
The Year 2013 Compared to the Year 2012
The 2013 sales results reflect a year in which a number of product lines had an excellent year, but the growth was more than offset by expected declines in other product lines. Transit products, Allegheny Rail Products, and friction management products all saw nice improvement year over year. The largest increase related to the Transit Products business. During 2013, Transit products benefitted from the Honolulu, HI elevated transit system project awarded during 2012. Reductions related to CXT concrete ties, rail distribution, and track components products drove the overall results in declining sales. Lower sales volume in CXT ties was planned as a result of the volume of warranty ties that consumed customer attention in 2013. Rail Technologies sales in the U.K. had a positive impact on sales results in 2013.
During 2012, warranty charges totaling $22,000 related to our former Grand Island, NE concrete tie facility adversely impacted our Rail Products segment gross profit. Without these charges, Rail Products’ gross profit margins would have been 20.1% for the period ended December 31, 2012.
Construction Products
| Twelve Months Ended December 31, |
(Decrease) Increase |
Increase | Percent (Decrease) /Increase |
Percent Increase |
||||||||||||||||||||||||
| 2014 | 2013 | 2012 | 2014 vs. 2013 | 2013 vs. 2012 | 2014 vs. 2013 | 2013 vs. 2012 | ||||||||||||||||||||||
| Net Sales |
$ | 178,847 | $ | 191,751 | $ | 169,253 | $ | (12,904 | ) | $ | 22,498 | (6.7 | )% | 13.3 | % | |||||||||||||
|
|
|
|
|
|
|
|
|
|
|
|
|
|
|
|||||||||||||||
| Gross Profit |
$ | 32,391 | $ | 29,224 | $ | 25,080 | $ | 3,167 | $ | 4,144 | 10.8 | % | 16.5 | % | ||||||||||||||
|
|
|
|
|
|
|
|
|
|
|
|
|
|
|
|||||||||||||||
| Gross Profit Percentage |
18.1 | % | 15.2 | % | 14.8 | % | 2.9 | % | 0.4 | % | 19.1 | % | 2.7 | % | ||||||||||||||
|
|
|
|
|
|
|
|
|
|
|
|
|
|
|
|||||||||||||||
30
Table of Contents
The Year 2014 Compared to the Year 2013
Construction Products segment sales declined by $12,904, or 6.7%, compared to the prior period. The reduction was driven by a 20.8% reduction in Piling Product sales which was partially offset by significant growth in the Fabricated Bridge Products business as well as revenues from the July 2014 acquisition of Carr Concrete. The Piling shortfall was partially attributable to insufficient product supply which caused the segment to be unable to meet demand levels during much of the year. During 2014, the Fabricated Bridge business experienced a record year and generated $8,800 in revenues related to the Newburgh-Beacon bridge project compared to $4,360 in the prior year. The project is expected to be completed during 2015.
Including orders from Carr Concrete, the Construction Products segment generated an increase in new orders of 3.5% during 2014.
Leverage from engineered product sales created a favorable sales mix within the segment leading to a 287 basis point improvement over the prior year.
The Year 2013 Compared to the Year 2012
During 2013, sales increases of $22,498, or 13.3%, related to stronger demand within our Piling Products business and increased sales within our buildings business which was partially offset by reduced Fabricated Bridge sales. The pace of piling orders and sales was slow to start 2013, but ended with a much improved second half helping to contribute to the 13.3% overall increase. Concrete buildings turned in similar results as a slow start in the first half of 2013 led to a full year in which sales grew at nearly a double digit pace. The outlook for concrete buildings in early 2013 was hampered by uncertainty in government spending, only to finish the year with state spending making up for federal spending shortfalls. The Fabricated Bridge business was expected to decline as the operations started 2013 with lower backlog as key projects were approaching to completion. At the same time, order input activity saw some of the strongest activity in recent years resulting in an increase in backlog to start 2014.
Volume related sales increases in Piling Products along with solid project management helped improve gross profit margins. The concrete buildings business made significant progress in productivity while managing new growth opportunities. The combined efforts in these two product areas led to enhanced profitability of 40 basis points in gross profit in 2013 compared to the prior year results.
Tubular Products
| Twelve Months Ended December 31, |
Increase / (Decrease) |
Decrease | Percent Increase/ (Decrease) |
Percent Decrease |
||||||||||||||||||||||||
| 2014 | 2013 | 2012 | 2014 vs. 2013 | 2013 vs. 2012 | 2014 vs. 2013 | 2013 vs. 2012 | ||||||||||||||||||||||
| Net Sales |
$ | 53,730 | $ | 42,545 | $ | 48,966 | $ | 11,185 | $ | (6,421 | ) | 26.3 | % | (13.1 | )% | |||||||||||||
|
|
|
|
|
|
|
|
|
|
|
|
|
|
|
|||||||||||||||
| Gross Profit |
$ | 11,722 | $ | 12,278 | $ | 15,189 | $ | (556 | ) | $ | (2,911 | ) | (4.5 | )% | (19.2 | )% | ||||||||||||
|
|
|
|
|
|
|
|
|
|
|
|
|
|
|
|||||||||||||||
| Gross Profit Percentage |
21.8 | % | 28.9 | % | 31.0 | % | (7.1 | )% | (2.1 | )% | (24.6 | )% | (6.8 | )% | ||||||||||||||
|
|
|
|
|
|
|
|
|
|
|
|
|
|
|
|||||||||||||||
The Year 2014 Compared to the Year 2013
Tubular Products segment sales increased $11,185, or 26.3% compared to the prior year period. The increase was principally due to a full year of sales from Ball Winch which was acquired in November 2013. Adding to the improvement was a 6.2% increase in sales from the Birmingham, AL coated products business.
Compared to the prior year, the Tubular Products segment generated an increase in new orders of 31.2%. New orders from the 2013 acquisition of Ball Winch represented 23.7% of current year orders.
Gross profit declines of 705 basis points were attributable to cost overruns on a Coated Products project completed during the 2014 third quarter as well as the impact of a three week plant shutdown in Birmingham, AL. The shutdown was completed in January 2015.
31
Table of Contents
The Year 2013 Compared to the Year 2012
The Threaded products business turned in another year of positive growth and new customer acquisition. However, we experienced order delays from Coated Products customers reacting to changing market conditions that led to a $6,421 reduction in 2013 sales compared to the prior year period. Although our threaded business was not impacted by the market uncertainty, our coated facility in Birmingham, AL entered the second half of 2013 with significantly reduced backlog levels compared to the prior year. We are accustomed to responding to rapidly changing order patterns in the energy market, and as a result, we utilized the lower production period to enhance our facilities in an effort to prepare for anticipated growth.
Gross profit declined at a rate lower than anticipated given the rapid change in volume. The decline was largely attributed to overhead costs in place for a year in which we expected similar volume to the prior year.
32
Table of Contents
Liquidity and Capital Resources
Total debt at December 31, 2014 and 2013 was $26,428 and $56, respectively, and was comprised of proceeds from the revolving credit facility as well as assets funded through financing agreements.
Our need for liquidity relates primarily to working capital requirements for continuing operating activities, debt service payments, capital expenditures, JV capital obligations, strategic acquisitions or alliances, share repurchases, and dividends.
The following table summarizes the impact of these items:
| December 31, | ||||||||||||
| 2014 | 2013 | 2012 | ||||||||||
| Liquidity needs: |
||||||||||||
| Working capital and other assets and liabilities |
$ | 29,259 | $ | (29,964 | ) | $ | 2,900 | |||||
| Capital expenditures |
(17,056 | ) | (9,674 | ) | (7,160 | ) | ||||||
| Capital contributions to equity method investments |
(82 | ) | — | — | ||||||||
| Other long-term debt repayments |
(125 | ) | (6 | ) | (2,373 | ) | ||||||
| Financing costs paid |
(473 | ) | — | — | ||||||||
| Treasury stock acquisitions |
(985 | ) | (708 | ) | (669 | ) | ||||||
| Dividends paid to common shareholders |
(1,345 | ) | (1,240 | ) | (1,029 | ) | ||||||
| Acquisitions, net of cash acquired |
(80,797 | ) | (37,500 | ) | — | |||||||
| Cash interest paid |
(362 | ) | (330 | ) | (405 | ) | ||||||
|
|
|
|
|
|
|
|||||||
| Net liquidity needs |
(71,966 | ) | (79,422 | ) | (8,736 | ) | ||||||
|
|
|
|
|
|
|
|||||||
| Liquidity sources: |
||||||||||||
| Internally generated cash flows before interest paid |
37,089 | 43,616 | 24,464 | |||||||||
| Dividends from LB Pipe & Coupling Products, LLC |
630 | 558 | — | |||||||||
| Proceeds from asset sales |
184 | — | 24 | |||||||||
| Equity transactions |
467 | 238 | 321 | |||||||||
| Other long-term debt proceeds |
24,516 | — | — | |||||||||
| Foreign exchange effects |
(3,642 | ) | (2,106 | ) | 940 | |||||||
|
|
|
|
|
|
|
|||||||
| Net liquidity sources |
59,244 | 42,306 | 25,749 | |||||||||
|
|
|
|
|
|
|
|||||||
| Discontinued operations |
123 | 275 | 10,724 | |||||||||
|
|
|
|
|
|
|
|||||||
| Net Change in Cash |
$ | (12,599 | ) | $ | (36,841 | ) | $ | 27,737 | ||||
|
|
|
|
|
|
|
|||||||
Cash Flow from Continuing Operating Activities
During 2014, cash provided by continuing operating activities was $66,616 compared to $13,880 in 2013. During 2014, income, adjustments to income from continuing operating activities, and dividends from the joint venture provided $37,357 compared to providing $43,844 in 2013. Working capital and other assets and liabilities provided $29,259 in 2014 compared to working capital and other assets and liabilities use of $29,964 in 2013. The significant increase in cash flows primarily relates to additional emphasis on working capital management throughout 2014.
The Company’s calculation for days sales outstanding at December 31, 2014 was 50 days compared to 52 days at December 31, 2013 and we believe our receivable portfolio continues to be strong.
During 2013, cash provided by continuing operating activities was $13,880 compared to $26,959 in 2012. During 2013, income, adjustments to income from continuing operating activities and dividends from the joint venture provided $43,844 compared to providing $24,059 in 2012. Working capital and other assets and liabilities used $29,964 in 2013 compared to working capital and other assets and liabilities providing $2,900 in 2012. Cash payments for taxes and changes in working capital, including warranty replacements, were the primary drivers of the 2013 reductions.
33
Table of Contents
Cash Flow from Continuing Investing Activities
The primary investing activity in 2014 related to a cash use of $80,302 for the acquisitions of Chemtec, Carr Concrete, and FWO as well a $495 working capital distribution related to the 2013 acquisition of Ball Winch. Capital expenditures of $17,056 related to improvements to our machinery and equipment across each segment, strategic land acquisitions to increase production capacity, leasehold improvements, and plant upgrades at our Birmingham, AL facility. We anticipate 2015 capital expenditures to be in the $18,000 - $22,000 range.
The primary investing activity in 2013 related to the $37,500 acquisition of assets from Ball Winch. Capital expenditures of $9,674 related to improvements to our machinery and equipment across each segment, leasehold improvements, and plant upgrades at our Birmingham, AL facility. The 2012 capital expenditures were primarily used for our Burnaby, British Columbia, Canada Rail Technologies facility, moving into our new threaded products facility in Magnolia, TX, and other yard and plant upgrades.
Cash Flow from Continuing Financing Activities
As a result of additional financing needs during the fourth quarter of 2014, the primary financing activity related to the receipt of proceeds from our revolving credit facility of $24,200. Additionally, we paid dividends of $0.04 per share during the fourth quarter of 2014 and $0.03 per share during each of the prior three quarters of 2014. During 2013, we paid quarterly dividends of $0.03 per share. We did not purchase any common shares of the Company under the share repurchase authorization in 2014 or 2013, however, the Company withheld 21,676 and 16,166 shares to pay employee withholding taxes in connection with the vesting of restricted stock awards for approximately $985 and $708, respectively.
We paid quarterly dividends of $0.03 and $0.025 per share in 2013 and 2012, respectively. During 2013 and 2012, we did not purchase any common shares of the Company under the share repurchase authorization, however, the Company withheld 16,166 and 23,562 shares for approximately $708 and $669 respectively, from employees to pay their withholding taxes in connection with the exercise and/or vesting of stock options and restricted stock awards.
Financial Condition
As of December 31, 2014, we had $52,024 in cash and cash equivalents and credit facilities with $175,375 of availability. We believe this capacity will afford us the flexibility to take advantage of opportunities as we explore both organic and external growth opportunities. As of December 31, 2014, we were in compliance with all of our credit agreements’ covenants.
Our priority remains the preservation of our principal cash balances while investing our funds in a manner to maximize returns and maintain liquidity while seeking the highest yield available. Approximately $49,233 of our cash and cash equivalents is held in non-domestic bank accounts, and is not available to fund domestic operations unless repatriated. It is management’s intent to indefinitely reinvest such funds outside of the United States. The Company utilized non-domestic funds totaling approximately $27,600 for the acquisitions of FWO and Tew in October 2014 and January 2015, respectively. The Company is continuing to explore foreign acquisition opportunities and expects to utilize these non-domestic cash accounts to fund any such acquisitions.
Borrowings under the Amended Credit Agreement will bear interest at rates based upon either the base rate or Euro-rate plus applicable margins. Applicable margins are dictated by the ratio of the Company’s indebtedness less cash on hand to the Company’s consolidated EBITDA, as defined in the underlying Amended Credit Agreement. The base rate is the highest of (a) PNC Bank’s prime rate, (b) the Federal Funds Rate plus 0.50% or (c) the daily Euro-rate (as defined in the Amended Credit Agreement) plus 1.00%. The base rate and Euro-rate spreads range from 0.00% to 1.00% and 1.00% to 2.00%, respectively.
The Amended Credit Agreement includes two financial covenants: (a) Leverage Ratio, defined as the Company’s indebtedness less cash on hand, in excess of $15,000, divided by the Company’s consolidated EBITDA, which must not exceed 3.25 to 1.00 and (b) Minimum Interest Coverage, defined as consolidated EBITDA less capital expenditures divided by consolidated interest expense, which must be no less than 3.00 to 1.00.
34
Table of Contents
The Amended Credit Agreement permits the Company to pay dividends, distributions, and make redemptions with respect to its stock provided no event of default or potential default (as defined in the Amended Credit Agreement) has occurred prior to or after giving effect to the dividend, distribution, or redemption. Dividends, distributions, and redemptions are capped at $25,000 per year when funds are drawn on the facility. If no drawings on the facility exist, dividends, distributions, and redemptions in excess of $25,000 per year are subjected to a limitation of $75,000 in the aggregate. The $75,000 aggregate limitation also permits certain loans, investments, and acquisitions.
Other restrictions exist at all times including, but not limited to, limitation of the Company’s sale of assets, other indebtedness incurred by either the borrowers or the non-borrower subsidiaries of the Company, guarantees, and liens.
As of December 31, 2014, the Company was in compliance with the Amended Credit Agreement’s covenants.
Tabular Disclosure of Contractual Obligations
A summary of the Company’s required payments under financial instruments and other commitments at December 31, 2014 are presented in the following table:
| Total | Less than 1 year |
1-3 years |
4-5 years |
More than 5 years |
||||||||||||||||
| Contractual Cash Obligations |
||||||||||||||||||||
| Revolving credit facility (1) |
$ | 24,200 | $ | — | $ | — | $ | 24,200 | $ | — | ||||||||||
| Interest |
3,874 | 808 | 1,653 | 1,413 | — | |||||||||||||||
| Other debt |
2,228 | 676 | 1,474 | 78 | — | |||||||||||||||
| Pension plan contributions |
280 | 280 | — | — | — | |||||||||||||||
| Operating leases |
17,108 | 2,512 | 3,659 | 3,119 | 7,818 | |||||||||||||||
| Purchase obligations not reflected in the financial statements |
44,499 | 44,499 | — | — | — | |||||||||||||||
|
|
|
|
|
|
|
|
|
|
|
|||||||||||
| Total contractual cash obligations |
$ | 92,189 | $ | 48,775 | $ | 6,786 | $ | 28,810 | $ | 7,818 | ||||||||||
|
|
|
|
|
|
|
|
|
|
|
|||||||||||
| Other Financial Commitments |
||||||||||||||||||||
| Standby letters of credit |
$ | 425 | $ | 425 | $ | — | $ | — | $ | — | ||||||||||
|
|
|
|
|
|
|
|
|
|
|
|||||||||||
| (1) | Repayments of outstanding loan balances are disclosed in Note 11 of the “Notes to Consolidated Financial Statements” included in Part II, Item 8 of this report. |
Other long-term liabilities include items such as income taxes which are not contractual obligations by nature. The Company cannot estimate the settlement years for these items and has excluded them from the above table.
Management believes its internal and external sources of funds are adequate to meet anticipated needs, including those disclosed above, for the foreseeable future.
Off Balance Sheet Arrangements
The Company’s off-balance sheet arrangements include the operating leases, purchase obligations, and standby letters of credit disclosed within the contractual obligations table above in the “Liquidity and Capital Resources” section. These arrangements provide the Company with increased flexibility relative to the utilization and investment of cash resources.
Outlook
Market conditions for 2015 are expected to differ between the businesses that serve the transportation infrastructure market and those that serve the energy infrastructure. Transportation infrastructure spending is expected
35
Table of Contents
to have a favorable market environment. In particular, the rail industry, which is our primary market, continues to forecast increases in capital spending from freight railroads and ongoing expansion of transit networks in the United States and United Kingdom. Capital spending is expected to favor capacity expansions to support the growing “crude-by-rail” activity, as well as intermodal network capacity. The freight rails are also investing in hardening the track infrastructure and methods for improving velocity and throughput across their systems. These are all favorable trends for the markets that L.B. Foster serves.
The energy markets have an uncertain outlook as many companies make adjustments in spending in reaction to declining oil prices. While L.B. Foster primarily serves the midstream markets today which are typically less impacted by the price of oil, we expect to see more widespread unfavorable impact as a result of the overall environment. Most end users in the energy markets have already reduced operating and capital spending forecasts for 2015. Although we anticipate reduced spending in all energy markets in 2015 and into 2016, these markets remain attractive to L.B. Foster on a long term basis.
Our construction businesses, which are primarily driven by transportation infrastructure spending are forecasting market conditions that are on par with 2014. Specifically, we will see fewer sales in our Fabricated Bridge business as their backlog entering the year is lower than prior year, and we are in the process of completing the Newburgh-Beacon bridge project. There is opportunity for increases in Piling sales to offset this expected decline, and our concrete products businesses are expected to improve as a result of benefits from the July 7, 2014 Carr Concrete acquisition.
In addition to the current market dynamics within each of our business segments, the ongoing concrete tie warranty dispute with the UPRR may impact our sales and profitability within certain divisions of the Company in the event that there is a reduction in UPRR orders.
The Company is also completing some significant projects in 2015 associated with the modernization of facilities in Birmingham, AL and Niles, OH. These programs are intended to improve operational efficiency, increase capacity, and lower costs for the Coated Products and rail businesses they serve. Throughout 2014 the Company expanded operations in Bedford, PA as part of its initiative to enter the corrugated bridge form market.
As part of the Company’s strategic plan, a more aggressive acquisition program is supporting our objectives to seek growth in existing and adjacent markets. In 2015, we will focus on the opportunities presented by four recently completed acquisitions. Tew in the United Kingdom brings opportunities in automated solutions primarily for rail and transportation industry customers. FWO in Germany expands our expertise in friction management solutions for the rail industry and expands market coverage into the German transit market. Chemtec will allow us to expand the products and solutions we offer to midstream market operators with highly engineered metering and custody transfer systems. Lastly, Carr extends our precast concrete buildings presence into the eastern United States and creates new precast products for the transportation market. Each of these companies supports our strategic growth initiatives and brings valuable talent and market access necessary to succeed.
The Company plans to enter into the second phase of its Enterprise Resource Planning (ERP) modernization project in 2015. This phase will begin the application development related to the implementation of software configuration and process re-engineering that will start with a few divisions of our business. The program will eventually support all operating units of L.B. Foster and is expected to yield operational benefits and customer service improvements. The expected 2015 ERP related costs include approximately $7,000 of the 2015 capital expenditure budget.
Although backlog is not necessarily indicative of future operating results, total Company backlog at December 31, 2014 was $184,350. The following table provides the backlog by business segment:
| Backlog | ||||||||||||
| December 31, 2014 |
December 31, 2013 |
December 31, 2012 |
||||||||||
| Rail Products |
$ | 104,821 | $ | 121,853 | $ | 140,592 | ||||||
| Construction Products |
65,843 | 53,483 | 59,239 | |||||||||
| Tubular Products |
13,686 | 7,775 | 11,087 | |||||||||
|
|
|
|
|
|
|
|||||||
| Total Backlog from Continuing Operations |
$ | 184,350 | $ | 183,111 | $ | 210,918 | ||||||
|
|
|
|
|
|
|
|||||||
36
Table of Contents
While a considerable portion of the Company’s business is somewhat backlog driven, the Rail Technologies business is less sensitive to backlog at any given time. Backlog related to 2014 acquisitions represented 6% of the total.
Critical Accounting Policies and Estimates
The Company’s significant accounting policies are described in Part II, Item 8, Note 1 to the Consolidated Financial Statements. The accompanying consolidated financial statements have been prepared in conformity with accounting principles generally accepted in the United States. When more than one accounting principle, or the method of its application, is generally accepted, management selects the principle or method that is appropriate in the Company’s specific circumstance. Application of these accounting principles requires management to make estimates that affect the reported amount of assets, liabilities, revenues, and expenses, and the related disclosure of contingent assets and liabilities. The following critical accounting policies relate to the Company’s more significant judgments and estimates used in the preparation of its consolidated financial statements. There can be no assurance that actual results will not differ from those estimates.
Goodwill and Intangible Assets — We account for acquired businesses using the acquisition method of accounting, which requires that the assets acquired and liabilities assumed be recorded at the date of acquisition at their respective estimated fair values. The cost to acquire a business is allocated to the underlying net assets of the acquired business based on estimates of their respective fair values. Intangible assets are amortized over the expected life of the asset. Any excess of the purchase price over the estimated fair values of the net assets acquired is recorded as goodwill. The judgments made in determining the estimated fair value assigned to each class of assets acquired and liabilities assumed, as well as asset lives, can materially impact our results of operations. Fair values and useful lives are determined based on, among other factors, the expected future period of benefit of the asset, the various characteristics of the asset, and projected cash flows. Because this process involves management making estimates with respect to future revenues and market conditions and because these estimates also form the basis for the determination of whether or not an impairment charge should be recorded, these estimates are considered to be critical accounting estimates.
Goodwill is required to be tested for impairment at least annually. The Company performs its annual impairment test as of October 1st or more frequently when indicators of impairment are present. The goodwill impairment test involves comparing the fair value of a reporting unit to its carrying value, including goodwill. If the carrying amount of the reporting unit exceeds its fair value, a second step is required to measure the goodwill impairment loss. This step compares the implied fair value of the reporting unit’s goodwill to the carrying amount of that goodwill. If the carrying amount of the goodwill exceeds the implied fair value of the goodwill, an impairment loss equal to the excess is recorded as a component of continuing operations. The Company uses a combination of market approach and a discounted cash flow model (DCF model) to determine the current fair value of the reporting unit. A number of significant assumptions and estimates are involved in the application of the DCF model to forecast operating cash flows, including markets and market share, sales volume and pricing, costs to produce, and working capital changes. The Company considers historical experience and available information at the time the fair values of its business are estimated. However, actual amounts realized may differ from those used to evaluate the impairment of goodwill. If actual results are not consistent with our assumptions and judgments used in estimating future cash flows and asset fair values, the Company may be exposed to impairment losses that could be material to our results of operations. There were no goodwill impairments recorded during the three years ended December 31, 2014.
Asset Impairment — The Company is required to test for asset impairment whenever events or changes in circumstances indicate that the carrying value of an asset might not be recoverable. The applicable guidance requires that, if the sum of the future expected cash flows associated with an asset, undiscounted and without interest charges, is less than the carrying value, an asset impairment must be recognized in the financial statements. The amount of the impairment is the difference between the fair value of the asset and the carrying value of the asset. The accounting estimate related to asset impairment is highly susceptible to change from period to period and because it requires management to make assumptions about the existence of impairment indicators and cash flows over future years. These assumptions impact the amount of an impairment, which would have an impact on the income statement. There were no material asset impairments recorded during the three years ended December 31, 2014.
37
Table of Contents
Product Warranty — The Company maintains a current warranty for the repair or replacement of defective products. For certain manufactured products, an accrual is made on a monthly basis as a percentage of cost of sales. For long-term construction projects, a product warranty accrual is established when the claim is known and quantifiable. The product warranty accrual is periodically adjusted based on the identification or resolution of known individual product warranty claims. The underlying assumptions used to calculate the product warranty accrual can change from period to period and are dependent upon estimates of the amount and cost of future product repairs or replacements. At December 31, 2014 and 2013, the product warranty reserve was $11,500 and $7,483, respectively. During the years ended December 31, 2014, 2013, and 2012, the Company recorded product warranty expense of $10,957, $1,695 and $24,252, respectively. For additional information regarding the Company’s product warranty, refer to Part II, Item 8, Note 20 to the Consolidated Financial Statements, “Commitments and Contingent Liabilities” included herein.
Contingencies — The preparation of consolidated financial statements requires us to make estimates and assumptions that affect the reported amounts of assets and liabilities and the disclosure of contingent assets and liabilities as of the date of the consolidated financial statements, and also affect the amounts of revenues and expenses reported for each period.
In the ordinary course of business, various legal and regulatory claims and proceedings are pending or threatened against the Company. When a probable, estimable exposure exists, the Company accrues the estimate of the probable costs for the resolution of these matters. These estimates have been developed in consultation with legal counsel involved in the defense of these matters and are based upon an analysis of potential results, assuming a combination of litigation and settlement strategies. Future results of operations could be materially affected by changes in our assumptions or the outcome of these proceedings.
The Company’s operations are subject to national, state, foreign, and/or local laws and regulations that impose limitations and prohibitions on the discharge and emission of, and establish standards for the use, disposal, and management of, regulated materials and waste. These regulations impose liability for the costs of investigation, remediation, and damages resulting from, present and past spills, disposals, or other releases of hazardous substances or materials. Liabilities are recorded when remediation efforts are probable and the costs can be reasonably estimated. Estimates are not reduced by potential claims for recovery. Claims for recovery are recognized as agreements are reached with third parties or as amounts are received. Established reserves are periodically reviewed and adjusted to reflect current remediation progress, prospective estimates of required activity, and other factors that may be relevant, including changes in technology or regulations.
Refer to Part II, Item 8, Note 20 to the Consolidated Financial Statements, “Commitments and Contingent Liabilities” for additional information regarding the Company’s commitments and contingent liabilities.
Revenue Recognition — The Company’s revenues are comprised of product sales as well as products and services provided under long-term contracts. For product sales, the Company recognizes revenue when the following criteria have been satisfied; persuasive evidence of a sales arrangement exists, product delivery and transfer of title to the customer has occurred, the price is fixed or determinable, and collectability is reasonably assured. Within each segment, title generally passes to the customer upon shipment. In limited cases, title does not transfer and revenue is not recognized until the customer has received the products at its physical location. Revenue is recorded net of returns, allowances, customer discounts, and incentives. Sales taxes collected from customers and remitted to governmental authorities are accounted for on a net (excluded from revenues) basis. Shipping and handling costs are included in cost of goods sold.
Revenues for products under long-term contracts are generally recognized using the percentage-of-completion method. Sales and gross profit are recognized as work is performed based upon the proportion of actual costs incurred to estimated total project costs. Sales and gross profit are adjusted prospectively for revisions in estimated total project costs and contract values. For certain products, the percentage of completion is based upon actual labor costs as a percentage of estimated total labor costs. At the time a loss contract becomes known, the entire amount of the estimated loss is recognized in the Consolidated Statement of Operations. Revenues recognized using percentage of completion are not material relative to the Company’s consolidated revenues.
38
Table of Contents
Revenue recognition involves judgments, including assessments of expected returns, the likelihood of nonpayment and estimates of expected costs and profits on long-term contracts. In determining when to recognize revenue, we analyze various factors, including the specifics of the transaction, historical experience, creditworthiness of the customer, and current market and economic conditions. Changes in judgments on these factors could impact the timing and amount of revenue recognized with a resulting impact on the timing and amount of associated income.
Pension Plans — The calculation of the Company’s net periodic benefit cost (pension expense) and benefit obligation (pension liability) associated with its defined benefit pension plans (pension plans) requires the use of a number of assumptions that the Company deems to be critical accounting estimates. Changes in these assumptions can result in a different pension expense and liability amounts, and future actual experience can differ significantly from the assumptions. During 2014, the Company adjusted its mortality assumption by adopting the Society of Actuaries updated RP-2014 mortality tables. The Company believes that the two most critical assumptions are the expected long-term rate of return on plan assets and the assumed discount rate.
The expected long-term rate of return reflects the average rate of earnings expected on funds invested or to be invested in the pension plans to provide for the benefits included in the pension liability. The Company establishes the expected long-term rate of return at the beginning of each fiscal year based upon information available to the Company at that time, including the plan’s investment mix and the forecasted rates of return on these types of securities. Any differences between actual experience and assumed experience are deferred as an unrecognized actuarial gain or loss. The unrecognized actuarial gains or losses are amortized in accordance with applicable accounting guidance.
The weighted average expected long-term rate of return determined by the Company for its 2015 and 2014 domestic pension expense was 5.50% and 6.50%, respectively. The weighted average expected long-term rate of return determined by the Company for its 2015 and 2014 U.K. pension expense was 5.00% and 5.80%, respectively. Pension expense increases as the expected long-term rate of return decreases.
The assumed discount rate reflects the current rate at which the pension benefits could effectively be settled. In estimating that rate, applicable guidance requires the Company utilize rates of return on high quality, fixed income investments. The Company’s pension liability increases as the discount rate is reduced. Therefore, a decline in the assumed discount rate has the effect of increasing the Company’s pension obligation and future pension expense. The weighted average assumed discount rate used by the Company was 4.00% and 4.90%, respectively, as of December 31, 2014 and 2013 for its domestic pension plans. The weighted average assumed discount rate used by the Company was 3.60% and 4.60%, as of December 31, 2014 and 2013 for its U.K. pension plan.
Income Taxes — The recognition of deferred tax assets requires management to make judgments regarding the future realization of these assets. As prescribed by FASB ASC 740, “Income Taxes,” valuation allowances must be provided for those deferred tax assets for which it is more likely than not (a likelihood of more than 50%) that some portion or all of the deferred tax assets will not be realized. This guidance requires management to evaluate positive and negative evidence regarding the recoverability of deferred tax assets. Determination of whether the positive evidence outweighs the negative evidence and quantification of the valuation allowance requires management to make estimates and judgments of future financial results.
The Company evaluates all tax positions taken on its federal, state, and foreign tax filings to determine if the position is more likely than not to be sustained upon examination. For positions that meet the more likely than not to be sustained criteria, the largest amount of benefit to be realized upon ultimate settlement is determined on a cumulative probability basis. A previously recognized tax position is derecognized when it is subsequently determined that a tax position no longer meets the more likely than not threshold to be sustained. The evaluation of the sustainability of a tax position and the expected tax benefit is based on judgment, historical experience, and various other assumptions. Actual results could differ from those estimates upon subsequent resolution of identified matters.
The Company’s income tax rate is significantly affected by the tax rate on global operations. In addition to local country tax laws and regulations, this rate depends on the extent earnings are indefinitely reinvested outside the United States. Indefinite reinvestment is determined by management’s judgment about and intentions
39
Table of Contents
concerning the future operations of the Company. We do not intend to repatriate these earnings to fund U.S. operations. Should we decide to repatriate the foreign earnings, the Company would have to accrue income and withholding taxes in the period in which it is determined that the earnings will no longer be indefinitely invested outside the United States.
Refer to Part II, Item 8, Note 15, “Income Taxes” included herein for additional information regarding the Company’s deferred tax assets. The Company’s ability to realize these tax benefits may affect the Company’s reported income tax expense and net income.
ITEM 7A. QUANTITATIVE AND QUALITATIVE DISCLOSURES ABOUT MARKET RISK
Interest Rate Risk
In the ordinary course of business, the Company is exposed to interest rate risks that may adversely affect funding costs associated with its variable-rate debt. The Company does not purchase or hold any derivative financial instruments for trading purposes and the Company did not have any interest rate derivatives as of December 31, 2014, 2013 or 2012.
Foreign Currency Exchange Rate Risk
The Company is subject to exposures to changes in foreign currency exchange rates. The Company may manage its exposure to changes in foreign currency exchange rates on firm sale and purchase commitments by entering into foreign currency forward contracts. The Company’s risk management objective is to reduce its exposure to the effects of changes in exchange rates on these transactions over the duration of the transactions. The Company did not engage in significant foreign currency hedging transactions during the three-year period ended December 31, 2014, and no foreign currency hedges were outstanding as of December 31, 2014. Realized gains or losses from foreign currency hedges did not exceed $100 in any of the three years ended December 31, 2014.
40
Table of Contents
| ITEM 8. | FINANCIAL STATEMENTS AND SUPPLEMENTARY DATA |
Report of Independent Registered Public Accounting Firm
The Board of Directors and Stockholders of L.B. Foster Company and Subsidiaries
We have audited the accompanying consolidated balance sheets of L. B. Foster Company and Subsidiaries as of December 31, 2014 and 2013, and the related consolidated statements of operations, comprehensive income, stockholders’ equity and cash flows for each of the three years in the period ended December 31, 2014. Our audits also included the financial statement schedule listed in the Index at Item 15(a)(2). These financial statements and schedule are the responsibility of the Company’s management. Our responsibility is to express an opinion on these financial statements and schedule based on our audits.
We conducted our audits in accordance with the standards of the Public Company Accounting Oversight Board (United States). Those standards require that we plan and perform the audit to obtain reasonable assurance about whether the financial statements are free of material misstatement. An audit includes examining, on a test basis, evidence supporting the amounts and disclosures in the financial statements. An audit also includes assessing the accounting principles used and significant estimates made by management, as well as evaluating the overall financial statement presentation. We believe that our audits provide a reasonable basis for our opinion.
In our opinion, the financial statements referred to above present fairly, in all material respects, the consolidated financial position of L. B. Foster Company and Subsidiaries at December 31, 2014 and 2013, and the consolidated results of their operations and their cash flows for each of the three years in the period ended December 31, 2014, in conformity with U.S. generally accepted accounting principles. Also, in our opinion, the related financial statement schedule, when considered in relation to the basic financial statements taken as a whole, presents fairly in all material respects the information set forth therein.
We also have audited, in accordance with the standards of the Public Company Accounting Oversight Board (United States), L. B. Foster Company and Subsidiaries’ internal control over financial reporting as of December 31, 2014, based on criteria established in Internal Control-Integrated Framework issued by the Committee of Sponsoring Organizations of the Treadway Commission (2013 framework) and our report dated March 3, 2015, expressed an unqualified opinion thereon.
/s/ Ernst & Young LLP
Pittsburgh, Pennsylvania
March 3, 2015
41
Table of Contents
L. B. FOSTER COMPANY AND SUBSIDIARIES
CONSOLIDATED BALANCE SHEETS
DECEMBER 31,
| 2014 | 2013 | |||||||
| (In thousands, except share data) |
||||||||
| ASSETS |
| |||||||
| Current assets: |
||||||||
| Cash and cash equivalents |
$ | 52,024 | $ | 64,623 | ||||
| Accounts receivable — net |
90,178 | 98,437 | ||||||
| Inventories — net |
95,089 | 76,956 | ||||||
| Current deferred tax assets |
3,497 | 461 | ||||||
| Prepaid income tax |
2,790 | 4,741 | ||||||
| Other current assets |
4,101 | 2,000 | ||||||
| Current assets of discontinued operations |
— | 149 | ||||||
|
|
|
|
|
|||||
| Total current assets |
247,679 | 247,367 | ||||||
| Property, plant, and equipment — net |
74,802 | 50,109 | ||||||
| Other assets: |
||||||||
| Goodwill |
82,949 | 57,781 | ||||||
| Other intangibles — net |
82,134 | 51,846 | ||||||
| Investments |
5,824 | 5,090 | ||||||
| Other assets |
1,733 | 1,461 | ||||||
|
|
|
|
|
|||||
| Total Assets |
$ | 495,121 | $ | 413,654 | ||||
|
|
|
|
|
|||||
| LIABILITIES AND STOCKHOLDERS’ EQUITY |
| |||||||
| Current liabilities: |
||||||||
| Accounts payable |
$ | 67,166 | $ | 46,620 | ||||
| Deferred revenue |
8,034 | 5,715 | ||||||
| Accrued payroll and employee benefits |
13,419 | 8,927 | ||||||
| Accrued warranty |
11,500 | 7,483 | ||||||
| Current maturities of long-term debt |
676 | 31 | ||||||
| Current deferred tax liabilities |
77 | 179 | ||||||
| Other accrued liabilities |
7,899 | 6,501 | ||||||
| Liabilities of discontinued operations |
— | 26 | ||||||
|
|
|
|
|
|||||
| Total current liabilities |
108,771 | 75,482 | ||||||
| Long-term debt |
25,752 | 25 | ||||||
| Deferred tax liabilities |
10,945 | 11,798 | ||||||
| Other long-term liabilities |
13,765 | 9,952 | ||||||
| Stockholders’ equity: |
||||||||
| Common stock, par value $.01, authorized 20,000,000 shares; shares issued at December 31, 2014 and December 31, 2013, 11,115,779; shares outstanding at December 31, 2014 and December 31, 2013, 10,242,405 and 10,188,521, respectively |
111 | 111 | ||||||
| Paid-in capital |
48,115 | 47,239 | ||||||
| Retained earnings |
322,672 | 298,361 | ||||||
| Treasury stock — at cost, common stock, shares at December 31, 2014 and December 31, 2013, 873,374 and 927,258, respectively |
(23,118 | ) | (24,731 | ) | ||||
| Accumulated other comprehensive loss |
(11,892 | ) | (4,583 | ) | ||||
|
|
|
|
|
|||||
| Total stockholders’ equity |
335,888 | 316,397 | ||||||
|
|
|
|
|
|||||
| TOTAL LIABILITIES AND STOCKHOLDERS’ EQUITY |
$ | 495,121 | $ | 413,654 | ||||
|
|
|
|
|
|||||
The accompanying notes are an integral part of these Consolidated Financial Statements.
42
Table of Contents
L. B. FOSTER COMPANY AND SUBSIDIARIES
CONSOLIDATED STATEMENTS OF OPERATIONS FOR
THE THREE YEARS ENDED DECEMBER 31,
| 2014 | 2013 | 2012 | ||||||||||
| (In thousands, except share data) | ||||||||||||
| Net sales |
$ | 607,192 | $ | 597,963 | $ | 588,541 | ||||||
| Cost of goods sold |
485,601 | 482,024 | 496,272 | |||||||||
|
|
|
|
|
|
|
|||||||
| Gross profit |
121,591 | 115,939 | 92,269 | |||||||||
| Selling and administrative expenses |
79,814 | 71,256 | 66,651 | |||||||||
| Amortization expense |
4,695 | 3,112 | 2,961 | |||||||||
| Interest expense |
512 | 485 | 542 | |||||||||
| Interest income |
(530 | ) | (659 | ) | (452 | ) | ||||||
| Equity in income of nonconsolidated investments |
(1,282 | ) | (1,316 | ) | (837 | ) | ||||||
| Other income |
(674 | ) | (1,054 | ) | (426 | ) | ||||||
|
|
|
|
|
|
|
|||||||
| 82,535 | 71,824 | 68,439 | ||||||||||
|
|
|
|
|
|
|
|||||||
| Income from continuing operations before income taxes |
39,056 | 44,115 | 23,830 | |||||||||
| Income tax expense |
13,402 | 14,839 | 9,066 | |||||||||
|
|
|
|
|
|
|
|||||||
| Income from continuing operations |
25,654 | 29,276 | 14,764 | |||||||||
|
|
|
|
|
|
|
|||||||
| Discontinued operations: |
||||||||||||
| Income from discontinued operations before income taxes |
4 | 23 | 3,842 | |||||||||
| Income tax expense |
2 | 9 | 2,418 | |||||||||
|
|
|
|
|
|
|
|||||||
| Income from discontinued operations |
2 | 14 | 1,424 | |||||||||
|
|
|
|
|
|
|
|||||||
| Net income |
$ | 25,656 | $ | 29,290 | $ | 16,188 | ||||||
|
|
|
|
|
|
|
|||||||
| Basic earnings per common share: |
||||||||||||
| From continuing operations |
$ | 2.51 | $ | 2.88 | $ | 1.46 | ||||||
| From discontinued operations |
0.00 | 0.00 | 0.14 | |||||||||
|
|
|
|
|
|
|
|||||||
| Basic earnings per common share |
$ | 2.51 | $ | 2.88 | $ | 1.60 | ||||||
|
|
|
|
|
|
|
|||||||
| Diluted earnings per common share: |
||||||||||||
| From continuing operations |
$ | 2.48 | $ | 2.85 | $ | 1.44 | ||||||
| From discontinued operations |
0.00 | 0.00 | 0.14 | |||||||||
|
|
|
|
|
|
|
|||||||
| Diluted earnings per common share |
$ | 2.48 | $ | 2.85 | $ | 1.58 | ||||||
|
|
|
|
|
|
|
|||||||
| Dividends paid per common share |
$ | 0.13 | $ | 0.12 | $ | 0.10 | ||||||
|
|
|
|
|
|
|
|||||||
The accompanying notes are an integral part of these Consolidated Financial Statements.
43
Table of Contents
L. B. FOSTER COMPANY AND SUBSIDIARIES
CONSOLIDATED STATEMENTS OF COMPREHENSIVE INCOME FOR
THE THREE YEARS ENDED DECEMBER 31,
| 2014 | 2013 | 2012 | ||||||||||
| (In thousands) | ||||||||||||
| Net income |
$ | 25,656 | $ | 29,290 | $ | 16,188 | ||||||
|
|
|
|
|
|
|
|||||||
| Other comprehensive (loss) income, net of tax: |
||||||||||||
| Foreign currency translation adjustment |
(4,863 | ) | (3,475 | ) | 1,724 | |||||||
| Pension and post-retirement benefit plans, net of tax (benefit) expense: ($1,383), $1,199, and ($481) |
(2,631 | ) | 2,258 | (1,043 | ) | |||||||
| Reclassification of pension liability adjustments to earnings, net of tax expense of $63, $134 and $125 * |
185 | 303 | 278 | |||||||||
|
|
|
|
|
|
|
|||||||
| Other comprehensive (loss) income, net of tax |
(7,309 | ) | (914 | ) | 959 | |||||||
|
|
|
|
|
|
|
|||||||
| Comprehensive income |
$ | 18,347 | $ | 28,376 | $ | 17,147 | ||||||
|
|
|
|
|
|
|
|||||||
| * | Reclassifications out of accumulated other comprehensive income for pension obligations are charged to selling and administrative expense. |
The accompanying notes are an integral part of these Consolidated Financial Statements.
44
Table of Contents
L.B. FOSTER COMPANY AND SUBSIDIARIES
CONSOLIDATED STATEMENTS OF CASH FLOWS FOR
THE THREE YEARS ENDED DECEMBER 31,
| 2014 | 2013 | 2012 | ||||||||||
| (In thousands) | ||||||||||||
| CASH FLOWS FROM OPERATING ACTIVITIES: |
||||||||||||
| Income from continuing operations |
$ | 25,654 | $ | 29,276 | $ | 14,764 | ||||||
| Adjustments to reconcile income from continuing operations to net cash provided by operating activities: |
||||||||||||
| Deferred income taxes |
(2,914 | ) | 3,244 | (4,563 | ) | |||||||
| Depreciation and amortization |
12,577 | 10,002 | 12,973 | |||||||||
| Equity in income of nonconsolidated investments |
(1,282 | ) | (1,316 | ) | (837 | ) | ||||||
| Loss on sales and disposals of property, plant, and equipment |
21 | 127 | 388 | |||||||||
| Deferred gain amortization on sale-leaseback |
— | — | (456 | ) | ||||||||
| Share-based compensation |
3,007 | 2,156 | 1,989 | |||||||||
| Excess income tax benefit from share-based compensation |
(336 | ) | (203 | ) | (199 | ) | ||||||
| Change in operating assets and liabilities, net of acquisitions: |
||||||||||||
| Accounts receivable |
15,188 | (37,057 | ) | 6,823 | ||||||||
| Inventories |
(9,872 | ) | 29,919 | (17,644 | ) | |||||||
| Other current assets |
(1,004 | ) | (310 | ) | (243 | ) | ||||||
| Prepaid income tax |
2,530 | (6,882 | ) | 4,339 | ||||||||
| Other noncurrent assets |
(386 | ) | 264 | (194 | ) | |||||||
| Dividends from LB Pipe & Coupling Products, LLC |
630 | 558 | — | |||||||||
| Accounts payable |
16,285 | (5,206 | ) | 1,241 | ||||||||
| Deferred revenue |
591 | (1,805 | ) | 1,467 | ||||||||
| Accrued payroll and employee benefits |
2,542 | (608 | ) | 75 | ||||||||
| Other current liabilities |
2,732 | (7,561 | ) | 6,655 | ||||||||
| Other liabilities |
653 | (718 | ) | 381 | ||||||||
|
|
|
|
|
|
|
|||||||
| Net cash provided by continuing operating activities |
66,616 | 13,880 | 26,959 | |||||||||
|
|
|
|
|
|
|
|||||||
| Net cash provided by discontinued operations |
123 | 275 | 176 | |||||||||
|
|
|
|
|
|
|
|||||||
| CASH FLOWS FROM INVESTING ACTIVITIES: |
||||||||||||
| Proceeds from the sale of property, plant, and equipment |
184 | — | 24 | |||||||||
| Capital expenditures on property, plant, and equipment |
(17,056 | ) | (9,674 | ) | (7,160 | ) | ||||||
| Acquisitions, net of cash acquired |
(80,797 | ) | (37,500 | ) | — | |||||||
| Capital contributions to equity method investments |
(82 | ) | — | — | ||||||||
|
|
|
|
|
|
|
|||||||
| Net cash used by continuing investing activities |
(97,751 | ) | (47,174 | ) | (7,136 | ) | ||||||
|
|
|
|
|
|
|
|||||||
| Net cash provided by discontinued operations |
— | — | 10,548 | |||||||||
|
|
|
|
|
|
|
|||||||
| CASH FLOWS FROM FINANCING ACTIVITIES: |
||||||||||||
| Repayments of long-term debt |
(125 | ) | (6 | ) | (2,373 | ) | ||||||
| Proceeds from long-term debt |
24,516 | — | — | |||||||||
| Proceeds from exercise of stock options and stock awards |
131 | 35 | 122 | |||||||||
| Financing fees |
(473 | ) | — | — | ||||||||
| Treasury stock acquisitions |
(985 | ) | (708 | ) | (669 | ) | ||||||
| Cash dividends on common stock paid to shareholders |
(1,345 | ) | (1,240 | ) | (1,029 | ) | ||||||
| Excess income tax benefit from share-based compensation |
336 | 203 | 199 | |||||||||
|
|
|
|
|
|
|
|||||||
| Net cash provided (used) by continuing financing activities |
22,055 | (1,716 | ) | (3,750 | ) | |||||||
|
|
|
|
|
|
|
|||||||
| Effect of exchange rate changes on cash and cash equivalents |
(3,642 | ) | (2,106 | ) | 940 | |||||||
|
|
|
|
|
|
|
|||||||
| Net (decrease) increase in cash and cash equivalents |
(12,599 | ) | (36,841 | ) | 27,737 | |||||||
| Cash and cash equivalents at beginning of period |
64,623 | 101,464 | 73,727 | |||||||||
|
|
|
|
|
|
|
|||||||
| Cash and cash equivalents at end of period |
$ | 52,024 | $ | 64,623 | $ | 101,464 | ||||||
|
|
|
|
|
|
|
|||||||
| Supplemental disclosure of cash flow information: |
||||||||||||
| Interest paid |
$ | 362 | $ | 330 | $ | 405 | ||||||
|
|
|
|
|
|
|
|||||||
| Income taxes paid |
$ | 14,617 | $ | 18,697 | $ | 11,999 | ||||||
|
|
|
|
|
|
|
|||||||
| Capital expenditures funded through financing agreements |
$ | 1,981 | $ | — | $ | — | ||||||
|
|
|
|
|
|
|
|||||||
The accompanying notes are an integral part of these Consolidated Financial Statements.
45
Table of Contents
L.B. FOSTER COMPANY AND SUBSIDIARIES
CONSOLIDATED STATEMENTS OF STOCKHOLDERS EQUITY
FOR THE THREE YEARS ENDED DECEMBER 31, 2014
| Accumulated | ||||||||||||||||||||||||
| Other | ||||||||||||||||||||||||
| Common | Paid-in | Retained | Treasury | Comprehensive | ||||||||||||||||||||
| Stock | Capital | Earnings | Stock | (Loss) Income | Total | |||||||||||||||||||
| (In thousands, except share data) | ||||||||||||||||||||||||
| Balance, January 1, 2012 |
$ | 111 | $ | 47,349 | $ | 255,152 | $ | (28,169 | ) | $ | (4,628 | ) | $ | 269,815 | ||||||||||
|
|
|
|
|
|
|
|
|
|
|
|
|
|||||||||||||
| Net income |
16,188 | 16,188 | ||||||||||||||||||||||
| Other comprehensive (loss) income net of tax: |
||||||||||||||||||||||||
| Pension liability adjustment |
(765 | ) | (765 | ) | ||||||||||||||||||||
| Foreign currency translation adjustment |
1,724 | 1,724 | ||||||||||||||||||||||
| Issuance of 75,995 Common shares, net of shares withheld for taxes |
(3,247 | ) | 2,701 | (546 | ) | |||||||||||||||||||
| Stock based compensation and related excess tax benefit |
2,188 | 2,188 | ||||||||||||||||||||||
| Cash dividends on common stock paid to shareholders |
(1,029 | ) | (1,029 | ) | ||||||||||||||||||||
|
|
|
|
|
|
|
|
|
|
|
|
|
|||||||||||||
| Balance, December 31, 2012 |
111 | 46,290 | 270,311 | (25,468 | ) | (3,669 | ) | 287,575 | ||||||||||||||||
|
|
|
|
|
|
|
|
|
|
|
|
|
|||||||||||||
| Net income |
29,290 | 29,290 | ||||||||||||||||||||||
| Other comprehensive income (loss) net of tax: |
||||||||||||||||||||||||
| Pension liability adjustment |
2,561 | 2,561 | ||||||||||||||||||||||
| Foreign currency translation adjustment |
(3,475 | ) | (3,475 | ) | ||||||||||||||||||||
| Issuance of 39,123 Common shares, net of shares withheld for taxes |
(1,410 | ) | 737 | (673 | ) | |||||||||||||||||||
| Stock based compensation and related excess tax benefit |
2,359 | 2,359 | ||||||||||||||||||||||
| Cash dividends on common stock paid to shareholders |
(1,240 | ) | (1,240 | ) | ||||||||||||||||||||
|
|
|
|
|
|
|
|
|
|
|
|
|
|||||||||||||
| Balance, December 31, 2013 |
111 | 47,239 | 298,361 | (24,731 | ) | (4,583 | ) | 316,397 | ||||||||||||||||
|
|
|
|
|
|
|
|
|
|
|
|
|
|||||||||||||
| Net income |
25,656 | 25,656 | ||||||||||||||||||||||
| Other comprehensive loss net of tax: |
||||||||||||||||||||||||
| Pension liability adjustment |
(2,446 | ) | (2,446 | ) | ||||||||||||||||||||
| Foreign currency translation adjustment |
(4,863 | ) | (4,863 | ) | ||||||||||||||||||||
| Issuance of 53,884 Common shares, net of shares withheld for taxes |
(2,467 | ) | 1,613 | (854 | ) | |||||||||||||||||||
| Stock based compensation and related excess tax benefit |
3,343 | 3,343 | ||||||||||||||||||||||
| Cash dividends on common stock paid to shareholders |
(1,345 | ) | (1,345 | ) | ||||||||||||||||||||
|
|
|
|
|
|
|
|
|
|
|
|
|
|||||||||||||
| Balance, December 31, 2014 |
$ | 111 | $ | 48,115 | $ | 322,672 | $ | (23,118 | ) | $ | (11,892 | ) | $ | 335,888 | ||||||||||
|
|
|
|
|
|
|
|
|
|
|
|
|
|||||||||||||
The accompanying notes are an integral part of these Consolidated Financial Statements.
46
Table of Contents
L.B. FOSTER COMPANY AND SUBSIDIARIES
NOTES TO CONSOLIDATED FINANCIAL STATEMENTS
Note 1.
(Dollars in thousands, except share data unless otherwise noted)
Summary of Significant Accounting Policies
Basis of financial statement presentation
The consolidated financial statements include the accounts of the Company and its wholly owned subsidiaries, ventures, and partnerships in which a controlling interest is held. Inter-company transactions and accounts have been eliminated. The Company utilizes the equity method of accounting for companies where its ownership is less than or equal to 50% and significant influence exists.
Cash and cash equivalents
The Company considers cash and other instruments with maturities of three months or less, when purchased, to be cash and cash equivalents. The Company invests available funds in a manner to maximize returns, preserve investment principle, and maintain liquidity while seeking the highest yield available.
Cash and cash equivalents held in non-domestic accounts was approximately $49,233 and $43,560 at December 31, 2014 and 2013, respectively. Included in non-domestic cash equivalents are investments in bank term deposits of approximately $25 and $32,947 at December 31, 2014 and 2013, respectively. The carrying amounts approximated fair value because of the short maturity of the instruments.
Domestic cash equivalents as of December 31, 2013 principally consisted of investments in money market funds and bank certificates of deposit. Invested cash of $18,276 was held in an actively traded BlackRock Liquidity Temporary Fund — Institutional account. This money market fund had various underlying securities all of which maintained AAA credit agency ratings. The carrying amount approximates fair value because of the short maturity of the instruments.
Inventories
Certain inventories are valued at the lower of the last-in, first-out (LIFO) cost or market. Approximately 44% in 2014 and 38% in 2013, of the Company’s inventory is valued at average cost or market, whichever is lower. Slow-moving inventory is reviewed and adjusted regularly, based upon product knowledge, physical inventory observation, and the age of the inventory.
Property, plant, and equipment
Maintenance, repairs, and minor renewals are charged to operations as incurred. Major renewals and betterments which substantially extend the useful life of the property are capitalized at cost. Upon sale or other disposition of assets, the costs and related accumulated depreciation and amortization are removed from the accounts and the resulting gain or loss, if any, is reflected in income.
Depreciation and amortization are provided on a straight-line basis over the estimated useful lives of 25 to 40 years for buildings and 3 to 10 years for machinery and equipment. Leasehold improvements are amortized over 2 to 14 years which represent the lives of the respective leases or the lives of the improvements, whichever is shorter. Depreciation expense is appropriately recorded within “costs of sales” and “selling and administrative” expenses based upon the assets’ use. The Company reviews long-lived assets for impairment whenever events or changes in circumstances indicate that the carrying amount of an asset may not be recoverable. The Company did not record any material asset impairment charges during 2014, 2013, or 2012.
Allowance for doubtful accounts
The allowance for doubtful accounts is recorded to reflect the ultimate realization of the Company’s accounts receivable and includes assessment of the probability of collection and the credit-worthiness of certain
47
Table of Contents
customers. Reserves for uncollectible accounts are recorded as part of selling and administrative expenses on the Consolidated Statements of Operations. The Company records a monthly provision for accounts receivable that are considered to be uncollectible. In order to calculate the appropriate monthly provision, the Company reviews its accounts receivable aging and calculates an allowance through application of historic reserve factors to overdue receivables. This calculation is supplemented by specific account reviews performed by the Company’s credit department. As necessary, the application of the Company’s allowance rates to specific customers are reviewed and adjusted to more accurately reflect the credit risk inherent within that customer relationship.
Investments
Investments in companies in which the Company has the ability to exert significant influence, but not control, over operating and financial policies (generally 20% to 50% ownership) are accounted for using the equity method. Under the equity method, investments are initially recorded at cost and adjusted for dividends and undistributed earnings and losses. The equity method of accounting requires a company to recognize a loss in the value of an equity method investment that is other than a temporary decline.
Goodwill and other intangible assets
Goodwill is tested annually for impairment or more often if there are indicators of impairment. The goodwill impairment test involves comparing the fair value of a reporting unit to its carrying value, including goodwill. If the carrying amount of the reporting unit exceeds its fair value, a second step is required to measure the goodwill impairment loss. This step compares the implied fair value of the reporting unit’s goodwill to the carrying amount of that goodwill. If the carrying amount of the goodwill exceeds the implied fair value of the goodwill, an impairment loss equal to the excess is recorded as a component of continuing operations. The Company performs its annual impairment tests as of October 1st. No goodwill impairment was recognized during 2014, 2013, or 2012.
The Company has no significant indefinite-lived intangible assets. All intangible assets are amortized over their useful lives ranging from 5 to 25 years, with a total weighted average amortization period of approximately 16 years, as of December 31, 2014.
See Note 5, “Goodwill and Other Intangible Assets,” for additional information including regarding the Company’s goodwill and other intangible assets.
Environmental remediation and compliance
Environmental remediation costs are accrued when the liability is probable and costs are estimable. Environmental compliance costs, which principally include the disposal of waste generated by routine operations, are expensed as incurred. Capitalized environmental costs, when appropriate, are depreciated over their useful life. Reserves are not reduced by potential claims for recovery. Claims for recovery are recognized as agreements are reached with third parties or as amounts are received. Reserves are periodically reviewed throughout the year and adjusted to reflect current remediation progress, prospective estimates of required activity, and other factors that may be relevant, including changes in technology or regulations. See Note 20, “Commitments and Contingent Liabilities,” for additional information regarding the Company’s outstanding environmental and litigation reserves.
Separately, the Company maintains liabilities for asset retirement obligations in conjunction with the leases of certain of our facilities. The obligations are included within “other long-term liabilities” and totaled $832 and $667 as of December 31, 2014 and 2013, respectively. The 2014 and 2013 activity related to settlements, revisions, and accretion expense was not material.
Earnings per share
Basic earnings per share is calculated by dividing net income by the weighted average of common shares outstanding during the year. Diluted earnings per share is calculated by using the weighted average of common shares outstanding adjusted to include the potentially dilutive effect of outstanding stock options and restricted stock utilizing the treasury stock method.
48
Table of Contents
Revenue recognition
The Company’s revenues are composed of product sales and products and services provided under long-term contracts. For product sales, the Company recognizes revenue when the following criteria have been satisfied; persuasive evidence of a sales arrangement exists, product delivery and transfer of title to the customer has occurred, the price is fixed or determinable, and collectability is reasonably assured. Within each segment, title generally passes to the customer upon shipment. In limited cases, title does not transfer and revenue is not recognized until the customer has received the products at its physical location. Revenue is recorded net of returns, allowances, customer discounts, and incentives. Sales taxes collected from customers and remitted to governmental authorities are accounted for on a net (excluded from revenues) basis. Shipping and handling costs are included in cost of goods sold.
Revenues for products under long-term contracts are generally recognized using the percentage-of-completion method based upon the proportion of actual costs incurred to estimated total costs. For certain products, the percentage of completion is based upon actual labor costs to estimated total labor costs. At the time a loss contract becomes known, the entire amount of the estimated loss is recognized in the Consolidated Statement of Operations. Revenues recognized using percentage of completion are not material relative to the Company’s consolidated revenues.
Costs in excess of billings are classified as work-in-process inventory. Projects with billings in excess of costs are recorded within deferred revenue.
Deferred revenue
Deferred revenue consists of customer payments received for which the revenue recognition criteria have not yet been met as well as billings in excess of costs on percentage of completion projects. Advanced payments from customers typically relate to contracts that the Company has significantly fulfilled its obligations and the customers have paid, but due to the Company’s continuing involvement with the material, revenue is precluded from being recognized until title, ownership, and risk of loss have passed to the customer.
Fair value of financial instruments
The Company’s financial instruments consist of cash equivalents, accounts receivable, accounts payable, and short-term and long-term debt.
The carrying amounts of the Company’s financial instruments at December 31, 2014 and 2013 approximate fair value. See Note 19, “Fair Value Measurements,” for additional information.
Use of estimates
The preparation of financial statements in conformity with U.S. generally accepted accounting principles requires management to make estimates and assumptions that affect the amounts reported in the financial statements and accompanying notes. Actual results could differ from those estimates.
Stock-based compensation
The Company applies the provisions of FASB ASC 718, “Compensation — Stock Compensation,” to account for the Company’s share-based compensation. Under the guidance, share-based compensation cost is measured at the grant date based on the calculated fair value of the award. The expense is recognized over the employees’ requisite service period, generally the vesting period of the award.
Product warranty
The Company maintains a current warranty liability for the repair or replacement of defective products. For certain manufactured products, an accrual is made on a monthly basis as a percentage of cost of sales. For long-term construction products, a warranty is established when the claim is known and quantifiable. The product warranty accrual is periodically adjusted based on the identification or resolution of known individual product
49
Table of Contents
warranty claims or due to changes in the Company’s historical warranty experience. At December 31, 2014 and 2013, the product warranty reserve was $11,500 and $7,483, respectively. See Note 20, “Commitments and Contingencies” for additional information regarding the product warranty.
Income taxes
Income taxes are accounted for under the asset and liability method. Deferred tax assets and liabilities are recognized for the future tax consequences attributable to differences between the financial statement carrying amounts of assets and liabilities and their respective tax bases. Deferred taxes are measured using enacted tax laws and rates expected to be in effect when such differences are recovered or settled. The effect of a change in tax rates on deferred taxes is recognized in income in the period that includes the enactment date of the change.
The Company makes judgments regarding the recognition of deferred tax assets and the future realization of these assets. As prescribed by FASB ASC 740 “Income Taxes” and applicable guidance, valuation allowances must be provided for those deferred tax assets for which it is more likely than not (a likelihood more than 50%) that some portion or all of the deferred tax assets will not be realized. The guidance requires the Company to evaluate positive and negative evidence regarding the recoverability of deferred tax assets. Determination of whether the positive evidence outweighs the negative evidence and quantification of the valuation allowance requires the Company to make estimates and judgments of future financial results.
The Company evaluates all tax positions taken on its federal, state, and foreign tax filings to determine if the position is more likely than not to be sustained upon examination. For positions that meet the more likely than not to be sustained criteria, the largest amount of benefit to be realized upon ultimate settlement is determined on a cumulative probability basis. A previously recognized tax position is derecognized when it is subsequently determined that a tax position no longer meets the more likely than not threshold to be sustained. The evaluation of the sustainability of a tax position and the expected tax benefit is based on judgment, historical experience, and various other assumptions. Actual results could differ from those estimates upon subsequent resolution of identified matters. The Company accrues interest and penalties related to unrecognized tax benefits in its provision for income taxes.
Foreign currency translation
The assets and liabilities of our foreign subsidiaries are measured using the local currency as the functional currency and are translated into U.S. dollars at exchange rates as of the balance sheet date. Income statement amounts are translated at the weighted-average rates of exchange during the year. The translation adjustment is accumulated as a separate component of accumulated other comprehensive income (loss). Foreign currency transaction gains and losses are included in determining net income. Included in net income for the years ended December 31, 2014, 2013, and 2012 were foreign currency transaction gains of approximately $422 and $433 and losses of $238, respectively.
Research and development
The Company expenses research and development costs as costs are incurred. For the years ended December 31, 2014, 2013, and 2012, research and development expenses were $3,096, $3,154, and $2,926, respectively, and were principally related to the Company’s friction management and railroad monitoring system products.
Reclassifications
Certain accounts in the prior year consolidated financial statements have been reclassified for comparative purposes principally to conform to the presentation in the current year period.
Subsequent events
On January 13, 2015, the Company acquired the stock of Tew Holdings, LTD (Tew) for approximately $26,600, subject to a net debt and net working capital adjustment. Headquartered in Nottingham, UK, Tew provides application engineering solutions primarily to the rail market and other major industries. The transaction was funded with non-domestic cash and the results of Tew’s operations will be included within the Rail Products segment.
50
Table of Contents
We have evaluated all other subsequent events through the date the financial statements were issued. No material recognized subsequent events were identified and all material non-recognizable subsequent events have been disclosed.
Recently adopted accounting guidance
In April 2014, the Financial Accounting Standards Board (FASB) issued Accounting Standards Update No. 2014-08 (ASU 2014-08) “Presentation of Financial Statements (Topic 205) and Property, Plant, and Equipment (Topic 360): Reporting Discontinued Operations and Disclosures of Disposals of Components of an Entity.” ASU 2014-08 raises the threshold for a disposal to qualify as a discontinued operation and requires new disclosures of both discontinued operations and certain other disposals that do not meet the definition of a discontinued operation. It is effective for annual periods beginning on or after December 15, 2014. Early adoption is permitted but only for disposals that have not been reported in financial statements previously issued. We do not expect the impact of the adoption of ASU 2014-08 to be material to our consolidated financial statements.
In May 2014, the Financial Accounting Standards Board (“FASB”) issued Accounting Standard Update (“ASU”) 2014-09, “Revenue from Contracts with Customers (Topic 606),” (“ASU 2014-09”), which supersedes the revenue recognition requirements in Accounting Standards Codification 605, “Revenue Recognition.” ASU 2014-09 is based on the principle that revenue is recognized to depict the transfer of goods or services to customers in an amount that reflects the consideration to which the entity expects to be entitled in exchange for those goods or services. It also requires additional disclosure about the nature, amount, timing, and uncertainty of revenue and cash flows arising from customer contracts, including significant judgments and changes in judgments and assets recognized from costs incurred to obtain or fulfill a contract. ASU 2014-09 is effective for fiscal years beginning after December 15, 2016, including interim periods within that reporting period. The Company is currently evaluating its implementation approach and assessing the impact of ASU 2014-09 on our financial position and results of operations.
In August 2014, the FASB issued ASU 2014-15, “Presentation of Financial Statements — Going Concern — Disclosures of Uncertainties about an entity’s Ability to Continue as a Going Concern.” ASU 2014-15 provides new guidance related to management’s responsibility to evaluate whether there is substantial doubt about an entity’s ability to continue as a going concern by incorporating and expanding upon certain principles that are currently in U.S. auditing standards and to provide related footnote disclosures. This new guidance is effective for the annual period ending after December 15, 2016, and for annual periods and interim periods thereafter. The requirements of ASU 2014-15 are not expected to have a significant impact on the consolidated financial statements.
Note 2.
Business Segments
The Company is a leading manufacturer, fabricator, and distributor of products and services for rail, construction, energy, and utility markets. The Company is organized and evaluated by product group, which is the basis for identifying reportable segments. Each segment represents a revenue-producing component of the Company for which separate financial information is produced internally and is subject to evaluation by the Company’s chief operating decision maker in deciding how to allocate resources. Each segment is evaluated based upon their contribution to the Company’s consolidated results based upon segment profit.
The Company markets its products directly in all major industrial areas of the United States, Canada, and Europe, primarily through an internal sales force.
The Company’s Rail Products segment provides a full line of new and used rail, trackwork, and accessories to railroads, mines, and industry. The Rail segment also designs and produces concrete railroad ties, insulated rail joints, power rail, track fasteners, coverboards, and special accessories for mass transit and other rail systems. In addition, the Rail Products segment engineers, manufactures, and assembles friction management products and railway wayside data collection and management systems.
The Company’s Construction Products segment sells and rents steel sheet piling, H-bearing pile, and other piling products for foundation and earth retention requirements. The Company’s Fabricated Products division
51
Table of Contents
sells bridge decking, bridge railing, structural steel fabrications, expansion joints, bridge forms, and other products for highway construction and repair. The concrete products businesses produce precast concrete buildings and a variety of specialty precast concrete products.
The Company’s Tubular Products segment supplies pipe coatings for natural gas pipelines and utilities, blending, injection, and metering equipment for the oil and gas market, and produces threaded pipe products for industrial water well and irrigation markets.
The following table illustrates net sales, profits, assets, depreciation/amortization, and expenditures for long-lived assets of the Company by segment from continuing operations. Segment profit is the earnings from continuing operations before income taxes and includes internal cost of capital charges for net assets used in the segment at a rate of generally 1% per month. The internal cost of capital charges are eliminated during the consolidation process. The accounting policies of the reportable segments are the same as those described in the summary of significant accounting policies except that the Company accounts for inventory on a First-In, First-Out (FIFO) basis at the segment level compared to a Last-In, First-Out (LIFO) basis at the consolidated level.
| 2014 | ||||||||||||||||||||
| Expenditures | ||||||||||||||||||||
| Net | Segment | Segment | Depreciation/ | for Long-Lived | ||||||||||||||||
| Sales | Profit | Assets | Amortization | Assets | ||||||||||||||||
| Rail Products |
$ | 374,615 | $ | 30,093 | $ | 239,951 | $ | 6,153 | $ | 5,115 | ||||||||||
| Construction Products |
178,847 | 13,106 | 102,978 | 2,232 | 3,343 | |||||||||||||||
| Tubular Products |
53,730 | 5,350 | 130,289 | 3,208 | 6,988 | |||||||||||||||
|
|
|
|
|
|
|
|
|
|
|
|||||||||||
| Total |
$ | 607,192 | $ | 48,549 | $ | 473,218 | $ | 11,593 | $ | 15,446 | ||||||||||
|
|
|
|
|
|
|
|
|
|
|
|||||||||||
| 2013 | ||||||||||||||||||||
| Expenditures | ||||||||||||||||||||
| Net | Segment | Segment | Depreciation/ | for Long-Lived | ||||||||||||||||
| Sales | Profit | Assets | Amortization | Assets | ||||||||||||||||
| Rail Products |
$ | 363,667 | $ | 28,692 | $ | 252,049 | $ | 6,505 | $ | 3,383 | ||||||||||
| Construction Products |
191,751 | 10,206 | 77,900 | 1,758 | 1,805 | |||||||||||||||
| Tubular Products |
42,545 | 9,208 | 51,497 | 1,054 | 2,460 | |||||||||||||||
|
|
|
|
|
|
|
|
|
|
|
|||||||||||
| Total |
$ | 597,963 | $ | 48,106 | $ | 381,446 | $ | 9,317 | $ | 7,648 | ||||||||||
|
|
|
|
|
|
|
|
|
|
|
|||||||||||
| 2012 | ||||||||||||||||||||
| Expenditures | ||||||||||||||||||||
| Net | Segment | Segment | Depreciation/ | for Long-Lived | ||||||||||||||||
| Sales | Profit | Assets | Amortization | Assets | ||||||||||||||||
| Rail Products |
$ | 370,322 | $ | 9,074 | $ | 243,072 | $ | 9,736 | $ | 4,180 | ||||||||||
| Construction Products |
169,253 | 7,859 | 73,804 | 2,119 | 474 | |||||||||||||||
| Tubular Products |
48,966 | 12,854 | 13,573 | 599 | 1,350 | |||||||||||||||
|
|
|
|
|
|
|
|
|
|
|
|||||||||||
| Total |
$ | 588,541 | $ | 29,787 | $ | 330,449 | $ | 12,454 | $ | 6,004 | ||||||||||
|
|
|
|
|
|
|
|
|
|
|
|||||||||||
During 2014, 2013, and 2012, no single customer accounted for more than 10% of the Company’s consolidated net sales. Sales between segments are immaterial.
52
Table of Contents
Reconciliations of reportable segment net sales, profits, assets, depreciation/amortization, and expenditures for long-lived assets from continuing operations to the Company’s consolidated totals from continuing operations are illustrated as follows:
| 2014 | 2013 | 2012 | ||||||||||
| Income from Continuing Operations: |
||||||||||||
| Total for reportable segments |
$ | 48,549 | $ | 48,106 | $ | 29,787 | ||||||
| Adjustment of inventory to LIFO |
738 | 37 | 1,118 | |||||||||
| Unallocated interest income |
530 | 659 | 452 | |||||||||
| Unallocated equity in income of nonconsolidated investments |
1,282 | 1,316 | 837 | |||||||||
| Unallocated corporate amounts |
(12,043 | ) | (6,003 | ) | (8,364 | ) | ||||||
|
|
|
|
|
|
|
|||||||
| Income from continuing operations, before income taxes |
$ | 39,056 | $ | 44,115 | $ | 23,830 | ||||||
|
|
|
|
|
|
|
|||||||
| Assets: |
||||||||||||
| Total for reportable segments |
$ | 473,218 | $ | 381,446 | $ | 330,449 | ||||||
| Unallocated corporate assets |
30,192 | 41,235 | 84,737 | |||||||||
| LIFO |
(8,289 | ) | (9,027 | ) | (9,064 | ) | ||||||
|
|
|
|
|
|
|
|||||||
| Total assets |
$ | 495,121 | $ | 413,654 | $ | 406,122 | ||||||
|
|
|
|
|
|
|
|||||||
| Depreciation/Amortization: |
||||||||||||
| Total for reportable segments |
$ | 11,593 | $ | 9,317 | $ | 12,454 | ||||||
| Other |
984 | 685 | 519 | |||||||||
|
|
|
|
|
|
|
|||||||
| Total |
$ | 12,577 | $ | 10,002 | $ | 12,973 | ||||||
|
|
|
|
|
|
|
|||||||
| Expenditures for Long-Lived Assets: |
||||||||||||
| Total for reportable segments |
$ | 15,446 | $ | 7,648 | $ | 6,004 | ||||||
| Expenditures funded through financing agreements |
1,981 | — | — | |||||||||
| Other expenditures |
1,610 | 2,026 | 1,156 | |||||||||
|
|
|
|
|
|
|
|||||||
| Total |
$ | 19,037 | $ | 9,674 | $ | 7,160 | ||||||
|
|
|
|
|
|
|
|||||||
The following table summarizes the Company’s sales from continuing operations by major geographic region in which the Company has operations:
| 2014 | 2013 | 2012 | ||||||||||
| United States |
$ | 498,025 | $ | 495,710 | $ | 485,111 | ||||||
| Canada |
39,375 | 37,290 | 40,892 | |||||||||
| United Kingdom |
22,625 | 16,548 | 18,698 | |||||||||
| Other |
47,167 | 48,415 | 43,840 | |||||||||
|
|
|
|
|
|
|
|||||||
| $ | 607,192 | $ | 597,963 | $ | 588,541 | |||||||
|
|
|
|
|
|
|
|||||||
The following table summarizes the Company’s long-lived assets from continuing operations by geographic region:
| 2014 | 2013 | 2012 | ||||||||||
| United States |
$ | 66,905 | $ | 40,717 | $ | 31,961 | ||||||
| Canada |
7,440 | 8,833 | 9,773 | |||||||||
| Europe |
457 | 559 | 599 | |||||||||
|
|
|
|
|
|
|
|||||||
| $ | 74,802 | $ | 50,109 | $ | 42,333 | |||||||
|
|
|
|
|
|
|
|||||||
53
Table of Contents
The following table summarizes the Company’s sales by major product line from continuing operations:
| 2014 | 2013 | 2012 | ||||||||||
| Rail distribution products |
$ | 139,529 | $ | 144,911 | $ | 155,832 | ||||||
| Piling products |
111,182 | 140,302 | 114,070 | |||||||||
| Rail Technologies products |
109,053 | 88,670 | 92,826 | |||||||||
| CXT concrete tie products |
52,562 | 44,108 | 58,182 | |||||||||
| Allegheny Rail Products |
45,008 | 36,666 | 33,046 | |||||||||
| Concrete products |
36,396 | 32,969 | 30,195 | |||||||||
| Other products |
113,462 | 110,337 | 104,390 | |||||||||
|
|
|
|
|
|
|
|||||||
| $ | 607,192 | $ | 597,963 | $ | 588,541 | |||||||
|
|
|
|
|
|
|
|||||||
Note 3.
Acquisitions
Chemtec Energy Services, L.L.C.
On December 30, 2014, the Company acquired Chemtec Energy Services, L.L.C. (Chemtec) for $66,719, net of cash received, which is inclusive of an estimated $1,867 related to working capital adjustments. The cash payment included $5,000 which will be held in escrow to satisfy any indemnity claims under the purchase agreement. Chemtec is a manufacturer and turnkey provider of blending, injection, and metering equipment for the oil and gas industry. The acquired business is included within our Tubular Products segment from the acquisition date through December 31, 2014, and was not material to the periods presented.
FWO
On October 29, 2014, the Company acquired FWO, a business of Balfour Beatty Rail GmbH for $1,103, net of a $161 post-closing working capital receivable adjustment. FWO is engaged in the electronic track lubrication and maintenance business and has been included in our Rail Products segment for the period October 29 through December 31, 2014. FWO was not material to the periods presented.
Carr Concrete
On July 7, 2014, the Company acquired Carr Concrete Corporation (Carr) for $12,480, inclusive of a $189 post-closing purchase price adjustment. Carr is a provider of pre-stressed and precast concrete products located in Waverly, WV and the transaction was funded with cash on hand. Included within the purchase price is $1,000 which will be held in escrow to satisfy any indemnity claims under the purchase agreement. The results of Carr’s operations for the period July 7, 2014 through December 31, 2014 are included in our Construction Products segment and were not material to the periods presented.
Ball Winch
During 2013, the Company acquired Ball Winch, LLC (Ball Winch). Cash payments totaling $37,500 were made during 2013 and a post-closing working capital adjustment of $495 was paid in February 2014 resulting in a total purchase price of $37,995. Included within the purchase price was $3,300 which is held in escrow to satisfy any indemnity claims under the purchase agreement. The results of operations for Ball Winch are included in the Company’s Tubular Products segment.
Acquisition Summary
Each transaction was accounted for under the acquisition method of accounting under U.S. generally accepted accounting principles which requires an acquiring entity to recognize, with limited exceptions, all of the assets acquired and liabilities assumed in a transaction at fair value as of the acquisition date. Goodwill primarily represented the value paid for each acquisition’s enhancement of the Company’s service offerings and capabilities as well as a premium payment related to the right to control the acquired assets. The Company has concluded that intangible assets and goodwill values resulting from these transactions will be deductible for tax purposes.
54
Table of Contents
The Company incurred $2,240 and $182 of acquisition-related costs which are included in the results of operations within selling and administrative costs for the years ended December 31, 2014 and 2013.
The following table summarizes the preliminary estimated fair values of the assets acquired and liabilities assumed at the date of the acquisition:
| Allocation of Purchase Price |
December 30, 2014 - Chemtec |
October 29, 2014 - FWO |
July 7, 2014 - Carr |
November 7, 2013 - Ball Winch |
||||||||||||
| Current assets |
$ | 15,528 | $ | 131 | $ | 3,180 | $ | 1,857 | ||||||||
| Other assets |
— | — | 45 | 64 | ||||||||||||
| Property, plant, and equipment |
4,705 | — | 7,648 | 5,555 | ||||||||||||
| Goodwill |
22,302 | 971 | 1,936 | 16,544 | ||||||||||||
| Other intangibles |
33,130 | 419 | 1,348 | 14,682 | ||||||||||||
| Current liabilities |
(6,756 | ) | (418 | ) | (1,677 | ) | (707 | ) | ||||||||
|
|
|
|
|
|
|
|
|
|||||||||
| Total |
$ | 68,909 | $ | 1,103 | $ | 12,480 | $ | 37,995 | ||||||||
|
|
|
|
|
|
|
|
|
|||||||||
The following table summarizes the preliminary estimates of the fair values and amortizable lives of the identifiable intangible assets acquired in 2014:
| Intangible Asset |
December 30, 2014 - Chemtec |
October 29, 2014 - FWO |
July 7, 2014 - Carr |
November 7, 2013 - Ball Winch |
||||||||||||
| Trade name |
$ | 3,149 | $ | — | $ | 613 | $ | 723 | ||||||||
| Customer relationships |
23,934 | 34 | 524 | — | ||||||||||||
| Technology |
4,930 | 341 | 87 | 11,129 | ||||||||||||
| Non-competition agreements |
1,117 | 44 | 124 | 2,830 | ||||||||||||
|
|
|
|
|
|
|
|
|
|||||||||
| Total identified intangible assets |
$ | 33,130 | $ | 419 | $ | 1,348 | $ | 14,682 | ||||||||
|
|
|
|
|
|
|
|
|
|||||||||
The purchase price allocations for Chemtec, FWO, and Carr are based on preliminary valuations. If new information is obtained about facts and circumstances that existed as of the acquisition date that, if known, would have affected the measurement recognized for assets or liabilities assumed, the Company will retrospectively adjust the amounts recognized as of the acquisition date. Intangible asset values for the 2013 acquisition of Ball Winch were finalized during 2014.
Note 4.
Discontinued Operations
On June 4, 2012, the Company sold substantially all of the assets and liabilities of its railway securement business, Shipping Systems Division (SSD), for $8,579, resulting in a pre-tax gain of approximately $3,508.
On August 30, 2012, the Company sold substantially all of the assets and liabilities of its precise structural products business (Precise), for $2,643, resulting in a pre-tax loss of approximately $315.
The operations of these divisions qualified as a “component of an entity” under FASB ASC 205-20, “Presentation of Financial Statements — Discontinued Operations”. The operations are classified as discontinued for all periods presented. Future expenses of discontinued operations are not expected to be material. SSD and Precise were previously reported in the Rail Products and Construction Products segments, respectively.
Net sales and income, including the 2012 pre-tax gain of $3,193, from discontinued operations were as follows for the three years ended December 31:
| 2014 | 2013 | 2012 | ||||||||||
| Net sales |
$ | 2 | $ | 73 | $ | 8,705 | ||||||
|
|
|
|
|
|
|
|||||||
| Income from discontinued operations |
$ | 4 | $ | 23 | $ | 3,842 | ||||||
| Income tax expense |
2 | 9 | 2,418 | |||||||||
|
|
|
|
|
|
|
|||||||
| Income from discontinued operations |
$ | 2 | $ | 14 | $ | 1,424 | ||||||
|
|
|
|
|
|
|
|||||||
| Effective income tax rate |
50.0 | % | 39.1 | % | 62.9 | % | ||||||
|
|
|
|
|
|
|
|||||||
55
Table of Contents
Goodwill of $2,588 allocated to SSD for discontinued operations was not deductible for income tax purposes, resulting in a 62.9% effective tax rate for 2012.
Note 5.
Goodwill and Other Intangible Assets
The following table represents the goodwill balance by reportable segment:
| Rail Products | Construction Products | Tubular Products | Total | |||||||||||||
| Balance at December 31, 2012 |
$ | 38,026 | $ | 3,211 | $ | — | $ | 41,237 | ||||||||
| Acquisitions |
— | — | 16,544 | 16,544 | ||||||||||||
|
|
|
|
|
|
|
|
|
|||||||||
| Balance at December 31, 2013 |
38,026 | 3,211 | 16,544 | 57,781 | ||||||||||||
| Acquisitions |
971 | 1,936 | 22,302 | 25,209 | ||||||||||||
| Foreign currency translation impact |
(41 | ) | — | — | (41 | ) | ||||||||||
|
|
|
|
|
|
|
|
|
|||||||||
| Balance at December 31, 2014 |
$ | 38,956 | $ | 5,147 | $ | 38,846 | $ | 82,949 | ||||||||
|
|
|
|
|
|
|
|
|
|||||||||
The following table represents the gross intangible assets balance by reportable segment:
| 2014 | 2013 | |||||||
| Rail Products |
$ | 44,781 | $ | 44,455 | ||||
| Construction Products |
3,178 | 1,830 | ||||||
| Tubular Products |
47,812 | 14,682 | ||||||
|
|
|
|
|
|||||
| $ | 95,771 | $ | 60,967 | |||||
|
|
|
|
|
|||||
The components of the Company’s intangible assets are as follows:
| 2014 | ||||||||||||||||
| Weighted Average | Gross | Net | ||||||||||||||
| Amortization Period | Carrying | Accumulated | Carrying | |||||||||||||
| In Years | Value | Amortization | Amount | |||||||||||||
| Non-compete agreements |
5 | $ | 4,143 | $ | (705 | ) | $ | 3,438 | ||||||||
| Patents |
10 | 564 | (189 | ) | 375 | |||||||||||
| Customer relationships |
19 | 44,450 | (4,679 | ) | 39,771 | |||||||||||
| Supplier relationships |
5 | 350 | (268 | ) | 82 | |||||||||||
| Trademarks and trade names |
14 | 10,765 | (1,855 | ) | 8,910 | |||||||||||
| Technology |
14 | 35,499 | (5,941 | ) | 29,558 | |||||||||||
|
|
|
|
|
|
|
|||||||||||
| $ | 95,771 | $ | (13,637 | ) | $ | 82,134 | ||||||||||
|
|
|
|
|
|
|
|||||||||||
| 2013 | ||||||||||||||||
| Weighted Average | Gross | Net | ||||||||||||||
| Amortization Period | Carrying | Accumulated | Carrying | |||||||||||||
| In Years | Value | Amortization | Amount | |||||||||||||
| Non-compete agreements |
5 | $ | 2,860 | $ | (117 | ) | $ | 2,743 | ||||||||
| Patents |
10 | 639 | (201 | ) | 438 | |||||||||||
| Customer relationships |
23 | 19,960 | (3,575 | ) | 16,385 | |||||||||||
| Supplier relationships |
5 | 350 | (213 | ) | 137 | |||||||||||
| Trademarks and trade names |
16 | 7,003 | (1,334 | ) | 5,669 | |||||||||||
| Technology |
15 | 30,155 | (3,681 | ) | 26,474 | |||||||||||
|
|
|
|
|
|
|
|||||||||||
| $ | 60,967 | $ | (9,121 | ) | $ | 51,846 | ||||||||||
|
|
|
|
|
|
|
|||||||||||
Intangible assets are amortized over their useful lives ranging from 5 to 25 years, with a total weighted average amortization period of approximately 16 years. Amortization expense from continuing operations for the years ended December 31, 2014, 2013, and 2012 was $4,695, $3,112, and $2,961, respectively.
56
Table of Contents
Estimated amortization expense from continuing operations for the years 2015 and thereafter is as follows:
| Amortization Expense |
||||
| 2015 |
$ | 7,176 | ||
| 2016 |
7,012 | |||
| 2017 |
6,981 | |||
| 2018 |
6,876 | |||
| 2019 |
6,152 | |||
| 2020 and thereafter |
47,937 | |||
|
|
|
|||
| $ | 82,134 | |||
|
|
|
|||
Note 6.
Accounts Receivable
Accounts receivable from continuing operations at December 31, 2014 and 2013 are summarized as follows:
| 2014 | 2013 | |||||||
| Trade |
$ | 90,494 | $ | 98,474 | ||||
| Allowance for doubtful accounts |
(1,036 | ) | (1,099 | ) | ||||
|
|
|
|
|
|||||
| 89,458 | 97,375 | |||||||
| Other |
720 | 1,062 | ||||||
|
|
|
|
|
|||||
| $ | 90,178 | $ | 98,437 | |||||
|
|
|
|
|
|||||
Bad debt expense/(recovery) was $462, $236 and $ (319) in 2014, 2013, and 2012, respectively.
The Company’s customers are principally in the Rail, Construction, and Tubular Products segments of the economy. As of December 31, 2014 and 2013, trade receivables, net of allowance for doubtful accounts, from customers in these markets were as follows:
| 2014 | 2013 | |||||||
| Rail Products |
$ | 45,931 | $ | 57,342 | ||||
| Construction Products |
33,760 | 35,711 | ||||||
| Tubular Products |
9,767 | 4,322 | ||||||
|
|
|
|
|
|||||
| $ | 89,458 | $ | 97,375 | |||||
|
|
|
|
|
|||||
Credit is extended based upon an evaluation of the customer’s financial condition and while collateral is not required, the Company often receives surety bonds that guarantee payment. Credit terms are consistent with industry standards and practices.
Note 7.
Inventory
Inventories of continuing operations of the Company at December 31, 2014 and 2013 are summarized in the following table:
| 2014 | 2013 | |||||||
| Finished goods |
$ | 65,335 | $ | 55,166 | ||||
| Work-in-process |
16,188 | 11,332 | ||||||
| Raw materials |
21,855 | 19,485 | ||||||
|
|
|
|
|
|||||
| Total inventories at current costs |
103,378 | 85,983 | ||||||
| Less: LIFO reserve |
(8,289 | ) | (9,027 | ) | ||||
|
|
|
|
|
|||||
| $ | 95,089 | $ | 76,956 | |||||
|
|
|
|
|
|||||
57
Table of Contents
At December 31, 2014 and 2013, the LIFO carrying value of inventories for book purposes exceeded the LIFO value for tax purposes by approximately $11,697 and $12,241, respectively. As of December 31, 2014, 2013, and 2012 liquidation of certain LIFO inventory layers carried at costs which were higher than the costs of current purchases resulted in increases in cost of goods sold of $6, $1,128 and $15 respectively.
Note 8.
Property, Plant, and Equipment
Property, plant, and equipment of continuing operations at December 31, 2014 and 2013 consist of the following:
| 2014 | 2013 | |||||||
| Land |
$ | 9,102 | $ | 4,862 | ||||
| Improvements to land and leaseholds |
29,016 | 24,903 | ||||||
| Buildings |
22,807 | 15,834 | ||||||
| Machinery and equipment, including equipment under capitalized leases |
95,547 | 88,803 | ||||||
| Construction in progress |
12,033 | 3,567 | ||||||
|
|
|
|
|
|||||
| 168,505 | 137,969 | |||||||
|
|
|
|
|
|||||
| Less accumulated depreciation and amortization, including accumulated amortization of capitalized leases |
93,703 | 87,860 | ||||||
|
|
|
|
|
|||||
| $ | 74,802 | $ | 50,109 | |||||
|
|
|
|
|
|||||
Depreciation expense, including amortization of assets under capital leases, for the years ended December 31, 2014, 2013, and 2012 amounted to $7,882, $6,890 and $9,979, respectively.
Note 9.
Investments
The Company is a member of a joint venture, L B Pipe and Coupling Products, LLC (LB Pipe JV) in which it maintains a 45% ownership interest. The LB Pipe JV manufactures, markets, and sells various precision coupling products for the energy, utility, and construction markets and is scheduled to terminate on June 30, 2019.
Under applicable guidance for variable interest entities in ASC 810, “Consolidation,” the Company determined that the LB Pipe JV is a variable interest entity. The Company concluded that it is not the primary beneficiary of the variable interest entity, as the Company does not have a controlling financial interest and does not have the power to direct the activities that most significantly impact the economic performance of the LB Pipe JV. Accordingly, the Company concluded that the equity method of accounting remains appropriate.
During the years ended December 31, 2014 and 2013, each of the LB Pipe JV members received proportional distributions of equity from the LB Pipe JV. The Company’s 45% ownership interest resulted in cash distributions of $630 and $558 as of December 31, 2014 and 2013, respectively. There were no changes to the members’ ownership interests as a result of the distribution.
The Company recorded equity in the income of the LB Pipe JV of approximately $1,286, $1,316 and $837 for the years ended December 31, 2014, 2013, and 2012, respectively.
As of December 31, 2014 and 2013, the Company had a nonconsolidated equity method investment of $5,746 and $5,090, respectively, in the LB Pipe JV and other investments totaling $78 as of December 31, 2014.
58
Table of Contents
The Company’s exposure to loss results from its capital contributions, net of the Company’s share of the JV’s income or loss, and its net investment in the direct financing lease covering the facility used by the JV for its operations. The carrying amounts with the maximum exposure to loss of the Company at December 31, 2014 and 2013, respectively, are as follows:
| 2014 | 2013 | |||||||
| LB Pipe JV equity method investment |
$ | 5,746 | $ | 5,090 | ||||
| Net investment in direct financing lease |
1,117 | 1,224 | ||||||
|
|
|
|
|
|||||
| $ | 6,863 | $ | 6,314 | |||||
|
|
|
|
|
|||||
The Company is leasing five acres of land and two facilities to the JV over a period of 9.5 years, through June 30, 2019, with a 5.5 year renewal period. In November 2012, the Company executed the first amendment to its lease with the JV. The amendment included the addition of a second facility built by the Company that was leased to the JV. The current monthly lease payments, including interest, approximate $17, with a balloon payment of approximately $488, which is required to be paid either at the termination of the lease, allocated over the renewal period, or during the initial term of the lease. This lease qualifies as a direct financing lease under the applicable guidance in ASC 840-30, Leases.
The following is a schedule of the direct financing minimum lease payments for the years 2015 and thereafter
| Minimum Lease Payments |
||||
| 2015 |
$ | 122 | ||
| 2016 |
131 | |||
| 2017 |
140 | |||
| 2018 |
150 | |||
| 2019 |
574 | |||
| 2020 and thereafter |
— | |||
|
|
|
|||
| $ | 1,117 | |||
|
|
|
|||
Note 10.
Deferred Revenue
Deferred revenue of $8,034 and $5,715 as of December 31, 2014 and 2013, respectively, consists of customer payments received for which the revenue recognition criteria have not yet been met as well as billings in excess of costs on percentage of completion projects. Advanced payments from customers typically relate to contracts that the Company has significantly fulfilled its obligations and the customers have paid, but due to the Company’s continuing involvement with the material, revenue is precluded from being recognized until title, ownership, and risk of loss have passed to the customer.
59
Table of Contents
Note 11.
Long-Term Debt and Related Matters
Long-term debt at December 31, 2014 and 2013 consists of the following:
| 2014 | 2013 | |||||||
| Revolving credit facility |
$ | 24,200 | $ | — | ||||
| Financing agreement payable in installments through July 1, 2017 with an interest rate of 3.00% at December 31, 2014 |
1,781 | — | ||||||
| Lease obligations payable in installments through 2019 with a weighted average interest rate of 3.50% at December 31, 2014 and 5.37% December 31, 2013 |
447 | 56 | ||||||
|
|
|
|
|
|||||
| Total |
26,428 | 56 | ||||||
| Less current maturities |
676 | 31 | ||||||
|
|
|
|
|
|||||
| Long-term portion |
$ | 25,752 | $ | 25 | ||||
|
|
|
|
|
|||||
The maturities of long-term debt for each of the succeeding five years subsequent to December 31, 2014 are as follows:
| 2015 |
$ | 676 | ||
| 2016 |
853 | |||
| 2017 |
621 | |||
| 2018 |
67 | |||
| 2019 |
24,211 | |||
| 2020 and thereafter |
— | |||
|
|
|
|||
| Total |
$ | 26,428 | ||
|
|
|
Borrowings
United States
On September 23, 2014, the Company, its domestic subsidiaries, and certain of its Canadian subsidiaries entered into an amended and restated $200,000 Revolving Credit Facility Credit Agreement (“Amended Credit Agreement”) with PNC Bank, N.A., Bank of America, N.A., Wells Fargo Bank, N.A., and Citizens Bank of Pennsylvania. This Amended Credit Agreement modifies the prior revolving credit facility which had a maximum credit line of $125,000. The Amended Credit Agreement provides for a five-year, unsecured revolving credit facility that permits borrowing up to $200,000 for the U.S. borrowers and a sublimit of the equivalent of $25,000 U.S. dollars that is available to the Canadian borrowers. The Amended Credit Agreement also modifies the accordion feature in the prior revolving credit facility which permitted a maximum increase of $50,000. The Amended Credit Agreement’s accordion feature permits the Company to increase the available revolving borrowings under the facility by up to an additional $100,000 subject to the Company’s receipt of increased commitments from existing lenders or new commitments from new lenders and to certain conditions being satisfied. The Amended Credit Agreement also increases the sublimit for the issuance of trade and standby letters of credit from $20,000 to $30,000.
Borrowings under the Amended Credit Agreement will bear interest at rates based upon either the base rate or Euro-rate plus applicable margins. Applicable margins are dictated by the ratio of the Company’s indebtedness less cash on hand to the Company’s consolidated EBITDA, as defined in the underlying Amended Credit Agreement. The base rate is the highest of (a) PNC Bank’s prime rate, (b) the Federal Funds Rate plus 0.50% or (c) the daily Euro-rate (as defined in the Amended Credit Agreement) plus 1.00%. The base rate and Euro-rate spreads range from 0.00% to 1.00% and 1.00% to 2.00%, respectively.
The Amended Credit Agreement includes two financial covenants: (a) Leverage Ratio, defined as the Company’s indebtedness less cash on hand, in excess of $15,000, divided by the Company’s consolidated
60
Table of Contents
EBITDA, which must not exceed 3.25 to 1.00 and (b) Minimum Interest Coverage, defined as consolidated EBITDA less capital expenditures divided by consolidated interest expense, which must be no less than 3.00 to 1.00.
The Amended Credit Agreement permits the Company to pay dividends, distributions, and make redemptions with respect to its stock provided no event of default or potential default (as defined in the Amended Credit Agreement) has occurred prior to or after giving effect to the dividend, distribution, or redemption. Dividends, distributions, and redemptions are capped at $25,000 per year when funds are drawn on the facility. If no drawings on the facility exist, dividends, distributions, and redemptions in excess of $25,000 per year are subjected to a limitation of $75,000 in the aggregate. The $75,000 aggregate limitation also permits certain loans, investments, and acquisitions.
Other restrictions exist at all times including, but not limited to, limitation of the Company’s sale of assets, other indebtedness incurred by either the borrowers or the non-borrower subsidiaries of the Company, guarantees, and liens.
The Company had $24,200 outstanding borrowings under the Amended Credit Agreement at December 31, 2014 and had available borrowing capacity of $175,375 and at December 31, 2014. As of December 31, 2013, the Company had no outstanding borrowings and an available borrowing capacity of $124,186 under the previous $125,000 revolving facility.
As of December 31, 2014, the Company was in compliance with the Amended Credit Agreement’s covenants.
Letters of Credit
At December 31, 2014 and 2013, the Company had outstanding letters of credit of approximately $425 and $814, respectively.
United Kingdom
A subsidiary of the Company has a working capital facility with NatWest Bank for its United Kingdom operations which includes an overdraft availability of £1,500 pounds sterling (approximately $2,337 at December 31, 2014). This credit facility supports the subsidiary’s working capital requirements and is collateralized by substantially all of the assets of its United Kingdom operations. The interest rate on this facility is the financial institution’s base rate plus 1.50%. Outstanding performance bonds reduce availability under this credit facility. The subsidiary of the Company had no outstanding borrowings under this credit facility as of December 31, 2014. There was $60 in outstanding guarantees (as defined in the underlying agreement) at December 31, 2013. This credit facility was renewed during the third quarter of 2014 with no significant changes to the underlying terms or conditions in the facility. It is the Company’s intention to renew this credit facility with NatWest Bank during the annual review over the credit facility in 2015.
The United Kingdom loan agreements contain certain financial covenants that require that subsidiary to maintain senior interest and cash flow coverage ratios. The subsidiary was in compliance with these financial covenants as of December 31, 2014 and 2013. The subsidiary had available borrowing capacity of $2,337 and $2,424 at December 31, 2014 and 2013, respectively.
Note 12.
Stockholders’ Equity
The Company had authorized shares of 20,000,000 in common stock with 11,115,779 shares issued at December 31, 2014 and 2013. The common stock has a par value of $.01 per share and the Company paid dividends of $0.03 per quarter through September 30, 2014. During the 2014 fourth quarter, the Board approved an increase to $0.04 per share per quarter.
At December 31, 2014 and 2013, the Company had authorized shares of 5,000,000 in preferred stock. No preferred stock has been issued. No par value has been assigned to the preferred stock.
61
Table of Contents
On December 4, 2013 the Company’s Board of Directors authorized the purchase of up to $15,000 in shares of its common stock through a share repurchase program at prevailing market prices or privately negotiated transactions. There were no share repurchases during 2014, and the authorization will expire on December 31, 2016.
As of December 31, 2014 and 2013, the Company withheld 21,676 and 16,166 shares for approximately $985 and $708, respectively, from employees to pay their withholding taxes in connection with the exercise and/or vesting of stock options and restricted stock awards.
Cash dividends of $1,345, $1,240 and $1,029 were paid in 2014, 2013, and 2012, respectively.
| Common Stock | ||||||||
| Share Activity |
Treasury | Outstanding | ||||||
| (Number of Shares) | ||||||||
| Balance at end of 2011 |
1,042,376 | 10,073,403 | ||||||
| Issued for stock-based compensation plans |
(75,995 | ) | 75,995 | |||||
|
|
|
|
|
|||||
| Balance at end of 2012 |
966,381 | 10,149,398 | ||||||
| Issued for stock-based compensation plans |
(39,123 | ) | 39,123 | |||||
|
|
|
|
|
|||||
| Balance at end of 2013 |
927,258 | 10,188,521 | ||||||
| Issued for stock-based compensation plans |
(53,884 | ) | 53,884 | |||||
|
|
|
|
|
|||||
| Balance at end of 2014 |
873,374 | 10,242,405 | ||||||
|
|
|
|
|
|||||
Note 13.
Accumulated Other Comprehensive Loss
The components of accumulated other comprehensive loss, net of tax, for the years ended December 31, 2014 and 2013, are as follows:
| 2014 | 2013 | |||||||
| Pension and post-retirement benefit plan adjustments |
$ | (4,089 | ) | $ | (1,643 | ) | ||
| Foreign currency translation adjustments |
(7,803 | ) | (2,940 | ) | ||||
|
|
|
|
|
|||||
| $ | (11,892 | ) | $ | (4,583 | ) | |||
|
|
|
|
|
|||||
Foreign currency translation adjustments are generally not adjusted for income taxes as they relate to indefinite investments in non U.S. subsidiaries. See Note 15 “Income Taxes”.
62
Table of Contents
Note 14.
Earnings Per Common Share
The following table sets forth the computation of basic and diluted earnings per common share for the three years ended December 31:
| 2014 | 2013 | 2012 | ||||||||||
| Numerator for basic and diluted earnings per common share — |
||||||||||||
| Income available to common stockholders: |
||||||||||||
| Income from continuing operations |
$ | 25,654 | $ | 29,276 | $ | 14,764 | ||||||
| Income from discontinued operations |
2 | 14 | 1,424 | |||||||||
|
|
|
|
|
|
|
|||||||
| Net income |
$ | 25,656 | $ | 29,290 | $ | 16,188 | ||||||
|
|
|
|
|
|
|
|||||||
| Denominator: |
||||||||||||
| Weighted average shares |
10,225 | 10,175 | 10,124 | |||||||||
|
|
|
|
|
|
|
|||||||
| Denominator for basic earnings per common share |
10,225 | 10,175 | 10,124 | |||||||||
| Effect of dilutive securities: |
||||||||||||
| Employee stock options |
6 | 11 | 16 | |||||||||
| Other stock compensation plans |
101 | 74 | 94 | |||||||||
|
|
|
|
|
|
|
|||||||
| Dilutive potential common shares |
107 | 85 | 110 | |||||||||
|
|
|
|
|
|
|
|||||||
| Denominator for diluted earnings per common share — adjusted weighted average shares and assumed conversions |
10,332 | 10,260 | 10,234 | |||||||||
|
|
|
|
|
|
|
|||||||
| Basic earnings per common share: |
||||||||||||
| Continuing operations |
$ | 2.51 | $ | 2.88 | $ | 1.46 | ||||||
| Discontinued operations |
0.00 | 0.00 | 0.14 | |||||||||
|
|
|
|
|
|
|
|||||||
| Basic earnings per common share |
$ | 2.51 | $ | 2.88 | $ | 1.60 | ||||||
|
|
|
|
|
|
|
|||||||
| Diluted earnings per common share: |
||||||||||||
| Continuing operations |
$ | 2.48 | $ | 2.85 | $ | 1.44 | ||||||
| Discontinued operations |
0.00 | 0.00 | 0.14 | |||||||||
|
|
|
|
|
|
|
|||||||
| Diluted earnings per common share |
$ | 2.48 | $ | 2.85 | $ | 1.58 | ||||||
|
|
|
|
|
|
|
|||||||
| Dividends paid per common share |
$ | 0.13 | $ | 0.12 | $ | 0.10 | ||||||
|
|
|
|
|
|
|
|||||||
There were no antidilutive shares in 2014, 2013, and 2012.
63
Table of Contents
Note 15.
Income Taxes
Significant components of the Company’s deferred tax liabilities and assets as of December 31, 2014 and 2013 are as follows:
| 2014 | 2013 | |||||||
| Deferred tax liabilities: |
||||||||
| Goodwill and other intangibles |
$ | (10,800 | ) | $ | (11,360 | ) | ||
| Depreciation |
(3,763 | ) | (3,369 | ) | ||||
| Inventories |
(3,188 | ) | (3,611 | ) | ||||
| Investment in LB Pipe joint venture |
(553 | ) | (587 | ) | ||||
| Other |
(527 | ) | (437 | ) | ||||
|
|
|
|
|
|||||
| Total deferred tax liabilities |
(18,831 | ) | (19,364 | ) | ||||
|
|
|
|
|
|||||
| Deferred tax assets: |
||||||||
| Pension and post-retirement liability |
2,147 | 1,033 | ||||||
| Warranty reserve |
4,180 | 2,689 | ||||||
| Deferred compensation |
1,755 | 1,525 | ||||||
| Accounts receivable |
369 | 388 | ||||||
| Contingent liabilities |
667 | 662 | ||||||
| Long-term insurance reserves |
660 | 569 | ||||||
| Net operating loss / tax credit carryforwards |
883 | 139 | ||||||
| Other |
645 | 843 | ||||||
|
|
|
|
|
|||||
| Total deferred tax assets |
11,306 | 7,848 | ||||||
|
|
|
|
|
|||||
| Net deferred tax liability |
$ | (7,525 | ) | $ | (11,516 | ) | ||
|
|
|
|
|
|||||
Significant components of the provision for income taxes are as follows:
| 2014 | 2013 | 2012 | ||||||||||
| Current: |
||||||||||||
| Federal |
$ | 11,486 | $ | 8,776 | $ | 9,742 | ||||||
| State |
1,491 | 837 | 1,977 | |||||||||
| Foreign |
3,339 | 1,982 | 1,910 | |||||||||
|
|
|
|
|
|
|
|||||||
| Total current |
16,316 | 11,595 | 13,629 | |||||||||
|
|
|
|
|
|
|
|||||||
| Deferred: |
||||||||||||
| Federal |
(2,321 | ) | 3,200 | (3,966 | ) | |||||||
| State |
(122 | ) | 273 | (155 | ) | |||||||
| Foreign |
(471 | ) | (229 | ) | (442 | ) | ||||||
|
|
|
|
|
|
|
|||||||
| Total deferred |
(2,914 | ) | 3,244 | (4,563 | ) | |||||||
|
|
|
|
|
|
|
|||||||
| Total income tax expense from continuing operations |
$ | 13,402 | $ | 14,839 | $ | 9,066 | ||||||
|
|
|
|
|
|
|
|||||||
At December 31, 2014, the Company has not recorded deferred U.S. income taxes or foreign withholding taxes on $56,266 of undistributed earnings of its foreign subsidiaries. It is management’s intent and practice to indefinitely reinvest such earnings outside of the U.S. Determination of the amount of any unrecognized deferred income tax liability associated with these undistributed earnings is not practicable because of the complexities of the hypothetical calculation.
64
Table of Contents
Income before income taxes, as shown in the accompanying consolidated statements of operations, includes the following components:
| 2014 | 2013 | 2012 | ||||||||||
| Domestic |
$ | 30,762 | $ | 37,283 | $ | 16,600 | ||||||
| Foreign |
8,294 | 6,832 | 7,230 | |||||||||
|
|
|
|
|
|
|
|||||||
| Income from continuing operations, before income taxes |
$ | 39,056 | $ | 44,115 | $ | 23,830 | ||||||
|
|
|
|
|
|
|
|||||||
The reconciliation of income tax computed at statutory rates to income tax expense is as follows:
| 2014 | 2013 | 2012 | ||||||||||
| Statutory rate |
35.0 | % | 35.0 | % | 35.0 | % | ||||||
| Foreign tax rate differential |
(2.2 | ) | (1.7 | ) | (3.0 | ) | ||||||
| State income taxes, net of federal benefit |
2.7 | 2.6 | 4.5 | |||||||||
| Non-deductible expenses |
1.8 | 0.6 | 1.4 | |||||||||
| Tax credits |
(0.9 | ) | (0.8 | ) | (2.2 | ) | ||||||
| Change in liability for unrecognized tax benefits |
(0.8 | ) | (1.9 | ) | 0.9 | |||||||
| Domestic production activities deduction |
(2.2 | ) | (1.2 | ) | (1.2 | ) | ||||||
| Other |
0.9 | 1.0 | 2.6 | |||||||||
|
|
|
|
|
|
|
|||||||
| 34.3 | % | 33.6 | % | 38.0 | % | |||||||
|
|
|
|
|
|
|
|||||||
At December 31, 2014 and 2013, the tax benefit of net operating loss carryforwards available for state income tax purposes was $74 and $83, respectively. The state net operating loss carryforwards will expire in various years from 2019 through 2032. At December 31, 2014, the Company has foreign net operating loss carryforwards of $162, which may be carried forward indefinitely. The Company has foreign tax credit carryforwards in the amount of $780 that will expire in 2023 through 2025. The Company anticipates utilizing these operating loss and credit carryforwards prior to their expiration and, therefore, has not provided a valuation allowance for these amounts.
The following table provides a reconciliation of unrecognized tax benefits as of December 31, 2014 and 2013:
| 2014 | 2013 | |||||||
| Unrecognized tax benefits at beginning of period: |
$ | 1,509 | $ | 2,045 | ||||
| Increases based on tax positions for prior periods |
18 | 149 | ||||||
| Decreases based on tax positions for prior periods |
(325 | ) | (89 | ) | ||||
| Decreases related to settlements with taxing authorities |
(126 | ) | (596 | ) | ||||
| Decreases as a result of a lapse of the applicable statute of limitations |
(63 | ) | — | |||||
|
|
|
|
|
|||||
| Balance at end of period |
$ | 1,013 | $ | 1,509 | ||||
|
|
|
|
|
|||||
The total amount of unrecognized tax benefits that, if recognized, would affect the effective tax rate is $1,013 at December 31, 2014. The Company accrues interest and penalties related to unrecognized tax benefits in its provision for income taxes. At December 31, 2014 and 2013, the Company had accrued interest and penalties related to unrecognized tax benefits of $335 and $342, respectively. As of December 31, 2014, the Company does not expect any material increases or decreases to its unrecognized tax benefits within the next 12 months. Ultimate realization of this decrease is dependent upon the occurrence of certain events, including the completion of audits by tax authorities and expiration of statutes of limitations.
The Company files income tax returns in the United States and in various state, local and foreign jurisdictions. The Company is subject to federal income tax examinations for the period 2011 and forward. With respect to the state, local and foreign filings, certain entities of the Company are subject to income tax examinations for the periods 2007 and forward.
65
Table of Contents
Note 16.
Stock-based Compensation
The Company applies the provisions of FASB ASC 718, Compensation — Stock Compensation, to account for the Company’s share-based compensation. Share-based compensation cost is measured at the grant date based on the calculated fair value of the award and is recognized over the employees’ requisite service period. The Company recorded share-based compensation expense of $3,007, $2,156 and $1,989 for the years ended December 31, 2014, 2013, and 2012, respectively, related to fully-vested stock awards, restricted stock awards, and performance unit awards as follows. As of December 31, 2014, unrecognized compensation expense for awards the Company expects to vest approximated $2,896. The Company will recognize this expense over the upcoming 3.2 year period through February 2018.
Shares issued as a result of vested stock-based compensation generally will be from previously issued shares which have been reacquired by the Company and held as Treasury shares or authorized but previously unissued common stock.
The excess tax benefit realized for the tax deduction from share-based compensation approximated $336, $203 and $199 for the years ended December 31, 2014, 2013, and 2012, respectively. This excess tax benefit is included in cash flows from financing activities in the Consolidated Statements of Cash Flows.
As of December 31, 2014, the Company had outstanding stock option and other stock awards issued pursuant to two shareholder-approved plans: The 2006 Omnibus Incentive Plan, as amended and restated in October 2013 (Omnibus Plan), and the 1998 Long-Term Incentive Plan for Officers and Directors, amended and restated in May 2006, (1998 Plan). The 1998 Plan expired by its terms in 2008 and no awards may be granted under that Plan, which currently has outstanding stock option awards that expire in 2015. The Company currently makes equity awards only under the Omnibus Plan.
The 1998 Plan provided for the award of stock options to key employees and directors to purchase up to 900,000 shares of common stock at no less than 100% of fair market value on the date of the grant. The 1998 Plan authorized the granting of “nonqualified options” and “incentive stock options” with a duration of not more than ten years from the date of grant. The 1998 Plan also provided that, unless otherwise set forth in the option agreement, stock options are exercisable in installments of up to 25% annually beginning one year from date of grant. Non-employee directors were automatically awarded fully vested, nonqualified stock options to acquire 5,000 shares of the Company’s common stock on each date the outside directors were elected at an annual shareholders’ meeting to serve as directors. The 1998 Plan was amended in May 2006 to remove the automatic awarding of stock options to outside directors. As noted above, the 1998 Plan expired by its terms in 2008 and there are remaining stock option awards outstanding which expire in 2015. The Company no longer issues awards under the 1998 Plan.
The Omnibus Plan allows for the issuance of 900,000 shares of common stock through the granting of stock options or stock awards (including performance units convertible into stock) to key employees and directors at no less than 100% of fair market value on the date of the grant. The Omnibus Plan provides for the granting of “nonqualified options” with a duration of not more than ten years from the date of grant. The Omnibus Plan also provides that, unless otherwise set forth in the option agreement, stock options are exercisable in installments of up to 25% annually beginning one year from the date of grant. No stock options have been granted under the Omnibus Plan and, as such, there was no share-based compensation expense related to stock options recorded in 2014, 2013, or 2012
66
Table of Contents
Stock Option Awards
Certain information for the three years ended December 31, 2014 relative to employee stock options is summarized as follows:
| 2014 | 2013 | 2012 | ||||||||||
| Number of shares under the plans: |
||||||||||||
| Outstanding and exercisable at beginning of year |
18,750 | 22,500 | 39,950 | |||||||||
| Granted |
— | — | — | |||||||||
| Canceled |
— | — | — | |||||||||
| Exercised |
(11,250 | ) | (3,750 | ) | (17,450 | ) | ||||||
|
|
|
|
|
|
|
|||||||
| Outstanding and exercisable at end of year |
7,500 | 18,750 | 22,500 | |||||||||
|
|
|
|
|
|
|
|||||||
Certain information for the three years ended December 31, 2014 relative to stock options at respective exercise price ranges is summarized as follows:
| Options Outstanding and Exercisable | ||||||||||||||||||||
| December 31, |
Range of Exercise Prices | Number of Shares |
Weighted Average Remaining Life |
Weighted Exercise Price |
Intrinsic Value |
|||||||||||||||
| 2014 |
$ | 8.97 - $9.29 | 7,500 | 0.3 | $ | 9.08 | $ | 296 | ||||||||||||
| 2013 |
$ | 7.81 - $14.77 | 18,750 | 1.3 | 10.64 | 687 | ||||||||||||||
| 2012 |
$ | 7.81 - $14.77 | 22,500 | 2.2 | 10.41 | 743 | ||||||||||||||
The weighted average exercise price per share of the stock options exercised in 2014, 2013, and 2012 were $11.67, $9.30, and $7.03, respectively. The total intrinsic value of stock options exercised during the years ended December 31, 2014, 2013, and 2012 were $426, $124, and $457, respectively.
Fully-Vested Stock Awards
Non-employee directors are automatically awarded 3,500 fully vested shares, or a lesser amount determined by the directors, of the Company’s common stock on each date the non-employee directors are elected at an annual shareholders’ meeting to serve as directors.
The non-employee directors were granted a total of 10,182, 9,960, and 12,000 fully-vested shares for the years ended December 31, 2014, 2013, and 2012, respectively. Compensation expense recorded by the Company related to fully-vested stock awards to non-employee directors was approximately $488, $450, and $337 for the years ended December 31, 2014, 2013, and 2012, respectively.
The weighted average fair value of all the fully-vested stock grants awarded was $47.94, $45.16, and $28.05 per share for 2014, 2013, and 2012, respectively.
Restricted Stock Awards and Performance Unit Awards
Under the amended and restated 2006 Omnibus Plan, the Company grants eligible employees Restricted Stock and Performance Unit Awards. The forfeitable Restricted Stock Awards generally time-vest after a four year holding period, unless indicated otherwise by the underlying Restricted Stock Agreement. Performance Unit Awards are offered annually under separate three-year long-term incentive programs. Performance units are subject to forfeiture and will be converted into common stock of the Company based upon the Company’s performance relative to performance measures and conversion multiples as defined in the underlying program. If the Company’s estimate of the number of Performance Stock Awards expected to vest changes in a subsequent accounting period, cumulative compensation expense could increase or decrease. The change will be recognized in the current period for the vested shares and would change future expense over the remaining vesting period.
67
Table of Contents
The following table summarizes the Restricted Stock Award and Performance Unit Award activity for the period ended December 31, 2014:
| Restricted Stock Units |
Performance Stock Units |
Weighted Average Grant Date Fair Value |
||||||||||
| Outstanding at January 1, 2012 |
105,168 | 81,489 | $ | 31.24 | ||||||||
|
|
|
|
|
|
|
|||||||
| Granted |
108,677 | 43,042 | 30.24 | |||||||||
| Vested |
(36,599 | ) | (33,508 | ) | 27.38 | |||||||
| Adjustment for incentive awards expected to vest |
— | (31,298 | ) | 31.79 | ||||||||
| Canceled |
(600 | ) | — | 38.44 | ||||||||
|
|
|
|
|
|
|
|||||||
| Outstanding at December 31, 2012 |
176,646 | 59,725 | 31.65 | |||||||||
|
|
|
|
|
|
|
|||||||
| Granted |
12,973 | 31,418 | 42.49 | |||||||||
| Vested |
(41,579 | ) | — | 29.18 | ||||||||
| Adjustment for incentive awards expected to vest |
— | (18,408 | ) | 35.84 | ||||||||
| Canceled |
(18,314 | ) | (11,084 | ) | 33.55 | |||||||
|
|
|
|
|
|
|
|||||||
| Outstanding at December 31, 2013 |
129,726 | 61,651 | 34.00 | |||||||||
|
|
|
|
|
|
|
|||||||
| Granted |
19,051 | 34,652 | 44.07 | |||||||||
| Vested |
(40,540 | ) | (13,588 | ) | 34.59 | |||||||
| Adjustment for incentive awards expected to vest |
— | (7,845 | ) | 43.59 | ||||||||
| Canceled |
— | (2,880 | ) | 44.13 | ||||||||
|
|
|
|
|
|
|
|||||||
| Outstanding at December 31, 2014 |
108,237 | 71,990 | $ | 36.25 | ||||||||
|
|
|
|
|
|
|
|||||||
Performance units are subject to forfeiture and will be converted into common stock of the Company based upon the Company’s performance relative to performance measures and conversion multiples as defined in the underlying plan. The aggregate fair value in the above table is based upon achieving 100% of the performance targets as defined in the underlying plan. During 2014 and 2012, the Company reversed $702 and $807, respectively, of incentive compensation costs under its separate three-year long-term incentive plans caused by the impact of the product warranty charges on Company performance, as it related to the awards’ underlying performance conditions. More information on the product warranty charge can be found in Note 20, Commitments and Contingent Liabilities.
Excluding the fully-vested stock awards granted to non-employee directors, the Company recorded compensation expense of $2,519, $1,706, and $1,652, respectively, for the periods ended December 31, 2014, 2013, and 2012 related to restricted stock and performance unit awards.
| 2014 | 2013 | 2012 | ||||||||||
| Number of shares available for future grant: |
||||||||||||
| Beginning of year |
513,280 | 517,280 | 271,465 | |||||||||
|
|
|
|
|
|
|
|||||||
| End of year |
469,840 | 513,280 | 517,280 | |||||||||
|
|
|
|
|
|
|
|||||||
The Company issued, pursuant to the Omnibus Plan, approximately 14,000 fully-vested shares during 2014 which were earned under the 2011 — 2013 three year long-term incentive plan. This non-cash transaction of $454 was reflected as a decrease to Treasury Stock in the Consolidated Balance Sheet at December 31, 2014. During 2012, approximately 34,000 fully-vested shares were issued which were earned under the 2009 — 2011 three year long-term incentive plan. This non-cash transaction of $1,130 was reflected as a decrease to Treasury Stock in the Consolidated Balance Sheet at December 31, 2012.
68
Table of Contents
Note 17.
Retirement Plans
The Company has six retirement plans which cover its hourly and salaried employees in the United States: three defined benefit plans (one active / two frozen) and three defined contribution plans. Employees are eligible to participate in the appropriate plan based on employment classification. The Company’s funding to the defined benefit and defined contribution plans are governed by the Employee Retirement Income Security Act of 1974 (ERISA), applicable plan policy and investment guidelines. The Company policy is to contribute at least the minimum in accordance with the funding standards of ERISA.
The Company’s subsidiary, L.B. Foster Rail Technologies (Rail Technologies), maintains two defined contribution plans for its employees in Canada, as well as a post-retirement benefit plan. In the United Kingdom, Rail Technologies maintains both a defined contribution plan and a defined benefit plan. These plans are discussed in further detail below.
United States Defined Benefit Plans
The following tables present a reconciliation of the changes in the benefit obligation, the fair market value of the assets, and the funded status of the plans:
| 2014 | 2013 | |||||||
| Changes in benefit obligation: |
||||||||
| Benefit obligation at beginning of year |
$ | 16,112 | $ | 18,034 | ||||
| Service cost |
23 | 33 | ||||||
| Interest cost |
771 | 707 | ||||||
| Actuarial loss (gain) |
2,753 | (1,924 | ) | |||||
| Benefits paid |
(734 | ) | (738 | ) | ||||
|
|
|
|
|
|||||
| Benefit obligation at end of year |
$ | 18,925 | $ | 16,112 | ||||
|
|
|
|
|
|||||
| Change to plan assets: |
||||||||
| Fair value of assets at beginning of year |
$ | 15,039 | $ | 13,262 | ||||
| Actual gain on plan assets |
601 | 2,019 | ||||||
| Employer contribution |
299 | 496 | ||||||
| Benefits paid |
(734 | ) | (738 | ) | ||||
|
|
|
|
|
|||||
| Fair value of assets at end of year |
15,205 | 15,039 | ||||||
|
|
|
|
|
|||||
| Funded status at end of year |
$ | (3,720 | ) | $ | (1,073 | ) | ||
|
|
|
|
|
|||||
| Amounts recognized in the consolidated balance sheet consist of: |
||||||||
| Other long-term liabilities |
$ | (3,720 | ) | $ | (1,073 | ) | ||
|
|
|
|
|
|||||
| Amounts recognized in accumulated other comprehensive income consist of: |
||||||||
| Net loss |
$ | 4,429 | $ | 1,375 | ||||
| Prior service cost |
3 | 4 | ||||||
|
|
|
|
|
|||||
| $ | 4,432 | $ | 1,379 | |||||
|
|
|
|
|
|||||
The actuarial loss included in accumulated other comprehensive loss that will be recognized in net periodic pension cost during 2015 is $278, before taxes.
69
Table of Contents
Net periodic pension costs for the three years ended December 31, 2014 are as follows:
| 2014 | 2013 | 2012 | ||||||||||
| Components of net periodic benefit cost: |
||||||||||||
| Service cost |
$ | 23 | $ | 33 | $ | 31 | ||||||
| Interest cost |
771 | 707 | 748 | |||||||||
| Expected return on plan assets |
(968 | ) | (856 | ) | (810 | ) | ||||||
| Amortization of prior service cost |
1 | 1 | 1 | |||||||||
| Recognized net actuarial loss |
65 | 212 | 194 | |||||||||
|
|
|
|
|
|
|
|||||||
| Net periodic pension (income) cost |
$ | (108 | ) | $ | 97 | $ | 164 | |||||
|
|
|
|
|
|
|
|||||||
The weighted average assumptions in the following table represent the rates used to develop the actuarial present value of the projected benefit obligation for the year listed and also the net periodic benefit cost for the following year.
| 2014 | 2013 | 2012 | ||||||||||
| Discount rate |
4.0 | % | 4.9 | % | 4.0 | % | ||||||
|
|
|
|
|
|
|
|||||||
| Expected rate of return on plan assets |
5.5 | % | 6.5 | % | 6.5 | % | ||||||
|
|
|
|
|
|
|
|||||||
The expected long-term rate of return is based on numerous factors including the target asset allocation for plan assets, historical rate of return, long-term inflation assumptions, and current and projected market conditions. The decline in the expected rate of return on plan assets reflects a shift in the Plans’ investment strategy toward a higher focus on fixed income investments.
Amounts applicable to the Company’s pension plans with accumulated benefit obligations in excess of plan assets are as follows:
| 2014 | 2013 | |||||||
| Projected benefit obligation |
$ | 18,925 | $ | 12,513 | ||||
| Accumulated benefit obligation |
18,925 | 12,513 | ||||||
| Fair value of plan assets |
$ | 15,205 | $ | 11,321 | ||||
|
|
|
|
|
|||||
Plan assets consist primarily of various fixed income and equity investments. The Company’s primary investment objective is to provide long-term growth of capital while accepting a moderate level of risk. The investments are limited to cash and equivalents, bonds, preferred stocks, and common stocks. The investment target ranges and actual allocation of pension plan assets by major category at December 31, 2014 and 2013 are as follows:
| Target | 2014 | 2013 | ||||||||||
| Asset Category |
||||||||||||
| Cash and cash equivalents |
0 - 10 | % | 2 | % | 4 | % | ||||||
| Total fixed income funds |
25 - 50 | 34 | 27 | |||||||||
| Total mutual funds and equities |
50 - 70 | 64 | 69 | |||||||||
|
|
|
|
|
|||||||||
| Total |
100 | % | 100 | % | ||||||||
|
|
|
|
|
|||||||||
70
Table of Contents
In accordance with the fair value disclosure requirements with FASB ASC 820, “Fair Value Measurements and Disclosures,” the following assets were measured at fair value on a recurring basis at December 31, 2014 and 2013. Additional information regarding FASB ASC 820 and the fair value hierarchy can be found in Note 19, Fair Value Measurements.
| 2014 | 2013 | |||||||
| Asset Category |
||||||||
| Cash and cash equivalents |
$ | 347 | $ | 568 | ||||
| Fixed income funds |
||||||||
| Corporate bonds |
5,194 | 4,005 | ||||||
|
|
|
|
|
|||||
| Total fixed income funds |
5,194 | 4,005 | ||||||
| Equity funds and equities |
||||||||
| Mutual funds |
3,566 | 9,142 | ||||||
| Common stock |
6,098 | 1,324 | ||||||
|
|
|
|
|
|||||
| Total mutual funds and equities |
9,664 | 10,466 | ||||||
| Total |
$ | 15,205 | $ | 15,039 | ||||
|
|
|
|
|
|||||
Cash equivalents. The Company uses quoted market prices to determine the fair value of these investments in interest-bearing cash accounts and they are classified in Level 1 of the fair value hierarchy. The carrying amounts approximate fair value because of the short maturity of the instruments.
Fixed income funds. Investments within the fixed income funds category consist of fixed income corporate debt. The Company uses quoted market prices to determine the fair value of these fixed income funds. These instruments consist of exchange-traded government and corporate bonds and are classified in Level 1 of the fair value hierarchy.
Equity funds and equities. The valuation of investments in registered investment companies is based on the underlying investments in securities. Securities traded on security exchanges are valued at the latest quoted sales price. Securities traded in the over-the-counter market and listed securities for which no sale was reported on that date are valued at the average of the last reported bid and ask quotations. These investments are classified in Level 1 of the fair value hierarchy.
The Company currently does not anticipate contributions to its United States defined benefit plans in 2015.
The following benefit payments are expected to be paid:
| Pension Benefits |
||||
| 2015 |
$ | 793 | ||
| 2016 |
822 | |||
| 2017 |
882 | |||
| 2018 |
915 | |||
| 2019 |
993 | |||
| Years 2020 — 2024 |
5,606 | |||
71
Table of Contents
United Kingdom Defined Benefit Plan
The Portec Rail Products (UK) Limited Pension Plan covers certain current employees, former employees, and retirees. The plan has been frozen to new entrants since April 1, 1997 and also covers the former employees of a merged plan after January 2002. Benefits under the plan were based on years of service and eligible compensation during defined periods of service. Our funding policy for the plan is to make minimum annual contributions required by applicable regulations.
The funded status of the United Kingdom defined benefit plan at year end is as follows:
| 2014 | 2013 | |||||||
| Changes in benefit obligation: |
||||||||
| Benefit obligation at beginning of year |
$ | 8,450 | $ | 8,034 | ||||
| Interest cost |
360 | 348 | ||||||
| Actuarial loss |
883 | 162 | ||||||
| Benefits paid |
(397 | ) | (247 | ) | ||||
| Foreign currency exchange rate changes |
(499 | ) | 153 | |||||
|
|
|
|
|
|||||
| Benefit obligation at end of year |
$ | 8,797 | $ | 8,450 | ||||
|
|
|
|
|
|||||
| Change to plan assets: |
||||||||
| Fair value of assets at beginning of year |
$ | 6,769 | $ | 6,051 | ||||
| Actual gain on plan assets |
502 | 545 | ||||||
| Employer contribution |
284 | 303 | ||||||
| Benefits paid |
(397 | ) | (247 | ) | ||||
| Foreign currency exchange rate changes |
(401 | ) | 117 | |||||
|
|
|
|
|
|||||
| Fair value of assets at end of year |
6,757 | 6,769 | ||||||
|
|
|
|
|
|||||
| Funded status at end of year |
$ | (2,040 | ) | $ | (1,681 | ) | ||
|
|
|
|
|
|||||
| Amounts recognized in the consolidated balance sheet consist of: |
||||||||
| Other long-term liabilities |
$ | (2,040 | ) | $ | (1,681 | ) | ||
|
|
|
|
|
|||||
| Amounts recognized in accumulated other comprehensive income consist of: |
||||||||
| Net loss |
$ | 1,413 | $ | 906 | ||||
| Prior service cost |
112 | 142 | ||||||
| Transition obligation |
— | (50 | ) | |||||
|
|
|
|
|
|||||
| $ | 1,525 | $ | 998 | |||||
|
|
|
|
|
|||||
Net periodic pension costs for the three years ended December 31, 2014 are as follows:
| 2014 | 2013 | 2012 | ||||||||||
| Components of net periodic benefit cost: |
||||||||||||
| Interest cost |
$ | 360 | $ | 348 | $ | 338 | ||||||
| Expected return on plan assets |
(370 | ) | (321 | ) | (307 | ) | ||||||
| Amortization of transition obligation |
(50 | ) | (46 | ) | (49 | ) | ||||||
| Amortization of prior service cost |
30 | 22 | 23 | |||||||||
| Recognized net actuarial loss |
185 | 229 | 221 | |||||||||
|
|
|
|
|
|
|
|||||||
| Net periodic pension cost |
$ | 155 | $ | 232 | $ | 226 | ||||||
|
|
|
|
|
|
|
|||||||
72
Table of Contents
The weighted average assumptions in the following table represent the rates used to develop the actuarial present value of the projected benefit obligation for the year listed and also the net periodic benefit cost for the following year.
| 2014 | 2013 | 2012 | ||||||||||
| Discount rate |
3.6 | % | 4.6 | % | 4.3 | % | ||||||
|
|
|
|
|
|
|
|||||||
| Expected rate of return on plan assets |
5.0 | % | 5.8 | % | 5.2 | % | ||||||
|
|
|
|
|
|
|
|||||||
Amounts applicable to the Company’s pension plans with accumulated benefit obligations in excess of plan assets are as follows:
| 2014 | 2013 | |||||||
| Projected benefit obligation |
$ | 8,797 | $ | 8,450 | ||||
| Accumulated benefit obligation |
8,797 | 8,450 | ||||||
| Fair value of plan assets |
6,757 | 6,769 | ||||||
|
|
|
|
|
|||||
The Company has estimated the long-term rate of return on plan assets based primarily on historical returns on plan assets, adjusted for changes in target portfolio allocations, and recent changes in long-term interest rates based on publicly available information.
Plan assets are invested by the trustees in accordance with a written statement of investment principles. This statement permits investment in equities, corporate bonds, United Kingdom government securities, commercial property, and cash, based on certain target allocation percentages. Asset allocation is primarily based on a strategy to provide steady growth without undue fluctuations. The target asset allocation percentages for 2014 are as follows:
| Portec Rail Plan | ||
| Equity securities |
Up to 100% | |
| Commercial property |
Not to exceed 50% | |
| U.K. Government securities |
Not to exceed 50% | |
| Cash |
Up to 100% |
Plan assets held within the Portec Rail Plan consist of cash and marketable securities which have been classified as Level 1 of the fair value hierarchy. All other plan assets have been classified as Level 2 of the fair value hierarchy.
The plan assets by category for the years ended December 31, are as follows:
| 2014 | 2013 | |||||||
| Asset Category |
||||||||
| Cash and cash equivalents |
$ | 218 | $ | 369 | ||||
| Equity securities |
2,156 | 2,803 | ||||||
| Bonds |
1,899 | 1,468 | ||||||
| Commercial property |
2,484 | 2,129 | ||||||
|
|
|
|
|
|||||
| Total |
$ | 6,757 | $ | 6,769 | ||||
|
|
|
|
|
|||||
United Kingdom regulations require trustees to adopt a prudent approach to funding required contributions to defined benefit pension plans. The Company anticipates making contributions of $280 to the Portec Rail Plan during 2015.
73
Table of Contents
The following estimated future benefits payments are expected to be paid under the Portec Rail Plan:
| Pension Benefits |
||||
| 2015 |
$ | 246 | ||
| 2016 |
270 | |||
| 2017 |
288 | |||
| 2018 |
307 | |||
| 2019 |
334 | |||
| Years 2020 — 2024 |
1,965 | |||
Other Post-Retirement Benefit Plan
Rail Technologies’ operation near Montreal, Quebec, Canada, maintains a post-retirement benefit plan, which provides retiree life insurance, health care benefits, and, for a closed group of employees, dental care. Retiring employees with a minimum of 10 years of service are eligible for the plan benefits. The plan is not funded. Cost of benefits earned by employees is charged to expense as services are rendered. The expense related to this plan was not material for 2014 and 2013. Rail Technologies’ accrued benefit obligation was $1,172 and $1,080 as of December 31, 2014 and 2013, respectively. Benefit payments anticipated for 2015 are not material. This obligation is recognized within other long-term liabilities.
The weighted average assumptions in the following table represent the rates used to develop the actuarial present value of the projected benefit obligation for the year listed and also the net periodic benefit cost for the following year.
| 2014 | 2013 | |||||||
| Discount rate |
4.0 | % | 5.0 | % | ||||
|
|
|
|
|
|||||
| Weighted average health care trend rate |
6.2 | % | 6.4 | % | ||||
|
|
|
|
|
|||||
The weighted average health care rate trends downward to an ultimate rate of 4.4% in 2032.
A 1% increase in the assumed health care cost trend rate will increase the service and interest cost components of the expense by $5 and increase the accumulated post-retirement benefit obligation by approximately $66 for 2014. A 1% decrease in the assumed health care cost trend rate will decrease the service and interest cost components of the expense by $7 and decrease the accumulated post-retirement benefit obligation by $77 for 2014.
Defined Contribution Plans
The Company sponsors six defined contribution plans for hourly and salaried employees across our domestic and international facilities. The following table summarizes the expense associated with the contributions made to these plans.
| 2014 | 2013 | 2012 | ||||||||||
| United States |
$ | 2,425 | $ | 2,151 | $ | 2,107 | ||||||
| Canada |
227 | 266 | 269 | |||||||||
| United Kingdom |
158 | 136 | 116 | |||||||||
|
|
|
|
|
|
|
|||||||
| $ | 2,810 | $ | 2,553 | $ | 2,492 | |||||||
|
|
|
|
|
|
|
|||||||
Note 18.
Rental and Lease Information
The Company has capital and operating leases for certain plant facilities, office facilities, and equipment. Rental expense for the years ended December 31, 2014, 2013, and 2012 amounted to $3,062, $3,333, and $3,762, respectively. Generally, land and building leases include escalation clauses.
74
Table of Contents
The following is a schedule, by year, of the future minimum payments under capital and operating leases, together with the present value of the net minimum payments as of December 31, 2014:
| Year ending December 31, | Capital Leases |
Operating Leases |
||||||
| 2015 |
$ | 156 | $ | 2,512 | ||||
| 2016 |
149 | 1,850 | ||||||
| 2017 |
91 | 1,809 | ||||||
| 2018 |
68 | 1,635 | ||||||
| 2019 |
11 | 1,484 | ||||||
| 2020 and thereafter |
— | 7,818 | ||||||
|
|
|
|
|
|||||
| Total minimum lease payments |
475 | $ | 17,108 | |||||
|
|
|
|||||||
| Less amount representing interest |
28 | |||||||
|
|
|
|||||||
| Total present value of minimum payments |
447 | |||||||
| Less current portion of such obligations |
142 | |||||||
|
|
|
|||||||
| Long-term obligations with interest rates ranging from 2.95% to 5.25% |
$ | 305 | ||||||
|
|
|
|||||||
Assets recorded under capital leases are as follows:
| 2014 | 2013 | |||||||
| Land improvements |
— | 6,373 | ||||||
| Machinery and equipment at cost |
638 | 6,427 | ||||||
| Buildings |
— | 399 | ||||||
|
|
|
|
|
|||||
| 638 | 13,199 | |||||||
| Less accumulated amortization |
181 | 12,676 | ||||||
|
|
|
|
|
|||||
| Net capital lease assets |
$ | 457 | $ | 523 | ||||
|
|
|
|
|
|||||
Included in the Company’s 2012 “Other income” in the Consolidated Statements of Operations are gains totaling $577 which were recognized in connection with the Company’s 2008 sale-leaseback transaction. Including this amount, the Company recorded approximately $456 within “Other Income” related to this transaction for the period ended December 31, 2012.
Note 19.
Fair Value Measurements
The Company determines the fair value of assets and liabilities based on the exchange price that would be received for an asset or paid to transfer a liability (an exit price) in the principal or most advantageous market for the asset or liability in an orderly transaction between market participants. The fair values are based on assumptions that market participants would use when pricing an asset or liability, including assumptions about risk and the risks inherent in valuation techniques and the inputs to valuations. The fair value hierarchy is based on whether the inputs to valuation techniques are observable or unobservable. Observable inputs reflect market data obtained from independent sources, while unobservable inputs reflect the Company’s own assumptions of what market participants would use. The fair value hierarchy includes three levels of inputs that may be used to measure fair value as described below.
Level 1: Quoted market prices in active markets for identical assets or liabilities.
Level 2: Observable market-based inputs or unobservable inputs that are corroborated by market data.
Level 3: Unobservable inputs that are not corroborated by market data.
The Company has an established process for determining fair value for its financial assets and liabilities, principally cash and cash equivalents. Fair value is based on quoted market prices, where available. If quoted
75
Table of Contents
market prices are not available, fair value is based on assumptions that use as inputs market-based parameters. The following section describes the valuation methodologies used by the Company to measure different financial instruments at fair value, including an indication of the level in the fair value hierarchy in which each instrument is generally classified. Where appropriate, the description includes details of the key inputs to the valuations and any significant assumptions.
Cash equivalents. Included within “Cash and cash equivalents” are investments in money market funds with various underlying securities all of which maintain AAA credit ratings. Also included within cash equivalents are our investments in non-domestic bank certificates of deposit. The Company uses quoted market prices to determine the fair value of these investments and they are classified in Level 1 of the fair value hierarchy. The carrying amounts approximate fair value because of the short maturity of the instruments. As of December 31, 2014, the Company utilized its domestic cash equivalents for acquisitions and transferred the majority of its non-domestic cash equivalents to savings accounts.
The following assets of the Company were measured at fair value on a recurring basis subject to the disclosure requirements of ASC 820 at December 31, 2014 and December 31, 2013:
| Fair Value Measurements at Reporting Date Using |
Fair Value Measurements at Reporting Date Using |
|||||||||||||||||||||||||||||||||||
| December 31, 2014 |
Quoted Prices in Active Markets for Identical Assets (Level 1) |
Significant Other Observable Inputs (Level 2) |
Significant Unobservable Inputs (Level 3) |
December 31, 2013 |
Quoted Prices in Active Markets for Identical Assets (Level 1) |
Significant Other Observable Inputs (Level 2) |
Significant Unobservable Inputs (Level 3) |
|||||||||||||||||||||||||||||
| Assets |
||||||||||||||||||||||||||||||||||||
| Domestic money market funds |
$ | — | $ | — | $ | — | $ | — | $ | 18,276 | $ | 18,276 | $ | — | $ | — | ||||||||||||||||||||
| Non-domestic bank term deposits |
25 | 25 | — | — | 32,947 | 32,947 | — | — | ||||||||||||||||||||||||||||
|
|
|
|
|
|
|
|
|
|
|
|
|
|
|
|
|
|||||||||||||||||||||
| Total Assets |
$ | 25 | $ | 25 | $ | — | $ | — | $ | 51,223 | $ | 51,223 | $ | — | $ | — | ||||||||||||||||||||
|
|
|
|
|
|
|
|
|
|
|
|
|
|
|
|
|
|||||||||||||||||||||
Information regarding the fair value disclosures associated with the assets of the Company’s defined benefit plans can be found in Note 17, Retirement Plans.
Note 20.
Commitments and Contingent Liabilities
Product Warranty Claims
On July 12, 2011, the UPRR notified (UPRR Notice) the Company and its subsidiary, CXT Incorporated (CXT), of a warranty claim under CXT’s 2005 supply contract relating to the sale of pre-stressed concrete railroad ties to the UPRR. The UPRR asserted that a significant percentage of concrete ties manufactured in 2006 through 2011 at CXT’s Grand Island, NE facility failed to meet contract specifications, had workmanship defects and were cracking and failing prematurely. Of the 3.0 million ties manufactured between 1998 and 2011 from the Grand Island, NE facility, approximately 1.6 million ties were sold during the period the UPRR had claimed nonconformance. The 2005 contract called for each concrete tie which failed to conform to the specifications or had a material defect in workmanship to be replaced with 1.5 new concrete ties, provided, that UPRR within five years of the sale of a concrete tie, notified CXT of such failure to conform or such defect in workmanship. The UPRR Notice did not specify how many ties manufactured during this period were defective nor the exact nature of the alleged workmanship defect.
Following the UPRR Notice, the Company worked with material scientists and pre-stressed concrete experts to test a representative sample of Grand Island, NE concrete ties and assess warranty claims for certain concrete ties made in its Grand Island, NE facility between 1998 and 2011. The Company discontinued manufacturing operations in Grand Island, NE in early 2011.
76
Table of Contents
2012
During 2012, the Company completed sufficient testing and analysis to further understand this matter. Based upon testing results and expert analysis, the Company believed it discovered conditions, which largely related to the 2006 to 2007 manufacturing period, that can shorten the life of the concrete ties produced during this period. During the fourth quarter of 2012 and first quarter of 2013, the Company reached agreement with the UPRR on several matters including a process for the Company and the UPRR to work together to identify, prioritize, and replace defective ties that meet the criteria for replacement. This process applies to the ties the Company shipped to the UPRR from its Grand Island, NE facility from 1998 to 2011. During most of this period the Company’s warranty policy for UPRR carried a 5 year warranty with a 1.5:1 replacement ratio for any defective ties. In order to accommodate the UPRR and other customer concerns, the Company also reverted to a previously used warranty policy providing a 15 year warranty with a 1:1 replacement ratio. This change provided an additional 10 years of warranty protection. In the amended 2005 supply agreement, the Company and the UPRR also extended the supply of Tucson ties by five years and agreed on a cash payment of $12,000 to the UPRR as compensation for concrete ties already replaced by the UPRR during the investigation period.
During 2012, as a result of testing the Company conducted on concrete ties manufactured at its former Grand Island, NE facility and of the related developments of the UPRR and other customer matters, the Company recorded pre-tax warranty charges of $22,000 in “Cost of Goods Sold” within its Rail Products segment based on the Company’s estimate of the number of defective concrete ties that will ultimately require replacement during the applicable warranty periods.
2013
Throughout 2013, at the UPRR’s request and under the terms of the amended 2005 supply agreement, the Company provided warranty replacement concrete ties for use across certain UPRR subdivisions. The Company attempted to reconcile the quantity of warranty claims for ties replaced and obtain supporting detail for the ties removed. The Company believes that the UPRR did not replace concrete ties in accordance with the amended agreement and has not furnished adequate documentation throughout the replacement process in these subdivisions to support its full warranty claim. Based on the information received by the Company to date, the Company believes that a significant number of ties which the UPRR replaced in these subdivisions did not meet the criteria to be covered as warranty replacement ties under the amended 2005 supply agreement. The disagreement related to the 2013 warranty replacement activity includes approximately 170,000 ties where the Company provided detailed documentation supporting our position with reason codes that detail why these ties are not eligible for a warranty claim.
In late November 2013, the Company received notice from the UPRR asserting a material breach of the amended 2005 supply agreement. The UPRR’s notice asserted that the failure to honor its claims for warranty ties in these subdivisions was a material breach. Following receipt of this notice, the Company provided information to the UPRR to refute the UPRR’s claim of breach and included the reconciliation of warranty claims supported by substantial findings from the Company’s track observation team, all within the 90 day cure period. The Company also proposed further discussions to reach agreement on reconciliation for 2013 replacement activities and future replacement activities and a recommended process that will ensure future replacement activities are done with appropriate documentation and per the terms of the amended 2005 supply agreement.
2014
During the first quarter of 2014, the Company further responded within the 90 day cure period to the UPRR’s claim and presented a reconciliation for the subdivisions at issue. This proposed reconciliation was based on empirical data and visual observation from Company employees that were present during the replacement process for a substantial majority of the concrete ties replaced. The Company has spent considerable time documenting facts related to concrete tie condition and track condition to assess whether the ties replaced met the criteria to be eligible for replacement under the terms of the amended 2005 supply agreement.
During the second quarter of 2014, the Company increased its accrual by an additional $4,000 based on revised estimates of ties to be replaced. The Company continued to work with UPRR to identify, replace, and reconcile defective ties related to the warranty claim in accordance with the amended 2005 supply agreement.
77
Table of Contents
The Company and UPRR met during the third quarter of 2014 to evaluate each other’s position in an effort to work towards agreement on the unreconciled 2013 and 2014 replacement activity as well as the standards and practices to be implemented for future replacement activity and warranty tie replacement. No agreement was reached and the Company continues to endeavor to reconcile the replaced warranty ties with UPRR.
As of December 31, 2014, the Company and the UPRR have not been able to reconcile the disagreement related to the 2013 and 2014 warranty replacement activity. The disagreement relating to the 2014 warranty replacement activity includes approximately 90,100 ties that the Company believes are not warranty-eligible.
As a result of the current year replacement activity and related discussions with the UPRR, during the fourth quarter of 2014 the Company recognized a $4,766 charge to increase the warranty obligation to reflect the Company’s current expectations of tie failures, based upon scientific testing and other analysis, adjusted for ties already provided to the UPRR. The accrued concrete tie warranty reserve of $10,331 as of December 31, 2014 is the best estimate of the expected value of defective ties that will be replaced as a result of our observation and analysis of ties in track. While the Company believes this is a reasonable estimate of these potential warranty claims, these estimates could change due to the receipt of new information and future events. In the event the UPRR continues to replace ties and assert warranty claims in future years in the same manner as 2013 and 2014, we are likely to have a disagreement in those future years relating to the number of ties eligible for warranty claim.
In November and December of 2014, the Company received additional notices from the UPRR asserting that ties manufactured in 2000 were defective and again asserting material breaches of the amended 2005 supply agreement relating to warranty tie replacements as well as certain new ties provided to the UPRR being out of specification. The Company again responded to the UPRR that it was not in material breach of the amended 2005 supply agreement relating to warranty tie replacements and that new ties being manufactured complied with the specifications provided by the UPRR.
Although the Company has denied it is in material breach of the amended 2005 supply agreement, this dispute could jeopardize our amended 2005 supply agreement. For the years ended December 31, 2014, 2013, and 2012, sales to the UPRR from our Tucson, AZ facility were approximately $15,297, $12,664, and $25,441, respectively. Additionally, as of December 31, 2014 we had long-lived assets with a net book value of approximately $978 associated with the Tucson, AZ facility.
On January 23, 2015, the UPRR filed a Complaint and Demand for Jury Trial in the District Court for Douglas County, NE against the Company and its subsidiary, CXT Incorporated, asserting among other matters that the Company breached its express warranty, breached an implied covenant of good faith and fair dealing, anticipatorily repudiated its warranty obligations, and that UPRR’s exclusive and limited remedy provisions in the supply agreement have failed of their essential purpose which entitles UPRR to recover all incidental and consequential damages. The complaint seeks to cancel all duties of UPRR under the contracts, to adjudge the Company as having no remaining rights under the contracts, and to recover damages in an amount to be determined at trial for the value of unfulfilled warranty replacement ties and ties likely to become warranty eligible, for costs of cover for replacement ties, and for various incidental and consequential damages. The amended 2005 supply agreement provides that UPRR’s exclusive remedy is to receive a replacement tie that meets the contract specifications for each tie that failed to meet the contract specifications or otherwise contained a material defect provided that the Company receives written notice of such failure or defect within 15 years after that tie was produced. The amended 2005 supply agreement continues to provide that the Company’s warranty does not apply to ties that (a) have been repaired or altered without the Company’s written consent in such a way as to affect the stability or reliability thereof, (b) have been subject to misuse, negligence or accident, or (c) have been improperly maintained or used contrary to the specifications for which such ties were produced. The amended 2005 supply agreement also continues to provide that the Company’s warranty is in lieu of all other express or implied warranties and that neither party shall be subject to or liable for any incidental or consequential damages to the other party. The dispute is largely based on (1) claims submitted which the Company believes are for ties inaccurately rated that are not the responsibility of the Company and claims that do not meet the criteria of a warranty replacement and (2) UPRR’s assertion, which the Company vigorously disputes, that UPRR in future years will be entitled to warranty replacement ties for virtually all of the Grand Island ties. Many thousands of Grand Island ties have been performing in track for over ten years. In addition, a significant amount of Grand Island ties were rated by both parties in the excellent category of the rating system. The Company believes UPRR’s claims are without merit and intends to vigorously defend itself.
78
Table of Contents
The Company continues to engage in discussions in an effort to resolve this matter, however, we cannot predict that such discussions will be successful, the results of the litigation with UPRR, or whether any settlement or judgment amounts will be within the range of our estimated accruals for loss contingencies. Future potential costs pertaining to UPRR’s claims and the outcome of the UPRR litigation could result in a material adverse effect on our results of operations, financial condition, and cash flows.
The Company is subject to product warranty claims that arise in the ordinary course of its business. For certain manufactured products, the Company maintains a product warranty accrual which is adjusted on a monthly basis as a percentage of cost of sales. This product warranty accrual is periodically adjusted based on the identification or resolution of known individual product warranty claims. The following table sets forth the Company’s continuing operations product warranty accrual:
| Warranty Liability | ||||
| Balance at December 31, 2012 |
$ | 15,727 | ||
| Additions to warranty liability |
1,695 | |||
| Warranty liability utilized |
(9,939 | ) | ||
|
|
|
|||
| Balance at December 31, 2013 |
$ | 7,483 | ||
| Additions to warranty liability |
10,957 | |||
| Warranty liability utilized |
(6,992 | ) | ||
| Warranty liabilities acquired |
52 | |||
|
|
|
|||
| Balance at December 31, 2014 |
$ | 11,500 | ||
|
|
|
|||
Included within the above table are concrete tie warranty reserves of approximately $10,331 and $6,462, respectively, as of December 31, 2014 and 2013. For the periods ended December 31, 2014, 2013, and 2012, the Company recorded approximately $9,854, $612, and $23,019, respectively, in pre-tax concrete tie warranty charges within “Cost of Goods Sold” in the Company’s Rail Products segment primarily related to concrete ties manufactured at the Company’s former Grand Island, NE facility.
Environmental and Legal Proceedings
The Company is subject to national, state, foreign, and/or local laws and regulations relating to the protection of the environment. The Company is monitoring its potential environmental exposure related to current and former facilities. The Company’s efforts to comply with environmental regulations may have an adverse effect on its future earnings. In the opinion of management, compliance with the present environmental protection laws will not have a material adverse effect on the financial condition, results of operations, cash flows, competitive position, or capital expenditures of the Company.
The Company is also subject to legal proceedings and claims that arise in the ordinary course of its business. In the opinion of management, the amount of ultimate liability with respect to these actions will not materially affect the financial condition or liquidity of the Company. The resolution, in any reporting period, of one or more of these matters could have a material effect on the Company’s results of operations for that period.
As of December 31, 2014 and 2013, the Company maintained environmental and litigation reserves of $3,344 and $2,190, respectively.
Note 21.
Quarterly Financial Information (Unaudited)
As more fully described in Note 3 of the Notes to the Consolidated Financial Statements, “Acquisitions” the Company acquired Carr, FWO, and Chemtec, and the results of the subsidiary’s operations are included from the acquisition dates through December 31, 2014.
As more fully described in Note 4 of the Notes to the Consolidated Financial Statements, “Discontinued Operations,” the Company sold its SSD and Precise businesses in June 2012 and August 2012, respectively. The operations of these divisions qualified as a “component of an entity” under FASB ASC 205-20 and thus, the operations are classified as discontinued.
79
Table of Contents
Quarterly financial information for the years ended December 31, 2014 and 2013 is presented below:
| 2014 | ||||||||||||||||||||
| First | Second | Third | Fourth | |||||||||||||||||
| Quarter | Quarter | Quarter | Quarter | Total | ||||||||||||||||
| Net sales |
$ | 111,414 | $ | 166,832 | $ | 167,797 | $ | 161,149 | $ | 607,192 | ||||||||||
| Gross profit |
$ | 24,127 | $ | 30,700 | $ | 35,159 | $ | 31,605 | $ | 121,591 | ||||||||||
| Income from continuing operations |
$ | 3,649 | $ | 6,848 | $ | 9,119 | $ | 6,038 | $ | 25,654 | ||||||||||
| Income (loss) from discontinued operations |
$ | — | $ | 14 | $ | (3 | ) | $ | (9 | ) | $ | 2 | ||||||||
| Net income |
$ | 3,649 | $ | 6,862 | $ | 9,116 | $ | 6,029 | $ | 25,656 | ||||||||||
| Basic earnings per common share: |
||||||||||||||||||||
| From continuing operations |
$ | 0.36 | $ | 0.67 | $ | 0.89 | $ | 0.59 | $ | 2.51 | ||||||||||
| From discontinued operations |
$ | — | $ | 0.00 | $ | (0.00 | ) | $ | (0.00 | ) | $ | 0.00 | ||||||||
| Basic earnings per common share |
$ | 0.36 | $ | 0.67 | $ | 0.89 | $ | 0.59 | $ | 2.51 | ||||||||||
| Diluted earnings per common share: |
||||||||||||||||||||
| From continuing operations |
$ | 0.35 | $ | 0.66 | $ | 0.88 | $ | 0.58 | $ | 2.48 | ||||||||||
| From discontinued operations |
$ | — | $ | 0.00 | $ | (0.00 | ) | $ | (0.00 | ) | $ | 0.00 | ||||||||
| Diluted earnings per common share |
$ | 0.35 | $ | 0.67 | $ | 0.88 | $ | 0.58 | $ | 2.48 | ||||||||||
| Dividends paid per common share |
$ | 0.03 | $ | 0.03 | $ | 0.03 | $ | 0.04 | $ | 0.13 | ||||||||||
| 2013 | ||||||||||||||||||||
| First | Second | Third | Fourth | |||||||||||||||||
| Quarter | Quarter | Quarter | Quarter | Total | ||||||||||||||||
| Net sales |
$ | 129,321 | $ | 149,936 | $ | 162,248 | $ | 156,458 | $ | 597,963 | ||||||||||
| Gross profit |
$ | 24,848 | $ | 29,175 | $ | 31,305 | $ | 30,611 | $ | 115,939 | ||||||||||
| Income from continuing operations |
$ | 4,951 | $ | 7,257 | $ | 9,793 | $ | 7,275 | $ | 29,276 | ||||||||||
| (Loss) Income from discontinued operations |
$ | (24 | ) | $ | 38 | $ | — | $ | — | $ | 14 | |||||||||
| Net income |
$ | 4,927 | $ | 7,295 | $ | 9,793 | $ | 7,275 | $ | 29,290 | ||||||||||
| Basic earnings per common share: |
||||||||||||||||||||
| From continuing operations |
$ | 0.49 | $ | 0.71 | $ | 0.96 | $ | 0.71 | $ | 2.88 | ||||||||||
| From discontinued operations |
$ | (0.00 | ) | $ | 0.00 | $ | — | $ | — | $ | 0.00 | |||||||||
| Basic earnings per common share |
$ | 0.49 | $ | 0.72 | $ | 0.96 | $ | 0.71 | $ | 2.88 | ||||||||||
| Diluted earnings per common share: |
||||||||||||||||||||
| From continuing operations |
$ | 0.48 | $ | 0.71 | $ | 0.95 | $ | 0.71 | $ | 2.85 | ||||||||||
| From discontinued operations |
$ | (0.00 | ) | $ | 0.00 | $ | — | $ | — | $ | 0.00 | |||||||||
| Diluted earnings per common share |
$ | 0.48 | $ | 0.71 | $ | 0.95 | $ | 0.71 | $ | 2.85 | ||||||||||
| Dividends paid per common share |
$ | 0.03 | $ | 0.03 | $ | 0.03 | $ | 0.03 | $ | 0.12 | ||||||||||
80
Table of Contents
| ITEM 9. | CHANGES IN AND DISAGREEMENTS WITH ACCOUNTANTS ON ACCOUNTING AND FINANCIAL DISCLOSURE |
None.
| ITEM 9A. | CONTROLS AND PROCEDURES |
Evaluation of Disclosure Controls and Procedures
L.B. Foster Company carried out an evaluation, under the supervision and with the participation of the Company’s management, including the Chief Executive Officer and the Chief Financial Officer, of the effectiveness of the design and operation of the Company’s disclosure controls and procedures (as defined in Rule 13a–15(e) under the Securities and Exchange Act of 1934, as amended (the Exchange Act)) as of the end of the period covered by this report. Based on that evaluation, the Chief Executive Officer and Chief Financial Officer concluded that the Company’s disclosure controls and procedures were effective as of the end of the period covered by this report.
Managements’ Report on Internal Control Over Financial Reporting
The management of L.B. Foster Company is responsible for establishing and maintaining adequate internal control over financial reporting, as such term is defined in Exchange Act Rule 13a–15(f). L.B. Foster Company’s internal control system is designed to provide reasonable assurance to the Company’s management and Board of Directors regarding the reliability of financial reporting and the preparation of financial statements for external purposes in accordance with accounting principles generally accepted in the United States. All internal control systems, no matter how well designed, have inherent limitations. Accordingly, even effective controls can provide only reasonable assurance with respect to financial statement preparation and presentation. There were no significant changes in internal control over financial reporting (as defined in Rule 13a-15(f) under the Exchange Act) that occurred during the fourth quarter of 2014 that have materially affected, or are reasonably likely to materially affect, the Company’s internal control over financial reporting.
L.B. Foster Company’s management assessed the effectiveness of the Company’s internal control over financial reporting as of December 31, 2014. In making this assessment, management used criteria set forth by the Committee of Sponsoring Organizations of the Treadway Commission (COSO) in Internal Control-Integrated Framework (2013 Framework). Based on this assessment, management concluded that the Company maintained effective internal control over financial reporting as of December 31, 2014.
The SEC’s general guidance permits the exclusion of an assessment of the effectiveness of a registrant’s disclosure controls and procedures as they relate to its internal controls over financial reporting for an acquired business during the first year following such acquisition, if among other circumstances and factors there is not adequate time between the acquisition date and the date of assessment. As previously discussed in Note 3 — Acquisitions of this Annual Report on Form 10-K, L.B. Foster Company completed the acquisition of FWO and Chemtec, on October 29, 2014 and December 30, 2014, respectively. The acquired businesses constituted approximately 16% of total assets as of December 31, 2014 and less than 1% of revenues and pre-tax income for the year then ended. Management’s assessment and conclusion on the effectiveness of the Company’s disclosure controls and procedures as of December 31, 2014 excluded an assessment of the internal control over financial reporting of the assets and business acquired for the FWO and Chemtec acquisitions.
Ernst & Young LLP, the independent registered public accounting firm that also audited the Company’s consolidated financial statements has issued an attestation report on the Company’s internal control over financial reporting. Ernst & Young’s attestation report on the Company’s internal control over financial reporting appears in Part II, Item 8 of this Annual Report on Form 10-K and is incorporated herein by reference.
81
Table of Contents
Report of Independent Registered Public Accounting Firm
The Board of Directors and Stockholders L. B. Foster Company and Subsidiaries
We have audited L.B. Foster Company and Subsidiaries’ internal control over financial reporting as of December 31, 2014, based on criteria established in Internal Control — Integrated Framework issued by the Committee of Sponsoring Organizations of the Treadway Commission (2013 framework) (the COSO criteria). L. B. Foster Company and Subsidiaries’ management is responsible for maintaining effective internal control over financial reporting, and for its assessment of the effectiveness of internal control over financial reporting included in the accompanying Managements’ Report on Internal Control over Financial Reporting. Our responsibility is to express an opinion on the company’s internal control over financial reporting based on our audit.
We conducted our audit in accordance with the standards of the Public Company Accounting Oversight Board (United States). Those standards require that we plan and perform the audit to obtain reasonable assurance about whether effective internal control over financial reporting was maintained in all material respects. Our audit included obtaining an understanding of internal control over financial reporting, assessing the risk that a material weakness exists, testing and evaluating the design and operating effectiveness of internal control based on the assessed risk, and performing such other procedures as we considered necessary in the circumstances. We believe that our audit provides a reasonable basis for our opinion.
A company’s internal control over financial reporting is a process designed to provide reasonable assurance regarding the reliability of financial reporting and the preparation of financial statements for external purposes in accordance with generally accepted accounting principles. A company’s internal control over financial reporting includes those policies and procedures that (1) pertain to the maintenance of records that, in reasonable detail, accurately and fairly reflect the transactions and dispositions of the assets of the company; (2) provide reasonable assurance that transactions are recorded as necessary to permit preparation of financial statements in accordance with generally accepted accounting principles, and that receipts and expenditures of the company are being made only in accordance with authorizations of management and directors of the company; and (3) provide reasonable assurance regarding prevention or timely detection of unauthorized acquisition, use, or disposition of the company’s assets that could have a material effect on the financial statements.
Because of its inherent limitations, internal control over financial reporting may not prevent or detect misstatements. Also, projections of any evaluation of effectiveness to future periods are subject to the risk that controls may become inadequate because of changes in conditions, or that the degree of compliance with the policies or procedures may deteriorate.
As indicated in the accompanying Managements’ Report on Internal Control over Financial Reporting, management’s assessment of and conclusion on the effectiveness of internal control over financial reporting did not include the internal controls of FWO and Chemtec Energy Services, L.L.C. (Chemtec) which are included in the 2014 consolidated financial statements of L.B. Foster Company and Subsidiaries and constituted approximately 16% of total assets as of December 31, 2014 and less than 1% of revenues and pre-tax income for the year then ended. Our audit of internal control over financial reporting of L.B. Foster Company and Subsidiaries also did not include an evaluation of the internal control over financial reporting of FWO and Chemtec.
In our opinion, L. B. Foster Company and Subsidiaries maintained, in all material respects, effective internal control over financial reporting as of December 31, 2014, based on the COSO criteria.
We also have audited, in accordance with the standards of the Public Company Accounting Oversight Board (United States), the consolidated balance sheets of L. B. Foster Company and Subsidiaries, as of December 31, 2014 and 2013, and the related consolidated statements of operations, comprehensive income, stockholders’ equity, and cash flows for each of the three years in the period ended December 31, 2014 and our report dated March 3, 2015 expressed an unqualified opinion thereon.
| /s/ Ernst & Young LLP |
Pittsburgh, Pennsylvania
March 3, 2015
82
Table of Contents
| ITEM 9B. | OTHER INFORMATION |
None.
PART III
| ITEM 10. | DIRECTORS, EXECUTIVE OFFICERS, AND CORPORATE GOVERNANCE |
The information required by this Item regarding the directors of the Company is incorporated herein by reference to the information included in the Company’s proxy statement for the 2015 annual meeting of stockholders (the “Proxy Statement”) under the caption “Election of Directors.”
The information required by this Item regarding the executive officers of the Company is set forth in Part I of this Annual Report on Form 10-K under the caption “Executive Officers of the Registrant” and is incorporated herein by reference.
The information required by this Item regarding compliance with Section 16(a) of the Securities Exchange Act of 1934 is incorporated herein by reference to the information included in the Proxy Statement under the caption “Section 16(a) Beneficial Reporting Compliance.”
The information required by this Item regarding our Code of Ethics is set forth in Part I of this Annual Report on Form 10-K under the caption “Code of Ethics” and is incorporated herein by reference.
The information required by this Item regarding our audit committee and the audit committee financial expert(s) is incorporated herein by reference to the information included in the Proxy Statement under the caption “Corporate Governance — Board Committees — Audit Committee.”
| ITEM 11. | EXECUTIVE COMPENSATION |
The information required by this Item regarding executive compensation is incorporated herein by reference to the information included in the Proxy Statement under the captions “Director Compensation — 2014,” “Executive Compensation,” “Summary Compensation Table (2014, 2013, and 2012),” “Grants of Plan-Based Awards in 2014,” “Outstanding Equity Awards At 2014 Fiscal Year-End,” “2014 Options Exercises and Stock Vested Table,” “2014 Nonqualified Deferred Compensation,” “Change-In-Control,” “Compensation Committee Interlocks and Insider Participation,” and “Compensation Committee Report.”
| ITEM 12. | SECURITY OWNERSHIP OF CERTAIN BENEFICIAL OWNERS AND MANAGEMENT AND RELATED STOCKHOLDER MATTERS |
The information required by this Item regarding the Company’s equity compensation plans is set forth in Part II, Item 5 of this Annual Report on Form 10-K under the caption “Securities Authorized for Issuance Under Equity Compensation Plans” and is incorporated herein by reference.
The information required by this Item regarding the beneficial ownership of the Company is incorporated herein by reference to the information included in the Proxy Statement under the caption “Stock Ownership.”
| ITEM 13. | CERTAIN RELATIONSHIPS AND RELATED TRANSACTIONS, AND DIRECTOR INDEPENDENCE |
The information required by this Item regarding transactions with related persons is incorporated herein by reference to the information included in the Proxy Statement under the caption “Corporate Governance — Transactions with Related Parties.”
The information required by this Item regarding director independence is incorporated herein by reference to information included in the Proxy Statement under the caption “Corporate Governance — The Board and Board Meetings.”
| ITEM 14. | PRINCIPAL ACCOUNTANT FEES AND SERVICES |
The information required by this Item regarding principal accountant fees and services is incorporated herein by reference to information included in the Proxy Statement under the caption “Independent Registered Public Accountants’ Fees.”
83
Table of Contents
PART IV
| ITEM 15. | EXHIBITS, FINANCIAL STATEMENT SCHEDULES |
The following documents are filed as a part of this Report:
(a)(1). Financial Statements
The following Reports of Independent Registered Public Accounting Firm, consolidated financial statements, and accompanying notes are included in Item 8 of this Report:
| Reports of Independent Registered Public Accounting Firm. |
||
| Consolidated Balance Sheets as of December 31, 2014 and 2013. | ||
| Consolidated Statements of Operations for the Years Ended December 31, 2014, 2013, and 2012. | ||
| Consolidated Statements of Comprehensive Income for the Years Ended December 31, 2014, 2013, and 2012. | ||
| Consolidated Statements of Cash Flows for the Years Ended December 31, 2014, 2013, and 2012. | ||
| Consolidated Statements of Stockholders’ Equity for the Years Ended December 31, 2014, 2013, and 2012. | ||
| Notes to Consolidated Financial Statements. | ||
(a)(2). Financial Statement Schedule
Schedules for the Years Ended December 31, 2014, 2013, and 2012:
| II — Valuation and Qualifying Accounts. |
The remaining schedules are omitted because of the absence of conditions upon which they are required.
(a)(3). Exhibits
The Index to Exhibits immediately following the signature page are filed as part of this Annual Report on Form 10-K.
84
Table of Contents
L. B. FOSTER COMPANY AND SUBSIDIARIES
SCHEDULE II VALUATION AND QUALIFYING ACCOUNTS
FOR THE YEARS ENDED DECEMBER 31, 2014, 2013, AND 2012
| Additions | ||||||||||||||||||||
| Balance at | Charged to | Balance | ||||||||||||||||||
| Beginning | Costs and | at End | ||||||||||||||||||
| of Year | Expenses | Other (1) | Deductions (2) | of Year | ||||||||||||||||
| 2014 |
||||||||||||||||||||
| Deducted from assets to which they apply: |
||||||||||||||||||||
| Allowance for doubtful accounts |
$ | 1,099 | $ | 462 | $ | 30 | $ | 555 | $ | 1,036 | ||||||||||
|
|
|
|
|
|
|
|
|
|
|
|||||||||||
| 2013 |
||||||||||||||||||||
| Deducted from assets to which they apply: |
||||||||||||||||||||
| Allowance for doubtful accounts |
$ | 899 | $ | 236 | $ | — | $ | 36 | $ | 1,099 | ||||||||||
|
|
|
|
|
|
|
|
|
|
|
|||||||||||
| 2012 |
||||||||||||||||||||
| Deducted from assets to which they apply: |
||||||||||||||||||||
| Allowance for doubtful accounts |
$ | 1,725 | $ | (319 | ) | $ | — | $ | 507 | $ | 899 | |||||||||
|
|
|
|
|
|
|
|
|
|
|
|||||||||||
| (1) | Assumed allowance related to acquisitions |
| (2) | Notes and accounts receivable written off as uncollectible. |
85
Table of Contents
Pursuant to the requirements of Section 13 or 15(d) of the Securities Exchange Act of 1934, the Registrant has duly caused this report to be signed on its behalf by the undersigned, thereunto duly authorized.
| L.B. FOSTER COMPANY | ||||||
| Date: March 3, 2015 |
By: | /s/ Robert P. Bauer | ||||
| (Robert P. Bauer, | ||||||
| President and Chief Executive Officer) | ||||||
Pursuant to the requirements of the Securities Exchange Act of 1934, this report has been signed below by the following persons on behalf of the Registrant and in the capacities and on the dates indicated.
| Name |
Position |
Date | ||||
| By: |
/s/ Lee B. Foster II |
Chairman of the Board and Director | March 3, 2015 | |||
| (Lee B. Foster II) | ||||||
| By: |
/s/ Robert P. Bauer |
President, Chief Executive Officer | March 3, 2015 | |||
| (Robert P. Bauer) | and Director | |||||
| By: |
/s/ Peter McIlroy II |
Director | March 3, 2015 | |||
| (Peter McIlroy II) | ||||||
| By: |
/s/ G. Thomas McKane |
Director | March 3, 2015 | |||
| (G. Thomas McKane) | ||||||
| By: |
/s/ Diane B. Owen |
Director | March 3, 2015 | |||
| (Diane B. Owen) | ||||||
| By: |
/s/ Robert S. Purgason |
Director | March 3, 2015 | |||
| (Robert S. Purgason) | ||||||
| By: |
/s/ William H. Rackoff |
Director | March 3, 2015 | |||
| (William H. Rackoff) | ||||||
| By: |
/s/ Suzanne B. Rowland |
Director | March 3, 2015 | |||
| (Suzanne B. Rowland) | ||||||
| By: |
/s/ David J. Russo |
Senior Vice President, | March 3, 2015 | |||
| (David J. Russo) | Chief Financial Officer | |||||
| and Treasurer | ||||||
| By: |
/s/ Christopher T. Scanlon |
Controller and Chief Accounting Officer | March 3, 2015 | |||
| (Christopher T. Scanlon) | ||||||
86
Table of Contents
INDEX TO EXHIBITS
All exhibits are incorporated herein by reference:
| 3.1 | Restated Certificate of Incorporation of the Company, incorporated by reference to Exhibit 3.1 to the Company’s Quarterly Report on Form 10-Q for the quarter ended March 31, 2003, File No. 0-10436, filed on May 13, 2003. | |
| 3.2 | Bylaws of the Company, incorporated by reference to Exhibit 3.1 to the Company’s Quarterly Report on Form 10-Q for the quarter ended September 30, 2012, File No. 0-10436, filed on November 8, 2012. | |
| 4.1 | Rights Agreement, amended and restated as of November 19, 2012, between L.B. Foster Company and American Stock Transfer & Trust Company, including the form of Rights Certificate and the Summary of Rights attached thereto, incorporated by reference to Exhibit 4.1 to the Company’s Current Report on Form 8-K, File No. 0-10436, filed on November 20, 2012. | |
| 10.0 | $200,000,000 Amended and Restated Credit Agreement dated September 23, 2014, between Registrant and PNC Bank, N.A., Bank of America, N.A., Wells Fargo Bank, N.A., and Citizens Bank of Pennsylvania, incorporated by reference to Exhibit 10.0 to the Company’s Current Report on Form 8-K, File No. 0-10436, filed on September 26, 2014. | |
| 10.1 | $125,000,000 Revolving Credit Facility Credit Agreement dated May 2, 2011, between Registrant and PNC Bank, N.A., Bank of America, N.A., Wells Fargo Bank, N.A., and Citizens Bank of Pennsylvania, incorporated by reference to Exhibit 10.0 to the Company’s Current Report on Form 8-K, File No. 0-10436, filed on May 4, 2011. | |
| 10.2 | First Amendment to Credit Agreement, incorporated by reference to Exhibit 10.1 to the Company’s Quarterly Report on Form 10-Q for the quarter ended September 30, 2012, File No. 0-10436, filed on November 8, 2012. | |
| 10.3 | Employment Agreement with Robert P. Bauer, dated January 18, 2012, incorporated by reference to Exhibit 10.1 to the Company’s Current Report on Form 8-K, File No. 0-10436, filed on January 23, 2012. | |
| 10.4 | 2006 Omnibus Incentive Plan, as amended and restated October 30, 2013, incorporated by reference to Exhibit 10.4 to the Company’s Annual Report on Form 10-K for the year ended December 31, 2013, File No. 0-10436, filed on February 27, 2014. | |
| 10.5 | Form of Restricted Stock Agreement (for grants made prior to December 23, 2011), incorporated by reference to Exhibit 10.1 to the Company’s Current Report on Form 8-K, File No. 0-10436, filed on December 21, 2011. | |
| 10.6 | Amended Form of Restricted Stock Agreement (for grants made on or after December 23, 2011), incorporated by reference to Exhibit 10.2 to the Company’s Current Report on Form 8-K, File No. 0-10436, filed on December 21, 2011. | |
| 10.7 | Restricted Stock Agreement between Registrant and David J. Russo dated May 28, 2010, incorporated by reference to Exhibit 10.62 to the Company’s Current Report on Form 8-K, File No. 0-10436, filed on June 1, 2010. | |
| 10.8 | Retention Performance Share Unit Award Agreement between Registrant and David R. Sauder dated March 15, 2011, incorporated by reference to Exhibit 10.14 to the Company’s Annual Report on Form 10-K for the year ended December 31, 2011, File No. 0-10436, filed on March 15, 2012. | |
| 10.9 | Form of Performance Share Unit Award Agreement (2008 – 2011), incorporated by reference to Exhibit 10.15 to the Company’s Annual Report on Form 10-K for the year ended December 31, 2011, File No. 0-10436, filed on March 15, 2012. | |
| 10.9.1 | Form of Performance Share Unit Award Agreement (2012), incorporated by reference to Exhibit 10.15.1 to the Company’s Annual Report on Form 10-K for the year ended December 31, 2011, File No. 0-10436, filed on March 15, 2012. |
87
Table of Contents
| 10.9.2 | Form of Performance Share Unit Award Agreement (2013), incorporated by reference to Exhibit 10.13.2 to the Company’s Annual Report on Form 10-K for the year ended December 31, 2012, File No. 0-10436, filed on March 8, 2013. | |
| 10.9.3 | Form of Performance Share Unit Award Agreement (2014), incorporated by reference to Exhibit 10.10.3 to the Company’s Annual Report on Form 10-K for the year ended December 31, 2013, File No. 0-10436, filed on February 27, 2014 | |
| 10.10 | Executive Annual Incentive Compensation Plan (as Amended and Restated), incorporated by reference to Exhibit A to the Company’s Definitive Proxy Statement on Schedule 14A, filed on April 12, 2013. | |
| 10.11 | Amended and Restated Key Employee Separation Plan, incorporated by reference to Exhibit 10.15 to the Company’s Annual Report on Form 10-K for the year ended December 31, 2012, File No. 0-10436, filed on March 8, 2013. | |
| 10.12 | Restated Supplemental Executive Retirement Plan, incorporated by reference to Exhibit 10.1 to the Company’s Quarterly Report on Form 10-Q for the quarter ended June 30, 2012, File No. 0-10436, filed on August 9, 2012. | |
| 10.13 | Amended and Restated 1998 Long-Term Incentive Plan as of May 25, 2005, incorporated by reference to Exhibit 10.34 to the Company’s Annual Report on Form 10-K for the year ended December 31, 2010, File No. 0-10436, filed on March 16, 2011. | |
| 10.14 | Amendment, effective May 24, 2006, to Amended and Restated 1998 Long-Term Incentive Plan as of May 25, 2005, incorporated by reference to Exhibit 10.34.1 to the Company’s Annual Report on Form 10-K for the year ended December 31, 2010, File No. 0-10436, filed on March 16, 2011. | |
| 10.15 | Medical Reimbursement Plan (MRP1) effective January 1, 2006, incorporated by reference to Exhibit 10.45 to the Company’s Annual Report on Form 10-K for the year ended December 31, 2010, File No. 0-10436, filed on March 16, 2011. | |
| 10.16 | Medical Reimbursement Plan (MRP2) effective January 1, 2006, incorporated by reference to Exhibit 10.45.1 to the Company’s Annual Report on Form 10-K for the year ended December 31, 2010, File No. 0-10436, filed on March 16, 2011. | |
| 10.17 | Amendments to MRP2, incorporated by reference to Exhibit 10.45.2 to the Company’s Annual Report on Form 10-K for the year ended December 31, 2010, File No. 0-10436, filed on March 16, 2011. | |
| 10.18 | Leased Vehicle Plan as amended and restated on September 1, 2007, incorporated by reference to Exhibit 10.46 to the Company’s Annual Report on Form 10-K for the year ended December 31, 2010, File No. 0-10436, filed on March 16, 2011. | |
| 10.19 | Non-Employee Director Compensation, incorporated by reference to Exhibit 10.1 to the Company’s Quarterly Report on Form 10-Q for the quarter ended June 30, 2013, File No. 0-10436, filed on August 6, 2013. | |
| 10.20 | 2014 Executive Annual Incentive Compensation Plan, incorporated by reference to Exhibit 10.1 to the Company’s Quarterly Report on Form 10-Q for the quarter ended March 31, 2014, File No. 0-10436, filed May 5, 2014. | |
| 10.21 | Form of 2014 Restricted Stock Agreement, incorporated by reference to Exhibit 10.2 to the Company’s Quarterly Report on Form 10-Q for the quarter ended March 31, 2014, File No. 0-10436, filed May 5, 2014. | |
| 10.22 | 2013 Executive Annual Incentive Compensation Plan, incorporated by reference to Exhibit 10.3 to the Company’s Quarterly Report on Form 10-Q for the quarter ended March 31, 2014, File No. 0-10436, filed May 5, 2014. | |
| 10.23 | 2012 Executive Annual Incentive Compensation Plan, incorporated by reference to Exhibit 10.4 to the Company’s Quarterly Report on Form 10-Q for the quarter ended March 31, 2014, File No. 0-10436, filed May 5, 2014. |
88
Table of Contents
| 10.24 | Retirement and Consulting Agreement and Non-Competition and Non-Solicitation Agreement dated June 20, 2014 between L.B. Foster Company and Donald L. Foster, incorporated by reference to Exhibit 10.1 to the Company’s Current Report on Form 8-K, File No. 0-10436, filed on June 20, 2014. | |
| 10.25 |
Release Agreement dated June 20, 2014 between L.B. Foster Company and Donald L. Foster, incorporated by reference to Exhibit 10.2 to the Company’s Current Report on Form 8-K, File No. 0-10436, filed on June 20, 2014. | |
| *21 | List of Subsidiaries | |
| *23 | Consent of Independent Registered Public Accounting Firm. | |
| *31.1 | Certification of Chief Executive Officer under Section 302 of the Sarbanes-Oxley Act of 2002. | |
| *31.2 | Certification of Chief Financial Officer under Section 302 of the Sarbanes-Oxley Act of 2002. | |
| *32.0 | Certification of Chief Executive Officer and Chief Financial Officer under Section 906 of the Sarbanes-Oxley Act of 2002. | |
| *101.INS | XBRL Instance Document. | |
| *101.SCH | XBRL Taxonomy Extension Schema Document. | |
| *101.CAL | XBRL Taxonomy Extension Calculation Linkbase Document. | |
| *101.DEF | XBRL Taxonomy Extension Definition Linkbase Document. | |
| *101.LAB | XBRL Taxonomy Extension Label Linkbase Document. | |
| *101.PRE | XBRL Taxonomy Extension Presentation Linkbase Document. | |
| * | Exhibits marked with an asterisk are filed herewith. |
89