Attached files
| file | filename |
|---|---|
| 8-K - 8-K - KAPSTONE PAPER & PACKAGING CORP | a15-3970_18k.htm |
| EX-99.1 - EX-99.1 - KAPSTONE PAPER & PACKAGING CORP | a15-3970_1ex99d1.htm |
Exhibit 99.2
|
|
2014 Fourth Quarter and Full Year Review Roger W. Stone Chairman and Chief Executive Officer Andrea K. Tarbox Vice President and Chief Financial Officer February 9, 2015 |
|
|
Forward Looking Statements Forward-Looking Statements The information in this presentation and statements made during this presentation may contain certain forward-looking statements within the meaning of federal securities laws. These statements reflect management’s expectations regarding future events and operating performance. Risk Factors These forward-looking statements involve a number of risks and uncertainties. A list of the factors that could cause actual results to differ materially from those expressed in, or underlying, any forward-looking statements can be found in the Company’s filings with the Securities and Exchange Commission, such as its annual and quarterly reports. The Company disclaims any obligation to revise or update such statements to reflect the occurrence of events after the date of this presentation. Non-GAAP Financial Measures This presentation refers to non-U.S. GAAP financial information. A reconciliation of non-U.S. GAAP to U.S. GAAP financial measures is available on the company’s website at KapStonepaper.com under Investors. 2 |
|
|
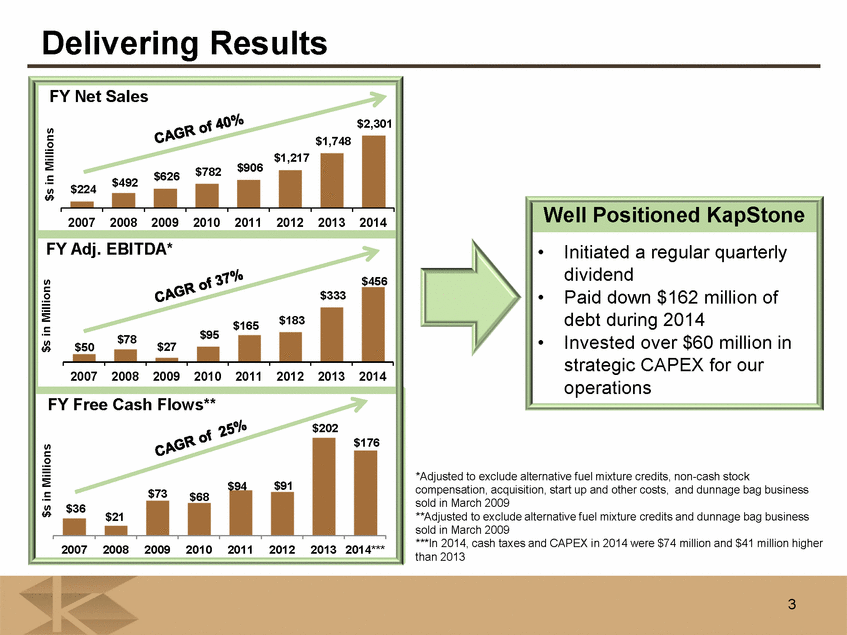
Delivering Results Well Positioned KapStone Initiated a regular quarterly dividend Paid down $162 million of debt during 2014 Invested over $60 million in strategic CAPEX for our operations *Adjusted to exclude alternative fuel mixture credits, non-cash stock compensation, acquisition, start up and other costs, and dunnage bag business sold in March 2009 **Adjusted to exclude alternative fuel mixture credits and dunnage bag business sold in March 2009 ***In 2014, cash taxes and CAPEX in 2014 were $74 million and $41 million higher than 2013 3 |
|
|
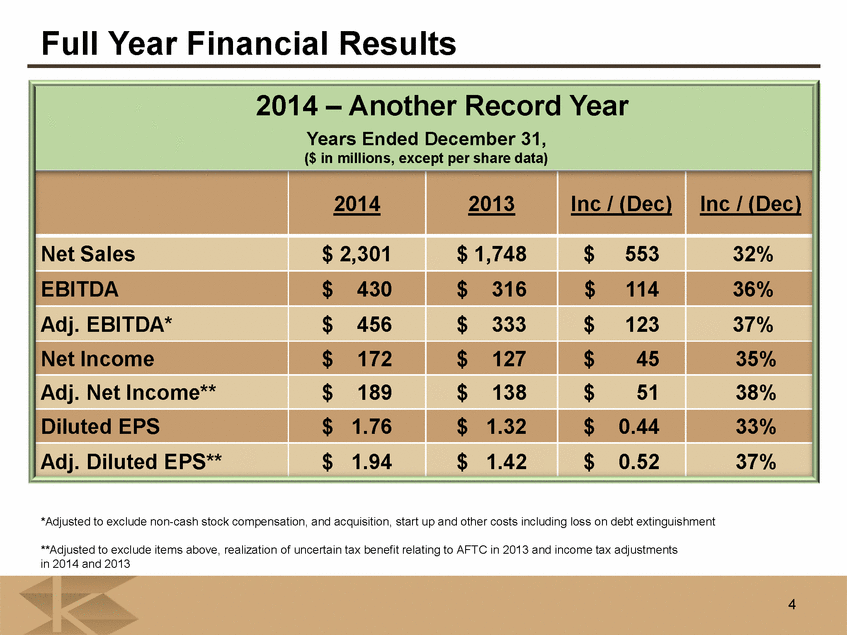
Full Year Financial Results 2014 – Another Record Year Years Ended December 31, ($ in millions, except per share data) 2014 2013 Inc / (Dec) Inc / (Dec) Net Sales $ 2,301 $ 1,748 $ 553 32% EBITDA $ 430 $ 316 $ 114 36% Adj. EBITDA* $ 456 $ 333 $ 123 37% Net Income $ 172 $ 127 $ 45 35% Adj. Net Income** $ 189 $ 138 $ 51 38% Diluted EPS $ 1.76 $ 1.32 $ 0.44 33% Adj. Diluted EPS** $ 1.94 $ 1.42 $ 0.52 37% **Adjusted to exclude items above, realization of uncertain tax benefit relating to AFTC in 2013 and income tax adjustments in 2014 and 2013 *Adjusted to exclude non-cash stock compensation, and acquisition, start up and other costs including loss on debt extinguishment 4 |
|
|
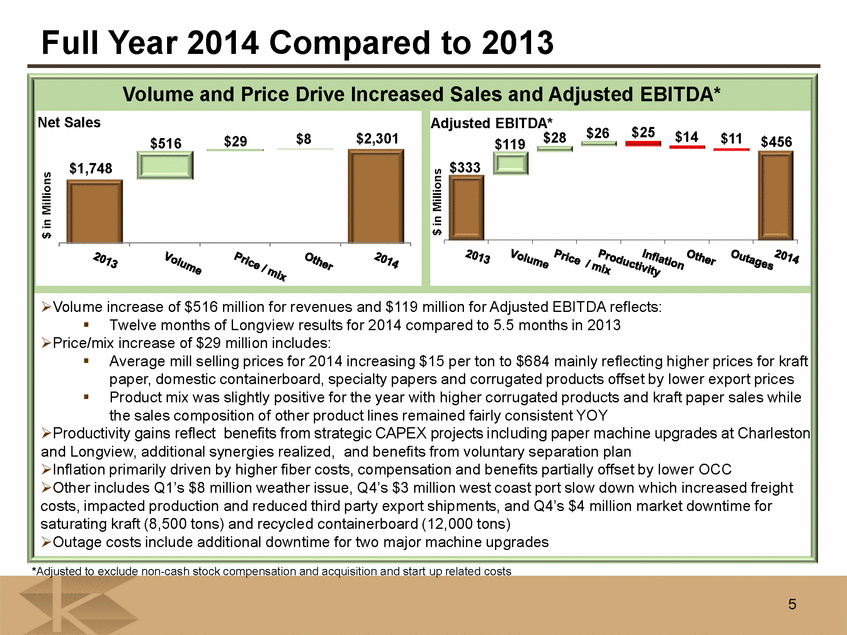
Full Year 2014 Compared to 2013 olume increase of $516 million for revenues and $119 million for Adjusted EBITDA reflects: • Twelve months of Longview results for 2014 compared to 5.5 months in 2013 >Price/mix increase of $29 million includes: • Average mill selling prices for 2014 increasing $15 per ton to $684 mainly reflecting higher prices for kraft paper, domestic containerboard, specialty papers and corrugated products offset by lower export prices • Product mix was slightly positive for the year with higher corrugated products and kraft paper sales while the sales composition of other product lines remained fairly consistent YOY >Productivity gains reflect benefits from strategic CAPEX projects including paper machine upgrades at Charleston and Longview, additional synergies realized, and benefits from voluntary separation plan >Inflation primarily driven by higher fiber costs, compensation and benefits partially offset by lower OCC >Other includes Q1 ’s $8 million weather issue, Q4’s $3 million west coast port slow down which increased freight costs, impacted production and reduced third party export shipments, and Q4’s $4 million market downtime for saturating kraft (8,500 tons) and recycled containerboard (12,000 tons) >Outage costs include additional downtime for two major machine upgrades *Adjusted to exclude non-cash stock compensation and acquisition and start up related costs 5 |
|
|
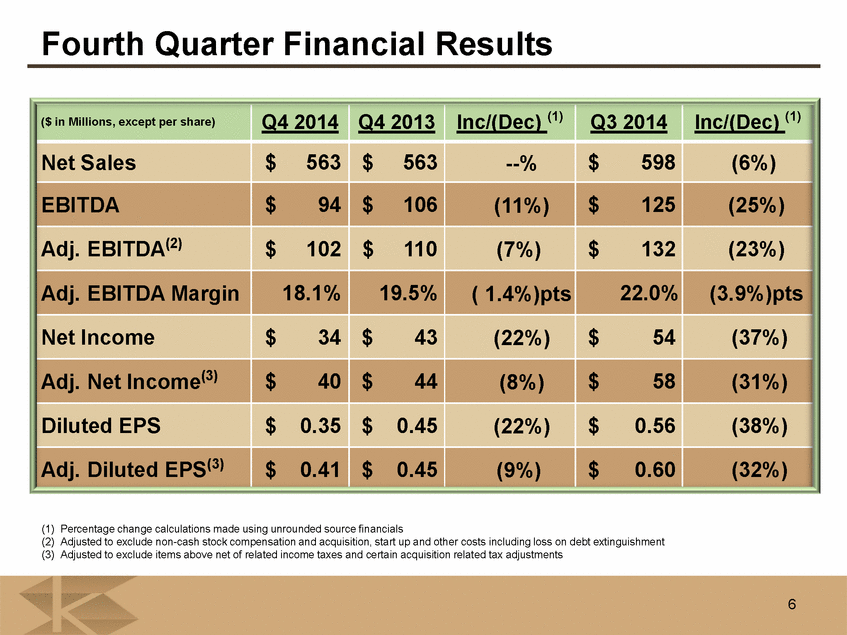
Fourth Quarter Financial Results ($ in Millions, except per share) Q4 2014 Q4 2013 Inc/(Dec) (1) Q3 2014 Inc/(Dec) (1) Net Sales $ 563 $ 563 --% $ 598 (6%) EBITDA $ 94 $ 106 (11%) $ 125 (25%) Adj. EBITDA(2) $ 102 $ 110 (7%) $ 132 (23%) Adj. EBITDA Margin 18.1% 19.5% ( 1.4%)pts 22.0% (3.9%)pts Net Income $ 34 $ 43 (22%) $ 54 (37%) Adj. Net Income(3) $ 40 $ 44 (8%) $ 58 (31%) Diluted EPS $ 0.35 $ 0.45 (22%) $ 0.56 (38%) Adj. Diluted EPS(3) $ 0.41 $ 0.45 (9%) $ 0.60 (32%) (1) Percentage change calculations made using unrounded source financials (2) Adjusted to exclude non-cash stock compensation and acquisition, start up and other costs including loss on debt extinguishment (3) Adjusted to exclude items above net of related income taxes and certain acquisition related tax adjustments 6 |
|
|
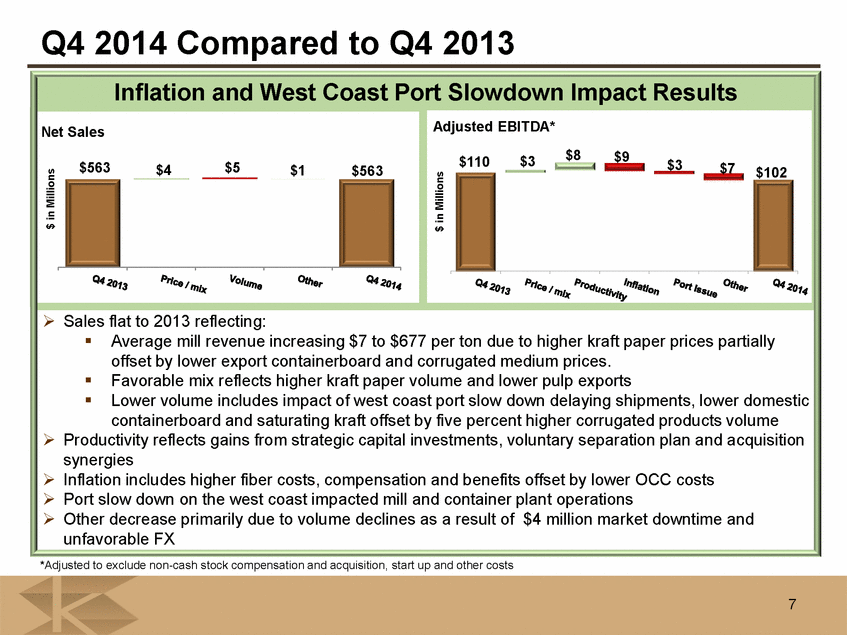
Q4 2014 Compared to Q4 2013 Sales flat to 2013 reflecting: Average mill revenue increasing $7 to $677 per ton due to higher kraft paper prices partially offset by lower export containerboard and corrugated medium prices. Favorable mix reflects higher kraft paper volume and lower pulp exports Lower volume includes impact of west coast port slow down delaying shipments, lower domestic containerboard and saturating kraft offset by five percent higher corrugated products volume Productivity reflects gains from strategic capital investments, voluntary separation plan and acquisition synergies Inflation includes higher fiber costs, compensation and benefits offset by lower OCC costs Port slow down on the west coast impacted mill and container plant operations Other decrease primarily due to volume declines as a result of $4 million market downtime and unfavorable FX *Adjusted to exclude non-cash stock compensation and acquisition, start up and other costs 7 |
|
|
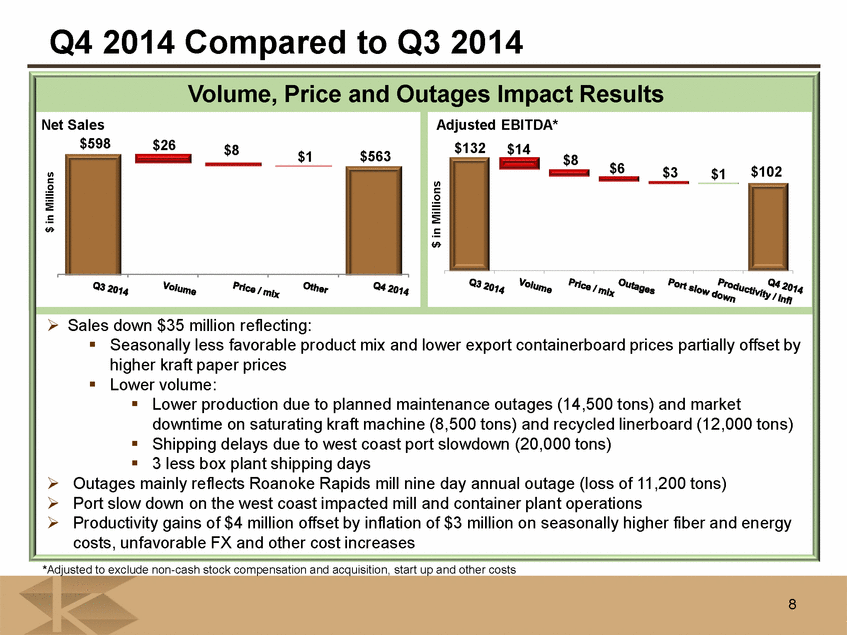
Q4 2014 Compared to Q3 2014 Volume, Price and Outages Impact Results Net Sales Adjusted EBITDA* $598 $26 $132 $14 $8 $1 $563 $8 $6 $3 $1 $102 $ in Millions $ in Millions Sales down $35 million reflecting: Seasonally less favorable product mix and lower export containerboard prices partially offset by higher kraft paper prices Lower volume: Lower production due to planned maintenance outages (14,500 tons) and market downtime on saturating kraft machine (8,500 tons) and recycled linerboard (12,000 tons) Shipping delays due to west coast port slowdown (20,000 tons) 3 less box plant shipping days Outages mainly reflects Roanoke Rapids mill nine day annual outage (loss of 11,200 tons) Port slow down on the west coast impacted mill and container plant operations Productivity gains of $4 million offset by inflation of $3 million on seasonally higher fiber and energy costs, unfavorable FX and other cost increases *Adjusted to exclude non-cash stock compensation and acquisition, start up and other costs 8 |
|
|
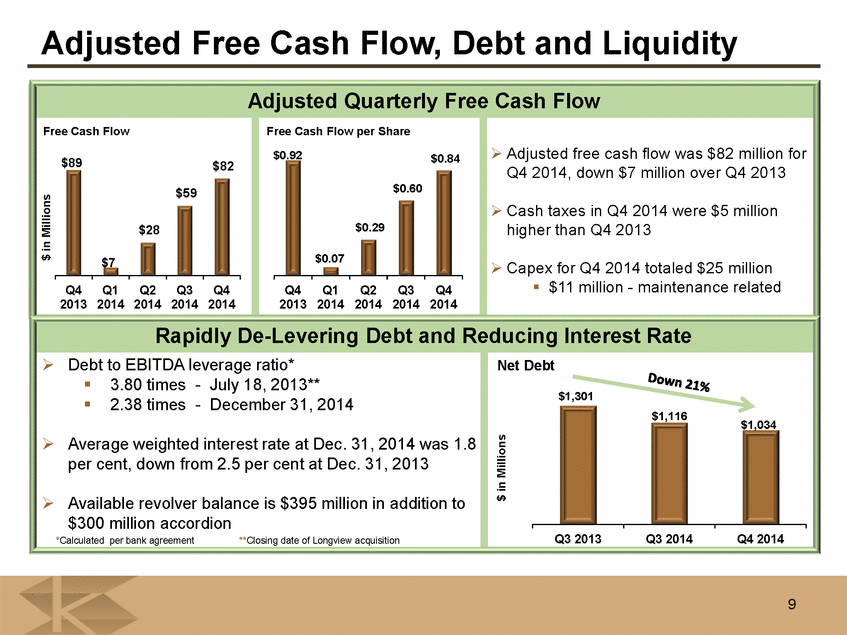
Adjusted Free Cash Flow, Debt and Liquidity Adjusted Quarterly Free Cash Flow Adjusted free cash flow was $82 million for Q4 2014, down $7 million over Q4 2013 Cash taxes in Q4 2014 were $5 million higher than Q4 2013 Capex for Q4 2014 totaled $25 million $11 million - maintenance related Rapidly De-Levering Debt and Reducing Interest Rate Debt to EBITDA leverage ratio* Net Debt 3.80 times - July 18, 2013** $1,301 2.38 times - December 31, 2014 $1,116 $1,034 Average weighted interest rate at Dec. 31, 2014 was 1.8 per cent, down from 2.5 per cent at Dec. 31, 2013 $ in Millions Available revolver balance is $395 million in addition to $300 million accordion * Calculated per bank agreement **Closing date of Longview acquisition Q3 2013 Q3 2014 Q4 2014 9 |
|
|
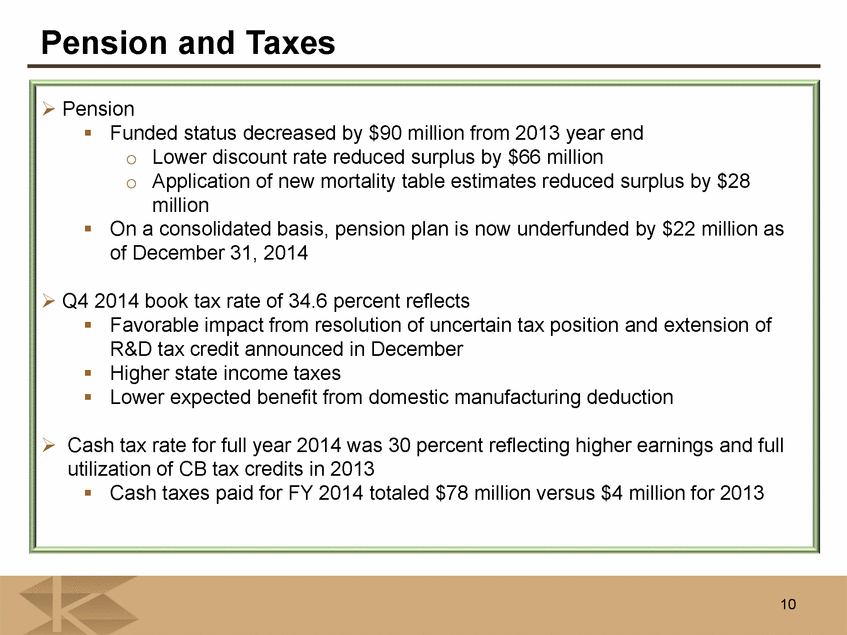
Pension and Taxes Pension Funded status decreased by $90 million from 2013 year end o Lower discount rate reduced surplus by $66 million o Application of new mortality table estimates reduced surplus by $28 million On a consolidated basis, pension plan is now underfunded by $22 million as of December 31, 2014 Q4 2014 book tax rate of 34.6 percent reflects Favorable impact from resolution of uncertain tax position and extension of R&D tax credit announced in December Higher state income taxes Lower expected benefit from domestic manufacturing deduction Cash tax rate for full year 2014 was 30 percent reflecting higher earnings and full utilization of CB tax credits in 2013 Cash taxes paid for FY 2014 totaled $78 million versus $4 million for 2013 10 |
|
|
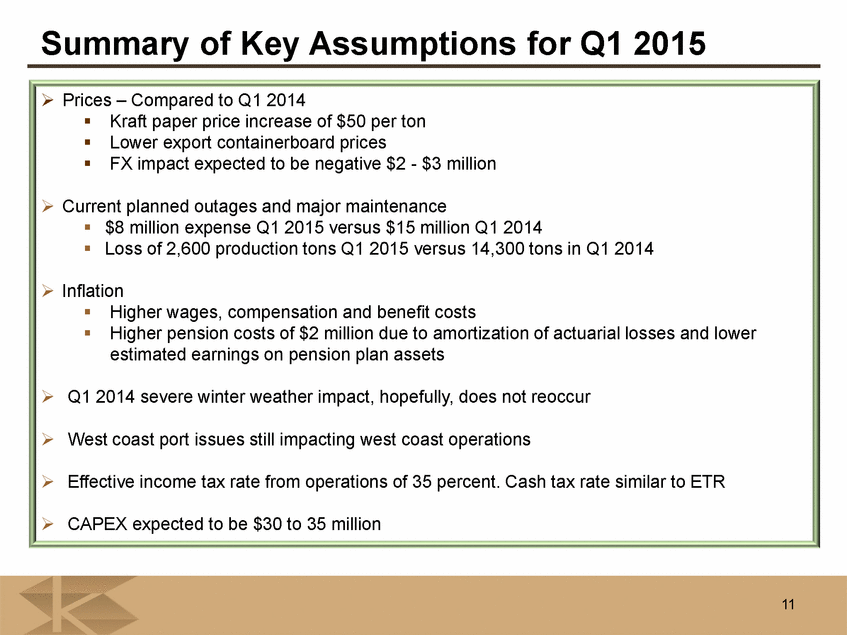
Summary of Key Assumptions for Q1 2015 Prices – Compared to Q1 2014 • Kraft paper price increase of $50 per ton • Lower export containerboard prices • FX impact expected to be negative $2 - $3 million > Current planned outages and major maintenance • $8 million expense Q1 2015 versus $15 million Q1 2014 • Loss of 2,600 production tons Q1 2015 versus 14,300 tons in Q1 2014 > Inflation • Higher wages, compensation and benefit costs • Higher pension costs of $2 million due to amortization of actuarial losses and lower estimated earnings on pension plan assets > Q1 2014 severe winter weather impact, hopefully, does not reoccur > West coast port issues still impacting west coast operations > Effective income tax rate from operations of 35 percent. Cash tax rate similar to ETR > CAPEX expected to be $30 to 35 million 11 |
|
|
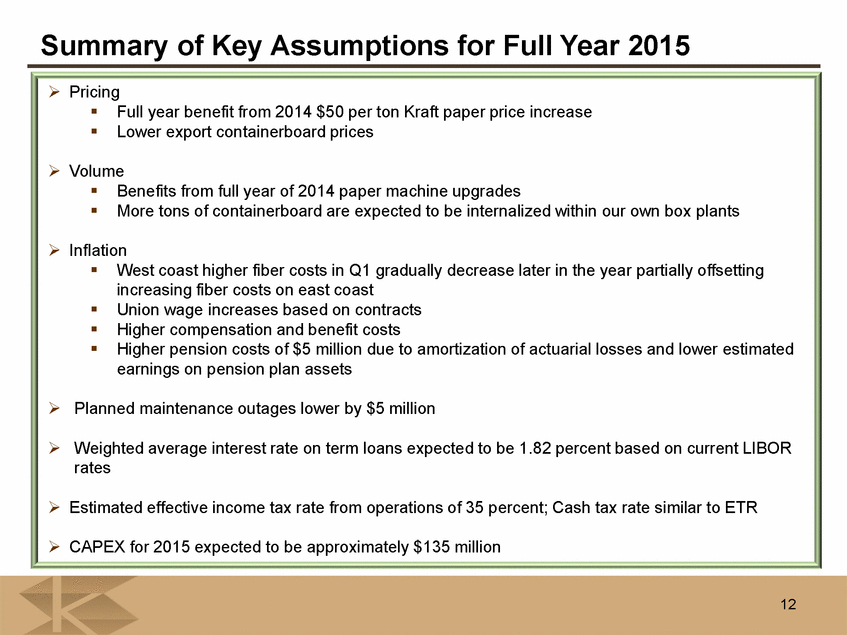
Summary of Key Assumptions for Full Year 2015 Pricing • Full year benefit from 2014 $50 per ton Kraft paper price increase • Lower export containerboard prices Volume • Benefits from full year of 2014 paper machine upgrades • More tons of containerboard are expected to be internalized within our own box plants Inflation • West coast higher fiber costs in Q1 gradually decrease later in the year partially offsetting increasing fiber costs on east coast • Union wage increases based on contracts • Higher compensation and benefit costs • Higher pension costs of $5 million due to amortization of actuarial losses and lower estimated earnings on pension plan assets Planned maintenance outages lower by $5 million Weighted average interest rate on term loans expected to be 1.82 percent based on current LIBOR rates > Estimated effective income tax rate from operations of 35 percent; Cash tax rate similar to ETR > CAPEX for 2015 expected to be approximately $135 million 12 |
|
|
Appendix |
|
|
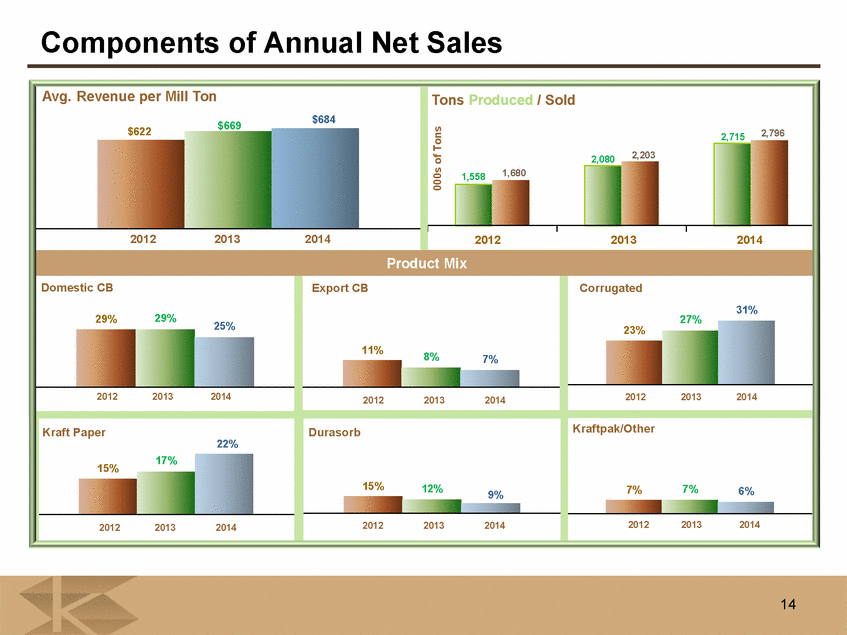
Components of Annual Net Sales Avg. Revenue per Mill Ton Tons Produced / Sold $684 $669 $622 2,796 2,715 2,080 2,203 000s of Tons 1,558 1,680 2012 2013 2014 2012 2013 2014 Product Mix Domestic CB Export CB Corrugated 31% 29% 29% 27% 25% 23% 11% 8% 7% 2012 2013 2014 2012 2013 2014 2012 2013 2014 Kraft Paper Durasorb Kraftpak/Other 22% 17% 15% 15% 12% 7% 7% 9% 6% 2012 2013 2014 2012 2013 2014 2012 2013 2014 14 |
|
|
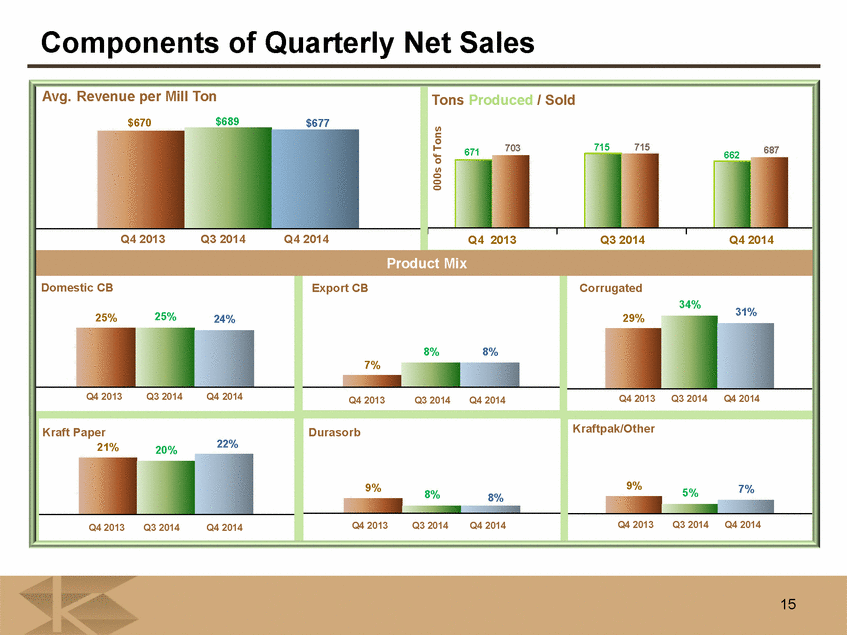
Components of Annual Net Sales Avg. Revenue per Mill Ton Tons Produced / Sold $684 $669 $622 2,796 2,715 2,080 2,203 000s of Tons 1,558 1,680 2012 2013 2014 2012 2013 2014 Product Mix Domestic CB Export CB Corrugated 31% 29% 29% 27% 25% 23% 11% 8% 7% 2012 2013 2014 2012 2013 2014 2012 2013 2014 Kraft Paper Durasorb Kraftpak/Other 22% 17% 15% 15% 12% 7% 7% 9% 6% 2012 2013 2014 2012 2013 2014 2012 2013 2014 13 Components of Quarterly Net Sales Avg. Revenue per Mill Ton Tons Produced / Sold $670 $689 $677 703 715 715 687 000s of Tons 671 662 Q4 2013 Q3 2014 Q4 2014 Q4 2013 Q3 2014 Q4 2014 Product Mix Domestic CB Export CB Corrugated 34% 25% 31% 25% 24% 29% 8% 8% 7% Q4 2013 Q3 2014 Q4 2014 Q4 2013 Q3 2014 Q4 2014 Q4 2013 Q3 2014 Q4 2014 Kraft Paper Durasorb Kraftpak/Other 21% 22% 20% 9% 9% 7% 8% 5% 8% Q4 2013 Q3 2014 Q4 2014 Q4 2013 Q3 2014 Q4 2014 Q4 2013 Q3 2014 Q4 2014 15 |
|
|
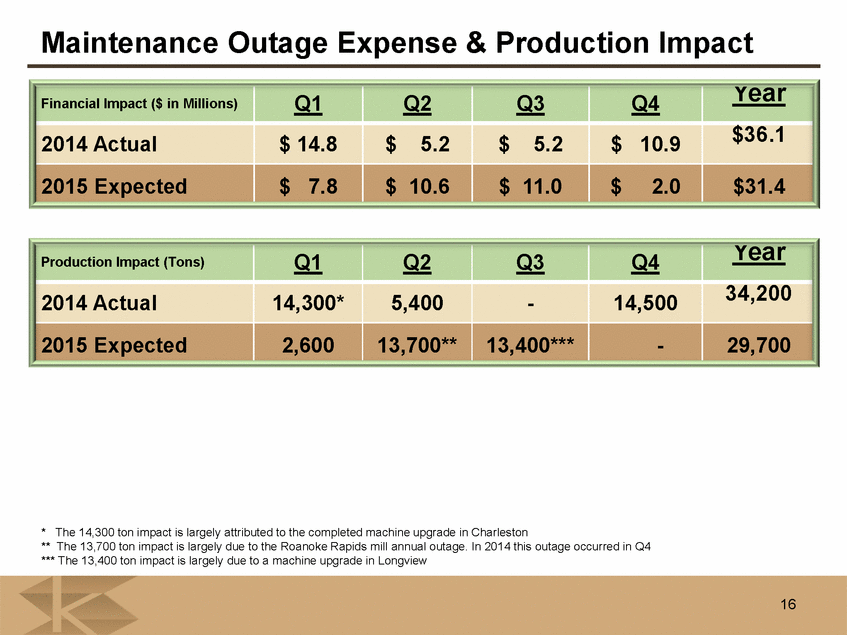
Maintenance Outage Expense & Production Impact Year Financial Impact ($ in Millions) Q1 Q2 Q3 Q4 $36.1 2014 Actual $ 14.8 $ 5.2 $ 5.2 $ 10.9 2015 Expected $ 7.8 $ 10.6 $ 11.0 $ 2.0 $31.4 Year Production Impact (Tons) Q1 Q2 Q3 Q4 34,200 2014 Actual 14,300* 5,400 - 14,500 2015 Expected 2,600 13,700** 13,400*** - 29,700 * The 14,300 ton impact is largely attributed to the completed machine upgrade in Charleston ** The 13,700 ton impact is largely due to the Roanoke Rapids mill annual outage. In 2014 this outage occurred in Q4 *** The 13,400 ton impact is largely due to a machine upgrade in Longview 16 |

