Attached files
| file | filename |
|---|---|
| 8-K - 8-K - GOLUB CAPITAL BDC, Inc. | v400537_8k.htm |
www.golubcapitalbdc.com GBDC Golub Capital BDC, Inc. Investor Presentation Quarter Ended December 31, 2014

Disclaimer Some of the statements in this presentation constitute forward-looking statements, which relate to future events or our future performance or financial condition. The forward-looking statements contained in this presentation involve risks and uncertainties, including statements as to: our future operating results; our business prospects and the prospects of our portfolio companies; the effect of investments that we expect to make and the competition for those investments; our contractual arrangements and relationships with third parties; actual and potential conflicts of interest with GC Advisors LLC ("GC Advisors"), our investment adviser, and other affiliates of Golub Capital LLC (collectively, "Golub Capital"); the dependence of our future success on the general economy and its effect on the industries in which we invest; the ability of our portfolio companies to achieve their objectives; the use of borrowed money to finance a portion of our investments; the adequacy of our financing sources and working capital; the timing of cash flows, if any, from the operations of our portfolio companies; general economic trends and other external factors; the ability of GC Advisors to locate suitable investments for us and to monitor and administer our investments; the ability of GC Advisors or its affiliates to attract and retain highly talented professionals; our ability to qualify and maintain our qualification as a regulated investment company and as a business development company; general price and volume fluctuations in the stock market; the impact on our business of the Dodd- Frank Wall Street Reform and Consumer Protection Act and the rules and regulations issued thereunder; and the effect of changes to tax legislation and our tax position. Such forward-looking statements may include statements preceded by, followed by or that otherwise include the words "may," "might," "will," "intend," "should," "could," "can," "would," "expect," "believe," "estimate," "anticipate," "predict," "potential," "plan" or similar words. We have based the forward-looking statements included in this presentation on information available to us on the date of this presentation, and we assume no obligation to update any such forward-looking statements. Actual results could differ materially from those anticipated in our forward-looking statements and future results could differ materially from historical performance. Although we undertake no obligation to revise or update any forward-looking statements, whether as a result of new information, future events or otherwise, you are advised to consult any additional disclosures that we may make directly to you or through reports that we have filed or in the future may file with the Securities and Exchange Commission ("SEC"), including annual reports on Form 10-K, registration statements on Form N-2, quarterly reports on Form 10-Q and current reports on Form 8-K. This presentation contains statistics and other data that have been obtained from or compiled from information made available by third-party service providers. We have not independently verified such statistics or data.
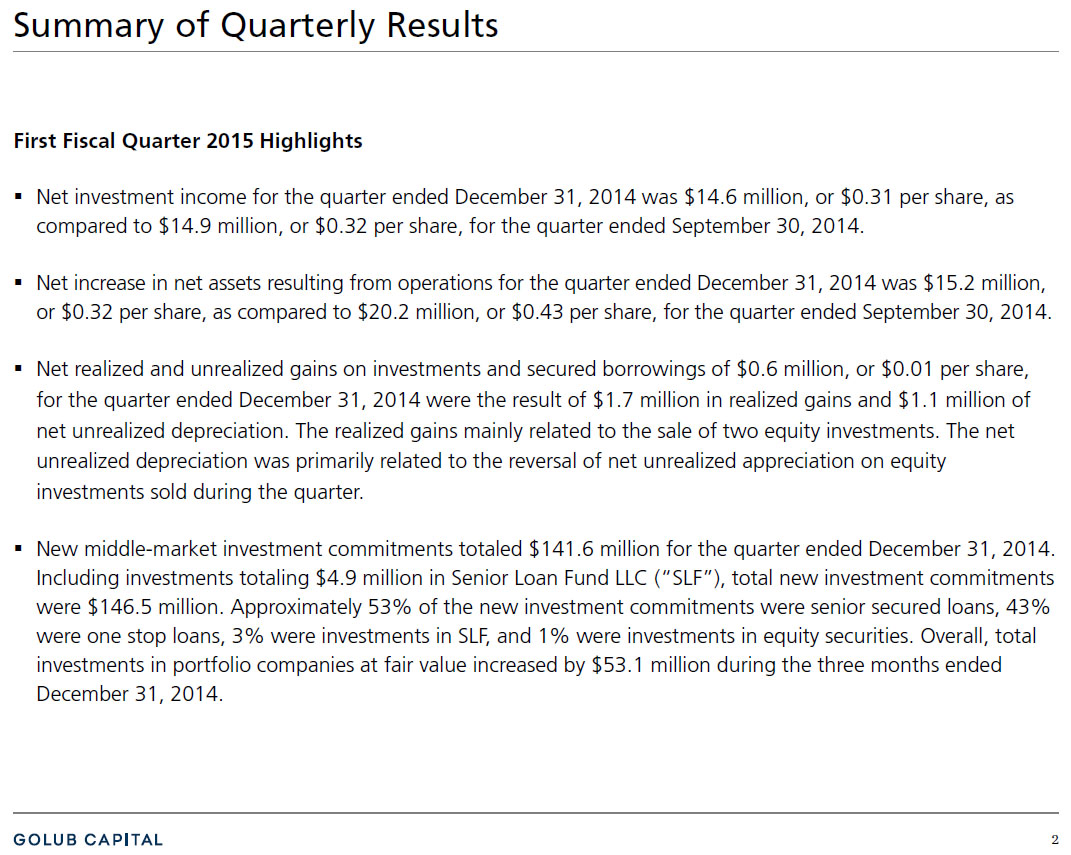
2 Summary of Quarterly Results First Fiscal Quarter 2015 Highlights Net investment income for the quarter ended December 31, 2014 was $14.6 million, or $0.31 per share, as compared to $14.9 million, or $0.32 per share, for the quarter ended September 30, 2014. Net increase in net assets resulting from operations for the quarter ended December 31, 2014 was $15.2 million, or $0.32 per share, as compared to $20.2 million, or $0.43 per share, for the quarter ended September 30, 2014. Net realized and unrealized gains on investments and secured borrowings of $0.6 million, or $0.01 per share, for the quarter ended December 31, 2014 were the result of $1.7 million in realized gains and $1.1 million of net unrealized depreciation. The realized gains mainly related to the sale of two equity investments. The net unrealized depreciation was primarily related to the reversal of net unrealized appreciation on equity investments sold during the quarter. New middle-market investment commitments totaled $141.6 million for the quarter ended December 31, 2014. Including investments totaling $4.9 million in Senior Loan Fund LLC ("SLF"), total new investment commitments were $146.5 million. Approximately 53% of the new investment commitments were senior secured loans, 43% were one stop loans, 3% were investments in SLF, and 1% were investments in equity securities. Overall, total investments in portfolio companies at fair value increased by $53.1 million during the three months ended December 31, 2014.

3 Financial Highlights Q1 2 015 Q4 2 014 Q3 2 014 Q2 2 014 Q1 2 014 Net investment income per share $ 0.31 $ 0.32 $ 0.32 $ 0.31 $ 0.31 Net realized /unrealized gain (loss) per share 0.01 0.11 0.03 0.01 0.03 Earnings per share 0.32 0.43 0. 35 0. 32 0. 34 Net asset value per share 15.55 15.55 15.44 15.41 15.23 Distributions paid per share 0.32 0.32 0.32 0.32 0.32 Q1 2 015 Q4 2 014 Q3 2 014 Q2 2 014 Q1 2 014 Investments in Securities, at Fair Value (000s) $ 1,361,021 $ 1,312,781 $ 1,290,493 $ 1,211,888 $ 1,147,169 Investments in SLF, at Fair Value (000s) $ 39,705 $ 34,831 $ 34,397 $ 41,709 $ 32,750 Total Fair Value of Investments (000s) $ 1,400,726 $ 1,347,612 $ 1,324,890 $ 1,253,597 $ 1,179,919 Number of Portfolio Company Investments 1 147 145 146 139 139 Average Investment Size (000s) $ 9,259 $ 9,054 $ 8,839 $ 8,719 $ 8,253 Fair Value as a Percentage of Principal (Loans) 98.5% 98.7% 98.9% 99.0% 99.0% 1. Excluding our investments in SLF.
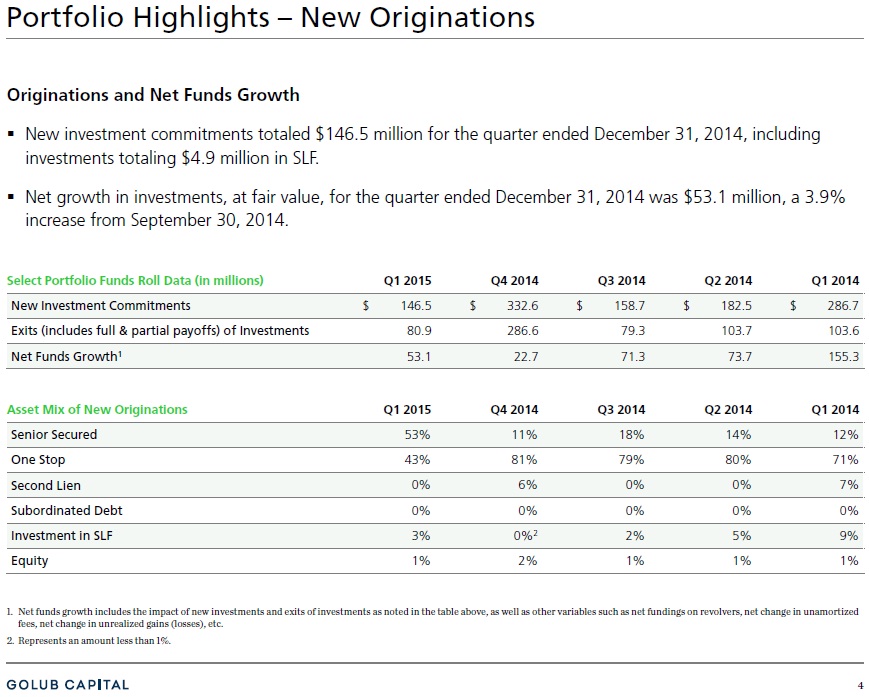
4 Portfolio Highlights – New Originations Originations and Net Funds Growth ▪ New investment commitments totaled $146.5 million for the quarter ended December 31, 2014, including investments totaling $4.9 million in SLF. ▪ Net growth in investments, at fair value, for the quarter ended December 31, 2014 was $53.1 million, a 3.9% increase from September 30, 2014. Select Portfolio Funds Roll Data (in millions) Q1 2 015 Q4 2 014 Q3 2 014 Q2 2 014 Q1 2 014 New Investment Commitments $ 146.5 $ 332.6 $ 158.7 $ 182.5 $ 286.7 Exits (includes full & partial payoffs) of Investments 80.9 286.6 79.3 103.7 103.6 Net Funds Growth 1 53.1 22.7 71.3 73.7 155.3 Asset Mix of New Originations Q1 2 015 Q4 2 014 Q3 2 014 Q2 2 014 Q1 2 014 Senior Secured 53% 11% 18% 14% 12% One Stop 43% 81% 79% 80% 71% Second Lien 0% 6% 0% 0% 7% Subordinated Debt 0% 0% 0% 0% 0% Investment in SLF 3% 0% 2 2% 5% 9% Equity 1% 2% 1% 1% 1% 1. Net funds growth includes the impact of new investments and exits of investments as noted in the table above, as well as othe r v ariables such as net fundings on revolvers, net change in unamortized fees, net change in unrealized gains (losses), etc. 2. Represents an amount less than 1%.

5 Portfolio Highlights – Portfolio Diversity as of December 31, 2014 Healthcare, Education & Childcare Retail Stores Div. Conglomerate Services Beverage, Food & Tobacco 1. The percentage of fixed rate loans and floating rate loans are calculated using total debt investments at fair value and excl ude equity investments . Borrower Diversity by Investment Size Industry Diversity of Investments Interest Rate on Loans 1 Electronics Aerospace & Defense Diversified / Conglomerate Manufacturing Leisure, Amusement, Motion Pictures, Entertainment Personal, Food & Miscellaneous Other Investment Portfolio (excluding SLF) $ 1,361mm 147 Investments – Average Size $9.3mm Top 10 Investments 23% Top 25 Investments 44% SLF 3% Remaining 122 Investments 53% Fixed – 0.3% Floating 99.7% 19% 13% 12% 9% 8% 6% 5% 4% 3% 2% 19% Historical Investment Portfolio ($mm) $1,180 $1,254 $1,325 $1,348 $1,401 $- $200 $400 $600 $800 $1,000 $1,200 $1,400 $1,600 Q1 2014 Q2 2014 Q3 2014 Q4 2014 Q1 2015 Inv. in SLF Equity Sub. Debt Second Lien One Stop Sr. Secured 25% 23% 22% 20% 18% 59% 61% 65% 70% 72% 9 % 9% 6 % 4 % 4% 3 % 3% 1 % 3% 3% 1% 3% 3% 1% 3% 3% <1% 3% 3% <1% Buildings & Real Estate
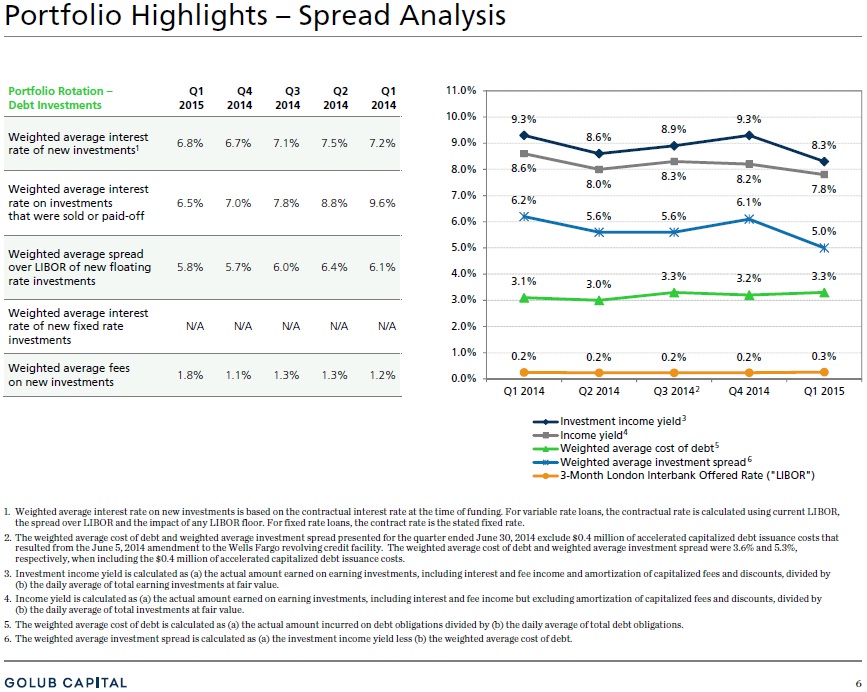
6 9.3% 8.6% 8.9% 9.3% 8.3% 8.6% 8.0% 8.3% 8.2% 7.8% 3.1% 3.0% 3.3% 3.2% 3.3% 6.2% 5.6% 5.6% 6.1% 5.0% 0.2% 0.2% 0.2% 0.2% 0.3% 0.0% 1.0% 2.0% 3.0% 4.0% 5.0% 6.0% 7.0% 8.0% 9.0% 10.0% 11.0% Q1 2014 Q2 2014 Q3 2014 Q4 2014 Q1 2015 Investment income yield Income yield Weighted average cost of debt Weighted average investment spread 3-Month London Interbank Offered Rate ("LIBOR") 3 5 4 6 2 Portfolio Highlights – Spread Analysis 1. Weighted average interest rate on new investments is based on the contractual interest rate at the time of funding. For varia ble rate loans, the contractual rate is calculated using current LIBOR, the spread over LIBOR and the impact of any LIBOR floor. For f ixe d rate loans, the contract rate is the stated fixed rate. 2. The weighted average cost of debt and weighted average investment spread presented for the quarter ended June 30, 2014 exclud e $ 0.4 million of accelerated capitalized debt issuance costs that resulted from the June 5, 2014 amendment to the Wells Fargo revol vin g credit facility. The weighted average cost of debt and weighted average investment spread were 3.6% and 5.3%, respectively, when in clu ding the $0.4 million of accelerated capitalized debt issuance costs. 3. Investment income yield is calculated as (a) the actual amount earned on earning investments , including interest and fee income and amortization of capitalized fees and discounts, divided by ( b) the daily average of total earning investments at fair value. 4. Income yield is calculated as (a) the actual amount earned on earning investments, including interest and fee income but excluding amortization of capitalized fees and discounts, divided by ( b) the daily average of total investments at fair value. 5. The weighted average cost of debt is calculated as (a) the actual amount incurred on debt obligations divided by (b) the daily average of total debt obligations. 6. The weighted average investment spread is calculated as (a) the investment income yield less (b) the weighted average cost of debt . Portfolio Rotation – Debt Investments Q1 2 015 Q4 2 014 Q3 2 014 Q2 2 014 Q1 2 014 Weighted average interest rate of new investments 1 6.8% 6.7% 7.1% 7.5% 7.2% Weighted average interest rate on investments that were sold or paid - off 6.5% 7.0% 7.8% 8.8% 9.6% Weighted average spread over LIBOR of new floating rate investments 5.8% 5.7% 6.0% 6.4% 6.1% Weighted average interest rate of new fixed rate investments N/A N/A N/A N/A N/A Weighted average fees on new investments 1.8% 1.1% 1.3% 1.3% 1.2%
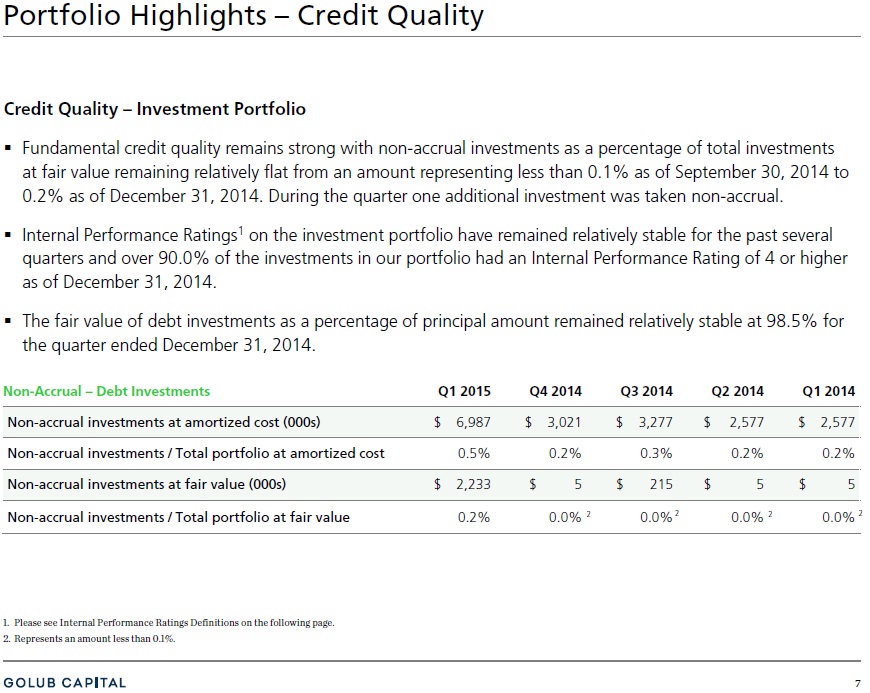
7 Portfolio Highlights – Credit Quality Credit Quality – Investment Portfolio ▪ Fundamental credit quality remains strong with non - accrual investments as a percentage of total investments at fair value remaining relatively flat from an amount representing less than 0.1% as of September 30, 2014 to 0.2% as of December 31, 2014 . During the quarter one additional investment was taken non - accrual . ▪ Internal Performance Ratings 1 on the investment portfolio have remained relatively stable for the past several quarters and over 90.0% of the investments in our portfolio had an Internal Performance Rating of 4 or higher as of December 31, 2014. ▪ The fair value of debt investments as a percentage of principal amount remained relatively stable at 98.5% for the quarter ended December 31, 2014. Non - Accrual – Debt Investments Q1 2 015 Q4 2 014 Q3 2 014 Q2 2 014 Q1 2 014 Non - accrual investments at amortized cost (000s) $ 6,987 $ 3,021 $ 3,277 $ 2,577 $ 2,577 Non - accrual investments / Total portfolio at amortized cost 0.5% 0.2% 0.3% 0.2% 0.2% Non - accrual investments at fair value (000s) $ 2,233 $ 5 $ 215 $ 5 $ 5 Non - accrual investments / Total portfolio at fair value 0.2% 0.0% 0.0% 0.0% 0.0% 1. Please see Internal Performance Ratings Definitions on the following page. 2. Represents an amount less than 0.1%. 2 2 2 2
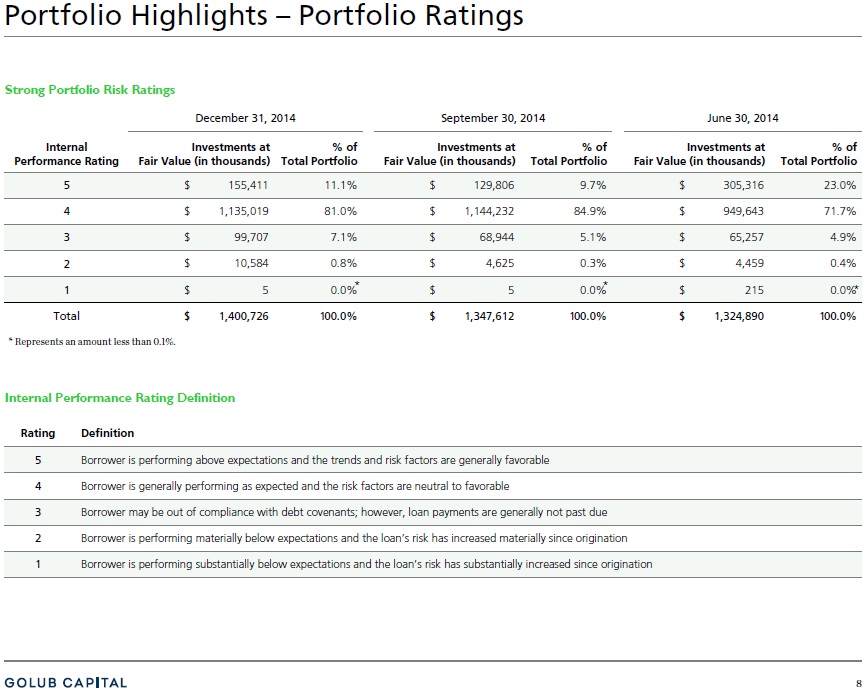
8 Portfolio Highlights – Portfolio Ratings Rating Definition 5 Borrower is performing above expectations and the trends and risk factors are generally favorable 4 Borrower is generally performing as expected and the risk factors are neutral to favorable 3 Borrower may be out of compliance with debt covenants; however, loan payments are generally not past due 2 Borrower is performing materially below expectations and the loan’s risk has increased materially since origination 1 Borrower is p erforming substantially below expectations and the loan’s risk has substantially increased since origination December 31, 2014 September 30, 2014 June 30, 2014 Internal Performance Rating Investments at Fair Value (in thousands) % of Total Portfolio Investments at Fair Value (in thousands) % of Total Portfolio Investments at Fair Value (in thousands) % of Total Portfolio 5 $ 155,411 11.1% $ 129,806 9.7% $ 305,316 23.0% 4 $ 1,135,019 81.0% $ 1,144,232 84.9% $ 949,643 71.7% 3 $ 99,707 7.1% $ 68,944 5.1% $ 65,257 4.9% 2 $ 10,584 0.8% $ 4,625 0.3% $ 4,459 0.4% 1 $ 5 0.0% $ 5 0.0% $ 215 0.0% Total $ 1,400,726 1 00.0% $ 1,347,612 1 00.0% $ 1,324,890 1 00.0% Strong Portfolio Risk Ratings Internal Performance Rating Definition * * * Represents an amount less than 0.1%. *

9 Quarterly Statements of Financial Condition As of ( Dollar amounts in thousands , except per share data) December 31, 2014 (unaudited) September 30, 2014 (audited ) June 30, 2014 (unaudited ) March 31, 2014 (unaudited ) December 31, 2013 (unaudited ) Assets Investments in securities, at fair value $ 1,400,726 $ 1,347,612 $ 1,324,890 $ 1,253,597 $ 1,179,919 Cash and cash equivalents 5,740 5,135 11,392 12,810 31,891 Restricted cash and cash equivalents 35,686 74,808 109,818 41,261 39,792 Other assets 18,431 15,833 16,013 13,976 13,225 Total Assets $ 1,460,583 $ 1,443,388 $ 1,462,113 $ 1,321,644 $ 1,264,827 Liabilities Debt $ 714,650 $ 697,150 $ 703,300 $ 572,150 $ 577,200 Secured borrowings, at fair value 380 389 20,264 18,222 14,366 Interest payable 4,455 3,196 3,689 1,691 3,159 Management and incentive fee payable 5,853 8,451 5,897 5,736 6,751 Payable for open trades – – – – 1,657 Other liabilities 1,527 1,463 2,189 1,915 1,713 Total Liabilities 726,865 710,649 735,339 599,714 604,846 Total Net Assets 733,718 732,739 726,774 721,930 659,981 Total Liabilities and Net Assets $ 1,460,583 $ 1,443,388 $ 1,462,113 $ 1,321,644 $ 1,264,827 Net Asset Value per Share $ 15.55 $ 15.55 $ 15.44 $ 15.41 $ 15.23 GAAP leverage 0.97x 0.95x 1.00x 0.82x 0.90x Regulatory leverage 1 0.69x 0.67x 0.71x 0.54x 0.60x Asset coverage 1 244.4% 249.1% 240.8% 285.5% 266.9% 1. On September 13, 2011, we received exemptive relief from the SEC to permit us to exclude the debt of our small business inves tme nt company (“SBIC”) subsidiaries from our 200% asset coverage test. As such , asset coverage and regulatory leverage exclude the SBA debentures of our SBICs.

10 Quarterly Operating Results For the three months ended ( Dollar amounts in thousands , except share and per share data) December 31, 2014 (unaudited) September 30, 2014 (unaudited) June 30, 2014 (unaudited) March 31, 2014 (unaudited) December 31, 2013 (unaudited) Investment Income Interest income $ 27,319 $ 28,840 $ 26,035 $ 24,977 $ 24,479 Dividend income 18 536 952 262 16 Fee income 208 1,282 1,042 21 1,084 Total Investment Income 27,545 30,658 28,029 25,260 25,579 Expenses Interest and other debt financing expenses 5,694 5,987 5,609 4,540 4,092 Base management fee 4,821 4,650 4,394 4,185 3,824 Incentive fee 1,071 3,833 1,607 1,656 3,032 Other operating expenses 1,402 1,338 1,346 1,527 1,371 Total Expenses 12,988 15,808 12,956 11,908 12,319 Net Investment Income 14,557 14,850 15,073 13,352 13,260 Net Gain (Loss) on Investments and Secured Borrowings Net realized gain (loss) on investments 1,726 10,290 1 87 ( 4,994) Net unrealized appreciation (depreciation) on investments and secured borrowings (1,111) (4,958) 1,206 662 6,571 Net gain (loss) on investments and secured borrowings 615 5,332 1,207 737 1,577 Net Increase in Net Assets Resulting from Operations $ 15,172 $ 20,182 $ 16,280 $ 14,089 $ 14,837 Per Share Earnings P er Share $ 0.32 $ 0.43 $ 0.35 $ 0.32 $ 0.34 Net Investment Income $ 0.31 $ 0.32 $ 0.32 $ 0.31 $ 0.31 Distributions Paid $ 0.32 $ 0.32 $ 0.32 $ 0.32 $ 0.32 Weighted average common shares outstanding 47,121,194 47,067,990 46,985,908 43,754,776 43,285,250 Common shares outstanding at end of period 47,171,518 47,119,498 47,065,030 46,857,608 43,325,575

11 0.31 0.31 0.32 0.32 0.31 0.03 0.01 0.03 0.11 0.01 $0.34 $0.32 $0.35 $0.43 $0.32 $0.00 $0.10 $0.20 $0.30 $0.40 $0.50 Q1'14 Q2'14 Q3'14 Q4'14 Q1'15 NII Gains/Loss 8.0% 8.1% 8.3% 8.1% 7.9% 8.9% 8.5% 9.0% 11.0% 8.2% 0% 2% 4% 6% 8% 10% 12% 14% Q1'14 Q2'14 Q3'14 Q4'14 Q1'15 NII Net Income $14.74 $14.75 $14.75 $14.56 $14.53 $14.69 $14.58 $14.60 $14.66 $14.80 $15.12 $15.21 $15.23 $15.41 $15.44 $15.55 $15.55 $14.00 $14.20 $14.40 $14.60 $14.80 $15.00 $15.20 $15.40 $15.60 $15.80 Q1'11 Q2'11 Q3'11 Q4'11 Q1'12 Q2'12 Q3'12 Q4'12 Q1'13 Q2'13 Q3'13 Q4'13 Q1'14 Q2'14 Q3'14 Q4'14 Q1'15 Financial Performance Highlights Quarterly EPS Composition Annualized Return on Average Equity 1, 2 GBDC Quarterly NAV per Common Share Since IPO 1. The net investment income (“NII”) annualized return on average equity is calculated as (a) the net investment income for the per iod presented divided by (b) the daily average of total net assets. 2. The net income annualized return on average equity is calculated as (a) the net increase in assets resulting from operations for the period presented divided by (b) the daily average of total net assets.
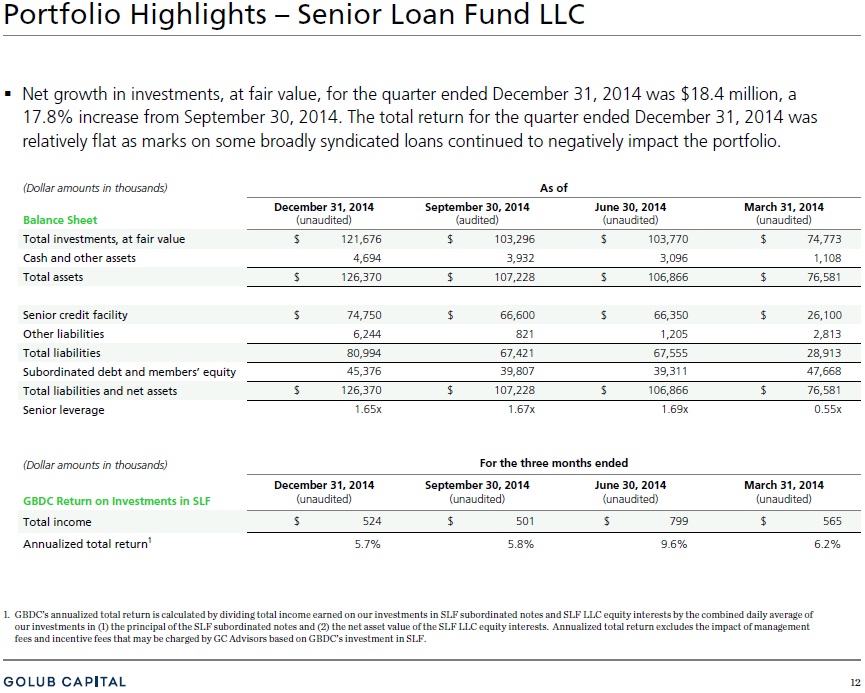
12 Portfolio Highlights – Senior Loan Fund LLC (Dollar amounts in thousands) As of Balance Sheet December 31, 2014 (unaudited) September 30, 2014 (audited) June 30, 2014 (unaudited) March 31, 2014 (unaudited) Total investments, at fair value $ 121,676 $ 103,296 $ 103,770 $ 74,773 Cash and other assets 4,694 3,932 3,096 1,108 Total assets $ 126,370 $ 107,228 $ 106,866 $ 76,581 Senior credit facility $ 74,750 $ 66,600 $ 66,350 $ 26,100 Other liabilities 6,244 821 1,205 2,813 Total liabilities 80,994 67,421 67,555 28,913 Subordinated debt and members’ equity 45,376 39,807 39,311 47,668 Total liabilities and net assets $ 126,370 $ 107,228 $ 106,866 $ 76,581 Senior leverage 1.65x 1.67x 1.69x 0.55x (Dollar amounts in thousands) For the three months ended GBDC Return on Investments in SLF December 31, 2014 (unaudited) September 30, 2014 (unaudited) June 30, 2014 (unaudited) March 31, 2014 (unaudited) Total income $ 524 $ 501 $ 799 $ 565 Annualized total return 1 5.7% 5.8% 9.6% 6.2% 1. GBDC’s annualized total return is calculated by dividing total income earned on our investments in SLF subordinated notes and SLF LLC equity interests by the combined daily average of our investments in (1) the principal of the SLF subordinated notes and (2) the net asset value of the SLF LLC equity interests. Annualized total return excludes the impact of management fees and incentive fees that may be charged by GC Advisors based on GBDC’s investment in SLF. ▪ Net growth in investments, at fair value, for the quarter ended December 31, 2014 was $18.4 million, a 17.8% increase from September 30, 2014. The total return for the quarter ended December 31, 2014 was relatively flat as marks on some broadly syndicated loans continued to negatively impact the portfolio.
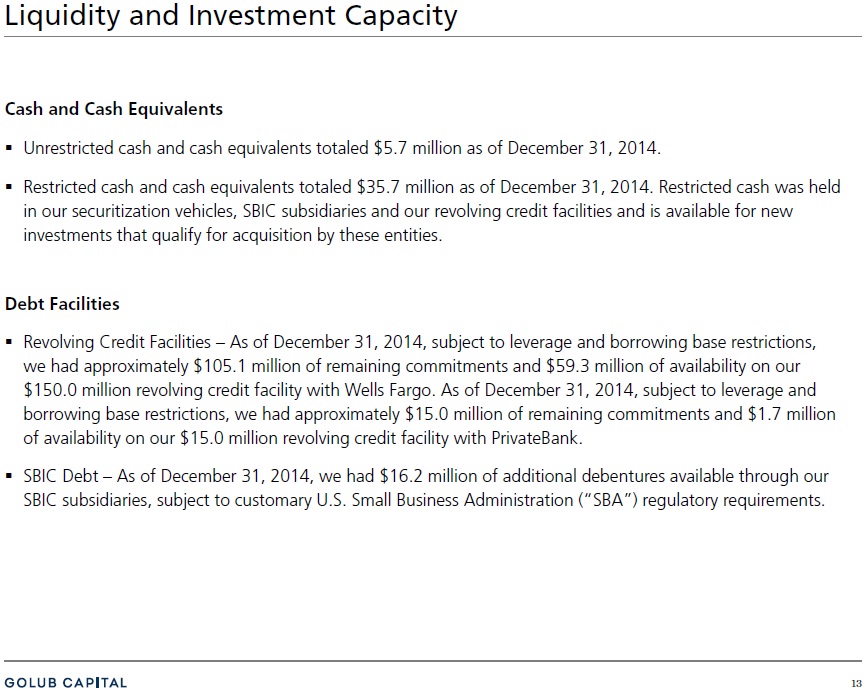
13 Liquidity and Investment Capacity Cash and Cash Equivalents ▪ Unrestricted cash and cash equivalents totaled $5.7 million as of December 31, 2014. ▪ Restricted cash and cash equivalents totaled $35.7 million as of December 31, 2014. Restricted cash was held in our securitization vehicles, SBIC subsidiaries and our revolving credit facilities and is available for new investments that qualify for acquisition by these entities. Debt Facilities ▪ Revolving Credit Facilities – As of December 31, 2014, subject to leverage and borrowing base restrictions, we had approximately $105.1 million of remaining commitments and $59.3 million of availability on our $150.0 million revolving credit facility with Wells Fargo. As of December 31, 2014, subject to leverage and borrowing base restrictions, we had approximately $15.0 million of remaining commitments and $1.7 million of availability on our $15.0 million revolving credit facility with PrivateBank . ▪ SBIC Debt – As of December 31, 2014, we had $16.2 million of additional debentures available through our SBIC subsidiaries, subject to customary U.S. Small Business Administration (“SBA”) regulatory requirements.
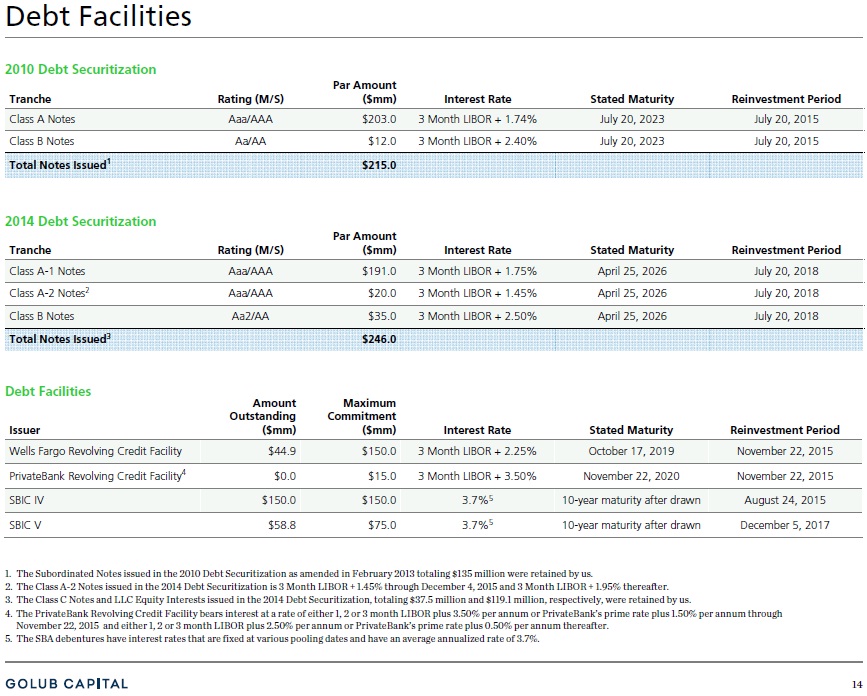
14 Tranche Rating (M/S) Par Amount ($mm) Interest Rate Stated Maturity Reinvestment Period Class A - 1 Notes Aaa/AAA $191.0 3 Month LIBOR + 1.75% April 25, 2026 July 20, 2018 Class A - 2 Notes 2 Aaa/AAA $20.0 3 Month LIBOR + 1.45% April 25, 2026 July 20, 2018 Class B Notes Aa2/AA $35.0 3 Month LIBOR + 2.50% April 25, 2026 July 20, 2018 Total Notes Issued 3 $246.0 Tranche Rating (M/S) Par Amount ($mm) Interest Rate Stated Maturity Reinvestment Period Class A Notes Aaa/AAA $203.0 3 Month LIBOR + 1.74% July 20, 2023 July 20, 2015 Class B Notes Aa/AA $12.0 3 Month LIBOR + 2.40% July 20, 2023 July 20, 2015 Total Notes Issued 1 $215.0 Issuer Amount Outstanding ($mm) Maximum Commitment ($mm) Interest Rate Stated Maturity Reinvestment Period Wells Fargo Revolving Credit Facility $44.9 $150.0 3 Month LIBOR + 2.25% October 17, 2019 November 22, 2015 PrivateBank Revolving Credit Facility 4 $0.0 $15.0 3 Month LIBOR + 3.50% November 22, 2020 November 22, 2015 SBIC IV $150.0 $150.0 3.7% 5 10 - year maturity after drawn August 24, 2015 SBIC V $58.8 $75.0 3.7% 5 10 - year maturity after drawn December 5, 2017 2010 Debt Securitization 2014 Debt Securitization 1. The Subordinated Notes issued in the 2010 Debt Securitization as amended in February 2013 totaling $135 million were retained by us. 2. The Class A - 2 Notes issued in the 2014 Debt Securitization is 3 Month LIBOR + 1.45% through December 4, 2015 and 3 Month LIBOR + 1.95% thereafter. 3. The Class C Notes and LLC Equity Interests issued in the 2014 Debt Securitization, totaling $37.5 million and $119.1 million, respectively, were retained by us. 4. The PrivateBank Revolving Credit Facility bears interest at a rate of either 1, 2 or 3 month LIBOR plus 3.50% per annum or PrivateBank’s prime rate plus 1.50% per annum through November 22 , 2015 and either 1, 2 or 3 month LIBOR plus 2.50% per annum or PrivateBank’s prime rate plus 0.50% per annum thereafter. 5. The SBA debentures have interest rates that are fixed at various pooling dates and have an average annualized rate of 3.7%. Debt Facilities Debt Facilities
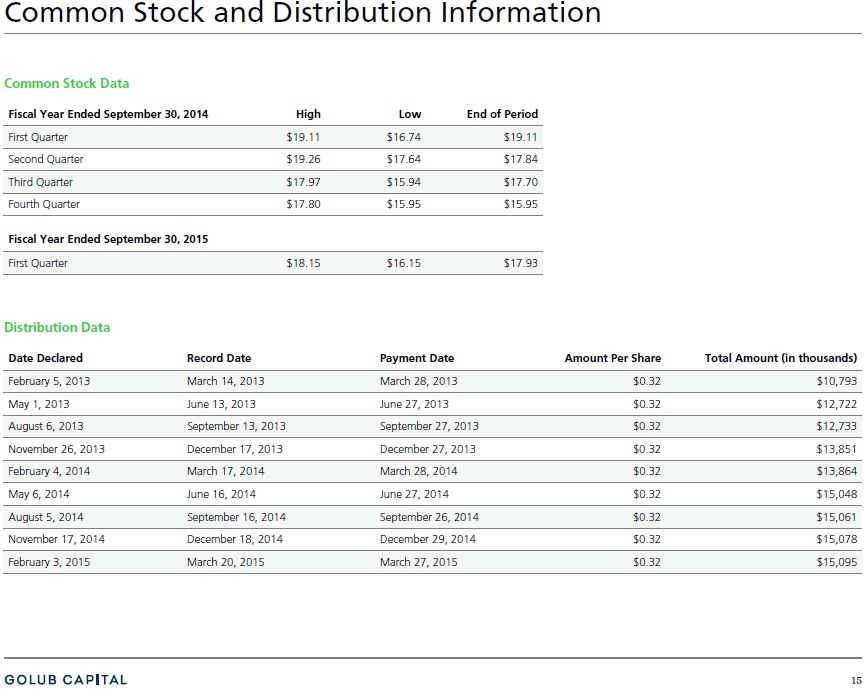
15 Common Stock and Distribution Information Common Stock Data Distribution Data Date Declared Record Date Payment Date Amount Per Share Total Amount (in thousands) February 5, 2013 March 14, 2013 March 28, 2013 $0.32 $10,793 May 1, 2013 June 13, 2013 June 27, 2013 $0.32 $12,722 August 6, 2013 September 13, 2013 September 27, 2013 $0.32 $12,733 November 26, 2013 December 17, 2013 December 27, 2013 $0.32 $13,851 February 4, 2014 March 17, 2014 March 28, 2014 $0.32 $13,864 May 6, 2014 June 16, 2014 June 27, 2014 $0.32 $15,048 August 5, 2014 September 16, 2014 September 26, 2014 $0.32 $15,061 November 17, 2014 December 18, 2014 December 29, 2014 $0.32 $15,078 February 3, 2015 March 20, 2015 March 27, 2015 $0.32 $15,095 Fiscal Year Ended September 30, 2 014 High Low End of Period First Quarter $19.11 $16.74 $19.11 Second Quarter $19.26 $17.64 $17.84 Third Quarter $17.97 $15.94 $17 .70 Fourth Quarter $17.80 $15.95 $15.95 Fiscal Year Ended September 30, 2 015 First Quarter $18.15 $16.15 $17.93