Attached files
| file | filename |
|---|---|
| EXCEL - IDEA: XBRL DOCUMENT - MWI Veterinary Supply, Inc. | Financial_Report.xls |
| EX-32 - EX-32 - MWI Veterinary Supply, Inc. | mwiv-20140930xex32.htm |
| EX-23 - EX-23 - MWI Veterinary Supply, Inc. | mwiv-20140930xex23.htm |
| EX-3.2 - EX-3.2 - MWI Veterinary Supply, Inc. | mwiv-20140930ex32b2c53f8.htm |
| EX-31.2 - EX-31.2 - MWI Veterinary Supply, Inc. | mwiv-20140930ex312a9b38d.htm |
| EX-10.13 - EX-10.13 - MWI Veterinary Supply, Inc. | mwiv-20140930ex10135c879.htm |
| EX-31.1 - EX-31.1 - MWI Veterinary Supply, Inc. | mwiv-20140930ex311d7bb7e.htm |
| EX-21.1 - EX-21.1 - MWI Veterinary Supply, Inc. | mwiv-20140930ex21195b3b1.htm |
UNITED STATES SECURITIES AND
EXCHANGE COMMISSION
Washington, D.C. 20549
FORM 10-K
|
☒ |
ANNUAL REPORT PURSUANT TO SECTION 13 or 15(d) OF THE SECURITIES EXCHANGE ACT OF 1934 |
|
|
For the fiscal year ended September 30, 2014 |
|
|
Commission file number 000-51468 |
|
|
OR |
|
☐ |
TRANSITION REPORT PURSUANT TO SECTION 13 or 15(d) OF THE SECURITIES EXCHANGE ACT OF 1934 |
|
|
For the transition period from ________ to ________ |
MWI VETERINARY SUPPLY, INC.
(Exact name of registrant as specified in its Charter)
|
Delaware |
|
02‑0620757 |
|
(State or Other Jurisdiction of Incorporation or Organization) |
|
(I.R.S. Employer Identification No.) |
|
3041 W Pasadena Dr |
||
|
Boise, ID |
|
83705 |
|
(Address of Principal Executive Offices) |
|
(Zip Code) |
|
|
(208) 955-8930 |
|
|
(Registrant’s telephone number, including area code) |
||
SECURITIES REGISTERED PURSUANT TO SECTION 12(b) OF THE SECURITIES EXCHANGE ACT OF 1934:
|
Title of each class |
Name of each exchange on which registered |
|
Common Stock, $0.01 par value |
The Nasdaq Stock Market, LLC |
SECURITIES REGISTERED PURSUANT TO SECTION 12(g) OF THE SECURITIES EXCHANGE ACT OF 1934: NONE
Indicate by check mark if the registrant is a well-known seasoned issuer, as defined in Rule 405 of the Securities Act. Yes ☒ No ☐
Indicate by check mark if the registrant is not required to file reports pursuant to Section 13 or Section 15(d) of the Act. Yes ☐ No ☒
Indicate by check mark whether the registrant (1) has filed all reports required to be filed by Section 13 or 15(d) of the Securities Exchange Act of 1934, as amended (the “Act”) during the preceding 12 months (or for such shorter period that the registrant was required to file such reports) and (2) has been subject to such filing requirements for the past 90 days. Yes ☒ No ☐
Indicate by check mark whether the registrant has submitted electronically and posted on its corporate Web site, if any, every Interactive Data File required to be submitted and posted pursuant to Rule 405 of Regulation S-T (§229.405 of this chapter) during the preceding 12 months (or for such shorter period that the registrant was required to submit and post such files). Yes ☒ No ☐
Indicate by check mark if disclosure of delinquent filers pursuant to Item 405 of Regulation S-K (§229.405 of this chapter) is not contained herein and will not be contained, to the best of registrant’s knowledge, in definitive proxy or information statements incorporated by reference in Part III of this Form 10-K or any amendment to this Form 10-K. ☒
Indicate by check mark whether the registrant is a large accelerated filer, an accelerated filer, a non-accelerated filer, or a smaller reporting company. See definition of “large accelerated filer”, “accelerated filer” and “smaller reporting company” in Rule 12b-2 of the Exchange Act. (Check one):
|
|
Large Accelerated Filer ☒ |
Accelerated Filer ☐ |
Non-Accelerated Filer ☐ |
Smaller Reporting Company ☐ |
|
|
|
|
(Do not check if a smaller reporting company) |
|
Indicate by check mark whether the registrant is a shell company (as defined in Rule 12b‑2 of the Act). Yes ☐ No ☒
As of March 31, 2014 (the last business day of the registrant’s most recently completed second fiscal quarter), the aggregate market value of the voting stock held by non-affiliates of the registrant was approximately $1,932,000,000. Shares of common stock held by each executive officer and director and by each person who owns 10% or more of our outstanding common stock have been excluded since such persons may be deemed affiliates. This determination of affiliate status is not necessarily a conclusive determination for other purposes.
The number of shares of the registrant’s common stock, $0.01 par value, outstanding as of November 14, 2014 was 12,912,068.
Documents Incorporated by Reference
Listed hereunder are the documents, any portions of which are incorporated by reference and the Parts of this Form 10‑K into which such portions are incorporated:
1.The registrant’s definitive proxy statement for use in connection with the Annual Meeting of Stockholders to be held on or about February 11, 2015 to be filed within 120 days after the registrant’s fiscal year ended September 30, 2014, portions of which are incorporated by reference into Part III of this Form 10-K.
MWI VETERINARY SUPPLY, INC.
FORM 10-K
TABLE OF CONTENTS
Cautionary Statement for Purposes of “Safe Harbor Provisions” of the Private Securities Litigation Reform Act of 1995
This annual report on Form 10-K contains forward‑looking statements within the meaning of the federal securities laws. Statements that are not historical facts, including statements about our beliefs and expectations, are forward‑looking statements. Forward‑looking statements include statements preceded by, followed by or that include the words “may,” “could,” “would,” “should,” “believe,” “expect,” “anticipate,” “plan,” “estimate,” “target,” “project,” “intend” and similar expressions. These statements include, among others, statements regarding our expected business outlook, anticipated financial and operating results, our business strategy and means to implement our strategy, our objectives, the amount and timing of capital expenditures, the likelihood of our success in expanding our business, financing plans, budgets, working capital needs and sources of liquidity.
Forward‑looking statements are only predictions and are not guarantees of performance. These statements are based on our management’s beliefs and assumptions, which in turn are based on currently available information. Important assumptions relating to the forward‑looking statements include, among others, assumptions regarding demand for our products, the expansion of product offerings geographically or through new applications, the timing and cost of planned capital expenditures, competitive conditions and general economic conditions. These assumptions could prove inaccurate. Forward‑looking statements also involve known and unknown risks and uncertainties, which could cause actual results to differ materially from those contained in any forward‑looking statement. Many of these factors are beyond our ability to control or predict. Such factors include, but are not limited to, the following:
|
· |
the impact of vendor consolidation on our business; |
|
· |
changes in or availability of vendor contracts or rebate programs; |
|
· |
vendor rebates based upon attaining certain growth goals; |
|
· |
transitional challenges associated with acquisitions, including the failure to retain customers, system integrations, and the disproportionate demands on management resources to integrate acquired businesses; |
|
· |
financial risks associated with acquisitions and investments; |
|
· |
changes in the way vendors introduce/deliver products to market; |
|
· |
seasonality; |
|
· |
competition; |
|
· |
possible changes in the use of feed additives (antibiotics, growth promotants) used in production animal products due to trade restrictions, animal welfare and/or government regulations; |
|
· |
an outbreak of foodborne diseases in production animal products; |
|
· |
inability to ship products to the customer as a result of technological or shipping disruptions; |
|
· |
the recall of a significant product by one of our vendors or suppliers; |
|
· |
risks associated with our international operations; |
|
· |
failures of, or security problems with, our information systems; |
|
· |
an outbreak of infectious disease in animals; |
|
· |
extended shortage or backorder of a significant product by one of our vendors; |
|
· |
the impact of tightening credit standards and/or access to credit on behalf of our customers and suppliers; |
|
· |
a disruption caused by adverse weather (i.e. drought) or other natural conditions or disasters; |
|
· |
exclusivity requirements with certain vendors that may prohibit us from distributing competing products manufactured by other vendors or margin reductions if we become a non-exclusive distributor; |
|
· |
the impact of general economic trends on our business; |
|
· |
our intellectual property rights may be inadequate to protect our business; |
|
· |
the timing and effectiveness of marketing programs or price changes offered by our vendors; |
|
· |
the timing of the introduction of new products and services by our vendors; |
|
· |
unforeseen litigation; |
|
· |
the ability to borrow on our revolving credit facility, extend the terms of our revolving credit facility or obtain alternative financing on favorable terms or at all; and |
|
· |
risks from potential increases in variable interest rates. |
Except as required by applicable law, including the securities laws of the United States and the rules and regulations of the Securities and Exchange Commission (“SEC”), we are under no obligation to publicly update or revise any
1
forward‑looking statements, whether as a result of any new information, future events or otherwise. You should not place undue reliance on our forward-looking statements. Although we believe that the expectations reflected in the forward‑looking statements are reasonable, we cannot guarantee future results or performance.
Investors should also be aware that while we do, from time to time, communicate with securities analysts, it is against our policy to disclose any material non-public information or other confidential commercial information. Accordingly, stockholders should not assume that we agree with any statement or report issued by any analyst irrespective of the content of the statement or report. Furthermore, we have a policy against issuing or confirming financial forecasts or projections issued by others. Thus, to the extent that reports issued by securities analysts contain any projections, forecasts or opinions, such reports are not the responsibility of MWI Veterinary Supply, Inc.
General
Our business commenced operations as part of a veterinary practice in 1976 and was incorporated as MWI Drug Supply, Inc., an Idaho corporation, in 1980. MWI Drug Supply, Inc. was acquired by Agri Beef Co. (“Agri Beef”) in 1981. MWI Veterinary Supply Co. (“MWI Co.”) was incorporated as an independent subsidiary of Agri Beef in September 1994. Effective June 18, 2002, MWI Holdings, Inc. was formed by Bruckmann, Rosser, Sherrill & Co. II, L.P. for the sole purpose of acquiring all of the outstanding stock of MWI Co. from Agri Beef. As a result of this transaction, MWI Co. became a wholly‑owned subsidiary of MWI Holdings, Inc. On April 21, 2005, we changed our name from MWI Holdings, Inc. to MWI Veterinary Supply, Inc., and on August 3, 2005 we completed our initial public offering. References in this report to “we,” “us,” “our,” and “MWI” refer to MWI Veterinary Supply, Inc. unless otherwise indicated. Unless otherwise indicated, all statistical information provided about our business in this report is as of September 30, 2014.
We are a leading distributor of animal health products across the United States, and through our Centaur Services (“Centaur”) business, in the United Kingdom. Our growth has primarily been from internal growth initiatives as well as selective acquisitions, including the following transactions.
|
· |
In October 2011, we acquired substantially all of the assets of Micro Beef Technologies, Ltd. (“Micro”), a value-added distributor to the production animal market, including the distribution of micro feed ingredients, pharmaceuticals, vaccines, parasiticides, supplies, and other animal health products. In addition, as a result of the Micro transaction, we now offer proprietary, computerized management systems for the production animal market. |
|
· |
In December 2012, we purchased substantially all of the assets of Prescription Containers, Inc. (“PCI Animal Health”), a distributor of companion animal health products primarily to veterinary practices, primarily in the Northeastern United States. |
|
· |
On November 1, 2013, we acquired substantially all of the assets of IVESCO Holdings, LLC (“IVESCO”), a value-added distributor of animal health and related products to veterinarians, food animal producers and dealers in the United States. |
|
· |
On September 2, 2014, we acquired the outstanding share capital of VetSpace Limited and certain of its affiliates (collectively, “VetSpace”). VetSpace is a provider of practice management software to veterinary practices, principally in the United Kingdom. |
Products we sell include pharmaceuticals, vaccines, parasiticides, diagnostics, micro feed ingredients, supplies, specialty products, veterinary pet food, capital equipment and nutritional products. We market these products to customers in both the companion animal and production animal markets. As of September 30, 2014, we had a sales force of 621 people covering the United States and a sales force of 29 people in the United Kingdom. We also offer our customers a variety of value‑added services, including our e-commerce platform, technology management systems, pharmacy fulfillment, inventory management system, equipment procurement consultation, special order fulfillment, educational seminars and pet cremation, which we believe closely integrate us with our customers’ day-to-day operations and provide them with meaningful incentives to continue ordering from us.
2
We estimate that approximately 52% of our total revenues in the United States have been generated from sales to the companion animal market and 48% from sales to the production animal market. Including the gross billings from agency commissions which are excluded from our total revenues in order to comply with generally accepted accounting principles, we estimate that in the United States approximately 57% of our total revenues have been generated from sales to the companion animal market and 43% from sales to the production animal market. In the United Kingdom, we estimate that approximately 75% of our total revenues have been generated from sales to the companion animal market and 25% from sales to the production animal market.
Geographic Information
Revenues and long-lived assets by geographic region are as follows (in thousands):
|
2014 |
2013 |
2012 |
||||||
|
Revenues for the fiscal years ended September 30 |
||||||||
|
United States |
$ |
2,651,818 |
$ |
2,032,260 |
$ |
1,776,414 | ||
|
International (United Kingdom) |
329,220 | 315,225 | 298,732 | |||||
|
Total |
$ |
2,981,038 |
$ |
2,347,485 |
$ |
2,075,146 | ||
|
Long-lived assets as of September 30 |
||||||||
|
United States |
$ |
40,306 |
$ |
32,881 |
$ |
29,001 | ||
|
International (United Kingdom) |
9,844 | 6,302 | 6,783 | |||||
|
Total |
$ |
50,150 |
$ |
39,183 |
$ |
35,784 | ||
Industry Overview
According to Sundale Research (“Sundale”), animal health product sales in the United States for calendar year 2013 were approximately $8.9 billion based on prices at the manufacturers’ level. The market for animal health products in the United States is a mix of products sold for companion and production animals. Companion animals include dogs, cats, horses and other pets, while production animals include cattle, swine, poultry and other food-producing animals. Sundale estimates that companion animal products accounted for 57% of the total market for animal health products in the United States in calendar year 2013. According to the GfK Vetrak UK market survey in October 2014 that compiles revenue statistics, animal health product sales in the United Kingdom for our fiscal year ended September 30, 2014 was approximately £904 ($1,477) million.
Historically, the growth in the companion animal market has been due to the increasing number of households with companion animals, increased expenditures on animal health and preventative care, an aging pet population, advancements in animal health products and diagnostic testing and extensive marketing programs sponsored by companion animal nutrition and pharmaceutical companies. Product sales in the production animal market are impacted by volatility in commodity prices such as milk, grains, livestock and poultry, changes in weather patterns (e.g. droughts or seasons of higher precipitation that determine how long cattle will graze and consequently the number of days an animal is on feed during a finishing phase) or a change in the general economy, which can shift the number of animals treated, the timing of when animals are treated, to what extent they are treated and which products they are treated with. Historically, sales in this market have been largely driven by spending on animal health products to improve productivity, weight gain and disease prevention, as well as a growing focus on food safety. We believe that these growth factors have been mitigated by the downward influence of generic drugs on pricing.
Veterinarians are one of the primary purchasers of animal health products, particularly in the companion animal market. As of December 31, 2013, according to the American Veterinary Medical Association, or AVMA, there were more than 64,000 veterinarians in private practice nationwide. According to the statistics from the Royal College of Veterinary Surgeons, there are approximately 17,800 veterinarians in private practice in the United Kingdom, with a total of approximately 5,500 veterinary outlets. We believe that distributors play a vital role for veterinary practices by providing access to a broad selection of products through a single channel and helping them efficiently manage their inventory levels. Distributors also offer vendors substantial value by providing cost-effective access to a highly fragmented and geographically diverse customer base.
3
Competitive Strengths
We believe that our strengths include:
|
· |
Leading Animal Health Distributor. While most of our products are available from several sources and our customers typically have relationships with several distributors, we have achieved our position as a leading distributor primarily through internal growth. We believe that our broad product offering, competitive pricing, superior customer service, rapid product fulfillment and value‑added services provide meaningful incentives for our customers to continue ordering from us. Our value-added services include our e-commerce platform, technology and information systems and pharmacy fulfillment programs. Our pharmacies provide an efficient way for our customers to order prescription products in a cost effective, efficient manner while ensuring that they adhere to the strict regulations for these products. |
|
· |
Leading Sales and Marketing Franchise. Our sales representatives in the United States educate customers on new animal health products, assist in product selection and purchasing, and offer inventory management solutions. We also publish detailed product catalogs and monthly magazines, which are often utilized by our customers as reference tools. While salespeople and printed materials are vital to our marketing strategy, we also provide on-line ordering, valuable business information and value-added services through our Internet sites, www.mwivet.com and www.centaurweb.co.uk. |
|
· |
Strong, Established Relationships with Veterinarians and Vendors. Our ability to serve as a single source for most of our customers’ animal health product needs has enabled us to develop strong and long-term customer relationships. For more than eighteen years we have maintained distribution arrangements with Banfield, The Pet Hospital (“Banfield”), the nation’s largest private veterinary practice, and with our non-controlled affiliate, Feeders’ Advantage, L.L.C. (“Feeders’ Advantage”), a related party and a buying group composed of several of the largest cattle feeders in the United States. Since we currently do not manufacture the vast majority of the products we sell, we are dependent on our vendors for the supply of our products. While our vendors often have relationships with multiple distributors, we have long-term relationships with many of our key vendors including Boehringer Ingelheim, Elanco, Merck, Merial, Vedco and Zoetis. |
|
· |
Recurring Revenue Product Base. Approximately 98% of our product sales were from consumable medicines and supplies commonly required by our customers in their practice. Historically, this aspect of our business has resulted in a recurring stream of revenues. |
|
· |
Sophisticated Technology and Information Systems. We continue to invest in our technology and information systems, which we believe has created a competitive advantage when delivering quality service to our customers. Our e-commerce platform offers enhanced online ordering capabilities for our customers. This platform provides many features for our customers with enhanced security. Our advanced computerized technology management systems offer our production animal customers the ability to more efficiently and effectively manage their animals and their operations. This includes comprehensive information collection and management decision making in the areas of health, nutrition, information and animal management. These precision management tools help implement traceability and food safety regimens while optimizing performance and the use of the consumable products we distribute. |
|
· |
Experienced Management Team. We have a strong and experienced senior management team with substantial animal health industry expertise. The members of our senior management team have been with us for an average of over sixteen years, and each member has demonstrated a commitment and capability to deliver growth in revenues and profitability. |
Business Strategy
Our mission is to be the best resource to the animal health profession by delivering superior value, efficiency and innovation. Our strategy to achieve our mission is outlined below.
Increase Sales to Existing Customers. We believe that our customers typically purchase animal health products from multiple distributors in the United States. For our fiscal year ended September 30, 2014, our average annual product sales per veterinary practice served in the United States was approximately $57,000. We intend to increase our
4
share of these purchases by utilizing our proprietary customer database to focus our marketing efforts, expanding our sales force, selectively adding products to our portfolio and increasing and expanding the value-added services we provide to our customers. By increasing the dollar value of purchases made by each customer as well as their average order size, we intend to increase our profitability. Competition for hiring sales representatives who have existing customer relationships is intense and we focus on retaining valued members of our staff who have demonstrated the skills needed to successfully market our products and services. If we fail to hire or retain a sufficient number of qualified sales professionals, it could adversely impact our business.
Expand Business Assistance Services for Our Customers. We intend to enhance our customer relationships by expanding our business assistance services for our customers. These value-added services include, among others, our e-commerce platform, technology management systems, pharmacy fulfillment, inventory management system, equipment procurement consultation, special order fulfillment, educational seminars and pet cremation.
Increase the Total Number of Customers. We intend to add new customers by increasing the number and productivity of our sales representatives, selectively acquiring other animal health distributors and expanding distribution centers. Veterinary practices typically purchase the majority of their animal health products from one wholesaler in the United Kingdom.
Continuously Seek to Improve Operations. We continuously evaluate opportunities to increase sales, lower costs and realize operating efficiencies. Current initiatives include investments in our technology and distribution center infrastructure. We also plan to pursue alternative product sourcing strategies and have a private label program on selected products to reduce our procurement costs and increase our profitability, while maintaining strong relationships with key vendors.
Make Selective Acquisitions. The United States market for animal health products distribution is fragmented, with a mix of national, regional and local distributors. Many of these companies are small, privately-held businesses, some of which may represent attractive acquisition candidates. We also believe there are acquisition opportunities outside of the United States and we intend to seek out those companies that would be a strategic fit for us.
Products
During fiscal year 2014 in the United States, we sold more than 50,000 products, of which over 25,000 are stocked in our distribution centers, sourced from over 1,000 vendors. During fiscal year 2014 in the United Kingdom, we sold approximately 21,000 products, of which nearly 11,000 are stocked in our distribution center, sourced from approximately 400 vendors. For our fiscal year ended September 30, 2014, our product revenues in the United States were comprised of approximately 35% pharmaceutical products, 16% vaccine products, 15% parasiticide products, 7% micro feed ingredients, 7% diagnostic products, 2% capital equipment products and 18% of other supplies. In addition, we sell over 700 products in the United States under agency agreements with our vendors. Under an agency agreement, we typically solicit orders and provide customer service for a commission, while the vendor stocks and ships the products. Including gross billings from agency contracts, for our fiscal year ended September 30, 2014, our product revenues in the United States were comprised of approximately 32% pharmaceutical products, 15% vaccine products, 20% parasiticide products, 6% micro feed ingredients, 6% diagnostic products, 2% capital equipment products and 19% of other supplies. We also have available on special order approximately 22,000 products in the United States that we do not normally stock in our warehouses. We continually seek to update and improve the range of products we offer to address our customers’ requirements. For our fiscal year ended September 30, 2014, our product revenues in the United Kingdom were comprised of approximately 79% pharmaceuticals (which include vaccines and parasiticides), 14% pet foods and 7% other consumable supplies.
Pharmaceuticals, Vaccines, Parasiticides and Micro Feed Ingredients
We offer our customers a variety of pharmaceuticals, vaccines, parasiticides and micro feed ingredients. Our pharmaceutical products typically include anesthetics, analgesics, antibiotics, ophthalmics and hormones. Our vaccine products are primarily comprised of small animal, equine and production animal biologicals. Our parasiticides are used for control of fleas, ticks, flies, mosquitoes and internal parasites. Micro feed ingredients are feed grade products such as pharmaceuticals, vitamins, minerals and other nutritional products that are used to optimize the health and performance of production animals.
Diagnostics, Capital Equipment and Supplies
We offer a wide range of diagnostics, capital equipment and supplies to our customers. Diagnostic sales typically include consumable in-clinic tests for detecting heartworm, lyme, feline leukemia and parvovirus, as well as consumable products for measuring blood chemistry, electrolyte balance and cell counts. Our capital equipment sales include anesthesia
5
machines, surgical monitors, diagnostic equipment, dental machines, cages, lights and x-ray machines. We employ a team of capital equipment specialists to analyze the latest technologies and recommend equipment that meets our customers’ specific needs. Our sales of supplies include syringes, instruments, bandages, IV products, surgical consumables, grooming materials and other small equipment items used by our customers.
Veterinary Pet Food and Nutritional Products
We offer our customers a broad selection of veterinary pet foods and nutritional products. We consider veterinary pet food to consist of two categories: foods for specialty diets and premium pet foods. Specialty diets are recommended by veterinarians to address specific medical and nutritional needs. Premium pet foods are recommended by veterinarians to promote optimal nutrition in healthy animals. Pet foods are typically sold under agency agreements. Nutritional products include dietary supplements, vitamins, dental chews and specialty treats which either help address specific medical conditions or are compatible with recommended nutritional guidelines.
Value‑Added Services
We offer our customers a variety of value‑added services, which we believe closely integrate us with our customers’ day-to-day operations and provide them with meaningful incentives to continue ordering from us. These services include the following:
|
Service |
|
|
|
Description |
|
E‑commerce platform |
|
On‑line ordering system that provides information to customers on products, vendor programs and purchasing history |
||
|
Pharmacy fulfillment |
|
Shipment of prescription production and companion animal health products to end‑users in the United States on behalf of veterinarians from our seven licensed pharmacies located in Amarillo, Texas; Edwardsville, Kansas; Elizabethtown, Pennsylvania; Nampa, Idaho; Shakopee, Minnesota; Springdale, Arkansas and Whitestown, Indiana and a licensed veterinary food-animal drug retailer in Visalia, California |
||
|
Inventory management system |
|
Flexible system that facilitates counting, maintaining and ordering inventory in veterinary practices |
||
|
Technology management systems |
|
Comprehensive feed, health, information and production management systems including micro ingredient machines, health management systems and age and source verification |
||
|
Equipment procurement consultation |
|
Consultation and demonstrations provided by our dedicated capital equipment specialists in the United States |
||
|
Special order fulfillment |
|
Procurement and shipment of approximately 22,000 unique products in the United States that we do not normally stock in our warehouses |
||
|
Educational seminars |
|
Seminars for our customers covering business and medical topics, frequently sponsored in conjunction with our vendors |
||
|
Pet cremation |
|
Facility in Idaho that serves veterinary practices and their clients by providing cremation services |
||
Customers
As of September 30, 2014, we served a vast majority of the veterinary practices and producers located throughout the United States and approximately one-third of the veterinary practices in the United Kingdom. These veterinary practices are typically small, privately-held businesses that we believe place at least one order per week to avoid storing and managing large volumes of supplies. We believe that our customers usually purchase animal health products from multiple distributors. We seek to be the principal provider of animal health products to our customer base.
We maintain a diverse and stable customer base. Independent veterinary practices have historically accounted for approximately 89% of our product sales. Also, for more than eighteen years, we have maintained distribution arrangements with Banfield, the nation’s largest private veterinary practice with over 800 veterinary hospitals, and our non-controlled
6
affiliate, Feeders’ Advantage, a buying group composed of several of the largest cattle feeders in the United States. We typically do not enter into long-term contracts with our independent veterinary customers.
Sales and Marketing
Our sales and marketing strategies are designed to establish and maintain strong customer relationships through personal visits by field sales representatives, frequent telesales contact and direct marketing, emphasizing our broad product lines, competitive pricing, efficient ordering capabilities, high levels of customer support and service and other value‑added services. The key elements of our sales and marketing strategy are:
Field Sales Representatives: Our sales force in the United States is a key component of our value-added approach. Due to the fragmented nature of the animal health products market, we believe that a large sales force is vital to effectively support existing customers and target potential customers. As of September 30, 2014, we had 407 field sales personnel throughout the United States. Our field sales representatives educate customers on new animal health products, assist in product selection and purchasing and offer inventory management solutions. Once a field sales representative has established a relationship with a customer, the field sales representative encourages the customer to use our telesales representatives and online ordering capabilities for day-to-day customer needs. Field sales representatives work under the supervision of regional sales managers within an assigned sales territory to ensure effective communication and timely sales calls with customers. Our field sales representatives complement our telesales and direct marketing efforts and enable us to better market, service and support the sale of our products and services. Our field sales representatives are employees of our Company and are compensated with a combination of salaries and commissions. The sales staff for Centaur does not actively promote products to the veterinarians, but rather sells products and maximizes the logistics services that Centaur provides.
Telesales: We support our field sales representatives and direct marketing efforts with telesales representatives in thirteen call centers covering the United States. As of September 30, 2014, we had 214 telesales representatives in the United States. Telesales representatives work as partners with our field sales representatives, providing a dual coverage approach for individual customers. Telesales representatives process orders and generate new sales through frequent and direct contact with customers. Telesales representatives are responsible for assisting customers with ordering, purchasing decisions and general questions. Telesales representatives utilize our customized order entry system to process customer orders, access pricing, availability and promotional information about products, and research customer preferences and order history. Our call centers are connected by our telecommunications system which enables them to operate as one virtual call center.
|
· |
E-Commerce Platform: We provide on-line ordering, valuable business information and value-added services to our customers via our primary Internet site in the United States, www.mwivet.com, our Internet site in the United Kingdom, www.centaurweb.co.uk, and customized Internet sites that we maintain for two of our largest customers, Banfield and Feeders’ Advantage. Customers can use our Internet sites to order products, learn more about product and vendor programs, print forms needed for their practice, review their historical purchases and manage their inventory. For our fiscal years ended September 30, 2014, 2013 and 2012, approximately 45%, 43% and 39%, respectively, of our product sales in the United States, excluding revenues related to Micro and IVESCO, were generated through orders placed over the Internet. In the United Kingdom, over 96% of our orders are placed electronically. |
Direct Marketing: We market to existing and potential customers by distributing product catalogs and monthly magazines. We publish a small animal catalog, a livestock catalog and an equine catalog. These catalogs include detailed descriptions and specifications of our products and are often used as a reference tool by our customers and sales force. We also promote our products and services in our monthly magazine, Messenger, which our field sales representatives use as a tool to educate customers on product and vendor programs. Additional marketing tools that we utilize include specialty catalogs, customer loyalty programs, specific product and vendor programs, flyers, faxes, emails and other promotional materials. For the fiscal year ended September 30, 2014, we distributed over 1.6 million pieces of direct marketing materials to existing and potential customers. We also participate in international, national and regional trade shows to extend our customer reach and enhance customer interaction.
Product Sourcing
We currently do not manufacture the vast majority of our products and are dependent on vendors for our supply of products. We believe that effective purchasing is a key factor in maintaining our position as a leading provider of animal health products. We regularly assess our purchasing needs and our vendors’ product offerings and prices to obtain products at
7
favorable prices. While we purchase products from many vendors and there is generally more than one vendor for most animal health product categories, our concentration of aggregate purchases with key vendors is significant. Our ten largest vendors accounted for approximately 67% of our revenues for the fiscal year ended September 30, 2014, 70% of our revenues for the fiscal year ended September 30, 2013 and 71% of our revenues for the fiscal year ended September 30, 2012. Zoetis supplied products that accounted for approximately 20% of our revenues for our fiscal years ended September 30, 2014, 2013, and 2012. Of the Zoetis supplied products, production animal products under a livestock products agreement accounted for approximately 10% of our revenues for our fiscal years ended September 30, 2014 and 2013, and approximately 11% of our revenues for our fiscal year ended September 30, 2012. Merck (formerly known as Intervet/Schering-Plough), supplied products that accounted for approximately 11%, 14% and 15% of our revenues for our fiscal years ended September 30, 2014, 2013 and 2012, respectively. Elanco, the animal health division of Eli Lilly and Company, supplied products that accounted for approximately 10% of our revenues for our fiscal years ended September 30, 2014 and 2013, and approximately 9% of our revenues for the fiscal year ended September 30, 2012. Merial, the animal health division of Sanofi, supplies the majority of their products to us under an agency relationship. Commission revenue generated from Merial products accounted for approximately 47%, 50% and 52% of total commission revenues for our fiscal years ended September 30, 2014, 2013 and 2012, respectively.
There are two major types of transactions that can affect the flow of our products from our vendors, through us, to our customers. The method of selling products to our customers is dictated by our vendors. Traditional “buy/sell” transactions, which account for the vast majority of our business, involve the direct purchase of products by us from vendors, which we manage and typically store in our warehouses. A customer places an order with us, and the order is then picked, packed, shipped and invoiced by us to our customer, followed by payment from our customer to us.
We also sell certain product lines to our customers under agency agreements with some of our vendors. Under this model, when we receive orders for products from the customer, we transmit the order to the vendor who then picks, packs and ships the products direct to our customers. In some cases our vendor invoices and collects payment from our customer, while in other cases we invoice and collect payment from our customer. We receive a commission payment for soliciting the order and for providing other customer service activities. Our operating expenses associated with agency sales transactions are lower than in traditional “buy/sell” transactions.
We have written agreements with over 50 of our vendors. Our vendor agreements are typically terminable by either party without cause on short notice.
Animal health product vendors may implement sales promotions or price changes for products distributed to our customers that can affect the period in which we recognize revenues. In addition, at the time we negotiate vendor agreements for the upcoming year, our vendors typically establish sales growth goals for us to meet in order to receive performance rebates or may reduce or eliminate rebate opportunities. These growth goals may be based on quarterly, semi-annual or annual targets.
Product returns from our customers and to our vendors occur in the ordinary course of business. We extend our customers the same return of goods policies as are extended to us by our vendors. We do not believe that our operations will be adversely impacted due to the return of products.
Distribution
As of September 30, 2014, we distributed our products from twenty-three strategically located distribution centers throughout the United States and one in the United Kingdom. During our fiscal year 2014, we opened a new redistribution center in Shawnee, Kansas. During our fiscal year 2013, we moved into a new distribution center in Shakopee, Minnesota.
We maintain inventory levels in our warehouses appropriate to satisfy customer demand for prompt delivery and fulfillment of their product orders. Inventory levels are managed on a daily basis through our information systems. In order to meet the rapid delivery requirements of our customers, we offer next-day delivery service on most of the products we stock in our warehouses. We estimate that during the fiscal year ended September 30, 2014, we shipped same day from our warehouses approximately 98% of the dollar value of orders placed by our customers. We currently ship the majority of our orders in the United States through United Parcel Service, Inc. (“UPS”), and FedEx Corporation (“FedEx”) with the balance of our orders being shipped by our own delivery trucks, local carriers, regional carriers and other national carriers. Products shipped out of the Centaur and Micro facilities are primarily shipped by our own delivery trucks.
Competition
The distribution and manufacture of animal health products is highly competitive. We compete with numerous vendors and distributors based on customer relationships, service and delivery, product selection, price and e-commerce capabilities.
8
Manufacturers have also invested heavily in the animal health industry by developing direct sales capabilities, which has intensified competition. Most of our products are available from several sources, including other distributors and vendors, and our customers tend to have relationships with several distributors. In addition, our competitors could obtain exclusive rights to distribute certain products, eliminating our ability to distribute those products. Consolidation in the veterinary distribution business could result in existing competitors increasing their market share, which could give them greater pricing power, decrease our revenues and profitability, and increase the competition for customers. Our primary competitors in the United States include the following:
|
· |
Animal Health International, Inc.; |
|
· |
Henry Schein Animal Health; |
|
· |
Midwest Veterinary Supply; |
|
· |
Patterson Veterinary; |
|
· |
other national, regional, local and specialty distributors; and |
|
· |
manufacturers with direct sales capabilities. |
Successful distributors are increasingly providing value‑added services in addition to the products they have traditionally provided. We believe that to remain competitive we must continue to add value to the distribution channel, while removing unnecessary costs associated with product movement.
Seasonality in Operating Results
Our quarterly sales and operating results have varied significantly in the past, and will likely continue to do so in the future. Historically, our total revenues have typically been higher during the spring and fall months due to increased sales of production animal products. The sales of production animal products can vary due to changes in commodity prices and weather patterns (e.g. droughts or seasons of higher precipitation that determine how long cattle will graze and consequently the number of days an animal is on feed during a finishing phase) which may also affect seasonality. Product use cycles for production animal products are directly related to medical procedures performed by veterinarians on production animals during the spring and fall months. These buying patterns can also be affected by vendors’ and distributors’ marketing programs or price increase announcements, which can cause veterinarians to purchase production animal health products earlier than those products are needed. This kind of early purchasing may reduce our sales in the months these purchases would have otherwise been made. See “Risk Factors — Our quarterly operating results may fluctuate significantly, and these fluctuations may cause our stock price to fall.” Additionally, while we accrue rebates as they are earned, our rebates have historically been highest during the quarter ended December 31, since some of our vendors’ rebate programs were designed to include targets to be achieved near the end of the calendar year. This trend has slowed some in recent years due to certain changes in vendor contracts but it still remains our largest quarter for vendor rebates.
Intellectual Property
We have registered with the United States Patent and Trademark Office the marks “MWI,” “MWI Design,” “MWIVET.com,” “VETONE,” “PROXYRx” and “ANIMAL Rx PHARMACY,” among others. We believe that the MWI mark is well recognized in the animal health products industry and by veterinarians and is therefore a valuable asset of ours.
Our success depends in part on our ability to protect our intellectual property rights. There are always risks that third parties may claim we are infringing upon their intellectual property rights and we could be prevented from selling our products, or suffer significant litigation or licensing expenses as a result of these claims. See “Risk Factors – If third parties claim that we infringe upon their intellectual property rights, our financial results could be adversely affected.” In addition, third parties may infringe upon or design around our intellectual property rights, and we may expend significant resources enforcing our rights or suffer competitive injury with adverse effects on our business and results of operations. See “Risk Factors – Our intellectual property rights may be inadequate to protect our business.”
Employees
As of September 30, 2014, we had 1,825 employees across the United States and 296 employees in the United Kingdom. We have not experienced a shortage of qualified personnel in the past, and believe that we will be able to attract such employees in the future. None of our employees are a party to a collective bargaining agreement, and we consider our relations with our employees to be good.
9
Website
Our website address is www.mwivet.com and can be used to access free of charge, through the investor relations category, our annual report on Form 10-K, quarterly reports on Form 10-Q, current reports on Form 8-K, and any amendments to those reports, as soon as reasonably practicable after we electronically file such material with or furnish it to the SEC. The information on our website is not incorporated as a part of this annual report. The public can also obtain copies of these reports by visiting the SEC’s Public Reference Room at 100 F Street NE, Washington DC 20549, or by calling the SEC at 1-800-SEC-0330, or by accessing the SEC’s website at www.sec.gov.
Governmental Regulation
Certain of our businesses involve the distribution of pharmaceuticals, and in this regard we are subject to various local, state, federal and foreign governmental laws and regulations applicable to the distribution of pharmaceuticals. Our vendors of pharmaceuticals, vaccines, parasiticides and certain controlled substances are typically regulated by federal agencies, such as the Food and Drug Administration (“FDA”), the United States Department of Agriculture (“USDA”), the Environmental Protection Agency (“EPA”), and the Drug Enforcement Agency (“DEA”), as well as most similar state agencies. Therefore, we are subject, either directly or indirectly, to regulation by the same agencies. Most states and the DEA require us to be registered or otherwise keep a current permit or license to handle controlled substances. Manufacturers of vaccines are required by the USDA to comply with various storage and shipping criteria and requirements for vaccines. To the extent we distribute such products, we must comply with the same requirements, including, without limitation, the storage and shipping requirements for vaccines.
Most state boards of pharmacy require us to be licensed in their respective states for the sale of pharmaceutical products and medical devices within their jurisdictions. As a distributor of prescription pharmaceutical products, we are subject to the Prescription Drug Marketing Act (“PDMA”). The PDMA provides governance and authority to the states to provide minimum standards, terms and conditions for the licensing by state licensing authorities of persons who “engage” in wholesale distribution (as defined by each state regulatory agency) in interstate commerce of prescription drugs. With this authority, states require site-specific registrations for the parties that engage in the selling and/or physical distribution of pharmaceutical products into their state in the form of out-of-state registrations. The federal pedigree regulations of the FDA under the PDMA require tracking human labeled prescription products through the entire distribution chain and are applicable to distributors that do not have a written agreement with the manufacturer granting the wholesale distributor status as an “Authorized Distributor of Record.” Selling and/or distributing products without the appropriate registrations may subject us to fines, penalties, misdemeanor or felony convictions, and/or seizure of the products involved. We have a Manager of Regulatory Compliance and have engaged outside consultants as needed to assist us in meeting and complying with the various state and federal licensure requirements to which we are subject.
In order to supply pharmaceutical products in the United Kingdom, we must comply with the requirements of the applicable regulatory bodies. The Veterinary Medicines Directorate regulates the use of veterinary products and the Medicines Healthcare Products Regulatory Authority regulates the use of human medicinal products within the United Kingdom.
Our pet cremation business is subject to state and local zoning laws, and we are required to maintain permits for the construction and operation of an animal incineration device. We are also required to have an air pollution permit in connection with the operation of our pet cremation business.
Some states (as well as certain cities and counties) require us to collect sales taxes/use taxes on certain types of animal products. We are also subject to laws governing our relationship with employees, including minimum wage requirements, overtime, working conditions and citizenship requirements. In addition, we are subject to additional regulations regarding our hiring practices because several federal, state and local governmental agencies are our customers.
Environmental Considerations
We do not currently manufacture or alter in any way the composition of the vast majority of the products that we distribute. All products are distributed in compliance with the relevant rules and regulations as approved by various state and federal agencies.
10
Executive Officers of the Registrant
The following table sets forth the names, ages and titles, as well as a brief account of the business experience of each person who was an executive officer of the Company as of the date of the filing:
|
Name |
|
|
|
Age |
|
Title |
|
James F. Cleary, Jr. |
|
51 |
|
Board Director, President and Chief Executive Officer |
||
|
Mary Patricia B. Thompson |
|
51 |
|
Senior Vice President of Finance and Administration, Chief Financial Officer |
||
|
Jeffrey J. Danielson |
|
54 |
|
Vice President of Sales |
||
|
John J. Francis |
|
61 |
|
Vice President and General Manager of the Specialty Resources Group |
||
|
Bryan P. Mooney |
|
46 |
|
Vice President of Operations |
||
|
Kevin W. Price |
|
46 |
|
Vice President of Inventory Management |
||
|
John R. Ryan Alden J. Sutherland Jeremy C. Ouchley |
|
45 51 38 |
|
Vice President of Marketing Vice President and Chief Information Officer Vice President and General Counsel |
||
|
|
|
|
|
|
||
James F. Cleary, Jr. has served as President since March 2000 and Chief Executive Officer since June 2002. Mr. Cleary has also been a member of the Board of Directors since June 2002. He joined MWI in January 1998 as Director of National Accounts and was promoted to Vice President of Demand Generation in 1999. Mr. Cleary was Vice President of Agri Beef, MWI’s former parent, from 1996 to 1998. From 1990 to 1996, Mr. Cleary was employed in management positions with Morrison Knudsen Corporation and its affiliate MK Rail Corporation. Mr. Cleary graduated from Dartmouth College in 1985 with a Bachelor of Arts in Economics and received his Masters of Business Administration from Harvard Business School in 1990. Mr. Cleary is also a member of the Board of Managers of Feeders’ Advantage, L.L.C.
Mary Patricia B. Thompson, CPA has served as Senior Vice President of Finance and Administration, Chief Financial Officer since August 2006, with oversight of finance, inventory management, information technology, and human resources. Prior to August 2006, Ms. Thompson had been the Vice President, Secretary and Chief Financial Officer since June 2002. Ms. Thompson joined Agri Beef in 1989 as the Feedlot and Commodity Division Controller. In September 1991, Ms. Thompson was promoted to Controller of MWI Co., then a wholly-owned subsidiary of Agri Beef. Prior to joining Agri Beef, Ms. Thompson worked for Arthur Andersen LLP from 1985 to 1989, where she provided auditing and accounting services. Ms. Thompson graduated from the University of Idaho in 1985, summa cum laude, with a Bachelor of Science in Accounting. Ms. Thompson is a licensed Certified Public Accountant in the state of Idaho. Ms. Thompson is a member of the Board of Directors and past-president of the American Veterinary Distributors Association. Ms. Thompson is also a member of the University of Idaho College of Business and Economics Advisory Board.
Jeffrey J. Danielson has served as Vice President of Sales since 2001. Mr. Danielson joined MWI in 1985 as an Outside Sales Representative, serving the state of Washington. From 1989 to 1991, Mr. Danielson served as Assistant Sales Manager and from 1991 to 2001 served as National Sales Manager. Mr. Danielson graduated from Colorado State University in 1983 with a Bachelor of Science in Agricultural Business.
John J. Francis has served as Vice President and General Manager of the Specialty Resources Group since September 2006. Prior to joining MWI, Mr. Francis worked for Webster Veterinary Supply as the Vice President of Sales from April 2004 to September 2006. Mr. Francis was the Key Account Manager of Excel, a division of Cargill, Inc., from June 2002 to April 2004 and was the Vice President of Sales for Future Beef based in Parker, Colorado, from May 2000 to May 2002. From 1990 until 2000, Mr. Francis served as General Manager and then President of MWI Co. Mr. Francis graduated from Michigan State University in 1975 with a Bachelor of Science in Animal Husbandry and holds a Master of Science in Animal Science obtained in 1977 from the University of Illinois. Mr. Francis is a member of the Board of Directors of Vedco, Inc.
Bryan P. Mooney has served as Vice President of Operations since May 2005. Mr. Mooney joined MWI in January 1994 as the Operations Manager of our Denver, Colorado distribution operation and served in that capacity until May 1998. From May 1998 until February 2005, Mr. Mooney served as Manager of Transportation and Logistics and from
11
January 2005 until May 2005 as the Western Regional Operations Manager. Mr. Mooney graduated from the University of Wyoming in 1991 with a Bachelor of Science in Agricultural Business.
Kevin W. Price has served as Vice President of Inventory Management since October 1, 2011. From 2003 to 2011, Mr. Price served as Purchasing Manager. In 1998, Mr. Price was promoted to Food Animal Product Manager. Mr. Price joined MWI in April 1989 in our Nampa distribution center. Mr. Price graduated from Northwest Nazarene University in 2010 with a Bachelor of Science in Business Administration. Mr. Price is member of the Board of Directors of Agri Laboratories, Ltd. In 2007, Mr. Price filed for bankruptcy under Chapter 13 of the United States Bankruptcy Code, and Mr. Price has informed the Company that he is performing his obligations in full under the plan. Mr. Price has also informed the Company that he intends to make additional payments outside of the plan so that his legitimate creditors will be paid in full when all payments are completed.
John R. Ryan has served as Vice President of Marketing since 2000. Mr. Ryan joined MWI in June 1995 as an Outside Sales Representative and served in such capacity until June 2000. Prior to joining MWI, Mr. Ryan worked for the Virbac Corporation (a companion animal pharmaceutical company) as a Territory Manager from 1993 to 1995. Mr. Ryan graduated from the University of California, Davis in 1993 with a Bachelor of Science in Animal Physiology.
Alden J. Sutherland joined MWI in January 2012 and has served as Vice President and Chief Information Officer since April 1, 2012. Prior to joining MWI, he served as President of Exploridor since January 2011. Prior to Exploridor, he served as President of Pristine Pools and Spas from 2010 to 2011. He served as Chief Information Officer at Jostens, Inc. in Minneapolis, Minnesota from 2006 to 2010. From 2000 to 2006, he served as Chief Information Officer at Entegris, Inc. From 1987 to 2000, he held various leadership and I.T. positions for Novartis in its former Seed and Crop Protection Divisions, including Director of I.T. in the United States, Head of I.T., Finance and Planning for the Asia Pacific Region, Head of Finance, I.T. and Operations for the Eastern Europe and Former Soviet Union Region and Controller for Europe and Latin America. Mr. Sutherland graduated from Boise State University in 1988 with a Bachelor of Business Administration.
Jeremy C. Ouchley joined MWI in October 2013 as Vice President and General Counsel. Prior to joining MWI, he served as Business Unit Counsel for McKesson Corporation from December 2010 to September 2013. From March 2007 to December 2010, he served as Associate General Counsel – Business Development of US Oncology, Inc., and as Senior Counsel from February 2006 to March 2007. Previously, Mr. Ouchley practiced corporate and securities law with Baker Botts LLP from September 2002 to February 2006. Mr. Ouchley received his JD from the University of Texas School of Law in 2002, with honors, and received his Bachelors of Business Administration, summa cum laude, from the University of Louisiana at Monroe in 1998.
12
In addition to the factors discussed elsewhere in this Form 10‑K, the following are important factors which could cause actual results or events to differ materially from those contained in any forward-looking statements made by or on behalf of the Company.
Our operating results may fluctuate due to factors outside of management’s control.
Our future revenues and results of operations may significantly fluctuate due to a combination of factors, many of which are outside of management’s control. The most notable of these factors include:
|
· |
the impact of vendor consolidation on our business; |
|
· |
changes in or availability of vendor contracts or rebate programs; |
|
· |
vendor rebates based upon attaining certain growth goals; |
|
· |
transitional challenges associated with acquisitions, including the failure to retain customers, system integrations, and the disproportionate demands on management resources to integrate acquired businesses; |
|
· |
financial risks associated with acquisitions and investments; |
|
· |
changes in the way vendors introduce/deliver products to market; |
|
· |
seasonality; |
|
· |
competition; |
|
· |
possible changes in the use of feed additives (antibiotics, growth promotants) used in production animal products due to trade restrictions, animal welfare and/or government regulations; |
|
· |
an outbreak of foodborne diseases in production animal products; |
|
· |
inability to ship products to the customer as a result of technological or shipping disruptions; |
|
· |
the recall of a significant product by one of our vendors or suppliers; |
|
· |
risks associated with our international operations; |
|
· |
failures of, or security problems with, our information systems; |
|
· |
an outbreak of infectious disease in animals; |
|
· |
extended shortage or backorder of a significant product by one of our vendors; |
|
· |
the impact of tightening credit standards and/or access to credit on behalf of our customers and suppliers; |
|
· |
a disruption caused by adverse weather (i.e. drought) or other natural conditions or disasters; |
|
· |
exclusivity requirements with certain vendors that may prohibit us from distributing competing products manufactured by other vendors or margin reductions if we become a non-exclusive distributor; |
|
· |
the impact of general economic trends on our business; |
|
· |
our intellectual property rights may be inadequate to protect our business; |
|
· |
the timing and effectiveness of marketing programs or price changes offered by our vendors; |
|
· |
the timing of the introduction of new products and services by our vendors; |
|
· |
unforeseen litigation; |
|
· |
the ability to borrow on our revolving credit facility, extend the terms of our revolving credit facility or obtain alternative financing on favorable terms or at all; and |
|
· |
risks from potential increases in variable interest rates. |
These factors could adversely impact our results of operations and financial condition. We may be unable to reduce operating expenses quickly enough to offset any unexpected shortfall in revenues or gross profit. If we have a shortfall in revenues or gross profit without a corresponding reduction to expenses, operating results may suffer. Our operating results for any particular fiscal year or quarter may not be indicative of future operating results. You should not rely on year-to-year or quarter-to-quarter comparisons of results of operations as an indication of our future performance.
13
The loss of one or more of our key vendors, a material reduction in their supply of products to us or material changes in the terms we obtain from them could have a material adverse effect on our business.
We currently do not manufacture the vast majority of our products and are dependent on our vendors for our supply of products. We maintain written agreements with many of our vendors, but most agreements are terminable by either party without cause on short notice. Our ten largest vendors accounted for approximately 67% of our revenues for the fiscal year ended September 30, 2014, 70% of our revenues for the fiscal year ended September 30, 2013 and 71% of our revenues for the fiscal year ended September 30, 2012. Zoetis supplied products that accounted for approximately 20% of our revenues for our fiscal years ended September 30, 2014, 2013, and 2012. Of the Zoetis supplied products, production animal products under a livestock products agreement accounted for approximately 10% of our revenues for our fiscal years ended September 30, 2014 and 2013, and approximately 11% of our revenues for our fiscal year ended September 30, 2012. Merck (formerly known as Intervet/Schering-Plough), supplied products that accounted for approximately 11%, 14% and 15% of our revenues for our fiscal years ended September 30, 2014, 2013 and 2012, respectively. Elanco, the animal health division of Eli Lilly and Company, supplied products that accounted for approximately 10% of our revenues for our fiscal years ended September 30, 2014 and 2013, and approximately 9% of our revenues for the fiscal year ended September 30, 2012. Merial, the animal health division of Sanofi, supplies the majority of their products to us under an agency relationship. Commission revenue generated from Merial products accounted for approximately 47%, 50% and 52% of total commission revenues for our fiscal years ended September 30, 2014, 2013 and 2012, respectively.
Our ability to sustain our gross profits is dependent in part upon our ability to obtain favorable terms and access to new and existing products from our vendors. These terms may be subject to changes from time to time by vendors, such as changing from a “buy/sell” to an agency relationship, or from an agency to a “buy/sell” relationship, either of which could adversely affect our revenues and operating income.
Vendors may also choose to change the method in which products are taken to market. A vendor may change our relationship from a complete distribution provider, including logistics and sales support, to only a logistics provider or only a sales support provider. A reduction in our role as a value-added service provider would result in reduced margins on product sales, which could have a material adverse effect on our business.
Even if we maintain our vendor relationships, our vendors may decide to compete with us by pursuing or increasing their efforts in direct marketing and sales of their products. These vendors could sell their products at lower prices and maintain a higher gross margin on their product sales than we can. In this event, veterinarians or animal owners may elect to purchase animal health products directly from these vendors. Vendors may also elect to discontinue sales through distributors, including us, for some or all of their products. For example, in July 2014, we received notice that IDEXX Laboratories is moving to a fully direct sales and distribution model, and as a result, is ending its companion animal diagnostic products distribution agreement with us, effective December 31, 2014. Increased competition from any vendor of animal health products could significantly reduce our market share and adversely impact our financial results.
An adverse change in vendor rebates could negatively affect our business.
The terms on which we purchase or sell products from many vendors of animal health products may entitle us to receive a rebate based on the attainment of certain growth goals. Vendors may adversely change the terms of or eliminate some or all of these rebate programs at any time without notice. Because the amount of rebates we earn is directly related to the attainment of pre-determined sales growth goals, and because the nature of the rebate programs and the amount of rebates available are determined by the vendors, there can be no assurance as to the amount of rebates that we will earn in any given year. Changes to or elimination of any rebate program initiated by our vendors may have a material effect on our gross profit and our operating results in any given quarter or year. Vendors may reduce or eliminate rebates offered under their programs, interpret the terms of their rebate programs in a way that is adverse to us or increase the growth goals or other conditions we must meet to earn rebates to levels that we cannot achieve. Increased competition either from generic or equivalent branded products could result in us failing to earn rebates that are conditioned upon achievement of growth goals. Additionally, factors outside of our control, such as customer preferences or vendor supply issues, can have a material impact on our ability to achieve the growth goals established by our vendors, which may reduce the amount of rebates we receive. The occurrence of any of these events could have an adverse impact on our results of operations.
14
Consolidation among our vendors could be harmful to our business.
Vendor consolidation continues in the animal health industry, which is a trend that could harm our business. For example, in 2014, Eli Lilly announced an agreement to acquire Novartis Animal Health to expand its existing animal health business, Elanco. As vendors consolidate, they may use their increased market share as leverage to negotiate terms, such as pricing, that are materially less favorable to us than our current terms. In addition, consolidated vendors may be more likely to sell directly to animal health customers. If vendors have difficulty integrating consolidated operations, product supply to us could be disrupted. The occurrence of any of these events could materially adversely affect our net sales and profitability. There is also a possibility of product disruption as these companies integrate their operations which could adversely impact our financial results. Further consolidation could result in our vendors further increasing their market share, which could give vendors greater pricing power and make it easier for such vendors to sell their products directly to animal health customers, both of which could decrease our net sales and profitability.
Difficulties with the integration of acquisitions or the improvement of the performance of acquired companies may impose substantial costs and delays and cause other unanticipated problems for us.
In connection with our growth strategy, we from time to time acquire other businesses that we believe will expand or complement our existing businesses and operations. For example, in November 2013, we acquired substantially all of the assets of IVESCO, a distributor of animal health and related products, and on September 2, 2014, we acquired the outstanding share capital of VetSpace, a provider of practice management software to veterinary practices, principally in the United Kingdom. Acquisitions involve a number of risks relating to our ability to integrate an acquired business into our existing operations. The process of integrating or improving the performance of the operations of an acquired business, particularly its personnel, could cause interruptions to our business. Some of the risks we face include:
|
· |
the need to spend substantial operational and financial resources in integrating new businesses, technologies and products, and difficulties management may encounter in integrating or improving the performance of the operations, personnel or systems of the acquired business; |
|
· |
the need to spend a disproportionate amount of management resources on new acquisitions, potentially distracting management from other key business activities; |
|
· |
difficulties integrating the information technology systems of the businesses we acquire; |
|
· |
retention of key personnel, customers and vendors of the acquired business; |
|
· |
damage to relationships with customers, resulting in loss of customers; |
|
· |
regulatory issues with acquired operations or assets; |
|
· |
impairments of goodwill and other intangible assets; and |
|
· |
contingent and latent risks associated with the past operations of, and other unanticipated costs and problems arising in, an acquired business. |
If we are unable to successfully integrate the operations of an acquired business into our operations, we could be required to undertake unanticipated changes. These changes could have a material adverse effect on our business.
In addition, it may be difficult to manage rapid growth from our acquired companies in the future, and the future success of our acquisitions depends on our ability to implement and/or maintain:
|
· |
sales and marketing programs; |
|
· |
customer service levels; |
|
· |
current and new product and service lines and vendor relationships; |
|
· |
technological support which equals or exceeds our competitors’; |
|
· |
recruitment and training of new personnel; and |
|
· |
operational and financial control systems. |
If we are not able to manage our rapid growth from our acquisitions, there is a risk our customer service quality could deteriorate which may in turn lead to decreased sales or profitability. Also, due to acquisitions the cost of our operations could increase faster than growth in our revenues, negatively impacting our profitability.
15
Our quarterly operating results may fluctuate significantly, and these fluctuations may cause our stock price to fall.
Our quarterly revenues and operating results have varied significantly in the past, and may continue to do so in the future. Reasons for this seasonal variability include:
|
· |
higher vendor rebates during the quarter ending December 31, as a result of rebate programs designed around full calendar year targets; |
|
· |
seasonal buying patterns for production animal products for medical procedures performed during the spring and fall months; |
|
· |
vendor and distributor marketing program and price increase announcements, which can lead to advance purchases of products by our customers, resulting in lower sales in later periods; |
|
· |
volatility in commodity prices (e.g., milk, grains, livestock and poultry) and weather patterns (e.g., droughts or seasons of higher precipitation), which impact the timing of animal treatment patterns, and, consequently, our revenues; and |
|
· |
changes in the general economy impacting production animal markets. |
We believe period-to-period comparisons of our results of operations are not necessarily meaningful as our future revenue and results of operations may vary substantially. It is also possible that in future quarters our results of operations will be below the expectations of securities analysts and investors. In either case, the price of our common stock could decline, possibly materially.
Our market is highly competitive. Failure to compete successfully could have a material adverse effect on our business, financial condition and results of operations.
The market for veterinary distribution services is highly competitive, continually evolving and subject to technological change. We compete with numerous vendors and distributors based on customer relationships, service and delivery, product selection, price and e-commerce capabilities. Our primary competitors in the United States include the following:
|
· |
Animal Health International, Inc.; |
|
· |
Henry Schein Animal Health; |
|
· |
Midwest Veterinary Supply; |
|
· |
Patterson Veterinary; |
|
· |
other national, regional, local and specialty distributors; and |
|
· |
manufacturers with direct sales capabilities. |
Some of our competitors may have more customers, stronger brand recognition or greater financial, technological and other resources than we do. Most of our products are available from several sources, including other distributors and vendors, and our customers typically have relationships with several distributors and vendors. Many of our competitors have comparable product lines, technical expertise or distribution strategies that directly compete with us and some of our competitors own veterinary practice management software, which they can offer to customers. Our competitors could obtain exclusive rights to distribute certain products, eliminating our ability to distribute those products. The entry of new or additional animal health distributors could also have a material adverse effect on our ability to compete. If we do not compete successfully against these organizations, it could have a material and adverse effect on our business, financial condition and results of operations.
We only have one distribution center in the United Kingdom and any catastrophic event could materially impact our results.
We conduct all of our fulfillment operations in the United Kingdom from our distribution center in Castle Cary, England. This facility contains all of our product inventory in that country. A natural disaster or other catastrophic event, such as a fire, break-in, server or systems failure, terrorist attack, or other comparable event at this facility would cause interruptions or delays in our business and loss of inventory and could render us unable to process or fulfill customer orders in a timely manner, or at all. Further, we have a limited disaster recovery plan, and our business interruption insurance may not adequately compensate us for losses that may occur, including with respect to any lost profits for any period in which the
16
business is not able to operate. If our operations at our UK facility were interrupted, our business, financial condition, and operating results would be harmed.
Consolidation of veterinary practices and the formation of buying groups may decrease our revenues and profitability.
Consolidation of the many small, privately-held veterinary practices and the formation of buying groups by veterinarians could lead to our customers having increased purchasing leverage and the ability to negotiate lower product costs. This could reduce our operating margins and negatively impact our revenues and profitability. Any of these developments could result in increased marketing expenses and have a material adverse effect on our business, financial condition and results of operations.
Increases in over-the-counter sales of animal health products or sales of products from non-veterinarian sources could adversely affect our business.
We sell our products primarily to veterinarians. For this reason, we rely on animal owners who purchase their animal health products directly from veterinarians, which we refer to as the ethical channel. Animal health products are becoming increasingly available to consumers at competitive prices from sources other than the ethical channel, including:
|
· |
human health product pharmacies; |
|
· |
internet pharmacies; and |
|
· |
big-box retailers such as Walmart, Target and Costco. |
Any increased competition from non-ethical channels could significantly reduce our market share and adversely impact our financial results.
Demand from customers in the production animal market may be adversely affected by a decrease in the sale and consumption of protein products due to increased consumer concern with health and animal welfare, loss of export markets, international trade restrictions and/or governmental regulations, or an outbreak of foodborne disease.
Recently, there has been consumer concern and consumer activism with respect to the use of antibiotics and growth promotants in animal feed as well as the consumption of protein (defined as beef, dairy, swine or poultry) products generally. In addition, heightened concern over production animal welfare has resulted in a growth promotant product we sell being removed from the market. A sustained campaign of negative press resulting from media or consumer advocacy groups, industry litigation, loss of export markets or other factors could adversely affect the public’s perception of the industry as a whole, lead to reluctance by customers to buy protein or other products. The resulting negative impact on the production animal market can strongly affect demand for the products we distribute. Continued concern over the impact of growth promotants on animal welfare could result in further removal from the market of products in that category, adversely impacting our sales. In addition, heightened consumer concern over the use of antibiotics and growth promotants in animal feed could result in increased government regulation in response to that concern. Finally, an outbreak of foodborne disease could reduce consumer demand for animal products, harm export markets for such products and lead to increased government regulation of the industry. Any such event may affect the growth of the production animal market and lead to a decrease in the sales of the products we distribute which could have a material adverse effect on our business, financial condition and results of operations.
Risks associated with our international operations.
We have operations in the United Kingdom, and we may expand our international operations into other countries. International operations are subject to risks that may materially adversely affect our business, results of operations and financial condition. The risks that our international operations are subject to include, among other things:
|
· |
difficulties and costs relating to staffing and managing foreign operations; |
|
· |
difficulties in establishing channels of distribution; |
|
· |
fluctuations in the value of foreign currencies; |
|
· |
repatriation of cash from our foreign operations to the United States; |
17
|
· |
regulatory requirements; |
|
· |
foreign countries may impose additional withholding taxes or otherwise tax our foreign income; |
|
· |
separate operating and financial systems; |
|
· |
disaster recovery; |
|
· |
unexpected difficulties in importing or exporting our products; |
|
· |
imposition of import/export duties, quotas, sanctions or penalties; |
|
· |
liability related to the defined benefit plan; and |
|
· |
unexpected regulatory, economic and political changes in foreign markets. |
Our business in the United Kingdom relies on a smaller number of relatively large customers than our business in the United States, and any default in payment by one or more of these significant customers there could adversely impact our results of operations and financial condition.
Our wholly owned subsidiary, Centaur, a distributor of animal health products to veterinarians in the United Kingdom, relies on a smaller number of relatively large customers than does our business in the United States. Centaur’s customers in the aggregate account for 12.3% and 14.5% of our consolidated accounts receivable balance as of September 30, 2014 and 2013, respectively. Like all of our customers, we continually assess these customers’ ability to pay us and adjust our allowance for doubtful accounts as necessary. However, if any of the significant customers of Centaur were to become insolvent or otherwise are unable or unwilling to make timely payments to us for any reason, our business in the United Kingdom will be harmed, and our results of operations and financial condition will be adversely affected.
We rely substantially on third-party vendors, and the loss of products or delays in product availability from one or more third-party vendors could substantially harm our business.
We must contract for the supply of current and future products of appropriate quantity, quality and cost. These products must be available on a timely basis and be in compliance with any regulatory requirements. Failure to do so could substantially harm our business.
We often purchase products from our vendors under agreements that typically have a term of one year and can be terminated on short notice. Our vendors may not meet their obligations under these agreements. Risks of relying on vendors include:
|
· |
If an existing agreement expires or a certain product line is discontinued or recalled, then we would not be able to continue to offer our customers the same breadth of products and our sales and operating results would likely suffer unless we are able to find an alternate supply of a similar product. |
|
· |
If market demand for our products increases suddenly, our current vendors might not be able to fulfill our commercial needs, which would require us to seek new manufacturing arrangements or find new sources of supply, and may result in substantial delays in meeting market demand. If we consistently generate more demand for a product than a given vendor is capable of handling, it could lead to large backorders and potentially lost sales to competitive products that are more readily available. |
|
· |
We may not be able to control or adequately monitor the quality of products we receive from our vendors. Poor quality products could damage our reputation with our customers. |
|
· |
Some of our third party vendors are subject to ongoing periodic unannounced inspection by regulatory authorities, including the FDA, the USDA, the EPA and the DEA, as well as other federal and state agencies for compliance with strictly enforced regulations. We do not have control over our vendors’ compliance with these regulations and standards. Violations could potentially lead to interruptions in supply that could lead to lost sales to competitive products that are more readily available. |
|
· |
If a vendor is unable to obtain the necessary credit to manage their business, they may not be able to deliver their products to us. |
Potential problems with vendors such as those described above could substantially decrease sales of our products, lead to higher costs and damage our reputation with our customers.
18
We rely upon third parties to ship products to our customers and interruptions in their operations could harm our business, financial condition and results of operations.
We use UPS and FedEx as our primary delivery services for our air and ground domestic shipments of products to our customers. If there were any significant service interruptions, there can be no assurance that we could engage alternative service providers to deliver these products in either a timely or cost-efficient manner, particularly in rural areas where many of our customers are located. Any labor disputes, slowdowns, transportation disruptions or other adverse conditions in the transportation industry experienced by UPS or FedEx could impair or disrupt our ability to deliver our products to our customers on a timely basis, and could have a material adverse effect upon our customer relationships, business, financial condition and results of operations. In addition, rising fuel costs may result in continued increases in shipping costs charged by UPS or FedEx, or other delivery service providers, and could have an adverse effect on our financial condition and results of operations.
The loss of one or more significant customers could adversely affect our profitability.
Our two largest customers, Banfield and Feeders’ Advantage (a related party), accounted for approximately 5% and 2%, respectively, of our product sales for our fiscal year ended September 30, 2014, 6% and 3%, respectively, of our product sales for our fiscal year ended September 30, 2013 and 6% and 3%, respectively, of our product sales for our fiscal year ended September 30, 2012. Our ten largest customers, excluding Banfield and Feeders’ Advantage, accounted for approximately 7% of our product sales for our fiscal years ended September 30, 2014 and 2013 and 6% of our product sales for our fiscal year ended September 30, 2012. Our business and results of operations could be adversely affected if the business of these customers was lost. We cannot guarantee that we will maintain or improve our relationships with these customers or that we will continue to supply these customers at current levels. Banfield, Feeders’ Advantage and other customers may seek to purchase some of the products that we currently sell directly from the vendors or from one or more of our competitors. Furthermore, our customers are not required to purchase any minimum amount of products from us. The loss of Banfield or Feeders’ Advantage or deterioration in our relations with either of them could significantly affect our financial condition and results of operations. Additionally, deterioration in the financial condition of one or more of our customers could have a material adverse effect on our results of operations.
Our acquired technology or developed technology may not be successful in maintaining existing customers or gaining new customers or the technology may fail to produce its intended results.
The process of acquiring or developing new technology products and solutions is inherently complex and uncertain. It requires accurate anticipation of customers’ changing needs and emerging technological trends. We must make long-term investments and commit significant resources before knowing whether these investments will eventually result in products or services that achieve customer acceptance and generate the revenues required to provide desired returns. If we fail to accurately anticipate and meet our customers’ needs through the development of new products and technologies and service offerings or if we fail to adequately protect our intellectual property rights or if our new products are not widely accepted or if our current or future products fail to meet applicable worldwide regulatory requirements, we could lose market share and customers to our competitors and that could materially adversely affect our results of operations and financial condition. Additionally, if technology investments do not achieve the intended results we may write-off the investments, and we face the risk of claims from system users that the systems failed to produce the intended result and/or that the systems caused negative performance of the customer’s animals or overall operation of the customer’s business. Any such claims, even those without merit, could be expensive and time consuming to defend, cause us to lose a customer and the associated revenue, divert management’s attention and resources or require us to pay damages.
If we fail to comply with or become subject to more onerous government regulations governing our industry, our business could be adversely affected.
The animal health products distribution industry is subject to changing political and regulatory influences. Both state and federal government agencies regulate the distribution of certain animal health products and we are subject to regulation, either directly or indirectly, by the FDA, the USDA, the EPA, the DEA and comparable state agencies. As a distributor of prescription pharmaceutical products, we are also subject to the PDMA, which provides for minimum standards, terms and conditions to be maintained for licensing as a distributor, including strict drug pedigree requirements for human labeled prescription products. If we are unable to maintain or achieve compliance with these laws and regulations, we could be
19
subject to substantial fines or other restrictions on our ability to provide competitive distribution services, which could have an adverse impact on our financial condition.
Our vendors are subject to regulation by the FDA, the USDA, the EPA, the DEA, and the PDMA, as well as other federal and state agencies, and material changes to the applicable regulations could affect our vendors’ ability to manufacture certain products, which could adversely impact our product supply. In addition, some of our customers may rely, in part, on farm and agricultural subsidy programs. Changes in the regulatory positions that impact the availability of funding for such programs could have an adverse impact on our customers’ financial positions, which could lead to decreased sales.
We cannot assure you that existing laws and regulations will not be revised or that new, more restrictive laws will not be adopted or become applicable to us or the products that we distribute or dispense. We cannot assure you that the vendors of products that may become subject to more stringent laws will not try to recover any or all increased costs of compliance from us by increasing the prices at which we purchase products from them, or that we will be able to recover any such increased prices from our customers. We also cannot assure you that our business and financial condition will not be materially and adversely affected by future changes in applicable laws and regulations.
Loss of key management or sales representatives could harm our business.
Our future success depends to a significant extent on the skills, experience and efforts of management, including our President and Chief Executive Officer, Mr. James F. Cleary, Jr. While we have not experienced problems in the past attracting and maintaining members of our management team, the loss of any or all of these individuals could adversely impact our business. We do not carry key-man life insurance on any member of management. In addition, we do not have employment agreements with key members of our senior management team. We must continue to develop and retain a core group of individuals if we are to realize our goal of continued expansion and growth. We cannot assure you that we will be able to do so in the future.
Also, due to the specialized nature of our products and services, generally only highly qualified and trained sales representatives have the necessary skills to market our products and provide our services. These individuals develop relationships with our customers that could be damaged if these employees are not retained. We face intense competition for the hiring of these professionals, and many professionals in the field that may otherwise be attractive candidates for us to hire may be bound by non-competition agreements with our competitors. Any failure on our part to hire, train and retain a sufficient number of qualified professionals would damage our business. We do not generally enter into agreements that contain non-competition provisions with our employees, other than with members of our senior management team, former owners of acquired companies and certain other employees.
Failures of, or security problems with, our information systems could damage our business.
Our information systems are dependent on third party software, global communications providers, telephone systems and other aspects of technology and Internet infrastructure that are susceptible to failure. Though we have implemented security measures and some redundant systems, our customer satisfaction and our business could be harmed if we or our vendors or customers experience any system delays, failures, loss of data, power outages, computer viruses, break-ins, unauthorized access by competitors or similar disruptions. Although we have safeguards for emergencies, including, without limitation, sophisticated back-up systems, the occurrence of a major catastrophic event or other system failure at any of our distribution facilities could interrupt data processing or result in the loss of stored data. This may result in the loss of customers or a reduction in demand for our services. Our systems could be susceptible to failure as we modify or upgrade our systems to integrate acquired operations or to expand system capacity. Only some of our systems are fully redundant and although we do carry business interruption insurance, it may not be sufficient to compensate us for losses that may occur as a result of system failures. If a disruption occurs, our profitability and results of operations may suffer.
The outbreak of an infectious disease within either the production animal or companion animal population could have a significant adverse effect on our business and our results of operations.
An outbreak of disease affecting animals, such as foot-and-mouth disease, porcine epidemic diarrhea virus (“PED”) or bovine spongiform encephalopathy, commonly referred to as “mad cow disease,” could result in the widespread destruction of affected animals and consequently result in a reduction in demand for animal health products. In addition, outbreaks of these or other diseases or concerns of such diseases could create adverse publicity that may have a material adverse effect on
20
consumer demand for meat, dairy and poultry products, and, as a result, on our customers’ demand for the products we distribute. The outbreak of a disease among the companion animal population which could cause a reduction in the demand for companion animals could also adversely affect our business. Although we have not been adversely impacted by the outbreak of a disease in the past, there can be no assurance that a future outbreak of an infectious disease will not have an adverse effect on our business.
Our business may be directly and indirectly affected by poor or unusual weather conditions that could reduce demand for the products we distribute.
Poor or unusual weather conditions can significantly affect the purchasing decisions of our production animal customers. The timing and quantity of rainfall are two of the most important factors in agricultural production. Drought can affect the availability and price of feed for livestock. Faced with a reduction in readily available feed or an increase in costs for such feed, our customers may decide to further reduce herd size, which would ultimately decrease the demand for the products we distribute, including micro feed ingredients, animal health products, dairy sanitation solutions, as well as the development and implementation of proprietary computerized systems for feed, health, information and production animal management.
We may lose access to products as a result of vendor exclusivity requirements, which could cause a loss of market share and business.
We may not be able to establish or maintain relationships with key vendors in the animal health industry if we have established relationships with competitors of these key vendors. Although we have written agreements with many of our vendors, most are terminable without cause on short notice. Upon expiration, we may not be able to renew our existing agreements on favorable terms, or at all.
In addition, vendors may require us to distribute their products on an exclusive basis, which would cause us to forego distributing competing products that may also be profitable, including generic products that may gain increased market share. In this situation we are often forced to project future sales of competing products so that we can elect to distribute the product that we believe will be more profitable. Our projections may not be correct, and we may be contractually prohibited from distributing products that gain market share, including generic products, at the expense of the products that we distribute. Competitors of ours could also obtain exclusive rights to market particular products, which we would be unable to market. If we lose the right to distribute products under such agreements, or are required to exclusively distribute certain products at the expense of others that may be more profitable, we may lose access to certain products and lose a competitive advantage. Potential competitors could sell products from vendors that we fail to continue with and erode our market share. Additionally, if we have a reduction in our gross margin as a result of switching from an exclusive distributor to a non-exclusive distributor, the gross margin generated from the additional products that we are able to sell may not be enough to offset the decrease.
Our financial results could be adversely affected by foreign exchange fluctuations.
We operate in both the United States and the United Kingdom, but report revenues, costs and earnings in U.S. dollars. Exchange rates between the U.S. dollar and the British pound sterling are likely to fluctuate from period to period. Because our financial results are reported in U.S. dollars, we are subject to the risk of translation losses for reporting purposes. If we continue to expand our international operations, we will conduct more transactions in currencies other than the U.S. dollar. To the extent that foreign revenue and expense transactions are not denominated in the local currency, we are also subject to the risk of transaction losses. Given the volatility of exchange rates, there is no assurance that we will be able to effectively manage currency transaction and/or translation risks. We have not entered into derivative instruments to offset the impact of foreign exchange fluctuations. Fluctuations in foreign currency exchange rates could have a material adverse effect on our results of operations and financial condition.
An economic downturn could materially adversely affect our business.
Our business may be materially adversely affected by negative trends in the general economy that could reduce consumer discretionary spending on animal health products and reduce or eliminate sources of credit available to our customers. Some of the factors that could influence the levels of consumer spending include continuing increases in fuel and other energy costs, conditions in the residential real estate and mortgage markets, unemployment levels, healthcare costs,
21
access to credit, consumer confidence and other macroeconomic factors affecting consumer spending behavior. In addition, volatility in commodity prices such as milk, grains, livestock and poultry, changes in weather patterns (e.g., droughts or seasons of higher precipitation that determine how long cattle will graze) and changes in the general economy may adversely impact the amount spent by animal owners in the production animal market. Such volatility and/or tightening of credit available to our customers could further deteriorate the financial condition of our customers, and may ultimately lead our customers to reduce their working capital available to purchase our products.
Our business ultimately depends on the ability and willingness of animal owners to pay for our products. This dependence could make us more vulnerable to any reduction in consumer confidence or disposable income than companies in other industries that are less reliant on consumer spending, such as the human health care industry, in which a large portion of payments are made by insurance programs. Additionally, any cost-cutting measures taken to offset the effects of an economic downturn could materially impact our ability to generate future revenue growth. For all of these reasons, an economic downturn could materially affect our business.
If third parties claim that we infringe upon their intellectual property rights, our financial results could be adversely affected.
We face the risk of claims that we have infringed third parties’ intellectual property rights, including trademarks, trade names, and patents. Third parties may claim that our proprietary branded products infringe their trademarks and/or trade names; that our consultative services infringe a patented machine, process, or business method; and/or that our products infringe such third parties’ patented animal health products. We have not conducted an independent review of trademarks or patents issued to third parties. The large number of trademarks and patents, the rapid rate of new trademark and patent issuances, the complexities of the technology involved in patents and uncertainty of litigation increase the risk of business assets and management’s attention being diverted to intellectual property litigation.
Any claims of patent or other intellectual property infringement, even those without merit, could:
|
· |
be expensive and time consuming to defend; |
|
· |
cause us to cease making, licensing or using products or services that incorporate the challenged intellectual property; |
|
· |
require us to redesign, reengineer, or rebrand our products or packaging, if feasible; |
|
· |
divert management’s attention and resources; or |
|
· |
require us to enter into royalty or licensing agreements in order to obtain the right to use a third party’s intellectual property. |
Any royalty or licensing agreements, if required, may not be available to us on acceptable terms or at all. A successful claim of infringement against us could result in our being required to pay significant damages, enter into costly license or royalty agreements, or stop the sale of certain products, any of which could have a negative impact on our financial results and harm our future prospects.
Our intellectual property rights may be inadequate to protect our business.
We attempt to protect our intellectual property rights through a combination of patent, trademark, copyright and trade secret laws, as well as licensing agreements and third-party nondisclosure and assignment agreements. Our failure to obtain or maintain adequate protection of our intellectual property rights for any reason could have a material adverse effect on our business.
We rely on our trademarks, trade names, service marks and brand names to distinguish our proprietary branded products and services from the products and services of our competitors, and have registered or applied to register many of these trademarks and servicemarks. We cannot assure you that our trademark and servicemark applications will be approved. Third parties may also oppose our trademark and servicemark applications, or otherwise challenge our use of the trademarks and servicemarks. In the event that our marks are successfully challenged, we could be forced to rebrand our proprietary branded products and services, which could result in loss of brand recognition, and could require us to devote resources to advertise and market new brands. Further, we cannot assure you that competitors will not infringe upon our marks, or that we will have adequate resources to enforce our marks.
22
The pursuit and assertion of patent rights involve complex legal and factual determinations and, therefore, are characterized by some uncertainty. In addition, the laws governing patentability and the scope of patent coverage continue to evolve. As a result, we cannot assure you patents will be issued from any of our patent applications. The scope of any of our patents, if issued, may not be sufficiently broad to offer meaningful protection. In addition, our patents, if they are issued, may be successfully challenged, invalidated, circumvented or rendered unenforceable so that our patent rights might not create an effective competitive barrier for certain of our niche products. Further, we cannot assure you that competitors will not infringe upon our patents, or that we will have adequate resources to enforce our patents.
We also rely on unpatented proprietary technology. It is possible that others will independently develop the same or similar technology or otherwise obtain access to our unpatented technology. To protect our trade secrets and other proprietary information, we require employees, consultants, advisors and collaborators to enter into confidentiality agreements. We cannot assure you that these agreements will provide meaningful protection for our trade secrets, know-how or other proprietary information in the event of any unauthorized use, misappropriation or disclosure of such trade secrets, know-how or other proprietary information. Our inability to maintain the proprietary nature of our technologies for any reason could have a material adverse effect on our business.
If our proprietary branded products infringe on the intellectual property rights of others, we may be required to indemnify our customers for any damages they suffer.
Third parties may assert infringement claims against our customers. These claims may require us to initiate or defend protracted and costly litigation on behalf of our customers, regardless of the merits of these claims. If any of these claims succeed, we may be forced to pay damages on behalf of our customers or may be required to obtain licenses for the products they use. If we cannot obtain all necessary licenses on commercially reasonable terms, our customers may be forced to stop using our products.
We may be subject to product liability and other claims in the ordinary course of business.
Our business involves a risk of product liability and other claims in the ordinary course of business, such as claims arising from shipping mislabeled or outdated product, product recalls or disputes among competing vendors. If our private label business continues to grow, purchasers of these products may increasingly seek recourse directly from us, rather than the ultimate product manufacturer, for product-related claims. We maintain general liability insurance with customary policy limits, and in many cases we have indemnification rights against product-related claims from the manufacturers of the products we distribute. Our ability to recover under insurance or indemnification arrangements is subject to the financial viability of the insurers and manufacturers. We cannot assure you that our insurance coverage or the manufacturers’ indemnity will be available or sufficient in any future cases brought against us.
Any inability of our customers to pay us for our products and services due to their deteriorating financial condition or otherwise may adversely affect our results of operations and financial condition.
We generally extend some level of credit to our customers without requiring collateral, which exposes us to credit risk. For example, milk price declines in the dairy market could have a significant impact on dairy farmers, which would create cash-flow challenges for these farmers and, in turn, impact the time it takes for us to collect on outstanding accounts receivable from these customers. If customers’ cash flow or operating and financial performance deteriorates, or if they are unable to make scheduled payments or obtain other sources of credit, they may not be able to pay or may delay payment to us, or in some cases may return products to us. The financial difficulties of a customer could cause us to curtail business with that customer or the customer to reduce its business with us and cancel orders. Any inability of current and/or potential customers to pay us for our products and/or services due to their deteriorating financial condition or otherwise may adversely affect our results of operations and financial condition.
We may not be able to raise needed capital in the future on favorable terms or at all.
We expect that our existing sources of cash, together with any funds generated from operations, will be sufficient to meet our anticipated capital needs for at least the next twelve months. However, we may require additional capital to finance our growth strategies or other activities in the future. Our capital requirements will depend on many factors, including the costs associated with our growth and expansion. Additional financing may not be available when needed and, if such financing is
23
available, it may not be available on terms favorable to us. Our failure to raise capital when needed could have an adverse effect on our business, financial condition and results of operations.
Our variable rate indebtedness subjects us to interest rate risk, which could cause our debt service obligations to increase significantly.
Any borrowings on the revolving credit facility will be at variable rates of interest and expose us to interest rate risk based on market rates. If interest rates increase, our debt service obligations on any future variable rate indebtedness that we may incur on our revolving credit facility would increase even if the amount borrowed remained the same, and our net income and cash available for servicing our indebtedness would decrease. Our variable rate debt as of September 30, 2014 was $78.2 million (comprised of revolving credit facilities). Our interest expense for fiscal year 2014 was approximately $1.2 million and was approximately $0.7 million for fiscal year 2013. A 1% increase in the average interest rate would not have a material impact on our operations assuming our current level of debt. However, if we had to borrow additional funds to operate our business, the change in interest rates could affect our operations. See “Management’s Discussion and Analysis of Financial Condition and Results of Operations — Liquidity and Capital Resources.”
Item 1B.Unresolved Staff Comments.
None.
24
The table below provides a summary of the Company’s principal facilities as of September 30, 2014:
|
Location |
Total Square Feet (1) |
Own or Lease |
Principal Function (2) |
|||
|
Boise, Idaho |
62,000 |
Own |
Headquarters and call center |
|||
|
Greensboro, North Carolina |
225,000 |
Lease |
Distribution center |
|||
|
Edwardsville, Kansas |
135,000 |
Lease |
Distribution center and pharmacy |
|||
|
Shakopee, Minnesota |
126,000 |
Lease |
Distribution center and pharmacy |
|||
|
Elizabethtown, Pennsylvania |
111,000 |
Lease |
Distribution center and pharmacy |
|||
|
Shawnee, Kansas |
107,000 |
Lease |
Redistribution center |
|||
|
Warsaw, North Carolina |
90,000 |
Lease |
Distribution center and call center |
|||
|
Castle Cary, England |
84,000 |
Own |
Centaur office, call center and distribution center |
|||
|
Springdale, Arkansas |
84,000 |
Lease |
Distribution center, pharmacy and call center |
|||
|
Visalia, California |
81,000 |
Lease |
Distribution center and veterinary food-animal drug retailer |
|||
|
Denver, Colorado |
75,000 |
Lease |
Distribution center and call center |
|||
|
Harrisonburg, Virginia |
75,000 |
Own |
Distribution center and call center |
|||
|
Grand Prairie, Texas |
70,000 |
Lease |
Distribution center and call center |
|||
|
Whitestown, Indiana |
70,000 |
Lease |
Distribution center and pharmacy |
|||
|
Iowa Falls, Iowa |
62,000 |
Own |
Distribution center and call center |
|||
|
Orlando, Florida |
42,000 |
Lease |
Distribution center |
|||
|
Atlanta, Georgia |
41,000 |
Lease |
Distribution center |
|||
|
Jacksonville, Florida |
41,000 |
Lease |
Distribution center |
|||
|
Amarillo, Texas |
40,000 |
Own |
Distribution center and pharmacy (3) |
|||
|
Nampa, Idaho |
36,000 |
Lease |
Distribution center and pharmacy |
|||
|
Fife, Washington |
30,000 |
Lease |
Distribution center |
|||
|
Amarillo, Texas |
26,000 |
Lease |
Micro office (3) |
|||
|
Nacogdoches, Texas |
25,000 |
Own |
Distribution center |
|||
|
Gainesville, Georgia |
22,000 |
Lease |
Distribution center |
|||
|
Glendale, Arizona |
20,000 |
Lease |
Distribution center (4) |
|||
|
Hereford, Texas |
16,000 |
Lease |
Distribution center |
|||
|
Sturbridge, Massachusetts |
16,000 |
Lease |
Securos office and call center |
|||
|
(1) Rounded to the nearest thousand square feet. |
||||||
|
(2) We also operate out of a number of shipping depots in the United States and United Kingdom but maintain little to no inventory at these locations. |
||||||
|
(3) In May 2014, we entered into a new lease commencing October 1, 2014, to open a 70,000 square foot replacement distribution center, pharmacy and office in Amarillo, Texas. |
||||||
|
(4) In October 2014, we terminated our lease for this facility. |
||||||
On July 30, 2014, Ealena Callender, a purported stockholder of the Company, brought a derivative lawsuit in the Court of Chancery of the State of Delaware against the Company as nominal defendant and against each of the Company’s directors, as well as a former director, as defendants, alleging breach of fiduciary duty and unjust enrichment relating to the Company’s non-employee director stock grants made between 2012 and 2014. The complaint alleges that the directors breached their fiduciary duties by issuing stock grants that were inconsistent with the terms of the Company’s Amended and Restated 2005 Stock-Based Incentive Compensation Plan. The complaint seeks rescission of a total of 16,505 shares of
25
common stock issued to the directors as well as damages plus pre-judgment and post-judgment interest. The Company believes that the allegations in the complaint are without merit.
Except as set forth above, we are not currently a party to any material pending legal proceedings and are not aware of any claims that individually or in the aggregate could have a material adverse effect on our financial position, results of operations or cash flows.
Item 4.Mine Safety Disclosures
Not applicable.
26
Item 5.Market for Registrant’s Common Equity, Related Stockholder Matters and Issuer Purchases of Equity Securities.
Our common stock has been quoted on the Nasdaq under the symbol “MWIV” since August 3, 2005. Prior to that date there was no public market for our common stock. The following table sets forth, for the two most recent fiscal years, the high and low sales prices of our common stock, reported by the Nasdaq Global Select Market.
|
Common Stock Price |
|||||
|
High |
Low |
||||
|
Fiscal Year Ended September 30, 2013 |
|||||
|
First Quarter |
$ |
119.05 |
$ |
101.00 | |
|
Second Quarter |
$ |
137.18 |
$ |
110.01 | |
|
Third Quarter |
$ |
134.87 |
$ |
114.60 | |
|
Fourth Quarter |
$ |
156.51 |
$ |
116.81 | |
|
Fiscal Year Ended September 30, 2014 |
|||||
|
First Quarter |
$ |
184.00 |
$ |
148.11 | |
|
Second Quarter |
$ |
188.40 |
$ |
149.00 | |
|
Third Quarter |
$ |
164.99 |
$ |
129.75 | |
|
Fourth Quarter |
$ |
151.00 |
$ |
135.00 | |
At the close of business on November 14, 2014, we had 12,921,068 shares of common stock issued and outstanding. As of that date, there were 683 registered holders of record. This does not reflect beneficial stockholders who hold their stock in nominee or “street” name through brokerage firms.
We have not paid or declared any dividends on our common stock and do not anticipate paying any dividends on our common stock in the foreseeable future. We intend to retain future earnings to finance the ongoing operations and growth of our business. Any future determination relating to our dividend policy will be made at the discretion of our Board of Directors and will depend on conditions at that time, including our financial condition, results of operations, contractual restrictions, capital requirements, business prospects and other factors our Board of Directors may deem relevant. The information contained under the heading “Equity Compensation Plan Information” in Item 12 of this Form 10-K is incorporated herein by reference.
The table below provides information concerning our repurchase of shares of our common stock during the fourth quarter ended September 30, 2014.
|
Issuer Purchases of Equity Securities |
||||||||||
|
Total Number of |
Maximum Number (or |
|||||||||
|
Total |
Shares Purchased |
Approximate Dollar |
||||||||
|
Number |
Average |
as Part of Publicly |
Value) of Shares that May |
|||||||
|
of Shares |
Price Paid |
Announced Plans |
Yet Be Purchased Under |
|||||||
|
Period |
Purchased |
per Share |
or Programs |
the Plans or Programs |
||||||
|
July 1 to July 31, 2014 |
120 | (1) |
$ |
141.34 |
— |
— |
||||
|
August 1 to August 31, 2014 |
233 | (1) |
$ |
142.82 |
— |
— |
||||
|
September 1 to September 30, 2014 |
13,067 | (1) |
$ |
146.54 |
— |
— |
||||
|
Total |
13,420 |
$ |
146.43 |
— |
— |
|||||
|
(1) These shares were withheld upon the vesting of employee stock grants in connection with payment |
||||||||||
|
of required withholding taxes. |
||||||||||
27
The graph below compares the cumulative total stockholder return on $100 invested at the market close on September 30, 2009 through and including September 30, 2014, with the cumulative total return of the same time period on the same amount invested in the Russell 2000 Index, the Standard and Poor’s SmallCap 600 Index and a Peer Group Index, consisting of nine companies that compete or operate in a comparable industry as MWI. The chart below the graph sets forth the actual numbers depicted on the graph.
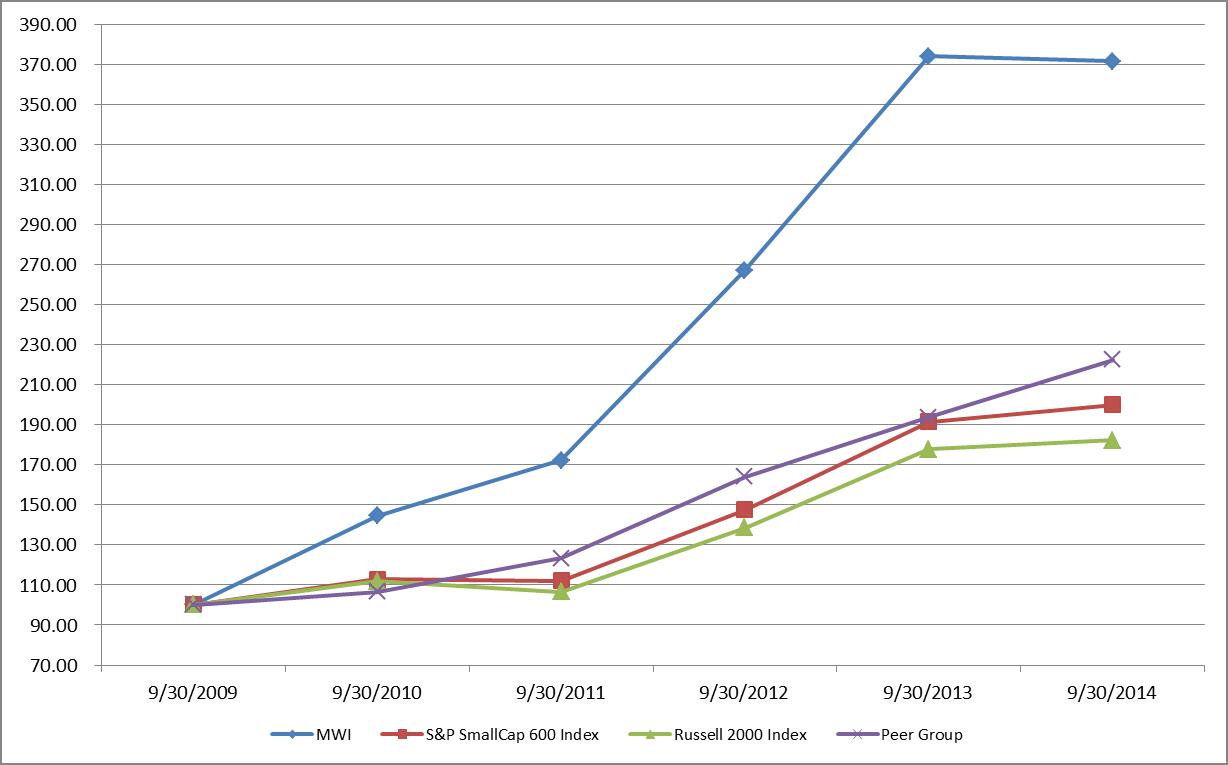
|
|
|
9/30/2009 |
|
9/30/2010 |
|
9/30/2011 |
|
9/30/2012 |
|
9/30/2013 |
|
9/30/2014 |
|
MWI Veterinary Supply, Inc. |
$ 100.00
|
$ 144.48
|
$ 172.27
|
$ 276.03
|
$ 373.87
|
$ 371.46
|
||||||
|
S&P SmallCap 600 Index |
|
100.00 |
|
112.95 |
|
111.96 |
|
147.43 |
|
191.46 |
|
200.04 |
|
Russell 2000 Index |
|
100.00 |
|
111.89 |
|
106.60 |
|
138.59 |
|
177.70 |
|
182.31 |
|
Peer Group(1) |
|
100.00 |
|
106.61 |
|
123.32 |
|
163.99 |
|
193.80 |
|
222.52 |
|
(1) |
Peer Group consists of Abaxis, Inc. (ABAX), Henry Schein Inc. (HSIC), Heska Corporation (HSKA), IDEXX Laboratories Inc. (IDXX), Owens & Minor Inc. (OMI), Patterson Companies Inc. (PDCO), PetMed Express Inc. (PETS), Tractor Supply Company (TSCO) and VCA Antech Inc. (WOOF). |
28
Item 6.Selected Financial Data.
The selected consolidated financial data below represent portions of our financial statements and are not complete. You should read this information together with “Management’s Discussion and Analysis of Financial Condition and Results of Operations” and our consolidated financial statements and the related notes to these statements included in this annual report. Historical results are not necessarily indicative of future performance.
|
Year Ended September 30, |
||||||||||||||
|
2014 |
2013 |
2012 |
2011 |
2010 |
||||||||||
|
(In thousands, except per share data) |
||||||||||||||
|
Revenues: |
||||||||||||||
|
Product sales |
$ |
2,892,023 |
$ |
2,260,279 |
$ |
1,996,294 |
$ |
1,489,500 |
$ |
1,169,545 | ||||
|
Product sales to related party |
68,501 | 68,355 | 61,873 | 55,185 | 43,017 | |||||||||
|
Commissions |
20,514 | 18,851 | 16,979 | 20,655 | 16,780 | |||||||||
|
Total revenues |
2,981,038 | 2,347,485 | 2,075,146 | 1,565,340 | 1,229,342 | |||||||||
|
Cost of product sales |
2,609,725 | 2,043,147 | 1,808,230 | 1,359,755 | 1,064,339 | |||||||||
|
Gross profit |
371,313 | 304,338 | 266,916 | 205,585 | 165,003 | |||||||||
|
Selling, general and administrative expenses |
241,717 | 193,999 | 172,104 | 130,656 | 105,793 | |||||||||
|
Depreciation and amortization |
11,836 | 10,016 | 9,045 | 6,263 | 4,992 | |||||||||
|
Operating income |
117,760 | 100,323 | 85,767 | 68,666 | 54,218 | |||||||||
|
Other income (expense): |
||||||||||||||
|
Interest expense |
(1,186) | (714) | (926) | (741) | (539) | |||||||||
|
Earnings of equity method investees |
342 | 337 | 318 | 268 | 220 | |||||||||
|
Other |
789 | 735 | 781 | 507 | 427 | |||||||||
|
Total other income (expense) |
(55) | 358 | 173 | 34 | 108 | |||||||||
|
Income before taxes |
117,705 | 100,681 | 85,940 | 68,700 | 54,326 | |||||||||
|
Income tax expense |
(45,743) | (37,832) | (32,463) | (26,120) | (20,886) | |||||||||
|
Net income |
$ |
71,962 |
$ |
62,849 |
$ |
53,477 |
$ |
42,580 |
$ |
33,440 | ||||
|
Earnings per common share: |
||||||||||||||
|
Basic |
$ |
5.66 |
$ |
4.96 |
$ |
4.24 |
$ |
3.42 |
$ |
2.73 | ||||
|
Diluted |
$ |
5.65 |
$ |
4.95 |
$ |
4.23 |
$ |
3.40 |
$ |
2.70 | ||||
|
Weighted average common shares outstanding: |
||||||||||||||
|
Basic |
12,715 | 12,675 | 12,616 | 12,464 | 12,241 | |||||||||
|
Diluted |
12,745 | 12,709 | 12,647 | 12,513 | 12,395 | |||||||||
|
As of September 30, |
||||||||||||||
|
2014 |
2013 |
2012 |
2011 |
2010 |
||||||||||
|
(In thousands) |
||||||||||||||
|
Cash |
$ |
2,433 |
$ |
953 |
$ |
514 |
$ |
606 |
$ |
911 | ||||
|
Total assets |
1,041,916 | 802,555 | 696,383 | 504,219 | 467,932 | |||||||||
|
Total debt |
78,201 | 18,920 | 48,522 | 4,170 | 14,724 | |||||||||
|
Total stockholders’ equity |
502,371 | 426,319 | 359,302 | 292,810 | 246,787 | |||||||||
29
Item 7.Management’s Discussion and Analysis of Financial Condition and Results of Operations.
All dollar and sterling pound amounts are presented in thousands, except for per share amounts.
Overview
We are a leading distributor of animal health products in the United States and the United Kingdom. We sell our products primarily to veterinarians in both the companion and production animal markets. Our growth has been from internal growth initiatives as well as selective acquisitions.
We estimate that in the United States approximately 52% of our total revenues have been generated from sales to the companion animal market and 48% from sales to the production animal market. Including the gross billings from agency commissions which are excluded from our total revenues in order to comply with generally accepted accounting principles, we estimate that in the United States approximately 57% of our total revenues have been generated from sales to the companion animal market and 43% from sales to the production animal market. We estimate that approximately 75% of our total revenues have been generated from sales to the companion animal market and 25% from sales to the production animal market in the United Kingdom. The state of the overall economy in both the United States and United Kingdom and consumer spending have impacted both the companion animal and production animal markets, with volatile commodity prices in milk, grains, livestock and poultry, and changes in weather patterns (e.g. droughts or seasons of higher precipitation) also affecting demand in the production animal market.
We believe that the companion animal market in both the United States and United Kingdom has improved in 2014, and we believe that it will continue to grow in 2015. The state of the overall economy, and recent product innovations in the market are positive trends that we believe will continue. Historically, growth in the companion animal market has been due to the increasing number of households with companion animals, increasing expenditures on animal health and preventative care, an aging pet population, advancements in animal health products and diagnostic testing and extensive marketing programs sponsored by companion animal nutrition and pharmaceutical companies. While the average order size for companion animal health products is often smaller than production animal health products, companion animal health products typically have higher margins. We intend to continue to penetrate this market through internal growth initiatives and selective acquisitions.
Product sales in the production animal market in both the United States and United Kingdom are impacted by volatility in commodity prices such as milk, grains, livestock and poultry, changes in weather patterns (e.g. droughts or seasons of higher precipitation that determine how long cattle will graze and consequently the number of days an animal is on feed during a finishing phase) or a change in the general economy, which can shift the number of animals treated, the timing of when animals are treated, to what extent they are treated and which products they are treated with. Historically, sales in this market have been largely driven by spending on animal health products to improve productivity, weight gain and disease prevention, as well as a growing focus on food safety.
We generally extend some level of credit to our customers without requiring collateral, which exposes us to credit risk. If our customers’ cash flow or operating and financial performance deteriorates, or if they are unable to make scheduled payments or obtain other sources of credit, they may not be able to pay or may delay payment to us, or in some cases may return products to us. In the United Kingdom, we rely on a smaller number of relatively larger customers than does our business in the United States. These customers in the aggregate accounted for 12.3% and 14.5% of our consolidated accounts receivable balance as of September 30, 2014 and 2013, respectively. We continually assess our customers’ ability to pay us and adjust our allowance for doubtful accounts, as necessary.
We sell products that we source from our vendors to our customers through either a “buy/sell” transaction or an agency relationship with our vendors. In a “buy/sell” transaction, we purchase or take inventory of products from our vendors. When a customer places an order with us, we pick, pack, ship and invoice the customer for the order. We record sales from “buy/sell” transactions, which account for the vast majority of our business, as revenues in conformity with generally accepted accounting principles in the United States. In an agency relationship, we generally do not purchase and take inventory of products from our vendors. When we receive an order from our customer, we transmit the order to our vendor, who picks, packs and ships the order to our customer. In some cases, our vendor invoices and collects payment from our customer, while in other cases we invoice and collect payment from our customer on behalf of our vendor. We receive a commission payment for soliciting the order from our customer and for providing other customer service activities. The aggregate revenues we receive in agency transactions constitute the “commissions” line item on our consolidated statements of income and are recorded in conformity with accounting principles generally accepted in the United States. Our vendors determine the method we use to sell our products. Historically, vendors have occasionally switched between the “buy/sell” and agency models for particular products in response to market conditions related to that particular product. A switch
30
between models can impact our revenues and our operating income. We cannot know in advance when a vendor will switch between the “buy/sell” and agency models or what impact, if any, such a change may have. A switch can occur even with vendors with whom we have written agreements, because most of our agreements with vendors have relatively short terms and are terminable with or without cause on short notice, normally 30 to 90 days. The impact of any individual change from a “buy/sell” to an agency model depends on the costs and expenses associated with a particular product, and can have either a positive or a negative effect on our profitability.
We typically renegotiate vendor contracts annually. These vendor contracts may include terms defining margins, rebates, commissions, exclusivity requirements and the manner in which we go to market. For example, vendors could require us to distribute their products on an exclusive basis, which could cause us to forego distributing competing products which may also be profitable. Conversely, competitors could obtain exclusive rights to market particular products, which we would be unable to market. If we lose the right to distribute products under such exclusive agreements, we may lose access to certain products and lose a competitive advantage. Exclusivity agreements could allow potential competitors to sell products that we cannot offer and erode our market share. In addition, vendors have the ability to expand the distributors that they use which could have a material adverse effect on our business.
Some of our current and future vendors may decide to compete with us in the future by pursuing or increasing their efforts in direct marketing and sales of their products. These vendors could sell their products at lower prices and maintain a higher gross margin on their product sales than we can. In this event, veterinarians or animal owners may elect to purchase animal health products directly from these vendors. Vendors may also elect to discontinue sales through distributors, including us, for some or all of their products. For example, in July 2014, we received notice that IDEXX Laboratories is moving to a fully direct sales and distribution model, and as a result, is ending its companion animal diagnostic products distribution agreement with us, effective December 31, 2014. Other vendors may move between direct marketing and distribution in the future.
Many of our vendors’ rebate programs are based on a calendar year. Historically, the three months ended December 31 has been our most significant quarter for recognition of rebates. Sales growth goals are typically negotiated annually, and the amount of rebates available varies in any given year. Increasing growth goals, less lucrative rebate programs, and generic competition make it more challenging to achieve rebate goals each year. Vendor rebates based on sales are classified in our accompanying consolidated statements of income as a reduction to cost of product sales at the time the sales performance measures are achieved. Purchase rebates are measured against inventory purchases from the vendors and are a reduction of inventory until the product is sold. When the inventory is sold, purchase rebates are recognized as a reduction to cost of product sales.
Total Revenues. Our total revenues increased from $1,229,342 for our fiscal year ended September 30, 2010 to $2,981,038 for our fiscal year ended September 30, 2014. Our revenue growth has been driven from internal growth as well as selective acquisitions, and our ability to offer a broad product selection at competitive prices with high levels of customer service and support and an expansion in the number of veterinary practices to which we distribute products. We have continually added new vendor relationships to expand our product offering and field sales representatives to increase our customer reach.
Operating Expenses. Our selling, general and administrative expenses increased from $105,793 for our fiscal year ended September 30, 2010 to $241,717 for our fiscal year ended September 30, 2014. Selling, general and administrative expenses consist mainly of compensation and benefits, warehouse operating supplies, occupancy and location expenses and other general corporate expenses. Our selling, general and administrative expenses as a percentage of total revenues were 8.6% for our fiscal year ended September 30, 2010, compared to 8.1% for the same period in 2014.
Acquisitions. On October 31, 2011, we acquired substantially all of the assets of Micro, a value-added distributor to the production animal market, including the distribution of micro feed ingredients, pharmaceuticals, vaccines, parasiticides, supplies and other animal health products. In addition, as a result of the Micro transaction, we now offer proprietary, computerized management systems for the production animal market.
On December 31, 2012, we acquired substantially all of the assets of PCI Animal Health. PCI Animal Health was a distributor of companion animal health products to veterinary practices, primarily in the Northeastern United States.
On November 1, 2013, we acquired substantially all of the assets of IVESCO, a value-added distributor of animal health and related products to veterinarians, food animal producers and dealers in the United States.
On September 2, 2014, we acquired all of the share capital of VetSpace, a provider of practice management software to veterinary practices, principally in the United Kingdom.
31
Results of Operations
The following tables summarize our historical results of operations for our fiscal years ended September 30, 2014, 2013 and 2012.
|
Year Ended September 30, |
||||||||||||||
|
2014 |
% |
2013 |
% |
2012 |
% |
|||||||||
|
(In thousands, except per share data) |
||||||||||||||
|
Revenues: |
||||||||||||||
|
Product sales |
$ |
2,892,023 | 97.0% |
$ |
2,260,279 | 96.3% |
$ |
1,996,294 | 96.2% | |||||
|
Product sales to related party |
68,501 | 2.3% | 68,355 | 2.9% | 61,873 | 3.0% | ||||||||
|
Commissions |
20,514 | 0.7% | 18,851 | 0.8% | 16,979 | 0.8% | ||||||||
|
Total revenues |
2,981,038 | 100.0% | 2,347,485 | 100.0% | 2,075,146 | 100.0% | ||||||||
|
Cost of product sales |
2,609,725 | 87.5% | 2,043,147 | 87.0% | 1,808,230 | 87.1% | ||||||||
|
Gross profit |
371,313 | 12.5% | 304,338 | 13.0% | 266,916 | 12.9% | ||||||||
|
Selling, general and administrative expenses |
241,717 | 8.1% | 193,999 | 8.3% | 172,104 | 8.3% | ||||||||
|
Depreciation and amortization |
11,836 | 0.4% | 10,016 | 0.4% | 9,045 | 0.4% | ||||||||
|
Operating income |
117,760 | 4.0% | 100,323 | 4.3% | 85,767 | 4.2% | ||||||||
|
Other income (expense): |
||||||||||||||
|
Interest expense |
(1,186) | 0.0% | (714) | 0.0% | (926) | 0.0% | ||||||||
|
Earnings of equity method investees |
342 | 0.0% | 337 | 0.0% | 318 | 0.0% | ||||||||
|
Other |
789 | 0.0% | 735 | 0.0% | 781 | 0.0% | ||||||||
|
Total other income (expense) |
(55) | 0.0% | 358 | 0.0% | 173 | 0.0% | ||||||||
|
Income before taxes |
117,705 | 3.9% | 100,681 | 4.3% | 85,940 | 4.2% | ||||||||
|
Income tax expense |
(45,743) |
-1.5% |
(37,832) |
-1.6% |
(32,463) |
-1.6% |
||||||||
|
Net income |
$ |
71,962 | 2.4% |
$ |
62,849 | 2.7% |
$ |
53,477 | 2.6% | |||||
|
Earnings per common share: |
||||||||||||||
|
Basic |
$ |
5.66 |
$ |
4.96 |
$ |
4.24 | ||||||||
|
Diluted |
$ |
5.65 |
$ |
4.95 |
$ |
4.23 | ||||||||
|
Weighted average common shares |
||||||||||||||
|
outstanding: |
||||||||||||||
|
Basic |
12,715 | 12,675 | 12,616 | |||||||||||
|
Diluted |
12,745 | 12,709 | 12,647 | |||||||||||
Fiscal 2014 Compared to Fiscal 2013
Total Revenues. Total revenues increased 27.0% to $2,981,038 for the fiscal year ended September 30, 2014, from $2,347,485 for the fiscal year ended September 30, 2013. Revenue growth in the United States was 30.5% for the fiscal year ended September 30, 2014 as compared to the fiscal year ended September 30, 2013, due to revenues related to the acquisition of substantially all of the assets of IVESCO and organic revenue growth. Growth in diagnostics lines represented 1.4% of the revenue growth in the United States during the year ended September 30, 2014. Revenues in the United States benefited from growth in flea, tick and heartworm products, which represented 1.3% of the revenues growth during the year ended September 30, 2014. Revenues increased 4.5% in the United Kingdom primarily due to a 6.0% increase related to foreign currency translation. Commissions increased 8.8% to $20,514 for the fiscal year ended September 30, 2014, from $18,851 for the fiscal year ended September 30, 2013. Gross agency billings were $355,773 and $349,006 for the years ended September 30, 2014 and 2013, respectively.
32
Gross Profit. Gross profit increased by 22.0% to $371,313 for the fiscal year ended September 30, 2014, from $304,338 for the fiscal year ended September 30, 2013. Gross profit as a percentage of total revenues was 12.5% for the fiscal year ended September 30, 2014, compared to 13.0% for the fiscal year ended September 30, 2013. Product margin as a percentage of total revenues decreased primarily due to the addition of the IVESCO business in November 2013. The product margin on this business is generally lower than our overall product margin. This serves to reduce the overall product margin of the consolidated company when compared to our results for the prior year. Vendor rebates for the fiscal year ended September 30, 2014 increased by approximately $8,780 compared to the fiscal year ended September 30, 2013, due to success with manufacturer rebate programs, particularly in the first quarter of fiscal 2014.
Selling, General and Administrative (“SG&A”). SG&A expenses increased 24.6% to $241,717 for the fiscal year ended September 30, 2014, from $193,999 for the fiscal year ended September 30, 2013. The increase in SG&A expenses was primarily due to the addition of IVESCO in November 2013. We incurred approximately $3,348 of integration and acquisition related costs during the year in connection with our acquisitions of IVESCO and VetSpace. SG&A expenses as a percentage of total revenues improved to 8.1% for the year ended September 30, 2014 compared to 8.3% for the year ended September 30, 2013.
Depreciation and Amortization. Depreciation and amortization increased 18.2% to $11,836 for the fiscal year ended September 30, 2014, from $10,016 for the fiscal year ended September 30, 2013. The increase was primarily due to technology and equipment investments, as well as the assets acquired from IVESCO.
Income Tax Expense. Our effective tax rate was 38.9% for the fiscal year ended September 30, 2014 and 37.6% for the fiscal year ended September 30, 2013. This increase is primarily due to a higher foreign and state effective tax rate.
Fiscal 2013 Compared to Fiscal 2012
Total Revenues. Total revenues increased 13.1% to $2,347,485 for the fiscal year ended September 30, 2013, from $2,075,146 for the fiscal year ended September 30, 2012. Revenue growth in the United States was 14.4% for the fiscal year ended September 30, 2013 as compared to the fiscal year ended September 30, 2012. Revenues increased 6.6% in the United Kingdom, but were reduced by 1.0% related to foreign currency translation for the fiscal year ended September 30, 2013, compared to the fiscal year ended September 30, 2012.
Growth in flea, tick and heartworm products represented approximately 2.3% of the revenue growth the United States in 2013. Revenue growth in the United States also benefited from new diagnostic lines, which represented approximately 1.7% of the growth. Additional new customers from the acquisition of PCI Animal Health business represented approximately 0.3% of the growth in the United States, and the growth from existing overlap customers was approximately 0.9% of the growth. Finally, fiscal 2013 benefited from a full year of ownership of Micro, compared to eleven months in the prior year, which accounted for approximately 1.6% of the growth in revenues. Product sales to related parties increased by 10.5% to $68,355 for the fiscal year ended September 30, 2013, from $61,873 for the fiscal year ended September 30, 2012. Commissions increased 11.0% to $18,851 for the fiscal year ended September 30, 2013, from $16,979 for the fiscal year ended September 30, 2012.
Gross Profit. Gross profit increased by 14.0% to $304,338 for the fiscal year ended September 30, 2013, from $266,916 for the fiscal year ended September 30, 2012. Gross profit as a percentage of total revenues improved to 13.0% for the fiscal year ended September 30, 2013 from 12.9% for the fiscal year ended September 30, 2012. This increase was due primarily to an improvement in vendor rebates as a percentage of total revenues, offset in part by a decrease in product margin. Vendor rebates for the fiscal year ended September 30, 2013 increased by approximately $9,919 compared to the fiscal year ended September 30, 2012 primarily due to the timing of manufacturer rebate programs and growth in revenues.
Selling, General and Administrative. SG&A expenses increased 12.7% to $193,999 for the fiscal year ended September 30, 2013, from $172,104 for the fiscal year ended September 30, 2012. The increase in SG&A expenses was primarily due to an increase in compensation and benefit costs. We incurred approximately $1,424 of acquisition related costs in connection with the acquisition of the IVESCO business. SG&A expenses as a percentage of total revenues were consistent at 8.3% for each of the fiscal years ended September 30, 2013 and 2012.
Depreciation and Amortization. Depreciation and amortization increased 10.7% to $10,016 for the fiscal year ended September 30, 2013, from $9,045 for the fiscal year ended September 30, 2012. The increase was primarily due to amortization for assets acquired from PCI Animal Health.
33
Seasonality in Operating Results
Our quarterly sales and operating results have varied significantly in the past, and will likely continue to do so in the future. Historically, our total revenues have typically been higher during the spring and fall months due to increased sales of production animal products. The sales of production animal products can vary due to changes in commodity prices and weather patterns (e.g. droughts or seasons of higher precipitation that determine how long cattle will graze and consequently the number of days an animal is on feed during a finishing phase) which may also affect seasonality. Product use cycles for production animal products are directly related to medical procedures performed on production animals during the spring and fall months. These buying patterns can also be affected by vendors’ and distributors’ marketing programs or price increase announcements, which can cause our customers to purchase production animal health products earlier than those products are needed. This kind of early purchasing may reduce our sales in the months these purchases would have otherwise been made. See “Risk Factors — Our quarterly operating results may fluctuate significantly, and these fluctuations may cause our stock price to fall.” Additionally, while we accrue rebates as they are earned, our rebates have historically been highest during the quarter ended December 31, since some of our vendors’ rebate programs were designed to include targets to be achieved near the end of the calendar year. This trend has slowed some in recent years due to certain changes in vendor contracts but it still remains our largest quarter for vendor rebates.
Our companion animal products tend to have a different product use cycle that minimally overlaps with that of production animal products. In the companion animal market, sales of flea, tick and mosquito products are highest during the spring and summer months. The differing product use cycles of companion animal products partially offsets the seasonality we typically experience due to our sales of production animal products.
For the reasons and factors discussed above our quarterly operating results may fluctuate significantly. Accordingly, results for any one quarter are not necessarily indicative of results to be expected for any other quarter or for any year and our sales for any particular future period may decrease. In the future, operating results may fall below the expectations of securities analysts and investors. If this occurs, the price of our stock would likely decrease.
Liquidity and Capital Resources
Our principal sources of liquidity are cash flows generated from operations and borrowings on our credit facilities. We use capital primarily to fund day-to-day operations and to maintain sufficient inventory levels in order to promptly fulfill customer orders and to expand our operations and sales growth. We believe our capital resources, including our ability to borrow funds from our credit facilities, will be sufficient to meet our anticipated cash needs for at least the next twelve months.
We generally extend some level of credit to our customers without requiring collateral, which exposes us to credit risk. If customers’ cash flow or operating and financial performance deteriorates, or if they are unable to make scheduled payments or obtain other sources of credit, they may not be able to pay or may delay payment to us, or in some cases may return products to us. Any inability of current and/or potential customers to pay us for our products and/or services due to their deteriorating financial condition or otherwise may adversely affect our results of operations and financial condition. Volatility in commodity prices, such as milk, grains, livestock and poultry, and deteriorating economic conditions can have a significant impact on the financial results of our customers. In the United Kingdom, we rely on a smaller number of relatively larger customers than does our business in the United States. These customers in the aggregate accounted for 12.3% and 14.5% of our consolidated accounts receivable balance as of September 30, 2014 and 2013, respectively. We continually assess our customers’ ability to pay us and adjust our allowance for doubtful accounts, as necessary.
We consider the undistributed earnings of our foreign subsidiaries to be indefinitely reinvested as of September 30, 2014 and, accordingly, no provision for U.S. income taxes has been made with respect to any such amounts. As of September 30, 2014, the amount of cash and cash equivalents associated with indefinitely reinvested foreign earnings was approximately $2,192. We have not, nor do we anticipate the need to, repatriate funds to the United States to satisfy domestic liquidity needs arising in the ordinary course of business, including liquidity needs associated with our domestic debt service requirements. In the event that these funds are repatriated, such amounts would be subject to income tax liabilities in the United States. We believe that there are no material implications or restrictions upon our liquidity based on the insignificance of the amounts currently held by our foreign subsidiaries.
Capital Resources. MWI Co., as borrower, was party to a Credit Agreement dated December 13, 2006, as amended (the “Prior Credit Agreement”), by and among MWI Co., MWI, and Memorial Pet Care, Inc. and Bank of America, N.A. and Wells Fargo Bank, N.A. as lenders (collectively, the “Lenders”). The Prior Credit Agreement allowed for an aggregate revolving commitment of the Lenders of $200,000 and a maturity date of November 1, 2016. Under the Prior Credit Agreement, the margin on variable interest rate borrowings ranged from 0.95% to 1.50%. The commitment fee under the
34
Prior Credit Agreement ranged from 0.15% to 0.25% depending on the funded debt to EBITDA ratio. The variable interest rate was equal to the Daily LIBOR Floating Rate or the LIBOR 1-month, 2-month, 3-month or 6-month fixed rate (at MWI Co.’s option) plus the margin. The facility contained financial covenants, including a fixed charge ratio and a funded debt to EBITDA calculation. We were in compliance with all of the covenants as of September 30, 2014 and 2013. Our outstanding balance on the Prior Credit Agreement at September 30, 2014 was $78,200, and the interest rate was 1.03% as of September 30, 2014.
On October 2, 2014, MWI Co., as borrower, entered into an Amended and Restated Credit Agreement (the “Amended Credit Agreement”), with MWI and Memorial Pet Care, Inc., as guarantors and the Lenders. The Amended Credit Agreement allows for an aggregate revolving commitment of the Lenders of $230,000 and includes a $45,000 sublimit for borrowings in alternative currencies. The Amended Credit Agreement has a maturity date of October 2, 2019. Under the Amended Credit Agreement, the margin on variable interest rate borrowings ranges from 0.95% to 1.50%. The commitment fee under the Amended Credit Agreement ranges from 0.15% to 0.25% depending on the funded debt to EBITDA ratio. The variable interest rate on borrowings in dollars, euros or British pounds is equal to the Daily LIBOR Floating Rate or the LIBOR 1-month, 2-month, 3-month or 6-month fixed rate (at MWI Co.’s option) plus the margin. The Amended Credit Agreement contains financial covenants, including an interest charge coverage ratio and a funded debt to EBITDA ratio.
The Amended Credit Agreement replaces the Prior Credit Agreement.
Centaur is party to an unsecured revolving line of credit facility dated November 5, 2010, as amended (the “Sterling Revolving Credit Facility”) with Wells Fargo Bank, N.A. London Branch. The Sterling Revolving Credit Facility has a maximum loan amount of £20,000 and a maturity date of November 1, 2016. Interest is based on LIBOR for the applicable interest period plus an applicable margin of 0.95% to 1.50%, and the commitment fee ranges from 0.15% to 0.25%, depending on our funded debt to EBITDA ratio. The facility contains a financial covenant requiring Centaur to maintain a minimum tangible net worth of £5,000. As of September 30, 2014 and 2013, Centaur was in compliance with the covenant. Pursuant to the Amended Credit Agreement, we are required to terminate the Sterling Revolving Credit Facility on or before December 31, 2014.
Centaur is party to an uncommitted overdraft facility dated March 15, 2013, (the “Overdraft Facility”) with Wells Fargo. The Overdraft Facility allows Centaur to borrow an additional £10,000 to fund short term normal trading cycle fluctuations. The Overdraft Facility will expire on November 1, 2016. Interest on the borrowing under the Overdraft Facility is the same as the terms under the Sterling Revolving Credit Facility.
Operating Activities. For the fiscal year ended September 30, 2014, cash provided by operations was $58,665 and was primarily attributable to net income of $71,962. The increase in net income is a result of the factors discussed above in “Results of Operations.” Changes in working capital used cash of $29,767. The increase in receivables was primarily due to the revenue growth during the fiscal year. The increases in inventories and accounts payable were primarily due to strategic inventory purchases made during the fiscal year ended September 30, 2014.
For the fiscal year ended September 30, 2013, cash provided by operating activities was $57,449, and was primarily attributable to net income of $62,849 and an increase in accounts payable of $63,403. This amount was partially offset by an increase in receivables of $15,173 and an increase in inventories of $72,864. The increase in net income is a result of the factors discussed above in “Results of Operations.” The increase in receivables was primarily due to the revenue growth during the fiscal year. The increases in inventories and accounts payable were primarily due to strategic inventory purchases made during the fiscal year ended September 30, 2013.
For the fiscal year ended September 30, 2012, cash provided by operating activities was $14,238, and was primarily attributable to net income of $53,477 and an increase in accounts payable of $50,018. This amount was partially offset by an increase in receivables of $48,879 and an increase in inventories of $52,831. The increase in net income is a result of the factors discussed above in “Results of Operations.” The increase in receivables was primarily due to the revenue growth during the fiscal year. The increases in inventories and accounts payable were primarily due to strategic inventory purchases made during the fiscal year ended September 30, 2012 to accommodate our revenue growth and the redistribution of products from our distribution center in Kansas City to the rest of our distribution centers.
Investing Activities.For the fiscal year ended September 30, 2014, net cash used in investing activities was $116,043. We acquired VetSpace and substantially all of the assets of IVESCO for $102,097 in the aggregate, net of $2,549 of cash acquired. Additionally, we paid for capital expenditures of $14,919 which primarily related to technology and equipment purchases.
35
For the fiscal year ended September 30, 2013, net cash used in investing activities was $28,128. We paid $17,107, in cash, after consideration of post-closing adjustments for the acquisition of substantially all of the assets of PCI Animal Health. Additionally, we paid for capital expenditures of $10,780 which primarily related to technology and equipment purchases, in addition to equipment purchased for our move into a new distribution center in Shakopee, Minnesota.
For the fiscal year ended September 30, 2012, net cash used in investing activities was $59,865. We paid $51,718 for the acquisition of substantially all of the assets of Micro, which closed on October 31, 2011. We paid for capital expenditures of $7,597 which primarily related to information technology and our new distribution center in Harrisburg, Pennsylvania.
Financing Activities. For the fiscal year ended September 30, 2014, net cash provided by financing activities was $58,829 which was primarily due to net borrowings of $59,308 on our revolving credit facilities.
For the fiscal year ended September 30, 2013, net cash used in financing activities was $29,107, which was primarily due to net payments of $29,022 on our revolving credit facilities. Our revolving credit facilities are used to fund strategic acquisitions, capital expenditures and meet our working capital requirements.
For the fiscal year ended September 30, 2012, net cash provided by financing activities was $45,399, and was primarily attributable to the net borrowings on our credit facilities of $44,885.
Off Balance Sheet Arrangements. At September 30, 2014, we had no significant investments that were accounted for under the equity method in accordance with accounting principles generally accepted in the United States except for Feeders Advantage. Feeders Advantage has no liabilities associated with it that were guaranteed by or that would be considered material to us. Accordingly, we do not have any off balance sheet arrangements.
36
Contractual Obligations
Contractual Obligations. Our contractual obligations at September 30, 2014 mature as follows:
|
Payments Due by Period |
||||||||||||||
|
Total |
1 Year or less |
2-3 Years |
4-5 Years |
More than 5 Years |
||||||||||
|
Revolving credit facilities (1) |
$ |
78,200 |
$ |
- |
$ |
78,200 |
$ |
- |
$ |
- |
||||
|
Operating lease commitments |
54,011 | 8,515 | 15,867 | 13,046 | 16,583 | |||||||||
|
Capital lease commitments |
1 | 1 |
- |
- |
- |
|||||||||
|
Interest on revolving credit |
||||||||||||||
|
facilities (2) |
2,173 | 1,038 | 1,135 |
- |
- |
|||||||||
|
Other long-term obligations (3) |
3,003 | 626 | 535 |
- |
1,842 | |||||||||
|
Total contractual obligations |
$ |
137,388 |
$ |
10,180 |
$ |
95,737 |
$ |
13,046 |
$ |
18,425 | ||||
(1)For the purposes of the Contractual Obligations table above the revolving credit facilities are assumed to be paid at the respective credit facility’s termination date.
(2)For debt instruments with variable interest rates and unused commitment fees, interest has been calculated for all future periods using the rates in effect at September 30, 2014.
(3)Other long-term obligations include contracts primarily related to the pension liability of $1,842 which was assumed to be paid out beyond year five.
Guarantees. We provide guarantees, indemnifications and assurances to others in the ordinary course of our business. We have evaluated our agreements that contain guarantees and indemnification clauses in accordance with the guidance of financial accounting rules.
We enter into a wide range of indemnification arrangements in the ordinary course of business. These include tort indemnities, tax indemnities, indemnities against third party claims arising out of arrangements to provide services to us, indemnities in merger and acquisition agreements and indemnities in agreements related to the sale of our securities. Also, our governance documents and the governance documents of all of our subsidiaries provide for the indemnification of individuals made party to any suit or proceeding by reason of the fact that the individual was acting as an officer, director or agent of the relevant company or as a fiduciary of a company-sponsored welfare benefit plan. We also provide guarantees and indemnifications for the benefit of our wholly-owned subsidiaries for the satisfaction of performance obligations, including certain lease obligations. We are not aware of any material liabilities arising from these indemnification arrangements.
Inflation
Most of our operating expenses are inflation-sensitive, with inflation generally producing increased costs of operations. During the past three years, the most significant effects of inflation have been on employee wages, costs of products and fuel-intensive costs including freight, packing supplies and travel. We manage the effects of inflation by controlling increases in compensation expense, renegotiating freight carrier contracts and utilizing a central source for warehouse shipping supplies.
Critical Accounting Policies and Estimates
Our discussion and analysis of our financial condition and results of operations are based upon our consolidated financial statements, which have been prepared in accordance with accounting principles generally accepted in the United States. The preparation of these financial statements requires us to make estimates and judgments that affect the reported amounts of assets, liabilities, revenues and expenses and related disclosure of contingent assets and liabilities. On an ongoing basis, we evaluate our estimates, including those related to allowance for doubtful accounts, customer incentives, vendor rebates, inventories, goodwill and intangible assets, income taxes and contingencies. We base our estimates on historical
37
experience and on various other assumptions and factors that are believed to be reasonable under the circumstances, the results of which form the basis for making judgments about the carrying values of assets and liabilities that are not readily apparent from other sources. We, based on our ongoing review, will make adjustments to our judgments and estimates where facts and circumstances dictate. Historically, actual results have not significantly deviated from those determined using the estimates described above.
We believe the following critical accounting policies are important to understand our financial condition and results of operations and require management’s most difficult, subjective or complex judgments, often as a result of the need to make estimates about the effect of matters that are inherently uncertain.
Revenue Recognition
We sell products that we source from vendors to our customers through either a “buy/sell” transaction or an agency relationship with our vendors. In a “buy/sell” transaction, we purchase and take inventory of products from the vendor. When a customer places an order with us, we pick, pack, ship and invoice the customer for the order. We recognize revenue from “buy/sell” transactions as product sales when the product is delivered to the customer. We accept product returns from our customers. We estimate sales returns based on historical experience, and returns are recognized as a reduction of product sales. Product returns have not been significant to our financial statements. In an agency relationship, we generally do not purchase and take inventory of products from our vendors. We receive an order from a customer, then transmit the order to the vendor, who picks, packs and ships the order to the customer. In some cases, the vendor invoices and collects payment from the customer, while in other cases we invoice and collect payment from the customer on behalf of the vendor. We receive a commission payment for soliciting the order from the customer and for providing other customer service activities. Commissions are recognized when the services upon which the commissions are based are complete.
Vendor Rebates
Vendor rebates are recorded based on the terms of the contracts with each vendor. We may receive quarterly, semi-annual and annual performance‑based rebates from third-party vendors based upon attainment of certain sales and/or purchase goals. Sales rebates are classified in our accompanying consolidated statements of income as a reduction to cost of product sales at the time the sales performance measures are achieved. Purchase rebates are measured against inventory purchases from the vendors and are a reduction of inventory until the product is sold. When the inventory is sold, purchase rebates are recognized as a reduction to cost of product sales.
Historically, actual results have not significantly deviated from those determined using the estimates described above. We expect that our estimates in the future will continue to be reasonable as our rebates are based on specific vendor program goals and are principally recorded upon achievement of sales or purchase performance measures. Vendors may change or eliminate rebate programs from year to year.
Customer Incentives
Customer incentives are accrued based on the terms of the contracts with each customer. These incentive programs provide that the customer receives an incentive based on their product purchases or attainment of performance goals. Incentives are estimated based on the specific terms in each agreement, historical experience and product growth rates. The incentives are recognized as a reduction of product sales.
Goodwill and Intangible Assets
We assess the potential impairment of goodwill and amortizing and non-amortizing intangible assets annually and on an interim basis whenever events or changes in circumstances indicate that the carrying value may not be recoverable. Factors that we consider important and may trigger an interim impairment review include:
|
· |
significant underperformance relative to expected historical or projected future operating results; |
|
· |
significant changes in the manner of our use of acquired assets or the strategy of our overall business; and |
|
· |
significant negative industry or economic trends. |
If we determine through the impairment review process that goodwill or amortizing or non-amortizing intangible assets are impaired, an impairment charge is recognized in our consolidated statement of income.
Goodwill and amortizing and non-amortizing intangible assets were evaluated for impairment in our fourth quarter of 2014 and we determined that the recorded amount was not impaired. The fair value calculations used for these tests require us to make assumptions about items that are inherently uncertain. Assumptions related to future market demand, market prices
38
and product costs could vary from actual results, and the impact of such variations could be material. Factors that could affect the assumptions include changes in economic conditions, changes in government regulations, success in marketing products and competitive conditions in our industry. The factors that most significantly affect the fair value calculation are market multiples and estimates of future cash flows. Fair value was determined using both an income approach and a market approach, and the resulting fair value is substantially in excess of the carrying value.
Recently Issued and New Accounting Pronouncements
In May 2014, the FASB issued Accounting Standards Update (“ASU”) No. 2014-09, Revenue from Contracts with Customers, which requires entities to recognize revenue in a way that depicts the transfer of promised goods or services to customers in an amount that reflects the consideration to which the entity expects to be entitled to in exchange for those goods or services. This guidance is effective for our fiscal year and interim periods beginning October 1, 2017. We are currently evaluating the effect that adopting this new accounting guidance will have on our consolidated financial statements.
Item 7A.Quantitative and Qualitative Disclosures About Market Risk.
We are exposed to market risks primarily from changes in interest rates, in particular, the Daily LIBOR Floating Rate, and foreign currency translation risk. We do not engage in financial transactions for trading or speculative purposes. We do not hedge the translation of foreign currency profits into U.S. dollars. We continually evaluate our foreign currency exchange rate risk and the different options available for managing such risk.
We are exposed to foreign currency risk due to our U.K. subsidiary Centaur. A hypothetical 10% change in the value of the U.S. dollar in relation to the British Pound, which is the Company’s most significant foreign currency exposure, would have changed fiscal year 2014 net sales by approximately $33,000. This amount is not indicative of the hypothetical net earnings impact due to the partially offsetting impact of the currency exchange movements on cost of sales and operating expenses.
The interest payable on our revolving credit facilities is based on variable interest rates and is affected by changes in market interest rates. The outstanding balance on the revolving credit facility in the United States as of September 30, 2014 was $78,200. There was no outstanding balance on the revolving credit facility in the United Kingdom as of September 30, 2014. If there had been a combined balance on the revolving credit facilities of $248,000, which is the approximate maximum available amount on the facilities based on the foreign currency rates as of September 30, 2014, a change of 10% from the interest rates as of September 30, 2014 would have changed interest by $275 for fiscal year 2014.
39
Item 8.Financial Statements and Supplementary Data.
MWI Veterinary Supply, Inc.
Index to Consolidated Financial Statements
40
REPORT OF INDEPENDENT REGISTERED PUBLIC ACCOUNTING FIRM
To the Board of Directors and Stockholders of
MWI Veterinary Supply, Inc.
Boise, Idaho
We have audited the accompanying consolidated balance sheets of MWI Veterinary Supply, Inc. and subsidiaries (the “Company”) as of September 30, 2014 and 2013, and the related consolidated statements of income, comprehensive income, stockholders' equity, and cash flows for each of the three years in the period ended September 30, 2014. Our audits also included the financial statement schedule listed in the Index at Item 15(a)(2). These financial statements and the financial statement schedule are the responsibility of the Company’s management. Our responsibility is to express an opinion on the financial statements and financial statement schedule based on our audits.
We conducted our audits in accordance with the standards of the Public Company Accounting Oversight Board (United States). Those standards require that we plan and perform the audit to obtain reasonable assurance about whether the financial statements are free of material misstatement. An audit includes examining, on a test basis, evidence supporting the amounts and disclosures in the financial statements. An audit also includes assessing the accounting principles used and significant estimates made by management, as well as evaluating the overall financial statement presentation. We believe that our audits provide a reasonable basis for our opinion.
In our opinion, such consolidated financial statements present fairly, in all material respects, the financial position of MWI Veterinary Supply, Inc. and subsidiaries as of September 30, 2014 and 2013, and the results of their operations and their cash flows for each of the three years in the period ended September 30, 2014, in conformity with accounting principles generally accepted in the United States of America. Also, in our opinion, such financial statement schedule, when considered in relation to the basic consolidated financial statements taken as a whole, presents fairly, in all material respects, the information set forth therein.
We have also audited, in accordance with the standards of the Public Company Accounting Oversight Board (United States), the Company's internal control over financial reporting as of September 30, 2014, based on the criteria established in Internal Control—Integrated Framework (1992) issued by the Committee of Sponsoring Organizations of the Treadway Commission and our report dated November 26, 2014 expressed an unqualified opinion on the Company's internal control over financial reporting.
/s/ DELOITTE & TOUCHE LLP
Boise, Idaho
November 26, 2014
41
|
MWI VETERINARY SUPPLY, INC. |
||||||||
|
CONSOLIDATED STATEMENTS OF INCOME |
||||||||
|
For the Years Ended September 30, 2014, 2013 and 2012 |
||||||||
|
Dollars and shares in thousands, except per share amounts |
||||||||
|
2014 |
2013 |
2012 |
||||||
|
Revenues: |
||||||||
|
Product sales |
$ |
2,892,023 |
$ |
2,260,279 |
$ |
1,996,294 | ||
|
Product sales to related party |
68,501 | 68,355 | 61,873 | |||||
|
Commissions |
20,514 | 18,851 | 16,979 | |||||
|
Total revenues |
2,981,038 | 2,347,485 | 2,075,146 | |||||
|
Cost of product sales |
2,609,725 | 2,043,147 | 1,808,230 | |||||
|
Gross profit |
371,313 | 304,338 | 266,916 | |||||
|
Selling, general and administrative expenses |
241,717 | 193,999 | 172,104 | |||||
|
Depreciation and amortization |
11,836 | 10,016 | 9,045 | |||||
|
Operating income |
117,760 | 100,323 | 85,767 | |||||
|
Other income (expense): |
||||||||
|
Interest expense |
(1,186) | (714) | (926) | |||||
|
Earnings of equity method investees |
342 | 337 | 318 | |||||
|
Other |
789 | 735 | 781 | |||||
|
Total other (expense) income, net |
(55) | 358 | 173 | |||||
|
Income before taxes |
117,705 | 100,681 | 85,940 | |||||
|
Income tax expense |
(45,743) | (37,832) | (32,463) | |||||
|
Net income |
$ |
71,962 |
$ |
62,849 |
$ |
53,477 | ||
|
Earnings per common share: |
||||||||
|
Basic |
$ |
5.66 |
$ |
4.96 |
$ |
4.24 | ||
|
Diluted |
$ |
5.65 |
$ |
4.95 |
$ |
4.23 | ||
|
Weighted average common shares outstanding: |
||||||||
|
Basic |
12,715 | 12,675 | 12,616 | |||||
|
Diluted |
12,745 | 12,709 | 12,647 | |||||
|
See notes to consolidated financial statements |
||||||||
42
|
MWI VETERINARY SUPPLY, INC. |
||||||||
|
CONSOLIDATED STATEMENTS OF COMPREHENSIVE INCOME |
||||||||
|
For the Years Ended September 30, 2014, 2013 and 2012 |
||||||||
|
Dollars in thousands |
||||||||
|
2014 |
2013 |
2012 |
||||||
|
Net income |
$ |
71,962 |
$ |
62,849 |
$ |
53,477 | ||
|
Other comprehensive income (loss) |
||||||||
|
Foreign currency translation |
(293) | 237 | 1,877 | |||||
|
Actuarial (loss) gain on unfunded pension liability, net of tax of $(207), $48, and $145, respectively |
(318) | 139 | 228 | |||||
|
Total comprehensive income |
$ |
71,351 |
$ |
63,225 |
$ |
55,582 | ||
|
See notes to consolidated financial statements |
||||||||
43
|
MWI VETERINARY SUPPLY, INC. |
|||||
|
CONSOLIDATED BALANCE SHEETS |
|||||
|
As of September 30, 2014 and 2013 |
|||||
|
Dollars and shares in thousands, except per share amounts |
|||||
|
2014 |
2013 |
||||
|
Assets |
|||||
|
Current Assets: |
|||||
|
Cash and cash equivalents |
$ |
2,433 |
$ |
953 | |
|
Receivables, net |
398,990 | 307,445 | |||
|
Inventories |
430,499 | 326,093 | |||
|
Prepaid expenses and other current assets |
8,436 | 6,004 | |||
|
Deferred income taxes |
2,812 | 2,327 | |||
|
Total current assets |
843,170 | 642,822 | |||
|
Property and equipment, net |
50,150 | 39,183 | |||
|
Goodwill |
86,881 | 71,150 | |||
|
Intangibles, net |
50,093 | 40,490 | |||
|
Other assets, net |
11,622 | 8,910 | |||
|
Total assets |
$ |
1,041,916 |
$ |
802,555 | |
|
Liabilities and Stockholders’ Equity |
|||||
|
Current Liabilities: |
|||||
|
Credit facilities |
$ |
78,200 |
$ |
18,801 | |
|
Accounts payable |
417,388 | 324,057 | |||
|
Accrued expenses and other current liabilities |
28,792 | 21,816 | |||
|
Current portion of capital lease obligations |
1 | 103 | |||
|
Total current liabilities |
524,381 | 364,777 | |||
|
Deferred income taxes |
12,602 | 9,321 | |||
|
Long-term portion of capital lease obligations |
- |
16 | |||
|
Other long-term liabilities |
2,562 | 2,122 | |||
|
Commitments and contingencies |
|||||
|
Stockholders’ Equity |
|||||
|
Common stock $0.01 par value, 40,000 authorized; 12,912 and |
|||||
|
12,848 shares issued and outstanding, respectively |
129 | 128 | |||
|
Additional paid in capital |
153,159 | 148,459 | |||
|
Retained earnings |
347,776 | 275,814 | |||
|
Accumulated other comprehensive income |
1,307 | 1,918 | |||
|
Total stockholders’ equity |
502,371 | 426,319 | |||
|
Total liabilities and stockholders’ equity |
$ |
1,041,916 |
$ |
802,555 | |
|
See notes to consolidated financial statements |
|||||
44
|
MWI VETERINARY SUPPLY, INC. |
||||||||||||||||
|
CONSOLIDATED STATEMENTS OF STOCKHOLDERS’ EQUITY |
||||||||||||||||
|
For the Years Ended September 30, 2014, 2013 and 2012 |
||||||||||||||||
|
Dollars and shares in thousands |
||||||||||||||||
|
Shares of |
Additional |
Accum. |
||||||||||||||
|
Common |
Common |
Paid In |
Other Comp. |
Retained |
||||||||||||
|
Stock |
Stock |
Capital |
Inc/(Loss) |
Earnings |
Total |
|||||||||||
|
Balance at October 1, 2011 |
12,618 |
$ |
126 |
$ |
133,759 |
$ |
(563) |
$ |
159,488 |
$ |
292,810 | |||||
|
Net income |
— |
— |
— |
— |
53,477 | 53,477 | ||||||||||
|
Issuance of common stock |
7 |
— |
562 |
— |
— |
562 | ||||||||||
|
Issuance of common stock for purchase |
- |
|||||||||||||||
|
of Micro |
94 | 1 | 7,158 |
— |
— |
7,159 | ||||||||||
|
Exercises of common stock options |
15 |
— |
154 |
— |
— |
154 | ||||||||||
|
Tax benefit of common stock exercises |
— |
— |
895 |
— |
— |
895 | ||||||||||
|
Issuance of stock awards, net of forfeitures |
58 | 1 | 2,139 |
— |
— |
2,140 | ||||||||||
|
Foreign currency translation |
— |
— |
— |
1,877 |
— |
1,877 | ||||||||||
|
Actuarial gain on unfunded pension liability adjustment |
— |
— |
— |
228 |
— |
228 | ||||||||||
|
Balance at September 30, 2012 |
12,792 |
$ |
128 |
$ |
144,667 |
$ |
1,542 |
$ |
212,965 |
$ |
359,302 | |||||
|
Net income |
— |
— |
— |
— |
62,849 | 62,849 | ||||||||||
|
Issuance of common stock |
5 |
— |
651 |
— |
651 | |||||||||||
|
Exercises of common stock options |
6 |
— |
108 |
— |
— |
108 | ||||||||||
|
Tax benefit of common stock exercises |
— |
— |
1,323 |
— |
— |
1,323 | ||||||||||
|
Issuance of stock awards, net of forfeitures |
45 |
— |
1,710 |
— |
— |
1,710 | ||||||||||
|
Foreign currency translation |
— |
— |
— |
237 |
— |
237 | ||||||||||
|
Actuarial gain on unfunded pension liability adjustment |
— |
— |
— |
139 |
— |
139 | ||||||||||
|
Balance at September 30, 2013 |
12,848 |
$ |
128 |
$ |
148,459 |
$ |
1,918 |
$ |
275,814 |
$ |
426,319 | |||||
|
Net income |
— |
— |
— |
— |
71,962 | 71,962 | ||||||||||
|
Issuance of common stock |
6 |
— |
841 |
— |
— |
841 | ||||||||||
|
Exercises of common stock options |
4 |
— |
72 |
— |
— |
72 | ||||||||||
|
Tax benefit of common stock exercises |
— |
— |
963 |
— |
— |
963 | ||||||||||
|
Issuance of stock awards, net of forfeitures |
54 | 1 | 2,912 |
— |
— |
2,913 | ||||||||||
|
Foreign currency translation |
— |
— |
— |
(293) |
— |
(293) | ||||||||||
|
Actuarial loss on unfunded pension liability adjustment |
— |
— |
— |
(318) |
— |
(318) | ||||||||||
|
Other |
— |
— |
(88) |
— |
— |
(88) | ||||||||||
|
Balance at September 30, 2014 |
12,912 |
$ |
129 |
$ |
153,159 |
$ |
1,307 |
$ |
347,776 |
$ |
502,371 | |||||
|
See notes to consolidated financial statements |
||||||||||||||||
45
|
MWI VETERINARY SUPPLY, INC. |
||||||||
|
CONSOLIDATED STATEMENTS OF CASH FLOWS |
||||||||
|
For the Years Ended September 30, 2014, 2013 and 2012 |
||||||||
|
Dollars in thousands |
||||||||
|
2014 |
2013 |
2012 |
||||||
|
Cash Flows From Operating Activities: |
||||||||
|
Net income |
$ |
71,962 |
$ |
62,849 |
$ |
53,477 | ||
|
Adjustments to reconcile net income to net cash provided by |
||||||||
|
operating activities: |
||||||||
|
Depreciation and amortization |
11,858 | 10,038 | 9,062 | |||||
|
Amortization of debt issuance costs |
39 | 38 | 41 | |||||
|
Stock-based compensation |
5,033 | 3,553 | 2,157 | |||||
|
Deferred income taxes |
1,017 | 1,410 | 1,182 | |||||
|
Earnings of equity method investees |
(342) | (337) | (318) | |||||
|
Distribution from equity method investee |
337 |
- |
- |
|||||
|
Excess tax benefit of exercise of common stock options |
||||||||
|
and restricted stock vesting |
(963) | (1,323) | (895) | |||||
|
(Gain)/loss on disposal of property and equipment |
(600) | 111 | 32 | |||||
|
Other |
91 | (280) | (206) | |||||
|
Changes in operating assets and liabilities (net of effects of business acquisitions): |
||||||||
|
Receivables |
(12,602) | (15,173) | (48,879) | |||||
|
Inventories |
(39,201) | (72,864) | (52,831) | |||||
|
Prepaid expenses and other assets |
(903) | 3,135 | (1,118) | |||||
|
Accounts payable |
18,581 | 63,403 | 50,018 | |||||
|
Accrued expenses |
4,358 | 2,889 | 2,516 | |||||
|
Net cash provided by operating activities |
58,665 | 57,449 | 14,238 | |||||
|
Cash Flows From Investing Activities: |
||||||||
|
Business acquisitions, net of cash acquired in fiscal year 2014 of $2,549 |
(102,097) | (17,107) | (51,718) | |||||
|
Purchases of property and equipment |
(14,919) | (10,780) | (7,597) | |||||
|
Proceeds from sales of property and equipment |
2,216 | 189 | 96 | |||||
|
Other |
(1,243) | (430) | (646) | |||||
|
Net cash used in investing activities |
(116,043) | (28,128) | (59,865) | |||||
|
Cash Flows From Financing Activities: |
||||||||
|
Borrowings on credit facilities |
735,867 | 673,249 | 539,071 | |||||
|
Payments on credit facilities |
(676,559) | (702,271) | (494,186) | |||||
|
Proceeds from issuance of common stock |
841 | 651 | 562 | |||||
|
Proceeds from exercise of common stock options |
72 | 108 | 154 | |||||
|
Excess tax benefit of exercise of common stock options |
||||||||
|
and restricted stock vesting |
963 | 1,323 | 895 | |||||
|
Tax withholdings on net settlements of share-based awards |
(2,120) | (1,855) |
- |
|||||
|
Debt issuance costs |
- |
(111) | ||||||
|
Payment on long-term debt and capital lease obligations |
(110) | (312) | (986) | |||||
|
Other |
(125) | |||||||
|
Net cash provided by/(used in) financing activities |
58,829 | (29,107) | 45,399 | |||||
|
Effect of exchange rate on Cash and Cash Equivalents |
29 | 225 | 136 | |||||
|
Net Increase (Decrease) in Cash and Cash Equivalents |
1,480 | 439 | (92) | |||||
|
Cash and Cash Equivalents at Beginning of Period |
953 | 514 | 606 | |||||
|
Cash and Cash Equivalents at End of Period |
$ |
2,433 |
$ |
953 |
$ |
514 | ||
|
See notes to consolidated financial statements |
||||||||
46
MWI VETERINARY SUPPLY, INC.
NOTES TO CONSOLIDATED FINANCIAL STATEMENTS
Dollars and sterling pounds in thousands, except share and per share data
1. Business Description and Basis of Presentation
MWI Veterinary Supply, Inc. is a leading distributor of animal health products in the United States and United Kingdom. We sell our products in both the companion and production animal markets. As of September 30, 2014, we operated twenty-three distribution centers located across the United States and one distribution center in the United Kingdom.
2. Summary of Significant Accounting Policies
Principles of Consolidation — The accompanying consolidated financial statements consist of MWI Veterinary Supply, Inc. and its wholly-owned subsidiaries, collectively referred to herein as “MWI” or the “Company.” All intercompany transactions have been eliminated. We use the equity method of accounting for our investments in entities in which we have significant influence. Our share of income or loss from these investments is reported as increases or decreases in the respective investment with a corresponding amount reported as other income/(expense).
Basis of Accounting and Use of Estimates — The accompanying consolidated financial statements have been prepared on the accrual basis of accounting using accounting principles generally accepted in the United States. In preparing financial information, we use certain estimates and assumptions that may affect the reported amounts and disclosures. Some of these estimates require difficult, subjective and complex judgments about matters that are inherently uncertain. As a result, actual results could differ from these estimates. Estimates are used when accounting for allowance for doubtful accounts, customer incentives, vendor rebates, inventories, goodwill and intangible assets, income taxes and contingencies. The estimates of fair value of assets and liabilities and the disclosure of contingent assets and liabilities as of the balance sheet date and reported amounts of revenue and expenses for the periods are based on assumptions that we believe to be reasonable.
Segment Information — We are a distributor of animal health products, primarily to veterinarians. Our financial results are disclosed as one reportable segment. We identified two operating segments based on geographic areas but aggregate based on applicable accounting standards. We determined that the two operating segments have similar operating margins and are expected to maintain this similarity into the future. Additionally, our products, customers, operations, delivery to market and regulatory environments are all similar in nature.
Foreign Currency Translation — For our international operations, local currencies have been determined to be the functional currencies. We translate functional currency assets and liabilities to their U.S. dollar equivalents at rates in effect at the balance sheet date and record these translation adjustments in Stockholders’ Equity – Accumulated Other Comprehensive Income/(Loss). We translate functional currency statement of income amounts to their U.S. dollar equivalents at average rates for the period.
Other Comprehensive Income — Comprehensive income includes cumulative foreign currency translation adjustments and actuarial adjustments on pension valuation. As of September 30, 2014, accumulated other comprehensive income is comprised of actuarial adjustments, net of tax, of ($385), and foreign currency translation adjustments of $1,692.
Revenue Recognition — We sell products we source from vendors to our customers through either a “buy/sell” transaction or an agency relationship with our vendors. In a “buy/sell” transaction, we purchase or take inventory of products from the vendor. When a customer places an order with us, we pick, pack, ship and invoice the customer for the order. We recognize revenue from “buy/sell” transactions as product sales when the product is delivered to the customer. We accept product returns from our customers. We estimate returns based on historical experience and recognize these estimated returns as a reduction of product sales. Product returns have not been significant to our financial statements. We record revenues net
47
of sales tax. In an agency relationship, we generally do not purchase and take inventory of products from vendors. We receive an order from a customer, then transmit the order to the vendor, who picks, packs and ships the order to the customer. In some cases, the vendor invoices and collects payment from the customer, while in other cases we invoice and collect payment from the customer on behalf of the vendor. We receive a commission payment for soliciting the order from the customer and for providing other customer service activities. Commissions are recognized when the services upon which the commissions are based are complete. Gross billings from agency contracts were $355,773, $349,006 and $332,343 for the years ended September 30, 2014, 2013 and 2012, respectively, and generated commission revenue of $20,514, $18,851 and $16,979 for the years ended September 30, 2014, 2013 and 2012, respectively.
Cost of Product Sales and Vendor Rebates — Cost of product sales consist of our inventory product cost, including direct shipping costs to and from our distribution centers. Costs of fulfillment are included in selling, general and administrative costs. Vendor rebates are recorded based on the terms of the contracts or programs with each vendor. We receive quarterly, semi-annual and annual performance-based rebates from third-party vendors based upon attainment of certain sales and/or purchase goals. Sales rebates are classified in the accompanying consolidated statements of income as a reduction to cost of product sales at the time the sales performance measures are achieved. Purchase rebates are measured against inventory purchases from the vendors and are classified as a reduction of inventory until the product is sold. When the inventory is sold and purchase measures are achieved, purchase rebates are recognized as a reduction to cost of product sales.
Historically, actual results have not significantly deviated from those determined using the estimates described above. We expect that our estimates in the future will continue to be reasonable as our rebates are based on specific vendor program goals and are principally recorded upon achievement of sales or purchase performance measures. Vendors may change or eliminate rebate programs from year to year.
Customer Incentives — Customer incentives are accrued based on the terms of the contracts with each customer. These incentive programs provide that the customer receive an incentive based on their product purchases or attainment of performance goals. Incentives are estimated based on the specific terms in each agreement, historical experience and product growth rates. Incentives are recognized as a reduction to product sales.
Cash and Cash Equivalents — Cash equivalents consist of highly liquid investments with a maturity of three months or less from the date of purchase. Our banking arrangements allow us to fund outstanding checks when presented to the financial institution for payment.
Inventories — Inventories, consisting of pharmaceuticals, vaccines, parasiticides, diagnostics, micro feed ingredients, capital equipment and technology, supplies and nutritional products, are stated at the lower of cost (on a moving-average basis) or market.
Property and Equipment — Property and equipment are stated at cost and depreciation is computed using the straight-line method over the estimated useful lives, which include the shorter of useful life or lease term for leasehold improvements, of the related assets as follows:
|
Buildings |
25 to 35 years |
|||
|
Machinery, furniture and equipment |
3 to 15 years |
|||
|
Computer equipment |
3 to 7 years |
|||
|
Leasehold improvements |
1 to 10 years |
|||
The cost and accumulated depreciation of items sold or retired are removed from the property accounts and any resulting gain or loss is reflected in net income. Repairs and maintenance are expensed as incurred and improvements are capitalized.
We periodically review long-lived assets for impairment when events or changes in circumstances indicate that the carrying amount of an asset may not be recoverable. No impairments were identified during the fiscal years ended September 30, 2014, 2013 and 2012.
Goodwill and Intangible Assets — We recognize the excess purchase price over the fair value of net assets acquired and liabilities assumed in a business combination as goodwill on the consolidated balance sheet. We perform an annual
48
impairment test on goodwill as of September 30th each year. We calculate the fair value of each reporting unit using both an income approach and a market approach, and compare the fair value to its book value. We have concluded that there was no impairment during the fiscal years ended September 30, 2014, 2013 and 2012. Impairment tests will continue to be performed at least annually and more frequently if circumstances indicate a possible impairment.
Identifiable intangible assets primarily include customer relationships, trademarks and patents, technology and covenants not to compete and are amortized, as necessary, on a straight-line basis, over their useful lives or contractual term which range from 1-20 years. We review both indefinite-lived and definite-lived identifiable intangible assets at least annually for impairment or when events or changes in circumstances indicate that the carrying amount of an asset may not be recoverable. No impairments were identified during the fiscal years ended September 30, 2014, 2013 and 2012.
Other Assets — Included in other assets are our equity method investments and investments in entities accounted for under the cost method of accounting. The carrying value of cost method investments was $5,989 and $4,932 at September 30, 2014 and 2013, respectively. We periodically evaluate these investments for other-than-temporary impairment using both qualitative and quantitative criteria, or when indicators of impairment are noted. In the event an investment is deemed to be other-than-temporarily impaired, we would recognize the loss component in the consolidated statements of income. Other assets also consist of debt issuance costs that are being amortized over the term of the related debt.
Earnings Per Common Share — Basic earnings per common share is calculated based on the weighted-average number of outstanding common shares during the applicable period. Diluted earnings per common share is based on the weighted-average number of outstanding common shares plus the weighted-average number of potential outstanding common shares. Potential common shares that would increase earnings per share amounts are antidilutive and are, therefore, excluded from the earnings per common share computations. Earnings per common share is computed separately for each period presented.
Income Taxes — Income taxes are accounted for under the asset and liability method, which requires the recognition of deferred tax assets and liabilities for the expected future tax consequences of events that have been included in the financial statements. Under this method, deferred tax assets and liabilities are determined on the basis of the differences between the financial statement and tax bases of assets and liabilities using enacted tax rates in effect for the year in which the differences are expected to reverse. The effect of a change in tax rates on deferred tax assets and liabilities is recognized in income in the period that includes the enactment date.
Deferred tax assets are recognized to the extent that we believe these assets are more likely than not to be realized. In making such a determination, we consider all available positive and negative evidence, including future reversals of existing taxable temporary differences, projected future taxable income, tax-planning strategies, and results of recent operations. If we determine that we would be able to realize our deferred tax assets in the future in excess of their net recorded amount, we would make an adjustment to the deferred tax asset valuation allowance, which would reduce the provision for income taxes.
We record uncertain tax positions in accordance with ASC 740 on the basis of a two-step process whereby (1) we determine whether it is more likely than not that the tax positions will be sustained on the basis of the technical merits of the position and (2) for those tax positions that meet the more-likely-than-not recognition threshold, we recognize the largest amount of tax benefit that is more than 50 percent likely to be realized upon ultimate settlement with the related tax authority.
We recognize interest and penalties related to unrecognized tax benefits within the income tax expense line in the accompanying Consolidated Statements of Income. Accrued interest and penalties, if any, are included within the related tax liability line in the Consolidated Balance Sheets.
Concentrations of Risk — Our financial instruments that are exposed to concentrations of credit risk consist primarily of our receivables. Our customers are geographically dispersed throughout the United States and United Kingdom. In the United Kingdom, we rely on a smaller number of relatively larger customers than does our business in the United States. These customers in the aggregate accounted for 12.3% and 14.5% of our consolidated accounts receivable balance as of September 30, 2014 and 2013, respectively. We routinely assess the financial strength of our customers and review their credit history before extending credit. In addition, we establish an allowance for doubtful accounts based upon factors surrounding the credit risk of specific customers, historical trends and other information.
Advertising — Advertising costs are expensed when incurred and are included as part of selling, general and administrative expenses. Advertising costs were $1,481, $1,165 and $1,203 in fiscal years 2014, 2013 and 2012, respectively.
49
Recently Issued and New Accounting Pronouncements —In May 2014, the FASB issued Accounting Standards Update (“ASU”) No. 2014-09, Revenue from Contracts with Customers, which requires entities to recognize revenue in a way that depicts the transfer of promised goods or services to customers in an amount that reflects the consideration to which the entity expects to be entitled to in exchange for those goods or services. This guidance is effective for our fiscal year and interim periods beginning October 1, 2017. We are currently evaluating the effect that adopting this new accounting guidance will have on our consolidated financial statements.
3. Business Acquisitions
On October 31, 2011, MWI Co. purchased substantially all of the assets of Micro Beef Technologies, Ltd. (“Micro”) for $60,878, including $53,400 in cash and 94,359 shares of common stock valued at $7,158, which is the fair value of the common stock as of the date of acquisition and a working capital adjustment of $320. The $53,400 paid in cash as consideration of Micro was funded with borrowings under our Credit Agreement (as defined in Note 7) as then in effect. Micro is a value-added distributor to the production animal market, including the distribution of micro feed ingredients, pharmaceuticals, vaccines, parasiticides, supplies and other animal health products. Micro also is a leading innovator of proprietary, computerized management systems for the production animal market. We incurred $1,104 of direct acquisition-related and integration expenses. The intangible assets acquired in the acquisition include technology, customer relationships, trade name and covenant not to compete. The useful life of the amortizing intangible assets ranges from 5 years to 17 years. Trade name is a non-amortizing intangible asset. Goodwill is calculated as the excess of the consideration transferred over the net assets recognized and represents the future economic benefits arising from other assets acquired that could not be individually identified and separately recognized. The goodwill recorded as part of the acquisition of Micro includes the expected synergies that we believed would result from this acquisition. The amount recorded in goodwill is deductible for tax purposes over 15 years. The fair values assigned to the tangible and intangible assets acquired and liabilities assumed are based on management's estimates and assumptions as well as other information compiled by management, including valuations that utilize customary valuation procedures and techniques.
On December 31, 2012, MWI Co. purchased substantially all of the assets of Prescription Containers, Inc. (“PCI Animal Health”), for a net purchase price of $17,107, after consideration of post-closing adjustments. PCI Animal Health was a distributor of companion animal health products to veterinary practices, primarily in the Northeastern United States. The intangible asset acquired in the acquisition is for customer relationships and has a useful life of 10 years. The amount recorded in goodwill is expected to be deductible for tax purposes over 15 years. The fair values assigned to the tangible and intangible assets acquired and liabilities assumed are based on management's estimates and assumptions, as well as other information compiled by management, including valuations that utilize customary valuation procedures and techniques.
On November 1, 2013, MWI Co. purchased substantially all of the assets of IVESCO Holdings, LLC (“IVESCO”) for a net purchase price of $79,633, after giving effect to post-closing adjustments. The cash purchase price was funded with borrowings by the Company under its Prior Credit Agreement (as defined herein). IVESCO engaged in the distribution and sale of animal health and related products and services, logistics and technical support relating to such distribution and sale of animal health and related products. The intangible assets acquired in the acquisition include trade name and customer relationships. The intangible asset representing customer relationships acquired in the acquisition has an estimated useful life of 9 years. The amount recorded in goodwill is expected to be deductible for tax purposes over 15 years. The fair values assigned to the tangible and intangible assets acquired and liabilities assumed are based on management’s estimates and assumptions as well as other information compiled by management, including valuations that utilize customary valuation procedures and techniques.
On September 2, 2014, MWI Co. purchased all of the outstanding share capital of VetSpace Limited and certain of its affiliates (collectively, VetSpace) for a net purchase price of $25,013. This transaction is subject to a final post-closing working capital adjustment. The cash purchase price was funded with borrowings by the Company under its Prior Credit Agreement (as defined herein). VetSpace is a provider of practice management software to veterinary practices, principally in the United Kingdom. The intangible assets acquired in the acquisition include trade name and customer relationships, which have useful lives ranging from 10 to 20 year. The amount recorded in goodwill will not be deductible for tax purposes. The fair values assigned to the tangible and intangible assets acquired and liabilities assumed are based on management’s estimates and assumptions as well as other information compiled by management, including valuations that utilize customary valuation procedures and techniques.
50
The following table summarizes the fair values of the assets acquired and liabilities assumed at the date of each acquisition. The fair values for VetSpace may be adjusted during the measurement period as defined in Accounting Standards Codification (“ASC”) 805. These purchase price allocations are based on a combination of valuations and analyses.
|
2014 |
2013 |
2012 |
||||||
|
Cash |
$ |
2,549 |
$ |
- |
$ |
1 | ||
|
Receivables |
78,993 | 3,585 | 22,374 | |||||
|
Inventories |
65,098 | 1,928 | 27,701 | |||||
|
Other current assets |
491 |
- |
105 | |||||
|
Property and equipment |
7,693 |
- |
8,882 | |||||
|
Investments |
1,103 |
- |
199 | |||||
|
Goodwill |
16,053 | 9,327 | 12,473 | |||||
|
Intangibles |
13,021 | 4,780 | 15,760 | |||||
|
Total assets acquired |
185,001 | 19,620 | 87,495 | |||||
|
Accounts payable |
74,863 | 2,513 | 25,026 | |||||
|
Accrued expenses |
3,658 |
- |
1,591 | |||||
|
Other liabilities |
1,834 |
- |
||||||
|
Total liabilities assumed |
80,355 | 2,513 | 26,617 | |||||
|
Net assets acquired |
$ |
104,646 |
$ |
17,107 |
$ |
60,878 | ||
Revenues and earnings of VetSpace that are included in our consolidated statements of income from the acquisition date of September 2, 2014 through September 30, 2014 are not presented separately as they are not material. Due to the commencement of the integration of IVESCO, it is impracticable to separately present the revenues and earnings of IVESCO that are included in our consolidated statements of income from the acquisition date of November 1, 2013 through September 30, 2014. This information for PCI Animal Health is also not presented as it is impracticable due to the integration of the acquired operations.
The following table presents information for Micro that is included in our consolidated statements of income from the acquisition date of October 31, 2011 through the fiscal year ended September 30, 2012:
|
Micro's operations included in MWI's results |
||
|
Fiscal year ended September 30, 2012 |
||
|
Revenues |
$ |
246,624 |
|
Net Income |
$ |
4,089 |
The following table presents supplemental pro forma information for the Company for the years ended September 30, 2014, 2013 and 2012 (unaudited) as if the acquisitions of substantially all of the assets of IVESCO and Micro had occurred on October 1, 2011 (pro forma information is not presented for VetSpace or PCI Animal Health as it is not material):
|
Unaudited Pro Forma Consolidated Results |
||||||||
|
Fiscal year ended September 30, |
||||||||
|
2014 |
2013 |
2012 |
||||||
|
Revenues |
$ |
3,031,030 |
$ |
2,849,712 |
$ |
2,586,351 | ||
|
Net Income |
$ |
71,963 |
$ |
66,521 |
$ |
57,143 | ||
51
The unaudited pro forma consolidated results are not necessarily indicative of what our consolidated results of operations would have been had we completed the acquisitions on October 1, 2011. Additionally, the unaudited pro forma consolidated results do not purport to project the future results of operations of the combined company.
4. Receivables
Receivables consist of the following at September 30:
|
2014 |
2013 |
||||
|
Trade |
$ |
358,757 |
$ |
282,923 | |
|
Vendor rebates and programs |
43,179 | 26,983 | |||
| 401,936 | 309,906 | ||||
|
Allowance for doubtful accounts |
(2,946) | (2,461) | |||
|
$ |
398,990 |
$ |
307,445 | ||
5. Property and Equipment
Property and equipment consists of the following at September 30:
|
2014 |
2013 |
||||
|
Land |
$ |
2,023 |
$ |
1,932 | |
|
Building and leasehold improvements |
17,351 | 14,914 | |||
|
Machinery, furniture and equipment |
44,877 | 38,032 | |||
|
Computer equipment |
17,374 | 9,868 | |||
|
Construction in progress |
5,641 | 4,328 | |||
| 87,266 | 69,074 | ||||
|
Accumulated depreciation and amortization |
(37,116) | (29,891) | |||
|
$ |
50,150 |
$ |
39,183 | ||
We recorded depreciation expense of $8,489, $6,974 and $6,210 for the years ended September 30, 2014, 2013 and 2012, respectively.
6. Goodwill and Intangibles
The changes in the carrying value of goodwill for the fiscal years ended September 30, are as follows:
|
2014 |
2013 |
||||
|
Goodwill - Beginning of year |
$ |
71,150 |
$ |
61,841 | |
|
Acquisition activity |
16,053 | 9,327 | |||
|
Foreign exchange translation |
(322) | (18) | |||
|
Goodwill - End of year |
$ |
86,881 |
$ |
71,150 | |
52
Balances of intangibles are as follows:
|
Estimated |
|||||||||||
|
Useful Lives |
September 30, 2014 |
||||||||||
|
Amortizing: |
Cost |
Accumulated Amortization |
Net |
||||||||
|
Customer relationships |
9 - 20 years |
$ |
45,860 |
$ |
(10,899) |
$ |
34,961 | ||||
|
Covenants not to compete |
1 - 5 years |
372 | (163) | 209 | |||||||
|
Technology |
11 years |
5,830 | (1,546) | 4,284 | |||||||
|
Other |
2 - 10 years |
1,627 | (1,072) | 555 | |||||||
| 53,689 | (13,680) | 40,009 | |||||||||
|
Non-Amortizing: |
|||||||||||
|
Trade names and patents |
10,084 |
- |
10,084 | ||||||||
|
$ |
63,773 |
$ |
(13,680) |
$ |
50,093 | ||||||
|
Estimated |
|||||||||||
|
Useful Lives |
September 30, 2013 |
||||||||||
|
Amortizing: |
Cost |
Accumulated Amortization |
Net |
||||||||
|
Customer relationships |
9 - 20 years |
$ |
35,797 |
$ |
(8,393) |
$ |
27,404 | ||||
|
Covenants not to compete |
1 - 5 years |
450 | (185) | 265 | |||||||
|
Technology |
11 years |
5,830 | (1,016) | 4,814 | |||||||
|
Other |
2 - 7 years |
1,126 | (794) | 332 | |||||||
| 43,203 | (10,388) | 32,815 | |||||||||
|
Non-Amortizing: |
|||||||||||
|
Trade names and patents |
7,675 |
- |
7,675 | ||||||||
|
$ |
50,878 |
$ |
(10,388) |
$ |
40,490 | ||||||
We recorded amortization expense of $3,368, $3,064 and $2,852 for the years ended September 30, 2014, 2013 and 2012, respectively. Estimated future amortization expense related to intangible assets as of September 30, 2014 is as follows:
|
Amount |
||
|
2015 |
$ |
3,438 |
|
2016 |
3,316 | |
|
2017 |
3,237 | |
|
2018 |
3,212 | |
|
2019 |
3,041 | |
|
Thereafter |
23,765 | |
|
$ |
40,009 | |
53
7. Debt
|
2014 |
2013 |
||||
|
Revolving credit facility, 1.03% as of September 30, 2014 |
$ |
78,200 |
$ |
16,300 | |
|
Sterling revolving credit facility |
- |
2,501 | |||
|
Capital lease obligations (1) |
1 | 119 | |||
|
Total debt and capital lease obligations |
78,201 | 18,920 | |||
|
Less: Long-term portion of capital lease obligations |
- |
(16) | |||
|
Total debt and capital lease obligations included in current liabilities |
$ |
78,201 |
$ |
18,904 | |
|
(1) The capital lease obligations have varying maturity dates. |
|||||
Revolving Credit Facility — MWI Co., as borrower, was party to a Credit Agreement dated December 13, 2006, as amended (the “Prior Credit Agreement”), by and among MWI Co., MWI, and Memorial Pet Care, Inc. and Bank of America, N.A. and Wells Fargo Bank, N.A. as lenders (collectively, the “Lenders”). The Prior Credit Agreement allowed for an aggregate revolving commitment of the Lenders of $200,000 and a maturity date of November 1, 2016. Under the Prior Credit Agreement, the margin on variable interest rate borrowings ranged from 0.95% to 1.50%. The commitment fee under the Credit Agreement ranged from 0.15% to 0.25% depending on the funded debt to EBITDA ratio. The variable interest rate was equal to the Daily LIBOR Floating Rate or the LIBOR 1-month, 2-month, 3-month or 6-month fixed rate (at MWI Co.’s option) plus the margin. The Credit Agreement contained financial covenants, including a fixed charge ratio and a funded debt to EBITDA ratio. We were in compliance with all of the covenants as of September 30, 2014 and 2013.
On October 2, 2014, MWI Co., as borrower, entered into an Amended and Restated Credit Agreement (the “Amended Credit Agreement”), with MWI and Memorial Pet Care, Inc., as guarantors and the Lenders. The Amended Credit Agreement allows for an aggregate revolving commitment of the Lenders of $230,000 and includes a $45,000 sublimit for borrowings in alternative currencies. The Amended Credit Agreement has a maturity date of October 2, 2019. Under the Amended Credit Agreement, the margin on variable interest rate borrowings ranges from 0.95% to 1.50%. The commitment fee under the Amended Credit Agreement ranges from 0.15% to 0.25% depending on the funded debt to EBITDA ratio. The variable interest rate on borrowings in dollars, euros or British pounds is equal to the Daily LIBOR Floating Rate or the LIBOR 1-month, 2-month, 3-month or 6-month fixed rate (at MWI Co.’s option) plus the margin. The Amended Credit Agreement contains financial covenants, including an interest charge coverage ratio and a funded debt to EBITDA ratio.
The Amended Credit Agreement replaces the Prior Credit Agreement.
Sterling Revolving Credit Facility— On March 15, 2013, Centaur entered into a First Amendment (the “Amendment”) to the unsecured revolving line of credit facility (the “Sterling Revolving Credit Facility”) dated November 5, 2010 with Wells Fargo Bank, N.A. London Branch. The Amendment increases the maximum loan amount of the Sterling Revolving Credit Facility to £20,000, an increase of £7,500, and extends the term of the facility to November 1, 2016. Interest is based on LIBOR for the applicable interest period plus an applicable margin of 0.95% to 1.50%, and the commitment fee ranges from 0.15% to 0.25%, depending on our funded debt to EBITDA ratio. The facility contains a financial covenant requiring Centaur to maintain a minimum tangible net worth of £5,000. As of September 30, 2014 and 2013, Centaur was in compliance with the covenant.
Also on March 15, 2013, Centaur entered into an uncommitted overdraft facility (the “Overdraft Facility”) with Wells Fargo. The Overdraft Facility allows Centaur to borrow an additional £10,000 to fund short term normal trading cycle fluctuations. The Overdraft Facility will expire on November 1, 2016. Interest on the borrowing under the Overdraft Facility is the same as the terms under the Sterling Revolving Credit Facility.
MWI Co. guarantees the obligations of Centaur under the Sterling Revolving Credit Facility and the Overdraft Facility.
54
8. Common Stock and Stock-Based Awards
2002 Stock Plan
We had a 2002 Stock Plan (the “2002 Plan”) to provide our directors, executives and other key employees with additional incentives by allowing them to acquire an ownership interest in us and, as a result, encouraging them to contribute to our success. All options that were granted under this plan have been exercised and there are no additional shares available for issuance under the 2002 Plan.
2005 Stock Plan
We have a 2005 Stock-Based Award and Incentive Compensation Plan (the “2005 Plan”), under which we may offer restricted shares of our common stock and grant options to purchase shares of our common stock to selected employees and non-employee directors. The purpose of the 2005 Plan is to promote our long-term financial success by attracting, retaining and rewarding eligible participants. At September 30, 2014 and 2013 we had 757,588 and 815,260 shares, respectively, of our common stock available for issuance under the 2005 Plan.
The 2005 Plan permits us to grant stock options (both incentive stock options and non‑qualified stock options), restricted stock and deferred stock. The compensation committee will determine the number and type of stock-based awards to each participant, the exercise price of each award, the duration of the award (not to exceed ten years), vesting provisions and all other terms and conditions of such award in individual award agreements. The 2005 Plan provides for the cancellation of all unvested awards upon termination of employment with us, unless determined otherwise by the compensation committee at the time awards are granted.
A summary of common stock options activity under the 2002 and 2005 Plans is as follows:
|
2014 |
2013 |
2012 |
||||||||||||||||||
|
Weighted |
Weighted |
Weighted |
||||||||||||||||||
|
Number |
average |
Number |
average |
Number |
average |
|||||||||||||||
|
of |
exercise |
of |
exercise |
of |
exercise |
|||||||||||||||
|
Shares |
price |
Shares |
price |
Shares |
price |
|||||||||||||||
|
Outstanding at beginning of year |
16,038 |
$ |
17.58 | 22,360 |
$ |
17.53 | 37,385 |
$ |
14.73 | |||||||||||
|
Exercised |
(4,030) | 17.84 | (6,186) | 17.43 | (14,769) | 10.44 | ||||||||||||||
|
Cancelled or expired |
(74) | 17.00 | (136) | 17.00 | (256) | 17.00 | ||||||||||||||
|
Outstanding at end of year |
11,934 |
$ |
17.49 | 16,038 |
$ |
17.58 | 22,360 |
$ |
17.53 | |||||||||||
|
Exercisable at end of year |
11,934 |
$ |
17.49 | 16,038 |
$ |
17.58 | 22,360 |
$ |
17.53 | |||||||||||
|
Outstanding and exercisable options |
|||||||
|
Weighted |
|||||||
|
average |
|||||||
|
remaining |
Weighted |
||||||
|
contractual |
average |
||||||
|
Number of |
life |
exercise |
|||||
|
Range of exercise prices |
Shares |
(in years) |
price |
||||
|
$17.00 - $19.99 |
10,774 | 0.8 |
$ |
17.00 | |||
|
$20.00 - $22.60 |
1,160 | 1.0 |
$ |
22.05 | |||
The intrinsic value of the shares outstanding and exercisable was $1,562 as of September 30, 2014 and $2,114 as of September 30, 2013. The total intrinsic value of options exercised during the years ended September 30, 2014, 2013 and 2012 was $553, $644, and $1,105, respectively.
55
A summary of restricted stock awards activity under the 2005 Plan is as follows:
|
2014 |
2013 |
2012 |
|||||||||||||||||
|
Weighted |
Weighted |
Weighted |
|||||||||||||||||
|
Number |
average |
Number |
average |
Number |
average |
||||||||||||||
|
of |
grant date |
of |
grant date |
of |
grant date |
||||||||||||||
|
Shares |
fair value |
Shares |
fair value |
Shares |
fair value |
||||||||||||||
|
Nonvested at beginning of year |
142,244 |
$ |
83.13 | 129,396 |
$ |
69.94 | 105,540 |
$ |
61.69 | ||||||||||
|
Granted |
76,555 | 148.10 | 70,575 | 145.65 | 74,848 | 101.97 | |||||||||||||
|
Vested |
(47,154) | 104.72 | (44,547) | 144.52 | (48,072) | 102.09 | |||||||||||||
|
Forfeitures |
(8,107) | 110.64 | (13,180) | 80.96 | (2,920) | 63.49 | |||||||||||||
|
Nonvested at end of year |
163,538 |
$ |
132.04 | 142,244 |
$ |
83.13 | 129,396 |
$ |
69.94 | ||||||||||
As of September 30, 2014, total unrecognized stock based compensation expense related to nonvested awards was approximately $21,319 before income taxes, which is expected to be recognized over the remaining term of the awards which range from 1 to 5 years. During the fiscal years ended September 30, 2014 and 2013, we recognized $5,033 and $3,553, respectively, in compensation expense related to common stock awards. The total fair value of shares vested during the years ended September 30, 2014, 2013, and 2012, was $7,020, $6,438, and $4,908, respectively.
2008 Employee Stock Purchase Plan
The 2008 Employee Stock Purchase Plan (the “ESPP”) allows substantially all employees to purchase shares of our common stock at 95% of the fair market value on the date of purchase. The purchase date is the last trading date of the purchase period, which begins in March, June, September and December. Employees accumulate amounts through payroll deductions during the purchase period of between 1% and 10% but no more than $20 annually. An employee is allowed to purchase a maximum of 200 shares per purchase period. We issued 5,764 and 5,396 shares of our common stock under the ESPP during fiscal years ended September 30, 2014 and 2013, respectively.
9. Computation of Earnings per Common Share (In thousands, except per share data)
|
2014 |
2013 |
2012 |
|||||||||||||||
|
Basic |
Diluted |
Basic |
Diluted |
Basic |
Diluted |
||||||||||||
|
Net income |
$ |
71,962 |
$ |
71,962 |
$ |
62,849 |
$ |
62,849 |
$ |
53,477 |
$ |
53,477 | |||||
|
Weighted average common |
|||||||||||||||||
|
shares outstanding |
12,715 | 12,715 | 12,675 | 12,675 | 12,616 | 12,616 | |||||||||||
|
Effect of dilutive securities |
|||||||||||||||||
|
Stock options and restricted stock |
30 | 34 | 31 | ||||||||||||||
|
Weighted average shares |
|||||||||||||||||
|
outstanding |
12,745 | 12,709 | 12,647 | ||||||||||||||
|
Earnings per share |
$ |
5.66 |
$ |
5.65 |
$ |
4.96 |
$ |
4.95 |
$ |
4.24 |
$ |
4.23 | |||||
|
Anti-dilutive shares excluded from calculation |
3 |
- |
- |
||||||||||||||
56
10. Income Taxes
Income before taxes is as follows:
|
2014 |
2013 |
2012 |
||||||
|
Income before taxes |
||||||||
|
United States |
$ |
115,545 |
$ |
96,915 |
$ |
81,482 | ||
|
Foreign |
2,160 | 3,766 | 4,458 | |||||
|
Total income before taxes |
$ |
117,705 |
$ |
100,681 |
$ |
85,940 | ||
The components of income tax expense consist of the following:
|
2014 |
2013 |
2012 |
||||||
|
United States |
||||||||
|
Current payable |
||||||||
|
Federal |
$ |
36,585 |
$ |
30,200 |
$ |
25,535 | ||
|
State |
6,875 | 4,952 | 4,494 | |||||
|
Deferred |
||||||||
|
Federal |
1,216 | 1,652 | 1,308 | |||||
|
State |
302 | 253 | 220 | |||||
|
Total U.S. tax expense |
44,978 | 37,057 | 31,557 | |||||
|
International |
||||||||
|
Current payable |
1,265 | 1,275 | 1,252 | |||||
|
Deferred |
(500) | (500) | (346) | |||||
|
Total foreign tax expense |
765 | 775 | 906 | |||||
|
Total income tax expense |
$ |
45,743 |
$ |
37,832 |
$ |
32,463 | ||
Our deferred tax assets and liabilities consist of the following at September 30:
|
2014 |
2013 |
||||
|
Deferred tax assets: |
|||||
|
Allowance for doubtful accounts |
$ |
1,061 |
$ |
866 | |
|
Inventories |
942 | 658 | |||
|
Lease expense |
713 | 544 | |||
|
Employee benefits |
599 | 334 | |||
|
Acquisition-related costs |
- |
444 | |||
|
Other |
416 | 164 | |||
|
Total deferred tax assets |
3,731 | 3,010 | |||
|
Deferred tax liabilities: |
|||||
|
Investments |
(1,414) | (786) | |||
|
Property and equipment |
(11,808) | (8,876) | |||
|
Prepaid expenses |
(299) | (227) | |||
|
Other |
- |
(115) | |||
|
Total deferred tax liabilities |
(13,521) | (10,004) | |||
|
Net deferred liabilities |
$ |
(9,790) |
$ |
(6,994) | |
Other deferred tax assets totaling $760 and $711 as of September 30, 2014 and 2013, respectively, arising from the Company’s foreign subsidiary, are subject to full valuation allowance.
57
Income tax expense differed from income taxes at the U.S. federal statutory tax rate for all periods presented as follows:
|
2014 |
2013 |
2012 |
|||
|
Taxes computed at statutory rate |
35.0% | 35.0% | 35.0% | ||
|
State income taxes (net of federal income tax benefit) |
4.0 | 3.4 | 3.6 | ||
|
Foreign |
(0.3) | (0.9) | (1.1) | ||
|
Other |
0.2 | 0.1 | 0.3 | ||
| 38.9% | 37.6% | 37.8% |
In general, it is the practice and intention of the Company to reinvest the earnings of its non-U.S. subsidiaries in those operations. We consider the undistributed earnings of our foreign subsidiaries to be indefinitely reinvested as of September 30, 2014 and, accordingly, no provision for U.S. income taxes has been made with respect to any such amounts. As of September 30, 2014, the amount of cash and cash equivalents associated with indefinitely reinvested foreign earnings was approximately $2,192. We have not, nor do we anticipate the need to, repatriate funds to the United States to satisfy domestic liquidity needs arising in the ordinary course of business, including liquidity needs associated with our domestic debt service requirements. In the event that these funds are repatriated, such amounts would be subject to income tax liabilities in the United States. It is not practicable to estimate the amount of deferred tax liability related to investments in foreign subsidiaries because of the complexities of the hypothetical calculation.
A reconciliation of the unrecognized tax benefits is as follows:
|
2014 |
2013 |
2012 |
||||||
|
Unrecognized tax benefits – Beginning of year |
$ |
- |
$ |
- |
$ |
23 | ||
|
Gross increases related to prior period tax positions |
- |
- |
- |
|||||
|
Gross decreases related to prior period tax positions |
- |
- |
(8) | |||||
|
Gross increases related to current period tax positions |
- |
- |
- |
|||||
|
Settlements |
- |
- |
(15) | |||||
|
Unrecognized tax benefits – End of year |
$ |
- |
$ |
- |
$ |
- |
||
For the fiscal years ended September 30, 2014, 2013 and 2012, the amount included in our income tax expense for tax-related interest and penalties was not significant. We expect no material changes to our unrecognized tax benefits during the next fiscal year.
With few exceptions, we are no longer subject to income tax examination for years before 2010 in the U.S. and significant state and local jurisdictions. We are no longer subject to income tax examinations for years before 2012 in significant foreign jurisdictions.
11. Statements of Cash Flows — Supplemental and Noncash Disclosures
|
2014 |
2013 |
2012 |
||||||
|
Supplemental Disclosures |
||||||||
|
Cash paid for interest |
$ |
1,110 |
$ |
620 |
$ |
788 | ||
|
Cash paid for income taxes |
45,117 | 34,045 | 31,025 | |||||
|
Noncash Investing and Financing Activities |
||||||||
|
Issuance of restricted common stock for asset acquisition |
- |
- |
7,158 | |||||
|
Capital lease asset additions and related obligations |
- |
- |
165 | |||||
|
Property and equipment acquisitions financed with accounts payable |
364 | 265 | 192 | |||||
58
12. Commitments and Contingencies
From time to time, in the normal course of business, we may become a party to legal proceedings that may have an adverse effect on our financial position, results of operations and cash flow. Except as set forth below, at September 30, 2014, we were not a party to any material pending legal proceedings and were not aware of any claims that individually or in the aggregate could have a material adverse effect on our financial position, results of operations or cash flows.
On July 30, 2014, Ealena Callender, a purported stockholder of the Company, brought a derivative lawsuit in the Court of Chancery of the State of Delaware against the Company as nominal defendant and against each of the Company’s directors, as well as a former director, as defendants, alleging breach of fiduciary duty and unjust enrichment relating to the Company’s non-employee director stock grants made between 2012 and 2014. The complaint alleges that the directors breached their fiduciary duties by issuing stock grants that were inconsistent with the terms of the Company’s Amended and Restated 2005 Stock-Based Incentive Compensation Plan. The complaint seeks rescission of a total of 16,505 shares of common stock issued to the directors as well as damages plus pre-judgment and post-judgment interest. The Company believes that the allegations in the complaint are without merit.
We have operating leases for office and distribution center space and equipment for varying periods. We also lease some of our vehicles in the United Kingdom under capital leases. Certain leases have renewal options and require contingent payments for increases, including executory costs, property taxes, insurance and certain other costs in excess of a base year amount. Total rent expense for the years ended September 30, 2014, 2013 and 2012 were $8,494, $6,301 and $5,382, respectively.
The aggregate future noncancelable minimum rental payments on operating leases and capital leases at September 30, 2014 are as follows:
|
Lease Obligations |
||||||
|
Fiscal Year |
Operating Leases |
Capital Leases |
||||
|
2015 |
$ |
8,515 |
$ |
1 | ||
|
2016 |
8,218 | |||||
|
2017 |
7,649 | |||||
|
2018 |
7,070 | |||||
|
2019 |
5,976 | |||||
|
Thereafter |
16,583 | |||||
|
Total future minimum obligations |
$ |
54,011 |
$ |
1 | ||
13. Accumulated Other Comprehensive Income
Changes in accumulated other comprehensive income consisted of the following:
|
Year Ended September 30, |
|||||||||
|
2014 |
2013 |
2012 |
|||||||
|
Balance, beginning of period |
$ |
1,918 |
$ |
1,542 |
$ |
(563) | |||
|
Foreign currency translation gain (loss) in |
|||||||||
|
other comprehensive income |
(293) | 237 | 1,877 | ||||||
|
Actuarial (loss) gain on unfunded pension liability |
|||||||||
|
net of tax of $(207), $48, and $145, respectively |
(318) | 139 | 228 | ||||||
|
Balance, end of period |
$ |
1,307 |
$ |
1,918 |
$ |
1,542 | |||
14. Related Party Transactions
MWI Co. holds a 50% membership interest in Feeders’ Advantage that is accounted for as an investment using the equity method. Sales of products to Feeders’ Advantage, which are at our cost, were $68,501, $68,355 and $61,873 for the
59
fiscal years ended September 30, 2014, 2013 and 2012, respectively. MWI Co. charged Feeders’ Advantage for certain operating and administrative services of $1,097, $1,079 and $1,008 for the fiscal years ended September 30, 2014, 2013 and 2012, respectively. Our President and Chief Executive Officer and a member of our Board of Directors are each members of the Board of Managers of Feeders’ Advantage.
MWI Co. allows Feeders’ Advantage to use its cash management system to finance its day-to-day operations. At any given time, the outstanding position used in the cash management system may be a receivable or payable depending on the cash activity. A receivable balance bears interest at the prime rate. The interest due on the outstanding receivable is calculated and charged to Feeders’ Advantage on the last day of each month. Conversely, to the extent MWI Co. has a payable balance due to Feeders’ Advantage, the payable balance accrues interest in favor of Feeders’ Advantage at the average federal funds rates in effect for that month. As of September 30, 2014 and 2013 MWI Co. had a payable balance to Feeders’ Advantage of $1,495 and $777, respectively.
15. Employee Benefit Plans
We have a multi-employer defined contribution profit sharing plan with a 401(k) arrangement for employees in the United States. To become eligible for the profit sharing portion of the plan, an employee must complete two years of service and attain the age of twenty-one. Participation is automatic beginning the following January or July. To become eligible for the 401(k) portion of the plan, the employee must complete three-months of service and attain the age of twenty-one.
Both portions of the plan allow for employer contributions. We match 50% of the employee’s contribution to the 401(k) portion of the plan up to 6% of the employee’s salary, at management’s discretion. Our matching contributions for the 401(k) portion of the plan were $2,451, $2,122 and $1,871 for the fiscal years ended September 30, 2014, 2013 and 2012, respectively. Employee’s contributions are fully vested immediately while employer contributions vest over a five-year period.
Contributions to the profit sharing portion of the Plans are discretionary, ranging from 0% to 3%, and are approved by our Board of Directors. Total profit sharing expense for the fiscal years ended September 30, 2014, 2013 and 2012 were $2,203, $1,997 and $1,847, respectively. Employer contributions are fully vested immediately.
Centaur sponsors a defined contribution plan for all other staff not participating in the defined benefit plan described below. The contributions made by the employer over the period are detailed below. Contributions are currently payable at a minimum of 3% up to a maximum of 6% of eligible pay if matched by employee. The matching contribution for the plan was $278, $257 and $250 for the fiscal years ended September 30, 2014, 2013 and 2012, respectively.
Centaur operates a defined benefit pension plan which provides benefits based on pensionable pay and is closed to future benefit accrual.
The fair value of plan assets, benefit obligation and funded status of the defined benefit plan as of September 30 is as follows:
|
2014 |
2013 |
2012 |
||||||
|
Fair value of plan assets |
$ |
5,732 |
$ |
5,242 |
$ |
5,329 | ||
|
Benefit obligation |
(7,574) | (6,667) | (7,228) | |||||
|
Unfunded pension liability |
$ |
(1,842) |
$ |
(1,425) |
$ |
(1,899) | ||
60
The unfunded pension liability is recognized as other long-term liabilities in the Consolidated Balance Sheets. Net periodic benefit expense for the fiscal year ended September 30 consisted of the following:
|
2014 |
2013 |
2012 |
||||||
|
Interest cost |
$ |
234 |
$ |
195 |
$ |
219 | ||
|
Expected return on plan assets |
(322) | (252) | (249) | |||||
|
Net periodic cost |
(88) | (57) | (30) | |||||
|
Other changes recognized in other comprehensive income |
||||||||
|
Actuarial loss (gain) |
666 | (187) | (373) | |||||
|
Total recognized in net periodic benefit costs and |
||||||||
|
other comprehensive income |
$ |
578 |
$ |
(244) |
$ |
(403) | ||
|
Total loss (gain) recognized in other comprehensive income, net of tax |
$ |
318 |
$ |
(139) |
$ |
(228) | ||
The estimated net actuarial gain that will be amortized from accumulated other comprehensive income into net periodic benefit costs during fiscal year 2014 is not significant. The following table provides the weighted-average actuarial assumptions:
|
2014 |
2013 |
|||||
|
Assumptions used to determine benefit obligations |
||||||
|
Discount rate |
3.1% | 3.6% | ||||
|
Rate of compensation increase (1) |
N/A |
N/A |
||||
|
2014 |
2013 |
2012 |
||||
|
Assumptions used to determine net periodic benefit cost |
||||||
|
Discount rate |
3.6% | 3.0% | 3.1% | |||
|
Expected return on plan assets |
6.0% | 5.0% | 5.2% | |||
|
Rate of compensation increase (1) |
N/A |
N/A |
N/A |
|||
|
(1) There is no assumed rate of compensation increase as there have been no current active members since April 2006. |
||||||
The following table sets forth, by level within the fair value hierarchy, as discussed in Note 15, Fair Value of Financial Instruments, the assets of the plan, by major asset category, at fair value as of September 30:
|
2014 |
2013 |
|||||||||||||
|
Market |
Asset |
Fair Value |
Market |
Asset |
Fair Value |
|||||||||
|
Asset Class |
Value |
Allocation |
Level |
Value |
Allocation |
Level |
||||||||
|
Equities |
$ |
2,418 | 42% | 2 |
$ |
2,062 | 39% | 2 | ||||||
|
Corporate bonds |
822 | 14% | 2 | 979 | 19% | 2 | ||||||||
|
Cash |
152 | 3% | 1 | 82 | 2% | 1 | ||||||||
|
Other assets |
2,340 | 41% | 2 | 2,119 | 40% | 2 | ||||||||
|
Total |
$ |
5,732 | 100% |
$ |
5,242 | 100% | ||||||||
61
16. Fair Value of Financial Instruments
Current fair value accounting guidance includes a hierarchy that is intended to increase consistency and comparability in fair value measurements and disclosures. This hierarchy prioritizes inputs to valuation techniques based on observable and unobservable data. The guidance categorizes these inputs used in measuring fair value into three levels which include the following:
|
· |
Level 1 – observable inputs such as quoted prices in active markets; |
|
· |
Level 2 – inputs, other than quoted prices, that are observable for the asset or liability, either directly or indirectly. These include quoted prices for similar assets or liabilities in active markets and quoted prices for identical or similar assets or liabilities in markets that are not active; and |
|
· |
Level 3 – unobservable inputs in which there is little or no market data, which require the reporting entity to develop its own assumptions. |
As of September 30, 2014 and 2013, financial instruments include cash and cash equivalents, receivables and accounts payable, and the fair values approximate book values due to their short maturities.
Our revolving credit facilities in the United States and in the United Kingdom were amended in the recent past and are based on market conditions such as LIBOR. Because these credit facilities include interest rates based on current market conditions (Level 1 inputs), we believe that the estimated fair value of our debt was materially the same as our carrying value.
17. Geographic Information
Revenues and long-lived assets by geographic region are as follows:
|
2014 |
2013 |
2012 |
||||||
|
Revenues for the fiscal years ended September 30 |
||||||||
|
United States |
$ |
2,651,818 |
$ |
2,032,260 |
$ |
1,776,414 | ||
|
International |
329,220 | 315,225 | 298,732 | |||||
|
Total |
$ |
2,981,038 |
$ |
2,347,485 |
$ |
2,075,146 | ||
|
Long-lived assets as of September 30 |
||||||||
|
United States |
$ |
40,306 |
$ |
32,881 |
$ |
29,001 | ||
|
International |
9,844 | 6,302 | 6,783 | |||||
|
Total |
$ |
50,150 |
$ |
39,183 |
$ |
35,784 | ||
62
18. Quarterly Financial Data (Unaudited)
|
Three-Months Ended |
|||||||||||||||
|
Dec. 31, |
Mar. 31, |
June 30, |
Sept. 30, |
Year (1) |
|||||||||||
|
(Dollars and shares in thousands, except per share data) |
|||||||||||||||
|
Fiscal Year 2014 |
|||||||||||||||
|
Total revenues |
$ |
687,259 |
$ |
721,272 |
$ |
778,448 |
$ |
794,059 |
$ |
2,981,038 | |||||
|
Gross profit |
89,088 | 91,060 | 97,475 | 93,690 | 371,313 | ||||||||||
|
Operating income |
30,206 | 27,431 | 31,329 | 28,793 | 117,760 | ||||||||||
|
Net income |
18,439 | 16,776 | 19,365 | 17,382 | 71,962 | ||||||||||
|
Earnings per common share — basic |
$ |
1.45 |
$ |
1.32 |
$ |
1.52 |
$ |
1.37 |
$ |
5.66 | |||||
|
Earnings per common share — diluted |
$ |
1.45 |
$ |
1.32 |
$ |
1.52 |
$ |
1.36 |
$ |
5.65 | |||||
|
Weighted average common shares |
|||||||||||||||
|
outstanding: |
|||||||||||||||
|
Basic |
12,707 | 12,712 | 12,718 | 12,722 | 12,715 | ||||||||||
|
Diluted |
12,743 | 12,748 | 12,744 | 12,747 | 12,745 | ||||||||||
|
Fiscal Year 2013 |
|||||||||||||||
|
Total revenues |
$ |
572,848 |
$ |
563,114 |
$ |
606,443 |
$ |
605,080 |
$ |
2,347,485 | |||||
|
Gross profit |
76,929 | 74,679 | 77,511 | 75,219 | 304,338 | ||||||||||
|
Operating income |
27,077 | 24,238 | 26,534 | 22,473 | 100,323 | ||||||||||
|
Net income |
16,751 | 15,100 | 16,781 | 14,217 | 62,849 | ||||||||||
|
Earnings per common share — basic |
$ |
1.32 |
$ |
1.19 |
$ |
1.32 |
$ |
1.12 |
$ |
4.96 | |||||
|
Earnings per common share — diluted |
$ |
1.32 |
$ |
1.19 |
$ |
1.32 |
$ |
1.12 |
$ |
4.95 | |||||
|
Weighted average common shares |
|||||||||||||||
|
outstanding: |
|||||||||||||||
|
Basic |
12,665 | 12,674 | 12,679 | 12,683 | 12,675 | ||||||||||
|
Diluted |
12,695 | 12,709 | 12,713 | 12,721 | 12,709 | ||||||||||
|
(1) The sums of the quarterly amounts may not agree to the year-to-date amount as a result of rounding. |
|||||||||||||||
Item 9.Changes in and Disagreements with Accountants on Accounting and Financial Disclosure.
None
Item 9A. Controls and Procedures.
Our management, including the Chief Executive Officer and the Chief Financial Officer, have evaluated the effectiveness of our disclosure controls and procedures (as defined in Rule 13a‑15(e) of the Securities Exchange Act of 1934) as of September 30, 2014. Based on this evaluation, the Chief Executive Officer and the Chief Financial Officer concluded that our Company’s disclosure controls and procedures, including the accumulation and communication of disclosures to the Company’s Chief Executive Officer and Chief Financial Officer as appropriate to allow timely decisions regarding required disclosure, are effective to provide reasonable assurance that information required to be disclosed by us in the reports that we file or submit under the Exchange Act is recorded, processed, summarized and reported within the time periods specified by the Securities and Exchange Commission‘s rules and forms.
Management’s annual report on internal control over financial reporting and the attestation report of our independent registered public accounting firm are set forth below on this Annual Report on Form 10-K.
There were no changes in our internal controls over financial reporting that occurred during our most recently completed fiscal quarter that have materially affected, or are reasonably likely to materially affect, our internal control over financial reporting.
63
Management’s Report on Internal Control over Financial Reporting
The management of MWI Veterinary Supply, Inc. and its subsidiaries (the “Company”) is responsible for establishing and maintaining effective internal control over financial reporting (as such term is defined in Exchange Act Rules 13a-15(f)).
There are inherent limitations in the effectiveness of any internal control, including the possibility of human error and the circumvention or overriding of controls. Accordingly, even effective internal control can provide only reasonable assurance with respect to financial statement preparation. Further, because of changes in conditions, the effectiveness of internal control may vary over time.
In November 2013, the Company acquired substantially all of the assets of IVESCO Holdings, LLC (“IVESCO”), a value-added distributor of animal health and related products to veterinarians, food animal producers and dealers in the United States, and in September 2014, the Company acquired the outstanding share capital of VetSpace Limited and certain of its affiliates (collectively, “VetSpace”), a provider of practice management software to veterinary practices, principally in the United Kingdom. For purposes of determining the effectiveness of our internal control over financial reporting as of September 30, 2014, and any change in our internal control over financial report for the fiscal fourth quarter of 2014, management has excluded the internal control over financial reporting of IVESCO and VetSpace from its evaluation of these matters. Our consolidated financial statements as of and for the year ended September 30, 2014, include approximately $62 million in assets (including intangibles and goodwill) or 6% of our total assets, and approximately $404 million of revenue or 14% of our total revenues, associated with IVESCO and VetSpace, combined.
Management assessed the effectiveness of the Company’s internal control over financial reporting excluding the recently completed acquisitions of IVESCO and VetSpace as of September 30, 2014. This assessment was based on criteria for effective internal control over financial reporting described in “Internal Control – Integrated Framework (1992),” issued by the Committee of Sponsoring Organizations of the Treadway Commission. Based on this assessment, management believes that, as of September 30, 2014, internal control over financial reporting was effective to provide reasonable assurance regarding the reliability of financial reporting and the preparation of financial statements in accordance with U.S. generally accepted accounting principles.
The effectiveness of the Company’s internal control over financial reporting has been audited by Deloitte & Touche LLP, an independent registered public accounting firm, in accordance with the standards of the Public Company Accounting Oversight Board (United States). Their report is included herein.
64
REPORT OF INDEPENDENT REGISTERED PUBLIC ACCOUNTING FIRM
To the Board of Directors and Stockholders of
MWI Veterinary Supply, Inc.
Boise, Idaho
We have audited the internal control over financial reporting of MWI Veterinary Supply, Inc. and subsidiaries (the "Company") as of September 30, 2014, based on Internal Control — Integrated Framework (1992) issued by the Committee of Sponsoring Organizations of the Treadway Commission. As described in Management’s Report on Internal Control over Financial Reporting management excluded from its assessment the internal control over financial reporting at IVESCO Holdings, LLC (“IVESCO”), which was acquired on November 1, 2013 and VetSpace Limited and certain of its affiliates (collectively, “VetSpace”), which was acquired on September 2, 2014 whose combined financial statements constitute approximately 6% of total assets and 14% of revenues of the consolidated financial statement amounts as of and for the year ended September 30, 2014. Accordingly, our audit did not include the internal control over financial reporting at IVESCO, or VetSpace. The Company's management is responsible for maintaining effective internal control over financial reporting and for its assessment of the effectiveness of internal control over financial reporting, included in the accompanying Management’s Report on Internal Control over Financial Reporting. Our responsibility is to express an opinion on the Company's internal control over financial reporting based on our audit.
We conducted our audit in accordance with the standards of the Public Company Accounting Oversight Board (United States). Those standards require that we plan and perform the audit to obtain reasonable assurance about whether effective internal control over financial reporting was maintained in all material respects. Our audit included obtaining an understanding of internal control over financial reporting, assessing the risk that a material weakness exists, testing and evaluating the design and operating effectiveness of internal control based on the assessed risk, and performing such other procedures as we considered necessary in the circumstances. We believe that our audit provides a reasonable basis for our opinion.
A company's internal control over financial reporting is a process designed by, or under the supervision of, the company's principal executive and principal financial officers, or persons performing similar functions, and effected by the company's board of directors, management, and other personnel to provide reasonable assurance regarding the reliability of financial reporting and the preparation of financial statements for external purposes in accordance with generally accepted accounting principles. A company's internal control over financial reporting includes those policies and procedures that (1) pertain to the maintenance of records that, in reasonable detail, accurately and fairly reflect the transactions and dispositions of the assets of the company; (2) provide reasonable assurance that transactions are recorded as necessary to permit preparation of financial statements in accordance with generally accepted accounting principles, and that receipts and expenditures of the company are being made only in accordance with authorizations of management and directors of the company; and (3) provide reasonable assurance regarding prevention or timely detection of unauthorized acquisition, use, or disposition of the company's assets that could have a material effect on the financial statements.
Because of the inherent limitations of internal control over financial reporting, including the possibility of collusion or improper management override of controls, material misstatements due to error or fraud may not be prevented or detected on a timely basis. Also, projections of any evaluation of the effectiveness of the internal control over financial reporting to future periods are subject to the risk that the controls may become inadequate because of changes in conditions, or that the degree of compliance with the policies or procedures may deteriorate.
In our opinion, the Company maintained, in all material respects, effective internal control over financial reporting as of September 30,2014, based on the criteria established in Internal Control — Integrated Framework (1992) issued by the Committee of Sponsoring Organizations of the Treadway Commission.
We have also audited, in accordance with the standards of the Public Company Accounting Oversight Board (United States), the consolidated financial statements and financial statement schedule as of and for the year ended September 30, 2014 of the Company and our report dated November 26, 2014 expressed an unqualified opinion on those financial statements and financial statement schedule.
/s/ DELOITTE & TOUCHE LLP
Boise, Idaho
November 26, 2014
65
None.
Item 10.Directors, Executive Officers and Corporate Governance of the Registrant.
The information regarding directors and nominees for directors of the Company, including identification of the audit committee and audit committee financial expert, is presented under the headings “Corporate Governance—Committees of the Board of Directors,” and “Election of Directors—Nominees For Directors” in the Company’s definitive proxy statement for use in connection with the 2014 Annual Meeting of Stockholders (the “Proxy Statement”) to be filed within 120 days after the end of the Company’s fiscal year ended September 30, 2014. The information contained under these headings is incorporated herein by reference. Information regarding the executive officers of the Company is included in this Annual Report on Form 10‑K under Item 1 of Part I as permitted by Instruction 3 to Item 401(b) of Regulation S-K.
The Company has adopted a code of conduct that applies to its Chief Executive Officer and Chief Financial Officer. This code of conduct is available on the Company’s Web site at www.mwivet.com. If the Company makes any amendments to this code other than technical, administrative or other non-substantive amendments, or grants any waivers, including implicit waivers, from a provision of this code to the Company’s Chief Executive Officer or Chief Financial Officer, the Company will disclose the nature of the amendment or waiver, its effective date and to whom it applies in a report on Form 8‑K filed with the SEC.
Item 11.Executive Compensation.
Information concerning executive compensation is presented under the headings “Executive Compensation” and “Compensation Committee Report” in the Proxy Statement. The information contained under these headings is incorporated herein by reference.
Item 12.Security Ownership of Certain Beneficial Owners and Management and Related Stockholder Matters.
Information with respect to security ownership of certain beneficial owners and management is set forth under the heading “Security Ownership of Certain Beneficial Owners and Directors and Officers” in the Proxy Statement. The information contained under these headings is incorporated herein by reference.
Equity Compensation Plan Information
The following table provides information as of September 30, 2014 about the common stock that may be issued under all of our existing equity compensation plans, including the 2002 Stock Plan and 2005 Stock-Based Incentive Compensation Plans. Both of these plans have been approved by our stockholders.
|
Number of securities to |
Weighted-average exercise |
Number of securities |
|||||||||||
|
Equity compensation plans approved by security holders |
11,934 | $ 17.49
|
757,588 | ||||||||||
|
Equity compensation plans not approved by security holders |
|
|
— |
|
|
|
— |
|
|
|
— |
|
|
|
Total |
|
|
11,934 |
|
|
|
$ 17.49
|
|
|
|
757,588 |
|
|
66
Item 13.Certain Relationships, Related Transactions and Director Independence.
Information concerning related transactions and director independence is presented under the heading “Certain Relationships, Related Transactions and Director Independence” in the Proxy Statement. The information contained under this heading is incorporated herein by reference.
Item 14.Principal Accountant Fees and Services.
Information concerning principal accountant fees and services is presented under the heading “Ratification of Appointment of Independent Registered Public Accounting Firm” in the Proxy Statement. The information contained under this heading is incorporated herein by reference.
Item 15.Exhibits and Financial Statement Schedules.
(a)The following documents are filed as part of this report:
1)Consolidated Financial Statements: See Index to Consolidated Financial Statements at Item 8 on page 40 of this report.
2)Financial Statement Schedule: Schedule II—Consolidated Valuation and Qualifying Accounts
3)Exhibits are incorporated herein by reference or are filed with this report as set forth in the Index to Exhibits on pages 69 through 71 hereof
MWI VETERINARY SUPPLY, INC.
SCHEDULE II—CONSOLIDATED VALUATION AND QUALIFYING ACCOUNTS
(Amounts in thousands)
|
Balance at Beginning of Period |
Charged (Credited) to Costs and Expense |
Deductions/Write-offs |
Balance at End of Period |
||||||||
|
Allowance for Doubtful Accounts: |
|||||||||||
|
Year ended September 30, 2012 |
$ |
2,579 | 661 | (494) | 2,746 | ||||||
|
Year ended September 30, 2013 |
2,746 | 449 | (734) | 2,461 | |||||||
|
Year ended September 30, 2014 |
2,461 | 619 | (134) | 2,946 | |||||||
67
Pursuant to the requirements of Section 13 or 15(d) of the Securities Exchange Act of 1934, the registrant has duly caused this report to be signed on its behalf by the undersigned, thereunto duly authorized.
|
|
Mwi Veterinary Supply, Inc. |
|
|
By: /s/ Mary Patricia B. Thompson |
|
|
Mary Patricia B. Thompson |
|
|
(Senior Vice President of Finance and Administration, Chief Financial Officer) |
|
Date: November 26, 2014 |
|
Pursuant to the requirements of the Securities Exchange Act of 1934, this report has been signed below by the following persons on behalf of the registrant and in the capacities indicated as of November 26, 2014.
|
/s/ James F. Cleary, Jr. |
|
/s/ Mary Patricia B. Thompson |
|
James F. Cleary, Jr. |
|
Mary Patricia B. Thompson |
|
/s/ Keith E. Alessi |
|
/s/ Bruce C. Bruckmann |
|
Keith E. Alessi (Director) |
|
Bruce C. Bruckmann (Director) |
|
/s/ D. Mark Durcan |
|
/s/ A. Craig Olson |
|
D. Mark. Durcan (Director) |
|
A. Craig Olson (Director) |
|
/s/ Robert N. Rebholtz |
|
/s/ William J. Robison |
|
Robert N. Rebholtz (Director) |
|
William J. Robison (Director) |
68
Index to Exhibits
Filed with the Annual Report
on Form 10‑K for the
Year Ended September 30, 2014
|
Number |
Description |
|
|
2.1 |
Asset Purchase Agreement dated September 20, 2011 by and among MWI Veterinary Supply, Inc., MWI Veterinary Supply Co. and Micro Beef Technologies, Ltd., incorporated herein by reference to Exhibit 2.2 of the Company’s Annual Report on Form 10-K, filed November 28, 2011. |
|
|
2.2 |
Asset Purchase Agreement dated August 28, 2013 by and among IVESCO Holdings LLC, AHN International LLC and MWI Veterinary Supply Co., incorporated herein by reference to Exhibit 2.2 of the Company’s Annual Report on Form 10-K, filed November 27, 2013. |
|
|
3.1 |
Form of Amended and Restated Certificate of Incorporation of MWI Veterinary Supply, Inc., incorporated herein by reference to Exhibit 3.1 of the Company’s Quarterly Report on Form 10-Q, filed August 1, 2007. |
|
|
3.2 |
Form of Amended and Restated Bylaws of MWI Veterinary Supply, Inc. |
|
|
4.1 |
Form of MWI Veterinary Supply, Inc. common stock certificate, incorporated herein by reference to Exhibit 4.1 of the Company’s Registration Statement on Form S‑1 (Reg No. 333‑124264). |
|
|
4.2 |
Registration Rights Agreement dated as of June 18, 2002 by and between MWI Holdings, Inc., Bruckmann, Rosser, Sherrill & Co. II, L.P., Agri Beef Co. and the other parties thereto, incorporated herein by reference to Exhibit 4.3 of the Company’s Registration Statement on Form S‑1 (Reg No. 333‑124264). |
|
|
4.3 |
Executive Stock Agreement dated as of June 18, 2002 by and among MWI Veterinary Supply Co., MWI Holdings, Inc. and James Cleary, incorporated herein by reference to Exhibit 4.4 of the Company’s Registration Statement on Form S‑1 (Reg No. 333‑124264).* |
|
|
4.4 |
Executive Stock Agreement dated as of June 18, 2002 by and among MWI Veterinary Supply Co., MWI Holdings, Inc. and Jeff Danielson, incorporated herein by reference to Exhibit 4.5 of the Company’s Registration Statement on Form S‑1 (Reg No. 333‑124264).* |
|
|
4.5 |
Executive Stock Agreement dated as of June 18, 2002 by and among MWI Veterinary Supply Co., MWI Holdings, Inc. and Mary Pat Thompson, incorporated herein by reference to Exhibit 4.8 of the Company’s Registration Statement on Form S‑1 (Reg No. 333‑124264).* |
|
|
4.6 |
Executive Stock Agreement dated as of June 18, 2002 by and among MWI Veterinary Supply Co., MWI Holdings, Inc. and John Ryan, incorporated herein by reference to Exhibit 4.11 of the Company’s Quarterly Report on Form 10-Q, filed February 6, 2014.* |
|
|
4.7 |
First Amendment to Executive Stock Agreement dated as of May 6, 2005 by and among MWI Veterinary Supply, Inc., MWI Veterinary Supply Co. and James F. Cleary, Jr., incorporated herein by reference to Exhibit 4.9 of the Company’s Registration Statement on Form S‑1 (Reg No. 333‑124264).* |
|
|
4.8 |
First Amendment to Executive Stock Agreement dated as of May 5, 2005 by and among MWI Veterinary Supply, Inc., MWI Veterinary Supply Co. and Jeffrey J. Danielson, incorporated herein by reference to Exhibit 4.10 of the Company’s Registration Statement on Form S‑1 (Reg No. 333‑124264).* |
|
|
4.9 |
First Amendment to Executive Stock Agreement dated as of May 6, 2005 by and among MWI Veterinary Supply, Inc., MWI Veterinary Supply Co. and Mary Patricia B. Thompson, incorporated herein by reference to Exhibit 4.13 of the Company’s Registration Statement on Form S‑1 (Reg No. 333‑124264).* |
|
|
4.10 |
First Amendment to Executive Stock Agreement dated as of May 5, 2005 by and among MWI Veterinary Supply, Inc., MWI Veterinary Supply Co. and John R. Ryan, incorporated herein by reference to Exhibit 4.12 of the Company’s Quarterly Report on Form 10-Q, filed February 5, 2014.* |
|
|
10.1 |
2002 Stock Option Plan, incorporated herein by reference to Exhibit 10.11 of the Company’s Registration Statement on Form S‑1 (Reg No. 333‑124264).* |
|
|
10.2 |
MWI Veterinary Supply, Inc. 2005 Stock-Based Incentive Compensation Plan, adopted July 27, 2005, as Amended and Restated, effective July 24, 2006, incorporated herein by reference to Exhibit 10.21 of the Company’s Current Report on Form 8-K, filed February 8, 2007.* |
|
|
10.3 |
Form of Option Letter, incorporated herein by reference to Exhibit 10.22 of the Company’s Registration Statement on Form S‑1 (Reg No. 333‑124264). |
69
|
Number |
Description |
|
|
10.4 |
Credit Agreement dated as of December 13, 2006 by and between MWI Veterinary Supply Co., as Borrower, MWI Veterinary Supply, Inc. and Memorial Pet Care, Inc. as Guarantors, Bank of America, N.A. and Wells Fargo Bank, N.A., as Lenders, incorporated herein by reference to Exhibit 10.4 of the Company’s Quarterly Report on Form 10-Q, filed February 5, 2007. |
|
|
10.5 |
MWI Veterinary Supply, Inc. 2008 Employee Stock Purchase Plan, incorporated herein by reference to Exhibit 10.3 of the Company’s Quarterly Report on Form 10-Q, filed May 1, 2008. |
|
|
10.6 |
License Agreement dated and effective July 1, 2008 between MWI Veterinary Supply Co. and American Animal Hospital Association, incorporated herein by reference to Exhibit 10.14 of the Company’s Annual Report on Form 10-K, filed November 24, 2008. † |
|
|
10.7 |
Sponsorship Letter Agreement dated June 30, 2008 between American Animal Hospital Association and MWI Veterinary Supply Co, incorporated herein by reference to Exhibit 10.15 of the Company’s Annual Report on Form 10-K, filed November 24, 2008. |
|
|
10.8 |
First Amendment to Credit Agreement dated February 8, 2010 by and among MWI Veterinary Supply, Inc., MWI Veterinary Supply Co., Memorial Pet Care, Inc., Bank of America, N.A. and Wells Fargo Bank, N.A., incorporated herein by reference to Exhibit 10.1 of the Company’s Current Report on Form 8-K filed February 12, 2010. |
|
|
10.9 |
Second Amendment to Credit Agreement dated August 10, 2010 by and among MWI Veterinary Supply, Inc., MWI Veterinary Supply Co., Memorial Pet Care, Inc., Bank of America, N.A. and Wells Fargo Bank, N.A., incorporated herein by reference to Exhibit 10.1 of the Company’s Current Report on Form 8-K filed August 13, 2010. |
|
|
10.10 |
Third Amendment to Credit Agreement dated November 1, 2011 by and among MWI Veterinary Supply, Inc., MWI Veterinary Supply Co., Memorial Pet Care, Inc., Bank of America, N.A. and Wells Fargo Bank, N.A., incorporated herein by reference to Exhibit 10.17 of the Company’s Annual Report on Form 10-K, filed November 28, 2011. |
|
|
10.11 |
Fourth Amendment to Credit Agreement dated March 15, 2013 by and among MWI Veterinary Supply, Inc., MWI Veterinary Supply Co., Memorial Pet Care, Inc., Bank of America, N.A. and Wells Fargo Bank, N.A., incorporated herein by reference to Exhibit 10.4 of the Company’s Current Report on Form 8-K, filed March 20, 2013. |
|
|
10.12 |
Fifth Amendment to Credit Agreement dated February 3, 2014 by and among MWI Veterinary Supply, Inc., MWI Veterinary Supply Co., Memorial Pet Care, Inc., Bank of America, N.A. and Wells Fargo Bank, N.A., incorporated herein by reference to Exhibit 10.1 of the Company’s Quarterly Report on Form 10-Q, filed May 6, 2014. |
|
|
10.13 |
Amended and Restated Credit Agreement by and among MWI Veterinary Supply, Inc., MWI Veterinary Supply Co., Memorial Pet Care, Inc., Bank of America, N.A. and Wells Fargo Bank, N.A. dated October 2, 2014. |
|
|
10.14 |
Non-competition and Confidential Information Agreement dated September 20, 2011, by and between MWI Veterinary Supply Co. and Mark Shaw, incorporated herein by reference to Exhibit 10.19 of the Company’s Annual Report on Form 10-K, filed November 28, 2011. |
|
|
10.15 |
Sterling Revolving Credit Facility dated November 5, 2010 by and among Centaur Services Limited and Wells Fargo Bank, N.A., incorporated herein by reference to Exhibit 10.1 of the Company’s Current Report on Form 8-K filed November 10, 2010. |
|
|
10.16 |
First Amendment to the Sterling Revolving Credit Facility between Centaur Services Limited and Wells Fargo, N.A., London Branch dated March 15, 2013, incorporated herein by reference to Exhibit 10.1 of the Company’s Current Report on Form 8-K, filed March 20, 2013. |
|
|
10.17 |
Amended and Restated Continuing Guaranty of MWI Veterinary Supply Co. dated March 15, 2013, incorporated herein by reference to Exhibit 10.3 of the Company’s Current Report on Form 8-K, filed March 20, 2013. |
|
|
10.18 |
Overdraft Facility between Centaur Services Limited and Wells Fargo, N.A., London Branch dated March 15, 2013, incorporated herein by reference to Exhibit 10.2 of the Company’s Current Report on Form 8-K, filed March 20, 2013. |
|
|
10.19 |
Non-Disclosure and Non-Competition Agreement dated as of September 10, 2006 by and among MWI Veterinary Supply Co. and John Francis, incorporated herein by reference to Exhibit 4.1 of the Company’s Quarterly Report on Form 10-Q, filed May 6, 2010.* |
|
|
10.20 |
Non-Disclosure and Non-Competition Agreement dated as of August 26, 2011 by and among MWI Veterinary Supply Co. and Kevin W. Price, incorporated herein by reference to Exhibit 10.24 of the Company’s Annual Report on Form 10-K, filed November 28, 2011.* |
70
|
Number |
Description |
|
|
10.21 |
MWI Veterinary Supply, Inc. Annual Incentive Bonus Plan, incorporated herein by reference to Exhibit 10.5 of the Company’s Quarterly Report on Form 10-Q, filed May 2, 2013.* |
|
|
10.22 |
Non-Exclusive Distributor Agreement by and between MWI Veterinary Supply Co. and ABAXIS, Inc. effective as of January 1, 2013, incorporated by reference to Exhibit 10.27 of the Company’s Annual Report on Form 10-K, filed November 27, 2012. |
|
|
10.23 |
Letter Agreement by and between MWI Veterinary Supply Co. and ABAXIS, Inc. dated as of September 28, 2012, incorporated by reference to Exhibit 10.28 of the Company’s Annual Report on Form 10-K, filed November 27, 2012. † |
|
|
10.24 |
Non-Disclosure and Non-Competition Agreement dated as of September 12, 2011 by and among MWI Veterinary Supply Co. and Alden J. Sutherland, incorporated by reference to Exhibit 10.30 of the Company’s Annual Report on Form 10-K, filed November 27, 2012.* |
|
|
10.25 |
Non-Disclosure and Non-Competition Agreement dated as of October 7, 2013 by and among MWI Veterinary Supply Co. and Jeremy Ouchley, incorporated by reference to Exhibit 10.27 of the Company’s Annual Report on Form 10-K, filed November 27, 2013.* |
|
|
21.1 |
Subsidiaries of MWI Veterinary Supply, Inc. |
|
|
23 |
Consent of Deloitte & Touche LLP |
|
|
31.1 |
Certification of the Chief Executive Officer pursuant to Section 302 of the Sarbanes-Oxley Act of 2002. |
|
|
31.2 |
Certification of the Chief Financial Officer pursuant to Section 302 of the Sarbanes-Oxley Act of 2002. |
|
|
32 |
Certification pursuant to 18 U.S.C. Section 1350, as adopted pursuant to Section 906 of the Sarbanes-Oxley Act of 2002. |
|
|
101 |
Financial Statements in XBRL Format |
*Identifies management contracts or compensatory plans or arrangements required to be filed as an exhibit hereto.
†Certain portions of the exhibit have been omitted pursuant to a confidential treatment request submitted to and approved by the SEC.
71