Attached files
| file | filename |
|---|---|
| 8-K - 8-K - Wesco Aircraft Holdings, Inc | a14-24875_18k.htm |
| EX-10.1 - EX-10.1 - Wesco Aircraft Holdings, Inc | a14-24875_1ex10d1.htm |
| EX-99.3 - EX-99.3 - Wesco Aircraft Holdings, Inc | a14-24875_1ex99d3.htm |
| EX-99.1 - EX-99.1 - Wesco Aircraft Holdings, Inc | a14-24875_1ex99d1.htm |
Exhibit 99.2
|
|
Fiscal 2014 Fourth Quarter and Year-End Earnings Conference Call November 20, 2014 |
|
|
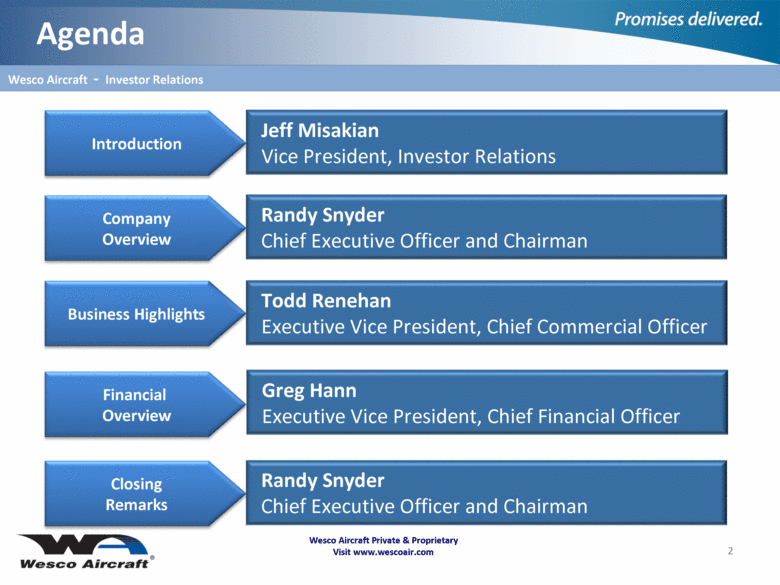
Wesco Aircraft Private & Proprietary Visit www.wescoair.com Agenda Company Overview Business Highlights Financial Overview Closing Remarks Jeff Misakian Vice President, Investor Relations Randy Snyder Chief Executive Officer and Chairman Todd Renehan Executive Vice President, Chief Commercial Officer Greg Hann Executive Vice President, Chief Financial Officer 2 Wesco Aircraft - Investor Relations Randy Snyder Chief Executive Officer and Chairman |
|
|
Wesco Aircraft Private & Proprietary Visit www.wescoair.com Disclaimer This presentation contains forward-looking statements (including within the meaning of the Private Securities Litigation Reform Act of 1995) concerning Wesco Aircraft Holdings, Inc. (“Wesco Aircraft “ or the “Company”) and other matters. These statements may discuss goals, intentions and expectations as to future plans, trends, events, results of operations or financial condition, or otherwise, based on current beliefs of management, as well as assumptions made by, and information currently available to, such management. Forward-looking statements may be accompanied by words such as “aim,” “anticipate,” “believe,” “plan,” “could,” “would,” “should,” “estimate,” “expect,” “forecast,” “future,” “guidance,” “intend,” “may,” “will,” “possible,” “potential,” “predict,” “project” or similar words, phrases or expressions. These forward-looking statements are subject to various risks and uncertainties, many of which are outside the Company’s control. Therefore, you should not place undue reliance on such statements. Factors that could cause actual results to differ materially from those in the forward-looking statements include: general economic and industry conditions; conditions in the credit markets; changes in military spending; risks unique to suppliers of equipment and services to the U.S. government; risks associated with the Company’s long-term, fixed-price agreements that have no guarantee of future sales volumes; risks associated with the loss of significant customers, a material reduction in purchase orders by significant customers or the delay, scaling back or elimination of significant programs on which the Company relies; the Company’s ability to effectively manage its inventory; the Company’s ability to successfully integrate the acquired business of Haas Group Inc. in a timely fashion; failure to realize anticipated benefits of the combined operations; risks relating to unanticipated costs of integration; risks associated with the Company’s rapid expansion; the Company’s suppliers’ ability to provide it with the products the Company sells in a timely manner, in adequate quantities and/or at a reasonable cost; the Company’s ability to maintain effective information technology systems; the Company’s ability to retain key personnel; risks associated with the Company’s international operations; fluctuations in the Company’s financial results from period-to-period; risks associated with assumptions the Company makes in connection with its critical accounting estimates and legal proceedings; the Company’s ability to effectively compete in its industry; environmental risks; risks related to the handling, transportation and storage of chemical products; the Company’s dependence on third-party package delivery companies; risks related to the aerospace industry and the regulation thereof; risks related to the Company’s indebtedness; and other risks and uncertainties. The foregoing list of factors is not exhaustive. You should carefully consider the foregoing factors and the other risks and uncertainties that affect the Company’s business, including those described in the Company’s Annual Report on Form 10-K, Quarterly Reports on Form 10-Q, Current Reports on Form 8-K and other documents filed from time to time with the Securities and Exchange Commission. All forward-looking statements included in this presentation (including information included or incorporated by reference herein) are based upon information available to the Company as of the date hereof, and the Company undertakes no obligation to update or revise publicly any forward-looking statements, whether as a result of new information, future events or otherwise. The Company utilizes and discusses Adjusted Net Income, Adjusted Basic EPS, Adjusted Diluted EPS, Adjusted EBITDA and organic sales, which are non-GAAP measures its management uses to evaluate its business, because the Company believes they assist investors and analysts in comparing its performance across reporting periods on a consistent basis by excluding items that the Company does not believe are indicative of its core operating performance. The Company believes these metrics are used in the financial community, and the Company presents these metrics to enhance investors’ understanding of its operating performance. You should not consider Adjusted EBITDA and Adjusted Net Income as an alternative to Net Income, determined in accordance with GAAP, as an indicator of operating performance. Adjusted Net Income, Adjusted Basic EPS, Adjusted Diluted EPS, Adjusted EBITDA and organic sales are not measurements of financial performance under GAAP, and these metrics may not be comparable to similarly titled measures of other companies. See the Appendix for a reconciliation of Adjusted Net Income, Adjusted Basic EPS, Adjusted Diluted EPS and Adjusted EBITDA to the most directly comparable financial measures calculated and presented in accordance with GAAP. 3 Wesco Aircraft - Investor Relations |
|
|
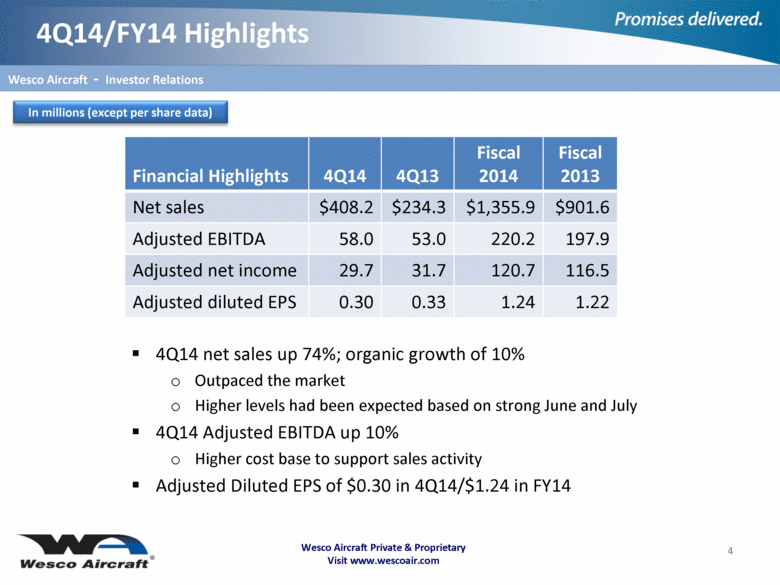
Wesco Aircraft Private & Proprietary Visit www.wescoair.com 4Q14/FY14 Highlights 4 Wesco Aircraft - Investor Relations Financial Highlights 4Q14 4Q13 Fiscal 2014 Fiscal 2013 Net sales $408.2 $234.3 $1,355.9 $901.6 Adjusted EBITDA 58.0 53.0 220.2 197.9 Adjusted net income 29.7 31.7 120.7 116.5 Adjusted diluted EPS 0.30 0.33 1.24 1.22 In millions (except per share data) 4Q14 net sales up 74%; organic growth of 10% Outpaced the market Higher levels had been expected based on strong June and July 4Q14 Adjusted EBITDA up 10% Higher cost base to support sales activity Adjusted Diluted EPS of $0.30 in 4Q14/$1.24 in FY14 |
|
|
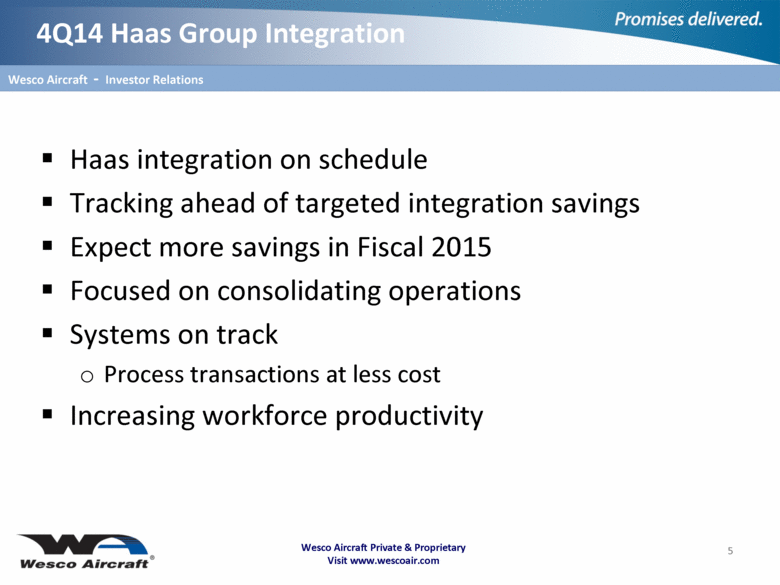
Haas integration on schedule Tracking ahead of targeted integration savings Expect more savings in Fiscal 2015 Focused on consolidating operations Systems on track Process transactions at less cost Increasing workforce productivity Wesco Aircraft Private & Proprietary Visit www.wescoair.com 4Q14 Haas Group Integration 5 Wesco Aircraft - Investor Relations |
|
|
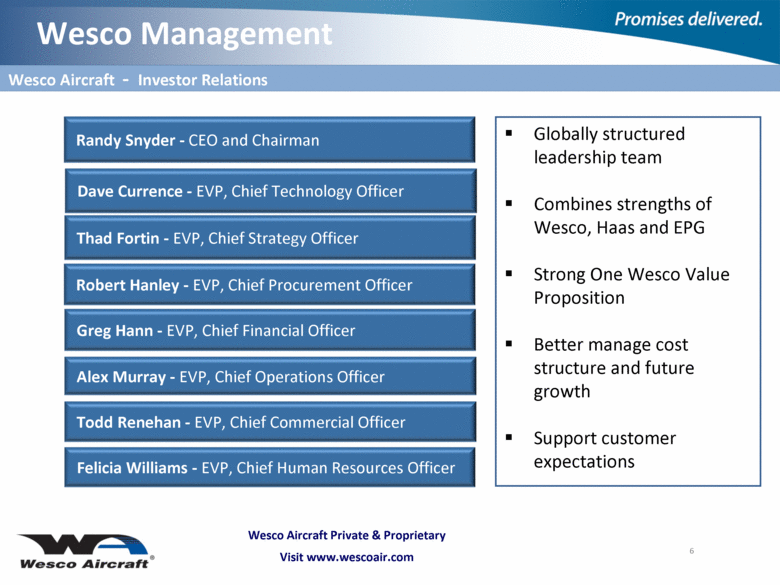
Wesco Aircraft Private & Proprietary Visit www.wescoair.com Wesco Management 6 Wesco Aircraft - Investor Relations Alex Murray - EVP, Chief Operations Officer Thad Fortin - EVP, Chief Strategy Officer Todd Renehan - EVP, Chief Commercial Officer Dave Currence - EVP, Chief Technology Officer Felicia Williams - EVP, Chief Human Resources Officer Randy Snyder - CEO and Chairman Greg Hann - EVP, Chief Financial Officer Robert Hanley - EVP, Chief Procurement Officer Globally structured leadership team Combines strengths of Wesco, Haas and EPG Strong One Wesco Value Proposition Better manage cost structure and future growth Support customer expectations |
|
|
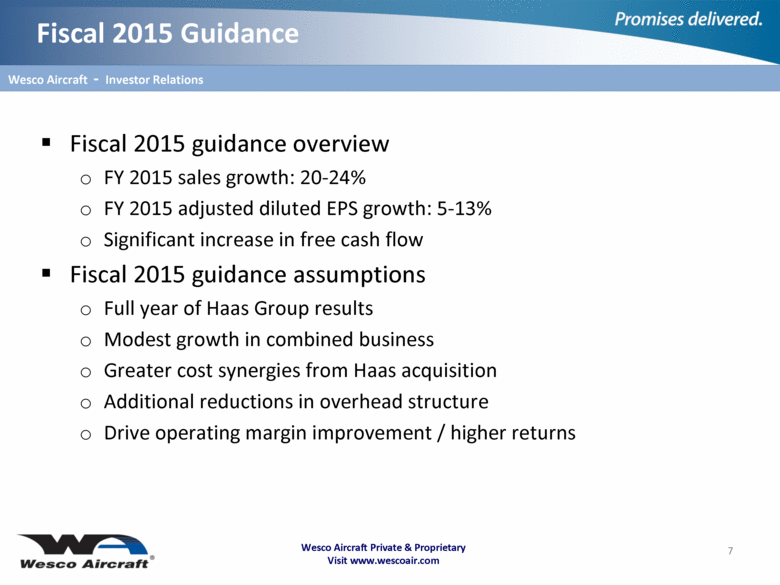
Fiscal 2015 guidance overview FY 2015 sales growth: 20-24% FY 2015 adjusted diluted EPS growth: 5-13% Significant increase in free cash flow Fiscal 2015 guidance assumptions Full year of Haas Group results Modest growth in combined business Greater cost synergies from Haas acquisition Additional reductions in overhead structure Drive operating margin improvement / higher returns Wesco Aircraft Private & Proprietary Visit www.wescoair.com Fiscal 2015 Guidance 7 Wesco Aircraft - Investor Relations |
|
|
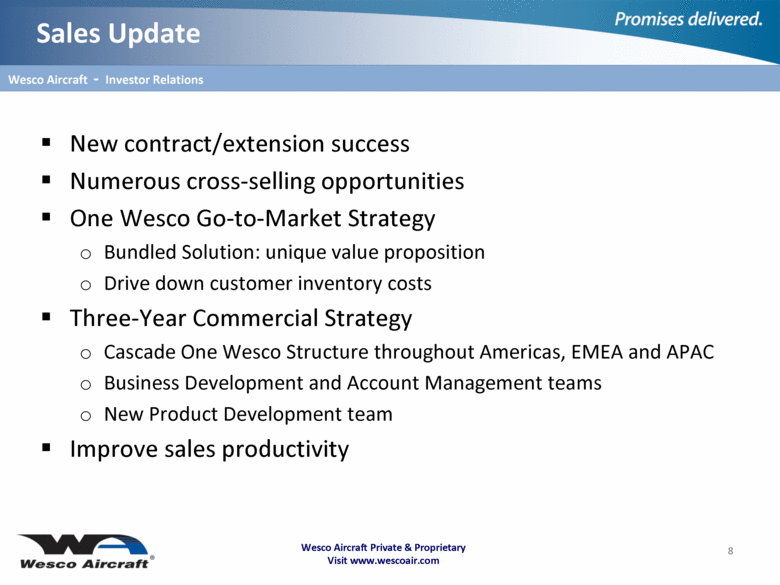
New contract/extension success Numerous cross-selling opportunities One Wesco Go-to-Market Strategy Bundled Solution: unique value proposition Drive down customer inventory costs Three-Year Commercial Strategy Cascade One Wesco Structure throughout Americas, EMEA and APAC Business Development and Account Management teams New Product Development team Improve sales productivity Wesco Aircraft Private & Proprietary Visit www.wescoair.com Sales Update 8 Wesco Aircraft - Investor Relations |
|
|
* Fiscal 2014 data include acquisition of Haas Group Inc. Sales growth driven by Haas, new business, ramp-up of recent contracts, and scope expansion Ad hoc/contract mix change reflects Haas, international growth, and ongoing contract emphasis Adjusted EBITDA growth: addition of Haas, partially offset by lower margins 4Q Adjusted Diluted EPS of $0.30 vs. $0.33 Wesco Aircraft Private & Proprietary Visit www.wescoair.com 4Q/FY14 Financial Results Sales ($M) * Adjusted EBITDA ($M) * 9 Mix * Adjusted Diluted EPS * Wesco Aircraft - Investor Relations |
|
|
Wesco Aircraft Private & Proprietary Visit www.wescoair.com 4Q/FY14 Segments: North America Sales ($M) * Adjusted EBITDA ($M) * 10 Mix * Wesco Aircraft - Investor Relations * Fiscal 2014 data include acquisition of Haas Group Inc. Sales increase of 72% for 4Q14; organic growth of 11% Sales driven by Haas, new business, ramp-up of recent contracts, and scope expansion Ad hoc/contract mix change reflects Haas; ongoing contract emphasis Adjusted EBITDA growth of 8%: addition of Haas, partially offset by lower margins |
|
|
Wesco Aircraft Private & Proprietary Visit www.wescoair.com 4Q/FY14 Segments: Rest of World Sales ($M) * Adjusted EBITDA ($M) * 11 Mix * Wesco Aircraft - Investor Relations * Fiscal 2014 data include acquisition of Haas Group Inc. Sales increase of 83% in 4Q14; organic growth of 7% Sales driven by Haas, new business, ramp-up of recent contracts, and scope expansion International sales have higher proportion of contact business Adjusted EBITDA growth of 14%: addition of Haas, partially offset by lower margins |
|
|
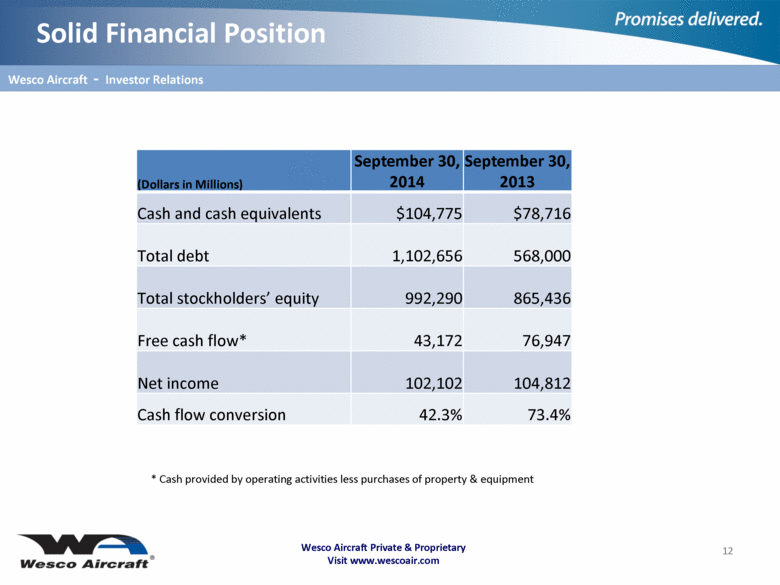
Wesco Aircraft Private & Proprietary Visit www.wescoair.com Solid Financial Position 12 Wesco Aircraft - Investor Relations (Dollars in Millions) September 30, 2014 September 30, 2013 Cash and cash equivalents $104,775 $78,716 Total debt 1,102,656 568,000 Total stockholders’ equity 992,290 865,436 Free cash flow* 43,172 76,947 Net income 102,102 104,812 Cash flow conversion 42.3% 73.4% * Cash provided by operating activities less purchases of property & equipment |
|
|
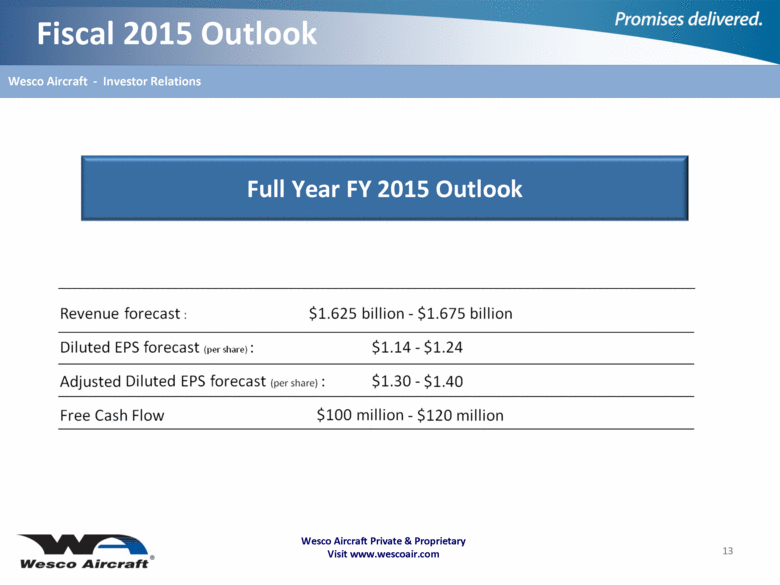
Wesco Aircraft Private & Proprietary Visit www.wescoair.com Fiscal 2015 Outlook Full Year FY 2015 Outlook 13 Wesco Aircraft - Investor Relations Revenue forecast: $1.625 billion - $1.675 billion Diluted EPS forecast (per share): $1.14 - $1.24 Adjusted Diluted EPS forecast (per share): $1.30 - $1.40 Free Cash Flow $100 million - $120 million |
|
|
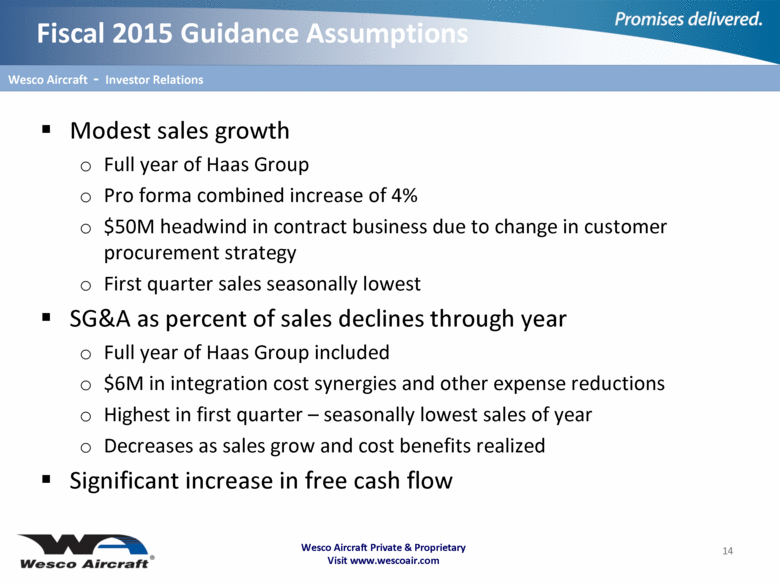
Modest sales growth Full year of Haas Group Pro forma combined increase of 4% $50M headwind in contract business due to change in customer procurement strategy First quarter sales seasonally lowest SG&A as percent of sales declines through year Full year of Haas Group included $6M in integration cost synergies and other expense reductions Highest in first quarter – seasonally lowest sales of year Decreases as sales grow and cost benefits realized Significant increase in free cash flow Wesco Aircraft Private & Proprietary Visit www.wescoair.com Fiscal 2015 Guidance Assumptions 14 Wesco Aircraft - Investor Relations |
|
|
Significant accomplishments in fiscal 2014 Vision: Offer customers more products at competitive price Eliminating customer internal cost of transactions Unique combination of products/services Single Voice: One Wesco Offering Deliver distinctive solution Drive down customer inventory/transaction costs Customers can focus on core business Greater focus on profit margins and tighter balance sheet Finish fiscal 2015 with improved cost structure and margin profile Wesco Aircraft Private & Proprietary Visit www.wescoair.com Closing Remarks 15 Wesco Aircraft - Investor Relations |
|
|
Wesco Aircraft Private & Proprietary Visit www.wescoair.com APPENDIX 16 |
|
|
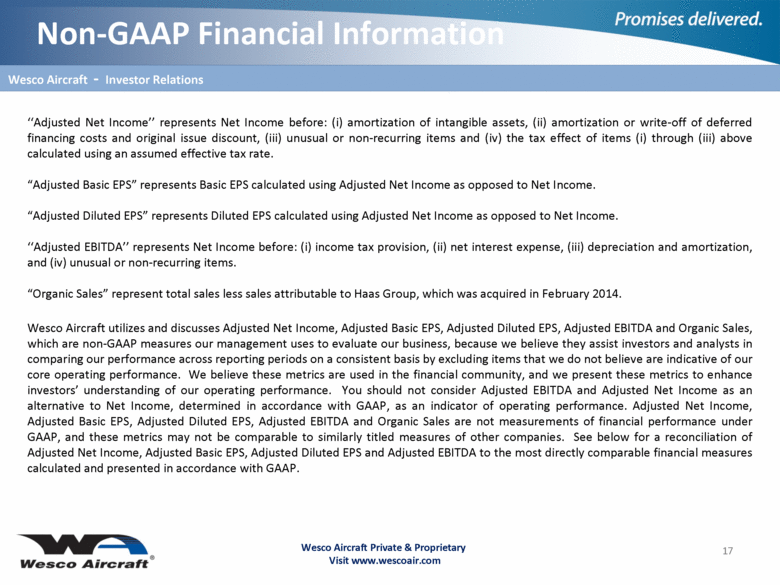
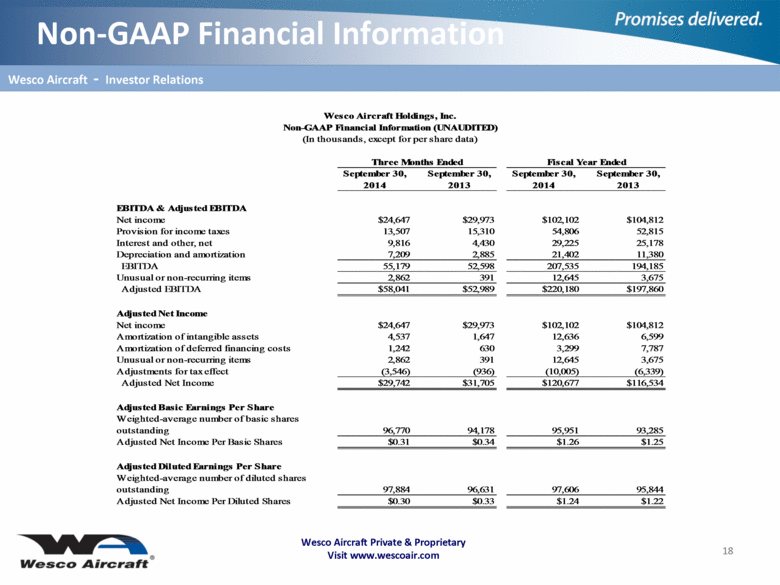
Wesco Aircraft Private & Proprietary Visit www.wescoair.com Non-GAAP Financial Information ‘‘Adjusted Net Income’’ represents Net Income before: (i) amortization of intangible assets, (ii) amortization or write-off of deferred financing costs and original issue discount, (iii) unusual or non-recurring items and (iv) the tax effect of items (i) through (iii) above calculated using an assumed effective tax rate. “Adjusted Basic EPS” represents Basic EPS calculated using Adjusted Net Income as opposed to Net Income. “Adjusted Diluted EPS” represents Diluted EPS calculated using Adjusted Net Income as opposed to Net Income. ‘‘Adjusted EBITDA’’ represents Net Income before: (i) income tax provision, (ii) net interest expense, (iii) depreciation and amortization, and (iv) unusual or non-recurring items. “Organic Sales” represent total sales less sales attributable to Haas Group, which was acquired in February 2014. Wesco Aircraft utilizes and discusses Adjusted Net Income, Adjusted Basic EPS, Adjusted Diluted EPS, Adjusted EBITDA and Organic Sales, which are non-GAAP measures our management uses to evaluate our business, because we believe they assist investors and analysts in comparing our performance across reporting periods on a consistent basis by excluding items that we do not believe are indicative of our core operating performance. We believe these metrics are used in the financial community, and we present these metrics to enhance investors’ understanding of our operating performance. You should not consider Adjusted EBITDA and Adjusted Net Income as an alternative to Net Income, determined in accordance with GAAP, as an indicator of operating performance. Adjusted Net Income, Adjusted Basic EPS, Adjusted Diluted EPS, Adjusted EBITDA and Organic Sales are not measurements of financial performance under GAAP, and these metrics may not be comparable to similarly titled measures of other companies. See below for a reconciliation of Adjusted Net Income, Adjusted Basic EPS, Adjusted Diluted EPS and Adjusted EBITDA to the most directly comparable financial measures calculated and presented in accordance with GAAP. 17 Wesco Aircraft - Investor Relations |
|
|
Wesco Aircraft Private & Proprietary Visit www.wescoair.com Non-GAAP Financial Information 18 Wesco Aircraft - Investor Relations September 30, 2014 September 30, 2013 September 30, 2014 September 30, 2013 EBITDA & Adjusted EBITDA Net income $24,647 $29,973 $102,102 $104,812 Provision for income taxes 13,507 15,310 54,806 52,815 Interest and other, net 9,816 4,430 29,225 25,178 Depreciation and amortization 7,209 2,885 21,402 11,380 EBITDA 55,179 52,598 207,535 194,185 Unusual or non-recurring items 2,862 391 12,645 3,675 Adjusted EBITDA $58,041 $52,989 $220,180 $197,860 Adjusted Net Income Net income $24,647 $29,973 $102,102 $104,812 Amortization of intangible assets 4,537 1,647 12,636 6,599 Amortization of deferred financing costs 1,242 630 3,299 7,787 Unusual or non-recurring items 2,862 391 12,645 3,675 Adjustments for tax effect (3,546) (936) (10,005) (6,339) Adjusted Net Income $29,742 $31,705 $120,677 $116,534 Adjusted Basic Earnings Per Share Weighted-average number of basic shares outstanding 96,770 94,178 95,951 93,285 Adjusted Net Income Per Basic Shares $0.31 $0.34 $1.26 $1.25 Adjusted Diluted Earnings Per Share Weighted-average number of diluted shares outstanding 97,884 96,631 97,606 95,844 Adjusted Net Income Per Diluted Shares $0.30 $0.33 $1.24 $1.22 Wesco Aircraft Holdings, Inc. Non-GAAP Financial Information (UNAUDITED) (In thousands, except for per share data) Three Months Ended Fiscal Year Ended |

