Attached files
| file | filename |
|---|---|
| 8-K - FORM 8-K - United Financial Bancorp, Inc. | d818707d8k.htm |
Exhibit 99.1
Create Your Balance
NASDAQ Global Select Market: UBNK Third Quarter 2014
Forward Looking Statements
This Presentation contains forward-looking statements that are within the meaning of the Private Securities Litigation Reform Act of 1995. Such statements are based upon the current beliefs and expectations of our management and are subject to significant risks and uncertainties. These risks and uncertainties could cause our results to differ materially from those set forth in such forward-looking statements. Forward-looking statements can be identified by the fact that they do not relate strictly to historical or current facts. Words such as “believes,” “anticipates,” “expects,” “intends,” “plans,” “estimates,” “targeted” and similar expressions, and future or conditional verbs, such as “will,” “would,” “should,” “could” or “may” are intended to identify forward-looking statements but are not the only means to identify these statements. Forward-looking statements involve risks and uncertainties. Actual conditions, events or results may differ materially from those contemplated by a forward-looking statement. Factors that could cause this difference — many of which are beyond our control — include without limitation the following: Any forward-looking statements made by or on behalf of us in this Presentation speak only as of the date of this Presentation. We do not undertake to update forward-looking statements to reflect the impact of circumstances or events that arise after the date the forward-looking statement was made. The reader should; however, consult any further disclosures of a forward-looking nature we may make in future filings.
With regard to presentations compared to peer institutions, the peer companies include: BHLB, BRKL, CBU, CUBI, DCOM, FCF, FFIC, IBCP, NPBC, NBTB, NWBI, PFS, STBA, STL, TMP, and TRST. The data presented in this presentation relating to the peer companies is based on the calendar year. Data for peers is sourced from SNL Financial LLC.
NON-GAAP FINANCIAL MEASURES
This presentation references non-GAAP financial measures incorporating tangible equity and related measures, and operating earnings excluding non-recurring costs. These measures are commonly used by investors in evaluating financial condition. GAAP earnings are lower than core earnings primarily due to non-recurring conversion, balance sheet restructuring and cost cutting initiative related expenses. Reconciliations are in earnings releases at www.unitedfinancialinc.com.
| 2 |
|
NASDAQ: UBNK
Corporate Contacts
William H. W. Crawford, IV Chief Executive Officer
Eric R. Newell, CFA
Executive Vice President, Chief Financial Officer
David C. Paulson
Executive Vice President, Head of Wholesale Banking
Brandon C. Lorey
Executive Vice President, Head of Consumer Lending
Investor Information: Marliese L. Shaw
Executive Vice President, Corporate Secretary/Investor Relations Officer 860-291-3622 or mshaw@bankatunited.com
NASDAQ: UBNK
Table of Contents
Page
Management Team 5 Branch Franchise 6 Balance Sheet Trends 7
Balance Sheet Summary 8
Deposit Market Share 10 How United Creates Value 11 Potential Upside From Improved ROE 12 2015 Priorities 13 Appendix 18
4
NASDAQ: UBNK
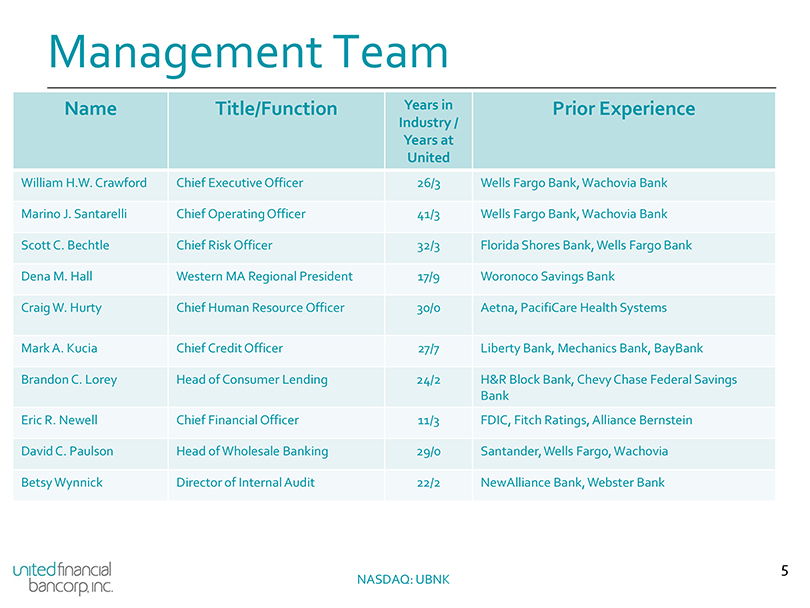
Management Team
Name Title/Function Years in Prior Experience
Industry / Years at United
William H.W. Crawford Chief Executive Officer 26/3 Wells Fargo Bank, Wachovia Bank Marino J. Santarelli Chief Operating Officer 41/3 Wells Fargo Bank, Wachovia Bank Scott C. Bechtle Chief Risk Officer 32/3 Florida Shores Bank, Wells Fargo Bank Dena M. Hall Western MA Regional President 17/9 Woronoco Savings Bank Craig W. Hurty Chief Human Resource Officer 30/0 Aetna, PacifiCare Health Systems Mark A. Kucia Chief Credit Officer 27/7 Liberty Bank, Mechanics Bank, BayBank
Brandon C. Lorey Head of Consumer Lending 24/2 H&R Block Bank, Chevy Chase Federal Savings Bank
Eric R. Newell Chief Financial Officer 11/3 FDIC, Fitch Ratings, Alliance Bernstein David C. Paulson Head of Wholesale Banking 29/0 Santander, Wells Fargo, Wachovia Betsy Wynnick Director of Internal Audit 22/2 NewAlliance Bank, Webster Bank
NASDAQ: UBNK
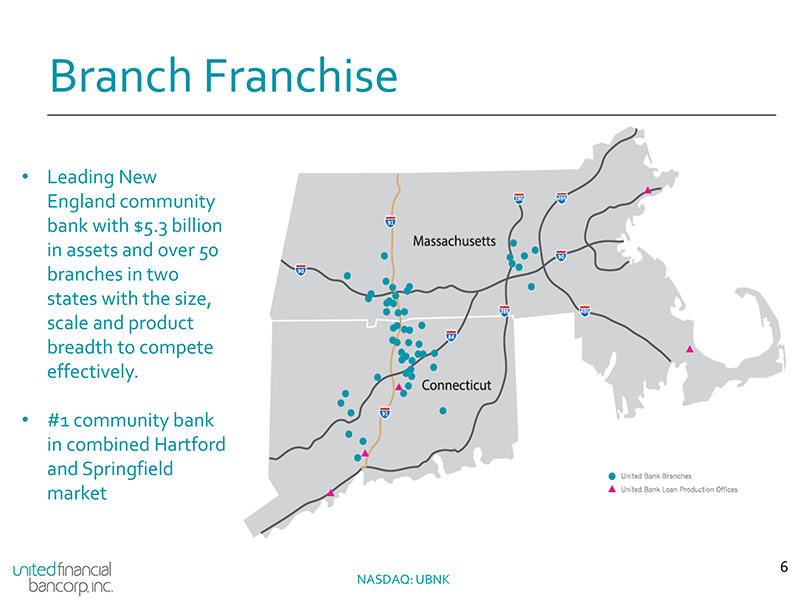
Branch Franchise
Leading New England community bank with $5.3 billion in assets and over 50 branches in two states with the size, scale and product breadth to compete effectively.
#1 community bank in combined Hartford and Springfield market
NASDAQ: UBNK
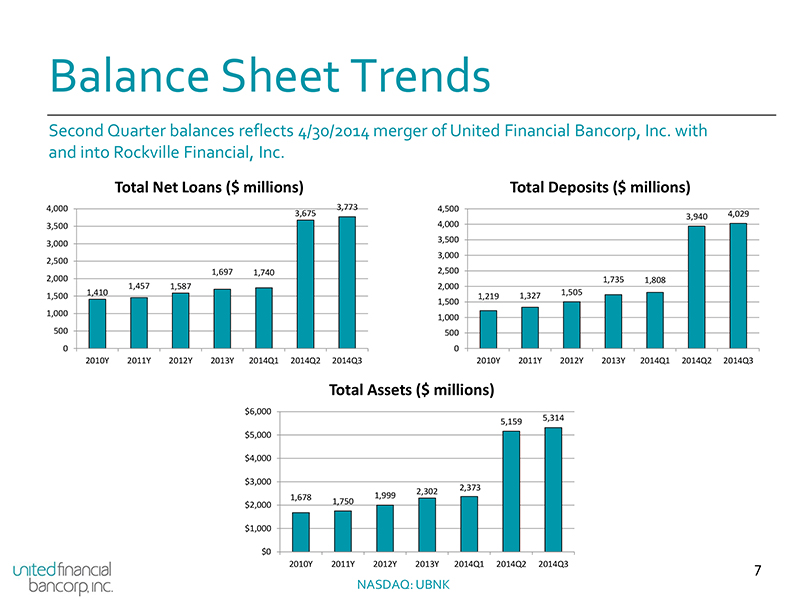
Balance Sheet Trends
Second Quarter balances reflects 4/30/2014 merger of United Financial Bancorp, Inc. with and into Rockville Financial, Inc.
Total Net Loans ($ millions) Total Deposits ($ millions)
4,000 3,773 4,500
3,675 3,940 4,029 3,500 4,000 3,500 3,000 3,000 2,500 1,697 1,740 2,500 2,000 1,735 1,808 1,457 1,587 2,000 1,410 1,505 1,500 1,219 1,327 1,500 1,000 1,000 500 500
0 0
2010Y 2011Y 2012Y 2013Y 2014Q1 2014Q2 2014Q3 2010Y 2011Y 2012Y 2013Y 2014Q1 2014Q2 2014Q3
Total Assets ($ millions)
$6,000 5,314 5,159 $5,000
$4,000
$3,000
2,373 2,302 1,678 1,999 1,750 $2,000
$1,000
$0
2010Y 2011Y 2012Y 2013Y 2014Q1 2014Q2 2014Q3 7
NASDAQ: UBNK
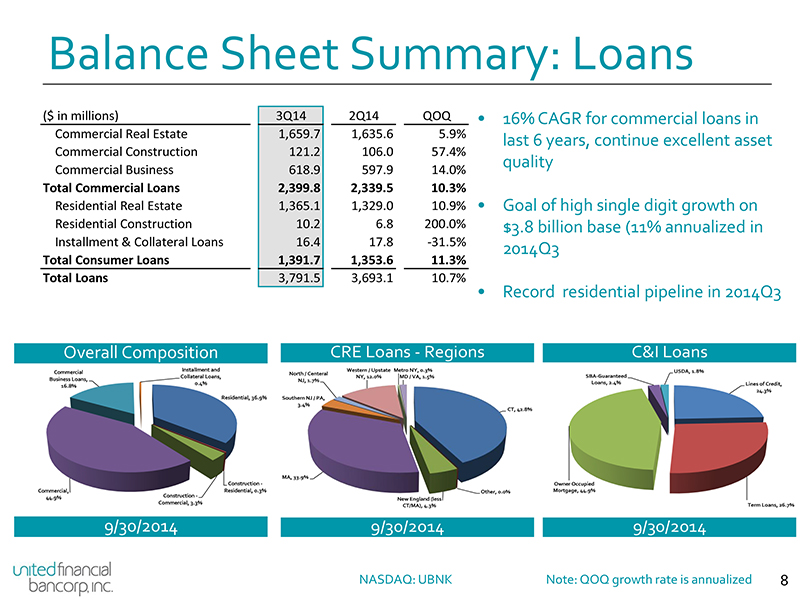
Balance Sheet Summary: Loans
($ in millions) 3Q14 2Q14 QOQ • 16% CAGR for commercial loans in
Commercial Real Estate 1,659.7 1,635.6 5.9% last 6 years, continue excellent asset Commercial Construction 121.2 106.0 57.4%
quality
Commercial Business 618.9 597.9 14.0%
Total Commercial Loans 2,399.8 2,339.5 10.3%
Residential Real Estate 1,365.1 1,329.0 10.9% • Goal of high single digit growth on Residential Construction 10.2 6.8 200.0% $3.8 billion base (11% annualized in Installment & Collateral Loans 16.4 17.8 -31.5% 2014Q3
Total Consumer Loans 1,391.7 1,353.6 11.3% Total Loans 3,791.5 3,693.1 10.7%
Record residential pipeline in 2014Q3
Loans—Regions C&I Loans
Upstate Metro NY, 0.3% USDA, 1.8% .0% MD / VA, 1.5% SBA-Guaranteed
Loans, 2.4% Lines of Credit,
24.3% CT, 42.8%
Owner Occupied Other, 0.0% Mortgage, 44.9% New England (less
CT/MA), 4.3% Term Loans, 26.7%
9/30/2014 9/30/2014
NASDAQ: UBNK Note: QOQ growth rate is annualized 8
Balance Sheet Summary: Deposits
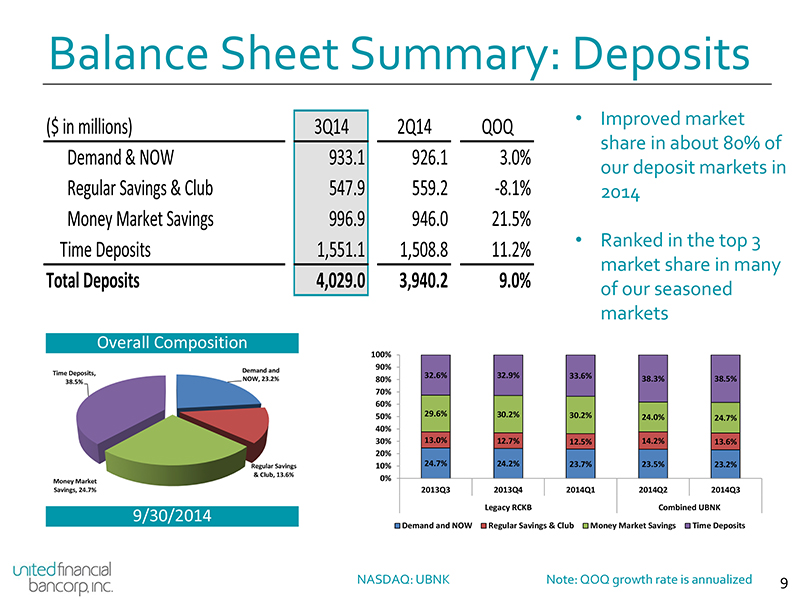
($ in millions) 3Q14 2Q14 QOQ • Improved market
share in about 80% of
Demand & NOW 933.1 926.1 3.0%
our deposit markets in
Regular Savings & Club 547.9 559.2 -8.1% 2014 Money Market Savings 996.9 946.0 21.5%
Ranked in the top 3
Time Deposits 1,551.1 1,508.8 11.2%
market share in many
Total Deposits 4,029.0 3,940.2 9.0%
of our seasoned markets
Overall Composition
100% 90%
Demand and
Time Deposits, NOW, 23.2% 32.6% 32.9% 33.6%
38.5% 80% 38.3% 38.5% 70% 60% 50% 29.6% 30.2% 30.2%
24.0% 24.7% 40% 30% 13.0% 12.7% 12.5% 14.2% 13.6% 20%
Regular Savings 10% 24.7% 24.2% 23.7% 23.5% 23.2%
& Club, 13.6% 0% Money Market
Savings, 24.7% 2013Q3 2013Q4 2014Q1 2014Q2 2014Q3
Legacy RCKB Combined UBNK
Demand and NOW Regular Savings & Club Money Market Savings Time Deposits
NASDAQ: UBNK Note: QOQ growth rate is annualized 9
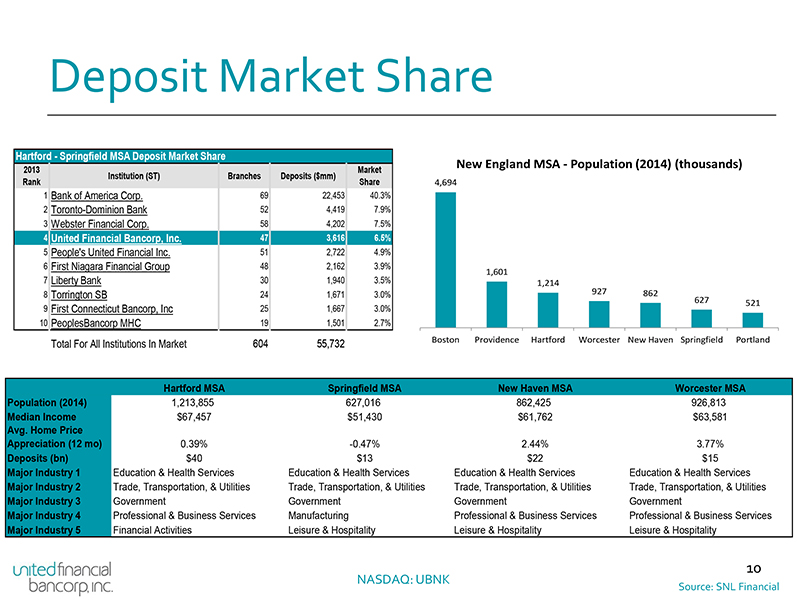
Deposit Market Share
Hartford—Springfield MSA Deposit Market Share
New England MSA—Population (2014) (thousands)
2013 Market Institution (ST) Branches Deposits ($mm)
Rank Share 4,694
1 Bank of America Corp. 69 22,453 40.3%
2 Toronto-Dominion Bank 52 4,419 7.9%
3 Webster Financial Corp. 58 4,202 7.5%
4 United Financial Bancorp, Inc. 47 3,616 6.5%
5 People’s United Financial Inc. 51 2,722 4.9%
6 First Niagara Financial Group 48 2,162 3.9%
1,601
7 Liberty Bank 30 1,940 3.5% 1,214
8 Torrington SB 24 1,671 3.0% 927 862
627 521
9 First Connecticut Bancorp, Inc 25 1,667 3.0%
10 PeoplesBancorp MHC 19 1,501 2.7%
Total For All Institutions In Market 604 55,732 Boston Providence Hartford Worcester New Haven Springfield Portland
Hartford MSA Springfield MSA New Haven MSA Worcester MSA Population (2014) 1,213,855 627,016 862,425 926,813 Median Income $67,457 $51,430 $61,762 $63,581
Avg. Home Price
Appreciation (12 mo) 0.39% -0.47% 2.44% 3.77%
Deposits (bn) $40 $13 $22 $15
Major Industry 1 Education & Health Services Education & Health Services Education & Health Services Education & Health Services Major Industry 2 Trade, Transportation, & Utilities Trade, Transportation, & Utilities Trade, Transportation, & Utilities Trade, Transportation, & Utilities Major Industry 3 Government Government Government Government Major Industry 4 Professional & Business Services Manufacturing Professional & Business Services Professional & Business Services Major Industry 5 Financial Activities Leisure & Hospitality Leisure & Hospitality Leisure & Hospitality
10
NASDAQ: UBNK
Source: SNL Financial
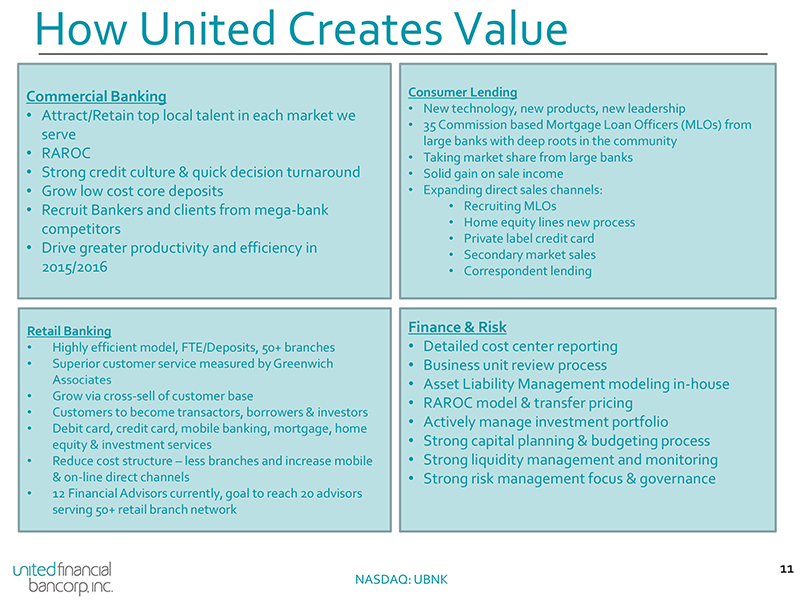
How United Creates Value
Commercial Banking Consumer Lending
New technology, new products, new leadership
Attract/Retain top local talent in each market we
35 Commission based Mortgage Loan Officers (MLOs) from
serve
large banks with deep roots in the community
RAROC Taking market share from large banks
Strong credit culture & quick decision turnaround Solid gain on sale income
Grow low cost core deposits Expanding direct sales channels:
Recruit Bankers and clients from mega-bank Recruiting MLOs
Home equity lines new process
competitors
Private label credit card
Drive greater productivity and efficiency in
Secondary market sales 2015/2016 Correspondent lending
Retail Banking Finance & Risk
Highly efficient model, FTE/Deposits, 50+ branches Detailed cost center reporting
Superior customer service measured by Greenwich Business unit review process
Associates • Asset Liability Management modeling in-house
Grow via cross-sell of customer base
RAROC model & transfer pricing
Customers to become transactors, borrowers & investors
Actively manage investment portfolio
Debit card, credit card, mobile banking, mortgage, home
equity & investment services • Strong capital planning & budgeting process
Reduce cost structure – less branches and increase mobile Strong liquidity management and monitoring
& on-line direct channels • Strong risk management focus & governance
12 Financial Advisors currently, goal to reach 20 advisors serving 50+ retail branch network
11
NASDAQ: UBNK
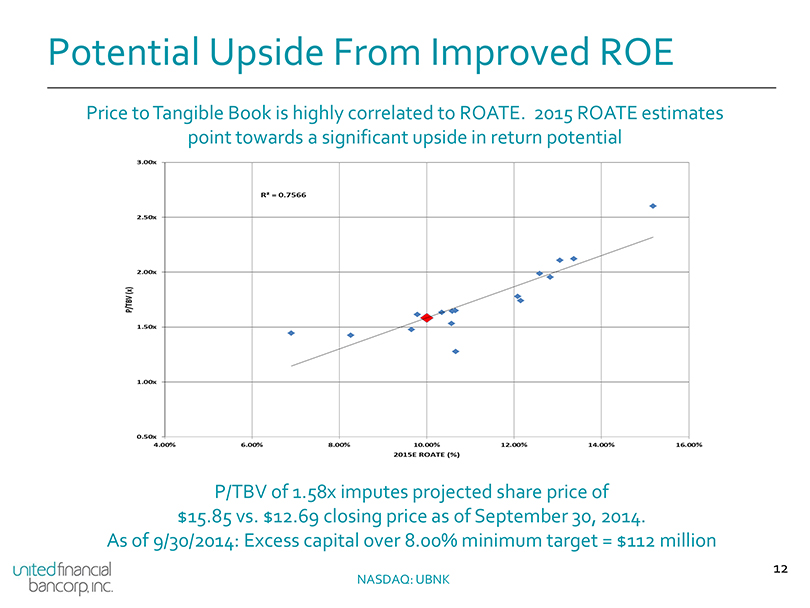
Potential Upside From Improved ROE
Price to Tangible Book is highly correlated to ROATE. 2015 ROATE estimates point towards a significant upside in return potential
P/TBV of 1.58x imputes projected share price of $15.85 vs. $12.69 closing price as of September 30, 2014.
As of 9/30/2014: Excess capital over 8.00% minimum target = $112 million
12
NASDAQ: UBNK
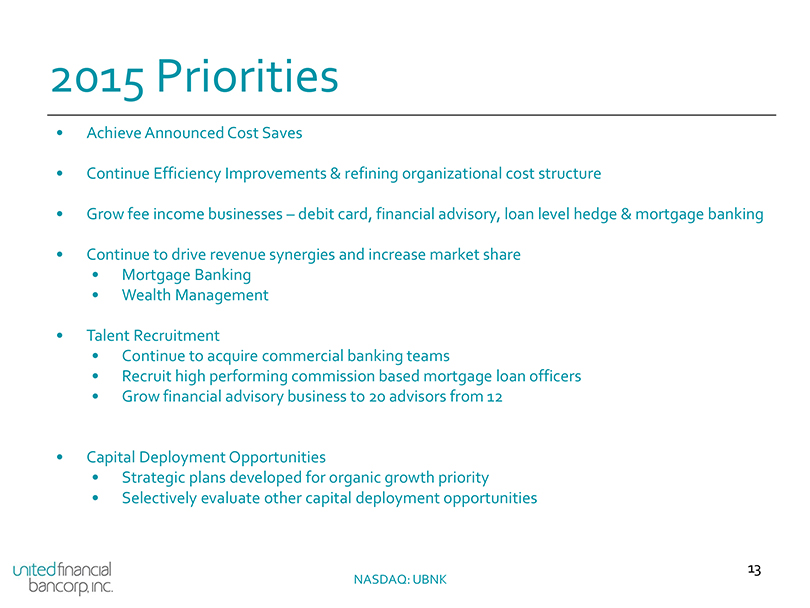
2015 Priorities
Achieve Announced Cost Saves
Continue Efficiency Improvements & refining organizational cost structure
Grow fee income businesses – debit card, financial advisory, loan level hedge & mortgage banking
Continue to drive revenue synergies and increase market share
Mortgage Banking
Wealth Management
Talent Recruitment
Continue to acquire commercial banking teams
Recruit high performing commission based mortgage loan officers
Grow financial advisory business to 20 advisors from 12
Capital Deployment Opportunities
Strategic plans developed for organic growth priority
Selectively evaluate other capital deployment opportunities
13
NASDAQ: UBNK
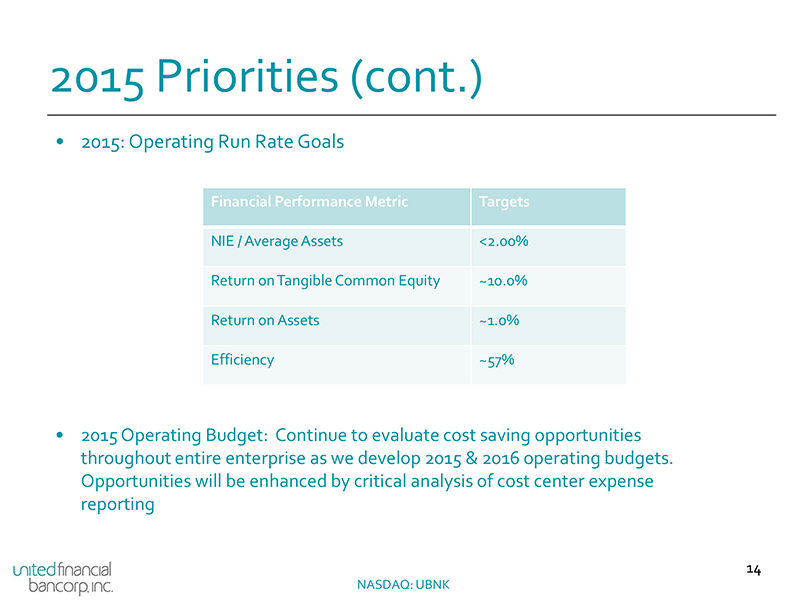
2015 Priorities (cont.)
2015: Operating Run Rate Goals
Financial Performance Metric Targets
NIE / Average Assets <2.00% Return on Tangible Common Equity ~10.0% Return on Assets ~1.0% Efficiency ~57%
2015 Operating Budget: Continue to evaluate cost saving opportunities throughout entire enterprise as we develop 2015 & 2016 operating budgets. Opportunities will be enhanced by critical analysis of cost center expense reporting
14
NASDAQ: UBNK
APPENDIX
15
NASDAQ: UBNK
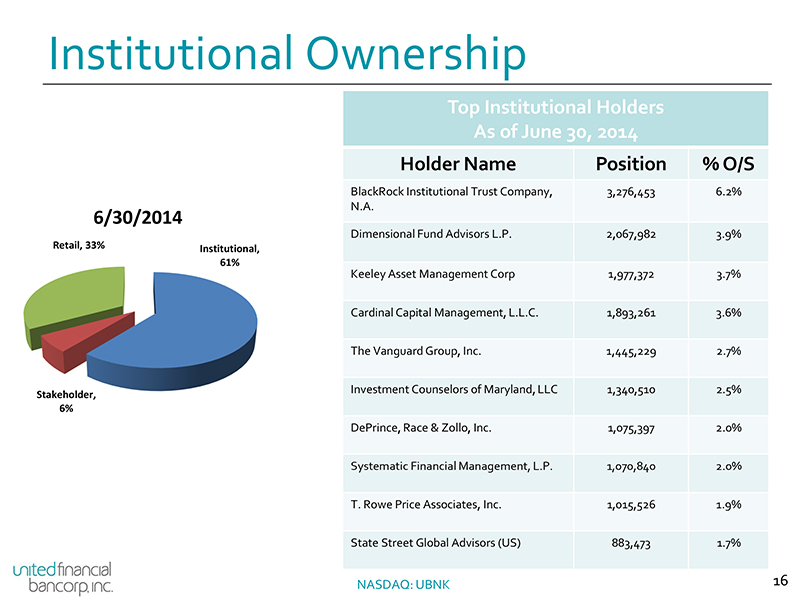
Institutional Ownership
Top Institutional Holders As of June 30, 2014
Holder Name Position % O/S
BlackRock Institutional Trust Company, 3,276,453 6.2% N.A.
6/30/2014
Dimensional Fund Advisors L.P. 2,067,982 3.9%
Retail, 33% Institutional, 61%
Keeley Asset Management Corp 1,977,372 3.7% Cardinal Capital Management, L.L.C. 1,893,261 3.6% The Vanguard Group, Inc. 1,445,229 2.7%
Investment Counselors of Maryland, LLC 1,340,510 2.5%
Stakeholder, 6%
DePrince, Race & Zollo, Inc. 1,075,397 2.0% Systematic Financial Management, L.P. 1,070,840 2.0% T. Rowe Price Associates, Inc. 1,015,526 1.9% State Street Global Advisors (US) 883,473 1.7%
NASDAQ: UBNK 16
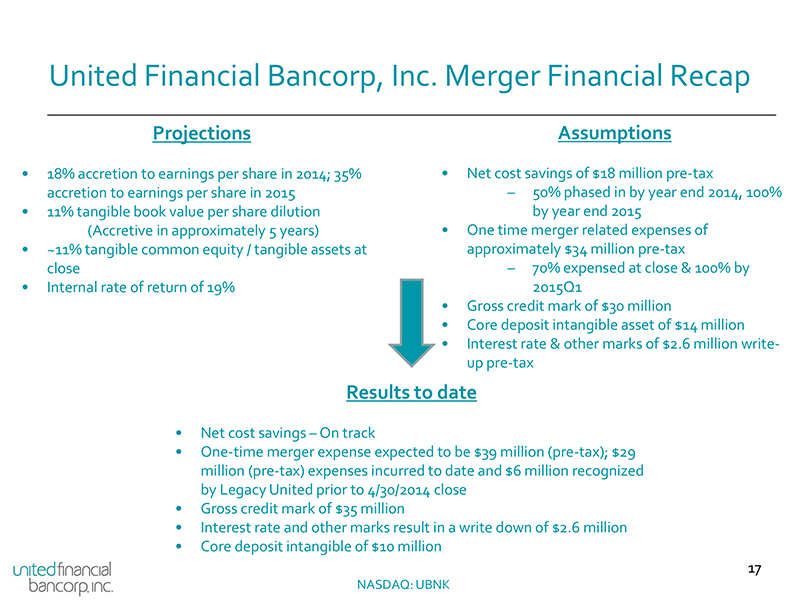
United Financial Bancorp, Inc. Merger Financial Recap
Projections Assumptions
18% accretion to earnings per share in 2014; 35% Net cost savings of $18 million pre-tax accretion to earnings per share in 2015 – 50% phased in by year end 2014, 100%
11% tangible book value per share dilution by year end 2015
(Accretive in approximately 5 years) • One time merger related expenses of
~11% tangible common equity / tangible assets at approximately $34 million pre-tax close – 70% expensed at close & 100% by
Internal rate of return of 19% 2015Q1
• Gross credit mark of $30 million
Core deposit intangible asset of $14 million
Interest rate & other marks of $2.6 million writeup pre-tax
Results to date
Net cost savings – On track
One-time merger expense expected to be $39 million (pre-tax); $29 million (pre-tax) expenses incurred to date and $6 million recognized by Legacy United prior to 4/30/2014 close
Gross credit mark of $35 million
Interest rate and other marks result in a write down of $2.6 million
Core deposit intangible of $10 million
17
NASDAQ: UBNK
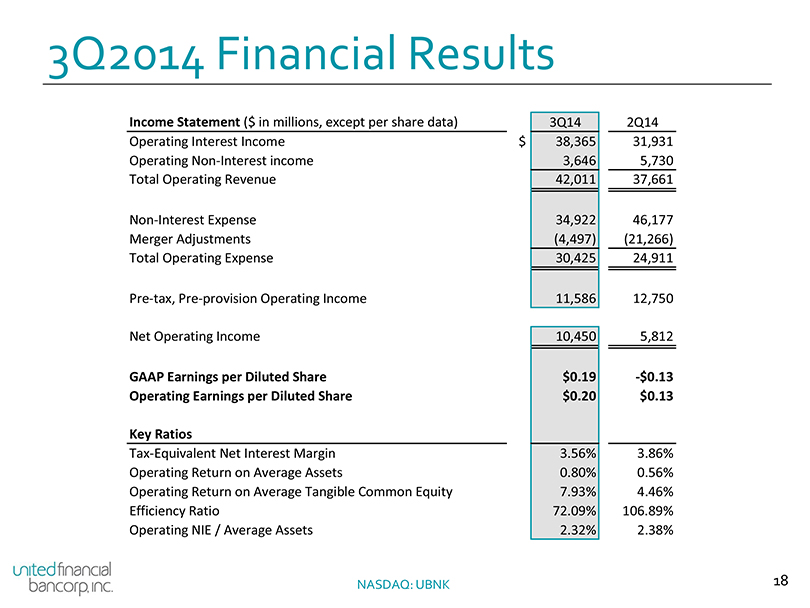
3Q2014 Financial Results
Income Statement ($ in millions, except per share data) 3Q14 2Q14 Operating Interest Income $ 38,365 31,931 Operating Non-Interest income 3,646 5,730 Total Operating Revenue 42,011 37,661
Non-Interest Expense 34,922 46,177 Merger Adjustments (4,497) (21,266) Total Operating Expense 30,425 24,911
Pre-tax, Pre-provision Operating Income 11,586 12,750
Net Operating Income 10,450 5,812
GAAP Earnings per Diluted Share $0.19 -$0.13 Operating Earnings per Diluted Share $0.20 $0.13
Key Ratios
Tax-Equivalent Net Interest Margin 3.56% 3.86% Operating Return on Average Assets 0.80% 0.56% Operating Return on Average Tangible Common Equity 7.93% 4.46% Efficiency Ratio 72.09% 106.89% Operating NIE / Average Assets 2.32% 2.38%
NASDAQ: UBNK 18
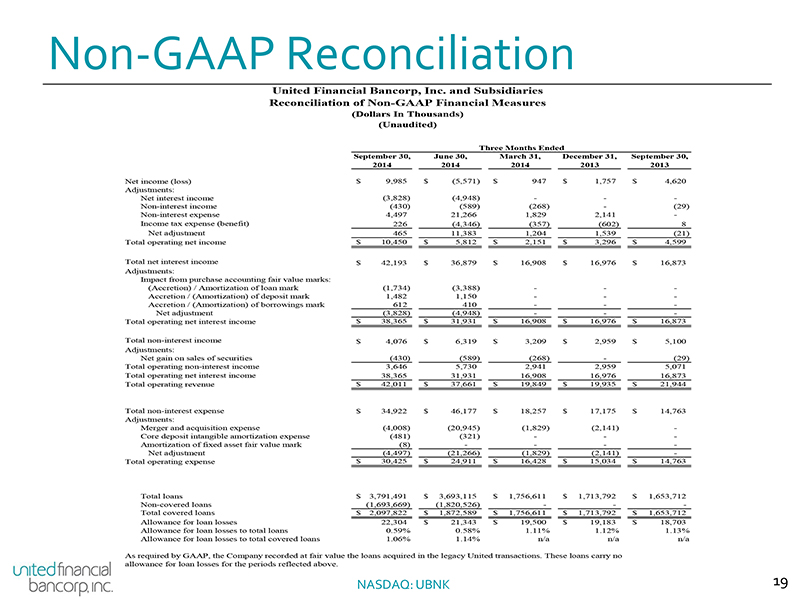
Non-GAAP Reconciliation
United Financial Bancorp, Inc. and Subsidiaries Reconciliation of Non-GAAP Financial Measures
(Dollars In Thousands) (Unaudited)
Three Months Ended
September 30, June 30, March 31, December 31, September 30, 2014 2014 2014 2013 2013
Net income (loss) $ 9,985 $ (5,571) $ 947 $ 1,757 $ 4,620 Adjustments: Net interest income (3,828) (4,948) — — -Non-interest income (430) (589) (268) — (29) Non-interest expense 4,497 21,266 1,829 2,141 -Income tax expense (benefit) 226 (4,346) (357) (602) 8 Net adjustment 465 11,383 1,204 1,539 (21) Total operating net income $ 10,450 $ 5,812 $ 2,151 $ 3,296 $ 4,599
Total net interest income $ 42,193 $ 36,879 $ 16,908 $ 16,976 $ 16,873 Adjustments: Impact from purchase accounting fair value marks: (Accretion) / Amortization of loan mark (1,734) (3,388) — — -Accretion / (Amortization) of deposit mark 1,482 1,150 — — -Accretion / (Amortization) of borrowings mark 612 410 — — -Net adjustment (3,828) (4,948) — — -Total operating net interest income $ 38,365 $ 31,931 $ 16,908 $ 16,976 $ 16,873
Total non-interest income $ 4,076 $ 6,319 $ 3,209 $ 2,959 $ 5,100 Adjustments: Net gain on sales of securities (430) (589) (268) — (29) Total operating non-interest income 3,646 5,730 2,941 2,959 5,071 Total operating net interest income 38,365 31,931 16,908 16,976 16,873 Total operating revenue $ 42,011 $ 37,661 $ 19,849 $ 19,935 $ 21,944
Total non-interest expense $ 34,922 $ 46,177 $ 18,257 $ 17,175 $ 14,763 Adjustments: Merger and acquisition expense (4,008) (20,945) (1,829) (2,141) -Core deposit intangible amortization expense (481) (321) — — -Amortization of fixed asset fair value mark (8) — — — -Net adjustment (4,497) (21,266) (1,829) (2,141) -Total operating expense $ 30,425 $ 24,911 $ 16,428 $ 15,034 $ 14,763
Total loans $ 3,791,491 $ 3,693,115 $ 1,756,611 $ 1,713,792 $ 1,653,712 Non-covered loans (1,693,669) (1,820,526) — — -Total covered loans $ 2,097,822 $ 1,872,589 $ 1,756,611 $ 1,713,792 $ 1,653,712 Allowance for loan losses 22,304 $ 21,343 $ 19,500 $ 19,183 $ 18,703 Allowance for loan losses to total loans 0.59% 0.58% 1.11% 1.12% 1.13% Allowance for loan losses to total covered loans 1.06% 1.14% n/a n/a n/a
As required by GAAP, the Company recorded at fair value the loans acquired in the legacy United transactions. These loans carry no allowance for loan losses for the periods reflected above.
NASDAQ: UBNK 19
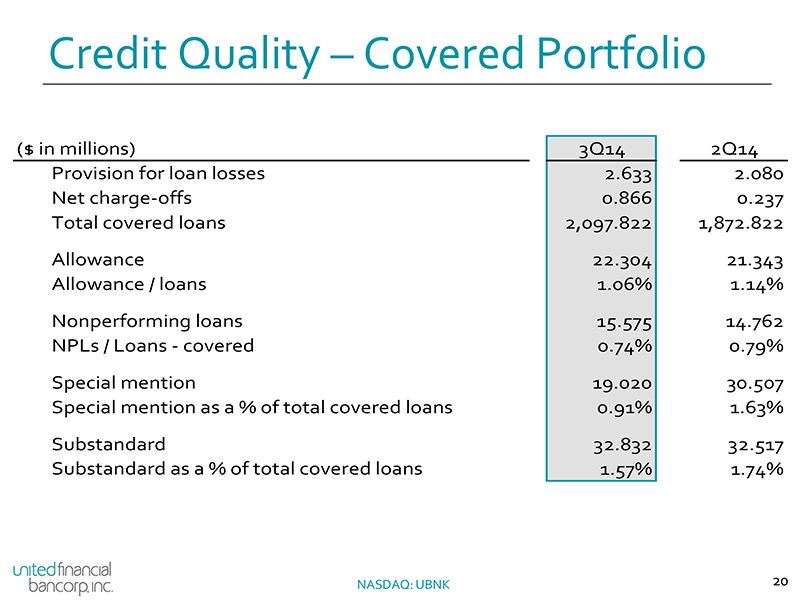
Credit Quality – Covered Portfolio
($ in millions) 3Q14 2Q14 Provision for loan losses 2.633 2.080 Net charge-offs 0.866 0.237 Total covered loans 2,097.822 1,872.822
Allowance 22.304 21.343 Allowance / loans 1.06% 1.14%
Nonperforming loans 15.575 14.762 NPLs / Loans—covered 0.74% 0.79%
Special mention 19.020 30.507 Special mention as a % of total covered loans 0.91% 1.63%
Substandard 32.832 32.517 Substandard as a % of total covered loans 1.57% 1.74%
NASDAQ: UBNK 20
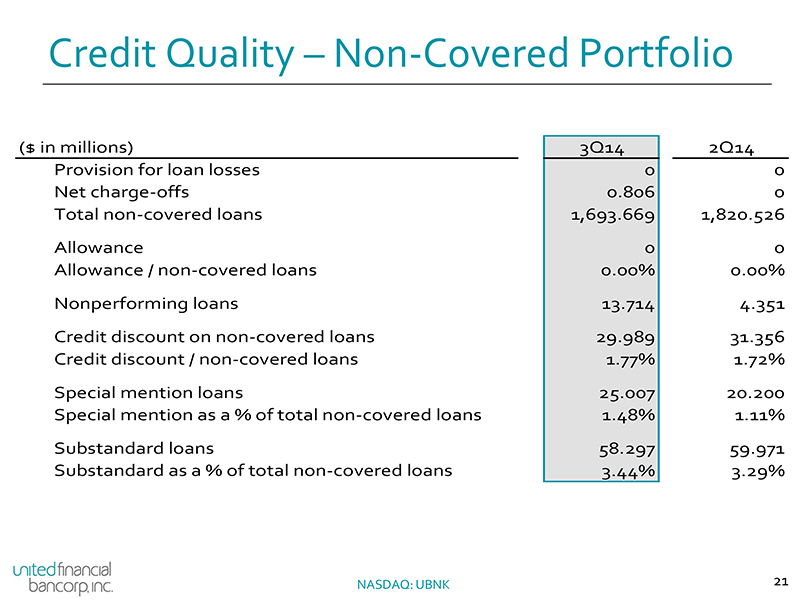
Credit Quality – Non-Covered Portfolio
($ in millions) 3Q14 2Q14 Provision for loan losses 0 0 Net charge-offs 0.806 0 Total non-covered loans 1,693.669 1,820.526
Allowance 0 0 Allowance / non-covered loans 0.00% 0.00%
Nonperforming loans 13.714 4.351
Credit discount on non-covered loans 29.989 31.356 Credit discount / non-covered loans 1.77% 1.72%
Special mention loans 25.007 20.200 Special mention as a % of total non-covered loans 1.48% 1.11%
Substandard loans 58.297 59.971 Substandard as a % of total non-covered loans 3.44% 3.29%
NASDAQ: UBNK 21
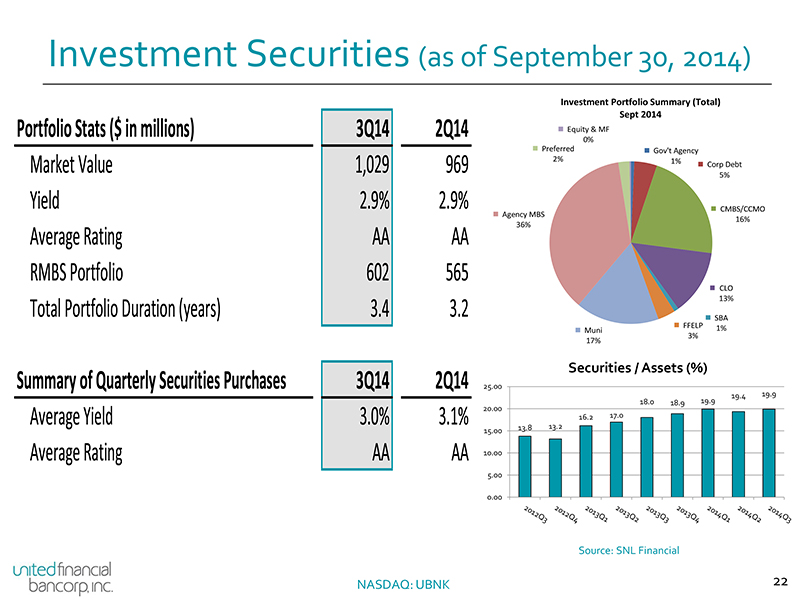
Investment Securities (as of September 30, 2014)
Investment Portfolio Summary (Total) Sept 2014
Portfolio Stats ($ in millions) 3Q14 2Q14 Equity & MF
0%
Preferred Gov’t Agency
2% 1%
Market Value 1,029 969 Corp Debt
5%
Yield 2.9% 2.9% CMBS/CCMO
Agency MBS
16%
Average Rating AA AA 36% RMBS Portfolio 602 565
CLO
Total Portfolio Duration (years) 3.4 3.2 13%
SBA FFELP 1%
Muni
3% 17%
Securities / Assets (%)
Summary of Quarterly Securities Purchases 3Q14 2Q14 25.00
19.9 19.4 19.9 18.0 18.9 20.00
Average Yield 3.0% 3.1% 16.2 17.0
13.8 13.2 15.00
Average Rating AA AA 10.00
5.00
0.00
Source: SNL Financial
NASDAQ: UBNK 22
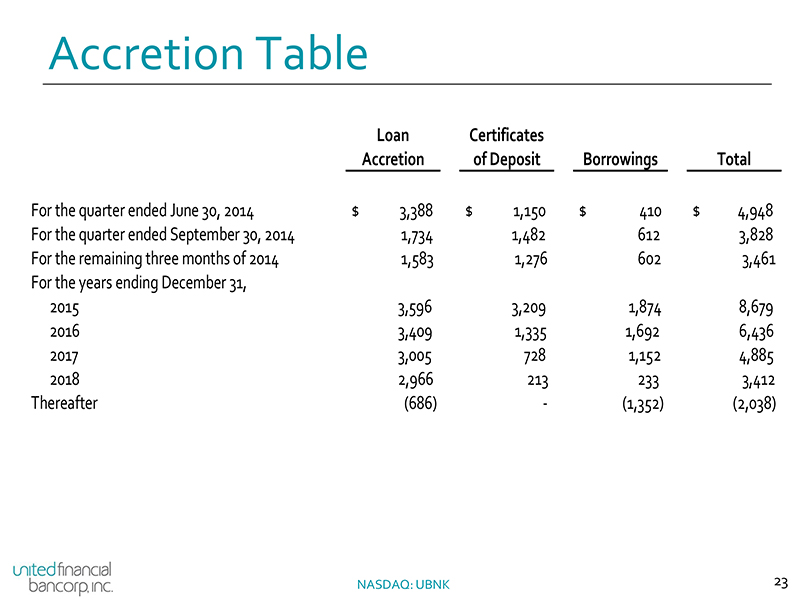
Accretion Table
Loan Certificates
Accretion of Deposit Borrowings Total
For the quarter ended June 30, 2014 $ 3,388 $ 1,150 $ 410 $ 4,948 For the quarter ended September 30, 2014 1,734 1,482 612 3,828 For the remaining three months of 2014 1,583 1,276 602 3,461 For the years ending December 31, 2015 3,596 3,209 1,874 8,679 2016 3,409 1,335 1,692 6,436 2017 3,005 728 1,152 4,885 2018 2,966 213 233 3,412 Thereafter (686) — (1,352) (2,038)
NASDAQ: UBNK 23