Attached files
| file | filename |
|---|---|
| 8-K - FS INVESTMENT CORP - FORM 8-K - FS KKR Capital Corp | d819127d8k.htm |
| EX-99.1 - EX-99.1 - FS KKR Capital Corp | d819127dex991.htm |
 www.fsinvestmentcorp.com
FS Investment Corporation
THIRD QUARTER 2014 FINANCIAL INFORMATION
Exhibit 99.2 |
 2
Important Disclosure Notice
This presentation may contain certain forward-looking statements, including statements with regard
to the future performance of FS Investment Corporation (FSIC, we or us). Words such as
“believes,” “expects,” “projects” and “future” or similar expressions
are intended to identify forward-looking statements. These forward-looking statements are
subject to the inherent uncertainties in predicting future results and conditions. Certain
factors could cause actual results to differ materially from those projected in these
forward-looking statements. Factors that could cause actual results to differ materially include
changes in the economy, risks associated with possible disruption in FSIC's operations or the
economy due generally to terrorism or natural disasters, future changes in laws or regulations
and conditions in FSIC's operating area, and the price at which shares of common stock may trade
on the New York Stock Exchange LLC (NYSE). Some of these factors are enumerated in the filings FSIC
makes with the Securities and Exchange Commission (SEC). FSIC undertakes no obligation to
update or revise any forward-looking statements, whether as a result of new information,
future events or otherwise.
This presentation contains summaries of certain financial and statistical information about FSIC. The
information contained in this presentation is summary information that is intended to be
considered in the context of FSIC’s SEC filings and other public announcements that FSIC
may make, by press release or otherwise, from time to time. FSIC undertakes no duty or obligation to
update or revise the information contained in this presentation. In addition, information related to
past performance, while helpful as an evaluative tool, is not necessarily indicative of future
results, the achievement of which cannot be assured. Investors should not view the past
performance of FSIC, or information about the market, as indicative of FSIC’s future results.
This presentation contains certain financial measures that have not been prepared in accordance with
U.S. generally accepted accounting principles (GAAP). FSIC uses these non-GAAP financial
measures internally in analyzing financial results and believes that the presentation of these
non-GAAP financial measures is useful to investors as an additional tool to evaluate
ongoing results and trends and in comparing FSIC’s financial results with other business
development companies.
Non-GAAP financial measures are not meant to be considered in isolation or as a substitute for
comparable GAAP financial measures, and should be read only in conjunction with FSIC’s
consolidated financial statements prepared in accordance with GAAP. A reconciliation of
non-GAAP financial measures to the most directly comparable GAAP measures has been provided in
the table on page 15 included in this presentation and investors are encouraged to review the
reconciliation.
Certain figures in this presentation have been rounded. |
 3
Financial and Portfolio Highlights
Financial Highlights
(all
per
share
amounts
are
basic
and
diluted)
1
Q3-14
Q2-14
Q3-13
9ME-14
9ME-13
Net investment income per share
$
0.25
$
0.23
$
0.26
$
0.69
$
0.76
Adjusted
net
investment
income
per
share
2*
$
0.25
$
0.26
$
0.25
$
0.75
$
0.76
Total
net
realized
and
unrealized
gain
(loss)
on
investments
per
share
$
(0.02)
$
0.04
$
(0.03)
$
0.12
$
(0.01)
Net increase (decrease) in net assets resulting from operations (Earnings per
Share)
$
0.23
$
0.27
$
0.23
$
0.81
$
0.74
Stockholder
distributions
per
share
3**
$
0.3228
$
0.2228
$
0.2093
$
0.7616
$
0.6166
Net asset value per share at period end
$
10.19
$
10.28
$
10.10
$
10.19
$
10.10
Weighted average shares outstanding
239,548,922
255,301,300
256,108,444
251,603,035
254,322,277
Shares outstanding, end of period
240,001,859
239,026,360
257,190,300
240,001,859
257,190,300
Portfolio Highlights
(in thousands)
Q3-14
Q2-14
Q3-13
9ME-14
9ME-13
Purchases
$
432,026
$
737,704
$
875,476
$
1,641,221
$
(2,204,560)
Sales and Redemptions
(348,358)
(609,417)
(668,647)
(1,523,890)
1,974,977
Net Portfolio Activity
$
83,668
$
128,287
$
206,829
$
117,331
$
(229,583)
Total fair value of investments
$
4,316,524
$
4,227,103
$
4,200,801
$
4,316,524
$
4,200,801
Total assets
$
4,570,655
$
4,572,364
$
4,633,585
$
4,570,655
$
4,633,585
*See page 15 hereof for reconciliations between net investment income per share and
adjusted net investment income per share. **On July 1, 2014, the board of
directors of FSIC declared a special cash distribution of $0.10 per share, which was
paid on August 15, 2014 to stockholders of record as of the close of business on
July 31, 2014. Endnotes begin on page 16. |
 4
Select Historical Information
As of
(dollar amounts in thousands)
9/30/2014
6/30/2014
3/31/2014
12/31/2013
9/30/2013
Investments, at fair value
$
4,316,524
$
4,227,103
$
4,077,627
$
4,137,581
$
4,200,801
Portfolio Data
Number of Portfolio Companies
128
125
148
165
182
Average Annual EBITDA of Portfolio Companies
$
148,000
$
181,000
$
174,200
$
190,700
$
252,900
Weighted
Average
Purchase
Price
of
Investments
(as
a
%
of
par
or
stated
value)
97.7%
97.4%
97.1%
97.3%
97.3%
Weighted
Average
Credit
Rating
of
Investments
that
were
Rated
4
B3
B3
B3
B3
B3
%
of
Investments
on
Non-Accrual
(based
on
fair
value)
5
0.5%
0.5%
—
—
—
Asset Class (based on fair value)
Senior Secured Loans—First Lien
54%
54%
50%
51%
51%
Senior Secured Loans—Second Lien
18%
18%
22%
22%
22%
Senior Secured Bonds
8%
9%
10%
9%
9%
Subordinated Debt
11%
10%
10%
10%
11%
Collateralized Securities
3%
3%
3%
4%
3%
Equity/Other
6%
6%
5%
4%
4%
Portfolio
Composition
by
Strategy
(based
on
fair
value)
6
Direct Originations
70%
66%
57%
51%
52%
Opportunistic
20%
22%
26%
28%
25%
Broadly Syndicated/Other
10%
12%
17%
21%
23%
Interest Rate Type (based on fair value)
% Variable Rate
71.4%
71.2%
71.3%
72.2%
70.0%
% Fixed Rate
22.1%
22.9%
22.9%
23.5%
26.3%
% Income Producing Equity or Other Investments
2.5%
2.5%
2.5%
2.4%
2.2%
% Non-Income Producing Equity or Other Investments
4.0%
3.4%
3.3%
1.9%
1.5%
Yields
Gross Portfolio Yield Prior to Leverage (based on amortized cost)
9.9%
9.9%
10.2%
10.1%
10.4%
Gross Portfolio Yield Prior to Leverage (based on amortized cost)—Excluding
Non-Income Producing Assets
10.3%
10.3%
10.3%
10.2%
10.6% |
 5
Select Direct Origination Information
Three Months Ended
(dollar amounts in thousands)
9/30/2014
6/30/2014
3/31/2014
12/31/2013
9/30/2013
New Direct Originations
Total Commitments (including unfunded commitments)
$
451,931
$
529,871
$
369,033
$
86,913
$
614,862
Exited Investments (including partial paydowns)
(213,837)
(114,422)
(126,964)
(188,718)
(97,561)
Net Direct Originations
$
238,094
$
415,449
$
242,069
$
(101,805)
$
517,301
New Direct Originations by Asset Class (including unfunded commitments)
Senior Secured Loans—First Lien
80%
76%
24%
78%
67%
Senior Secured Loans—Second Lien
11%
—
65%
—
23%
Senior Secured Bonds
—
5%
4%
—
—
Subordinated Debt
9%
12%
2%
—
6%
Collateralized Securities
—
—
—
19%
—
Equity/Other
0%
7%
5%
3%
4%
Average New Direct Origination Commitment Amount
$
37,661
$
44,156
$
28,387
$
21,728
$
55,897
Weighted Average Maturity for New Direct Originations
3/18/2020
1/6/2020
10/12/2020
5/19/2019
7/31/2018
Gross Portfolio Yield Prior to Leverage (based on amortized cost) of New Direct
Originations during Period
9.7%
10.4%
9.1%
9.2%
11.7%
Gross Portfolio Yield Prior to Leverage (based on amortized cost) of New Direct
Originations during Period—Excluding Non-Income Producing
Assets 9.7%
11.2%
9.6%
9.5%
11.8%
Gross Portfolio Yield Prior to Leverage (based on amortized cost) of Direct
Originations Exited during Period
10.0%
11.2%
9.4%
16.9%
11.0%
As of
Characteristics of All Direct Originations held in Portfolio
9/30/2014
12/31/2013
Direct Originations, at fair value
$
3,001,347
$
2,096,806
Number of Portfolio Companies
48
35
Average Annual EBITDA of Portfolio Companies
$
48,800
$
34,900
Average Leverage Through Tranche of Portfolio Companies—Excluding Equity/Other
and Collateralized Securities
4.4x
4.0x
% of Investments on Non-Accrual
—
—
Gross Portfolio Yield Prior to Leverage (based on amortized cost) of Funded Direct
Originations
9.8%
9.9%
Gross Portfolio Yield Prior to Leverage (based on amortized cost) of Funded Direct
Originations—Excluding Non-Income Producing Assets
10.1%
10.0% |
 6
Quarterly Operating Results
Three Months Ended
(dollar amounts in thousands, except per share amounts)
9/30/2014
6/30/2014
3/31/2014
12/31/2013
9/30/2013
Total investment income
$
115,917
$
120,721
$
114,796
$
116,866
$
123,307
Net expenses
(55,814)
(62,748)
(58,919)
(59,446)
(54,793)
Net investment income before taxes
$
60,103
$
57,973
$
55,877
$
57,420
$
68,514
Excise taxes
—
—
—
(5,000)
(742)
Net investment income
$
60,103
$
57,973
$
55,877
$
52,420
$
67,772
Total net realized and unrealized gain (loss) on investments
(4,504)
11,338
24,183
24,388
(8,155)
Net increase (decrease) in net assets resulting from operations
$
55,599
$
69,311
$
80,060
$
76,808
$
59,617
Per
share
1
Net investment income
$
0.25
$
0.23
$
0.22
$
0.20
$
0.26
Adjusted
net
investment
income
2
$
0.25
$
0.26
$
0.23
$
0.24
$
0.25
Net increase (decrease) in net assets resulting from operations
(Earnings per Share)
$
0.23
$
0.27
$
0.31
$
0.30
$
0.23
Stockholder
distributions
3*
$
0.3228
$
0.2228
$
0.2160
$
0.2137
$
0.2093
Weighted average shares outstanding
239,548,922
255,301,300
260,185,661
258,262,842
256,108,444
Shares outstanding, end of period
240,001,859
239,026,360
261,301,955
259,320,161
257,190,300
Nine Months Ended
(dollar amounts in thousands, except per share amounts)
9/30/2014
9/30/2013
Total investment income
$
351,434
$
357,700
Net expenses
(177,481)
(164,402)
Net investment income before taxes
$
173,953
$
193,298
Excise taxes
—
(742)
Net investment income
$
173,953
$
192,556
Total net realized and unrealized gain (loss) on investments
31,017
(3,524)
Net increase (decrease) in net assets resulting from operations
$
204,970
$
189,032
Per
share
1
Net investment income
$
0.69
$
0.76
Adjusted
net
investment
income
2
$
0.75
$
0.76
Net increase (decrease) in net assets resulting from operations
(Earnings per Share)
$
0.81
$
0.74
Stockholder
distributions
3*
$
0.7616
$
0.6166
Weighted average shares outstanding
251,603,035
254,322,277
Shares outstanding, end of period
240,001,859
257,190,300
*On July 1, 2014, the board of directors of FSIC declared a special cash
distribution of $0.10 per share, which was paid on August 15, 2014 to
stockholders of record as of the close of business on July 31, 2014. |
 7
Quarterly Operating Results Detail
Three Months Ended
(in thousands)
9/30/2014
6/30/2014
3/31/2014
12/31/2013
9/30/2013
Investment income
Interest income—unaffiliated
$
104,823
$
102,096
$
104,711
$
109,907
$
109,886
Fee income—unaffiliated
10,606
18,450
10,085
6,903
11,975
Dividend income—unaffiliated
488
175
—
56
1,446
Total investment income
$
115,917
$
120,721
$
114,796
$
116,866
$
123,307
Operating expenses
Management fees
$
20,000
$
22,695
$
22,371
$
22,706
22,720
Capital
gains
incentive
fees
7
(910)
2,268
4,836
4,794
(1,548)
Subordinated income incentive fees
14,794
15,061
15,178
14,303
16,555
Administrative services expenses
1,202
1,189
1,200
1,131
1,243
Stock transfer agent fees
4
546
451
420
610
Accounting and administrative fees
172
320
332
327
343
Interest expense
18,940
14,129
12,700
13,653
13,098
Directors' fees
266
264
265
254
241
Listing advisory fees
—
5,043
—
—
—
Other general and administrative expenses
1,346
4,070
1,586
1,858
1,531
Total operating expenses
$
55,814
$
65,585
$
58,919
$
59,446
$
54,793
Management fee waiver
—
(2,837)
—
—
—
Net expenses
$
55,814
$
62,748
$
58,919
$
59,446
$
54,793
Net investment income before taxes
$
60,103
$
57,973
$
55,877
$
57,420
$
68,514
Excise taxes
—
—
—
(5,000)
(742)
Net investment income
$
60,103
$
57,973
$
55,877
$
52,420
$
67,772 |
 8
Quarterly Gain/Loss Information
Three Months Ended
(in thousands)
9/30/2014
6/30/2014
3/31/2014
12/31/2013
9/30/2013
Realized gain/loss
Net realized gain (loss) on investments—unaffiliated
$
5,421
$
6,716
$
13,822
$
9,794
$
6,602
Net realized gain (loss) on foreign currency
(338)
114
(19)
(79)
70
Total net realized gain (loss)
$
5,083
$
6,830
$
13,803
$
9,715
$
6,672
Unrealized gain/loss
Net change in unrealized appreciation (depreciation) on
investments—unaffiliated
$
(8,901)
$
4,706
$
10,335
$
14,855
$
(14,857)
Net change in unrealized appreciation (depreciation) on
investments—affiliated
(747)
(299)
—
—
—
Net change in unrealized gain (loss) on foreign currency
61
101
45
(182)
30
Total net unrealized gain (loss)
$
(9,587)
$
4,508
$
10,380
$
14,673
$
(14,827)
Total net realized and unrealized gain (loss) on investments
$
(4,504)
$
11,338
$
24,183
$
24,388
$
(8,155) |
 9
Quarterly Balance Sheets
As of
(in thousands, except per share amounts)
9/30/2014
6/30/2014
3/31/2014
12/31/2013
9/30/2013
Assets
Investments, at fair value—unaffiliated
$
4,299,639
$
4,209,471
$
4,077,627
$
4,137,581
$
4,200,801
Investments, at fair value—affiliated
16,885
17,632
—
—
—
Cash
179,984
244,074
297,685
227,328
290,439
Receivable for investments sold and repaid
9,502
35,592
67,779
26,722
85,341
Interest receivable
52,650
56,362
55,327
47,622
51,075
Deferred financing costs
10,962
7,768
4,845
5,168
5,757
Prepaid expenses and other assets
1,033
1,465
404
156
172
Total assets
$
4,570,655
$
4,572,364
$
4,503,667
$
4,444,577
$
4,633,585
Liabilities
Payable for investments purchased
$
105,425
$
92,522
$
24,321
$
23,423
$
44,648
Credit facilities payable
564,294
965,686
738,482
723,682
986,421
Unsecured notes payable
400,000
—
—
—
—
Repurchase agreement payable
950,000
950,000
950,000
950,000
906,083
Stockholder distributions payable
17,819
17,748
18,814
18,671
17,939
Management fees payable
20,009
19,862
22,375
22,700
22,808
Accrued capital gains incentive fees
36,737
37,647
35,379
32,133
27,339
Subordinated income incentive fees payable
14,794
15,061
15,178
14,303
16,555
Administrative services expense payable
988
1,686
1,820
1,153
1,361
Interest payable
12,801
11,509
10,302
10,563
10,545
Directors' fees payable
292
253
254
254
229
Other accrued expenses and liabilities
1,712
2,823
1,573
6,703
1,967
Total liabilities
$
2,124,871
$
2,114,797
$
1,818,498
$
1,803,585
$
2,035,895
Stockholders' Equity
Preferred stock, $0.001 par value
—
—
—
—
—
Common stock, $0.001 par value
$
240
$
239
$
261
$
259
$
257
Capital in excess of par value
2,256,843
2,246,910
2,487,105
2,466,753
2,451,662
Accumulated undistributed net realized gains on investments and gain/loss on foreign
currency 9,431
75,977
69,147
55,344
5,014
Accumulated undistributed (distributions in excess of) net investment income
90,655
36,239
34,962
35,322
72,116
Net unrealized appreciation (depreciation) on investments and gain/loss on foreign
currency 88,615
98,202
93,694
83,314
68,641
Total stockholders' equity
$
2,445,784
$
2,457,567
$
2,685,169
$
2,640,992
$
2,597,690
Total liabilities and stockholders' equity
$
4,570,655
$
4,572,364
$
4,503,667
$
4,444,577
$
4,633,585
Net asset value per share of common stock at period end
$
10.19
$
10.28
$
10.28
$
10.18
$
10.10 |
 10
Financing Arrangements
Financing Arrangements as of
September 30, 2014
Type of Financing
Arrangement
Rate
Amount
Outstanding
Amount
Available
Maturity Date
(in thousands)
Broad Street Credit Facility
Revolving Credit Facility
L + 1.50%
$
80,608
$
44,392
December 20, 2014
ING Credit Facility
Revolving Credit Facility
L + 2.50%
$
270,886
$
29,114
April 3, 2018
JPM Facility
Repurchase Agreement
3.25%
$
950,000
$
—
April 15, 2017
Walnut Street Credit Facility
Revolving Credit Facility
L + 1.50% to 2.50%
$
212,800
$
87,200
May 17, 2017
4.000%
Notes
due
2019
9
Unsecured Notes
4.00%
$
400,000
$
—
July 15, 2019
Total debt outstanding under debt facilities
$
1,914,294
Debt/equity ratio
10
78.3%
Weighted average effective interest rate on borrowings (including
non-usage fees)
3.3%
% of debt outstanding at fixed interest rates
70.5%
% of debt outstanding at variable interest rates
29.5%
Financing Arrangements as of
June 30, 2014
Type of Financing
Arrangement
Rate
Amount
Outstanding
Amount
Available
Maturity Date
(in thousands)
Arch
Street
Credit
Facility
8
Revolving Credit Facility
L + 2.05%
$
350,000
$
—
August 29, 2016
Broad Street Credit Facility
Revolving Credit Facility
L + 1.50%
$
125,000
$
—
December 20, 2014
ING Credit Facility
Revolving Credit Facility
L + 2.50%
$
250,886
$
49,114
April 3, 2018
JPM Facility
Repurchase Agreement
3.25%
$
950,000
$
—
April 15, 2017
Walnut Street Credit Facility
Revolving Credit Facility
L + 1.50% to 2.50%
$
239,800
$
60,200
May 17, 2017
Total debt outstanding under debt facilities
$
1,915,686
Debt/equity
ratio
10
78.0%
Weighted average effective interest rate on borrowings (including
non-usage fees)
2.9%
% of debt outstanding at fixed interest rates
49.6%
% of debt outstanding at variable interest rates
50.4% |
 11
Distribution History
11
•
On October 10, 2014, the board of directors of FSIC declared a regular monthly cash
distribution of $0.07425 per share. The regular monthly cash distribution
was paid on November 4, 2014 to stockholders of record as of the close of business on October 27, 2014.
•
On October 10, 2014, the board of directors of FSIC declared a special cash
distribution of $0.10 per share, which will be paid on or about November 14,
2014 to stockholders of record as of the close of business on October 31, 2014.
•
On November 6, 2014, the board of directors of FSIC declared a regular monthly cash
distribution of $0.07425 per share. The regular monthly cash distribution
will be paid on or about December 2, 2014 to stockholders of record as of the close of business on November 20, 2014.
•
As
of
September
30,
2014,
FSIC
had
approximately
$162.4
million
($0.68
per
share
based
on
shares
outstanding)
of
undistributed
net
investment
income and realized gains on a tax basis.
$0.05
$0.07
$0.07
$0.01
$0.02
$0.015
$0.05
$0.10
$0.10 |
 12
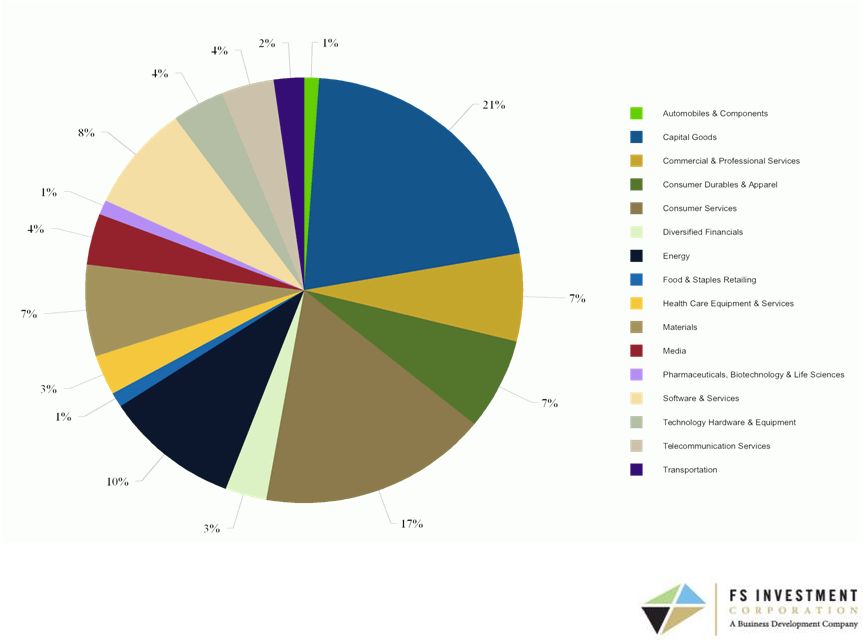
Investment Portfolio
•
As of September
30, 2014, FSIC's three largest industry concentrations based on fair value were
Capital Goods (21%); Consumer Services (17%); and Energy (10%).
•
As of September
30, 2014, FSIC's portfolio assets in Retailing amounted to less than 1% based on
fair value. Industry Diversification
As of September
30, 2014, based on fair value |
 13
Issuer Concentration
Issuer Concentration
Top
ten
portfolio
companies
as
of
September
30,
2014,
based
on
fair
value
and
excluding
unfunded
commitment
amounts
All other investments
•
FSIC's top ten portfolio companies by fair value represent 35.2% of the company's
total portfolio. |
 14
Portfolio Asset Quality
As of
September 30, 2014
June 30, 2014
September 30, 2013
Investment
Rating
12
Fair Value
% of Portfolio
Fair Value
% of Portfolio
Fair Value
% of Portfolio
1
$
533,141
12%
$
402,787
9%
$
300,405
7%
2
3,386,481
79%
3,450,489
82%
3,551,113
85%
3
359,759
8%
331,225
8%
300,802
7%
4
14,994
0%
15,310
0%
45,326
1%
5
22,149
1%
27,292
1%
3,155
0%
Total
$
4,316,524
100%
$
4,227,103
100%
$
4,200,801
100%
Investment Rating
Summary Description
1
Investment exceeding expectations and/or capital gain expected.
2
Performing
investment
generally
executing
in
accordance
with
the
portfolio
company's
business
plan—full
return
of
principal
and
interest
expected.
3
Performing investment requiring closer monitoring.
4
Underperforming investment—some loss of interest or dividend possible, but
still expecting a positive return on investment. 5
Underperforming investment with expected loss of interest and some
principal. |
 15
Reconciliation
of
Non-GAAP
Financial
Measures
1
Three Months Ended
9/30/2014
6/30/2014
3/31/2014
12/31/2013
9/30/2013
GAAP net investment income per share
$
0.25
$
0.23
$
0.22
$
0.20
$
0.26
Plus capital gains incentive fees per share
—
0.01
0.02
0.02
(0.01)
Plus excise taxes per share
—
—
—
0.02
—
Plus
one-time
expenses
per
share
13
0.01
0.02
—
—
—
Adjusted net investment income per share
$
0.25
$
0.26
$
0.23
$
0.24
$
0.25
Nine Months Ended
9/30/2014
9/30/2013
GAAP net investment income per share
$
0.69
$
0.76
Plus capital gains incentive fees
0.02
—
Plus excise taxes per share
—
—
Plus
one-time
expenses
per
share
13
0.03
—
Adjusted net investment income per share
$
0.75
$
0.76 |
 16
End Notes
1)
The per share data was derived by using the weighted average shares of our common
stock outstanding during the applicable period. Per share numbers may not sum
due to rounding. 2)
Adjusted net investment income is a non-GAAP financial measure. We present
adjusted net investment income for all periods as GAAP net investment income
excluding (i) the accrual for the capital gains incentive fee for realized and unrealized gains; (ii) excise taxes; and (iii) certain
non-recurring operating expenses that are one-time in nature and are not
representative of ongoing operating expenses incurred during FSIC's normal
course of business (referred to herein as one-time expenses). We use this non-GAAP financial measure internally in analyzing financial
results and believe that the use of this non-GAAP financial measure is useful
to investors as an additional tool to evaluate ongoing results and trends
and in comparing our financial results with other business development companies. The presentation of this additional information is not
meant to be considered in isolation or as a substitute for financial results
prepared in accordance with GAAP. Reconciliations of GAAP net
investment
income
to
adjusted
net
investment
income
can
be
found
on
page
15
of
this
presentation.
3)
The per share data for distributions reflects the actual amount of distributions
paid per share of our common stock during the applicable period. 4)
The
weighted
average
credit
rating
of
investments
is
based
upon
the
investments
in
our
portfolio
that
were
rated,
based
upon
the
scale
of
Moody's Investors Service, Inc. As of September
30, 2014, approximately 27.1% of our portfolio (based on the fair value of our
investments) was rated.
5)
We record interest income on an accrual basis. Generally, investments are placed on
non-accrual when the collection of future interest and principal
payments is uncertain. 6)
We have identified and intend to focus on the following investment categories,
which we believe will allow us to generate an attractive total return with
an acceptable level of risk. Direct Originations:
We intend to leverage our relationship with GSO / Blackstone Debt Funds Management
LLC and its global sourcing and origination
platform
to
directly
source
investment
opportunities.
Such
investments
are
originated
or
structured
specifically
for
us
or
made
by
us
and are not generally available to the broader market. These investments may
include both debt and equity components, although we do not expect to make
equity investments independent of having an existing credit relationship. We believe directly originated investments may offer
higher returns and more favorable protections than broadly syndicated
transactions. Opportunistic:
We intend to seek to capitalize on market price inefficiencies by investing in
loans, bonds and other securities where the market price of such investment
reflects a lower value than deemed warranted by our fundamental analysis. We believe that market price inefficiencies
may occur due to, among other things, general dislocations in the markets, a
misunderstanding by the market of a particular company or an industry being
out of favor with the broader investment community. We seek to allocate capital to these securities that have been misunderstood
or mispriced by the market and where we believe there is an opportunity to earn an
attractive return on our investment. Such opportunities may include event
driven investments, anchor orders and collateralized securities. Broadly
Syndicated/Other: Although our primary focus is to invest in directly
originated transactions and opportunistic investments, in certain
circumstances
we
will
also
invest
in
the
broadly
syndicated
loan
and
high
yield
markets.
Broadly
syndicated
loans
and
bonds
are
generally
more
liquid
than
our
directly
originated
investments
and
provide
a
complement
to
our
less
liquid
strategies.
In
addition,
and
because
we
typically
receive more attractive financing terms on these positions than we do on our less
liquid assets, we are able to leverage the broadly syndicated portion of our
portfolio in such a way that maximizes the levered return potential of our portfolio. |
 17
End Notes (Cont'd)
7)
During the three months ended September 30, 2014, FSIC reversed capital gains incentive fees of $910
based on the performance of its portfolio. No such fee is actually payable by FSIC with respect
to unrealized gains unless and until those gains are actually realized.
8)
On July 14, 2014, we repaid the Arch Street credit facility in full. In conjunction with the repayment
of the Arch Street credit facility, $2,226 of remaining unamortized deferred financing costs
were charged to interest expense. The Arch Street credit facility provided for borrowings in an
aggregate principal amount up to $350,000 on a committed basis.
9)
On July 14, 2014, FSIC and U.S. Bank National Association entered into an indenture and a first
supplemental indenture relating to FSIC's issuance of $400,000 aggregate principal amount of
4.000% notes due 2019. The notes mature on July 15, 2019 and may be redeemed in whole or in
part at FSIC's option at any time or from time to time at the redemption price set forth in the indenture. The notes bear interest at
a rate of 4.000% per year payable semi-annually on January 15 and July 15 of each year, commencing
on January 15, 2015. The notes are general unsecured obligations of FSIC that rank senior in
right of payment to all of FSIC's existing and future indebtedness that is expressly
subordinated in right of payment to the notes and rank parri passu with all outstanding and
future unsecured unsubordinated indebtedness issued by FSIC. The net proceeds to FSIC from the
offering were approximately $394,392 before expenses, after deducting underwriting discounts
and commissions of $3,600. On July 14, 2014, FSIC used $350,000 of the net proceeds from the notes offering to repay the Arch
Street credit facility in full and $44,392 of the net proceeds to repay borrowings under the Broad
Street credit facility. For more information regarding the notes, see Note 8 to FSIC's
unaudited consolidated financial statements for the quarterly period ended September 30, 2014.
10) The debt/equity ratio is the ratio of total debt outstanding to stockholder's equity as of the
applicable date.
11) To date, no portion of any distributions paid to stockholders have been paid from offering
proceeds or borrowings. A portion of future distributions to stockholders may be deemed to
constitute a return of capital for tax purposes due to the character of the amounts received by
FSIC from portfolio companies. Any such return of capital will not reduce the amounts available for
investments. The timing and amount of any future distributions on FSIC's shares of common stock
are subject to applicable legal restrictions and the sole discretion of FSIC's board of
directors. Therefore there can be no assurance as to the amount or timing of any such future distributions.
12) Based on the investment rating system as described in FSIC's quarterly report on Form 10-Q for
the period ended September 30, 2014, under the heading "Management's Discussion and
Analysis of Financial Condition and Results of Operations — Portfolio Asset Quality."
13) FSIC's one-time expenses for the three and nine months ended September 30, 2014 were $1,780
and $7,380, respectively. For the three months ended September 30, 2014, FSIC incurred $2,226
of remaining unamortized deferred financing costs associated with the closing of the Arch
Street credit facility. These costs were partially offset by a $446 reduction in FSIC's subordinated incentive fee on income due to the
reduction in pre-incentive fee net investment income associated with the one-time
expenses. In addition to these costs, during the nine months ended September 30, 2014,
FSIC incurred expenses of $7,000 in connection with the listing of its shares on the NYSE, including
listing advisory fees of $5,043 and other legal, printing and marketing expenses. These expenses were
partially offset by a $1,400 reduction in FSIC's subordinated incentive fee on income. |
 18
Corporate Information
Board of Directors
Executive Officers
Investor Relations Contact
Michael C. Forman
Michael C. Forman
Ben Holman
Chairman of the Board
Chief Executive Officer
Chairman of the Board
Chief Executive Officer
Phone: (215)-220-6266
Email: ben.holman@franklinsquare.com
David J. Adelman
Gerald F. Stahlecker
Vice Chairman
President and Chief Executive Officer of Campus Apartments, Inc.
President
Michael J. Hagan
Brad Marshall
Lead Independent Director
Chairman, President and Chief Executive of LifeShield Security, Inc.
Senior Portfolio Manager
Managing Director, GSO / Blackstone
Gregory P. Chandler
Zachary Klehr
Chief Financial Officer of Emtec, Inc.
Executive Vice President
Barry H. Frank
Sean Coleman
Partner with law firm of Archer & Greiner, P.C.
Managing Director
Thomas J. Gravina
William Goebel
Executive Chairman of GPX Enterprises, L.P.
Chief Financial Officer
Jeffrey K. Harrow
Salvatore Faia
Chairman of Sparks Marketing Group, Inc.
Chief Compliance Officer
Michael Heller
Stephen S. Sypherd
President and Chief Executive Officer of Cozen O'Conner
Vice President, Treasurer and Secretary
Paul Mendelson
Senior Advisor for Business Development for Lincoln Investment
Planning, Inc
Pedro A. Ramos
Partner with law firm of Schnader Harrison Segal & Lewis, LLP
|