Attached files
Table of Contents
UNITED STATES
SECURITIES AND EXCHANGE COMMISSION
WASHINGTON, D.C. 20549
FORM 10-K
| x | ANNUAL REPORT PURSUANT TO SECTION 13 OR 15(d) OF THE SECURITIES EXCHANGE ACT OF 1934 |
| FOR THE FISCAL YEAR ENDED DECEMBER 31, 2010 |
OR
| ¨ | TRANSITION REPORT PURSUANT TO SECTION 13 OR 15(d) OF THE SECURITIES EXCHANGE ACT OF 1934 |
| FOR THE TRANSITION PERIOD FROM TO |
COMMISSION FILE NUMBER: 0-53424
FS Investment Corporation
(Exact name of registrant as specified in its charter)
| Maryland | 26-1630040 | |
| (State of Incorporation) | (I.R.S. Employer Identification Number) | |
| Cira Centre 2929 Arch Street, Suite 675 Philadelphia, Pennsylvania |
19104 | |
| (Address of principal executive offices) | (Zip Code) | |
Registrant’s telephone number, including area code: (215) 495-1150
Securities registered pursuant to Section 12(b) of the Act:
Common Stock, par value
None
Securities registered pursuant to Section 12(g) of the Act:
Common Stock, par value
$0.001 per share
Indicate by check mark if the registrant is a well-known seasoned issuer, as defined in Rule 405 of the Securities Act. Yes ¨ No x.
Indicate by check mark if the registrant is not required to file reports pursuant to Section 13 or Section 15(d) of the Act. Yes ¨ No x.
Indicate by check mark whether the Registrant (1) has filed all reports required to be filed by Section 13 or 15(d) of the Securities Exchange Act of 1934 during the preceding 12 months (or for such shorter period that the Registrant was required to file such reports), and (2) has been subject to such filing requirements for the past 90 days. Yes x No ¨.
Indicate by check mark whether the registrant has submitted electronically and posted on its corporate Web site, if any, every Interactive Data File required to be submitted and posted pursuant to Rule 405 of Regulation S-T (§232.405 of this chapter) during the preceding 12 months (or for shorter period that the registrant was required to submit and post such files). Yes ¨ No ¨.
Indicate by check mark if disclosure of delinquent filers pursuant to Item 405 of Regulation S-K is not contained herein, and will not be contained, to the best of Registrant’s knowledge, in definitive proxy or information statements incorporated by reference in Part III of this Form 10-K or any amendment to this Form 10-K. ¨
Indicate by check mark whether the registrant is a large accelerated filer, an accelerated filer, a non-accelerated filer, or a smaller reporting company. See definition of “accelerated filer,”, “large accelerated filer” and “smaller reporting company” in Rule 12b-2 of the Exchange Act. (Check one):
| Large accelerated filer ¨ |
Accelerated filer ¨ | |
| Non-accelerated filer x |
Smaller reporting company ¨ |
Indicate by check mark whether the registrant is a shell company (as defined in Rule 12b-2 of the Act). Yes ¨ No x.
There is no established market for the Registrant’s shares of common stock. The Registrant is currently conducting an ongoing public offering of its shares of common stock pursuant to a Registration Statement on Form N-2, which shares are being sold at $10.75 per share, with discounts available for certain categories of purchasers, or at a price necessary to ensure that shares are not sold at a price below net asset value per share.
There were 56,165,179 shares of the Registrant’s common stock outstanding as of March 15, 2011.
Documents Incorporated by Reference
Portions of the registrant’s definitive Proxy Statement relating to the registrant’s 2011 Annual Meeting of Stockholders, to be filed with the Securities and Exchange Commission within 120 days following the end of the Company’s fiscal year, are incorporated by reference in Part III of this Annual Report on Form 10-K as indicated herein.
Table of Contents
FS INVESTMENT CORPORATION
FORM 10-K FOR THE FISCAL YEAR
ENDED DECEMBER 31, 2010
| Page | ||||||
| PART I |
||||||
| ITEM 1. |
1 | |||||
| ITEM 1A. |
26 | |||||
| ITEM 1B. |
46 | |||||
| ITEM 2. |
46 | |||||
| ITEM 3. |
46 | |||||
| ITEM 4. |
46 | |||||
| PART II |
||||||
| ITEM 5. |
47 | |||||
| ITEM 6. |
52 | |||||
| ITEM 7. |
MANAGEMENT’S DISCUSSION AND ANALYSIS OF FINANCIAL CONDITION AND RESULTS OF OPERATIONS |
53 | ||||
| ITEM 7A. |
71 | |||||
| ITEM 8. |
73 | |||||
| ITEM 9. |
CHANGES IN AND DISAGREEMENTS WITH ACCOUNTANTS ON ACCOUNTING AND FINANCIAL DISCLOSURE |
107 | ||||
| ITEM 9A. |
107 | |||||
| ITEM 9B. |
108 | |||||
| PART III |
||||||
| ITEM 10. |
110 | |||||
| ITEM 11. |
110 | |||||
| ITEM 12. |
SECURITY OWNERSHIP OF CERTAIN BENEFICIAL OWNERS AND MANAGEMENT AND RELATED STOCKHOLDER MATTERS |
110 | ||||
| ITEM 13. |
CERTAIN RELATIONSHIPS AND RELATED TRANSACTIONS, AND DIRECTOR INDEPENDENCE |
110 | ||||
| ITEM 14. |
110 | |||||
| PART IV |
||||||
| ITEM 15. |
111 | |||||
| 113 | ||||||
Table of Contents
PART I
Many of the amounts and percentages presented in Part I have been rounded for convenience of presentation, and all dollar amounts, excluding per share amounts, are presented in thousands unless otherwise noted.
| Item 1. | Business |
FS Investment Corporation (“FSIC” or the “Company,” which may also be referred to as “we,” “us” or “our”) was organized in December 2007 to invest in debt securities of private U.S. companies and commenced operations in January 2009. We are an externally managed, non-diversified, closed-end management investment company that has elected to be treated as a business development company, or BDC, under the Investment Company Act of 1940, as amended, or the 1940 Act. In addition, we have elected to be treated for federal income tax purposes as a regulated investment company, or RIC, under Subchapter M of the Internal Revenue Code of 1986, as amended, or the Code.
We are managed by FB Income Advisor, LLC, or FB Advisor, a registered investment adviser under the Investment Advisers Act of 1940, as amended, or the Advisers Act, which oversees the management of our operations and is responsible for making investment decisions for our portfolio. FB Advisor has engaged GSO / Blackstone Debt Funds Management LLC, or GDFM, to act as our investment sub-adviser. GDFM assists FB Advisor in identifying investment opportunities and makes investment recommendations for approval by FB Advisor, according to asset allocation and other guidelines set by FB Advisor. GDFM, a registered investment adviser under the Advisers Act, is a subsidiary of GSO Capital Partners LP, or GSO, the credit platform affiliate of The Blackstone Group L.P., a leading global alternative asset manager and provider of financial advisory services. GSO is one of the world’s largest credit platforms in the alternative asset business with approximately $31.0 billion in assets under management as of December 31, 2010.
Our investment objectives are to generate current income and, to a lesser extent, long-term capital appreciation. We will seek to meet our investment objectives by:
| • | utilizing the experience and expertise of FB Advisor and GDFM, along with the broader resources of GSO which includes its access to the relationships and human capital of its parent, The Blackstone Group L.P., in sourcing, evaluating and structuring transactions; |
| • | employing a defensive investment approach focused on long-term credit performance and principal protection; |
| • | focusing primarily on debt investments in a broad array of private U.S. companies, including small and middle-market companies, which we define as companies with annual revenue of $10 million to $2.5 billion at the time of investment. In many environments, we believe such a focus offers an opportunity for superior risk adjusted returns; |
| • | focusing primarily on investing in established, stable companies with positive cash flows; and |
| • | maintaining rigorous portfolio monitoring, in an attempt to anticipate and pre-empt negative credit events within our portfolio. |
Our portfolio is comprised primarily of investments in senior secured loans, second lien secured loans and, to a lesser extent, subordinated loans, or mezzanine loans, of private U.S. companies. We may purchase interests in loans through secondary market transactions in the “over-the-counter” market for institutional loans or directly from our target companies as primary market investments. In connection with our debt investments, we may on occasion receive equity interests such as warrants or options as additional consideration. We may also purchase minority interests in the form of common or preferred equity in our target companies, either in conjunction with one of our debt investments or through a co-investment with a financial sponsor. In addition, a portion of our portfolio may be comprised of corporate bonds and other debt securities. However, such investments are not expected to comprise a significant portion of our portfolio.
1
Table of Contents
The senior secured and second lien secured loans in which we invest generally have stated terms of three to seven years and any mezzanine investments that we make generally have stated terms of up to ten years, but the expected average life of such loans is generally between three and seven years. However, there is no limit on the maturity or duration of any security in our portfolio. The loans that we invest in are often rated by a nationally recognized statistical ratings organization (NRSRO), and generally carry a rating below investment grade (rated lower than “Baa3” by Moody’s Investors Service or lower than “BBB-” by Standard & Poor’s Corporation). However, we may also invest in non-rated debt securities.
During the year ended December 31, 2010, we made investments in portfolio companies totaling $849,242. During the same period, we sold positions totaling $122,581 and received principal repayments of $117,473. As of December 31, 2010, our investment portfolio, with a total fair value of $733,580, consisted of interests in 144 portfolio companies (66% in first lien senior secured loans, 19% in second lien senior secured loans, 4% in senior secured bonds and 11% in mezzanine debt/other) with an average annual earnings before interest, taxes, depreciation and amortization, or EBITDA, of approximately $294.5 million. As of December 31, 2010, the investments in our portfolio were purchased at an average price of 94.9% of par value, the weighted average credit rating of our portfolio was B2 based upon the Moody’s scale and our estimated gross annual portfolio yield, prior to leverage, was 8.5% based upon the purchase price of our investments.
As a BDC, we are subject to certain regulatory restrictions in making our investments. For example, we will not be permitted to co-invest with certain entities affiliated with GDFM in transactions originated by GSO or its affiliates unless we obtain an exemptive order from the Securities and Exchange Commission, or the SEC. We are currently seeking an exemptive order. However, there can be no assurance that we will obtain such relief. Even if we receive exemptive relief, GSO and its affiliates are not obligated to offer GDFM or us the right to participate in any transactions originated by them.
Prior to obtaining exemptive relief, we intend to co-invest alongside GSO or its affiliates only in accordance with existing regulatory guidance. For example, at any time, we may co-invest in syndicated deals and secondary loan market transactions where price is the only negotiated point. While we desire to receive exemptive relief from the SEC, given the latitude permitted within existing regulatory guidance and our current universe of investment opportunities, we do not feel that the absence of exemptive relief materially affects our ability to achieve our investment objectives.
To enhance our opportunity for gain, we intend to employ leverage as market conditions permit and at the discretion of FB Advisor, but in no event will leverage employed exceed 50% of the value of our assets, as required by the 1940 Act.
While a BDC may list its shares for trading in the public markets, we have currently elected not to do so. We believe that a non-traded structure is more appropriate for the long-term nature of the assets in which we invest. This structure allows us to operate with a long-term view, similar to that of other types of private investment funds—instead of managing to quarterly market expectations—and to pursue our investment objectives without subjecting our investors to the daily share price volatility associated with the public markets. To provide our stockholders with limited liquidity, we conduct quarterly tender offers pursuant to our share repurchase program. During the year ended December 31, 2010, we repurchased 228,950 shares at $9.36 per share for aggregate consideration totaling $2,143. On January 3, 2011, we repurchased 99,633 shares at $9.59 per share for aggregate consideration totaling $955.
We currently intend to limit the number of shares to be repurchased during any calendar year to the number of shares we can repurchase with the proceeds we receive from the sale of shares under our distribution reinvestment plan. At the discretion of our board of directors, we may also use cash on hand, cash available from borrowings and cash from the liquidation of securities investments as of the end of the applicable period to repurchase shares. In addition, we will not repurchase shares in any calendar year in an amount exceeding 10% of the weighted average number of shares outstanding in the prior calendar year, or 2.5% in each quarter. We will
2
Table of Contents
offer to repurchase such shares on each date of repurchase at a price equal to 90% of the current offering price in effect on each date of repurchase. Our board of directors may amend, suspend or terminate the repurchase program at any time upon 30 days’ notice.
Although we do not currently intend to list our securities on an exchange and do not expect a public market to develop for them in the foreseeable future, we intend to seek to complete a liquidity event within five to seven years following the completion of our offering stage or at such earlier time as our board of directors may determine, taking into consideration market conditions and other factors. We will view our offering stage as complete as of the termination date of our most recent public equity offering, if we have not conducted a public equity offering in any continuous two-year period. Therefore, stockholders may not be able to sell their shares promptly or at a desired price.
Status of Our Ongoing Public Offering
Since commencing our initial public offering and through March 15, 2011, we have sold 56,357,510 shares (as adjusted for stock distributions) of our common stock for gross proceeds of approximately $576.4 million. As of March 15, 2011, we had raised total gross proceeds of approximately $577.4 million, including approximately $1 million contributed by principals of our investment adviser in February 2008.
Distributions
The following table reflects the cash distributions per share that we have declared and paid on our common stock during the years ended December 31, 2008, 2009 and 2010:
| Distribution | ||||||||
| For the Year Ended |
Per Share(1)(2)(3) | Amount | ||||||
| 2008 |
$ | 0.1835 | $ | 25 | ||||
| 2009 |
0.6717 | 3,134 | ||||||
| 2010 |
0.8728 | 21,389 | ||||||
| (1) | The amount of each per share distribution has been retroactively adjusted to reflect the stock distributions declared throughout 2009 and 2010 as discussed below. |
| (2) | In addition to regular semi-monthly cash distributions during such period, cash distributions declared and paid on our common stock during the year ended December 31, 2010 include approximately $3,851, or approximately $0.12 per share, in special cash distributions. |
| (3) | On October 13, 2010, our board of directors determined to increase the amount of semi-monthly distributions payable to stockholders of record from $0.03125 per share to $0.03185 per share, effective October 1, 2010. On October 29, 2010, our board of directors determined to increase the amount of semi-monthly distributions payable to stockholders of record from $0.03185 per share to $0.032156 per share, effective November 1, 2010. |
On January 13, 2011, our board of directors declared two regular semi-monthly cash distributions of $0.032156 per share each, which were paid on January 31, 2011 to stockholders of record on January 14, 2011 and January 28, 2011, respectively. On February 14, 2011, our board of directors declared two regular semi-monthly cash distributions of $0.032156 per share each, which were paid on February 28, 2011 to stockholders of record on February 14, 2011 and February 25, 2011, respectively. On March 14, 2011, our board of directors declared two regular semi-monthly cash distributions of $0.032156 per share each, which will be paid on March 31, 2011 to stockholders of record on March 14, 2011 and March 30, 2011, respectively. The timing and amount of any future distributions to stockholders are subject to applicable legal restrictions and the sole discretion of our board of directors.
3
Table of Contents
The following table reflects the stock distributions per share that we have declared and paid on our common stock to date:
| Date Declared |
Record Date | Payment Date | Distribution Percentage |
Shares Issued |
||||||||||||
| Fiscal 2009 |
||||||||||||||||
| March 31, 2009 |
March 31, 2009 | March 31, 2009 | 1.4 | % | 13,818 | |||||||||||
| April 30, 2009 |
April 30, 2009 | April 30, 2009 | 3.0 | % | 42,661 | |||||||||||
| May 29, 2009 |
May 29, 2009 | May 29, 2009 | 3.7 | % | 79,125 | |||||||||||
| June 30, 2009 |
June 30, 2009 | June 30, 2009 | 3.5 | % | 96,976 | |||||||||||
| July 30, 2009 |
July 31, 2009 | July 31, 2009 | 3.1 | % | 117,219 | |||||||||||
| August 31, 2009 |
August 31, 2009 | August 31, 2009 | 3.0 | % | 148,072 | |||||||||||
| December 31, 2009 |
December 31, 2009 | December 31, 2009 | 0.5 | % | 49,710 | |||||||||||
| Fiscal 2010 |
||||||||||||||||
| January 28, 2010 |
January 31, 2010 | January 31, 2010 | 2.5 | % | 283,068 | |||||||||||
About FB Advisor
FB Advisor is registered as an investment adviser with the SEC under the Advisers Act. Our chief executive officer, Michael C. Forman, has led FB Advisor since its inception. In 2005, Mr. Forman co-founded FB Capital Partners, L.P., an investment firm that invests in private equity, senior and mezzanine debt, and real estate, and has served as managing general partner since its inception. In 2007, he co-founded Franklin Square Holdings, L.P., or Franklin Square Holdings, a national sponsor and distributor of alternative investment products designed for the individual investor. In managing its funds, Franklin Square Holdings seeks to partner with what it believes to be best-in-class institutional asset managers.
Mr. Forman and the other members of FB Advisor’s senior management team, including David J. Adelman, the vice chairman of our board of directors and the co-founder of Franklin Square Holdings, have extensive experience in private lending, private equity and real estate investing, and have developed an expertise in using all levels of a firm’s capital structure to produce income-generating investments, while focusing on risk management. FB Advisor is presently staffed with twelve employees and may retain additional investment personnel as our activities expand.
All investment decisions require the unanimous approval of FB Advisor’s investment committee, which is led by Mr. Forman. Our board of directors, including a majority of independent directors, oversees and monitors our investment performance and annually reviews the compensation we pay to FB Advisor and the compensation FB Advisor pays to GDFM to determine that the provisions of the investment advisory and administrative services agreement and the investment sub-advisory agreement, respectively, are carried out.
About GDFM
From time to time, FB Advisor may enter into sub-advisory relationships with registered investment advisers that possess skills that FB Advisor believes will aid it in achieving our investment objectives. FB Advisor has engaged GDFM to act as our investment sub-adviser. GDFM assists FB Advisor in identifying investment opportunities and makes investment recommendations for approval by FB Advisor, according to asset allocation and other guidelines set by FB Advisor. GDFM is a Delaware limited liability company with principal offices located at 280 Park Avenue, New York, New York 10017.
GDFM is a wholly-owned subsidiary of GSO. GSO is the credit platform affiliate of The Blackstone Group L.P., or Blackstone, a leading global alternative asset manager. As of December 31, 2010, GSO and its affiliates
4
Table of Contents
managed approximately $31.0 billion of assets across multiple strategies within the leveraged finance marketplace, including leveraged loans, high-yield bonds, distressed, mezzanine and private equity. As sub-adviser, GDFM makes recommendations to FB Advisor in a manner that is consistent with its existing investment and monitoring processes.
Blackstone is a leading global alternative asset manager and provider of financial advisory services. It is one of the largest independent managers of private capital in the world, with assets under management of $128.1 billion as of December 31, 2010. Blackstone’s alternative asset management businesses include the management of private equity funds, real estate funds, funds of hedge funds, credit-oriented funds, collateralized loan obligation vehicles, separately managed accounts and publicly-traded closed-end mutual funds. Blackstone is a publicly traded limited partnership that has common units which trade on the New York Stock Exchange under the symbol “BX.” Information about Blackstone and its various affiliates, including certain ownership, governance and financial information, is disclosed in Blackstone’s periodic filings with the SEC, which can be obtained from Blackstone’s website at http://ir.blackstone.com or the SEC’s website at www.sec.gov.
Under the investment sub-advisory agreement, GDFM assists FB Advisor in identifying investment opportunities and makes investment recommendations for approval by FB Advisor, according to asset allocation and other guidelines set by FB Advisor. In addition, to the extent requested by FB Advisor, GDFM assists with the monitoring of our portfolio and may make managerial assistance available to certain of our portfolio companies. It is anticipated that FB Advisor will benefit from the scale arising from GDFM’s existing infrastructure, access to investment opportunities from GSO’s existing institutional relationships, access to proprietary investments from GSO’s existing dedicated origination and sourcing team and risk management from GDFM’s existing policies and expertise. GDFM has an established infrastructure and investment processes for managing leveraged credit portfolios, including senior secured loans, second lien secured loans, mezzanine debt, high yield bonds, structured finance instruments and credit derivatives. GDFM may rely upon the wider resources and operations of GSO, including additional originated deal flow, market risk management, finance, compliance, legal, internal audit and fund administration as needed.
Market Opportunity
We believe that there are and will continue to be significant investment opportunities in senior secured and second lien secured loans as well as investments in debt securities of small and middle market companies.
Attractive Opportunities in Senior Secured and Second Lien Secured Loans
Since the beginning of 2009, there have been signs that global credit and other financial market conditions have improved markedly as stability has increased throughout the international financial system. Concentrated policy initiatives undertaken by central banks and governments appear to have curtailed the incidence of large-scale failures within the global financial system. Concurrently, investor confidence, financial indicators, capital markets activity and asset prices have shown signs of marked improvement. While financial conditions have improved, economic activity continues to be somewhat subdued as unemployment rates remain high. Corporate interest rate risk premiums, otherwise known as credit spreads, remain above historical averages, particularly in the loan market. Given current market conditions, it is our view that, at this time, there are and will continue to be significant investment opportunities in senior secured and second lien secured loans as well as investments in debt securities of small and middle market companies.
5
Table of Contents
The chart below illustrates the sharp decline and subsequent partial recovery in the average prices of senior secured loans, including first and second lien loans, tracked by the Credit Suisse Leveraged Loan Index.
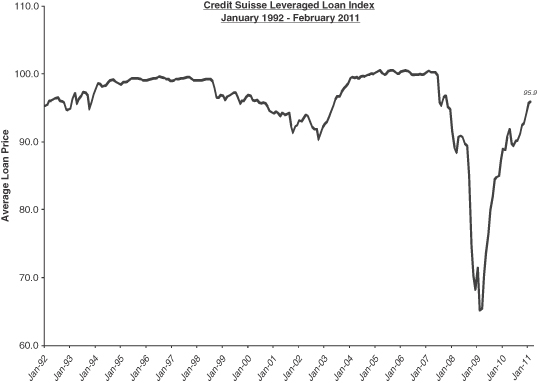
Source: Bloomberg
We feel that opportunities in senior secured loans and second lien secured loans are significant not only because of the potential returns available, but also because of the strong defensive characteristics of this investment class. Because these loans have priority in payment among an issuer’s security holders (i.e., they are due to receive payment before bondholders and stockholders), they carry the least potential risk among investments in the issuer’s capital structure. Further, these investments are secured by the issuer’s assets, which may be seized in the event of a default if necessary, and generally carry restrictive covenants aimed at ensuring repayment before unsecured creditors, such as most types of public bondholders, and other security holders and preserving collateral to protect against credit deterioration. In addition, most senior secured debt issues carry variable interest rate structures, meaning the securities are generally less susceptible to declines in value experienced by fixed-rate securities in a rising interest rate environment. However, in declining interest rate environments, variable interest rate structures decrease the income we would receive from our debt securities.
6
Table of Contents
The chart below illustrates examples of the collateral used to secure senior secured and second lien secured debt.
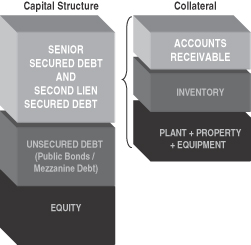
Source: Moody’s Investors Service
Further, as a result of the dislocation in the credit markets and the reduction in competition for loans, lenders have recalibrated their concepts of risk and are now in a position to demand improved pricing, reduced issuer leverage and more stringent covenant structures before committing to new debt issues. As an example, the chart below depicts the reduced leverage permitted of issuers in the current marketplace. In contrast to the recent peak of the credit cycle, which was characterized by loose lending practices, we believe that the current environment for newly-issued loans presents an opportunity for investors to receive stronger risk-adjusted returns.
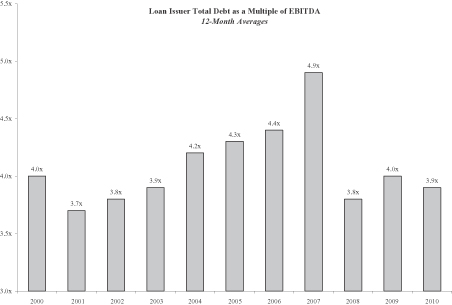
Source: S&P Leveraged Commentary & Data
7
Table of Contents
Opportunity in Small and Middle Market Private Companies
In addition to investing in senior secured and second lien secured loans generally, we believe that the market for lending to private companies, particularly small and middle market private companies within the U.S., is underserved and presents a compelling investment opportunity.
Large Target Market
According to The U.S. Census Bureau, in its most recently released economic census in 2002, there were approximately 153,000 small and middle market companies in the U.S. with annual revenues between $10 million and $2.5 billion, compared with approximately 900 companies with revenues greater than $2.5 billion. These smaller and middle market companies represent a significant portion of the growth segment of the U.S. economy and often require substantial capital investment to grow their businesses. In the same economic census mentioned above, The U.S. Census Bureau found that firms in this target market collectively generated $8.7 trillion in revenues and employed 44.3 million people. Small and middle market companies have generated a significant number of investment opportunities for investment programs managed by FB Advisor and GDFM over the past several years, and we believe that this market segment may continue to produce significant investment opportunities for us.
Limited Investment Competition
Despite the size of the market, we believe that financial difficulties and a widespread consolidation in the financial services industry have substantially reduced the number of investment firms and financial institutions lending to small and middle market companies. For example, the Federal Deposit Insurance Corporation reports that the number of federally insured financial institutions declined from approximately 15,200 in 1990 to approximately 7,800 in 2010.
We believe that lending to small and middle market companies, which are often private, generally requires a greater dedication of the lender’s time and resources compared to lending to larger companies due in part to the smaller size of each investment and the often fragmented nature of information available for disclosure from these firms. Further, many investment firms lack the breadth and scale necessary to track investment opportunities, particularly within the secondary market, in the loans of thousands of small and middle market firms, meaning that attractive investment opportunities are often overlooked. In addition, small and middle market companies may require more active monitoring and participation on the lender’s part. We believe that many large financial organizations, with relatively high cost structures, are not equipped to deal with these factors and instead emphasize services to larger corporate clients and transactions with a consequential reduction in the availability of debt financing to small and middle market companies.
Attractive Market Segment
We believe that the underserved nature of such a large segment of the market can at times create an opportunity for investment. In many environments, we believe that small and middle market companies are more likely to offer attractive economics in terms of transaction pricing, up-front and ongoing fees, prepayment penalties and more attractive security features in the form of stricter covenants and quality collateral. Further, due to a lack of coverage at many investment firms, loans to small and middle market firms tend to be priced less efficiently, potentially creating attractive opportunities for investment. Additionally, as compared to larger companies, small and middle market companies often have simpler capital structures and carry less leverage, thus aiding the structuring and negotiation process and allowing us greater flexibility in structuring favorable transactions. We believe that these factors often result in advantageous conditions in which to pursue our investment objectives of generating current income and, to a lesser extent, long-term capital appreciation.
8
Table of Contents
Characteristics of and Risks Relating to Investments in Private Companies
We invest primarily in the debt of privately held companies. Investments in private companies pose certain incremental risks as compared to investments in public companies. First, private companies have reduced access to the capital markets, resulting in diminished capital resources and ability to withstand financial distress. Second, the investments themselves may often be illiquid. As such, we may have difficulty exiting an investment promptly or at a desired price prior to maturity or outside of a normal amortization schedule. In addition, little public information generally exists about private companies. Finally, these companies often do not have third-party debt ratings or audited financial statements. We must therefore rely on the ability of FB Advisor and/or GDFM to obtain adequate information through their due diligence efforts to evaluate the creditworthiness of, and risks involved in, investing in these companies. These companies and their financial information will also generally not be subject to the Sarbanes-Oxley Act of 2002, or the Sarbanes-Oxley Act, and other rules and regulations that govern public companies that are designed to protect investors.
Investment Strategy
When identifying prospective portfolio companies, we focus primarily on the following attributes, which we believe help us generate attractive total returns with an acceptable level of risk. While these criteria provide general guidelines for our investment decisions, we caution you that, if we believe the benefits of investing are sufficiently strong, not all of these criteria necessarily will be met by each prospective portfolio company in which we choose to invest. These attributes are:
| • | Leading, defensible market positions. We seek to invest in companies that have developed strong positions within their respective markets and exhibit the potential to maintain sufficient cash flows and profitability to service our debt in a range of economic environments. We seek companies that we believe possess advantages in scale, scope, customer loyalty, product pricing, or product quality versus their competitors, thereby minimizing business risk and protecting profitability. |
| • | Investing in stable companies with positive cash flow. We seek to invest in established, stable companies with strong profitability and cash flows. Such companies, we believe, are well-positioned to maintain consistent cash flow to service and repay our loans and maintain growth in their businesses or market share. We do not intend to invest in start-up companies, turnaround situations or companies with speculative business plans. |
| • | Proven management teams. We focus on investments in which the target company has an experienced management team with an established track record of success. We typically require the portfolio companies to have in place proper incentives to align management’s goals with ours. |
| • | Private equity sponsorship. Often, we seek to participate in transactions sponsored by what we believe to be high-quality private equity firms. FB Advisor’s management team believes that a private equity sponsor’s willingness to invest significant sums of equity capital into a company is an implicit endorsement of the quality of the investment. Further, by co-investing with quality private equity firms which commit significant sums of equity capital with junior priority to our debt investments, we may benefit from having due diligence on our investments performed by both parties. Further, strong private equity sponsors with significant investments at risk have the ability and a strong incentive to contribute additional capital in difficult economic times should operational issues arise. |
| • | Diversification. We seek to diversify our portfolio broadly among issuers and industries, thereby potentially reducing the risk of a downturn in any one company or industry having a disproportionate impact on the value of our portfolio. We cannot assure you that we will be successful in this regard. |
| • | Viable exit strategy. Many of our current investments are tradable in a privately negotiated over-the-counter market, providing us a means by which we may exit our positions. We expect that a large portion of our portfolio will continue to be tradable on this secondary market for the foreseeable future, depending upon market conditions. For any investments that are not traded within a secondary |
9
Table of Contents
| market, we focus primarily on investing in companies whose business models and growth prospects offer other attractive exit possibilities, including repayment of our investments, with the potential for capital gain on any equity interests we hold, through an initial public offering of common stock, merger, sale or recapitalization. |
Competitive Advantages
We believe that we offer the following competitive advantages to our investors:
Global platform with seasoned investment professionals
FB Advisor’s management team believes that the breadth and depth of its experience, together with the wider resources of GSO’s investment team, which is dedicated to sourcing, structuring, executing, monitoring and realizing upon a broad range of private investments, as well as the specific expertise of GDFM, provides us with a significant competitive advantage in sourcing and analyzing attractive investment opportunities worldwide.
Long-term investment horizon
Unlike most private equity and venture capital funds, we will not be required to return capital to our stockholders once we exit a portfolio investment. Such funds typically can only be invested once and must be returned to investors within a specific time period. These provisions often force private equity and venture capital funds to seek liquidity events, including initial public offerings, mergers, or recapitalizations, more quickly than they otherwise might, potentially resulting in a lower return to investors. We believe that freedom from such capital return requirements, which allows us to invest using a longer-term focus, will provide us with the opportunity to increase total returns on invested capital, compared to other private company investment vehicles.
GDFM transaction sourcing capability
FB Advisor seeks to leverage GDFM’s significant access to transaction flow. GDFM seeks to generate investment opportunities through syndicate and club deals (generally, investments made by a small group of investment firms) and, subject to regulatory constraints as discussed under “Item 1. Business—Regulation,” also through GSO’s proprietary origination channels. With respect to syndicate and club deals, GDFM has built a network of relationships with commercial and investment banks, finance companies and other investment funds as a result of the long track record of its investment professionals in the leveraged finance marketplace. With respect to GDFM’s origination channel, FB Advisor seeks to leverage the global presence of GSO to generate access to a substantial amount of originated transactions with attractive investment characteristics. We believe that the broad network of GDFM will produce a significant amount of investment opportunities for us. GDFM also has a significant trading platform allowing us access to the secondary loan market for investment opportunities.
Disciplined, income-oriented investment philosophy
FB Advisor and GDFM employ a defensive investment approach focused on long-term credit performance and principal protection. This investment approach involves a multi-stage selection process for each investment opportunity, as well as ongoing monitoring of each investment made, with particular emphasis on early detection of credit deterioration. This strategy is designed to maximize current yield and minimize the risk of capital loss while maintaining the potential for long-term capital appreciation. FB Advisor’s approach seeks to produce strong returns concurrent with reduced risk by:
| • | focusing on companies it believes to have leading, defensible market positions; |
| • | engaging in extensive due diligence and credit analysis; |
| • | committing significant resources to monitor portfolio companies closely after the transaction is closed; |
10
Table of Contents
| • | participating in transactions sponsored by what it believes to be high-quality private equity firms; |
| • | investing primarily in companies with proven management teams; and |
| • | investing in established, stable companies with positive cash flow. |
Expertise across all levels of the corporate capital structure
FB Advisor and GDFM believe that their broad expertise and experience at all levels of a company’s capital structure affords us numerous approaches to managing risk while preserving the opportunity for significant returns on our investments. We attempt to capitalize on this expertise in an effort to produce and maintain an investment portfolio that will perform in a broad range of economic conditions
Operating and Regulatory Structure
Our investment activities are managed by FB Advisor and supervised by our board of directors, a majority of whom are independent. Under our investment advisory and administrative services agreement, we have agreed to pay FB Advisor an annual base management fee based on our gross assets as well as incentive fees based on our performance. See “Item 7. Management’s Discussion and Analysis of Financial Condition and Results of Operations—Contractual Obligations” for a description of the fees we pay to FB Advisor.
FB Advisor provides us with general ledger accounting, fund accounting, and investor and other administrative services. FB Advisor has contracted with BNY Mellon Asset Servicing (formerly, PNC Global Investment Servicing) to provide various accounting and administrative services. FB Advisor has also contracted with Pine Hill Group, LLC, to provide us with a chief financial officer, Charles Jacobson, the Managing Director of that firm, and has contracted with Vigilant Compliance Services, LLC, to provide us with a chief compliance officer, Salvatore Faia, a principal with that firm.
On March 14, 2011, our board of directors appointed William Goebel to serve as our full-time chief financial officer, effective upon the resignation from such position by Mr. Jacobson. In connection with Mr. Goebel’s appointment, Mr. Jacobson tendered his resignation, which will take effect immediately after the filing of this annual report on Form 10-K. Mr. Goebel is employed by Franklin Square Holdings, an affiliate of FB Advisor. Mr. Jacobson’s resignation and Mr. Goebel’s appointment were effected in accordance with our board of directors’ determination that the services of a full-time chief financial officer were in our best interests.
As a business development company, we are required to comply with certain regulatory requirements. Also, while we are permitted to finance investments using debt, our ability to use debt will be limited in certain significant respects. Within the limits of existing regulation, we will adjust our use of debt, according to market conditions, to the level we believe will allow us to generate maximum risk-adjusted returns. See “Item 1. Business—Regulation.” We have elected to be treated for federal income tax purposes as a RIC under Subchapter M of the Code.
Investment Types
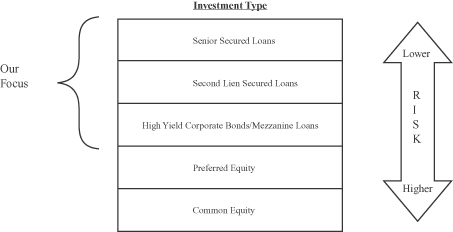
We focus primarily on investments in debt securities, including senior secured loans, second lien secured loans and, to a lesser extent, mezzanine loans. FB Advisor will seek to tailor our investment focus as market conditions evolve. Depending on market conditions, we may increase or decrease our exposure to less senior portions of the capital structure, where returns tend to be stronger in a more stable or growing economy, but less secure in weak economic environments. Below is a diagram illustrating where these investments lie in a typical portfolio company’s capital structure. Senior secured debt is situated at the top of the capital structure, and typically has the first claim on the assets and cash flows of the company, followed by second lien secured debt, mezzanine debt, preferred equity and finally common equity. Due to this priority of cash flows, an investment’s risk increases as it moves further down the capital structure. Investors are usually compensated for this risk
11
Table of Contents
associated with junior status in the form of higher returns, either through higher interest payments or potentially higher capital appreciation. We rely on FB Advisor’s and GDFM’s experience to structure investments, possibly using all levels of the capital structure, which we believe will perform in a broad range of economic environments.
Typical Leveraged Capital Structure Diagram
Senior Secured Loans
Senior secured loans are situated at the top of the capital structure. Because these loans have priority in payment, they carry the least risk among all investments in a firm. Generally, our senior secured loans are expected to have maturities of three to seven years, offer some form of amortization, and have first priority security interests in the assets of the borrower. Generally, we expect that the interest rate on our senior secured loans typically will have variable rates ranging between 2.0% and 6.0% over a standard benchmark, such as the prime rate or the London Interbank Offered Rate (LIBOR).
Second Lien Secured Loans
Second lien secured loans are immediately junior to senior secured loans and have substantially the same maturities, collateral and covenant structures as senior secured loans. Second lien secured loans, however, are granted a second priority security interest in the assets of the borrower. In return for this junior ranking, second lien secured loans generally offer higher returns compared to senior secured debt. These higher returns come in the form of higher interest and in some cases the potential for equity participation through warrants, though to a lesser extent than with mezzanine loans. Generally, we expect these loans to carry a fixed or a floating current yield of 4.0% to 8.0% over the prime rate or LIBOR. In addition, we may receive additional returns from any warrants we may receive in connection with these investments.
Mezzanine Loans
In addition to senior secured and second lien secured loans, we also may invest a portion of our assets in mezzanine loans. Mezzanine loans usually rank junior in priority of payment to senior secured loans and second lien secured loans and are often unsecured, but are situated above preferred equity and common stock in the capital structure. In return for their junior status compared to senior secured loans and second lien secured loans, mezzanine loans typically offer higher returns through both higher interest rates and possible equity ownership in the form of warrants, enabling the lender to participate in the capital appreciation of the borrower. These
12
Table of Contents
warrants typically require only a nominal cost to exercise. We intend to generally target mezzanine loans with interest-only payments throughout the life of the loan, with the principal due at maturity. Typically, mezzanine loans have maturities of five to ten years. Generally, we expect these loans to carry a fixed or a floating current yield of 6.0% to 12.0% over the prime rate or LIBOR. In addition, we may receive additional returns from any warrants we may receive in connection with these investments. In some cases, a portion of the total interest may accrue or be paid in kind.
Equity and Equity-Related Securities
While we intend to maintain our focus on investments in debt securities, from time to time, when we see the potential for extraordinary gain, or in connection with securing particularly favorable terms in a debt investment, we may enter into non-control investments in preferred or common equity, typically in conjunction with a private equity sponsor we believe to be of high quality. In addition, we typically receive the right to make equity investments in a portfolio company whose debt securities we hold in connection with the next equity financing round for that company. This right will provide us with the opportunity to further enhance our returns over time through equity investments in our portfolio companies. In addition, we may hold equity-related securities consisting primarily of warrants or other equity interests generally obtained in connection with our mezzanine loans. In the future, we may achieve liquidity through a merger or acquisition of a portfolio company, a public offering of a portfolio company’s stock or by exercising our right, if any, to require a portfolio company to repurchase the equity-related securities we hold. With respect to any preferred or common equity investments, we expect to target an annual investment return of at least 25%.
Cash
In addition, we may maintain a certain level of cash or equivalent instruments to make follow-on investments if necessary in existing portfolio companies or to take advantage of new opportunities.
Comparison of Targeted Debt Investments to Corporate Bonds
Loans to private companies are debt instruments that can be compared to corporate bonds to aid an investor’s understanding. As with corporate bonds, loans to private companies can range in credit quality depending on security-specific factors, including total leverage, amount of leverage senior to the security in question, variability in the issuer’s cash flows, the quality of assets securing debt and the degree to which such assets cover the subject company’s debt obligations. As is the case in the corporate bond market, we will require greater returns for securities that we perceive to carry increased risk. The companies in which we invest may be leveraged, often as a result of leveraged buyouts or other recapitalization transactions, and, in certain cases, will not be rated by national rating agencies. We believe that our targeted debt investments typically will carry ratings from an NRSRO, and that such ratings generally will be below investment grade (rated lower than “Baa3” by Moody’s Investors Service or lower than “BBB-” by Standard & Poor’s Corporation). To the extent we make unrated investments, we believe that such investments would likely receive similar ratings if they were to be examined by a NRSRO. Compared to below-investment grade corporate bonds that are typically available to the public, our targeted senior secured and second lien secured loan investments are higher in the capital structure, have priority in receiving payment, are secured by the issuer’s assets, allowing the lender to seize collateral if necessary, and generally exhibit higher rates of recovery in the event of default. Corporate bonds, on the other hand, are often unsecured obligations of the issuer.
The market for loans to private companies possesses several key differences compared to the corporate bond market. For instance, due to a possible lack of debt ratings for certain small and middle market firms, and also due to the reduced availability of information for private companies, investors must conduct extensive due diligence investigations before committing to an investment. This intensive due diligence process gives the investor significant access to management, which is often not possible in the case of corporate bondholders, who rely on underwriters, debt rating agencies and publicly available information for due diligence reviews and
13
Table of Contents
monitoring of corporate issuers. While holding these investments, private debt investors often receive monthly or quarterly updates on the portfolio company’s financial performance, along with possible representation on the company’s board of directors, which allows the investor to take remedial action quickly if conditions happen to deteriorate. Due to reduced liquidity, the relative scarcity of capital and extensive due diligence and expertise required on the part of the investor, we believe that private debt securities typically offer higher returns than corporate bonds of equivalent credit quality.
Sources of Income
The primary means through which our stockholders will receive a return of value is through interest income, dividends and capital gains generated by our investments. In addition to these sources of income, we may receive fees paid by our portfolio companies, including one-time closing fees paid at the time each investment is made and monitoring fees paid throughout the term of our investments. Closing fees typically range from 1.0% to 2.0% of the purchase price of an investment, while monitoring fees generally range from 0.25% to 1.0% of the purchase price of an investment annually.
Risk Management
We seek to limit the downside potential of our investment portfolio by:
| • | applying our investment strategy guidelines for portfolio investments; |
| • | requiring a total return on investments (including both interest and potential appreciation) that adequately compensates us for credit risk; |
| • | diversifying our portfolio, size permitting, with an adequate number of companies, across different industries, with different types of collateral; and |
| • | negotiating or seeking out loans with covenants that protect us while affording portfolio companies flexibility in managing their businesses consistent with preservation of capital. |
Such restrictions may include affirmative and negative covenants, default penalties, lien protection, change of control provisions and board rights. We may also enter into interest rate hedging transactions at the sole discretion of FB Advisor. Such transactions will enable us to selectively modify interest rate exposure as market conditions dictate.
Affirmative Covenants
Affirmative covenants require borrowers to take actions that are meant to ensure the solvency of the company, facilitate the lender’s monitoring of the borrower, and ensure payment of interest and loan principal due to lenders. Examples of affirmative covenants include requiring the firm to maintain adequate insurance, accounting and tax records, and to produce frequent financial reports for the benefit of the lender.
Negative Covenants
Negative covenants impose restrictions on the borrower and are meant to protect lenders from actions that the borrower may take that could harm the credit quality of the lender’s investments. Examples of negative covenants include restrictions on the payment of dividends and restrictions on the issuance of additional debt without the lender’s approval. In addition, certain covenants restrict a borrower’s activities by requiring it to meet certain earnings interest coverage ratio and leverage ratio requirements. These covenants are also referred to as financial or maintenance covenants.
14
Table of Contents
Investment Process
The investment professionals employed by FB Advisor and GDFM have spent their careers developing the resources necessary to invest in private companies. Our transaction process is highlighted below.
Our Transaction Process

Sourcing
In order to source transactions, FB Advisor seeks to leverage GDFM’s significant access to transaction flow, along with GDFM’s trading platform, which allows for access to the syndicated loan market, a key source of investment opportunities for us. GDFM seeks to generate investment opportunities through its trading platform, through syndicate and club deals and, subject to regulatory constraints, through GSO’s proprietary origination channels. With respect to syndicate and club deals, GDFM has built a network of relationships with commercial and investment banks, finance companies and other investment funds as a result of the long track record of its investment professionals in the leveraged finance marketplace. With respect to GDFM’s origination channel, FB Advisor seeks to leverage the global presence of GSO to generate access to originated transactions with attractive investment characteristics. We believe that the broad network of GDFM will produce a significant pipeline of investment opportunities for us.
Evaluation
Initial Review. In its initial review of an investment opportunity to present to FB advisor, GDFM’s transaction team examines information furnished by the target company and external sources, including rating agencies, if applicable, to determine whether the investment meets our basic investment criteria and other guidelines specified by FB Advisor, within the context of proper portfolio diversification, and offers an acceptable probability of attractive returns with identifiable downside risk. For the majority of loans available on the secondary market, a comprehensive credit analysis is conducted and continuously maintained by a dedicated GDFM research analyst, the results of which are available for the transaction team to review. In the case of a primary loan transaction, FB Advisor and GDFM conduct detailed due diligence investigations as necessary.
Credit Analysis/Due Diligence. Before undertaking an investment, the transaction team conducts a thorough due diligence review of the opportunity to ensure the company fits our investment strategy, which may include:
| • | a full operational analysis to identify the key risks and opportunities of the target’s business, including a detailed review of historical and projected financial results; |
| • | a detailed analysis of industry dynamics, competitive position, regulatory, tax and legal matters; |
| • | on-site visits, if deemed necessary; |
| • | background checks to further evaluate management and other key personnel; |
| • | a review by legal and accounting professionals, environmental or other industry consultants, if necessary; |
| • | financial sponsor due diligence, including portfolio company and lender reference checks, if necessary; and |
| • | a review of management’s experience and track record. |
15
Table of Contents
When possible, our advisory team seeks to structure transactions in such a way that our target companies are required to bear the costs of due diligence, including those costs related to any outside consulting work we may require.
Execution
Recommendation. FB Advisor has engaged GDFM to identify and recommend investment opportunities for its approval. GDFM seeks to maintain a defensive approach toward its investment recommendations by emphasizing risk control in its transaction process, which includes (i) the pre-review of each opportunity by one of its portfolio managers to assess the general quality, value and fit relative to our portfolio, (ii) where possible, transaction structuring with a focus on preservation of capital in varying economic environments and (iii) ultimate approval of investment recommendations by GDFM’s investment committee.
Approval. After completing its internal transaction process, GDFM makes formal recommendations for review and approval by FB Advisor. In connection with its recommendation, it transmits any relevant underwriting material and other information pertinent to the decision-making process. In addition, GDFM makes its staff available to answer inquiries by FB Advisor in connection with its recommendations. The consummation of a transaction requires unanimous approval of the members of FB Advisor’s investment committee.
Monitoring
Portfolio Monitoring. FB Advisor, with the help of GDFM, monitors our portfolio with a focus toward anticipating negative credit events. To maintain portfolio company performance and help to ensure a successful exit, FB Advisor and GDFM work closely with the lead equity sponsor, loan syndicator, portfolio company management, consultants, advisers and other lenders to discuss financial position, compliance with covenants, financial requirements and execution of the company’s business plan. In addition, depending on the size, nature and performance of the transaction, we may occupy a seat or serve as an observer on a portfolio company’s board of directors.
Typically, FB Advisor and GDFM receive financial reports detailing operating performance, sales volumes, margins, cash flows, financial position and other key operating metrics on a quarterly basis from our portfolio companies. FB Advisor and GDFM use these data, combined with due diligence gained through contact with the company’s customers, suppliers, competitors, market research, and other methods, to conduct an ongoing, rigorous assessment of the company’s operating performance and prospects.
In addition to various risk management and monitoring tools, FB Advisor uses an investment rating system to characterize and monitor the expected level of returns on each investment in our portfolio. FB Advisor uses an investment rating scale of 1 to 5. The following is a description of the conditions associated with each investment rating:
| Investment Rating |
Summary Description | |
| 1 | Investment exceeding expectations and/or capital gain expected. | |
| 2 | Performing investment generally executing in accordance with the portfolio company’s business plan—full return of principal and interest expected. | |
| 3 | Performing investment requiring closer monitoring. | |
| 4 | Underperforming investment—some loss of interest or dividend expected, but still expecting a positive return on investment. | |
| 5 | Underperforming investment with expected loss of interest and some principal. | |
16
Table of Contents
FB Advisor monitors and, when appropriate, changes the investment ratings assigned to each investment in our portfolio. In connection with valuing our assets, our board of directors reviews these investment ratings on a quarterly basis. In the event that our board of directors or advisory team determines that an investment is underperforming, or circumstances suggest that the risk associated with a particular investment has significantly increased, they attempt to sell the asset in the secondary market, if applicable, or to implement a plan to attempt to exit the investment or to correct the situation.
The following table shows the distribution of our debt investments on the 1 to 5 investment rating scale at fair value as of December 31, 2010 and 2009:
| December 31, 2010 | December 31, 2009 | |||||||||||||||
| Investment Rating |
Investments at Fair Value |
Percentage of Portfolio |
Investments at Fair Value |
Percentage of Portfolio |
||||||||||||
| 1 |
$ | 38,899 | 5 | % | $ | — | — | |||||||||
| 2 |
682,861 | 93 | % | 98,848 | 98 | % | ||||||||||
| 3 |
11,384 | 2 | % | — | — | |||||||||||
| 4 |
436 | 0 | % | 1,744 | 2 | % | ||||||||||
| 5 |
— | — | — | — | ||||||||||||
| $ | 733,580 | 100 | % | $ | 100,592 | 100 | % | |||||||||
The amount of the portfolio in each grading category may vary substantially from period to period resulting primarily from changes in the composition of the portfolio as a result of new investment, repayment, and exit activities. In addition, changes in the grade of investments may be made to reflect our expectation of performance and changes in investment values.
Valuation Process. Each quarter, we value investments in our portfolio, and such values are disclosed each quarter in reports filed with the SEC. Investments for which market quotations are readily available are recorded at such market quotations. With respect to investments for which market quotations are not readily available, our board of directors determines the fair value of investments in good faith utilizing the input of our valuation committee, FB Advisor, and the input of any other professionals or materials that our board of directors deems worthy and relevant, including GDFM and independent third-party valuations, if applicable. See “Item 7. Management’s Discussion and Analysis of Financial Condition and Results of Operations—Valuation of Portfolio Investments.”
Managerial Assistance. As a business development company, we will offer, and must provide upon request, managerial assistance to certain of our portfolio companies. This assistance could involve, among other things, monitoring the operations of our portfolio companies, participating in board and management meetings, consulting with and advising officers of portfolio companies and providing other organizational and financial guidance. Depending on the nature of the assistance required, FB Advisor or GDFM will provide such managerial assistance on our behalf to portfolio companies that request this assistance. To the extent fees are paid for these services, we, rather than FB Advisor, will retain any fees paid for such assistance.
Exit
Many of our current investments are tradable in a privately negotiated over-the-counter market, providing us a means by which we may exit our positions. We expect that a large portion of our portfolio will continue to be tradable on this secondary market for the foreseeable future, depending on market conditions. For any investments that are not tradable within this market, we focus primarily on investing in companies whose business models and growth prospects offer attractive exit possibilities, including repayment of our investments, with the potential for capital gain on any equity interests we hold, through an initial public offering of common stock, merger, a sale or a recapitalization.
17
Table of Contents
Financing Arrangements
On January 28, 2011, Broad Street Funding LLC, or Broad Street, our wholly-owned financing subsidiary, and Deutsche Bank AG, New York Branch, or Deutsche Bank, entered into an amended and restated multi-lender, syndicated revolving credit facility, or the credit facility, which amended and restated the revolving credit facility Broad Street originally entered into with Deutsche Bank on March 10, 2010 and the amendments thereto, or the original credit facility. Deutsche Bank is a lender and serves as administrative agent under the credit facility.
The credit facility provides for borrowings in an aggregate amount up to $340,000. Pursuant to the terms of the credit facility, borrowings thereunder may be designated as Tranche A borrowings in an amount up to $240,000 (referred to herein as the Tranche A Commitment) or as Tranche C borrowings in an amount up to $100,000 (referred to herein as the Tranche C Commitment). The credit facility also provides for Tranche B borrowings in an amount up to $100,000 (referred to herein as the Tranche B Commitment), but there are currently no Tranche B Commitments outstanding. All Tranche A Commitments bear interest at the rate of LIBOR + 2.23% per annum and will mature and be due and payable on March 10, 2012. All Tranche C Commitments bear interest at the rate of LIBOR + 1.85% per annum and will mature and be due and payable on March 10, 2012. In connection with the amendment and restatement of the original credit facility, a $100,000 Tranche B Commitment that was provided under the original credit facility by Deutsche Bank to Broad Street on an uncommitted basis was converted into a $100,000 Tranche C Commitment provided by a new lender on a committed basis.
In connection with entering into the original credit facility, and from time to time thereafter, we have transferred debt securities to Broad Street as a contribution to capital and retain a residual interest in the contributed debt securities through our ownership of Broad Street. We may contribute additional debt securities to Broad Street from time to time and Broad Street may purchase additional debt securities from various sources. Broad Street has appointed us to manage its portfolio of debt securities pursuant to the terms of an investment management agreement. Broad Street’s obligations to the lenders under the credit facility are secured by a first priority security interest in substantially all of the assets of Broad Street, including its portfolio of debt securities.
As of December 31, 2010, $297,201 was outstanding under the credit facility. See “Item 7. Management’s Discussion and Analysis of Financial Condition and Results of Operations—Financial Condition, Liquidity and Capital Resources” for a more detailed discussion of the terms of the credit facility.
On March 18, 2011, Arch Street Funding LLC, or Arch Street, our newly-formed, wholly-owned financing subsidiary, entered into a total return swap, or TRS, for senior secured floating rate loans with Citibank, N.A., or Citibank.
The obligations of Arch Street under the TRS are non-recourse to us and our exposure under the TRS is limited to the value of our investment in Arch Street, which generally will equal the value of cash collateral provided by Arch Street under the TRS. Pursuant to the terms of the TRS, Arch Street may select a portfolio of loans with a maximum market value of $200,000. Arch Street is required to initially cash collateralize a specified percentage of each loan (generally between 20% and 25% of the market value of such loan) included under the TRS in accordance with margin requirements described in the agreements governing the TRS.
A TRS is a commonly used form of financing arrangement that provides economic exposure similar to the exposure under Broad Street’s credit facility. Because of the unique structure of a TRS, a TRS often offers lower financing costs than are offered through more traditional borrowing arrangements.
Generally, pursuant to a TRS, one party agrees to make periodic payments to another party based on the change in the market value of the assets underlying the TRS, which may include a specified security, basket of securities or securities indices during the specified period, in return for periodic payments based on a fixed or
18
Table of Contents
variable interest rate. A TRS is typically used to obtain exposure to a security or market without owning or taking physical custody of such security or investing directly in such market. A TRS may effectively add leverage to our portfolio because, in addition to our total net assets, we would be subject to investment exposure on the amount of securities subject to the TRS.
The TRS with Citibank enables us, through our ownership of Arch Street, to obtain the economic benefit of owning the loans subject to the TRS, without actually owning them, in return for an interest-type payment to Citibank. As such, the TRS is analogous to Arch Street borrowing funds to acquire loans and incurring interest expense to a lender.
Pursuant to the terms of an investment management agreement that we have entered into with Arch Street, we act as the manager of the rights and obligations of Arch Street under the TRS, including selecting the specific loans to be included in the portfolio of loans subject to the TRS. The terms of the TRS are governed by a set of agreements between Arch Street and Citibank, which collectively establish the TRS, and are collectively referred to herein as the TRS Agreement.
Pursuant to the terms of the TRS Agreement, Arch Street may select a portfolio of loans with a maximum market value (determined at the time each such loan becomes subject to the TRS) of $200,000. Each individual loan, and the portfolio of loans taken as a whole, must meet criteria described in the TRS Agreement. Arch Street will receive from Citibank all interest and fees payable in respect of the loans included in the portfolio. Arch Street will pay to Citibank interest at a rate equal to one-month LIBOR + 1.25% per annum. In addition, upon the termination or repayment of any loan subject to the TRS, Arch Street will either receive from Citibank the appreciation in the value of such loan, or pay to Citibank any depreciation in the value of such loan. Arch Street may be required to post additional collateral from time to time as a result of a decline in the mark-to-market value of the portfolio of loans subject to the TRS.
Citibank may terminate the TRS on or after the second anniversary of the effectiveness of the TRS. Arch Street may terminate the TRS at any time upon providing no more than 30 days, and no less than 10 days, prior notice to Citibank. Any termination prior to the second anniversary of the effectiveness of the TRS will result in payment of an early termination fee to Citibank. Arch Street is required to pay a minimum usage fee in connection with the TRS. Arch Street will also pay Citibank customary fees in connection with the establishment and maintenance of the TRS.
Regulation
We have elected to be regulated as a business development company under the 1940 Act. The 1940 Act contains prohibitions and restrictions relating to transactions between business development companies and their affiliates, principal underwriters and affiliates of those affiliates or underwriters. The 1940 Act requires that a majority of the directors be persons other than “interested persons,” as that term is defined in the 1940 Act. In addition, the 1940 Act provides that we may not change the nature of our business so as to cease to be, or to withdraw our election as, a business development company unless approved by a majority of our outstanding voting securities.
The 1940 Act defines “a majority of the outstanding voting securities” as the lesser of (i) 67% or more of the voting securities present at a meeting if the holders of more than 50% of our outstanding voting securities are present or represented by proxy or (ii) 50% of our voting securities.
We will generally not be able to issue and sell our common stock at a price below net asset value per share. See “Item 1A. Risk Factors—Risks Related to Business Development Companies—Regulations governing our operation as a business development company and RIC will affect our ability to raise, and the way in which we raise additional capital or borrow for investment purposes, which may have a negative effect on our growth.” We may, however, sell our common stock, or warrants, options or rights to acquire our common stock, at a price below the then-current net asset value of our common stock if our board of directors determines that such sale is
19
Table of Contents
in our best interests and the best interests of our stockholders, and our stockholders approve such sale. In addition, we may generally issue new shares of our common stock at a price below net asset value in rights offerings to existing stockholders, in payment of dividends and in certain other limited circumstances.
As a business development company, we are not permitted to invest in any portfolio company in which FB Advisor or any of its affiliates currently have an investment or to make any co-investments with FB Advisor or any of their affiliates without an exemptive order from the SEC. We are seeking an exemptive order. However, there is no assurance that we will obtain such relief. As a result, we could be limited in our ability to invest in certain portfolio companies in which GDFM or any of its affiliates are investing or are invested.
Qualifying Assets
Under the 1940 Act, a business development company may not acquire any asset other than assets of the type listed in Section 55(a) of the 1940 Act, which are referred to as qualifying assets, unless, at the time the acquisition is made, qualifying assets represent at least 70% of the company’s total assets. The principal categories of qualifying assets relevant to our business are any of the following:
| 1. | Securities purchased in transactions not involving any public offering from the issuer of such securities, which issuer (subject to certain limited exceptions) is an eligible portfolio company, or from any person who is, or has been during the preceding 13 months, an affiliated person of an eligible portfolio company, or from any other person, subject to such rules as may be prescribed by the SEC. An eligible portfolio company is defined in the 1940 Act as any issuer which: |
| a. | is organized under the laws of, and has its principal place of business in, the United States; |
| b. | is not an investment company (other than a small business investment company wholly owned by the business development company) or a company that would be an investment company but for certain exclusions under the 1940 Act; and |
| c. | satisfies any of the following: |
| i. | does not have any class of securities that is traded on a national securities exchange; |
| ii. | has a class of securities listed on a national securities exchange, but has an aggregate market value of outstanding voting and non-voting common equity of less than $250 million; |
| iii. | is controlled by a business development company or a group of companies including a business development company and the business development company has an affiliated person who is a director of the eligible portfolio company; or |
| iv. | is a small and solvent company having total assets of not more than $4.0 million and capital and surplus of not less than $2.0 million. |
| 2. | Securities of any eligible portfolio company that we control. |
| 3. | Securities purchased in a private transaction from a U.S. issuer that is not an investment company or from an affiliated person of the issuer, or in transactions incident thereto, if the issuer is in bankruptcy and subject to reorganization or if the issuer, immediately prior to the purchase of its securities was unable to meet its obligations as they came due without material assistance other than conventional lending or financing arrangements. |
| 4. | Securities of an eligible portfolio company purchased from any person in a private transaction if there is no ready market for such securities and we already own 60% of the outstanding equity of the eligible portfolio company. |
| 5. | Securities received in exchange for or distributed on or with respect to securities described in (1) through (4) above, or pursuant to the exercise of warrants or rights relating to such securities. |
| 6. | Cash, cash equivalents, U.S. government securities or high-quality debt securities maturing in one year or less from the time of investment. |
20
Table of Contents
In addition, a business development company must have been organized and have its principal place of business in the United States and must be operated for the purpose of making investments in the types of securities described in (1), (2) or (3) above.
Managerial Assistance to Portfolio Companies
In order to count portfolio securities as qualifying assets for the purpose of the 70% test, we must either control the issuer of the securities or must offer to make available to the issuer of the securities (other than small and solvent companies described above) significant managerial assistance; except that, where we purchase such securities in conjunction with one or more other persons acting together, one of the other persons in the group may make available such managerial assistance. Making available managerial assistance means, among other things, any arrangement whereby the business development company, through its directors, officers or employees, offers to provide, and, if accepted, does so provide, significant guidance and counsel concerning the management, operations or business objectives and policies of a portfolio company.
Temporary Investments
Pending investment in other types of “qualifying assets,” as described above, our investments may consist of cash, cash equivalents, U.S. government securities or high-quality debt securities maturing in one year or less from the time of investment, which we refer to, collectively, as temporary investments, so that 70% of our assets are qualifying assets. Typically, we will invest in U.S. Treasury bills or in repurchase agreements, provided that such agreements are fully collateralized by cash or securities issued by the U.S. government or its agencies. A repurchase agreement involves the purchase by an investor, such as us, of a specified security and the simultaneous agreement by the seller to repurchase it at an agreed-upon future date and at a price that is greater than the purchase price by an amount that reflects an agreed-upon interest rate. There is no percentage restriction on the proportion of our assets that may be invested in such repurchase agreements. However, if more than 25% of our total assets constitute repurchase agreements from a single counterparty, we would not meet the Diversification Tests in order to qualify as a RIC for federal income tax purposes. Thus, we do not intend to enter into repurchase agreements with a single counterparty in excess of this limit. FB Advisor will monitor the creditworthiness of the counterparties with which we enter into repurchase agreement transactions.
Senior Securities
We are permitted, under specified conditions, to issue multiple classes of debt and one class of stock senior to our common stock if our asset coverage, as defined in the 1940 Act, is at least equal to 200% immediately after each such issuance. In addition, while any senior securities remain outstanding, we must make provisions to prohibit any distribution to our stockholders or the repurchase of such securities or shares unless we meet the applicable asset coverage ratios at the time of the distribution or repurchase. We may also borrow amounts up to 5% of the value of our total assets for temporary or emergency purposes without regard to asset coverage. For a discussion of the risks associated with leverage, see “Item 1A. Risk Factors—Risks Related to Business Development Companies—Regulations governing our operation as a business development company and RIC will affect our ability to raise, and the way in which we raise additional capital or borrow for investment purposes, which may have a negative effect on our growth.”
Code of Ethics
We have adopted a code of ethics pursuant to Rule 17j-1 under the 1940 Act that establishes procedures for personal investments and restricts certain personal securities transactions. Personnel subject to the code may invest in securities for their personal investment accounts, including securities that may be purchased or held by us, so long as such investments are made in accordance with the code’s requirements. We have attached our code of ethics as an exhibit to the registration statement of which our prospectus is a part. You may also read and copy the code of ethics at the SEC’s Public Reference Room located at 100 F Street, N.E., Washington, D.C. 20549.
21
Table of Contents
You may obtain information on the operation of the Public Reference Room by calling the SEC at 1-800-SEC-0330. In addition, the code of ethics is available on the EDGAR Database on the SEC’s Internet site at www.sec.gov.
Compliance Policies and Procedures
We and FB Advisor have adopted and implemented written policies and procedures reasonably designed to prevent violation of the federal securities laws and are required to review these compliance policies and procedures annually for their adequacy and the effectiveness of their implementation. Our chief compliance officer is responsible for administering these policies and procedures.
Proxy Voting Policies and Procedures
We have delegated our proxy voting responsibility to FB Advisor. The proxy voting policies and procedures of FB Advisor are set forth below. The guidelines are reviewed periodically by FB Advisor and our non-interested directors, and, accordingly, are subject to change.
Introduction
As an investment adviser registered under the Advisers Act, FB Advisor has a fiduciary duty to act solely in the best interests of its clients. As part of this duty, it recognizes that it must vote client securities in a timely manner free of conflicts of interest and in the best interests of its clients.
These policies and procedures for voting proxies for the investment advisory clients of FB Advisor are intended to comply with Section 206 of, and Rule 206(4)-6 under, the Advisers Act.
Proxy Policies
FB Advisor will vote proxies relating to our securities in the best interest of its clients’ stockholders. It will review on a case-by-case basis each proposal submitted for a stockholder vote to determine its impact on the portfolio securities held by its clients. Although FB Advisor will generally vote against proposals that may have a negative impact on its clients’ portfolio securities, it may vote for such a proposal if there exists compelling long-term reasons to do so.
The proxy voting decisions of FB Advisor are made by the senior officers who are responsible for monitoring each of its clients’ investments. To ensure that its vote is not the product of a conflict of interest, it will require that: (a) anyone involved in the decision-making process disclose to its chief compliance officer any potential conflict that he or she is aware of and any contact that he or she has had with any interested party regarding a proxy vote; and (b) employees involved in the decision making process or vote administration are prohibited from revealing how FB Advisor intends to vote on a proposal in order to reduce any attempted influence from interested parties.
Proxy Voting Records
You may obtain information, without charge, regarding how we voted proxies with respect to our portfolio securities by making a written request for proxy voting information to: Chief Compliance Officer, Cira Centre, 2929 Arch Street, Suite 675, Philadelphia, Pennsylvania 19104.
22
Table of Contents
Other
We will be periodically examined by the SEC for compliance with the 1940 Act.
We are required to provide and maintain a bond issued by a reputable fidelity insurance company to protect us against larceny and embezzlement. Furthermore, as a business development company, we are prohibited from protecting any director or officer against any liability to us or our stockholders arising from willful misconduct, bad faith, gross negligence or reckless disregard of the duties involved in the conduct of such person’s office.
Securities Exchange Act and Sarbanes-Oxley Act Compliance
We are subject to the reporting and disclosure requirements of the Securities Exchange Act of 1934, as amended, or the Exchange Act, including the filing of quarterly, annual and current reports, proxy statements and other required items. In addition, we are subject to the Sarbanes-Oxley Act, which imposes a wide variety of regulatory requirements on publicly-held companies and their insiders. Many of these requirements affect us. For example:
| • | pursuant to Rule 13a-14 of the Exchange Act, our chief executive officer and chief financial officer are required to certify the accuracy of the financial statements contained in our periodic reports; |
| • | pursuant to Item 307 of Regulation S-K, our periodic reports are required to disclose our conclusions about the effectiveness of our disclosure controls and procedures; and |
| • | pursuant to Rule 13a-15 of the Exchange Act, our management is required to prepare a report regarding its assessment of our internal control over financial reporting. |
The Sarbanes-Oxley Act requires us to review our current policies and procedures to determine whether we comply with the Sarbanes-Oxley Act and the regulations promulgated thereunder. We monitor our compliance with all regulations that are adopted under the Sarbanes-Oxley Act and take actions necessary to ensure that we are in compliance therewith. In addition, we have voluntarily elected to comply with Section 404(b) of the Sarbanes-Oxley Act, and have engaged our independent registered public accounting firm to audit our internal control over financial reporting.
Taxation as a Regulated Investment Company
We have elected, effective as of the date of our formation, to be treated as a RIC under Subchapter M of the Code. As a RIC, we generally will not have to pay corporate-level federal income taxes on any income that we distribute to our stockholders from our tax earnings and profits. To maintain our qualification as a RIC, we must, among other things, meet certain source-of-income and asset diversification requirements (as described below). In addition, in order to maintain RIC tax treatment, we must distribute to our stockholders, for each taxable year, at least 90% of our “investment company taxable income,” which is generally our net ordinary income plus the excess, if any, of realized net short-term capital gains over realized net long-term capital losses, or the Annual Distribution Requirement.
If we:
| • | maintain our qualification as a RIC; and |
| • | satisfy the Annual Distribution Requirement, |
then we will not be subject to federal income tax on the portion of our income we distribute (or are deemed to distribute) to stockholders. We will be subject to U.S. federal income tax at the regular corporate rates on any income or capital gains not distributed (or deemed distributed) to our stockholders.
23
Table of Contents
We will be subject to a 4% nondeductible federal excise tax on certain undistributed income unless we distribute in a timely manner an amount at least equal to the sum of (1) 98% of our net ordinary income for each calendar year, (2) 98.2% of our capital gain net income for the one-year period ending October 31 in that calendar year and (3) any income recognized, but not distributed, in preceding years and on which we paid no federal income tax, or the Excise Tax Avoidance Requirement. We generally will endeavor in each taxable year to avoid any U.S. federal excise tax on our earnings.
In order to maintain our qualification as a RIC for federal income tax purposes, we must, among other things:
| • | continue to qualify as a business development company under the 1940 Act at all times during each taxable year; |
| • | derive in each taxable year at least 90% of our gross income from dividends, interest, payments with respect to certain securities, loans, gains from the sale of stock or other securities, net income from certain “qualified publicly traded partnerships,” or other income derived with respect to our business of investing in such stock or securities, or the 90% Income Test; and |
| • | diversify our holdings so that at the end of each quarter of the taxable year: |
| • | at least 50% of the value of our assets consists of cash, cash equivalents, U.S. Government securities, securities of other RICs, and other securities if such other securities of any one issuer do not represent more than 5% of the value of our assets or more than 10% of the outstanding voting securities of the issuer; and |
| • | no more than 25% of the value of our assets is invested in the securities, other than U.S. government securities or securities of other RICs, of one issuer, of two or more issuers that are controlled, as determined under applicable Code rules, by us and that are engaged in the same or similar or related trades or businesses or of certain “qualified publicly traded partnerships,” or the Diversification Tests. |
For federal income tax purposes, we may be required to recognize taxable income in circumstances in which we do not receive a corresponding payment in cash. For example, if we hold debt obligations that are treated under applicable tax rules as having original issue discount (such as debt instruments with PIK interest or, in certain cases, increasing interest rates or debt instruments that were issued with warrants), we must include in income each year a portion of the original issue discount that accrues over the life of the obligation, regardless of whether cash representing such income is received by us in the same taxable year. We may also have to include in income other amounts that we have not yet received in cash, such as deferred loan origination fees that are paid after origination of the loan or are paid in non-cash compensation such as warrants or stock. We anticipate that a portion of our income may constitute original issue discount or other income required to be included in taxable income prior to receipt of cash.
Because any original issue discount or other amounts accrued will be included in our investment company taxable income for the year of the accrual, we may be required to make a distribution to our stockholders in order to satisfy the Annual Distribution Requirement, even though we will not have received any corresponding cash amount. As a result, we may have difficulty meeting the annual distribution requirement necessary to obtain and maintain RIC tax treatment under the Code. We may have to sell some of our investments at times and/or at prices we would not consider advantageous, raise additional debt or equity capital or forgo new investment opportunities for this purpose. If we are not able to obtain cash from other sources, we may fail to qualify for RIC tax treatment and thus become subject to corporate-level income tax.
Although we do not presently expect to do so, we are authorized to borrow funds and to sell assets in order to satisfy distribution requirements. However, under the 1940 Act, we are not permitted to make distributions to our stockholders while our debt obligations and other senior securities are outstanding unless certain “asset
24
Table of Contents
coverage” tests are met. Moreover, our ability to dispose of assets to meet our distribution requirements may be limited by (1) the illiquid nature of our portfolio and/or (2) other requirements relating to our status as a RIC, including the Diversification Tests. If we dispose of assets in order to meet the Annual Distribution Requirement or the Excise Tax Avoidance Requirement, we may make such dispositions at times that, from an investment standpoint, are not advantageous.
Employees
We do not currently have any employees. The compensation of our chief compliance officer, Salvatore Faia, is paid in the form of fees to his firm, Vigilant Compliance Services. The compensation of our chief financial officer, Charles Jacobson, is paid in the form of fees to his firm, Pine Hill Group, LLC. On March 14, 2011, our board of directors appointed William Goebel to serve as our full-time chief financial officer, effective upon the resignation from such position by Mr. Jacobson. In connection with Mr. Goebel’s appointment, Mr. Jacobson tendered his resignation, which will take effect immediately after the filing of this annual report on Form 10-K. Mr. Goebel is employed by Franklin Square Holdings, an affiliate of FB Advisor, and the portion of his compensation relating to the provision of his services to us as chief financial officer will be reimbursed by us pursuant to the investment advisory and administrative services agreement with FB Advisor.
Available Information
Within 60 days after each fiscal quarter, we will distribute our quarterly report on Form 10-Q to all stockholders of record. In addition, we will distribute our annual report on Form 10-K to all stockholders within 120 days after the end of each fiscal year. These reports will also be available on our website at www.fsinvestmentcorp.com and on the SEC’s website at www.sec.gov. Information contained on our website is not incorporated by reference into this annual report on Form 10-K and you should not consider information contained on our website to be part of this annual report on Form 10-K.
We are required to file with or submit to the SEC annual, quarterly and current reports, proxy statements and other information meeting the informational requirements of the Exchange Act. You may inspect and copy these reports, proxy statements and other information, as well as related exhibits and schedules, at the Public Reference Room of the SEC at 100 F Street, N.E., Washington, DC 20549. You may obtain information on the operation of the Public Reference Room by calling the SEC at 1-800-SEC-0330. The SEC maintains an Internet site that contains reports, proxy and information statements and other information filed electronically by us with the SEC, which are available on the SEC’s website at www.sec.gov. Copies of these reports, proxy and information statements and other information may be obtained, after paying a duplicating fee, by electronic request at the following e-mail address: publicinfo@sec.gov, or by writing the SEC’s Public Reference Section, 100 F Street, N.E., Washington, DC 20549.
25
Table of Contents
| Item 1A. | Risk Factors |
Investing in our common stock involves a number of significant risks. In addition to the other information contained in this annual report on Form 10-K, you should consider carefully the following information before making an investment in our common stock. If any of the following events occur, our business, financial condition and results of operations could be materially and adversely affected. In such case, the net asset value of our common stock could decline, and you may lose all or part of your investment.
Risks Relating to Our Business and Structure
We are a relatively new company and have limited operating history.
We were formed on December 21, 2007 and commenced operations on January 2, 2009 after meeting our minimum offering requirement of selling, in aggregate, $2.5 million in common stock to persons not affiliated with us. We are subject to all of the business risks and uncertainties associated with any new business, including the risk that we will not achieve our investment objectives and that the value of our common stock could decline substantially.
Economic activity in the United States was impacted by the global financial crisis of 2008 and has yet to fully recover.
Beginning in the third quarter of 2007, global credit and other financial markets suffered substantial stress, volatility, illiquidity and disruption. These forces reached extraordinary levels in late 2008, resulting in the bankruptcy of, the acquisition of, or government intervention in the affairs of several major domestic and international financial institutions. In particular, the financial services sector was negatively impacted by significant write-offs as the value of the assets held by financial firms declined, impairing their capital positions and abilities to lend and invest. We believe that such value declines were exacerbated by widespread forced liquidations as leveraged holders of financial assets, faced with declining prices, were compelled to sell to meet margin requirements and maintain compliance with applicable capital standards. Such forced liquidations also impaired or eliminated many investors and investment vehicles, leading to a decline in the supply of capital for investment and depressed pricing levels for many assets. These events significantly diminished overall confidence in the debt and equity markets, engendered unprecedented declines in the values of certain assets, and caused extreme economic uncertainty.
Economic activity continues to be somewhat subdued as unemployment rates remain high. Despite this, capital has steadily flowed into the financial markets since the nadir of the credit crisis, as general risk aversion has subsided. As a result, corporate interest rate risk premiums, otherwise known as credit spreads, declined significantly throughout most of 2009 and 2010. However, credit spreads remain above historical averages, particularly in the loan market. The improving economic and market conditions which have driven these declines in credit spreads may reverse themselves if uncertainty returns to the markets. Such a reversal could negatively impact credit spreads as well as our ability to obtain financing, particularly from the debt markets.
Price declines in the large corporate leveraged loan market may adversely affect the fair value of our syndicated loan portfolio, reducing our net asset value through increased net unrealized depreciation.
Prior to the onset of the financial crisis, collateralized loan obligations, or CLOs, a type of leveraged investment vehicle holding corporate loans, hedge funds and other highly leveraged investment vehicles, comprised the majority of the market for purchasing and holding senior secured and second lien secured loans. As the secondary market pricing of the loans underlying these portfolios deteriorated during the fourth quarter of 2008, it is our understanding that many investors, as a result of their generally high degrees of leverage, were forced to raise cash by selling their interests in performing loans in order to satisfy margin requirements or the equivalent of margin requirements imposed by their lenders. This resulted in a forced deleveraging cycle of price declines, compulsory sales, and further price declines, with widespread redemption requests and other constraints
26
Table of Contents
resulting from the credit crisis generating further selling pressure. The pervasive forced selling and the resultant price declines led to the elimination or significant impairment of many of our leveraged competitors for investment opportunities, especially those having built their investment portfolios prior to the financial crisis.
While prices appreciated measurably during 2009 and 2010, conditions in the large corporate leveraged loan market may deteriorate again, which may cause pricing levels to decline. As a result, we may suffer unrealized depreciation and could incur realized losses in connection with the sale of our syndicated loans, which could have a material adverse impact on our business, financial condition and results of operations.
Our ability to achieve our investment objectives depends on FB Advisor’s and GDFM’s ability to manage and support our investment process. If either FB Advisor or GDFM were to lose any members of their respective senior management teams, our ability to achieve our investment objectives could be significantly harmed.
Since we have no employees, we depend on the investment expertise, skill and network of business contacts of FB Advisor and GDFM. FB Advisor, with the assistance of GDFM, evaluates, negotiates, structures, executes, monitors and services our investments. Our future success depends to a significant extent on the continued service and coordination of FB Advisor and its senior management team. The departure of any members of FB Advisor’s senior management team could have a material adverse effect on our ability to achieve our investment objectives. Likewise, the departure of any key employees of GDFM may impact its ability to render services to us under the terms of its sub-advisory agreement with FB Advisor.
Our ability to achieve our investment objectives depends on FB Advisor’s ability, with the assistance of GDFM, to identify, analyze, invest in, finance and monitor companies that meet our investment criteria. FB Advisor’s capabilities in structuring the investment process, providing competent, attentive and efficient services to us, and facilitating access to financing on acceptable terms depend on the employment of investment professionals in an adequate number and of adequate sophistication to match the corresponding flow of transactions. To achieve our investment objectives, FB Advisor may need to hire, train, supervise and manage new investment professionals to participate in our investment selection and monitoring process. FB Advisor may not be able to find investment professionals in a timely manner or at all. Failure to support our investment process could have a material adverse effect on our business, financial condition and results of operations. In addition, both the investment advisory and administrative services agreement and the sub-advisory agreement that FB Advisor has entered into with GDFM have termination provisions that allow the parties to terminate the agreements without penalty. The investment advisory and administrative services agreement may be terminated at any time, without penalty, by FB Advisor, upon 120 days notice to us. The sub-advisory agreement may be terminated at any time, without the payment of any penalty, upon 60 days written notice by GDFM or, if our board of directors or the holders of a majority of our outstanding voting securities determine that the sub-advisory agreement with GDFM should be terminated, by FB Advisor. If either agreement is terminated, it may adversely affect the quality of our investment opportunities. In addition, in the event such agreements are terminated, it may be difficult for us to replace FB Advisor or for FB Advisor to replace GDFM. Furthermore, the termination of either of these agreements may adversely impact the terms of our credit facility. See “—Risks Related to Debt Financing.”
Because our business model depends to a significant extent upon relationships with private equity sponsors, investment banks, and commercial banks, the inability of FB Advisor and GDFM to maintain or develop these relationships, or the failure of these relationships to generate investment opportunities, could adversely affect our business.
We expect that FB Advisor and GDFM will depend on their relationships with private equity sponsors, investment banks, and commercial banks, and we will rely to a significant extent upon these relationships to provide us with potential investment opportunities. If FB Advisor or GDFM fail to maintain their existing relationships or develop new relationships with other sponsors or sources of investment opportunities, we may not be able to grow our investment portfolio. In addition, individuals with whom FB Advisor and GDFM have relationships are not obligated to provide us with investment opportunities, and, therefore, there is no assurance that such relationships will generate investment opportunities for us.
27
Table of Contents
We may face increasing competition for investment opportunities, which could delay deployment of our capital, reduce returns and result in losses.
We compete for investments with other business development companies and investment funds (including private equity funds, mezzanine funds and collateralized loan obligation, or CLO, funds), as well as traditional financial services companies such as commercial banks and other sources of funding. Moreover, alternative investment vehicles, such as hedge funds, have begun to invest in areas they have not traditionally invested in, including making investments in small- to mid-sized private, U.S. companies. As a result of these new entrants, competition for investment opportunities in small and middle market private U.S. companies may intensify. Many of our competitors are substantially larger and have considerably greater financial, technical and marketing resources than we do. For example, some competitors may have a lower cost of capital and access to funding sources that are not available to us. In addition, some of our competitors may have higher risk tolerances or different risk assessments than we have. These characteristics could allow our competitors to consider a wider variety of investments, establish more relationships and offer better pricing and more flexible structuring than we are able to do. We may lose investment opportunities if we do not match our competitors’ pricing, terms and structure. If we are forced to match our competitors’ pricing, terms and structure, we may not be able to achieve acceptable returns on our investments or may bear substantial risk of capital loss. A significant part of our competitive advantage stems from the fact that the market for investments in small and middle market private U.S. companies is underserved by traditional commercial banks and other financial sources. A significant increase in the number and/or the size of our competitors in this target market could force us to accept less attractive investment terms. Furthermore, many of our competitors have greater experience operating under, or are not subject to, the regulatory restrictions that the 1940 Act imposes on us as a business development company.
A significant portion of our investment portfolio will be recorded at fair value as determined in good faith by our board of directors and, as a result, there is and will be uncertainty as to the value of our portfolio investments.
Under the 1940 Act, we are required to carry our portfolio investments at market value or, if there is no readily available market value, at fair value, as determined by our board of directors. However, the majority of our investments are not publicly traded or actively traded on a secondary market but are, instead, traded on a privately negotiated over-the-counter secondary market for institutional investors. As a result, we will value these securities quarterly at fair value as determined in good faith by our board of directors.
Certain factors that may be considered in determining the fair value of our investments include dealer quotes for securities traded on the secondary market for institutional investors, the nature and realizable value of any collateral, the portfolio company’s earnings and its ability to make payments on its indebtedness, the markets in which the portfolio company does business, comparison to comparable publicly-traded companies, discounted cash flow and other relevant factors. Because such valuations, and particularly valuations of private securities and private companies, are inherently uncertain, may fluctuate over short periods of time and may be based on estimates, our determinations of fair value may differ materially from the values that would have been used if a ready market for these securities existed. Due to this uncertainty, our fair value determinations may cause our net asset value on a given date to materially understate or overstate the value that we may ultimately realize upon the sale of one or more of our investments.
There is a risk that investors in our equity securities may not receive distributions or that our distributions may not grow over time.
We intend to make distributions to our stockholders out of assets legally available for distribution. We cannot assure you that we will achieve investment results that will allow us to make a specified level of cash distributions or year-to-year increases in cash distributions. In addition, due to the asset coverage test applicable to us as a BDC, we may be limited in our ability to make distributions. See “Item 1. Business—Regulation—Senior Securities.”
28
Table of Contents
The amount of any distributions we may make is uncertain. Our distribution proceeds have exceeded and in the future may exceed our net investment income, particularly during the period before we have substantially invested the net proceeds from our public offering. Therefore, portions of the distributions that we make may represent a return of capital to you for tax purposes, which will lower your tax basis in your shares and reduce the amount of funds we have for investment in targeted assets. We may not be able to pay you distributions, and our distributions may not grow over time. We may pay distributions from offering proceeds, borrowings or the sale of assets to the extent our cash flow from operations, net investment income or earnings are not sufficient to fund declared distributions.
We intend to declare distributions on either a semi-monthly or monthly basis and pay distributions on either a monthly or quarterly basis. We will pay these distributions to our stockholders out of assets legally available for distribution. We may fund distributions from the uninvested proceeds of this offering and borrowings. We have paid and may continue to pay distributions from the sale of assets to the extent distributions exceed our net investment income or cash flows from operations.
While Franklin Square Holdings has, in the past, limited our expenses to ensure that such expenses were reasonable in relation to our income, we cannot assure you that we will achieve investment results that will allow us to make a targeted level of cash distributions or year-to-year increases in cash distributions. We do not expect that conditions will require Franklin Square Holdings to provide reimbursements in the future. Our ability to pay distributions might be adversely affected by, among other things, the impact of one or more of the risk factors described herein. In addition, the inability to satisfy the asset coverage test applicable to us as a business development company may limit our ability to pay distributions. All distributions will be paid at the discretion of our board of directors and will depend on our earnings, our net investment income, our financial condition, maintenance of our RIC status, compliance with applicable business development company regulations and such other factors as our board of directors may deem relevant from time to time. We cannot assure you that we will pay distributions to our stockholders in the future. In the event that we encounter delays in locating suitable investment opportunities, we may pay all or a substantial portion of our distributions from the proceeds of our public offering or from borrowings in anticipation of future cash flow, which may constitute a return of your capital and will lower your tax basis in your shares. Distributions from the proceeds of our public offering or from borrowings also could reduce the amount of capital we ultimately invest in our portfolio companies.
Our board of directors may change our operating policies and strategies without prior notice or stockholder approval, the effects of which may be adverse.
Our board of directors has the authority to modify or waive our current operating policies, investment criteria and strategies without prior notice and without stockholder approval. We cannot predict the effect any changes to our current operating policies, investment criteria and strategies would have on our business, net asset value, operating results and value of our stock. However, the effects might be adverse, which could negatively impact our ability to pay you distributions and cause you to lose all or part of your investment. Moreover, we will have significant flexibility in investing the net proceeds of this offering and may use the net proceeds from our public offering in ways with which investors may not agree or for purposes other than those contemplated at the time of our public offering.
If we internalize our management functions, your interest in us could be diluted, and we could incur other significant costs associated with being self-managed.
Our board of directors may decide in the future to internalize our management functions. If we do so, we may elect to negotiate to acquire FB Advisor’s assets and personnel. At this time, we cannot anticipate the form or amount of consideration or other terms relating to any such acquisition. Such consideration could take many forms, including cash payments, promissory notes and shares of our common stock. The payment of such consideration could result in dilution of your interests as a stockholder and could reduce the earnings per share attributable to your investment.
29
Table of Contents
In addition, while we would no longer bear the costs of the various fees and expenses we expect to pay to FB Advisor under the existing investment advisory and administrative services agreement, we would incur the compensation and benefits costs of our officers and other employees and consultants that are now being paid by FB Advisor or its affiliates. In addition, we may issue equity awards to officers, employees and consultants. These awards would decrease net income and may further dilute your investment. We cannot reasonably estimate the amount of fees we would save or the costs we would incur if we became self-managed. If the expenses we assume as a result of an internalization are higher than the expenses we avoid paying to FB Advisor, our earnings per share would be lower as a result of the internalization than it otherwise would have been, potentially decreasing the amount of funds available to distribute to our stockholders and the value of our shares. As we are currently organized, we will not have any employees. If we elect to internalize our operations, we would employ personnel and would be subject to potential liabilities commonly faced by employers, such as workers disability and compensation claims and other employee-related liabilities and grievances.
If we internalize our management functions, we could have difficulty integrating these functions as a stand-alone entity. Currently, individuals employed by FB Advisor and its affiliates perform asset management and general and administrative functions, including accounting and financial reporting, for multiple entities. These personnel have a great deal of know-how and experience. We may fail to properly identify the appropriate mix of personnel and capital needs to operate as a stand-alone entity. An inability to manage an internalization transaction effectively could thus result in our incurring excess costs and/or suffering deficiencies in our disclosure controls and procedures or our internal control over financial reporting. Such deficiencies could cause us to incur additional costs, and our management’s attention could be diverted from effectively managing our investments.
Changes in laws or regulations governing our operations may adversely affect our business or cause us to alter our business strategy.
We and our portfolio companies are subject to regulation at the local, state and federal level. New legislation may be enacted or new interpretations, rulings or regulations could be adopted, including those governing the types of investments we are permitted to make, any of which could harm us and our stockholders, potentially with retroactive effect.
Additionally, any changes to the laws and regulations governing our operations relating to permitted investments may cause us to alter our investment strategy to avail ourselves of new or different opportunities. Such changes could result in material differences to our strategies and plans as set forth herein and may result in our investment focus shifting from the areas of expertise of FB Advisor and GDFM to other types of investments in which FB Advisor and GDFM may have less expertise or little or no experience. Thus, any such changes, if they occur, could have a material adverse effect on our results of operations and the value of your investment.
The impact of recent financial reform legislation on us is uncertain.
In light of current conditions in the U.S. and global financial markets and the U.S. and global economy, legislators, the presidential administration and regulators have increased their focus on the regulation of the financial services industry. The recently enacted Dodd-Frank Wall Street Reform and Consumer Protection Act, or the Dodd-Frank Act, institutes a wide range of reforms that will have an impact on all financial institutions. Many of the requirements called for in the Dodd-Frank Act will be implemented over time, most of which will be subject to implementing regulations over the course of several years. Given the uncertainty associated with the manner in which the provisions of the Dodd-Frank Act will be implemented by the various regulatory agencies and through regulations, the full impact such requirements will have on our business, results of operations or financial condition is unclear. The changes resulting from the Dodd-Frank Act may require us to invest significant management attention and resources to evaluate and make necessary changes in order to comply with new statutory and regulatory requirements. Failure to comply with any such laws, regulations or principles, or changes thereto, may negatively impact our business, results of operations and financial condition. While we cannot predict what effect any changes in the laws or regulations or their interpretations would have on us as a result of the Dodd-Frank Act, these changes could be materially adverse to us and our stockholders.
30
Table of Contents
As a public company, we are subject to regulations not applicable to private companies, such as provisions of the Sarbanes-Oxley Act. Efforts to comply with such regulations will involve significant expenditures, and non-compliance with such regulations may adversely affect us.
We are subject to regulations not applicable to private companies, such as provisions of the Sarbanes-Oxley Act and the related rules and regulations promulgated by the SEC. Our management is required to report on our internal control over financial reporting pursuant to Section 404 of the Sarbanes-Oxley Act and rules and regulations of the SEC thereunder. We are required to review on an annual basis our internal control over financial reporting, and on a quarterly and annual basis to evaluate and disclose changes in our internal control over financial reporting. As a result, we expect to incur significant additional expenses, which may negatively impact our financial performance and our ability to make distributions. In the event that we are unable to maintain or achieve compliance with the Sarbanes-Oxley Act and related rules and regulations, we may be adversely affected.
We may experience fluctuations in our quarterly results.
We could experience fluctuations in our quarterly operating results due to a number of factors, including our ability or inability to make investments in companies that meet our investment criteria, the interest rate payable on the debt securities we acquire, the level of our expenses, variations in and the timing of the recognition of realized and unrealized gains or losses, the degree to which we encounter competition in our markets and general economic conditions. As a result of these factors, results for any previous period should not be relied upon as being indicative of performance in future periods.
Risks Related to FB Advisor and Its Affiliates
FB Advisor has limited experience managing a business development company or a regulated investment company, or RIC.
FB Advisor has limited experience managing a BDC or a RIC and may not be able to successfully operate our business or achieve our investment objectives. As a result, an investment in our shares of common stock may entail more risk than the shares of common stock of a comparable company with a substantial operating history.
The 1940 Act and the Code impose numerous constraints on the operations of business development companies and RICs that do not apply to the other types of investment vehicles previously managed by FB Advisor. For example, under the 1940 Act, business development companies are required to invest at least 70% of their total assets primarily in securities of qualifying U.S. private or thinly traded companies. Moreover, qualification for RIC tax treatment under subchapter M of the Code requires satisfaction of source-of-income, diversification and other requirements. The failure to comply with these provisions in a timely manner could prevent us from qualifying as a business development company or RIC or could force us to pay unexpected taxes and penalties, which could be material. FB Advisor’s limited experience in managing a portfolio of assets under such constraints may hinder its ability to take advantage of attractive investment opportunities and, as a result, achieve our investment objectives.
FB Advisor and its affiliates, including our officers and some of our directors, face conflicts of interest caused by compensation arrangements with us and our affiliates, which could result in actions that are not in the best interests of our stockholders.
FB Advisor and its affiliates receive substantial fees from us in return for their services, and these fees could influence the advice provided to us. Among other matters, the compensation arrangements could affect their judgment with respect to public offerings of equity by us, which allow the dealer manager to earn additional dealer manager fees and FB Advisor to earn increased asset management fees. In addition, the decision to utilize leverage has increased our assets and, as a result, has increased the amount of management fees payable to FB Advisor.
31
Table of Contents
We may be obligated to pay FB Advisor incentive compensation even if we incur a net loss due to a decline in the value of our portfolio.
Our investment advisory and administrative services agreement entitles FB Advisor to receive incentive compensation on income regardless of any capital losses. In such case, we may be required to pay FB Advisor incentive compensation for a fiscal quarter even if there is a decline in the value of our portfolio or if we incur a net loss for that quarter.
Any incentive fee payable by us that relates to our net investment income may be computed and paid on income that may include interest that has been accrued but not yet received. If a portfolio company defaults on a loan that is structured to provide accrued interest, it is possible that accrued interest previously included in the calculation of the incentive fee will become uncollectible. FB Advisor is not under any obligation to reimburse us for any part of the incentive fee it received that was based on accrued income that we never received as a result of a default by an entity on the obligation that resulted in the accrual of such income, and such circumstances would result in our paying an incentive fee on income we never received.
For federal income tax purposes, we may be required to recognize taxable income (such as deferred interest that is accrued as original issue discount) in circumstances in which we do not receive a corresponding payment in cash and to make distributions with respect to such income to maintain our status as a RIC even though we will not have received any corresponding cash amount. Under such circumstances, we may have difficulty meeting the annual distribution requirement necessary to obtain and maintain RIC tax treatment under the Code. This difficulty in making the required distribution may be amplified to the extent that we are required to pay an incentive fee with respect to such accrued income for which we have not received a corresponding cash payment. As a result, we may have to sell some of our investments at times and/or at prices we would not consider advantageous, raise additional debt or equity capital or forgo new investment opportunities for this purpose. If we are not able to obtain cash from other sources, we may fail to qualify for RIC tax treatment and thus become subject to corporate-level income tax. For additional discussion regarding the tax implications of a RIC, see “—Federal Income Tax Risks—We will be subject to corporate-level income tax if we are unable to qualify as a RIC under Subchapter M of the Code or to satisfy RIC distribution requirements.”
The time and resources that individuals employed by FB Advisor and GDFM devote to us may be diverted and we may face additional competition due to the fact that individuals employed by FB Advisor and GDFM are not prohibited from raising money for or managing another entity that makes the same types of investments that we target.
Neither FB Advisor nor GSO are prohibited from raising money for and managing another investment entity that makes the same types of investments as those we target. As a result, the time and resources that these individuals may devote to us may be diverted. In addition, we may compete with any such investment entity for the same investors and investment opportunities. If we are able to obtain exemptive relief from the SEC, we also intend to co-invest with any such investment entity to the extent permitted by the 1940 Act, or the rules and regulations thereunder. There is no assurance that we will obtain such relief. In the event the SEC does not grant us relief, we could be limited in our ability to invest in certain portfolio companies in which GDFM or any of its affiliates are investing or are invested. Even if we are able to receive exemptive relief, we will be unable to participate in certain transactions originated by GSO or its affiliates prior to receipt of such relief. Affiliates of GDFM, whose primary business include the origination of investments, engage in investment advisory business with accounts that compete with us. Affiliates of GDFM have no obligation to make their originated investment opportunities available to GDFM or to us.
Our incentive fee may induce FB Advisor to make, and GDFM to recommend, speculative investments.
The incentive fee payable by us to FB Advisor may create an incentive for it to make investments on our behalf that are risky or more speculative than would be the case in the absence of such compensation
32
Table of Contents
arrangement. The way in which the incentive fee payable to FB Advisor is determined may encourage it to use leverage to increase the return on our investments. In addition, the fact that our base management fee is payable based upon our gross assets, which would include any borrowings for investment purposes, may encourage FB Advisor to use leverage to make additional investments. Under certain circumstances, the use of leverage may increase the likelihood of default, which would disfavor holders of our common stock. Such a practice could result in our investing in more speculative securities than would otherwise be in our best interests, which could result in higher investment losses, particularly during cyclical economic downturns. In addition, since GDFM will receive a portion of the advisory fees paid to FB Advisor, GDFM may have an incentive to recommend investments that are riskier or more speculative.
Risks Related to Business Development Companies
The requirement that we invest a sufficient portion of our assets in qualifying assets could preclude us from investing in accordance with our current business strategy; conversely, the failure to invest a sufficient portion of our assets in qualifying assets could result in our failure to maintain our status as a business development company.
As a BDC, we may not acquire any assets other than “qualifying assets” unless, at the time of and after giving effect to such acquisition, at least 70% of our total assets are qualifying assets. See “Item 1. Business—Regulation.” Therefore, we may be precluded from investing in what we believe are attractive investments if such investments are not qualifying assets. Conversely, if we fail to invest a sufficient portion of our assets in qualifying assets, we could lose our status as a BDC, which would have a material adverse effect on our business, financial condition and result of operations. Similarly, these rules could prevent us from making additional investments in existing portfolio companies, which could result in the dilution of our position, or could require us to dispose of investments at an inopportune time to comply with the 1940 Act. If we were forced to sell non-qualifying investments in the portfolio for compliance purposes, the proceeds from such sale could be significantly less than the current value of such investments.
Failure to maintain our status as a business development company would reduce our operating flexibility.
If we do not remain a BDC, we might be regulated as a closed-end investment company under the 1940 Act, which would subject us to substantially more regulatory restrictions under the 1940 Act and correspondingly decrease our operating flexibility.
Regulations governing our operation as a business development company and RIC will affect our ability to raise, and the way in which we raise additional capital or borrow for investment purposes, which may have a negative effect on our growth.
As a result of the annual distribution requirement to qualify as a RIC, we may need to periodically access the capital markets to raise cash to fund new investments. We may issue “senior securities,” including borrowing money from banks or other financial institutions only in amounts such that our asset coverage, as defined in the 1940 Act, equals at least 200% after such incurrence or issuance. Our ability to issue different types of securities is also limited. Compliance with these requirements may unfavorably limit our investment opportunities and reduce our ability in comparison to other companies to profit from favorable spreads between the rates at which we can borrow and the rates at which we can lend. As a BDC, therefore, we intend to continuously issue equity at a rate more frequent than our privately owned competitors, which may lead to greater stockholder dilution.
We expect to borrow for investment purposes. If the value of our assets declines, we may be unable to satisfy the asset coverage test, which would prohibit us from paying distributions and could prevent us from qualifying as a RIC. If we cannot satisfy the asset coverage test, we may be required to sell a portion of our investments and, depending on the nature of our debt financing, repay a portion of our indebtedness at a time when such sales may be disadvantageous.
33
Table of Contents
Under the 1940 Act, we generally are prohibited from issuing or selling our common stock at a price below net asset value per share, which may be a disadvantage as compared with other public companies. We may, however, sell our common stock, or warrants, options or rights to acquire our common stock, at a price below the current net asset value of the common stock if our board of directors and independent directors determine that such sale is in our best interests and the best interests of our stockholders, and our stockholders as well as those stockholders that are not affiliated with us approve such sale. In any such case, the price at which our securities are to be issued and sold may not be less than a price that, in the determination of our board of directors, closely approximates the fair value of such securities.
Our ability to enter into transactions with our affiliates will be restricted.
We are prohibited under the 1940 Act from participating in certain transactions with certain of our affiliates without the prior approval of a majority of the independent members of our board of directors and, in some cases, the SEC. Any person that owns, directly or indirectly, 5% or more of our outstanding voting securities will be our affiliate for purposes of the 1940 Act and we will generally be prohibited from buying or selling any securities from or to such affiliate, absent the prior approval of our board of directors. The 1940 Act also prohibits certain “joint” transactions with certain of our affiliates, which could include investments in the same portfolio company (whether at the same or different times), without prior approval of our board of directors and, in some cases, the SEC. If a person acquires more than 25% of our voting securities, we will be prohibited from buying or selling any security from or to such person or certain of that person’s affiliates, or entering into prohibited joint transactions with such persons, absent the prior approval of the SEC. Similar restrictions limit our ability to transact business with our officers or directors or their affiliates. As a result of these restrictions, we may be prohibited from buying or selling any security from or to any portfolio company of a private equity fund managed by FB Advisor without the prior approval of the SEC, which may limit the scope of investment opportunities that would otherwise be available to us.
We are uncertain of our sources for funding our future capital needs; if we cannot obtain debt or equity financing on acceptable terms, our ability to acquire investments and to expand our operations will be adversely affected.
The net proceeds from the sale of shares will be used for our investment opportunities, operating expenses and for payment of various fees and expenses such as base management fees, incentive fees and other fees. Any working capital reserves we maintain may not be sufficient for investment purposes, and we may require debt or equity financing to operate. Accordingly, in the event that we develop a need for additional capital in the future for investments or for any other reason, these sources of funding may not be available to us. Consequently, if we cannot obtain debt or equity financing on acceptable terms, our ability to acquire investments and to expand our operations will be adversely affected. As a result, we would be less able to achieve portfolio diversification and our investment objectives, which may negatively impact our results of operations and reduce our ability to make distributions to our stockholders.
Risks Related to Our Investments
Our investments in prospective portfolio companies may be risky, and we could lose all or part of our investment.
We invest primarily in senior secured term loans, second lien secured loans and, to a lesser extent, mezzanine debt and selected equity investments issued by private U.S. companies, including small and middle market companies.
Senior Secured Loans and Second Lien Secured Loans. When we invest in senior secured term loans and second lien secured loans, we will generally take a security interest in the available assets of these portfolio companies, including the equity interests of their subsidiaries. We expect this security interest to help mitigate
34
Table of Contents
the risk that we will not be repaid. However, there is a risk that the collateral securing our loans may decrease in value over time or lose its entire value, may be difficult to sell in a timely manner, may be difficult to appraise and may fluctuate in value based upon the success of the business and market conditions, including as a result of the inability of the portfolio company to raise additional capital. Also, in some circumstances, our security interest could be subordinated to claims of other creditors. In addition, deterioration in a portfolio company’s financial condition and prospects, including its inability to raise additional capital, may be accompanied by deterioration in the value of the collateral for the loan. Consequently, the fact that a loan is secured does not guarantee that we will receive principal and interest payments according to the loan’s terms, or at all, or that we will be able to collect on the loan should we be forced to enforce our remedies.
Mezzanine Debt. Our mezzanine debt investments will generally be subordinated to senior loans and will generally be unsecured. This may result in a heightened level of risk and volatility or a loss of principal, which could lead to the loss of the entire investment. These investments may involve additional risks that could adversely affect our investment returns. To the extent interest payments associated with such debt are deferred, such debt may be subject to greater fluctuations in valuations, and such debt could subject us and our stockholders to non-cash income. Since we will not receive any principal repayments prior to the maturity of some of our mezzanine debt investments, such investments will be of greater risk than amortizing loans.
Equity Investments. We expect to make selected equity investments. In addition, when we invest in senior secured and second lien secured loans or mezzanine debt, we may acquire warrants to purchase equity securities. Our goal is ultimately to dispose of these equity interests and realize gains upon our disposition of such interests. However, the equity interests we receive may not appreciate in value and, in fact, may decline in value. Accordingly, we may not be able to realize gains from our equity interests, and any gains that we do realize on the disposition of any equity interests may not be sufficient to offset any other losses we experience.
In addition, investing in small and middle market companies involves a number of significant risks, including that they:
| • | may have limited financial resources and may be unable to meet their obligations under their debt securities that we hold, which may be accompanied by a deterioration in the value of any collateral and a reduction in the likelihood of us realizing any guarantees we may have obtained in connection with our investment; |
| • | have shorter operating histories, narrower product lines and smaller market shares than larger businesses, which tends to render them more vulnerable to competitors’ actions and changing market conditions, as well as general economic downturns; |
| • | are more likely to depend on the management talents and efforts of a small group of persons; therefore, the death, disability, resignation or termination of one or more of these persons could have a material adverse impact on our portfolio company and, in turn, on us; |
| • | generally have less predictable operating results, may from time to time be parties to litigation, may be engaged in rapidly changing businesses with products subject to a substantial risk of obsolescence, and may require substantial additional capital to support their operations, finance expansion or maintain their competitive position. In addition, our executive officers, directors and members of FB Advisor may, in the ordinary course of business, be named as defendants in litigation arising from our investments in the portfolio companies; and |
| • | may have difficulty accessing the capital markets to meet future capital needs, which may limit their ability to grow or to repay their outstanding indebtedness upon maturity. |
35
Table of Contents
Our portfolio companies may incur debt that ranks equally with, or senior to, our investments in such companies.
We invest primarily in first lien, second lien and, to a lesser extent, mezzanine debt issued by private U.S. companies, including small and middle market private U.S. companies. Our portfolio companies may have, or may be permitted to incur, other debt that ranks equally with, or senior to, the debt in which we invest. By their terms, such debt instruments may entitle the holders to receive payment of interest or principal on or before the dates on which we are entitled to receive payments with respect to the debt instruments in which we invest. Also, in the event of insolvency, liquidation, dissolution, reorganization or bankruptcy of a portfolio company, holders of debt instruments ranking senior to our investment in that portfolio company would typically be entitled to receive payment in full before we receive any distribution. After repaying such senior creditors, such portfolio company may not have any remaining assets to use for repaying its obligation to us. In the case of debt ranking equally with debt instruments in which we invest, we would have to share on an equal basis any distributions with other creditors holding such debt in the event of an insolvency, liquidation, dissolution, reorganization or bankruptcy of the relevant portfolio company.
There may be circumstances where our debt investments could be subordinated to claims of other creditors or we could be subject to lender liability claims.
Even though we intend to generally structure certain of our investments as senior loans, if one of our portfolio companies were to go bankrupt, depending on the facts and circumstances, including the extent to which we actually provided managerial assistance to that portfolio company, a bankruptcy court might recharacterize our debt investment and subordinate all or a portion of our claim to that of other creditors. In situations where a bankruptcy carries a high degree of political significance, our legal rights may be subordinated to other creditors. We may also be subject to lender liability claims for actions taken by us with respect to a borrower’s business or instances where we exercise control over the borrower.
We generally will not control our portfolio companies.
We do not expect to control most of our portfolio companies, even though we may have board representation or board observation rights, and our debt agreements with such portfolio companies may contain certain restrictive covenants. As a result, we are subject to the risk that a portfolio company in which we invest may make business decisions with which we disagree and the management of such company, as representatives of the holders of their common equity, may take risks or otherwise act in ways that do not serve our interests as debt investors. Due to the lack of liquidity for our investments in non-traded companies, we may not be able to dispose of our interests in our portfolio companies as readily as we would like or at an appropriate valuation. As a result, a portfolio company may make decisions that could decrease the value of our portfolio holdings.
We will be exposed to risks associated with changes in interest rates.
We are subject to financial market risks, including changes in interest rates. While the majority of our investments are floating-rate debt instruments, to the extent that we invest in fixed-rate securities or loans, general interest rate fluctuations may have a substantial negative impact on our investments and investment opportunities and, accordingly, have a material adverse effect on our investment objectives and our rate of return on invested capital. In addition, an increase in interest rates would make it more expensive to use debt for our financing needs, if any.
We may enter into total return swap agreements or other derivative transactions which expose us to certain risks, including risks similar to those associated with the use of leverage.
Our wholly-owned financing subsidiary, Arch Street, has entered into a TRS with Citibank. See “Item 7. Management’s Discussion and Analysis of Financial Condition and Results of Operations—Recent Developments” for a more detailed discussion of the terms of the TRS between Arch Street and Citibank.
36
Table of Contents
A TRS is a contract in which one party agrees to make periodic payments to another party based on the change in the market value of the assets underlying the TRS, which may include a specified security, basket of securities or securities indices during the specified period, in return for periodic payments based on a fixed or variable interest rate. A TRS is typically used to obtain exposure to a security or market without owning or taking physical custody of such security or investing directly in such market. A TRS may effectively add leverage to our portfolio because, in addition to our total net assets, we would be subject to investment exposure on the amount of securities subject to the TRS.
A TRS is also subject to the risk that a counterparty will default on its payment obligations thereunder or that we will not be able to meet our obligations to the counterparty. In the case of the TRS with Citibank, Arch Street is required to post cash collateral amounts to secure its obligations to Citibank under the TRS. Citibank, however, is not required to collateralize any of its obligations to Arch Street under the TRS.
In addition to customary events of default and termination events, the agreements governing the TRS with Citibank contain the following termination events: (a) a failure to satisfy the portfolio criteria for at least 30 days; (b) a failure to post initial cash collateral or additional collateral as required by the agreements; (c) a default by Arch Street or us with respect to indebtedness in an amount equal to or greater than the lesser of $10,000 and 2% of our net asset value at such time; (d) a merger of Arch Street or us meeting certain criteria; (e) us or Arch Street amending our respective constituent documents to alter our investment strategy in a manner that has or could reasonably be expected to have a material adverse effect; and (f) our ceasing to be the investment manager of Arch Street or having authority to enter into transactions under the TRS on behalf of Arch Street, and not being replaced by an entity reasonably acceptable to Citibank.
In addition to the rights of Citibank to terminate the TRS following an event of default or termination event as described above, Citibank may terminate the TRS on or after the second anniversary of the effectiveness of the TRS. Arch Street may terminate the TRS at any time upon providing no more than 30 days, and no less than 10 days, prior notice to Citibank. Any termination prior to the second anniversary of the effectiveness of the TRS will result in payment of an early termination fee to Citibank. Upon any termination of the TRS, Arch Street will be required to pay Citibank the amount of any decline in the aggregate value of the loans subject to the TRS or, alternatively, will be entitled to receive the amount of any appreciation in the aggregate value of such loans. In the event that Citibank chooses to exercise its termination rights, it is possible that Arch Street will owe more to Citibank or, alternatively, will be entitled to receive less from Citibank than it would have if Arch Street controlled the timing of such termination due to the existence of adverse market conditions at the time of such termination.
In addition, because a TRS is a form of synthetic leverage, such arrangements are subject to risks similar to those associated with the use of leverage. See “—Risks Relating to Debt Financing” below.
Second priority liens on collateral securing loans that we will make to our portfolio companies may be subject to control by senior creditors with first priority liens. If there is a default, the value of the collateral may not be sufficient to repay in full both the first priority creditors and us.
Certain loans that we make to portfolio companies may be secured on a second priority basis by the same collateral securing first priority debt of such companies. The first priority liens on the collateral will secure the portfolio company’s obligations under any outstanding senior debt and may secure certain other future debt that may be permitted to be incurred by the company under the agreements governing the loans. The holders of obligations secured by the first priority liens on the collateral will generally control the liquidation of and be entitled to receive proceeds from any realization of the collateral to repay their obligations in full before us. In addition, the value of the collateral in the event of liquidation will depend on market and economic conditions, the availability of buyers and other factors. There can be no assurance that the proceeds, if any, from the sale or sales of all of the collateral would be sufficient to satisfy the loan obligations secured by the second priority liens after payment in full of all obligations secured by the first priority liens on the collateral. If such proceeds are not
37
Table of Contents
sufficient to repay amounts outstanding under the loan obligations secured by the second priority liens, then we, to the extent not repaid from the proceeds of the sale of the collateral, will only have an unsecured claim against the company’s remaining assets, if any.
The rights we may have with respect to the collateral securing the loans we make to our portfolio companies with senior debt outstanding may also be limited pursuant to the terms of one or more intercreditor agreements that we enter into with the holders of senior debt. Under such an intercreditor agreement, at any time that obligations that have the benefit of the first priority liens are outstanding, any of the following actions that may be taken in respect of the collateral will be at the direction of the holders of the obligations secured by the first priority liens: the ability to cause the commencement of enforcement proceedings against the collateral; the ability to control the conduct of such proceedings; the approval of amendments to collateral documents; releases of liens on the collateral; and waivers of past defaults under collateral documents. We may not have the ability to control or direct such actions, even if our rights are adversely affected.
A covenant breach by our portfolio companies may harm our operating results.
A portfolio company’s failure to satisfy financial or operating covenants imposed by us or other lenders could lead to defaults and, potentially, termination of its loans and foreclosure on its secured assets, which could trigger cross-defaults under other agreements and jeopardize a portfolio company’s ability to meet its obligations under the debt or equity securities that we hold. We may incur expenses to the extent necessary to seek recovery upon default or to negotiate new terms, which may include the waiver of certain financial covenants, with a defaulting portfolio company.
We may not realize gains from our equity investments.
Certain investments that we may make could include warrants or other equity securities. In addition, we may make direct equity investments in companies. Our goal is ultimately to realize gains upon our disposition of such equity interests. However, the equity interests we receive may not appreciate in value and, in fact, may decline in value. Accordingly, we may not be able to realize gains from our equity interests, and any gains that we do realize on the disposition of any equity interests may not be sufficient to offset any other losses we experience. We also may be unable to realize any value if a portfolio company does not have a liquidity event, such as a sale of the business, recapitalization or public offering, which would allow us to sell the underlying equity interests. We intend to seek puts or similar rights to give us the right to sell our equity securities back to the portfolio company issuer. We may be unable to exercise these put rights for the consideration provided in our investment documents if the issuer is in financial distress.
An investment strategy focused primarily on privately held companies presents certain challenges, including the lack of available information about these companies.
Our investments are primarily in privately held companies. Investments in private companies pose certain incremental risks as compared to investments in public companies. First, private companies have reduced access to the capital markets, resulting in diminished capital resources and the ability to withstand financial distress. Second, the investments themselves tend to be less liquid. As such, we may have difficulty exiting an investment promptly or at a desired price prior to maturity or outside of a normal amortization schedule. As a result, the relative lack of liquidity and the potential diminished capital resources of our target portfolio companies may affect our investment returns. Finally, little public information generally exists about private companies. Further, these companies may not have third-party debt ratings or audited financial statements. We must therefore rely on the ability of FB Advisor and/or GDFM to obtain adequate information through due diligence to evaluate the creditworthiness and potential returns from investing in these companies. These companies and their financial information will generally not be subject to the Sarbanes-Oxley Act and other rules and regulations that govern public companies. If we are unable to uncover all material information about these companies, we may not make a fully informed investment decision, and we may lose money on our investments.
38
Table of Contents
A lack of liquidity in certain of our investments may adversely affect our business.
We invest in certain companies whose securities are not publicly traded or actively traded on the secondary market and are, instead, traded on a privately negotiated over-the-counter secondary market for institutional investors and whose securities are subject to legal and other restrictions on resale or are otherwise less liquid than publicly traded securities. The illiquidity of certain of our investments may make it difficult for us to sell these investments when desired. In addition, if we are required to liquidate all or a portion of our portfolio quickly, we may realize significantly less than the value at which we had previously recorded these investments. The reduced liquidity of our investments may make it difficult for us to dispose of them at a favorable price, and, as a result, we may suffer losses.
We may not have the funds or ability to make additional investments in our portfolio companies.
We may not have the funds or ability to make additional investments in our portfolio companies. After our initial investment in a portfolio company, we may be called upon from time to time to provide additional funds to such company or have the opportunity to increase our investment through the exercise of a warrant to purchase common stock. There is no assurance that we will make, or will have sufficient funds to make, follow-on investments. Any decisions not to make a follow-on investment or any inability on our part to make such an investment may have a negative impact on a portfolio company in need of such an investment, may result in a missed opportunity for us to increase our participation in a successful operation or may reduce the expected return on the investment.
Risks Relating to Debt Financing
The agreements governing Broad Street’s revolving credit facility contain various covenants which, if not complied with, could accelerate repayment under the facility, thereby materially and adversely affecting our liquidity, financial condition, results of operations and our ability to pay distributions to our stockholders.
Our wholly-owned financing subsidiary, Broad Street, has entered into a revolving credit facility with Deutsche Bank. The agreements governing this facility contain default provisions such as (a) the failure to make principal payments when due or interest payments within three business days of when due; (b) borrowings under the facility exceeding the applicable advance rates; (c) the purchase by Broad Street of certain ineligible assets; (d) the insolvency or bankruptcy of us or Broad Street; (e) our ceasing to act as investment manager of Broad Street’s assets; (f) the decline of our net asset value below $50,000; and (g) fraud or other illicit acts by us or FB Advisor or GDFM in our or their investment advisory capacities. An event of default under the facility would result, among other things, in the termination of the availability of further funds under the facility and an accelerated maturity date for all amounts outstanding under the facility. This could disrupt our business, reduce our revenues and, by delaying any dividends allowed to us under the facility until the lender has been paid in full, reduce our liquidity and cash flow and impair our ability to grow our business, make distribution payments to our stockholders and maintain our status as a RIC.
The agreements governing the facility also require Broad Street to comply with certain operational covenants. These covenants require Broad Street to, among other things, maintain eligible assets with an aggregate value equal to or exceeding a specified multiple of the borrowings under the facility. The occurrence of certain “Super-Collateralization Events” results in an increase of the minimum aggregate value of eligible assets that Broad Street is required to maintain. Super-Collateralization Events include, without limitation, (i) certain key employees ceasing to be directors, principals, officers or investment managers of GDFM; (ii) the bankruptcy or insolvency of GDFM or FB Advisor; (iii) GDFM ceasing to act as our sub-adviser or FB Advisor ceasing to act as our investment adviser; (iv) our ceasing to act as Broad Street’s investment manager, becoming bankrupt or insolvent, defaulting in certain material agreements or failing to maintain a net asset value at least equal to $50,000; and (v) us or GDFM or FB Advisor committing fraud or other illicit acts in our or their investment advisory capacities. A decline in the value of assets owned by Broad Street or the occurrence of a Super-
39
Table of Contents
Collateralization Event under the facility could result in us being required to contribute additional assets to Broad Street, which would likely disrupt our business and impact our ability to meet our investment objectives and pay distributions to our stockholders.
The failure to meet collateral requirements under the facility or the occurrence of any other event of default which results in the termination of the facility may force Broad Street or us to liquidate positions at a time and/or at a price which is disadvantageous to us and could result in losses. In addition, upon the occurrence of an event of default under the facility, Deutsche Bank would have the right to the assets pledged as collateral supporting the amounts outstanding under the facility and could sell such assets in order to satisfy amounts due under the facility.
Each borrowing under the facility is subject to the satisfaction of certain conditions. We cannot assure you that Broad Street will be able to borrow funds under the facility at any particular time or at all. See “Item 7. Management’s Discussion and Analysis of Financial Condition and Results of Operations—Financial Condition, Liquidity and Capital Resources” for a more detailed discussion of the terms of the facility.
If we borrow money, the potential for gain or loss on amounts invested in us will be magnified and may increase the risk of investing in us.
The use of borrowings, also known as leverage, increases the volatility of investments by magnifying the potential for gain or loss on invested equity capital. If we use leverage to partially finance our investments, through borrowing from banks and other lenders, you will experience increased risks of investing in our common stock. If the value of our assets increases, leveraging would cause the net asset value attributable to our common stock to increase more sharply than it would have had we not leveraged. Conversely, if the value of our assets decreases, leveraging would cause net asset value to decline more sharply than it otherwise would have had we not leveraged. Similarly, any increase in our income in excess of interest payable on the borrowed funds would cause our net income to increase more than it would without the leverage, while any decrease in our income would cause net income to decline more sharply than it would have had we not borrowed. Such a decline could negatively affect our ability to make common stock distribution payments. Leverage is generally considered a speculative investment technique.
At December 31, 2010, we had approximately $297.2 million of indebtedness outstanding under Broad Street’s revolving credit facility with Deutsche Bank.
Changes in interest rates may affect our cost of capital and net investment income.
Since we intend to use debt to finance investments, our net investment income will depend, in part, upon the difference between the rate at which we borrow funds and the rate at which we invest those funds. As a result, we can offer no assurance that a significant change in market interest rates will not have a material adverse effect on our net investment income. In periods of rising interest rates when we have debt outstanding, our cost of funds will increase, which could reduce our net investment income. We expect that our long-term fixed-rate investments will be financed primarily with equity and long-term debt. We may use interest rate risk management techniques in an effort to limit our exposure to interest rate fluctuations. These techniques may include various interest rate hedging activities to the extent permitted by the 1940 Act. These activities may limit our ability to participate in the benefits of lower interest rates with respect to the hedged portfolio. Adverse developments resulting from changes in interest rates or hedging transactions could have a material adverse effect on our business, financial condition and results of operations. Also, we have limited experience in entering into hedging transactions, and we will initially have to purchase or develop such expertise.
You should also be aware that a rise in the general level of interest rates can be expected to lead to higher interest rates applicable to our debt investments. Accordingly, an increase in interest rates would make it easier for us to meet or exceed the incentive fee preferred return and may result in a substantial increase of the amount of incentive fees payable to FB Advisor with respect to pre-incentive fee net investment income.
40
Table of Contents
Risks Relating to an Investment in Our Common Stock
Investors will not know the purchase price per share at the time they submit their subscription agreements and could receive fewer shares of common stock than anticipated if our board of directors determines to increase the offering price to comply with the requirement that we avoid selling shares below net asset value per share.
The purchase price at which you purchase shares will be determined at each semi-monthly closing date to ensure that the sales price is equal to or greater than the net asset value of our shares, after deducting selling commissions and dealer manager fees. As a result, in the event of an increase in our net asset value per share, your purchase price may be higher than the prior semi-monthly closing price per share, and therefore you may receive a smaller number of shares than if you had subscribed at the prior semi-monthly closing price.
Investors will not know the purchase price per share at the time they submit their subscription agreements and could pay a premium for their shares of common stock if our board of directors does not decrease the offering price in the event of a decline to our net asset value per share.
The purchase price at which you purchase shares will be determined at each semi-monthly closing date to ensure that the sales price is equal to or greater than the net asset value of our shares, after deducting selling commissions and dealer manager fees. In the event of a decrease to our net asset value per share, you could pay a premium of more than 5% for your shares of common stock if our board of directors does not decrease the offering price. A decline in our net asset value per share to an amount more than 5% below our current offering price, net of selling commissions and dealer manager fees, creates a rebuttable presumption that there has been a material change in the value of our assets such that a reduction in the offering price per share is warranted. This presumption may only be rebutted if our board of directors, in consultation with our management, reasonably and in good faith determines that the decline in net asset value per share is the result of a temporary movement in the credit markets or the value of our assets, rather than a more fundamental shift in the valuation of our portfolio. In the event that (i) net asset value per share decreases to more than 5% below our current net offering price and (ii) our board of directors believes that such decrease in net asset value per share is the result of a non-temporary movement in the credit markets or the value of our assets, our board of directors will undertake to establish a new net offering price that is not more than 5% above our net asset value per share. If our board of directors determines that the decline in our net asset value per share is the result of a temporary movement in the credit markets or the value of our assets, investors will purchase shares at an offering price per share, net of selling commissions and dealer manager fees, which represents a premium to the net asset value per share of greater than 5%.
If we are unable to raise substantial funds in our ongoing, continuous “best efforts” offering, we will be limited in the number and type of investments we may make, and the value of your investment in us may be reduced in the event our assets under-perform.
Our continuous offering is being made on a best efforts basis, whereby the dealer manager and broker-dealers participating in the offering are only required to use their best efforts to sell our shares and have no firm commitment or obligation to purchase any of the shares. To the extent that less than the maximum number of shares is subscribed for, the opportunity for diversification of our investments may be decreased and the returns achieved on those investments may be reduced as a result of allocating all of our expenses among a smaller capital base.
Our shares are not listed on an exchange or quoted through a quotation system, and will not be for the foreseeable future, if ever. Therefore, our stockholders have limited liquidity and may not receive a full return of invested capital upon selling shares.
Our shares are illiquid assets for which there is not a secondary market, and it is not expected that any will develop in the future. We intend to seek to complete a liquidity event for our stockholders within five to seven years following the completion of our offering stage or at such earlier time as our board of directors may
41
Table of Contents
determine, taking into consideration market conditions and other factors. However, there can be no assurance that we will complete a liquidity event within such time or at all. We expect that our board of directors, in the exercise of its fiduciary duty to our stockholders, will determine to pursue a liquidity event when it believes that then-current market conditions are favorable for a liquidity event, and that such an event is in the best interests of our stockholders. A liquidity event could include (1) the sale of all or substantially all of our assets either on a complete portfolio basis or individually followed by a liquidation, (2) a listing of our shares on a national securities exchange or (3) a merger or another transaction approved by our board in which our stockholders will receive cash or shares of a publicly traded company.
Prior to the completion of a liquidity event, our share repurchase program may provide a limited opportunity for investors to achieve liquidity, subject to certain restrictions and limitations, at a price which may reflect a discount from the purchase price you paid for the shares being repurchased.
In making the decision to apply for listing of our shares, our directors will try to determine whether listing our shares or liquidating our assets will result in greater value for our stockholders. In making a determination of what type of liquidity event is in the best interest of our stockholders, our board of directors, including our independent directors, may consider a variety of criteria, including, but not limited to, market conditions, portfolio diversification, portfolio performance, our financial condition, potential access to capital as a listed company, market conditions for the sale of our assets or listing of our common stock, internal management requirements to become a perpetual life company and the potential for stockholder liquidity. If our shares are listed, we cannot assure you a public trading market will develop. Further, even if we do complete a liquidity event, you may not receive a return of all of your invested capital.
We are not obligated to complete a liquidity event by a specified date; therefore, it will be difficult for an investor to sell his or her shares.
We intend to seek to complete a liquidity event for our stockholders within five to seven years following the completion of our offering stage or at such earlier time as our board of directors may determine, taking into consideration market conditions and other factors. We expect that our board of directors, in the exercise of the requisite standard of care applicable to directors under Maryland law, will determine to pursue a liquidity event when it believes that then-current market conditions are favorable for a liquidity event, and that such a transaction is in the best interests of our stockholders. A liquidity event could include (1) the sale of all or substantially all of our assets either on a complete portfolio basis or individually followed by a liquidation, (2) a listing of our shares on a national securities exchange or (3) a merger or another transaction approved by our board in which our stockholders will receive cash or shares of a publicly traded company. However, there can be no assurance that we will complete a liquidity event within such time or at all. If we do not successfully complete a liquidity event, liquidity for an investor’s shares will be limited to our share repurchase program, which we have no obligation to maintain.
The dealer manager in our continuous offering may be unable to sell a sufficient number of shares of common stock for us to achieve our investment objectives.
The dealer manager for our public offering is FS2 Capital Partners, LLC, or our dealer manager. Our dealer manager has limited experience selling shares on behalf of a BDC. There is no assurance that it will be able to sell a sufficient number of shares to allow us to have adequate funds to purchase a diversified portfolio of investments and generate income sufficient to cover our expenses. As a result, we may be unable to achieve our investment objectives, and you could lose some or all of the value of your investment.
42
Table of Contents
Because the dealer manager is one of our affiliates, you will not have the benefit of an independent due diligence review of us, which is customarily performed in firm commitment underwritten offerings; the absence of an independent due diligence review increases the risks and uncertainty you face as a stockholder.
The dealer manager, FS2 Capital Partners, LLC, is one of our affiliates. As a result, its due diligence review and investigation of us cannot be considered to be an independent review. Therefore, you do not have the benefit of an independent review and investigation of our offering of the type normally performed by an unaffiliated, independent underwriter in a firm commitment underwritten public securities offering.
Our ability to successfully conduct our continuous offering is dependent, in part, on the ability of the dealer manager to successfully establish, operate and maintain a network of broker-dealers.
Other than serving as dealer manager for our public offering, the dealer manager has no prior experience acting as a dealer manager for a public offering. The success of our public offering, and correspondingly our ability to implement our business strategy, is dependent upon the ability of the dealer manager to establish and maintain a network of licensed securities broker-dealers and other agents to sell our shares. If the dealer manager fails to perform, we may not be able to raise adequate proceeds through our public offering to implement our investment strategy. If we are unsuccessful in implementing our investment strategy, you could lose all or a part of your investment.
We intend to offer to repurchase your shares on a quarterly basis. As a result, you will have limited opportunities to sell your shares and, to the extent you are able to sell your shares under the repurchase program, you may not be able to recover the amount of your investment in our shares.
We intend to conduct tender offers to allow you to tender your shares on a quarterly basis at a price equal to 90% of our public offering price in effect on the date of repurchase. The first such tender offer commenced in March 2010 and the repurchase occurred in connection with our April 1, 2010 closing. The share repurchase program will include numerous restrictions that limit your ability to sell your shares. We intend to limit the number of shares repurchased pursuant to our share repurchase program as follows: (1) we currently intend to limit the number of shares to be repurchased during any calendar year to the number of shares we can repurchase with the proceeds we receive from the sale of shares of our common stock under our distribution reinvestment plan, although at the discretion of our board of directors, we may also use cash on hand, cash available from borrowings and cash from liquidation of securities investments as of the end of the applicable period to repurchase shares; (2) we will not repurchase shares in any calendar year in excess of 10% of the weighted average number of shares outstanding in the prior calendar year, or 2.5% in each quarter; (3) unless you tender all of your shares, you must tender at least 25% of the amount of shares you have purchased in the offering and must maintain a minimum balance of $5 subsequent to submitting a portion of your shares for repurchase by us; and (4) to the extent that the number of shares put to us for repurchase exceeds the number of shares that we are able to purchase, we will repurchase shares on a pro rata basis, not on a first-come, first-served basis. Further, we will have no obligation to repurchase shares if the repurchase would violate the restrictions on distributions under federal law or Maryland law, which prohibits distributions that would cause a corporation to fail to meet statutory tests of solvency. These limits may prevent us from accommodating all repurchase requests made in any year. Our board of directors may amend, suspend or terminate the repurchase program upon 30 days notice. We will notify you of such developments (1) in our quarterly reports or (2) by means of a separate mailing to you, accompanied by disclosure in a current or periodic report under the Exchange Act. In addition, although we have adopted a share repurchase program, we have discretion to not repurchase your shares, to suspend the plan, and to cease repurchases. Further, the plan has many limitations and should not be relied upon as a method to sell shares promptly and at a desired price.
The timing of our repurchase offers pursuant to our share repurchase program may be at a time that is disadvantageous to our stockholders.
When we make quarterly repurchase offers pursuant to the share repurchase program, we may offer to repurchase shares at a price that is lower than the price that investors paid for shares in our offering. As a result,
43
Table of Contents
to the extent investors have the ability to sell their shares to us as part of our share repurchase program, the price at which an investor may sell shares, which will be 90% of the offering price in effect on the date of repurchase, may be lower than what an investor paid in connection with the purchase of shares in our offering.
In addition, in the event an investor chooses to participate in our share repurchase program, the investor will be required to provide us with notice of intent to participate prior to knowing what the net asset value per share will be on the repurchase date. Although an investor will have the ability to withdraw a repurchase request prior to the repurchase date, to the extent an investor seeks to sell shares to us as part of our periodic share repurchase program, the investor will be required to do so without knowledge of what the repurchase price of our shares will be on the repurchase date.
We may be unable to invest a significant portion of the net proceeds of our offering on acceptable terms in an acceptable timeframe.
Delays in investing the net proceeds of our offering may impair our performance. We cannot assure you that we will be able to identify any investments that meet our investment objectives or that any investment that we make will produce a positive return. We may be unable to invest the net proceeds of our offering on acceptable terms within the time period that we anticipate or at all, which could harm our financial condition and operating results.
In addition, even if we are able to raise significant proceeds, we will not be permitted to use such proceeds to co-invest with certain entities affiliated with GDFM in transactions originated by GSO or its affiliates unless we first obtain an exemptive order from the SEC. We are seeking an exemptive order. However, there can be no assurance that we will obtain such relief.
Before making investments, we will invest the net proceeds of our public offering primarily in cash, cash equivalents, U.S. government securities, repurchase agreements and high-quality debt instruments maturing in one year or less from the time of investment, which may produce returns that are significantly lower than the returns which we expect to achieve when our portfolio is fully invested in securities meeting our investment objectives. As a result, any distributions that we pay while our portfolio is not fully invested in securities meeting our investment objectives may be lower than the distributions that we may be able to pay when our portfolio is fully invested in securities meeting our investment objectives.
A stockholder’s interest in us will be diluted if we issue additional shares, which could reduce the overall value of an investment in us.
Our investors do not have preemptive rights to any shares we issue in the future. Our charter authorizes us to issue 450,000,000 shares of common stock. Pursuant to our charter, a majority of our entire board of directors may amend our charter to increase the number of authorized shares of stock without stockholder approval. After an investor purchases shares, our board may elect to sell additional shares in the future, issue equity interests in private offerings or issue share-based awards to our independent directors or employees of FB Advisor. To the extent we issue additional equity interests after an investor purchases our shares, an investor’s percentage ownership interest in us will be diluted. In addition, depending upon the terms and pricing of any additional offerings and the value of our investments, an investor may also experience dilution in the book value and fair value of your shares.
Certain provisions of our charter and bylaws as well as provisions of the Maryland General Corporation Law could deter takeover attempts and have an adverse impact on the value of our common stock.
The Maryland General Corporation Law and our charter and bylaws contain provisions that may have the effect of discouraging, delaying or making difficult a change in control of our company or the removal of our incumbent directors. We will be covered by the Business Combination Act of the Maryland General Corporation Law to the extent that such statute is not superseded by applicable requirements of the 1940 Act. However, our
44
Table of Contents
board of directors has adopted a resolution exempting from the Business Combination Act any business combination between us and any person to the extent that such business combination receives the prior approval of our board of directors, including a majority of our directors who are not interested persons as defined in the 1940 Act. Under the Control Share Acquisition Act of the Maryland General Corporation Law, “control shares” acquired in a “control share acquisition” have no voting rights except to the extent approved by a vote of two-thirds of the votes entitled to be cast on the matter, excluding shares owned by the acquiror, by officers or by directors who are employees of the corporation. Our bylaws contain a provision exempting from the Control Share Acquisition Act any and all acquisitions by any person of shares of our common stock. The Business Combination Act (if our board should repeal the resolution) and the Control Share Acquisition Act (if we amend our bylaws to be subject to that Act) may discourage others from trying to acquire control of us and increase the difficulty of consummating any offer.
Additionally, our board of directors may, without stockholder action, authorize the issuance of shares of stock in one or more classes or series, including preferred stock; and our board of directors may, without stockholder action, amend our charter to increase the number of shares of stock of any class or series that we have authority to issue. These anti-takeover provisions may inhibit a change of control in circumstances that could give the holders of our common stock the opportunity to realize a premium over the value of our common stock.
Federal Income Tax Risks
We will be subject to corporate-level income tax if we are unable to maintain our qualification as a RIC under Subchapter M of the Code or to satisfy RIC distribution requirements.
To maintain RIC tax treatment under the Code, we must meet the following annual distribution, income source and asset diversification requirements. See “Item 1. Business—Taxation as a Regulated Investment Company.”
| • | The annual distribution requirement for a RIC will be satisfied if we distribute to our stockholders on an annual basis at least 90% of our net ordinary income and realized net short-term capital gains in excess of realized net long-term capital losses, if any. Because we may use debt financing, we are subject to an asset coverage ratio requirement under the 1940 Act and may in the future become subject to certain financial covenants under loan and credit agreements that could, under certain circumstances, restrict us from making distributions necessary to satisfy the distribution requirement. If we are unable to obtain cash from other sources, we could fail to qualify for RIC tax treatment and thus become subject to corporate-level income tax. |
| • | The income source requirement will be satisfied if we obtain at least 90% of our income for each year from dividends, interest, gains from the sale of stock or securities or similar sources. |
| • | The asset diversification requirement will be satisfied if we meet certain asset diversification requirements at the end of each quarter of our taxable year. To satisfy this requirement, at least 50% of the value of our assets must consist of cash, cash equivalents, U.S. Government securities, securities of other RICs, and other acceptable securities; and no more than 25% of the value of our assets can be invested in the securities, other than U.S. government securities or securities of other RICs, of one issuer, of two or more issuers that are controlled, as determined under applicable Code rules, by us and that are engaged in the same or similar or related trades or businesses or of certain “qualified publicly traded partnerships.” Failure to meet these requirements may result in our having to dispose of certain investments quickly in order to prevent the loss of RIC status. Because most of our investments will be in private companies, and therefore will be relatively illiquid, any such dispositions could be made at disadvantageous prices and could result in substantial losses. |
If we fail to maintain RIC tax treatment for any reason and are subject to corporate income tax, the resulting corporate taxes could substantially reduce our net assets, the amount of income available for distribution and the amount of our distributions.
45
Table of Contents
We may have difficulty paying our required distributions if we recognize income before or without receiving cash representing such income.
For federal income tax purposes, we may be required to recognize taxable income in circumstances in which we do not receive a corresponding payment in cash. For example, if we hold debt obligations that are treated under applicable tax rules as having original issue discount (such as debt instruments with PIK interest or, in certain cases, increasing interest rates or debt instruments that were issued with warrants), we must include in income each year a portion of the original issue discount that accrues over the life of the obligation, regardless of whether cash representing such income is received by us in the same taxable year. We may also have to include in income other amounts that we have not yet received in cash, such as deferred loan origination fees that are paid after origination of the loan or are paid in non-cash compensation such as warrants or stock. We anticipate that a portion of our income may constitute original issue discount or other income required to be included in taxable income prior to receipt of cash. Further, we may elect to amortize market discounts and include such amounts in our taxable income in the current year, instead of upon disposition, as an election not to do so would limit our ability to deduct interest expenses for tax purposes.
Because any original issue discount or other amounts accrued will be included in our investment company taxable income for the year of the accrual, we may be required to make a distribution to our stockholders in order to satisfy the annual distribution requirement, even though we will not have received any corresponding cash amount. As a result, we may have difficulty meeting the annual distribution requirement necessary to obtain and maintain RIC tax treatment under the Code. We may have to sell some of our investments at times and/or at prices we would not consider advantageous, raise additional debt or equity capital or forgo new investment opportunities for this purpose. If we are not able to obtain cash from other sources, we may fail to qualify for RIC tax treatment and thus become subject to corporate-level income tax.
| Item 1B. | Unresolved Staff Comments |
Not applicable.
| Item 2. | Properties |
We do not own any real estate or other physical properties materially important to our operation. Our headquarters are located at 2929 Arch Street, Suite 675, Philadelphia, Pennsylvania, 19104. We believe that our office facilities are suitable and adequate for our business as it is presently conducted.
| Item 3. | Legal Proceedings |
We are not currently subject to any material legal proceedings, nor, to our knowledge, is any material legal proceeding threatened against us. From time to time, we may be a party to certain legal proceedings in the ordinary course of business, including proceedings relating to the enforcement of our rights under contracts with our portfolio companies. While the outcome of these legal proceedings cannot be predicted with certainty, we do not expect that these proceedings will have a material effect upon our financial condition or results of operations.
| Item 4. | Reserved |
46
Table of Contents
PART II
Many of the amounts and percentages presented in Part II have been rounded for convenience of presentation, and all dollar amounts, excluding per share amounts, are presented in thousands.
| Item 5. | Market for Registrant’s Common Equity, Related Stockholder Matters and Issuer Purchases of Equity Securities |
There is currently no market for our common stock, and we do not expect that a market for our shares will develop in the foreseeable future. No shares of our common stock have been authorized for issuance under any equity compensation plans. Under Maryland law, our stockholders generally will not be personally liable for our debts or obligations.
We are currently selling our shares on a continuous basis at a price of $10.75 per share; however, to the extent that our net asset value per share increases, we will sell at a price necessary to ensure that shares are not sold at a price, after deduction of selling commissions and dealer manager fees, that is below net asset value per share. In connection with each semi-monthly closing on the sale of shares of our common stock pursuant to our prospectus, as amended or supplemented, which relates to our public offering of common stock on a continuous basis, our board of directors or a committee thereof is required to make the determination that we are not selling shares of our common stock at a price below our then current net asset value per share within 48 hours of the time that we price our shares.
A decline in our net asset value per share to an amount more than 5% below our current offering price, net of selling commissions and dealer manager fees, creates a rebuttable presumption that there has been a material change in the value of our assets such that a reduction in the offering price per share is warranted. This presumption may only be rebutted if our board of directors, in consultation with our management, reasonably and in good faith determines that the decline in net asset value per share is the result of a temporary movement in the credit markets or the value of our assets, rather than a more fundamental shift in the valuation of our portfolio. In the event that (i) net asset value per share decreases to more than 5% below our current net offering price and (ii) our board of directors believes that such decrease in net asset value per share is the result of a non-temporary movement in the credit markets or the value of our assets, our board of directors will undertake to establish a new net offering price that is not more than 5% above our net asset value per share.
Set forth below is a chart describing the classes of our securities outstanding as of March 15, 2011:
| (1) |
(2) | (3) | (4) | |||||||||
| Title of Class |
Amount Authorized |
Amount Held by Us or for Our Account |
Amount Outstanding Exclusive of Amount Under Column(3) |
|||||||||
| Common Stock |
450,000,000 | — | 56,165,178.776 | |||||||||
As of March 15, 2011, we had 15,722 record holders of our common stock.
Distributions
We declared our first distribution on January 29, 2009. Subject to the board of directors’ discretion and applicable legal restrictions, our board of directors intends to authorize and declare distributions on either a semi-monthly or monthly basis and pay distributions on either a monthly or quarterly basis. While we historically paid distributions on a quarterly basis, commencing in the fourth quarter of 2010, subject to the board of directors’ discretion and applicable legal restrictions, we began to pay distributions on a monthly rather than quarterly basis. We will calculate each stockholder’s specific distribution amount for the period using record and declaration dates and each stockholder’s distributions will begin to accrue on the date we accept each stockholder’s subscription for shares of our common stock. From time to time, we may also pay interim special
47
Table of Contents
distributions in the form of cash or shares of common stock at the discretion of our board of directors. Each year a statement on Form 1099-DIV, identifying the source of the distribution (i.e., paid from ordinary income, paid from net capital gains on the sale of securities, and/or a return of paid-in capital surplus, which is a nontaxable distribution) will be mailed to our stockholders. Our distributions may exceed our earnings, especially during the period before we have substantially invested the proceeds from our offering. As a result, a portion of the distributions we make may represent a return of capital for tax purposes. No portion of the distributions paid during the years ended December 31, 2010 or 2009 represented a return of capital for tax purposes.
We intend to continue to make our ordinary distributions in the form of cash, out of assets legally available, unless stockholders elect to receive their distributions and/or long-term capital gains distributions in additional shares of our common stock under our distribution reinvestment plan. Any distributions reinvested under the plan will nevertheless remain taxable to a U.S. stockholder. If stockholders hold shares in the name of a broker or financial intermediary, they should contact the broker or financial intermediary regarding their election to receive distributions in additional shares of our common stock.
To maintain RIC tax treatment, we must, among other things, distribute at least 90% of our net ordinary income and realized net short-term capital gains in excess of realized net long-term capital losses, if any. In order to avoid certain excise taxes imposed on RICs, we currently intend to distribute during each calendar year an amount at least equal to the sum of (1) 98% of our net ordinary income for the calendar year, (2) 98.2% of our capital gains in excess of capital losses for the one-year period ending on October 31 of the calendar year and (3) any net ordinary income and net capital gains for preceding years that were not distributed during such years and on which we paid no federal income tax. We can offer no assurance that we will achieve results that will permit the payment of any cash distributions and, if we issue senior securities, we will be prohibited from making distributions if doing so causes us to fail to maintain the asset coverage ratios stipulated by the 1940 Act or if distributions are limited by the terms of any of our borrowings.
Promptly following the payment of distributions to all stockholders of record, we will send information to stockholders residing in Maryland regarding the source of such distributions.
The following table reflects the cash distributions per share that we have declared and paid on our common stock during the years ended December 31, 2008, 2009 and 2010:
| Distribution | ||||||||
| For the Year Ended |
Per Share(1)(2)(3) | Amount | ||||||
| 2008 |
$ | 0.1835 | $ | 25 | ||||
| 2009 |
0.6717 | 3,134 | ||||||
| 2010 |
0.8728 | 21,389 | ||||||
| (1) | The amount of each per share distribution has been retroactively adjusted to reflect the stock distributions declared throughout 2009 and 2010 as discussed below. |
| (2) | In addition to regular semi-monthly cash distributions during such period, cash distributions declared and paid on our common stock during the year ended December 31, 2010 include approximately $3,851, or approximately $0.12 per share, in special cash distributions. |
| (3) | On October 13, 2010, our board of directors determined to increase the amount of semi-monthly distributions payable to stockholders of record from $0.03125 per share to $0.03185 per share, effective October 1, 2010. On October 29, 2010, our board of directors determined to increase the amount of semi-monthly distributions payable to stockholders of record from $0.03185 per share to $0.032156 per share, effective November 1, 2010. |
On January 13, 2011, our board of directors declared two regular semi-monthly cash distributions of $0.032156 per share each, which were paid on January 31, 2011 to stockholders of record on January 14, 2011 and January 28, 2011, respectively. On February 14, 2011, our board of directors declared two regular semi-
48
Table of Contents
monthly cash distributions of $0.032156 per share each, which were paid on February 28, 2011 to stockholders of record on February 14, 2011 and February 25, 2011, respectively. On March 14, 2011, our board of directors declared two regular semi-monthly cash distributions of $0.032156 per share each, which will be paid on March 31, 2011 to stockholders of record on March 14, 2011 and March 30, 2011, respectively. The timing and amount of any future distributions to stockholders are subject to applicable legal restrictions and the sole discretion of our board of directors.
We have adopted an “opt in” distribution reinvestment plan for our stockholders. As a result, if we make a distribution, our stockholders will receive distributions in cash unless they specifically “opt in” to the distribution reinvestment plan so as to have their cash distributions reinvested in additional shares of our common stock.
We may fund our cash distributions to stockholders from any sources of funds available to us, including offering proceeds, borrowings, net investment income from operations, capital gains proceeds from the sale of assets, non-capital gains proceeds from the sale of assets and expense reimbursements from Franklin Square Holdings. The following table reflects, for tax purposes, the sources of the cash distributions that we have paid on our common stock during the years ended December 31, 2010, 2009 and 2008:
| Year ended December 31, | ||||||||||||||||||||||||
| 2010 | 2009 | 2008 | ||||||||||||||||||||||
| Source of Distribution |
Distribution Amount |
Percentage | Distribution Amount |
Percentage | Distribution Amount |
Percentage | ||||||||||||||||||
| Offering proceeds |
$ | — | — | $ | — | — | $ | — | — | |||||||||||||||
| Borrowings |
— | — | — | — | — | — | ||||||||||||||||||
| Net investment income(1) |
13,545 | 63 | % | 1,917 | 61 | % | 25 | 100 | % | |||||||||||||||
| Capital gains proceeds from the sale of assets |
7,844 | 37 | % | 977 | 31 | % | — | — | ||||||||||||||||
| Non-capital gains proceeds from the sale of assets |
— | — | — | — | — | — | ||||||||||||||||||
| Expense reimbursement from sponsor |
— | — | 240 | 8 | % | — | — | |||||||||||||||||
| Total |
$ | 21,389 | 100 | % | $ | 3,134 | 100 | % | $ | 25 | 100 | % | ||||||||||||
| (1) | During the years ended December 31, 2010 and 2009, 84% and 57%, respectively, of our gross investment income was attributable to cash interest earned and 16% and 43%, respectively, was attributable to non-cash accretion of discount and PIK interest. |
The aggregate cost of our investments for federal income tax purposes totaled $715,695 and $92,366 as of December 31, 2010 and 2009, respectively. The aggregate net unrealized appreciation on a tax basis was $17,885 and $8,226 as of December 31, 2010 and 2009, respectively. Our net investment income on a tax basis for the years ended December 31, 2010 and 2009 was $13,545 and $2,157, respectively. We distributed all of our net investment income earned as of December 31, 2010 and 2009.
49
Table of Contents
The difference between our GAAP-basis net investment income and our tax-basis net investment income is due to the tax-basis amortization of organization and start-up costs incurred prior to the commencement of our operations, interest income earned on a tax basis due to the required accretion of discount on a non-performing loan, and the required accrual for GAAP purposes of incentive fees on unrealized gains even though no such incentive fees on unrealized gains are payable by us. See “Item 7. Management’s Discussion and Analysis of Financial Condition and Results of Operations—Critical Accounting Policies—Capital Gains Incentive Fee.” The following table sets forth a reconciliation between GAAP-basis net investment income and tax-basis net investment income during the years ended December 31, 2010 and 2009:
| Year ended December 31, | ||||||||
| 2010 | 2009 | |||||||
| GAAP basis net investment income |
$ | 9,392 | $ | 2,151 | ||||
| Amortization of organizational costs |
(43 | ) | (43 | ) | ||||
| Tax accretion of discount on investment |
133 | 49 | ||||||
| Reversal of incentive fee accrual on unrealized gains |
4,063 | — | ||||||
| Tax basis net investment income |
$ | 13,545 | $ | 2,157 | ||||
The determination of the tax attributes of our distributions is made annually as of the end of our fiscal year based upon our taxable income for the full year and distributions paid for the full year. Therefore, a determination made on a quarterly basis may not be representative of the actual tax attributes of our distributions for a full year.
The following table reflects the stock distributions per share that we have declared on our common stock to date:
| Date Declared |
Record Date | Payment Date | Distribution Percentage |
Shares Issued |
||||||||||||
| Fiscal 2009 |
||||||||||||||||
| March 31, 2009 |
March 31, 2009 | March 31, 2009 | 1.4 | % | 13,818 | |||||||||||
| April 30, 2009 |
April 30, 2009 | April 30, 2009 | 3.0 | % | 42,661 | |||||||||||
| May 29, 2009 |
May 29, 2009 | May 29, 2009 | 3.7 | % | 79,125 | |||||||||||
| June 30, 2009 |
June 30, 2009 | June 30, 2009 | 3.5 | % | 96,976 | |||||||||||
| July 30, 2009 |
July 31, 2009 | July 31, 2009 | 3.1 | % | 117,219 | |||||||||||
| August 31, 2009 |
August 31, 2009 | August 31, 2009 | 3.0 | % | 148,072 | |||||||||||
| December 31, 2009 |
December 31, 2009 | December 31, 2009 | 0.5 | % | 49,710 | |||||||||||
| Fiscal 2010 |
||||||||||||||||
| January 28, 2010 |
January 31, 2010 | January 31, 2010 | 2.5 | % | 283,068 | |||||||||||
The purpose of these special distributions was to maintain a net asset value per share that was below the then-current net offering price, as required by the 1940 Act, subject to certain limited exceptions. Our board of directors determined that our portfolio performance sufficiently warranted taking these actions.
The stock distributions increased the number of shares outstanding, thereby reducing our net asset value per share. However, because the stock distributions were issued to all stockholders in proportion to their current holdings, the reduction in net asset value per share as a result of the stock distributions was offset exactly by the increase in the number of shares owned by each investor. As overall value to an investor was not reduced as a result of the special stock distributions, our board of directors determined that these issuances would not be dilutive to existing stockholders. As the stock distributions did not change any stockholder’s proportionate interest in us, they are not expected to represent taxable distributions. Specific tax characteristics of all distributions are reported to stockholders annually on Form 1099-DIV.
50
Table of Contents
As of December 31, 2010 and 2009, the components of accumulated earnings on a tax basis were as follows:
| As of December 31, | ||||||||
| 2010 | 2009 | |||||||
| Distributable ordinary income |
$ | 1,290 | $ | 53 | ||||
| Incentive fee accrual on unrealized gains |
(4,063 | ) | — | |||||
| Unamortized organizational costs |
(558 | ) | (600 | ) | ||||
| Unrealized appreciation on investments(1) |
17,885 | 8,226 | ||||||
| $ | 14,554 | $ | 7,679 | |||||
| (1) | As of December 31, 2010 and 2009, the gross unrealized appreciation on our investments was $20,136 and $8,390, respectively. As of December 31, 2010 and 2009, the gross unrealized depreciation on our investments was $2,251 and $164, respectively. |
51
Table of Contents
| Item 6. | Selected Financial Data |
The following selected financial data for the years ended December 31, 2010, 2009 and 2008 and for the period from December 21, 2007 (Inception) to December 31, 2007 is derived from our financial statements which have been audited by McGladrey & Pullen, LLP, our independent registered public accounting firm. The data should be read in conjunction with our financial statements and related notes thereto and “Item 7. Management’s Discussion and Analysis of Financial Condition and Results of Operations” included elsewhere in this report.
| Period
from December 21, 2007 (Inception) to December 31, 2007 |
||||||||||||||||
| Year Ended December 31, | ||||||||||||||||
| 2010 | 2009 | 2008 | ||||||||||||||
| Statement of operations data: |
||||||||||||||||
| Investment income |
$ | 30,670 | $ | 4,420 | $ | 25 | $ | — | ||||||||
| Operating expenses |
||||||||||||||||
| Total expenses |
21,278 | 2,509 | 605 | 37 | ||||||||||||
| Less: Expense reimbursement from sponsor |
— | (240 | ) | — | — | |||||||||||
| Net expenses |
21,278 | 2,269 | 605 | 37 | ||||||||||||
| Net investment income (loss) |
9,392 | 2,151 | (580 | ) | (37 | ) | ||||||||||
| Realized and unrealized gain |
18,872 | 9,305 | — | — | ||||||||||||
| Net increase (decrease) in net assets resulting from operations |
$ | 28,264 | $ | 11,456 | $ | (580 | ) | $ | (37 | ) | ||||||
| Per share data: |
||||||||||||||||
| Net investment income (loss)—basic and diluted |
$ | 0.40 | $ | 0.48 | $ | (4.72 | ) | |||||||||
| Net increase (decrease) in net assets resulting from operations—basic and diluted |
$ | 1.21 | $ | 2.57 | $ | (4.72 | ) | |||||||||
| Distributions declared |
$ | 0.87 | $ | 0.67 | $ | 0.18 | ||||||||||
| Balance sheet data: |
||||||||||||||||
| Total assets |
$ | 782,005 | $ | 110,068 | $ | 1,000 | ||||||||||
| Credit facility payable |
$ | 297,201 | $ | — | $ | — | ||||||||||
| Total net assets |
$ | 389,232 | $ | 93,197 | $ | 999 | ||||||||||
| Other data: |
||||||||||||||||
| Total return(1) |
13.08 | % | 33.33 | % | 2.40 | % | ||||||||||
| Number of portfolio company investments at period end |
144 | 50 | — | |||||||||||||
| Total portfolio investments for the period |
$ | 849,242 | $ | 106,098 | $ | — | ||||||||||
| Investment sales and prepayments for the period |
$ | 240,054 | $ | 16,717 | $ | — | ||||||||||
| (1) | The 2008 total return is based on an initial investment at $7.32 per share, which represents the initial offering price per share, net of commissions and discounts, after taking into account the stock distributions to stockholders described in “Item 5. Market for Registrant’s Common Equity, Related Stockholder Matters and Issuer Purchases of Equity Securities—Distributions”. The 2009 total return was calculated by taking the net asset value per share as of December 31, 2009, adding the cash distributions per share which were declared during the calendar year and dividing the total by the net asset value per share on December 31, 2008. The 2010 total return was calculated by taking the net asset value per share as of December 31, 2010, adding the cash distributions per share which were declared during the calendar year and dividing the total by the net asset value per share on December 31, 2009. The total return does not consider the effect of the sales load from the sale of the Company’s common stock. |
52
Table of Contents
| Item 7. | Management’s Discussion and Analysis of Financial Condition and Results of Operations |
FORWARD-LOOKING STATEMENTS
The following discussion should be read in conjunction with our financial statements and the notes thereto included elsewhere in this annual report on Form 10-K.
Some of the statements in this annual report on Form 10-K constitute forward-looking statements because they relate to future events or our future performance or financial condition. The forward-looking statements contained in this annual report on Form 10-K may include statements as to:
| • | our future operating results; |
| • | our business prospects and the prospects of our portfolio companies; |
| • | the impact of the investments that we expect to make; |
| • | the ability of our portfolio companies to achieve their objectives; |
| • | our current and expected financings and investments; |
| • | the adequacy of our cash resources and working capital; and |
| • | the timing of cash flows, if any, from the operations of our portfolio companies. |
In addition, words such as “anticipate,” “believe,” “expect” and “intend” indicate a forward-looking statement, although not all forward-looking statements include these words. The forward-looking statements contained in this annual report on Form 10-K involve risks and uncertainties. Our actual results could differ materially from those implied or expressed in the forward-looking statements for any reason. Factors that could cause actual results to differ materially include:
| • | changes in the economy; |
| • | risks associated with possible disruption in our operations or the economy generally due to terrorism or natural disasters; and |
| • | future changes in laws or regulations and conditions in our operating areas. |
We have based the forward-looking statements included in this annual report on Form 10-K on information available to us on the date of this annual report on Form 10-K, and we assume no obligation to update any such forward-looking statements. Except as required by the federal securities laws, we undertake no obligation to revise or update any forward-looking statements, whether as a result of new information, future events or otherwise. You are advised to consult any additional disclosures that we may make directly to you or through reports that we in the future may file with the SEC, including annual reports on Form 10-K, quarterly reports on Form 10-Q and current reports on Form 8-K. The forward-looking statements and projections contained in this annual report on Form 10-K are excluded from the safe harbor protection provided by Section 27A of the Securities Act of 1933, as amended, or the Securities Act.
Overview
We were incorporated under the general corporation laws of the State of Maryland on December 21, 2007, and commenced operations on January 2, 2009 upon raising gross proceeds in excess of $2.5 million from persons who are not affiliated with us or FB Advisor. We are an externally managed, non-diversified, closed-end management investment company that has elected to be treated as a BDC under the 1940 Act and has elected to be treated for federal income tax purposes as a RIC under the Code.
Our investment objectives are to generate current income and, to a lesser extent, long-term capital appreciation. Our portfolio is comprised primarily of investments in senior secured loans, second lien secured
53
Table of Contents
loans and, to a lesser extent, long-term subordinated loans, referred to as mezzanine loans, of private U.S. companies. We may purchase interests in loans through secondary market transactions in the “over-the-counter” market for institutional loans or directly from our target companies. In connection with our debt investments, we may on occasion receive equity interests such as warrants or options as additional consideration. We may also purchase minority interests in the form of common or preferred equity in our target companies, either in conjunction with one of our debt investments or through a co-investment with a financial sponsor. In addition, a portion of our portfolio may be comprised of corporate bonds and other debt securities. However, such investments are not expected to comprise a significant portion of our portfolio.
The senior secured and second lien secured loans in which we invest generally have stated terms of three to seven years and any mezzanine investments that we make generally will have stated terms of up to ten years, but the expected average life of such loans is generally between three and seven years. However, there is no limit on the maturity or duration of any security in our portfolio. The loans that we invest in are often rated by a nationally recognized statistical ratings organization (NRSRO), and generally will carry a rating below investment grade (rated lower than “Baa3” by Moody’s Investors Service or lower than “BBB-” by Standard & Poor’s Corporation). However, we may also invest in non-rated debt securities.
Portfolio Investment Activity For The Years Ended December 31, 2010 and 2009
During the year ended December 31, 2010, we made investments in portfolio companies totaling $849,242. During the same period, we sold positions totaling $122,581 and received principal repayments of $117,473. As of December 31, 2010, our investment portfolio, with a total fair value of $733,580, consisted of interests in 144 portfolio companies (66% in first lien senior secured loans, 19% in second lien senior secured loans, 4% in senior secured bonds and 11% in mezzanine debt/other) with an average annual EBITDA of approximately $294.5 million. As of December 31, 2010, the investments in our portfolio were purchased at an average price of 94.9% of par value, the weighted average credit rating of our portfolio was B2 based upon the Moody’s scale and our estimated gross annual portfolio yield, prior to leverage, was 8.5% based upon the purchase price of our investments.
During the year ended December 31, 2009, we made investments in portfolio companies totaling $106,098. During the same period, we sold positions totaling $11,779 and received principal repayments of $4,938. As of December 31, 2009, our investment portfolio, with a total fair value of $100,592, consisted of interests in 50 portfolio companies (46% in first lien senior secured loans, 45% in second lien senior secured loans and 9% in mezzanine debt) with an average annual EBITDA of approximately $269.4 million. As of December 31, 2009, the investments in our portfolio were purchased at an average price of 82.5% of par value, the weighted average credit rating of our portfolio was B3 based upon the Moody’s scale and our estimated gross annual portfolio yield was 13.2% based upon the purchase price of our investments.
The following table summarizes the composition of our investment portfolio at cost and fair value as of December 31, 2010 and 2009:
| Year Ended December 31, | ||||||||||||||||||||||||
| 2010 | 2009 | |||||||||||||||||||||||
| Cost (1) | Fair Value | Percentage of Portfolio |
Cost(1) | Fair Value | Percentage of Portfolio |
|||||||||||||||||||
| Senior Secured Loans—First Lien |
$ | 473,881 | $ | 484,105 | 66 | % | $ | 41,835 | $ | 45,780 | 46 | % | ||||||||||||
| Senior Secured Loans—Second Lien |
131,960 | 135,962 | 19 | % | 41,351 | 45,521 | 45 | % | ||||||||||||||||
| Senior Secured Bonds |
30,265 | 31,659 | 4 | % | — | — | 0 | % | ||||||||||||||||
| Mezzanine Debt/Other |
79,408 | 81,854 | 11 | % | 9,131 | 9,291 | 9 | % | ||||||||||||||||
| $ | 715,514 | $ | 733,580 | 100 | % | $ | 92,317 | $ | 100,592 | 100 | % | |||||||||||||
| (1) | Cost represents the original cost adjusted for the accretion of discounts on debt investments. |
54
Table of Contents
We do not “control” and are not an “affiliate” of any of our portfolio companies, each as defined in the 1940 Act. In general, under the 1940 Act, we would be presumed to “control” a portfolio company if we owned 25% or more of its voting securities and would be an “affiliate” of a portfolio company if we owned 5% or more of its voting securities.
Our investment portfolio may contain loans that are in the form of lines of credit or revolving credit facilities, which require us to provide funding when requested by portfolio companies in accordance with the terms of the underlying loan agreements. As of December 31, 2010, we had three such investments, all of which have been fully funded.
The table below describes investments by industry classification and enumerates the percentage, by fair value, of the total portfolio assets in such industries as of December 31, 2010 and 2009:
| Year Ended December 31, | ||||||||||||||||
| 2010 | 2009 | |||||||||||||||
| Industry Classification |
Fair Value | Percentage of Portfolio |
Fair Value | Percentage of Portfolio |
||||||||||||
| Consumer Discretionary |
$ | 129,749 | 17.6 | % | $ | 10,739 | 10.7 | % | ||||||||
| Consumer Staples |
56,184 | 7.7 | % | 4,615 | 4.6 | % | ||||||||||
| Energy |
69,048 | 9.4 | % | 9,388 | 9.3 | % | ||||||||||
| Financials |
59,431 | 8.1 | % | 6,876 | 6.8 | % | ||||||||||
| Healthcare |
63,460 | 8.7 | % | 3,927 | 3.9 | % | ||||||||||
| Industrials |
96,762 | 13.2 | % | 10,943 | 10.9 | % | ||||||||||
| Information Technology |
117,499 | 16.0 | % | 32,030 | 31.8 | % | ||||||||||
| Materials |
46,832 | 6.4 | % | 5,762 | 5.7 | % | ||||||||||
| Telecommunication Services |
81,675 | 11.1 | % | 12,671 | 12.7 | % | ||||||||||
| Utilities |
12,940 | 1.8 | % | 3,641 | 3.6 | % | ||||||||||
| Total |
$ | 733,580 | 100.0 | % | $ | 100,592 | 100.0 | % | ||||||||
Portfolio Asset Quality
In addition to various risk management and monitoring tools, FB Advisor uses an investment rating system to characterize and monitor the expected level of returns on each investment in our portfolio. FB Advisor uses an investment rating scale of 1 to 5. The following is a description of the conditions associated with each investment rating:
| Investment |
Summary Description | |
| 1 | Investment exceeding expectations and/or capital gain expected. | |
| 2 | Performing investment generally executing in accordance with the portfolio company’s business plan—full return of principal and interest expected. | |
| 3 | Performing investment requiring closer monitoring. | |
| 4 | Underperforming investment—some loss of interest or dividend expected, but still expecting a positive return on investment. | |
| 5 | Underperforming investment with expected loss of interest and some principal. | |
55
Table of Contents
The following table shows the distribution of our debt investments on the 1 to 5 investment rating scale at fair value as of December 31, 2010 and 2009:
| December 31, 2010 | December 31, 2009 | |||||||||||||||
| Investment Rating |
Investments at Fair Value |
Percentage of Portfolio |
Investments at Fair Value |
Percentage of Portfolio |
||||||||||||
| 1 |
$ | 38,899 | 5 | % | $ | — | — | |||||||||
| 2 |
682,861 | 93 | % | 98,848 | 98 | % | ||||||||||
| 3 |
11,384 | 2 | % | — | — | |||||||||||
| 4 |
436 | 0 | % | 1,744 | 2 | % | ||||||||||
| 5 |
— | — | — | — | ||||||||||||
| $ | 733,580 | 100 | % | $ | 100,592 | 100 | % | |||||||||
The amount of the portfolio in each grading category may vary substantially from period to period resulting primarily from changes in the composition of the portfolio as a result of new investment, repayment, and exit activities. In addition, changes in the grade of investments may be made to reflect our expectation of performance and changes in investment values.
Results of Operations
The principal measure of our financial performance is net increase in net assets resulting from operations, which includes net investment income, net realized gain, net unrealized appreciation and depreciation and net unrealized gains and losses on foreign currency. Net investment income is the difference between our income from interest, dividends, fees and other investment income and our operating expenses. Net realized gain on investments is the difference between the proceeds received from dispositions of portfolio investments and their stated cost. Net unrealized appreciation and depreciation on investments is the net change in the fair value of our investment portfolio. Net unrealized gains and losses on foreign currency is the net change in the fair value of our investments due to the impact of foreign currency fluctuations.
Comparison of the years ended December 31, 2010 and December 31, 2009
Revenues
We generated investment income of $30,670 and $4,420 for the years ended December 31, 2010 and 2009, respectively, in the form of interest earned on senior secured loans, mezzanine debt, collateralized loan and debt obligations and corporate bonds in our portfolio. Such revenues represent $25,742 and $2,513 of cash interest earned as well as $4,928 and $1,907 in non-cash portions relating to accretion of discount and PIK interest for the years ended December 31, 2010 and 2009, respectively. Cash flows related to such non-cash revenues may not occur for a number of reporting periods or years after such revenues are recognized. The increase in investment income is due to the growth of our portfolio since commencing operations in 2009. The level of interest income we receive is directly related to the balance of interest-bearing investments multiplied by the weighted average yield of our investments.
We expect the dollar amount of interest and any dividend income that we earn to increase as the size of our investment portfolio increases. We may also generate revenues in the form of dividends on the equity or other securities we may hold. Since commencing operations, we have not owned any equity interests in our portfolio companies and, therefore, did not receive dividend payments or other fees from our portfolio companies.
In addition, we may generate revenues in the form of commitment, origination, structuring or diligence fees, monitoring fees, fees for providing managerial assistance, consulting fees and performance-based fees. Any such fees generated in connection with our investments will be recognized as earned. No such fees were earned during the years ended December 31, 2010 or 2009.
56
Table of Contents
Expenses
Our primary operating expenses are the payment of advisory fees and other expenses under the investment advisory and administrative services agreement and other expenses necessary for our operations. Our investment advisory fee compensates FB Advisor for its work in identifying, evaluating, negotiating, executing, monitoring and servicing our investments. FB Advisor is responsible for compensating our investment sub-adviser.
We also reimburse FB Advisor for its performance of services related to our administration and operation, provided that such reimbursement shall be the lower of FB Advisor’s actual costs or the amount that we would be required to pay for comparable administrative services in the same geographic location, and provided further that such costs will be reasonably allocated to us on the basis of assets, revenues, time records or other reasonable methods. We do not reimburse FB Advisor for any services for which it receives a separate fee, nor for rent, depreciation, utilities, capital equipment or other administrative items allocated to a controlling person of FB Advisor. We bear all other expenses of our operations and transactions, including (without limitation) fees and expenses relating to:
| • | corporate and organizational expenses relating to offerings of our common stock, subject to limitations included in the investment advisory and administrative services agreement; |
| • | the cost of calculating our net asset value, including the cost of any third-party valuation services; |
| • | the cost of effecting sales and repurchases of shares of our common stock and other securities; |
| • | investment advisory fees; |
| • | fees payable to third parties relating to, or associated with, making investments and valuing investments, including fees and expenses associated with performing due diligence reviews of prospective investments; |
| • | transfer agent and custodial fees; |
| • | fees and expenses associated with marketing efforts; |
| • | federal and state registration fees; |
| • | federal, state and local taxes; |
| • | independent directors’ fees and expenses; |
| • | costs of proxy statements, stockholders’ reports and notices; |
| • | fidelity bond, directors and officers/errors and omissions liability insurance and other insurance premiums; |
| • | direct costs such as printing, mailing, long distance telephone and staff; |
| • | fees and expenses associated with independent audits and outside legal costs, including compliance with the Sarbanes-Oxley Act of 2002; |
| • | costs associated with our reporting and compliance obligations under the 1940 Act and applicable federal and state securities laws; |
| • | brokerage commissions for the purchase and sale of our investments; and |
| • | all other expenses incurred by FB Advisor, our sub-adviser or us in connection with administering our business, including expenses incurred by FB Advisor or our sub-adviser in performing administrative services for us, and the reimbursement of the compensation of our chief compliance officer and other administrative personnel paid by FB Advisor, to the extent they are not controlling persons of FB Advisor or any of its affiliates, subject to the limitations included in the investment advisory and administrative services agreement. |
57
Table of Contents
Our total operating expenses were $21,278 and $2,509 for the years ended December 31, 2010 and 2009, respectively. Our operating expenses include base management fees attributed to FB Advisor of $7,900 and $829 for the years ended December 31, 2010 and 2009, respectively. Our operating expenses also include administrative services expenses attributed to FB Advisor of $924 and $261 for the years ended December 31, 2010 and 2009, respectively.
FB Advisor is eligible to receive incentive fees based on performance. We accrued incentive fee expenses during the years ended December 31, 2010 and 2009 of $5,459 and $173, respectively. The incentive fee expense for the year ended December 31, 2010 includes $4,063 accrued with respect to unrealized gains in our investment portfolio, although no such incentive fee is actually payable by us with respect to such unrealized gains unless and until those gains are actually realized. See “—Critical Accounting Policies—Capital Gains Incentive Fee.”
We recorded interest expense of $3,881 for the year ended December 31, 2010 in connection with our revolving credit facility. Fees incurred with BNY Mellon Asset Servicing (formerly PNC Global Investment Services), which provides various accounting and administrative services to us, totaled $568 and $326 for the years ended December 31, 2010 and 2009, respectively. We incurred expenses with our stock transfer agent of $890 and $265 for the years ended December 31, 2010 and 2009, respectively.
Our other general and administrative expenses totaled $1,656 and $655 for the years ended December 31, 2010 and 2009, respectively, and consisted of the following:
| Year Ended December 31, | ||||||||
| 2010 | 2009 | |||||||
| Expenses associated with our independent audit and related fees |
$ | 385 | $ | 114 | ||||
| Compensation of our chief financial officer and our chief compliance officer |
168 | 153 | ||||||
| Legal fees |
316 | 151 | ||||||
| Printing fees |
260 | 42 | ||||||
| Fees paid to our independent directors |
189 | 81 | ||||||
| Other |
338 | 114 | ||||||
| Total |
$ | 1,656 | $ | 655 | ||||
After the first half of 2009, our other general and administrative expenses increased as initial pricing arrangements that we negotiated with certain vendors, due to our relatively small scale, ceased. In addition, our independent directors began receiving fees in connection with their service as independent directors in the second half of 2009. Prior to the third quarter of 2009, our independent directors had agreed to waive all fees payable in connection with their service as members of our board of directors.
Over the next several quarters, we expect our general and administrative operating expenses related to our ongoing operations to continue to increase because of the anticipated growth in the size of our asset base. During the years ended December 31, 2010 and 2009, the ratio of our operating expenses to our average net assets was 9.89% and 6.53%, respectively. We generally expect our general and administrative operating expenses to decline as a percentage of our total assets during periods of asset growth and increase as a percentage of our total assets during periods of asset declines. Incentive fees, interest expense and costs relating to our continuous offering, among other things, may also increase or decrease our operating expenses in relation to our expense ratios relative to comparative periods depending on portfolio performance, changes in benchmark interest rates such as LIBOR and offerings of our securities, among other factors. The higher ratio of operating expenses to average net assets during the year ended December 31, 2010 compared to the year ended December 31, 2009 can primarily be attributed to (i) a change in our methodology during 2010 for accruing for incentive fees to include unrealized gains in the calculation of our capital gains incentive fee expense, even though no such incentive fee is actually payable by us with respect to such unrealized gains unless and until those gains are actually realized (see “—Critical Accounting Policies—Capital Gains Incentive Fee”), and (ii) interest expense related to the
58
Table of Contents
revolving credit facility between Broad Street and Deutsche Bank which was established during the first quarter of 2010. Without such expenses, our ratio of operating expenses to average net assets would have been approximately 6.20% during the year ended December 31, 2010.
Expense Reimbursement
Beginning on February 26, 2009, our affiliate and sponsor, Franklin Square Holdings, agreed to reimburse us for expenses in an amount that is sufficient to ensure that, for tax purposes, our net investment income and net capital gains are equal to or greater than the cumulative distributions paid to our stockholders in each quarter. This arrangement is designed to ensure that no portion of our distributions will represent a return of capital for our stockholders. Franklin Square Holdings has no obligation to reimburse any portion of our expenses. The specific amount of expenses reimbursed by Franklin Square Holdings, if any, will be determined at the end of each quarter. During the year ended December 31, 2010, we received no reimbursements from Franklin Square Holdings. During the year ended December 31, 2009, reimbursements from Franklin Square Holdings totaled $240. We do not expect that conditions will require Franklin Square Holdings to provide reimbursements in the future. To the extent reimbursements may be needed in the future, there can be no assurance that Franklin Square Holdings will provide any such reimbursements. Franklin Square Holdings is controlled by our chief executive officer, Michael Forman, and our director, David Adelman.
Net Investment Income
Our net investment income totaled $9,392 ($0.40 per share) and $2,151 ($0.48 per share) for the years ended December 31, 2010 and 2009, respectively.
Net Realized Gains or Losses
We sold investments and received principal repayments of $122,581 and $117,473, respectively, during the year ended December 31, 2010, from which we realized net gains of $9,081. We sold investments and received principal repayments of $11,779 and $4,938, respectively, during the year ended December 31, 2009, from which we realized net gains of $1,030.
Net Change in Unrealized Appreciation on Investments and Unrealized Loss on Foreign Currency
For the year ended December 31, 2010, the net change in unrealized appreciation on investments totaled $9,809 and the net change in unrealized loss on foreign currency totaled $18. For the year ended December 31, 2009, the net change in unrealized appreciation on investments totaled $8,275. We did not hold any investment denominated in a foreign currency during the year ended December 31, 2009. The unrealized appreciation on our investments during the year ended December 31, 2010 was primarily driven by general improvement in the credit markets. The increase in unrealized appreciation for the year ended December 31, 2009 was due primarily to general increases in prices for senior secured debt as the loan market partially recovered from its historical lows reached in the fourth quarter of 2008.
Net Increase in Net Assets Resulting from Operations
For the year ended December 31, 2010, the net increase in net assets resulting from operations was $28,264 ($1.21 per share) compared to a net increase in net assets resulting from operations of $11,456 ($2.57 per share) during the corresponding period in 2009.
Comparison of the years ended December 31, 2009 and December 31, 2008
We commenced operations on January 2, 2009, when we raised in excess of $2.5 million from persons who are not affiliated with us or FB Advisor. As a result, no comparisons with the year ended December 31, 2008 have been provided.
59
Table of Contents
For the year ended December 31, 2008 and for the period from December 21, 2007 (Inception) to December 31, 2007, we incurred organization costs of $605 and $37, respectively, included in other general and administrative expenses, which represented our only operating activities at that time. These organization costs included, among other items, the cost of legal services pertaining to our organization and the incorporation of our business. These costs were paid on our behalf by an affiliate and were treated as capital contributions. No such costs were incurred during the years ended December 31, 2010 and 2009.
Financial Condition, Liquidity and Capital Resources
During the year ended December 31, 2010, we sold 31,320,067 shares (as adjusted for stock distributions) of our common stock for gross proceeds of $324,420. The gross proceeds received during the year ended December 31, 2010 include reinvested stockholder distributions of $8,252. During the year ended December 31, 2010, we also incurred offering costs of $1,671 in connection with the sale of our common stock, which consisted primarily of legal, due diligence and printing fees. Franklin Square Holdings funded $1,125 of these offering costs. We recorded these costs as a contribution to capital. The offering costs were offset against capital in excess of par in our consolidated financial statement and the other expenses were charged to expense as incurred. The sales commissions and dealer manager fees related to the sale of our common stock were $30,252 for the year ended December 31, 2010. These sales commissions and fees include $5,435 retained by the dealer manager, FS2 Capital Partners, LLC, or FS2, which is one of our affiliates.
During the year ended December 31, 2009, we sold 10,105,293 shares (as adjusted for stock distributions) of our common stock for gross proceeds of $93,464 and incurred related offering costs of $387 in connection with the sale of our common stock, which consisted primarily of legal, due diligence and printing fees. Franklin Square Holdings funded these offering costs. The sales commissions and dealer manager fees related to the sale of our common stock were $8,187 for the year ended December 31, 2009. These sales commissions and fees include $1,295 retained by FS2.
As of March 15, 2011, we have sold 56,357,510 shares (as adjusted for stock distributions) of our common stock for gross proceeds of $576,396 since commencing our continuous public offering. Including the seed capital contributed by Messrs. Forman and Adelman, we have raised gross proceeds of $577,396 to date.
We generate cash primarily from the net proceeds of our ongoing continuous public offering and from cash flows from fees, interest and dividends earned from our investments as well as principal repayments and proceeds from sales of our investments. We are engaged in a continuous offering of shares of our common stock. We accept subscriptions on a continuous basis and issue shares at semi-monthly closings at prices that, after deducting selling commissions and dealer manager fees, must be above our net asset value per share.
Prior to investing in debt securities of private U.S. companies, we will invest the net proceeds from our continuous offering primarily in cash, cash equivalents, U.S. government securities, repurchase agreements and high-quality debt instruments maturing in one year or less from the time of investment, consistent with our business development company election and our election to be taxed as a RIC.
As of December 31, 2010, we had $38,790 in cash, which we have invested in interest bearing accounts.
To provide our stockholders with limited liquidity, we conduct quarterly tender offers pursuant to our share repurchase program. During the year ended December 31, 2010, we repurchased 228,950 shares at $9.36 per share for aggregate consideration totaling $2,143. On January 3, 2011, we repurchased 99,633 shares at $9.59 per share for aggregate consideration totaling $955.
60
Table of Contents
Revolving Credit Facility
On January 28, 2011, Broad Street and Deutsche Bank entered into an amended and restated multi-lender, syndicated revolving credit facility, or the credit facility, which amended and restated the revolving credit facility Broad Street originally entered into with Deutsche Bank on March 10, 2010 and the amendments thereto, or the original credit facility. Deutsche Bank is a lender and serves as administrative agent under the credit facility.
The credit facility provides for borrowings in an aggregate amount up to $340,000. Pursuant to the terms of the credit facility, borrowings thereunder may be designated as Tranche A borrowings in an amount up to $240,000 (referred to herein as the Tranche A Commitment) or as Tranche C borrowings in an amount up to $100,000 (referred to herein as the Tranche C Commitment). The credit facility also provides for Tranche B borrowings in an amount up to $100,000 (referred to herein as the Tranche B Commitment), but there are currently no Tranche B Commitments outstanding. All Tranche A Commitments bear interest at the rate of LIBOR + 2.23% per annum and will mature and be due and payable on March 10, 2012. All Tranche C Commitments bear interest at the rate of LIBOR + 1.85% per annum and will mature and be due and payable on March 10, 2012. In connection with the amendment and restatement of the original credit facility, a $100,000 Tranche B Commitment that was provided under the original credit facility by Deutsche Bank to Broad Street on an uncommitted basis was converted into a $100,000 Tranche C Commitment provided by a new lender on a committed basis.
In connection with entering into the original credit facility, and from time to time thereafter, we have transferred debt securities to Broad Street as a contribution to capital and retain a residual interest in the contributed debt securities through our ownership of Broad Street. We may contribute additional debt securities to Broad Street from time to time and Broad Street may purchase additional debt securities from various sources. Broad Street has appointed us to manage its portfolio of debt securities pursuant to the terms of an investment management agreement. Broad Street’s obligations to the lenders under the credit facility are secured by a first priority security interest in substantially all of the assets of Broad Street, including its portfolio of debt securities.
As of December 31, 2010, $297,201 was outstanding under the credit facility. The carrying amount of the amount outstanding under the credit facility approximates its fair value. We incurred costs of $1,341 in connection with obtaining and amending the credit facility, which we have recorded as deferred financing costs on our consolidated balance sheet and amortize to interest expense over the life of the credit facility. As of December 31, 2010, $835 of such deferred financing costs have yet to be amortized to interest expense.
The effective interest rate under the credit facility was 2.38% on December 31, 2010. Interest is paid quarterly in arrears and commenced August 20, 2010. We recorded interest expense of $3,881 for the year ended December 31, 2010, of which $506 related to the amortization of deferred financing costs. We paid $2,492 in interest expense for the year ended December 31, 2010.
Borrowings under the credit facility are subject to compliance with a borrowing base, pursuant to which the amount of funds advanced to Broad Street varies depending upon the types of assets in Broad Street’s portfolio. The occurrence of certain events described as “Super-Collateralization Events” in the credit agreement that governs the credit facility, or a decline in our net asset value below a specified threshold, results in a lowering of the amount of funds that will be advanced against such assets. Super-Collateralization Events include, without limitation, (i) certain key employees ceasing to be directors, principals, officers or investment managers of GDFM, the sub-adviser to FB Advisor; (ii) the bankruptcy or insolvency of GDFM or FB Advisor; (iii) GDFM ceasing to act as our sub-adviser or FB Advisor ceasing to act as our investment adviser; (iv) our ceasing to act as Broad Street’s investment manager, becoming bankrupt or insolvent, defaulting on certain material agreements or failing to maintain a net asset value at least equal to $50,000; and (v) us or GDFM or FB Advisor committing fraud or other illicit acts in our or their investment advisory capacities.
In connection with the credit facility, Broad Street has made certain representations and warranties and is required to comply with various covenants, reporting requirements and other customary requirements for similar
61
Table of Contents
facilities. In addition to customary events of default included in financing transactions, the credit facility contains the following events of default: (a) the failure to make principal payments when due or interest payments within three business days of when due, (b) borrowings under the credit facility exceeding the applicable advance rates, (c) the purchase by Broad Street of certain ineligible assets, (d) the insolvency or bankruptcy of Broad Street or us, (e) we cease to act as investment manager of Broad Street’s assets, (f) the decline of our net asset value below $50,000 and (g) fraud or other illicit acts by us or FB Advisor or GDFM in our or their investment advisory capacities. During the continuation of an event of default, Broad Street must pay interest at a default rate. Broad Street was in compliance with the terms of the credit facility as of December 31, 2010.
Borrowings of Broad Street will be considered borrowings by us for purposes of complying with the asset coverage requirements under the 1940 Act applicable to business development companies.
RIC Status and Distributions
We have elected to be treated for federal income tax purposes as a RIC under Subchapter M of the Code. In order to qualify as a RIC, we must distribute at least 90% of our “Investment Company Taxable Income,” as defined by the Code, each year. As long as the distributions are declared by the due date of the tax return, including extensions, distributions paid up to one year after the current tax year can be carried back to the prior tax year for determining the distributions paid in such tax year. We intend to make sufficient distributions to our stockholders to maintain our RIC status each year. We are also subject to nondeductible federal excise taxes if we do not distribute at least 98% of net ordinary income, 98.2% of any capital gain net income, if any, and any recognized and undistributed income from prior years for which we paid no federal income taxes.
We declared our first distribution on January 29, 2009. Subject to the board of directors’ discretion and applicable legal restrictions, our board of directors intends to authorize and declare distributions on either a semi-monthly or monthly basis and pay distributions on either a monthly or quarterly basis. While we historically paid distributions on a quarterly basis, commencing in the fourth quarter of 2010, we began to pay distributions on a monthly rather than quarterly basis. We will calculate each stockholder’s specific distribution amount for the period using record and declaration dates and each stockholder’s distributions will begin to accrue on the date we accept each stockholder’s subscription for shares of our common stock. From time to time, we may also pay special interim distributions in the form of cash or shares of our common stock at the discretion of our board of directors. During certain periods, our distributions may exceed our earnings. As a result, it is possible that a portion of the distributions we make may represent a return of capital for tax purposes. Each year a statement on Form 1099-DIV identifying the source of the distribution will be mailed to our stockholders. No portion of the distributions paid during the years ended December 31, 2010 or 2009 represented a return of capital for tax purposes.
We make our ordinary distributions in the form of cash, out of assets legally available, unless stockholders elect to receive their distributions and/or long-term capital gains distributions in additional shares of our common stock under our distribution reinvestment plan. Any distributions reinvested under the plan will nevertheless remain taxable to the U.S. stockholder.
The following table reflects the cash distributions per share that we have declared and paid on our common stock during the years ended December 31, 2008, 2009 and 2010:
| Distribution | ||||||||
| For the Year Ended |
Per Share(1)(2)(3) | Amount | ||||||
| 2008 |
$ | 0.1835 | $ | 25 | ||||
| 2009 |
0.6717 | 3,134 | ||||||
| 2010 |
0.8728 | 21,389 | ||||||
| (1) | The amount of each per share distribution has been retroactively adjusted to reflect the stock distributions declared throughout 2009 and 2010 as discussed below. |
62
Table of Contents
| (2) | In addition to regular semi-monthly cash distributions during such period, cash distributions declared and paid on our common stock during the year ended December 31, 2010 include approximately $3,851, or approximately $0.12 per share, in special cash distributions. |
| (3) | On October 13, 2010, our board of directors determined to increase the amount of semi-monthly distributions payable to stockholders of record from $0.03125 per share to $0.03185 per share, effective October 1, 2010. On October 29, 2010, our board of directors determined to increase the amount of semi-monthly distributions payable to stockholders of record from $0.03185 per share to $0.032156 per share, effective November 1, 2010. |
On January 13, 2011, our board of directors declared two regular semi-monthly cash distributions of $0.032156 per share each, which were paid on January 31, 2011 to stockholders of record on January 14, 2011 and January 28, 2011, respectively. On February 14, 2011, our board of directors declared two regular semi-monthly cash distributions of $0.032156 per share each, which were paid on February 28, 2011 to stockholders of record on February 14, 2011 and February 25, 2011, respectively. On March 14, 2011, our board of directors declared two regular semi-monthly cash distributions of $0.032156 per share each, which will be paid on March 31, 2011 to stockholders of record on March 14, 2011 and March 30, 2011, respectively. The timing and amount of any future distributions to stockholders are subject to applicable legal restrictions and the sole discretion of our board of directors.
We have adopted an “opt in” distribution reinvestment plan for our stockholders. As a result, if we make a distribution, our stockholders will receive distributions in cash unless they specifically “opt in” to the distribution reinvestment plan so as to have their cash distributions reinvested in additional shares of our common stock.
We may fund our cash distributions to stockholders from any sources of funds available to us, including offering proceeds, borrowings, net investment income from operations, capital gains proceeds from the sale of assets, non-capital gains proceeds from the sale of assets and expense reimbursements from Franklin Square Holdings. The following table reflects, for tax purposes, the sources of the cash distributions that we have paid on our common stock during the years ended December 31, 2010, 2009 and 2008:
| Year ended December 31, | ||||||||||||||||||||||||
| 2010 | 2009 | 2008 | ||||||||||||||||||||||
| Source of Distribution |
Distribution Amount |
Percentage | Distribution Amount |
Percentage | Distribution Amount |
Percentage | ||||||||||||||||||
| Offering proceeds |
$ | — | — | $ | — | — | $ | — | — | |||||||||||||||
| Borrowings |
— | — | — | — | — | — | ||||||||||||||||||
| Net investment income(1) |
13,545 | 63 | % | 1,917 | 61 | % | 25 | 100 | % | |||||||||||||||
| Capital gains proceeds from the sale of assets |
7,844 | 37 | % | 977 | 31 | % | — | — | ||||||||||||||||
| Non-capital gains proceeds from the sale of assets |
— | — | — | — | — | — | ||||||||||||||||||
| Expense reimbursement from sponsor |
— | — | 240 | 8 | % | — | — | |||||||||||||||||
| Total |
$ | 21,389 | 100 | % | $ | 3,134 | 100 | % | $ | 25 | 100 | % | ||||||||||||
| (1) | During the years ended December 31, 2010 and 2009, 84% and 57%, respectively, of our gross investment income was attributable to cash interest earned and 16% and 43%, respectively, was attributable to non-cash accretion of discount and PIK interest. |
63
Table of Contents
The aggregate cost of our investments for federal income tax purposes totaled $715,695 and $92,366 as of December 31, 2010 and 2009, respectively. The aggregate net unrealized appreciation on a tax basis was $17,885 and $8,226 as of December 31, 2010 and 2009, respectively. Our net investment income on a tax basis for the years ended December 31, 2010 and 2009 was $13,545 and $2,157, respectively. We distributed all of our net investment income earned as of December 31, 2010 and 2009.
The difference between our GAAP-basis net investment income and our tax-basis net investment income is due to the tax-basis amortization of organization and start-up costs incurred prior to the commencement of our operations, interest income earned on a tax basis due to the required accretion of discount on a non-performing loan, and the required accrual for GAAP purposes of incentive fees on unrealized gains even though no such incentive fees on unrealized gains are payable by us. See “—Critical Accounting Policies—Capital Gains Incentive Fee.” The following table sets forth a reconciliation between GAAP-basis net investment income and tax-basis net investment income during the years ended December 31, 2010 and 2009:
| Year ended December 31, | ||||||||
| 2010 | 2009 | |||||||
| GAAP basis net investment income |
$ | 9,392 | $ | 2,151 | ||||
| Amortization of organizational costs |
(43 | ) | (43 | ) | ||||
| Tax accretion of discount on investment |
133 | 49 | ||||||
| Reversal of incentive fee accrual on unrealized gains |
4,063 | — | ||||||
| Tax basis net investment income |
$ | 13,545 | $ | 2,157 | ||||
The determination of the tax attributes of our distributions is made annually as of the end of our fiscal year based upon our taxable income for the full year and distributions paid for the full year. Therefore, a determination made on a quarterly basis may not be representative of the actual tax attributes of our distributions for a full year. The actual tax characteristics of distributions to stockholders are reported to stockholders annually on a Form 1099-DIV.
The following table reflects the stock distributions per share that we have declared on our common stock to date:
| Date Declared |
Record Date | Payment Date | Distribution Percentage |
Shares Issued |
||||||||||||
| Fiscal 2009 |
||||||||||||||||
| March 31, 2009 |
March 31, 2009 | March 31, 2009 | 1.4 | % | 13,818 | |||||||||||
| April 30, 2009 |
April 30, 2009 | April 30, 2009 | 3.0 | % | 42,661 | |||||||||||
| May 29, 2009 |
May 29, 2009 | May 29, 2009 | 3.7 | % | 79,125 | |||||||||||
| June 30, 2009 |
June 30, 2009 | June 30, 2009 | 3.5 | % | 96,976 | |||||||||||
| July 30, 2009 |
July 31, 2009 | July 31, 2009 | 3.1 | % | 117,219 | |||||||||||
| August 31, 2009 |
August 31, 2009 | August 31, 2009 | 3.0 | % | 148,072 | |||||||||||
| December 31, 2009 |
December 31, 2009 | December 31, 2009 | 0.5 | % | 49,710 | |||||||||||
| Fiscal 2010 |
||||||||||||||||
| January 28, 2010 |
January 31, 2010 | January 31, 2010 | 2.5 | % | 283,068 | |||||||||||
The purpose of these special distributions was to maintain a net asset value per share that was below the then-current net offering price, as required by the 1940 Act, subject to certain limited exceptions. Our board of directors determined that our portfolio performance sufficiently warranted taking these actions.
The stock distributions increased the number of shares outstanding, thereby reducing our net asset value per share. However, because the stock distributions were issued to all stockholders in proportion to their current holdings, the reduction in net asset value per share as a result of the stock distribution was offset exactly by the
64
Table of Contents
increase in the number of shares owned by each investor. As overall value to an investor was not reduced as a result of the special stock distributions, our board of directors determined that these issuances would not be dilutive to existing stockholders. As the stock distributions did not change any stockholder’s proportionate interest in us, they are not expected to represent taxable distributions. Specific tax characteristics of all distributions will be reported to stockholders annually on Form 1099-DIV.
As of December 31, 2010 and 2009, the components of accumulated earnings on a tax basis were as follows:
| As of December 31, | ||||||||
| 2010 | 2009 | |||||||
| Distributable ordinary income |
$ | 1,290 | $ | 53 | ||||
| Incentive fee accrual on unrealized gains |
(4,063 | ) | — | |||||
| Unamortized organizational costs |
(558 | ) | (600 | ) | ||||
| Unrealized appreciation on investments(1) |
17,885 | 8,226 | ||||||
| $ | 14,554 | $ | 7,679 | |||||
| (1) | As of December 31, 2010 and 2009, the gross unrealized appreciation on our investments was $20,136 and $8,390, respectively. As of December 31, 2010 and 2009, the gross unrealized depreciation on our investments was $2,251 and $164, respectively. |
Critical Accounting Policies
Our financial statements are prepared in conformity with accounting principles generally accepted in the United States of America, or U.S. GAAP, which requires us to make estimates and assumptions that affect the reported amounts of assets and liabilities at the date of the financial statements and the reported amounts of revenues and expenses during the reporting periods. Critical accounting policies are those that require the application of management’s most difficult, subjective or complex judgments, often because of the need to make estimates about the effect of matters that are inherently uncertain and that may change in subsequent periods. In preparing the financial statements, management has made estimates and assumptions that affect the reported amounts of assets and liabilities at the date of the financial statements, and the reported amounts of revenues and expenses during the reporting periods. In preparing the financial statements, management has utilized available information, including our past history, industry standards and the current economic environment, among other factors, in forming its estimates and judgments, giving due consideration to materiality. Actual results may differ from these estimates. In addition, other companies may utilize different estimates, which may impact the comparability of our results of operations to those of companies in similar businesses. As our expected operating plans occur we will describe additional critical accounting policies in the notes to our future financial statements in addition to those discussed below:
Valuation of Portfolio Investments
We determine the net asset value of our investment portfolio each quarter. Securities that are publicly-traded are valued at the reported closing price on the valuation date. Securities that are not publicly-traded are valued at fair value as determined in good faith by our board of directors. In connection with that determination, FB Advisor prepares portfolio company valuations using relevant inputs, including, but not limited to, indicative dealer quotes, values of like securities, recent portfolio company financial statements and forecasts, and valuations prepared by third-party valuation services.
Accounting Standards Codification Topic 820, Fair Value Measurements and Disclosure, or ASC Topic 820, issued by the Financial Accounting Standards Board, or FASB, clarifies the definition of fair value and requires companies to expand their disclosure about the use of fair value to measure assets and liabilities in
65
Table of Contents
interim and annual periods subsequent to initial recognition. ASC Topic 820 defines fair value as the price that would be received from the sale of an asset or paid to transfer a liability in an orderly transaction between market participants at the measurement date. ASC Topic 820 also establishes a three-tier fair value hierarchy, which prioritizes the inputs used in measuring fair value. These tiers include: Level 1, defined as observable inputs such as quoted prices in active markets; Level 2, which includes inputs such as quoted prices for similar securities in active markets and quoted prices for identical securities where there is little or no activity in the market; and Level 3, defined as unobservable inputs for which little or no market data exists, therefore requiring an entity to develop its own assumptions.
With respect to investments for which market quotations are not readily available, we have undertaken a multi-step valuation process each quarter, as described below:
| • | our quarterly valuation process begins with each portfolio company or investment being initially valued by FB Advisor’s management team, with such valuation potentially taking into account information received from any of our sub-advisers or an independent valuation firm, if applicable; |
| • | preliminary valuation conclusions are then documented and discussed with our valuation committee; |
| • | our valuation committee reviews the preliminary valuation and FB Advisor’s management team, together with our independent valuation firm, if applicable, responds and supplements the preliminary valuation to reflect any comments provided by the valuation committee; and |
| • | our board of directors discusses valuations and determines the fair value of each investment in our portfolio in good faith based on various statistical and other factors, including the input and recommendation of FB Advisor, the valuation committee and any third-party valuation firm, if applicable. |
Determination of fair value involves subjective judgments and estimates. Accordingly, the notes to our financial statements refer to the uncertainty with respect to the possible effect of such valuations, and any change in such valuations on our financial statements. Below is a description of factors that our board of directors may consider when valuing our equity and debt investments.
Valuation of fixed income investments, such as loans and debt securities, depends upon a number of factors, including prevailing interest rates for like securities, expected volatility in future interest rates, call features, put features and other relevant terms of the debt. For investments without readily available market prices, we will incorporate these factors into discounted cash flow models to arrive at fair value. Other factors that our board will consider include the borrower’s ability to adequately service its debt, the fair market value of the portfolio company in relation to the face amount of its outstanding debt and the quality of collateral securing our debt investments.
Our equity interests in portfolio companies for which there is no liquid public market are valued at fair value. Our board of directors, in its analysis of fair value, may consider various factors, such as multiples of EBITDA, cash flows, net income, revenues or, in limited instances, book value or liquidation value. All of these factors may be subject to adjustments based upon the particular circumstances of a portfolio company or our actual investment position. For example, adjustments to EBITDA may take into account compensation to previous owners or acquisition, recapitalization, restructuring or other related items.
Our board of directors may also look to private merger and acquisition statistics, public trading multiples discounted for illiquidity and other factors, valuations implied by third-party investments in the portfolio companies or industry practices in determining fair value. Our board of directors may also consider the size and scope of a portfolio company and its specific strengths and weaknesses, as well as any other factors it deems relevant in assessing the value. Generally, the value of our equity interests in public companies for which market quotations are readily available is based upon the most recent closing public market price. Portfolio securities that carry certain restrictions on sale are typically valued at a discount from the public market value of the security.
66
Table of Contents
The fair values of our investments are determined in good faith by our board of directors. Our board of directors is solely responsible for the valuation of our portfolio investments at fair value as determined in good faith pursuant to our valuation policy and consistently applied valuation process. Our investments as of December 31, 2010 consisted primarily of debt securities that are traded on a private over-the-counter market for institutional investors. We valued our collateralized loan and debt obligations and our mezzanine debt investments by obtaining bid and ask prices from independent dealers. We valued all of our other investments, including our senior secured bond investments, by using an independent third-party pricing service, which provided prevailing bid and ask prices that were screened for validity by the service from dealers on the date of the relevant period end. Our investments as of December 31, 2009 consisted entirely of debt securities that are traded on a private over-the-counter market for institutional investors. We valued one of our second lien investments and one of our mezzanine debt investments by obtaining bid and ask prices from independent dealers. We valued all of our other investments by using an independent third-party pricing service, which provided prevailing bid and ask prices that were screened for validity by the service from dealers on the date of the relevant period end. We periodically benchmark the bid and ask prices received from the service against the actual prices at which we purchase and sell our investments. Based on the results of the benchmark analysis and our experience in purchasing and selling these investments, we believe that these prices are reliable indicators of fair value. However, because of the private nature of this marketplace (meaning actual transactions are not publicly reported), we believe that these valuation inputs are classified as Level 3 within the fair value hierarchy. We may also use other methods to determine fair value for securities for which we cannot obtain prevailing bid and ask prices through our third-party pricing service. Our valuation committee and board of directors reviewed and approved the valuation determinations made with respect to these investments in a manner consistent with our valuation process.
Revenue Recognition
Security transactions are accounted for on the trade date. We record interest income on an accrual basis to the extent that we expect to collect such amounts. We do not accrue as a receivable interest or dividends on loans and securities if we have reason to doubt our ability to collect such income. Loan origination fees, original issue discount, and market discount are capitalized and we amortize such amounts as interest income over the respective term of the loan. Upon the prepayment of a loan or security, any unamortized loan origination fees are recorded as interest income. We record prepayment premiums on loans and securities as interest income when we receive such amounts.
Net Realized Gains or Losses and Net Change in Unrealized Appreciation or Depreciation and Net Change in Unrealized Gains or Losses on Foreign Currency
Gains or losses on the sale of investments are calculated by using the specific identification method. We measure realized gains or losses by the difference between the net proceeds from the repayment or sale and the amortized cost basis of the investment, without regard to unrealized appreciation or depreciation previously recognized, but considering unamortized upfront fees. Net change in unrealized appreciation or depreciation reflects the change in portfolio investment values during the reporting period, including any reversal of previously recorded unrealized gains or losses, when gains or losses are realized. Net change in unrealized gains or losses on foreign currency reflects the change in portfolio investment values during the reporting period due to the impact of foreign currency fluctuations.
Capital Gains Incentive Fee
Pursuant to the terms of the investment advisory and administrative services agreement we entered into with FB Advisor, the incentive fee on capital gains earned on liquidated investments of our portfolio during operations prior to our liquidation will be determined and payable in arrears as of the end of each calendar year. Such fee will equal 20.0% of our incentive fee capital gains (i.e., our realized capital gains on a cumulative basis from inception, calculated as of the end of each calendar year, net of all realized capital losses and unrealized capital
67
Table of Contents
depreciation on a cumulative basis), less the aggregate amount of any previously paid capital gains incentive fees. On a quarterly basis, we accrue for the capital gains incentive fee by calculating such fee as if it were due and payable as of the end of such period.
While the investment advisory and administrative services agreement with FB Advisor neither includes nor contemplates the inclusion of unrealized gains in the calculation of the capital gains incentive fee, pursuant to an interpretation of an American Institute for Certified Public Accountants, or AICPA, Technical Practice Aid for investment companies, commencing during the quarter ended December 31, 2010, we have changed our methodology for accruing for this incentive fee to include unrealized gains in the calculation of the capital gains incentive fee expense and related capital gains incentive fee payable. This accrual reflects the incentive fees that would be payable to FB Advisor as if our entire portfolio was liquidated at its fair value as of the balance sheet date even though FB Advisor is not entitled to an incentive fee with respect to unrealized gains unless and until such gains are actually realized. During the year ended December 31, 2010, we accrued a capital gains incentive fee of $5,459 based on the performance of our portfolio, of which only $1,396 was based on realized gains and is payable to FB Advisor.
Uncertainty in Income Taxes
We evaluate our tax positions to determine if the tax positions taken meet the minimum recognition threshold in connection with accounting for uncertainties in income tax positions taken or expected to be taken for the purposes of measuring and recognizing tax liabilities in the financial statements. Recognition of a tax benefit or liability with respect to an uncertain tax position is required only when the position is “more likely than not” to be sustained assuming examination by taxing authorities. We recognize interest and penalties, if any, related to unrecognized tax liabilities as income tax expense in the Statements of Operations.
Contractual Obligations
We have entered into an agreement with FB Advisor to provide investment advisory and administrative services. Payments for investment advisory services under the investment advisory and administrative services agreement are equal to (a) an annual base management fee of 2.0% of the average value of our gross assets and (b) an incentive fee based on our performance. FB Advisor, and to the extent it is required to provide such services, our sub-adviser, will be reimbursed for administrative expenses incurred on our behalf. For the years ended December 31, 2010 and 2009, we incurred $7,900 and $829, respectively, in base management fees and $924 and $261, respectively, in administrative services expenses under the investment advisory and administrative services agreement. In addition, FB Advisor is eligible to receive incentive fees based on performance. During the years ended December 31, 2010 and 2009, we accrued $1,396 and $173, respectively, in capital gains incentive fees payable to FB Advisor under the investment advisory and administrative services agreement. We have also recorded $4,063 in incentive fees based on the unrealized gains in our investment portfolio as of December 31, 2010; however, such fees are not due and payable to FB Advisor unless and until such time as the gains become realized.
As of December 31, 2010, $297,201 was outstanding under the revolving credit facility between Broad Street and Deutsche Bank. All such amounts will mature, and all accrued and unpaid interest thereunder will be due and payable, on March 10, 2012.
A summary of our significant contractual payment obligations for the repayment of outstanding borrowings under the revolving credit facility between Broad Street and Deutsche Bank at December 31, 2010 is as follows:
| Payments Due By Period | ||||||||||||||||||||
| Total | Less than 1 year | 1-3 years | 3-5 years | More than 5 years | ||||||||||||||||
| Borrowings(1) |
$ | 297,201 | $ | — | $ | 297,201 | $ | — | $ | — | ||||||||||
| (1) | At December 31, 2010, $42,799 remained unused under the revolving credit facility. |
68
Table of Contents
Off-Balance Sheet Arrangements
We currently have no off-balance sheet arrangements, including any risk management of commodity pricing or other hedging practices.
Recently Issued Accounting Standards
In January 2010, the FASB issued Accounting Standards Update No. 2010-06, which provides additional guidance to improve disclosures regarding fair value measurements. This guidance requires two new disclosures: (1) transfers in and out of Level 1 and 2 measurements and the reasons for the transfers and (2) a gross presentation of activity within the Level 3 roll forward. The guidance also includes clarifications to existing disclosure requirements on the level of disaggregation and disclosures regarding inputs and valuation techniques. The guidance applies to all entities required to make disclosures about recurring and nonrecurring fair value measurements. The effective date of this guidance is the first interim or annual reporting period beginning after December 15, 2009, except for the gross presentation of the Level 3 roll forward information, which is required for annual reporting periods beginning after December 15, 2010 and for interim reporting periods within those years. Except for the gross presentation of Level 3 roll forward information, we adopted this guidance during 2010, and such adoption did not have a significant impact on our consolidated financial statements or disclosures. We are currently evaluating the impact that the gross presentation of Level 3 roll forward information will have on our consolidated financial statement disclosures when adopted.
Related Party Transactions
We have entered into an investment advisory and administrative services agreement with FB Advisor. Pursuant to the investment advisory and administrative services agreement, FB Advisor is paid a base management fee of 2% of average gross assets and an incentive fee of 20% of net investment income, subject to an annualized 8% hurdle, and 20% of net realized gains, if applicable. We commenced accruing fees under the agreement on January 2, 2009, upon the commencement of operations. During the years ended December 31, 2010 and 2009, FB Advisor earned $7,900 and $829, respectively, in base management fees. Management fees are paid on a quarterly basis in arrears. We paid $5,039 and $392 of these fees during the years ended December 31, 2010 and 2009, respectively.
We accrue for the capital gains incentive fee, which, if earned, is paid annually. We accrue the incentive fee based on net realized and unrealized gains; however, under the terms of our investment advisory and administrative services agreement, the fee payable to FB Advisor is based on realized gains and no such fee is payable with respect to unrealized gains unless and until such gains are actually realized. During the year ended December 31, 2010, we accrued a capital gains incentive fee of $5,459 based on the performance of our portfolio, of which only $1,396 was based on realized gains and is payable to FB Advisor. During the year ended December 31, 2010, we paid FB Advisor $173 in capital gains incentive fees earned during the year ended December 31, 2009. We also reimburse FB Advisor for expenses necessary for its performance of services related to our administration and operation, provided that such reimbursement shall be the lower of FB Advisor’s actual costs or the amount that we would be required to pay for comparable services in the same geographic location, and provided further that such costs will be reasonably allocated to us on the basis of assets, revenues, time records or other reasonable methods. During the years ended December 31, 2010 and 2009, we incurred administrative services charges of $924 and $261, respectively, attributable to FB Advisor. Of these charges, $908 and $257, respectively, related to the allocation of costs of administrative personnel for services provided to us by employees of FB Advisor and the remainder related to other reimbursable expenses. We have paid FB Advisor $710 and $165, respectively, for the services incurred under this arrangement during the years ended December 31, 2010 and 2009.
Franklin Square Holdings funded offering costs and other expenses in the amount of $1,125, $404 and $1,914 for the years ended December 31, 2010, 2009 and 2008, respectively. We recorded these costs as a
69
Table of Contents
contribution to capital. The offering costs were offset against capital in excess of par on the financial statement and the other expenses were charged to expense as incurred. We incurred organization costs of $605 during the year ended December 31, 2008. No such costs were incurred during the years ended December 31, 2010 and 2009.
The dealer manager for our public offering is FS2, which is one of our affiliates. During the years ended December 31, 2010 and 2009, FS2 retained $5,435 and $1,295, respectively, for selling commissions and dealer manager fees in connection with the sale of our common stock.
Under the terms of the investment advisory and administrative services agreement, when our registration statement was declared effective by the SEC and we were successful in raising gross proceeds from unrelated outside investors of at least $2.5 million, or the minimum offering requirement, FB Advisor became entitled to receive 1.5% of gross proceeds raised until all offering costs and organization costs funded by FB Advisor or its affiliates (including Franklin Square Holdings) have been recovered. On January 2, 2009, we exceeded the minimum offering requirement. We paid total reimbursements of $1,678 and $1,418, respectively, to FB Advisor and its affiliates during the years ended December 31, 2010 and 2009. As of December 31, 2010, $641 is payable to FB Advisor and its affiliates under this arrangement. The reimbursements are recorded as a reduction of capital.
Members of FB Advisor’s senior management team provide investment advisory services to both us and FB Capital Partners, L.P. FB Capital Partners, L.P., which is owned by Mr. Forman, our chief executive officer, was organized for the purpose of sourcing and managing income-oriented investments for institutions and high net worth individuals. While neither FB Capital Partners, L.P. nor FB Advisor is making private corporate debt investments for clients other than us currently, FB Advisor intends to allocate investment opportunities in a fair and equitable manner consistent with our investment objectives and strategies, if necessary, so that we will not be disadvantaged in relation to any other client of FB Advisor or its management team.
Beginning on February 26, 2009, our affiliate and sponsor, Franklin Square Holdings, agreed to reimburse us for expenses in an amount that is sufficient to ensure that, for tax purposes, our net investment income and net capital gains are equal to or greater than the cumulative distributions paid to our stockholders in each quarter. This arrangement is designed to ensure that no portion of our distributions will represent a return of capital for our stockholders. Franklin Square Holdings has no obligation to reimburse any portion of our expenses. The specific amount of expenses reimbursed by Franklin Square Holdings, if any, will be determined at the end of each quarter. During the year ended December 31, 2010, we received no reimbursements from Franklin Square Holdings. During the year ended December 31, 2009, the reimbursements from Franklin Square Holdings totaled $240. We do not expect that conditions will require Franklin Square Holdings to provide reimbursements in the future. To the extent reimbursements may be needed in the future, there can be no assurance that Franklin Square Holdings will provide any such reimbursements. Franklin Square Holdings is controlled by our chief executive officer, Michael Forman, and our director, David Adelman.
Recent Developments
For the period from January 1, 2011 to March 15, 2011, we have sold 14,932,150 shares of our common stock for gross proceeds of $158,512 at an average price per share of $10.62.
On March 18, 2011, Arch Street, our newly-formed, wholly-owned financing subsidiary, entered into a total return swap, or TRS, for senior secured floating rate loans with Citibank.
The obligations of Arch Street under the TRS are non-recourse to us and our exposure under the TRS is limited to the value of our investment in Arch Street, which generally will equal the value of cash collateral provided by Arch Street under the TRS. Pursuant to the terms of the TRS, Arch Street may select a portfolio of loans with a maximum market value of $200,000. Arch Street is required to initially cash collateralize a specified
70
Table of Contents
percentage of each loan (generally between 20% and 25% of the market value of such loan) included under the TRS in accordance with margin requirements described in the agreements governing the TRS.
A TRS is a commonly used form of financing arrangement that provides economic exposure similar to the exposure under Broad Street’s credit facility. Because of the unique structure of a TRS, a TRS often offers lower financing costs than are offered through more traditional borrowing arrangements.
Generally, pursuant to a TRS, one party agrees to make periodic payments to another party based on the change in the market value of the assets underlying the TRS, which may include a specified security, basket of securities or securities indices during the specified period, in return for periodic payments based on a fixed or variable interest rate. A TRS is typically used to obtain exposure to a security or market without owning or taking physical custody of such security or investing directly in such market. A TRS may effectively add leverage to our portfolio because, in addition to our total net assets, we would be subject to investment exposure on the amount of securities subject to the TRS.
The TRS with Citibank enables us, through our ownership of Arch Street, to obtain the economic benefit of owning the loans subject to the TRS, without actually owning them, in return for an interest-type payment to Citibank. As such, the TRS is analogous to Arch Street borrowing funds to acquire loans and incurring interest expense to a lender.
Pursuant to the terms of an investment management agreement that we have entered into with Arch Street, we act as the manager of the rights and obligations of Arch Street under the TRS, including selecting the specific loans to be included in the portfolio of loans subject to the TRS. The terms of the TRS are governed by a set of agreements between Arch Street and Citibank, which collectively establish the TRS, and are collectively referred to herein as the TRS Agreement.
Pursuant to the terms of the TRS Agreement, Arch Street may select a portfolio of loans with a maximum market value (determined at the time each such loan becomes subject to the TRS) of $200,000. Each individual loan, and the portfolio of loans taken as a whole, must meet criteria described in the TRS Agreement. Arch Street will receive from Citibank all interest and fees payable in respect of the loans included in the portfolio. Arch Street will pay to Citibank interest at a rate equal to one-month LIBOR + 1.25% per annum. In addition, upon the termination or repayment of any loan subject to the TRS, Arch Street will either receive from Citibank the appreciation in the value of such loan, or pay to Citibank any depreciation in the value of such loan. Arch Street may be required to post additional collateral from time to time as a result of a decline in the mark-to-market value of the portfolio of loans subject to the TRS.
Citibank may terminate the TRS on or after the second anniversary of the effectiveness of the TRS. Arch Street may terminate the TRS at any time upon providing no more than 30 days, and no less than 10 days, prior notice to Citibank. Any termination prior to the second anniversary of the effectiveness of the TRS will result in payment of an early termination fee to Citibank. Arch Street is required to pay a minimum usage fee in connection with the TRS. Arch Street will also pay Citibank customary fees in connection with the establishment and maintenance of the TRS.
| Item 7A. | Quantitative and Qualitative Disclosures About Market Risk |
We are subject to financial market risks, including changes in interest rates. As of December 31, 2010, all but sixteen of our portfolio investments paid variable interest rates. A rise in the general level of interest rates can be expected to lead to higher interest rates applicable to our debt investments, especially to the extent that we hold variable rate investments, and to declines in the value of any fixed rate investments we hold. Accordingly, an increase in interest rates would make it easier for us to meet or exceed our incentive fee preferred return, as defined in our investment advisory and administrative services agreement, and may result in a substantial increase in our net investment income, and also to the amount of incentive fees payable to FB Advisor with respect to our increased pre-incentive fee net investment income.
71
Table of Contents
Pursuant to the terms of the $340,000 revolving credit facility which Broad Street maintains with Deutsche Bank, Broad Street borrows at a floating rate based on LIBOR. Pursuant to the terms of the TRS between Arch Street and Citibank, Arch Street pays fees to Citibank at a floating rate based on LIBOR in exchange for the right to receive the economic benefit of a pool of loans having a maximum notional amount of $200,000. We expect any future credit facilities or total return swap agreements that we or any subsidiary may enter into will also be based on a floating interest rate. As a result, we are subject to risks relating to changes in market interest rates. In periods of rising interest rates when we have debt outstanding or swap agreements in effect, our interest expense would increase, which could reduce our net investment income, especially to the extent we hold fixed rate investments. We expect that our long-term investments will be financed primarily with equity and long-term debt. If deemed prudent, we may use interest rate risk management techniques in an effort to minimize our exposure to interest rate fluctuations. These techniques may include various interest rate hedging activities to the extent permitted by the 1940 Act. Adverse developments resulting from changes in interest rates or hedging transactions could have a materially adverse effect on our business, financial condition and results of operations.
In addition, we may have risk regarding portfolio valuation. See “Item 7. Management’s Discussion and Analysis of Financial Condition and Results of Operations—Critical Accounting Policies—Valuation of Portfolio Investments.”
72
Table of Contents
| Item 8. | Financial Statements and Supplementary Data |
Index to Financial Statements
73
Table of Contents
MANAGEMENT’S REPORT ON INTERNAL CONTROL OVER FINANCIAL REPORTING
Our management is responsible for establishing and maintaining adequate internal control over financial reporting. In connection with the preparation of our annual financial statements, management has conducted an assessment of the effectiveness of our internal control over financial reporting based on the framework set forth in Internal Control—Integrated Framework issued by the Committee of Sponsoring Organizations of the Treadway Commission (“COSO”). Management’s assessment included an evaluation of the design of our internal control over financial reporting and testing of the operational effectiveness of those controls. Based on this evaluation, we have concluded that, as of December 31, 2010, our internal control over financial reporting was effective to provide reasonable assurance regarding the reliability of financial reporting and the preparation of financial statements for external purposes in accordance with U.S. generally accepted accounting principles.
74
Table of Contents
REPORT OF INDEPENDENT REGISTERED PUBLIC ACCOUNTING FIRM
To the Board of Directors and Stockholders
FS Investment Corporation
Philadelphia, Pennsylvania
We have audited FS Investment Corporation’s internal control over financial reporting as of December 31, 2010, based on criteria established in Internal Control—Integrated Framework issued by the Committee of Sponsoring Organizations of the Treadway Commission. FS Investment Corporation’s management is responsible for maintaining effective internal control over financial reporting and for its assessment of the effectiveness of internal control over financial reporting included in the accompanying Management’s Report on Internal Control Over Financial Reporting. Our responsibility is to express an opinion on the company’s internal control over financial reporting based on our audit.
We conducted our audit in accordance with the standards of the Public Company Accounting Oversight Board (United States). Those standards require that we plan and perform the audit to obtain reasonable assurance about whether effective internal control over financial reporting was maintained in all material respects. Our audit included obtaining an understanding of internal control over financial reporting, assessing the risk that a material weakness exists, and testing and evaluating the design and operating effectiveness of internal control based on the assessed risk. Our audit also included performing such other procedures as we considered necessary in the circumstances. We believe that our audit provides a reasonable basis for our opinion.
A company’s internal control over financial reporting is a process designed to provide reasonable assurance regarding the reliability of financial reporting and the preparation of financial statements for external purposes in accordance with generally accepted accounting principles. A company’s internal control over financial reporting includes those policies and procedures that (a) pertain to the maintenance of records that, in reasonable detail, accurately and fairly reflect the transactions and dispositions of the assets of the company; (b) provide reasonable assurance that transactions are recorded as necessary to permit preparation of financial statements in accordance with generally accepted accounting principles, and that receipts and expenditures of the company are being made only in accordance with authorizations of management and directors of the company; and (c) provide reasonable assurance regarding prevention or timely detection of unauthorized acquisition, use, or disposition of the company’s assets that could have a material effect on the financial statements.
Because of its inherent limitations, internal control over financial reporting may not prevent or detect misstatements. Also, projections of any evaluation of effectiveness to future periods are subject to the risk that controls may become inadequate because of changes in conditions, or that the degree of compliance with the policies or procedures may deteriorate.
In our opinion, FS Investment Corporation maintained, in all material respects, effective internal control over financial reporting as of December 31, 2010, based on criteria established in Internal Control—Integrated Framework issued by the Committee of Sponsoring Organizations of the Treadway Commission.
We have also audited, in accordance with the standards of the Public Company Accounting Oversight Board (United States), the consolidated balance sheets of FS Investment Corporation, including the consolidated schedules of investments as of December 31, 2010 and 2009, the related consolidated statements of operations, changes in net assets and cash flows for each of the three years in the period ended December 31, 2010 and our report dated March 24, 2011 expressed an unqualified opinion.
/s/ McGladrey & Pullen, LLP
Blue Bell, Pennsylvania
March 24, 2011
75
Table of Contents
REPORT OF INDEPENDENT REGISTERED PUBLIC ACCOUNTING FIRM
To the Board of Directors and Stockholders
FS Investment Corporation
Philadelphia, Pennsylvania
We have audited the accompanying consolidated balance sheets of FS Investment Corporation, including the consolidated schedules of investments, as of December 31, 2010 and 2009, and the related consolidated statements of operations, changes in net assets and cash flows for each of the three years in the period ended December 31, 2010. These consolidated financial statements are the responsibility of the Company’s management. Our responsibility is to express an opinion on these financial statements based on our audits.
We conducted our audits in accordance with the standards of the Public Company Accounting Oversight Board (United States). Those standards require that we plan and perform the audit to obtain reasonable assurance about whether the financial statements are free of material misstatement. An audit includes examining, on a test basis, evidence supporting the amounts and disclosures in the financial statements. An audit also includes assessing the accounting principles used and significant estimates made by management, as well as evaluating the overall financial statement presentation. Our procedures included confirmation of securities owned as of December 31, 2010 by correspondence with the custodians, or by other auditing procedures. We believe that our audits provide a reasonable basis for our opinion.
In our opinion, the financial statements referred to above present fairly, in all material respects, the consolidated financial position of FS Investment Corporation as of December 31, 2010 and 2009 and the results of its consolidated operations, changes in its net assets and its cash flows for each of the three years in the period ended December 31, 2010 in conformity with U.S. generally accepted accounting principles.
We also have audited, in accordance with the standards of the Public Company Accounting Oversight Board (United States), FS Investment Corporation’s internal control over financial reporting as of December 31, 2010, based on the criteria established in Internal Control—Integrated Framework issued by the Committee of Sponsoring Organizations of the Treadway Commission, and our report dated March 24, 2011 expressed an unqualified opinion on the effectiveness of FS Investment Corporation’s internal control over financial reporting.
/s/ McGladrey & Pullen, LLP
Blue Bell, Pennsylvania
March 24, 2011
76
Table of Contents
Consolidated Balance Sheets
(in thousands, except share and per share amounts)
| December 31, | ||||||||
| 2010 | 2009 | |||||||
| Assets |
||||||||
| Investments, at fair value (amortized cost—$715,514 and $92,317, respectively) |
$ | 733,580 | $ | 100,592 | ||||
| Cash |
38,790 | 9,035 | ||||||
| Receivable for investments sold and repaid |
5,162 | 15 | ||||||
| Interest receivable |
3,632 | 402 | ||||||
| Deferred financing costs |
835 | 14 | ||||||
| Prepaid expenses and other assets |
6 | 10 | ||||||
| Total assets |
$ | 782,005 | $ | 110,068 | ||||
| Liabilities |
||||||||
| Payable for investments purchased |
$ | 81,800 | $ | 15,366 | ||||
| Credit facility payable |
297,201 | — | ||||||
| Stockholder distributions payable |
2,556 | 616 | ||||||
| Management fees payable |
3,298 | 437 | ||||||
| Capital gains incentive fee payable(1) |
5,459 | 173 | ||||||
| Administrative services fees payable |
310 | 96 | ||||||
| Reimbursements payable |
641 | — | ||||||
| Interest payable |
883 | — | ||||||
| Other accrued expenses and liabilities |
625 | 183 | ||||||
| Total liabilities |
392,773 | 16,871 | ||||||
| Stockholders’ equity |
||||||||
| Preferred stock, $0.001 par value, 50,000,000 shares authorized, none issued and outstanding |
— | — | ||||||
| Common stock, $0.001 par value, 450,000,000 shares authorized, 41,332,661 and 10,241,544 shares issued and outstanding, respectively(2) |
41 | 10 | ||||||
| Capital in excess of par value |
374,637 | 85,508 | ||||||
| Accumulated undistributed net realized gains on investments |
1,290 | 53 | ||||||
| Accumulated distributions in excess of net investment income(3) |
(4,802 | ) | (649 | ) | ||||
| Net unrealized appreciation on investments and loss on foreign currency |
18,066 | 8,275 | ||||||
| Total stockholders’ equity |
389,232 | 93,197 | ||||||
| Total liabilities and stockholders’ equity |
$ | 782,005 | $ | 110,068 | ||||
| Net asset value per common share at period end |
$ | 9.42 | $ | 9.10 | ||||
| (1) | See Note 2 for a discussion of the methodology employed by the Company in calculating the capital gains incentive fee. |
| (2) | As discussed in Note 5, between March 31, 2009 and January 31, 2010, the Company issued eight stock distributions. The outstanding shares and net asset value per common share reflect these stock distributions on a retroactive basis. |
| (3) | See Note 5 for a discussion of the source of distributions paid by the Company. |
See notes to consolidated financial statements.
77
Table of Contents
Consolidated Statements of Operations
(in thousands, except share and per share amounts)
| Year Ended December 31, | ||||||||||||
| 2010 | 2009 | 2008 | ||||||||||
| Investment income |
||||||||||||
| Interest income |
$ | 30,670 | $ | 4,420 | $ | 25 | ||||||
| Operating expenses |
||||||||||||
| Management fees |
7,900 | 829 | — | |||||||||
| Capital gains incentive fees(1) |
5,459 | 173 | — | |||||||||
| Administrative services expenses |
924 | 261 | — | |||||||||
| Stock transfer agent fees |
890 | 265 | — | |||||||||
| Accounting and administrative fees |
568 | 326 | — | |||||||||
| Interest expense |
3,881 | — | — | |||||||||
| Other general and administrative expenses |
1,656 | 655 | 605 | |||||||||
| Total expenses |
21,278 | 2,509 | 605 | |||||||||
| Less: Expense reimbursement from sponsor (Note 4) |
— | (240 | ) | — | ||||||||
| Net expenses |
21,278 | 2,269 | 605 | |||||||||
| Net investment income (loss) |
9,392 | 2,151 | (580 | ) | ||||||||
| Realized and unrealized gain |
||||||||||||
| Net realized gain on investments |
9,081 | 1,030 | — | |||||||||
| Net change in unrealized appreciation on investments |
9,809 | 8,275 | — | |||||||||
| Net change in unrealized loss on foreign currency |
(18 | ) | — | — | ||||||||
| Total net realized and unrealized gain on investments |
18,872 | 9,305 | — | |||||||||
| Net increase (decrease) in net assets resulting from operations |
$ | 28,264 | $ | 11,456 | $ | (580 | ) | |||||
| Per share information—basic and diluted |
||||||||||||
| Net increase (decrease) in net assets resulting from operations |
$ | 1.21 | $ | 2.57 | $ | (4.72 | ) | |||||
| Weighted average shares outstanding(2) |
23,283,593 | 4,465,071 | 122,850 | |||||||||
| (1) | See Note 2 for a discussion of the methodology employed by the Company in calculating the capital gains incentive fee. |
| (2) | As discussed in Note 5, between March 31, 2009 and January 31, 2010, the Company issued eight stock distributions. The weighted average shares used in the per share computation of the net increase (decrease) in net assets resulting from operations reflect these stock distributions on a retroactive basis. |
See notes to consolidated financial statements.
78
Table of Contents
Consolidated Statements of Changes in Net Assets
(in thousands)
| Year Ended December 31, | ||||||||||||
| 2010 | 2009 | 2008 | ||||||||||
| Operations |
||||||||||||
| Net investment income |
$ | 9,392 | $ | 2,151 | $ | (580 | ) | |||||
| Net realized gain on investments |
9,081 | 1,030 | — | |||||||||
| Net change in unrealized appreciation on investments |
9,809 | 8,275 | — | |||||||||
| Net change in unrealized loss on foreign currency |
(18 | ) | — | — | ||||||||
| Net increase (decrease) in net assets resulting from operations |
28,264 | 11,456 | (580 | ) | ||||||||
| Stockholder distributions(1) |
||||||||||||
| Distributions from net investment income |
(13,545 | ) | (2,157 | ) | (25 | ) | ||||||
| Distributions from net realized gain on investments |
(7,844 | ) | (977 | ) | — | |||||||
| Net decrease in net assets resulting from stockholder distributions |
(21,389 | ) | (3,134 | ) | (25 | ) | ||||||
| Capital share transactions |
||||||||||||
| Issuance of common stock |
285,916 | 84,787 | 1,000 | |||||||||
| Reinvestment of stockholder distributions |
8,252 | 490 | — | |||||||||
| Repurchases of common stock |
(2,143 | ) | — | — | ||||||||
| Offering costs |
(1,671 | ) | (387 | ) | (1,310 | ) | ||||||
| Reimbursement of investment adviser (Note 4) |
(2,319 | ) | (1,418 | ) | — | |||||||
| Capital contributions of investment adviser |
1,125 | 404 | 1,914 | |||||||||
| Net increase in net assets resulting from capital share transactions |
289,160 | 83,876 | 1,604 | |||||||||
| Total increase in net assets |
296,035 | 92,198 | 999 | |||||||||
| Net assets at beginning of year |
93,197 | 999 | — | |||||||||
| Net assets at end of year |
$ | 389,232 | $ | 93,197 | $ | 999 | ||||||
| (1) | See Note 5 for a discussion of the source of distributions paid by the Company. |
See notes to consolidated financial statements.
79
Table of Contents
Consolidated Statements of Cash Flows
(in thousands)
| Year Ended December 31, | ||||||||||||
| 2010 | 2009 | 2008 | ||||||||||
| Cash flows from operating activities |
||||||||||||
| Net increase in net assets resulting from operations |
$ | 28,264 | $ | 11,456 | $ | (580 | ) | |||||
| Adjustments to reconcile net increase in net assets resulting from operations to net cash used in operating activities: |
||||||||||||
| Purchases of investments |
(849,242 | ) | (106,098 | ) | — | |||||||
| Payment-in-kind interest |
(103 | ) | (133 | ) | — | |||||||
| Proceeds from sales and repayments of investments |
240,054 | 16,717 | — | |||||||||
| Net change in unrealized appreciation on investments |
(9,809 | ) | (8,275 | ) | — | |||||||
| Net change in unrealized loss on foreign currency |
18 | — | — | |||||||||
| Net realized gain on investments |
(9,081 | ) | (1,030 | ) | — | |||||||
| Accretion of discount |
(4,825 | ) | (1,774 | ) | — | |||||||
| Amortization of deferred financing costs |
506 | — | — | |||||||||
| Increase in interest receivable |
(3,230 | ) | (402 | ) | — | |||||||
| (Increase) Decrease in prepaid expenses and other assets |
4 | (24 | ) | — | ||||||||
| Increase in payable for investments purchased |
66,434 | 15,366 | — | |||||||||
| Increase in receivable for investments sold and repaid |
(5,147 | ) | (15 | ) | — | |||||||
| Increase in management fees payable |
2,861 | 437 | — | |||||||||
| Increase in capital gains incentive fee payable |
5,286 | 173 | — | |||||||||
| Increase in interest payable |
883 | — | — | |||||||||
| Increase in administrative services fees payable |
214 | 96 | — | |||||||||
| Increase in other accrued expenses and liabilities |
442 | 183 | 1 | |||||||||
| Net cash used in operating activities |
(536,471 | ) | (73,323 | ) | (579 | ) | ||||||
| Cash flows from financing activities |
||||||||||||
| Issuance of common stock |
285,916 | 84,787 | 1,000 | |||||||||
| Reinvestment of stockholder distributions |
8,252 | 490 | — | |||||||||
| Repurchases of common stock |
(2,143 | ) | — | — | ||||||||
| Offering costs |
(1,671 | ) | (387 | ) | (1,310 | ) | ||||||
| Payments to investment adviser for offering and organization costs (Note 4) |
(1,678 | ) | (1,418 | ) | — | |||||||
| Capital contributions of investment adviser |
1,125 | 404 | 1,914 | |||||||||
| Stockholder distributions |
(19,449 | ) | (2,518 | ) | (25 | ) | ||||||
| Borrowings under credit facility |
297,201 | — | — | |||||||||
| Deferred financing costs paid |
(1,327 | ) | — | — | ||||||||
| Net cash provided by financing activities |
566,226 | 81,358 | 1,579 | |||||||||
| Total increase in cash |
29,755 | 8,035 | 1,000 | |||||||||
| Cash at beginning of year |
9,035 | 1,000 | — | |||||||||
| Cash at end of year |
$ | 38,790 | $ | 9,035 | $ | 1,000 | ||||||
| Non-cash financing activities |
||||||||||||
| Payable to investment adviser for offering and organization costs (Note 4) |
$ | 641 | $ | — | $ | — | ||||||
See notes to consolidated financial statements.
80
Table of Contents
Consolidated Schedule of Investments
As of December 31, 2010
(in thousands)
| Portfolio Company(a) |
Industry |
Principal Amount(b) |
Amortized Cost |
Fair Value(c) |
||||||||||
| Senior Secured Loans—First Lien—124.4% |
||||||||||||||
| 1-800 Contacts, Inc., L+395, 3.8% LIBOR Floor, 3/4/15 |
Healthcare | $ | 5,508 | $ | 5,233 | $ | 5,494 | |||||||
| Advance Pierre Foods, Inc., L+525, 1.8% LIBOR Floor, 9/29/16(d) |
Consumer Staples | 4,924 | 4,829 | 4,934 | ||||||||||
| Airvana Network Solutions Inc., L+900, 2.0% LIBOR Floor, 8/27/14 |
Telecommunication Services | 2,367 | 2,356 | 2,378 | ||||||||||
| Alaska Communications Systems Holdings, Inc., L+400, 1.5% LIBOR Floor, 10/21/16(f) |
Telecommunication Services | 3,683 | 3,647 | 3,701 | ||||||||||
| Alliant Holdings LLC, L+500, 1.8% LIBOR Floor, 8/16/14(d)(e) |
Financials | 2,000 | 2,020 | 2,015 | ||||||||||
| Altegrity, Inc., L+600, 1.8% LIBOR Floor, 2/21/15(d) |
Industrials | 7,363 | 7,260 | 7,455 | ||||||||||
| Amscan Holdings, Inc., L+525, 1.5% LIBOR Floor, 12/2/17(d) |
Consumer Discretionary | 6,923 | 6,869 | 6,942 | ||||||||||
| AmWINS Group, Inc., L+250, 6/8/13(d) |
Financials | 949 | 797 | 902 | ||||||||||
| Anchor Glass Container Corp., L+400, 2.0% LIBOR Floor, 3/1/16(d) |
Industrials | 3,416 | 3,386 | 3,430 | ||||||||||
| Ardent Health Services LLC, L+500, 1.5% LIBOR Floor, 9/15/15(d) |
Healthcare | 7,302 | 7,229 | 7,321 | ||||||||||
| Armstrong World Industries, Inc., L+350, 1.5% LIBOR Floor, 5/23/17(d)(f) |
Industrials | 1,687 | 1,678 | 1,702 | ||||||||||
| Aspect Software, Inc., L+450, 1.8% LIBOR Floor, 5/7/16(d) |
Information Technology | 1,985 | 1,967 | 2,000 | ||||||||||
| Atlantic Broadband Finance, LLC, L+350, 1.5% LIBOR Floor, 11/29/15(d) |
Telecommunication Services | 1,338 | 1,331 | 1,350 | ||||||||||
| Avaya Inc., L+350, 0.8% LIBOR Floor, 10/24/14(d) |
Information Technology | 9,925 | 9,170 | 9,598 | ||||||||||
| BBHI Acquisition LLC, L+300, 1.5% LIBOR Floor, 12/14/17(d) |
Telecommunication Services | 2,064 | 2,043 | 2,078 | ||||||||||
| Bentley Systems Inc., L+425, 1.5% LIBOR Floor, 11/24/16(e) |
Information Technology | 1,789 | 1,771 | 1,804 | ||||||||||
| Burger King Corp., L+450, 1.8% LIBOR Floor, 10/19/16(d) |
Consumer Staples | 6,529 | 6,547 | 6,638 | ||||||||||
| Calumet Lubricants Co., LP, L+400, 1/3/15(d)(f) |
Energy | 2,819 | 2,630 | 2,727 | ||||||||||
| Canwest LP, L+700, 2.0% LIBOR Floor, 7/23/16(d)(e)(f) |
Consumer Discretionary | 7,828 | 7,754 | 7,960 | ||||||||||
| CCC Information Services Inc., L+400, 1.5% LIBOR Floor, 11/11/15(d) |
Information Technology | 1,578 | 1,562 | 1,593 | ||||||||||
| CDW Corp., L+500, 7/10/17(d) |
Information Technology | 5,584 | 4,978 | 5,551 | ||||||||||
| Cedar Fair, LP, L+400, 1.5% LIBOR Floor, 12/15/16(d)(f) |
Consumer Discretionary | 2,954 | 2,927 | 2,989 | ||||||||||
| Cenveo Corp., L+475, 1.5% LIBOR Floor, 12/21/16(d)(f) |
Consumer Discretionary | 6,667 | 6,600 | 6,728 | ||||||||||
| Ceridian Corp., L+300, 11/9/14(d) |
Industrials | 7,456 | 6,780 | 7,115 | ||||||||||
| Citgo Petroleum Corp., L+700, 2.0% LIBOR Floor, 6/24/17(d)(f) |
Energy | 6,965 | 6,878 | 7,289 | ||||||||||
| Clopay Ames True Temper Holding Corp., L+600, 1.8% LIBOR Floor, 9/30/16(d)(e)(f) |
Consumer Discretionary | 7,941 | 7,903 | 8,021 | ||||||||||
| CMP Susquehanna Corp., L+200, 5/5/13(d)(e) |
Telecommunication Services | 6,980 | 6,267 | 6,319 | ||||||||||
| Contec LLC, L+475, 3.0% LIBOR Floor, 7/28/14(d) |
Telecommunication Services | 1,942 | 1,656 | 1,767 | ||||||||||
| ConvaTec Inc., L+425, 1.5% LIBOR Floor, 12/22/16(d) |
Healthcare | 2,314 | 2,303 | 2,342 | ||||||||||
| Corel Corp., L+400, 5/2/12(f) |
Information Technology | 1,434 | 1,313 | 1,369 | ||||||||||
| Cumulus Media Inc., L+375, 6/11/14(d) |
Telecommunication Services | 4,060 | 3,748 | 3,787 | ||||||||||
| Custom Building Products, Inc., L+400, 1.8% LIBOR Floor, 3/1/15(d) |
Materials | 2,830 | 2,806 | 2,851 | ||||||||||
| Data Device Corp., L+550, 1.8% LIBOR Floor, 12/23/16 |
Industrials | 9,231 | 9,092 | 9,144 | ||||||||||
| DEI Sales, Inc., L+550, 2.0% LIBOR Floor, 9/22/13 |
Consumer Discretionary | 2,348 | 2,201 | 2,160 | ||||||||||
| DineEquity, Inc., L+450, 1.5% LIBOR Floor, 10/7/17(d)(f) |
Consumer Staples | 2,436 | 2,412 | 2,476 | ||||||||||
| Dunkin’ Brands, Inc., L+425, 1.5% LIBOR Floor, 11/23/17(d) |
Consumer Staples | 2,500 | 2,488 | 2,534 | ||||||||||
| Fairmount Minerals, Ltd., L+450, 1.8% LIBOR Floor, 8/5/16(d) |
Materials | 6,759 | 6,701 | 6,885 | ||||||||||
| Fifth Third Processing Solutions LLC, L+400, 1.5% LIBOR Floor, 11/3/16(d) |
Financials | 3,731 | 3,695 | 3,769 | ||||||||||
| First Data Corp., L+275, 9/24/14(d) |
Information Technology | 7,621 | 6,622 | 7,063 | ||||||||||
| First Reserve Crestwood Holdings LLC, L+850, 2.0% LIBOR Floor, 10/3/16 |
Energy | 4,500 | 4,413 | 4,596 | ||||||||||
| Freescale Semiconductor, Inc., L+425, 12/1/16(d) |
Industrials | 7,437 | 7,076 | 7,224 | ||||||||||
| General Chemical Corp., L+500, 1.8% LIBOR Floor, 10/6/15(d)(e) |
Materials | 7,527 | 7,557 | 7,637 | ||||||||||
| Getty Images, Inc., L+375, 1.5% LIBOR Floor, 11/7/16(d) |
Consumer Discretionary | 2,441 | 2,418 | 2,466 | ||||||||||
| Global Tel Link Corp., L+550, 1.8% LIBOR Floor, 11/10/16(d) |
Telecommunication Services | 8,304 | 8,151 | 8,206 | ||||||||||
| Goodman Global, Inc., L+400, 1.8% LIBOR Floor, 10/28/16(d) |
Consumer Discretionary | 1,814 | 1,796 | 1,826 | ||||||||||
| Green Mountain Coffee Roasters, Inc., L+400, 1.5% LIBOR Floor, 12/16/16(d)(f) |
Consumer Staples | 1,754 | 1,737 | 1,757 | ||||||||||
| Green Tree Credit Solutions LLC, L+575, 2.3% LIBOR Floor, 12/18/15(d) |
Financials | 4,466 | 4,303 | 4,459 | ||||||||||
| Grifols, SA , L+425, 1.8% LIBOR Floor, 6/4/16(d)(e)(f) |
Healthcare | 4,336 | 4,295 | 4,392 | ||||||||||
| Hanger Orthopedic Group, Inc., L+375, 1.5% LIBOR Floor, 12/1/16(d)(f) |
Healthcare | 1,944 | 1,935 | 1,962 | ||||||||||
| Harbor Freight Tools USA, Inc., L+500, 1.5% LIBOR Floor, 12/22/17(d) |
Consumer Discretionary | 9,929 | 9,830 | 9,931 | ||||||||||
| HarbourVest Partners LP, L+475, 1.5% LIBOR Floor, 12/17/16(d) |
Financials | 11,642 | 11,526 | 11,671 | ||||||||||
| Harland Clarke Holdings Corp., L+250, 6/30/14(d)(f) |
Industrials | 2,448 | 2,121 | 2,223 | ||||||||||
| iHealth Technologies, Inc., L+600, 1.8% LIBOR Floor, 12/28/16(e) |
Healthcare | 3,636 | 3,564 | 3,618 | ||||||||||
| Infogroup, Inc., L+450, 1.8% LIBOR Floor, 7/1/16(d) |
Consumer Discretionary | 4,647 | 4,563 | 4,695 | ||||||||||
| Intelsat Jackson Holdings SA, L+375, 1.5% LIBOR Floor, 4/2/18(d)(e)(f) |
Telecommunication Services | 5,638 | 5,609 | 5,702 | ||||||||||
| Interactive Data Corp., L+500, 1.8% LIBOR Floor, 1/29/17(d)(e)(f) |
Financials | 6,716 | 6,651 | 6,813 | ||||||||||
| Intralinks, Inc.,L+425, 1.5% LIBOR Floor, 6/15/14 |
Information Technology | 1,451 | 1,169 | 1,437 | ||||||||||
| KIK Custom Products Inc., L+225, 5/31/14(d)(f) |
Consumer Staples | 4,949 | 4,394 | 4,248 | ||||||||||
| Knology, Inc., L+400, 1.5% LIBOR Floor, 10/15/16(d)(f) |
Consumer Discretionary | 1,950 | 1,931 | 1,964 | ||||||||||
| Lantiq Deutschland GmbH, L+700, 2.0% LIBOR Floor, 11/16/15(d)(f) |
Information Technology | 5,993 | 5,879 | 6,008 | ||||||||||
| MDA Info Products Ltd., L+550, 1.5% LIBOR Floor, 1/4/17(e) |
Information Technology | 5,000 | 4,925 | 4,950 | ||||||||||
| MedAssets, Inc., L+375, 1.5% LIBOR Floor, 11/22/16(d)(f) |
Healthcare | 1,667 | 1,650 | 1,677 | ||||||||||
| Michael Foods Group, Inc., L+450, 1.8% LIBOR Floor, 6/29/16(d) |
Consumer Staples | 2,536 | 2,490 | 2,575 | ||||||||||
See notes to consolidated financial statements.
81
Table of Contents
FS Investment Corporation
Consolidated Schedule of Investments (continued)
As of December 31, 2010
(in thousands)
| Portfolio Company(a) |
Industry |
Principal Amount(b) |
Amortized Cost |
Fair Value(c) |
||||||||||
| Mosaic US Holdings Inc., L+275, 4/3/13 |
Consumer Discretionary | $ | 882 | $ | 666 | $ | 789 | |||||||
| NBTY, Inc., L+450, 1.8% LIBOR Floor, 10/1/17(d) |
Consumer Staples | 2,212 | 2,191 | 2,248 | ||||||||||
| NCO Group, Inc., L+500, 2.5% LIBOR Floor, 5/15/13(d) |
Information Technology | 3,303 | 3,283 | 3,270 | ||||||||||
| New Development Holdings, LLC (Calpine), L+550, 1.5% LIBOR Floor, 7/3/17(d)(f) |
Utilities | 5,558 | 5,486 | 5,662 | ||||||||||
| OSI Restaurant Partners, LLC, L+225, 6/14/14(d) |
Consumer Discretionary | 5,638 | 4,968 | 5,397 | ||||||||||
| Ozburn Hessey Holding Co., LLC, L+550, 2.0% LIBOR Floor, 4/8/16(d) |
Industrials | 6,230 | 6,198 | 6,316 | ||||||||||
| Petco Animal Supplies, Inc., L+450, 1.5% LIBOR Floor, 11/24/17(d) |
Consumer Discretionary | 2,930 | 2,901 | 2,958 | ||||||||||
| Protection One, Inc., L+425, 1.8% LIBOR Floor, 6/4/16(d) |
Consumer Discretionary | 4,402 | 4,375 | 4,424 | ||||||||||
| RBS Worldpay, Inc., L+450, 1.8% LIBOR Floor, 10/15/17(e) |
Financials | 1,538 | 1,523 | 1,551 | ||||||||||
| Remy International, Inc., L+450, 1.8% LIBOR Floor, 12/17/13(d)(e) |
Consumer Discretionary | 2,083 | 2,063 | 2,099 | ||||||||||
| RepconStrickland, Inc., L+525, 3.3% LIBOR Floor, 2/19/13 |
Energy | 3,925 | 3,595 | 3,572 | ||||||||||
| Res-Care, Inc., L+550, 1.8% LIBOR Floor, 12/22/16(e)(f) |
Consumer Discretionary | 5,000 | 4,900 | 4,925 | ||||||||||
| Revlon Consumer Products Corp., L+400, 2.0% LIBOR Floor, 3/11/15(d)(f) |
Consumer Discretionary | 6,357 | 6,263 | 6,393 | ||||||||||
| Reynolds & Reynolds Co., L+350, 1.8% LIBOR Floor, 4/21/17(d) |
Information Technology | 4,969 | 4,936 | 5,011 | ||||||||||
| Reynolds Group Holdings Inc., L+446, 1.8% LIBOR Floor, 5/5/16(d)(f) |
Industrials | 7,950 | 7,934 | 8,043 | ||||||||||
| Rural/Metro Corp., L+425, 1.8% LIBOR Floor, 11/24/16(d)(f) |
Industrials | 1,474 | 1,466 | 1,491 | ||||||||||
| Sagittarius Restaurants LLC, L+550, 2.0% LIBOR Floor, 5/18/15 |
Consumer Discretionary | 3,084 | 3,052 | 3,090 | ||||||||||
| Savvis, Inc., L+500, 1.8% LIBOR Floor, 8/4/16(d)(f) |
Information Technology | 7,382 | 7,230 | 7,513 | ||||||||||
| SemGroup Corp., L+700, 1.5% LIBOR Floor, 11/30/12(d)(f) |
Energy | 3,492 | 3,458 | 3,457 | ||||||||||
| Sheridan Production Co., LLC, L+550, 2.0% LIBOR Floor, 4/20/17(d) |
Energy | 7,948 | 7,824 | 8,021 | ||||||||||
| Sitel, LLC, L+550, 1/30/14(d) |
Telecommunication Services | 5,966 | 5,614 | 5,707 | ||||||||||
| Six Flags Theme Parks, Inc., L+400, 1.5% LIBOR Floor, 6/30/16(d)(f) |
Consumer Discretionary | 2,737 | 2,724 | 2,765 | ||||||||||
| Smile Brands Group Inc., L+525, 1.8% LIBOR Floor, 12/21/17(d)(e) |
Healthcare | 5,966 | 5,877 | 5,932 | ||||||||||
| Smurfit-Stone Container Enterprises, Inc., L+475, 2.0% LIBOR Floor, 2/10/16(f) |
Industrials | 6,965 | 6,905 | 7,093 | ||||||||||
| Spansion, LLC, L+550, 2.0% LIBOR Floor, 2/9/15(d)(f) |
Information Technology | 5,903 | 5,942 | 5,991 | ||||||||||
| Sports Authority, Inc., L+600, 1.5% LIBOR Floor, 11/16/17(d) |
Consumer Discretionary | 8,000 | 7,783 | 8,020 | ||||||||||
| Styron Sarl, L+575, 1.8% LIBOR Floor, 6/14/16(d) |
Materials | 7,897 | 7,812 | 8,027 | ||||||||||
| Summit Materials Companies I, LLC, L+500, 1.5% LIBOR Floor, 12/31/15(d) |
Materials | 4,000 | 4,000 | 4,002 | ||||||||||
| Swift Transportation Co., Inc., L+450, 1.5% LIBOR Floor, 12/21/16(d)(e)(f) |
Industrials | 4,545 | 4,500 | 4,568 | ||||||||||
| Syniverse Holdings, Inc., L+375, 1.5% LIBOR Floor, 9/8/14(d)(e)(f) |
Telecommunication Services | 2,029 | 2,009 | 2,055 | ||||||||||
| Targus Information Corp., L+525, 1.8% LIBOR Floor, 12/28/16(e) |
Information Technology | 5,000 | 4,900 | 4,950 | ||||||||||
| Telcordia Technologies Inc., L+500, 1.8% LIBOR Floor, 4/30/16(d) |
Telecommunication Services | 8,004 | 8,024 | 8,018 | ||||||||||
| Texas Competitive Electric Holdings Co. LLC, L+350, 10/10/14(d) |
Utilities | 9,384 | 7,737 | 7,278 | ||||||||||
| The Gymboree Corp., L+400, 1.5% LIBOR Floor, 11/23/17(d) |
Consumer Discretionary | 2,139 | 2,128 | 2,154 | ||||||||||
| TNS, Inc., L+400, 2.0% LIBOR Floor, 11/18/15(d)(f) |
Telecommunication Services | 1,317 | 1,317 | 1,324 | ||||||||||
| Toys“R”Us, Inc., L+450, 1.5% LIBOR Floor, 8/17/16(d) |
Consumer Discretionary | 6,733 | 6,696 | 6,806 | ||||||||||
| Trident Exploration Corp., L+950, 3.0% LIBOR Floor, 6/10/14(d)(f) |
Energy | 8,960 | 8,904 | 9,464 | ||||||||||
| Univar Inc., L+450, 1.8% LIBOR Floor, 6/30/17(d) |
Materials | 6,642 | 6,589 | 6,640 | ||||||||||
| Universal Health Services, Inc., L+400, 1.5% LIBOR Floor, 11/15/16(f) |
Healthcare | 5,000 | 4,930 | 5,079 | ||||||||||
| Vertafore, Inc., L+500, 1.8% LIBOR Floor, 7/29/16(d) |
Information Technology | 6,910 | 6,827 | 6,969 | ||||||||||
| WCP Exposition Services Operating Co. LLC, L+600, 3.0% LIBOR Floor, 8/29/11 |
Consumer Discretionary | 539 | 244 | 436 | ||||||||||
| Yell Group Plc, L+300, 7/31/14(f) |
Consumer Discretionary | 804 | 675 | 379 | ||||||||||
| Total Senior Secured Loans—First Lien |
473,881 | 484,105 | ||||||||||||
| Senior Secured Loans—Second Lien—34.9% |
||||||||||||||
| Advance Pierre Foods, Inc., L+950, 1.8% LIBOR Floor, 9/29/17 |
Consumer Staples | 5,000 | 4,864 | 5,072 | ||||||||||
| Advantage Sales & Marketing Inc., L+775, 1.5% LIBOR Floor, 6/17/18(d) |
Industrials | 10,000 | 9,850 | 10,083 | ||||||||||
| AMN Healthcare Services, Inc., L+1000, 1.8% LIBOR Floor, 9/1/16 |
Healthcare | 10,000 | 9,716 | 9,750 | ||||||||||
| AmWINS Group, Inc., L+550, 6/8/14 |
Financials | 1,992 | 1,672 | 1,712 | ||||||||||
| Attachmate Corp., L+675, 10/13/13(d) |
Information Technology | 5,000 | 4,358 | 4,951 | ||||||||||
| Awesome Acquisition Co., L+500, 6/4/14 |
Consumer Discretionary | 2,940 | 2,343 | 2,616 | ||||||||||
| BNY ConvergEx Group, LLC, L+700, 1.8% LIBOR Floor, 12/17/17(d)(e) |
Information Technology | 6,000 | 5,925 | 6,158 | ||||||||||
| Carestream Health, Inc., L+525, 10/30/13(d) |
Healthcare | 8,000 | 7,723 | 7,892 | ||||||||||
| Central Parking Systems, Inc., L+450, 11/22/14 |
Industrials | 250 | 199 | 180 | ||||||||||
| Datatel, Inc., L+825, 2.0% LIBOR Floor, 12/10/16 |
Information Technology | 5,000 | 4,915 | 5,070 | ||||||||||
| Dresser, Inc., L+575, 5/4/15(d) |
Energy | 7,405 | 6,980 | 7,411 | ||||||||||
| Edwards Ltd., L+575, 11/30/14(d)(f) |
Industrials | 2,305 | 2,062 | 2,201 | ||||||||||
| FR Brand Acquisition Corp., L+625, 2/7/15(d) |
Industrials | 8,000 | 6,948 | 7,256 | ||||||||||
| Goodman Global, Inc., L+700, 2.0% LIBOR Floor, 10/27/17(d) |
Consumer Discretionary | 7,000 | 6,863 | 7,230 | ||||||||||
| Kronos Inc., L+575, 6/11/15(d) |
Industrials | 3,000 | 2,919 | 2,941 | ||||||||||
| Roundy’s Supermarkets, Inc., L+800, 2.0% LIBOR Floor, 4/16/16(d) |
Consumer Staples | 10,000 | 10,106 | 10,169 | ||||||||||
| Sedgwick CMS Holdings, L+750, 1.5% LIBOR Floor, 5/30/17 |
Industrials | 500 | 500 | 500 | ||||||||||
| Southern Pacific Resource Co., L+850, 2.0% LIBOR Floor, 12/22/15(e)(f) |
Energy | 10,000 | 9,700 | 9,850 | ||||||||||
| TPF Generation Holdings (Tenaska Power Fund), LLC, L+425, 12/15/14(d) |
Energy | 9,170 | 8,329 | 8,442 | ||||||||||
See notes to consolidated financial statements.
82
Table of Contents
FS Investment Corporation
Consolidated Schedule of Investments (continued)
As of December 31, 2010
(in thousands)
| Portfolio Company(a) |
Industry |
Principal Amount(b) |
Amortized Cost |
Fair Value(c) |
||||||||||
| Vertafore, Inc., L+825, 1.5% LIBOR Floor, 10/19/17(d) |
Information Technology | $ | 10,000 | $ | 9,902 | $ | 10,131 | |||||||
| Wm. Bolthouse Farms, Inc., L+750, 2.0% LIBOR Floor, 8/11/16(d) |
Consumer Staples | 8,384 | 8,385 | 8,497 | ||||||||||
| Xerium Technologies, Inc., L+625, 2.0% LIBOR Floor, 5/25/15(d)(e) |
Materials | 7,960 | 7,701 | 7,850 | ||||||||||
| Total Senior Secured Loans—Second Lien |
131,960 | 135,962 | ||||||||||||
| Senior Secured Bonds—8.1% | ||||||||||||||
| Allen Systems Group, Inc., 10.5%, 11/15/16 |
Information Technology | 7,348 | 7,383 | 7,458 | ||||||||||
| First Data Corp., 8.9%, 8/15/20(d) |
Information Technology | 4,300 | 4,232 | 4,517 | ||||||||||
| Logan’s Roadhouse, Inc., 10.8%, 10/15/17 |
Consumer Discretionary | 4,000 | 4,000 | 4,322 | ||||||||||
| Nexstar Broadcasting Group, Inc., 8.9%, 4/15/17(d) |
Telecommunication Services | 5,000 | 4,971 | 5,318 | ||||||||||
| Paetec Holding Corp., 8.9%, 6/30/17(d) |
Telecommunication Services | 4,680 | 4,809 | 5,008 | ||||||||||
| Roofing Supply Group LLC, 8.6%, 12/1/17(d) |
Industrials | 800 | 800 | 817 | ||||||||||
| Stallion Oilfield Services Ltd., 10.5%, 2/15/15 |
Energy | 4,000 | 4,070 | 4,219 | ||||||||||
| Total Senior Secured Bonds |
30,265 | 31,659 | ||||||||||||
| Mezzanine Debt/Other—21.0% |
||||||||||||||
| Apidos CDO IV Class E, L+360, 10/27/18(f) |
Financials | 2,000 | 1,051 | 1,375 | ||||||||||
| Ares 2007 CLO 11A Class E, L+600, 10/11/21(f) |
Financials | 4,775 | 3,028 | 3,565 | ||||||||||
| Ares 2007 CLO 12X Class E, L+575, 11/25/20(f) |
Financials | 2,252 | 1,743 | 1,633 | ||||||||||
| Aspect Software, Inc., 10.6%, 5/15/17(d) |
Information Technology | 4,000 | 4,000 | 4,137 | ||||||||||
| ATI Enterprises Inc., L+1100, 2.3% LIBOR Floor, 12/30/16 |
Consumer Discretionary | 8,000 | 7,908 | 7,253 | ||||||||||
| Aurora Diagnostics, LLC, 10.8%, 1/15/18 |
Healthcare | 8,000 | 8,000 | 8,001 | ||||||||||
| Base CLO I Class E, EURIBOR+500, 10/17/18(f) |
Financials | € | 1,500 | 960 | 1,207 | |||||||||
| Blue Mountain CLO III Class E, L+355, 3/17/21 |
Financials | $ | 2,000 | 869 | 1,195 | |||||||||
| Bresnan Broadband Holdings LLC, 8.0%, 12/15/18(d)(f) |
Telecommunication Services | 5,000 | 5,000 | 5,175 | ||||||||||
| Cincinnati Bell Inc., 8.4%, 10/15/20(d)(f) |
Telecommunication Services | 8,000 | 8,000 | 7,682 | ||||||||||
| Franklin CLO 6A Class E, L+425, 8/9/19(f) |
Financials | 1,919 | 1,133 | 1,219 | ||||||||||
| Hughes Network Systems, LLC, 9.5%, 4/15/14(f) |
Telecommunication Services | 2,000 | 2,072 | 2,070 | ||||||||||
| Lightpoint CLO 2006 V Class D, L+365, 8/5/19(f) |
Financials | 6,500 | 3,012 | 3,920 | ||||||||||
| Lightpoint CLO 2007 VII Class D, L+400, 5/15/21(f) |
Financials | 4,000 | 2,182 | 2,390 | ||||||||||
| Mediacom Broadband LLC, 8.5%, 10/15/15(f) |
Consumer Discretionary | 2,000 | 2,029 | 2,011 | ||||||||||
| Mountain View CLO II Class Pref, 17.4%, 1/12/21(e)(f) |
Financials | 8,975 | 7,272 | 7,135 | ||||||||||
| N.E.W. Customer Service Cos., Inc., L+750, 2.0% LIBOR Floor, 3/22/17(d) |
Industrials | 7,000 | 6,867 | 6,980 | ||||||||||
| NBTY, Inc., 9.0%, 10/1/18 |
Consumer Staples | 4,700 | 4,700 | 5,036 | ||||||||||
| Octagon CDO 2007 1A Class Income, 38.1%, 8/25/21(f) |
Financials | 4,000 | 2,774 | 2,900 | ||||||||||
| Paetec Holding Corp., 9.9%, 12/1/18(f) |
Telecommunication Services | 4,000 | 3,868 | 4,030 | ||||||||||
| Univar Inc., 12.0%, 6/30/18 |
Materials | 3,000 | 2,940 | 2,940 | ||||||||||
| Total Mezzanine Debt |
79,408 | 81,854 | ||||||||||||
| TOTAL INVESTMENTS—188.4% |
$ | 715,514 | 733,580 | |||||||||||
| LIABILITIES IN EXCESS OF OTHER ASSETS—(88.4%) |
(344,348 | ) | ||||||||||||
| NET ASSETS—100.0% |
$ | 389,232 | ||||||||||||
| (a) | Security may be an obligation of one or more entities affiliated with the named company. |
| (b) | Denominated in U.S. Dollars unless otherwise noted. |
| (c) | Fair value determined by the Company’s Board of Directors (see Note 7). |
| (d) | Security or portion thereof held within Broad Street Funding LLC and is pledged as collateral supporting the amounts outstanding under the revolving credit facility with Deutsche Bank AG, New York Branch (see Notes 9 and 10). |
| (e) | Position or portion thereof unsettled as of December 31, 2010. |
| (f) | The investment is not a qualifying asset under the 1940 Act. A business development company may not acquire any asset other than qualifying assets, unless, at the time the acquisition is made, qualifying assets represent at least 70% of the company’s total assets. |
See notes to consolidated financial statements.
83
Table of Contents
FS Investment Corporation
Schedule of Investments
As of December 31, 2009
(in thousands)
| Portfolio Company(a) |
Industry | Principal Amount |
Amortized Cost |
Fair Value(b) |
||||||||||||
| Senior Secured Loans—First Lien—49.1% |
||||||||||||||||
| 1-800 Contacts, Inc., L+395, 3.8% LIBOR Floor, 3/4/15 |
Healthcare | $ | 3,079 | $ | 2,733 | $ | 2,987 | |||||||||
| AmWINS Group, Inc., L+250, 6/8/13 |
Financials | 975 | 762 | 829 | ||||||||||||
| Apptis (DE), Inc., L+325, 12/20/12 |
Information Technology | 879 | 684 | 835 | ||||||||||||
| CamelBak Products, Prime+475, 8/4/11 |
Consumer Discretionary | 1,966 | 1,817 | 1,857 | ||||||||||||
| Caritor, Inc. (Keane Inc.), L+225, 6/4/13 |
Information Technology | 1,988 | 1,571 | 1,827 | ||||||||||||
| Columbian Chemicals Co., L+600, 3/16/13 |
Materials | 1,214 | 816 | 1,068 | ||||||||||||
| Contec LLC, L+475, 3.0% LIBOR Floor, 7/28/14 |
Telecommunication Services | 1,984 | 1,618 | 1,711 | ||||||||||||
| Corel Corp., L+400, 5/2/12 |
Information Technology | 1,569 | 1,346 | 1,386 | ||||||||||||
| Data Transmission Network Corp., L+500, 3/10/13 |
Information Technology | 483 | 433 | 464 | ||||||||||||
| Edwards Ltd., L+200, 5/31/14 |
Industrials | 1,950 | 1,272 | 1,553 | ||||||||||||
| First Data Corp., L+ 275, 9/24/14 |
Information Technology | 2,982 | 2,348 | 2,654 | ||||||||||||
| Global Tel Link Corp., L+600, 3.0% LIBOR Floor, 2/14/13 |
Telecommunication Services | 401 | 362 | 398 | ||||||||||||
| Green Tree Credit Solutions LLC, L+575, 2.3% LIBOR Floor, 12/18/15 |
Financials | 3,000 | 2,851 | 2,895 | ||||||||||||
| Harland Clarke Holdings Corp., L+250, 6/30/14(c) |
Industrials | 2,483 | 1,818 | 2,082 | ||||||||||||
| InfrastruX Group, Inc., L+500, 2.5% LIBOR Floor, 0.5% PIK, 11/3/12 |
Industrials | 724 | 670 | 656 | ||||||||||||
| Intralinks, Inc., L+275, 6/15/14 |
Information Technology | 1,480 | 1,120 | 1,391 | ||||||||||||
| Kenan Advantage Group, Inc., L+275, 12/16/11 |
Industrials | 990 | 807 | 950 | ||||||||||||
| King Pharmaceuticals, Inc., L+500, 4/19/12 |
Healthcare | 117 | 97 | 100 | ||||||||||||
| Mosaic US Holdings Inc., L+275, 4/3/13 |
Consumer Discretionary | 889 | 592 | 689 | ||||||||||||
| National Processing Co. Group, Inc., L+500, 2.5% LIBOR Floor, 10/31/13 |
Information Technology | 1,196 | 1,136 | 1,144 | ||||||||||||
| NCO Group, Inc., L+500, 2.5% LIBOR Floor, 5/15/13(c) |
Information Technology | 2,955 | 2,601 | 2,859 | ||||||||||||
| Pierre Foods, Inc., L+600, 2.5% LIBOR Floor, 9/30/14 |
Consumer Staples | 2,850 | 2,768 | 2,871 | ||||||||||||
| Quantum Corp., L+350, 7/12/14 |
Information Technology | 897 | 762 | 833 | ||||||||||||
| SafeNet, Inc., L+250, 4/12/14 |
Information Technology | 495 | 358 | 467 | ||||||||||||
| SemGroup Corp., L+700, 1.5% LIBOR Floor, 11/30/12 |
Energy | 4,000 | 3,804 | 3,940 | ||||||||||||
| Sitel, LLC, L+550, 1/30/14 |
Telecommunication Services | 2,000 | 1,498 | 1,777 | ||||||||||||
| Texas Competitive Electric Holdings Co. LLC, L+350, 10/10/14 |
Utilities | 4,473 | 3,431 | 3,641 | ||||||||||||
| Vertellus Specialties, Inc., L+425, 12/10/12 |
Materials | 487 | 416 | 472 | ||||||||||||
| WCP Exposition Services Operating Co. LLC, L+600, 3.0% LIBOR Floor, 8/29/11 |
Consumer Discretionary | 544 | 246 | 320 | ||||||||||||
| West Corp., L+500, 3.5% LIBOR Floor, 10/24/13 |
Telecommunication Services | 495 | 442 | 498 | ||||||||||||
| Yell Group Plc, L+300, 7/31/14 |
Consumer Discretionary | 845 | 656 | 626 | ||||||||||||
| Total Senior Secured Loans—First Lien |
41,835 | 45,780 | ||||||||||||||
| Senior Secured Loans—Second Lien—48.8% |
||||||||||||||||
| Allen Systems Group, Inc., L+800, 3.0% LIBOR Floor, 2.0% PIK, 4/19/14 |
Information Technology | 4,016 | 3,812 | 3,906 | ||||||||||||
| American Safety Razor, L+625, 1/30/14 |
Consumer Staples | 2,500 | 1,864 | 1,744 | ||||||||||||
| AmWINS Group, Inc., L+550, 6/8/14 |
Financials | 300 | 184 | 247 | ||||||||||||
| Aspect Software, Inc., L+700, 7/11/12 |
Information Technology | 3,500 | 2,187 | 3,229 | ||||||||||||
| Asurion Corp., L+650, 7/3/15(c) |
Financials | 3,000 | 2,600 | 2,905 | ||||||||||||
| Attachmate Corp., L+675, 10/13/13 |
Information Technology | 3,000 | 2,433 | 2,460 | ||||||||||||
| Awesome Acquisition Co., L+500, 6/4/14 |
Consumer Discretionary | 2,940 | 2,195 | 2,322 | ||||||||||||
| Bresnan Communications LLC, L+450, 3/29/14 |
Telecommunication Services | 1,000 | 765 | 953 | ||||||||||||
| Building Materials Corp. of America, L+575, 10/6/14 |
Materials | 2,000 | 1,654 | 1,825 | ||||||||||||
| Custom Building Products, L+800, 2.8% LIBOR Floor, 4/20/12 |
Materials | 2,500 | 2,347 | 2,397 | ||||||||||||
| Datatel, Inc., L+825, 2.0% LIBOR Floor, 12/10/16 |
Information Technology | 5,000 | 4,901 | 5,075 | ||||||||||||
| Dresser, Inc., L+575, 5/4/15(c) |
Energy | 4,000 | 3,116 | 3,723 | ||||||||||||
| FR Brand Acquisition Corp., L+600, 2/7/15 |
Industrials | 2,000 | 1,306 | 1,682 | ||||||||||||
| Harrington Holdings, Inc., L+600, 7/11/14 |
Healthcare | 1,000 | 680 | 840 | ||||||||||||
| ILC Holdings, Inc., 11.5%, 6/30/14 |
Industrials | 4,000 | 4,000 | 4,020 | ||||||||||||
| Intergraph Corp., L+600, 11/28/14 |
Information Technology | 1,000 | 868 | 950 | ||||||||||||
| Sirius Computer Solutions, Inc., L+600, 5/30/13 |
Information Technology | 3,000 | 2,152 | 2,550 | ||||||||||||
| Sorenson Communications, Inc., L+700, 2/16/14 |
Telecommunication Services | 3,008 | 2,584 | 2,968 | ||||||||||||
| TPF Generation Holdings (Tenaska Power Fund), L+425, 12/15/14(c) |
Energy | 2,000 | 1,703 | 1,725 | ||||||||||||
| Total Senior Secured Loans—Second Lien |
41,351 | 45,521 | ||||||||||||||
See notes to consolidated financial statements.
84
Table of Contents
FS Investment Corporation
Schedule of Investments (continued)
As of December 31, 2009
(in thousands)
| Portfolio Company(a) |
Industry | Principal Amount |
Amortized Cost |
Fair Value(b) |
||||||||||||
| Mezzanine Debt—10.0% |
||||||||||||||||
| ATI Enterprises, Inc., L+1100, 2.3% LIBOR Floor, 12/30/16(c) |
Consumer Discretionary | $ | 5,000 | $ | 4,901 | $ | 4,925 | |||||||||
| Sorenson Holdings, Inc., L+1200 PIK, 8/16/14(c) |
Telecommunication Services | 4,616 | 4,230 | 4,366 | ||||||||||||
| Total Mezzanine Debt |
9,131 | 9,291 | ||||||||||||||
| TOTAL INVESTMENTS—107.9% |
$ | 92,317 | 100,592 | |||||||||||||
| LIABILITIES IN EXCESS OF OTHER ASSETS—(7.9%) |
(7,395 | ) | ||||||||||||||
| NET ASSETS—100.0% |
$ | 93,197 | ||||||||||||||
| (a) | Security may be an obligation of one or more entities affiliated with the named company. |
| (b) | Fair value determined by the Company’s Board of Directors (see Note 7). |
| (c) | Position or portion thereof unsettled as of December 31, 2009. |
See notes to consolidated financial statements.
85
Table of Contents
Notes to Consolidated Financial Statements
(in thousands, except share and per share amounts)
Note 1. Principal Business and Organization
FS Investment Corporation, or the Company, was incorporated under the general corporation laws of the State of Maryland on December 21, 2007 and formally commenced operations on January 2, 2009. The Company has elected to be regulated as a business development company, or BDC, under the Investment Company Act of 1940, as amended, or the 1940 Act. The Company is an externally managed, non-diversified, closed-end management investment company that has elected to be treated for federal income tax purposes as a regulated investment company, or RIC, as defined under Subchapter M of the Internal Revenue Code of 1986, as amended, or the Code. As of December 31, 2010, the Company had one wholly-owned financing subsidiary, Broad Street Funding LLC, or Broad Street, which was established on February 2, 2010. On March 1, 2011, the Company formed a second wholly-owned financing subsidiary, Arch Street Funding LLC, or Arch Street. See “Note 12. Subsequent Events.” The consolidated financial statements include both the Company’s accounts and the accounts of Broad Street. The consolidated financial statements do not include the accounts of Arch Street, as Arch Street was not in existence during the periods covered by the consolidated financial statements. All significant intercompany transactions have been eliminated in consolidation.
Since commencing its initial public offering and through March 15, 2011, the Company has sold 56,357,510 shares (as adjusted for stock distributions) of common stock for gross proceeds of $576,396. As of March 15, 2011, the Company had raised total gross proceeds of $577,396, including approximately $1,000 contributed by the principals of the Company’s investment adviser in February 2008. During the years ended December 31, 2010 and 2009, the Company sold 31,320,067 and 10,105,293 shares for gross proceeds of $324,420 and $93,464 at an average price per share of $10.31 and $9.25, respectively. The gross proceeds received during the years ended December 31, 2010 and 2009 include reinvested stockholder distributions of $8,252 and $490, respectively. During the period from January 1, 2011 to March 15, 2011, the Company sold 14,932,150 shares of common stock for gross proceeds of $158,512 at an average price per share of $10.62.
The proceeds from the issuance of common stock as presented on the Company’s consolidated statements of changes in net assets and consolidated statements of cash flows are presented net of selling commissions of $30,252 and $8,187 for the years ended December 31, 2010 and 2009, respectively.
Note 2. Summary of Significant Accounting Policies
Basis of Presentation: The accompanying audited financial statements of the Company have been prepared in accordance with U.S. generally accepted accounting principles. The Company has evaluated the impact of subsequent events through the date the financial statements were issued and filed with the Securities and Exchange Commission, or the SEC.
Use of Estimates: The preparation of the financial statements in conformity with U.S. generally accepted accounting principles requires management to make estimates and assumptions that affect the reported amounts of assets and liabilities, and disclosure of contingent assets and liabilities at the date of the financial statements and the reported amounts of revenues and expenses during the reporting period. Actual results could differ from those estimates. Many of the amounts have been rounded, and all amounts are in thousands, except share and per share information.
Cash and Cash Equivalents: The Company considers all highly liquid investments with original maturities of three months or less to be cash equivalents. All cash balances are maintained with high credit quality financial institutions, which are members of the FDIC.
86
Table of Contents
FS Investment Corporation
Notes to Consolidated Financial Statements
(in thousands, except share and per share amounts)
Valuation of Portfolio Investments: The Company determines the net asset value of its investment portfolio each quarter. Securities that are publicly-traded are valued at the reported closing price on the valuation date. Securities that are not publicly-traded are valued at fair value as determined in good faith by the Company’s board of directors. In connection with that determination, the Company’s investment adviser, FB Income Advisor, LLC or FB Advisor, prepares portfolio company valuations using relevant inputs, including, but not limited to, indicative dealer quotes, values of like securities, recent portfolio company financial statements and forecasts, and valuations prepared by third-party valuation services.
Accounting Standards Codification Topic 820, Fair Value Measurements and Disclosure, or ASC Topic 820, issued by the Financial Accounting Standards Board, or FASB, clarifies the definition of fair value and requires companies to expand their disclosure about the use of fair value to measure assets and liabilities in interim and annual periods subsequent to initial recognition. ASC Topic 820 defines fair value as the price that would be received from the sale of an asset or paid to transfer a liability in an orderly transaction between market participants at the measurement date. ASC Topic 820 also establishes a three-tier fair value hierarchy, which prioritizes the inputs used in measuring fair value. These tiers include: Level 1, defined as observable inputs such as quoted prices in active markets; Level 2, which includes inputs such as quoted prices for similar securities in active markets and quoted prices for identical securities where there is little or no activity in the market; and Level 3, defined as unobservable inputs for which little or no market data exists, therefore requiring an entity to develop its own assumptions.
With respect to investments for which market quotations are not readily available, the Company has undertaken a multi-step valuation process each quarter, as described below:
| • | the quarterly valuation process begins with each portfolio company or investment being initially valued by FB Advisor’s management team, with such valuation potentially taking into account information received from the Company’s sub-adviser or an independent valuation firm, if applicable; |
| • | preliminary valuation conclusions are then documented and discussed with the Company’s valuation committee; |
| • | the valuation committee reviews the preliminary valuation and FB Advisor’s management team, together with the Company’s independent valuation firm, if applicable, responds and supplements the preliminary valuation to reflect any comments provided by the valuation committee; and |
| • | the Company’s board of directors discusses valuations and determines the fair value of each investment in the Company’s portfolio in good faith based on various statistical and other factors, including the input and recommendation of FB Advisor, the valuation committee and any third-party valuation firm, if applicable. |
Determination of fair value involves subjective judgments and estimates. Accordingly, these notes to the Company’s financial statements refer to the uncertainty with respect to the possible effect of such valuations, and any change in such valuations on the Company’s financial statements. Below is a description of factors that the board of directors may consider when valuing the Company’s debt and equity investments.
Valuation of fixed income investments, such as loans and debt securities, depends upon a number of factors, including prevailing interest rates for like securities, expected volatility in future interest rates, call features, put features and other relevant terms of the debt. For investments without readily available market prices, the Company will incorporate these factors into discounted cash flow models to arrive at fair value. Other factors that the Company’s board of directors may consider include the borrower’s ability to adequately service its debt,
87
Table of Contents
FS Investment Corporation
Notes to Consolidated Financial Statements
(in thousands, except share and per share amounts)
the fair market value of the portfolio company in relation to the face amount of its outstanding debt and the quality of collateral securing the Company’s debt investments.
Equity interests in portfolio companies for which there is no liquid public market are valued at fair value. The Company’s board of directors, in its analysis of fair value, may consider various factors, such as multiples of earnings before interest, taxes, depreciation and amortization, or EBITDA, cash flows, net income, revenues or, in limited instances, book value or liquidation value. All of these factors may be subject to adjustments based upon the particular circumstances of a portfolio company or the Company’s actual investment position. For example, adjustments to EBITDA may take into account compensation to previous owners or acquisition, recapitalization, restructuring or other related items.
The Company’s board of directors may also look to private merger and acquisition statistics, public trading multiples discounted for illiquidity and other factors, valuations implied by third-party investments in the portfolio companies or industry practices in determining fair value. The Company’s board of directors may also consider the size and scope of a portfolio company and its specific strengths and weaknesses, as well as any other factors it deems relevant in assessing the value. Generally, the value of the Company’s equity interests in public companies for which market quotations are readily available is based upon the most recent closing public market price. Portfolio securities that carry certain restrictions on sale are typically valued at a discount from the public market value of the security.
The fair values of the Company’s investments are determined in good faith by its board of directors. The Company’s board of directors is solely responsible for the valuation of the Company’s portfolio investments at fair value as determined in good faith pursuant to the Company’s valuation policy and consistently applied valuation process. The Company’s investments as of December 31, 2010 consisted primarily of debt securities that are traded on a private over-the-counter market for institutional investors. The Company valued its collateralized loan and debt obligations and its mezzanine debt investments by obtaining bid and ask prices from independent dealers. The Company valued all of its other investments, including its senior secured bond investments, by using an independent third-party pricing service, which provided prevailing bid and ask prices that were screened for validity by the service from dealers on the date of the relevant period end. The Company’s investments as of December 31, 2009 consisted entirely of debt securities that are traded on a private over-the-counter market for institutional investors. The Company valued one of its second lien investments and one of its mezzanine debt investments by obtaining bid and ask prices from independent dealers. The Company valued all of its other investments by using an independent third-party pricing service, which provided prevailing bid and ask prices that were screened for validity by the service from dealers on the date of the relevant period end. The Company periodically benchmarks the bid and ask prices received from the service against the actual prices at which the Company purchases and sells its investments. Based on the results of the benchmark analysis and the Company’s experience in purchasing and selling these investments, the Company believes that these prices are reliable indicators of fair value. However, because of the private nature of this marketplace (meaning actual transactions are not publicly reported), the Company believes that these valuation inputs are classified as Level 3 within the fair value hierarchy. The Company may also use other methods to determine fair value for securities for which the Company cannot obtain prevailing bid and ask prices through its third-party pricing service. The Company’s valuation committee and board of directors reviewed and approved the valuation determinations made with respect to these investments in a manner consistent with the Company’s valuation process.
Revenue Recognition: Security transactions are accounted for on the trade date. The Company records interest income on an accrual basis to the extent that it expects to collect such amounts. The Company does not
88
Table of Contents
FS Investment Corporation
Notes to Consolidated Financial Statements
(in thousands, except share and per share amounts)
accrue as a receivable interest or dividends on loans and securities if it has reason to doubt the ability to collect such income. Loan origination fees, original issue discount, and market discount are capitalized and such amounts are amortized as interest income over the respective term of the loan. Upon the prepayment of a loan or security, any unamortized loan origination fees are recorded as interest income. The Company records prepayment premiums on loans and securities as interest income when it receives such amounts.
Net Realized Gains or Losses and Net Change in Unrealized Appreciation or Depreciation and Net Change in Unrealized Gains or Losses on Foreign Currency: Gains or losses on the sale of investments are calculated by using the specific identification method. The Company measures realized gains or losses by the difference between the net proceeds from the repayment or sale and the amortized cost basis of the investment, without regard to unrealized appreciation or depreciation previously recognized, but considering unamortized upfront fees. Net change in unrealized appreciation or depreciation reflects the change in portfolio investment values during the reporting period, including any reversal of previously recorded unrealized gains or losses when gains or losses are realized. Net change in unrealized gains or losses on foreign currency reflects the change in portfolio investment values during the reporting period due to the impact of foreign currency fluctuations.
Capital Gains Incentive Fee: Pursuant to the terms of the investment advisory and administrative services agreement the Company entered into with FB Advisor, the incentive fee on capital gains earned on liquidated investments of the Company’s portfolio during operations prior to a liquidation of the Company will be determined and payable in arrears as of the end of each calendar year. Such fee will equal 20.0% of the Company’s incentive fee capital gains (i.e., the Company’s realized capital gains on a cumulative basis from inception, calculated as of the end of each calendar year, net of all realized capital losses and unrealized capital depreciation on a cumulative basis), less the aggregate amount of any previously paid capital gains incentive fees. On a quarterly basis, the Company accrues for the capital gains incentive fee by calculating such fee as if it were due and payable as of the end of such period.
While the investment advisory and administrative services agreement with FB Advisor neither includes nor contemplates the inclusion of unrealized gains in the calculation of the capital gains incentive fee, pursuant to an interpretation of an American Institute for Certified Public Accountants, or AICPA, Technical Practice Aid for investment companies, commencing during the quarter ended December 31, 2010, the Company has changed its methodology for accruing for this incentive fee to include unrealized gains in the calculation of the capital gains incentive fee expense and related capital gains incentive fee payable. This accrual reflects the incentive fees that would be payable to FB Advisor as if the Company’s entire portfolio was liquidated at its fair value as of the balance sheet date even though FB Advisor is not entitled to an incentive fee with respect to unrealized gains unless and until such gains are actually realized. During the year ended December 31, 2010, the Company accrued a capital gains incentive fee of $5,459 based on the performance of its portfolio, of which only $1,396 was based on realized gains and is payable to FB Advisor.
Organization Costs: Organization costs include, among other things, the cost of incorporation including the cost of legal services pertaining to the organization and incorporation of the business and incorporation fees. These costs are expensed as incurred and are included in other general and administrative expenses. For the year ended December 31, 2008, the Company incurred organization costs of $605, which were paid on behalf of the Company by an affiliate and have been recorded as a capital contribution (Note 4). There were no organization costs for the years ended December 31, 2010 and 2009.
Offering Costs: The Company’s offering costs include, among other things, legal fees and other costs pertaining to the preparation of the Company’s Registration Statement on Form N-2 pertaining to the public offering of its shares of common stock, or the Registration Statement. The Company has charged offering costs
89
Table of Contents
FS Investment Corporation
Notes to Consolidated Financial Statements
(in thousands, except share and per share amounts)
against capital in excess of par on the balance sheet. During the years ended December 31, 2010, 2009 and 2008, the Company had offering costs of $1,671, $387 and $1,310, respectively, of which $1,125, $387 and $1,310, respectively, were paid on behalf of the Company by an affiliate and have been recorded as a contribution to capital (Note 4).
Income Taxes: The Company has elected to be treated for federal income tax purposes as a RIC under Subchapter M of the Code. To maintain qualification as a RIC, the Company must, among other things, meet certain source-of-income and asset diversification requirements and distribute to its stockholders, for each taxable year, at least 90% of its “investment company taxable income,” which is generally net ordinary income plus the excess, if any, of realized net short-term capital gains over realized net long-term capital losses. As a RIC, the Company will not have to pay corporate-level federal income taxes on any income that it distributes to its stockholders. The Company intends to make sufficient distributions to its stockholders to maintain its RIC status each year and to not pay any federal income taxes on income so distributed. The Company is also subject to nondeductible federal excise taxes if it does not distribute at least 98% of net ordinary income, 98.2% of any capital gain net income, if any, and any recognized and undistributed income from prior years for which it paid no federal income taxes.
Uncertainty in Income Taxes: The Company evaluates its tax positions to determine if the tax positions taken meet the minimum recognition threshold in connection with accounting for uncertainties in income tax positions taken or expected to be taken for the purposes of measuring and recognizing tax liabilities in the financial statements. Recognition of a tax benefit or liability with respect to an uncertain tax position is required only when the position is “more likely than not” to be sustained assuming examination by taxing authorities. The Company recognizes interest and penalties, if any, related to unrecognized tax liabilities as income tax expense in the Statements of Operations. During the years ended December 31, 2010, 2009 and 2008, the Company did not incur any interest or penalties.
The Company has analyzed the tax positions taken on federal and state income tax returns for all open tax years, and has concluded that no provision for income tax is required in the Company’s financial statements. The Company’s federal and state income and federal excise tax returns for tax years for which the applicable statutes of limitations have not expired are subject to examination by the Internal Revenue Service and state departments of revenue.
Distributions: Distributions to stockholders are recorded as of the record date. The amount of distributions was determined by the Company’s board of directors on a monthly basis. Net realized capital gains, if any, are distributed or deemed distributed at least annually.
Reclassifications: Certain amounts in the consolidated financial statements for the year ended December 31, 2009 have been reclassified to conform to the classifications used to prepare the consolidated financial statements for the year ended December 31, 2010. These reclassifications had no material impact on the Company’s consolidated financial position, results of operations or cash flows as previously reported.
Note 3. Recently Issued Accounting Standards
In January 2010, the FASB issued Accounting Standards Update No. 2010-06, which provides additional guidance to improve disclosures regarding fair value measurements. This guidance requires two new disclosures: (1) transfers in and out of Level 1 and 2 measurements and the reasons for the transfers and (2) a gross presentation of activity within the Level 3 roll forward. The guidance also includes clarifications to existing
90
Table of Contents
FS Investment Corporation
Notes to Consolidated Financial Statements
(in thousands, except share and per share amounts)
disclosure requirements on the level of disaggregation and disclosures regarding inputs and valuation techniques. The guidance applies to all entities required to make disclosures about recurring and nonrecurring fair value measurements. The effective date of this guidance is the first interim or annual reporting period beginning after December 15, 2009, except for the gross presentation of the Level 3 roll forward information, which is required for annual reporting periods beginning after December 15, 2010 and for interim reporting periods within those years. Except for the gross presentation of Level 3 roll forward information, the Company adopted this guidance during 2010, and such adoption did not have a significant impact on the Company’s consolidated financial statements or disclosures. The Company is currently evaluating the impact that the gross presentation of Level 3 roll forward information will have on its consolidated financial statement disclosures when adopted. See “Note 7. Fair Value of Financial Instruments” for a discussion of the three-level fair value hierarchy employed by the Company under existing accounting guidance.
Note 4. Related Party Transactions
The Company has entered into an investment advisory and administrative services agreement with FB Advisor. Pursuant to the investment advisory and administrative services agreement, FB Advisor is entitled to an annual base management fee of 2.0% of the average value of the Company’s gross assets and an incentive fee based on the Company’s performance. The incentive fee consists of three parts. The first part, which is referred to as the subordinated incentive fee on income, is calculated and payable quarterly in arrears and equals 20.0% of “pre-incentive fee net investment income” for the immediately preceding quarter and is subordinated to a preferred return on adjusted capital, as defined in the Company’s investment advisory and administrative services agreement, equal to 2.0% per quarter, or an annualized rate of 8.0%. The second part of the incentive fee, which is referred to as the incentive fee on capital gains during operations, is an incentive fee on capital gains earned on liquidated investments from the Company’s portfolio during operations prior to a liquidation of the Company and is determined and payable in arrears as of the end of each calendar year (or upon termination of the investment advisory and administrative services agreement). This fee equals 20.0% of the Company’s incentive fee capital gains, which equals the Company’s realized capital gains on a cumulative basis from inception, calculated as of the end of each calendar year, computed net of all realized capital losses and unrealized capital depreciation on a cumulative basis, less the aggregate amount of any previously paid capital gain incentive fees. The third part of the incentive fee, which is referred to as the subordinated liquidation incentive fee, equals 20.0% of the net proceeds from a liquidation of the Company in excess of adjusted capital, as calculated immediately prior to liquidation.
The Company commenced accruing fees under the investment advisory and administrative services agreement on January 2, 2009, upon the commencement of the Company’s operations. During the years ended December 31, 2010 and 2009, FB Advisor earned $7,900 and $829, respectively, in base management fees. Management fees are paid on a quarterly basis in arrears. The Company paid $5,039 and $392, respectively, of these fees during the years ended December 31, 2010 and 2009.
The Company accrues for the capital gains incentive fee, which, if earned, is paid annually. The Company accrues the incentive fee based on net realized and unrealized gains; however, under the terms of the investment advisory and administrative services agreement, the fee payable to FB Advisor is based on realized gains and no such fee is payable with respect to unrealized gains unless and until such gains are actually realized. During the year ended December 31, 2010, the Company accrued a capital gains incentive fee of $5,459 based on the performance of the Company’s portfolio, of which only $1,396 was based on realized gains and is payable to FB Advisor. During the year ended December 31, 2010, the Company paid FB Advisor $173 in capital gains incentive fees earned during the year ended December 31, 2009.
91
Table of Contents
FS Investment Corporation
Notes to Consolidated Financial Statements
(in thousands, except share and per share amounts)
The Company also reimburses FB Advisor for expenses necessary for its performance of services related to administering and operating the Company, provided that such reimbursement shall be the lower of FB Advisor’s actual costs or the amount that the Company would be required to pay for comparable services in the same geographic location, and provided further that such costs will be reasonably allocated to the Company on the basis of assets, revenues, time records or other reasonable methods. During the years ended December 31, 2010 and 2009, the Company incurred administrative services charges of $924 and $261, respectively, attributable to FB Advisor. Of these charges, $908 and $257, respectively, related to the allocation of costs of administrative personnel for services provided to the Company by employees of FB Advisor and the remainder related to other reimbursable expenses. The Company paid FB Advisor $710 and $165, respectively, for the services incurred under this arrangement during the years ended December 31, 2010 and 2009.
Franklin Square Holdings, L.P., or Franklin Square Holdings, the Company’s sponsor and an affiliate of FB Advisor, funded offering costs and other expenses in the amount of $1,125, $404 and $1,914 for the years ended December 31, 2010, 2009 and 2008, respectively. These costs have been recorded by the Company as a contribution to capital. The offering costs were offset against capital in excess of par on the financial statements and the other expenses were charged to expense as incurred by the Company. The Company incurred organization costs of $605 during the year ended December 31, 2008. No such costs were incurred during the years ended December 31, 2010 and 2009.
The dealer manager for the Company’s public offering is FS2 Capital Partners, LLC, or FS2, which is one of the Company’s affiliates. During the years ended December 31, 2010, and 2009, FS2 retained $5,435 and $1,295, respectively, for selling commissions and dealer manager fees in connection with the sale of the Company’s common stock.
Under the terms of the investment advisory and administrative services agreement, when the Company’s Registration Statement was declared effective by the SEC and the Company was successful in raising gross proceeds from unrelated outside investors of at least $2.5 million, or the minimum offering requirement, FB Advisor became entitled to receive 1.5% of gross proceeds raised until all offering costs and organization costs funded by FB Advisor or its affiliates (including Franklin Square Holdings) have been recovered. On January 2, 2009, the Company exceeded the minimum offering requirement. The Company paid total reimbursements of $1,678 and $1,418, respectively, to FB Advisor and its affiliates during the years ended December 31, 2010 and 2009, respectively. As of December 31, 2010, $641 is payable to FB Advisor and its affiliates under this arrangement. The reimbursements are recorded as a reduction of capital.
Members of FB Advisor’s senior management team provide investment advisory services to both the Company and FB Capital Partners, L.P. FB Capital Partners, L.P., which is owned by Mr. Forman, the Company’s chief executive officer, was organized for the purpose of sourcing and managing income-oriented investments for institutions and high net worth individuals. While neither FB Capital Partners, L.P. nor FB Advisor is making private corporate debt investments for clients other than the Company currently, FB Advisor intends to allocate investment opportunities in a fair and equitable manner consistent with the Company’s investment objectives and strategies, if necessary, so that the Company will not be disadvantaged in relation to any other client of FB Advisor or its management team.
Beginning on February 26, 2009, Franklin Square Holdings agreed to reimburse the Company for expenses in an amount that is sufficient to ensure that, for tax purposes, the Company’s net investment income and net capital gains are equal to or greater than the cumulative distributions paid to the Company’s stockholders in each quarter. This arrangement is designed to ensure that no portion of the Company’s distributions will represent a
92
Table of Contents
FS Investment Corporation
Notes to Consolidated Financial Statements
(in thousands, except share and per share amounts)
return of capital for the Company’s stockholders. Franklin Square Holdings has no obligation to reimburse any portion of the Company’s expenses. The specific amount of expenses reimbursed by Franklin Square Holdings, if any, will be determined at the end of each quarter. During the year ended December 31, 2010, the Company received no reimbursements from Franklin Square Holdings. During the year ended December 31, 2009, the reimbursements from Franklin Square Holdings totaled $240. The Company does not expect that conditions will require Franklin Square Holdings to provide reimbursements in the future. To the extent reimbursements may be needed in the future, there can be no assurance that Franklin Square Holdings will provide any such reimbursements. Franklin Square Holdings is controlled by the Company’s chief executive officer, Michael Forman, and its director, David Adelman.
Note 5. Distributions
The following table reflects the cash distributions per share that the Company has declared and paid on its common stock during the years ended December 31, 2008, 2009 and 2010:
| Distribution | ||||||||
| For the Year Ended |
Per Share(1)(2)(3) | Amount | ||||||
| 2008 |
$ | 0.1835 | $ | 25 | ||||
| 2009 |
0.6717 | 3,134 | ||||||
| 2010 |
0.8728 | 21,389 | ||||||
| (1) | The amount of each per share distribution has been retroactively adjusted to reflect the stock distributions declared throughout 2009 and 2010 as discussed below. |
| (2) | In addition to regular semi-monthly cash distributions during such period, cash distributions declared and paid on the Company’s common stock during the year ended December 31, 2010 include approximately $3,851, or approximately $0.12 per share, in special cash distributions. |
| (3) | On October 13, 2010, the Company’s board of directors determined to increase the amount of semi-monthly distributions payable to stockholders of record from $0.03125 per share to $0.03185 per share, effective October 1, 2010. On October 29, 2010, the Company’s board of directors determined to increase the amount of semi-monthly distributions payable to stockholders of record from $0.03185 per share to $0.032156 per share, effective November 1, 2010. |
On January 13, 2011, the Company’s board of directors declared two regular semi-monthly cash distributions of $0.032156 per share each, which were paid on January 31, 2011 to stockholders of record on January 14, 2011 and January 28, 2011, respectively. On February 14, 2011, the Company’s board of directors declared two regular semi-monthly cash distributions of $0.032156 per share each, which were paid on February 28, 2011 to stockholders of record on February 14, 2011 and February 25, 2011, respectively. On March 14, 2011, the Company’s board of directors declared two regular semi-monthly cash distributions of $0.032156 per share each, which will be paid on March 31, 2011 to stockholders of record on March 14, 2011 and March 30, 2011, respectively. The timing and amount of any future distributions to stockholders are subject to applicable legal restrictions and the sole discretion of the Company’s board of directors.
The Company has adopted an “opt in” distribution reinvestment plan for its stockholders. As a result, if the Company makes a distribution, its stockholders will receive distributions in cash unless they specifically “opt in” to the distribution reinvestment plan so as to have their cash distributions reinvested in additional shares of the Company’s common stock.
93
Table of Contents
FS Investment Corporation
Notes to Consolidated Financial Statements
(in thousands, except share and per share amounts)
The Company may fund its cash distributions to stockholders from any sources of funds available to it, including offering proceeds, borrowings, net investment income from operations, capital gains proceeds from the sale of assets, non-capital gains proceeds from the sale of assets and expense reimbursements from Franklin Square Holdings. The following table reflects, for tax purposes, the sources of the cash distributions that the Company has paid on its common stock during the years ended December 31, 2010, 2009 and 2008:
| Year ended December 31, | ||||||||||||||||||||||||
| 2010 | 2009 | 2008 | ||||||||||||||||||||||
| Source of Distribution |
Distribution Amount |
Percentage | Distribution Amount |
Percentage | Distribution Amount |
Percentage | ||||||||||||||||||
| Offering proceeds |
$ | — | — | $ | — | — | $ | — | — | |||||||||||||||
| Borrowings |
— | — | — | — | — | — | ||||||||||||||||||
| Net investment income(1) |
13,545 | 63 | % | 1,917 | 61 | % | 25 | 100 | % | |||||||||||||||
| Capital gains proceeds from the sale of assets |
7,844 | 37 | % | 977 | 31 | % | — | — | ||||||||||||||||
| Non-capital gains proceeds from the sale of assets |
— | — | — | — | — | — | ||||||||||||||||||
| Expense reimbursement from sponsor |
— | — | 240 | 8 | % | — | — | |||||||||||||||||
| Total |
$ | 21,389 | 100 | % | $ | 3,134 | 100 | % | $ | 25 | 100 | % | ||||||||||||
| (1) | During the years ended December 31, 2010 and 2009, 84% and 57%, respectively, of the Company’s gross investment income was attributable to cash interest earned and 16% and 43%, respectively, was attributable to non-cash accretion of discount and PIK interest. |
The aggregate cost of the Company’s investments for federal income tax purposes totaled $715,695 and $92,366 as of December 31, 2010 and 2009, respectively. The aggregate net unrealized appreciation on a tax basis was $17,885 and $8,226 as of December 31, 2010 and 2009, respectively. The Company’s net investment income on a tax basis for the years ended December 31, 2010 and 2009 was $13,545 and $2,157, respectively. The Company distributed all of its net investment income earned as of December 31, 2010 and 2009.
The difference between the Company’s GAAP-basis net investment income and its tax-basis net investment income is due to the tax-basis amortization of organization and start-up costs incurred prior to the commencement of the Company’s operations, interest income earned on a tax basis due to the required accretion of discount on a non-performing loan, and the required accrual for GAAP purposes of incentive fees on unrealized gains even though no such incentive fees on unrealized gains are payable by the Company. See “Note 2. Summary of Significant Accounting Policies—Capital Gains Incentive Fee.” The following table sets forth a reconciliation between GAAP-basis net investment income and tax-basis net investment income during the years ended December 31, 2010 and 2009:
| Year ended December 31, | ||||||||
| 2010 | 2009 | |||||||
| GAAP basis net investment income |
$ | 9,392 | $ | 2,151 | ||||
| Amortization of organizational costs |
(43 | ) | (43 | ) | ||||
| Tax accretion of discount on investment |
133 | 49 | ||||||
| Reversal of incentive fee accrual on unrealized gains |
4,063 | — | ||||||
| Tax basis net investment income |
$ | 13,545 | $ | 2,157 | ||||
94
Table of Contents
FS Investment Corporation
Notes to Consolidated Financial Statements
(in thousands, except share and per share amounts)
The determination of the tax attributes of the Company’s distributions is made annually as of the end of the Company’s fiscal year based upon the Company’s taxable income for the full year and distributions paid for the full year. Therefore, a determination made on a quarterly basis may not be representative of the actual tax attributes of the Company’s distributions for a full year. The actual tax characteristics of distributions to stockholders are reported to stockholders annually on a Form 1099-DIV.
The following table reflects the stock distributions per share that the Company declared on its common stock to date:
| Date Declared |
Record Date | Payment Date | Distribution Percentage |
Shares Issued |
||||||||||||
| Fiscal 2009 |
||||||||||||||||
| March 31, 2009 |
March 31, 2009 | March 31, 2009 | 1.4 | % | 13,818 | |||||||||||
| April 30, 2009 |
April 30, 2009 | April 30, 2009 | 3.0 | % | 42,661 | |||||||||||
| May 29, 2009 |
May 29, 2009 | May 29, 2009 | 3.7 | % | 79,125 | |||||||||||
| June 30, 2009 |
June 30, 2009 | June 30, 2009 | 3.5 | % | 96,976 | |||||||||||
| July 30, 2009 |
July 31, 2009 | July 31, 2009 | 3.1 | % | 117,219 | |||||||||||
| August 31, 2009 |
August 31, 2009 | August 31, 2009 | 3.0 | % | 148,072 | |||||||||||
| December 31, 2009 |
December 31, 2009 | December 31, 2009 | 0.5 | % | 49,710 | |||||||||||
| Fiscal 2010 |
||||||||||||||||
| January 28, 2010 |
January 31, 2010 | January 31, 2010 | 2.5 | % | 283,068 | |||||||||||
The purpose of these special distributions was to maintain a net asset value per share that was below the then-current net offering price, as required by the 1940 Act, subject to certain limited exceptions. The Company’s board of directors determined that its portfolio performance sufficiently warranted taking these actions.
The stock distributions increased the number of shares outstanding, thereby reducing the Company’s net asset value per share. However, because the stock distributions were issued to all stockholders in proportion to their current holdings, the reduction in net asset value per share as a result of the stock distributions was offset exactly by the increase in the number of shares owned by each investor. As overall value to an investor was not reduced as a result of the special stock distributions, the Company’s board of directors determined that these issuances would not be dilutive to existing stockholders. As the stock distributions did not change any stockholder’s proportionate interest in the Company, they are not expected to represent taxable distributions. Specific tax characteristics of all distributions are reported to stockholders annually on Form 1099-DIV.
As of December 31, 2010 and 2009, the components of accumulated earnings on a tax basis were as follows:
| As of December 31, | ||||||||
| 2010 | 2009 | |||||||
| Distributable ordinary income |
$ | 1,290 | $ | 53 | ||||
| Incentive fee accrual on unrealized gains |
(4,063 | ) | — | |||||
| Unamortized organizational costs |
(558 | ) | (600 | ) | ||||
| Unrealized appreciation on investments(1) |
17,885 | 8,226 | ||||||
| $ | 14,554 | $ | 7,679 | |||||
| (1) | As of December 31, 2010 and 2009, the gross unrealized appreciation on the Company’s investments was $20,136 and $8,390, respectively. As of December 31, 2010 and 2009, the gross unrealized depreciation on the Company’s investments was $2,251 and $164, respectively. |
95
Table of Contents
FS Investment Corporation
Notes to Consolidated Financial Statements
(in thousands, except share and per share amounts)
Note 6. Investment Portfolio
The following table summarizes the composition of the Company’s investment portfolio at cost and fair value as of December 31, 2010 and 2009:
| Year Ended December 31, | ||||||||||||||||||||||||
| 2010 | 2009 | |||||||||||||||||||||||
| Cost (1) | Fair Value | Percentage of Portfolio |
Cost(1) | Fair Value | Percentage of Portfolio |
|||||||||||||||||||
| Senior Secured Loans—First Lien |
$ | 473,881 | $ | 484,105 | 66 | % | $ | 41,835 | $ | 45,780 | 46 | % | ||||||||||||
| Senior Secured Loans—Second Lien |
131,960 | 135,962 | 19 | % | 41,351 | 45,521 | 45 | % | ||||||||||||||||
| Senior Secured Bonds |
30,265 | 31,659 | 4 | % | — | — | 0 | % | ||||||||||||||||
| Mezzanine Debt/Other |
79,408 | 81,854 | 11 | % | 9,131 | 9,291 | 9 | % | ||||||||||||||||
| $ | 715,514 | $ | 733,580 | 100 | % | $ | 92,317 | $ | 100,592 | 100 | % | |||||||||||||
| (1) | Cost represents the original cost adjusted for the accretion of discounts on debt investments. |
The Company does not “control” and is not an “affiliate” of any of its portfolio companies, each as defined in the 1940 Act. In general, under the 1940 Act, the Company would be presumed to “control” a portfolio company if it owned 25% or more of its voting securities and would be an “affiliate” of a portfolio company if it owned 5% or more of its voting securities.
The Company’s investment portfolio may contain loans that are in the form of lines of credit or revolving credit facilities, which require the Company to provide funding when requested by portfolio companies in accordance with the terms of the underlying loan agreements. As of December 31, 2010, the Company had three such investments, all of which have been fully funded.
The table below describes investments by industry classification and enumerates the percentage, by fair value, of the total portfolio assets in such industries as of December 31, 2010 and 2009:
| Year Ended December 31, | ||||||||||||||||
| 2010 | 2009 | |||||||||||||||
| Industry Classification |
Fair Value | Percentage of Portfolio |
Fair Value | Percentage of Portfolio |
||||||||||||
| Consumer Discretionary |
$ | 129,749 | 17.6 | % | $ | 10,739 | 44.3 | % | ||||||||
| Consumer Staples |
56,184 | 7.7 | % | 4,615 | 48.6 | % | ||||||||||
| Energy |
69,048 | 9.4 | % | 9,388 | 53.0 | % | ||||||||||
| Financials |
59,431 | 8.1 | % | 6,876 | 57.3 | % | ||||||||||
| Healthcare |
63,460 | 8.7 | % | 3,927 | 61.7 | % | ||||||||||
| Industrials |
96,762 | 13.2 | % | 10,943 | 66.0 | % | ||||||||||
| Information Technology |
117,499 | 16.0 | % | 32,030 | 70.4 | % | ||||||||||
| Materials |
46,832 | 6.4 | % | 5,762 | 74.7 | % | ||||||||||
| Telecommunication Services |
81,675 | 11.1 | % | 12,671 | 79.1 | % | ||||||||||
| Utilities |
12,940 | 1.8 | % | 3,641 | 83.4 | % | ||||||||||
| Total |
$ | 733,580 | 100.0 | % | $ | 100,593 | 87.8 | % | ||||||||
96
Table of Contents
FS Investment Corporation
Notes to Consolidated Financial Statements
(in thousands, except share and per share amounts)
Note 7. Fair Value of Financial Instruments
Under existing accounting guidance, fair value is defined as the price that the Company would receive upon selling an investment or pay to transfer a liability in an orderly transaction to a market participant in the principal or most advantageous market for the investment. This accounting guidance emphasizes that valuation techniques maximize the use of observable market inputs and minimize the use of unobservable inputs. Inputs refer broadly to the assumptions that market participants would use in pricing an asset or liability, including assumptions about risk. Inputs may be observable or unobservable. Observable inputs are inputs that reflect the assumptions market participants would use in pricing an asset or liability developed based on market data obtained from sources independent of the Company. Unobservable inputs are inputs that reflect the assumptions market participants would use in pricing an asset or liability developed based on the best information available in the circumstances. The Company classifies the inputs used to measure these fair values into the following hierarchy as defined by current accounting guidance:
Level 1: Inputs that are quoted prices (unadjusted) in active markets for identical assets or liabilities.
Level 2: Inputs that are quoted prices for similar assets or liabilities in active markets.
Level 3: Inputs that are unobservable for an asset or liability.
A financial instrument’s categorization within the valuation hierarchy is based upon the lowest level of input that is significant to the fair value measurement.
As of December 31, 2010 and 2009, the Company’s investments were categorized as follows in the fair value hierarchy:
| Year Ended December 31, | ||||||||
| Valuation Inputs |
2010 | 2009 | ||||||
| Level 1—Price quotations in active markets |
$ | — | $ | — | ||||
| Level 2—Significant other observable inputs |
— | — | ||||||
| Level 3—Significant unobservable inputs |
733,580 | 100,592 | ||||||
| $ | 733,580 | $ | 100,592 | |||||
The Company’s investments as of December 31, 2010 consisted primarily of debt securities that are traded on a private over-the-counter market for institutional investors. The Company valued its collateralized loan and debt obligations and its mezzanine debt investments by obtaining bid and ask prices from independent dealers. The Company valued all of its other investments, including its senior secured bond investments, by using an independent third-party pricing service, which provided prevailing bid and ask prices that were screened for validity by the service from dealers on the date of the relevant period end. The Company’s investments as of December 31, 2009 consisted entirely of debt securities that are traded on a private over-the-counter market for institutional investors. The Company valued one of its second lien investments and one of its mezzanine debt investments by obtaining bid and ask prices from independent dealers. The Company valued all of its other investments by using an independent third-party pricing service, which provided prevailing bid and ask prices that were screened for validity by the service from dealers on the date of the relevant period end. The Company periodically benchmarks the bid and ask prices received from the service against the actual prices at which it purchases and sells its investments. Based on the results of the benchmark analysis and the Company’s experience in purchasing and selling these investments, the Company believes that these prices are reliable indicators of fair value. However, because of the private nature of this marketplace (meaning actual transactions are not publicly reported), the Company believes that these valuation inputs are classified as Level 3 within the
97
Table of Contents
FS Investment Corporation
Notes to Consolidated Financial Statements
(in thousands, except share and per share amounts)
fair value hierarchy. The Company may also use other methods to determine fair value for securities for which it cannot obtain prevailing bid and ask prices through the third-party pricing service. The Company’s valuation committee and board of directors reviewed and approved the valuation determinations made with respect to these investments in a manner consistent with the Company’s valuation process.
The following is a reconciliation for the years ended December 31, 2010 and 2009 of investments for which significant unobservable inputs (Level 3) were used in determining fair value:
| For the Year Ended December 31, 2010 | ||||||||||||||||||||
| Senior Secured Loans - First Lien |
Senior Secured Loans - Second Lien |
Senior Secured Bonds |
Mezzanine Debt/Other |
Total | ||||||||||||||||
| Fair value at beginning of period |
$ | 45,780 | $ | 45,521 | $ | — | $ | 9,291 | $ | 100,592 | ||||||||||
| Accretion of discount |
2,933 | 1,656 | (8 | ) | 244 | 4,825 | ||||||||||||||
| Net realized gain (loss) |
4,378 | 4,788 | (890 | ) | 805 | 9,081 | ||||||||||||||
| Net change in unrealized appreciation (depreciation) |
6,279 | (167 | ) | 1,394 | 2,285 | 9,791 | ||||||||||||||
| Purchases |
555,405 | 153,442 | 55,282 | 85,113 | 849,242 | |||||||||||||||
| Paid-in-kind interest |
— | 61 | — | 42 | 103 | |||||||||||||||
| Sales and redemptions |
(130,670 | ) | (69,339 | ) | (24,119 | ) | (15,926 | ) | (240,054 | ) | ||||||||||
| Net transfers in or out of Level 3 |
— | — | — | — | — | |||||||||||||||
| Fair value at end of period |
$ | 484,105 | $ | 135,962 | $ | 31,659 | $ | 81,854 | $ | 733,580 | ||||||||||
| The amount of total gains for the period included in changes in net assets attributable to the change in unrealized gains or losses relating to investments still held at the reporting date |
$ | 4,696 | $ | (2,942 | ) | $ | 1,394 | $ | 2,150 | $ | 5,298 | |||||||||
| For the Year Ended December 31, 2009 | ||||||||||||||||||||
| Senior Secured Loans - First Lien |
Senior Secured Loans - Second Lien |
Senior Secured Bonds |
Mezzanine Debt/Other |
Total | ||||||||||||||||
| Fair value at beginning of period |
$ | — | $ | — | $ | — | $ | — | $ | — | ||||||||||
| Accretion of discount |
963 | 793 | — | 6 | 1,762 | |||||||||||||||
| Net realized gain |
694 | — | — | 107 | 801 | |||||||||||||||
| Net change in unrealized appreciation |
3,945 | 4,170 | — | 160 | 8,275 | |||||||||||||||
| Purchases |
52,302 | 40,542 | — | 11,904 | 104,748 | |||||||||||||||
| Paid-in-kind interest |
1 | 16 | 116 | 133 | ||||||||||||||||
| Sales and redemptions |
(12,125 | ) | — | — | (3,002 | ) | (15,127 | ) | ||||||||||||
| Net transfers in or out of Level 3 |
— | — | — | — | — | |||||||||||||||
| Fair value at end of period |
$ | 45,780 | $ | 45,521 | $ | — | $ | 9,291 | $ | 100,592 | ||||||||||
| The amount of total gains for the period included in changes in net assets attributable to the change in unrealized gains or losses relating to investments still held at the reporting date |
$ | 3,945 | $ | 4,170 | $ | — | $ | 160 | $ | 8,275 | ||||||||||
98
Table of Contents
FS Investment Corporation
Notes to Consolidated Financial Statements
(in thousands, except share and per share amounts)
Note 8. Share Repurchase Program
The Company intends to conduct quarterly tender offers pursuant to its share repurchase program. The first such tender offer commenced in March 2010 and the repurchase occurred in connection with the Company’s April 1, 2010 closing. The Company’s board of directors will consider the following factors, among others, in making its determination regarding whether to cause the Company to offer to repurchase shares and under what terms:
| • | the effect of such repurchases on the Company’s qualification as a RIC (including the consequences of any necessary asset sales); |
| • | the liquidity of its assets (including fees and costs associated with disposing of assets); |
| • | the Company’s investment plans and working capital requirements; |
| • | the relative economies of scale with respect to the Company’s size; |
| • | the Company’s history in repurchasing shares or portions thereof; and |
| • | the condition of the securities markets. |
The Company currently intends to limit the number of shares to be repurchased during any calendar year to the number of shares it can repurchase with the proceeds it receives from the sale of shares under its distribution reinvestment plan. At the discretion of the Company’s board of directors, the Company may also use cash on hand, cash available from borrowings and cash from liquidation of securities investments as of the end of the applicable period to repurchase shares. In addition, the Company will not repurchase shares in any calendar year in excess of 10% of the weighted average number of shares outstanding in the prior calendar year, or 2.5% in each quarter. The Company will offer to repurchase such shares on each date of repurchase at a price equal to 90% of the current offering price in effect on each date of repurchase. The Company’s board of directors may amend, suspend or terminate the repurchase program at any time upon 30 days’ notice. During the year ended December 31, 2010, the Company repurchased 228,950 shares at $9.36 per share for aggregate consideration totaling $2,143. On January 3, 2011, the Company repurchased 99,633 shares at $9.59 per share for aggregate consideration totaling $955.
Note 9. Revolving Credit Facility
On January 28, 2011, Broad Street and Deutsche Bank AG, New York Branch, or Deutsche Bank, entered into an amended and restated multi-lender, syndicated revolving credit facility, or the credit facility, which amended and restated the revolving credit facility Broad Street originally entered into with Deutsche Bank on March 10, 2010 and the amendments thereto, or the original credit facility. Deutsche Bank is a lender and serves as administrative agent under the credit facility.
The credit facility provides for borrowings in an aggregate amount up to $340,000. Pursuant to the terms of the credit facility, borrowings thereunder may be designated as Tranche A borrowings in an amount up to $240,000 (referred to herein as the Tranche A Commitment) or as Tranche C borrowings in an amount up to $100,000 (referred to herein as the Tranche C Commitment). The credit facility also provides for Tranche B borrowings in an amount up to $100,000 (referred to herein as the Tranche B Commitment), but there are currently no Tranche B Commitments outstanding. All Tranche A Commitments bear interest at the rate of LIBOR + 2.23% per annum and will mature and be due and payable on March 10, 2012. All Tranche C Commitments bear interest at the rate of LIBOR + 1.85% per annum and will mature and be due and payable on March 10, 2012. In connection with the amendment and restatement of the original credit facility, a $100,000
99
Table of Contents
FS Investment Corporation
Notes to Consolidated Financial Statements
(in thousands, except share and per share amounts)
Tranche B Commitment that was provided under the original credit facility by Deutsche Bank to Broad Street on an uncommitted basis was converted into a $100,000 Tranche C Commitment provided by a new lender on a committed basis.
In connection with entering into the original credit facility, and from time to time thereafter, the Company has transferred debt securities to Broad Street as a contribution to capital and retains a residual interest in the contributed debt securities through the Company’s ownership of Broad Street. The Company may contribute additional debt securities to Broad Street from time to time and Broad Street may purchase additional debt securities from various sources. Broad Street has appointed the Company to manage its portfolio of debt securities pursuant to the terms of an investment management agreement. Broad Street’s obligations to the lenders under the credit facility are secured by a first priority security interest in substantially all of the assets of Broad Street, including its portfolio of debt securities.
As of December 31, 2010, $297,201 was outstanding under the credit facility. The carrying amount of the amount outstanding under the credit facility approximates its fair value. The Company incurred costs of $1,341 in connection with obtaining and amending the credit facility, which the Company has recorded as deferred financing costs on its consolidated balance sheet and amortizes to interest expense over the life of the credit facility. As of December 31, 2010, $835 of such deferred financing costs have yet to be amortized to interest expense.
The effective interest rate under the credit facility was 2.38% on December 31, 2010. Interest is paid quarterly in arrears, and commenced August 20, 2010. The Company recorded interest expense of $3,881 for the year ended December 31, 2010, of which $506 related to the amortization of deferred financing costs. The Company paid $2,492 in interest expense for the year ended December 31, 2010. The average borrowings under the credit facility for the year ended December 31, 2010 were $170,161, with a weighted average interest rate of 2.6%.
Borrowings under the credit facility are subject to compliance with a borrowing base, pursuant to which the amount of funds advanced to Broad Street varies depending upon the types of assets in Broad Street’s portfolio. The occurrence of certain events described as “Super-Collateralization Events” in the credit agreement that governs the credit facility, or a decline in the Company’s net asset value below a specified threshold, results in a lowering of the amount of funds that will be advanced against such assets. Super-Collateralization Events include, without limitation, (i) certain key employees ceasing to be directors, principals, officers or investment managers of GSO / Blackstone Debt Funds Management LLC, or GDFM, the sub-adviser to FB Advisor; (ii) the bankruptcy or insolvency of GDFM or FB Advisor; (iii) GDFM ceasing to act as the Company’s sub-adviser or FB Advisor ceasing to act as the Company’s investment adviser; (iv) the Company ceasing to act as Broad Street’s investment manager, becoming bankrupt or insolvent, defaulting on certain material agreements or failing to maintain a net asset value at least equal to $50,000; and (v) the Company or GDFM or FB Advisor committing fraud or other illicit acts in its or their investment advisory capacities.
In connection with the credit facility, Broad Street has made certain representations and warranties and is required to comply with various covenants, reporting requirements and other customary requirements for similar facilities. In addition to customary events of default included in financing transactions, the credit facility contains the following events of default: (a) the failure to make principal payments when due or interest payments within three business days of when due, (b) borrowings under the credit facility exceeding the applicable advance rates, (c) the purchase by Broad Street of certain ineligible assets, (d) the insolvency or bankruptcy of Broad Street or the Company, (e) the Company ceases to act as investment manager of Broad Street’s assets, (f) the decline of
100
Table of Contents
FS Investment Corporation
Notes to Consolidated Financial Statements
(in thousands, except share and per share amounts)
the Company’s net asset value below $50,000 and (g) fraud or other illicit acts by the Company, FB Advisor or GDFM in its or their investment advisory capacities. During the continuation of an event of default, Broad Street must pay interest at a default rate.
Borrowings of Broad Street will be considered borrowings of the Company for purposes of complying with the asset coverage requirements under the 1940 Act applicable to business development companies.
Note 10. Broad Street Funding LLC
The financial statements of Broad Street are maintained separate from those of the Company. The assets of Broad Street are pledged as collateral supporting the amounts outstanding under the credit facility and as such are not available to pay the debts of the Company. The following is the balance sheet of Broad Street as of December 31, 2010:
| Assets |
||||
| Investments, at fair value (amortized cost—$527,964) |
$ | 540,186 | ||
| Cash |
9,534 | |||
| Receivable for investments sold and repaid |
5,162 | |||
| Interest receivable |
2,360 | |||
| Deferred financing costs |
835 | |||
| Total assets |
$ | 558,077 | ||
| Liabilities |
||||
| Payable for investments purchased |
$ | 48,947 | ||
| Credit facility payable |
297,201 | |||
| Due to FS Investment Corporation |
992 | |||
| Interest payable |
883 | |||
| Other accrued expenses |
43 | |||
| Total liabilities |
348,066 | |||
| Member’s equity |
210,011 | |||
| Total liabilities and member’s equity |
$ | 558,077 | ||
101
Table of Contents
FS Investment Corporation
Notes to Consolidated Financial Statements
(in thousands, except share and per share amounts)
Note 11. Financial Highlights
The following is a schedule of financial highlights for the years ended December 31, 2010, 2009 and 2008:
| Year Ended December 31, | ||||||||||||
| 2010 | 2009 | 2008 | ||||||||||
| Per Share Data(1): |
||||||||||||
| Net asset value, beginning of period |
$ | 9.10 | $ | 7.33 | $ | — | ||||||
| Results of operations(2) |
||||||||||||
| Net investment income |
0.40 | 0.48 | (4.72 | ) | ||||||||
| Net realized and unrealized appreciation on investments and unrealized loss on foreign currency |
0.81 | 2.09 | — | |||||||||
| Net increase (decrease) in net assets resulting from operations |
1.21 | 2.57 | (4.72 | ) | ||||||||
| Stockholder distributions(3) |
||||||||||||
| Distributions from net investment income |
(0.55 | ) | (0.46 | ) | (0.18 | ) | ||||||
| Distributions from net realized gain on investments |
(0.32 | ) | (0.21 | ) | — | |||||||
| Net decrease in net assets resulting from stockholder distributions |
(0.87 | ) | (0.67 | ) | (0.18 | ) | ||||||
| Capital share transactions |
||||||||||||
| Issuance of common stock(4) |
0.10 | 0.19 | 7.32 | |||||||||
| Repurchases of common stock(5) |
— | — | — | |||||||||
| Offering costs(2) |
(0.07 | ) | (0.09 | ) | (10.67 | ) | ||||||
| Reimbursement to investment adviser(2) |
(0.10 | ) | (0.32 | ) | — | |||||||
| Capital contributions of investment adviser(2) |
0.05 | 0.09 | 15.58 | |||||||||
| Net increase (decrease) in net assets resulting from capital share transactions |
(0.02 | ) | (0.13 | ) | 12.23 | |||||||
| Net asset value, end of period |
$ | 9.42 | $ | 9.10 | $ | 7.33 | ||||||
| Shares outstanding, end of period |
41,332,661 | 10,241,544 | 136,251 | |||||||||
| Total return(6) |
13.08 | % | 33.33 | % | 2.40 | % | ||||||
| Ratio/Supplemental Data: |
||||||||||||
| Net assets, end of period |
$ | 389,232 | $ | 93,197 | $ | 999 | ||||||
| Ratio of net investment income to average net assets(7) |
4.37 | % | 5.60 | % | (116.12 | %) | ||||||
| Ratio of operating expenses to average net assets(7) |
9.89 | % | 6.53 | % | 121.20 | % | ||||||
| Ratio of expenses reimbursed to average net assets(7) |
0.00 | % | (0.62 | %) | 0.00 | % | ||||||
| Ratio of total operating expenses to average net assets(7) |
9.89 | % | 5.91 | % | 121.20 | % | ||||||
| Portfolio turnover |
67.48 | % | 46.45 | % | 0.00 | % | ||||||
| (1) | The share information utilized to determine per share data has been retroactively adjusted to reflect the stock distributions discussed in Note 5. |
| (2) | The per share data was derived by using the weighted average shares outstanding during the period. |
| (3) | The per share data for distributions reflects the actual amount of distributions paid per share during the period. |
102
Table of Contents
FS Investment Corporation
Notes to Consolidated Financial Statements
(in thousands, except share and per share amounts)
| (4) | The issuance of common stock on a per share basis reflects the incremental net asset value changes as a result of the issuance of shares of common stock in the Company’s continuous offering. |
| (5) | The per share impact for the Company’s repurchases of common stock is a reduction to net asset value of $0.0026 per share. |
| (6) | The 2008 total return is based on an initial investment at $7.32 per share, which represents the initial offering price per share, net of commissions and discounts, after taking into account the stock distributions to stockholders described in Note 5. The Company’s net loss in 2008 did not reduce net asset value as all expenses were funded by a third-party affiliate. The 2009 total return was calculated by taking the net asset value per share as of December 31, 2009, adding the cash distributions per share which were declared during the calendar year and dividing the total by the net asset value per share on December 31, 2008. The 2010 total return was calculated by taking the net asset value per share as of December 31, 2010, adding the cash distributions per share which were declared during the calendar year and dividing the total by the net asset value per share on December 31, 2009. The total return does not consider the effect of the sales load from the sale of the Company’s common stock. |
| (7) | Average monthly net assets are used for this calculation. |
Note 12. Subsequent Events
On March 18, 2011, Arch Street, the Company’s newly-formed, wholly-owned financing subsidiary, entered into a total return swap, or TRS, for senior secured floating rate loans with Citibank, N.A., or Citibank.
The obligations of Arch Street under the TRS are non-recourse to the Company and the Company’s exposure under the TRS is limited to the value of the Company’s investment in Arch Street, which generally will equal the value of cash collateral provided by Arch Street under the TRS. Pursuant to the terms of the TRS, Arch Street may select a portfolio of loans with a maximum market value of $200,000. Arch Street is required to initially cash collateralize a specified percentage of each loan (generally between 20% and 25% of the market value of such loan) included under the TRS in accordance with margin requirements described in the agreements governing the TRS.
A TRS is a commonly used form of financing arrangement that provides economic exposure similar to the exposure under Broad Street’s credit facility. Because of the unique structure of a TRS, a TRS often offers lower financing costs than are offered through more traditional borrowing arrangements.
Generally, pursuant to a TRS, one party agrees to make periodic payments to another party based on the change in the market value of the assets underlying the TRS, which may include a specified security, basket of securities or securities indices during the specified period, in return for periodic payments based on a fixed or variable interest rate. A TRS is typically used to obtain exposure to a security or market without owning or taking physical custody of such security or investing directly in such market. A TRS may effectively add leverage to the Company’s portfolio because, in addition to the Company’s total net assets, the Company would be subject to investment exposure on the amount of securities subject to the TRS.
The TRS with Citibank enables the Company, through its ownership of Arch Street, to obtain the economic benefit of owning the loans subject to the TRS, without actually owning them, in return for an interest-type payment to Citibank. As such, the TRS is analogous to Arch Street borrowing funds to acquire loans and incurring interest expense to a lender.
103
Table of Contents
FS Investment Corporation
Notes to Consolidated Financial Statements
(in thousands, except share and per share amounts)
Pursuant to the terms of an investment management agreement that the Company has entered into with Arch Street, the Company acts as the manager of the rights and obligations of Arch Street under the TRS, including selecting the specific loans to be included in the portfolio of loans subject to the TRS. The terms of the TRS are governed by a set of agreements between Arch Street and Citibank, which collectively establish the TRS, and are collectively referred to herein as the TRS Agreement.
Pursuant to the terms of the TRS Agreement, Arch Street may select a portfolio of loans with a maximum market value (determined at the time each such loan becomes subject to the TRS) of $200,000. Each individual loan, and the portfolio of loans taken as a whole, must meet criteria described in the TRS Agreement. Arch Street will receive from Citibank all interest and fees payable in respect of the loans included in the portfolio. Arch Street will pay to Citibank interest at a rate equal to one-month LIBOR + 1.25% per annum. In addition, upon the termination or repayment of any loan subject to the TRS, Arch Street will either receive from Citibank the appreciation in the value of such loan, or pay to Citibank any depreciation in the value of such loan. Arch Street may be required to post additional collateral from time to time as a result of a decline in the mark-to-market value of the portfolio of loans subject to the TRS.
Citibank may terminate the TRS on or after the second anniversary of the effectiveness of the TRS. Arch Street may terminate the TRS at any time upon providing no more than 30 days, and no less than 10 days, prior notice to Citibank. Any termination prior to the second anniversary of the effectiveness of the TRS will result in payment of an early termination fee to Citibank. Arch Street is required to pay a minimum usage fee in connection with the TRS. Arch Street will also pay Citibank customary fees in connection with the establishment and maintenance of the TRS.
104
Table of Contents
FS Investment Corporation
Notes to Consolidated Financial Statements
(in thousands, except share and per share amounts)
Note 13. Selected Quarterly Financial Data (Unaudited)
The following is the quarterly results of operations for the years ended December 31, 2010 and 2009. The following information reflects all normal recurring adjustments necessary for a fair presentation of the information for the periods presented. The operating results for any quarter are not necessarily indicative of results for any future period.
| Quarter Ended | ||||||||||||||||
| December 31, 2010 |
September 30, 2010 |
June 30, 2010 |
March 31, 2010 |
|||||||||||||
| Investment income |
$ | 12,798 | $ | 8,678 | $ | 6,060 | $ | 3,134 | ||||||||
| Operating expenses |
||||||||||||||||
| Total expenses(2) |
11,215 | 5,119 | 2,925 | 2,019 | ||||||||||||
| Net expenses |
11,215 | 5,119 | 2,925 | 2,019 | ||||||||||||
| Net investment income |
1,583 | 3,559 | 3,135 | 1,115 | ||||||||||||
| Realized and unrealized gain (loss) |
13,681 | 8,289 | (6,852 | ) | 3,754 | |||||||||||
| Net increase (decrease) in net assets resulting from operations |
$ | 15,264 | $ | 11,848 | $ | (3,717 | ) | $ | 4,869 | |||||||
| Per share information—basic and diluted |
||||||||||||||||
| Net investment income |
$ | 0.05 | $ | 0.14 | $ | 0.16 | $ | 0.08 | ||||||||
| Net increase (decrease) in net assets resulting from operations |
$ | 0.43 | $ | 0.47 | $ | (0.19 | ) | $ | 0.37 | |||||||
| Weighted average shares outstanding(1) |
35,142,181 | 25,426,504 | 19,178,168 | 13,121,990 | ||||||||||||
| Quarter Ended | ||||||||||||||||
| December 31, 2009 |
September 30, 2009 |
June 30, 2009 |
March 31, 2009 |
|||||||||||||
| Investment income |
$ | 2,339 | $ | 1,353 | $ | 570 | $ | 158 | ||||||||
| Operating expenses |
||||||||||||||||
| Total expenses |
994 | 785 | 462 | 268 | ||||||||||||
| Less: Expense reimbursement from sponsor |
— | (64 | ) | (52 | ) | (124 | ) | |||||||||
| Net expenses |
994 | 721 | 410 | 144 | ||||||||||||
| Net investment income |
1,345 | 632 | 160 | 14 | ||||||||||||
| Realized and unrealized gain |
2,124 | 4,650 | 2,252 | 279 | ||||||||||||
| Net increase in net assets resulting from operations |
$ | 3,469 | $ | 5,282 | $ | 2,412 | $ | 293 | ||||||||
| Per share information—basic and diluted |
||||||||||||||||
| Net investment income |
$ | 0.15 | $ | 0.12 | $ | 0.07 | $ | 0.02 | ||||||||
| Net increase in net assets resulting from operations |
$ | 0.38 | $ | 0.99 | $ | 0.98 | $ | 0.33 | ||||||||
| Weighted average shares outstanding(1) |
9,069,349 | 5,337,073 | 2,456,465 | 898,022 | ||||||||||||
| (1) | The weighted average share information has been retroactively adjusted to reflect the stock distributions discussed in Note 5. |
105
Table of Contents
FS Investment Corporation
Notes to Consolidated Financial Statements
(in thousands, except share and per share amounts)
| (2) | Commencing during the quarter ended December 31, 2010, the Company has changed its methodology for accruing for incentive fees to include unrealized gains in the calculation of the capital gains incentive fee expense. As a result, the Company recorded an additional $4,063 in capital gains incentive fees during this quarter. |
The sum of quarterly per share amounts does not equal per share amounts reported for the years ended December 31, 2010 and 2009. This is due to changes in the number of weighted-average shares outstanding and the effects of rounding for each period.
106
Table of Contents
| Item 9. | Changes in and Disagreements with Accountants on Accounting and Financial Disclosure |
None.
| Item 9A. | Controls and Procedures. |
| (a) | Evaluation of Disclosure Controls and Procedures |
We maintain disclosure controls and procedures that are designed to ensure that information required to be disclosed in our reports filed under the Securities Exchange Act of 1934, as amended, or the Exchange Act, is recorded, processed, summarized and reported within the time periods specified in the SEC’s rules and forms and that such information is accumulated and communicated to our management, including our chief executive officer and chief financial officer, as appropriate, to allow for timely decisions regarding required disclosure. In designing and evaluating the disclosure controls and procedures, management recognizes that any controls and procedures, no matter how well designed and operated, can provide only reasonable assurance of achieving the desired control objectives, and management is required to apply its judgment in evaluating the cost-benefit relationship of possible controls and procedures.
As required by SEC Rule 15d-15(b), we carried out an evaluation under the supervision and with the participation of our management, including our chief executive officer and chief financial officer, of the effectiveness of the design and operation of our disclosure controls and procedures as of December 31, 2010. Based on the foregoing, our chief executive officer and chief financial officer concluded that our disclosure controls and procedures were (a) designed to ensure that the information we are required to disclose in our reports under the Exchange Act is recorded, processed and reported in an accurate manner and on a timely basis and the information that we are required to disclose in our Exchange Act reports is accumulated and communicated to management to permit timely decisions with respect to required disclosure and (b) operating in an effective manner.
| (b) | Management’s Annual Report on Internal Control Over Financial Reporting |
Our management is responsible for establishing and maintaining adequate internal control over financial reporting. As defined in SEC Rules 13a-15(f) and 15d-15(f), internal control over financial reporting is a process designed by, or under the supervision of, the company’s principal executive and principal financial officers, or persons performing similar functions, and effected by the company’s board of directors, management and other personnel, to provide reasonable assurance regarding the reliability of financial reporting and the preparation of financial statements for external purposes in accordance with U.S. generally accepted accounting principles.
Our internal control over financial reporting includes those policies and procedures that:
1. Pertain to the maintenance of records that, in reasonable detail, accurately and fairly reflect the Company’s transactions and the dispositions of assets of the Company;
2. Provide reasonable assurance that transactions are recorded as necessary to permit preparation of financial statements in accordance with generally accepted accounting principles, and that receipts and expenditures of the Company are being made only in accordance with authorizations of our management and Board of Directors; and
3. Provide reasonable assurance regarding prevention or timely detection of unauthorized acquisition, use or disposition of the Company’s assets that could have a material effect on the financial statements.
Because of its inherent limitations, a system of internal control over financial reporting can provide only reasonable assurance with respect to financial statement preparation and presentation and may not prevent or detect misstatements. Also, projections of any evaluation of effectiveness to future periods are subject to the risk that controls may become inadequate because of changes in conditions, or that the degree of compliance with the policies or procedures may deteriorate.
107
Table of Contents
Management’s report on internal control over financial reporting is set forth above under the heading “Management’s Report on Internal Control over Financial Reporting” in Item 8 of this annual report on Form 10-K.
| (c) | Attestation Report of the Registered Public Accounting Firm |
Our registered public accounting firm has issued an attestation report on our internal control over financial reporting. This report appears on page 75.
| (d) | Changes in Internal Control Over Financial Reporting |
During our fourth quarter of 2010, there has been no change in our internal control over financial reporting (as defined in SEC Rules 13a-15(f) or 15d-15(f)) that has materially affected, or is reasonably likely to materially affect, our internal control over financial reporting.
| Item 9B. | Other Information. |
On March 18, 2011, Arch Street Funding LLC, or Arch Street, the Company’s newly-formed, wholly-owned financing subsidiary, entered into a total return swap, or TRS, for senior secured floating rate loans with Citibank, N.A., or Citibank.
The TRS with Citibank enables the Company, through its ownership of Arch Street, to obtain the economic benefit of owning the loans subject to the TRS, without actually owning them, in return for an interest-type payment to Citibank. As such, the TRS is analogous to Arch Street borrowing funds to acquire loans and incurring interest expense to a lender.
Pursuant to the terms of an investment management agreement that the Company has entered into with Arch Street, the Company acts as the manager of the rights and obligations of Arch Street under the TRS, including selecting the specific loans to be included in the portfolio of loans subject to the TRS. The terms of the TRS are governed by an ISDA 2002 Master Agreement, the Schedule thereto and Credit Support Annex to such Schedule, and the Confirmation exchanged thereunder, between Arch Street and Citibank, which collectively establish the TRS, and are collectively referred to herein as the TRS Agreement.
Pursuant to the terms of the TRS Agreement, and subject to conditions customary for transactions of this nature, Arch Street may select a portfolio of loans with a maximum market value (determined at the time each such loan becomes subject to the TRS) of $200,000,000. Each individual loan, and the portfolio of loans taken as a whole, must meet criteria described in the TRS Agreement. Arch Street will receive from Citibank all interest and, subject to limitations described in the TRS Agreement, all fees payable in respect of the loans included in the portfolio. Arch Street will pay to Citibank interest at a rate equal to one-month LIBOR + 1.25% per annum. In addition, upon the termination or repayment of any loan subject to the TRS, Arch Street will either receive from Citibank the appreciation in the value of such loan, or pay to Citibank any depreciation in the value of such loan.
Citibank may terminate the TRS on or after the second anniversary of the effectiveness of the TRS. Arch Street may terminate the TRS at any time upon providing no more than 30 days, and no less than 10 days, prior notice to Citibank. Any termination prior to the second anniversary of the effectiveness of the TRS will result in payment of an early termination fee to Citibank. Arch Street is required to pay a minimum usage fee in connection with the TRS of 1.25% on 90% of the unused portion of the maximum amount permitted under the TRS. Such minimum usage fee will not apply during the first 90 and last 30 days of the term of the TRS or be payable if Citibank rejects a specified percentage of loans proposed by Arch Street to be included in the portfolio that meet specific criteria described in the TRS Agreement. Arch Street will also pay Citibank customary fees in connection with the establishment and maintenance of the TRS.
Arch Street is required to initially cash collateralize a specified percentage of each loan (generally between 20% and 25% of the market value of such loan) included under the TRS in accordance with margin requirements described in the TRS Agreement. Arch Street may be required to post additional collateral from time to time as a
108
Table of Contents
result of a decline in the mark-to-market value of the portfolio of loans subject to the TRS. The obligations of Arch Street under the TRS Agreement are non-recourse to the Company and the Company’s exposure under the TRS Agreement is limited to the value of the Company’s investment in Arch Street, which generally will equal the value of cash collateral provided by Arch Street under the TRS Agreement.
In connection with the TRS, Arch Street has made customary representations and warranties and is required to comply with various covenants, reporting requirements and other customary requirements for similar facilities. In addition to customary events of default and termination events included in the form ISDA 2002 Master Agreement, the TRS Agreement contains the following termination events: (a) a failure to satisfy the portfolio criteria for at least 30 days; (b) a failure to post initial cash collateral or additional collateral as required by the TRS Agreement; (c) a default by Arch Street or the Company with respect to indebtedness in an amount equal to or greater than the lesser of $10,000,000 and 2% of the Company’s net asset value at such time; (d) a merger of Arch Street or the Company meeting certain criteria; (e) the Company or Arch Street amending their respective constituent documents to alter their investment strategy in a manner that has or could reasonably be expected to have a material adverse effect; and (f) the Company ceasing to be the investment manager of Arch Street or having authority to enter into transactions under the TRS Agreement on behalf of Arch Street, and not being replaced by an entity reasonably acceptable to Citibank.
The summary descriptions of the TRS and the TRS Agreement contained in this Annual Report on Form 10-K are qualified in its entirety by the full text of the agreements constituting the TRS Agreement, copies of which are attached to this Annual Report on Form 10-K as Exhibits 10.13, 10.14 and 10.15 and are incorporated herein by reference.
109
Table of Contents
PART III
We will file a definitive Proxy Statement for our 2011 Annual Meeting of Stockholders with the SEC, pursuant to Regulation 14A, not later than 120 days after the end of our fiscal year. Accordingly, certain information required by Part III has been omitted under General Instruction G(3) to Form 10-K. Only those sections of our definitive Proxy Statement that specifically address the items set forth herein are incorporated by reference.
| Item 10. | Directors, Executive Officers and Corporate Governance |
The information required by Item 10 is hereby incorporated by reference from the Company’s definitive Proxy Statement relating to the Company’s 2011 Annual Meeting of Stockholders, to be filed with the SEC within 120 days following the end of the Company’s fiscal year.
| Item 11. | Executive Compensation |
The information required by Item 11 is hereby incorporated by reference from the Company’s definitive Proxy Statement relating to the Company’s 2011 Annual Meeting of Stockholders, to be filed with the SEC within 120 days following the end of the Company’s fiscal year.
| Item 12. | Security Ownership of Certain Beneficial Owners and Management and Related Stockholder Matters |
The information required by Item 12 is hereby incorporated by reference from the Company’s definitive Proxy Statement relating to the Company’s 2011 Annual Meeting of Stockholders, to be filed with the SEC within 120 days following the end of the Company’s fiscal year.
| Item 13. | Certain Relationships and Related Transactions, and Director Independence |
The information required by Item 13 is hereby incorporated by reference from the Company’s definitive Proxy Statement relating to the Company’s 2011 Annual Meeting of Stockholders, to be filed with the SEC within 120 days following the end of the Company’s fiscal year.
| Item 14. | Principal Accountant Fees and Services |
The information required by Item 14 is hereby incorporated by reference from the Company’s definitive Proxy Statement relating to the Company’s 2011 Annual Meeting of Stockholders, to be filed with the SEC within 120 days following the end of the Company’s fiscal year.
110
Table of Contents
PART IV
| Item 15. | Exhibits, Financial Statement Schedules |
a. Documents Filed as Part of this Report
The following financial statements are set forth in Item 8:
b. Exhibits
Please note that the agreements included as exhibits to this Annual Report on Form 10-K are included to provide information regarding their terms and are not intended to provide any other factual or disclosure information about FS Investment Corporation or the other parties to the agreements. The agreements contain representations and warranties by each of the parties to the applicable agreement that have been made solely for the benefit of the other parties to the applicable agreement and may not describe the actual state of affairs as of the date they were made or at any other time.
The following exhibits are filed as part of this report or hereby incorporated by reference to exhibits previously filed with the SEC:
| 3.1 | Articles of Amendment and Restatement of FS Investment Corporation. (Incorporated by reference to Exhibit (a)(2) filed with Amendment No. 3 to the Company’s registration statement on Form N-2 (File No. 333-149374) filed on September 17, 2008.) | |
| 3.2 | Amended and Restated Bylaws of FS Investment Corporation. (Incorporated by reference to Exhibit (b)(1) filed with Amendment No. 3 to the Company’s registration statement on Form N-2 (File No. 333-149374) filed on September 17, 2008.) | |
| 4.1 | Form of Subscription Agreement. (Incorporated by reference to Appendix A filed with prospectus Supplement No. 2 on Form 497 (File No. 333-149374) filed on January 14, 2009.) | |
| 4.2 | Amended and Restated Distribution Reinvestment Plan. (Incorporated by reference to Exhibit (e)(1) filed with Amendment No. 3 to the Company’s registration statement on Form N-2 (File No. 333-149374) filed on September 17, 2008.) | |
| 10.1 | Investment Advisory and Administrative Services Agreement by and between the Company and FB Income Advisor, LLC. (Incorporated by reference to Exhibit (g) filed with the Company’s registration statement on Form N-2 (File No. 333-149374) filed on February 25, 2008.) | |
| 10.2 | First Amendment to the Investment Advisory and Administrative Services Agreement. (Incorporated by reference to Exhibit (g)(1) filed with Amendment No. 3 to the Company’s registration statement on Form N-2 (File No. 333-149374) filed on September 17, 2008.) | |
| 10.3 | Investment Sub-advisory Agreement between FB Income Advisor, LLC and GSO / Blackstone Debt Funds Management, LLC. (Incorporated by reference to Exhibit (g)(2) filed with Amendment No. 2 to the Company’s registration statement on Form N-2 (File No. 333-149374) filed on June 19, 2008.) | |
| 10.4 | Form of Dealer Manager Agreement by and between the Company and FS2 Capital Partners, LLC. (Incorporated by reference to Exhibit (h)(1) filed with Amendment No. 3 to the Company’s registration statement on Form N-2 (File No. 333-149374) filed on September 17, 2008.) |
111
Table of Contents
| 10.5 | Form of Selected Dealer Agreement (Included as Appendix A to the Form of Dealer Manager Agreement). (Incorporated by reference to Exhibit (h)(1) filed with Amendment No. 3 to the Company’s registration statement on Form N-2 (File No. 333-149374) filed on September 17, 2008.) | |
| 10.6 | Custodian Agreement by and between the Company and PFPC Trust Company. (Incorporated by reference to Exhibit (j)(1) filed with Post-Effective Amendment No. 1 to the Company’s registration statement on Form N-2 (File No. 333-149374) filed on November 13, 2008.) | |
| 10.7 | Form of Escrow Agreement by and between the Company and UMB Bank, N.A. (Incorporated by reference to Exhibit (k) filed with Amendment No. 3 to the Company’s registration statement on Form N-2 (File No. 333-149374) filed on September 17, 2008.) | |
| 10.8 | Amended and Restated Credit Agreement by and between Broad Street Funding LLC and Deutsche Bank AG, New York Branch, dated as of January 28, 2011. (Incorporated by reference to Exhibit 10.1 to the Company’s Current Report on Form 8-K filed on February 1, 2011.) | |
| 10.9 | Asset Contribution Agreement by and between the Company and Broad Street Funding LLC, dated March 10, 2010. (Incorporated by reference to Exhibit 10.2 to the Company’s Current Report on Form 8-K filed on March 16, 2010.) | |
| 10.10 | First Amendment to Asset Contribution Agreement by and between the Company and Broad Street Funding LLC, dated as of June 17, 2010. (Incorporated by reference to Exhibit 10.2 to the Company’s Current Report on Form 8-K filed on July 19, 2010.) | |
| 10.11 | Investment Management Agreement by and between the Company and Broad Street Funding LLC, dated March 10, 2010. (Incorporated by reference to Exhibit 10.3 to the Company’s Current Report on Form 8-K filed on March 16, 2010.) | |
| 10.12 | Amended and Restated Security Agreement by and between Broad Street Funding LLC and Deutsche Bank AG, New York Branch, dated as of January 28, 2011. (Incorporated by reference to Exhibit 10.2 to the Company’s Current Report on Form 8-K filed on February 1, 2011.) | |
| 10.13* | ISDA 2002 Master Agreement, together with the Schedule thereto and Credit Support Annex to such Schedule, each dated as of March 18, 2011, by and between Arch Street Funding LLC and Citibank, N.A. | |
| 10.14* | Confirmation Letter Agreement, dated as of March 18, 2011, by and between Arch Street Funding LLC and Citibank, N.A. | |
| 10.15* | Investment Management Agreement by and between the Company and Arch Street Funding LLC, dated as of March 18, 2011. | |
| 21.1* | Subsidiaries of FS Investment Corporation. | |
| 31.1* | Certification of Chief Executive Officer pursuant to Rule 13a-14 of the Securities Exchange Act of 1934, as amended. | |
| 31.2* | Certification of Chief Financial Officer pursuant to Rule 13a-14 of the Securities Exchange Act of 1934, as amended. | |
| 32.1* | Certification of Chief Executive Officer pursuant to Section 1350, Chapter 63 of Title 18, United States Code, as adopted pursuant to Section 906 of the Sarbanes-Oxley Act of 2002. | |
| 32.2* | Certification of Chief Financial Officer pursuant to Section 1350, Chapter 63 of Title 18, United States Code, as adopted pursuant to Section 906 of the Sarbanes-Oxley Act of 2002. | |
| * | Filed herewith. |
c. Financial statement schedules
No financial statement schedules are filed herewith because (1) such schedules are not required or (2) the information has been presented in the aforementioned financial statements.
112
Table of Contents
Pursuant to the requirements of Section 13 or 15(d) of the Securities Exchange Act of 1934, the registrant has duly caused this report to be signed on its behalf by the undersigned, thereunto duly authorized.
| FS INVESTMENT CORPORATION | ||||
| Date: March 24, 2011 |
/s/ Michael C. Forman | |||
| Michael C. Forman Chief Executive Officer | ||||
Pursuant to the requirements of the Securities Exchange Act of 1934, this report has been signed below by the following persons on behalf of the registrant and in the capacity and on the dates indicated.
| Date: March 24, 2011 |
/s/ Michael C. Forman | |||
| Michael C. Forman Chief Executive Officer and Director (Principal Executive Officer) | ||||
| Date: March 24, 2011 |
/s/ Charles M. Jacobson | |||
| Charles M. Jacobson Chief Financial Officer (Principal Accounting and Financial Officer) | ||||
| Date: March 24, 2011 |
/s/ David Adelman | |||
| David Adelman Director | ||||
| Date: March 24, 2011 |
/s/ Gregory P. Chandler | |||
| Gregory P. Chandler Director | ||||
| Date: March 24, 2011 |
/s/ Barry H. Frank | |||
| Barry H. Frank Director | ||||
| Date: March 24, 2011 |
/s/ Thomas J. Gravina | |||
| Thomas J. Gravina Director | ||||
| Date: March 24, 2011 |
/s/ Jeffrey K. Harrow | |||
| Jeffrey K. Harrow Director | ||||
| Date: March 24, 2011 |
/s/ Michael Heller | |||
| Michael Heller Director | ||||
| Date: March 24, 2011 |
/s/ Paul Mendelson | |||
| Paul Mendelson Director | ||||
113