Attached files
| file | filename |
|---|---|
| EX-32.2 - EX-32.2 - FS KKR Capital Corp | d878293dex322.htm |
| EX-21.1 - EX-21.1 - FS KKR Capital Corp | d878293dex211.htm |
| EX-32.1 - EX-32.1 - FS KKR Capital Corp | d878293dex321.htm |
| EX-31.1 - EX-31.1 - FS KKR Capital Corp | d878293dex311.htm |
| EX-31.2 - EX-31.2 - FS KKR Capital Corp | d878293dex312.htm |
Table of Contents
UNITED STATES
SECURITIES AND EXCHANGE COMMISSION
WASHINGTON, D.C. 20549
FORM 10-K
| x | ANNUAL REPORT PURSUANT TO SECTION 13 OR 15(d) OF THE SECURITIES EXCHANGE |
| ACT OF 1934 |
| FOR THE FISCAL YEAR ENDED DECEMBER 31, 2014 |
OR
| ¨ | TRANSITION REPORT PURSUANT TO SECTION 13 OR 15(d) OF THE SECURITIES EXCHANGE ACT OF 1934 |
| FOR THE TRANSITION PERIOD FROM TO |
COMMISSION FILE NUMBER: 814-00757
FS Investment Corporation
(Exact name of registrant as specified in its charter)
| Maryland | 26-1630040 | |
| (State of Incorporation) | (I.R.S. Employer Identification Number) | |
| 201 Rouse Boulevard Philadelphia, Pennsylvania |
19112 | |
| (Address of principal executive offices) | (Zip Code) | |
Registrant’s telephone number, including area code: (215) 495-1150
Securities registered pursuant to Section 12(b) of the Act:
| Common Stock, par value $0.001 per share | The New York Stock Exchange | |
| (Title of class) | (Name of exchange on which registered) |
Securities registered pursuant to Section 12(g) of the Act:
None
Indicate by check mark if the registrant is a well-known seasoned issuer, as defined in Rule 405 of the Securities Act. Yes ¨ No x.
Indicate by check mark if the registrant is not required to file reports pursuant to Section 13 or Section 15(d) of the Act. Yes ¨ No x.
Indicate by check mark whether the Registrant (1) has filed all reports required to be filed by Section 13 or 15(d) of the Securities Exchange Act of 1934 during the preceding 12 months (or for such shorter period that the Registrant was required to file such reports), and (2) has been subject to such filing requirements for the past 90 days. Yes x No ¨.
Indicate by check mark whether the registrant has submitted electronically and posted on its corporate Web site, if any, every Interactive Data File required to be submitted and posted pursuant to Rule 405 of Regulation S-T (§232.405 of this chapter) during the preceding 12 months (or for shorter period that the registrant was required to submit and post such files). Yes ¨ No ¨.
Indicate by check mark if disclosure of delinquent filers pursuant to Item 405 of Regulation S-K is not contained herein, and will not be contained, to the best of Registrant’s knowledge, in definitive proxy or information statements incorporated by reference in Part III of this Form 10-K or any amendment to this Form 10-K. ¨
Indicate by check mark whether the registrant is a large accelerated filer, an accelerated filer, a non-accelerated filer, or a smaller reporting company. See definition of “accelerated filer,” “large accelerated filer” and “smaller reporting company” in Rule 12b-2 of the Exchange Act. (Check one):
| Large accelerated filer x | Accelerated filer ¨ | |||
| Non-accelerated filer ¨ | (Do not check if a smaller reporting company) | Smaller reporting company ¨ |
Indicate by check mark whether the registrant is a shell company (as defined in Rule 12b-2 of the Exchange Act). Yes ¨ No x.
The aggregate market value of common stock held by non-affiliates of the registrant (assuming solely for the purpose of this disclosure, but without conceding, all executive officers and directors of the registrant are “affiliates”), as of June 30, 2014, the last business day of the registrant’s most recently completed second fiscal quarter, was approximately $2.5 billion.
There were 241,101,434 shares of the registrant’s common stock outstanding as of February 27, 2015.
Documents Incorporated by Reference
Portions of the registrant’s definitive Proxy Statement relating to the registrant’s 2015 Annual Meeting of Stockholders, to be filed with the U.S. Securities and Exchange Commission within 120 days following the end of the registrant’s fiscal year, are incorporated by reference in Part III of this annual report on Form 10-K as indicated herein.
Table of Contents
| Page | ||||||
| PART I |
||||||
| ITEM 1. |
BUSINESS | 1 | ||||
| ITEM 1A. | 24 | |||||
| ITEM 1B. | 52 | |||||
| ITEM 2. | 52 | |||||
| ITEM 3. | 52 | |||||
| ITEM 4. | 52 | |||||
| PART II |
||||||
| ITEM 5. | 53 | |||||
| ITEM 6. | 57 | |||||
| ITEM 7. | MANAGEMENT’S DISCUSSION AND ANALYSIS OF FINANCIAL CONDITION AND RESULTS OF OPERATIONS |
59 | ||||
| ITEM 7A. | 98 | |||||
| ITEM 8. | 100 | |||||
| ITEM 9. | CHANGES IN AND DISAGREEMENTS WITH ACCOUNTANTS ON ACCOUNTING AND FINANCIAL DISCLOSURE |
166 | ||||
| ITEM 9A. | 166 | |||||
| ITEM 9B. | 167 | |||||
| PART III |
||||||
| ITEM 10. | 168 | |||||
| ITEM 11. | 168 | |||||
| ITEM 12. | SECURITY OWNERSHIP OF CERTAIN BENEFICIAL OWNERS AND MANAGEMENT AND RELATED STOCKHOLDER MATTERS |
168 | ||||
| ITEM 13. | CERTAIN RELATIONSHIPS AND RELATED TRANSACTIONS, AND DIRECTOR INDEPENDENCE |
168 | ||||
| ITEM 14. | 168 | |||||
| PART IV |
||||||
| ITEM 15. | 169 | |||||
| SIGNATURES | 174 | |||||
Table of Contents
PART I
Many of the amounts and percentages presented in Part I have been rounded for convenience of presentation and all dollar amounts, excluding share and per share amounts, are presented in thousands unless otherwise noted.
| Item 1. | Business. |
Summary
FS Investment Corporation, or the Company, which may also be referred to as “we,” “us” or “our,” was incorporated under the general corporation laws of the State of Maryland on December 21, 2007 and formally commenced investment operations on January 2, 2009. We are an externally managed, non-diversified, closed-end management investment company that has elected to be regulated as a business development company, or BDC, under the Investment Company Act of 1940, as amended, or the 1940 Act. As such, we are required to comply with certain regulatory requirements. In addition, we have elected to be treated for U.S. federal income tax purposes, and intend to qualify annually, as a regulated investment company, or RIC, under Subchapter M of the Internal Revenue Code of 1986, as amended, or the Code. As of December 31, 2014, we had total assets of approximately $4.4 billion.
We are managed by FB Income Advisor, LLC, or FB Advisor, a registered investment adviser under the Investment Advisers Act of 1940, as amended, or the Advisers Act, which oversees the management of our operations and is responsible for making investment decisions for our portfolio. FB Advisor has engaged GSO /Blackstone Debt Funds Management LLC, or GDFM, to act as our investment sub-adviser. GDFM assists FB Advisor in identifying investment opportunities and makes investment recommendations for approval by FB Advisor, according to guidelines set by FB Advisor. GDFM, a registered investment adviser under the Advisers Act, is a subsidiary of GSO Capital Partners LP, or GSO, the credit platform of The Blackstone Group L.P., or Blackstone, a leading global alternative asset manager and provider of financial advisory services. GSO is one of the world’s largest credit platforms in the alternative asset business with approximately $72.9 billion in assets under management as of December 31, 2014.
Our investment objectives are to generate current income and, to a lesser extent, long-term capital appreciation. We seek to meet our investment objectives by:
| • | utilizing the experience and expertise of the management teams of FB Advisor and GDFM, along with the broader resources of GSO, which include its access to the relationships and human capital of its parent, Blackstone, in sourcing, evaluating and structuring transactions; |
| • | employing a defensive investment approach focused on long-term credit performance and principal protection; |
| • | focusing primarily on debt investments in a broad array of private U.S. companies, including middle-market companies, which we define as companies with annual revenue of $50 million to $2.5 billion at the time of investment. In many market environments, we believe such a focus offers an opportunity for superior risk adjusted returns; |
| • | investing primarily in established, stable enterprises with positive cash flows; and |
| • | maintaining rigorous portfolio monitoring, in an attempt to anticipate and pre-empt negative credit events within our portfolio. |
Our portfolio is comprised primarily of investments in senior secured loans and second lien secured loans of private middle market U.S. companies and, to a lesser extent, subordinated loans of private U.S. companies. Although we do not expect a significant portion of our portfolio to be comprised of subordinated loans, there is no limit on the amount of such loans in which we may invest. We may purchase interests in loans or make other
1
Table of Contents
debt investments, including investments in senior secured bonds, through secondary market transactions in the “over-the-counter” market or directly from our target companies as primary market or directly originated investments. In connection with our debt investments, we may on occasion receive equity interests such as warrants or options as additional consideration. We may also purchase minority interests in the form of common or preferred equity or the equity-related securities in our target companies, generally in conjunction with one of our debt investments or through a co-investment with a financial sponsor, such as an institutional investor or private equity firm. In addition, a portion of our portfolio may be comprised of corporate bonds, other debt securities and derivatives, including total return swaps and credit default swaps. FB Advisor will seek to tailor our investment focus as market conditions evolve. Depending on market conditions, we may increase or decrease our exposure to less senior portions of the capital structure or otherwise make opportunistic investments.
The senior secured loans, second lien secured loans and senior secured bonds in which we invest generally have stated terms of three to seven years and subordinated debt investments that we make generally have stated terms of up to ten years, but the expected average life of such securities is generally between three and seven years. However, there is no limit on the maturity or duration of any security in our portfolio. The loans in which we invest may be rated by a nationally recognized statistical rating organization and, in such case, generally will carry a rating below investment grade (rated lower than “Baa3” by Moody’s Investors Service, Inc., or Moody’s, or lower than “BBB-” by Standard & Poor’s Ratings Services, or S&P). We also invest in non-rated debt securities.
To seek to enhance our returns, we employ leverage as market conditions permit and at the discretion of FB Advisor, but in no event will leverage employed exceed 50% of the value of our assets, as required by the 1940 Act.
During the year ended December 31, 2014, we made investments in portfolio companies totaling $2,178,075. During the same period, we sold investments for proceeds of $1,246,624 and received principal repayments of $875,315. As of December 31, 2014, our investment portfolio, with a total fair value of $4,183,447 (53% in first lien senior secured loans, 17% in second lien senior secured loans, 8% in senior secured bonds, 11% in subordinated debt, 3% in collateralized securities and 8% in equity/other), consisted of interests in 118 portfolio companies. The portfolio companies that comprised our portfolio as of such date had an average annual earnings before interest, taxes, depreciation and amortization, or EBITDA, of approximately $155.2 million. As of December 31, 2014, the investments in our portfolio were purchased at a weighted average price of 97.4% of par or stated value, as applicable, and our estimated gross annual portfolio yield (which represents the expected yield to be generated by us on our investment portfolio based on the composition of our portfolio as of such date), prior to leverage, was 10.0% based upon the amortized cost of our investments.
As a BDC, we are subject to certain regulatory restrictions in making our investments. For example, we generally will not be permitted to co-invest with certain entities affiliated with FB Advisor or GDFM in transactions originated by FB Advisor or GDFM or their respective affiliates unless we obtain an exemptive order from the SEC or co-invest alongside FB Advisor or GDFM or their respective affiliates in accordance with existing regulatory guidance and the allocation policies of FB Advisor, GDFM and their respective affiliates, as applicable. However, we will be permitted to, and may, co-invest in syndicated deals and secondary loan market transactions where price is the only negotiated point. In an order dated June 4, 2013, the SEC granted exemptive relief permitting us, subject to the satisfaction of certain conditions, to co-invest in certain privately negotiated investment transactions with certain affiliates of FB Advisor, including FS Energy and Power Fund, FS Investment Corporation II, FS Investment Corporation III and any future BDCs that are advised by FB Advisor or its affiliated investment advisers, or collectively our co-investment affiliates. We believe this relief has and may continue to enhance our ability to further our investment objectives and strategy. We believe this relief may also increase favorable investment opportunities for us, in part, by allowing us to participate in larger investments, together with our co-investment affiliates, than would be available to us if such relief had not been obtained. Because we did not seek exemptive relief to engage in co-investment transactions with GDFM and its affiliates, we will continue to be permitted to co-invest with GDFM and its affiliates only in accordance with existing regulatory guidance.
2
Table of Contents
Our Public Offering and Listing
In May 2012, we closed our continuous public offering of shares of common stock to new investors. We sold 247,454,171 shares (as adjusted for stock distributions) of common stock for gross proceeds of $2,605,158 in our continuous public offering. On April 16, 2014, shares of our common stock began trading on the NYSE under the ticker symbol “FSIC”. This listing accomplished our goal of providing our stockholders with greatly enhanced liquidity.
Distributions
Effective January 1, 2015 and subject to applicable legal restrictions and the sole discretion of our board of directors, we intend to authorize, declare and pay regular cash distributions on a quarterly basis. From time to time, we may also pay special interim distributions in the form of cash or shares of our common stock at the discretion of our board of directors. The timing and amount of any future distributions to stockholders are subject to applicable legal restrictions and the sole discretion of our board of directors.
The following table reflects the cash distributions per share that we have declared and paid on our common stock during the years ended December 31, 2014, 2013 and 2012:
| Distribution | ||||||||
| For the Year Ended December 31, |
Per Share | Amount | ||||||
|
2012(1)(2) |
$ | 0.8586 | $ | 197,906 | ||||
|
2013(3) |
0.8303 | 212,153 | ||||||
|
2014(4)(5) |
1.0843 | 267,856 | ||||||
| (1) | In addition to regular cash distributions during such period, cash distributions declared and paid on our common stock during the year ended December 31, 2012 include approximately $12,417, or approximately $0.05 per share, in special cash distributions. |
| (2) | On May 15, 2012, our board of directors determined to increase the amount of semi-monthly distributions payable to stockholders of record from $0.033594 per share to $0.03375 per share, effective May 16, 2012. Beginning in June 2012, we declared and paid regular cash distributions on a monthly basis in an amount equal to $0.0675 per share. |
| (3) | On June 25, 2013, our board of directors determined to increase the amount of the regular monthly cash distributions payable to stockholders of record from $0.0675 per share to $0.06975 per share, effective as of June 28, 2013. On October 16, 2013, our board of directors determined to increase the amount of regular monthly cash distributions payable to stockholders of record from $0.06975 per share to $0.0720 per share, effective as of November 29, 2013. |
| (4) | On March 31, 2014, our board of directors determined to increase the amount of the regular monthly cash distribution payable to stockholders of record from $0.0720 per share to $0.07425 per share, effective as of April 30, 2014. |
| (5) | On July 1, 2014, our board of directors declared a special cash distribution of $0.10 per share, which was paid on August 15, 2014 to stockholders of record as of the close of business on July 31, 2014. On October 10, 2014, our board of directors also declared a special cash distribution of $0.10 per share, which was paid on November 14, 2014 to stockholders of record as of the close of business on October 31, 2014. |
On January 13, 2015, our board of directors declared a regular quarterly cash distribution of $0.22275 per share, which will be paid on or about April 2, 2015 to stockholders of record as of the close of business on March 25, 2015.
For additional information regarding our distributions and our distribution reinvestment plan, including certain related tax considerations, see “Item 7. Management’s Discussion and Analysis of Financial Condition and Results of Operations—RIC Status and Distributions.”
3
Table of Contents
About FB Advisor
FB Advisor is a subsidiary of our affiliate, Franklin Square Holdings, L.P., or Franklin Square Holdings, a national sponsor of alternative investment funds designed for the individual investor. FB Advisor is registered as an investment adviser with the SEC under the Advisers Act and is led by substantially the same personnel that form the investment and operations team of FS Investment Advisor, LLC, FSIC II Advisor, LLC, FSIC III Advisor, LLC and FS Global Advisor, LLC. FS Investment Advisor, LLC, FSIC II Advisor, LLC and FSIC III Advisor, LLC are registered investment advisers that manage Franklin Square Holdings’ three other affiliated BDCs, FS Energy and Power Fund, FS Investment Corporation II and FS Investment Corporation III, respectively. FS Global Advisor, LLC is a registered investment adviser that manages Franklin Square Holdings’ affiliated closed-end management investment company, FS Global Credit Opportunities Fund.
In addition to managing our investments, the managers, officers and other personnel of FB Advisor also currently manage the following entities through affiliated investment advisers:
| Name |
Entity |
Investment Focus |
Gross Assets(1) |
|||||
| FS Energy and Power Fund |
BDC | Primarily invests in debt and income-oriented equity securities of privately-held U.S. companies in the energy and power industry. | $ | 3,450,406 | ||||
| FS Investment Corporation II |
BDC | Primarily invests in senior secured loans, second lien secured loans and, to a lesser extent, subordinated loans of private U.S. companies. | $ | 4,501,423 | ||||
| FS Investment Corporation III |
BDC | Primarily invests in senior secured loans, second lien secured loans and, to a lesser extent, subordinated loans of private U.S. companies. | $ | 595,301 | ||||
| FS Global Credit Opportunities Fund(2) |
Closed-end management investment company | Primarily invests in secured and unsecured floating and fixed rate loans, bonds and other types of credit instruments. | $
|
224,870
|
| |||
| (1) | As of September 30, 2014, except as otherwise noted below. |
| (2) | Two funds affiliated with FS Global Credit Opportunities Fund, FS Global Credit Opportunities Fund—A and FS Global Credit Opportunities Fund—D, or together, the FSGCOF Offered Funds, which have the same investment objectives and strategies as FS Global Credit Opportunities Fund, currently offer common shares of beneficial interest to the public and invest substantially all of the net proceeds of their respective offerings in FS Global Credit Opportunities Fund. Gross assets shown as of June 30, 2014. |
Our chairman and chief executive officer, Michael C. Forman, has led FB Advisor since its inception. In 2007, he co-founded Franklin Square Holdings with the goal of delivering alternative investment solutions, advised by what Franklin Square Holdings believes to be best-in-class institutional asset managers, to individual investors nationwide. In addition to leading FB Advisor, Mr. Forman currently serves as chairman, president and chief executive officer of FS Investment Advisor, LLC, FS Energy and Power Fund, FSIC II Advisor, LLC, FS Investment Corporation II, FSIC III Advisor, LLC, FS Investment Corporation III, FS Global Advisor, LLC, FS Global Credit Opportunities Fund and the FSGCOF Offered Funds.
FB Advisor’s senior management team has significant experience in private lending and private equity investing, and has developed an expertise in using all levels of a firm’s capital structure to produce income-generating investments, while focusing on risk management. The team also has extensive knowledge of the managerial, operational and regulatory requirements of publicly registered alternative asset entities, such as BDCs. We believe that the active and ongoing participation by Franklin Square Holdings and its affiliates in the credit markets, and the depth of experience and disciplined investment approach of FB Advisor’s management team, will allow FB Advisor to successfully execute our investment strategy.
4
Table of Contents
All of our investment decisions require the unanimous approval of FB Advisor’s investment committee, which is currently comprised of Mr. Forman, Gerald F. Stahlecker, our president, Zachary Klehr, our executive vice president, and Sean Coleman, our managing director. Our board of directors, including a majority of independent directors, oversees and monitors our investment performance and annually reviews the compensation we pay to FB Advisor and the compensation FB Advisor pays to GDFM to determine, among other things, whether such compensation is reasonable in light of the services provided.
About GDFM
From time to time, FB Advisor may enter into sub-advisory relationships with registered investment advisers that possess skills that FB Advisor believes will aid it in achieving our investment objectives. FB Advisor has engaged GDFM to act as our investment sub-adviser. GDFM assists FB Advisor in identifying investment opportunities and makes investment recommendations for approval by FB Advisor according to guidelines set by FB Advisor. GDFM also serves as the investment sub-adviser to FS Investment Corporation II and FS Investment Corporation III. Furthermore, GDFM’s parent, GSO, serves as the investment sub-adviser to FS Energy and Power Fund and FS Global Credit Opportunities Fund. GDFM is a Delaware limited liability company with principal offices located at 345 Park Avenue, New York, New York 10154.
GDFM is a wholly-owned subsidiary of GSO. GSO is the credit platform of Blackstone, a leading global alternative asset manager. As of December 31, 2014, GSO and its affiliates, excluding Blackstone, managed approximately $72.9 billion of assets across multiple strategies within the leveraged finance marketplace, including leveraged loans, high-yield bonds, distressed, mezzanine and private equity. As investment sub-adviser, GDFM makes recommendations to FB Advisor in a manner that is consistent with its existing investment and monitoring processes.
Blackstone is a leading global alternative asset manager and provider of financial advisory services. It is one of the largest independent managers of private capital in the world, with assets under management of approximately $290.4 billion as of December 31, 2014. Blackstone’s alternative asset management businesses include the management of private equity funds, real estate funds, funds of hedge funds, credit-oriented funds, collateralized loan obligation vehicles, separately managed accounts and publicly-traded closed-end mutual funds. Blackstone is a publicly traded limited partnership that has common units which trade on the NYSE under the ticker symbol “BX.” Information about Blackstone and its various affiliates, including certain ownership, governance and financial information, is disclosed in Blackstone’s periodic filings with the SEC, which can be obtained from Blackstone’s website at http://ir.blackstone.com or the SEC’s website at www.sec.gov. Information contained on Blackstone’s website and in Blackstone’s filings with the SEC are not incorporated by reference into this annual report on Form 10-K and you should not consider that information to be part of this annual report on Form 10-K.
Market Opportunity
We believe that there are and will continue to be significant investment opportunities in the senior secured and second lien secured loan asset class, as well as investments in debt securities of middle market companies.
Attractive Opportunities in Senior Secured and Second Lien Secured Loans
We believe that opportunities in senior secured and second lien secured loans are significant because of the variable rate structure of most senior secured debt issues and because of the strong defensive characteristics of this investment class. Given current market conditions, we believe that debt issues with variable interest rates offer a superior return profile to fixed-rate securities, since variable interest rate structures are generally less susceptible to declines in value experienced by fixed-rate securities in a rising interest rate environment.
Senior secured debt also provides strong defensive characteristics. Because this debt has priority in payment among an issuer’s security holders (i.e., they are due to receive payment before unsecured creditors and equityholders), they carry the least potential risk among investments in the issuer’s capital structure. Further,
5
Table of Contents
these investments are secured by the issuer’s assets, which may be seized in the event of a default, if necessary. They generally also carry restrictive covenants aimed at ensuring repayment before unsecured creditors, such as unsecured bondholders, and other security holders and preserving collateral to protect against credit deterioration.
The chart below illustrates examples of the collateral used to secure senior secured and second lien secured debt.
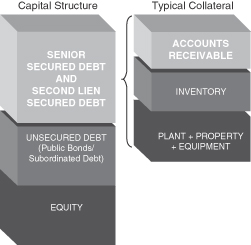
Source: Moody’s Investors Service, Inc.
Opportunity in Middle Market Private Companies
In addition to investing in senior secured and second lien secured loans generally, we believe that the market for lending to private companies, particularly middle market private companies within the United States, is underserved and presents a compelling investment opportunity. We believe that the following characteristics support our belief:
Large Target Market
According to The U.S. Census Bureau, in its 2007 economic census, there were approximately 40,000 middle market companies in the United States with annual revenues between $50 million and $2.5 billion, compared with approximately 1,200 companies with revenues greater than $2.5 billion. These middle market companies represent, we believe, a significant portion of the growth segment of the U.S. economy and often require substantial capital investment to grow their businesses. Middle market companies have generated a significant number of investment opportunities for us and investment programs managed by our affiliates and GDFM over the past several years, and we believe that this market segment will continue to produce significant investment opportunities for us.
Limited Investment Competition
Despite the size of the market, we believe that regulatory changes and other factors have diminished the role of traditional financial institutions and certain other capital providers in providing financing to middle market companies. As tracked by S&P Capital IQ LCD, U.S. banks’ share of senior secured loans to middle market companies contracted to 4% of overall middle market loan volume in 2014, down from 9% in 2013 and nearly 20% in 2011. We believe this trend of reduced middle market lending by financial institutions may continue as increased regulatory scrutiny as well as other regulatory changes may further reduce banks’ lending activities and the role they play in providing capital to middle market companies.
6
Table of Contents
In addition, regulatory uncertainty regarding collateralized loan obligations, or CLOs, may limit financing once available to middle market companies. Risk retention and certain limitations placed on some banks’ ability to hold certain CLO securities may also inhibit future CLO creation and future lending to middle market companies. CLOs represented 62.2% of the institutional investor base for broadly syndicated loans in 2014, as tracked by S&P Capital IQ LCD, and any decline in the formation of new CLOs will likely have broad implications for the senior secured loan marketplace and for middle market borrowers.
We also believe that lending and originating new loans to middle market companies, which are often private, generally requires a greater dedication of the lender’s time and resources compared to lending to larger companies, due in part to the smaller size of each investment and the often fragmented nature of information available from these companies. Further, many investment firms lack the breadth and scale necessary to identify investment opportunities, particularly in regards to directly originated investments in middle market companies, and that attractive investment opportunities are often overlooked. In addition, middle market companies may require more active monitoring and participation on the lender’s part. We believe that many large financial organizations, which often have relatively high cost structures, are not suited to deal with these factors and instead emphasize services and transactions to larger corporate clients with a consequent reduction in the availability of financing to middle market companies.
Attractive Market Segment
We believe that the underserved nature of such a large segment of the market can at times create a significant opportunity for investment. In many environments, we believe that middle market companies are more likely to offer attractive economics in terms of transaction pricing, up-front and ongoing fees, prepayment penalties and security features in the form of stricter covenants and quality collateral than loans to larger companies. In addition, as compared to larger companies, middle market companies often have simpler capital structures and carry less leverage, thus aiding the structuring and negotiation process and allowing us greater flexibility in structuring favorable transactions. We believe that these factors will result in advantageous conditions in which to pursue our investment objectives of generating current income and, to a lesser extent, long-term capital appreciation.
Characteristics of and Risks Related to Investments in Private Companies
We invest primarily in the debt of private middle market U.S. companies. Investments in private companies pose significantly greater risks than investments in public companies. First, private companies have reduced access to the capital markets, resulting in diminished capital resources and ability to withstand financial distress. As a result, these companies, which may present greater credit risk than public companies, may be unable to meet the obligations under their debt securities that we hold. Second, the investments themselves may often be illiquid. The securities of most of the companies in which we invest are not publicly-traded or actively-traded on the secondary market and are, instead, traded on a privately negotiated over-the-counter secondary market for institutional investors. In addition, our directly originated investments generally will not be traded on any secondary market and a trading market for such investments may not develop. The securities in which we invest may also be subject to legal and other restrictions on resale. As such, we may have difficulty exiting an investment promptly or at a desired price prior to maturity or outside of a normal amortization schedule. These investments may also be difficult to value because little public information generally exists about private companies, requiring an experienced due diligence team to analyze and value the potential portfolio company. Finally, these companies may not have third-party debt ratings or audited financial statements. We must therefore rely on the ability of FB Advisor and/or GDFM to obtain adequate information through their due diligence efforts to evaluate the creditworthiness of, and risks involved in, investing in these companies, and to determine the optimal time to exit an investment. These companies and their financial information will also generally not be subject to the Sarbanes-Oxley Act of 2002, or the Sarbanes-Oxley Act, and other rules and regulations that govern public companies that are designed to protect investors.
7
Table of Contents
Investment Strategy
Our principal focus is to invest in senior secured and second lien secured loans of private U.S. middle market companies, and to a lesser extent, subordinated loans of private U.S. companies. Although we do not expect a significant portion of our portfolio to be comprised of subordinated loans, there is no limit on the amount of such loans in which we may invest. We may purchase interests in loans or make other debt investments, including investments in senior secured bonds, through secondary market transactions in the “over-the-counter” market or directly from our target companies as primary market or directly originated investments. In connection with our debt investments, we may on occasion receive equity interests such as warrants or options as additional consideration. We may also purchase minority interests in the form of common or preferred equity or the equity-related securities in our target companies, generally in conjunction with one of our debt investments or through a co-investment with a financial sponsor, such as an institutional investor or private equity firm. In addition, a portion of our portfolio may be comprised of corporate bonds, other debt securities and derivatives, including total return swaps and credit default swaps. FB Advisor will seek to tailor our investment focus as market conditions evolve. Depending on market conditions, we may increase or decrease our exposure to less senior portions of the capital structure or otherwise make opportunistic investments.
When identifying prospective portfolio companies, we focus primarily on the attributes set forth below, which we believe will help us generate higher total returns with an acceptable level of risk. While these criteria provide general guidelines for our investment decisions, we caution investors that, if we believe the benefits of investing are sufficiently strong, not all of these criteria necessarily will be met by each prospective portfolio company in which we choose to invest. These attributes are:
| • | Leading, defensible market positions. We seek to invest in companies that have developed strong positions within their respective markets and exhibit the potential to maintain sufficient cash flows and profitability to service our debt in a range of economic environments. We seek companies that can protect their competitive advantages through scale, scope, customer loyalty, product pricing or product quality versus their competitors, thereby minimizing business risk and protecting profitability. |
| • | Investing in stable companies with positive cash flow. We seek to invest in established, stable companies with strong profitability and cash flows. Such companies, we believe, are well-positioned to maintain consistent cash flow to service and repay our loans and maintain growth in their businesses or market share. We do not intend to invest to any significant degree in start-up companies, turnaround situations or companies with speculative business plans. |
| • | Proven management teams. We focus on companies that have experienced management teams with an established track record of success. We typically prefer our portfolio companies to have proper incentives in place, which may include non-cash and performance-based compensation, to align management’s goals with ours. |
| • | Private equity sponsorship. Often, we seek to participate in transactions sponsored by what we believe to be sophisticated and seasoned private equity firms. FB Advisor’s management team believes that a private equity sponsor’s willingness to invest significant sums of equity capital into a company is an endorsement of the quality of the investment. Further, by co-investing with such experienced private equity firms which commit significant sums of equity capital ranking junior in priority of payment to our debt investments, we may benefit from the due diligence review performed by the private equity firm, in addition to our own due diligence review. Further, strong private equity sponsors with significant investments at risk have the ability and a strong incentive to contribute additional capital in difficult economic times should operational or financial issues arise, which could provide additional protections for our investments. |
| • | Allocation among various issuers and industries. We seek to allocate our portfolio broadly among issuers and industries, thereby attempting to reduce the risk of a downturn in any one company or industry having a disproportionate adverse impact on the value of our portfolio. |
8
Table of Contents
| • | Viable exit strategy. While we attempt to invest in securities that may be sold in a privately negotiated over-the-counter market, providing us a means by which we may exit our positions, we expect that a large portion of our portfolio may not be sold on this secondary market. For any investments that are not able to be sold within this market, we focus primarily on investing in companies whose business models and growth prospects offer attractive exit possibilities, including repayment of our investments, an initial public offering of equity securities, a merger, a sale or a recapitalization, in each case with the potential for capital gains. |
In addition, in an order dated June 4, 2013, the SEC granted exemptive relief that, subject to the satisfaction of certain conditions, expands our ability to co-invest in certain privately negotiated investment transactions with our co-investment affiliates, which we believe has and may continue to enhance our ability to further our investment objectives and strategy.
Potential Competitive Strengths
We believe that we offer our investors the following potential competitive strengths:
Global platform with seasoned investment professionals
We believe that the breadth and depth of the experience of FB Advisor’s senior management team, together with the wider resources of GSO’s investment team, which is dedicated to sourcing, structuring, executing, monitoring and harvesting a broad range of private investments, as well as the specific expertise of GDFM, provide us with a significant competitive advantage in sourcing and analyzing attractive investment opportunities.
Long-term investment horizon
Our long-term investment horizon gives us great flexibility, which we believe allows us to maximize returns on our investments. Unlike most private equity and venture capital funds, as well as many private debt funds, we are not required to return capital to our stockholders once we exit a portfolio investment. We believe that freedom from such capital return requirements, which allows us to invest using a longer-term focus, provides us with the opportunity to increase total returns on invested capital, compared to other private company investment vehicles.
GDFM transaction sourcing capability
FB Advisor seeks to leverage GDFM’s significant access to transaction flow. GDFM seeks to generate investment opportunities through syndicate and club deals (generally, investments made by a small group of investment firms) and, subject to regulatory constraints as discussed under “—Regulation,” and the allocation policies of GDFM and its affiliates, as applicable, also through GSO’s direct origination channels. These include significant contacts to participants in the credit and leveraged finance marketplace, which it can draw upon in sourcing investment opportunities for us. With respect to syndicate and club deals, GDFM has built a network of relationships with commercial and investment banks, finance companies and other investment funds as a result of the long track record of its investment professionals in the leveraged finance marketplace. With respect to GDFM’s origination channel, FB Advisor seeks to leverage the global presence of GSO to generate access to a substantial amount of directly originated transactions with attractive investment characteristics. We believe that the broad network of GDFM provides a significant pipeline of investment opportunities for us. GDFM also has a significant trading platform, which, we believe, allows us access to the secondary market for investment opportunities.
Disciplined, income-oriented investment philosophy
FB Advisor and GDFM employ a defensive investment approach focused on long-term credit performance and principal protection. This investment approach involves a multi-stage selection process for each investment opportunity, as well as ongoing monitoring of each investment made, with particular emphasis on early detection of deteriorating credit conditions at portfolio companies which would result in adverse portfolio developments. This strategy is designed to maximize current income and minimize the risk of capital loss while maintaining the potential for long-term capital appreciation.
9
Table of Contents
Investment expertise across all levels of the corporate capital structure
FB Advisor and GDFM believe that their broad expertise and experience investing at all levels of a company’s capital structure enable us to manage risk while affording us the opportunity for significant returns on our investments. We attempt to capitalize on this expertise in an effort to produce and maintain an investment portfolio that will perform in a broad range of economic conditions.
Operating and Regulatory Structure
Our investment activities are managed by FB Advisor and supervised by our board of directors, a majority of whom are independent. Under our amended and restated investment advisory agreement, dated July 17, 2014, or the July 2014 investment advisory agreement, we have agreed to pay FB Advisor an annual base management fee based on the average value of our gross assets as well as incentive fees based on our performance. See “Item 7. Management’s Discussion and Analysis of Financial Condition and Results of Operations—Contractual Obligations” for a description of the fees we pay to FB Advisor.
From time to time, FB Advisor may enter into sub-advisory relationships with registered investment advisers that possess skills or attributes that FB Advisor believes will aid it in achieving our investment objectives. FB Advisor has engaged GDFM to act as our investment sub-adviser. GDFM assists FB Advisor in identifying investment opportunities and makes investment recommendations for approval by FB Advisor according to guidelines set by FB Advisor.
FB Advisor oversees our day-to-day operations, including the provision of general ledger accounting, fund accounting, legal services, investor relations and other administrative services. FB Advisor also performs, or oversees the performance of, our corporate operations and required administrative services, which includes being responsible for the financial records which we are required to maintain and preparing reports for our stockholders and reports filed with the SEC. In addition, FB Advisor assists us in calculating our net asset value, overseeing the preparation and filing of tax returns and the printing and dissemination of reports to our stockholders, and generally overseeing the payment of our expenses and the performance of administrative and professional services rendered to us by others.
Pursuant to the administration agreement, we reimburse FB Advisor for expenses necessary to perform services related to our administration and operations, including FB Advisor’s allocable portion of the compensation and related expenses of certain personnel of Franklin Square Holdings providing administrative services to us on behalf of FB Advisor. We reimburse FB Advisor no less than quarterly for all costs and expenses incurred by FB Advisor in performing its obligations and providing personnel and facilities under the administration agreement. FB Advisor allocates the cost of such services to us based on factors such as total assets, revenues, time allocations and/or other reasonable metrics. Our board of directors reviews the methodology employed in determining how the expenses are allocated to us and the proposed allocation of administrative expenses among us and certain affiliates of FB Advisor. Our board of directors then assesses the reasonableness of such reimbursements for expenses allocated to us based on the breadth, depth and quality of such services as compared to the estimated cost to us of obtaining similar services from third-party service providers known to be available. In addition, our board of directors considers whether any single third-party service provider would be capable of providing all such services at comparable cost and quality. Finally, our board of directors compares the total amount paid to FB Advisor for such services as a percentage of our net assets to the same ratio as reported by other comparable BDCs.
We have contracted with State Street Bank and Trust Company to provide various accounting and administrative services, including, but not limited to, preparing preliminary financial information for review by FB Advisor, preparing and monitoring expense budgets, maintaining accounting and corporate books and records, processing trade information provided by us and performing testing with respect to RIC compliance. We have also contracted with Vigilant Compliance, LLC to provide us with a chief compliance officer, Salvatore Faia, president of that firm.
10
Table of Contents
As a BDC, we are required to comply with certain regulatory requirements. Also, while we are permitted to finance investments using debt, our ability to use debt will be limited in certain significant respects pursuant to the 1940 Act. Within the limits of existing regulation, we will adjust our use of debt, according to market conditions, to the level we believe will allow us to generate maximum risk-adjusted returns. See “—Regulation.” We have elected to be treated for U.S. federal income tax purposes, and intend to qualify annually, as a RIC under Subchapter M of the Code.
Investment Types
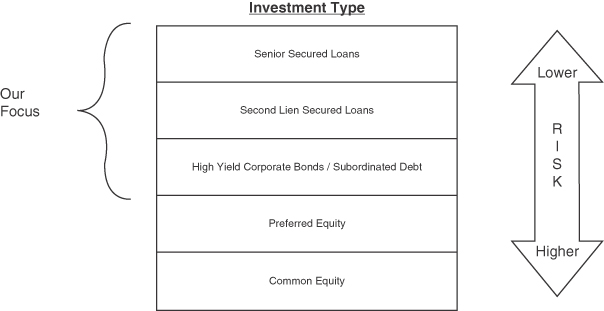
Our portfolio is comprised primarily of investments in senior secured loans and second lien secured loans of private U.S middle market companies and, to a lesser extent, subordinated loans of private U.S. companies. Although we do not expect a significant portion of our portfolio to be comprised of subordinated loans, there is no limit on the amount of such loans in which we may invest. We may purchase interests in loans or make other debt investments, including investments in senior secured bonds, through secondary market transactions in the “over-the-counter” market or directly from our target companies as primary market or directly originated investments. In connection with our debt investments, we may on occasion receive equity interests such as warrants or options as additional consideration. We may also purchase minority interests in the form of common or preferred equity or the equity-related securities in our target companies, generally in conjunction with one of our debt investments or through a co-investment with a financial sponsor, such as an institutional investor or private equity firm. In addition, a portion of our portfolio may be comprised of corporate bonds, other debt securities and derivatives, including total return swaps and credit default swaps. FB Advisor will seek to tailor our investment focus as market conditions evolve. Depending on market conditions, we may increase or decrease our exposure to less senior portions of the capital structure, where returns tend to be stronger in a more stable or growing economy, but less secure in weak economic environments. Below is a diagram illustrating where these investments lie in a typical portfolio company’s capital structure. Senior secured debt is situated at the top of the capital structure and typically has the first claim on the assets and cash flows of the company, followed by second lien secured debt, subordinated debt, preferred equity and, finally, common equity. Due to this priority of cash flows, an investment’s risk increases as it moves further down the capital structure. Investors are usually compensated for this risk associated with junior status in the form of higher returns, either through higher interest payments or potentially higher capital appreciation. We rely on FB Advisor’s and GDFM’s experience to structure investments, possibly using all levels of the capital structure, which we believe will perform in a broad range of economic environments.
Typical Leveraged Capital Structure Diagram
11
Table of Contents
Senior Secured Loans
Senior secured loans are situated at the top of the capital structure. Because these loans generally have priority in payment, they carry the least risk among all investments in a firm. Generally, our senior secured loans are expected to have maturities of three to seven years, offer some form of amortization, and have first priority security interests in the assets of the borrower. Generally, we expect that the interest rate on our senior secured loans typically will have variable rates ranging between 6.0% and 10.0% over a standard benchmark, such as the prime rate or the London Interbank Offered Rate, or LIBOR.
Second Lien Secured Loans
Second lien secured loans are immediately junior to senior secured loans and have substantially the same maturities, collateral and covenant structures as senior secured loans. Second lien secured loans, however, are granted a second priority security interest in the assets of the borrower, which means that any realization of collateral will generally be applied to pay senior secured loans in full before second lien secured loans are paid and the value of the collateral may not be sufficient to repay in full both senior secured loans and second lien secured loans. In return for this junior ranking, second lien secured loans generally offer higher returns compared to senior secured debt. These higher returns come in the form of higher interest and in some cases the potential for equity participation through warrants, though to a lesser extent than with subordinated loans. Generally, we expect these loans to carry a fixed rate, or a floating current yield of 9.0% to 12.0% over a standard benchmark. In addition, we may receive additional returns from any warrants we may receive in connection with these investments.
Senior Secured Bonds
Senior secured bonds are generally secured by collateral on a senior, pari passu or junior basis with other debt instruments in an issuer’s capital structure and have similar maturities and covenant structures as senior secured loans. Generally, we expect these investments to carry a fixed rate of 8.0% to 14.0%.
Subordinated Debt
In addition to senior secured loans, second lien secured loans and senior secured bonds, we may invest a portion of our assets in subordinated debt. Subordinated debt investments usually rank junior in priority of payment to senior debt and are often unsecured, but are situated above preferred equity and common equity in the capital structure. In return for their junior status compared to senior debt, subordinated debt investments typically offer higher returns through both higher interest rates and possible equity ownership in the form of warrants, enabling the lender to participate in the capital appreciation of the borrower. These warrants typically require only a nominal cost to exercise. We generally target subordinated debt with interest-only payments throughout the life of the security, with the principal due at maturity. Typically, subordinated debt investments have maturities of five to ten years. Generally, we expect these securities to carry a fixed rate, or a floating current yield of 7.5% to 14.0% over a standard benchmark. In addition, we may receive additional returns from any warrants we may receive in connection with these investments. In some cases, a portion of the total interest may accrue or be paid-in-kind, or PIK.
Equity and Equity-Related Securities
While we intend to maintain our focus on investments in debt securities, from time to time, when we see the potential for extraordinary gain, or in connection with securing particularly favorable terms in a debt investment, we may enter into non-control investments in preferred or common equity, typically in conjunction with a private equity sponsor we believe to be sophisticated and seasoned. In addition, we typically receive the right to make equity investments in a portfolio company whose debt securities we hold in connection with the next equity financing round for that company. This right will provide us with the opportunity to further enhance our returns over time through equity investments in our portfolio companies. In addition, we may hold equity-related
12
Table of Contents
securities, such as rights and warrants that may be converted into or exchanged for common stock or other equity or the cash value of common stock or other equity, generally obtained in conjunction with one of our debt investments or through a co-investment with a financial sponsor, such as an institutional investor or private equity firm. In the future, we may achieve liquidity through a merger or acquisition of a portfolio company, a public offering of a portfolio company’s stock or by exercising our right, if any, to require a portfolio company to repurchase the equity-related securities we hold. With respect to any preferred or common equity investments, we expect to target an annual investment return of at least 15%.
Non-U.S. Securities
We may invest in non-U.S. securities, which may include securities denominated in U.S. dollars or in non-U.S. currencies, to the extent permitted by the 1940 Act.
Other Securities
We may also invest from time to time in derivatives, including total return swaps and credit default swaps.
Cash and Cash Equivalents
We may maintain a certain level of cash or equivalent instruments to make follow-on investments, if necessary, in existing portfolio companies or to take advantage of new opportunities.
Comparison of Targeted Debt Investments to Corporate Bonds
Loans to private companies are debt instruments that can be compared to corporate bonds to aid an investor’s understanding. As with corporate bonds, loans to private companies can range in credit quality depending on security-specific factors, including total leverage, amount of leverage senior to the security in question, variability in the issuer’s cash flows, the quality of assets securing debt and the degree to which such assets cover the subject company’s debt obligations. As is the case in the corporate bond market, we will require greater returns for securities that we perceive to carry increased risk. The companies in which we invest may be leveraged, often as a result of leveraged buyouts or other recapitalization transactions, and, in many cases, will not be rated by national rating agencies. When our targeted debt investments do carry ratings from a NRSRO, we believe that such ratings generally will be below investment grade (rated lower than “Baa3” by Moody’s or lower than “BBB-” by S&P). To the extent we make unrated investments, we believe that such investments would likely receive similar ratings if they were to be examined by a NRSRO. Compared to below-investment grade corporate bonds that are typically available to the public, our targeted senior secured and second lien secured loan investments are higher in the capital structure, have priority in receiving payment, are secured by the issuer’s assets, allow the lender to seize collateral if necessary, and generally exhibit higher rates of recovery in the event of default. Corporate bonds, on the other hand, are often unsecured obligations of the issuer.
The market for loans to private companies possesses several key differences compared to the corporate bond market. For instance, due to a possible lack of debt ratings for certain middle market firms, and also due to the reduced availability of information for private companies, investors must conduct extensive due diligence investigations before committing to an investment. This intensive due diligence process gives the investor significant access to management, which is often not possible in the case of corporate bondholders, who rely on underwriters, debt rating agencies and publicly available information for due diligence reviews and monitoring of corporate issuers. While holding these investments, private debt investors often receive monthly or quarterly updates on the portfolio company’s financial performance, along with possible representation on the company’s board of directors, which allows the investor to take remedial action quickly if conditions happen to deteriorate. Due to reduced liquidity, the relative scarcity of capital and extensive due diligence and expertise required on the part of the investor, we believe that private debt securities typically offer higher returns than corporate bonds of equivalent credit quality.
13
Table of Contents
Sources of Income
The primary means through which our stockholders will receive a return of value is through interest income, dividends and capital gains generated by our investments. In addition to these sources of income, we may receive fees paid by our portfolio companies, including one-time closing fees paid at the time each investment is made. Closing fees typically range from 1.0% to 2.0% of the purchase price of an investment. In addition, we may generate revenues in the form of commitment, origination, structuring or diligence fees, fees for providing managerial assistance, consulting fees and performance-based fees.
Risk Management
We seek to limit the downside potential of our investment portfolio by:
| • | applying our investment strategy guidelines for portfolio investments; |
| • | requiring a total return on investments (including both interest and potential appreciation) that adequately compensates us for credit risk; |
| • | allocating our portfolio among various issuers and industries, size permitting, with an adequate number of companies, across different industries, with different types of collateral; and |
| • | negotiating or seeking debt investments with covenants or features that protect us while affording portfolio companies flexibility in managing their businesses consistent with preservation of capital, which may include affirmative and negative covenants, default penalties, lien protection, change of control provisions and board rights. |
We may also enter into interest rate hedging transactions at the sole discretion of FB Advisor. Such transactions will enable us to selectively modify interest rate exposure as market conditions dictate.
Affirmative Covenants
Affirmative covenants require borrowers to take actions that are meant to ensure the solvency of the company, facilitate the lender’s monitoring of the borrower, and ensure payment of interest and loan principal due to lenders. Examples of affirmative covenants include covenants requiring the borrower to maintain adequate insurance, accounting and tax records, and to produce frequent financial reports for the benefit of the lender.
Negative Covenants
Negative covenants impose restrictions on the borrower and are meant to protect lenders from actions that the borrower may take that could harm the credit quality of the lender’s investments. Examples of negative covenants include restrictions on the payment of dividends and restrictions on the issuance of additional debt without the lender’s approval. In addition, certain covenants restrict a borrower’s activities by requiring it to meet certain earnings interest coverage ratio and leverage ratio requirements. These covenants are also referred to as financial or maintenance covenants.
Investment Process
The investment professionals employed by FB Advisor and GDFM have spent their careers developing the resources necessary to invest in private companies. Our transaction process is highlighted below.
14
Table of Contents
Our Transaction Process

Sourcing
In order to source transactions, FB Advisor seeks to leverage GDFM’s significant access to transaction flow, along with GDFM’s trading platform. GDFM seeks to generate investment opportunities through its trading platform, through syndicate and club deals and, subject to regulatory constraints and the allocation policies of GDFM and its affiliates, as applicable, through GSO’s direct origination channels. With respect to syndicate and club deals, GDFM has built a network of relationships with commercial and investment banks, finance companies and other investment funds as a result of the long track record of its investment professionals in the leveraged finance marketplace. With respect to GDFM’s origination channel, FB Advisor seeks to leverage the global presence of GSO to generate access to a substantial amount of directly originated transactions with attractive investment characteristics. We believe that the broad network of GDFM provides a significant pipeline of investment opportunities for us.
Evaluation
Initial Review. In its initial review of an investment opportunity to present to FB Advisor, GDFM’s transaction team examines information furnished by the target company and external sources, including rating agencies, if applicable, to determine whether the investment meets our basic investment criteria and other guidelines specified by FB Advisor, within the context of proper allocation of our portfolio among various issuers and industries, and offers an acceptable probability of attractive returns with identifiable downside risk. For the majority of securities available on the secondary market, a comprehensive analysis is conducted and continuously maintained by a dedicated GDFM research analyst, the results of which are available for the transaction team to review. In the case of a directly originated transaction, FB Advisor and GDFM conduct detailed due diligence investigations as necessary.
Credit Analysis/Due Diligence. Before undertaking an investment, the transaction team from GDFM and FB Advisor conducts a thorough due diligence review of the opportunity to ensure the company fits our investment strategy, which may include:
| • | a full operational analysis to identify the key risks and opportunities of the target’s business, including a detailed review of historical and projected financial results; |
| • | a detailed analysis of industry dynamics, competitive position, regulatory, tax and legal matters; |
| • | on-site visits, if deemed necessary; |
| • | background checks to further evaluate management and other key personnel; |
| • | a review by legal and accounting professionals, environmental or other industry consultants, if necessary; |
| • | financial sponsor due diligence, including portfolio company and lender reference checks, if necessary; and |
| • | a review of management’s experience and track record. |
When possible, our advisory team seeks to structure transactions in such a way that our target companies are required to bear the costs of due diligence, including those costs related to any outside consulting work we may require.
15
Table of Contents
Execution
Recommendation. FB Advisor has engaged GDFM to identify and recommend investment opportunities for its approval. GDFM seeks to maintain a defensive approach toward its investment recommendations by emphasizing risk control in its transaction process, which includes (i) the pre-review of each opportunity by one of its portfolio managers to assess the general quality, value and fit relative to our portfolio, (ii) where possible, transaction structuring with a focus on preservation of capital in varying economic environments and (iii) ultimate approval of investment recommendations by GDFM’s investment committee.
Approval. After completing its internal transaction process, GDFM makes formal recommendations for review and approval by FB Advisor. In connection with its recommendation, it transmits any relevant underwriting material and other information pertinent to the decision-making process. In addition, GDFM makes its staff available to answer inquiries by FB Advisor in connection with its recommendations. The consummation of a transaction requires unanimous approval of the members of FB Advisor’s investment committee.
Monitoring
Portfolio Monitoring. FB Advisor, with the help of GDFM, monitors our portfolio with a focus toward anticipating negative credit events. To maintain portfolio company performance and help to ensure a successful exit, FB Advisor and GDFM work closely with, as applicable, the lead equity sponsor, loan syndicator, portfolio company management, consultants, advisers and other security holders to discuss financial position, compliance with covenants, financial requirements and execution of the company’s business plan. In addition, depending on the size, nature and performance of the transaction, we may occupy a seat or serve as an observer on a portfolio company’s board of directors or similar governing body.
Typically, FB Advisor and GDFM receive financial reports detailing operating performance, sales volumes, margins, cash flows, financial position and other key operating metrics on a quarterly basis from our portfolio companies. FB Advisor and GDFM use this data, combined with due diligence gained through contact with the company’s customers, suppliers, competitors, market research and other methods, to conduct an ongoing, rigorous assessment of the company’s operating performance and prospects.
In addition to various risk management and monitoring tools, FB Advisor uses an investment rating system to characterize and monitor the expected level of returns on each investment in our portfolio. FB Advisor uses an investment rating scale of 1 to 5. The following is a description of the conditions associated with each investment rating:
| Investment Rating |
Summary Description | |
| 1 | Investment exceeding expectations and/or capital gain expected. | |
| 2 | Performing investment generally executing in accordance with the portfolio company’s business plan—full return of principal and interest expected. | |
| 3 | Performing investment requiring closer monitoring. | |
| 4 | Underperforming investment—some loss of interest or dividend possible, but still expecting a positive return on investment. | |
| 5 | Underperforming investment with expected loss of interest and some principal. | |
FB Advisor monitors and, when appropriate, changes the investment ratings assigned to each investment in our portfolio. In connection with valuing our assets, our board of directors reviews these investment ratings on a quarterly basis. In the event that our advisory team determines that an investment is underperforming, or circumstances suggest that the risk associated with a particular investment has significantly increased, we will attempt to sell the asset in the secondary market, if applicable, or to implement a plan to attempt to exit the investment or to correct the situation.
16
Table of Contents
The following table shows the distribution of our investments on the 1 to 5 investment rating scale at fair value as of December 31, 2014 and 2013:
| December 31, 2014 | December 31, 2013 | |||||||||||||||
| Investment Rating |
Fair Value |
Percentage
of Portfolio |
Fair Value |
Percentage
of Portfolio |
||||||||||||
| 1 |
$ | 484,332 | 12 | % | $ | 510,687 | 12 | % | ||||||||
| 2 |
3,213,335 | 77 | % | 3,244,518 | 79 | % | ||||||||||
| 3 |
434,620 | 10 | % | 340,238 | 8 | % | ||||||||||
| 4 |
37,178 | 1 | % | 40,034 | 1 | % | ||||||||||
| 5 |
13,982 | 0 | % | 2,104 | 0 | % | ||||||||||
|
|
|
|
|
|
|
|
|
|||||||||
| Total |
$ | 4,183,447 | 100 | % | $ | 4,137,581 | 100 | % | ||||||||
|
|
|
|
|
|
|
|
|
|||||||||
The amount of the portfolio in each grading category may vary substantially from period to period resulting primarily from changes in the composition of the portfolio as a result of new investment, repayment and exit activities. In addition, changes in the grade of investments may be made to reflect our expectation of performance and changes in investment values.
Valuation Process. Each quarter, we value investments in our portfolio, and such values are disclosed each quarter in reports filed with the SEC. Investments for which market quotations are readily available are recorded at such market quotations. With respect to investments for which market quotations are not readily available, our board of directors determines the fair value of such investments in good faith, utilizing the input of management, our valuation committee, FB Advisor and any other professionals or materials that our board of directors deems worthy and relevant, including GDFM, independent third-party pricing services and independent third-party valuation firms, if applicable. See “Item 7. Management’s Discussion and Analysis of Financial Condition and Results of Operations—Critical Accounting Policies—Valuation of Portfolio Investments.”
Managerial Assistance. As a BDC, we must offer, and provide upon request, managerial assistance to certain of our portfolio companies. This assistance could involve, among other things, monitoring the operations of our portfolio companies, participating in board and management meetings, consulting with and advising officers of portfolio companies and providing other organizational and financial guidance. Depending on the nature of the assistance required, FB Advisor or GDFM will provide such managerial assistance on our behalf to portfolio companies that request this assistance. To the extent fees are paid for these services, we, rather than FB Advisor or GDFM, will retain any fees paid for such assistance.
Exit
While we attempt to invest in securities that may be sold in a privately negotiated over-the-counter market, providing us a means by which we may exit our positions, we expect that a large portion of our portfolio may not be sold on this secondary market. For any investments that are not able to be sold within this market, we focus primarily on investing in companies whose business models and growth prospects offer attractive exit possibilities, including repayment of our investments, an initial public offering of equity securities, a merger, a sale or a recapitalization, in each case with the potential for capital gains.
17
Table of Contents
Financing Arrangements
To seek to enhance our returns, we employ leverage as market conditions permit and at the discretion of FB Advisor, but in no event will leverage employed exceed 50% of the value of our assets, as required by the 1940 Act. Below is a summary of our outstanding financing arrangements as of December 31, 2014:
| Arrangement |
Type of Arrangement |
Rate |
Amount Outstanding |
Amount Available |
Maturity Date | |||||||||
| Broad Street Credit Facility |
Revolving Credit Facility | L+1.50% | $ | 65,808 | $ | 59,192 | December 18, 2015 | |||||||
| ING Credit Facility |
Revolving Credit Facility | L+2.50% | $ | 123,019 | (1) | $ | 176,981 | April 3, 2018 | ||||||
| JPM Facility |
Repurchase Agreement | 3.25% | $ | 950,000 | $ | — | April 15, 2017 | |||||||
| 4.000% Notes due 2019 |
Unsecured Notes | 4.00% | $ | 400,000 | $ | — | July 15, 2019 | |||||||
| 4.250% Notes due 2020 |
Unsecured Notes | 4.25% | $ | 325,000 | $ | — | January 15, 2020 | |||||||
| (1) | Amount includes borrowing in U.S. dollars and Euros. Euro balance outstanding of €29,625 has been converted to U.S. dollars at an exchange rate of €1.00 to $1.21 as of December 31, 2014 to reflect total amount outstanding in U.S. dollars. |
Our average borrowings and weighted average interest rate, including the effect of non-usage fees, for the year ended December 31, 2014 were $1,825,246 and 3.16%, respectively. As of December 31, 2014, our weighted average effective interest rate on borrowings, including the effect of non-usage fees was 3.53%.
See “Item 7. Management’s Discussion and Analysis of Financial Condition and Results of Operations—Financial Condition, Liquidity and Capital Resources” for additional information regarding our financing arrangements.
Regulation
We have elected to be regulated as a BDC under the 1940 Act. The 1940 Act contains prohibitions and restrictions relating to transactions between BDCs and their affiliates, principal underwriters and affiliates of those affiliates or underwriters. The 1940 Act requires that a majority of our directors be persons other than “interested persons,” as that term is defined in the 1940 Act. In addition, the 1940 Act provides that we may not change the nature of our business so as to cease to be, or to withdraw our election as, a BDC unless approved by a majority of our outstanding voting securities.
The 1940 Act defines “a majority of the outstanding voting securities” as the lesser of (i) 67% or more of the voting securities present at a meeting if the holders of more than 50% of our outstanding voting securities are present or represented by proxy or (ii) 50% of our voting securities.
We will generally not be able to issue and sell our common stock at a price per share, after deducting underwriting commissions and discounts, that is below our net asset value per share. See “Item 1A. Risk Factors—Risks Related to Business Development Companies—Regulations governing our operation as a BDC and RIC will affect our ability to raise, and the way in which we raise, additional capital or borrow for investment purposes, which may have a negative effect on our growth.” We may, however, sell our common stock, or warrants, options or rights to acquire our common stock, at a price below the then-current net asset value of our common stock if our board of directors determines that such sale is in our best interests and the best interests of our stockholders, and our stockholders approve such sale. At a 2014 special stockholders meeting, our stockholders approved the sale of shares of our common stock at a price below the then-current net asset value per share, subject to certain conditions, during the period beginning on July 17, 2014 and expiring on July 17, 2015. We currently do not intend to utilize this authority to sell shares of our common stock at a price below the then-current net asset value per share. In addition, we may generally issue new shares of our common stock at a price below net asset value per share in rights offerings to existing stockholders, in payment of dividends and in certain other limited circumstances.
18
Table of Contents
As a BDC, we are subject to certain regulatory restrictions in making our investments. For example, we generally will not be permitted to co-invest with certain entities affiliated with FB Advisor or GDFM in transactions originated by FB Advisor or GDFM or their respective affiliates unless we obtain an exemptive order from the SEC or co-invest alongside FB Advisor or GDFM or their respective affiliates in accordance with existing regulatory guidance and the allocation policies of FB Advisor, GDFM and their respective affiliates, as applicable. However, we will be permitted to, and may, co-invest in syndicated deals and secondary loan market transactions where price is the only negotiated point. In an order dated June 4, 2013, the SEC granted exemptive relief permitting us, subject to the satisfaction of certain conditions, to co-invest in certain privately negotiated investment transactions with our co-investment affiliates. We believe this relief has and may continue to enhance our ability to further our investment objectives and strategy. We believe this relief may also increase favorable investment opportunities for us, in part, by allowing us to participate in larger investments, together with our co-investment affiliates, than would be available to us if we had not obtained such relief. Because we did not seek exemptive relief to engage in co-investment transactions with GDFM and its affiliates, we will continue to be permitted to co-invest with GDFM and its affiliates only in accordance with existing regulatory guidance.
Qualifying Assets
Under the 1940 Act, a BDC may not acquire any asset other than assets of the type listed in Section 55(a) of the 1940 Act, which are referred to as qualifying assets, unless, at the time the acquisition is made, qualifying assets represent at least 70% of the company’s total assets. The principal categories of qualifying assets relevant to our business are any of the following:
| 1. | Securities purchased in transactions not involving any public offering from the issuer of such securities, which issuer (subject to certain limited exceptions) is an eligible portfolio company, or from any person who is, or has been during the preceding 13 months, an affiliated person of an eligible portfolio company, or from any other person, subject to such rules as may be prescribed by the SEC. An eligible portfolio company is defined in the 1940 Act as any issuer which: |
| a. | is organized under the laws of, and has its principal place of business in, the United States; |
| b. | is not an investment company (other than a small business investment company wholly owned by the BDC) or a company that would be an investment company but for certain exclusions under the 1940 Act; and |
| c. | satisfies any of the following: |
| i. | does not have any class of securities that is traded on a national securities exchange; |
| ii. | has a class of securities listed on a national securities exchange, but has an aggregate market value of outstanding voting and non-voting common equity of less than $250 million; |
| iii. | is controlled by a BDC or a group of companies including a BDC and the BDC has an affiliated person who is a director of the eligible portfolio company; or |
| iv. | is a small and solvent company having total assets of not more than $4.0 million and capital and surplus of not less than $2.0 million. |
| 2. | Securities of any eligible portfolio company that we control. |
| 3. | Securities purchased in a private transaction from a U.S. issuer that is not an investment company or from an affiliated person of the issuer, or in transactions incident thereto, if the issuer is in bankruptcy and subject to reorganization or if the issuer, immediately prior to the purchase of its securities was unable to meet its obligations as they came due without material assistance other than conventional lending or financing arrangements. |
| 4. | Securities of an eligible portfolio company purchased from any person in a private transaction if there is no ready market for such securities and we already own 60% of the outstanding equity of the eligible portfolio company. |
19
Table of Contents
| 5. | Securities received in exchange for or distributed on or with respect to securities described in (1) through (4) above, or pursuant to the exercise of warrants or rights relating to such securities. |
| 6. | Cash, cash equivalents, U.S. government securities or high-quality debt securities maturing in one year or less from the time of investment. |
In addition, a BDC must have been organized and have its principal place of business in the United States and must be operated for the purpose of making investments in the types of securities described in (1), (2) or (3) above.
Managerial Assistance to Portfolio Companies
In order to count portfolio securities as qualifying assets for the purpose of the 70% test, we must either control the issuer of the securities or must offer to make available to the issuer of the securities (other than small and solvent companies described above) significant managerial assistance; except that, where we purchase such securities in conjunction with one or more other persons acting together, one of the other persons in the group may make available such managerial assistance. Making available managerial assistance means, among other things, any arrangement whereby the BDC, through its directors, officers or employees, offers to provide, and, if accepted, does so provide, significant guidance and counsel concerning the management, operations or business objectives and policies of a portfolio company.
Temporary Investments
Pending investment in other types of “qualifying assets,” as described above, our investments may consist of cash, cash equivalents, U.S. government securities or high-quality debt securities maturing in one year or less from the time of investment, which we refer to, collectively, as temporary investments, so that 70% of our assets are qualifying assets. Typically, we will invest in U.S. Treasury bills or in repurchase agreements, provided that such agreements are fully collateralized by cash or securities issued by the U.S. government or its agencies. A repurchase agreement involves the purchase by an investor, such as us, of a specified security and the simultaneous agreement by the seller to repurchase it at an agreed-upon future date and at a price that is greater than the purchase price by an amount that reflects an agreed-upon interest rate. There is no percentage restriction on the proportion of our assets that may be invested in such repurchase agreements. However, if more than 25% of our total assets constitute repurchase agreements from a single counterparty, we would not meet the asset diversification tests in order to qualify as a RIC for U.S. federal income tax purposes as described below under “—Taxation as a RIC.” Thus, we do not intend to enter into repurchase agreements with a single counterparty in excess of this limit. FB Advisor will monitor the creditworthiness of the counterparties with which we enter into repurchase agreement transactions.
Senior Securities
We are permitted, under specified conditions, to issue multiple classes of debt and one class of stock senior to our common stock if our asset coverage, as defined in the 1940 Act, is at least equal to 200% immediately after each such issuance. In addition, while any senior securities remain outstanding, we must make provisions to prohibit any distribution to our stockholders or the repurchase of such securities or shares unless we meet the applicable asset coverage ratios at the time of the distribution or repurchase. We may also borrow amounts up to 5% of the value of our total assets for temporary purposes without regard to asset coverage. For a discussion of the risks associated with leverage, see “Item 1A. Risk Factors—Risks Related to Debt Financing” and “Item 1A. Risk Factors—Risks Related to Business Development Companies.”
Code of Ethics
We and FB Advisor have each adopted a code of ethics pursuant to Rule 17j-1 promulgated under the 1940 Act that, among other things, establishes procedures for personal investments and restricts certain personal securities transactions. Personnel subject to the code may invest in securities for their personal investment
20
Table of Contents
accounts, including securities that may be purchased or held by us, so long as such investments are made in accordance with the code’s requirements. On March 11, 2014, our board of directors adopted a revised code of business conduct and ethics, or code of ethics, that amended, restated and replaced the prior code of business conduct, ethics and statement on the prohibition of insider trading applicable to us. The code of ethics (i) clarified the applicability of certain provisions of the code of ethics to persons associated with FB Advisor to the extent such persons are not covered by a separate code of ethics and (ii) removed our insider trading policy from the code of ethics to a separate document administered by us. Our code of ethics was filed as an exhibit to our current report on Form 8-K filed with the SEC on March 12, 2014. Stockholders may also read and copy our and FB Advisor’s code of ethics at the SEC’s Public Reference Room located at 100 F Street, N.E., Washington, D.C. 20549. Stockholders may obtain information on the operation of the Public Reference Room by calling the SEC at (202) 551-8090. In addition, our and FB Advisor’s code of ethics is available on our website at www.fsinvestmentcorp.com and on the EDGAR Database on the SEC’s Internet site at www.sec.gov. Stockholders may also obtain a copy of our and FB Advisor’s code of ethics, after paying a duplicating fee, by electronic request at the following e-mail address: publicinfo@sec.gov, or by writing the SEC’s Public Reference Section at 100 F Street, N.E., Washington, D.C. 20549.
Compliance Policies and Procedures
We and FB Advisor have adopted and implemented written policies and procedures reasonably designed to prevent violation of the federal securities laws and are required to review these compliance policies and procedures annually for their adequacy and the effectiveness of their implementation. Our chief compliance officer and the chief compliance officer of FB Advisor are responsible for administering these policies and procedures.
Proxy Voting Policies and Procedures
We have delegated our proxy voting responsibility to FB Advisor. The proxy voting policies and procedures of FB Advisor are set forth below. The guidelines are reviewed periodically by FB Advisor and our non-interested directors, and, accordingly, are subject to change.
As an investment adviser registered under the Advisers Act, FB Advisor has a fiduciary duty to act solely in the best interests of its clients. As part of this duty, it recognizes that it must vote client securities in a timely manner free of conflicts of interest and in the best interests of its clients. These policies and procedures for voting proxies for the investment advisory clients of FB Advisor are intended to comply with Section 206 of, and Rule 206(4)-6 promulgated under, the Advisers Act.
FB Advisor will vote proxies relating to our securities in the best interest of its clients’ stockholders. It will review on a case-by-case basis each proposal submitted for a stockholder vote to determine its impact on the portfolio securities held by its clients. Although FB Advisor will generally vote against proposals that may have a negative impact on its clients’ portfolio securities, it may vote for such a proposal if there exists compelling long-term reasons to do so.
The proxy voting decisions of FB Advisor are made by the senior officers who are responsible for monitoring each of its clients’ investments. To ensure that its vote is not the product of a conflict of interest, it will require that: (a) anyone involved in the decision-making process disclose to its chief compliance officer any potential conflict that he or she is aware of and any contact that he or she has had with any interested party regarding a proxy vote; and (b) employees involved in the decision making process or vote administration are prohibited from revealing how FB Advisor intends to vote on a proposal in order to reduce any attempted influence from interested parties.
Stockholders may obtain information, without charge, regarding how FB Advisor voted proxies with respect to our portfolio securities by making a written request for proxy voting information to: Chief Compliance Officer, FS Investment Corporation, 201 Rouse Boulevard, Philadelphia, Pennsylvania 19112 or by calling us collect at (215) 495-1150.
21
Table of Contents
Other
We will be periodically examined by the SEC for compliance with the 1940 Act.
We are required to provide and maintain a bond issued by a reputable fidelity insurance company to protect us against larceny and embezzlement. Furthermore, as a BDC, we are prohibited from protecting any director or officer against any liability to us or our stockholders arising from willful misconduct, bad faith, gross negligence or reckless disregard of the duties involved in the conduct of such person’s office.
Securities Exchange Act and Sarbanes-Oxley Act Compliance
We are subject to the reporting and disclosure requirements of the Securities Exchange Act of 1934, as amended, or the Exchange Act, including the filing of quarterly, annual and current reports, proxy statements and other required items. In addition, we are subject to the Sarbanes-Oxley Act, which imposes a wide variety of regulatory requirements on publicly-held companies and their insiders. Many of these requirements affect us. For example:
| • | pursuant to Rule 13a-14 of the Exchange Act, our chief executive officer and chief financial officer are required to certify the accuracy of the financial statements contained in our periodic reports; |
| • | pursuant to Item 307 of Regulation S-K, our periodic reports are required to disclose our conclusions about the effectiveness of our disclosure controls and procedures; |
| • | pursuant to Rule 13a-15 of the Exchange Act, our management is required to prepare a report regarding its assessment of our internal control over financial reporting; and |
| • | pursuant to Item 308 of Regulation S-K, our auditors must attest to, and report on, our management’s assessment of our internal control over financial reporting. |
The Sarbanes-Oxley Act requires us to review our current policies and procedures to determine whether we comply with the Sarbanes-Oxley Act and the regulations promulgated thereunder. We monitor our compliance with all regulations that are adopted under the Sarbanes-Oxley Act and take actions necessary to ensure that we are in compliance therewith.
Taxation as a RIC
We have elected, effective as of the date of our formation, to be treated as a RIC under Subchapter M of the Code. As a RIC, we generally will not have to pay corporate-level U.S. federal income taxes on any income that we distribute to our stockholders from our tax earnings and profits. To qualify as a RIC, we must, among other things, meet certain source-of-income and asset diversification requirements (as described below). In addition, in order to maintain RIC tax treatment, we must distribute to our stockholders, for each taxable year, at least 90% of our “investment company taxable income,” which is generally our net ordinary income plus the excess, if any, of realized net short-term capital gains over realized net long-term capital losses, or the Annual Distribution Requirement.
If we:
| • | qualify as a RIC; and |
| • | satisfy the Annual Distribution Requirement, |
then we will not be subject to U.S. federal income tax on the portion of our income we distribute (or are deemed to distribute) to stockholders. We will be subject to U.S. federal income tax at the regular corporate rates on any income or capital gains not distributed (or deemed distributed) to our stockholders.
22
Table of Contents
We will be subject to a 4% nondeductible federal excise tax on certain undistributed income unless we distribute in a timely manner an amount at least equal to the sum of (1) 98% of our net ordinary income (taking into account certain deferrals and elections) for the calendar year, (2) 98.2% of our capital gains in excess of capital losses, or “capital gain net income” (adjusted for certain ordinary losses), for the one-year period ending October 31 of that calendar year and (3) any net ordinary income and net capital gains for the preceding years that were not distributed during such years and on which we paid no U.S. federal income tax, or the Excise Tax Avoidance Requirement.
In order to qualify as a RIC for U.S. federal income tax purposes, we must, among other things:
| • | continue to qualify as a BDC under the 1940 Act at all times during each tax year; |
| • | derive in each tax year at least 90% of our gross income from dividends, interest, payments with respect to certain securities, loans, gains from the sale of stock or other securities, net income from certain “qualified publicly-traded partnerships,” or other income derived with respect to our business of investing in such stock or securities; and |
| • | diversify our holdings so that at the end of each quarter of the tax year: |
| • | at least 50% of the value of our assets consists of cash, cash equivalents, U.S. government securities, securities of other RICs, and other securities if such other securities of any one issuer do not represent more than 5% of the value of our assets or more than 10% of the outstanding voting securities of such issuer; and |
| • | no more than 25% of the value of our assets is invested in the securities, other than U.S. government securities or securities of other RICs, of one issuer, of two or more issuers that are controlled, as determined under applicable Code rules, by us and that are engaged in the same or similar or related trades or businesses or of certain “qualified publicly-traded partnerships,” or the Diversification Tests. |
For U.S. federal income tax purposes, we may be required to recognize taxable income in circumstances in which we do not receive a corresponding payment in cash. For example, if we hold debt obligations that are treated under applicable tax rules as having original issue discount (such as debt instruments with PIK interest or, in certain cases, increasing interest rates or debt instruments that were issued with warrants), we must include in income each year a portion of the original issue discount that accrues over the life of the obligation, regardless of whether cash representing such income is received by us in the same tax year. We may also have to include in income other amounts that we have not yet received in cash, such as deferred loan origination fees that are paid after origination of the loan or are paid in non-cash compensation such as warrants or stock. We anticipate that a portion of our income may constitute original issue discount or other income required to be included in taxable income prior to receipt of cash.
Because any original issue discount or other amounts accrued will be included in our investment company taxable income for the year of the accrual, we may be required to make a distribution to our stockholders in order to satisfy the Annual Distribution Requirement, even though we will not have received any corresponding cash amount. As a result, we may have difficulty meeting the Annual Distribution Requirement necessary to qualify for and maintain RIC tax treatment under Subchapter M of the Code. We may have to sell some of our investments at times and/or at prices we would not consider advantageous, raise additional debt or equity capital or forgo new investment opportunities for this purpose. If we are not able to obtain cash from other sources, we may fail to qualify for RIC tax treatment and thus become subject to corporate-level income tax.
Although we do not presently expect to do so, we are authorized to borrow funds and to sell assets in order to satisfy distribution requirements. However, under the 1940 Act, we are not permitted to make distributions to our stockholders while our debt obligations and other senior securities are outstanding unless certain “asset coverage” tests are met. See “—Regulation—Senior Securities.” Moreover, our ability to dispose of assets to meet our distribution requirements may be limited by (1) the illiquid nature of our portfolio and/or (2) other
23
Table of Contents
requirements relating to our status as a RIC, including the Diversification Tests. If we dispose of assets in order to meet the Annual Distribution Requirement or the Excise Tax Avoidance Requirement, we may make such dispositions at times that, from an investment standpoint, are not advantageous.
Employees
We do not currently have any employees. Each of our executive officers, aside from our chief compliance officer, Mr. Faia, is a principal, officer or employee of FB Advisor, which manages and oversees our investment operations. Mr. Faia is not affiliated with FB Advisor. In the future, FB Advisor may retain additional investment personnel based upon its needs.
Available Information
We file with or submit to the SEC annual, quarterly and current periodic reports, proxy statements and other information meeting the informational requirements of the Exchange Act. This information is available free of charge by calling us collect at (215) 495-1150 or on our website at www.fsinvestmentcorp.com. Information contained on our website is not incorporated into this annual report on Form 10-K and you should not consider such information to be part of this annual report on Form 10-K. You also may inspect and copy these reports, proxy statements and other information, as well as this annual report of Form 10-K and related exhibits and schedules, at the Public Reference Room of the SEC at 100 F Street, N.E., Washington, D.C. 20549. Such information is also available from the EDGAR database on the SEC’s web site at www.sec.gov. You also can obtain copies of such information, after paying a duplicating fee, by sending a request by e-mail to publicinfo@sec.gov or by writing the SEC’s Public Reference Branch, Office of Consumer Affairs and Information Services, Securities and Exchange Commission, Washington, D.C. 20549. You may obtain information on the operation of the SEC’s Public Reference Room by calling the SEC at (202) 551-8090.
| Item 1A. | Risk Factors |
Investing in our securities involves a number of significant risks. In addition to the other information contained in this annual report on Form 10-K, investors should consider carefully the following information before making an investment in our securities. If any of the following events occur, our business, financial condition and results of operations could be materially and adversely affected. In such case, the net asset value and market price of our common stock could decline, and investors may lose all or part of their investment.
Risks Related to Economic Conditions
Future disruptions or instability in capital markets could negatively impact our ability to raise capital and have a material adverse effect on our business, financial condition and results of operations.
From time to time, the global capital markets may experience periods of disruption and instability, which could materially and adversely impact the broader financial and credit markets and reduce the availability to us of debt and equity capital. For example, between 2008 and 2009, instability in the global capital markets resulted in disruptions in liquidity in the debt capital markets, significant write-offs in the financial services sector, the re-pricing of credit risk in the broadly syndicated credit market and the failure of major domestic and international financial institutions. In particular, the financial services sector was negatively impacted by significant write-offs as the value of the assets held by financial firms declined, impairing their capital positions and abilities to lend and invest. We believe that such value declines were exacerbated by widespread forced liquidations as leveraged holders of financial assets, faced with declining prices, were compelled to sell to meet margin requirements and maintain compliance with applicable capital standards. Such forced liquidations also impaired or eliminated many investors and investment vehicles, leading to a decline in the supply of capital for investment and depressed pricing levels for many assets. These events significantly diminished overall confidence in the debt and equity markets, engendered unprecedented declines in the values of certain assets, caused extreme economic uncertainty and significantly reduced the availability of debt and equity capital for the market as a whole and
24
Table of Contents
financial services firms in particular. While market conditions have experienced relative stability in recent years, there have been continuing periods of volatility and there can be no assurance that adverse market conditions will not repeat themselves in the future.
Future volatility and dislocation in the capital markets could create a challenging environment in which to raise or access capital. For example, the re-appearance of market conditions similar to those experienced from 2008 through 2009 for any substantial length of time could make it difficult to extend the maturity of or refinance our existing indebtedness or obtain new indebtedness with similar terms. Significant changes or volatility in the capital markets may also have a negative effect on the valuations of our investments. While most of our investments are not publicly traded, applicable accounting standards require us to assume as part of our valuation process that our investments are sold in a principal market to market participants (even if we plan on holding an investment through its maturity) and impairments of the market values or fair market values of our investments, even if unrealized, must be reflected in our financial statements for the applicable period, which could result in significant reductions to our net asset value for the period. With certain limited exceptions, we are only allowed to borrow amounts or issue debt securities if our asset coverage, as calculated pursuant to the 1940 Act, equals at least 200% immediately after such borrowing. Equity capital may also be difficult to raise during periods of adverse or volatile market conditions because, subject to some limited exceptions, as a BDC, we are generally not able to issue additional shares of our common stock at a price less than net asset value without first obtaining approval for such issuance from our stockholders and our independent directors. If we are unable to raise capital or refinance existing debt on acceptable terms, then we may be limited in our ability to make new commitments or to fund existing commitments to our portfolio companies. Significant changes in the capital markets may also affect the pace of our investment activity and the potential for liquidity events involving our investments. Thus, the illiquidity of our investments may make it difficult for us to sell such investments to access capital if required, and as a result, we could realize significantly less than the value at which we have recorded our investments if we were required to sell them for liquidity purposes.
Uncertainty with respect to the financial stability of the United States and several countries in the European Union (EU) could have a significant adverse effect on our business, financial condition and results of operations.
In August 2011, S&P’s Ratings Services lowered its long-term sovereign credit rating on the U.S. from “AAA” to “AA+,” which was affirmed by S&P in June 2013. Moody’s and Fitch have also warned that they may downgrade the U.S. federal government’s credit rating. In addition, the economic downturn and the significant government interventions into the financial markets and fiscal stimulus spending over the last several years have contributed to significantly increased U.S. budget deficits. The U.S. government has on several occasions adopted legislation to suspend the federal debt ceiling, most recently until March 16, 2015. Further downgrades or warnings by S&P or other rating agencies, and the U.S. government’s credit and deficit concerns in general, including issues around the federal debt ceiling, could cause interest rates and borrowing costs to rise, which may negatively impact both the perception of credit risk associated with our debt portfolio and our ability to access the debt markets on favorable terms. Furthermore, in February 2014, the Federal Reserve began scaling back its bond-buying program, or quantitative easing, which it ended completely in October 2014. Quantitative easing was designed to stimulate the economy and expand the Federal Reserve’s holdings of long-term securities until key economic indicators, such as the unemployment rate, showed signs of improvement. The Federal Reserve has also indicated that it may raise interest raise interest rates as early as mid-2015. It is unclear what effect, if any, the end of quantitative easing and the Federal Reserves’ stated intentions to raise interest rates will have on the value of our investments or our ability to access the debt markets on favorable terms.
In 2010, a financial crisis emerged in Europe, triggered by high budget deficits and rising direct and contingent sovereign debt in Greece, Ireland, Italy, Portugal and Spain, which created concerns about the ability of these nations to continue to service their sovereign debt obligations. In January 2012, S&P’s Ratings Services lowered its long-term sovereign credit rating for France, Italy, Spain and six other European countries, which has negatively impacted global markets and economic conditions. In addition, in April 2012, S&P’s Ratings Services
25
Table of Contents
further lowered its long-term sovereign credit rating for Spain. While the financial stability of such countries has improved, risks resulting from any future debt crisis in Europe or any similar crisis could have a detrimental impact on the global economic recovery, sovereign and non-sovereign debt in these countries and the financial condition of U.S. and European financial institutions. Market disruptions in Europe, including the increased cost of funding for certain governments and financial institutions, could negatively impact the global economy, and there can be no assurance that assistance packages will be available, or if available, will be sufficient to stabilize countries and markets in Europe. To the extent uncertainty regarding any economic recovery in Europe negatively impacts consumer confidence levels and spending, personal bankruptcy rates, levels of incurrence and default on consumer debt and home prices, or other credit factors, our business, financial condition and results of operations could be significantly and adversely affected.
Future economic recessions or downturns could impair our portfolio companies and harm our operating results.
Many of our portfolio companies may be susceptible to economic slowdowns or recessions (such as the economic downturn that occurred from 2008 through 2009) and may be unable to repay our debt investments during these periods. Therefore, our non-performing assets are likely to increase, and the value of our portfolio is likely to decrease during these periods. Adverse economic conditions may also decrease the value of any collateral securing our debt investments. A prolonged recession may further decrease the value of such collateral and result in losses of value in our portfolio and a decrease in our revenues, net income and net asset value. Unfavorable economic conditions also could increase our funding costs, limit our access to the capital markets or result in a decision by lenders not to extend credit to us on terms we deem acceptable. These events could prevent us from increasing investments and harm our operating results. Economic downturns or recessions may also result in a portfolio company’s failure to satisfy financial or operating covenants imposed by us or other lenders, which could lead to defaults and, potentially, acceleration of the time when the loans are due and foreclosure on its assets representing collateral for its obligations, which could trigger cross defaults under other agreements and jeopardize our portfolio company’s ability to meet its obligations under the debt that we hold and the value of any equity securities we own. We may incur expenses to the extent necessary to seek recovery upon default or to negotiate new terms with a defaulting portfolio company.
Price declines in the large corporate leveraged loan market may adversely affect the fair value of our syndicated loan portfolio, reducing our net asset value through increased net unrealized depreciation.
Prior to the onset of the financial crisis, CLOs, a type of leveraged investment vehicle holding corporate loans, hedge funds and other highly leveraged investment vehicles comprised a substantial portion of the market for purchasing and holding first and second lien secured loans. As the secondary market pricing of the loans underlying these portfolios deteriorated during the fourth quarter of 2008, it is our understanding that many investors, as a result of their generally high degrees of leverage, were forced to raise cash by selling their interests in performing loans in order to satisfy margin requirements or the equivalent of margin requirements imposed by their lenders. This resulted in a forced deleveraging cycle of price declines, compulsory sales and further price declines, with widespread redemption requests and other constraints resulting from the credit crisis generating further selling pressure. This pervasive forced selling and the resultant price declines eliminated or significantly impaired many of our leveraged competitors for investment opportunities, especially those having built their investment portfolios prior to the financial crisis.
Where prices appreciated measurably in recent years, conditions in the large corporate leveraged loan market may experience similar disruptions or deterioration, which may cause pricing levels to similarly decline or be volatile. As a result, we may suffer unrealized depreciation and could incur realized losses in connection with the sale of our syndicated loans, which could have a material adverse impact on our business, financial condition and results of operations.
26
Table of Contents
Risks Related to Our Business and Structure
Our ability to achieve our investment objectives depends on FB Advisor’s and GDFM’s ability to manage and support our investment process and if either our agreement with FB Advisor or FB Advisor’s agreement with GDFM were to be terminated, or if either FB Advisor or GDFM lose any members of their respective senior management teams, our ability to achieve our investment objectives could be significantly harmed.
Since we have no employees, we depend on the investment expertise, skill and network of business contacts of FB Advisor and GDFM. FB Advisor, with the assistance of GDFM, evaluates, negotiates, structures, executes, monitors and services our investments. Our future success depends to a significant extent on the continued service and coordination of FB Advisor and its senior management team. The departure of any members of the senior management team or other key employees of either FB Advisor or GDFM could have a material adverse effect on our ability to achieve our investment objectives.
Our ability to achieve our investment objectives depends on FB Advisor’s ability, with the assistance of GDFM, to identify, analyze, invest in, finance and monitor companies that meet our investment criteria. FB Advisor’s capabilities in structuring the investment process, providing competent, attentive and efficient services to us, and facilitating access to financing on acceptable terms depend on the employment of investment professionals in an adequate number and of adequate sophistication to match the corresponding flow of transactions. To achieve our investment objectives, FB Advisor may need to hire, train, supervise and manage new investment professionals to participate in our investment selection and monitoring process. FB Advisor may not be able to find investment professionals in a timely manner or at all. Failure to support our investment process could have a material adverse effect on our business, financial condition and results of operations.
In addition, each of the investment advisory agreement and administration agreement that FB Advisor has entered into with us, as well as the sub-advisory agreement that FB Advisor has entered into with GDFM, have termination provisions that allow the parties to terminate the agreements without penalty. The investment advisory agreement and administration agreement may each be terminated at any time, without penalty, by FB Advisor, upon 60 days’ notice to us. The sub-advisory agreement may be terminated at any time, without the payment of any penalty, upon 60 days’ written notice by GDFM or, if our board of directors or the holders of a majority of our outstanding voting securities determine that the sub-advisory agreement with GDFM should be terminated, by FB Advisor. If either agreement is terminated, it may adversely affect the quality of our investment opportunities. In addition, in the event such agreements are terminated, it may be difficult for us to replace FB Advisor or for FB Advisor to replace GDFM. Furthermore, the termination of either of these agreements may adversely impact the terms of any financing facility into which we may enter, which could have a material adverse effect on our business and financial condition.
Because our business model depends to a significant extent upon relationships with private equity sponsors, investment banks and commercial banks, the inability of FB Advisor and GDFM to maintain or develop these relationships, or the failure of these relationships to generate investment opportunities, could adversely affect our business.
If FB Advisor or GDFM fails to maintain its existing relationships with private equity sponsors, investment banks and commercial banks on which they rely to provide us with potential investment opportunities, or develop new relationships with other sponsors or sources of investment opportunities, we may not be able to grow our investment portfolio. In addition, individuals with whom FB Advisor and GDFM have relationships are not obligated to provide us with investment opportunities, and, therefore, there is no assurance that such relationships will generate investment opportunities for us.
We may face increasing competition for investment opportunities, which could delay deployment of our capital, reduce returns and result in losses.
We compete for investments with other BDCs and investment funds (including private equity funds, mezzanine funds and CLO funds), as well as traditional financial services companies such as commercial banks
27
Table of Contents
and other sources of funding. Moreover, alternative investment vehicles, such as hedge funds, have begun to invest in areas in which they have not traditionally invested, including making investments in middle market private U.S. companies. As a result of these new entrants, competition for investment opportunities in middle market private U.S. companies may intensify. Many of our competitors are substantially larger and have considerably greater financial, technical and marketing resources than we do. For example, some competitors may have a lower cost of capital and access to funding sources that are not available to us. In addition, some of our competitors may have higher risk tolerances or different risk assessments than we have. These characteristics could allow our competitors to consider a wider variety of investments, establish more relationships and offer better pricing and more flexible structuring than we are able to do. We may lose investment opportunities if we do not match our competitors’ pricing, terms and structure. If we are forced to match our competitors’ pricing, terms and structure, we may not be able to achieve acceptable returns on our investments or may bear substantial risk of capital loss. A significant part of our competitive advantage stems from the fact that the market for investments in middle market private U.S. companies is underserved by traditional commercial banks and other financial sources. A significant increase in the number and/or the size of our competitors in this target market could force us to accept less attractive investment terms. Furthermore, many of our competitors have greater experience operating under, or are not subject to, the regulatory restrictions that the 1940 Act imposes on us as a BDC.
Our board of directors may change our operating policies and strategies without prior notice or stockholder approval.
Our board of directors has the authority to modify or waive our current operating policies, investment criteria and strategies without prior notice and without stockholder approval. Moreover, we have significant investment flexibility within our investment strategies. Therefore, we may invest our assets in ways with which investors may not agree. We also cannot predict the effect any changes to our current operating policies, investment criteria and strategies would have on our business, net asset value, operating results and the value of our stock. However, the effects might be adverse, which could negatively impact our ability to pay stockholders distributions and cause them to lose all or part of their investment.
If we internalize our management functions, a stockholder’s interest in us could be diluted, and we could incur other significant costs associated with being self-managed.
Our board of directors may decide in the future to internalize our management functions. If we do so, we may elect to negotiate to acquire FB Advisor’s assets and personnel. At this time, we cannot anticipate the form or amount of consideration or other terms relating to any such acquisition. Such consideration could take many forms, including cash payments, promissory notes and shares of our common stock. The payment of such consideration could result in dilution of a stockholder’s interest in us and could reduce the earnings per share attributable to their investment.
In addition, while we would no longer bear the costs of the various fees and expenses we expect to pay to FB Advisor under the investment advisory agreement, we would incur the entire compensation and benefits costs of our officers and other employees and consultants. In addition, we may issue equity awards to officers, employees and consultants. These awards would decrease net income and may further dilute an investment in us. We cannot reasonably estimate the amount of fees we would save or the costs we would incur if we became self-managed. If the expenses we assume as a result of an internalization are higher than the expenses we avoid paying to FB Advisor, our earnings per share would be lower as a result of the internalization than it otherwise would have been, potentially decreasing the amount of funds available to distribute to our stockholders and the value of our shares. As we are currently organized, we do not have any employees. If we elect to internalize our operations, we would employ personnel and would be subject to potential liabilities commonly faced by employers, such as workers disability and compensation claims and other employee-related liabilities and grievances.
If we internalize our management functions, we could have difficulty integrating these functions as a standalone entity. Currently, individuals employed by FB Advisor and its affiliates perform asset management
28
Table of Contents
and general and administrative functions, including accounting and financial reporting, for multiple entities. These personnel have a great deal of know-how and experience. We may fail to properly identify the appropriate mix of personnel and capital needs to operate as a standalone entity. An inability to manage an internalization transaction effectively could thus result in our incurring excess costs and/or suffering deficiencies in our disclosure controls and procedures or our internal control over financial reporting. Such deficiencies could cause us to incur additional costs and our management’s attention could be diverted from effectively managing our investments.
Internalization transactions have also, in some cases, been the subject of litigation. Even if these claims are without merit, we could be forced to spend significant amounts of money defending such claims, which would reduce the amount of funds we have available for investment in targeted assets.
Changes in laws or regulations governing our operations or the operations of our business partners may adversely affect our business or cause us to alter our business strategy.
We, our portfolio companies and our business partners are subject to regulation at the local, state and federal level. New legislation may be enacted or new interpretations, rulings or regulations could be adopted, including those governing the types of investments we are permitted to make, potentially with retroactive effect. In particular, over the last several years there has been an increase in regulatory attention to the extension of credit outside of the traditional banking sector, raising the possibility that some portion of the non-bank financial sector will be subject to new regulation. New legislation, interpretations, rulings or regulations could require changes to certain business practices of us or our portfolio companies, negatively impact the operations, cash flows or financial condition of us or our portfolio companies, impose additional costs on us or our portfolio companies or otherwise adversely affect our business or the business of our portfolio companies. In addition, any changes to the laws and regulations governing our operations, including with respect to permitted investments, may cause us to alter our investment strategy to avail ourselves of new or different opportunities or make other changes to our business. Such changes could result in material differences to our strategies and plans as set forth in this annual report on Form 10-K and may result in our investment focus shifting from the areas of expertise of FB Advisor and GDFM to other types of investments in which FB Advisor and GDFM may have less expertise or little or no experience. Thus, any such changes, if they occur, could have a material adverse effect on our results of operations and the value of a stockholder’s investment.
The impact on us of recent financial reform legislation, including the Dodd-Frank Act, is uncertain.
In light of recent conditions in the U.S. and global financial markets and the U.S. and global economy, legislators, the presidential administration and regulators have increased their focus on the regulation of the financial services industry. In particular, the Dodd-Frank Wall Street Reform and Consumer Protection Act, or the Dodd-Frank Act, institutes a wide range of reforms that will have an impact on all financial institutions. Many of the requirements called for in the Dodd-Frank Act will be implemented over time, most of which will be subject to implementing regulations over the course of several years. Given the uncertainty associated with the manner in which the provisions of the Dodd-Frank Act will be implemented by the various regulatory agencies and through regulations, the full impact such requirements will have on our business, results of operations or financial condition is unclear. The changes resulting from the Dodd-Frank Act may require us to invest significant management attention and resources to evaluate and make necessary changes in order to comply with new statutory and regulatory requirements. Failure to comply with any such laws, regulations or principles, or changes thereto, may negatively impact our business, results of operations and financial condition. While we cannot predict what effect any changes in the laws or regulations or their interpretations would have on us as a result of recent financial reform legislation, these changes could be materially adverse to us and our stockholders.
Future legislation may allow us to incur additional leverage.
As a BDC, we are generally not permitted to incur indebtedness unless immediately after such borrowing we have an asset coverage for total borrowing of at least 200% (i.e., the amount of debt may not exceed 50% of
29
Table of Contents
the value of our assets). Legislation was previously introduced in the U.S. House of Representatives that proposed a modification of this section of the 1940 Act to permit an increase in the amount of debt that BDCs could incur by modifying the percentage from 200% to 150%. Similar legislation may be reintroduced and may pass that permits us to incur additional leverage under the 1940 Act. As a result, we may be able to incur additional indebtedness in the future, and, therefore, the risk of an investment in us may increase.
As a public company, we are subject to regulations not applicable to private companies, such as provisions of the Sarbanes-Oxley Act. Efforts to comply with such regulations will involve significant expenditures, and non-compliance with such regulations may adversely affect us.
As a public company, we incur legal, accounting and other expenses, including costs associated with the periodic reporting requirements applicable to a company whose securities are registered under the Securities Exchange Act of 1934, as amended, or the Exchange Act, as well as additional corporate governance requirements, including requirements under the Sarbanes-Oxley Act, and other rules implemented by the SEC and the listing standards of the NYSE. Our management is required to report on our internal control over financial reporting pursuant to Section 404 of the Sarbanes-Oxley Act and rules and regulations of the SEC thereunder. In particular, our management is required to review on an annual basis our internal control over financial reporting, and on a quarterly and annual basis to evaluate and disclose changes in our internal control over financial reporting. Section 404 of the Sarbanes-Oxley Act also generally requires an attestation from our independent registered public accounting firm on the effectiveness of our internal control over financial reporting.
We incur significant expenses in connection with our compliance with the Sarbanes-Oxley Act and other regulations applicable to public companies, which may negatively impact our financial performance and our ability to make distributions. Compliance with such regulations also requires a significant amount of our management’s time and attention. For example, we cannot be certain as to the timing of the completion of our Sarbanes-Oxley mandated evaluations, testings and remediation actions, if any, or the impact of the same on our operations, and we may not be able to ensure that the process is effective or that our internal control over financial reporting is or will be deemed effective in the future. In the event that we are unable to maintain an effective system of internal control and maintain compliance with the Sarbanes-Oxley Act and related rules, we may be adversely affected.
We may experience fluctuations in our quarterly results.
We could experience fluctuations in our quarterly operating results due to a number of factors, including our ability or inability to make investments in companies that meet our investment criteria, the interest rate payable on the debt securities we acquire, the level of our expenses, variations in and the timing of the recognition of realized and unrealized gains or losses, the degree to which we encounter competition in our markets and general economic conditions. As a result of these factors, results for any previous period should not be relied upon as being indicative of performance in future periods.
Risks Related to FB Advisor, GDFM and their respective Affiliates
FB Advisor, GDFM and their affiliates, including our officers and some of our directors, face conflicts of interest caused by compensation arrangements with us and our affiliates, which could result in actions that are not in the best interests of our stockholders.
FB Advisor, GDFM and their affiliates receive substantial fees from us in return for their services, and these fees could influence the advice provided to us. We pay to FB Advisor an incentive fee that is based on the performance of our portfolio and an annual base management fee that is based on the average value of our gross assets, and FB Advisor shares a portion of these fees with GDFM pursuant to the sub-advisory agreement between FB Advisor and GDFM. Because the incentive fee is based on the performance of our portfolio, FB Advisor may be incentivized to make investments on our behalf, and GDFM to recommend investments for us to
30
Table of Contents
FB Advisor, that are riskier or more speculative than would be the case in the absence of such compensation arrangement. The way in which the incentive fee is determined may also encourage FB Advisor to use leverage to increase the return on our investments. In addition, because the management fee is based upon the average value of our gross assets, which includes any borrowings for investment purposes, FB Advisor may be incentivized to recommend the use leverage or the issuance of additional equity to make additional investments and increase the average value of or gross assets. Under certain circumstances, the use of leverage may increase the likelihood of default, which could disfavor holders of our common stock. Our compensation arrangements could therefore result in our making riskier or more speculative investments, or relying more on leverage to make investments, than would otherwise be the case. This could result in higher investment losses, particularly during cyclical economic downturns.
We may be obligated to pay FB Advisor incentive compensation on income that we have not received.
Any incentive fee payable by us that relates to our net investment income may be computed and paid on income that may include interest that has been accrued but not yet received. If a portfolio company defaults on a loan that is structured to provide accrued interest, it is possible that accrued interest previously included in the calculation of the incentive fee will become uncollectible. FB Advisor is not under any obligation to reimburse us for any part of the incentive fee it received that was based on accrued income that we never received as a result of a default by an entity on the obligation that resulted in the accrual of such income, and such circumstances would result in our paying an incentive fee on income we never received.
For U.S. federal income tax purposes, we are required to recognize taxable income (such as deferred interest that is accrued as original issue discount) in some circumstances in which we do not receive a corresponding payment in cash and to make distributions with respect to such income to maintain our status as a RIC. Under such circumstances, we may have difficulty meeting the annual distribution requirement necessary to maintain RIC tax treatment under the Code. This difficulty in making the required distribution may be amplified to the extent that we are required to pay an incentive fee with respect to such accrued income. As a result, we may have to sell some of our investments at times and/or at prices we would not consider advantageous, raise additional debt or equity capital, or forgo new investment opportunities for this purpose. If we are not able to obtain cash from other sources, we may fail to qualify for RIC tax treatment and thus become subject to corporate-level income tax.
There may be conflicts of interest related to obligations FB Advisor’s and GDFM’s senior management and investment teams have to our affiliates and to other clients.
The members of the senior management and investment teams of both FB Advisor and GDFM serve or may serve as officers, directors or principals of entities that operate in the same or a related line of business as we do, or of investment funds managed by the same personnel. For example, the officers, managers and other personnel of FB Advisor also serve in similar capacities for the investment advisers to Franklin Square Holdings’ three other affiliated BDCs, FS Energy and Power Fund, FS Investment Corporation II and FS Investment Corporation III, and Franklin Square Holdings’ affiliated closed-end management investment company, FS Global Credit Opportunities Fund. In serving in these multiple and other capacities, they may have obligations to other clients or investors in those entities, the fulfillment of which may not be in our best interests or in the best interest of our stockholders. Our investment objectives may overlap with the investment objectives of such investment funds, accounts or other investment vehicles. For example, we rely on FB Advisor to manage our day-to-day activities and to implement our investment strategy. FB Advisor and certain of its affiliates are presently, and plan in the future to continue to be, involved with activities which are unrelated to us. As a result of these activities, FB Advisor, its employees and certain of its affiliates will have conflicts of interest in allocating their time between us and other activities in which they are or may become involved, including the management of other entities affiliated with Franklin Square Holdings. FB Advisor and its employees will devote only as much of its or their time to our business as FB Advisor and its employees, in their judgment, determine is reasonably required, which may be substantially less than their full time.
31
Table of Contents
Furthermore, GDFM, on which FB Advisor relies to assist it in identifying investment opportunities and making investment recommendations, has similar conflicts of interest. GDFM or its affiliate, GSO, serves as investment sub-adviser to Franklin Square Holdings’ three other affiliated BDCs and Franklin Square Holdings’ affiliated closed-end management investment company. GDFM, its affiliates and their respective members, partners, officers and employees will devote as much of their time to our activities as they deem necessary and appropriate. GDFM and its affiliates are not restricted from forming additional investment funds, from entering into other investment advisory relationships or from engaging in other business activities, even though such activities may be in competition with us and/or may involve substantial time and resources of GDFM. Also, in connection with such business activities, GDFM and its affiliates may have existing business relationships or access to material, non-public information that may prevent it from recommending investment opportunities that would otherwise fit within our investment objectives. All of these factors could be viewed as creating a conflict of interest in that the time, effort and ability of the members of GDFM, its affiliates and their officers and employees will not be devoted exclusively to our business but will be allocated between us and the management of the monies of other advisees of GDFM and its affiliates.
The time and resources that individuals employed by FB Advisor and GDFM devote to us may be diverted and we may face additional competition due to the fact that individuals employed by FB Advisor and GDFM are not prohibited from raising money for or managing another entity that makes the same types of investments that we target.
Neither FB Advisor nor GDFM, or individuals employed by FB Advisor or GDFM, are prohibited from raising money for and managing another investment entity that makes the same types of investments as those we target. As a result, the time and resources that these individuals may devote to us may be diverted. In addition, we may compete with any such investment entity for the same investors and investment opportunities. In an order dated June 4, 2013, the SEC granted exemptive relief permitting us, subject to the satisfaction of certain conditions, to co-invest in certain privately negotiated investment transactions with our co-investment affiliates. Because we did not seek exemptive relief to engage in co-investment transactions with GDFM and its affiliates, we will continue to be permitted to co-invest with GDFM and its affiliates only in accordance with existing regulatory guidance. Affiliates of GDFM, whose primary businesses include the origination of investments, engage in investment advisory business with accounts that compete with us. Affiliates of GDFM have no obligation to make their originated investment opportunities available to GDFM or to us.
FB Advisor’s liability is limited under each of our investment advisory agreement and our administration agreement, and we are required to indemnify it against certain liabilities, which may lead it to act in a riskier manner on our behalf than it would when acting for its own account.
Pursuant to each of our investment advisory agreement and our administration agreement, FB Advisor and its officers, managers, partners, members (and their members, including the owners of their members), agents, employees, controlling persons and any other person or entity affiliated with FB Advisor will not be liable to us for their acts under our investment advisory agreement or our administration agreement, as applicable, absent willful misfeasance, bad faith or gross negligence in the performance of their duties. We have agreed to indemnify, defend and protect FB Advisor and its officers, managers, partners, members (and their members, including the owners of their members), agents, employees, controlling persons and any other person or entity affiliated with FB Advisor with respect to all damages, liabilities, costs and expenses resulting from acts of FB Advisor not arising out of willful misfeasance, bad faith or gross negligence in the performance of their duties under our investment advisory agreement or our administration agreement, as applicable. These protections may lead FB Advisor to act in a riskier manner when acting on our behalf than it would when acting for its own account.
32
Table of Contents
Risks Related to Business Development Companies
Failure to maintain our status as a BDC would reduce our operating flexibility.
If we do not remain a BDC, we might be regulated as a closed-end investment company under the 1940 Act, which would subject us to substantially more regulatory restrictions under the 1940 Act and correspondingly decrease our operating flexibility.
We are uncertain of our sources for funding our future capital needs and if we cannot obtain debt or equity financing on acceptable terms, or at all, our ability to acquire investments and to expand our operations will be adversely affected.
Any working capital reserves we maintain may not be sufficient for investment purposes, and we may require debt or equity financing to operate. We may also need to access the capital markets to refinance existing debt obligations to the extent maturing obligations are not repaid with cash flows from operations. In order to maintain our RIC status we must distribute to our stockholders on a timely basis generally an amount equal to at least 90% of our investment company taxable income, and the amounts of such distributions will therefore not be available to fund investment originations or to repay maturing debt. In addition, with certain limited exceptions, we are only allowed to borrow amounts or issue debt securities or preferred stock, which we refer to collectively as “senior securities,” such that our asset coverage, as calculated pursuant to the 1940 Act, equals at least 200% immediately after such borrowing, which, in certain circumstances, may restrict our ability to borrow or issue debt securities or preferred stock. In the event that we develop a need for additional capital in the future for investments or for any other reason, and we cannot obtain debt or equity financing on acceptable terms, or at all, our ability to acquire investments and to expand our operations will be adversely affected. As a result, we would be less able to allocate our portfolio among various issuers and industries and achieve our investment objectives, which may negatively impact our results of operations and reduce our ability to make distributions to our stockholders.
The requirement that we invest a sufficient portion of our assets in qualifying assets could preclude us from investing in accordance with our current business strategy; conversely, the failure to invest a sufficient portion of our assets in qualifying assets could result in our failure to maintain our status as a BDC.
As a BDC, we may not acquire any assets other than “qualifying assets” unless, at the time of such acquisition, at least 70% of our total assets are qualifying assets. Therefore, we may be precluded from investing in what we believe are attractive investments if such investments are not qualifying assets. . Similarly, these rules could prevent us from making additional investments in existing portfolio companies, which could result in the dilution of our position, or could require us to dispose of investments at an inopportune time to comply with the 1940 Act. If we were forced to sell non-qualifying investments in the portfolio for compliance purposes, the proceeds from such sale could be significantly less than the current value of such investments. Conversely, if we fail to invest a sufficient portion of our assets in qualifying assets, we could lose our status as a BDC, which would subject us to substantially more regulatory restrictions and significantly decrease our operating flexibility.
Regulations governing our operation as a BDC and a RIC will affect our ability to raise, and the way in which we raise, additional capital or borrow for investment purposes, which may have a negative effect on our growth.
As a result of the Annual Distribution Requirement to qualify as a RIC, we may need to periodically access the capital markets to raise cash to fund new investments. We may issue “senior securities,” as defined in the 1940 Act, including issuing preferred stock, borrowing money from banks or other financial institutions, or issuing debt securities only in amounts such that our asset coverage, as defined in the 1940 Act, equals at least 200% after such incurrence or issuance. Our ability to issue certain other types of securities is also limited. Under the 1940 Act, we are also generally prohibited from issuing or selling our common stock at a price per share, after deducting underwriting commissions, that is below our net asset value per share, without first obtaining
33
Table of Contents
approval for such issuance from our stockholders and our independent directors. Compliance with these limitations on our ability to raise capital may unfavorably limit our investment opportunities. These limitations may also reduce our ability in comparison to other companies to profit from favorable spreads between the rates at which we can borrow and the rates at which we can lend.
In addition, because we incur indebtedness for investment purposes, if the value of our assets declines, we may be unable to satisfy the asset coverage test under the 1940 Act, which would prohibit us from paying distributions and could prevent us from qualifying as a RIC. If we cannot satisfy the asset coverage test, we may be required to sell a portion of our investments and, depending on the nature of our debt financing, repay a portion of our indebtedness at a time when such sales may be disadvantageous.
Our ability to enter into transactions with our affiliates is restricted.
We are prohibited under the 1940 Act from participating in certain transactions with certain of our affiliates without the prior approval of a majority of the independent members of our board of directors and, in some cases, the SEC. Any person that owns, directly or indirectly, 5% or more of our outstanding voting securities will be our affiliate for purposes of the 1940 Act, and we will generally be prohibited from buying or selling any securities from or to such affiliate, absent the prior approval of our board of directors. The 1940 Act also prohibits certain “joint” transactions with certain of our affiliates, which could include investments in the same portfolio company (whether at the same or different times), without prior approval of our board of directors and, in some cases, the SEC. In an order dated June 4, 2013, the SEC granted exemptive relief permitting us, subject to the satisfaction of certain conditions, to co-invest in certain privately negotiated investment transactions with our co-investment affiliates. If a person acquires more than 25% of our voting securities, we will be prohibited from buying or selling any security from or to such person or certain of that person’s affiliates, or entering into prohibited joint transactions with such persons to the extent not covered by our exemptive relief, absent the prior approval of the SEC. Similar restrictions limit our ability to transact business with our officers or directors or their affiliates. As a result of these restrictions, we may be prohibited from buying or selling any security from or to any portfolio company of a private equity fund managed by FB Advisor without the prior approval of the SEC, which may limit the scope of investment opportunities that would otherwise be available to us.
Risks Related to Our Investments
Our investments in prospective portfolio companies may be risky, and we could lose all or part of our investment.
Our investments in senior secured loans, second lien secured loans, senior secured bonds, subordinated debt and equity of private U.S. companies, including middle market companies, may be risky and there is no limit on the amount of any such investments in which we may invest.
Senior Secured Loans, Second Lien Secured Loans and Senior Secured Bonds. There is a risk that any collateral pledged by portfolio companies in which we have taken a security interest may decrease in value over time or lose its entire value, may be difficult to sell in a timely manner, may be difficult to appraise and may fluctuate in value based upon the success of the business and market conditions, including as a result of the inability of the portfolio company to raise additional capital. To the extent our debt investment is collateralized by the securities of a portfolio company’s subsidiaries, such securities may lose some or all of their value in the event of the bankruptcy or insolvency of the portfolio company. Also, in some circumstances, our security interest may be contractually or structurally subordinated to claims of other creditors. In addition, deterioration in a portfolio company’s financial condition and prospects, including its inability to raise additional capital, may be accompanied by deterioration in the value of the collateral for the debt. Secured debt that is under-collateralized involves a greater risk of loss. In addition, second lien secured debt is granted a second priority security interest in collateral, which means that any realization of collateral will generally be applied to pay senior secured debt in full before second lien secured debt is paid. Consequently, the fact that debt is secured does not guarantee that we will receive principal and interest payments according to the debt’s terms, or at all, or that we will be able to collect on the debt should we be forced to enforce our remedies.
34
Table of Contents
Subordinated Debt. Our subordinated debt investments will generally rank junior in priority of payment to senior debt and will generally be unsecured. This may result in a heightened level of risk and volatility or a loss of principal, which could lead to the loss of the entire investment. These investments may involve additional risks that could adversely affect our investment returns. To the extent interest payments associated with such debt are deferred, such debt may be subject to greater fluctuations in valuations, and such debt could subject us and our stockholders to non-cash income. Since we will not receive any principal repayments prior to the maturity of some of our subordinated debt investments, such investments will be of greater risk than amortizing loans.
Equity Investments. We may make select equity investments. In addition, in connection with our debt investments, we on occasion receive equity interest such as warrants or options as additional consideration. The equity interests we receive may not appreciate in value and, in fact, may decline in value. Accordingly, we may not be able to realize gains from our equity interests, and any gains that we do realize on the disposition of any equity interests may not be sufficient to offset any other losses we experience.
Non-U.S. securities. We may invest in non-U.S. securities, which may include securities denominated in U.S. dollars or in non-U.S. currencies, to the extent permitted by the 1940 Act. Because evidences of ownership of such securities usually are held outside the United States, we would be subject to additional risks if we invested in non-U.S. securities, which include possible adverse political and economic developments, seizure or nationalization of foreign deposits and adoption of governmental restrictions which might adversely affect or restrict the payment of principal and interest on the non-U.S. securities to investors located outside the country of the issuer, whether from currency blockage or otherwise. Since non-U.S. securities may be purchased with and payable in foreign currencies, the value of these assets as measured in U.S. dollars may be affected unfavorably by changes in currency rates and exchange control regulations.
In addition, we invest in securities that are rated below investment grade by rating agencies or that would be rated below investment grade if they were rated. Below investment grade securities, which are often referred to as “junk,” have predominantly speculative characteristics with respect to the issuer’s capacity to pay interest and repay principal. They may also be difficult to value and illiquid.
Investing in middle market companies involves a number of significant risks, any one of which could have a material adverse effect on our operating results.
Investments in middle market companies involve some of the same risks that apply generally to investments in larger, more established companies. However, such investments have more pronounced risks in that they:
| • | may have limited financial resources and may be unable to meet their obligations under their debt securities that we hold, which may be accompanied by a deterioration in the value of any collateral pledged under such securities and a reduction in the likelihood of us realizing any guarantees we may have obtained in connection with our investment; |
| • | have shorter operating histories, narrower product lines and smaller market shares than larger businesses, which tends to render them more vulnerable to competitors’ actions and changing market conditions, as well as general economic downturns; |
| • | are more likely to depend on the management talents and efforts of a small group of persons; therefore, the death, disability, resignation or termination of one or more of these persons could have a material adverse impact on our portfolio company and, in turn, on us; |
| • | generally have less predictable operating results, may from time to time be parties to litigation, may be engaged in rapidly changing businesses with products subject to a substantial risk of obsolescence, and may require substantial additional capital to support their operations, finance expansion or maintain their competitive position. In addition, our executive officers, directors and members of FB Advisor may, in the ordinary course of business, be named as defendants in litigation arising from our investments in the portfolio companies; and |
35
Table of Contents
| • | may have difficulty accessing the capital markets to meet future capital needs, which may limit their ability to grow or to repay their outstanding indebtedness upon maturity. |
Our portfolio companies may incur debt that ranks equally with, or senior to, our investments in such companies.
Our portfolio companies may have, or may be permitted to incur, other debt that ranks equally with, or senior to, the debt in which we invest. By their terms, such debt instruments may entitle the holders to receive payment of interest or principal on or before the dates on which we are entitled to receive payments with respect to the debt instruments in which we invest. Also, in the event of insolvency, liquidation, dissolution, reorganization or bankruptcy of a portfolio company, holders of debt instruments ranking senior to our investment in that portfolio company would typically be entitled to receive payment in full before we receive any proceeds. After repaying such senior creditors, such portfolio company may not have any remaining assets to use for repaying its obligation to us. In the case of debt ranking equally with debt instruments in which we invest, we would have to share on an equal basis any distributions with other creditors holding such debt in the event of an insolvency, liquidation, dissolution, reorganization or bankruptcy of the relevant portfolio company.
There may be circumstances where our debt investments could be subordinated to claims of other creditors or we could be subject to lender liability claims.
If one of our portfolio companies were to go bankrupt, depending on the facts and circumstances, including the extent to which we actually provided managerial assistance to that portfolio company, a bankruptcy court might recharacterize our debt investment and subordinate all or a portion of our claim to that of other creditors. In situations where a bankruptcy carries a high degree of political significance, our legal rights may be subordinated to other creditors. We may also be subject to lender liability claims for actions taken by us with respect to a borrower’s business or in instances where we exercise control over the borrower or render significant managerial assistance.
Second priority liens on collateral securing debt investments that we make to our portfolio companies may be subject to control by senior creditors with first priority liens. If there is a default, the value of the collateral may not be sufficient to repay in full both the first priority creditors and us.
Certain debt investments that we make to portfolio companies may be secured on a second priority basis by the same collateral securing first priority debt of such companies. The first priority liens on the collateral will secure the portfolio company’s obligations under any outstanding senior debt and may secure certain other future debt that may be permitted to be incurred by such company under the agreements governing the loans. The holders of obligations secured by the first priority liens on the collateral will generally control the liquidation of and be entitled to receive proceeds from any realization of the collateral to repay their obligations in full before us. In addition, the value of the collateral in the event of liquidation will depend on market and economic conditions, the availability of buyers and other factors. There can be no assurance that the proceeds, if any, from the sale or sales of all of the collateral would be sufficient to satisfy the debt obligations secured by the second priority liens after payment in full of all obligations secured by the first priority liens on the collateral. If such proceeds are not sufficient to repay amounts outstanding under the debt obligations secured by the second priority liens, then we, to the extent not repaid from the proceeds of the sale of the collateral, will only have an unsecured claim against such company’s remaining assets, if any.
The rights we may have with respect to the collateral securing the debt investments we make in our portfolio companies with senior debt outstanding may also be limited pursuant to the terms of one or more intercreditor agreements that we enter into with the holders of senior debt. Under such an intercreditor agreement, at any time that obligations that have the benefit of the first priority liens are outstanding, any of the following actions that may be taken in respect of the collateral will be at the direction of the holders of the obligations secured by the first priority liens: the ability to cause the commencement of enforcement proceedings against the collateral; the
36
Table of Contents
ability to control the conduct of such proceedings; the approval of amendments to collateral documents; releases of liens on the collateral; and waivers of past defaults under collateral documents. We may not have the ability to control or direct such actions, even if our rights are adversely affected.
We generally will not control our portfolio companies.
We do not expect to control most of our portfolio companies, even though we may have board representation or board observation rights, and our debt agreements with such portfolio companies may contain certain restrictive covenants. As a result, we are subject to the risk that a portfolio company in which we invest may make business decisions with which we disagree and the management of such company, as representatives of the holders of their common equity, may take risks or otherwise act in ways that do not serve our interests as debt investors. Due to the lack of liquidity for our investments in non-traded companies, we may not be able to dispose of our interests in our portfolio companies as readily as we would like or at an appropriate valuation. As a result, a portfolio company may make decisions that could decrease the value of our portfolio holdings.
Declines in market values or fair market values of our investments could result in significant net unrealized depreciation of our portfolio, which in turn would reduce our net asset value.
Under the 1940 Act, we are required to carry our investments at market value or, if no market value is ascertainable, at fair value as determined in good faith by or under the direction of our board of directors. While most of our investments are not publicly traded, applicable accounting standards require us to assume as part of our valuation process that our investments are sold in a principal market to market participants (even if we plan on holding an investment through its maturity) and impairments of the market values or fair market values of our investments, even if unrealized, must be reflected in our financial statements for the applicable period as unrealized depreciation, which can result in significant reductions our net asset values for a given period.
A significant portion of our investment portfolio is and will be recorded at fair value as determined in good faith by our board of directors and, as a result, there is and will be uncertainty as to the value of our portfolio investments.
Under the 1940 Act, we are required to carry our portfolio investments at market value or, if there is no readily available market value, at fair value, as determined by our board of directors. There is not a public market for the securities of the privately-held companies in which we invest. Most of our investments are not publicly-traded or actively-traded on a secondary market but are, instead, traded on a privately negotiated over-the-counter secondary market for institutional investors or are not traded at all. As a result, we value these securities quarterly at fair value as determined in good faith by our board of directors.
Certain factors that may be considered in determining the fair value of our investments include dealer quotes for securities traded on the secondary market for institutional investors, the nature and realizable value of any collateral, the portfolio company’s earnings and its ability to make payments on its indebtedness, the markets in which the portfolio company does business, comparison to comparable publicly-traded companies, discounted cash flow and other relevant factors. Because such valuations, and particularly valuations of private securities and private companies, are inherently uncertain, may fluctuate over short periods of time and may be based on estimates, our determinations of fair value may differ materially from the values that would have been used if a ready market for these non-traded securities existed. Due to this uncertainty, our fair value determinations may cause our net asset value on a given date to materially understate or overstate the value that we may ultimately realize upon the sale of one or more of our investments.
We are exposed to risks associated with changes in interest rates.
We are subject to financial market risks, including changes in interest rates. General interest rate fluctuations may have a substantial negative impact on our investments, investment opportunities and cost of capital and, accordingly, may have a material adverse effect on our investment objectives, our rate of return on invested capital and our ability to service our debt and make distributions to our stockholders.
37
Table of Contents
Our investment portfolio primarily consists of senior secured debt with maturities typically ranging from three to seven years. The longer the duration of these securities, generally, the more susceptible they are to changes in market interest rates. As market interest rates increase, those securities with a lower yield-at-cost can experience a mark-to-market unrealized loss. An impairment of the fair market value of our investments, even if unrealized, must be reflected in our financial statements for the applicable period and may therefore have a material adverse effect on our results of operations for that period.
Because we incur indebtedness to make investments, our net investment income is dependent, in part, upon the difference between the rate at which we borrow funds or pay interest on outstanding debt securities and the rate at which we invest these funds. An increase in interest rates would make it more expensive to use debt to finance our investments or to refinance our current financing arrangements. In addition, certain of our financing arrangements provide for adjustments in the loan interest rate along with changes in market interest rates. Therefore, in periods of rising interest rates, our cost of funds will increase, which could materially reduce our net investment income. Any reduction in the level of interest rates on new investments relative to interest rates on our current investments could also adversely impact our net investment income.
We have and may continue to increase our floating rate investments to position our portfolio for rate increases. However, there can be no assurance that this will successfully mitigate our exposure to interest rate risk. For example, in the event of a rising interest rate environment, payments under floating rate debt instruments generally would rise and there may be a significant number of issuers of such floating rate debt instruments that would be unable or unwilling to pay such increased interest costs and may otherwise be unable to repay their loans. Investments in floating rate debt instruments may also decline in value in response to rising interest rates if the interest rates of such investments do not rise as much, or as quickly, as market interest rates in general. Similarly, during periods of rising interest rates, our fixed rate investments may decline in value because the fixed rate of interest paid thereunder may be below market interest rates.
We may use interest rate risk management techniques in an effort to limit our exposure to interest rate fluctuations. These techniques may include various interest rate hedging activities to the extent permitted by the 1940 Act. These activities may limit our ability to participate in the benefits of lower interest rates with respect to the hedged portfolio. We have limited experience in entering into hedging transactions, and we will initially have to develop such expertise or arrange for such expertise to be provided. Adverse developments resulting from hedging transactions could have a material adverse effect on our business, financial condition, results of operations and cash flows.
Furthermore, because a rise in the general level of interest rates can be expected to lead to higher interest rates applicable to our debt investments, an increase in interest rates would make it easier for us to meet or exceed the incentive fee hurdle rate in our investment advisory agreement and may result in a substantial increase of the amount of incentive fees payable to FB Advisor with respect to pre-incentive fee net investment income.
A covenant breach by our portfolio companies may harm our operating results.
A portfolio company’s failure to satisfy financial or operating covenants imposed by us or other lenders could lead to defaults and, potentially, termination of its loans and foreclosure on its secured assets, which could trigger cross-defaults under other agreements and jeopardize a portfolio company’s ability to meet its obligations under the debt or equity securities that we hold. We may incur expenses to the extent necessary to seek recovery upon default or to negotiate new terms, which may include the waiver of certain financial covenants, with a defaulting portfolio company.
Our portfolio companies may be highly leveraged.
Some of our portfolio companies may be highly leveraged, which may have adverse consequences to these companies and to us as an investor. These companies may be subject to restrictive financial and operating covenants and the leverage may impair these companies’ ability to finance their future operations and capital
38
Table of Contents
needs. As a result, these companies’ flexibility to respond to changing business and economic conditions and to take advantage of business opportunities may be limited. Further, a leveraged company’s income and net assets will tend to increase or decrease at a greater rate than if borrowed money were not used.
We may not realize gains from our equity investments.
Certain investments that we may make may include equity related securities, such as rights and warrants that may be converted into or exchanged for common stock or the cash value of the common stock. In addition, we may make direct equity investments in portfolio companies. The equity interests we receive may not appreciate in value and, in fact, may decline in value. Accordingly, we may not be able to realize gains from our equity interests and any gains that we do realize on the disposition of any equity interests may not be sufficient to offset any other losses we experience. We also may be unable to realize any value if a portfolio company does not have a liquidity event, such as a sale of the business, recapitalization or public offering, which would allow us to sell the underlying equity interests. We may be unable to exercise any put rights we acquire, which grant us the right to sell our equity securities back to the portfolio company, for the consideration provided in our investment documents if the issuer is in financial distress.
An investment strategy focused primarily on privately held companies presents certain challenges, including the lack of available information about these companies.
Our investments are primarily in privately-held companies. Investments in private companies pose significantly greater risks than investments in public companies. First, private companies have reduced access to the capital markets, resulting in diminished capital resources and the ability to withstand financial distress. As a result, these companies, which may present greater credit risk than public companies, may be unable to meet their obligations under their debt securities that we hold. Second, the investments themselves often may be illiquid. The securities of most of the companies in which we invest are not publicly-traded or actively-traded on the secondary market and are, instead, traded on a privately negotiated over-the-counter secondary market for institutional investors. In addition, such securities may be subject to legal and other restrictions on resale. As such, we may have difficulty exiting an investment promptly or at a desired price prior to maturity or outside of a normal amortization schedule. These investments may also be difficult to value because little public information generally exists about private companies, requiring an experienced due diligence team to analyze and value the potential portfolio company. Finally, these companies may not have third-party debt ratings or audited financial statements. We must therefore rely on the ability of FB Advisor and/or GDFM to obtain adequate information through due diligence to evaluate the creditworthiness and potential returns from investing in these companies. These companies and their financial information will generally not be subject to the Sarbanes-Oxley Act and other rules and regulations that govern public companies. If we are unable to uncover all material information about these companies, we may not make a fully informed investment decision, and we may lose money on our investments.
A lack of liquidity in certain of our investments may adversely affect our business.
We invest in certain companies whose securities are not publicly-traded or actively-traded on the secondary market and are, instead, traded on a privately negotiated over-the-counter secondary market for institutional investors and whose securities are subject to legal and other restrictions on resale or are otherwise less liquid than publicly-traded securities. The illiquidity of certain of our investments may make it difficult for us to sell these investments when desired. In addition, if we are required to liquidate all or a portion of our portfolio quickly, we may realize significantly less than the value at which we had previously recorded these investments. The reduced liquidity of our investments may make it difficult for us to dispose of them at a favorable price, and, as a result, we may suffer losses.
We may not have the funds or ability to make additional investments in our portfolio companies.
We may not have the funds or ability to make additional investments in our portfolio companies. After our initial investment in a portfolio company, we may be called upon from time to time to provide additional funds to
39
Table of Contents
such company or have the opportunity to increase our investment through the exercise of a warrant to purchase common stock. There is no assurance that we will make, or will have sufficient funds to make, follow-on investments. Any decisions not to make a follow-on investment or any inability on our part to make such an investment may have a negative impact on a portfolio company in need of such an investment, may result in a missed opportunity for us to increase our participation in a successful operation or may reduce the expected return on the investment.
Prepayments of our debt investments by our portfolio companies could adversely impact our results of operations and reduce our return on equity.
We are subject to the risk that the investments we make in our portfolio companies may be repaid prior to maturity. When this occurs, we will generally reinvest these proceeds in temporary investments, pending their future investment in new portfolio companies. These temporary investments will typically have substantially lower yields than the debt being prepaid and we could experience significant delays in reinvesting these amounts. Any future investment in a new portfolio company may also be at lower yields than the debt that was repaid. As a result, our results of operations could be materially adversely affected if one or more of our portfolio companies elect to prepay amounts owed to us. Additionally, prepayments, net of prepayment fees, could negatively impact our return on equity.
Our investments may include original issue discount instruments.
To the extent that we invest in original issue discount instruments and the accretion of original issue discount constitutes a portion of our income, we will be exposed to risks associated with the requirement to include such non-cash income in taxable and accounting income prior to receipt of cash, including the following:
| • | Original issue discount instruments may have unreliable valuations because the accruals require judgments about collectability; |
| • | For accounting purposes, cash distributions to investors representing original issue discount income do not come from paid-in capital, although they may be paid from the offering proceeds. Thus, although a distribution of original issue discount income may come from the cash invested by investors, the 1940 Act does not require that investors be given notice of this fact; |
| • | The deferral of paid-in-kind, or PIK, interest may have a negative impact on liquidity, as it represents non-cash income that may require cash distributions to stockholders in order to maintain our RIC election; and |
| • | Original issue discount may create a risk of non-refundable cash payments to FB Advisor based on non-cash accruals that may never be realized. |
We may from time to time enter into total return swaps, credit default swaps or other derivative transactions which expose us to certain risks, including credit risk, market risk, liquidity risk and other risks similar to those associated with the use of leverage.
We may from time to time enter into total return swaps, credit default swaps or other derivative transactions that seek to modify or replace the investment performance of a particular reference security or other asset. These transactions are typically individually negotiated, non-standardized agreements between two parties to exchange payments, with payments generally calculated by reference to a notional amount or quantity. Swap contracts and similar derivative contracts are not traded on exchanges; rather, banks and dealers act as principals in these markets. These investments may present risks in excess of those resulting from the referenced security or other asset. Because these transactions are not an acquisition of the referenced security or other asset itself, the investor has no right directly to enforce compliance with the terms of the referenced security or other asset and has no voting or other consensual rights of ownership with respect to the referenced security or other asset. In the event of insolvency of a counterparty, we will be treated as a general creditor of the counterparty and will have no claim of title with respect to the referenced security or other asset.
40
Table of Contents
A total return swap is a contract in which one party agrees to make periodic payments to another party based on the change in the market value of the referenced security or other assets underlying the total return swap during a specified period, in return for periodic payments based on a fixed or variable interest rate.
A total return swap is subject to market risk, liquidity risk and risk of imperfect correlation between the value of the total return swap and the debt obligations underlying the total return swap. In addition, we may incur certain costs in connection with a total return swap that could in the aggregate be significant.
A credit default swap is a contract in which one party buys or sells protection against a credit event with respect to an issuer, such as an issuer’s failure to make timely payments of interest or principal on its debt obligations, bankruptcy or restructuring during a specified period. Generally, if we sell credit protection using a credit default swap, we will receive fixed payments from the swap counterparty and if a credit event occurs with respect to the applicable issuer, we will pay the swap counterparty par for the issuer’s defaulted debt securities and the swap counterparty will deliver the defaulted debt securities to us. Generally, if we buy credit protection using a credit default swap, we will make fixed payments to the counterparty and if a credit event occurs with respect to the applicable issuer, we will deliver the issuer’s defaulted securities underlying the swap to the swap counterparty and the counterparty will pay us par for the defaulted securities. Alternatively, a credit default swap may be cash settled and the buyer of protection would receive the difference between the par value and the market value of the issuer’s defaulted debt securities from the seller of protection.
Credit default swaps are subject to the credit risk of the underlying issuer. If we are selling credit protection, there is a risk that we will not properly assess the risk of the underlying issuer, a credit event will occur and we will have to pay the counterparty. If we are buying credit protection, there is a risk that we will not properly assess the risk of the underlying issuer, no credit event will occur and we will receive no benefit for the premium paid.
A derivative transaction is also subject to the risk that a counterparty will default on its payment obligations thereunder or that we will not be able to meet our obligations to the counterparty. In some cases, we may post collateral to secure our obligations to the counterparty, and we may be required to post additional collateral upon the occurrence of certain events such as a decrease in the value of the reference security or other asset. In some cases, the counterparty may not collateralize any of its obligations to us.
Derivative investments effectively add leverage to a portfolio by providing investment exposure to a security or market without owning or taking physical custody of such security or investing directly in such market. In addition to the risks described above, such arrangements are subject to risks similar to those associated with the use of leverage.
Risks Related to Debt Financing
We currently incur indebtedness to make investments, which magnifies the potential for gain or loss on amounts invested in our common shares and may increase the risk of investing in our common shares.
The use of indebtedness, also known as leverage, increases the volatility of investments by magnifying the potential for gain or loss on invested equity capital. When we use leverage to partially finance our investments, through borrowing from banks and other lenders or issuing debt securities, our stockholders will experience increased risks of investing in our common stock. If the value of our assets increases, then leverage would cause the net asset value attributable to our common stock to increase more sharply than it would have had we not utilized leverage. Conversely, if the value of our assets decreases, leverage would cause net asset value to decline more sharply than it otherwise would have had we not utilized leverage. Similarly, any increase in our income in excess of consolidated interest payable on our indebtedness would cause our net income to increase more than it would without leverage, while any decrease in our income would cause net income to decline more sharply than it would have had we not utilized leverage. Such a decline could negatively affect our ability to make distributions to stockholders.
41
Table of Contents
The agreements governing our debt financing arrangements contain various covenants which, if not complied with, have a material adverse effect on our ability to meet our investment obligations and to pay distributions to our stockholders.
The agreements governing certain of our and our special purpose financing subsidiaries’ financing arrangements require us and our subsidiaries to comply with certain financial and operational covenants. These covenants require us and our subsidiaries to, among other things, maintain certain financial ratios, including asset coverage and minimum stockholders’ equity. Compliance with these covenants depends on many factors, some of which are beyond our and their control. In the event of deterioration in the capital markets and pricing levels subsequent to this period, net unrealized depreciation in our and our subsidiaries’ portfolio may increase in the future and could result in non-compliance with certain covenants, or our taking actions which could disrupt our business and impact our ability to meet our investment objectives. For example, the agreements governing the Broad Street credit facility require Broad Street to comply with certain operational covenants, including maintaining eligible assets with an aggregate value equal to or exceeding a specified multiple of the borrowings under the Broad Street credit facility, and a decline in the value of assets owned by Broad Street could result in our being required to contribute additional assets to Broad Street.
There can be no assurance that we and our subsidiaries will continue to comply with the covenants under our financing arrangements. Failure to comply with these covenants could result in a default which, if we and our subsidiaries were unable to obtain a waiver from the debt holders, could accelerate repayment under any or all of our and their debt instruments and thereby force us to liquidate investments at a disadvantageous time and/or at a price which could result in losses, or allow our lenders to sell assets pledged as collateral under our financing arrangements in order to satisfy amounts due thereunder. These occurrences could have a material adverse impact on our liquidity, financial condition, results of operations and ability to pay distributions. See “Item 7. Management’s Discussion and Analysis of Financial Condition and Results of Operations—Financial Condition, Liquidity and Capital Resources” for a more detailed discussion of the terms of debt financings.
We are subject to risks associated with our debt securitization facility.
On April 23, 2013, through our two wholly-owned, special-purpose financing subsidiaries, Locust Street Funding LLC, or Locust Street, and Race Street Funding LLC, or Race Street, we entered into an amendment to our debt financing arrangement with JPMorgan Chase Bank, N.A., London Branch, or JPM, pursuant to which $950.0 million will be made available to us to fund investments and for other general corporate purposes. The financing transaction with JPM is structured as a debt securitization. We use the term “debt securitization” to describe a form of secured borrowing under which an operating company, sometimes referred to as an originator, acquires or originates loans or other assets that earn income, whether on a one-time or recurring basis, or collectively referred to herein as income producing assets, and borrows money on a non-recourse basis against a legally separate pool of income producing assets. In a typical debt securitization, the originator transfers the income producing assets to a special-purpose, bankruptcy-remote subsidiary, also referred to as a “special purpose entity”, which is established solely for the purpose of holding income producing assets and issuing debt secured by these income producing assets. The special purpose entity completes the borrowing through the issuance of notes secured by the income producing assets.
Pursuant to the financing arrangement, the assets held by Locust Street secure the obligations of Locust Street under the Class A Notes to be issued from time to time by Locust Street to Race Street pursuant to the Amended and Restated Indenture. Pursuant to the Amended and Restated Indenture, the aggregate principal amount of Class A Notes that may be issued by Locust Street from time to time is $1.14 billion. All principal and interest on the Class A Notes will be due and payable on the stated maturity date of April 15, 2024. Race Street will purchase the Class A Notes to be issued by Locust Street from time to time at a purchase price equal to their par value.
Race Street, in turn, has entered into a repurchase transaction with JPM pursuant to the terms of an amended and restated global master repurchase agreement and the related annex and amended and restated confirmation
42
Table of Contents
thereto, each dated as of April 23, 2013, and subsequently amended as of October 24, 2013 and as of November 19, 2014, or collectively, the JPM Facility. Pursuant to the JPM Facility, JPM has agreed to purchase from time to time Class A Notes held by Race Street for an aggregate purchase price equal to approximately 83.33% of the principal amount of Class A Notes purchased. Subject to certain conditions, the maximum principal amount of Class A Notes that may be purchased under the JPM Facility is $1.14 billion. Accordingly, the maximum amount payable at any time to Race Street under the JPM Facility will not exceed $950.0 million.
See “Item 7. Management’s Discussion and Analysis of Financial Condition and Results of Operations—Financial Condition, Liquidity and Capital Resources—JPM Financing” for a more detailed discussion of the terms of this debt securitization facility.
As a result of this debt securitization facility, we are subject to certain risks, including those set forth below.
Our equity investment in Locust Street is subordinated to the debt obligations of Locust Street.
Any dividends or other payments in respect of our equity interest in Locust Street are subordinated in priority of payment to the Class A Notes. In addition, Locust Street is subject to certain payment restrictions set forth in the Amended and Restated Indenture in respect of our equity interest.
We will receive cash distributions based on our investment in Locust Street only if Locust Street has made all required cash interest payments on the Class A Notes. We cannot assure stockholders that distributions on the assets held by Locust Street will be sufficient to make any distributions to us or that the yield on our investment in Locust Street will meet our expectations.
Our equity investment in Locust Street is unsecured and ranks behind all of the creditors, known or unknown, of Locust Street, including the holders of the Class A Notes. Consequently, if the value of Locust Street’s assets decreases as a result of conditions in the credit markets, defaulted loans, capital gains and losses on the underlying assets, prepayment or changes in interest rates generally, the value of our equity investment in Locust Street could be reduced. Accordingly, our investment in Locust Street may not produce a profit and may be subject to a loss in an amount up to the entire amount of such equity investment.
In addition, if the value of Locust Street’s assets decreases and Locust Street is unable to make any required payments to Race Street pursuant to the terms of the Class A Notes, Race Street may, in turn, be unable to make any required payments to JPM pursuant to the terms of the JPM Facility. In such event, if the value of Race Street’s assets is not sufficient to meet Race Street’s payment obligations to JPM, we would need to loan or otherwise provide additional funds to Race Street to cover Race Street’s payment obligations to JPM, or otherwise be subject to a loss in an amount up to the entire amount of our equity investment in Race Street.
Our equity investment in Race Street is subordinated to the debt obligations of Race Street.
Any dividends or other payments in respect of our equity interest in Race Street are subordinated in priority of payment to Race Street’s payment obligations under the JPM Facility. In addition, Race Street is subject to certain payment restrictions set forth in the JPM Facility in respect of our equity interest.
We will receive cash distributions based on our investment in Race Street only if Race Street has made all required payments under the JPM Facility. We cannot assure stockholders that distributions on the assets held by Race Street, including the Class A Notes, will be sufficient to make any distributions to us or that the yield on our investment in Race Street will meet our expectations.
Our equity investment in Race Street is unsecured and ranks behind all of the creditors, known or unknown, of Race Street, including JPM. Consequently, if the value of Race Street’s assets decreases as a result of conditions in the credit markets, defaulted loans, capital gains and losses on the underlying assets, prepayment or
43
Table of Contents
changes in interest rates generally, the value of our equity investment in Race Street could be reduced. Accordingly, our investment in Race Street may not produce a profit and may be subject to a loss in an amount up to the entire amount of such equity investment.
In addition, if the value of Race Street’s assets decreases or Locust Street fails to make any required payments to Race Street pursuant to the terms of the Class A Notes, Race Street may be unable to make any required payments to JPM pursuant to the terms of the JPM Facility. In such event, if the value of Race Street’s assets is not sufficient to meet Race Street’s payment obligations to JPM, we would need to loan or otherwise provide additional funds to Race Street to cover Race Street’s payment obligations to JPM, or otherwise be subject to a loss in an amount up to the entire amount of our equity investment in Race Street.
Our equity investments in Locust Street and Race Street have a high degree of leverage.
As of December 31, 2014, Locust Street had issued Class A Notes in an aggregate amount of $1.14 billion (the maximum amount of Class A Notes permitted to be issued by Locust Street under the Amended and Restated Indenture). The fair value of assets held by Locust Street as of December 31, 2014 was approximately $1,832,095, which included assets purchased by Locust Street with proceeds from the issuance of Class A Notes. The repurchase amount payable by Race Street to JPM under the JPM Facility in respect of the issued Class A Notes is $950.0 million, plus applicable interest, and as of December 31, 2014, the fair value of assets held by Race Street was approximately $855,341. The market value of our equity assets in Locust Street and Race Street may be significantly affected by a variety of factors, including changes in the market value of the assets held by Locust Street and Race Street, changes in distributions on the assets held by Locust Street and Race Street, defaults and recoveries on those assets, capital gains and losses on those assets, prepayments on those assets and other risks associated with those assets. Our investments in Locust Street and Race Street may not produce a profit and may be subject to a loss in an amount up to the entire amount of such equity investment. The leveraged nature of our equity investment may magnify the adverse impact of any loss on our equity investment.
The interests of JPM, as the holder of the Class A Notes, may not be aligned with our interests, and we will not have control over remedies in respect of the Class A Notes.
The Class A Notes rank senior in right of payment to any equity securities issued by Locust Street. As a result, there are circumstances in which the interests of JPM, as the holder of the Class A Notes, may not be aligned with our interests. For example, under the terms of the Class A Notes, JPM has the right to receive payments of principal and interest prior to Locust Street making any distributions or dividends to holders of its equity securities.
For as long as the Class A Notes remain outstanding, JPM has the right to act in certain circumstances with respect to the portfolio of assets that secure the obligations of Locust Street under the Class A Notes in ways that may benefit their interests but not ours, including by exercising remedies or directing the Amended and Restated Indenture trustee to declare events of default under or accelerate the Class A Notes in accordance with the terms of the Amended and Restated Indenture. JPM has no obligation to consider any possible adverse effect that actions taken may have on our equity interests. For example, upon the occurrence of an event of default with respect to the Class A Notes, the trustee, which is currently Citibank, may declare the outstanding principal amount of all of the Class A Notes, together with any accrued interest thereon, to be immediately due and payable. This would have the effect of accelerating the outstanding principal amount of the Class A Notes and triggering a repayment obligation on the part of Locust Street. Locust Street may not have funds sufficient to make required payments on the Class A Notes and make any distributions to us. Any failure of Locust Street to make distributions on the equity interests we hold could have a material adverse effect on our business, financial condition, results of operations and cash flows, and may result in our inability to make distributions to our stockholders in amounts sufficient to maintain our qualification as a RIC, or at all.
44
Table of Contents
Locust Street may fail to meet certain asset coverage and quality tests, which would have an adverse effect on us.
Under the Amended and Restated Indenture, there are coverage tests and quality tests applicable to the collateral securing the Class A Notes. The first coverage test, or the Class A Interest Coverage Test, compares the amount of interest received on the portfolio of assets held by Locust Street to the amount of interest payable in respect of the Class A Notes on the following payment date. To meet the Class A Interest Coverage Test, the aggregate amount of interest received on the portfolio of assets held by Locust Street must equal at least 150% of the interest payable in respect of the Class A Notes. The second coverage test, or the Class A Par Value Test, compares the aggregate par value of the portfolio of assets (other than any asset acquired for a purchase price of less than 80% of its par value, which asset will be assigned a value equal to their purchase price) plus cash held by Locust Street to the aggregate outstanding par value of the Class A Notes. To meet the Class A Par Value Test, the aggregate par value of the portfolio of assets (other than any assets acquired for a purchase price of less than 80% of its par value, which assets will be assigned a value equal to their purchase price) plus cash held by Locust Street must equal at least 145.36% of the aggregate outstanding principal amount of the Class A Notes. The third coverage test, or the Additional Class A Par Value Test, compares the aggregate principal amount of the portfolio of assets (other than any defaulted assets, which assets will be assigned a value equal to its market value) held by Locust Street to the aggregate outstanding par value of the Class A Notes. To meet the Additional Class A Par Value Test, the aggregate par value of the portfolio of assets (other than any defaulted assets, which assets will be assigned a value equal to its market value) held by Locust Street must equal at least 130% of the aggregate outstanding principal amount of the Class A Notes. The quality tests compare the minimum weighted average fixed coupon rates, the minimum weighted average floating coupon rates, the weighted average life, the anticipated recovery rates and the anticipated default rates of the portfolio of assets held by Locust Street to certain benchmarks as described more fully in the Amended and Restated Indenture.
If the Class A Interest Coverage Test or the Class A Par Value Test is not satisfied on any date on which compliance is measured, Locust Street is required to apply available amounts to the repayment of the outstanding principal of the Class A Notes to satisfy the applicable tests. Failure to satisfy the Additional Class A Par Value Test on any measurement date constitutes an event of default under the Amended and Restated Indenture. Obligations that may be added to the portfolio of assets held by Locust Street and constituting collateral from time to time under the Amended and Restated Indenture are subject to certain restrictions in respect of the quality tests referenced above and more fully described in the Amended and Restated Indenture.
The market value of the underlying assets held by Locust Street and Race Street may decline causing Race Street to borrow funds from us in order to meet certain margin posting and minimum market value requirements, which would have an adverse effect on the timing of payments to us.
If at any time during the term of the JPM Facility the market value of the underlying assets held by Locust Street securing the Class A Notes declines by an amount greater than 27% of their initial aggregate purchase price, or the Margin Threshold, Race Street will be required to post cash collateral with JPM in an amount at least equal to the amount by which the market value of such assets at such time is less than the Margin Threshold. Similarly, pursuant to the JPM Facility, the market value of the underlying assets held by Race Street must be at least $648.0 million, or the Market Value Requirement. In either such event, in order to satisfy these requirements, Race Street intends to borrow funds from us pursuant to a revolving credit agreement, dated as of July 21, 2011 and as amended as of September 26, 2012 and April 23, 2013, between Race Street, as borrower, and us, as lender, or the Revolving Credit Agreement. We may, in our sole discretion, make such loans from time to time to Race Street pursuant to the terms of the Revolving Credit Agreement. Borrowings under the Revolving Credit Agreement will accrue interest at a rate equal to one-month LIBOR plus a spread of 0.75% per annum. To the extent we loan additional funds to Race Street to satisfy the Margin Threshold or the Market Value Requirement, such event could have a material adverse effect on our business, financial condition, results of operations and cash flows, and may result in our inability to make distributions to our stockholders in amounts sufficient to maintain our qualification as a RIC, or at all. There is no assurance that loans made pursuant to the Revolving Credit Agreement will be repaid.
45
Table of Contents
Restructurings of investments held by Locust Street or Race Street, if any, may decrease their value and reduce the value of our equity interests in these entities.
As collateral manager, we have broad authority to direct and supervise the investment and reinvestment of the assets held by Locust Street and Race Street, which may require from time to time the execution of amendments, waivers, modifications and other changes to the investment documentation in accordance with the related collateral management agreements we have entered into with Locust Street and Race Street. During periods of economic uncertainty and recession, the necessity for amendments, waivers, modifications and restructurings of investments may increase. Such amendments, waivers, modifications and other restructurings of an investment may change the terms of the investments and, in some cases, may result in Locust Street or Race Street holding assets that do not meet certain specified criteria for the investments specified in the JPM Facility documentation. This could adversely impact the coverage and quality tests under the Amended and Restated Indenture applicable to Locust Street. This could also adversely impact the ability of Locust Street to meet the Margin Threshold and Race Street to meet the Market Value Requirement. Any amendment, waiver, modification or other restructuring of an investment that reduces Locust Street’s compliance with the coverage and quality tests under the Amended and Restated Indenture will make it more likely that Locust Street will need to pay cash to reduce the unpaid principal amount of the Class A Notes so as to cure any breach of such tests. Similarly, any amendment, waiver, modification or other restructuring of an investment that reduces Locust Street’s ability to meet the Margin Threshold or Race Street’s ability to meet the Market Value Requirement will make it more likely that Race Street will need to retain assets, including cash, to increase the market value of the assets held by Race Street and to post cash collateral with JPM in an amount at least equal to the amount by which the market value of the underlying assets held by Locust Street is less than the Margin Threshold. Any such use of cash by Locust Street or Race Street would reduce distributions available to us or delay the timing of distributions to us.
We may not receive cash from Locust Street or Race Street.
We receive cash from Locust Street and Race Street only to the extent that Locust Street or Race Street, respectively, makes distributions to us. Locust Street may make distributions to us, in turn, only to the extent permitted by the Amended and Restated Indenture. The Amended and Restated Indenture generally provides that distributions by Locust Street may not be made unless all amounts owing with respect to the Class A Notes have been paid in full. Race Street may make distributions to us only to the extent permitted by the JPM Facility. The JPM Facility generally provides that distributions by Race Street may not be made if the Margin Threshold has not been met or if the market value of the underlying assets held by Race Street is less than the Market Value Requirement. If we do not receive cash from Locust Street or Race Street, we may be unable to make distributions to our stockholders in amounts sufficient to maintain our qualification as a RIC, or at all. We also could be forced to sell investments in our portfolio at less than their fair value in order to continue making such distributions.
We are subject to the credit risk of JPM.
If JPM fails to sell the Class A Notes back to Race Street at the end of the applicable period, Race Street’s recourse will be limited to an unsecured claim against JPM for the difference between the value of such Class A Notes at such time and the amount that would be owing by Race Street to JPM had JPM performed under the JPM Facility. The ability of JPM to satisfy such a claim will be subject to JPM’s creditworthiness at that time.
Risks Related to an Investment in Our Common Stock
There is a risk that investors in our common stock may not receive distributions or that our distributions may not grow over time.
We cannot assure stockholders that we will achieve investment results that will allow us to make a specified level of cash distributions or year-to-year increases in cash distributions. All distributions will be paid at the
46
Table of Contents
discretion of our board of directors and will depend on our earnings, our net investment income, our financial condition, maintenance of our RIC status, compliance with applicable BDC regulations and such other factors as our board of directors may deem relevant from time to time. In addition, due to the asset coverage test applicable to us as a BDC, we may be limited in our ability to make distributions. See “Item 1. Business—Regulation—Senior Securities.”
Our distribution proceeds may exceed our earnings. Therefore, portions of the distributions that we make may represent a return of capital to stockholders, which will lower their tax basis in their shares.
A return of capital generally is a return of a stockholder’s investment rather than a return of earnings or gains derived from our investment activities. We may pay all or a substantial portion of our distributions from the proceeds of the sale of shares of our common stock or from borrowings in anticipation of future cash flow, which could constitute a return of stockholders’ capital and will lower such stockholders’ tax basis in their shares, which may result in increased tax liability to stockholders when they sell their shares.
Our shares of common stock may trade at a discount to net asset value.
Shares of closed-end investment companies, including BDCs, may trade at a market price that is less than the net asset value that is attributable to those shares. This characteristic of closed-end investment companies is separate and distinct from the risk that our net asset value per share may decline. It is not possible to predict whether shares of our common stock will trade at, above, or below net asset value. In the recent past, including during much of 2009, the stocks of BDCs as an industry traded below net asset value and at near historic lows as a result of concerns over liquidity, leverage restrictions and distribution requirements. If our common stock is trading at a price below its net asset value per share, we will generally not be able to issue additional shares of our common stock at their market price without first obtaining approval for such issuance from our stockholders and our independent directors. At a 2014 special stockholders meeting, our stockholders approved the sale of shares of our common stock at a price below the then-current net asset value per share, subject to certain conditions, during the period beginning on July 17, 2014 and expiring on July 17, 2015. We may not be able to obtain the necessary approvals to sell shares of common stock below net asset value after that date.
We may pay distributions from offering proceeds, borrowings or the sale of assets to the extent our cash flows from operations, net investment income or earnings are not sufficient to fund declared distributions.
We may fund distributions from the uninvested proceeds of a securities offering and borrowings, and we have not established limits on the amount of funds we may use from such proceeds or borrowings to make any such distributions. We have paid and may continue to pay distributions from the sale of assets to the extent distributions exceed our earnings or cash flows from operations. Distributions from offering proceeds or from borrowings could reduce the amount of capital we ultimately invest in our portfolio companies.
A stockholder’s interest in us will be diluted if we issue additional shares, which could reduce the overall value of an investment in us.
Our investors do not have preemptive rights to any shares we issue in the future. Our charter authorizes us to issue 450,000,000 shares of common stock. Pursuant to our charter, a majority of our entire board of directors may amend our charter to increase the number of authorized shares of stock without stockholder approval. After an investor purchases shares, our board of directors may elect to sell additional shares in the future, issue equity interests in private offerings or issue share-based awards to our independent directors or employees of FB Advisor. To the extent we issue additional equity interests after an investor purchases our shares, an investor’s percentage ownership interest in us will be diluted. In addition, depending upon the terms and pricing of any additional offerings and the value of our investments, an investor may also experience dilution in the book value and fair value of his or her shares.
47
Table of Contents
Stockholders may experience dilution in their ownership percentage if they do not participate in our distribution reinvestment plan.
Stockholders who do not participate in our distribution reinvestment plan may experience accretion to the net asset value of their shares if our shares are trading at a premium to net asset value and dilution if our shares are trading at a discount to net asset value. The level of accretion or discount would depend on various factors, including the proportion of our stockholders who participate in the plan, the level of premium or discount at which our shares are trading and the amount of the distribution payable to a stockholder.
Certain provisions of our charter and bylaws as well as provisions of the Maryland General Corporation Law could deter takeover attempts and have an adverse impact on the value of our common stock.
The Maryland General Corporation Law, or the MGCL, and our charter and bylaws contain certain provisions that may have the effect of discouraging, delaying or making difficult a change in control of our company or the removal of our incumbent directors. Under the Business Combination Act of the MGCL, certain business combinations between us and an “interested stockholder” (defined generally to include any person who beneficially owns 10% or more of the voting power of our outstanding shares) or an affiliate thereof is prohibited for five years and thereafter is subject to special stockholder voting requirements, to the extent that such statute is not superseded by applicable requirements of the 1940 Act. However, our board of directors has adopted a resolution exempting from the Business Combination Act any business combination between us and any person to the extent that such business combination receives the prior approval of our board of directors, including a majority of our directors who are not interested persons as defined in the 1940 Act. Under the Control Share Acquisition Act of the MGCL, “control shares” acquired in a “control share acquisition” have no voting rights except to the extent approved by a vote of two-thirds of the votes entitled to be cast on the matter, excluding shares owned by the acquirer, by officers or by directors who are employees of the corporation. Our bylaws contain a provision exempting from the Control Share Acquisition Act any and all acquisitions by any person of shares of our common stock, but such provision may be repealed at any time (before or after a control share acquisition). However, we will amend our bylaws to repeal such provision (so as to be subject to the Control Share Acquisition Act) only if our board of directors determines that it would be in our best interests and if the staff of the SEC does not object to our determination that our being subject to the Control Share Acquisition Act does not conflict with the 1940 Act. The Business Combination Act (if our board of directors should repeal the resolution) and the Control Share Acquisition Act (if we amend our bylaws to be subject to that Act) may discourage others from trying to acquire control of us and increase the difficulty of consummating any offer.
We have also adopted measures that may make it difficult for a third party to obtain control of us, including provisions of our charter: (a) classifying our board of directors into three classes serving staggered three-year terms, (b) providing that a director may be removed only for cause and only by vote of at least two-thirds of the votes entitled to be cast, and (c) authorizing our board of directors to (i) classify or reclassify shares of our stock into one or more classes or series, (ii) cause the issuance of additional shares of our stock, and (iii) amend our charter from time to time, without stockholder approval, to increase or decrease the aggregate number of shares of stock or the number of shares of stock of any class or series that we have authority to issue. These provisions, as well as other provisions of our charter and bylaws, may discourage, delay, defer, make more difficult or prevent a transaction or a change in control that might otherwise be in the best interest of our stockholders.
The net asset value of our common stock may fluctuate significantly.
The net asset value and liquidity, if any, of the market for shares of our common stock may be significantly affected by numerous factors, some of which are beyond our control and may not be directly related to our operating performance. These factors include: (i) changes in regulatory policies or tax guidelines, particularly with respect to RICs or BDCs; (ii) loss of RIC or BDC status; (iii) changes in earnings or variations in operating results; (iv) changes in the value of our portfolio of investments; (v) changes in accounting guidelines governing valuation of our investments; (vi) any shortfall in revenue or net income or any increase in losses from levels
48
Table of Contents
expected by investors; (vii) departure of our investment adviser or sub-adviser or certain of their respective key personnel; (viii) general economic trends and other external factors; and (ix) loss of a major funding source.
The market price of our common stock may fluctuate significantly.
The market price and liquidity of the market for our common stock may be significantly affected by numerous factors, some of which are beyond our control and may not be directly related to our operating performance. These factors include:
| • | significant volatility in the market price and trading volume of securities of publicly traded RICs, BDCs or other companies in our sector, which are not necessarily related to the operating performance of these companies; |
| • | price and volume fluctuations in the overall stock market from time to time; |
| • | changes in law, regulatory policies or tax guidelines, or interpretations thereof, particularly with respect to RICs or BDCs; |
| • | loss of our BDC or RIC status; |
| • | changes in our earnings or variations in our operating results; |
| • | changes in the value of our portfolio of investments; |
| • | any shortfall in revenue or net income or any increase in losses from levels expected by investors or securities analysts; |
| • | departure of FB Advisor’s or GDFM’s key personnel; |
| • | operating performance of companies comparable to us; |
| • | short-selling pressure with respect to shares of our common stock or BDCs generally; |
| • | future sales of our securities convertible into or exchangeable or exercisable for our common stock or the conversion of such securities; |
| • | uncertainty surrounding the strength of the economy; |
| • | general economic trends and other external factors; and |
| • | loss of a major funding source. |
In the past, following periods of volatility in the market price of a company’s securities, securities class action litigation has often been brought against that company. If the market price of our common stuck fluctuates significantly, we may be the target of securities litigation in the future. Securities litigation could result in substantial costs and divert management’s attention and resources from our business.
If we issue preferred stock, debt securities or convertible debt securities, the net asset value and market value of our common stock may become more volatile.
We also cannot assure you that the issuance of preferred stock, debt securities or convertible debt securities would result in a higher yield or return to the holders of our common stock. The issuance of preferred stock, debt securities or convertible debt securities would likely cause the net asset value and market value of our common stock to become more volatile. If the dividend rate on the preferred stock, or the interest rate on the debt securities, were to approach the net rate of return on our investment portfolio, the benefit of leverage to the holders of our common stock would be reduced. If the dividend rate on the preferred stock, or the interest rate on the debt securities, were to exceed the net rate of return on our portfolio, the use of leverage would result in a lower rate of return to the holders of common stock than if we had not issued the preferred stock or debt securities. Any decline in the net asset value of our investment would be borne entirely by the holders of our
49
Table of Contents
common stock. Therefore, if the market value of our portfolio were to decline, the leverage would result in a greater decrease in net asset value to the holders of our common stock than if we were not leveraged through the issuance of preferred stock. This decline in net asset value would also tend to cause a greater decline in the market price for our common stock.
There is also a risk that, in the event of a sharp decline in the value of our net assets, we would be in danger of failing to maintain required asset coverage ratios which may be required by the preferred stock, debt securities, convertible debt or units or of a downgrade in the ratings of the preferred stock, debt securities, convertible debt or units or our current investment income might not be sufficient to meet the dividend requirements on the preferred stock or the interest payments on the debt securities. In order to counteract such an event, we might need to liquidate investments in order to fund redemption of some or all of the preferred stock, debt securities or convertible debt. In addition, we would pay (and the holders of our common stock would bear) all costs and expenses relating to the issuance and ongoing maintenance of the preferred stock, debt securities, convertible debt or any combination of these securities. Holders of preferred stock, debt securities or convertible debt may have different interests than holders of common stock and may at times have disproportionate influence over our affairs.
Holders of any preferred stock that we may issue will have the right to elect members of the board of directors and have class voting rights on certain matters.
The 1940 Act requires that holders of shares of preferred stock must be entitled as a class to elect two directors at all times and to elect a majority of the directors if dividends on such preferred stock are in arrears by two years or more, until such arrearage is eliminated. In addition, certain matters under the 1940 Act require the separate vote of the holders of any issued and outstanding preferred stock, including changes in fundamental investment restrictions and conversion to open-end status and, accordingly, preferred stockholders could veto any such changes. Restrictions imposed on the declarations and payment of dividends or other distributions to the holders of our common stock and preferred stock, both by the 1940 Act and by requirements imposed by rating agencies, might impair our ability to maintain our qualification as a RIC for U.S. federal income tax purposes.
We may again obtain the approval of our stockholders to issue shares of our common stock at prices below the then current net asset value per share of our common stock. If we receive such approval from stockholders in the future, we may issue shares of our common stock at a price below the then current net asset value per share of common stock. Any such issuance could materially dilute our stockholders’ interest in our common stock and reduce our net asset value per share.
On July 17, 2014, we obtained the approval of our stockholders to issue shares of common stock at prices below the then current net asset value of our common stock, subject to certain conditions, during the period beginning on July 17, 2014 and expiring on July 17, 2015. We may again obtain the approval of our stockholders to issue shares of our common stock at prices below the then current net asset value per share of our common stock in one or more offerings for a twelve-month period. Such approval may allow us to access the capital markets in a way that we typically are unable to do as a result of restrictions that, absent stockholder approval, apply to BDCs under the 1940 Act.
Any sale or other issuance of shares of our common stock at a price below net asset value per share would result in an immediate dilution to our common stock and a reduction of our net asset value per share. This dilution would occur as a result of a proportionately greater decrease in a stockholder’s interest in our earnings and assets and voting interest in us than the increase in our assets resulting from such issuance. Because the number of future shares of common stock that may be issued below our net asset value per share and the price and timing of such issuances are not currently known, we cannot predict the actual dilutive effect of any such issuance. We also cannot determine the resulting reduction in our net asset value per share of any such issuance at this time. We caution you that such effects may be material, and we undertake to describe the material risks and dilutive effects of any offering that we make at a price below our then current net asset value in the future in a prospectus supplement issued in connection with any such offering.
50
Table of Contents
Risks Related to U.S. Federal Income Tax
We will be subject to corporate-level income tax if we are unable to qualify as a RIC under Subchapter M of the Code or to satisfy RIC distribution requirements.
To qualify for and maintain RIC tax treatment under Subchapter M of the Code, we must meet the following annual distribution, income source and asset diversification requirements. See “Item 1. Business—Taxation as a RIC.”
| • | The Annual Distribution Requirement for a RIC will be satisfied if we distribute to our stockholders each tax year, dividends of an amount at least equal to the sum of 90% of our investment company taxable income, without regard to any deduction for dividends paid. Because we may use debt financing, we are subject to an asset coverage ratio requirement under the 1940 Act and may in the future become subject to certain financial covenants under loan and credit agreements that could, under certain circumstances, restrict us from making distributions necessary to satisfy the Annual Distribution Requirement. If we are unable to obtain cash from other sources, we could fail to qualify for RIC tax treatment and thus become subject to corporate-level income tax. |
| • | The income source requirement will be satisfied if we obtain at least 90% of our gross income for each tax year from dividends, interest, gains from the sale of securities or similar sources. |
| • | The asset diversification requirement will be satisfied if we meet certain asset diversification requirements at the end of each quarter of our tax year. To satisfy this requirement, at least 50% of the value of our assets must consist of cash, cash equivalents, U.S. government securities, securities of other RICs, and other securities if such securities of any one issuer do not represent more than 5% of the value of our assets or more than 10% of the outstanding voting securities of such issuer; and no more than 25% of the value of our assets can be invested in the securities, other than U.S. government securities or securities of other RICs, of one issuer, of two or more issuers that are controlled, as determined under applicable Code rules, by us and that are engaged in the same or similar or related trades or businesses or of certain “qualified publicly-traded partnerships.” Failure to meet these requirements may result in our having to dispose of certain investments quickly in order to prevent the loss of RIC status. Because most of our investments will be in private companies, and therefore will be relatively illiquid, any such dispositions could be made at disadvantageous prices and could result in substantial losses. |
If we fail to qualify for or maintain RIC tax treatment for any reason and are subject to corporate income tax, the resulting corporate taxes could substantially reduce our net assets, the amount of income available for distribution and the amount of our distributions.
We may have difficulty paying our required distributions if we recognize income before or without receiving cash representing such income.
For U.S. federal income tax purposes, we may be required to recognize taxable income in circumstances in which we do not receive a corresponding payment in cash. For example, if we hold debt instruments that are treated under applicable tax rules as having original issue discount (such as debt instruments with PIK interest or, in certain cases, increasing interest rates or debt instruments that were issued with warrants), we must include in income each year a portion of the original issue discount that accrues over the life of the obligation, regardless of whether cash representing such income is received by us in the same tax year. We may also have to include in income other amounts that we have not yet received in cash, such as deferred loan origination fees that are paid after origination of the loan or are paid in non-cash compensation such as warrants or stock. We anticipate that a portion of our income may constitute original issue discount or other income required to be included in taxable income prior to receipt of cash. Further, we may elect to amortize market discount and include such amounts in our taxable income in the current year, instead of upon disposition, as an election not to do so would limit our ability to deduct interest expenses for tax purposes.
51
Table of Contents
Because any original issue discount or other amounts accrued will be included in our investment company taxable income for the year of the accrual, we may be required to make a distribution to our stockholders in order to satisfy the annual distribution requirement, even though we will not have received any corresponding cash amount. As a result, we may have difficulty meeting the annual distribution requirement necessary to qualify for and maintain RIC tax treatment under Subchapter M of the Code. We may have to sell some of our investments at times and/or at prices we would not consider advantageous, raise additional debt or equity capital or forgo new investment opportunities for this purpose. If we are not able to obtain cash from other sources, we may fail to qualify for or maintain RIC tax treatment and thus become subject to corporate-level income tax.
Our portfolio investments may present special tax issues.
Investments in below-investment grade debt instruments and certain equity securities may present special tax issues for us. U.S. federal income tax rules are not entirely clear about issues such as when we may cease to accrue interest, original issue discount or market discount, when and to what extent deductions may be taken for bad debts or worthless debt in equity securities, how payments received on obligations in default should be allocated between principal and interest income, as well as whether exchanges of debt instruments in a bankruptcy or workout context are taxable. Such matters could cause us to recognize taxable income for U.S. federal income tax purposes, even in the absence of cash or economic gain, and require us to make taxable distributions to our stockholders to maintain our RIC status or preclude the imposition of either U.S. federal corporate income or excise taxation. Additionally, because such taxable income may not be matched by corresponding cash received by us, we may be required to borrow money or dispose of other investments to be able to make distributions to our stockholders. These and other issues will be considered by us, to the extent determined necessary, in order that we minimize the level of any U.S. federal income or excise tax that we would otherwise incur. See “Item 1. Business—Taxation as a RIC.”
| Item 1B. | Unresolved Staff Comments. |
None.
| Item 2. | Properties. |
We do not own any real estate or other physical properties materially important to our operation. Our headquarters are located at 201 Rouse Boulevard, Philadelphia, Pennsylvania, 19112. We believe that our office facilities are suitable and adequate for our business as it is presently conducted.
| Item 3. | Legal Proceedings. |
We are not currently subject to any material legal proceedings, nor, to our knowledge, is any material legal proceeding threatened against us. From time to time, we may be party to certain legal proceedings in the ordinary course of business, including proceedings relating to the enforcement of our rights under contracts with our portfolio companies. While the outcome of any legal proceedings cannot be predicted with certainty, we do not expect that these proceedings will have a material adverse effect upon our financial condition or results of operations.
| Item 4. | Mine Safety Disclosures. |
Not applicable.
52
Table of Contents
PART II
Many of the amounts and percentages presented in Part II have been rounded for convenience of presentation, and all dollar amounts, excluding share and per share amounts, are presented in thousands unless otherwise noted.
| Item 5. | Market for Registrant’s Common Equity, Related Stockholder Matters and Issuer Purchases of Equity Securities. |
Market Information
Our common stock has been listed on the NYSE under the ticker symbol “FSIC” since April 16, 2014. Prior to such date, there was no public market for our common stock. Our shares of common stock have historically traded at prices both above and below our net asset value per share. It is not possible to predict whether shares of our common stock will trade at, above or below our net asset value in the future. See “Risk Factors—Risks Related to an Investment in Our Common Stock—Our shares of common stock may trade at a discount to net asset value.”
The following table sets forth the net asset value per share of our common stock as of the applicable period end and the range of high and low closing sales prices of our common stock as reported on the NYSE during such period. On February 27, 2015, the last reported closing sales price of our common stock on the NYSE was $10.00 per share.
| Net Asset
Value Per Share(1) |
Closing Sales Price | |||||||||||
| For the Three Months Ended |
High | Low | ||||||||||
| Fiscal 2014 |
||||||||||||
| Period from April 16, 2014 to June 30, 2014 |
$ | 10.28 | $ | 10.67 | $ | 10.07 | ||||||
| September 30, 2014 |
10.19 | 10.77 | 10.25 | |||||||||
| December 31, 2014 |
9.83 | 10.63 | 9.85 | |||||||||
| (1) | Net asset value per share is determined as of the last day in the relevant period and therefore may not reflect the net asset value per share on the date of the high and low closing sales prices. The net asset values shown are based on outstanding shares at the end of the relevant period. |
As of February 27, 2015, we had 3,407 record holders of our common stock which does not include beneficial owners of shares of common stock held in “street name” by brokers and other institutions on behalf of stockholders.
Listing Tender Offer and Share Repurchase Program
On April 16, 2014, we commenced a modified “Dutch auction” tender offer, or the listing tender offer, to purchase for cash up to $250,000 in value of our shares of common stock from our stockholders. In accordance with the terms of the listing tender offer, we selected the lowest price, not greater than $11.00 per share or less than $10.35 per share, net to the tendering stockholder in cash, less any applicable withholding taxes and without interest, that enabled us to purchase the maximum number of shares of common stock properly tendered in the listing tender offer and not properly withdrawn having an aggregate purchase price of up to $250,000.
The listing tender offer expired on May 28, 2014. Due to the oversubscription of the listing tender offer, on June 4, 2014, we accepted for purchase on a pro rata basis 23,255,813 shares of common stock, or approximately 96.6% of the shares tendered, at a purchase price of $10.75 per share, for an aggregate cost of approximately $250,000, excluding fees and expenses relating to the listing tender offer. The 23,255,813 shares of common stock accepted for purchase in the listing tender offer represented approximately 8.9% of our issued and outstanding shares of common stock as of June 4, 2014.
53
Table of Contents
We used available cash and borrowings under the ING credit facility to fund the purchase of shares of common stock in the listing tender offer and to pay for all related fees and expenses.
Historically, we conducted quarterly tender offers pursuant to our share repurchase program to provide our stockholders with limited liquidity. In anticipation of the listing of our shares of common stock on the NYSE, our board of directors terminated our share repurchase program effective March 21, 2014.
The following table provides information concerning our repurchases pursuant to our former share repurchase program during the years ended December 31, 2014, 2013 and 2012:
| For the Three Months Ended |
Repurchase Date | Shares Repurchased |
Percentage of Shares Tendered That Were Repurchased |
Repurchase Price Per Share |
Aggregate Consideration for Repurchased Shares |
|||||||||||||
| Fiscal 2012 |
||||||||||||||||||
| December 31, 2011 |
January 3, 2012 | 385,526 | 100 | % | $ | 9.585 | $ | 3,695 | ||||||||||
| March 31, 2012 |
April 2, 2012 | 411,815 | 100 | % | $ | 9.675 | $ | 3,984 | ||||||||||
| June 30, 2012 |
July 2, 2012 | 410,578 | 100 | % | $ | 9.720 | $ | 3,991 | ||||||||||
| September 30, 2012 |
October 1, 2012 | 672,064 | 100 | % | $ | 9.900 | $ | 6,653 | ||||||||||
| Fiscal 2013 |
||||||||||||||||||
| December 31, 2012 |
January 2, 2013 | 883,047 | 100 | % | $ | 10.000 | $ | 8,830 | ||||||||||
| March 31, 2013 |
April 1, 2013 | 1,053,119 | 100 | % | $ | 10.100 | $ | 10,637 | ||||||||||
| June 30, 2013 |
July 1, 2013 | 749,224 | 100 | % | $ | 10.200 | $ | 7,642 | ||||||||||
| September 30, 2013 |
October 1, 2013 | 656,541 | 100 | % | $ | 10.200 | $ | 6,697 | ||||||||||
| Fiscal 2014 |
||||||||||||||||||
| December 31, 2013 |
January 2, 2014 | 872,865 | 100 | % | $ | 10.200 | $ | 8,903 | ||||||||||
Distributions
Following the formal commencement of our investment operations, we declared our first distribution on January 29, 2009. Effective January 1, 2015 and subject to applicable legal restrictions and the sole discretion of our board of directors, we intend to authorize, declare and pay regular cash distributions on a quarterly basis. From time to time, we may also pay special interim distributions in the form of cash or shares of our common stock at the discretion of our board of directors. The timing and amount of any future distributions to stockholders are subject to applicable legal restrictions and the sole discretion of our board of directors.
The following table reflects the cash distributions per share that we have declared and paid on our common stock during the years ended December 31, 2014, 2013 and 2012:
| Distribution | ||||||||
| For the Year Ended December 31, |
Per Share | Amount | ||||||
|
2012(1)(2) |
$ | 0.8586 | $ | 197,906 | ||||
|
2013(3) |
0.8303 | 212,153 | ||||||
|
2014(4)(5) |
1.0843 | 267,856 | ||||||
| (1) | In addition to regular cash distributions during such period, cash distributions declared and paid on our common stock during the year ended December 31, 2012 include approximately $12,417, or approximately $0.05 per share, in special cash distributions. |
| (2) | On May 15, 2012, our board of directors determined to increase the amount of semi-monthly distributions payable to stockholders of record from $0.033594 per share to $0.03375 per share, effective May 16, 2012. Beginning in June 2012, we declared and paid regular cash distributions on a monthly basis in an amount equal to $0.0675 per share. |
54
Table of Contents
| (3) | On June 25, 2013, our board of directors determined to increase the amount of the regular monthly cash distributions payable to stockholders of record from $0.0675 per share to $0.06975 per share, effective as of June 28, 2013. On October 16, 2013, our board of directors determined to increase the amount of regular monthly cash distributions payable to stockholders of record from $0.06975 per share to $0.0720 per share, effective as of November 29, 2013. |
| (4) | On March 31, 2014, our board of directors determined to increase the amount of the regular monthly cash distribution payable to stockholders of record from $0.0720 per share to $0.07425 per share, effective as of April 30, 2014. |
| (5) | On July 1, 2014, our board of directors declared a special cash distribution of $0.10 per share, which was paid on August 15, 2014 to stockholders of record as of the close of business on July 31, 2014. On October 10, 2014, our board of directors also declared a special cash distribution of $0.10 per share, which was paid on November 14, 2014 to stockholders of record as of the close of business on October 31, 2014. |
On January 13, 2015, our board of directors declared a regular quarterly cash distribution of $0.22275 per share, which will be paid on or about April 2, 2015 to stockholders of record as of the close of business on March 25, 2015.
For additional information regarding our distributions and our distribution reinvestment plan, including certain related tax considerations, see “Item 7. Management’s Discussion and Analysis of Financial Condition and Results of Operations—RIC Status and Distributions.”
55
Table of Contents
Stock Performance Graph
This performance graph shall not be deemed “soliciting material” or to be “filed” with the SEC for purposes of Section 18 of the Exchange Act or otherwise subject to the liabilities under that Section, and shall not be deemed to be incorporated by reference into any filing of FS Investment Corporation under the Securities Act.
The following graph shows a comparison from April 16, 2014 (the date our shares of common stock commenced trading on the NYSE) through December 31, 2014 of the cumulative total return for our common stock, the S&P 500 Index, the Russell 2000 Financial Services Index and the Wells Fargo® BDC Index. The graph assumes that $100 was invested at the market close on April 16, 2014 in our common stock, the S&P 500 Index, the Russell 2000 Financial Services Index and the Wells Fargo® BDC Index, is based on historical stock prices and assumes all dividends or distributions are reinvested on the respective dividend or distribution payment dates without commissions. The stock price performance reflected by the following graph is not necessarily indicative of future stock price performance.
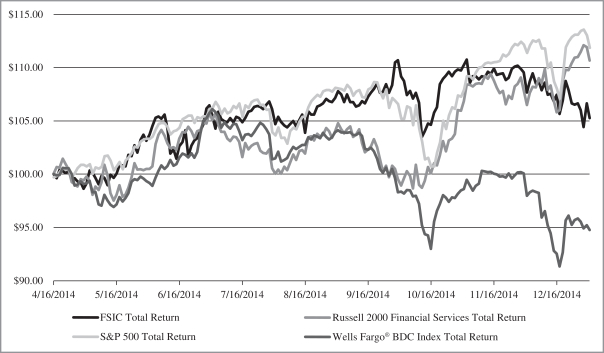
56
Table of Contents
| Item 6. | Selected Financial Data. |
The following selected consolidated financial data for the years ended December 31, 2014, 2013, 2012, 2011 and 2010 is derived from our consolidated financial statements which have been audited by McGladrey LLP, our independent registered public accounting firm. The data should be read in conjunction with our consolidated financial statements and related notes thereto and “Item 7. Management’s Discussion and Analysis of Financial Condition and Results of Operations” included elsewhere in this annual report on Form 10-K.
| Year Ended December 31, | ||||||||||||||||||||
| 2014 | 2013 | 2012 | 2011 | 2010 | ||||||||||||||||
| Statements of operations data: |
||||||||||||||||||||
| Investment income |
$ | 464,819 | $ | 474,566 | $ | 303,222 | $ | 115,484 | $ | 30,670 | ||||||||||
| Operating expenses |
||||||||||||||||||||
| Total expenses and excise taxes |
225,648 | 229,590 | 169,315 | 44,120 | 21,278 | |||||||||||||||
| Less: Expense reimbursement from sponsor |
(2,837 | ) | — | — | — | — | ||||||||||||||
|
|
|
|
|
|
|
|
|
|
|
|||||||||||
| Net expenses and excise taxes |
222,811 | 229,590 | 169,315 | 44,120 | 21,278 | |||||||||||||||
|
|
|
|
|
|
|
|
|
|
|
|||||||||||
| Net investment income (loss) |
242,008 | 244,976 | 133,907 | 71,364 | 9,392 | |||||||||||||||
| Total net realized and unrealized gain (loss) on investments |
(47,227 | ) | 20,864 | 196,292 | (17,894 | ) | 18,872 | |||||||||||||
|
|
|
|
|
|
|
|
|
|
|
|||||||||||
| Net increase (decrease) in net assets resulting from operations |
$ | 194,781 | $ | 265,840 | $ | 330,199 | $ | 53,470 | $ | 28,264 | ||||||||||
|
|
|
|
|
|
|
|
|
|
|
|||||||||||
| Per share data: |
||||||||||||||||||||
| Net investment income (loss)—basic and diluted(1) |
$ | 0.97 | $ | 0.96 | $ | 0.59 | $ | 0.76 | $ | 0.40 | ||||||||||
|
|
|
|
|
|
|
|
|
|
|
|||||||||||
| Net increase (decrease) in net assets resulting from operations—basic and diluted(1) |
$ | 0.78 | $ | 1.04 | $ | 1.45 | $ | 0.57 | $ | 1.21 | ||||||||||
|
|
|
|
|
|
|
|
|
|
|
|||||||||||
| Distributions declared(2) |
$ | 1.08 | $ | 0.83 | $ | 0.86 | $ | 0.91 | $ | 0.87 | ||||||||||
|
|
|
|
|
|
|
|
|
|
|
|||||||||||
| Balance sheet data: |
||||||||||||||||||||
| Total assets |
$ | 4,354,886 | $ | 4,444,577 | $ | 4,346,753 | $ | 2,144,225 | $ | 782,005 | ||||||||||
|
|
|
|
|
|
|
|
|
|
|
|||||||||||
| Credit facilities, notes and repurchase agreement payable |
$ | 1,863,827 | $ | 1,673,682 | $ | 1,649,713 | $ | 554,286 | $ | 297,201 | ||||||||||
|
|
|
|
|
|
|
|
|
|
|
|||||||||||
| Total net assets |
$ | 2,366,986 | $ | 2,640,992 | $ | 2,511,738 | $ | 1,498,892 | $ | 389,232 | ||||||||||
|
|
|
|
|
|
|
|
|
|
|
|||||||||||
| Other data: |
||||||||||||||||||||
| Total return based on net asset value(3) |
7.17 | % | 10.43 | % | 15.83 | % | 8.93 | % | 13.08 | % | ||||||||||
| Total return based on market value(4) |
5.35 | % | — | % | — | % | — | % | — | % | ||||||||||
| Number of portfolio company investments at period end |
118 | 165 | 263 | 183 | 144 | |||||||||||||||
| Total portfolio investments for the period |
$ | 2,178,075 | $ | 2,641,733 | $ | 3,863,334 | $ | 1,978,499 | $ | 849,242 | ||||||||||
| Proceeds from sales and prepayments of investments |
$ | 2,121,939 | $ | 2,510,887 | $ | 1,971,447 | $ | 858,661 | $ | 240,054 | ||||||||||
| (1) | The per share data was derived by using the weighted average shares outstanding during the applicable period. |
| (2) | The per share data for distributions reflects the actual amount of distributions paid per share during the applicable period. |
| (3) | The total return based on net asset value for each year presented was calculated by taking the net asset value per share as of the end of the applicable year, adding the cash distributions per share which were declared |
57
Table of Contents
| during the applicable calendar year and dividing the total by the net asset value per share at the beginning of the applicable year. The total return does not consider the effect of the sales load from the sale of our common stock. The total return includes the effect of the issuance of shares at a net offering price that is greater than net asset value per share, which causes an increase in net asset value per share. The historical calculation of total return should not be considered a representation of our future total return, which may be greater or less than the return shown in the table due to a number of factors, including our ability or inability to make investments in companies that meet our investment criteria, the interest rate payable on debt securities we acquire, the level of our expenses, variations in and the timing of the recognition of realized and unrealized gains or losses, the degree to which we encounter competition in our markets and general economic conditions. As a result of these factors, results for any previous period should not be relied upon as being indicative of performance in future periods. The total return calculations set forth above represent the total return on our investment portfolio during the applicable period and are calculated in accordance with GAAP. These return figures do not represent an actual return to stockholders. |
| (4) | The total return based on market value was calculated by taking the closing price of our shares on the NYSE on December 31, 2014, adding the cash distributions per share that were declared during the period from April 16, 2014 to December 31, 2014 and dividing the total by $10.25, the closing price of our shares on the NYSE on April 16, 2014 (the first day the shares began trading on the NYSE). The historical calculation of total return based on market value in the table should not be considered a representation of our future total return based on market value, which may be greater or less than the return shown in the table due to a number of factors, including our ability or inability to make investments in companies that meet its investment criteria, the interest rates payable on the debt securities we acquire, the level of our expenses, variations in and the timing of the recognition of realized and unrealized gains or losses, the degree to which we encounter competition in our markets, general economic conditions and fluctuations in per share market value. As a result of these factors, results for any previous period should not be relied upon as being indicative of performance in future periods. |
58
Table of Contents
| Item 7. | Management’s Discussion and Analysis of Financial Condition and Results of Operations. |
The information contained in this section should be read in conjunction with our consolidated financial statements and related notes thereto appearing elsewhere in this annual report on Form 10-K.
Forward-Looking Statements
Some of the statements in this annual report on Form 10-K constitute forward-looking statements because they relate to future events or our future performance or financial condition. The forward-looking statements contained in this annual report on Form 10-K may include statements as to:
| • | our future operating results; |
| • | our business prospects and the prospects of the companies in which we may invest; |
| • | the impact of the investments that we expect to make; |
| • | the ability of our portfolio companies to achieve their objectives; |
| • | our current and expected financings and investments; |
| • | receiving and maintaining corporate credit ratings and changes in the general interest rate environment; |
| • | the adequacy of our cash resources, financing sources and working capital; |
| • | the timing and amount of cash flows, distributions and dividends, if any, from our portfolio companies; |
| • | our contractual arrangements and relationships with third parties; |
| • | actual and potential conflicts of interest with FB Advisor, FS Investment Advisor, LLC, FS Energy and Power Fund, FSIC II Advisor, LLC, FS Investment Corporation II, FSIC III Advisor, LLC, FS Investment Corporation III, FS Global Advisor, LLC, FS Global Credit Opportunities Fund, GDFM or any of their affiliates; |
| • | the dependence of our future success on the general economy and its effect on the industries in which we may invest; |
| • | our use of financial leverage; |
| • | the ability of FB Advisor to locate suitable investments for us and to monitor and administer our investments; |
| • | the ability of FB Advisor or its affiliates to attract and retain highly talented professionals; |
| • | our ability to maintain our qualification as a RIC and as a BDC; |
| • | the impact on our business of the Dodd-Frank Act, and the rules and regulations issued thereunder; |
| • | the effect of changes to tax legislation and our tax position; and |
| • | the tax status of the enterprises in which we may invest. |
In addition, words such as “anticipate,” “believe,” “expect” and “intend” indicate a forward-looking statement, although not all forward-looking statements include these words. The forward-looking statements contained in this annual report on Form 10-K involve risks and uncertainties. Our actual results could differ materially from those implied or expressed in the forward-looking statements for any reason, including those factors set forth in “Item 1A. Risk Factors.” Factors that could cause actual results to differ materially include:
| • | changes in the economy; |
| • | risks associated with possible disruption in our operations or the economy generally due to terrorism or natural disasters; |
| • | future changes in laws or regulations and conditions in our operating areas; and |
| • | the price at which shares of our common stock may trade on the NYSE. |
59
Table of Contents
We have based the forward-looking statements included in this annual report on Form 10-K on information available to us on the date of this annual report on Form 10-K. Except as required by the federal securities laws, we undertake no obligation to revise or update any forward-looking statements, whether as a result of new information, future events or otherwise. Stockholders are advised to consult any additional disclosures that we may make directly to stockholders or through reports that we may file in the future with the SEC, including annual reports on Form 10-K, quarterly reports on Form 10-Q and current reports on Form 8-K. The forward-looking statements and projections contained in this annual report on Form 10-K are excluded from the safe harbor protection provided by Section 27A of the Securities Act of 1933, as amended, or the Securities Act, and Section 21E of the Exchange Act.
Overview
We were incorporated under the general corporation laws of the State of Maryland on December 21, 2007 and formally commenced investment operations on January 2, 2009. We are an externally managed, non-diversified, closed-end management investment company that has elected to be regulated as a BDC under the 1940 Act and has elected to be treated for U.S. federal income tax purposes, and intends to qualify annually, as a RIC under Subchapter M of the Code.
On April 16, 2014, shares of our common stock began trading on the NYSE under the ticker symbol “FSIC”. This listing accomplished our goal of providing our stockholders with greatly enhanced liquidity.
Our investment activities are managed by FB Advisor and supervised by our board of directors, a majority of whom are independent. Under our investment advisory agreement, we have agreed to pay FB Advisor an annual base management fee based on the average value of our gross assets and an incentive fee based on our performance. FB Advisor has engaged GDFM to act as our investment sub-adviser. GDFM assists FB Advisor in identifying investment opportunities and makes investment recommendations for approval by FB Advisor according to guidelines set by FB Advisor.
Our investment objectives are to generate current income and, to a lesser extent, long-term capital appreciation. We have identified and intend to focus on the following investment categories, which we believe will allow us to generate an attractive total return with an acceptable level of risk.
Direct Originations: We intend to leverage our relationship with GDFM and its global sourcing and origination platform to directly source investment opportunities. Such investments are originated or structured specifically for us or made by us and are not generally available to the broader market. These investments may include both debt and equity components, although we do not expect to make equity investments independent of having an existing credit relationship. We believe directly originated investments may offer higher returns and more favorable protections than broadly syndicated transactions.
Opportunistic: We intend to seek to capitalize on market price inefficiencies by investing in loans, bonds and other securities where the market price of such investment reflects a lower value than deemed warranted by our fundamental analysis. We believe that market price inefficiencies may occur due to, among other things, general dislocations in the markets, a misunderstanding by the market of a particular company or an industry being out of favor with the broader investment community. We seek to allocate capital to these securities that have been misunderstood or mispriced by the market and where we believe there is an opportunity to earn an attractive return on our investment. Such opportunities may include event driven investments, anchor orders and CLOs.
In the case of event driven investments, we intend to take advantage of dislocations that arise in the markets due to an impending event and where the market’s apparent expectation of value differs substantially from our fundamental analysis. Such events may include a looming debt maturity or default, a merger, spin-off or other corporate reorganization, an adverse regulatory or legal ruling, or a material contract expiration, any of which may significantly improve or impair a company’s financial position. Compared to other investment strategies,
60
Table of Contents
event driven investing depends more heavily on our ability to successfully predict the outcome of an individual event rather than on underlying macroeconomic fundamentals. As a result, successful event driven strategies may offer both substantial diversification benefits and the ability to generate performance in uncertain market environments.
We may also invest in certain opportunities that are originated and then syndicated by a commercial or investment bank, but where we provide a capital commitment significantly above the average syndicate participant, i.e., an anchor order. In these types of investments, we may receive fees, preferential pricing or other benefits not available to other lenders in return for our significant capital commitment. Our decision to provide an anchor order to a syndicated transaction is predicated on a rigorous credit analysis, our familiarity with a particular company, industry or financial sponsor, and the broader investment experiences of FB Advisor and GDFM.
In addition, our relationship with GSO, one of the largest CLO managers in the world, allows us to opportunistically invest in CLOs. CLOs are a form of securitization where the cash flow from a pooled basket of syndicated loans is used to support distribution payments made to different tranches of securities. While collectively CLOs represent nearly fifty percent of the broadly syndicated loan universe, investing in individual CLO tranches requires a high degree of investor sophistication due to their structural complexity and the illiquid nature of their securities.
Broadly Syndicated/Other: Although our primary focus is to invest in directly originated transactions and opportunistic investments, in certain circumstances we will also invest in the broadly syndicated loan and high yield markets. Broadly syndicated loans and bonds are generally more liquid than our directly originated investments and provide a complement to our less liquid strategies. In addition, and because we typically receive more attractive financing terms on these positions than we do on our less liquid assets, we are able to leverage the broadly syndicated portion of our portfolio in such a way that maximizes the levered return potential of our portfolio.
Our portfolio is comprised primarily of investments in senior secured loans and second lien secured loans of private middle market U.S. companies and, to a lesser extent, subordinated loans of private U.S. companies. Although we do not expect a significant portion of our portfolio to be comprised of subordinated loans, there is no limit on the amount of such loans in which we may invest. We may purchase interests in loans or make other debt investments, including investments in senior secured bonds, through secondary market transactions in the “over-the-counter” market or directly from our target companies as primary market or directly originated investments. In connection with our debt investments, we may on occasion receive equity interests such as warrants or options as additional consideration. We may also purchase minority interests in the form of common or preferred equity or the equity-related securities in our target companies, generally in conjunction with one of our debt investments or through a co-investment with a financial sponsor, such as an institutional investor or private equity firm. In addition, a portion of our portfolio may be comprised of corporate bonds, other debt securities and derivatives, including total return swaps and credit default swaps. FB Advisor will seek to tailor our investment focus as market conditions evolve. Depending on market conditions, we may increase or decrease our exposure to less senior portions of the capital structure or otherwise make opportunistic investments.
The senior secured loans, second lien secured loans and senior secured bonds in which we invest generally have stated terms of three to seven years and subordinated debt investments that we make generally have stated terms of up to ten years, but the expected average life of such securities is generally between three and seven years. However, there is no limit on the maturity or duration of any security in our portfolio. The loans in which we invest may be rated by a nationally recognized statistical rating organization and, in such case, generally will carry a rating below investment grade (rated lower than “Baa3” by Moody’s or lower than “BBB-” by S&P. We also invest in non-rated debt securities.
61
Table of Contents
Revenues
The principal measure of our financial performance is net increase in net assets resulting from operations, which includes net investment income, net realized gain or loss on investments, net realized gain or loss on foreign currency, net unrealized appreciation or depreciation on investments and net unrealized gain or loss on foreign currency. Net investment income is the difference between our income from interest, dividends, fees and other investment income and our operating and other expenses. Net realized gain or loss on investments is the difference between the proceeds received from dispositions of portfolio investments and their amortized cost, including the respective realized gain or loss on foreign currency for those foreign denominated investment transactions. Net realized gain or loss on foreign currency is the portion of realized gain or loss attributable to foreign currency fluctuations. Net unrealized appreciation or depreciation on investments is the net change in the fair value of our investment portfolio, including the respective unrealized gain or loss on foreign currency for those foreign denominated investments. Net unrealized gain or loss on foreign currency is the net change in the value of receivables or accruals due to the impact of foreign currency fluctuations.
We principally generate revenues in the form of interest income on the debt investments we hold. In addition, we generate revenues in the form of commitment, closing, origination, structuring or diligence fees, monitoring fees, fees for providing managerial assistance, consulting fees, prepayment fees and performance-based fees. Any such fees generated in connection with our investments will be recognized as earned. We may also generate revenues in the form of dividends and other distributions on the equity or other securities we hold.
Expenses
Our primary operating expenses include the payment of management and incentive fees and other expenses under the investment advisory agreement and the administration agreement, interest expense from financing facilities and other indebtedness, and other expenses necessary for our operations. The management and incentive fees compensate FB Advisor for its work in identifying, evaluating, negotiating, executing, monitoring and servicing our investments. FB Advisor is responsible for compensating our investment sub-adviser.
FB Advisor oversees our day-to-day operations, including the provision of general ledger accounting, fund accounting, legal services, investor relations and other administrative services. FB Advisor also performs, or oversees the performance of, our corporate operations and required administrative services, which includes being responsible for the financial records that we are required to maintain and preparing reports for our stockholders and reports filed with the SEC. In addition, FB Advisor assists us in calculating our net asset value, overseeing the preparation and filing of tax returns and the printing and dissemination of reports to our stockholders, and generally overseeing the payment of our expenses and the performance of administrative and professional services rendered to us by others.
Pursuant to the administration agreement, we reimburse FB Advisor for expenses necessary to perform services related to our administration and operations, including FB Advisor’s allocable portion of the compensation and related expenses of certain personnel of Franklin Square Holdings providing administrative services to us on behalf of FB Advisor. We reimburse FB Advisor no less than quarterly for all costs and expenses incurred by FB Advisor in performing its obligations and providing personnel and facilities under the administration agreement. FB Advisor allocates the cost of such services to us based on factors such as total assets, revenues, time allocations and/or other reasonable metrics. Our board of directors reviews the methodology employed in determining how the expenses are allocated to us and the proposed allocation of administrative expenses among us and certain affiliates of FB Advisor. Our board of directors then assesses the reasonableness of such reimbursements for expenses allocated to us based on the breadth, depth and quality of such services as compared to the estimated cost to us of obtaining similar services from third-party service providers known to be available. In addition, our board of directors considers whether any single third-party service provider would be capable of providing all such services at comparable cost and quality. Finally, our board of directors compares the total amount paid to FB Advisor for such services as a percentage of our net assets to the same ratio as reported by other comparable BDCs.
62
Table of Contents
We bear all other expenses of our operations and transactions, including (without limitation) fees and expenses relating to:
| • | corporate and organization expenses relating to offerings of our securities, subject to limitations included in the investment advisory and administrative services agreement; |
| • | the cost of calculating our net asset value, including the cost of any third-party pricing or valuation services; |
| • | the cost of effecting sales and repurchases of shares of our common stock and other securities; |
| • | investment advisory fees; |
| • | fees payable to third parties relating to, or associated with, making investments and valuing investments, including fees and expenses associated with performing due diligence reviews of prospective investments; |
| • | interest payments on our debt or related obligations; |
| • | transfer agent and custodial fees; |
| • | research and market data (including news and quotation equipment and services, and any computer hardware and connectivity hardware (e.g., telephone and fiber optic lines) incorporated into the cost of obtaining such research and market data); |
| • | fees and expenses associated with marketing efforts; |
| • | federal and state registration fees; |
| • | federal, state and local taxes; |
| • | fees and expenses of directors not also serving in an executive officer capacity for us or FB Advisor; |
| • | costs of proxy statements, stockholders’ reports, notices and other filings; |
| • | fidelity bond, directors and officers/errors and omissions liability insurance and other insurance premiums; |
| • | direct costs such as printing, mailing, long distance telephone and staff; |
| • | fees and expenses associated with accounting, corporate governance, independent audits and outside legal costs; |
| • | costs associated with our reporting and compliance obligations under the 1940 Act and applicable federal and state securities laws, including compliance with the Sarbanes-Oxley Act; |
| • | brokerage commissions for our investments; |
| • | costs associated with our chief compliance officer; and |
| • | all other expenses incurred by FB Advisor, GDFM or us in connection with administering our business, including expenses incurred by FB Advisor or GDFM in performing administrative services for us and administrative personnel paid by FB Advisor, to the extent they are not controlling persons of FB Advisor or any of its affiliates, subject to the limitations included in the investment advisory and administrative services agreement. |
In addition, we have contracted with State Street Bank and Trust Company to provide various accounting and administrative services, including, but not limited to, preparing preliminary financial information for review by FB Advisor, preparing and monitoring expense budgets, maintaining accounting and corporate books and records, processing trade information provided by us and performing testing with respect to RIC compliance.
63
Table of Contents
Expense Reimbursement
Pursuant to an expense support and conditional reimbursement agreement, dated as of March 13, 2012, and amended and restated as of May 16, 2013, or, as amended and restated, the expense reimbursement agreement, Franklin Square Holdings had agreed to reimburse us for expenses in an amount that was sufficient to ensure that no portion of our distributions to stockholders were paid from proceeds of the sale of shares of our common stock or borrowings.
As a result of the listing of our shares of common stock on the NYSE, effective November 7, 2014, Franklin Square Holdings terminated the expense reimbursement agreement pursuant to its terms. Since entering into the expense reimbursement agreement, no reimbursements were made, and no reimbursements were expected to be made in the foreseeable future, by Franklin Square Holdings, pursuant to the expense reimbursement agreement.
Portfolio Investment Activity for the Year Ended December 31, 2014 and 2013
During the year ended December 31, 2014, we made investments in portfolio companies totaling $2,178,075. During the same period, we sold investments for proceeds of $1,246,624 and received principal repayments of $875,315. As of December 31, 2014, our investment portfolio, with a total fair value of $4,183,447 (53% in first lien senior secured loans, 17% in second lien senior secured loans, 8% in senior secured bonds, 11% in subordinated debt, 3% in collateralized securities and 8% in equity/other), consisted of interests in 118 portfolio companies. The portfolio companies that comprised our portfolio as of such date had an average annual EBITDA of approximately $155.2 million. As of December 31, 2014, the investments in our portfolio were purchased at a weighted average price of 97.4% of par or stated value, as applicable, and our estimated gross annual portfolio yield (which represents the expected yield to be generated by us on our investment portfolio based on the composition of our portfolio as of such date), prior to leverage, was 10.0% based upon the amortized cost of our investments.
During the year ended December 31, 2013, we made investments in portfolio companies totaling $2,641,733. During the same period, we sold investments for proceeds of $1,137,264 and received principal repayments of $1,373,623. As of December 31, 2013, our investment portfolio, with a total fair value of $4,137,581 (51% in first lien senior secured loans, 22% in second lien senior secured loans, 9% in senior secured bonds, 10% in subordinated debt, 4% in collateralized securities and 4% in equity/other), consisted of interests in 165 portfolio companies. The portfolio companies that comprised our portfolio as of such date had an average annual EBITDA of approximately $190.7 million. As of December 31, 2013, the investments in our portfolio were purchased at a weighted average price of 97.3% of par or stated value, as applicable, and our estimated gross annual portfolio yield, prior to leverage, was 10.1% based upon the amortized cost of our investments.
Total Portfolio Activity
The following tables present certain selected information regarding our portfolio investment activity for the years ended December 31, 2014 and 2013:
| For the Year Ended | ||||||||
| Net Investment Activity |
December 31, 2014 |
December 31, 2013 |
||||||
| Purchases |
$ | 2,178,075 | $ | 2,641,733 | ||||
| Sales and Redemptions |
(2,121,939 | ) | (2,510,887 | ) | ||||
|
|
|
|
|
|||||
| Net Portfolio Activity |
$ | 56,136 | $ | 130,846 | ||||
|
|
|
|
|
|||||
64
Table of Contents
| For the Year Ended | ||||||||||||||||
| December 31, 2014 | December 31, 2013 | |||||||||||||||
| New Investment Activity by Asset Class |
Purchases | Percentage | Purchases | Percentage | ||||||||||||
| Senior Secured Loans—First Lien |
$ | 1,260,125 | 58 | % | $ | 1,646,725 | 62 | % | ||||||||
| Senior Secured Loans—Second Lien |
386,982 | 17 | % | 446,626 | 17 | % | ||||||||||
| Senior Secured Bonds |
215,937 | 10 | % | 231,539 | 9 | % | ||||||||||
| Subordinated Debt |
169,456 | 8 | % | 239,201 | 9 | % | ||||||||||
| Collateralized Securities |
19,217 | 1 | % | 47,340 | 2 | % | ||||||||||
| Equity/Other |
126,358 | 6 | % | 30,302 | 1 | % | ||||||||||
|
|
|
|
|
|
|
|
|
|||||||||
| Total |
$ | 2,178,075 | 100 | % | $ | 2,641,733 | 100 | % | ||||||||
|
|
|
|
|
|
|
|
|
|||||||||
The following table summarizes the composition of our investment portfolio at cost and fair value as of December 31, 2014 and 2013:
| December 31, 2014 | December 31, 2013 | |||||||||||||||||||||||
| Amortized
Cost(1) |
Fair Value | Percentage of Portfolio |
Amortized
Cost(1) |
Fair Value | Percentage of Portfolio |
|||||||||||||||||||
| Senior Secured Loans—First Lien |
$ | 2,215,957 | $ | 2,206,206 | 53 | % | $ | 2,080,228 | $ | 2,123,608 | 51 | % | ||||||||||||
| Senior Secured Loans—Second Lien |
713,675 | 708,255 | 17 | % | 875,276 | 897,845 | 22 | % | ||||||||||||||||
| Senior Secured Bonds |
423,961 | 359,275 | 8 | % | 414,297 | 385,548 | 9 | % | ||||||||||||||||
| Subordinated Debt |
467,645 | 464,304 | 11 | % | 421,964 | 426,728 | 10 | % | ||||||||||||||||
| Collateralized Securities |
110,362 | 123,920 | 3 | % | 120,206 | 140,508 | 4 | % | ||||||||||||||||
| Equity/Other |
250,497 | 321,487 | 8 | % | 142,114 | 163,344 | 4 | % | ||||||||||||||||
|
|
|
|
|
|
|
|
|
|
|
|
|
|||||||||||||
| Total |
$ | 4,182,097 | $ | 4,183,447 | 100 | % | $ | 4,054,085 | $ | 4,137,581 | 100 | % | ||||||||||||
|
|
|
|
|
|
|
|
|
|
|
|
|
|||||||||||||
| (1) | Amortized costs represent the original cost adjusted for the amortization of premiums and/or accretion of discounts, as applicable, on investments. |
The following table presents certain selected information regarding the composition of our investment portfolio as of December 31, 2014 and 2013:
| December 31, 2014 |
December 31, 2013 |
|||||||
| Number of Portfolio Companies |
118 | 165 | ||||||
| % Variable Rate (based on fair value) |
69.0 | % | 72.2 | % | ||||
| % Fixed Rate (based on fair value) |
23.3 | % | 23.5 | % | ||||
| % Income Producing Equity or Other Investments (based on fair value) |
2.9 | % | 2.4 | % | ||||
| % Non-Income Producing Equity or Other Investments (based on fair value) |
4.8 | % | 1.9 | % | ||||
| Average Annual EBITDA of Portfolio Companies |
$ | 155,200 | $ | 190,700 | ||||
| Weighted Average Purchase Price of Investments (as a % of par or stated value) |
97.4 | % | 97.3 | % | ||||
| % of Investments on Non-Accrual (based on fair value) |
0.3 | % | — | |||||
| Gross Portfolio Yield Prior to Leverage (based on amortized cost) |
10.0 | % | 10.1 | % | ||||
| Gross Portfolio Yield Prior to Leverage (based on amortized cost)—Excluding Non-Income Producing Assets |
10.4 | % | 10.2 | % | ||||
65
Table of Contents
Direct Originations
The following tables present certain selected information regarding our direct originations for the three months and year ended December 31, 2014:
| New Direct Originations |
For the Three Months Ended December 31, 2014 |
For the Year Ended December 31, 2014 |
||||||
| Total Commitments (including unfunded commitments) |
$ | 258,562 | $ | 1,609,397 | ||||
| Exited Investments (including partial paydowns) |
(88,376 | ) | (543,599 | ) | ||||
|
|
|
|
|
|||||
| Net Direct Originations |
$ | 170,186 | $ | 1,065,798 | ||||
|
|
|
|
|
|||||
| For the Three Months Ended December 31, 2014 |
For the Year
Ended December 31, 2014 |
|||||||||||||||
| New Direct Originations by Asset Class |
Commitment Amount |
Percentage | Commitment Amount |
Percentage | ||||||||||||
| Senior Secured Loans—First Lien |
$ | 92,101 | 36 | % | $ | 941,906 | 59 | % | ||||||||
| Senior Secured Loans—Second Lien |
— | — | 290,332 | 18 | % | |||||||||||
| Senior Secured Bonds |
74,813 | 29 | % | 118,336 | 7 | % | ||||||||||
| Subordinated Debt |
50,000 | 19 | % | 163,256 | 10 | % | ||||||||||
| Collateralized Securities |
19,460 | 7 | % | 19,460 | 1 | % | ||||||||||
| Equity/Other |
22,188 | 9 | % | 76,107 | 5 | % | ||||||||||
|
|
|
|
|
|
|
|
|
|||||||||
| Total |
$ | 258,562 | 100 | % | $ | 1,609,397 | 100 | % | ||||||||
|
|
|
|
|
|
|
|
|
|||||||||
| For the Three Months Ended December 31, 2014 |
For the
Year Ended December 31, 2014 |
|||||||
| Average New Direct Origination Commitment Amount |
$ | 23,506 | $ | 37,428 | ||||
| Weighted Average Maturity for New Direct Originations |
11/19/21 | 7/14/20 | ||||||
| Gross Portfolio Yield Prior to Leverage (based on amortized cost) of New Direct Originations during Period |
8.7 | % | 9.6 | % | ||||
| Gross Portfolio Yield Prior to Leverage (based on amortized cost) of New Direct Originations during Period—Excluding Non-Income Producing Assets |
10.5 | % | 10.5 | % | ||||
| Gross Portfolio Yield Prior to Leverage (based on amortized cost) of Direct Originations Exited during Period |
9.1 | % | 10.0 | % | ||||
The following table presents certain selected information regarding our direct originations as of December 31, 2014 and 2013:
| Characteristics of All Direct Originations held in Portfolio |
December 31, 2014 | December 31, 2013 | ||||||
| Number of Portfolio Companies |
52 | 35 | ||||||
| Average Annual EBITDA of Portfolio Companies |
$ | 47,200 | $ | 34,900 | ||||
| Average Leverage Through Tranche of Portfolio Companies—Excluding Equity / Other and Collateralized Securities |
4.6x | 4.0x | ||||||
| % of Investments on Non-Accrual |
— | — | ||||||
| Gross Portfolio Yield Prior to Leverage (based on amortized cost) of Funded Direct Originations |
9.7 | % | 9.9 | % | ||||
| Gross Portfolio Yield Prior to Leverage (based on amortized cost) of Funded Direct Originations—Excluding Non-Income Producing Assets |
10.1 | % | 10.0 | % | ||||
66
Table of Contents
Portfolio Composition by Strategy and Industry
The table below summarizes the composition of our investment portfolio by strategy and enumerates the percentage, by fair value, of the total portfolio assets in such strategies as of December 31, 2014 and December 31, 2013:
| December 31, 2014 | December 31, 2013 | |||||||||||||||
| Portfolio Composition by Strategy |
Fair Value |
Percentage of Portfolio |
Fair Value |
Percentage of Portfolio |
||||||||||||
| Direct Originations |
$ | 3,147,946 | 75 | % | $ | 2,096,806 | 51 | % | ||||||||
| Opportunistic |
790,060 | 19 | % | 1,155,322 | 28 | % | ||||||||||
| Broadly Syndicated/Other |
245,441 | 6 | % | 885,453 | 21 | % | ||||||||||
|
|
|
|
|
|
|
|
|
|||||||||
| Total |
$ | 4,183,447 | 100 | % | $ | 4,137,581 | 100 | % | ||||||||
|
|
|
|
|
|
|
|
|
|||||||||
The table below describes investments by industry classification and enumerates the percentage, by fair value, of the total portfolio assets in such industries as of December 31, 2014 and December 31, 2013:
| December 31, 2014 | December 31, 2013 | |||||||||||||||
| Industry Classification |
Fair Value |
Percentage of Portfolio |
Fair Value |
Percentage of Portfolio |
||||||||||||
| Automobiles & Components |
$ | 24,737 | 1 | % | $ | 51,551 | 1 | % | ||||||||
| Capital Goods |
964,394 | 23 | % | 858,352 | 21 | % | ||||||||||
| Commercial & Professional Services |
283,513 | 7 | % | 318,196 | 8 | % | ||||||||||
| Consumer Durables & Apparel |
319,160 | 8 | % | 306,917 | 7 | % | ||||||||||
| Consumer Services |
692,533 | 17 | % | 436,650 | 11 | % | ||||||||||
| Diversified Financials |
179,548 | 4 | % | 160,678 | 4 | % | ||||||||||
| Energy |
434,424 | 10 | % | 468,036 | 11 | % | ||||||||||
| Food & Staples Retailing |
18,324 | 0 | % | 29,484 | 1 | % | ||||||||||
| Food, Beverage & Tobacco |
— | — | 4,042 | 0 | % | |||||||||||
| Health Care Equipment & Services |
104,205 | 3 | % | 176,010 | 4 | % | ||||||||||
| Household & Personal Products |
— | — | 66,300 | 2 | % | |||||||||||
| Insurance |
— | — | 17,814 | 0 | % | |||||||||||
| Materials |
297,179 | 7 | % | 233,719 | 6 | % | ||||||||||
| Media |
157,443 | 4 | % | 193,283 | 5 | % | ||||||||||
| Pharmaceuticals, Biotechnology & Life Sciences |
16,243 | 0 | % | 57,794 | 1 | % | ||||||||||
| Retailing |
5,004 | 0 | % | 69,171 | 2 | % | ||||||||||
| Software & Services |
312,505 | 7 | % | 366,976 | 9 | % | ||||||||||
| Technology Hardware & Equipment |
137,471 | 3 | % | 134,121 | 3 | % | ||||||||||
| Telecommunication Services |
161,951 | 4 | % | 178,977 | 4 | % | ||||||||||
| Transportation |
74,813 | 2 | % | 9,510 | 0 | % | ||||||||||
|
|
|
|
|
|
|
|
|
|||||||||
| Total |
$ | 4,183,447 | 100 | % | $ | 4,137,581 | 100 | % | ||||||||
|
|
|
|
|
|
|
|
|
|||||||||
As of December 31, 2014, except for one equity/other investment, Fronton Investor Holdings, LLC, we were not an “affiliated person” of any of our portfolio companies, as defined in the 1940 Act. As of December 31, 2014, we did not “control” any of our portfolio companies, as defined in the 1940 Act. In general, under the 1940 Act, we would be presumed to “control” a portfolio company if we owned 25% or more of its voting securities or we had the power to exercise control over the management or policies of such portfolio company, and would be an “affiliated person” of a portfolio company if we owned 5% or more of its voting securities.
Our investment portfolio may contain loans that are in the form of lines of credit, revolving credit facilities or delayed draw credit facilities, which require us to provide funding when requested by portfolio companies in
67
Table of Contents
accordance with the terms of the underlying loan agreements. As of December 31, 2014, we had ten such investments with aggregate unfunded commitments of $101,099 and one equity/other investment with an unfunded commitment of $788. As of December 31, 2013, we had five such investments with aggregate unfunded commitments of $48,439 and one equity/other investment with an unfunded commitment of $4,629. We maintain sufficient cash on hand and available borrowings to fund such unfunded commitments should the need arise.
Portfolio Asset Quality
In addition to various risk management and monitoring tools, FB Advisor uses an investment rating system to characterize and monitor the expected level of returns on each investment in our portfolio. FB Advisor uses an investment rating scale of 1 to 5. The following is a description of the conditions associated with each investment rating:
| Investment Rating |
Summary Description | |
| 1 | Investment exceeding expectations and/or capital gain expected. | |
| 2 | Performing investment generally executing in accordance with the portfolio company’s business plan—full return of principal and interest expected. | |
| 3 | Performing investment requiring closer monitoring. | |
| 4 | Underperforming investment—some loss of interest or dividend possible, but still expecting a positive return on investment. | |
| 5 | Underperforming investment with expected loss of interest and some principal. | |
The following table shows the distribution of our investments on the 1 to 5 investment rating scale at fair value as of December 31, 2014 and 2013:
| December 31, 2014 | December 31, 2013 | |||||||||||||||
| Investment Rating |
Fair Value |
Percentage
of Portfolio |
Fair Value |
Percentage
of Portfolio |
||||||||||||
| 1 |
$ | 484,332 | 12 | % | $ | 510,687 | 12 | % | ||||||||
| 2 |
3,213,335 | 77 | % | 3,244,518 | 79 | % | ||||||||||
| 3 |
434,620 | 10 | % | 340,238 | 8 | % | ||||||||||
| 4 |
37,178 | 1 | % | 40,034 | 1 | % | ||||||||||
| 5 |
13,982 | 0 | % | 2,104 | 0 | % | ||||||||||
|
|
|
|
|
|
|
|
|
|||||||||
| Total |
$ | 4,183,447 | 100 | % | $ | 4,137,581 | 100 | % | ||||||||
|
|
|
|
|
|
|
|
|
|||||||||
The amount of the portfolio in each grading category may vary substantially from period to period resulting primarily from changes in the composition of the portfolio as a result of new investment, repayment and exit activities. In addition, changes in the grade of investments may be made to reflect our expectation of performance and changes in investment values.
Results of Operations
Comparison of the Years Ended December 31, 2014 and December 31, 2013
Revenues
We generated investment income of $464,819 and $474,566 for the years ended December 31, 2014 and 2013, respectively, in the form of interest and fees earned on senior secured loans (first and second lien), senior secured bonds, subordinated debt and collateralized securities in our portfolio and dividends and other
68
Table of Contents
distributions earned on equity/other investments. Such revenues represent $423,550 and $423,585 of cash income earned as well as $41,269 and $50,981 in non-cash portions relating to accretion of discount and PIK interest for the years ended December 31, 2014 and 2013, respectively. Cash flows related to such non-cash revenues may not occur for a number of reporting periods or years after such revenues are recognized. The decrease in investment income is due primarily to the reduction in the yield on our investments during the first nine months of 2014, which was attributed to a general tightening of spreads in the credit markets during this period. The level of investment income we receive is directly related to the balance of income-producing investments multiplied by the weighted average yield of our investments.
During the years ended December 31, 2014 and 2013, we generated $44,961 and $37,084, respectively, of fee income, which represented 9.7% and 7.8%, respectively of total investment income. Such fee income is transaction based, and typically consists of amendment and consent fees, prepayment fees, structuring fees and other non-recurring fees. As such, future fee income is generally dependent on new direct origination investments and the occurrence of events at existing portfolio companies resulting in such fees.
Expenses
Our expenses were $222,811 and $229,590 for the years ended December 31, 2014 and 2013, respectively. Our operating expenses include base management fees attributed to FB Advisor of $81,780 and $90,247 for the years ended December 31, 2014 and 2013, respectively. Our expenses also include administrative services expenses attributed to FB Advisor of $4,794 and $5,165 for the years ended December 31, 2014 and 2013, respectively.
FB Advisor is eligible to receive incentive fees based on our performance. During the year ended December 31, 2014, we accrued a subordinated incentive fee on income of $58,122 and paid FB Advisor $59,336 in respect of such fee. As of December 31, 2014, a subordinated incentive fee on income of $13,089 was payable to FB Advisor. During the year ended December 31, 2013, we accrued a subordinated incentive fee on income of $62,253 and paid FB Advisor $61,343 in respect of such fee. During the year ended December 31, 2014, we reversed capital gains incentive fees of $9,468 based on the performance of our portfolio. During the year ended December 31, 2013, we accrued capital gains incentive fees of $4,173 based on the performance of our portfolio, of which $2,583 was based on unrealized gains and $1,590 was based on realized gains. No capital gains incentive fees are actually payable by us with respect to unrealized gains unless and until those gains are actually realized. See “—Critical Accounting Policies—Capital Gains Incentive Fee” for additional information about how the incentive fees are calculated.
We recorded interest expense of $64,804 and $50,763 for the years ended December 31, 2014 and 2013, respectively, in connection with our credit facilities, the JPM Facility and the notes. The fees incurred with our fund administrator, which provides various accounting and administrative services to us, totaled $1,223 and $1,390 for the years ended December 31, 2014 and 2013, respectively. We incurred fees and expenses with our stock transfer agent of $1,037 and $2,820 for the years ended December 31, 2014 and 2013, respectively. Fees for our board of directors were $1,027 and $943 for the years ended December 31, 2014 and 2013, respectively.
Our other general and administrative expenses totaled $9,049 and $6,094 for the years ended December 31, 2014 and 2013, respectively, and consisted of the following:
| Year Ended December 31, |
||||||||
| 2014 | 2013 | |||||||
| Expenses associated with our independent audit and related fees |
$ | 456 | $ | 572 | ||||
| Compensation of our chief compliance officer |
100 | 100 | ||||||
| Legal fees |
3,071 | 1,510 | ||||||
| Printing fees |
1,792 | 1,500 | ||||||
| Other |
3,630 | 2,412 | ||||||
|
|
|
|
|
|||||
| Total |
$ | 9,049 | $ | 6,094 | ||||
|
|
|
|
|
|||||
69
Table of Contents
During the years ended December 31, 2014 and 2013, we accrued $5,400 and $5,742, respectively, for excise taxes.
During the years ended December 31, 2014 and 2013, the ratio of our expenses to our average net assets was 8.79% and 8.90%, respectively. Our ratio of expenses to our average net assets during the years ended December 31, 2014 and 2013 includes $64,804 and $50,763, respectively, related to interest expense, $48,654 and $66,426, respectively, related to accruals for incentive fees and an accrual of $5,400 and $5,742, respectively, for excise taxes. Without such expenses, our ratio of expenses to average net assets would have been 4.10% and 4.14% for the years ended December 31, 2014 and 2013, respectively. Incentive fees and interest expense, among other things, may increase or decrease our expense ratios relative to comparative periods depending on portfolio performance and changes in benchmark interest rates such as LIBOR, among other factors. The lower ratio of expenses to average net assets during the year ended December 31, 2014 compared to the year ended December 31, 2013 can primarily be attributed to a reduction in management fees as a result of the waiver by FB Advisor of certain management fees to which it was otherwise entitled, and subsequent permanent reduction of such fees during the year ended December 31, 2014, as well as a reduction in administrative services expenses and stock transfer agent fees charged to us, which were partially offset by costs associated with the listing of our common stock on the NYSE.
Net Investment Income
Our net investment income totaled $242,008 ($0.97 per share) and $244,976 ($0.96 per share) for the years ended December 31, 2014 and 2013, respectively. The decrease in net investment income can be attributed to, among other things, a reduction in revenues for the year ended December 31, 2014 which were largely offset by the expense reductions noted above. The increase in net investment income on a per share basis is due to a year over year decline in average shares outstanding as a result of our listing tender offer.
Net Realized Gains or Losses
We sold investments and received principal repayments of $1,246,624 and $875,315, respectively, during the year ended December 31, 2014, from which we realized a net gain of $30,607. We also realized a net loss of $301 from settlements on foreign currency during the year ended December 31, 2014. We sold investments and received principal repayments of $1,137,264 and $1,373,623, respectively, during the year ended December 31, 2013, from which we realized a net gain of $47,014. We also realized a net loss of $111 from settlements on foreign currency during the year ended December 31, 2013.
Net Change in Unrealized Appreciation (Depreciation) on Investments and Unrealized Gain (Loss) on Foreign Currency
For the year ended December 31, 2014, the net change in unrealized appreciation (depreciation) on investments totaled $(82,146) and the net change in unrealized gain (loss) on foreign currency totaled $4,613. For the year ended December 31, 2013, the net change in unrealized appreciation (depreciation) on investments totaled $(25,982) and the net change in unrealized gain (loss) on foreign currency totaled $(57). The net change in unrealized appreciation (depreciation) on our investments during the year ended December 31, 2014 was primarily driven by a general widening of credit spreads on our loan and debt investments during the fourth quarter, partially offset by increased valuations of certain of our equity/other positions.
Net Increase (Decrease) in Net Assets Resulting from Operations
For the year ended December 31, 2014, the net increase in net assets resulting from operations was $194,781 ($0.78 per share) compared to a net increase in net assets resulting from operations of $265,840 ($1.04 per share) during the year ended December 31, 2013.
70
Table of Contents
Comparison of the Years Ended December 31, 2013 and December 31, 2012
Revenues
We generated investment income of $474,566 and $303,222 for the years ended December 31, 2013 and 2012, respectively, in the form of interest and fees earned on senior secured loans (first and second lien), senior secured bonds, subordinated debt and collateralized securities in our portfolio and dividends and other distributions earned on equity/other investments. Such revenues represent $423,585 and $279,152 of cash income earned as well as $50,981 and $24,070 in non-cash portions relating to accretion of discount and PIK interest for the years ended December 31, 2013 and 2012, respectively. Cash flows related to such non-cash revenues may not occur for a number of reporting periods or years after such revenues are recognized. The increase in investment income during the year ended December 31, 2013 was due primarily to the growth in the average balance of our portfolio over the last year and the increase in the number of directly originated transactions during the year.
Expenses
Our expenses were $229,590 and $169,315 for the years ended December 31, 2013 and 2012, respectively. Our operating expenses include base management fees attributed to FB Advisor of $90,247 and $68,059 for the years ended December 31, 2013 and 2012, respectively. Our expenses also include administrative services expenses attributed to FB Advisor of $5,165 and $5,297 for the years ended December 31, 2013 and 2012, respectively.
FB Advisor is eligible to receive incentive fees based on our performance. During the year ended December 31, 2013, we accrued a subordinated incentive fee on income of $62,253 based upon the performance of our portfolio and paid FB Advisor $61,343 in respect of such fee. As of December 31, 2013, a subordinated incentive fee on income of $14,303 was payable to FB Advisor. During the year ended December 31, 2012, we accrued a subordinated incentive fee on income of $13,393 based upon the performance of our portfolio and paid FB Advisor $0 in respect of such fee. During the year ended December 31, 2013, we accrued capital gains incentive fees of $4,173 based on the performance of our portfolio, of which $2,583 was based on unrealized gains and $1,590 was based on realized gains. During the year ended December 31, 2012, we accrued capital gains incentive fees of $39,751 based on the performance of our portfolio, of which $27,960 was based on unrealized gains and $11,791 was based on realized gains. No capital gains incentive fees are actually payable by us with respect to unrealized gains unless and until those gains are actually realized. See “—Critical Accounting Policies—Capital Gains Incentive Fee.”
We recorded interest expense of $50,763 and $30,227 for the years ended December 31, 2013 and 2012, respectively, in connection with our credit facilities and the JPM Facility. The fees incurred with our fund administrator, which provides various accounting and administrative services to us, totaled $1,390 and $1,495 for the years ended December 31, 2013 and 2012, respectively. We incurred fees and expenses with our stock transfer agent of $2,820 and $3,641 for the years ended December 31, 2013 and 2012, respectively. Fees for our board of directors were $943 and $933 for the years ended December 31, 2013 and 2012, respectively.
Our other general and administrative expenses totaled $6,094 and $6,019 for the years ended December 31, 2013 and 2012, respectively, and consisted of the following:
| Year
Ended December 31, |
||||||||
| 2013 | 2012 | |||||||
| Expenses associated with our independent audit and related fees |
$ | 572 | $ | 769 | ||||
| Compensation of our chief compliance officer |
100 | 88 | ||||||
| Legal fees |
1,510 | 1,443 | ||||||
| Printing fees |
1,500 | 888 | ||||||
| Other |
2,412 | 2,831 | ||||||
|
|
|
|
|
|||||
| Total |
$ | 6,094 | $ | 6,019 | ||||
|
|
|
|
|
|||||
71
Table of Contents
During the years ended December 31, 2013 and 2012, we accrued $5,742 and $500, respectively, for excise taxes.
During the years ended December 31, 2013 and 2012, the ratio of our expenses to our average net assets was 8.90% and 7.67%, respectively. Our ratio of expenses to our average net assets during the years ended December 31, 2013 and 2012 includes $50,763 and $30,227, respectively, related to interest expense, $66,426 and $53,144, respectively, related to accruals for incentive fees and an accrual of $5,742 and $500, respectively, for excise taxes. Without such expenses, our ratio of expenses to average net assets would have been 4.14% and 3.87% for the years ended December 31, 2013 and 2012, respectively. Incentive fees and interest expense, among other things, may increase or decrease our expense ratios relative to comparative periods depending on portfolio performance and changes in benchmark interest rates such as LIBOR, among other factors. The higher ratio of expenses to average net assets during the year ended December 31, 2013 compared to the year ended December 31, 2012 can primarily be attributed to higher management fees as a percentage of average net assets as a result of the termination of the total return swap between Arch Street Funding LLC, our wholly-owned, special-purpose financing subsidiary, and Citibank, N.A., or the TRS, and the replacement of such financing arrangement with a revolving credit facility, or the Arch Street credit facility.
Net Investment Income
Our net investment income totaled $244,976 ($0.96 per share) and $133,907 ($0.59 per share) for the years ended December 31, 2013 and 2012, respectively. The increase in net investment income on a per share basis can be attributed to, among other things, our ability to efficiently deploy capital following the closing of our public offering and the increase in the number of directly originated transactions during the year.
Net Realized Gains or Losses
We sold investments and received principal repayments of $1,137,264 and $1,373,623, respectively, during the year ended December 31, 2013, from which we realized a net gain of $47,014. We also realized a net loss of $111 from settlements on foreign currency during the year ended December 31, 2013. We sold investments and received principal repayments of $926,136 and $1,045,311, respectively, during the year ended December 31, 2012, from which we realized a net gain of $47,008. We also earned $19,607 from periodic net settlement payments on our TRS and realized a net gain of $407 from settlements on foreign currency during the year ended December 31, 2012.
Net Change in Unrealized Appreciation (Depreciation) on Investments and Total Return Swap and Unrealized Gain (Loss) on Foreign Currency
For the year ended December 31, 2013, the net change in unrealized appreciation (depreciation) on investments totaled $(25,982) and the net change in unrealized gain (loss) on foreign currency totaled $(57). For the year ended December 31, 2012, the net change in unrealized appreciation (depreciation) on investments totaled $127,399, the net change in unrealized appreciation (depreciation) on our TRS was $1,996 and the net change in unrealized gain (loss) on foreign currency totaled $(125). The net change in unrealized appreciation (depreciation) on our investments during the year ended December 31, 2013 was primarily driven by the conversion of unrealized gains in 2012 to realized gains in 2013.
Net Increase (Decrease) in Net Assets Resulting from Operations
For the year ended December 31, 2013, the net increase in net assets resulting from operations was $265,840 ($1.04 per share) compared to a net increase in net assets resulting from operations of $330,199 ($1.45 per share) during the year ended December 31, 2012.
72
Table of Contents
Financial Condition, Liquidity and Capital Resources
Overview
As of December 31, 2014, we had $96,844 in cash, which we held in a custodial account, and $236,173 in borrowings available under our financing arrangements. On April 16, 2014, shares of our common stock began trading on the NYSE under the ticker symbol “FSIC.” This listing accomplished our goal of providing our stockholders with greatly enhanced liquidity.
On April 3, 2014, we entered a senior secured revolving credit facility with ING Capital LLC, or ING, as administrative agent, and the lenders party thereto, or the ING credit facility. The ING credit facility provides for borrowings in U.S. dollars and certain agreed upon foreign currencies in an initial aggregate amount of up to $300,000, with an option for us to request, at one or more times after closing, that existing or new lenders, at their election, provide up to $100,000 of additional commitments.
On April 16, 2014, we commenced the listing tender offer to purchase for cash up to $250,000 in value of our shares of common stock from our stockholders. In accordance with the terms of the listing tender offer, we selected the lowest price, not greater than $11.00 per share or less than $10.35 per share, net to the tendering stockholder in cash, less any applicable withholding taxes and without interest, that enabled us to purchase the maximum number of shares of common stock properly tendered in the listing tender offer and not properly withdrawn having an aggregate purchase price of up to $250,000.
The listing tender offer expired on May 28, 2014. Due to the oversubscription of the listing tender offer, on June 4, 2014, we accepted for purchase on a pro rata basis 23,255,813 shares of common stock, or approximately 96.6% of the shares tendered, at a purchase price of $10.75 per share, for an aggregate cost of approximately $250,000, excluding fees and expenses relating to the listing tender offer. The 23,255,813 shares of common stock accepted for purchase in the listing tender offer represented approximately 8.9% of our issued and outstanding shares of common stock as of June 4, 2014. We used available cash and borrowings under the ING credit facility to fund the purchase of shares of common stock in the listing tender offer and to pay for all related fees and expenses.
On July 14, 2014, we issued $400,000 aggregate principal amount of our 4.000% notes due 2019. The net proceeds to us from the issuance of the 4.000% notes were approximately $394,392 before expenses, after deducting the underwriting discounts and commissions of $3,600. On July 14, 2014, we used $350,000 of the net proceeds received from the issuance of the 4.000% notes to repay the Arch Street credit facility in full and $44,392 of the net proceeds to repay borrowings under the Broad Street credit facility.
On December 3, 2014, we issued $325,000 aggregate principal amount of our 4.250% notes due 2020. The net proceeds to us from the issuance of the 4.250% notes were approximately $320,886 before expenses, after deducting the underwriting discounts and commissions of $2,925. On December 3, 2014, we used $236,300 of the net proceeds received from the issuance of the 4.250% notes to repay the Walnut Street credit facility in full and $84,586 of the net proceeds to repay borrowings under the ING credit facility.
Historically, we conducted quarterly tender offers pursuant to our share repurchase program to provide our stockholders with limited liquidity. In anticipation of the listing of our shares of common stock on the NYSE, our board of directors terminated our share repurchase program effective March 21, 2014.
73
Table of Contents
The following table provides information concerning our repurchases pursuant to our former share repurchase program during the years ended December 31, 2014, 2013 and 2012:
| For the Three Months Ended |
Repurchase Date | Shares Repurchased |
Percentage of Shares Tendered That Were Repurchased |
Repurchase Price Per Share |
Aggregate Consideration for Repurchased Shares |
|||||||||||||
| Fiscal 2012 |
||||||||||||||||||
| December 31, 2011 |
January 3, 2012 | 385,526 | 100 | % | $ | 9.585 | $ | 3,695 | ||||||||||
| March 31, 2012 |
April 2, 2012 | 411,815 | 100 | % | $ | 9.675 | $ | 3,984 | ||||||||||
| June 30, 2012 |
July 2, 2012 | 410,578 | 100 | % | $ | 9.720 | $ | 3,991 | ||||||||||
| September 30, 2012 |
October 1, 2012 | 672,064 | 100 | % | $ | 9.900 | $ | 6,653 | ||||||||||
| Fiscal 2013 |
||||||||||||||||||
| December 31, 2012 |
January 2, 2013 | 883,047 | 100 | % | $ | 10.000 | $ | 8,830 | ||||||||||
| March 31, 2013 |
April 1, 2013 | 1,053,119 | 100 | % | $ | 10.100 | $ | 10,637 | ||||||||||
| June 30, 2013 |
July 1, 2013 | 749,224 | 100 | % | $ | 10.200 | $ | 7,642 | ||||||||||
| September 30, 2013 |
October 1, 2013 | 656,541 | 100 | % | $ | 10.200 | $ | 6,697 | ||||||||||
| Fiscal 2014 |
||||||||||||||||||
| December 31, 2013 |
January 2, 2014 | 872,865 | 100 | % | $ | 10.200 | $ | 8,903 | ||||||||||
Financing Arrangements
The following table presents a summary of information with respect to our outstanding financing arrangements as of December 31, 2014:
| Arrangement |
Type of Arrangement |
Rate |
Amount Outstanding |
Amount Available |
Maturity Date | |||||||||
| Broad Street Credit Facility |
Revolving Credit Facility | L+1.50% | $ | 65,808 | $ | 59,192 | December 18, 2015 | |||||||
| ING Credit Facility |
Revolving Credit Facility | L+2.50% | $ | 123,019 | (1) | $ | 176,981 | April 3, 2018 | ||||||
| JPM Facility |
Repurchase Agreement | 3.25% | $ | 950,000 | $ | — | April 15, 2017 | |||||||
| 4.000% Notes due 2019 |
Unsecured Notes | 4.00% | $ | 400,000 | $ | — | July 15, 2019 | |||||||
| 4.250% Notes due 2020 |
Unsecured Notes | 4.25% | $ | 325,000 | $ | — | January 15, 2020 | |||||||
| (1) | Amount includes borrowing in U.S. dollars and Euros. Euro balance outstanding of €29,625 has been converted to U.S. dollars at an exchange rate of €1.00 to $1.21 as of December 31, 2014 to reflect total amount outstanding in U.S. dollars. |
Our average borrowings and weighted average interest rate, including the effect of non-usage fees, for the year ended December 31, 2014 were $1,825,246 and 3.16%, respectively. As of December 31, 2014, our weighted average effective interest rate on borrowings, including the effect of non-usage fees was 3.53%.
Arch Street Credit Facility
On July 14, 2014, Arch Street repaid the revolving credit facility, or the Arch Street credit facility, with Citibank, N.A., as administrative agent, and the financial institutions and other lenders from time to time party thereto. The Arch Street credit facility provided for borrowings in an aggregate principal amount up to $350,000 on a committed basis. Prior to the termination of the Arch Street credit facility, borrowings under the Arch Street credit facility accrued interest at a rate equal to three-month LIBOR plus 2.05% per annum. Beginning November 27, 2012, Arch Street became required to pay a non-usage fee of 0.50% to the extent the aggregate principal amount available under the facility was not borrowed.
As of December 31, 2014 and 2013, $0 and $373,682, respectively, was outstanding under the Arch Street credit facility. We incurred costs of $4,884 in connection with obtaining and amending the Arch Street credit
74
Table of Contents
facility, which we had recorded as deferred financing costs on its consolidated balance sheets and amortized to interest expense over the life of the facility. In conjunction with the repayment of the Arch Street credit facility on July 14, 2014, $2,226 of remaining unamortized deferred financing costs were charged to interest expense.
For the years ended December 31, 2014, 2013 and 2012, the components of total interest expense for the Arch Street credit facility were as follows:
| Year
Ended December 31, |
||||||||||||
| 2014 | 2013 | 2012 | ||||||||||
| Direct interest expense |
$ | 4,173 | $ | 10,093 | $ | 3,766 | ||||||
| Non-usage fees |
220 | 311 | 22 | |||||||||
| Amortization of deferred financing costs |
2,896 | 1,481 | 507 | |||||||||
|
|
|
|
|
|
|
|||||||
| Total interest expense |
$ | 7,289 | $ | 11,885 | $ | 4,295 | ||||||
|
|
|
|
|
|
|
|||||||
For the years ended December 31, 2014, 2013 and 2012, the cash paid for interest expense, average borrowings, effective interest rate and weighted average interest rate for the Arch Street credit facility were as follows:
| Year Ended December 31, |
||||||||||||
| 2014 | 2013 | 2012 | ||||||||||
| Cash paid for interest expense(1) |
$ | 6,464 | $ | 12,121 | $ | — | ||||||
| Average borrowings under the facility(2) |
$ | 360,986 | $ | 488,712 | $ | 470,962 | ||||||
| Effective interest rate on borrowings (including the effect of non-usage fees) |
— | % | 1.99 | % | 2.30 | % | ||||||
| Weighted average interest rate (including the effect of non-usage fees) |
2.24 | % | 2.10 | % | 2.33 | % | ||||||
| (1) | Interest under the Arch Street credit facility was paid quarterly in arrears. |
| (2) | The average borrowings under the Arch Street credit facility are calculated from the beginning of the period to July 14, 2014, the date we terminated the facility. |
Borrowings of Arch Street were considered borrowings by us for purposes of complying with the asset coverage requirements applicable to BDCs under the 1940 Act.
Broad Street Credit Facility
On January 28, 2011, Broad Street, Deutsche Bank and the other lenders party thereto entered into the Broad Street credit facility, which amended and restated the revolving credit facility that Broad Street originally entered into with Deutsche Bank on March 10, 2010 and the amendments thereto. On March 23, 2012, Broad Street and Deutsche Bank entered into an amendment to the Broad Street credit facility which extended the maturity date of the facility to March 23, 2013, increased the aggregate amount which could be borrowed under the facility to $380,000 and reduced the interest rate for all borrowings under the facility to a rate of LIBOR, for an interest period equal to the weighted average LIBOR interest period of debt securities owned by Broad Street, plus 1.50% per annum. On December 13, 2012, Broad Street repaid $140,000 of borrowings under the facility, thereby reducing the amount which could be borrowed under the facility to $240,000. On March 22, 2013, Broad Street and Deutsche Bank entered into an amendment to the facility to extend the maturity date of the facility to December 22, 2013. On December 20, 2013, Broad Street and Deutsche Bank entered into an amendment to the facility that extended the maturity date to December 20, 2014 and reduced the maximum amount which could be borrowed under the facility to $125,000. On December 18, 2014, Broad Street and Deutsche Bank entered into a further amendment to the facility which extended the maturity date to December 18, 2015, incorporated a commitment fee of 1.50% payable on unused amounts (triggered after five consecutive business days of Broad Street utilizing less than 33% of the maximum commitment), and gave Broad Street the right to reduce the maximum commitment upon three (3) days’ notice to the administrative agent. The Broad Street credit facility provides for borrowings of up to $125,000 at a rate of LIBOR, for an interest period equal to the weighted average LIBOR interest period of debt securities owned by Broad Street, plus 1.50% per annum. Deutsche Bank is a lender and serves as administrative agent under the facility.
75
Table of Contents
Under the Broad Street credit facility, we transfer debt securities to Broad Street from time to time as a contribution to capital and retains a residual interest in the contributed debt securities through its ownership of Broad Street. The obligations of Broad Street under the facility are non-recourse to us and our exposure under the facility is limited to the value of its investment in Broad Street.
As of December 31, 2014 and 2013, $65,808 and $125,000, respectively, was outstanding under the Broad Street credit facility. The carrying amount of the amount outstanding under the facility approximates its fair value. We incurred costs of $2,566 in connection with obtaining and amending the facility, which we have recorded as deferred financing costs on our consolidated balance sheets and amortize to interest expense over the life of the facility. As of December 31, 2014, all of the deferred financing costs have been amortized to interest expense.
Borrowings under the Broad Street credit facility are subject to compliance with a borrowing base, pursuant to which the amount of funds advanced to Broad Street varies depending upon the types of assets in Broad Street’s portfolio. The occurrence of certain events described as “Super-Collateralization Events” in the credit agreement that governs the facility, or a decline in our net asset value below a specified threshold, results in a lowering of the amount of funds that will be advanced against such assets. Super-Collateralization Events include, without limitation: (i) certain key employees ceasing to be directors, principals, officers or investment managers of GDFM; (ii) the bankruptcy or insolvency of GDFM or FB Advisor; (iii) GDFM ceasing to act as our sub-adviser or FB Advisor ceasing to act as our investment adviser; (iv) our ceasing to act as Broad Street’s investment manager, becoming bankrupt or insolvent, defaulting on certain material agreements or failing to maintain a net asset value at least equal to $50,000; and (v) us, GDFM or FB Advisor committing fraud or other illicit acts in its or their investment advisory capacities.
In connection with the facility, Broad Street has made certain representations and warranties and is required to comply with various covenants and other requirements customary for similar facilities. The facility also contains customary events of default for similar financing transactions, including: (a) the failure to make principal payments when due or interest payments within three business days of when due; (b) borrowings under the facility exceeding the applicable advance rates; (c) the purchase by Broad Street of certain ineligible assets; (d) the insolvency or bankruptcy of Broad Street or us; (e) our ceasing to act as investment manager of Broad Street’s assets; (f) the decline of our net asset value below $50,000; and (g) fraud or other illicit acts by us, FB Advisor or GDFM in its or their investment advisory capacities. During the continuation of an event of default, Broad Street must pay interest at a default rate.
For the years ended December 31, 2014, 2013 and 2012, the components of total interest expense for the Broad Street credit facility were as follows:
| Year
Ended December 31, |
||||||||||||
| 2014 | 2013 | 2012 | ||||||||||
| Direct interest expense |
$ | 1,847 | $ | 4,117 | $ | 7,541 | ||||||
| Non-usage fees |
— | 72 | 18 | |||||||||
| Amortization of deferred financing costs |
— | 225 | 958 | |||||||||
|
|
|
|
|
|
|
|||||||
| Total interest expense |
$ | 1,847 | $ | 4,414 | $ | 8,517 | ||||||
|
|
|
|
|
|
|
|||||||
76
Table of Contents
For the years ended December 31, 2014, 2013 and 2012, the cash paid for interest expense, average borrowings, effective interest rate and weighted average interest rate for the Broad Street credit facility were as follows:
| Year Ended December 31, |
||||||||||||
| 2014 | 2013 | 2012 | ||||||||||
| Cash paid for interest expense(1) |
$ | 1,719 | $ | 4,735 | $ | 8,143 | ||||||
| Average borrowings under the facility |
$ | 107,113 | $ | 230,466 | $ | 368,023 | ||||||
| Effective interest rate on borrowings (including the effect of non-usage fees) |
1.75 | % | 1.74 | % | 1.80 | % | ||||||
| Weighted average interest rate (including the effect of non-usage fees) |
1.75 | % | 1.76 | % | 2.05 | % | ||||||
| (1) | Interest under the Broad Street credit facility is paid quarterly in arrears. |
Borrowings of Broad Street will be considered borrowings by us for purposes of complying with the asset coverage requirements applicable to BDCs under the 1940 Act.
ING Credit Facility
On April 3, 2014, we entered into the ING credit facility. The ING credit facility provides for borrowings in U.S. dollars and certain agreed upon foreign currencies in an initial aggregate amount of up to $300,000, with an option for us to request, at one or more times after closing, that existing or new lenders, at their election, provide up to $100,000 of additional commitments. The ING credit facility provides for the issuance of letters of credit in an aggregate face amount not to exceed $25,000. Our obligations under the ING credit facility are guaranteed by all of our subsidiaries, other than our special-purpose financing subsidiaries. Our obligations under the ING credit facility are secured by a first priority security interest in substantially all of our assets and the subsidiary guarantors thereunder other than the equity interests of our special-purpose financing subsidiaries.
Borrowings under the ING credit facility are subject to compliance with a borrowing base. Interest under the ING credit facility for (i) loans for which we elect the base rate option is payable at a rate equal to 1.5% per annum plus the greatest of (x) the “U.S. Prime Rate” as published in The Wall Street Journal, (y) the federal funds effective rate plus 0.5% per annum and (z) three-month LIBOR plus 1% per annum and (ii) loans for which we elect the Eurocurrency option is payable at a rate equal to 2.50% per annum plus adjusted LIBOR. The ING credit facility is subject to a non-usage fee of (a) 1% per annum on the unused portion of the commitment under the ING credit facility for each day such unused portion is 65% or more of the commitments and (b) 0.375% per annum on the unused portion of the commitments for each day the unused portion is less than 65%. We will pay letter of credit participation fees and a fronting fee on the average daily amount of any lender’s exposure with respect to any letters of credit issued under the ING credit facility.
In connection with the ING credit facility, we have made certain representations and warranties and must comply with various covenants and reporting requirements customary for facilities of this type. In addition, we must comply with the following financial covenants: (a) our minimum stockholders’ equity, measured as of each fiscal quarter-end, must be greater than or equal to the greater of (i) 40% of our assets and our subsidiaries as of the last day of such fiscal quarter and (ii) $1,980,744 (less amounts paid to purchase common stock in our listing tender offer), plus 50% of the net proceeds of any post-closing equity offerings; (b) we must maintain at all times a 200% asset coverage ratio; (c) the sum of (x) our and the guarantors’ net worth (defined as stockholders’ equity minus the net asset value held by us in any special-purpose financing subsidiaries) plus (y) 30% of the equity value of any special-purpose financing subsidiaries, must at all times be at least equal to the sum of (A) any of our unsecured longer-term debt and (B) accrued but unpaid base management fees and incentive fees at the time of measurement; and (d) the aggregate value of eligible portfolio investments that can be converted to cash in fewer than 20 business days without more than a 5% change in price must not be less than 10% of the covered debt amount (defined as the aggregate amount of outstanding loans and issued letters of credit under the facility,
77
Table of Contents
plus, to the extent incurred after closing of the ING credit facility, certain of our other permitted debt) for more than 30 business days during any period during which the covered debt amount (less cash and cash equivalents included in the borrowing base) is greater than 90% of the borrowing base (less cash and cash equivalents included therein).
The ING credit facility contains events of default customary for financing transactions of this type. Upon the occurrence of an event of default, ING, at the instruction of the lenders, may terminate the commitments and declare the outstanding advances and all other obligations under the ING credit facility immediately due and payable. During the continuation of an event of default and subject, in certain cases, to the instructions of the lenders, we must pay interest at a default rate.
As of December 31, 2014 and 2013, $123,019 and $0, respectively, was outstanding under the ING credit facility, which includes Eurocurrency borrowings in an aggregate amount of €29,625 and €0, respectively. The carrying amount of the amount outstanding under the facility approximates its fair value. We incurred costs of $3,406 in connection with obtaining the ING credit facility, which we have recorded as deferred financing costs on our consolidated balance sheets and amortize to interest expense over the life of the facility. As of December 31, 2014, $2,551 of such deferred financing costs had yet to be amortized to interest expense.
For the years ended December 31, 2014, 2013 and 2012, the components of total interest expense for the ING credit facility were as follows:
| Year Ended December 31, |
||||||||||||
| 2014 | 2013 | 2012 | ||||||||||
| Direct interest expense |
$ | 3,994 | $ | — | $ | — | ||||||
| Non-usage fees |
616 | — | — | |||||||||
| Amortization of deferred financing costs |
855 | — | — | |||||||||
|
|
|
|
|
|
|
|||||||
| Total interest expense |
$ | 5,465 | $ | — | $ | — | ||||||
|
|
|
|
|
|
|
|||||||
For the years ended December 31, 2014, 2013 and 2012, the cash paid for interest expense, average borrowings, effective interest rate and weighted average interest rate for the ING credit facility were as follows:
| Year Ended December 31, |
||||||||||||
| 2014 | 2013 | 2012 | ||||||||||
| Cash paid for interest expense(1) |
$ | 4,272 | — | — | ||||||||
| Average borrowings under the facility(2) |
$ | 251,387 | — | — | ||||||||
| Effective interest rate on borrowings (including the effect of non-usage fees) |
3.23 | % | — | — | ||||||||
| Weighted average interest rate (including the effect of non-usage fees) |
2.46 | % | — | — | ||||||||
| (1) | Interest under the ING credit facility is payable at the end of each interest period in arrears for Eurocurrency borrowings and quarterly in arrears for base rate borrowings. This first interest payment was made on July 8, 2014. |
| (2) | The average borrowings under the ING credit facility are calculated for the period since we commenced borrowing thereunder to December 31, 2014. |
Borrowings of ING will be considered borrowings by us for purposes of complying with the asset coverage requirements applicable to BDCs under the 1940 Act.
78
Table of Contents
JPM Financing
On April 23, 2013, through two wholly-owned, special-purpose financing subsidiaries, Locust Street Locust Street and Race Street, we entered into an amendment, or the April 2013 amendment, to our debt financing arrangement with JPM, which was originally entered into on July 21, 2011 (and previously amended on September 26, 2012). The April 2013 amendment, among other things: (i) increased the amount of debt financing available under the arrangement from $700,000 to $950,000; and (ii) extended the final repurchase date under the financing arrangement from October 15, 2016 to April 15, 2017. We elected to structure the financing in the manner described more fully below in order to, among other things, obtain such financing at a lower cost than would be available through alternate arrangements.
Pursuant to the financing arrangement, the assets held by Locust Street secure the obligations of Locust Street under certain Class A Floating Rate Notes, or the Class A Notes, to be issued from time to time by Locust Street to Race Street pursuant to the Amended and Restated Indenture, dated as of September 26, 2012 and as supplemented by Supplemental Indenture No. 1, dated April 23, 2013, with Citibank, as trustee, or the Amended and Restated Indenture. Pursuant to the Amended and Restated Indenture, the aggregate principal amount of Class A Notes that may be issued by Locust Street from time to time is $1,140,000. All principal and interest on the Class A Notes will be due and payable on the stated maturity date of April 15, 2024. Race Street will purchase the Class A Notes to be issued by Locust Street from time to time at a purchase price equal to their par value.
Pursuant to the Amended and Restated Indenture, Locust Street has made certain representations and warranties and is required to comply with various covenants, reporting requirements and other customary requirements for similar transactions. In addition, the Amended and Restated Indenture contains customary events of default for similar financing arrangements, including: (a) the failure to make principal payments on the Class A Notes at their stated maturity or redemption date or to make interest payments on the Class A Notes within five business days of when due; (b) the failure of the aggregate outstanding principal balance (subject to certain reductions) of the assets securing the Class A Notes to be at least 130% of the outstanding principal amount of the Class A Notes; and (c) GDFM ceasing to be the sub-adviser to our investment adviser, FB Advisor.
Race Street, in turn, has entered into an amended repurchase transaction with JPM pursuant to the terms of an amended and restated global master repurchase agreement and the related annex and amended and restated confirmation thereto, each dated as of April 23, 2013, and subsequently amended as of October 24, 2013, or, collectively, the JPM Facility. Pursuant to the JPM Facility, JPM has agreed to purchase from time to time Class A Notes held by Race Street for an aggregate purchase price equal to approximately 83.33% of the principal amount of Class A Notes purchased. Subject to certain conditions, the maximum principal amount of Class A Notes that may be purchased under the JPM Facility is $1,140,000. Accordingly, the maximum amount payable at any time to Race Street under the JPM Facility is $950,000. Under the JPM Facility, Race Street will, on a quarterly basis, repurchase the Class A Notes sold to JPM under the JPM Facility and subsequently resell such Class A Notes to JPM. The final repurchase transaction must occur no later than April 15, 2017. The repurchase price paid by Race Street to JPM for each repurchase of Class A Notes will be equal to the purchase price paid by JPM for such Class A Notes, plus interest thereon accrued at a fixed rate of 3.25% per annum. Commencing April 15, 2015, Race Street is permitted to reduce (based on certain thresholds) the aggregate principal amount of Class A Notes subject to the JPM Facility. Such reductions, and any other reductions of the principal amount of Class A Notes, including upon an event of default, will be subject to breakage fees in an amount equal to the present value of 1.25% per annum over the remaining term of the JPM Facility applied to the amount of such reduction.
If at any time during the term of the JPM Facility the market value of the assets held by Locust Street securing the Class A Notes declines by an amount greater than 27% of their initial aggregate purchase price, or the Margin Threshold, Race Street will be required to post cash collateral with JPM in an amount at least equal to
79
Table of Contents
the amount by which the market value of such assets at such time is less than the Margin Threshold. In such event, in order to satisfy any such margin-posting requirements, Race Street intends to borrow funds from us pursuant to a revolving credit agreement, dated as of July 21, 2011 and as amended as of September 26, 2012, between Race Street, as borrower, and us, as lender, or the Revolving Credit Agreement. We may, in our sole discretion, make such loans from time to time to Race Street pursuant to the terms of the Revolving Credit Agreement. Borrowings under the Revolving Credit Agreement will accrue interest at a rate equal to one-month LIBOR plus a spread of 0.75% per annum.
Pursuant to the financing arrangement, the assets held by Race Street secure the obligations of Race Street under the JPM Facility.
Pursuant to the JPM Facility, Race Street has made certain representations and warranties and is required to comply with various covenants, reporting requirements and other customary requirements for similar transactions. The JPM Facility contains customary events of default included in similar transactions, including: (a) the failure to pay the repurchase price upon the applicable payment dates; (b) the failure to post required cash collateral with JPM as discussed above; and (c) the occurrence of an event of default under the Indenture.
In connection with the Class A Notes and the Amended and Restated Indenture, Locust Street also entered into: (i) an amended and restated collateral management agreement with us, as collateral manager, dated as of September 26, 2012, pursuant to which we will manage the assets of Locust Street; and (ii) an amended and restated collateral administration agreement with Virtus Group, LP, or Virtus, as collateral administrator, and us, as collateral manager, dated as of September 26, 2012, pursuant to which Virtus will perform certain administrative services with respect to the assets of Locust Street. In connection with the JPM Facility, Race Street also entered into a collateral management agreement with us, as collateral manager, dated as of September 26, 2012, pursuant to which we will manage the assets of Race Street.
As of December 31, 2014 and 2013, Class A Notes in the aggregate principal amount of $1,140,000 and $1,140,000, respectively, had been purchased by Race Street from Locust Street and subsequently sold to JPM under the JPM Facility for aggregate proceeds of $950,000 and $950,000, respectively. The carrying amount outstanding under the JPM Facility approximates its fair value. We funded each purchase of Class A Notes by Race Street through a capital contribution to Race Street. As of December 31, 2014 and 2013, Race Street’s liability under the JPM Facility was $950,000 and $950,000, respectively, plus $6,690 and $6,690, respectively, of accrued interest expense. The Class A Notes issued by Locust Street and purchased by Race Street eliminate in consolidation on our financial statements.
As of December 31, 2014 and 2013, the fair value of assets held by Locust Street was $1,832,095 and $1,870,351, respectively, which included assets purchased by Locust Street with proceeds from the issuance of Class A Notes. As of December 31, 2014 and 2013, the fair value of assets held by Race Street was $855,341 and $747,330, respectively.
We incurred costs of $425 in connection with obtaining the JPM Facility, which we have recorded as deferred financing costs on our consolidated balance sheets and amortize to interest expense over the life of the JPM Facility. As of December 31, 2014, $61 of such deferred financing costs had yet to be amortized to interest expense.
For the years ended December 31, 2014, 2013 and 2012, the components of total interest expense for the JPM Facility were as follows:
| Year Ended December 31, |
||||||||||||
| 2014 | 2013 | 2012 | ||||||||||
| Direct interest expense |
$ | 31,304 | $ | 26,452 | $ | 14,652 | ||||||
| Non-usage fees |
— | — | — | |||||||||
| Amortization of deferred financing costs |
112 | 106 | 101 | |||||||||
|
|
|
|
|
|
|
|||||||
| Total interest expense |
$ | 31,416 | $ | 26,558 | $ | 14,753 | ||||||
|
|
|
|
|
|
|
|||||||
80
Table of Contents
For the years ended December 31, 2014, 2013 and 2012, the cash paid for interest expense, average borrowings, effective interest rate and weighted average interest rate for the JPM Facility were as follows:
| Year Ended December 31, |
||||||||||||
| 2014 | 2013 | 2012 | ||||||||||
| Cash paid for interest expense(1) |
$ | 31,304 | $ | 24,060 | $ | 11,648 | ||||||
| Average borrowings under the facility |
$ | 950,000 | $ | 802,746 | $ | 406,002 | ||||||
| Effective interest rate on borrowings (including the effect of non-usage fees) |
3.25 | % | 3.25 | % | 3.25 | % | ||||||
| Weighted average interest rate (including the effect of non-usage fees) |
3.25 | % | 3.25 | % | 3.61 | % | ||||||
| (1) | Interest under the JPM Facility is paid quarterly in arrears. |
Amounts outstanding under the JPM Facility will be considered borrowings by us for purposes of complying with the asset coverage requirements applicable to BDCs under the 1940 Act.
Walnut Street Credit Facility
On December 3, 2014, Walnut Street Funding LLC, or Walnut Street, our wholly-owned, special purpose financing subsidiary, repaid and terminated the revolving credit facility, or the Walnut Street credit facility, with Wells Fargo Bank, National Association, or together with Wells Fargo Securities, LLC, Wells Fargo. Wells Fargo Securities, LLC served as the administrative agent and Wells Fargo Bank, National Association was the sole lender, collateral agent, account bank and collateral custodian under the facility. The Walnut Street credit facility provided for borrowings in an aggregate principal amount up to $250,000 on a committed basis. Prior to the termination of the Walnut Street credit facility, borrowings under the Walnut Street credit facility accrued interest at a rate equal to three-month LIBOR, plus a spread ranging between 1.50% and 2.50% per annum, depending on the composition of the portfolio of debt securities for the relevant period. Beginning on September 17, 2012, Walnut Street became subject to a non-usage fee of 0.50% to the extent the aggregate principal amount available under the Walnut Street credit facility was not borrowed.
As of December 31, 2014 and 2013, $0 and $225,000, respectively, was outstanding under the Walnut Street credit facility. We incurred costs of $4,029 in connection with obtaining the Walnut Street credit facility, which we have recorded as deferred financing costs on our consolidated balance sheets and amortize to interest expense over the life of the facility. In conjunction with the repayment of the Walnut Street credit facility on December 18, 2014, $2,013 of remaining unamortized deferred financing costs were charged to interest expense.
For the years ended December 31, 2014, 2013 and 2012, the components of total interest expense for the Walnut Street credit facility were as follows:
| Year Ended December 31, |
||||||||||||
| 2014 | 2013 | 2012 | ||||||||||
| Direct interest expense |
$ | 6,009 | $ | 7,118 | $ | 1,988 | ||||||
| Non-usage fees |
734 | 33 | 205 | |||||||||
| Amortization of deferred financing costs |
2,805 | 755 | 469 | |||||||||
|
|
|
|
|
|
|
|||||||
| Total interest expense |
$ | 9,548 | $ | 7,906 | $ | 2,662 | ||||||
|
|
|
|
|
|
|
|||||||
81
Table of Contents
For the years ended December 31, 2014, 2013 and 2012, the cash paid for interest expense, average borrowings, effective interest rate and weighted average interest rate for the Walnut Street credit facility were as follows:
| Year Ended December 31, |
||||||||||||
| 2014 | 2013 | 2012 | ||||||||||
| Cash paid for interest expense(1) |
$ | 8,444 | $ | 6,959 | $ | 684 | ||||||
| Average borrowings under the facility(2) |
$ | 235,768 | $ | 243,583 | $ | 139,274 | ||||||
| Effective interest rate on borrowings (including the effect of non-usage fees) |
— | % | 2.89 | % | 2.70 | % | ||||||
| Weighted average interest rate (including the effect of non-usage fees) |
3.18 | % | 2.90 | % | 3.07 | % | ||||||
| (1) | Interest under the Walnut Street credit facility was paid quarterly in arrears. |
| (2) | The average borrowings under the Walnut Street credit facility are calculated from the beginning of the period to December 3, 2014, the date we terminated the facility. |
Borrowings of Walnut Street were considered borrowings by us for purposes of complying with the asset coverage requirements applicable to BDCs under the 1940 Act.
4.000% Notes due 2019
On July 14, 2014, we and U.S. Bank National Association, or U.S. Bank, entered into a base indenture, and a first supplemental indenture, or the first supplemental indenture, and together with the base indenture and second supplemental indenture described below, the indenture, relating to our issuance of $400,000 aggregate principal amount of its 4.000% notes due 2019, or the 4.000% notes.
The 4.000% notes will mature on July 15, 2019 and may be redeemed in whole or in part at our option at any time or from time to time at the redemption price set forth in the indenture. The 4.000% notes bear interest at a rate of 4.000% per year, payable semi-annually on January 15 and July 15 of each year, commencing on January 15, 2015. The 4.000% notes are general unsecured obligations by us that rank senior in right of payment to all of our existing and future indebtedness that is expressly subordinated in right of payment to the 4.000% notes and rank pari passu with all outstanding and future unsecured unsubordinated indebtedness issued by us.
In addition, on the occurrence of a “change of control repurchase event,” as defined in the indenture, we will generally be required to make an offer to purchase the outstanding 4.000% notes at a price equal to 100% of the principal amount of such notes plus accrued and unpaid interest to the repurchase date.
The indenture contains certain covenants, including covenants requiring us to comply with the asset coverage requirements of Section 18(a)(1)(A) of the 1940 Act, as modified by Section 61(a)(1) of the 1940 Act, whether or not it is subject to those requirements, and to provide financial information to the holders of the 4.000% notes and U.S. Bank if we are no longer subject to the reporting requirements under the Exchange Act. These covenants are subject to limitations and exceptions that are described in the indenture.
As of December 31, 2014 and 2013, $400,000 and $0, respectively, of the 4.000% notes were outstanding. The carrying amount outstanding under the 4.000% notes approximates its fair value. We incurred costs of $6,177 in connection with issuing the 4.000% notes, which we have recorded as deferred financing costs on our consolidated balance sheets and amortize to interest expense over the life of the 4.000% notes. As of December 31, 2014, $5,601 of such deferred financing costs had yet to be amortized to interest expense.
82
Table of Contents
For the years ended December 31, 2014, 2013 and 2012, the components of total interest expense for the 4.000% notes due 2019 were as follows:
| Year Ended December 31, |
||||||||||||
| 2014 | 2013 | 2012 | ||||||||||
| Direct interest expense |
$ | 7,496 | $ | — | $ | — | ||||||
| Amortization of deferred financing costs |
576 | — | — | |||||||||
|
|
|
|
|
|
|
|||||||
| Total interest expense |
$ | 8,072 | $ | — | $ | — | ||||||
|
|
|
|
|
|
|
|||||||
For the years ended December 31, 2014, 2013 and 2012, the cash paid for interest expense, average borrowings, effective interest rate and weighted average interest rate for the 4.000% notes due 2019 were as follows:
| Year Ended December 31, |
||||||||||||
| 2014 | 2013 | 2012 | ||||||||||
| Cash paid for interest expense(1) |
$ | — | — | — | ||||||||
| Average borrowings under the facility(2) |
$ | 400,000 | — | — | ||||||||
| Effective interest rate on borrowings (including the effect of non-usage fees) |
4.00 | % | — | — | ||||||||
| Weighted average interest rate (including the effect of non-usage fees) |
4.00 | % | — | — | ||||||||
| (1) | Interest under the 4.000% notes due 2019 is paid semi-annually in arrears. |
| (2) | Average borrowings under the 4.000% notes are calculated for the period since the date of issuance to December 31, 2014. |
4.250% Notes due 2020
On December 3, 2014, we and U.S. Bank entered into a second supplemental indenture to the indenture relating to our issuance of $325,000 aggregate principal amount of its 4.250% notes due 2020, or the 4.250% notes and, together with the 4.000% notes, the notes.
The 4.250% notes will mature on January 15, 2020 and may be redeemed in whole or in part at our option at any time or from time to time at the redemption price set forth in the indenture. The 4.250% notes bear interest at a rate of 4.250% per year, payable semi-annually on January 15 and July 15 of each year, commencing on July 15, 2015. The 4.250% notes are general unsecured obligations by us that rank senior in right of payment to all of our existing and future indebtedness that is expressly subordinated in right of payment to the 4.250% notes and rank pari passu with all outstanding and future unsecured unsubordinated indebtedness issued by us.
In addition, on the occurrence of a “change of control repurchase event,” as defined in the indenture, we will generally be required to make an offer to purchase the outstanding 4.250% notes at a price equal to 100% of the principal amount of such notes plus accrued and unpaid interest to the repurchase date.
The indenture contains certain covenants, including covenants requiring us to comply with the asset coverage requirements of Section 18(a)(1)(A) of the 1940 Act, as modified by Section 61(a)(1) of the 1940 Act, whether or not it is subject to those requirements, and to provide financial information to the holders of the 4.250% notes and U.S. Bank if we are no longer subject to the reporting requirements under the Exchange Act. These covenants are subject to limitations and exceptions that are described in the indenture.
As of December 31, 2014 and 2013, $325,000 and $0, respectively, of the 4.250% notes were outstanding. The carrying amount outstanding under the 4.250% notes approximates its fair value. We incurred costs of $4,954 in connection with issuing the 4.250% notes, which we have recorded as deferred financing costs on our
83
Table of Contents
consolidated balance sheets and amortize to interest expense over the life of the 4.250% notes. As of December 31, 2014, $4,884 of such deferred financing costs had yet to be amortized to interest expense.
For the years ended December 31, 2014, 2013 and 2012, the components of total interest expense for the 4.250% notes due 2020 were as follows:
| Year Ended December 31, |
||||||||||||
| 2014 | 2013 | 2012 | ||||||||||
| Direct interest expense |
$ | 1,097 | $ | — | $ | — | ||||||
| Amortization of deferred financing costs |
70 | — | — | |||||||||
|
|
|
|
|
|
|
|||||||
| Total interest expense |
$ | 1,167 | $ | — | $ | — | ||||||
|
|
|
|
|
|
|
|||||||
For the years ended December 31, 2014, 2013 and 2012, the cash paid for interest expense, average borrowings, effective interest rate and weighted average interest rate for the 4.250% notes due 2020 were as follows:
| Year Ended December 31, |
||||||||||||
| 2014 | 2013 | 2012 | ||||||||||
| Cash paid for interest expense(1) |
$ | — | — | — | ||||||||
| Average borrowings under the facility(2) |
$ | 325,000 | — | — | ||||||||
| Effective interest rate on borrowings (including the effect of non-usage fees) |
4.25 | % | — | — | ||||||||
| Weighted average interest rate (including the effect of non-usage fees) |
4.25 | % | — | — | ||||||||
| (1) | Interest under the 4.250% notes due 2020 is paid semi-annually in arrears. |
| (2) | Average borrowings under the 4.250% notes are calculated for the period since the date of issuance to December 31, 2014. |
RIC Status and Distributions
We have elected to be treated for U.S. federal income tax purposes, and intend to qualify annually, as a RIC under Subchapter M of the Code. In order to qualify as a RIC, we must, among other things, make distributions of an amount at least equal to 90% of our investment company taxable income, determined without regard to any deduction for distributions paid, each tax year. As long as the distributions are declared by the later of the fifteenth day of the ninth month following the close of the tax year or the due date of the tax return, including extensions, distributions paid up to one year after the current taxable year can be carried back to the prior taxable year for determining the distributions paid in such taxable year. We intend to make sufficient distributions to our stockholders to qualify for and maintain our RIC status each year. We are also subject to nondeductible federal excise taxes if we do not distribute during each calendar year an amount at least equal to the sum of (1) 98% of our net ordinary income (taking into account certain deferrals and elections) for the calendar year, (2) 98.2% of our capital gain net income (adjusted for certain ordinary losses) for the one-year period ending on October 31 of the calendar year and (3) any net ordinary income and capital gain net income for preceding years that were not distributed during such years and on which we paid no U.S. federal income tax. Any distribution declared by us in October, November or December of any calendar year, payable to stockholders of record on a specified date in such a month and actually paid during January of the following calendar year, will be treated as if it had been received by our U.S. stockholders on December 31 of the calendar year in which the distribution was declared. We can offer no assurance that we will achieve results that will permit us to pay any cash distributions. If we issue senior securities, we will be prohibited from making distributions if doing so causes us to fail to maintain the asset coverage ratios stipulated by the 1940 Act or if distributions are limited by the terms of any of our borrowings.
Following commencement of our investment operations, we declared our first distribution on January 29, 2009. Effective January 1, 2015 and subject to applicable legal restrictions and the sole discretion of our board of
84
Table of Contents
directors, we intend to authorize, declare and pay regular cash distributions on a quarterly basis. We will calculate each stockholder’s specific distribution amount for the period using record and declaration dates and each stockholder’s distributions will begin to accrue on the date that shares of our common stock are issued to such stockholder. From time to time, we may also pay special interim distributions in the form of cash or shares of our common stock at the discretion of our board of directors. The timing and amount of any future distributions to stockholders are subject to applicable legal restrictions and the sole discretion of our board of directors.
During certain periods, our distributions may exceed our earnings. As a result, it is possible that a portion of the distributions we make may represent a return of capital. A return of capital generally is a return of an stockholder’s investment rather than a return of earnings or gains derived from our investment activities. Each year a statement on Form 1099-DIV identifying the sources of the distributions will be mailed to our stockholders. No portion of the distributions paid during the tax years ended December 31, 2014, 2013 or 2012 represented a return of capital.
We intend to continue to make our regular distributions in the form of cash, out of assets legally available for distribution, except for those stockholders who receive their distributions in the form of shares of our common stock under the new DRP (as defined below). Any distributions reinvested under the plan will nevertheless remain taxable to a U.S. stockholder.
The following table reflects the cash distributions per share that we have declared and paid on our common stock during the years ended December 31, 2014, 2013 and 2012:
| Distribution | ||||||||
| For the Year Ended December 31, |
Per Share | Amount | ||||||
|
2012(1)(2) |
$ | 0.8586 | $ | 197,906 | ||||
|
2013(3) |
0.8303 | 212,153 | ||||||
|
2014(4)(5) |
1.0843 | 267,856 | ||||||
| (1) | In addition to regular cash distributions during such period, cash distributions declared and paid on our common stock during the year ended December 31, 2012 include approximately $12,417, or approximately $0.05 per share, in special cash distributions. |
| (2) | On May 15, 2012, our board of directors determined to increase the amount of semi-monthly distributions payable to stockholders of record from $0.033594 per share to $0.03375 per share, effective May 16, 2012. Beginning in June 2012, we declared and paid regular cash distributions on a monthly basis in an amount equal to $0.0675 per share. |
| (3) | On June 25, 2013, our board of directors determined to increase the amount of the regular monthly cash distributions payable to stockholders of record from $0.0675 per share to $0.06975 per share, effective as of June 28, 2013. On October 16, 2013, our board of directors determined to increase the amount of regular monthly cash distributions payable to stockholders of record from $0.06975 per share to $0.0720 per share, effective as of November 29, 2013. |
| (4) | On March 31, 2014, our board of directors determined to increase the amount of the regular monthly cash distribution payable to stockholders of record from $0.0720 per share to $0.07425 per share, effective as of April 30, 2014. |
| (5) | On July 1, 2014, our board of directors declared a special cash distribution of $0.10 per share, which was paid on August 15, 2014 to stockholders of record as of the close of business on July 31, 2014. On October 10, 2014, the board of directors of the Company also declared a special cash distribution of $0.10 per share, which was paid on November 14, 2014 to stockholders of record as of the close of business on October 31, 2014. |
85
Table of Contents
On January 13, 2015, our board of directors declared a regular quarterly cash distribution of $0.22275 per share, which will be paid on or about April 2, 2015 to stockholders of record as of the close of business on March 25, 2015. The timing and amount of any future distributions to stockholders are subject to applicable legal restrictions and the sole discretion of our board of directors.
Historically, we had an “opt in” distribution reinvestment plan for our stockholders, or the old DRP, which terminated upon the listing of our shares of common stock on the NYSE. The final distribution reinvestment under the old DRP was made in connection with the regular monthly cash distribution paid on March 31, 2014 to stockholders of record as of the close of business on March 28, 2014. Under the old DRP, if we made a cash distribution, our stockholders received distributions in cash unless they specifically “opted in” to the distribution reinvestment plan so as to have their cash distributions reinvested in additional shares of our common stock. On May 23, 2014, we adopted an “opt out” distribution reinvestment plan, or the new DRP, which was effective June 2, 2014. The new DRP was first implemented in connection with the regular monthly cash distribution paid on July 2, 2014 to stockholders of record as of the close of business on June 24, 2014. Pursuant to the new DRP, we will reinvest all cash dividends or distributions declared by our board of directors on behalf of stockholders who do not elect to receive their distributions in cash. As a result, if our board of directors declares a distribution, then stockholders who have not elected to “opt out” of the new DRP will have their distributions automatically reinvested in additional shares of our common stock.
With respect to each distribution pursuant to the new DRP, we reserve the right to either issue new shares of common stock or purchase shares of common stock in the open market in connection with implementation of the new DRP. Unless in our sole discretion, we otherwise direct the plan administrator, (A) if the per share market price (as defined in the new DRP) is equal to or greater than the estimated net asset value per share (rounded up to the nearest whole cent) of our common stock on the payment date for the distribution, then we will issue shares of common stock at the greater of (i) net asset value per share of common stock or (ii) 95% of the market price; or (B) if the market price is less than the net asset value per share, then, in our sole discretion, (i) shares of common stock will be purchased in open market transactions for the accounts of participants to the extent practicable, or (ii) we will issue shares of common stock at net asset value per share. Pursuant to the terms of the new DRP, the number of shares of common stock to be issued to a participant will be determined by dividing the total dollar amount of the distribution payable to a participant by the price per share at which we issue such shares; provided, however, that shares purchased in open market transactions by the plan administrator will be allocated to a participant based on the average purchase price, excluding any brokerage charges or other charges, of all shares of common stock purchased in the open market.
If a stockholder receives distributions in the form of common stock pursuant to the new DRP, such stockholder generally will be subject to the same federal, state and local tax consequences as if it elected to receive distributions in cash. If our common stock is trading at or below net asset value, a stockholder receiving distributions in the form of additional common stock will be treated as receiving a distribution in the amount of cash that they would have received if they had elected to receive the distribution in cash. If our common stock is trading above net asset value, a stockholder receiving distributions in the form of additional common stock will be treated as receiving a distribution in the amount of the fair market value of our common stock. The stockholder’s basis for determining gain or loss upon the sale of common stock received in a distribution will be equal to the total dollar amount of the distribution payable to the stockholder. Any stock received in a distribution will have a holding period for tax purposes commencing on the day following the day on which the shares of common stock are credited to the stockholder’s account.
We may fund our cash distributions to stockholders from any sources of funds legally available to us, including proceeds from the sale of shares of our common stock, borrowings, net investment income from operations, capital gains proceeds from the sale of assets, non-capital gains proceeds from the sale of assets and dividends or other distributions paid to us on account of preferred and common equity investments in portfolio companies. We have not established limits on the amount of funds we may use from available sources to make distributions. During certain periods, our distributions may exceed our earnings. As a result, it is possible that a
86
Table of Contents
portion of the distributions we make may represent a return of capital. A return of capital generally is a return of a stockholder’s investment rather than a return of earnings or gains derived from our investment activities. Each year a statement on Form 1099-DIV identifying the sources of the distributions (i.e., paid from ordinary income, paid from net capital gains on the sale of securities, and/or a return of paid-in capital surplus, which is a nontaxable distribution) will be mailed to our stockholders. There can be no assurance that we will be able to pay distributions at a specific rate or at all.
The following table reflects the sources of the cash distributions on a tax basis that we have paid on our common stock during the years ended December 31, 2014, 2013 and 2012:
| Year Ended December 31, | ||||||||||||||||||||||||
| 2014 | 2013 | 2012 | ||||||||||||||||||||||
| Source of Distribution |
Distribution Amount |
Percentage | Distribution Amount |
Percentage | Distribution Amount |
Percentage | ||||||||||||||||||
| Offering proceeds |
$ | — | — | $ | — | — | $ | — | — | |||||||||||||||
| Borrowings |
— | — | — | — | — | — | ||||||||||||||||||
| Net investment income(1) |
196,227 | 73 | % | 212,153 | 100 | % | 144,364 | 73 | % | |||||||||||||||
| Short-term capital gains proceeds from the sale of assets |
39,835 | 15 | % | — | — | 53,542 | 27 | % | ||||||||||||||||
| Long-term capital gains proceeds from the sale of assets |
31,794 | 12 | % | — | — | — | — | |||||||||||||||||
| Non-capital gains proceeds from the sale of assets |
— | — | — | — | — | — | ||||||||||||||||||
| Distributions on account of preferred and common equity |
— | — | — | — | — | — | ||||||||||||||||||
|
|
|
|
|
|
|
|
|
|
|
|
|
|||||||||||||
| Total |
$ | 267,856 | 100 | % | $ | 212,153 | 100 | % | $ | 197,906 | 100 | % | ||||||||||||
|
|
|
|
|
|
|
|
|
|
|
|
|
|||||||||||||
| (1) | During the years ended December 31, 2014, 2013 and 2012, 91.1%, 89.3% and 92.1%, respectively, of our gross investment income was attributable to cash income earned, 5.2%, 9.1% and 6.8%, respectively, was attributable to non-cash accretion of discount and 3.7%, 1.6% and 1.1%, respectively, was attributable to PIK interest. |
Our net investment income on a tax basis for the years ended December 31, 2014, 2013 and 2012 was $221,880, $236,936 and $185,513, respectively. As of December 31, 2014, 2013 and 2012, we had $152,743, $148,676 and $57,740, respectively, of undistributed net investment income and realized gains on a tax basis.
Our undistributed net investment income on a tax basis as of December 31, 2013 was adjusted following the filing of our 2013 tax return in September 2014. The adjustment was primarily due to tax-basis income received by us during the year ended December 31, 2013 exceeding GAAP-basis income with respect to collateralized securities and interests in partnerships held in our investment portfolio during such period. The tax notices for such collateralized securities and interests in partnerships were received by us subsequent to the filing of our annual report on Form 10-K for the year ended December 31, 2013.
The difference between our GAAP-basis net investment income and our tax-basis net investment income is primarily due to the reversal of the required accrual for GAAP purposes of incentive fees on unrealized gains even though no such incentive fees on unrealized gains are payable by us, the reclassification of unamortized original issue discount and prepayment fees recognized upon prepayment of loans from income for GAAP purposes to realized gains for tax purposes, the reversal of non-deductible excise taxes, and, with respect to the years ended December 31, 2013 and 2012, the inclusion of a portion of the periodic net settlement payments due on the total return swap in tax-basis net investment income and the amount by which tax-basis income received by us with respect to collateralized securities and interests in partnerships exceeded our GAAP-basis income.
87
Table of Contents
The following table sets forth a reconciliation between GAAP-basis net investment income and tax-basis net investment income during the years ended December 31, 2014, 2013 and 2012:
| Year Ended December 31, | ||||||||||||
| 2014 | 2013 | 2012 | ||||||||||
| GAAP-basis net investment income |
$ | 242,008 | $ | 244,976 | $ | 133,907 | ||||||
| Reversal of incentive fee accrual on unrealized gains |
(9,468 | ) | 2,583 | 27,960 | ||||||||
| Taxable income adjustment on collateralized securities and partnerships |
— | — | 9,355 | |||||||||
| Excise taxes |
5,400 | 5,742 | 500 | |||||||||
| Tax-basis net investment income portion of total return swap payments |
— | — | 12,356 | |||||||||
| Reclassification of unamortized original issue discount and prepayment fees |
(19,436 | ) | (15,904 | ) | — | |||||||
| Other miscellaneous differences |
3,376 | (461 | ) | 1,435 | ||||||||
|
|
|
|
|
|
|
|||||||
| Tax-basis net investment income |
$ | 221,880 | $ | 236,936 | $ | 185,513 | ||||||
|
|
|
|
|
|
|
|||||||
We may make certain adjustments to the classification of stockholders’ equity as a result of permanent book-to-tax differences. During the year ended December 31, 2014, we increased accumulated undistributed net realized gains on investments and gain/loss on foreign currency by $19,737 and decreased capital in excess of par value and accumulated undistributed (distributions in excess of) net investment income by $7,292 and $12,445, respectively. During the year ended December 31, 2013, we increased accumulated undistributed net realized gains on investments and gain/loss on foreign currency by $8,441 and decreased capital in excess of par value and accumulated undistributed (distributions in excess of) net investment income by $6,633 and $1,808, respectively. During the year ended December 31, 2012, we reduced accumulated undistributed net realized gains on investments and gain/loss on foreign currency by $13,480 and increased accumulated undistributed (distributions in excess of) net investment income by $13,480 to reflect the reclassification of a portion of realized gains on the total return swap into tax-basis net investment income.
The determination of the tax attributes of our distributions is made annually as of the end of our fiscal year based upon our taxable income for the full year and distributions paid for the full year. The actual tax characteristics of distributions to stockholders are reported to stockholders annually on Form 1099-DIV.
As of December 31, 2014 and 2013, the components of accumulated earnings on a tax basis were as follows:
| Year Ended December 31, | ||||||||
| 2014 | 2013 | |||||||
| Distributable ordinary income (income and short-term capital gains) |
$ | 114,667 | $ | 116,882 | ||||
| Distributable realized gains (long-term capital gains) |
38,076 | 31,794 | ||||||
| Incentive fee accrual on unrealized gains |
(21,075 | ) | (30,543 | ) | ||||
| Unamortized organization costs |
(386 | ) | (429 | ) | ||||
| Net unrealized appreciation (depreciation) on investments and gain/loss on foreign currency(1) |
(23,085 | ) | 56,276 | |||||
|
|
|
|
|
|||||
| $ | 108,197 | $ | 173,980 | |||||
|
|
|
|
|
|||||
| (1) | As of December 31, 2014 and December 31, 2013, the gross unrealized appreciation on our investments and gain on foreign currency was $136,422 and $125,870, respectively. As of December 31, 2014 and December 31, 2013, the gross unrealized depreciation on our investments and loss on foreign currency was $159,507 and $69,594, respectively. |
The aggregate cost of our investments for U.S. federal income tax purposes totaled $4,210,963 and $4,081,123 as of December 31, 2014 and 2013, respectively. The aggregate net unrealized appreciation (depreciation) on a tax basis was $(23,085) and $56,276 as of December 31, 2014 and 2013, respectively.
88
Table of Contents
See Note 5 to our consolidated financial statements contained in this annual report on Form 10-K for additional information regarding our distributions for the years ended December 31, 2014, 2013 and 2012.
Critical Accounting Policies
Our financial statements are prepared in conformity with GAAP, which requires us to make estimates and assumptions that affect the reported amounts of assets and liabilities at the date of the financial statements and the reported amounts of revenues and expenses during the reporting periods. Critical accounting policies are those that require the application of management’s most difficult, subjective or complex judgments, often because of the need to make estimates about the effect of matters that are inherently uncertain and that may change in subsequent periods. In preparing the financial statements, management has made estimates and assumptions that affect the reported amounts of assets and liabilities at the date of the financial statements and the reported amounts of revenues and expenses during the reporting periods. In preparing the financial statements, management has utilized available information, including our past history, industry standards and the current economic environment, among other factors, in forming its estimates and judgments, giving due consideration to materiality. Actual results may differ from these estimates. In addition, other companies may utilize different estimates, which may impact the comparability of our results of operations to those of companies in similar businesses. As we execute our operating plans, we will describe additional critical accounting policies in the notes to our future financial statements in addition to those discussed below.
Valuation of Portfolio Investments
We determine the net asset value of our investment portfolio each quarter. Securities that are publicly-traded are valued at the reported closing price on the valuation date. Securities that are not publicly-traded are valued at fair value as determined in good faith by our board of directors. In connection with that determination, FB Advisor provides our board of directors with portfolio company valuations which are based on relevant inputs, including, but not limited to, indicative dealer quotes, values of like securities, recent portfolio company financial statements and forecasts, and valuations prepared by third-party valuation services.
Accounting Standards Codification Topic 820, Fair Value Measurements and Disclosure, or ASC Topic 820, issued by the Financial Accounting Standards Board, clarifies the definition of fair value and requires companies to expand their disclosure about the use of fair value to measure assets and liabilities in interim and annual periods subsequent to initial recognition. ASC Topic 820 defines fair value as the price that would be received from the sale of an asset or paid to transfer a liability in an orderly transaction between market participants at the measurement date. ASC Topic 820 also establishes a three-tier fair value hierarchy, which prioritizes the inputs used in measuring fair value. These tiers include: Level 1, defined as observable inputs such as quoted prices in active markets; Level 2, which includes inputs such as quoted prices for similar securities in active markets and quoted prices for identical securities where there is little or no activity in the market; and Level 3, defined as unobservable inputs for which little or no market data exists, therefore requiring an entity to develop its own assumptions.
With respect to investments for which market quotations are not readily available, we undertake a multi-step valuation process each quarter, as described below:
| • | our quarterly valuation process begins with FB Advisor’s management team providing a preliminary valuation of each portfolio company or investment to our valuation committee, which valuation may be obtained from an independent valuation firm, if applicable; |
| • | preliminary valuation conclusions are then documented and discussed with our valuation committee; |
| • | our valuation committee reviews the preliminary valuation and FB Advisor’s management team, together with our independent valuation firm, if applicable, responds and supplements the preliminary valuation to reflect any comments provided by the valuation committee; and |
89
Table of Contents
| • | our board of directors discusses valuations and determines the fair value of each investment in our portfolio in good faith based on various statistical and other factors, including the input and recommendation of FB Advisor, the valuation committee and any third-party valuation firm, if applicable. |
Determination of fair value involves subjective judgments and estimates. Accordingly, the notes to our consolidated financial statements refer to the uncertainty with respect to the possible effect of such valuations and any change in such valuations on our consolidated financial statements. In making its determination of fair value, our board of directors may use independent third-party pricing or valuation services. However, our board of directors is not required to determine fair value in accordance with the valuation provided by any single source, and may use any relevant data, including information obtained from FB Advisor or any independent third-party valuation or pricing service that our board of directors deems to be reliable in determining fair value under the circumstances. Below is a description of factors that our board of directors may consider when valuing our debt and equity investments.
Valuation of fixed income investments, such as loans and debt securities, depends upon a number of factors, including prevailing interest rates for like securities, expected volatility in future interest rates, call features, put features and other relevant terms of the debt. For investments without readily available market prices, we may incorporate these factors into discounted cash flow models to arrive at fair value. Other factors that our board of directors may consider include the borrower’s ability to adequately service its debt, the fair market value of the portfolio company in relation to the face amount of its outstanding debt and the quality of collateral securing our debt investments.
For convertible debt securities, fair value generally approximates the fair value of the debt plus the fair value of an option to purchase the underlying security (the security into which the debt may convert) at the conversion price. To value such an option, a standard option pricing model may be used.
Our equity interests in portfolio companies for which there is no liquid public market are valued at fair value. Our board of directors, in its analysis of fair value, may consider various factors, such as multiples of EBITDA, cash flows, net income, revenues or, in limited instances, book value or liquidation value. All of these factors may be subject to adjustments based upon the particular circumstances of a portfolio company or our actual investment position. For example, adjustments to EBITDA may take into account compensation to previous owners or acquisition, recapitalization, restructuring or other related items.
Our board of directors may also look to private merger and acquisition statistics, public trading multiples discounted for illiquidity and other factors, valuations implied by third-party investments in the portfolio companies or industry practices in determining fair value. Our board of directors may also consider the size and scope of a portfolio company and its specific strengths and weaknesses, and may apply discounts or premiums, where and as appropriate, due to the higher (or lower) financial risk and/or the size of portfolio companies relative to comparable firms, as well as such other factors as our board of directors, in consultation with any third-party valuation firm, if applicable, may consider relevant in assessing fair value. Generally, the value of our equity interests in public companies for which market quotations are readily available is based upon the most recent closing public market price. Portfolio securities that carry certain restrictions on sale are typically valued at a discount from the public market value of the security.
When we receive warrants or other equity securities at nominal or no additional cost in connection with an investment in a debt security, the cost basis in the investment will be allocated between the debt securities and any such warrants or other equity securities received at the time of origination. Our board of directors subsequently values these warrants or other equity securities received at fair value.
The fair values of our investments are determined in good faith by our board of directors. Our board of directors is solely responsible for the valuation of our portfolio investments at fair value as determined in good faith pursuant to our valuation policy and consistently applied valuation process.
90
Table of Contents
Our investments as of December 31, 2014 consisted primarily of debt securities that were acquired directly from the issuer. Forty-one senior secured loan investments, one senior secured bond investment, eleven subordinated debt investments and one collateralized security, for which broker quotes were not available, were valued by an independent valuation firm, which determined the fair value of such investments by considering, among other factors, the borrower’s ability to adequately service its debt, prevailing interest rates for like investments, expected cash flows, call features and other relevant terms of the debt. Except as described below, all of our equity/other investments were valued by the same independent valuation firm, which determined the fair value of such investments by considering, among other factors, contractual rights ascribed to such investments, as well as various income scenarios and multiples of EBITDA, cash flows, net income, revenues or, in limited instances, book value or liquidation value. One equity investment which is traded on an active public market was valued at its closing price as of December 31, 2014. One senior secured loan investment and two collateralized loan securities which were newly issued and purchased near December 31, 2014, were valued at cost as our board of directors determined that the cost of each such investment was the best indication of its fair value. Except as described above, we valued our other investments, including three equity/other investments, by using the midpoint of the prevailing bid and ask prices from dealers on the date of the relevant period end, which were provided by independent third-party pricing services and screened for validity by such services.
Our investments as of December 31, 2013 consisted primarily of debt securities that are traded on a private over-the-counter market for institutional investors. Except as described below, we valued our investments by using the midpoint of the prevailing bid and ask prices from dealers on the date of the relevant period end, which were provided by independent third-party pricing services and screened for validity by such services. Twenty-seven senior secured loan investments, six subordinated debt investments and one collateralized security, for which broker quotes were not available, were valued by an independent valuation firm, which determined the fair value of such investments by considering, among other factors, the borrower’s ability to adequately service its debt, prevailing interest rates for like investments, call features and other relevant terms of the debt. Except as described below, all of our equity/other investments were valued by the same independent valuation firm, which determined the fair value of such investments by considering, among other factors, contractual rights ascribed to such investments, as well as various income scenarios and multiples of EBITDA, cash flows, net income, revenues or, in limited instances, book value or liquidation value. Also, one equity investment which is traded on an active public market was valued at its closing price as of December 31, 2013.
We periodically benchmark the bid and ask prices we receive from the third-party pricing services and/or dealers, as applicable, against the actual prices at which we purchase and sell our investments. Based on the results of the benchmark analysis and the experience of our management in purchasing and selling these investments, we believe that these prices are reliable indicators of fair value. However, because of the private nature of this marketplace (meaning actual transactions are not publicly reported), we believe that these valuation inputs are classified as Level 3 within the fair value hierarchy. We may also use other methods, including the use of an independent valuation firm, to determine fair value for securities for which we cannot obtain prevailing bid and ask prices through third-party pricing services or independent dealers, or where our board of directors otherwise determines that the use of other methods is appropriate. We periodically benchmark the valuations provided by the independent valuation firm against the actual prices at which we purchase and sell our investments. Our valuation committee and board of directors reviewed and approved the valuation determinations made with respect to these investments in a manner consistent with our valuation process.
Revenue Recognition
Security transactions are accounted for on the trade date. We record interest income on an accrual basis to the extent that we expect to collect such amounts. We record dividend income on the ex-dividend date. We do not accrue as a receivable interest or dividends on loans and securities if we have reason to doubt our ability to collect such income. Loan origination fees, original issue discount and market discount are capitalized and we amortize such amounts as interest income over the respective term of the loan or security. Upon the prepayment
91
Table of Contents
of a loan or security, any unamortized loan origination fees and original issue discount are recorded as interest income. Structuring and other upfront fees are recorded as fee income when earned. We record prepayment premiums on loans and securities as fee income when we receive such amounts.
Net Realized Gains or Losses, Net Change in Unrealized Appreciation or Depreciation and Net Change in Unrealized Gains or Losses on Foreign Currency
Gains or losses on the sale of investments are calculated by using the specific identification method. We measure realized gains or losses by the difference between the net proceeds from the repayment or sale and the amortized cost basis of the investment, without regard to unrealized appreciation or depreciation previously recognized, but considering unamortized upfront fees. Net change in unrealized appreciation or depreciation reflects the change in portfolio investment values during the reporting period, including any reversal of previously recorded unrealized gains or losses when gains or losses are realized. Net change in unrealized gains or losses on foreign currency reflects the change in the value of receivables or accruals during the reporting period due to the impact of foreign currency fluctuations.
Capital Gains Incentive Fee
Pursuant to the terms of each of the 2008 investment advisory and administrative services agreement, the April 2014 investment advisory agreement and the July 2014 investment advisory agreement, the incentive fee on capital gains is determined and payable in arrears as of the end of each calendar year (or upon termination of such agreement). Such fee will equal 20.0% of our incentive fee capital gains (i.e., our realized capital gains on a cumulative basis from inception, calculated as of the end of the applicable period, net of all realized capital losses and unrealized capital depreciation on a cumulative basis), less the aggregate amount of any previously paid capital gains incentive fees. On a quarterly basis, we accrue for the capital gains incentive fee by calculating such fee as if it were due and payable as of the end of such period.
While none of the 2008 investment advisory and administrative services agreement, the April 2014 investment advisory agreement or the July 2014 investment advisory agreement include or contemplate the inclusion of unrealized gains in the calculation of the capital gains incentive fee, pursuant to an interpretation of an American Institute of Certified Public Accountants, or AICPA, Technical Practice Aid for investment companies, commencing during the quarter ended December 31, 2010, we changed our methodology for accruing for this incentive fee to include unrealized gains in the calculation of the capital gains incentive fee expense and related accrued capital gains incentive fee. This accrual reflects the incentive fees that would be payable to FB Advisor if our entire portfolio was liquidated at its fair value as of the balance sheet date even though FB Advisor is not entitled to an incentive fee with respect to unrealized gains unless and until such gains are actually realized.
Subordinated Income Incentive Fee
Pursuant to the terms of each of the investment advisory and administrative services agreement, dated February 12, 2008, or the 2008 investment advisory and administrative services agreement, between us and FB Advisor, the amended and restated investment advisory agreement, dated April 16, 2014, or the April 2014 investment advisory agreement, between us and FB Advisor, and the July 2014 investment advisory agreement, FB Advisor may also be entitled to receive a subordinated incentive fee on income. The subordinated incentive fee on income under the 2008 investment advisory and administrative services agreement, which was calculated and payable quarterly in arrears, equaled 20.0% of our “pre-incentive fee net investment income” for the immediately preceding quarter and was subject to a hurdle rate, expressed as a rate of return on adjusted capital, as defined in the 2008 investment advisory and administrative services agreement, equal to 2.0% per quarter, or an annualized hurdle rate of 8.0%. As a result, FB Advisor did not earn this incentive fee for any quarter until our pre-incentive fee net investment income for such quarter exceeded the hurdle rate of 2.0%. Once our pre-incentive fee net investment income in any quarter exceeded the hurdle rate, FB Advisor was entitled to a “catch-up” fee equal to the amount of the pre-incentive fee net investment income in excess of the hurdle rate, until our
92
Table of Contents
pre-incentive fee net investment income for such quarter equaled 2.5%, or 10.0% annually, of adjusted capital. Thereafter, FB Advisor received 20.0% of pre-incentive fee net investment income. Under the April 2014 investment advisory agreement, the subordinated incentive fee on income was calculated in the same manner, except that the hurdle rate used to compute the subordinated incentive fee on income was based on the value of our net assets rather than adjusted capital.
Under the July 2014 investment advisory agreement, the hurdle rate, expressed as a rate of return on the value of our net assets, was reduced from 2.0% to 1.875% per quarter, or an annualized hurdle rate of 7.5%. As a result, FB Advisor will not earn this incentive fee for any quarter until our pre-incentive fee net investment income for such quarter exceeds the hurdle rate of 1.875%. Once our pre-incentive fee net investment income in any quarter exceeds the hurdle rate, FB Advisor will be entitled to a “catch-up” fee equal to the amount of the pre-incentive fee net investment income in excess of the hurdle rate, until our pre-incentive fee net investment income for such quarter equals 2.34375%, or 9.375% annually, of net assets. Thereafter, FB Advisor will be entitled to receive 20.0% of pre-incentive fee net investment income.
Under both the April 2014 investment advisory agreement and the July 2014 investment advisory agreement, the subordinated incentive fee on income is subject to a total return requirement, which provides that no incentive fee in respect of our pre-incentive fee net investment income will be payable except to the extent that 20.0% of the cumulative net increase in net assets resulting from operations over the then-current and eleven preceding calendar quarters exceeds the cumulative incentive fees accrued and/or paid for the eleven preceding calendar quarters. Accordingly, any subordinated incentive fee on income that is payable in a calendar quarter will be limited to the lesser of (i) 20.0% of the amount by which our pre-incentive fee net investment income for such calendar quarter exceeds the applicable quarterly hurdle rate, subject to the “catch-up” provision, and (ii) (x) 20.0% of the cumulative net increase in net assets resulting from operations for the then-current and eleven preceding calendar quarters minus (y) the cumulative incentive fees accrued and/or paid for the eleven preceding calendar quarters. For the foregoing purpose, the “cumulative net increase in net assets resulting from operations” is the sum of our pre-incentive fee net investment income, base management fees, realized gains and losses and unrealized appreciation and depreciation for the then-current and eleven preceding calendar quarters. There will be no accumulation of amounts on the hurdle rate from quarter to quarter and, accordingly, there will be no clawback of amounts previously paid if subsequent quarters are below the applicable quarterly hurdle rate and there will be no delay of payment if prior quarters are below the applicable quarterly hurdle rate.
Uncertainty in Income Taxes
We evaluate our tax positions to determine if the tax positions taken meet the minimum recognition threshold in connection with accounting for uncertainties in income tax positions taken or expected to be taken for the purposes of measuring and recognizing tax benefits or liabilities in our consolidated financial statements. Recognition of a tax benefit or liability with respect to an uncertain tax position is required only when the position is “more likely than not” to be sustained assuming examination by taxing authorities. We recognize interest and penalties, if any, related to unrecognized tax liabilities as income tax expense in our consolidated statements of operations. During the years ended December 31, 2014, 2013 and 2012, we did not incur any interest or penalties.
Contractual Obligations
We have entered into agreements with FB Advisor to provide us with investment advisory and administrative services. Payments for investment advisory services under the July 2014 investment advisory agreement are equal to (a) an annual base management fee based on the average value of our gross assets and (b) an incentive fee based on our performance. FB Advisor, and to the extent it is required to provide such services, our investment sub-adviser, are reimbursed for administrative expenses incurred on our behalf. See “—Related Party Transactions—Compensation of the Investment Adviser” for a discussion of these agreements.
93
Table of Contents
For the years ended December 31, 2014, 2013 and 2012, we incurred $81,780, $90,247 and $68,059, respectively, in base management fees and $4,794, $5,165 and $5,297, respectively, in administrative services expenses under the agreements governing investment advisory and administrative services. In addition, FB Advisor is eligible to receive incentive fees based on the performance of our portfolio. During the years ended December 31, 2014, 2013 and 2012, we accrued a subordinated incentive fee on income of $58,122, $62,253 and $13,393, respectively, based upon the performance of our portfolio. During the year ended December 31, 2014, we paid FB Advisor $59,336 in subordinated incentive fees on income. As of December 31, 2014, subordinated incentive fees on income of $13,089 were payable to FB Advisor. During the year ended December 31, 2014, we reversed $9,468 of capital gains incentive fees based on the performance of our portfolio. During the year ended December 31, 2013 and 2012, we accrued $4,173 and $39,751, respectively, of capital gains incentive fees based on the performance of our portfolio, of which $2,583 and $27,960, respectively, was based on unrealized gains and $1,590 and $11,791, respectively, was based on realized gains. We paid FB Advisor $1,590 in capital gains incentive fees during the year ended December 31, 2014. As of December 31, 2014, we had accrued $21,075 in capital gains incentive fees, all of which was based on unrealized gains, and none of which is payable unless and until those gains are actually realized.
A summary of our significant contractual payment obligations for the repayment of outstanding borrowings under the Broad Street credit facility, the ING credit facility, the JPM Facility and the notes at December 31, 2014 is as follows:
| Payments Due By Period | ||||||||||||||||||||
| Total | Less than 1 year | 1-3 years | 3-5 years | More than 5 years | ||||||||||||||||
| Borrowings of Broad Street(1) |
$ | 65,808 | $ | 65,808 | — | — | — | |||||||||||||
| Borrowings under ING Credit Facility(2) |
$ | 123,019 | — | — | $ | 123,019 | — | |||||||||||||
| Borrowings of Race Street(3) |
$ | 950,000 | $ | 950,000 | — | — | — | |||||||||||||
| Borrowings under 4.000% Notes due 2019(4) |
$ | 400,000 | — | — | $ | 400,000 | — | |||||||||||||
| Borrowings under 4.250% Notes due 2020(5) |
$ | 325,000 | — | — | — | $ | 325,000 | |||||||||||||
| (1) | At December 31, 2014, $59,192 remained unused under the Broad Street credit facility. All such amounts will mature, and all accrued and unpaid interest thereunder will be due and payable, on December 18, 2015. |
| (2) | At December 31, 2014, $176,981 remained unused under the ING credit facility. All such amounts will mature, and all accrued and unpaid interest thereunder will be due and payable, on April 3, 2018. |
| (3) | At December 31, 2014, no amounts remained unused under the JPM Facility. Race Street will, on a quarterly basis, repurchase the Class A Notes sold to JPM under the JPM Facility and subsequently resell such Class A Notes to JPM. As of December 31, 2014, the final repurchase transaction was scheduled to occur no later than April 15, 2017. |
| (4) | All such amounts will mature, and all accrued and unpaid interest thereunder will be due and payable, on July 15, 2019. |
| (5) | All such amounts will mature, and all accrued and unpaid interest thereunder will be due and payable, on January 15, 2020. |
Off-Balance Sheet Arrangements
We currently have no off-balance sheet arrangements, including any risk management of commodity pricing or other hedging practices.
Recently Issued Accounting Standards
None.
94
Table of Contents
Related Party Transactions
Compensation of the Investment Adviser
Pursuant to the 2008 investment advisory and administrative services agreement, the April 2014 investment advisory agreement and the July 2014 investment advisory agreement, FB Advisor is entitled to an annual base management fee based on the average value of our gross assets and an incentive fee based on our performance. We commenced accruing fees under the 2008 investment advisory and administrative services agreement on January 2, 2009, upon commencement of our investment operations. Base management fees are paid on a quarterly basis in arrears. The annual base management fees under the 2008 investment advisory and administrative services agreement and the April 2014 investment advisory agreement were equal to 2.0% of the average value of our gross assets.
In anticipation of the listing of our shares of common stock on the NYSE, FB Advisor recommended that the April 2014 investment advisory agreement be further amended to (i) reduce the annualized hurdle rate used in connection with the calculation of the subordinated incentive fee on income, expressed as a rate of return on our net assets, from 8% to 7.5% and (ii) assuming the reduction to the hurdle rate was approved, reduce the base management fee from 2.0% to 1.75% of the average value of our gross assets. At a special meeting of stockholders that was adjourned on June 23, 2014 and reconvened on July 17, 2014, we received stockholder approval to amend and restate the April 2014 investment advisory agreement to reflect the amendments approved by our stockholders. On July 17, 2014, we entered into the July 2014 investment advisory agreement. While stockholder approval of the proposal was pending, FB Advisor agreed, effective April 1, 2014, to waive a portion of the base management fee to which it was entitled under the April 2014 investment advisory agreement so that the fee received equaled 1.75% of the average value of our gross assets.
The incentive fee, which had consisted of three parts under the 2008 investment advisory and administrative services agreement and consists of two parts under each of the April 2014 advisory agreement and July 2014 investment advisory agreement. The first part of the incentive fee, which is referred to as the subordinated incentive fee on income, is calculated and payable quarterly in arrears, and equals 20.0% of our “pre-incentive fee net investment income” for the immediately preceding quarter. Under the 2008 investment advisory and administrative services agreement the subordinated incentive fee on income was subject to a hurdle rate, expressed as a rate of return on adjusted capital, as defined in the 2008 investment advisory and administrative services agreement, equal to 2.0% per quarter, or an annualized hurdle rate of 8.0%. As a result, FB Advisor did not earn this incentive fee for any quarter until our pre-incentive fee net investment income for such quarter exceeded the hurdle rate of 2.0%. Once our pre-incentive fee net investment income in any quarter exceeded the hurdle rate, FB Advisor was entitled to a “catch-up” fee equal to the amount of the pre-incentive fee net investment income in excess of the hurdle rate, until our pre-incentive fee net investment income for such quarter equaled 2.5%, or 10.0% annually, of adjusted capital. Thereafter, FB Advisor received 20.0% of our pre-incentive fee net investment income. Under the April 2014 investment advisory agreement, the subordinated incentive fee on income was calculated in the same manner, except that the hurdle rate used to compute the subordinated incentive fee on income was based on the value of our net assets rather than adjusted capital.
Under the July 2014 investment advisory agreement, the hurdle rate, expressed as a rate of return on the value of our net assets, was reduced from 2.0% to 1.875% per quarter, or an annualized hurdle rate of 7.5%. As a result, FB Advisor will not earn this incentive fee for any quarter until our pre-incentive fee net investment income for such quarter exceeds the hurdle rate of 1.875%. Once our pre-incentive fee net investment income in any quarter exceeds the hurdle rate, FB Advisor will be entitled to a “catch-up” fee equal to the amount of our pre-incentive fee net investment income in excess of the hurdle rate, until our pre-incentive fee net investment income for such quarter equals 2.34375%, or 9.375% annually, of the value of our net assets. Thereafter, FB Advisor will be entitled to receive 20.0% of our pre-incentive fee net investment income.
Under both the April 2014 investment advisory agreement and the July 2014 investment advisory agreement, the subordinated incentive fee on income is subject to a total return requirement, which provides that no incentive fee in respect of our pre-incentive fee net investment income will be payable except to the extent
95
Table of Contents
that 20.0% of the cumulative net increase in net assets resulting from operations over the then-current and eleven preceding calendar quarters exceeds the cumulative incentive fees accrued and/or paid for the eleven preceding calendar quarters. Accordingly, any subordinated incentive fee on income that is payable in a calendar quarter will be limited to the lesser of (i) 20.0% of the amount by which our pre-incentive fee net investment income for such calendar quarter exceeds the applicable quarterly hurdle rate, subject to the “catch-up” provision, and (ii) (x) 20.0% of the cumulative net increase in net assets resulting from operations for the then-current and eleven preceding calendar quarters minus (y) the cumulative incentive fees accrued and/or paid for the eleven preceding calendar quarters. For the foregoing purpose, the “cumulative net increase in net assets resulting from operations” is the sum of our pre-incentive fee net investment income, base management fees, realized gains and losses and unrealized appreciation and depreciation for the then-current and eleven preceding calendar quarters. There will be no accumulation of amounts on the hurdle rate from quarter to quarter and, accordingly, there will be no clawback of amounts previously paid if subsequent quarters are below the applicable quarterly hurdle rate and there will be no delay of payment if prior quarters are below the applicable quarterly hurdle rate.
The second part of the incentive fee, which is referred to as the incentive fee on capital gains, is determined and payable in arrears as of the end of each calendar year (or upon termination of the July 2014 investment advisory agreement). This fee equals 20.0% of our incentive fee capital gains, which equal our realized capital gains on a cumulative basis from inception, calculated as of the end of the applicable period, computed net of all realized capital losses and unrealized capital depreciation on a cumulative basis, less the aggregate amount of any previously paid capital gain incentive fees. We accrue for the capital gains incentive fee, which, if earned, is paid annually. We accrue the incentive fee based on net realized and unrealized gains; however, the fee payable to FB Advisor is based on realized gains and no such fee is payable with respect to unrealized gains unless and until such gains are actually realized. The methodology for calculating the capital gains incentive fee is identical under the 2008 investment advisory and administrative services agreement, the April 2014 investment advisory agreement and the July 2014 investment advisory agreement.
The third part of the incentive fee under the 2008 investment advisory and administrative services agreement was referred to as the subordinated liquidation incentive fee, which equaled 20.0% of the net proceeds from a liquidation of our assets in excess of adjusted capital, as calculated immediately prior to liquidation. The April 2014 investment advisory agreement and the July 2014 investment advisory agreement do not include the subordinated liquidation incentive fee.
Pursuant to the 2008 investment advisory and administrative services agreement, we reimbursed FB Advisor for expenses necessary to perform services related to our administration and operations. The amount of this reimbursement was set at the lesser of (1) FB Advisor’s actual costs incurred in providing such services and (2) the amount that we estimated it would be required to pay alternative service providers for comparable services in the same geographic location. FB Advisor was required to allocate the cost of such services to us based on factors such as total assets, revenues, time allocations and/or other reasonable metrics. Our board of directors then assessed the reasonableness of such reimbursements based on the breadth, depth and quality of such services as compared to the estimated cost to us of obtaining similar services from third-party providers known to be available. In addition, our board of directors considered whether any single third-party service provider would be capable of providing all such services at comparable cost and quality. Finally, our board of directors compared the total amount paid to FB Advisor for such services as a percentage of our net assets to the same ratio as reported by other comparable BDCs.
Pursuant to the administration agreement, we reimburse FB Advisor for expenses necessary to perform services related to our administration and operations, including FB Advisor’s allocable portion of the compensation and related expenses of certain personnel of Franklin Square Holdings providing administrative services to us on behalf of FB Advisor. We reimburse FB Advisor no less than quarterly for all costs and expenses incurred by FB Advisor in performing its obligations and providing personnel and facilities under the administration agreement. FB Advisor allocates the cost of such services to us based on factors such as total assets, revenues, time allocations and/or other reasonable metrics. Our board of directors reviews the
96
Table of Contents
methodology employed in determining how the expenses are allocated to us and the proposed allocation of administrative expenses among us and certain affiliates of FB Advisor. Our board of directors then assesses the reasonableness of such reimbursements for expenses allocated to us based on the breadth, depth and quality of such services as compared to the estimated cost to us of obtaining similar services from third-party service providers known to be available. In addition, our board of directors considers whether any single third-party service provider would be capable of providing all such services at comparable cost and quality. Finally, our board of directors compares the total amount paid to FB Advisor for such services as a percentage of our net assets to the same ratio as reported by other comparable BDCs.
The dealer manager for our continuous public offering was FS2, which is one of our affiliates. Under the dealer manager agreement among us, FB Advisor and FS2, FS2 was entitled to receive sales commissions and dealer manager fees in connection with the sale of shares of common stock in our continuous public offering, all or a portion of which were re-allowed to selected broker-dealers. The dealer manager agreement terminated in connection with the closing of our continuous public offering in May 2012.
The following table describes the fees and expenses accrued under the 2008 investment advisory and administrative services agreement, the April 2014 investment advisory agreement, the July 2014 investment advisory agreement and the administration agreement, as applicable, and the dealer manager agreement during the years ended December 31, 2014, 2013 and 2012:
| Year Ended December 31, | ||||||||||||||||
| Related Party |
Source Agreement |
Description |
2014 | 2013 | 2012 | |||||||||||
| FB Advisor |
2008 Investment Advisory and Administrative Services Agreement, April 2014 Investment Advisory Agreement and July 2014 Investment Advisory Agreement | Base Management Fee(1) | $ | 81,780 | $ | 90,247 | $ | 68,059 | ||||||||
| FB Advisor |
2008 Investment Advisory and Administrative Services Agreement, April 2014 Investment Advisory Agreement and July 2014 Investment Advisory Agreement | Capital Gains Incentive Fee(2) | $ | (9,468 | ) | $ | 4,173 | $ | 39,751 | |||||||
| FB Advisor |
2008 Investment Advisory and Administrative Services Agreement, April 2014 Investment Advisory Agreement and July 2014 Investment Advisory Agreement | Subordinated Incentive Fee on Income(3) | $ | 58,122 | $ | 62,253 | $ | 13,393 | ||||||||
| FB Advisor |
2008 Investment Advisory and Administrative Services Agreement, April 2014 Investment Advisory Agreement and Administration Agreement | Administrative Services Expenses(4) | $ | 4,794 | $ | 5,165 | $ | 5,297 | ||||||||
|
FS2 |
Dealer Manager Agreement | Dealer Manager Fee(5) | $ | — | $ | — | $ | 15,842 | ||||||||
| (1) | FB Advisor agreed, effective April 1, 2014, to waive a portion of the base management fee to which it was entitled under the April 2014 investment advisory agreement so that the fee received equaled 1.75% of the average value of our gross assets. As a result, the amount shown for the year ended December 31, 2014 is net of waivers of $2,837. During the years ended December 31, 2014, 2013 and 2012, $84,920, $89,054, and $56,124, respectively, in base management fees were paid to FB Advisor. As of December 31, 2014, $19,560 in base management fees were payable to FB Advisor. |
| (2) | During the year ended December 31, 2014, we reversed capital gains incentive fees of $9,468 based on the performance of our portfolio. During the years ended December 31, 2013 and 2012, we accrued capital gains incentive fees of $4,173 and $39,751 based on the performance of our portfolio, of which $2,583 and $27,960 were based on unrealized gains and $1,590 and $11,791 were based on realized gains, respectively. No capital gains incentive fees are actually payable by us with respect to unrealized gains unless and until |
97
Table of Contents
| those gains are actually realized. We paid FB Advisor $1,590 in capital gains incentive fees during the year ended December 31, 2014. As of December 31, 2014, $21,075 in capital gains incentive fees were accrued, all of which was based on unrealized gains, and none of which is payable unless and until those gains are actually realized. |
| (3) | During the year ended December 31, 2014, $59,336 of subordinated incentive fees on income were paid to FB Advisor. As of December 31, 2014, a subordinated incentive fee on income of $13,089 was payable to FB Advisor. |
| (4) | During the years ended December 31, 2014, 2013 and 2012, $3,849, $4,463 and $4,772, respectively, of administrative services expenses related to the allocation of costs of administrative personnel for services rendered to us by FB Advisor and the remainder related to other reimbursable expenses. We paid $4,537, $4,959 and $4,504, respectively, in administrative services expenses to FB Advisor during the years ended December 31, 2014, 2013 and 2012. |
| (5) | Represents aggregate dealer manager fees retained by FS2 and not re-allowed to selected broker-dealers. |
See Note 4 to our consolidated financial statements contained in this annual report on Form 10-K for additional information regarding our related party transactions and relationships, including our exemptive relief order, our terminated expense reimbursement agreement and our trademark license agreement with Franklin Square Holdings.
Potential Conflicts of Interest
FB Advisor’s senior management team is comprised of substantially the same personnel as the senior management teams of FS Investment Advisor, LLC, FSIC II Advisor, LLC, FSIC III Advisor, LLC and FS Global Advisor, LLC, the investment advisers to certain other BDCs and a closed-end management investment company sponsored by Franklin Square Holdings. As a result, such personnel provide investment advisory services to us and each of FS Energy and Power Fund, FS Investment Corporation II, FS Investment Corporation III and FS Global Credit Opportunities Fund. While none of FB Advisor, FS Investment Advisor, LLC, FSIC II Advisor, LLC, FSIC III Advisor, LLC or FS Global Advisor, LLC, is currently making private corporate debt investments for clients other than us, FS Energy and Power Fund, FS Investment Corporation II, FS Investment Corporation III or FS Global Credit Opportunities Fund, respectively, any, or all, may do so in the future. In the event that FB Advisor undertakes to provide investment advisory services to other clients in the future, it intends to allocate investment opportunities in a fair and equitable manner consistent with our investment objectives and strategies, if necessary, so that we will not be disadvantaged in relation to any other client of FB Advisor or its management team. In addition, even in the absence of FB Advisor retaining additional clients, it is possible that some investment opportunities may be provided to FS Energy and Power Fund, FS Investment Corporation II, FS Investment Corporation III and/or FS Global Credit Opportunities Fund rather than to us.
| Item 7A. | Quantitative and Qualitative Disclosures About Market Risk. |
We are subject to financial market risks, including changes in interest rates. As of December 31, 2014, 69.0% of our portfolio investments (based on fair value) paid variable interest rates, 23.3% paid fixed interest rates, 2.9% were income producing equity or other investments, and the remaining 4.8% consisted of non-income producing equity or other investments. A rise in the general level of interest rates can be expected to lead to higher interest rates applicable to any variable rate investments we hold and to declines in the value of any fixed rate investments we hold. However, many of our variable rate investments provide for an interest rate floor, which may prevent our interest income from increasing until benchmark interest rates increase beyond a threshold amount. To the extent that a substantial portion of our investments may be in variable rate investments, an increase in interest rates beyond this threshold would make it easier for us to meet or exceed the hurdle rate applicable to the subordinated incentive fee on income, and may result in a substantial increase in our net investment income and to the amount of incentive fees payable to FB Advisor with respect to our increased pre-incentive fee net investment income.
98
Table of Contents
Pursuant to the terms of the Broad Street credit facility and the ING credit facility, Broad Street and the Company, respectively, borrow at a floating rate based on a benchmark interest rate. Under the terms of the JPM Facility, Race Street pays interest to JPM at a fixed rate. Under the terms of the indenture governing the notes, the Company pays interest to the holders of the notes at a fixed rate. To the extent that any present or future credit facilities or other financing arrangements that we or any of our subsidiaries enter into are based on a floating interest rate, we will be subject to risks relating to changes in market interest rates. In periods of rising interest rates when we or our subsidiaries have such debt outstanding, or financing arrangements in effect, our interest expense would increase, which could reduce our net investment income, especially to the extent we hold fixed rate investments.
The following table shows the effect over a twelve month period of changes in interest rates on our interest income, interest expense and net interest income, assuming no changes in the composition of our investment portfolio, including the accrual status of our investments, and our financing arrangements in effect as of December 31, 2014 (dollar amounts are presented in thousands):
| Basis Point Change in Interest Rates |
Increase (Decrease) in Interest Income(1) |
Increase (Decrease) in Interest Expense |
Increase (Decrease) in Net Interest Income |
Percentage Change in Net Interest Income |
||||||||||||
| Down 25 basis points |
$ | (824 | ) | $ | (474 | ) | $ | (350 | ) | (0.1 | )% | |||||
| Current LIBOR |
— | — | — | — | ||||||||||||
| Up 100 basis points |
5,478 | 1,895 | 3,583 | 1.0 | % | |||||||||||
| Up 300 basis points |
60,637 | 5,684 | 54,953 | 15.7 | % | |||||||||||
| Up 500 basis points |
118,453 | 9,474 | 108,979 | 31.1 | % | |||||||||||
| (1) | Assumes no defaults or prepayments by portfolio companies over the next twelve months. |
We expect that our long-term investments will be financed primarily with equity and debt. If deemed prudent, we may use interest rate risk management techniques in an effort to minimize our exposure to interest rate fluctuations. These techniques may include various interest rate hedging activities to the extent permitted by the 1940 Act. Adverse developments resulting from changes in interest rates or hedging transactions could have a material adverse effect on our business, financial condition and results of operations. During the years ended December 31, 2014, 2013 and 2012 we did not engage in interest rate hedging activities.
In addition, we may have risk regarding portfolio valuation. See “Item 2. Management’s Discussion and Analysis of Financial Condition and Results of Operations—Critical Accounting Policies—Valuation of Portfolio Investments.”
99
Table of Contents
| Item 8. | Financial Statements and Supplementary Data. |
100
Table of Contents
MANAGEMENT’S REPORT ON INTERNAL CONTROL OVER FINANCIAL REPORTING
Our management is responsible for establishing and maintaining adequate internal control over financial reporting. In connection with the preparation of our annual financial statements, management has conducted an assessment of the effectiveness of our internal control over financial reporting based on the framework set forth in Internal Control—Integrated Framework issued by the Committee of Sponsoring Organizations of the Treadway Commission in 2013 (“COSO”). Management’s assessment included an evaluation of the design of our internal control over financial reporting and testing of the operational effectiveness of those controls. Based on this evaluation, we have concluded that, as of December 31, 2014, our internal control over financial reporting was effective to provide reasonable assurance regarding the reliability of financial reporting and the preparation of financial statements for external purposes in accordance with U.S. generally accepted accounting principles. Our internal control over financial reporting as of December 31, 2014 has been audited by our independent registered public accounting firm.
101
Table of Contents
REPORT OF INDEPENDENT REGISTERED PUBLIC ACCOUNTING FIRM
To the Board of Directors and Stockholders
FS Investment Corporation
Philadelphia, Pennsylvania
We have audited FS Investment Corporation’s internal control over financial reporting as of December 31, 2014, based on criteria established in Internal Control-Integrated Framework issued by the Committee of Sponsoring Organizations of the Treadway Commission in 2013. FS Investment Corporation’s management is responsible for maintaining effective internal control over financial reporting and for its assessment of the effectiveness of internal control over financial reporting included in the accompanying Management’s Report on Internal Control Over Financial Reporting. Our responsibility is to express an opinion on the company’s internal control over financial reporting based on our audit.
We conducted our audit in accordance with the standards of the Public Company Accounting Oversight Board (United States). Those standards require that we plan and perform the audit to obtain reasonable assurance about whether effective internal control over financial reporting was maintained in all material respects. Our audit included obtaining an understanding of internal control over financial reporting, assessing the risk that a material weakness exists, and testing and evaluating the design and operating effectiveness of internal control based on the assessed risk. Our audit also included performing such other procedures as we considered necessary in the circumstances. We believe that our audit provides a reasonable basis for our opinion.
A company’s internal control over financial reporting is a process designed to provide reasonable assurance regarding the reliability of financial reporting and the preparation of financial statements for external purposes in accordance with generally accepted accounting principles. A company’s internal control over financial reporting includes those policies and procedures that (a) pertain to the maintenance of records that, in reasonable detail, accurately and fairly reflect the transactions and dispositions of the assets of the company; (b) provide reasonable assurance that transactions are recorded as necessary to permit preparation of financial statements in accordance with generally accepted accounting principles, and that receipts and expenditures of the company are being made only in accordance with authorizations of management and directors of the company; and (c) provide reasonable assurance regarding prevention or timely detection of unauthorized acquisition, use, or disposition of the company’s assets that could have a material effect on the financial statements.
Because of its inherent limitations, internal control over financial reporting may not prevent or detect misstatements. Also, projections of any evaluation of effectiveness to future periods are subject to the risk that controls may become inadequate because of changes in conditions, or that the degree of compliance with the policies or procedures may deteriorate.
In our opinion, FS Investment Corporation maintained, in all material respects, effective internal control over financial reporting as of December 31, 2014, based on criteria established in Internal Control-Integrated Framework issued by the Committee of Sponsoring Organizations of the Treadway Commission in 2013.
We have also audited, in accordance with the standards of the Public Company Accounting Oversight Board (United States), the consolidated balance sheets, including the consolidated schedules of investments, of FS Investment Corporation as of December 31, 2014 and 2013, and the related consolidated statements of operations, changes in net assets and cash flows for each of the three years in the period ended December 31, 2014 and our report dated March 2, 2015 expressed an unqualified opinion.
/s/ McGladrey LLP
Blue Bell, Pennsylvania
March 2, 2015
102
Table of Contents
REPORT OF INDEPENDENT REGISTERED PUBLIC ACCOUNTING FIRM
To the Board of Directors and Stockholders
FS Investment Corporation
Philadelphia, Pennsylvania
We have audited the accompanying consolidated balance sheets, including the consolidated schedules of investments, of FS Investment Corporation (the “Company”) as of December 31, 2014 and 2013, and the related consolidated statements of operations, changes in net assets and cash flows for each of the three years in the period ended December 31, 2014. These financial statements are the responsibility of the Company’s management. Our responsibility is to express an opinion on these financial statements based on our audits.
We conducted our audits in accordance with the standards of the Public Company Accounting Oversight Board (United States). Those standards require that we plan and perform the audit to obtain reasonable assurance about whether the financial statements are free of material misstatement. An audit also includes examining, on a test basis, evidence supporting the amounts and disclosures in the financial statements, assessing the accounting principles used and significant estimates made by management, as well as evaluating the overall financial statement presentation. Our procedures included confirmation of securities owned as of December 31, 2014 and 2013 by correspondence with the custodians and brokers, or by other appropriate auditing procedures where replies from custodians and brokers were not received. We believe that our audits provide a reasonable basis for our opinion.
In our opinion, the consolidated financial statements referred to above present fairly, in all material respects, the financial position of FS Investment Corporation as of December 31, 2014 and 2013 and the results of their operations, their cash flows and the changes in their net assets for each of the three years in the period ended December 31, 2014, in conformity with U.S. generally accepted accounting principles.
We have also audited, in accordance with the standards of the Public Company Accounting Oversight Board (United States), FS Investment Corporation’s internal control over financial reporting as of December 31, 2014, based on criteria established in Internal Control-Integrated Framework issued by the Committee of Sponsoring Organizations of the Treadway Commission in 2013, and our report dated March 2, 2015 expressed an unqualified opinion on the effectiveness of FS Investment Corporation’s internal control over financial reporting.
/s/ McGladrey LLP
Blue Bell, Pennsylvania
March 2, 2015
103
Table of Contents
Part I—FINANCIAL INFORMATION
FS Investment Corporation
(in thousands, except share and per share amounts)
| December 31, | ||||||||
| 2014 | 2013 | |||||||
| Assets |
||||||||
| Investments, at fair value—unaffiliated (amortized cost—$4,164,166 and $4,054,085, respectively) |
$ | 4,168,654 | $ | 4,137,581 | ||||
| Investments, at fair value—affiliated (amortized cost—$17,931 and $0, respectively) |
14,793 | — | ||||||
| Cash |
96,844 | 227,328 | ||||||
| Receivable for investments sold and repaid |
8,976 | 26,722 | ||||||
| Interest receivable |
51,814 | 47,622 | ||||||
| Deferred financing costs |
13,097 | 5,168 | ||||||
| Prepaid expenses and other assets |
708 | 156 | ||||||
|
|
|
|
|
|||||
| Total assets |
$ | 4,354,886 | $ | 4,444,577 | ||||
|
|
|
|
|
|||||
| Liabilities |
||||||||
| Payable for investments purchased |
$ | 28,095 | $ | 23,423 | ||||
| Credit facilities payable |
188,827 | 723,682 | ||||||
| Unsecured notes payable |
725,000 | — | ||||||
| Repurchase agreement payable(1) |
950,000 | 950,000 | ||||||
| Stockholder distributions payable |
17,885 | 18,671 | ||||||
| Management fees payable |
19,560 | 22,700 | ||||||
| Accrued capital gains incentive fees(2) |
21,075 | 32,133 | ||||||
| Subordinated income incentive fees payable(2) |
13,089 | 14,303 | ||||||
| Administrative services expense payable |
1,410 | 1,153 | ||||||
| Interest payable |
15,850 | 10,563 | ||||||
| Directors’ fees payable |
296 | 254 | ||||||
| Deferred financing costs payable |
473 | — | ||||||
| Other accrued expenses and liabilities |
6,340 | 6,703 | ||||||
|
|
|
|
|
|||||
| Total liabilities |
1,987,900 | 1,803,585 | ||||||
|
|
|
|
|
|||||
| Commitments and contingencies(3) |
— | — | ||||||
| Stockholders’ equity |
||||||||
| Preferred stock, $0.001 par value, 50,000,000 shares authorized, none issued and outstanding |
— | — | ||||||
| Common stock, $0.001 par value, 450,000,000 shares authorized, 240,896,559 and 259,320,161 shares issued and outstanding, respectively |
241 | 259 | ||||||
| Capital in excess of par value |
2,258,548 | 2,466,753 | ||||||
| Accumulated undistributed net realized gains on investments and gain/loss on foreign currency(4) |
33,758 | 55,344 | ||||||
| Accumulated undistributed (distributions in excess of) net investment income(4) |
68,658 | 35,322 | ||||||
| Net unrealized appreciation (depreciation) on investments and gain/loss on foreign currency |
5,781 | 83,314 | ||||||
|
|
|
|
|
|||||
| Total stockholders’ equity |
2,366,986 | 2,640,992 | ||||||
|
|
|
|
|
|||||
| Total liabilities and stockholders’ equity |
$ | 4,354,886 | $ | 4,444,577 | ||||
|
|
|
|
|
|||||
| Net asset value per share of common stock at year end |
$ | 9.83 | $ | 10.18 | ||||
|
|
|
|
|
|||||
| (1) | See Note 8 for a discussion of the Company’s repurchase transaction. |
| (2) | See Note 2 and Note 4 for a discussion of the methodology employed by the Company in calculating the capital gains incentive fees and subordinated income incentive fees. |
| (3) | See Note 9 for a discussion of the Company’s commitments and contingencies. |
| (4) | See Note 5 for a discussion of the sources of distributions paid by the Company. |
See notes to consolidated financial statements.
104
Table of Contents
FS Investment Corporation
Consolidated Statements of Operations
(in thousands, except share and per share amounts)
| Year Ended December 31, | ||||||||||||
| 2014 | 2013 | 2012 | ||||||||||
| Investment income |
||||||||||||
| Interest income—unaffiliated |
$ | 418,749 | $ | 427,510 | $ | 287,875 | ||||||
| Fee income—unaffiliated |
44,961 | 37,084 | 15,291 | |||||||||
| Dividend income—unaffiliated |
810 | 9,972 | 56 | |||||||||
| Dividend income—affiliated |
299 | — | — | |||||||||
|
|
|
|
|
|
|
|||||||
| Total investment income |
464,819 | 474,566 | 303,222 | |||||||||
|
|
|
|
|
|
|
|||||||
| Operating expenses |
||||||||||||
| Management fees(1) |
84,617 | 90,247 | 68,059 | |||||||||
| Capitals gains incentive fees(2) |
(9,468 | ) | 4,173 | 39,751 | ||||||||
| Subordinated income incentive fees(2) |
58,122 | 62,253 | 13,393 | |||||||||
| Administrative services expenses |
4,794 | 5,165 | 5,297 | |||||||||
| Stock transfer agent fees |
1,037 | 2,820 | 3,641 | |||||||||
| Accounting and administrative fees |
1,223 | 1,390 | 1,495 | |||||||||
| Interest expense |
64,804 | 50,763 | 30,227 | |||||||||
| Directors’ fees |
1,027 | 943 | 933 | |||||||||
| Listing advisory fees |
5,043 | — | — | |||||||||
| Other general and administrative expenses |
9,049 | 6,094 | 6,019 | |||||||||
|
|
|
|
|
|
|
|||||||
| Total operating expenses |
220,248 | 223,848 | 168,815 | |||||||||
| Management fee waiver(1) |
(2,837 | ) | — | — | ||||||||
|
|
|
|
|
|
|
|||||||
| Net expenses |
217,411 | 223,848 | 168,815 | |||||||||
|
|
|
|
|
|
|
|||||||
| Net investment income before taxes |
247,408 | 250,718 | 134,407 | |||||||||
| Excise taxes |
5,400 | 5,742 | 500 | |||||||||
|
|
|
|
|
|
|
|||||||
| Net investment income |
242,008 | 244,976 | 133,907 | |||||||||
|
|
|
|
|
|
|
|||||||
| Realized and unrealized gain/loss |
||||||||||||
| Net realized gain (loss) on investments—unaffiliated |
30,607 | 47,014 | 47,008 | |||||||||
| Net realized gain (loss) on total return swap(3) |
— | — | 19,607 | |||||||||
| Net realized gain (loss) on foreign currency |
(301 | ) | (111 | ) | 407 | |||||||
| Net change in unrealized appreciation (depreciation) on investments—unaffiliated |
(79,008 | ) | (25,982 | ) | 127,399 | |||||||
| Net change in unrealized appreciation (depreciation) on investments—affiliated |
(3,138 | ) | — | — | ||||||||
| Net change in unrealized appreciation (depreciation) on total return swap(3) |
— | — | 1,996 | |||||||||
| Net change in unrealized gain (loss) on foreign currency |
4,613 | (57 | ) | (125 | ) | |||||||
|
|
|
|
|
|
|
|||||||
| Total net realized and unrealized gain (loss) on investments |
(47,227 | ) | 20,864 | 196,292 | ||||||||
|
|
|
|
|
|
|
|||||||
| Net increase (decrease) in net assets resulting from operations |
$ | 194,781 | $ | 265,840 | $ | 330,199 | ||||||
|
|
|
|
|
|
|
|||||||
| Per share information—basic and diluted |
||||||||||||
| Net increase (decrease) in net assets resulting from operations (Earnings per Share) |
$ | 0.78 | $ | 1.04 | $ | 1.45 | ||||||
|
|
|
|
|
|
|
|||||||
| Weighted average shares outstanding |
248,799,524 | 255,315,516 | 227,578,967 | |||||||||
|
|
|
|
|
|
|
|||||||
| (1) | See Note 4 for a discussion of the waiver by FB Income Advisor LLC, the Company’s investment adviser, of certain management fees to which it was otherwise entitled during the applicable period. |
| (2) | See Note 2 and Note 4 for a discussion of the methodology employed by the Company in calculating the capital gains incentive fees and subordinated income incentive fees. |
| (3) | On August 29, 2012, the Company terminated its total return swap agreement with Citibank, N.A. |
See notes to consolidated financial statements.
105
Table of Contents
FS Investment Corporation
Consolidated Statements of Changes in Net Assets
(in thousands)
| Year Ended December 31, | ||||||||||||
| 2014 | 2013 | 2012 | ||||||||||
| Operations |
||||||||||||
| Net investment income (loss) |
$ | 242,008 | $ | 244,976 | $ | 133,907 | ||||||
| Net realized gain (loss) on investments, total return swap and foreign currency(1) |
30,306 | 46,903 | 67,022 | |||||||||
| Net change in unrealized appreciation (depreciation) on investments |
(82,146 | ) | (25,982 | ) | 127,399 | |||||||
| Net change in unrealized appreciation (depreciation) on total return swap(1) |
— | — | 1,996 | |||||||||
| Net change in unrealized gain (loss) on foreign currency |
4,613 | (57 | ) | (125 | ) | |||||||
|
|
|
|
|
|
|
|||||||
| Net increase (decrease) in net assets resulting from operations |
194,781 | 265,840 | 330,199 | |||||||||
|
|
|
|
|
|
|
|||||||
| Stockholder distributions(2) |
||||||||||||
| Distributions from net investment income |
(196,227 | ) | (212,153 | ) | (144,364 | ) | ||||||
| Distributions from net realized gain on investments |
(71,629 | ) | — | (53,542 | ) | |||||||
|
|
|
|
|
|
|
|||||||
| Net decrease in net assets resulting from stockholder distributions |
(267,856 | ) | (212,153 | ) | (197,906 | ) | ||||||
|
|
|
|
|
|
|
|||||||
| Capital share transactions(3) |
||||||||||||
| Issuance of common stock |
— | — | 803,348 | |||||||||
| Reinvestment of stockholder distributions |
57,972 | 109,373 | 98,763 | |||||||||
| Repurchases of common stock |
(258,903 | ) | (33,806 | ) | (18,324 | ) | ||||||
| Offering costs |
— | — | (3,234 | ) | ||||||||
|
|
|
|
|
|
|
|||||||
| Net increase (decrease) in net assets resulting from capital share transactions |
(200,931 | ) | 75,567 | 880,553 | ||||||||
|
|
|
|
|
|
|
|||||||
| Total increase (decrease) in net assets |
(274,006 | ) | 129,254 | 1,012,846 | ||||||||
| Net assets at beginning of year |
2,640,992 | 2,511,738 | 1,498,892 | |||||||||
|
|
|
|
|
|
|
|||||||
| Net assets at end of year |
$ | 2,366,986 | $ | 2,640,992 | $ | 2,511,738 | ||||||
|
|
|
|
|
|
|
|||||||
| Accumulated undistributed (distributions in excess of) net investment income(2) |
$ | 68,658 | $ | 35,322 | $ | 4,307 | ||||||
|
|
|
|
|
|
|
|||||||
| (1) | On August 29, 2012, the Company terminated its total return swap agreement with Citibank, N.A. |
| (2) | See Note 5 for a discussion of the sources of distributions paid by the Company. |
| (3) | See Note 3 for a discussion of the Company’s capital share transactions. |
See notes to consolidated financial statements.
106
Table of Contents
FS Investment Corporation
Consolidated Statements of Cash Flows
(in thousands)
| Year Ended December 31, | ||||||||||||
| 2014 | 2013 | 2012 | ||||||||||
| Cash flows from operating activities |
||||||||||||
| Net increase (decrease) in net assets resulting from operations |
$ | 194,781 | $ | 265,840 | $ | 330,199 | ||||||
| Adjustments to reconcile net increase (decrease) in net assets resulting from operations to net cash provided by (used in) operating activities: |
||||||||||||
| Purchases of investments |
(2,178,075 | ) | (2,641,733 | ) | (3,863,334 | ) | ||||||
| Paid-in-kind interest |
(16,987 | ) | (7,715 | ) | (3,252 | ) | ||||||
| Proceeds from sales and repayments of investments |
2,121,939 | 2,510,887 | 1,971,447 | |||||||||
| Net realized (gain) loss on investments |
(30,607 | ) | (47,014 | ) | (47,008 | ) | ||||||
| Net change in unrealized (appreciation) depreciation on investments |
82,146 | 25,982 | (127,399 | ) | ||||||||
| Net change in unrealized (appreciation) depreciation on total return swap(1) |
— | — | (1,996 | ) | ||||||||
| Accretion of discount |
(24,282 | ) | (43,266 | ) | (20,818 | ) | ||||||
| Amortization of deferred financing costs |
7,314 | 2,567 | 2,035 | |||||||||
| (Increase) decrease in due from counterparty |
— | — | 69,684 | |||||||||
| (Increase) decrease in receivable for investments sold and repaid |
17,746 | (6,562 | ) | (18,756 | ) | |||||||
| (Increase) decrease in interest receivable |
(4,192 | ) | (2,911 | ) | (28,176 | ) | ||||||
| (Increase) decrease in receivable due on total return swap(1) |
— | — | 548 | |||||||||
| (Increase) decrease in prepaid expenses and other assets |
(552 | ) | 374 | (99 | ) | |||||||
| Increase (decrease) in payable for investments purchased |
4,672 | (55,997 | ) | 15,053 | ||||||||
| Increase (decrease) in management fees payable |
(3,140 | ) | 1,193 | 11,935 | ||||||||
| Increase (decrease) in accrued capital gains incentive fees |
(11,058 | ) | (7,618 | ) | 39,751 | |||||||
| Increase (decrease) in subordinated income incentive fees payable |
(1,214 | ) | 910 | 13,393 | ||||||||
| Increase (decrease) in administrative services expense payable |
257 | 206 | 793 | |||||||||
| Increase (decrease) in interest payable |
5,287 | 321 | 7,717 | |||||||||
| Increase (decrease) in directors’ fees payable |
42 | 254 | — | |||||||||
| Increase (decrease) in other accrued expenses and liabilities |
(363 | ) | 3,664 | 1,149 | ||||||||
|
|
|
|
|
|
|
|||||||
| Net cash provided by (used in) operating activities |
163,714 | (618 | ) | (1,647,134 | ) | |||||||
|
|
|
|
|
|
|
|||||||
| Cash flows from financing activities |
||||||||||||
| Issuance of common stock |
— | — | 803,348 | |||||||||
| Reinvestment of stockholder distributions |
57,972 | 109,373 | 98,763 | |||||||||
| Repurchases of common stock |
(258,903 | ) | (33,806 | ) | (18,324 | ) | ||||||
| Offering costs |
— | — | (3,234 | ) | ||||||||
| Stockholder distributions |
(268,642 | ) | (210,485 | ) | (191,446 | ) | ||||||
| Borrowings under credit facilities(2) |
386,173 | 17,050 | 773,046 | |||||||||
| Borrowings under unsecured notes(2) |
725,000 | — | — | |||||||||
| Repayments of credit facilities(2) |
(921,028 | ) | (266,414 | ) | (140,000 | ) | ||||||
| Borrowings under repurchase agreement(3) |
— | 273,333 | 462,381 | |||||||||
| Deferred financing costs paid |
(14,770 | ) | — | (9,219 | ) | |||||||
|
|
|
|
|
|
|
|||||||
| Net cash provided by (used in) financing activities |
(294,198 | ) | (110,949 | ) | 1,775,315 | |||||||
|
|
|
|
|
|
|
|||||||
| Total increase (decrease) in cash |
(130,484 | ) | (111,567 | ) | 128,181 | |||||||
| Cash at beginning of year |
227,328 | 338,895 | 210,714 | |||||||||
|
|
|
|
|
|
|
|||||||
| Cash at end of year |
$ | 96,844 | $ | 227,328 | $ | 338,895 | ||||||
|
|
|
|
|
|
|
|||||||
| Supplemental disclosure |
||||||||||||
| Local and excise taxes paid |
$ | 5,407 | $ | 1,347 | $ | 761 | ||||||
|
|
|
|
|
|
|
|||||||
| (1) | On August 29, 2012, the Company terminated its total return swap agreement with Citibank, N.A. |
| (2) | See Note 8 for a discussion of the Company’s credit facilities and unsecured notes. During the years ended December 31, 2014, 2013 and 2012, the Company paid $20,899, $23,815 and $8,827, respectively, in interest expense on the credit facilities. |
| (3) | See Note 8 for a discussion of the Company’s repurchase transaction. During the years ended December 31, 2014, 2013 and 2012, the Company paid $31,304, $24,060 and $11,648, respectively, in interest expense pursuant to the repurchase agreement. |
See notes to consolidated financial statements.
107
Table of Contents
FS Investment Corporation
Consolidated Schedule of Investments
As of December 31, 2014
(in thousands, except share amounts)
| Portfolio Company(a) |
Footnotes |
Industry |
Rate(b) |
Floor | Maturity | Principal
Amount(c) |
Amortized Cost |
Fair
Value(d) |
||||||||||||||
| Senior Secured Loans—First Lien—93.2% |
||||||||||||||||||||||
| A.P. Plasman Inc. |
(f)(g)(h)(i)(k) |
Capital Goods |
L+775 |
1.0% | 12/29/19 | $ | 137,875 | $ | 137,875 | $ | 137,875 | |||||||||||
| A.P. Plasman Inc. |
(i)(k)(p) |
Capital Goods |
L+775 |
1.0% | 12/29/19 | 36,919 | 36,919 | 36,919 | ||||||||||||||
| AccentCare, Inc. |
(i) |
Health Care Equipment & Services |
L+500 |
1.5% | 12/22/16 | 1,954 | 1,855 | 1,712 | ||||||||||||||
| Allen Systems Group, Inc. |
(f)(i) |
Software & Services |
L+1,425 |
1.0% | 12/14/17 | 1,539 | 1,718 | 1,897 | ||||||||||||||
| Allen Systems Group, Inc. |
(f)(i) |
Software & Services |
L+1,625 |
1.0% | 12/14/17 | 36,832 | 41,114 | 45,410 | ||||||||||||||
| Altus Power America, Inc. |
(i) |
Energy |
L+750 |
1.5% | 10/10/21 | 762 | 762 | 762 | ||||||||||||||
| Altus Power America, Inc. |
(i)(p) |
Energy |
L+750 |
1.5% | 10/10/21 | 2,363 | 2,363 | 2,363 | ||||||||||||||
| American Racing and Entertainment, LLC |
(f) |
Consumer Services |
L+700 |
7/1/15 | 12,500 | 12,500 | 12,484 | |||||||||||||||
| American Racing and Entertainment, LLC |
(f) |
Consumer Services |
9.0% |
7/1/15 | 7,750 | 7,750 | 7,769 | |||||||||||||||
| American Racing and Entertainment, LLC |
(f) |
Consumer Services |
L+800 |
1.0% | 7/1/18 | 5,495 | 5,495 | 5,516 | ||||||||||||||
| American Racing and Entertainment, LLC |
(f)(p) |
Consumer Services |
L+800 |
1.0% | 7/1/18 | 1,005 | 1,005 | 1,009 | ||||||||||||||
| AP Exhaust Acquisition, LLC |
(h) |
Automobiles & Components |
L+775 |
1.5% | 1/16/21 | 14,595 | 14,595 | 14,157 | ||||||||||||||
| Aspect Software, Inc. |
(i) |
Software & Services |
L+550 |
1.8% | 5/7/16 | 1,172 | 1,158 | 1,149 | ||||||||||||||
| Azure Midstream Energy LLC |
(i) |
Energy |
L+550 |
1.0% | 11/15/18 | 327 | 323 | 294 | ||||||||||||||
| BenefitMall Holdings, Inc. |
(h) |
Commercial & Professional Services |
L+725 |
1.0% | 11/24/20 | 15,000 | 15,000 | 15,000 | ||||||||||||||
| BenefitMall Holdings, Inc. |
(i)(p) |
Commercial & Professional Services |
L+725 |
1.0% | 11/24/20 | 5,455 | 5,455 | 5,455 | ||||||||||||||
| Boomerang Tube, LLC |
(i) |
Energy |
L+950 |
1.5% | 10/11/17 | 17,864 | 17,521 | 15,497 | ||||||||||||||
| Cadillac Jack, Inc. |
(f)(h)(i)(k) |
Consumer Services |
L+850 |
1.0% | 5/15/19 | 74,450 | 73,320 | 76,590 | ||||||||||||||
| Caesars Entertainment Operating Co., Inc. |
(e)(f)(k) |
Consumer Services |
L+575 |
3/1/17 | 12,621 | 11,822 | 11,073 | |||||||||||||||
| Caesars Entertainment Operating Co., Inc. |
(f)(k) |
Consumer Services |
L+675 |
3/1/17 | 2,363 | 2,266 | 2,077 | |||||||||||||||
| Caesars Entertainment Operating Co., Inc. |
(e)(f)(g)(i)(k) |
Consumer Services |
L+875 |
1.0% | 1/28/18 | 84,594 | 84,032 | 73,738 | ||||||||||||||
| Caesars Entertainment Resort Properties, LLC |
(e)(f)(i) |
Consumer Services |
L+600 |
1.0% | 10/11/20 | 72,178 | 68,410 | 67,727 | ||||||||||||||
| Corel Corp. |
(f)(g)(h)(i)(k) |
Software & Services |
L+825 |
6/7/19 | 151,063 | 151,063 | 151,063 | |||||||||||||||
| Corel Corp. |
(i)(k)(p) |
Software & Services |
Prime+725 |
6/7/18 | 10,000 | 10,000 | 10,000 | |||||||||||||||
| Corner Investment PropCo, LLC |
(f)(i) |
Consumer Services |
L+975 |
1.3% | 11/2/19 | 44,723 | 44,878 | 44,500 | ||||||||||||||
| CoSentry.Net, LLC |
(f)(h)(i) |
Software & Services |
L+800 |
1.3% | 12/31/19 | 57,945 | 57,945 | 58,235 | ||||||||||||||
| Crestwood Holdings LLC |
(i) |
Energy |
L+600 |
1.0% | 6/19/19 | 5,452 | 5,432 | 5,176 | ||||||||||||||
| Dent Wizard International Corp. |
(f)(h)(i) |
Commercial & Professional Services |
L+800 |
4/25/19 | 123,165 | 122,252 | 125,320 | |||||||||||||||
| Dent Wizard International Corp. |
(i)(p) |
Commercial & Professional Services |
Prime+325 |
4/25/19 | 5,000 | 5,000 | 5,000 | |||||||||||||||
| Eastman Kodak Co. |
(i) |
Consumer Durables & Apparel |
L+625 |
1.0% | 9/3/19 | 10,745 | 10,572 | 10,777 | ||||||||||||||
| Flanders Corp. |
(f)(h) |
Capital Goods |
L+950 |
1.5% | 5/14/18 | 35,993 | 35,444 | 36,218 | ||||||||||||||
| Fronton Holdings, LLC |
(f) |
Consumer Services |
15.0% |
4/30/19 | 3,736 | 3,703 | 3,736 | |||||||||||||||
| HBC Solutions, Inc. |
(f)(g)(i) |
Media |
L+875 |
1.5% | 2/4/18 | 84,990 | 84,990 | 84,990 | ||||||||||||||
| Industrial Group Intermediate Holdings, LLC |
(h) |
Materials |
L+800 |
1.3% | 5/31/20 | 13,894 | 13,894 | 13,894 | ||||||||||||||
See notes to consolidated financial statements.
108
Table of Contents
FS Investment Corporation
Consolidated Schedule of Investments (continued)
As of December 31, 2014
(in thousands, except share amounts)
| Portfolio Company(a) |
Footnotes |
Industry |
Rate(b) |
Floor | Maturity | Principal
Amount(c) |
Amortized Cost |
Fair
Value(d) |
||||||||||||||
| Industry City TI Lessor, L.P. |
(i) |
Consumer Services |
5.0%, 5.3% PIK (5.3% Max PIK) |
6/30/26 | $ | 24,885 | $ | 24,885 | $ | 24,512 | ||||||||||||
| Infiltrator Systems, Inc. |
(f)(g)(h)(i) |
Capital Goods |
L+841 |
1.3% | 10/31/19 | 226,000 | 225,860 | 224,870 | ||||||||||||||
| Intralinks, Inc. |
(f)(i)(k) |
Software & Services |
L+525 |
2.0% | 2/24/19 | 9,900 | 9,817 | 9,776 | ||||||||||||||
| Lantiq Deutschland GmbH |
(f)(i)(k) |
Software & Services |
L+900 |
2.0% | 11/16/15 | 7,968 | 7,781 | 7,928 | ||||||||||||||
| Larchmont Resources, LLC |
(h) |
Energy |
L+725 |
1.0% | 8/7/19 | 5,988 | 5,940 | 5,824 | ||||||||||||||
| Leading Edge Aviation Services, Inc. |
(f)(g)(h)(i) |
Capital Goods |
L+875 |
1.5% | 6/30/19 | 33,799 | 33,485 | 33,292 | ||||||||||||||
| LEAS Acquisition Co Ltd. |
(i)(k) |
Capital Goods |
L+875 |
1.5% | 6/30/19 | € | 29,250 | 40,045 | 34,864 | |||||||||||||
| LEAS Acquisition Co Ltd. |
(g)(k) |
Capital Goods |
L+875 |
1.5% | 6/30/19 | $ | 10,628 | 10,628 | 10,468 | |||||||||||||
| Maritime Telecommunications Network, Inc. |
(f) |
Telecommunication Services |
L+600 |
1.5% | 3/4/16 | 3,242 | 3,230 | 3,161 | ||||||||||||||
| MB Precision Holdings LLC |
(h) |
Capital Goods |
L+725 |
1.3% | 1/23/20 | 13,365 | 13,365 | 13,231 | ||||||||||||||
| Micronics, Inc. |
(f)(h)(i) |
Capital Goods |
L+800 |
1.3% | 3/28/19 | 43,228 | 42,893 | 43,228 | ||||||||||||||
| MMM Holdings, Inc. |
(h)(i) |
Health Care Equipment & Services |
L+825 |
1.5% | 12/12/17 | 8,956 | 8,841 | 8,687 | ||||||||||||||
| MModal Inc. |
(i) |
Health Care Equipment & Services |
L+775 |
1.3% | 1/31/20 | 4,322 | 4,302 | 4,241 | ||||||||||||||
| Mood Media Corp. |
(i)(k) |
Media |
L+600 |
1.0% | 5/1/19 | 698 | 692 | 685 | ||||||||||||||
| MSO of Puerto Rico, Inc. |
(h)(i) |
Health Care Equipment & Services |
L+825 |
1.5% | 12/12/17 | 6,511 | 6,427 | 6,316 | ||||||||||||||
| New Star Metals Inc. |
(f)(h)(i) |
Capital Goods |
L+800 |
1.3% | 3/20/20 | 36,575 | 36,575 | 36,575 | ||||||||||||||
| Nova Wildcat Amerock, LLC |
(h)(i) |
Consumer Durables & Apparel |
L+798 |
1.3% | 9/10/19 | 20,000 | 20,000 | 19,600 | ||||||||||||||
| Panda Sherman Power, LLC |
(f) |
Energy |
L+750 |
1.5% | 9/14/18 | 496 | 500 | 493 | ||||||||||||||
| Panda Temple Power, LLC (TLA) |
(f) |
Energy |
L+700 |
1.5% | 7/17/18 | 2,583 | 2,582 | 2,619 | ||||||||||||||
| PHRC License, LLC |
(g)(h)(i) |
Consumer Services |
L+900 |
1.5% | 8/14/20 | 45,000 | 45,000 | 44,550 | ||||||||||||||
| Polymer Additives, Inc. |
(i) |
Materials |
L+838 |
1.0% | 12/20/21 | 10,511 | 10,510 | 10,511 | ||||||||||||||
| Production Resource Group, LLC |
(h)(i) |
Media |
L+750 |
1.0% | 7/23/19 | 32,500 | 32,500 | 32,663 | ||||||||||||||
| PRV Aerospace, LLC |
(i) |
Capital Goods |
L+525 |
1.3% | 5/9/18 | 80 | 80 | 79 | ||||||||||||||
| Reddy Ice Holdings, Inc. |
(i) |
Food & Staples Retailing |
L+550 |
1.3% | 5/1/19 | 1,170 | 1,160 | 1,032 | ||||||||||||||
| Safariland, LLC |
(f)(h)(i) |
Capital Goods |
L+800 |
1.3% | 9/20/19 | 150,400 | 150,400 | 152,656 | ||||||||||||||
| Shell Topco L.P. |
(h)(i) |
Materials |
L+750 |
1.5% | 9/28/18 | 30,000 | 29,698 | 30,525 | ||||||||||||||
| Smile Brands Group Inc. |
(i) |
Health Care Equipment & Services |
L+625 |
1.3% | 8/16/19 | 20,243 | 19,878 | 19,383 | ||||||||||||||
| Sorenson Communications, Inc. |
(e)(f)(h)(i) |
Telecommunication Services |
L+575 |
2.3% | 4/30/20 | 93,500 | 93,081 | 94,435 | ||||||||||||||
| Southcross Holdings Borrower LP |
(i) |
Energy |
L+500 |
1.0% | 8/4/21 | 316 | 314 | 283 | ||||||||||||||
| Sports Authority, Inc. |
(h) |
Consumer Durables & Apparel |
L+600 |
1.5% | 11/16/17 | 6,318 | 6,321 | 5,607 | ||||||||||||||
| Stallion Oilfield Holdings, Inc. |
(h) |
Energy |
L+675 |
1.3% | 6/19/18 | 4,810 | 4,775 | 4,119 | ||||||||||||||
| SunGard Availability Services Capital, Inc. |
(e) |
Software & Services |
L+500 |
1.0% | 3/29/19 | 4,975 | 4,623 | 4,455 | ||||||||||||||
| Sunnova Asset Portfolio 5 Holdings, LLC. |
(i) |
Energy |
12.0% PIK (12.0% Max PIK) |
11/14/21 | 1,803 | 1,803 | 1,803 | |||||||||||||||
| Sunnova Asset Portfolio 5 Holdings, LLC. |
(i)(p) |
Energy |
12.0% PIK (12.0% Max PIK) |
11/14/21 | 3,200 | 3,200 | 3,200 | |||||||||||||||
| Swiss Watch International, Inc. |
(f)(h)(i) |
Consumer Durables & Apparel |
L+725 |
1.3% | 11/8/18 | 47,000 | 46,359 | 45,355 | ||||||||||||||
| U.S. Xpress Enterprises, Inc. |
(f)(g) |
Transportation |
L+850, 1.5% PIK (1.5% Max PIK) |
1.5% | 5/30/19 | 74,813 | 74,813 | 74,813 | ||||||||||||||
See notes to consolidated financial statements.
109
Table of Contents
FS Investment Corporation
Consolidated Schedule of Investments (continued)
As of December 31, 2014
(in thousands, except share amounts)
| Portfolio Company(a) |
Footnotes |
Industry |
Rate(b) |
Floor | Maturity | Principal
Amount(c) |
Amortized Cost |
Fair
Value(d) |
||||||||||||||
| Virtual Radiologic Corp. |
(i) |
Health Care Equipment & Services |
L+550 |
1.8% | 12/22/16 | $ | 3,484 | $ | 3,452 | $ | 2,645 | |||||||||||
| VPG Group Holdings LLC |
(f)(h)(i) |
Materials |
L+900 |
1.0% | 10/4/16 | 79,195 | 78,764 | 79,393 | ||||||||||||||
| Waste Pro USA, Inc. |
(f)(g)(h) |
Commercial & Professional Services |
L+750 |
1.0% | 10/15/20 | 86,889 | 86,889 | 86,889 | ||||||||||||||
| Waste Pro USA, Inc. |
(i)(p) |
Commercial & Professional Services |
L+750 |
1.0% | 10/15/20 | 9,444 | 9,444 | 9,444 | ||||||||||||||
|
|
|
|
|
|||||||||||||||||||
| Total Senior Secured Loans—First Lien |
2,289,343 | 2,279,592 | ||||||||||||||||||||
| Unfunded Loan Commitments |
(73,386 | ) | (73,386 | ) | ||||||||||||||||||
|
|
|
|
|
|||||||||||||||||||
| Net Senior Secured Loans—First Lien |
2,215,957 | 2,206,206 | ||||||||||||||||||||
|
|
|
|
|
|||||||||||||||||||
| Senior Secured Loans—Second Lien—29.9% |
||||||||||||||||||||||
| Advance Pierre Foods, Inc. |
(e)(f)(g) |
Food & Staples Retailing |
L+825 |
1.3% | 10/10/17 | 17,556 | 17,379 | 17,292 | ||||||||||||||
| Affordable Care, Inc. |
(f)(g)(i) |
Health Care Equipment & Services |
L+925 |
1.3% | 12/26/19 | 44,314 | 43,893 | 43,871 | ||||||||||||||
| Alison US LLC |
(i)(k) |
Capital Goods |
L+850 |
1.0% | 8/29/22 | 4,444 | 4,273 | 4,161 | ||||||||||||||
| American Energy—Utica, LLC |
(f) |
Energy |
L+400, 5.5% PIK (5.5% Max PIK) |
1.5% | 9/30/18 | 79,987 | 79,987 | 78,387 | ||||||||||||||
| American Energy—Utica, LLC |
(g) |
Energy |
L+400, 5.5% PIK (5.5% Max PIK) |
1.5% | 9/30/18 | 54,324 | 54,324 | 53,238 | ||||||||||||||
| American Racing and Entertainment, LLC |
(g) |
Consumer Services |
12.0% |
7/1/18 | 16,800 | 16,380 | 16,800 | |||||||||||||||
| BPA Laboratories, Inc. |
(i) |
Pharmaceuticals, Biotechnology & Life Sciences |
2.5% |
7/3/17 | 593 | 475 | 526 | |||||||||||||||
| Brasa (Holdings) Inc. |
(f) |
Consumer Services |
L+950 |
1.5% | 1/20/20 | 6,211 | 6,031 | 6,149 | ||||||||||||||
| Brock Holdings III, Inc. |
(i) |
Energy |
L+825 |
1.8% | 3/16/18 | 6,923 | 6,855 | 5,573 | ||||||||||||||
| Byrider Finance, LLC |
(g)(i) |
Automobiles & Components |
L+1000 |
1.3% | 8/22/20 | 10,000 | 10,000 | 10,000 | ||||||||||||||
| Compuware Corp. |
(e)(i)(j) |
Software & Services |
L+825 |
1.0% | 12/9/22 | 10,000 | 8,700 | 9,250 | ||||||||||||||
| Consolidated Precision Products Corp. |
(f) |
Capital Goods |
L+775 |
1.0% | 4/30/21 | 10,925 | 10,877 | 10,434 | ||||||||||||||
| DEI Sales, Inc. |
(f)(g) |
Commercial & Professional Services |
L+900 |
1.5% | 1/15/18 | 57,500 | 56,978 | 55,991 | ||||||||||||||
| Eastman Kodak Co. |
(f)(g) |
Consumer Durables & Apparel |
L+950 |
1.3% | 9/3/20 | 50,000 | 48,918 | 50,000 | ||||||||||||||
| Nielsen & Bainbridge, LLC |
(i) |
Consumer Services |
L+925 |
1.0% | 8/15/21 | 15,000 | 14,786 | 14,775 | ||||||||||||||
| OSP Group, Inc. |
(f)(g)(i) |
Consumer Durables & Apparel |
L+800 |
1.3% | 7/31/20 | 145,000 | 145,000 | 144,275 | ||||||||||||||
| Paw Luxco II Sarl |
(g)(k) |
Consumer Durables & Apparel |
EURIBOR+950 |
1/29/19 | € | 16,364 | 20,200 | 17,203 | ||||||||||||||
| Pelican Products, Inc. |
(i) |
Capital Goods |
L+825 |
1.0% | 4/9/21 | $ | 4,222 | 4,194 | 4,169 | |||||||||||||
| PSAV Acquisition Corp. |
(f)(i) |
Technology Hardware & Equipment |
L+825 |
1.0% | 1/24/22 | 80,000 | 78,898 | 80,500 | ||||||||||||||
| Sensus USA Inc. |
(i) |
Capital Goods |
L+725 |
1.3% | 5/9/18 | 3,000 | 3,027 | 2,873 | ||||||||||||||
| Sequential Brands Group, Inc. |
(f) |
Consumer Durables & Apparel |
L+800 |
1.0% | 8/15/20 | 25,000 | 25,000 | 25,000 | ||||||||||||||
| Stadium Management Corp. |
(f) |
Consumer Services |
L+825 |
1.0% | 2/15/22 | 57,500 | 57,500 | 57,788 | ||||||||||||||
|
|
|
|
|
|||||||||||||||||||
| Total Senior Secured Loans—Second Lien |
713,675 | 708,255 | ||||||||||||||||||||
|
|
|
|
|
|||||||||||||||||||
See notes to consolidated financial statements.
110
Table of Contents
FS Investment Corporation
Consolidated Schedule of Investments (continued)
As of December 31, 2014
(in thousands, except share amounts)
| Portfolio Company(a) |
Footnotes |
Industry |
Rate(b) |
Floor | Maturity | Principal
Amount(c) |
Amortized Cost |
Fair
Value(d) |
||||||||||||||
| Senior Secured Bonds—15.2% |
||||||||||||||||||||||
| Advanced Lighting Technologies, Inc. |
(f)(g) |
Materials |
10.5% |
6/1/19 | $ | 78,500 | $ | 77,139 | $ | 52,203 | ||||||||||||
| Allen Systems Group, Inc. |
(f)(g)(i)(m)(q) |
Software & Services |
10.5% |
11/15/16 | 38,448 | 31,201 | 13,457 | |||||||||||||||
| Aspect Software, Inc. |
(e) |
Software & Services |
10.6% |
5/15/17 | 6,000 | 5,991 | 5,700 | |||||||||||||||
| Avaya Inc. |
(e)(f)(g) |
Technology Hardware & Equipment |
10.5% |
3/1/21 | 39,250 | 36,194 | 33,853 | |||||||||||||||
| Caesars Entertainment Resort Properties, LLC |
(e)(f)(g) |
Consumer Services |
11.0% |
10/1/21 | 60,138 | 59,854 | 55,026 | |||||||||||||||
| FourPoint Energy, LLC |
(f)(g) |
Energy |
8.0% |
12/31/20 | 70,875 | 67,690 | 62,370 | |||||||||||||||
| FourPoint Energy, LLC |
(f)(g)(p) |
Energy |
8.0% |
12/31/20 | 27,563 | 27,563 | 24,255 | |||||||||||||||
| Global A&T Electronics Ltd. |
(i)(k) |
Technology Hardware & Equipment |
10.0% |
2/1/19 | 9,000 | 9,000 | 8,118 | |||||||||||||||
| JW Aluminum Co. |
(f)(g)(i) |
Materials |
11.5%, 1.0% PIK (1.0% Max PIK) |
11/15/17 | 66,297 | 65,818 | 66,297 | |||||||||||||||
| Logan’s Roadhouse Inc. |
(e)(g) |
Consumer Services |
10.8% |
10/15/17 | 56,294 | 46,855 | 41,728 | |||||||||||||||
| Sorenson Communications, Inc. |
(g) |
Telecommunication Services |
9.0% |
10/31/20 | 19,898 | 19,158 | 18,903 | |||||||||||||||
| Speedy Cash Intermediate Holdings Corp. |
(f) |
Diversified Financials |
10.8% |
5/15/18 | 5,000 | 5,061 | 4,928 | |||||||||||||||
|
|
|
|
|
|||||||||||||||||||
| Total Senior Secured Bonds |
451,524 | 386,838 | ||||||||||||||||||||
| Unfunded Bond Commitments |
(27,563 | ) | (27,563 | ) | ||||||||||||||||||
|
|
|
|
|
|||||||||||||||||||
| Net Senior Secured Bonds |
423,961 | 359,275 | ||||||||||||||||||||
|
|
|
|
|
|||||||||||||||||||
| Subordinated Debt—19.6% |
||||||||||||||||||||||
| Alta Mesa Holdings, L.P. |
(e) |
Energy |
9.6% |
10/15/18 | 11,165 | 11,084 | 9,468 | |||||||||||||||
| Aurora Diagnostics, LLC |
(f)(g) |
Pharmaceuticals, Biotechnology & Life Sciences |
10.8% |
1/15/18 | 18,065 | 18,099 | 15,717 | |||||||||||||||
| Brooklyn Basketball Holdings, LLC |
(g)(i) |
Consumer Services |
L+800 |
10/15/19 | 19,873 | 19,873 | 19,674 | |||||||||||||||
| Cadillac Jack, Inc. |
(g)(k) |
Consumer Services |
6.0%, 7.0% PIK (7.0% Max PIK) |
5/15/20 | 52,268 | 36,561 | 54,947 | |||||||||||||||
| Comstock Resources, Inc. |
(f)(k) |
Energy |
9.5% |
6/15/20 | 7,500 | 7,232 | 5,063 | |||||||||||||||
| Flanders Corp. |
(f)(g) |
Capital Goods |
13.8% PIK (13.8% Max PIK) |
5/14/18 | 22,344 | 22,217 | 19,495 | |||||||||||||||
| Flanders Corp. |
(g)(i) |
Capital Goods |
17.5% PIK (17.5% Max PIK) |
5/14/18 | 21,595 | 20,227 | 21,325 | |||||||||||||||
| Global Jet Capital, Inc. |
(i) |
Commercial & Professional Services |
8.0% PIK (8.0% Max PIK) |
1/30/15 | 313 | 313 | 313 | |||||||||||||||
| HBC Solutions, Inc. |
(i) |
Media |
12.5% PIK (12.5% Max PIK) |
8/4/18 | 303 | 303 | 303 | |||||||||||||||
| HBC Solutions, Inc. |
(i)(p) |
Media |
12.5% PIK (12.5% Max PIK) |
8/4/18 | 150 | 150 | 150 | |||||||||||||||
| Jupiter Resources, Inc. |
(e)(g)(k) |
Energy |
8.5% |
10/1/22 | 6,425 | 5,306 | 4,819 | |||||||||||||||
| Kinetic Concepts, Inc. |
(e)(f) |
Health Care Equipment & Services |
12.5% |
11/1/19 | 15,000 | 14,256 | 16,500 | |||||||||||||||
| KODA Distribution Group, Inc. |
(f) |
Materials |
11.3% |
9/30/19 | 35,000 | 34,440 | 35,000 | |||||||||||||||
| Lightstream Resources, Ltd. |
(g)(k) |
Energy |
8.6% |
2/1/20 | 1,650 | 1,290 | 1,163 | |||||||||||||||
| Mood Media Corp. |
(e)(f)(g)(k) |
Media |
9.3% |
10/15/20 | 43,135 | 42,124 | 35,263 | |||||||||||||||
| NewStar Financial, Inc. |
(f)(i)(k) |
Diversified Financials |
8.3%, 0.0% PIK (8.8% Max PIK) |
12/4/24 | 50,000 | 34,997 | 37,500 | |||||||||||||||
| P.F. Chang’s China Bistro, Inc. |
(e) |
Consumer Services |
10.3% |
6/30/20 | 1,390 | 1,384 | 1,397 | |||||||||||||||
See notes to consolidated financial statements.
111
Table of Contents
FS Investment Corporation
Consolidated Schedule of Investments (continued)
As of December 31, 2014
(in thousands, except share amounts)
| Portfolio Company(a) |
Footnotes |
Industry |
Rate(b) |
Floor | Maturity | Principal
Amount(c) |
Amortized Cost |
Fair
Value(d) |
||||||||||||||
| RKI Exploration & Production, LLC |
(e)(g) |
Energy |
8.5% |
8/1/21 | $ | 12,550 | $ | 12,362 | $ | 10,229 | ||||||||||||
| Samson Investment Co. |
(e)(f)(g)(i) |
Energy |
9.8% |
2/15/20 | 14,200 | 13,397 | 5,964 | |||||||||||||||
| Sandridge Energy, Inc. |
(e)(i)(k) |
Energy |
8.8% |
1/5/20 | 7,500 | 6,321 | 5,119 | |||||||||||||||
| Sequel Industrial Products Holdings, LLC |
(g) |
Energy |
12.0%, 2.5% PIK (2.5% Max PIK) |
5/10/18 | 7,000 | 6,909 | 7,245 | |||||||||||||||
| Sidewinder Drilling Inc. |
(f) |
Energy |
9.8% |
11/15/19 | 4,328 | 4,328 | 2,532 | |||||||||||||||
| Sorenson Communications, Inc. |
(g) |
Telecommunication Services |
13.0% |
10/31/21 | 15,122 | 14,112 | 15,425 | |||||||||||||||
| Talos Production, LLC |
(g) |
Energy |
9.8% |
2/15/18 | 1,500 | 1,364 | 1,358 | |||||||||||||||
| ThermaSys Corp. |
(f)(g) |
Capital Goods |
9.0%, 1.8% PIK (5.0% Max PIK) |
5/3/20 | 133,295 | 133,295 | 132,628 | |||||||||||||||
| VPG Group Holdings LLC |
(f) |
Materials |
11.0%, 2.0% PIK (2.0% Max PIK) |
7/15/19 | 5,142 | 5,142 | 5,232 | |||||||||||||||
| Warren Resources, Inc. |
(g) |
Energy |
9.0% |
8/1/22 | 1,000 | 709 | 625 | |||||||||||||||
|
|
|
|
|
|||||||||||||||||||
| Total Subordinated Debt |
467,795 | 464,454 | ||||||||||||||||||||
| Unfunded Debt Commitments |
(150 | ) | (150 | ) | ||||||||||||||||||
|
|
|
|
|
|||||||||||||||||||
| Net Subordinated Debt |
467,645 | 464,304 | ||||||||||||||||||||
|
|
|
|
|
|||||||||||||||||||
| Collateralized Securities—5.2% |
||||||||||||||||||||||
| ACASC 2013-2A B |
(g)(i)(k) |
Diversified Financials |
8.1% |
10/15/23 | 30,500 | 25,488 | 25,338 | |||||||||||||||
| Dryden CDO 23A Class Subord. |
(i)(k) |
Diversified Financials |
19.1% |
7/17/23 | 10,000 | 5,810 | 7,967 | |||||||||||||||
| JPMorgan Chase Bank, N.A. Credit-Linked Notes |
(g)(k) |
Diversified Financials |
14.3% |
12/20/21 | 16,740 | 16,594 | 17,284 | |||||||||||||||
| Lightpoint CLO 2006 V Class D |
(g)(k) |
Diversified Financials |
L+365 |
8/5/19 | 6,500 | 4,087 | 6,361 | |||||||||||||||
| NewStar Clarendon 2014-1A Class D |
(i)(j)(k) |
Diversified Financials |
L+435 |
1/25/27 | 1,560 | 1,461 | 1,461 | |||||||||||||||
| NewStar Clarendon 2014-1A Sub B |
(i)(j)(k) |
Diversified Financials |
12.5% |
1/25/27 | 17,900 | 17,713 | 17,713 | |||||||||||||||
| Rampart CLO 2007 1A Class Subord. |
(i)(k) |
Diversified Financials |
24.2% |
10/25/21 | 10,000 | 2,943 | 4,997 | |||||||||||||||
| Stone Tower CLO VI Class Subord. |
(g)(k) |
Diversified Financials |
32.6% |
4/17/21 | 5,000 | 2,225 | 3,936 | |||||||||||||||
| Wind River CLO Ltd. 2012 1A Class Sub B |
(i)(k) |
Diversified Financials |
18.8% |
1/15/24 | 42,504 | 34,041 | 38,863 | |||||||||||||||
|
|
|
|
|
|||||||||||||||||||
| Total Collateralized Securities |
110,362 | 123,920 | ||||||||||||||||||||
|
|
|
|
|
|||||||||||||||||||
| Equity/Other - 13.6%(l) | Number of Shares |
Amortized Cost |
Fair Value(d) |
|||||||||||||||||||
| Altus Power America, Inc., Preferred Equity |
(i)(m) |
Energy |
253,925 | 254 | 254 | |||||||||||||||||
| Amaya Gaming Group Inc., Warrants |
(i)(k)(m) |
Consumer Services |
2,000,000 | 16,832 | 35,180 | |||||||||||||||||
| American Energy Appalachia Holdings, LLC |
(i)(m)(n) |
Energy |
9,700,000 | 9,700 | 9,700 | |||||||||||||||||
| AP Exhaust Holdings, LLC, Common Equity |
(i)(m)(o) |
Automobiles & Components |
811 | 811 | 580 | |||||||||||||||||
| Aquilex Corp., Common Equity, Class A Shares |
(f) |
Energy |
15,128 | 1,088 | 4,295 | |||||||||||||||||
| Aquilex Corp., Common Equity, Class B Shares |
(f)(g) |
Energy |
32,637 | 1,690 | 9,266 | |||||||||||||||||
| BPA Laboratories, Inc., Series A Warrants |
(i)(m) |
Pharmaceuticals, Biotechnology & Life Sciences |
1,979 | — | — | |||||||||||||||||
See notes to consolidated financial statements.
112
Table of Contents
FS Investment Corporation
Consolidated Schedule of Investments (continued)
As of December 31, 2014
(in thousands, except share amounts)
| Portfolio Company(a) |
Footnotes |
Industry |
Number of Shares |
Amortized Cost |
Fair
Value(d) |
|||||||||||||||||
| BPA Laboratories, Inc., Series B Warrants |
(i)(m) |
Pharmaceuticals, Biotechnology & Life Sciences |
3,173 | $ | — | $ | — | |||||||||||||||
| Burleigh Point, Ltd., Warrants |
(i)(k)(m) |
Retailing |
17,256,081 | 1,898 | 5,004 | |||||||||||||||||
| CoSentry.Net, LLC, Preferred Equity |
(g)(m) |
Software & Services |
2,632 | 2,500 | 4,185 | |||||||||||||||||
| Eastman Kodak Co., Common Equity |
(f)(i)(m) |
Consumer Durables & Apparel |
61,859 | 1,202 | 1,343 | |||||||||||||||||
| ERC Ireland Holdings Ltd., Common Equity |
(g)(i)(j)(k)(m) |
Telecommunication Services |
37,547 | 5,219 | 5,950 | |||||||||||||||||
| ERC Ireland Holdings Ltd., Warrants |
(i)(k)(m) |
Telecommunication Services |
15,809 | 2,288 | 2,505 | |||||||||||||||||
| Flanders Corp., Common Equity |
(g)(m) |
Capital Goods |
6,177,490 | 6,531 | 1,853 | |||||||||||||||||
| FourPoint Energy, LLC, Class C Units |
(i)(m)(o) |
Energy |
21,000 | 21,000 | 26,775 | |||||||||||||||||
| FourPoint Energy, LLC, Class D Units |
(i)(m)(o) |
Energy |
3,937 | 2,601 | 5,059 | |||||||||||||||||
| Fronton Investor Holdings, LLC, Class B Units |
(i)(m)(o)(s) |
Consumer Services |
14,943 | 17,931 | 14,793 | |||||||||||||||||
| HBC Solutions, Inc., Common Equity, Class A Units |
(i)(m) |
Media |
26,774 | 3,027 | 3,539 | |||||||||||||||||
| Industrial Group Intermediate Holdings, LLC, Common Equity |
(i)(m)(o) |
Materials |
347,107 | 347 | 486 | |||||||||||||||||
| JW Aluminum Co., Common Equity |
(g)(m) |
Materials |
37,500 | 3,225 | — | |||||||||||||||||
| Leading Edge Aviation Services, Inc., Common Equity |
(g)(m) |
Capital Goods |
4,401 | 464 | 92 | |||||||||||||||||
| Leading Edge Aviation Services, Inc., Preferred Equity |
(g)(m) |
Capital Goods |
1,303 | 1,303 | 1,303 | |||||||||||||||||
| MB Precision Investment Holdings LLC, Class A-2 Units |
(g)(m) |
Capital Goods |
490,213 | 490 | 490 | |||||||||||||||||
| Micronics, Inc., Common Equity |
(i)(m) |
Capital Goods |
53,073 | 553 | 918 | |||||||||||||||||
| Micronics, Inc., Preferred Equity |
(i)(m) |
Capital Goods |
55 | 553 | 553 | |||||||||||||||||
| Milagro Holdings, LLC, Common Equity |
(g)(m) |
Energy |
12,057 | 50 | — | |||||||||||||||||
| Milagro Holdings, LLC, Preferred Equity |
(i)(m) |
Energy |
283,947 | 11,180 | 525 | |||||||||||||||||
| MModal Inc., Common Equity |
(i)(m) |
Health Care Equipment & Services |
56,529 | 933 | 850 | |||||||||||||||||
| New Star Metals Inc., Common Equity |
(i) |
Capital Goods |
741,082 | 750 | 963 | |||||||||||||||||
| NewStar Financial, Inc., Warrants |
(i)(k)(m) |
Diversified Financials |
2,375,000 | 15,058 | 15,675 | |||||||||||||||||
| Plains Offshore Operations Inc., Preferred Equity |
(f)(g) |
Energy |
50,000 | 61,722 | 66,778 | |||||||||||||||||
| Plains Offshore Operations Inc., Warrants |
(f)(g)(m) |
Energy |
1,067,481 | 1,722 | 2,028 | |||||||||||||||||
| PSAV Holdings LLC, Common Equity |
(g)(m) |
Technology Hardware & Equipment |
10,000 | 10,000 | 15,000 | |||||||||||||||||
| Safariland, LLC, Common Equity |
(g)(m) |
Capital Goods |
25,000 | 2,500 | 10,220 | |||||||||||||||||
| Safariland, LLC, Preferred Equity |
(g) |
Capital Goods |
2,042 | 22,284 | 22,578 | |||||||||||||||||
| Safariland, LLC, Warrants |
(g)(m) |
Capital Goods |
4,536 | 473 | 1,854 | |||||||||||||||||
| Sequel Industrial Products Holdings, LLC, Common Equity |
(g)(i)(m) |
Energy |
33,306 | 3,400 | 9,272 | |||||||||||||||||
| Sequel Industrial Products Holdings, LLC, Preferred Equity |
(g)(i) |
Energy |
8,000 | 10,085 | 10,094 | |||||||||||||||||
| Sequel Industrial Products Holdings, LLC, Warrants |
(i)(m)(r) |
Energy |
1,293 | 1 | 204 | |||||||||||||||||
| Sequel Industrial Products Holdings, LLC, Warrants |
(g)(m)(r) |
Energy |
19,388 | 12 | 3,459 | |||||||||||||||||
| Sorenson Communications, Inc., Common Equity |
(g)(m) |
Telecommunication Services |
46,163 | — | 21,572 | |||||||||||||||||
See notes to consolidated financial statements.
113
Table of Contents
FS Investment Corporation
Consolidated Schedule of Investments (continued)
As of December 31, 2014
(in thousands, except share amounts)
| Portfolio Company(a) |
Footnotes |
Industry |
Number of Shares |
Amortized Cost |
Fair
Value(d) |
|||||||||||||||||
| ThermaSys Corp., Common Equity |
(g)(m) |
Capital Goods |
51,813 | $ | 1 | $ | — | |||||||||||||||
| ThermaSys Corp., Preferred Equity |
(g) |
Capital Goods |
51,813 | 5,181 | 5,129 | |||||||||||||||||
| VPG Group Holdings LLC, Class A-2 Units |
(g)(m) |
Materials |
3,637,500 | 3,638 | 3,638 | |||||||||||||||||
|
|
|
|
|
|||||||||||||||||||
| Total Equity/Other |
250,497 | 323,962 | ||||||||||||||||||||
|
|
|
|||||||||||||||||||||
| Unfunded Contingent Warrant Commitment |
(2,475 | ) | ||||||||||||||||||||
|
|
|
|||||||||||||||||||||
| Net Equity/Other |
321,487 | |||||||||||||||||||||
|
|
|
|
|
|||||||||||||||||||
| TOTAL INVESTMENTS—176.7% |
$ | 4,182,097 | 4,183,447 | |||||||||||||||||||
|
|
|
|||||||||||||||||||||
| LIABILITIES IN EXCESS OF OTHER ASSETS—(76.7%) |
(1,816,461 | ) | ||||||||||||||||||||
|
|
|
|||||||||||||||||||||
| NET ASSETS—100% |
$ | 2,366,986 | ||||||||||||||||||||
|
|
|
|||||||||||||||||||||
| (a) | Security may be an obligation of one or more entities affiliated with the named company. |
| (b) | Certain variable rate securities in the Company’s portfolio bear interest at a rate determined by a publicly disclosed base rate plus a basis point spread. As of December 31, 2014, the three-month London Interbank Offered Rate, or LIBOR, was 0.26%, the Euro Interbank Offered Rate, or EURIBOR, was 0.08% and the U.S. Prime Lending Rate, or Prime, was 3.25%. |
| (c) | Denominated in U.S. dollars unless otherwise noted. |
| (d) | Fair value determined by the Company’s board of directors (see Note 7). |
| (e) | Security or portion thereof held within Broad Street Funding LLC and is pledged as collateral supporting the amounts outstanding under the revolving credit facility with Deutsche Bank AG, New York Branch (see Note 8). |
| (f) | Security or portion thereof held within Locust Street Funding LLC and is pledged as collateral supporting the amounts outstanding under the Class A Notes issued to Race Street Funding LLC pursuant to an indenture with Citibank, N.A., as trustee (see Note 8). |
| (g) | Security or portion thereof held within Race Street Funding LLC and is pledged as collateral supporting the amounts outstanding under the repurchase agreement with JPMorgan Chase Bank, N.A., London Branch (see Note 8). |
| (h) | Security or portion thereof held within Walnut Street Funding LLC and is pledged as collateral supporting the amounts outstanding under the revolving credit facility with Wells Fargo Bank, National Association (see Note 8). As of January 16, 2015, all such securities held within Walnut Street Funding LLC were sold or transferred to FS Investment Corporation. |
| (i) | Security or portion thereof is pledged as collateral supporting the amounts outstanding under the revolving credit facility with ING Capital LLC (see Note 8). |
| (j) | Position or portion thereof unsettled as of December 31, 2014. |
| (k) | The investment is not a qualifying asset under the Investment Company Act of 1940, as amended. A business development company may not acquire any asset other than qualifying assets, unless, at the time the acquisition is made, qualifying assets represent at least 70% of the company’s total assets. As of December 31, 2014, 78.7% of the Company’s total assets represented qualifying assets. |
| (l) | Listed investments may be treated as debt for GAAP or tax purposes. |
| (m) | Security is non-income producing. |
| (n) | Security held within IC American Energy Investments, Inc., a wholly-owned subsidiary of the Company. |
See notes to consolidated financial statements.
114
Table of Contents
FS Investment Corporation
Consolidated Schedule of Investments (continued)
As of December 31, 2014
(in thousands, except share amounts)
| (o) | Security held within FSIC Investments, Inc., a wholly-owned subsidiary of the Company. |
| (p) | Security is an unfunded loan commitment. |
| (q) | Security was on non-accrual status as of December 31, 2014. |
| (r) | Warrants expire on September 28, 2022 and May 10, 2022 and the strike prices are $121.00 and $100.00 per share, respectively. |
| (s) | Under the Investment Company Act of 1940, as amended, the Company generally is deemed to be an “affiliated person” of a portfolio company if it owns 5% or more of the portfolio company’s voting securities and generally is deemed to “control” a portfolio company if it owns 25% or more of the portfolio company’s voting securities or it has the power to exercise control over the management or policies of such portfolio company. During the year ended December 31, 2014, the Company made an investment in and, in connection with such investment is deemed to be an “affiliated person” of (but would not be deemed to “control”), the following portfolio company: |
| Portfolio Company |
Purchases | Sales and Repayments |
Interest Income |
Fee Income |
Net Realized Gain (Loss) |
Net Change in Unrealized Appreciation (Depreciation) |
||||||||||||||||||
| Equity/Other |
||||||||||||||||||||||||
| Fronton Investor Holdings, LLC, Class B Units |
$ | 17,931 | — | — | — | — | $ | (3,138 | ) | |||||||||||||||
See notes to consolidated financial statements.
115
Table of Contents
FS Investment Corporation
Consolidated Schedule of Investments
As of December 31, 2013
(in thousands, except share amounts)
| Portfolio Company(a) |
Footnotes |
Industry |
Rate |
Floor | Maturity | Principal Amount(b) |
Amortized Cost |
Fair Value(c) |
||||||||||||||
| Senior Secured Loans—First Lien—80.4% |
||||||||||||||||||||||
| A.P. Plasman Inc. |
(f)(h)(j) |
Capital Goods |
L+850 |
1.5% | 12/29/16 | $ | 49,941 | $ | 49,282 | $ | 51,502 | |||||||||||
| AccentCare, Inc. |
(d) |
Health Care Equipment & Services |
L+500 |
1.5% | 12/22/16 | 2,017 | 1,869 | 1,052 | ||||||||||||||
| Alcatel-Lucent USA Inc. |
(d)(j) |
Technology Hardware & Equipment |
L+475 |
1.0% | 1/30/19 | 4,069 | 4,051 | 4,094 | ||||||||||||||
| American Racing and Entertainment, LLC |
(f) |
Consumer Services |
L+700 |
6/30/14 | 13,500 | 13,500 | 13,500 | |||||||||||||||
| American Racing and Entertainment, LLC |
(f) |
Consumer Services |
9.0% |
6/30/14 | 7,750 | 7,750 | 7,789 | |||||||||||||||
| Aspect Software, Inc. |
(d) |
Software & Services |
L+525 |
1.8% | 5/6/16 | 6,436 | 6,307 | 6,470 | ||||||||||||||
| Attachmate Corp. |
(d)(e) |
Software & Services |
L+575 |
1.5% | 11/22/17 | 10,311 | 10,157 | 10,523 | ||||||||||||||
| Audio Visual Services Group, Inc. |
(d) |
Technology Hardware & Equipment |
L+550 |
1.3% | 11/9/18 | 3,948 | 3,959 | 3,977 | ||||||||||||||
| Avaya Inc. |
(d)(e)(i) |
Technology Hardware & Equipment |
L+450 |
10/26/17 | 9,905 | 9,184 | 9,717 | |||||||||||||||
| Avaya Inc. |
(d) |
Technology Hardware & Equipment |
L+675 |
1.3% | 3/31/18 | 14,827 | 14,891 | 15,072 | ||||||||||||||
| Azure Midstream Energy LLC |
(d) |
Energy |
L+550 |
1.0% | 11/15/18 | 4,500 | 4,434 | 4,534 | ||||||||||||||
| BlackBrush TexStar L.P. |
(d)(f) |
Energy |
L+650 |
1.3% | 6/4/19 | 14,179 | 14,049 | 14,311 | ||||||||||||||
| Boomerang Tube, LLC |
(d)(h) |
Energy |
L+950 |
1.5% | 10/11/17 | 18,870 | 18,408 | 18,210 | ||||||||||||||
| Cadillac Jack, Inc. |
(f)(h)(j) |
Consumer Services |
L+700 |
1.0% | 12/20/17 | 35,000 | 34,655 | 34,650 | ||||||||||||||
| Caesars Entertainment Operating Co. |
(e)(f)(j) |
Consumer Services |
L+425 |
1/26/18 | 16,351 | 15,017 | 15,513 | |||||||||||||||
| Caesars Entertainment Operating Co. |
(f)(j) |
Consumer Services |
L+525 |
1/28/18 | 2,500 | 2,369 | 2,394 | |||||||||||||||
| Caesars Entertainment Resort Properties, LLC |
(d)(e)(f) |
Consumer Services |
L+600 |
1.0% | 10/1/20 | 72,907 | 68,627 | 72,679 | ||||||||||||||
| Capital Vision Services, LLC |
(f)(h) |
Health Care Equipment & Services |
L+725 |
1.3% | 12/3/17 | 19,828 | 19,828 | 19,977 | ||||||||||||||
| Cenveo Corp. |
(d) |
Commercial & Professional Services |
L+500 |
1.3% | 2/13/17 | 3,628 | 3,613 | 3,658 | ||||||||||||||
| Citgo Petroleum Corp. |
(e) |
Energy |
L+600 |
2.0% | 6/24/15 | 2,536 | 2,551 | 2,561 | ||||||||||||||
| Citgo Petroleum Corp. |
(e)(f) |
Energy |
L+700 |
2.0% | 6/23/17 | 7,571 | 7,557 | 7,666 | ||||||||||||||
| Clear Channel Communications, Inc. |
(d)(f) |
Media |
L+365 |
1/29/16 | 16,079 | 13,772 | 15,604 | |||||||||||||||
| Clover Technologies Group, LLC |
(d) |
Commercial & Professional Services |
L+550 |
1.3% | 5/7/18 | 6,277 | 6,249 | 6,277 | ||||||||||||||
| Collective Brands, Inc. |
(d)(f) |
Consumer Durables & Apparel |
L+600 |
1.3% | 10/9/19 | 12,782 | 12,721 | 12,845 | ||||||||||||||
| Corel Corp. |
(d)(f)(h)(j) |
Software & Services |
L+825 |
6/7/19 | 117,000 | 117,000 | 117,878 | |||||||||||||||
| Corel Corp. |
(j) |
Software & Services |
L+825 |
6/7/18 | 10,000 | 10,000 | 10,000 | |||||||||||||||
| Corner Investment PropCo, LLC |
(d)(f)(i) |
Consumer Services |
L+975 |
1.3% | 11/2/19 | 25,750 | 25,363 | 26,265 | ||||||||||||||
| CoSentry.Net, LLC |
(d)(g)(h) |
Software & Services |
L+800 |
1.3% | 12/31/19 | 54,500 | 54,500 | 54,500 | ||||||||||||||
| Crestwood Holdings LLC |
(d) |
Energy |
L+600 |
1.0% | 6/19/19 | 5,735 | 5,709 | 5,907 | ||||||||||||||
| Dent Wizard International Corp. |
(d)(f)(g)(h) |
Commercial & Professional Services |
L+800 |
4/25/19 | 136,354 | 135,127 | 139,081 | |||||||||||||||
| Dent Wizard International Corp. |
Commercial & Professional Services |
L+425 |
4/25/19 | 15,000 | 15,000 | 15,000 | ||||||||||||||||
| Eastman Kodak Co. |
(d) |
Consumer Durables & Apparel |
L+625 |
1.0% | 9/3/19 | 10,855 | 10,647 | 10,844 | ||||||||||||||
| Education Management LLC |
(f)(j) |
Consumer Services |
L+400 |
6/1/16 | 3,935 | 3,393 | 3,788 | |||||||||||||||
See notes to consolidated financial statements.
116
Table of Contents
FS Investment Corporation
Consolidated Schedule of Investments (continued)
As of December 31, 2013
(in thousands, except share amounts)
| Portfolio Company(a) |
Footnotes |
Industry |
Rate |
Floor | Maturity | Principal Amount(b) |
Amortized Cost |
Fair Value(c) |
||||||||||||||
| Education Management LLC |
(e)(j) |
Consumer Services |
L+700 |
1.3% | 3/30/18 | $ | 15,697 | $ | 15,638 | $ | 15,771 | |||||||||||
| ERC Ireland Holdings Ltd. |
(g)(i)(j) |
Telecommunication Services |
EURIBOR+300, 1.0% PIK |
9/30/17 | € | 22,006 | 27,607 | 36,063 | ||||||||||||||
| FairPoint Communications, Inc. |
(d)(e)(j) |
Telecommunication Services |
L+625 |
1.3% | 2/14/19 | $ | 21,711 | 21,517 | 22,487 | |||||||||||||
| Flanders Corp. |
(f)(h) |
Capital Goods |
L+950 |
1.5% | 5/14/18 | 37,793 | 37,069 | 38,548 | ||||||||||||||
| Florida Gaming Centers, Inc. |
(f)(l) |
Consumer Services |
16.5% |
4/25/16 | 13,144 | 13,017 | 13,407 | |||||||||||||||
| FR Utility Services LLC |
(d) |
Energy |
L+575 |
1.0% | 10/18/19 | 6,481 | 6,418 | 6,481 | ||||||||||||||
| Fram Group Holdings Inc. |
(d) |
Automobiles & Components |
L+500 |
1.5% | 7/29/17 | 1,344 | 1,325 | 1,335 | ||||||||||||||
| Harlan Sprague Dawley, Inc. |
(d) |
Pharmaceuticals, Biotechnology & Life Sciences |
L+550 |
7/11/14 | 1,276 | 1,154 | 1,148 | |||||||||||||||
| HBC Solutions, Inc. |
(d)(f)(g)(h) |
Media |
L+875 |
1.5% | 2/4/18 | 81,371 | 81,371 | 81,371 | ||||||||||||||
| Ikaria Acquisition Inc. |
(d) |
Pharmaceuticals, Biotechnology & Life Sciences |
L+600 |
1.3% | 7/3/18 | 5,798 | 5,718 | 5,841 | ||||||||||||||
| ILC Industries, LLC |
(d)(h) |
Capital Goods |
L+650 |
1.5% | 7/11/18 | 9,746 | 9,592 | 9,770 | ||||||||||||||
| Infiltrator Systems, Inc. |
(f) |
Capital Goods |
L+825 |
1.3% | 6/27/18 | 30,000 | 30,000 | 30,150 | ||||||||||||||
| Infiltrator Systems, Inc. |
(f)(g)(h) |
Capital Goods |
L+825 |
1.3% | 6/27/18 | 170,000 | 170,000 | 170,850 | ||||||||||||||
| Infogroup Inc. |
(d) |
Software & Services |
L+650 |
1.5% | 5/25/18 | 3,004 | 2,699 | 2,456 | ||||||||||||||
| Insight Equity A.P. X, L.P. |
(f)(g)(h) |
Household & Personal Products |
L+850 |
1.0% | 10/26/18 | 65,000 | 63,934 | 66,300 | ||||||||||||||
| Intralinks, Inc. |
(f)(j) |
Software & Services |
L+450 |
1.5% | 6/15/14 | 1,022 | 989 | 1,022 | ||||||||||||||
| inVentiv Health, Inc. |
(e) |
Health Care Equipment & Services |
L+625 |
1.5% | 5/15/18 | 2,725 | 2,708 | 2,702 | ||||||||||||||
| Lantiq Deutschland GmbH |
(f)(j) |
Software & Services |
L+900 |
2.0% | 11/16/15 | 12,105 | 11,519 | 11,742 | ||||||||||||||
| Larchmont Resources, LLC |
(d) |
Energy |
L+725 |
1.0% | 8/7/19 | 11,087 | 10,982 | 11,294 | ||||||||||||||
| Leading Edge Aviation Services, Inc. |
(d)(f)(g)(h) |
Capital Goods |
L+850 |
1.5% | 4/5/18 | 35,787 | 35,206 | 35,787 | ||||||||||||||
| Leading Edge Aviation Services, Inc. |
(f)(g) |
Capital Goods |
L+850 |
1.5% | 4/5/18 | 8,250 | 8,250 | 8,250 | ||||||||||||||
| Leedsworld Inc. |
(d) |
Retailing |
L+475 |
1.3% | 6/28/19 | 9,750 | 9,661 | 9,787 | ||||||||||||||
| Maritime Telecommunications Network, Inc. |
(f) |
Telecommunication Services |
L+600 |
1.5% | 3/4/16 | 4,109 | 4,080 | 3,575 | ||||||||||||||
| McGraw-Hill Global Education Holdings, LLC |
(d)(e) |
Media |
L+775 |
1.3% | 3/22/19 | 18,594 | 18,089 | 18,969 | ||||||||||||||
| MetoKote Corp. |
(h) |
Materials |
L+800 |
1.3% | 9/30/19 | 20,000 | 20,000 | 20,200 | ||||||||||||||
| MetoKote Corp. |
Materials |
L+800 |
1.3% | 9/30/19 | 3,810 | 3,810 | 3,848 | |||||||||||||||
| Micronics, Inc. |
(d)(h) |
Capital Goods |
L+800 |
1.3% | 3/28/19 | 22,529 | 22,124 | 22,529 | ||||||||||||||
| MMI International Ltd. |
(d)(j) |
Technology Hardware & Equipment |
L+600 |
1.3% | 11/20/18 | 10,612 | 10,323 | 10,340 | ||||||||||||||
| MMM Holdings, Inc. |
(h) |
Health Care Equipment & Services |
L+825 |
1.5% | 12/12/17 | 10,040 | 9,877 | 10,120 | ||||||||||||||
| MModal Inc. |
(d) |
Health Care Equipment & Services |
L+650 |
1.3% | 8/16/19 | 7,182 | 7,070 | 6,190 | ||||||||||||||
| Mood Media Corp. |
(d)(j) |
Media |
L+550 |
1.5% | 5/7/18 | 3,014 | 2,990 | 3,028 | ||||||||||||||
| MSO of Puerto Rico, Inc. |
(h) |
Health Care Equipment & Services |
L+825 |
1.5% | 12/12/17 | 7,302 | 7,184 | 7,360 | ||||||||||||||
| National Mentor Holdings, Inc. |
(d) |
Health Care Equipment & Services |
L+525 |
1.3% | 2/9/17 | 4,929 | 4,929 | 4,970 | ||||||||||||||
See notes to consolidated financial statements.
117
Table of Contents
FS Investment Corporation
Consolidated Schedule of Investments (continued)
As of December 31, 2013
(in thousands, except share amounts)
| Portfolio Company(a) |
Footnotes |
Industry |
Rate |
Floor | Maturity | Principal Amount(b) |
Amortized Cost |
Fair Value(c) |
||||||||||||||
| National Vision, Inc. |
(d) |
Health Care Equipment & Services |
L+575 |
1.3% | 8/2/18 | $ | 4,672 | $ | 4,680 | $ | 4,686 | |||||||||||
| New HB Acquisition, LLC |
(d) |
Food, Beverage & Tobacco |
L+550 |
1.3% | 4/9/20 | 3,896 | 3,860 | 4,042 | ||||||||||||||
| Nova Wildcat Amerock, LLC |
(h) |
Consumer Durables & Apparel |
L+825 |
1.3% | 9/10/19 | 20,000 | 20,000 | 20,000 | ||||||||||||||
| Panda Sherman Power, LLC |
(d)(f) |
Energy |
L+750 |
1.5% | 9/14/18 | 9,273 | 9,203 | 9,551 | ||||||||||||||
| Panda Temple Power, LLC (TLA) |
(f) |
Energy |
L+700 |
1.5% | 7/17/18 | 3,000 | 3,000 | 3,081 | ||||||||||||||
| Patheon Inc. |
(d)(j) |
Pharmaceuticals, Biotechnology & Life Sciences |
L+600 |
1.3% | 12/14/18 | 10,156 | 9,892 | 10,275 | ||||||||||||||
| Princeton Review, Inc. |
(g) |
Consumer Services |
L+550 |
1.5% | 12/7/14 | 1,041 | 996 | 859 | ||||||||||||||
| PRV Aerospace, LLC |
(d) |
Capital Goods |
L+525 |
1.3% | 5/9/18 | 4,939 | 4,929 | 4,961 | ||||||||||||||
| RBS Holding Co. LLC |
(d) |
Commercial & Professional Services |
L+800 |
1.5% | 3/23/17 | 9,788 | 6,198 | 4,943 | ||||||||||||||
| Reddy Ice Holdings, Inc. |
(d) |
Food & Staples Retailing |
L+550 |
1.3% | 5/1/19 | 1,182 | 1,170 | 1,181 | ||||||||||||||
| Safariland, LLC |
(d)(f)(h) |
Capital Goods |
L+800 |
1.3% | 9/20/19 | 156,800 | 156,800 | 158,368 | ||||||||||||||
| Shell Topco L.P. |
(d)(h) |
Energy |
L+750 |
1.5% | 9/28/18 | 33,000 | 32,594 | 33,908 | ||||||||||||||
| Sirius Computer Solutions, Inc. |
(d) |
Software & Services |
L+575 |
1.3% | 12/7/18 | 8,096 | 8,027 | 8,228 | ||||||||||||||
| Smarte Carte, Inc. |
(d)(f)(h) |
Commercial & Professional Services |
L+650 |
1.3% | 11/30/17 | 57,950 | 57,403 | 58,819 | ||||||||||||||
| Smile Brands Group Inc. |
(d)(e)(h) |
Health Care Equipment & Services |
L+625 |
1.3% | 8/15/19 | 30,474 | 29,825 | 30,131 | ||||||||||||||
| Sorenson Communication, Inc. |
(d)(e)(f)(h) |
Telecommunication Services |
L+825 |
1.3% | 10/31/14 | 65,711 | 65,711 | 66,697 | ||||||||||||||
| Sports Authority, Inc. |
(d)(f) |
Consumer Durables & Apparel |
L+600 |
1.5% | 11/16/17 | 22,190 | 22,041 | 22,162 | ||||||||||||||
| Stallion Oilfield Holdings, Inc. |
(d) |
Energy |
L+675 |
1.3% | 6/19/18 | 4,975 | 4,929 | 5,087 | ||||||||||||||
| Swiss Watch International, Inc. |
(d)(f)(h) |
Consumer Durables & Apparel |
L+725 |
1.3% | 11/8/18 | 48,500 | 47,692 | 48,985 | ||||||||||||||
| Technicolor SA |
(d)(e)(j) |
Media |
L+600 |
1.3% | 7/10/20 | 33,885 | 32,921 | 34,254 | ||||||||||||||
| Tervita Corp. |
(d)(j) |
Commercial & Professional Services |
L+500 |
1.3% | 5/15/18 | 8,035 | 7,965 | 8,083 | ||||||||||||||
| Therakos, Inc. |
(d)(f) |
Pharmaceuticals, Biotechnology & Life Sciences |
L+625 |
1.3% | 12/27/17 | 27,060 | 26,494 | 27,162 | ||||||||||||||
| ThermaSys Corp. |
(d) |
Capital Goods |
L+400 |
1.3% | 5/3/19 | 9,875 | 9,785 | 9,768 | ||||||||||||||
| Totes Isotoner Corp. |
(d) |
Consumer Durables & Apparel |
L+575 |
1.5% | 7/7/17 | 6,622 | 6,546 | 6,660 | ||||||||||||||
| Toys “R” Us-Delaware, Inc. |
(e) |
Consumer Durables & Apparel |
L+450 |
1.5% | 9/1/16 | 1,520 | 1,524 | 1,379 | ||||||||||||||
| TravelCLICK, Inc. |
(d) |
Consumer Services |
L+450 |
1.3% | 3/16/16 | 7,776 | 7,712 | 7,854 | ||||||||||||||
| Tri-Northern Acquisition, Inc. |
(f)(h) |
Retailing |
L+800 |
1.3% | 7/1/19 | 54,725 | 54,725 | 54,725 | ||||||||||||||
| Tri-Northern Acquisition, Inc. |
(f) |
Retailing |
L+800 |
1.3% | 7/1/19 | 11,379 | 11,379 | 11,379 | ||||||||||||||
| Virtual Radiologic Corp. |
(g) |
Health Care Equipment & Services |
L+550 |
1.8% | 12/22/16 | 3,492 | 3,446 | 2,060 | ||||||||||||||
| VPG Group Holdings LLC |
(d)(f)(h) |
Materials |
L+900 |
1.0% | 10/4/16 | 64,070 | 63,409 | 65,031 | ||||||||||||||
| Willbros Group, Inc. |
(h)(j) |
Energy |
L+975 |
1.3% | 8/5/19 | 15,960 | 15,422 | 16,199 | ||||||||||||||
|
|
|
|
|
|||||||||||||||||||
| Total Senior Secured Loans—First Lien |
2,128,667 | 2,172,047 | ||||||||||||||||||||
| Unfunded Loan Commitments |
(48,439 | ) | (48,439 | ) | ||||||||||||||||||
|
|
|
|
|
|||||||||||||||||||
| Net Senior Secured Loans—First Lien |
2,080,228 | 2,123,608 | ||||||||||||||||||||
|
|
|
|
|
|||||||||||||||||||
See notes to consolidated financial statements.
118
Table of Contents
FS Investment Corporation
Consolidated Schedule of Investments (continued)
As of December 31, 2013
(in thousands, except share amounts)
| Portfolio Company(a) |
Footnotes |
Industry |
Rate |
Floor | Maturity | Principal Amount(b) |
Amortized Cost |
Fair Value(c) |
||||||||||||||
| Senior Secured Loans—Second Lien—34.0% |
||||||||||||||||||||||
| Advance Pierre Foods, Inc. |
(e)(f)(g) |
Food & Staples Retailing |
L+825 |
1.3% | 10/10/17 | $ | 22,556 | $ | 22,250 | $ | 21,879 | |||||||||||
| Advantage Sales & Marketing Inc. |
(e) |
Commercial & Professional Services |
L+725 |
1.0% | 6/12/18 | 14,844 | 14,844 | 15,081 | ||||||||||||||
| Affordable Care, Inc. |
(d)(f)(g)(h) |
Health Care Equipment & Services |
L+925 |
1.3% | 12/26/19 | 40,000 | 39,493 | 40,200 | ||||||||||||||
| Alliance Laundry Systems LLC |
Capital Goods |
L+825 |
1.3% | 12/10/19 | 2,012 | 1,994 | 2,041 | |||||||||||||||
| American Energy—Utica, LLC |
(f) |
Energy |
L+475, 4.75% PIK |
1.5% | 9/30/18 | 75,689 | 75,689 | 75,689 | ||||||||||||||
| American Racing and Entertainment, LLC |
(g) |
Consumer Services |
12.0% |
7/1/18 | 16,800 | 16,299 | 16,821 | |||||||||||||||
| Attachmate Corp. |
(e)(f)(i) |
Software & Services |
L+950 |
1.5% | 11/22/18 | 31,218 | 30,464 | 30,646 | ||||||||||||||
| Audio Visual Services Group, Inc. |
(d)(f)(g) |
Technology Hardware & Equipment |
L+950 |
1.3% | 5/9/18 | 52,885 | 51,962 | 54,603 | ||||||||||||||
| Brasa (Holdings) Inc. |
(f) |
Consumer Services |
L+950 |
1.5% | 1/20/20 | 11,180 | 10,813 | 11,292 | ||||||||||||||
| Brock Holdings III, Inc. |
(e)(g) |
Energy |
L+825 |
1.8% | 3/16/18 | 7,756 | 7,678 | 7,902 | ||||||||||||||
| Camp International Holding Co. |
(d) |
Capital Goods |
L+725 |
1.0% | 11/29/19 | 6,207 | 6,301 | 6,343 | ||||||||||||||
| CHG Buyer Corp. |
(d) |
Health Care Equipment & Services |
L+775 |
1.3% | 11/19/20 | 5,158 | 5,065 | 5,248 | ||||||||||||||
| Consolidated Precision Products Corp. |
(f) |
Capital Goods |
L+775 |
1.0% | 4/30/21 | 16,750 | 16,669 | 17,085 | ||||||||||||||
| Crossmark Holdings, Inc. |
Commercial & Professional Services |
L+750 |
1.3% | 12/21/20 | 7,778 | 7,707 | 7,749 | |||||||||||||||
| DEI Sales, Inc. |
(f)(g) |
Commercial & Professional Services |
L+900 |
1.5% | 1/15/18 | 57,500 | 56,850 | 57,284 | ||||||||||||||
| Eastman Kodak Co. |
(f) |
Consumer Durables & Apparel |
L+950 |
1.3% | 9/3/20 | 50,000 | 48,791 | 50,438 | ||||||||||||||
| EZE Software Group LLC |
(e) |
Software & Services |
L+725 |
1.3% | 4/5/21 | 2,381 | 2,359 | 2,427 | ||||||||||||||
| Fram Group Holdings Inc. |
(e) |
Automobiles & Components |
L+900 |
1.5% | 1/29/18 | 2,000 | 1,993 | 1,907 | ||||||||||||||
| ILC Industries, LLC |
(f)(g) |
Capital Goods |
L+1000 |
1.5% | 7/11/19 | 27,976 | 27,085 | 26,857 | ||||||||||||||
| Keystone Automotive Operations, Inc. |
(f) |
Automobiles & Components |
L+950 |
1.3% | 8/15/20 | 44,500 | 43,644 | 46,169 | ||||||||||||||
| Kronos Inc. |
(e)(f) |
Software & Services |
L+850 |
1.3% | 4/30/20 | 27,290 | 27,042 | 28,297 | ||||||||||||||
| LM U.S. Member LLC |
(g) |
Transportation |
L+825 |
1.3% | 10/26/20 | 9,375 | 9,248 | 9,510 | ||||||||||||||
| Mitchell International, Inc. |
(g) |
Software & Services |
L+750 |
1.0% | 10/11/21 | 15,000 | 14,854 | 15,258 | ||||||||||||||
| OSP Group, Inc. |
(d)(f)(g)(h) |
Consumer Durables & Apparel |
L+850 |
1.3% | 7/31/20 | 105,000 | 105,000 | 106,575 | ||||||||||||||
| P2 Upstream Acquisition Co. |
(g) |
Energy |
L+800 |
1.0% | 5/1/20 | 4,091 | 4,051 | 4,173 | ||||||||||||||
| Paw Luxco II Sarl |
(j) |
Consumer Durables & Apparel |
EURIBOR+950 |
1/29/19 | € | 20,000 | 24,230 | 24,882 | ||||||||||||||
| Pelican Products, Inc. |
(d) |
Capital Goods |
L+1000 |
1.5% | 6/14/19 | $ | 6,667 | 6,555 | 6,700 | |||||||||||||
| Pregis Corp. |
(f)(g) |
Capital Goods |
L+1000 |
1.5% | 3/23/18 | 50,000 | 49,283 | 50,250 | ||||||||||||||
| Ranpak Corp. |
(g) |
Commercial & Professional Services |
L+725 |
1.3% | 4/23/20 | 11,324 | 11,218 | 11,663 | ||||||||||||||
| Sensus USA Inc. |
(d)(e) |
Capital Goods |
L+725 |
1.3% | 5/9/18 | 8,571 | 8,576 | 8,571 | ||||||||||||||
| SESAC Holdings Inc. |
(f) |
Media |
L+875 |
1.3% | 7/12/19 | 3,000 | 2,961 | 3,075 | ||||||||||||||
| Stadium Management Corp. |
(f) |
Consumer Services |
L+950 |
1.3% | 12/7/18 | 23,529 | 23,163 | 23,647 | ||||||||||||||
| TNT Crane & Rigging, Inc. |
Energy |
L+900 |
1.0% | 11/27/21 | 1,500 | 1,381 | 1,448 | |||||||||||||||
See notes to consolidated financial statements.
119
Table of Contents
FS Investment Corporation
Consolidated Schedule of Investments (continued)
As of December 31, 2013
(in thousands, except share amounts)
| Portfolio Company(a) |
Footnotes |
Industry |
Rate |
Floor | Maturity | Principal Amount(b) |
Amortized Cost |
Fair Value(c) |
||||||||||||||
| TravelCLICK, Inc. |
(f)(g) |
Consumer Services |
L+850 |
1.3% | 3/26/18 | $ | 34,925 | $ | 34,620 | $ | 35,973 | |||||||||||
| Travelport LLC |
(g) |
Consumer Services |
4.0%, 4.4% PIK |
12/1/16 | 24,036 | 20,167 | 24,546 | |||||||||||||||
| TriZetto Group, Inc. |
(g) |
Software & Services |
L+725 |
1.3% | 3/28/19 | 8,372 | 8,265 | 8,037 | ||||||||||||||
| Vertafore, Inc. |
(e) |
Software & Services |
L+825 |
1.5% | 10/27/17 | 14,750 | 14,711 | 15,027 | ||||||||||||||
| Wall Street Systems Holdings, Inc. |
(d) |
Software & Services |
L+800 |
1.3% | 10/25/20 | 7,000 | 6,878 | 7,068 | ||||||||||||||
| WildHorse Resources, LLC |
(f) |
Energy |
L+625 |
1.3% | 12/13/18 | 15,407 | 15,123 | 15,484 | ||||||||||||||
|
|
|
|
|
|||||||||||||||||||
| Total Senior Secured Loans—Second Lien |
875,276 | 897,845 | ||||||||||||||||||||
|
|
|
|
|
|||||||||||||||||||
| Senior Secured Bonds—14.6% |
||||||||||||||||||||||
| Advanced Lighting Technologies, Inc. |
(f)(g) |
Materials |
10.5% |
6/1/19 | 78,500 | 76,913 | 56,520 | |||||||||||||||
| Allen Systems Group, Inc. |
(f)(g) |
Software & Services |
10.5% |
11/15/16 | 38,448 | 30,409 | 21,723 | |||||||||||||||
| Aspect Software, Inc. |
(e) |
Software & Services |
10.6% |
5/15/17 | 4,000 | 4,000 | 4,075 | |||||||||||||||
| Avaya Inc. |
(e)(f)(g) |
Technology Hardware & Equipment |
7.0% |
4/1/19 | 23,500 | 22,008 | 23,148 | |||||||||||||||
| Avaya Inc. |
(e) |
Technology Hardware & Equipment |
9.0% |
4/1/19 | 5,000 | 5,000 | 5,250 | |||||||||||||||
| Blackboard Inc. |
Software & Services |
7.8% |
11/15/19 | 6,500 | 6,500 | 6,486 | ||||||||||||||||
| Caesars Entertainment Operating Co. |
(f)(i)(j) |
Consumer Services |
9.0% |
2/15/20 | 20,000 | 19,066 | 19,481 | |||||||||||||||
| Caesars Entertainment Resort Properties, LLC |
(e)(f) |
Consumer Services |
11.0% |
10/1/21 | 54,598 | 54,288 | 56,398 | |||||||||||||||
| Chassix, Inc. |
Automobiles & Components |
9.3% |
8/1/18 | 2,000 | 2,067 | 2,140 | ||||||||||||||||
| Clear Channel Communications, Inc. |
(d)(e) |
Media |
9.0% |
12/15/19 | 1,152 | 989 | 1,182 | |||||||||||||||
| Dole Food Co., Inc. |
(g) |
Food & Staples Retailing |
7.3% |
5/1/19 | 6,400 | 6,400 | 6,424 | |||||||||||||||
| FairPoint Communications, Inc. |
(f)(j) |
Telecommunication Services |
8.8% |
8/15/19 | 19,750 | 19,750 | 20,984 | |||||||||||||||
| Global A&T Electronics Ltd. |
(j) |
Technology Hardware & Equipment |
10.0% |
2/1/19 | 9,000 | 9,000 | 7,920 | |||||||||||||||
| HOA Restaurant Group, LLC |
(f) |
Consumer Services |
11.3% |
4/1/17 | 14,100 | 14,109 | 14,805 | |||||||||||||||
| JW Aluminum Co. |
(f)(g) |
Materials |
11.5% |
11/15/17 | 47,980 | 47,336 | 47,920 | |||||||||||||||
| Kinetic Concepts, Inc. |
(f) |
Health Care Equipment & Services |
10.5% |
11/1/18 | 11,660 | 11,146 | 13,465 | |||||||||||||||
| Logan’s Roadhouse Inc. |
(e)(g) |
Consumer Services |
10.8% |
10/15/17 | 18,494 | 16,084 | 13,843 | |||||||||||||||
| Neff Rental LLC |
(f) |
Capital Goods |
9.6% |
5/15/16 | 7,352 | 7,597 | 7,793 | |||||||||||||||
| Ryerson Inc. |
(e) |
Capital Goods |
9.0% |
10/15/17 | 3,100 | 3,100 | 3,294 | |||||||||||||||
| Sorenson Communication, Inc. |
(g) |
Telecommunication Services |
10.5% |
2/1/15 | 39,000 | 35,991 | 29,171 | |||||||||||||||
| Speedy Cash Intermediate Holdings Corp. |
(f) |
Diversified Financials |
10.8% |
5/15/18 | 19,000 | 19,294 | 20,170 | |||||||||||||||
| Tervita Corp. |
(e)(j) |
Commercial & Professional Services |
8.0% |
11/15/18 | 3,250 | 3,250 | 3,356 | |||||||||||||||
|
|
|
|
|
|||||||||||||||||||
| Total Senior Secured Bonds |
414,297 | 385,548 | ||||||||||||||||||||
|
|
|
|
|
|||||||||||||||||||
See notes to consolidated financial statements.
120
Table of Contents
FS Investment Corporation
Consolidated Schedule of Investments (continued)
As of December 31, 2013
(in thousands, except share amounts)
| Portfolio Company(a) |
Footnotes |
Industry |
Rate |
Floor | Maturity | Principal Amount(b) |
Amortized Cost |
Fair Value(c) |
||||||||||||||
| Subordinated Debt—16.2% |
||||||||||||||||||||||
| Alta Mesa Holdings, L.P. |
(e) |
Energy |
9.6% |
10/15/18 | $ | 11,700 | $ | 11,598 | $ | 12,572 | ||||||||||||
| Asurion, LLC |
(f) |
Insurance |
L+950 |
1.5% | 8/16/19 | 15,000 | 14,629 | 15,488 | ||||||||||||||
| Aurora Diagnostics, LLC |
(f)(g) |
Pharmaceuticals, Biotechnology & Life Sciences |
10.8% |
1/15/18 | 18,065 | 18,109 | 13,368 | |||||||||||||||
| Brand Energy & Infrastructure Services, Inc. |
(g) |
Energy |
8.5% |
12/1/21 | 25,000 | 25,000 | 25,500 | |||||||||||||||
| Comstock Resources, Inc. |
(f)(j) |
Energy |
9.5% |
6/15/20 | 10,500 | 10,075 | 11,780 | |||||||||||||||
| CrownRock, L.P. |
(e)(f) |
Energy |
7.1% |
4/15/21 | 25,000 | 25,000 | 24,856 | |||||||||||||||
| Cumulus Media Inc. |
(f)(j) |
Media |
7.8% |
5/1/19 | 5,000 | 4,518 | 5,313 | |||||||||||||||
| Exopack Holdings S.A. |
(g)(j) |
Materials |
7.9% |
11/1/19 | 2,500 | 2,500 | 2,500 | |||||||||||||||
| Flanders Corp. |
(f)(g) |
Capital Goods |
10.0%, 3.8% PIK |
5/14/18 | 15,818 | 15,661 | 16,193 | |||||||||||||||
| Harland Clarke Holdings Corp. |
(g) |
Commercial & Professional Services |
9.5% |
5/15/15 | 2,193 | 2,060 | 2,202 | |||||||||||||||
| Hub International Ltd. |
(e) |
Insurance |
7.9% |
10/1/21 | 2,250 | 2,250 | 2,326 | |||||||||||||||
| Ipreo Holdings LLC |
(f) |
Software & Services |
11.8% |
8/15/18 | 10,000 | 9,966 | 10,513 | |||||||||||||||
| Kinetic Concepts, Inc. |
(e)(f)(g) |
Health Care Equipment & Services |
12.5% |
11/1/19 | 24,700 | 23,586 | 27,849 | |||||||||||||||
| KODA Distribution Group, Inc. |
(f) |
Materials |
11.3% |
9/30/19 | 32,500 | 31,877 | 32,825 | |||||||||||||||
| Monitronics International, Inc. |
(e)(j) |
Consumer Services |
9.1% |
4/1/20 | 2,250 | 2,250 | 2,396 | |||||||||||||||
| Mood Media Corp. |
(e)(f)(g)(j) |
Media |
9.3% |
10/15/20 | 31,400 | 30,632 | 27,632 | |||||||||||||||
| QR Energy, L.P. |
(e)(j) |
Energy |
9.3% |
8/1/20 | 3,250 | 3,210 | 3,385 | |||||||||||||||
| Resolute Energy Corp. |
(e)(j) |
Energy |
8.5% |
5/1/20 | 8,500 | 8,589 | 8,948 | |||||||||||||||
| RKI Exploration & Production, LLC |
(e) |
Energy |
8.5% |
8/1/21 | 10,900 | 10,900 | 11,538 | |||||||||||||||
| Samson Investment Co. |
(f) |
Energy |
9.8% |
2/15/20 | 10,000 | 10,000 | 10,929 | |||||||||||||||
| Sequel Industrial Products Holdings, LLC |
(g) |
Energy |
12.0%, 2.5% PIK |
5/10/18 | 15,792 | 15,551 | 16,187 | |||||||||||||||
| Sidewinder Drilling Inc. |
(f)(g) |
Capital Goods |
9.8% |
11/15/19 | 8,000 | 8,000 | 7,080 | |||||||||||||||
| ThermaSys Corp. |
(f)(g) |
Capital Goods |
9.0%, 1.8% PIK |
5/3/20 | 130,956 | 130,956 | 130,301 | |||||||||||||||
| VPG Group Holdings LLC |
(f) |
Materials |
11.0%, 2.0% PIK |
7/15/19 | 5,047 | 5,047 | 5,047 | |||||||||||||||
|
|
|
|
|
|||||||||||||||||||
| Total Subordinated Debt |
421,964 | 426,728 | ||||||||||||||||||||
|
|
|
|
|
|||||||||||||||||||
| Collateralized Securities—5.3% |
||||||||||||||||||||||
| ACASC 2013-2A B |
(g)(j) |
Diversified Financials |
12.6% |
10/15/23 | 30,500 | 30,019 | 30,896 | |||||||||||||||
| Apidos CDO IV Class E |
(g)(j) |
Diversified Financials |
L+360 |
10/27/18 | 2,000 | 1,301 | 1,908 | |||||||||||||||
| Ares 2007 CLO 11A Class E |
(g)(j) |
Diversified Financials |
L+600 |
10/11/21 | 4,775 | 3,327 | 4,760 | |||||||||||||||
| Ares 2007 CLO 12X Class E |
(g)(j) |
Diversified Financials |
L+575 |
11/25/20 | 2,252 | 1,863 | 2,219 | |||||||||||||||
| Carlyle Azure CLO Class Income |
(j) |
Diversified Financials |
18.9% |
5/27/20 | 28,000 | 11,436 | 14,276 | |||||||||||||||
| Dryden CDO 23A Class Subord. |
(j) |
Diversified Financials |
17.5% |
7/17/23 | 10,000 | 6,428 | 8,066 | |||||||||||||||
See notes to consolidated financial statements.
121
Table of Contents
FS Investment Corporation
Consolidated Schedule of Investments (continued)
As of December 31, 2013
(in thousands, except share amounts)
| Portfolio Company(a) |
Footnotes |
Industry |
Rate |
Floor | Maturity | Principal Amount(b) |
Amortized Cost |
Fair Value(c) |
||||||||||||||
| JP Morgan Chase Bank, N.A. Credit-Linked Notes |
(g)(j) |
Diversified Financials |
11.2% |
12/20/21 | $ | 16,740 | $ | 16,710 | $ | 16,740 | ||||||||||||
| Lightpoint CLO 2006 V Class D |
(g)(j) |
Diversified Financials |
L+365 |
8/5/19 | 6,500 | 3,758 | 6,054 | |||||||||||||||
| Rampart CLO 2007 1A Class Subord. |
(j) |
Diversified Financials |
40.3% |
10/25/21 | 10,000 | 3,676 | 7,404 | |||||||||||||||
| Stone Tower CLO VI Class Subord. |
(g)(j) |
Diversified Financials |
39.8% |
4/17/21 | 5,000 | 3,030 | 5,230 | |||||||||||||||
| Wind River CLO Ltd. 2012 1A Class Sub B |
(j) |
Diversified Financials |
13.5% |
1/15/24 | 42,504 | 38,658 | 42,955 | |||||||||||||||
|
|
|
|
|
|||||||||||||||||||
| Total Collateralized Securities |
120,206 | 140,508 | ||||||||||||||||||||
|
|
|
|
|
|||||||||||||||||||
| Equity/Other—6.2%(k) |
|
|
|
Number of Shares |
Amortized Cost |
Fair Value(c) |
||||||||||||||||
| American Energy Ohio Holdings, LLC, Common Equity |
(l)(m) |
Energy |
5,070,590 | 5,071 | 5,071 | |||||||||||||||||
| Aquilex Corp., Common Equity, Class A Shares |
(f) |
Energy |
15,128 | 1,087 | 3,333 | |||||||||||||||||
| Aquilex Corp., Common Equity, Class B Shares |
(f)(g) |
Energy |
32,637 | 1,690 | 7,190 | |||||||||||||||||
| Burleigh Point, Ltd., Warrants |
(j)(l) |
Retailing |
17,256,081 | 1,898 | 4,659 | |||||||||||||||||
| CoSentry.Net, LLC, Preferred Equity |
(g)(l) |
Software & Services |
2,632 | 2,500 | 2,500 | |||||||||||||||||
| Eastman Kodak Co., Common Equity |
(f)(l) |
Consumer Durables & Apparel |
61,859 | 1,202 | 2,147 | |||||||||||||||||
| ERC Ireland Holdings Ltd., Common Equity |
(g)(j)(l) |
Telecommunication Services |
21,099 | — | — | |||||||||||||||||
| ERC Ireland Holdings Ltd., Warrants |
(g)(j)(l) |
Telecommunication Services |
4,943 | — | — | |||||||||||||||||
| Flanders Corp., Common Equity |
(g)(l) |
Capital Goods |
5,000,000 | 5,000 | 9,500 | |||||||||||||||||
| Florida Gaming Centers, Inc., Warrants |
(g)(l) |
Consumer Services |
71 | — | 2,979 | |||||||||||||||||
| Florida Gaming Corp., Warrants |
(g)(l) |
Consumer Services |
226,635 | — | — | |||||||||||||||||
| HBC Solutions, Inc., Common Equity, Class A Units |
(l) |
Media |
26,984 | 3,051 | 2,855 | |||||||||||||||||
| Ipreo Holdings LLC, Common Equity |
(g)(l) |
Software & Services |
1,000,000 | 1,000 | 2,100 | |||||||||||||||||
| JW Aluminum Co., Common Equity |
(g)(l) |
Materials |
37,500 | 3,225 | — | |||||||||||||||||
| Leading Edge Aviation Services, Inc., Common Equity |
(g)(l) |
Capital Goods |
4,401 | 464 | 924 | |||||||||||||||||
| Leading Edge Aviation Services, Inc., Preferred Equity |
(g)(l) |
Capital Goods |
1,303 | 1,303 | 1,303 | |||||||||||||||||
| Micronics, Inc., Common Equity |
(l) |
Capital Goods |
50,000 | 500 | 520 | |||||||||||||||||
| Micronics, Inc., Preferred Equity |
(l) |
Capital Goods |
50 | 500 | 500 | |||||||||||||||||
| Milagro Holdings, LLC, Common Equity |
(g)(l) |
Energy |
12,057 | 50 | — | |||||||||||||||||
| Milagro Holdings, LLC, Preferred Equity |
(l) |
Energy |
283,947 | 11,180 | 2,104 | |||||||||||||||||
| Plains Offshore Operations Inc., Preferred Equity |
(f)(g) |
Energy |
50,000 | 55,404 | 62,630 | |||||||||||||||||
| Plains Offshore Operations Inc., Warrants |
(f)(g)(l) |
Energy |
1,013,444 | 1,722 | 2,635 | |||||||||||||||||
| Safariland, LLC, Common Equity |
(g)(l) |
Capital Goods |
25,000 | 2,500 | 5,303 | |||||||||||||||||
| Safariland, LLC, Preferred Equity |
(g) |
Capital Goods |
1,021 | 20,881 | 20,843 | |||||||||||||||||
See notes to consolidated financial statements.
122
Table of Contents
FS Investment Corporation
Consolidated Schedule of Investments (continued)
As of December 31, 2013
(in thousands, except share amounts)
| Portfolio Company(a) |
Footnotes |
Industry |
|
|
|
Number of Shares |
Amortized Cost |
Fair Value(c) |
||||||||||||||
| Safariland, LLC, Warrants |
(g)(l) |
Capital Goods |
2,263 | $ | 473 | $ | 962 | |||||||||||||||
| Sequel Industrial Products Holdings, LLC, Common Equity |
(g)(l) |
Energy |
3,330,600 | 3,400 | 6,661 | |||||||||||||||||
| Sequel Industrial Products Holdings, LLC, Preferred Equity |
(g)(l) |
Energy |
8,000,000 | 9,180 | 9,190 | |||||||||||||||||
| Sequel Industrial Products Holdings, LLC, Warrants |
(g)(l) |
Energy |
20,681 | 13 | 41 | |||||||||||||||||
| ThermaSys Corp., Common Equity |
(g)(l) |
Capital Goods |
51,813 | 1 | — | |||||||||||||||||
| ThermaSys Corp., Preferred Equity |
(g) |
Capital Goods |
51,813 | 5,181 | 3,756 | |||||||||||||||||
| VPG Group Holdings LLC, Class A-2 Units |
(g)(l) |
Materials |
2,500,000 | 3,638 | 3,638 | |||||||||||||||||
|
|
|
|
|
|||||||||||||||||||
| Total Equity/Other |
142,114 | 163,344 | ||||||||||||||||||||
|
|
|
|
|
|||||||||||||||||||
| TOTAL INVESTMENTS—156.7% |
$ | 4,054,085 | 4,137,581 | |||||||||||||||||||
|
|
|
|||||||||||||||||||||
| LIABILITIES IN EXCESS OF OTHER ASSETS—(56.7%) |
(1,496,589 | ) | ||||||||||||||||||||
|
|
|
|||||||||||||||||||||
| NET ASSETS—100.0% |
$ | 2,640,992 | ||||||||||||||||||||
|
|
|
|||||||||||||||||||||
| (a) | Security may be an obligation of one or more entities affiliated with the named company. |
| (b) | Denominated in U.S. dollars unless otherwise noted. |
| (c) | Fair value determined by the Company’s board of directors (see Note 7). |
| (d) | Security or portion thereof held within Arch Street Funding LLC and is pledged as collateral supporting the amounts outstanding under the revolving credit facility with Citibank, N.A. (see Note 8). |
| (e) | Security or portion thereof held within Broad Street Funding LLC and is pledged as collateral supporting the amounts outstanding under the revolving credit facility with Deutsche Bank AG, New York Branch (see Note 8). |
| (f) | Security or portion thereof held within Locust Street Funding LLC and is pledged as collateral supporting the amounts outstanding under the Class A Notes issued to Race Street Funding LLC pursuant to an indenture with Citibank, N.A., as trustee (see Note 8). |
| (g) | Security or portion thereof held within Race Street Funding LLC and is pledged as collateral supporting the amounts outstanding under the repurchase agreement with JPMorgan Chase Bank, N.A., London Branch (see Note 8). |
| (h) | Security or portion thereof held within Walnut Street Funding LLC and is pledged as collateral supporting the amounts outstanding under the revolving credit facility with Wells Fargo Bank, National Association (see Note 8). |
| (i) | Position or portion thereof unsettled as of December 31, 2013. |
| (j) | The investment is not a qualifying asset under the Investment Company Act of 1940, as amended. A business development company may not acquire any asset other than qualifying assets, unless, at the time the acquisition is made, qualifying assets represent at least 70% of the company’s total assets. As of December 31, 2013, 84.4% of the Company’s total assets represented qualifying assets. |
| (k) | Listed investments may be treated as debt for GAAP or tax purposes. |
| (l) | Security is non-income producing. |
| (m) | Security held within IC American Energy Investments, Inc., a wholly-owned subsidiary of the Company. |
See notes to consolidated financial statements.
123
Table of Contents
FS Investment Corporation
Notes to Consolidated Financial Statements
(in thousands, except share and per share amounts)
Note 1. Principal Business and Organization
FS Investment Corporation (NYSE: FSIC), or the Company, was incorporated under the general corporation laws of the State of Maryland on December 21, 2007 and formally commenced investment operations on January 2, 2009. The Company is an externally managed, non-diversified, closed-end management investment company that has elected to be regulated as a business development company, or BDC, under the Investment Company Act of 1940, as amended, or the 1940 Act. In addition, the Company has elected to be treated for U.S. federal income tax purposes, and intends to qualify annually, as a regulated investment company, or RIC, as defined under Subchapter M of the Internal Revenue Code of 1986, as amended, or the Code. As of December 31, 2014, the Company had four wholly-owned financing subsidiaries and three wholly-owned subsidiaries through which it holds equity interests in non-controlled portfolio companies. The consolidated financial statements include both the Company’s accounts and the accounts of its wholly-owned subsidiaries as of December 31, 2014. All significant intercompany transactions have been eliminated in consolidation.
The Company’s investment objectives are to generate current income and, to a lesser extent, long-term capital appreciation by investing primarily in senior secured loans and second lien secured loans of private U.S. companies. The Company seeks to generate superior risk-adjusted returns by focusing on debt investments in a broad array of private U.S. companies, including middle market companies, which the Company defines as companies with annual revenues of $50 million to $2.5 billion at the time of investment. The Company may purchase interests in loans or make other debt investments, including investments in senior secured bonds, through secondary market transactions in the “over-the-counter” market or directly from the Company’s target companies as primary market or directly originated investments. In connection with the Company’s debt investments, the Company may on occasion receive equity interests such as warrants or options as additional consideration. The Company may also purchase minority interests in the form of common or preferred equity or the equity-related securities in the Company’s target companies, generally in conjunction with one of the Company’s debt investments or through a co-investment with a financial sponsor, such as an institutional investor or private equity firm. In addition, a portion of the Company’s portfolio may be comprised of corporate bonds, other debt securities and derivatives, including total return swaps and credit default swaps.
Note 2. Summary of Significant Accounting Policies
Basis of Presentation: The accompanying audited consolidated financial statements of the Company have been prepared in accordance with U.S. generally accepted accounting principles, or GAAP. The Company is considered an investment company under GAAP and follows the accounting and reporting guidance applicable to investment companies. The Company has evaluated the impact of subsequent events through the date the consolidated financial statements were issued and filed with the Securities and Exchange Commission, or the SEC.
Use of Estimates: The preparation of the audited consolidated financial statements in conformity with GAAP requires management to make estimates and assumptions that affect the reported amounts of assets and liabilities, and disclosure of contingent assets and liabilities at the date of the financial statements and the reported amounts of revenues and expenses during the reporting period. Actual results could differ from those estimates. Many of the amounts have been rounded, and all amounts are in thousands, except share and per share amounts.
Cash and Cash Equivalents: The Company considers all highly liquid investments with original maturities of three months or less to be cash equivalents. All cash balances are maintained with high credit quality financial institutions, which are members of the Federal Deposit Insurance Corporation.
124
Table of Contents
FS Investment Corporation
Notes to Consolidated Financial Statements (continued)
(in thousands, except share and per share amounts)
Note 2. Summary of Significant Accounting Policies (continued)
Valuation of Portfolio Investments: The Company determines the net asset value of its investment portfolio each quarter. Securities that are publicly-traded are valued at the reported closing price on the valuation date. Securities that are not publicly-traded are valued at fair value as determined in good faith by the Company’s board of directors. In connection with that determination, the Company’s investment adviser, FB Income Advisor, LLC, or FB Advisor, provides the Company’s board of directors with portfolio company valuations which are based on relevant inputs, including, but not limited to, indicative dealer quotes, values of like securities, recent portfolio company financial statements and forecasts, and valuations prepared by third-party valuation services.
Accounting Standards Codification Topic 820, Fair Value Measurements and Disclosure, or ASC Topic 820, issued by the Financial Accounting Standards Board, or the FASB, clarifies the definition of fair value and requires companies to expand their disclosure about the use of fair value to measure assets and liabilities in interim and annual periods subsequent to initial recognition. ASC Topic 820 defines fair value as the price that would be received from the sale of an asset or paid to transfer a liability in an orderly transaction between market participants at the measurement date. ASC Topic 820 also establishes a three-tier fair value hierarchy, which prioritizes the inputs used in measuring fair value. These tiers include: Level 1, defined as observable inputs such as quoted prices in active markets; Level 2, which includes inputs such as quoted prices for similar securities in active markets and quoted prices for identical securities where there is little or no activity in the market; and Level 3, defined as unobservable inputs for which little or no market data exists, therefore requiring an entity to develop its own assumptions.
With respect to investments for which market quotations are not readily available, the Company undertakes a multi-step valuation process each quarter, as described below:
| • | the Company’s quarterly valuation process begins with FB Advisor’s management team providing a preliminary valuation of each portfolio company or investment to the Company’s valuation committee, which valuation may be obtained from an independent valuation firm, if applicable; |
| • | preliminary valuation conclusions are then documented and discussed with the Company’s valuation committee; |
| • | the Company’s valuation committee reviews the preliminary valuation and FB Advisor’s management team, together with its independent valuation firm, if applicable, responds and supplements the preliminary valuation to reflect any comments provided by the valuation committee; and |
| • | the Company’s board of directors discusses valuations and determines the fair value of each investment in the Company’s portfolio in good faith based on various statistical and other factors, including the input and recommendation of FB Advisor, the valuation committee and any third-party valuation firm, if applicable. |
Determination of fair value involves subjective judgments and estimates. Accordingly, these notes to the Company’s audited consolidated financial statements refer to the uncertainty with respect to the possible effect of such valuations and any change in such valuations on the Company’s consolidated financial statements. In making its determination of fair value, the Company’s board of directors may use independent third-party pricing or valuation services. However, the Company’s board of directors is not required to determine fair value in accordance with the valuation provided by any single source, and may use any relevant data, including information obtained from FB Advisor or any independent third-party valuation or pricing service that the
125
Table of Contents
FS Investment Corporation
Notes to Consolidated Financial Statements (continued)
(in thousands, except share and per share amounts)
Note 2. Summary of Significant Accounting Policies (continued)
Company’s board of directors deems to be reliable in determining fair value under the circumstances. Below is a description of factors that the Company’s board of directors may consider when valuing the Company’s debt and equity investments.
Valuation of fixed income investments, such as loans and debt securities, depends upon a number of factors, including prevailing interest rates for like securities, expected volatility in future interest rates, call features, put features and other relevant terms of the debt. For investments without readily available market prices, the Company may incorporate these factors into discounted cash flow models to arrive at fair value. Other factors that the Company’s board of directors may consider include the borrower’s ability to adequately service its debt, the fair market value of the portfolio company in relation to the face amount of its outstanding debt and the quality of collateral securing the Company’s debt investments.
For convertible debt securities, fair value generally approximates the fair value of the debt plus the fair value of an option to purchase the underlying security (the security into which the debt may convert) at the conversion price. To value such an option, a standard option pricing model may be used.
The Company’s equity interests in portfolio companies for which there is no liquid public market are valued at fair value. The Company’s board of directors, in its analysis of fair value, may consider various factors, such as multiples of earnings before interest, taxes, depreciation and amortization, or EBITDA, cash flows, net income, revenues or, in limited instances, book value or liquidation value. All of these factors may be subject to adjustments based upon the particular circumstances of a portfolio company or the Company’s actual investment position. For example, adjustments to EBITDA may take into account compensation to previous owners or acquisition, recapitalization, restructuring or other related items.
The Company’s board of directors may also look to private merger and acquisition statistics, public trading multiples discounted for illiquidity and other factors, valuations implied by third-party investments in the portfolio companies or industry practices in determining fair value. The Company’s board of directors may also consider the size and scope of a portfolio company and its specific strengths and weaknesses, and may apply discounts or premiums, where and as appropriate, due to the higher (or lower) financial risk and/or the size of portfolio companies relative to comparable firms, as well as such other factors as the Company’s board of directors, in consultation with any third party valuation firm, if applicable, may consider relevant in assessing fair value. Generally, the value of the Company’s equity interests in public companies for which market quotations are readily available is based upon the most recent closing public market price. Portfolio securities that carry certain restrictions on sale are typically valued at a discount from the public market value of the security.
When the Company receives warrants or other equity securities at nominal or no additional cost in connection with an investment in a debt security, the cost basis in the investment will be allocated between the debt securities and any such warrants or other equity securities received at the time of origination. The Company’s board of directors subsequently values these warrants or other equity securities received at fair value.
The fair values of the Company’s investments are determined in good faith by the Company’s board of directors. The Company’s board of directors is solely responsible for the valuation of the Company’s portfolio investments at fair value as determined in good faith pursuant to the Company’s valuation policy and consistently applied valuation process.
126
Table of Contents
FS Investment Corporation
Notes to Consolidated Financial Statements (continued)
(in thousands, except share and per share amounts)
Note 2. Summary of Significant Accounting Policies (continued)
Revenue Recognition: Security transactions are accounted for on the trade date. The Company records interest income on an accrual basis to the extent that it expects to collect such amounts. The Company records dividend income on the ex-dividend date. The Company does not accrue as a receivable interest or dividends on loans and securities if it has reason to doubt its ability to collect such income. Loan origination fees, original issue discount and market discount are capitalized and the Company amortizes such amounts as interest income over the respective term of the loan or security. Upon the prepayment of a loan or security, any unamortized loan origination fees and original issue discount are recorded as interest income. Structuring and other upfront fees are recorded as fee income when earned. The Company records prepayment premiums on loans and securities as fee income when it receives such amounts.
Net Realized Gains or Losses, Net Change in Unrealized Appreciation or Depreciation and Net Change in Unrealized Gains or Losses on Foreign Currency: Gains or losses on the sale of investments are calculated by using the specific identification method. The Company measures realized gains or losses by the difference between the net proceeds from the repayment or sale and the amortized cost basis of the investment, without regard to unrealized appreciation or depreciation previously recognized, but considering unamortized upfront fees. Net change in unrealized appreciation or depreciation reflects the change in portfolio investment values during the reporting period, including any reversal of previously recorded unrealized gains or losses when gains or losses are realized. Net change in unrealized gains or losses on foreign currency reflects the change in the value of receivables or accruals during the reporting period due to the impact of foreign currency fluctuations.
Capital Gains Incentive Fee: At the Company’s 2013 annual meeting of stockholders, the Company received stockholder approval to amend and restate the investment advisory and administrative services agreement, dated February 12, 2008 (as amended on August 5, 2008), or the 2008 investment advisory and administrative services agreement, by and between the Company and FB Income Advisor, LLC, or FB Advisor, effective upon a listing of the Company’s shares of common stock on a national securities exchange. The Company’s shares of common stock were listed and commenced trading on the New York Stock Exchange, or the NYSE, on April 16, 2014. On April 16, 2014, the Company entered into an amended and restated investment advisory agreement, or the April 2014 investment advisory agreement, with FB Advisor. Also on April 16, 2014, the Company entered into an administration agreement with FB Advisor, or the administration agreement, which governs the administrative services provided to the Company by FB Advisor that had previously been addressed in the 2008 investment advisory and administrative services agreement.
At a special meeting of stockholders of the Company that was adjourned on June 23, 2014 and reconvened on July 17, 2014, the Company received stockholder approval to amend and restate the April 2014 investment advisory agreement. On July 17, 2014, the Company entered into an amended and restated investment advisory agreement, or the July 2014 investment advisory agreement, with FB Advisor.
Pursuant to the terms of each of the 2008 investment advisory and administrative services agreement, the April 2014 investment advisory agreement and the July 2014 investment advisory agreement, the incentive fee on capital gains is determined and payable in arrears as of the end of each calendar year (or upon termination of such agreement). Such fee will equal 20.0% of the Company’s incentive fee capital gains (i.e., the Company’s realized capital gains on a cumulative basis from inception, calculated as of the end of the applicable period, net of all realized capital losses and unrealized capital depreciation on a cumulative basis), less the aggregate amount of any previously paid capital gains incentive fees. On a quarterly basis, the Company accrues for the capital gains incentive fee by calculating such fee as if it were due and payable as of the end of such period.
127
Table of Contents
FS Investment Corporation
Notes to Consolidated Financial Statements (continued)
(in thousands, except share and per share amounts)
Note 2. Summary of Significant Accounting Policies (continued)
While none of the 2008 investment advisory and administrative services agreement, the April 2014 investment advisory agreement or the July 2014 investment advisory agreement include or contemplate the inclusion of unrealized gains in the calculation of the capital gains incentive fee, pursuant to an interpretation of an American Institute of Certified Public Accountants, or AICPA, Technical Practice Aid for investment companies, commencing during the quarter ended December 31, 2010, the Company changed its methodology for accruing for this incentive fee to include unrealized gains in the calculation of the capital gains incentive fee expense and related accrued capital gains incentive fee. This accrual reflects the incentive fees that would be payable to FB Advisor if the Company’s entire portfolio was liquidated at its fair value as of the balance sheet date even though FB Advisor is not entitled to an incentive fee with respect to unrealized gains unless and until such gains are actually realized.
Subordinated Income Incentive Fee: Pursuant to the terms of each of the 2008 investment advisory and administrative services agreement, the April 2014 investment advisory agreement and the July 2014 investment advisory agreement, FB Advisor may also be entitled to receive a subordinated incentive fee on income. The subordinated incentive fee on income under the 2008 investment advisory and administrative services agreement, which was calculated and payable quarterly in arrears, equaled 20.0% of the Company’s “pre-incentive fee net investment income” for the immediately preceding quarter and was subject to a hurdle rate, expressed as a rate of return on adjusted capital, as defined in the 2008 investment advisory and administrative services agreement, equal to 2.0% per quarter, or an annualized hurdle rate of 8.0%. As a result, FB Advisor did not earn this incentive fee for any quarter until the Company’s pre-incentive fee net investment income for such quarter exceeded the hurdle rate of 2.0%. Once the Company’s pre-incentive fee net investment income in any quarter exceeded the hurdle rate, FB Advisor was entitled to a “catch-up” fee equal to the amount of the pre-incentive fee net investment income in excess of the hurdle rate, until the Company’s pre-incentive fee net investment income for such quarter equaled 2.5%, or 10.0% annually, of adjusted capital. Thereafter, FB Advisor received 20.0% of pre-incentive fee net investment income. Under the April 2014 investment advisory agreement, the subordinated incentive fee on income was calculated in the same manner, except that the hurdle rate used to compute the subordinated incentive fee on income was based on the value of the Company’s net assets rather than adjusted capital.
Under the July 2014 investment advisory agreement, the hurdle rate, expressed as a rate of return on the value of the Company’s net assets, was reduced from 2.0% to 1.875% per quarter, or an annualized hurdle rate of 7.5%. As a result, FB Advisor will not earn this incentive fee for any quarter until the Company’s pre-incentive fee net investment income for such quarter exceeds the hurdle rate of 1.875%. Once the Company’s pre-incentive fee net investment income in any quarter exceeds the hurdle rate, FB Advisor will be entitled to a “catch-up” fee equal to the amount of the pre-incentive fee net investment income in excess of the hurdle rate, until the Company’s pre-incentive fee net investment income for such quarter equals 2.34375%, or 9.375% annually, of net assets. Thereafter, FB Advisor will be entitled to receive 20.0% of pre-incentive fee net investment income.
Under both the April 2014 investment advisory agreement and the July 2014 investment advisory agreement, the subordinated incentive fee on income is subject to a total return requirement, which provides that no incentive fee in respect of the Company’s pre-incentive fee net investment income will be payable except to the extent that 20.0% of the cumulative net increase in net assets resulting from operations over the then-current and eleven preceding calendar quarters exceeds the cumulative incentive fees accrued and/or paid for the eleven preceding calendar quarters. Accordingly, any subordinated incentive fee on income that is payable in a calendar quarter will be limited to the lesser of (i) 20.0% of the amount by which the Company’s pre-incentive fee net
128
Table of Contents
FS Investment Corporation
Notes to Consolidated Financial Statements (continued)
(in thousands, except share and per share amounts)
Note 2. Summary of Significant Accounting Policies (continued)
investment income for such calendar quarter exceeds the applicable quarterly hurdle rate, subject to the “catch-up” provision, and (ii) (x) 20.0% of the cumulative net increase in net assets resulting from operations for the then-current and eleven preceding calendar quarters minus (y) the cumulative incentive fees accrued and/or paid for the eleven preceding calendar quarters. For the foregoing purpose, the “cumulative net increase in net assets resulting from operations” is the sum of pre-incentive fee net investment income, base management fees, realized gains and losses and unrealized appreciation and depreciation of the Company for the then-current and eleven preceding calendar quarters. There will be no accumulation of amounts on the hurdle rate from quarter to quarter and, accordingly, there will be no clawback of amounts previously paid if subsequent quarters are below the applicable quarterly hurdle rate and there will be no delay of payment if prior quarters are below the applicable quarterly hurdle rate.
Income Taxes: The Company has elected to be treated for U.S. federal income tax purposes, and intends to qualify annually, as a RIC under Subchapter M of the Code. To qualify for and maintain qualification as a RIC, the Company must, among other things, meet certain source-of-income and asset diversification requirements and distribute to its stockholders, for each taxable year, at least 90% of its “investment company taxable income,” which is generally the Company’s net ordinary income plus the excess, if any, of realized net short-term capital gains over realized net long-term capital losses. As a RIC, the Company will not have to pay corporate-level U.S. federal income taxes on any income that it distributes to its stockholders. The Company intends to make distributions in an amount sufficient to qualify for and maintain its RIC status each year and to not pay any U.S. federal income taxes on income so distributed. The Company is also subject to nondeductible federal excise taxes if it does not distribute at least 98% of net ordinary income, 98.2% of any capital gain net income, if any, and any recognized and undistributed income from prior years for which it paid no U.S. federal income taxes. The Company accrued $5,400, $5,742 and $500 in estimated excise taxes payable in respect of income received during the years ended December 31, 2014, 2013 and 2012, respectively. During the years ended December 31, 2014, 2013, and 2012 respectively, the Company paid $5,407, $1,347 and $761 in excise and other taxes.
Uncertainty in Income Taxes: The Company evaluates its tax positions to determine if the tax positions taken meet the minimum recognition threshold in connection with accounting for uncertainties in income tax positions taken or expected to be taken for the purposes of measuring and recognizing tax benefits or liabilities in the Company’s consolidated financial statements. Recognition of a tax benefit or liability with respect to an uncertain tax position is required only when the position is “more likely than not” to be sustained assuming examination by taxing authorities. The Company recognizes interest and penalties, if any, related to unrecognized tax liabilities as income tax expense in its consolidated statements of operations. During the years ended December 31, 2014, 2013 and 2012, the Company did not incur any interest or penalties.
The Company has analyzed the tax positions taken on federal and state income tax returns for all open tax years, and has concluded that no provision for income tax for uncertain tax positions is required in the Company’s financial statements. The Company’s federal and state income and federal excise tax returns for tax years for which the applicable statutes of limitations have not expired are subject to examination by the Internal Revenue Service and state departments of revenue.
Distributions: Distributions to the Company’s stockholders are recorded as of the record date. Subject to the discretion of the Company’s board of directors and applicable legal restrictions, the Company intends to declare and pay such distributions on a quarterly basis. Net realized capital gains, if any, are distributed or deemed distributed at least annually.
129
Table of Contents
FS Investment Corporation
Notes to Consolidated Financial Statements (continued)
(in thousands, except share and per share amounts)
Note 2. Summary of Significant Accounting Policies (continued)
Reclassifications: Certain amounts in the consolidated financial statements for the years ended December 31, 2013 and 2012 have been reclassified to conform to the classifications used to prepare the consolidated financial statements for the year ended December 31, 2014. These reclassifications had no material impact on the Company’s consolidated financial position, results of operations or cash flows as previously reported.
Note 3. Share Transactions
Below is a summary of transactions with respect to shares of the Company’s common stock during the years ended December 31, 2014, 2013 and 2012:
| Year Ended December 31, | ||||||||||||||||||||||||
| 2014 | 2013 | 2012 | ||||||||||||||||||||||
| Shares | Amount | Shares | Amount | Shares | Amount | |||||||||||||||||||
| Gross Proceeds from Offering(1) |
— | $ | — | — | $ | — | 83,239,728 | $ | 886,432 | |||||||||||||||
| Reinvestment of Distributions |
5,674,543 | 57,972 | 10,771,271 | 109,373 | 10,140,536 | 98,763 | ||||||||||||||||||
|
|
|
|
|
|
|
|
|
|
|
|
|
|||||||||||||
| Total Gross Proceeds |
5,674,543 | 57,972 | 10,771,271 | 109,373 | 93,380,264 | 985,195 | ||||||||||||||||||
| Commissions and Dealer Manager Fees |
— | — | — | — | — | (83,084 | ) | |||||||||||||||||
|
|
|
|
|
|
|
|
|
|
|
|
|
|||||||||||||
| Net Proceeds to Company |
5,674,543 | 57,972 | 10,771,271 | 109,373 | 93,380,264 | 902,111 | ||||||||||||||||||
| Share Repurchase Program |
(872,865 | ) | (8,903 | ) | (3,341,931 | ) | (33,806 | ) | (1,879,983 | ) | (18,324 | ) | ||||||||||||
| Fractional Share Round Up |
30,533 | — | — | — | — | — | ||||||||||||||||||
| Listing Tender Offer |
(23,255,813 | ) | (250,000 | ) | — | — | — | — | ||||||||||||||||
|
|
|
|
|
|
|
|
|
|
|
|
|
|||||||||||||
| Net Proceeds from Share Transactions |
(18,423,602 | ) | $ | (200,931 | ) | 7,429,340 | $ | 75,567 | 91,500,281 | $ | 883,787 | |||||||||||||
|
|
|
|
|
|
|
|
|
|
|
|
|
|||||||||||||
| (1) | Following the closing of its continuous public offering in May 2012, the Company has continued to issue shares only pursuant to its distribution reinvestment plan. |
In connection with the listing of its shares of common stock on the NYSE, the Company terminated its previous distribution reinvestment plan, or the old DRP. The final distribution reinvestment under the old DRP was made in connection with the regular monthly cash distribution paid on March 31, 2014 to stockholders of record as of the close of business on March 28, 2014. On May 23, 2014, the Company adopted a new distribution reinvestment plan, or the new DRP, which became effective on June 2, 2014. The new DRP was first implemented in connection with the regular monthly cash distribution paid on July 2, 2014 to stockholders of record as of the close of business on June 24, 2014. During the years ended December 31, 2014, 2013 and 2012, the Company issued 5,674,543, 10,771,271 and 10,140,536 shares of common stock pursuant to its distribution reinvestment plan in effect on the applicable date of issuance for gross proceeds of $57,972, $109,373 and $98,763 at an average price per share of $10.22, $10.15 and $9.74, respectively. During the period from January 1, 2015 to February 27, 2015, the Company issued 204,875 shares of common stock pursuant to the new DRP for gross proceeds of $2,006 at an average price per share of $9.79. For additional information regarding the terms of the new DRP, see Note 5.
130
Table of Contents
FS Investment Corporation
Notes to Consolidated Financial Statements (continued)
(in thousands, except share and per share amounts)
Note 3. Share Transactions (continued)
In May 2012, the Company closed its continuous public offering of shares of common stock to new investors. The Company sold 247,454,171 shares (as adjusted for stock distributions) of common stock for gross proceeds of $2,605,158 in its continuous public offering. Following the closing of its continuous public offering, the Company has continued to issue shares pursuant to its distribution reinvestment plan.
During the year ended December 31, 2012, the Company sold 93,380,264 shares for gross proceeds of $985,195 at an average price per share of $10.55. The proceeds from the issuance of common stock as presented on the Company’s consolidated statements of changes in net assets and consolidated statements of cash flows are presented net of selling commissions and dealer manager fees of $83,084 for the year ended December 31, 2012.
Listing and Fractional Shares
The Company’s shares of common stock were listed and commenced trading on the NYSE on April 16, 2014. The Company eliminated any outstanding fractional shares of its common stock in connection with the listing, as permitted by the Maryland General Corporation Law. The Company eliminated all outstanding fractional shares by rounding up the number of fractional shares held by each of the Company’s stockholders to the nearest whole number of shares as of April 4, 2014. As a result of the fractional share round up, the number of then outstanding shares was increased by 30,533 shares.
Listing Tender Offer
On April 16, 2014, the Company commenced a modified “Dutch auction” tender offer, or the listing tender offer, to purchase for cash up to $250,000 in value of the Company’s shares of common stock from stockholders. In accordance with the terms of the listing tender offer, the Company selected the lowest price, not greater than $11.00 per share or less than $10.35 per share, net to the tendering stockholder in cash, less any applicable withholding taxes and without interest, that enabled the Company to purchase the maximum number of shares of common stock properly tendered in the listing tender offer and not properly withdrawn having an aggregate purchase price of up to $250,000.
The listing tender offer expired on May 28, 2014. Due to the oversubscription of the listing tender offer, on June 4, 2014, the Company accepted for purchase on a pro rata basis 23,255,813 shares of common stock, or approximately 96.6% of the shares tendered at a purchase price of $10.75 per share, for an aggregate cost of approximately $250,000, excluding fees and expenses relating to the listing tender offer. The 23,255,813 shares of common stock accepted for purchase in the listing tender offer represented approximately 8.9% of the Company’s issued and outstanding shares of common stock as of June 4, 2014. The Company used available cash and borrowings under its senior secured revolving credit facility with ING Capital LLC, or ING, as administrative agent, and the lenders party thereto, or the ING credit facility, to fund the purchase of shares of common stock in the listing tender offer and to pay for all related fees and expenses.
Share Repurchase Program
Historically, the Company conducted quarterly tender offers pursuant to its former share repurchase program to provide limited liquidity to its stockholders. In anticipation of the listing of the Company’s shares of common stock on the NYSE, the Company’s board of directors terminated its share repurchase program effective March 21, 2014. The listing has provided liquidity to the Company’s stockholders, and therefore the Company does not expect to implement a new share repurchase program in the future.
131
Table of Contents
FS Investment Corporation
Notes to Consolidated Financial Statements (continued)
(in thousands, except share and per share amounts)
Note 3. Share Transactions (continued)
The following table sets forth the number of shares of common stock repurchased by the Company under its share repurchase program during the years ended December 31, 2014, 2013 and 2012:
| For the Three Months Ended |
Repurchase Date | Shares Repurchased |
Percentage of Shares Tendered That Were Repurchased |
Repurchase Price Per Share |
Aggregate Consideration for Repurchased Shares |
|||||||||||||
| Fiscal 2012 |
||||||||||||||||||
| December 31, 2011 |
January 3, 2012 | 385,526 | 100 | % | $ | 9.585 | $ | 3,695 | ||||||||||
| March 31, 2012 |
April 2, 2012 | 411,815 | 100 | % | $ | 9.675 | $ | 3,984 | ||||||||||
| June 30, 2012 |
July 2, 2012 | 410,578 | 100 | % | $ | 9.720 | $ | 3,991 | ||||||||||
| September 30, 2012 |
October 1, 2012 | 672,064 | 100 | % | $ | 9.900 | $ | 6,653 | ||||||||||
| Fiscal 2013 |
||||||||||||||||||
| December 31, 2012 |
January 2, 2013 | 883,047 | 100 | % | $ | 10.000 | $ | 8,830 | ||||||||||
| March 31, 2013 |
April 1, 2013 | 1,053,119 | 100 | % | $ | 10.100 | $ | 10,637 | ||||||||||
| June 30, 2013 |
July 1, 2013 | 749,224 | 100 | % | $ | 10.200 | $ | 7,642 | ||||||||||
| September 30, 2013 |
October 1, 2013 | 656,541 | 100 | % | $ | 10.200 | $ | 6,697 | ||||||||||
| Fiscal 2014 |
||||||||||||||||||
| December 31, 2013 |
January 2, 2014 | 872,865 | 100 | % | $ | 10.200 | $ | 8,903 | ||||||||||
Note 4. Related Party Transactions
Compensation of the Investment Adviser
Pursuant to the 2008 investment advisory and administrative services agreement, the April 2014 investment advisory agreement and the July 2014 investment advisory agreement, FB Advisor is entitled to an annual base management fee based on the average value of the Company’s gross assets and an incentive fee based on the Company’s performance. The Company commenced accruing fees under the 2008 investment advisory and administrative services agreement on January 2, 2009, upon commencement of the Company’s investment operations. Base management fees are paid on a quarterly basis in arrears. The annual base management fees under the 2008 investment advisory and administrative services agreement and the April 2014 investment advisory agreement were equal to 2.0% of the average value of the Company’s gross assets.
In anticipation of the listing of the Company’s shares of common stock on the NYSE, FB Advisor recommended that the April 2014 investment advisory agreement be further amended to (i) reduce the annualized hurdle rate used in connection with the calculation of the subordinated incentive fee on income, expressed as a rate of return on the Company’s net assets, from 8% to 7.5% and (ii) assuming the reduction to the hurdle rate was approved, reduce the base management fee from 2.0% to 1.75% of the average value of the Company’s gross assets. At a special meeting of stockholders that was adjourned on June 23, 2014 and reconvened on July 17, 2014, the Company received stockholder approval to amend and restate the April 2014 investment advisory agreement to reflect the amendments approved by the Company’s stockholders. On July 17, 2014, the Company entered into the July 2014 investment advisory agreement. While stockholder approval of the proposal was pending, FB Advisor agreed, effective April 1, 2014, to waive a portion of the base management fee to which it was entitled under the April 2014 investment advisory agreement so that the fee received equaled 1.75% of the average value of the Company’s gross assets.
132
Table of Contents
FS Investment Corporation
Notes to Consolidated Financial Statements (continued)
(in thousands, except share and per share amounts)
Note 4. Related Party Transactions (continued)
The incentive fee, which had consisted of three parts under the 2008 investment advisory and administrative services agreement, consists of two parts under each of the April 2014 advisory agreement and July 2014 investment advisory agreement. The first part of the incentive fee, which is referred to as the subordinated incentive fee on income, is calculated and payable quarterly in arrears, and equals 20.0% of the Company’s “pre-incentive fee net investment income” for the immediately preceding quarter. Under the 2008 investment advisory and administrative services agreement, the subordinated incentive fee on income was subject to a hurdle rate, expressed as a rate of return on adjusted capital, as defined in the 2008 investment advisory and administrative services agreement, equal to 2.0% per quarter, or an annualized hurdle rate of 8.0%. As a result, FB Advisor did not earn this incentive fee for any quarter until the Company’s pre-incentive fee net investment income for such quarter exceeded the hurdle rate of 2.0%. Once the Company’s pre-incentive fee net investment income in any quarter exceeded the hurdle rate, FB Advisor was entitled to a “catch-up” fee equal to the amount of the pre- incentive fee net investment income in excess of the hurdle rate, until the Company’s pre-incentive fee net investment income for such quarter equaled 2.5%, or 10.0% annually, of adjusted capital. Thereafter, FB Advisor received 20.0% of pre-incentive fee net investment income. Under the April 2014 investment advisory agreement, the subordinated incentive fee on income was calculated in the same manner, except that the hurdle rate used to compute the subordinated incentive fee on income was based on the value of the Company’s net assets rather than adjusted capital.
Under the July 2014 investment advisory agreement, the hurdle rate, expressed as a rate of return on the value of the Company’s net assets, was reduced from 2.0% to 1.875% per quarter, or an annualized hurdle rate of 7.5%. As a result, FB Advisor will not earn this incentive fee for any quarter until the Company’s pre-incentive fee net investment income for such quarter exceeds the hurdle rate of 1.875%. Once the Company’s pre-incentive fee net investment income in any quarter exceeds the hurdle rate, FB Advisor will be entitled to a “catch-up” fee equal to the amount of the pre-incentive fee net investment income in excess of the hurdle rate, until the Company’s pre-incentive fee net investment income for such quarter equals 2.34375%, or 9.375% annually, of the value of the Company’s net assets. Thereafter, FB Advisor will receive 20.0% of pre-incentive fee net investment income.
Under both the April 2014 investment advisory agreement and the July 2014 investment advisory agreement, the subordinated incentive fee on income is subject to a total return requirement, which provides that no incentive fee in respect of the Company’s pre-incentive fee net investment income will be payable except to the extent that 20.0% of the cumulative net increase in net assets resulting from operations over the then-current and eleven preceding calendar quarters exceeds the cumulative incentive fees accrued and/or paid for the eleven preceding calendar quarters. Accordingly, any subordinated incentive fee on income that is payable in a calendar quarter will be limited to the lesser of (i) 20.0% of the amount by which the Company’s pre-incentive fee net investment income for such calendar quarter exceeds the applicable quarterly hurdle rate, subject to the “catch-up” provision, and (ii) (x) 20.0% of the cumulative net increase in net assets resulting from operations for the then-current and eleven preceding calendar quarters minus (y) the cumulative incentive fees accrued and/or paid for the eleven preceding calendar quarters. For the foregoing purpose, the “cumulative net increase in net assets resulting from operations” is the sum of pre-incentive fee net investment income, base management fees, realized gains and losses and unrealized appreciation and depreciation of the Company for the then-current and eleven preceding calendar quarters. There will be no accumulation of amounts on the hurdle rate from quarter to quarter and, accordingly, there will be no clawback of amounts previously paid if subsequent quarters are below the applicable quarterly hurdle rate and there will be no delay of payment if prior quarters are below the applicable quarterly hurdle rate.
133
Table of Contents
FS Investment Corporation
Notes to Consolidated Financial Statements (continued)
(in thousands, except share and per share amounts)
Note 4. Related Party Transactions (continued)
The second part of the incentive fee, which is referred to as the incentive fee on capital gains, is determined and payable in arrears as of the end of each calendar year (or upon termination of the July 2014 investment advisory agreement). This fee equals 20.0% of the Company’s incentive fee capital gains, which equal the Company’s realized capital gains on a cumulative basis from inception, calculated as of the end of the applicable period, computed net of all realized capital losses and unrealized capital depreciation on a cumulative basis, less the aggregate amount of any previously paid capital gain incentive fees. The Company accrues for the capital gains incentive fee, which, if earned, is paid annually. The Company accrues the incentive fee based on net realized and unrealized gains; however, the fee payable to FB Advisor is based on realized gains and no such fee is payable with respect to unrealized gains unless and until such gains are actually realized. The methodology for calculating the capital gains incentive fee is identical under the 2008 investment advisory and administrative services agreement, the April 2014 investment advisory agreement and the July 2014 investment advisory agreement.
The third part of the incentive fee under the 2008 investment advisory and administrative services agreement was referred to as the subordinated liquidation incentive fee, which equaled 20.0% of the net proceeds from a liquidation of the Company in excess of adjusted capital, as calculated immediately prior to liquidation. The April 2014 investment advisory agreement and the July 2014 investment advisory agreement do not include the subordinated liquidation incentive fee.
Pursuant to the 2008 investment advisory and administrative services agreement, the Company reimbursed FB Advisor for expenses necessary to perform services related to the Company’s administration and operations. The amount of this reimbursement was set at the lesser of (1) FB Advisor’s actual costs incurred in providing such services and (2) the amount that the Company estimated it would be required to pay alternative service providers for comparable services in the same geographic location. FB Advisor was required to allocate the cost of such services to the Company based on factors such as total assets, revenues, time allocations and/or other reasonable metrics. The Company’s board of directors then assessed the reasonableness of such reimbursements based on the breadth, depth and quality of such services as compared to the estimated cost to the Company of obtaining similar services from third-party providers known to be available. In addition, the Company’s board of directors considered whether any single third-party service provider would be capable of providing all such services at comparable cost and quality. Finally, the Company’s board of directors compared the total amount paid to FB Advisor for such services as a percentage of the Company’s net assets to the same ratio as reported by other comparable BDCs.
Pursuant to the administration agreement, the Company reimburses FB Advisor for expenses necessary to perform services related to the Company’s administration and operations, including FB Advisor’s allocable portion of the compensation and related expenses of certain personnel of Franklin Square Holdings providing administrative services to us on behalf of FB Advisor. The Company reimburses FB Advisor no less than quarterly for all costs and expenses incurred by FB Advisor in performing its obligations and providing personnel and facilities under the administration agreement. FB Advisor allocates the cost of such services to the Company based on factors such as total assets, revenues, time allocations and/or other reasonable metrics. The Company’s board of directors reviews the methodology employed in determining how the expenses are allocated to the Company and the proposed allocation of administrative expenses among the Company and certain affiliates of FB Advisor. The Company’s board of directors then assesses the reasonableness of such reimbursements for expenses allocated to the Company based on the breadth, depth and quality of such services as compared to the estimated cost to the Company of obtaining similar services from third-party service providers known to be
134
Table of Contents
FS Investment Corporation
Notes to Consolidated Financial Statements (continued)
(in thousands, except share and per share amounts)
Note 4. Related Party Transactions (continued)
available. In addition, the Company’s board of directors considers whether any single third-party service provider would be capable of providing all such services at comparable cost and quality. Finally, the Company’s board of directors compares the total amount paid to FB Advisor for such services as a percentage of the Company’s net assets to the same ratio as reported by other comparable BDCs.
The dealer manager for the Company’s continuous public offering was FS2 Capital Partners, LLC, or FS2, which is one of the Company’s affiliates. Under the dealer manager agreement among the Company, FB Advisor and FS2, FS2 was entitled to receive sales commissions and dealer manager fees in connection with the sale of shares of common stock in the Company’s continuous public offering, all or a portion of which were re-allowed to selected broker-dealers. The dealer manager agreement terminated in connection with the closing of the Company’s continuous public offering in May 2012.
The following table describes the fees and expenses accrued under the 2008 investment advisory and administrative services agreement, the April 2014 investment advisory agreement, the July 2014 investment advisory agreement and the administration agreement, as applicable, and the dealer manager agreement during the years ended December 31, 2014, 2013 and 2012:
| Year Ended December 31, | ||||||||||||||||
| Related Party |
Source Agreement |
Description |
2014 | 2013 | 2012 | |||||||||||
| FB Advisor |
2008 Investment Advisory and Administrative Services Agreement, April 2014 Investment Advisory Agreement and July 2014 Investment Advisory Agreement | Base Management Fee(1) | $ | 81,780 | $ | 90,247 | $ | 68,059 | ||||||||
| FB Advisor |
2008 Investment Advisory and Administrative Services Agreement, April 2014 Investment Advisory Agreement and July 2014 Investment Advisory Agreement | Capital Gains Incentive Fee(2) | $ | (9,468 | ) | $ | 4,173 | $ | 39,751 | |||||||
| FB Advisor |
2008 Investment Advisory and Administrative Services Agreement, April 2014 Investment Advisory Agreement and July 2014 Investment Advisory Agreement | Subordinated Incentive Fee on Income(3) | $ | 58,122 | $ | 62,253 | $ | 13,393 | ||||||||
| FB Advisor |
2008 Investment Advisory and Administrative Services Agreement, April 2014 Investment Advisory Agreement and Administration Agreement | Administrative Services Expenses(4) | $ | 4,794 | $ | 5,165 | $ | 5,297 | ||||||||
|
FS2 |
Dealer Manager Agreement | Dealer Manager Fee(5) | $ | — | $ | — | $ | 15,842 | ||||||||
| (1) | FB Advisor agreed, effective April 1, 2014, to waive a portion of the base management fee to which it was entitled under the April 2014 investment advisory agreement so that the fee received equaled 1.75% of the average value of the Company’s gross assets. As a result, the amount shown for the year ended December 31, 2014 is net of waivers of $2,837. During the years ended December 31, 2014, 2013 and 2012, $84,920, $89,054, and $56,124, respectively, in base management fees were paid to FB Advisor. As of December 31, 2014, $19,560 in base management fees were payable to FB Advisor. |
| (2) | During the year ended December 31, 2014, the Company reversed capital gains incentive fees of $9,468 based on the performance of its portfolio. During the years ended December 31, 2013 and 2012, the Company accrued capital gains incentive fees of $4,173 and $39,751 based on the performance of its |
135
Table of Contents
FS Investment Corporation
Notes to Consolidated Financial Statements (continued)
(in thousands, except share and per share amounts)
Note 4. Related Party Transactions (continued)
| portfolio, of which $2,583 and $27,960 were based on unrealized gains and $1,590 and $11,791 were based on realized gains, respectively. No capital gains incentive fees are actually payable by the Company with respect to unrealized gains unless and until those gains are actually realized. The Company paid FB Advisor $1,590 in capital gains incentive fees during the year ended December 31, 2014. As of December 31, 2014, $21,075 in capital gains incentive fees were accrued, all of which was based on unrealized gains, and none of which is payable unless and until those gains are actually realized. |
| (3) | During the year ended December 31, 2014, $59,336 of subordinated incentive fees on income were paid to FB Advisor. As of December 31, 2014, a subordinated incentive fee on income of $13,089 was payable to FB Advisor. |
| (4) | During the years ended December 31, 2014, 2013 and 2012, $3,849, $4,463 and $4,772, respectively, of administrative services expenses related to the allocation of costs of administrative personnel for services rendered to the Company by FB Advisor and the remainder related to other reimbursable expenses. The Company paid $4,537, $4,959 and $4,504, respectively, in administrative services expenses to FB Advisor during the years ended December 31, 2014, 2013 and 2012. |
| (5) | Represents aggregate dealer manager fees retained by FS2 and not re-allowed to selected broker-dealers. |
Potential Conflicts of Interest
FB Advisor’s senior management team is comprised of substantially the same personnel as the senior management teams of FS Investment Advisor, LLC, FSIC II Advisor, LLC, FSIC III Advisor, LLC and FS Global Advisor, LLC, the investment advisers to certain other BDCs and a closed-end management investment company affiliated with Franklin Square Holdings, L.P., or Franklin Square Holdings. As a result, such personnel provide investment advisory services to the Company and each of FS Energy and Power Fund, FS Investment Corporation II, FS Investment Corporation III and FS Global Credit Opportunities Fund. While none of FB Advisor, FS Investment Advisor, LLC, FSIC II Advisor, LLC, FSIC III Advisor, LLC or FS Global Advisor, LLC, is currently making private corporate debt investments for clients other than the Company, FS Energy and Power Fund, FS Investment Corporation II, FS Investment Corporation III or FS Global Credit Opportunities Fund, respectively, any, or all, may do so in the future. In the event that FB Advisor undertakes to provide investment advisory services to other clients in the future, it intends to allocate investment opportunities in a fair and equitable manner consistent with the Company’s investment objectives and strategies, if necessary, so that the Company will not be disadvantaged in relation to any other client of FB Advisor or its management team. In addition, even in the absence of FB Advisor retaining additional clients, it is possible that some investment opportunities may be provided to FS Energy and Power Fund, FS Investment Corporation II, FS Investment Corporation III and/or FS Global Credit Opportunities Fund rather than to the Company.
Exemptive Relief
In an order dated June 4, 2013, the SEC granted exemptive relief permitting the Company, subject to the satisfaction of certain conditions, to co-invest in certain privately negotiated investment transactions with certain affiliates of FB Advisor, including FS Energy and Power Fund, FS Investment Corporation II, FS Investment Corporation III and any future BDCs that are advised by FB Advisor or its affiliated investment advisers, or collectively the Company’s co-investment affiliates. The Company believes this relief has and may continue to enhance its ability to further its investment objectives and strategy. The Company believes this relief may also increase favorable investment opportunities for the Company, in part, by allowing it to participate in larger investments, together with the Company’s co-investment affiliates, than would be available to it if it had not
136
Table of Contents
FS Investment Corporation
Notes to Consolidated Financial Statements (continued)
(in thousands, except share and per share amounts)
Note 4. Related Party Transactions (continued)
obtained such relief. Because the Company did not seek exemptive relief to engage in co-investment transactions with its investment sub-adviser, GSO / Blackstone Debt Funds Management LLC, or GDFM, and its affiliates, it will continue to be permitted to co-invest with GDFM and its affiliates only in accordance with existing regulatory guidance.
Expense Reimbursement
Beginning on February 26, 2009, Franklin Square Holdings agreed to reimburse the Company for expenses in an amount that was sufficient to ensure that, for tax purposes, the Company’s net investment income and net capital gains were equal to or greater than the cumulative distributions paid to its stockholders in each quarter. This arrangement was designed to ensure that no portion of the Company’s distributions would represent a return of capital for its stockholders. Under this arrangement, Franklin Square Holdings had no obligation to reimburse any portion of the Company’s expenses. Franklin Square Holdings is controlled by the Company’s chairman and chief executive officer, Michael C. Forman, and its vice-chairman, David J. Adelman.
Pursuant to an expense support and conditional reimbursement agreement, dated as of March 13, 2012, and amended and restated as of May 16, 2013, or, as amended and restated, the expense reimbursement agreement, Franklin Square Holdings had agreed to reimburse the Company for expenses in an amount that was sufficient to ensure that no portion of the Company’s distributions to stockholders were paid from proceeds of the sale of shares of its common stock or borrowings.
As a result of the listing of the Company’s shares of common stock on the NYSE, effective November 7, 2014, Franklin Square Holdings terminated the expense reimbursement agreement pursuant to its terms. Since entering into the expense reimbursement agreement, no reimbursements were made, and no reimbursements were expected to be made in the foreseeable future, by Franklin Square Holdings, pursuant to the expense reimbursement agreement.
Trademark License Agreement
On April 16, 2014, in connection with the listing of its common stock on the NYSE, the Company entered into a trademark license agreement, or the trademark license agreement, with Franklin Square Holdings. Pursuant to the trademark license agreement, Franklin Square Holdings granted the Company a non-exclusive, nontransferable, royalty-free right and license to use the name “FS Investment Corporation” and certain other trademarks, or the licensed marks, as a component of the Company’s name (and in connection with marketing the investment advisory and other services that FB Advisor may provide to the Company). Other than with respect to this limited license, the Company has no other rights to the licensed marks. The trademark license agreement may be terminated by Franklin Square Holdings or the Company on sixty days’ prior written notice and expires if FB Advisor or one of Franklin Square Holdings’ affiliates ceases to serve as investment adviser to the Company. Furthermore, Franklin Square Holdings may terminate the trademark license agreement at any time and in its sole discretion in the event that Franklin Square Holdings or the Company receives notice of any third-party claim arising out of the Company’s use of the licensed marks or if the Company attempts to assign or sublicense the trademark license agreement or any of the Company’s rights or duties under the trademark license agreement without the prior written consent of Franklin Square Holdings. FB Advisor is a third-party beneficiary of the trademark license agreement.
137
Table of Contents
FS Investment Corporation
Notes to Consolidated Financial Statements (continued)
(in thousands, except share and per share amounts)
Note 5. Distributions
The following table reflects the cash distributions per share that the Company has declared and paid on its common stock during the years ended December 31, 2014, 2013 and 2012:
| Distribution | ||||||||
| For the Year Ended December 31, |
Per Share | Amount | ||||||
|
2012(1)(2) |
$ | 0.8586 | $ | 197,906 | ||||
|
2013(3) |
0.8303 | 212,153 | ||||||
|
2014(4)(5) |
1.0843 | 267,856 | ||||||
| (1) | In addition to regular cash distributions during such period, cash distributions declared and paid on the Company’s common stock during the year ended December 31, 2012 include approximately $12,417, or approximately $0.05 per share, in special cash distributions. |
| (2) | On May 15, 2012, the Company’s board of directors determined to increase the amount of semi-monthly distributions payable to stockholders of record from $0.033594 per share to $0.03375 per share, effective May 16, 2012. Beginning in June 2012, the Company declared and paid regular cash distributions on a monthly basis in an amount equal to $0.0675 per share. |
| (3) | On June 25, 2013, the Company’s board of directors determined to increase the amount of the regular monthly cash distributions payable to stockholders of record from $0.0675 per share to $0.06975 per share, effective as of June 28, 2013. On October 16, 2013, the Company’s board of directors determined to increase the amount of regular monthly cash distributions payable to stockholders of record from $0.06975 per share to $0.0720 per share, effective as of November 29, 2013. |
| (4) | On March 31, 2014, the Company’s board of directors determined to increase the amount of the regular monthly cash distribution payable to stockholders of record from $0.0720 per share to $0.07425 per share, effective as of April 30, 2014. |
| (5) | On July 1, 2014, the board of directors of the Company declared a special cash distribution of $0.10 per share, which was paid on August 15, 2014 to stockholders of record as of the close of business on July 31, 2014. On October 10, 2014, the board of directors of the Company also declared a special cash distribution of $0.10 per share, which was paid on November 14, 2014 to stockholders of record as of the close of business on October 31, 2014. |
On November 6, 2014, the board of directors of the Company approved the declaration and payment of regular cash distributions to the Company’s stockholders on a quarterly rather than monthly basis, effective January 1, 2015. On January 13, 2015, the Company’s board of directors declared a regular quarterly cash distribution of $0.22275 per share, which will be paid on or about April 2, 2015 to stockholders of record on March 25, 2015. The timing and amount of any future distributions to stockholders are subject to applicable legal restrictions and the sole discretion of the Company’s board of directors.
Historically, the Company had an “opt in” distribution reinvestment plan for its stockholders, or the old DRP, which terminated upon the listing of the Company’s shares of common stock on the NYSE. The final distribution reinvestment under the old DRP was made in connection with the regular monthly cash distribution paid on March 31, 2014 to stockholders of record as of the close of business on March 28, 2014. Under the old DRP, if the Company made a cash distribution, its stockholders received distributions in cash unless they specifically “opted in” to the distribution reinvestment plan so as to have their cash distributions reinvested in additional shares of the Company’s common stock. On May 23, 2014, the Company adopted an “opt out”
138
Table of Contents
FS Investment Corporation
Notes to Consolidated Financial Statements (continued)
(in thousands, except share and per share amounts)
Note 5. Distributions (continued)
distribution reinvestment plan, or the new DRP, which was effective June 2, 2014. The new DRP was first implemented in connection with the regular monthly cash distribution paid on July 2, 2014 to stockholders of record as of the close of business on June 24, 2014. Pursuant to the new DRP, the Company will reinvest all cash dividends or distributions declared by the Company’s board of directors on behalf of stockholders who do not elect to receive their distributions in cash. As a result, if the Company’s board of directors declares a distribution, then stockholders who have not elected to “opt out” of the new DRP will have their distributions automatically reinvested in additional shares of the Company’s common stock.
With respect to each distribution pursuant to the new DRP, the Company reserves the right to either issue new shares of common stock or purchase shares of common stock in the open market in connection with implementation of the new DRP. Unless the Company, in its sole discretion, otherwise directs the plan administrator, (A) if the per share market price (as defined in the new DRP) is equal to or greater than the estimated net asset value per share (rounded up to the nearest whole cent) of the Company’s common stock on the payment date for the distribution, then the Company will issue shares of common stock at the greater of (i) net asset value per share of common stock or (ii) 95% of the market price; or (B) if the market price is less than the net asset value per share, then, in the sole discretion of the Company, (i) shares of common stock will be purchased in open market transactions for the accounts of participants to the extent practicable, or (ii) the Company will issue shares of common stock at net asset value per share. Pursuant to the terms of the new DRP, the number of shares of common stock to be issued to a participant will be determined by dividing the total dollar amount of the distribution payable to a participant by the price per share at which the Company issues such shares; provided, however, that shares purchased in open market transactions by the plan administrator will be allocated to a participant based on the average purchase price, excluding any brokerage charges or other charges, of all shares of common stock purchased in the open market.
If a stockholder receives distributions in the form of common stock pursuant to the new DRP, such stockholder generally will be subject to the same federal, state and local tax consequences as if it elected to receive distributions in cash. If the Company’s common stock is trading at or below net asset value, a stockholder receiving distributions in the form of additional common stock will be treated as receiving a distribution in the amount of cash that they would have received if they had elected to receive the distribution in cash. If the Company’s common stock is trading above net asset value, a stockholder receiving distributions in the form of additional common stock will be treated as receiving a distribution in the amount of the fair market value of the Company’s common stock. The stockholder’s basis for determining gain or loss upon the sale of common stock received in a distribution will be equal to the total dollar amount of the distribution payable to the stockholder. Any stock received in a distribution will have a holding period for tax purposes commencing on the day following the day on which the shares of common stock are credited to the stockholder’s account.
The Company may fund its cash distributions to stockholders from any sources of funds legally available to it, including proceeds from the sale of shares of the Company’s common stock, borrowings, net investment income from operations, capital gains proceeds from the sale of assets, non-capital gains proceeds from the sale of assets, and dividends or other distributions paid to the Company on account of preferred and common equity investments in portfolio companies. The Company has not established limits on the amount of funds it may use from available sources to make distributions. During certain periods, the Company’s distributions may exceed its earnings. As a result, it is possible that a portion of the distributions the Company makes may represent a return of capital. A return of capital generally is a return of a stockholder’s investment rather than a return of earnings or gains derived from the Company’s investment activities. Each year a statement on Form 1099-DIV identifying
139
Table of Contents
FS Investment Corporation
Notes to Consolidated Financial Statements (continued)
(in thousands, except share and per share amounts)
Note 5. Distributions (continued)
the sources of the distributions (i.e., paid from ordinary income, paid from net capital gains on the sale of securities, and/or a return of paid-in capital surplus, which is a nontaxable distribution) will be mailed to the Company’s stockholders. There can be no assurance that the Company will be able to pay distributions at a specific rate or at all.
The following table reflects the sources of the cash distributions on a tax basis that the Company has paid on its common stock during the years ended December 31, 2014, 2013 and 2012:
| Year Ended December 31, | ||||||||||||||||||||||||
| 2014 | 2013 | 2012 | ||||||||||||||||||||||
| Source of Distribution |
Distribution Amount |
Percentage | Distribution Amount |
Percentage | Distribution Amount |
Percentage | ||||||||||||||||||
| Offering proceeds |
$ | — | — | $ | — | — | $ | — | — | |||||||||||||||
| Borrowings |
— | — | — | — | — | — | ||||||||||||||||||
| Net investment income(1) |
196,227 | 73 | % | 212,153 | 100 | % | 144,364 | 73 | % | |||||||||||||||
| Short-term capital gains proceeds from the sale of assets |
39,835 | 15 | % | — | — | 53,542 | 27 | % | ||||||||||||||||
| Long-term capital gains proceeds from the sale of assets |
31,794 | 12 | % | — | — | — | — | |||||||||||||||||
| Non-capital gains proceeds from the sale of assets |
— | — | — | — | — | — | ||||||||||||||||||
| Distributions on account of preferred and common equity |
— | — | — | — | — | — | ||||||||||||||||||
|
|
|
|
|
|
|
|
|
|
|
|
|
|||||||||||||
| Total |
$ | 267,856 | 100 | % | $ | 212,153 | 100 | % | $ | 197,906 | 100 | % | ||||||||||||
|
|
|
|
|
|
|
|
|
|
|
|
|
|||||||||||||
| (1) | During the years ended December 31, 2014, 2013 and 2012, 91.1%, 89.3% and 92.1%, respectively, of the Company’s gross investment income was attributable to cash income earned, 5.2%, 9.1% and 6.8%, respectively, was attributable to non-cash accretion of discount and 3.7%, 1.6% and 1.1%, respectively, was attributable to paid-in-kind, or PIK, interest. |
The Company’s net investment income on a tax basis for the years ended December 31, 2014, 2013 and 2012 was $221,880, $236,936 and $185,513, respectively. As of December 31, 2014, 2013 and 2012, the Company had $152,743, $148,676 and $57,740, respectively, of undistributed net investment income and realized gains on a tax basis.
The Company’s undistributed net investment income on a tax basis as of December 31, 2013 was adjusted following the filing of the Company’s 2013 tax return in September 2014. The adjustment was primarily due to tax-basis income received by the Company during the year ended December 31, 2013 exceeding GAAP-basis income with respect to collateralized securities and interests in partnerships held in its investment portfolio during such period. The tax notices for such collateralized securities and interests in partnerships were received by the Company subsequent to the filing of the Company’s annual report on Form 10-K for the year ended December 31, 2013.
140
Table of Contents
FS Investment Corporation
Notes to Consolidated Financial Statements (continued)
(in thousands, except share and per share amounts)
Note 5. Distributions (continued)
The difference between the Company’s GAAP-basis net investment income and its tax-basis net investment income is primarily due to the reversal of the required accrual for GAAP purposes of incentive fees on unrealized gains even though no such incentive fees on unrealized gains are payable by the Company, the reclassification of unamortized original issue discount and prepayment fees recognized upon prepayment of loans from income for GAAP purposes to realized gains for tax purposes, the reversal of non-deductible excise taxes and, with respect to the year ended December 31, 2012, the inclusion of a portion of the periodic net settlement payments due on the Company’s total return swap in tax-basis net investment income and the amount by which tax-basis income received by the Company with respect to collateralized securities and interests in partnerships exceeded its GAAP-basis income.
The following table sets forth a reconciliation between GAAP-basis net investment income and tax-basis net investment income during the years ended December 31, 2014, 2013 and 2012:
| Year Ended December 31, | ||||||||||||
| 2014 | 2013 | 2012 | ||||||||||
| GAAP-basis net investment income |
$ | 242,008 | $ | 244,976 | $ | 133,907 | ||||||
| Reversal of incentive fee accrual on unrealized gains |
(9,468 | ) | 2,583 | 27,960 | ||||||||
| Taxable income adjustment on collateralized securities and partnerships |
— | — | 9,355 | |||||||||
| Excise taxes |
5,400 | 5,742 | 500 | |||||||||
| Tax-basis net investment income portion of total return swap payments |
— | — | 12,356 | |||||||||
| Reclassification of unamortized original issue discount and prepayment fees |
(19,436 | ) | (15,904 | ) | — | |||||||
| Other miscellaneous differences |
3,376 | (461 | ) | 1,435 | ||||||||
|
|
|
|
|
|
|
|||||||
| Tax-basis net investment income |
$ | 221,880 | $ | 236,936 | $ | 185,513 | ||||||
|
|
|
|
|
|
|
|||||||
The Company may make certain adjustments to the classification of stockholders’ equity as a result of permanent book-to-tax differences. During the year ended December 31, 2014, the Company increased accumulated undistributed net realized gains on investments and gain/loss on foreign currency by $19,737 and decreased capital in excess of par value and accumulated undistributed (distributions in excess of) net investment income by $7,292 and $12,445, respectively. During the year ended December 31, 2013, the Company increased accumulated undistributed net realized gains on investments and gain/loss on foreign currency by $8,441 and decreased capital in excess of par value and accumulated undistributed (distributions in excess of) net investment income by $6,633 and $1,808, respectively. During the year ended December 31, 2012, the Company reduced accumulated undistributed net realized gains on investments and gain/loss on foreign currency by $13,480 and increased accumulated undistributed (distributions in excess of) net investment income by $13,480 to reflect the reclassification of a portion of realized gains on the total return swap into tax-basis net investment income.
The determination of the tax attributes of the Company’s distributions is made annually as of the end of the Company’s fiscal year based upon the Company’s taxable income for the full year and distributions paid for the full year. The actual tax characteristics of distributions to stockholders are reported to stockholders annually on Form 1099-DIV.
141
Table of Contents
FS Investment Corporation
Notes to Consolidated Financial Statements (continued)
(in thousands, except share and per share amounts)
Note 5. Distributions (continued)
As of December 31, 2014 and 2013, the components of accumulated earnings on a tax basis were as follows:
| Year ended December 31, | ||||||||
| 2014 | 2013 | |||||||
| Distributable ordinary income (income and short-term capital gains) |
$ | 114,667 | $ | 116,882 | ||||
| Distributable realized gains (long-term capital gains) |
38,076 | 31,794 | ||||||
| Incentive fee accrual on unrealized gains |
(21,075 | ) | (30,543 | ) | ||||
| Unamortized organization costs |
(386 | ) | (429 | ) | ||||
| Net unrealized appreciation (depreciation) on investments and gain/loss on foreign currency(1) |
(23,085 | ) | 56,276 | |||||
|
|
|
|
|
|||||
| $ | 108,197 | $ | 173,980 | |||||
|
|
|
|
|
|||||
| (1) | As of December 31, 2014 and 2013, the gross unrealized appreciation on the Company’s investments and gain on foreign currency was $136,422 and $125,870, respectively. As of December 31, 2014 and 2013, the gross unrealized depreciation on the Company’s investments and loss on foreign currency was $159,507 and $69,594, respectively. |
The aggregate cost of the Company’s investments for U.S. federal income tax purposes totaled $4,210,963 and $4,081,123 as of December 31, 2014 and 2013, respectively. The aggregate net unrealized appreciation (depreciation) on a tax basis was $(23,085) and $56,276 as of December 31, 2014 and 2013, respectively.
Note 6. Investment Portfolio
The following table summarizes the composition of the Company’s investment portfolio at cost and fair value as of December 31, 2014 and December 31, 2013:
| December 31, 2014 | December 31, 2013 | |||||||||||||||||||||||
| Amortized Cost(1) |
Fair Value | Percentage of Portfolio |
Amortized Cost(1) |
Fair Value | Percentage of Portfolio |
|||||||||||||||||||
| Senior Secured Loans—First Lien |
$ | 2,215,957 | $ | 2,206,206 | 53 | % | $ | 2,080,228 | $ | 2,123,608 | 51 | % | ||||||||||||
| Senior Secured Loans—Second Lien |
713,675 | 708,255 | 17 | % | 875,276 | 897,845 | 22 | % | ||||||||||||||||
| Senior Secured Bonds |
423,961 | 359,275 | 8 | % | 414,297 | 385,548 | 9 | % | ||||||||||||||||
| Subordinated Debt |
467,645 | 464,304 | 11 | % | 421,964 | 426,728 | 10 | % | ||||||||||||||||
| Collateralized Securities |
110,362 | 123,920 | 3 | % | 120,206 | 140,508 | 4 | % | ||||||||||||||||
| Equity/Other |
250,497 | 321,487 | 8 | % | 142,114 | 163,344 | 4 | % | ||||||||||||||||
|
|
|
|
|
|
|
|
|
|
|
|
|
|||||||||||||
| Total |
$ | 4,182,097 | $ | 4,183,447 | 100 | % | $ | 4,054,085 | $ | 4,137,581 | 100 | % | ||||||||||||
|
|
|
|
|
|
|
|
|
|
|
|
|
|||||||||||||
| (1) | Amortized cost represents the original cost adjusted for the amortization of premiums and/or accretion of discounts, as applicable, on investments. |
142
Table of Contents
FS Investment Corporation
Notes to Consolidated Financial Statements (continued)
(in thousands, except share and per share amounts)
Note 6. Investment Portfolio (continued)
As of December 31, 2014, except for one equity/other investment, Fronton Investor Holdings, LLC, the Company was not an “affiliated person” of any of its portfolio companies, as defined in the 1940 Act. As of December 31, 2014, the Company did not “control” any of its portfolio companies, as defined in the 1940 Act. In general, under the 1940 Act, the Company would be presumed to “control” a portfolio company if it owned 25% or more of its voting securities or it had the power to exercise control over the management or policies of such portfolio company, and would be an “affiliated person” of a portfolio company if it owned 5% or more of its voting securities.
The Company’s investment portfolio may contain loans that are in the form of lines of credit, revolving credit facilities or delayed draw credit facilities, which require the Company to provide funding when requested by portfolio companies in accordance with the terms of the underlying loan agreements. As of December 31, 2014, the Company had ten such investments with aggregate unfunded commitments of $101,099 and one equity investment with an unfunded commitment of $788. As of December 31, 2013, the Company had five such investments with aggregate unfunded commitments of $48,439 and one equity investment with an unfunded commitment of $4,629. The Company maintains sufficient cash on hand and available borrowings to fund such unfunded commitments should the need arise.
The table below describes investments by industry classification and enumerates the percentage, by fair value, of the total portfolio assets in such industries as of December 31, 2014 and December 31, 2013:
| December 31, 2014 | December 31, 2013 | |||||||||||||||
| Industry Classification |
Fair Value |
Percentage of Portfolio |
Fair Value |
Percentage of Portfolio |
||||||||||||
| Automobiles & Components |
$ | 24,737 | 1 | % | $ | 51,551 | 1 | % | ||||||||
| Capital Goods |
964,394 | 23 | % | 858,352 | 21 | % | ||||||||||
| Commercial & Professional Services |
283,513 | 7 | % | 318,196 | 8 | % | ||||||||||
| Consumer Durables & Apparel |
319,160 | 8 | % | 306,917 | 7 | % | ||||||||||
| Consumer Services |
692,533 | 17 | % | 436,650 | 11 | % | ||||||||||
| Diversified Financials |
179,548 | 4 | % | 160,678 | 4 | % | ||||||||||
| Energy |
434,424 | 10 | % | 468,036 | 11 | % | ||||||||||
| Food & Staples Retailing |
18,324 | 0 | % | 29,484 | 1 | % | ||||||||||
| Food, Beverage & Tobacco |
— | — | 4,042 | 0 | % | |||||||||||
| Health Care Equipment & Services |
104,205 | 3 | % | 176,010 | 4 | % | ||||||||||
| Household & Personal Products |
— | — | 66,300 | 2 | % | |||||||||||
| Insurance |
— | — | 17,814 | 0 | % | |||||||||||
| Materials |
297,179 | 7 | % | 233,719 | 6 | % | ||||||||||
| Media |
157,443 | 4 | % | 193,283 | 5 | % | ||||||||||
| Pharmaceuticals, Biotechnology & Life Sciences |
16,243 | 0 | % | 57,794 | 1 | % | ||||||||||
| Retailing |
5,004 | 0 | % | 69,171 | 2 | % | ||||||||||
| Software & Services |
312,505 | 7 | % | 366,976 | 9 | % | ||||||||||
| Technology Hardware & Equipment |
137,471 | 3 | % | 134,121 | 3 | % | ||||||||||
| Telecommunication Services |
161,951 | 4 | % | 178,977 | 4 | % | ||||||||||
| Transportation |
74,813 | 2 | % | 9,510 | 0 | % | ||||||||||
|
|
|
|
|
|
|
|
|
|||||||||
| Total |
$ | 4,183,447 | 100 | % | $ | 4,137,581 | 100 | % | ||||||||
|
|
|
|
|
|
|
|
|
|||||||||
143
Table of Contents
FS Investment Corporation
Notes to Consolidated Financial Statements (continued)
(in thousands, except share and per share amounts)
Note 7. Fair Value of Financial Instruments
Under existing accounting guidance, fair value is defined as the price that the Company would receive upon selling an investment or pay to transfer a liability in an orderly transaction to a market participant in the principal or most advantageous market for the investment. This accounting guidance emphasizes that valuation techniques maximize the use of observable market inputs and minimize the use of unobservable inputs. Inputs refer broadly to the assumptions that market participants would use in pricing an asset or liability, including assumptions about risk. Inputs may be observable or unobservable. Observable inputs are inputs that reflect the assumptions market participants would use in pricing an asset or liability developed based on market data obtained from sources independent of the Company. Unobservable inputs are inputs that reflect the assumptions market participants would use in pricing an asset or liability developed based on the best information available in the circumstances. The Company classifies the inputs used to measure these fair values into the following hierarchy as defined by current accounting guidance:
Level 1: Inputs that are quoted prices (unadjusted) in active markets for identical assets or liabilities.
Level 2: Inputs that are quoted prices for similar assets or liabilities in active markets.
Level 3: Inputs that are unobservable for an asset or liability.
A financial instrument’s categorization within the valuation hierarchy is based upon the lowest level of input that is significant to the fair value measurement.
As of December 31, 2014 and December 31, 2013, the Company’s investments were categorized as follows in the fair value hierarchy:
| Valuation Inputs |
December 31, 2014 | December 31, 2013 | ||||||
| Level 1—Price quotations in active markets |
$ | 1,343 | $ | 2,147 | ||||
| Level 2—Significant other observable inputs |
— | — | ||||||
| Level 3—Significant unobservable inputs |
4,182,104 | 4,135,434 | ||||||
|
|
|
|
|
|||||
| $ | 4,183,447 | $ | 4,137,581 | |||||
|
|
|
|
|
|||||
The Company’s investments as of December 31, 2014 consisted primarily of debt investments that were acquired directly from the issuer. Forty-one senior secured loan investments, one senior secured bond investment, eleven subordinated debt investments and one collateralized security, for which broker quotes were not available, were valued by an independent valuation firm, which determined the fair value of such investments by considering, among other factors, the borrower’s ability to adequately service its debt, prevailing interest rates for like investments, expected cash flows, call features and other relevant terms of the debt. Except as described below, all of the Company’s equity/other investments were valued by the same independent valuation firm, which determined the fair value of such investments by considering, among other factors, contractual rights ascribed to such investments, as well as various income scenarios and multiples of EBITDA, cash flows, net income, revenues or, in limited instances, book value or liquidation value. One equity investment which is traded on an active public market was valued at its closing price as of December 31, 2014. One senior secured loan investment and two collateralized loan securities, which were newly issued and purchased near December 31, 2014, were valued at cost as the Company’s board of directors determined that the cost of each such investment was the best indication of its fair value. Except as described above, the Company valued its other investments, including three equity/other investments, by using the midpoint of the prevailing bid and ask prices from dealers on the date of the relevant period end, which were provided by independent third-party pricing services and screened for validity by such services.
144
Table of Contents
FS Investment Corporation
Notes to Consolidated Financial Statements (continued)
(in thousands, except share and per share amounts)
Note 7. Fair Value of Financial Instruments (continued)
The Company’s investments as of December 31, 2013 consisted primarily of debt investments that were traded on a private over-the-counter market for institutional investors. Except as described below, the Company valued its investments by using the midpoint of the prevailing bid and ask prices from dealers on the date of the relevant period end, which were provided by independent third-party pricing services and screened for validity by such services. Twenty-seven senior secured loan investments, six subordinated debt investments and one collateralized security, for which broker quotes were not available, were valued by an independent valuation firm, which determined the fair value of such investments by considering, among other factors, the borrower’s ability to adequately service its debt, prevailing interest rates for like investments, call features and other relevant terms of the debt. All of the Company’s equity/other investments were valued by the same independent valuation firm, which determined the fair value of such investments by considering, among other factors, contractual rights ascribed to such investments, as well as various income scenarios and multiples of EBITDA, cash flows, net income, revenues or, in limited instances, book value or liquidation value. Also, one equity investment which is traded on an active public market was valued at its closing price as of December 31, 2013.
The Company periodically benchmarks the bid and ask prices it receives from the third-party pricing services and/or dealers, as applicable, against the actual prices at which the Company purchases and sells its investments. Based on the results of the benchmark analysis and the experience of the Company’s management in purchasing and selling these investments, the Company believes that these prices are reliable indicators of fair value. However, because of the private nature of this marketplace (meaning actual transactions are not publicly reported), the Company believes that these valuation inputs are classified as Level 3 within the fair value hierarchy. The Company may also use other methods, including the use of an independent valuation firm, to determine fair value for securities for which it cannot obtain prevailing bid and ask prices through third-party pricing services or independent dealers, or where the Company’s board of directors otherwise determines that the use of such other methods is appropriate. The Company periodically benchmarks the valuations provided by the independent valuation firm against the actual prices at which the Company purchases and sells its investments. The Company’s valuation committee and board of directors reviewed and approved the valuation determinations made with respect to these investments in a manner consistent with the Company’s valuation process.
145
Table of Contents
FS Investment Corporation
Notes to Consolidated Financial Statements (continued)
(in thousands, except share and per share amounts)
Note 7. Fair Value of Financial Instruments (continued)
The following is a reconciliation for the years ended December 31, 2014 and 2013 of investments for which significant unobservable inputs (Level 3) were used in determining fair value:
| For the Year Ended December 31, 2014 | ||||||||||||||||||||||||||||
| Senior Secured Loans - First Lien |
Senior Secured Loans -Second Lien |
Senior Secured Bonds |
Subordinated Debt |
Collateralized Securities |
Equity/Other | Total | ||||||||||||||||||||||
| Fair value at beginning of period |
$ | 2,123,608 | $ | 897,845 | $ | 385,548 | $ | 426,728 | $ | 140,508 | $ | 161,197 | $ | 4,135,434 | ||||||||||||||
| Accretion of discount (amortization of premium) |
10,339 | 6,435 | 4,346 | 2,644 | 431 | 87 | 24,282 | |||||||||||||||||||||
| Net realized gain (loss) |
4,746 | 8,842 | (1,347 | ) | 6,154 | 6,581 | 5,631 | 30,607 | ||||||||||||||||||||
| Net change in unrealized appreciation (depreciation) |
(53,131 | ) | (27,989 | ) | (35,937 | ) | (8,105 | ) | (6,744 | ) | 50,564 | (81,342 | ) | |||||||||||||||
| Purchases |
1,260,125 | 386,982 | 215,937 | 169,456 | 19,217 | 126,358 | 2,178,075 | |||||||||||||||||||||
| Paid-in-kind interest |
1,536 | 6,321 | — | 7,237 | — | 1,893 | 16,987 | |||||||||||||||||||||
| Sales and redemptions |
(1,141,017 | ) | (570,181 | ) | (209,272 | ) | (139,810 | ) | (36,073 | ) | (25,586 | ) | (2,121,939 | ) | ||||||||||||||
| Net transfers in or out of Level 3 |
— | — | — | — | — | — | — | |||||||||||||||||||||
|
|
|
|
|
|
|
|
|
|
|
|
|
|
|
|||||||||||||||
| Fair value at end of period |
$ | 2,206,206 | $ | 708,255 | $ | 359,275 | $ | 464,304 | $ | 123,920 | $ | 320,144 | $ | 4,182,104 | ||||||||||||||
|
|
|
|
|
|
|
|
|
|
|
|
|
|
|
|||||||||||||||
| The amount of total gains or losses for the period included in changes in net assets attributable to the change in unrealized gains or losses relating to investments still held at the reporting date |
$ | (25,313) | $ | (9,193) | $ | (34,085) | $ | (5,016) | $ | (1,508) | $ | 57,139 | $ | (17,976 | ) | |||||||||||||
|
|
|
|
|
|
|
|
|
|
|
|
|
|
|
|||||||||||||||
| For the Year Ended December 31, 2013 | ||||||||||||||||||||||||||||
| Senior
Secured Loans-First Lien |
Senior
Secured Loans-Second Lien |
Senior Secured Bonds |
Subordinated Debt |
Collateralized Securities |
Equity/Other | Total | ||||||||||||||||||||||
| Fair value at beginning of period |
$ | 1,945,159 | $ | 764,356 | $ | 466,299 | $ | 511,971 | $ | 118,994 | $ | 127,943 | $ | 3,934,722 | ||||||||||||||
| Accretion of discount (amortization of premium) |
24,984 | 6,725 | 5,648 | 5,303 | 549 | 57 | 43,266 | |||||||||||||||||||||
| Net realized gain (loss) |
7,628 | 3,098 | 20,815 | 9,786 | 5,687 | — | 47,014 | |||||||||||||||||||||
| Net change in unrealized appreciation (depreciation) |
13,217 | 10,605 | (35,008 | ) | (15,301 | ) | (7,281 | ) | 6,841 | (26,927 | ) | |||||||||||||||||
| Purchases |
1,646,725 | 446,626 | 231,539 | 239,201 | 47,340 | 29,100 | 2,640,531 | |||||||||||||||||||||
| Paid-in-kind interest |
816 | 689 | 484 | 4,093 | — | 1,633 | 7,715 | |||||||||||||||||||||
| Sales and redemptions |
(1,514,921 | ) | (334,254 | ) | (304,229 | ) | (328,325 | ) | (24,781 | ) | (4,377 | ) | (2,510,887 | ) | ||||||||||||||
| Net transfers in or out of Level 3 |
— | — | — | — | — | — | — | |||||||||||||||||||||
|
|
|
|
|
|
|
|
|
|
|
|
|
|
|
|||||||||||||||
| Fair value at end of period |
$ | 2,123,608 | $ | 897,845 | $ | 385,548 | $ | 426,728 | $ | 140,508 | $ | 161,197 | $ | 4,135,434 | ||||||||||||||
|
|
|
|
|
|
|
|
|
|
|
|
|
|
|
|||||||||||||||
| The amount of total gains or losses for the period included in changes in net assets attributable to the change in unrealized gains or losses relating to investments still held at the reporting date |
$ | 31,181 | $ | 4,397 | $ | 3,767 | $ | (2,661) | $ | (3,588) | $ | 4,493 | $ | 37,589 | ||||||||||||||
|
|
|
|
|
|
|
|
|
|
|
|
|
|
|
|||||||||||||||
146
Table of Contents
FS Investment Corporation
Notes to Consolidated Financial Statements (continued)
(in thousands, except share and per share amounts)
Note 7. Fair Value of Financial Instruments (continued)
The valuation techniques and significant unobservable inputs used in recurring Level 3 fair value measurements as of December 31, 2014 and December 31, 2013 were as follows:
| Type of Investment |
Fair Value at December 31, 2014(1) |
Valuation Technique(2) |
Unobservable Input |
Range | Weighted Average | |||||||
| Senior Secured Loans—First Lien |
$ | 1,700,237 | Market Comparables | Market Yield (%) | 4.8% - 12.3% | 9.0% | ||||||
| Market Comparables | EBITDA Multiples (x) | 7.8x - 7.8x | 7.8x | |||||||||
| 47,307 | Other | Other | N/A | N/A | ||||||||
| 448,151 | Market Quotes | Indicative Dealer Quotes | 74.9% - 102.1% | 95.3% | ||||||||
| 10,511 | Cost | Cost | 100.0% - 100.0% | 100.0% | ||||||||
| Senior Secured Loans—Second Lien |
319,917 | Market Comparables | Market Yield (%) | 8.8% - 12.3% | 10.9% | |||||||
| 388,338 | Market Quotes | Indicative Dealer Quotes | 79.5% - 101.0% | 98.3% | ||||||||
| Senior Secured Bonds |
59,062 | Market Comparables | Market Yield (%) | 10.5% - 11.0% | 10.8% | |||||||
| 300,213 | Market Quotes | Indicative Dealer Quotes | 34.0% - 101.0% | 83.9% | ||||||||
| Subordinated Debt |
333,351 | Market Comparables | Market Yield (%) | 8.8% - 18.3% | 11.7% | |||||||
| 313 | Other | Other | N/A | N/A | ||||||||
| EBITDA Multiples (x) | 7.8x - 8.3x | 8.0x | ||||||||||
| 130,640 | Market Quotes | Indicative Dealer Quotes | 41.5% - 110.5% | 85.0% | ||||||||
| Collateralized Securities |
17,284 | Market Comparables | Market Yield (%) | 11.3% - 11.3% | 11.3% | |||||||
| 87,462 | Market Quotes | Indicative Dealer Quotes | 50.0% - 97.9% | 85.5% | ||||||||
| 19,174 | Cost | Cost | 93.7% - 99.0% | 98.6% | ||||||||
| Equity/Other |
310,839 | Market Comparables | Market Yield (%) | 13.0% - 15.8% | 14.9% | |||||||
| EBITDA Multiples (x) | 5.3x - 12.0x | 7.8x | ||||||||||
| Production Multiples (Mboe/d) | $32,500.0 - $70,256.0 | $46,915.4 | ||||||||||
| Proved Reserves Multiples (Mmboe) | $7.0 - $12.0 | $11.0 | ||||||||||
| PV-10 Multiples (x) | 0.5x - 1.8x | 1.7x | ||||||||||
| Discounted Cash Flow | Discount Rate (%) | 17.3% - 17.3% | 17.3% | |||||||||
| Option Valuation Model | Volatility (%) | 37.5% - 55.5% | 51.1% | |||||||||
| 9,305 | Market Quotes | Indicative Dealer Quotes | $13.8 - $132.7 | $120.4 | ||||||||
|
|
|
|||||||||||
| Total |
$ | 4,182,104 | ||||||||||
|
|
|
|||||||||||
| (1) | Except as otherwise described in this footnote, the remaining Level 3 assets were valued by using the midpoint of the prevailing bid and ask prices from dealers on the date of the relevant period end, which were provided by independent third-party pricing services and screened for validity by such services. |
| (2) | For investments utilizing a market comparables valuation technique, a significant increase (decrease) in the market yield, in isolation, would result in a significantly lower (higher) fair value measurement, and a significant increase (decrease) in any of the valuation multiples, in isolation, would result in a significantly higher (lower) fair value measurement. For investments utilizing a discounted cash flow valuation technique, a significant increase (decrease) in the discount rate, in isolation, would result in a significantly lower (higher) fair value measurement. For investments utilizing an option valuation model valuation technique, a significant increase (decrease) in the volatility, in isolation, would result in a significantly higher (lower) fair value measurement. |
147
Table of Contents
FS Investment Corporation
Notes to Consolidated Financial Statements (continued)
(in thousands, except share and per share amounts)
Note 7. Fair Value of Financial Instruments (continued)
| Type of Investment |
Fair Value
at December 31, 2013(1) |
Valuation Technique(2) |
Unobservable Input | Range | Weighted Average | |||||||
| Senior Secured Loans—First Lien |
$ | 1,406,294 | Market Comparables | Market Yield (%) | 6.5% - 16.0% | 8.8% | ||||||
| Senior Secured Loans—Second Lien |
200,044 | Market Comparables | Market Yield (%) | 10.3% -11.8% | 10.9% | |||||||
| Senior Secured Bonds |
211,066 | Market Comparables | Market Yield (%) | 7.8% - 13.8% | 11.1% | |||||||
| Subordinated Debt |
16,740 | Market Comparables | Market Yield (%) | 11.5% - 12.5% | 12.0% | |||||||
| Equity/Other |
161,197 | Market Comparables | Market Yield (%) | 13.5% - 15.8% | 15.1% | |||||||
| EBITDA Multiples (x) | 5.0x - 13.3x | 7.3x | ||||||||||
| Production Multiples (Mmb/d) |
$37,500.0 - $42,500.0 | $40,000.0 | ||||||||||
| Proved Reserves Multiples (Mmboe) |
$8.0 - $9.0 | $8.5 | ||||||||||
| PV-10 Multiples (x) | 0.6x - 0.7x | 0.6x | ||||||||||
| Discounted Cash Flow | Discount Rate (%) | 17.3% - 24.3% | 17.6% | |||||||||
| Option Valuation Model |
Volatility (%) | 52.5% - 61.5% | 53.0% | |||||||||
| (1) | Except as otherwise described in this footnote, the remaining Level 3 assets were valued by using the midpoint of the prevailing bid and ask prices from dealers on the date of the relevant period end, which were provided by independent third-party pricing services and screened for validity by such services. As of December 31, 2013, $48,439 of the senior secured loans-first lien investments consisted of unfunded loan commitments. |
| (2) | For investments utilizing a market comparables valuation technique, a significant increase (decrease) in the market yield, in isolation, would result in a significantly lower (higher) fair value measurement, and a significant increase (decrease) in any of the valuation multiples, in isolation, would result in a significantly higher (lower) fair value measurement. For investments utilizing a discounted cash flow valuation technique, a significant increase (decrease) in the discount rate, in isolation, would result in a significantly lower (higher) fair value measurement. For investments utilizing an option valuation model valuation technique, a significant increase (decrease) in the volatility, in isolation, would result in a significantly higher (lower) fair value measurement. |
Note 8. Financing Arrangements
The following table presents summary information with respect to the Company’s outstanding financing arrangements as of December 31, 2014:
| Arrangement |
Type of Arrangement | Rate |
Amount Outstanding |
Amount Available |
Maturity Date | |||||||||
| Broad Street Credit Facility |
Revolving Credit Facility | L+1.50% | $ | 65,808 | $ | 59,192 | December 18, 2015 | |||||||
| ING Credit Facility |
Revolving Credit Facility | L+2.50% | $ | 123,019 | (1) | $ | 176,981 | April 3, 2018 | ||||||
| JPM Facility |
Repurchase Agreement | 3.25% | $ | 950,000 | $ | — | April 15, 2017 | |||||||
| 4.000% Notes due 2019 |
Unsecured Notes | 4.00% | $ | 400,000 | $ | — | July 15, 2019 | |||||||
| 4.250% Notes due 2020 |
Unsecured Notes | 4.25% | $ | 325,000 | $ | — | January 15, 2020 | |||||||
| (1) | Amount includes borrowing in U.S. dollars and Euros. Euro balance outstanding of €29,625 has been converted to U.S. dollars at an exchange rate of €1.00 to $1.21 as of December 31, 2014 to reflect total amount outstanding in U.S. dollars. |
148
Table of Contents
FS Investment Corporation
Notes to Consolidated Financial Statements (continued)
(in thousands, except share and per share amounts)
Note 8. Financing Arrangements (continued)
The Company’s average borrowings and weighted average interest rate, including the effect of non-usage fees, for the year ended December 31, 2014 were $1,825,246 and 3.16%, respectively. As of December 31, 2014, the Company’s weighted average effective interest rate on borrowings, including the effect of non-usage fees, was 3.53%.
Arch Street Credit Facility
On July 14, 2014, Arch Street Funding LLC, or Arch Street, the Company’s wholly-owned, special purpose financing subsidiary, repaid the revolving credit facility, or the Arch Street credit facility, with Citibank, N.A., as administrative agent, and the financial institutions and other lenders from time to time party thereto. The Arch Street credit facility provided for borrowings in an aggregate principal amount up to $350,000 on a committed basis. Prior to the termination of the Arch Street credit facility, borrowings under the Arch Street credit facility accrued interest at a rate equal to three-month LIBOR plus 2.05% per annum. Beginning November 27, 2012, Arch Street became required to pay a non-usage fee of 0.50% to the extent the aggregate principal amount available under the facility was not borrowed.
As of December 31, 2014 and 2013, $0 and $373,682, respectively, was outstanding under the Arch Street credit facility. The Company incurred costs of $4,884 in connection with obtaining and amending the Arch Street credit facility, which the Company had recorded as deferred financing costs on its consolidated balance sheets and amortized to interest expense over the life of the facility. In conjunction with the repayment of the Arch Street credit facility on July 14, 2014, $2,226 of remaining unamortized deferred financing costs were charged to interest expense.
For the years ended December 31, 2014, 2013 and 2012, the components of total interest expense for the Arch Street credit facility were as follows:
| Year
Ended December 31, |
||||||||||||
| 2014 | 2013 | 2012 | ||||||||||
| Direct interest expense |
$ | 4,173 | $ | 10,093 | $ | 3,766 | ||||||
| Non-usage fees |
220 | 311 | 22 | |||||||||
| Amortization of deferred financing costs |
2,896 | 1,481 | 507 | |||||||||
|
|
|
|
|
|
|
|||||||
| Total interest expense |
$ | 7,289 | $ | 11,885 | $ | 4,295 | ||||||
|
|
|
|
|
|
|
|||||||
For the years ended December 31, 2014, 2013 and 2012, the cash paid for interest expense, average borrowings, effective interest rate and weighted average interest rate for the Arch Street credit facility were as follows:
| Year Ended December 31, |
||||||||||||
| 2014 | 2013 | 2012 | ||||||||||
| Cash paid for interest expense(1) |
$ | 6,464 | $ | 12,121 | — | |||||||
| Average borrowings under the facility(2) |
$ | 360,986 | $ | 488,712 | $ | 470,962 | ||||||
| Effective interest rate on borrowings (including the effect of non-usage fees) |
— | % | 1.99 | % | 2.30 | % | ||||||
| Weighted average interest rate (including the effect of non-usage fees) |
2.24 | % | 2.10 | % | 2.33 | % | ||||||
| (1) | Interest under the Arch Street credit facility was paid quarterly in arrears. |
149
Table of Contents
FS Investment Corporation
Notes to Consolidated Financial Statements (continued)
(in thousands, except share and per share amounts)
Note 8. Financing Arrangements (continued)
| (2) | The average borrowings under the Arch Street credit facility are calculated from the beginning of the period to July 14, 2014, the date the Company terminated the facility. |
Borrowings of Arch Street were considered borrowings of the Company for purposes of complying with the asset coverage requirements applicable to BDCs under the 1940 Act.
Broad Street Credit Facility
On January 28, 2011, Broad Street Funding LLC, or Broad Street, the Company’s wholly-owned, special-purpose financing subsidiary, Deutsche Bank AG, New York Branch, or Deutsche Bank, and the other lenders party thereto entered into an amended and restated multi-lender, syndicated revolving credit facility, or the Broad Street credit facility, which amended and restated the revolving credit facility that Broad Street originally entered into with Deutsche Bank on March 10, 2010 and the amendments thereto. On March 23, 2012, Broad Street and Deutsche Bank entered into an amendment to the Broad Street credit facility which extended the maturity date of the facility to March 23, 2013, increased the aggregate amount which could be borrowed under the facility to $380,000 and reduced the interest rate for all borrowings under the facility to a rate of LIBOR, for an interest period equal to the weighted average LIBOR interest period of debt securities owned by Broad Street, plus 1.50% per annum. On December 13, 2012, Broad Street repaid $140,000 of borrowings under the facility, thereby reducing the amount which could be borrowed under the facility to $240,000. On March 22, 2013, Broad Street and Deutsche Bank entered into an amendment to the facility to extend the maturity date of the facility to December 22, 2013. On December 20, 2013, Broad Street and Deutsche Bank entered into an amendment to the facility that extended the maturity date to December 20, 2014 and reduced the maximum amount which could be borrowed under the facility to $125,000. On December 18, 2014, Broad Street and Deutsche Bank entered into a further amendment to the facility which extended the maturity date to December 18, 2015, incorporated a commitment fee of 1.50% payable on unused amounts (triggered after five consecutive business days of Broad Street utilizing less than 33% of the maximum commitment), and gave Broad Street the right to reduce the maximum commitment upon three (3) days’ notice to the administrative agent. The Broad Street credit facility provides for borrowings of up to $125,000 at a rate of LIBOR, for an interest period equal to the weighted average LIBOR interest period of debt securities owned by Broad Street, plus 1.50% per annum. Deutsche Bank is a lender and serves as administrative agent under the facility.
Under the Broad Street credit facility, the Company transfers debt securities to Broad Street from time to time as a contribution to capital and retains a residual interest in the contributed debt securities through its ownership of Broad Street. The obligations of Broad Street under the facility are non-recourse to the Company and its exposure under the facility is limited to the value of its investment in Broad Street.
As of December 31, 2014 and 2013, $65,808 and $125,000, respectively, was outstanding under the Broad Street credit facility. The carrying amount of the amount outstanding under the facility approximates its fair value. The Company incurred costs of $2,566 in connection with obtaining and amending the facility, which the Company has recorded as deferred financing costs on its consolidated balance sheets and amortizes to interest expense over the life of the facility. As of December 31, 2014, all of the deferred financing costs have been amortized to interest expense.
Borrowings under the Broad Street credit facility are subject to compliance with a borrowing base, pursuant to which the amount of funds advanced to Broad Street varies depending upon the types of assets in Broad Street’s portfolio. The occurrence of certain events described as “Super-Collateralization Events” in the credit agreement that governs the facility, or a decline in the Company’s net asset value below a specified threshold, results in a lowering of the amount of funds that will be advanced against such assets. Super-Collateralization
150
Table of Contents
FS Investment Corporation
Notes to Consolidated Financial Statements (continued)
(in thousands, except share and per share amounts)
Note 8. Financing Arrangements (continued)
Events include, without limitation: (i) certain key employees ceasing to be directors, principals, officers or investment managers of GDFM; (ii) the bankruptcy or insolvency of GDFM or FB Advisor; (iii) GDFM ceasing to act as the Company’s sub-adviser or FB Advisor ceasing to act as the Company’s investment adviser; (iv) the Company ceasing to act as Broad Street’s investment manager, becoming bankrupt or insolvent, defaulting on certain material agreements or failing to maintain a net asset value at least equal to $50,000; and (v) the Company, GDFM or FB Advisor committing fraud or other illicit acts in its or their investment advisory capacities.
In connection with the facility, Broad Street has made certain representations and warranties and is required to comply with various covenants and other requirements customary for similar facilities. The facility also contains customary events of default for similar financing transactions, including: (a) the failure to make principal payments when due or interest payments within three business days of when due; (b) borrowings under the facility exceeding the applicable advance rates; (c) the purchase by Broad Street of certain ineligible assets; (d) the insolvency or bankruptcy of Broad Street or the Company; (e) the Company ceasing to act as investment manager of Broad Street’s assets; (f) the decline of the Company’s net asset value below $50,000; and (g) fraud or other illicit acts by the Company, FB Advisor or GDFM in its or their investment advisory capacities. During the continuation of an event of default, Broad Street must pay interest at a default rate.
For the years ended December 31, 2014, 2013 and 2012, the components of total interest expense for the Broad Street credit facility were as follows:
| Year
Ended December 31, |
||||||||||||
| 2014 | 2013 | 2012 | ||||||||||
| Direct interest expense |
$ | 1,847 | $ | 4,117 | $ | 7,541 | ||||||
| Non-usage fees |
— | 72 | 18 | |||||||||
| Amortization of deferred financing costs |
— | 225 | 958 | |||||||||
|
|
|
|
|
|
|
|||||||
| Total interest expense |
$ | 1,847 | $ | 4,414 | $ | 8,517 | ||||||
|
|
|
|
|
|
|
|||||||
For the years ended December 31, 2014, 2013 and 2012, the cash paid for interest expense, average borrowings, effective interest rate and weighted average interest rate for the Broad Street credit facility were as follows:
| Year Ended December 31, |
||||||||||||
| 2014 | 2013 | 2012 | ||||||||||
| Cash paid for interest expense(1) |
$ | 1,719 | $ | 4,735 | $ | 8,143 | ||||||
| Average borrowings under the facility |
$ | 107,113 | $ | 230,466 | $ | 368,023 | ||||||
| Effective interest rate on borrowings (including the effect of non-usage fees) |
1.75 | % | 1.74 | % | 1.80 | % | ||||||
| Weighted average interest rate (including the effect of non-usage fees) |
1.75 | % | 1.76 | % | 2.05 | % | ||||||
| (1) | Interest under the Broad Street credit facility is paid quarterly in arrears. |
Borrowings of Broad Street will be considered borrowings of the Company for purposes of complying with the asset coverage requirements applicable to BDCs under the 1940 Act.
151
Table of Contents
FS Investment Corporation
Notes to Consolidated Financial Statements (continued)
(in thousands, except share and per share amounts)
Note 8. Financing Arrangements (continued)
ING Credit Facility
On April 3, 2014, the Company entered into the ING credit facility. The ING credit facility provides for borrowings in U.S. dollars and certain agreed upon foreign currencies in an initial aggregate amount of up to $300,000, with an option for the Company to request, at one or more times after closing, that existing or new lenders, at their election, provide up to $100,000 of additional commitments. The ING credit facility provides for the issuance of letters of credit in an aggregate face amount not to exceed $25,000. The Company’s obligations under the ING credit facility are guaranteed by all of the Company’s subsidiaries, other than its special-purpose financing subsidiaries. The Company’s obligations under the ING credit facility are secured by a first priority security interest in substantially all of the assets of the Company and the subsidiary guarantors thereunder other than the equity interests of its special-purpose financing subsidiaries.
Borrowings under the ING credit facility are subject to compliance with a borrowing base. Interest under the ING credit facility for (i) loans for which the Company elects the base rate option is payable at a rate equal to 1.5% per annum plus the greatest of (x) the “U.S. Prime Rate” as published in The Wall Street Journal, (y) the federal funds effective rate plus 0.5% per annum and (z) three-month LIBOR plus 1% per annum and (ii) loans for which the Company elects the Eurocurrency option is payable at a rate equal to 2.50% per annum plus adjusted LIBOR. The ING credit facility is subject to a non-usage fee of (a) 1% per annum on the unused portion of the commitment under the ING credit facility for each day such unused portion is 65% or more of the commitments and (b) 0.375% per annum on the unused portion of the commitments for each day the unused portion is less than 65%. The Company will pay letter of credit participation fees and a fronting fee on the average daily amount of any lender’s exposure with respect to any letters of credit issued under the ING credit facility.
In connection with the ING credit facility, the Company has made certain representations and warranties and must comply with various covenants and reporting requirements customary for facilities of this type. In addition, the Company must comply with the following financial covenants: (a) the Company’s minimum stockholders’ equity, measured as of each fiscal quarter-end, must be greater than or equal to the greater of (i) 40% of assets of the Company and its subsidiaries as of the last day of such fiscal quarter and (ii) $1,980,744 (less amounts paid to purchase common stock in the Company’s listing tender offer), plus 50% of the net proceeds of any post-closing equity offerings; (b) the Company must maintain at all times a 200% asset coverage ratio; (c) the sum of (x) the Company and the guarantors’ net worth (defined as stockholders’ equity minus the net asset value held by the Company in any special-purpose financing subsidiaries) plus (y) 30% of the equity value of any special-purpose financing subsidiaries, must at all times be at least equal to the sum of (A) any unsecured longer-term debt of the Company and (B) accrued but unpaid base management fees and incentive fees at the time of measurement; and (d) the aggregate value of eligible portfolio investments that can be converted to cash in fewer than 20 business days without more than a 5% change in price must not be less than 10% of the covered debt amount (defined as the aggregate amount of outstanding loans and issued letters of credit under the facility, plus, to the extent incurred after closing of the ING credit facility, certain other permitted debt of the Company) for more than 30 business days during any period during which the covered debt amount (less cash and cash equivalents included in the borrowing base) is greater than 90% of the borrowing base (less cash and cash equivalents included therein).
The ING credit facility contains events of default customary for financing transactions of this type. Upon the occurrence of an event of default, ING, at the instruction of the lenders, may terminate the commitments and
152
Table of Contents
FS Investment Corporation
Notes to Consolidated Financial Statements (continued)
(in thousands, except share and per share amounts)
Note 8. Financing Arrangements (continued)
declare the outstanding advances and all other obligations under the ING credit facility immediately due and payable. During the continuation of an event of default and subject, in certain cases, to the instructions of the lenders, the Company must pay interest at a default rate.
As of December 31, 2014 and 2013, $123,019 and $0, respectively, was outstanding under the ING credit facility, which includes Eurocurrency borrowings in an aggregate amount of €29,625 and €0, respectively. The carrying amount of the amount outstanding under the facility approximates its fair value. The Company incurred costs of $3,406 in connection with obtaining the ING credit facility, which the Company has recorded as deferred financing costs on its consolidated balance sheets and amortizes to interest expense over the life of the facility. As of December 31, 2014, $2,551 of such deferred financing costs had yet to be amortized to interest expense.
For the years ended December 31, 2014, 2013 and 2012, the components of total interest expense for the ING credit facility were as follows:
| Year Ended December 31, |
||||||||||||
| 2014 | 2013 | 2012 | ||||||||||
| Direct interest expense |
$ | 3,994 | $ | — | $ | — | ||||||
| Non-usage fees |
616 | — | — | |||||||||
| Amortization of deferred financing costs |
855 | — | — | |||||||||
|
|
|
|
|
|
|
|||||||
| Total interest expense |
$ | 5,465 | $ | — | $ | — | ||||||
|
|
|
|
|
|
|
|||||||
For the years ended December 31, 2014, 2013 and 2012, the cash paid for interest expense, average borrowings, effective interest rate and weighted average interest rate for the ING credit facility were as follows:
| Year Ended December 31, |
||||||||||||
| 2014 | 2013 | 2012 | ||||||||||
| Cash paid for interest expense(1) |
$ | 4,272 | — | — | ||||||||
| Average borrowings under the facility(2) |
$ | 251,387 | — | — | ||||||||
| Effective interest rate on borrowings (including the effect of non-usage fees) |
3.23 | % | — | — | ||||||||
| Weighted average interest rate (including the effect of non-usage fees) |
2.46 | % | — | — | ||||||||
| (1) | Interest under the ING credit facility is payable at the end of each interest period in arrears for Eurocurrency borrowings and quarterly in arrears for base rate borrowings. This first interest payment was made on July 8, 2014. |
| (2) | The average borrowings under the ING credit facility are calculated for the period since the Company commenced borrowing thereunder to December 31, 2014. |
JPM Financing
On April 23, 2013, through its two wholly-owned, special-purpose financing subsidiaries, Locust Street Funding LLC, or Locust Street, and Race Street Funding LLC, or Race Street, the Company entered into an amendment, or the April 2013 amendment, to its debt financing arrangement with JPMorgan Chase Bank, N.A., London Branch, or JPM, which was originally entered into on July 21, 2011 (and previously amended on
153
Table of Contents
FS Investment Corporation
Notes to Consolidated Financial Statements (continued)
(in thousands, except share and per share amounts)
Note 8. Financing Arrangements (continued)
September 26, 2012). The April 2013 amendment, among other things: (i) increased the amount of debt financing available under the arrangement from $700,000 to $950,000; and (ii) extended the final repurchase date under the financing arrangement from October 15, 2016 to April 15, 2017. The Company elected to structure the financing in the manner described more fully below in order to, among other things, obtain such financing at a lower cost than would be available through alternate arrangements.
Pursuant to the financing arrangement, the assets held by Locust Street secure the obligations of Locust Street under certain Class A Floating Rate Notes, or the Class A Notes, to be issued from time to time by Locust Street to Race Street pursuant to the Amended and Restated Indenture, dated as of September 26, 2012 and as supplemented by Supplemental Indenture No. 1, dated April 23, 2013, with Citibank, as trustee, or the Amended and Restated Indenture. Pursuant to the Amended and Restated Indenture, the aggregate principal amount of Class A Notes that may be issued by Locust Street from time to time is $1,140,000. All principal and interest on the Class A Notes will be due and payable on the stated maturity date of April 15, 2024. Race Street will purchase the Class A Notes to be issued by Locust Street from time to time at a purchase price equal to their par value.
Pursuant to the Amended and Restated Indenture, Locust Street has made certain representations and warranties and is required to comply with various covenants, reporting requirements and other customary requirements for similar transactions. In addition, the Amended and Restated Indenture contains customary events of default for similar financing arrangements, including: (a) the failure to make principal payments on the Class A Notes at their stated maturity or redemption date or to make interest payments on the Class A Notes within five business days of when due; (b) the failure of the aggregate outstanding principal balance (subject to certain reductions) of the assets securing the Class A Notes to be at least 130% of the outstanding principal amount of the Class A Notes; and (c) GDFM ceasing to be the sub-adviser to the Company’s investment adviser, FB Advisor.
Race Street, in turn, has entered into an amended repurchase transaction with JPM pursuant to the terms of an amended and restated global master repurchase agreement and the related annex and amended and restated confirmation thereto, each dated as of April 23, 2013, and subsequently amended as of October 24, 2013, or, collectively, the JPM Facility. Pursuant to the JPM Facility, JPM has agreed to purchase from time to time Class A Notes held by Race Street for an aggregate purchase price equal to approximately 83.33% of the principal amount of Class A Notes purchased. Subject to certain conditions, the maximum principal amount of Class A Notes that may be purchased under the JPM Facility is $1,140,000. Accordingly, the maximum amount payable at any time to Race Street under the JPM Facility is $950,000. Under the JPM Facility, Race Street will, on a quarterly basis, repurchase the Class A Notes sold to JPM under the JPM Facility and subsequently resell such Class A Notes to JPM. The final repurchase transaction must occur no later than April 15, 2017. The repurchase price paid by Race Street to JPM for each repurchase of Class A Notes will be equal to the purchase price paid by JPM for such Class A Notes, plus interest thereon accrued at a fixed rate of 3.25% per annum. Commencing April 15, 2015, Race Street is permitted to reduce (based on certain thresholds) the aggregate principal amount of Class A Notes subject to the JPM Facility. Such reductions, and any other reductions of the principal amount of Class A Notes, including upon an event of default, will be subject to breakage fees in an amount equal to the present value of 1.25% per annum over the remaining term of the JPM Facility applied to the amount of such reduction.
If at any time during the term of the JPM Facility the market value of the assets held by Locust Street securing the Class A Notes declines by an amount greater than 27% of their initial aggregate purchase price, or
154
Table of Contents
FS Investment Corporation
Notes to Consolidated Financial Statements (continued)
(in thousands, except share and per share amounts)
Note 8. Financing Arrangements (continued)
the Margin Threshold, Race Street will be required to post cash collateral with JPM in an amount at least equal to the amount by which the market value of such assets at such time is less than the Margin Threshold. In such event, in order to satisfy any such margin-posting requirements, Race Street intends to borrow funds from the Company pursuant to a revolving credit agreement, dated as of July 21, 2011 and as amended as of September 26, 2012, between Race Street, as borrower, and the Company, as lender, or the Revolving Credit Agreement. The Company may, in its sole discretion, make such loans from time to time to Race Street pursuant to the terms of the Revolving Credit Agreement. Borrowings under the Revolving Credit Agreement will accrue interest at a rate equal to one-month LIBOR plus a spread of 0.75% per annum.
Pursuant to the financing arrangement, the assets held by Race Street secure the obligations of Race Street under the JPM Facility.
Pursuant to the JPM Facility, Race Street has made certain representations and warranties and is required to comply with various covenants, reporting requirements and other customary requirements for similar transactions. The JPM Facility contains customary events of default included in similar transactions, including: (a) the failure to pay the repurchase price upon the applicable payment dates; (b) the failure to post required cash collateral with JPM as discussed above; and (c) the occurrence of an event of default under the Indenture.
In connection with the Class A Notes and the Amended and Restated Indenture, Locust Street also entered into: (i) an amended and restated collateral management agreement with the Company, as collateral manager, dated as of September 26, 2012, pursuant to which the Company will manage the assets of Locust Street; and (ii) an amended and restated collateral administration agreement with Virtus Group, LP, or Virtus, as collateral administrator, and the Company, as collateral manager, dated as of September 26, 2012, pursuant to which Virtus will perform certain administrative services with respect to the assets of Locust Street. In connection with the JPM Facility, Race Street also entered into a collateral management agreement with the Company, as collateral manager, dated as of September 26, 2012, pursuant to which the Company will manage the assets of Race Street.
As of December 31, 2014 and 2013, Class A Notes in the aggregate principal amount of $1,140,000 and $1,140,000, respectively, had been purchased by Race Street from Locust Street and subsequently sold to JPM under the JPM Facility for aggregate proceeds of $950,000 and $950,000, respectively. The carrying amount outstanding under the JPM Facility approximates its fair value. The Company funded each purchase of Class A Notes by Race Street through a capital contribution to Race Street. As of December 31, 2014 and 2013, Race Street’s liability under the JPM Facility was $950,000 and $950,000, respectively, plus $6,690 and $6,690, respectively, of accrued interest expense. The Class A Notes issued by Locust Street and purchased by Race Street eliminate in consolidation on the Company’s financial statements.
As of December 31, 2014 and 2013, the fair value of assets held by Locust Street was $1,832,095 and $1,870,351, respectively, which included assets purchased by Locust Street with proceeds from the issuance of Class A Notes. As of December 31, 2014 and 2013, the fair value of assets held by Race Street was $855,341 and $747,330, respectively.
The Company incurred costs of $425 in connection with obtaining the JPM Facility, which the Company has recorded as deferred financing costs on its consolidated balance sheets and amortizes to interest expense over the life of the JPM Facility. As of December 31, 2014, $61 of such deferred financing costs had yet to be amortized to interest expense.
155
Table of Contents
FS Investment Corporation
Notes to Consolidated Financial Statements (continued)
(in thousands, except share and per share amounts)
Note 8. Financing Arrangements (continued)
For the years ended December 31, 2014, 2013 and 2012, the components of total interest expense for the JPM Facility were as follows:
| Year Ended December 31, |
||||||||||||
| 2014 | 2013 | 2012 | ||||||||||
| Direct interest expense |
$ | 31,304 | $ | 26,452 | $ | 14,652 | ||||||
| Non-usage fees |
— | — | — | |||||||||
| Amortization of deferred financing costs |
112 | 106 | 101 | |||||||||
|
|
|
|
|
|
|
|||||||
| Total interest expense |
$ | 31,416 | $ | 26,558 | $ | 14,753 | ||||||
|
|
|
|
|
|
|
|||||||
For the years ended December 31, 2014, 2013 and 2012, the cash paid for interest expense, average borrowings, effective interest rate and weighted average interest rate for the JPM Facility were as follows:
| Year Ended December 31, |
||||||||||||
| 2014 | 2013 | 2012 | ||||||||||
| Cash paid for interest expense(1) |
$ | 31,304 | $ | 24,060 | $ | 11,648 | ||||||
| Average borrowings under the facility |
$ | 950,000 | $ | 802,746 | $ | 406,002 | ||||||
| Effective interest rate on borrowings (including the effect of non-usage fees) |
3.25 | % | 3.25 | % | 3.25 | % | ||||||
| Weighted average interest rate (including the effect of non-usage fees) |
3.25 | % | 3.25 | % | 3.61 | % | ||||||
| (1) | Interest under the JPM Facility is paid quarterly in arrears. |
Amounts outstanding under the JPM Facility will be considered borrowings of the Company for purposes of complying with the asset coverage requirements applicable to BDCs under the 1940 Act.
Walnut Street Credit Facility
On December 3, 2014, Walnut Street Funding LLC, or Walnut Street, the Company’s wholly-owned, special purpose financing subsidiary, repaid and terminated the revolving credit facility, or the Walnut Street credit facility, with Wells Fargo Bank, National Association, or together with Wells Fargo Securities, LLC, Wells Fargo. Wells Fargo Securities, LLC served as the administrative agent and Wells Fargo Bank, National Association was the sole lender, collateral agent, account bank and collateral custodian under the facility. The Walnut Street credit facility provided for borrowings in an aggregate principal amount up to $250,000 on a committed basis. Prior to the termination of the Walnut Street credit facility, borrowings under the Walnut Street credit facility accrued interest at a rate equal to three-month LIBOR, plus a spread ranging between 1.50% and 2.50% per annum, depending on the composition of the portfolio of debt securities for the relevant period. Beginning on September 17, 2012, Walnut Street became subject to a non-usage fee of 0.50% to the extent the aggregate principal amount available under the Walnut Street credit facility was not borrowed.
As of December 31, 2014 and 2013, $0 and $225,000, respectively, was outstanding under the Walnut Street credit facility. The Company incurred costs of $4,029 in connection with obtaining the Walnut Street credit facility, which the Company had recorded as deferred financing costs on its consolidated balance sheets and amortized to interest expense over the life of the facility. In conjunction with the repayment of the Walnut Street credit facility on December 18, 2014, $2,013 of remaining unamortized deferred financing costs were charged to interest expense.
156
Table of Contents
FS Investment Corporation
Notes to Consolidated Financial Statements (continued)
(in thousands, except share and per share amounts)
Note 8. Financing Arrangements (continued)
For the years ended December 31, 2014, 2013 and 2012, the components of total interest expense for the Walnut Street credit facility were as follows:
| Year Ended December 31, |
||||||||||||
| 2014 | 2013 | 2012 | ||||||||||
| Direct interest expense |
$ | 6,009 | $ | 7,118 | $ | 1,988 | ||||||
| Non-usage fees |
734 | 33 | 205 | |||||||||
| Amortization of deferred financing costs |
2,805 | 755 | 469 | |||||||||
|
|
|
|
|
|
|
|||||||
| Total interest expense |
$ | 9,548 | $ | 7,906 | $ | 2,662 | ||||||
|
|
|
|
|
|
|
|||||||
For the years ended December 31, 2014, 2013 and 2012, the cash paid for interest expense, average borrowings, effective interest rate and weighted average interest rate for the Walnut Street credit facility were as follows:
| Year Ended December 31, |
||||||||||||
| 2014 | 2013 | 2012 | ||||||||||
| Cash paid for interest expense(1) |
$ | 8,444 | $ | 6,959 | $ | 684 | ||||||
| Average borrowings under the facility(2) |
$ | 235,768 | $ | 243,583 | $ | 139,274 | ||||||
| Effective interest rate on borrowings (including the effect of non-usage fees) |
— | % | 2.89 | % | 2.70 | % | ||||||
| Weighted average interest rate (including the effect of non-usage fees) |
3.18 | % | 2.90 | % | 3.07 | % | ||||||
| (1) | Interest under the Walnut Street credit facility was paid quarterly in arrears. |
| (2) | The average borrowings under the Walnut Street credit facility are calculated from the beginning of the period to December 3, 2014, the date the Company terminated the facility. |
Borrowings of Walnut Street were considered borrowings of the Company for purposes of complying with the asset coverage requirements applicable to BDCs under the 1940 Act.
4.000% Notes due 2019
On July 14, 2014, the Company and U.S. Bank National Association, or U.S. Bank, entered into an indenture, or the base indenture, and a first supplemental indenture, or the first supplemental indenture, and together with the base indenture and the second supplemental indenture described below, the indenture, relating to the Company’s issuance of $400,000 aggregate principal amount of its 4.000% notes due 2019, or the 4.000% notes.
The 4.000% notes will mature on July 15, 2019 and may be redeemed in whole or in part at the Company’s option at any time or from time to time at the redemption price set forth in the indenture. The 4.000% notes bear interest at a rate of 4.000% per year, payable semi-annually on January 15 and July 15 of each year, commencing on January 15, 2015. The 4.000% notes are general unsecured obligations of the Company that rank senior in right of payment to all of the Company’s existing and future indebtedness that is expressly subordinated in right of payment to the 4.000% notes and rank pari passu with all outstanding and future unsecured unsubordinated indebtedness issued by the Company.
157
Table of Contents
FS Investment Corporation
Notes to Consolidated Financial Statements (continued)
(in thousands, except share and per share amounts)
Note 8. Financing Arrangements (continued)
In addition, on the occurrence of a “change of control repurchase event,” as defined in the indenture, the Company will generally be required to make an offer to purchase the outstanding 4.000% notes at a price equal to 100% of the principal amount of such notes plus accrued and unpaid interest to the repurchase date.
The indenture contains certain covenants, including covenants requiring the Company to comply with the asset coverage requirements of Section 18(a)(1)(A) of the 1940 Act, as modified by Section 61(a)(1) of the 1940 Act, whether or not it is subject to those requirements, and to provide financial information to the holders of the 4.000% notes and U.S. Bank if the Company is no longer subject to the reporting requirements under the Exchange Act of 1934, as amended, or the Exchange Act. These covenants are subject to limitations and exceptions that are described in the indenture.
As of December 31, 2014 and 2013, $400,000 and $0, respectively, of the 4.000% notes were outstanding. The carrying amount outstanding under the 4.000% notes approximates its fair value. The Company incurred costs of $6,177 in connection with issuing the 4.000% notes, which the Company has recorded as deferred financing costs on its consolidated balance sheets and amortizes to interest expense over the life of the 4.000% notes. As of December 31, 2014, $5,601 of such deferred financing costs had yet to be amortized to interest expense.
For the years ended December 31, 2014, 2013 and 2012, the components of total interest expense for the 4.000% notes due 2019 were as follows:
| Year Ended December 31, |
||||||||||||
| 2014 | 2013 | 2012 | ||||||||||
| Direct interest expense |
$ | 7,496 | $ | — | $ | — | ||||||
| Amortization of deferred financing costs |
576 | — | — | |||||||||
|
|
|
|
|
|
|
|||||||
| Total interest expense |
$ | 8,072 | $ | — | $ | — | ||||||
|
|
|
|
|
|
|
|||||||
For the years ended December 31, 2014, 2013 and 2012, the cash paid for interest expense, average borrowings, effective interest rate and weighted average interest rate for the 4.000% notes due 2019 were as follows:
| Year Ended December 31, |
||||||||||||
| 2014 | 2013 | 2012 | ||||||||||
| Cash paid for interest expense(1) |
$ | — | — | — | ||||||||
| Average borrowings under the facility(2) |
$ | 400,000 | — | — | ||||||||
| Effective interest rate on borrowings (including the effect of non-usage fees) |
4.00 | % | — | — | ||||||||
| Weighted average interest rate (including the effect of non-usage fees) |
4.00 | % | — | — | ||||||||
| (1) | Interest under the 4.000% notes due 2019 is paid semi-annually in arrears. |
| (2) | Average borrowings under the 4.000% notes are calculated for the period since the date of issuance to December 31, 2014. |
158
Table of Contents
FS Investment Corporation
Notes to Consolidated Financial Statements (continued)
(in thousands, except share and per share amounts)
Note 8. Financing Arrangements (continued)
4.250% Notes due 2020
On December 3, 2014, the Company and U.S. Bank entered into a second supplemental indenture to the base indenture, or the second supplemental indenture, relating to the Company’s issuance of $325,000 aggregate principal amount of its 4.250% notes due 2020, or the 4.250% notes.
The 4.250% notes will mature on January 15, 2020 and may be redeemed in whole or in part at the Company’s option at any time or from time to time at the redemption price set forth in the indenture. The 4.250% notes bear interest at a rate of 4.250% per year, payable semi-annually on January 15 and July 15 of each year, commencing on July 15, 2015. The 4.250% notes are general unsecured obligations of the Company that rank senior in right of payment to all of the Company’s existing and future indebtedness that is expressly subordinated in right of payment to the 4.250% notes and rank pari passu with all outstanding and future unsecured unsubordinated indebtedness issued by the Company.
In addition, on the occurrence of a “change of control repurchase event,” as defined in the indenture, the Company will generally be required to make an offer to purchase the outstanding 4.250% notes at a price equal to 100% of the principal amount of such notes plus accrued and unpaid interest to the repurchase date.
The indenture contains certain covenants, including covenants requiring the Company to comply with the asset coverage requirements of Section 18(a)(1)(A) of the 1940 Act, as modified by Section 61(a)(1) of the 1940 Act, whether or not it is subject to those requirements, and to provide financial information to the holders of the 4.250% notes and U.S. Bank if the Company is no longer subject to the reporting requirements under the Exchange Act of 1934, as amended, or the Exchange Act. These covenants are subject to limitations and exceptions that are described in the indenture.
As of December 31, 2014 and 2013, $325,000 and $0, respectively, of the 4.250% notes was outstanding. The carrying amount outstanding under the 4.250% notes approximates its fair value. The Company incurred costs of $4,954 in connection with issuing the 4.250% notes, which the Company has recorded as deferred financing costs on its consolidated balance sheets and amortizes to interest expense over the life of the 4.250% notes. As of December 31, 2014, $4,884 of such deferred financing costs had yet to be amortized to interest expense.
For the years ended December 31, 2014, 2013 and 2012, the components of total interest expense for the 4.250% notes due 2020 were as follows:
| Year Ended December 31, |
||||||||||||
| 2014 | 2013 | 2012 | ||||||||||
| Direct interest expense |
$ | 1,097 | $ | — | $ | — | ||||||
| Amortization of deferred financing costs |
70 | — | — | |||||||||
|
|
|
|
|
|
|
|||||||
| Total interest expense |
$ | 1,167 | $ | — | $ | — | ||||||
|
|
|
|
|
|
|
|||||||
159
Table of Contents
FS Investment Corporation
Notes to Consolidated Financial Statements (continued)
(in thousands, except share and per share amounts)
Note 8. Financing Arrangements (continued)
For the years ended December 31, 2014, 2013 and 2012, the cash paid for interest expense, average borrowings, effective interest rate and weighted average interest rate for the 4.250% notes due 2020 were as follows:
| Year Ended December 31, |
||||||||||||
| 2014 | 2013 | 2012 | ||||||||||
| Cash paid for interest expense(1) |
$ | — | — | — | ||||||||
| Average borrowings under the facility(2) |
$ | 325,000 | — | — | ||||||||
| Effective interest rate on borrowings (including the effect of non-usage fees) |
4.25 | % | — | — | ||||||||
| Weighted average interest rate (including the effect of non-usage fees) |
4.25 | % | — | — | ||||||||
| (1) | Interest under the 4.250% notes due 2020 is paid semi-annually in arrears. |
| (2) | Average borrowings under the 4.250% notes are calculated for the period since the date of issuance to December 31, 2014. |
Note 9. Commitments and Contingencies
The Company enters into contracts that contain a variety of indemnification provisions. The Company’s maximum exposure under these arrangements is unknown; however, the Company has not had prior claims or losses pursuant to these contracts. Management of FB Advisor has reviewed the Company’s existing contracts and expects the risk of loss to the Company to be remote.
The Company is not currently subject to any material legal proceedings and, to the Company’s knowledge, no material legal proceedings are threatened against the Company. From time to time, the Company may be a party to certain legal proceedings in the ordinary course of business, including proceedings relating to the enforcement of the Company’s rights under contracts with its portfolio companies. While the outcome of these legal proceedings cannot be predicted with certainty, the Company does not expect that any such proceedings will have a material effect upon its financial condition or results of operations.
See Note 6 for a discussion of the Company’s unfunded commitments.
Note 10. Senior Securities Asset Coverage
Information about the Company’s senior securities is shown in the table below for the years ended December 31, 2014, 2013, 2012, 2011 and 2010:
| Year Ended December 31, |
Total Amount Outstanding Exclusive of Treasury Securities(1) |
Asset Coverage per Unit(2) |
Involuntary Liquidation Preference per Unit(3) |
Average Market Value per Unit(4) (Exclude Bank Loans) |
||||||||||||
| 2010 |
$ | 297,201 | 2.31 | — | N/A | |||||||||||
| 2011 |
$ | 791,324 | 2.89 | — | N/A | |||||||||||
| 2012 |
$ | 1,649,713 | 2.52 | — | N/A | |||||||||||
| 2013 |
$ | 1,673,682 | 2.58 | — | N/A | |||||||||||
| 2014 |
$ | 1,863,827 | 2.27 | — | N/A | |||||||||||
160
Table of Contents
FS Investment Corporation
Notes to Consolidated Financial Statements (continued)
(in thousands, except share and per share amounts)
Note 10. Senior Securities Asset Coverage (continued)
| (1) | Total amount of each class of senior securities outstanding at the end of the period presented. For purposes of the asset coverage test, the Company treats the outstanding notional amount of the TRS, less the initial amount of any cash collateral required to be posted, as a senior security. |
| (2) | Asset coverage per unit is the ratio of the carrying value of the Company’s total consolidated assets, less all liabilities and indebtedness not represented by senior securities, to the aggregate amount of senior securities representing indebtedness. |
| (3) | The amount to which such class of senior security would be entitled upon the voluntary liquidation of the Company in preference to any security junior to it. The “—” in this column indicates that the SEC expressly does not require this information to be disclosed for certain types of senior securities. |
| (4) | Not applicable because senior securities are not registered for public trading on a stock exchange. |
161
Table of Contents
FS Investment Corporation
Notes to Consolidated Financial Statements (continued)
(in thousands, except share and per share amounts)
Note 11. Financial Highlights
The following is a schedule of financial highlights of the Company for the years ended December 31, 2014, 2013, 2012, 2011 and 2010:
| Year Ended December 31, | ||||||||||||||||||||
| 2014 | 2013 | 2012 | 2011 | 2010 | ||||||||||||||||
| Per Share Data:(1) |
||||||||||||||||||||
| Net asset value, beginning of period |
$ | 10.18 | $ | 9.97 | $ | 9.35 | $ | 9.42 | $ | 9.10 | ||||||||||
| Results of operations(2) |
||||||||||||||||||||
| Net investment income (loss) |
0.97 | 0.96 | 0.59 | 0.76 | 0.40 | |||||||||||||||
| Net realized and unrealized appreciation (depreciation) on investments and total return swap and gain/loss on foreign currency |
(0.19 | ) | 0.08 | 0.86 | (0.19 | ) | 0.81 | |||||||||||||
|
|
|
|
|
|
|
|
|
|
|
|||||||||||
| Net increase (decrease) in net assets resulting from operations |
0.78 | 1.04 | 1.45 | 0.57 | 1.21 | |||||||||||||||
|
|
|
|
|
|
|
|
|
|
|
|||||||||||
| Stockholder distributions(3) |
||||||||||||||||||||
| Distributions from net investment income |
(0.79 | ) | (0.83 | ) | (0.63 | ) | (0.78 | ) | (0.55 | ) | ||||||||||
| Distributions from net realized gain on investments |
(0.29 | ) | — | (0.23 | ) | (0.13 | ) | (0.32 | ) | |||||||||||
|
|
|
|
|
|
|
|
|
|
|
|||||||||||
| Net decrease in net assets resulting from stockholder distributions |
(1.08 | ) | (0.83 | ) | (0.86 | ) | (0.91 | ) | (0.87 | ) | ||||||||||
|
|
|
|
|
|
|
|
|
|
|
|||||||||||
| Capital share transactions |
||||||||||||||||||||
| Issuance of common stock(4) |
— | — | 0.04 | 0.34 | 0.10 | |||||||||||||||
| Repurchases of common stock(5) |
(0.05 | ) | — | — | — | — | ||||||||||||||
| Offering costs(2) |
— | — | (0.01 | ) | (0.07 | ) | (0.07 | ) | ||||||||||||
| Reimbursement to investment adviser(2) |
— | — | — | — | (0.10 | ) | ||||||||||||||
| Capital contributions of investment adviser(2) |
— | — | — | — | 0.05 | |||||||||||||||
|
|
|
|
|
|
|
|
|
|
|
|||||||||||
| Net increase (decrease) in net assets resulting from capital share transactions |
(0.05 | ) | — | 0.03 | 0.27 | (0.02 | ) | |||||||||||||
|
|
|
|
|
|
|
|
|
|
|
|||||||||||
| Net asset value, end of period |
$ | 9.83 | $ | 10.18 | $ | 9.97 | $ | 9.35 | $ | 9.42 | ||||||||||
|
|
|
|
|
|
|
|
|
|
|
|||||||||||
| Per share market value, end of period |
$ | 9.93 | — | — | — | — | ||||||||||||||
|
|
|
|
|
|
|
|
|
|
|
|||||||||||
| Shares outstanding, end of period |
240,896,559 | 259,320,161 | 251,890,821 | 160,390,540 | 41,332,661 | |||||||||||||||
|
|
|
|
|
|
|
|
|
|
|
|||||||||||
| Total return based on net asset value(6) |
7.17 | % | 10.43 | % | 15.83 | % | 8.93 | % | 13.08 | % | ||||||||||
|
|
|
|
|
|
|
|
|
|
|
|||||||||||
| Total return based on market value(7) |
5.35 | % | — | — | — | — | ||||||||||||||
|
|
|
|
|
|
|
|
|
|
|
|||||||||||
| Ratio/Supplemental Data: |
||||||||||||||||||||
| Net assets, end of period |
$ | 2,366,986 | $ | 2,640,992 | $ | 2,511,738 | $ | 1,498,892 | $ | 389,232 | ||||||||||
|
|
|
|
|
|
|
|
|
|
|
|||||||||||
| Ratio of net investment income to average net assets(8) |
9.54 | % | 9.50 | % | 6.07 | % | 8.10 | % | 4.37 | % | ||||||||||
|
|
|
|
|
|
|
|
|
|
|
|||||||||||
| Ratio of total operating expenses to average net assets(8) |
8.90 | % | 8.90 | % | 7.67 | % | 5.01 | % | 9.89 | % | ||||||||||
| Ratio of waived expenses to average net assets(8) |
(0.11 | )% | — | — | — | — | ||||||||||||||
|
|
|
|
|
|
|
|
|
|
|
|||||||||||
| Ratio of net operating expenses to average net assets(8) |
8.79 | % | 8.90 | % | 7.67 | % | 5.01 | % | 9.89 | % | ||||||||||
|
|
|
|
|
|
|
|
|
|
|
|||||||||||
| Portfolio turnover |
50.27 | % | 61.18 | % | 65.70 | % | 72.28 | % | 67.48 | % | ||||||||||
|
|
|
|
|
|
|
|
|
|
|
|||||||||||
| Total amount of senior securities outstanding, exclusive of treasury securities |
$ | 1,863,827 | $ | 1,673,682 | $ | 1,649,713 | $ | 791,324 | $ | 297,201 | ||||||||||
|
|
|
|
|
|
|
|
|
|
|
|||||||||||
| Asset coverage per unit(9) |
2.27 | 2.58 | 2.52 | 2.89 | 2.31 | |||||||||||||||
| (1) | Per share data may be rounded in order to recompute the ending net asset value per share. |
162
Table of Contents
FS Investment Corporation
Notes to Consolidated Financial Statements (continued)
(in thousands, except share and per share amounts)
Note 11. Financial Highlights (continued)
| (2) | The per share data was derived by using the weighted average shares outstanding during the applicable period. |
| (3) | The per share data for distributions reflect the actual amount of distributions paid per share during the applicable period. |
| (4) | The issuance of common stock on a per share basis reflects the incremental net asset value changes as a result of the issuance of shares of common stock pursuant to the Company’s continuous public offering, as applicable, and pursuant to the Company’s distribution reinvestment plan. The issuance of common stock at an offering price, net of sales commissions and dealer manager fees, that is greater than the net asset value per share results in an increase in net asset value per share. |
| (5) | The listing tender offer and the purchase of shares of common stock pursuant thereto on June 4, 2014 resulted in a reduction to net asset value as a result of the Company repurchasing shares at a price greater than its net asset value per share. The per share impact of the Company’s repurchases of common stock is a reduction to net asset value of less than $0.01 per share during the years ended December 31, 2013, 2012, 2011 and 2010. |
| (6) | The total return based on net asset value for each year presented was calculated by taking the net asset value per share as of the end of the applicable year, adding the cash distributions per share that were declared during the applicable calendar year and dividing the total by the net asset value per share at the beginning of the applicable year. The historical calculation of total return in the table should not be considered a representation of the Company’s future total return, which may be greater or less than the return shown in the table due to a number of factors, including the Company’s ability or inability to make investments in companies that meet its investment criteria, the interest rates payable on the debt securities the Company acquires, the level of the Company’s expenses, variations in and the timing of the recognition of realized and unrealized gains or losses, the degree to which the Company encounters competition in its markets and general economic conditions. As a result of these factors, results for any previous period should not be relied upon as being indicative of performance in future periods. The total return calculations set forth above represent the total return on our investment portfolio during the applicable period and are calculated in accordance with GAAP. These return figures do not represent an actual return to stockholders. |
| (7) | The total return based on market value was calculated by taking the closing price of the Company’s shares on the NYSE on December 31, 2014, adding the cash distributions per share that were declared during the period from April 16, 2014 to December 31, 2014 and dividing the total by $10.25, the closing price of the Company’s shares on the NYSE on April 16, 2014 (the first day the shares began trading on the NYSE). The historical calculation of total return based on market value in the table should not be considered a representation of the Company’s future total return based on market value, which may be greater or less than the return shown in the table due to a number of factors, including the Company’s ability or inability to make investments in companies that meet its investment criteria, the interest rates payable on the debt securities the Company acquires, the level of the Company’s expenses, variations in and the timing of the recognition of realized and unrealized gains or losses, the degree to which the Company encounters competition in its markets, general economic conditions and fluctuations in per share market value. As a result of these factors, results for any previous period should not be relied upon as being indicative of performance in future periods. |
163
Table of Contents
FS Investment Corporation
Notes to Consolidated Financial Statements (continued)
(in thousands, except share and per share amounts)
Note 11. Financial Highlights (continued)
| (8) | Weighted average net assets during the applicable period are used for this calculation. The following is a schedule of supplemental ratios for the years ended December 31, 2014, 2013, 2012, 2011 and 2010: |
| Year Ended December 31, | ||||||||||||||||||||
| 2014 | 2013 | 2012 | 2011 | 2010 | ||||||||||||||||
| Ratio of accrued capital gains incentive fees to average net assets |
(0.37 | )% | 0.16 | % | 1.80 | % | (0.46 | )% | 2.54 | % | ||||||||||
| Ratio of subordinated income incentive fees to average net assets |
2.29 | % | 2.41 | % | 0.61 | % | — | — | ||||||||||||
| Ratio of interest expense to average net assets |
2.56 | % | 1.97 | % | 1.37 | % | 1.29 | % | 1.81 | % | ||||||||||
| Ratio of excise taxes to average net assets |
0.21 | % | 0.22 | % | 0.02 | % | — | — | ||||||||||||
| (9) | Asset coverage per unit is the ratio of the carrying value of our total consolidated assets, less liabilities and indebtedness not represented by senior securities, to the aggregate amount of senior securities representing indebtedness. |
164
Table of Contents
FS Investment Corporation
Notes to Consolidated Financial Statements (continued)
(in thousands, except share and per share amounts)
Note 12. Selected Quarterly Financial Data (Unaudited)
The following is the quarterly results of operations for the years ended December 31, 2014 and 2013. The following information reflects all normal recurring adjustments necessary for a fair presentation of the information for the periods presented. The operating results for any quarter are not necessarily indicative of results for any future period.
| Quarter Ended | ||||||||||||||||
| December 31, 2014 |
September 30, 2014 |
June 30, 2014 |
March 31, 2014 |
|||||||||||||
| Investment income |
$ | 113,385 | $ | 115,917 | $ | 120,721 | $ | 114,796 | ||||||||
| Operating expenses |
||||||||||||||||
| Net expenses and excise taxes |
45,330 | 55,814 | 62,748 | 58,919 | ||||||||||||
|
|
|
|
|
|
|
|
|
|||||||||
| Net investment income |
68,055 | 60,103 | 57,973 | 55,877 | ||||||||||||
| Realized and unrealized gain (loss) |
(78,244 | ) | (4,504 | ) | 11,338 | 24,183 | ||||||||||
|
|
|
|
|
|
|
|
|
|||||||||
| Net increase (decrease) in net assets resulting from operations |
$ | (10,189 | ) | $ | 55,599 | $ | 69,311 | $ | 80,060 | |||||||
|
|
|
|
|
|
|
|
|
|||||||||
| Per share information-basic and diluted |
||||||||||||||||
| Net investment income |
$ | 0.28 | $ | 0.25 | $ | 0.23 | $ | 0.22 | ||||||||
|
|
|
|
|
|
|
|
|
|||||||||
| Net increase (decrease) in net assets resulting from operations |
$ | (0.04 | ) | $ | 0.23 | $ | 0.27 | $ | 0.31 | |||||||
|
|
|
|
|
|
|
|
|
|||||||||
| Weighted average shares outstanding |
240,480,410 | 239,548,922 | 255,301,300 | 260,185,661 | ||||||||||||
|
|
|
|
|
|
|
|
|
|||||||||
| Quarter Ended | ||||||||||||||||
| December 31, 2013 |
September 30, 2013 |
June 30, 2013 |
March 31, 2013 |
|||||||||||||
| Investment income |
$ | 116,866 | $ | 123,307 | $ | 124,349 | $ | 110,044 | ||||||||
| Operating expenses |
||||||||||||||||
| Total expenses |
64,446 | 55,535 | 50,294 | 59,315 | ||||||||||||
|
|
|
|
|
|
|
|
|
|||||||||
| Net investment income |
52,420 | 67,772 | 74,055 | 50,729 | ||||||||||||
| Realized and unrealized gain (loss) |
24,388 | (8,155 | ) | (27,116 | ) | 31,747 | ||||||||||
|
|
|
|
|
|
|
|
|
|||||||||
| Net increase (decrease) in net assets resulting from operations |
$ | 76,808 | $ | 59,617 | $ | 46,939 | $ | 82,476 | ||||||||
|
|
|
|
|
|
|
|
|
|||||||||
| Per share information-basic and diluted |
||||||||||||||||
| Net investment income |
$ | 0.20 | $ | 0.26 | $ | 0.29 | $ | 0.20 | ||||||||
|
|
|
|
|
|
|
|
|
|||||||||
| Net increase (decrease) in net assets resulting from operations |
$ | 0.30 | $ | 0.23 | $ | 0.18 | $ | 0.33 | ||||||||
|
|
|
|
|
|
|
|
|
|||||||||
| Weighted average shares outstanding |
258,262,842 | 256,108,444 | 254,213,036 | 252,606,873 | ||||||||||||
|
|
|
|
|
|
|
|
|
|||||||||
The sum of quarterly per share amounts does not necessarily equal per share amounts reported for the years ended December 31, 2014 and 2013. This is due to changes in the number of weighted-average shares outstanding and the effects of rounding for each period.
165
Table of Contents
| Item 9. | Changes in and Disagreements with Accountants on Accounting and Financial Disclosure. |
None.
| Item 9A. | Controls and Procedures. |
Evaluation of Disclosure Controls and Procedures
We maintain disclosure controls and procedures that are designed to ensure that information required to be disclosed in our reports filed under the Exchange Act is recorded, processed, summarized and reported within the time periods specified in the SEC’s rules and forms and that such information is accumulated and communicated to our management, including our chief executive officer and chief financial officer, as appropriate, to allow for timely decisions regarding required disclosure. In designing and evaluating the disclosure controls and procedures, management recognizes that any controls and procedures, no matter how well designed and operated, can provide only reasonable assurance of achieving the desired control objectives, and management is required to apply its judgment in evaluating the cost-benefit relationship of possible controls and procedures.
As required by Exchange Act Rule 13(a)-15(b), we carried out an evaluation under the supervision and with the participation of our management, including our chief executive officer and chief financial officer, of the effectiveness of the design and operation of our disclosure controls and procedures as of December 31, 2014. Based on the foregoing, our chief executive officer and chief financial officer concluded that our disclosure controls and procedures were (a) designed to ensure that the information we are required to disclose in our reports under the Exchange Act is recorded, processed and reported in an accurate manner and on a timely basis and the information that we are required to disclose in our Exchange Act reports is accumulated and communicated to management to permit timely decisions with respect to required disclosure and (b) operating in an effective manner.
Management’s Annual Report on Internal Control Over Financial Reporting
Our management is responsible for establishing and maintaining adequate internal control over financial reporting. As defined in Exchange Act Rules 13a-15(f) and 15d-15(f), internal control over financial reporting is a process designed by, or under the supervision of, the company’s principal executive and principal financial officers, or persons performing similar functions, and effected by the company’s board of directors, management and other personnel, to provide reasonable assurance regarding the reliability of financial reporting and the preparation of financial statements for external purposes in accordance with GAAP.
Our internal control over financial reporting includes those policies and procedures that:
1. Pertain to the maintenance of records that, in reasonable detail, accurately and fairly reflect the Company’s transactions and the dispositions of assets of the Company;
2. Provide reasonable assurance that transactions are recorded as necessary to permit preparation of financial statements in accordance with generally accepted accounting principles, and that receipts and expenditures of the Company are being made only in accordance with authorizations of our management and board of directors; and
3. Provide reasonable assurance regarding prevention or timely detection of unauthorized acquisition, use or disposition of the Company’s assets that could have a material effect on the financial statements.
Because of its inherent limitations, a system of internal control over financial reporting can provide only reasonable assurance with respect to financial statement preparation and presentation and may not prevent or detect misstatements. Also, projections of any evaluation of effectiveness to future periods are subject to the risk that controls may become inadequate because of changes in conditions, or that the degree of compliance with the policies or procedures may deteriorate.
166
Table of Contents
Management’s report on internal control over financial reporting is set forth above under the heading “Management’s Report on Internal Control over Financial Reporting” in Item 8 of this annual report on Form 10-K.
Attestation Report of the Registered Public Accounting Firm
Our registered public accounting firm has issued an attestation report on our internal control over financial reporting. This report appears on page 102.
Changes in Internal Control Over Financial Reporting
During our fourth quarter of 2014, there has been no change in our internal control over financial reporting (as defined in Exchange Act Rules 13a-15(f) or 15d-15(f)) that has materially affected, or is reasonably likely to materially affect, our internal control over financial reporting.
None.
167
Table of Contents
PART III
We will file a definitive Proxy Statement for our 2015 Annual Meeting of Stockholders with the SEC, pursuant to Regulation 14A promulgated under the Exchange Act, not later than 120 days after the end of our fiscal year. Accordingly, certain information required by Part III has been omitted under General Instruction G(3) to Form 10-K. Only those sections of our definitive Proxy Statement that specifically address the items set forth herein are incorporated by reference.
| Item 10. | Directors, Executive Officers and Corporate Governance. |
The information required by Item 10 is hereby incorporated by reference from the Company’s definitive Proxy Statement relating to the Company’s 2015 Annual Meeting of Stockholders, to be filed with the SEC within 120 days following the end of our fiscal year.
| Item 11. | Executive Compensation. |
The information required by Item 11 is hereby incorporated by reference from the Company’s definitive Proxy Statement relating to the Company’s 2015 Annual Meeting of Stockholders, to be filed with the SEC within 120 days following the end of our fiscal year.
| Item 12. | Security Ownership of Certain Beneficial Owners and Management and Related Stockholder Matters. |
The information required by Item 12 is hereby incorporated by reference from the Company’s definitive Proxy Statement relating to the Company’s 2015 Annual Meeting of Stockholders, to be filed with the SEC within 120 days following the end of our fiscal year.
| Item 13. | Certain Relationships and Related Transactions, and Director Independence. |
The information required by Item 13 is hereby incorporated by reference from the Company’s definitive Proxy Statement relating to the Company’s 2015 Annual Meeting of Stockholders, to be filed with the SEC within 120 days following the end of our fiscal year.
| Item 14. | Principal Accountant Fees and Services. |
The information required by Item 14 is hereby incorporated by reference from the Company’s definitive Proxy Statement relating to the Company’s 2015 Annual Meeting of Stockholders, to be filed with the SEC within 120 days following the end of our fiscal year.
168
Table of Contents
PART IV
| Item 15. | Exhibits, Financial Statement Schedules. |
a. Documents Filed as Part of this Report
The following financial statements are set forth in Item 8:
b. Exhibits
Please note that the agreements included as exhibits to this annual report on Form 10-K are included to provide information regarding their terms and are not intended to provide any other factual or disclosure information about the Company or the other parties to the agreements. The agreements contain representations and warranties by each of the parties to the applicable agreement that have been made solely for the benefit of the other parties to the applicable agreement and may not describe the actual state of affairs as of the date they were made or at any other time.
The following exhibits are filed as part of this annual report or hereby incorporated by reference to exhibits previously filed with the SEC:
| 3.1 | Second Articles of Amendment and Restatement of FS Investment Corporation. (Incorporated by reference to Exhibit 3.1 to the Company’s Current Report on Form 8-K filed on April 16, 2014.) | |
| 3.2 | Second Amended and Restated Bylaws of FS Investment Corporation. (Incorporated by reference to Exhibit 3.2 to the Company’s Current Report on Form 8-K filed on April 16, 2014.) | |
| 4.1 | Distribution Reinvestment Plan, effective as of June 2, 2014. (Incorporated by reference to Exhibit 4.1 to the Company’s Current Report on Form 8-K filed on May 23, 2014.) | |
| 4.2 | Indenture, dated as of July 14, 2014, by and between the Company and U.S. Bank National Association, as trustee. (Incorporated by reference to Exhibit 4.2 to the Company’s Quarterly Report in Form 10-Q for the quarterly period ended June 30, 2014 filed on August 14, 2014.) | |
| 4.3 | First Supplemental Indenture, dated as of July 14, 2014, relating to the 4.000% Notes due 2019, by and between the Company and U.S. Bank National Association, as trustee. (Incorporated by reference to Exhibit 4.2 to the Company’s Current Report on Form 8-K filed on July 15, 2014.) | |
| 4.4 | Form of 4.000% Notes due 2019. (Incorporated by reference to Exhibit 4.2 to the Company’s Current Report on Form 8-K filed on July 15, 2014.) | |
| 4.5 | Second Supplemental Indenture, dated as of December 3, 2014, relating to the 4.250% Notes due 2020, by and between the Company and U.S. Bank National Association, as trustee. (Incorporated by reference to Exhibit 4.1 to the Company’s Current Report on Form 8-K filed on December 3, 2014.) | |
| 4.6 | Form of 4.250% Notes due 2020. (Incorporated by reference to Exhibit 4.2 to the Company’s Current Report on Form 8-K filed on December 3, 2014.) | |
169
Table of Contents
| 10.1 | Amended and Restated Investment Advisory Agreement, dated as of April 16, 2014, by and between FS Investment Corporation and FB Income Advisor, LLC. (Incorporated by reference to Exhibit 10.1 to the Company’s Current Report on Form 8-K filed on April 16, 2014.) | |
| 10.2 | Amended and Restated Investment Advisory Agreement, dated as of July 17, 2014, by and between FS Investment Corporation and FB Income Advisor, LLC. (Incorporated by reference to Exhibit 10.1 to the Company’s Current Report on Form 8-K filed on July 22, 2014.) | |
| 10.3 | Administration Agreement, dated as of April 16, 2014, by and between FS Investment Corporation and FB Income Advisor, LLC. (Incorporated by reference to Exhibit 10.2 to the Company’s Current Report on Form 8-K filed on April 16, 2014.) | |
| 10.4 | Investment Sub-advisory Agreement, dated as of April 13, 2008, by and between FB Income Advisor, LLC and GSO / Blackstone Debt Funds Management LLC. (Incorporated by reference to Exhibit (g)(2) filed with Amendment No. 2 to the Company’s registration statement on Form N-2 (File No. 333-149374) filed on June 19, 2008.) | |
| 10.5 | Investment Advisory and Administrative Services Agreement, dated as of February 12, 2008, by and between the Company and FB Income Advisor, LLC. (Incorporated by reference to Exhibit (g) filed with the Company’s registration statement on Form N-2 (File No. 333-149374) filed on February 25, 2008.) | |
| 10.6 | Custodian Agreement, dated as of November 14, 2011, by and between the Company and State Street Bank and Trust Company. (Incorporated by reference to Exhibit 10.9 filed with the Company’s Quarterly Report on Form 10-Q for the quarterly period ended September 30, 2011 filed on November 14, 2011.) | |
| 10.7 | Amended and Restated Credit Agreement, dated as of January 28, 2011, by and between Broad Street Funding LLC and Deutsche Bank AG, New York Branch. (Incorporated by reference to Exhibit 10.1 to the Company’s Current Report on Form 8-K filed on February 1, 2011.) | |
| 10.8 | Fourth Amendment to Credit Agreement, dated as of March 23, 2012, by and between Broad Street Funding LLC and Deutsche Bank AG, New York Branch. (Incorporated by reference to Exhibit 10.1 to the Company’s Current Report on Form 8-K filed on March 27, 2012.) | |
| 10.9 | Fifth Amendment to Credit Agreement, dated as of March 22, 2013, by and between Broad Street Funding LLC and Deutsche Bank AG, New York Branch. (Incorporated by reference to Exhibit 10.12 to the Company’s Annual Report on Form 10-K for the year ended December 31, 2012 filed on March 28, 2013.) | |
| 10.10 | Sixth Amendment to Credit Agreement, dated as of December 20, 2013, by and between Broad Street Funding LLC and Deutsche Bank AG, New York Branch. (Incorporated by reference to Exhibit 10.1 to the Company’s Current Report on Form 8-K filed on December 24, 2013.) | |
| 10.11 | Seventh Amendment to Credit Agreement, dated as of December 18, 2014, by and between Broad Street Funding LLC and Deutsche Bank AG, New York Branch. (Incorporated by reference to Exhibit 10.1 to the Company’s Current Report on Form 8-K filed on December 18, 2014.) | |
| 10.12 | Asset Contribution Agreement, dated as of March 10, 2010, by and between the Company and Broad Street Funding LLC. (Incorporated by reference to Exhibit 10.2 to the Company’s Current Report on Form 8-K filed on March 16, 2010.) | |
| 10.13 | First Amendment to Asset Contribution Agreement, dated as of June 17, 2010, by and between the Company and Broad Street Funding LLC. (Incorporated by reference to Exhibit 10.2 to the Company’s Current Report on Form 8-K filed on July 19, 2010.) | |
| 10.14 | Investment Management Agreement, dated as of March 10, 2010, by and between the Company and Broad Street Funding LLC. (Incorporated by reference to Exhibit 10.3 to the Company’s Current Report on Form 8-K filed on March 16, 2010.) | |
| 10.15 | Amended and Restated Security Agreement, dated as of January 28, 2011, by and between Broad Street Funding LLC and Deutsche Bank AG, New York Branch. (Incorporated by reference to Exhibit 10.2 to the Company’s Current Report on Form 8-K filed on February 1, 2011.) | |
170
Table of Contents
| 10.16 | Amended and Restated Investment Management Agreement, dated as of August 29, 2012, by and between the Company and Arch Street Funding LLC. (Incorporated by reference to Exhibit 10.5 to the Company’s Current Report on Form 8-K filed on August 31, 2012.) | |
| 10.17 | Amended and Restated Asset Transfer Agreement, dated as of September 26, 2012, by and between the Company and Locust Street Funding LLC. (Incorporated by reference to Exhibit 10.1 to the Company’s Current Report on Form 8-K filed on October 1, 2012.) | |
| 10.18 | Loan Agreement, dated as of August 29, 2012 and amended as of March 31, 2014, by and between Arch Street Funding LLC, the financial institutions and other lenders from time to time party thereto and Citibank, N.A., as administrative agent. (Incorporated by reference to Exhibit 10.4 to the Company’s Current Report on Form 8-K filed on April 4, 2014.) | |
| 10.19 | Account Control Agreement, dated as of August 29, 2012, by and between Arch Street Funding LLC, Citibank, N.A. and Virtus Group, LP. (Incorporated by reference to Exhibit 10.2 to the Company’s Current Report on Form 8-K filed on August 31, 2012.) | |
| 10.20 | Security Agreement, dated as of August 29, 2012, by and between Arch Street Funding LLC and Citibank, N.A. (Incorporated by reference to Exhibit 10.3 to the Company’s Current Report on Form 8-K filed on August 31, 2012.) | |
| 10.21 | Agreement and Plan of Merger, dated as of August 29, 2012, by and among Arch Street Funding LLC, Benjamin Loan Funding LLC, Benjamin 2 Loan Funding LLC, Citibank, N.A. and Citibank Financial Products Inc. (Incorporated by reference to Exhibit 10.4 to the Company’s Current Report on Form 8-K filed on August 31, 2012.) | |
| 10.22 | Amended and Restated Indenture, dated as of September 26, 2012, by and between Locust Street Funding LLC and Citibank, N.A., as trustee. (Incorporated by reference to Exhibit 10.2 to the Company’s Current Report on Form 8-K filed on October 1, 2012.) | |
| 10.23 | Supplemental Indenture No. 1, dated as of April 23, 2013, by and between Locust Street Funding LLC and Citibank, N.A., as trustee. (Incorporated by reference to Exhibit 10.1 to the Company’s Current Report on Form 8-K filed on April 26, 2013.) | |
| 10.24 | Locust Street Funding LLC Class A Floating Rate Secured Note, due 2021. (Incorporated by reference to Exhibit 10.3 to the Company’s Current Report on Form 8-K filed on February 21, 2012.) | |
| 10.25 | Locust Street Funding LLC Class A Floating Rate Secured Note, due 2023. (Incorporated by reference to Exhibit 10.3 to the Company’s Current Report on Form 8-K filed on October 1, 2012.) | |
| 10.26 | Locust Street Funding LLC Class A Floating Rate Secured Note, due 2024. (Incorporated by reference to Exhibit 10.2 to the Company’s Current Report on Form 8-K filed on April 26, 2013.) | |
| 10.27 | TBMA/ISMA 2000 Amended and Restated Global Master Repurchase Agreement by and between JPMorgan Chase Bank, N.A., London Branch and Race Street Funding LLC, together with the related Annex and Amended and Restated Confirmation thereto, each dated as of September 26, 2012. (Incorporated by reference to Exhibit 10.4 to the Company’s Current Report on Form 8-K filed on October 1, 2012.) | |
| 10.28 | TBMA/ISMA 2000 Amended and Restated Global Master Repurchase Agreement, by and between JPMorgan Chase Bank, N.A., London Branch and Race Street Funding LLC, together with the related Annex and Amended and Restated Confirmation thereto, each dated as of April 23, 2013. (Incorporated by reference to Exhibit 10.3 to the Company’s Current Report on Form 8-K filed on April 26, 2013.) | |
| 10.29 | Amended and Restated Confirmation, dated as of February 15, 2012, by and between Race Street Funding LLC and JPMorgan Chase Bank, N.A., London Branch. (Incorporated by reference to Exhibit 10.4 to the Company’s Current Report on Form 8-K filed on February 21, 2012.) | |
171
Table of Contents
| 10.30 | Revolving Credit Agreement, dated as of July 21, 2011, by and between the Company and Race Street Funding LLC. (Incorporated by reference to Exhibit 10.5 to the Company’s Current Report on Form 8-K filed on July 27, 2011.) | |
| 10.31 | Amendment to Credit Agreement, dated as of September 26, 2012, by and between Race Street Funding LLC and the Company. (Incorporated by reference to Exhibit 10.5 to the Company’s Current Report on Form 8-K filed on October 1, 2012.) | |
| 10.32 | Asset Transfer Amendment, dated as of September 26, 2012, by and between the Company and Race Street Funding LLC. (Incorporated by reference to Exhibit 10.6 to the Company’s Current Report on Form 8-K filed on October 1, 2012.) | |
| 10.33 | Amendment Agreement, dated as of October 24, 2013, by and between JPMorgan Chase Bank, N.A., London Branch and Race Street Funding LLC. (Incorporated by references to Exhibit 10.1 to the Company’s Current Report in Form 8-K filed on October 28, 2013.) | |
| 10.34 | Amended and Restated Collateral Management Agreement, dated as of September 26, 2012, by and between Locust Street Funding LLC and the Company. (Incorporated by reference to Exhibit 10.7 to the Company’s Current Report on Form 8-K filed on October 1, 2012.) | |
| 10.35 | Amended and Restated Collateral Administration Agreement, dated as of September 26, 2012, by and among Locust Street Funding LLC, the Company and Virtus Group, LP. (Incorporated by reference to Exhibit 10.8 to the Company’s Current Report on Form 8-K filed on October 1, 2012.) | |
| 10.36 | Collateral Management Agreement, dated as of September 26, 2012, by and between Race Street Funding LLC and the Company. (Incorporated by reference to Exhibit 10.9 to the Company’s Current Report on Form 8-K filed on October 1, 2012.) | |
| 10.37 | Loan and Servicing Agreement, dated as of May 17, 2012, by and among Walnut Street Funding LLC, Wells Fargo Securities, LLC, Wells Fargo Bank, National Association, and the other lender parties thereto. (Incorporated by reference to Exhibit 10.1 to the Company’s Current Report on Form 8-K filed on May 18, 2012.) | |
| 10.38 | Amendment No. 1 to Loan and Servicing Agreement, dated as of March 11, 2014, by and among Walnut Street Funding LLC, Wells Fargo Securities, LLC and Wells Fargo Bank, National Association. (Incorporated by reference to Exhibit 10.1 to the Company’s Current Report on Form 8-K filed on March 12, 2014). | |
| 10.39 | Purchase and Sale Agreement, dated as of May 17, 2012, by and between the Company and Walnut Street Funding LLC. (Incorporated by reference to Exhibit 10.2 to the Company’s Current Report on Form 8-K filed on May 18, 2012.) | |
| 10.40 | Collateral Management Agreement, dated as of May 17, 2012, by and between the Company and Walnut Street Funding LLC. (Incorporated by reference to Exhibit 10.3 to the Company’s Current Report on Form 8-K filed on May 18, 2012.) | |
| 10.41 | Securities Account Control Agreement, dated as of May 17, 2012, by and between Walnut Street Funding LLC and Wells Fargo Bank, National Association. (Incorporated by reference to Exhibit 10.4 to the Company’s Current Report on Form 8-K filed on May 18, 2012.) | |
| 10.42 | Senior Secured Revolving Credit Agreement, dated as of April 3, 2014, by and among FS Investment Corporation, ING Capital LLC, as administrative agent, and the lenders party thereto. (Incorporated by reference to Exhibit 10.1 to the Company’s Current Report on Form 8-K filed on April 4, 2014.) | |
| 10.43 | Guarantee, Pledge and Security Agreement, dated as of April 3, 2014, by and among FS Investment Corporation, ING Capital LLC, as revolving administrative agent and collateral agent, the subsidiary guarantors party thereto and each financing agent and designated indebtedness holder party thereto. (Incorporated by reference to Exhibit 10.2 to the Company’s Current Report on Form 8-K filed on April 4, 2014.) | |
172
Table of Contents
| 10.44 | Control Agreement, dated as of April 3, 2014, by and among FS Investment Corporation, ING Capital LLC, as collateral agent, and State Street Bank and Trust Company. (Incorporated by reference to Exhibit 10.3 to the Company’s Current Report on Form 8-K filed on April 4, 2014.) | |
| 10.45 | Trademark License Agreement, dated as of April 16, 2014, by and between FS Investment Corporation and Franklin Square Holdings, L.P. (Incorporated by reference to Exhibit 10.3 to the Company’s Current Report on Form 8-K filed on April 16, 2014.) | |
| 21.1* | Subsidiaries of the Company. | |
| 31.1* | Certification of Chief Executive Officer pursuant to Rule 13a-14 of the Securities Exchange Act of 1934, as amended. | |
| 31.2* | Certification of Chief Financial Officer pursuant to Rule 13a-14 of the Securities Exchange Act of 1934, as amended. | |
| 32.1* | Certification of Chief Executive Officer pursuant to Section 1350, Chapter 63 of Title 18, United States Code, as adopted pursuant to Section 906 of the Sarbanes-Oxley Act of 2002. | |
| 32.2* | Certification of Chief Financial Officer pursuant to Section 1350, Chapter 63 of Title 18, United States Code, as adopted pursuant to Section 906 of the Sarbanes-Oxley Act of 2002. | |
| * | Filed herewith. |
c. Financial statement schedules
No financial statement schedules are filed herewith because (1) such schedules are not required or (2) the information has been presented in the aforementioned financial statements.
173
Table of Contents
Pursuant to the requirements of Section 13 or 15(d) of the Securities Exchange Act of 1934, the registrant has duly caused this annual report to be signed on its behalf by the undersigned, thereunto duly authorized.
| FS INVESTMENT CORPORATION | ||||
| Date: March 2, 2015 |
/s/ MICHAEL C. FORMAN | |||
| Michael C. Forman Chief Executive Officer | ||||
Pursuant to the requirements of the Securities Exchange Act of 1934, this annual report has been signed below by the following persons on behalf of the registrant and in the capacity and on the dates indicated.
| Date: March 2, 2015 |
/s/ MICHAEL C. FORMAN | |||
| Michael C. Forman Chief Executive Officer and Director (Principal Executive Officer) | ||||
| Date: March 2, 2015 |
/s/ WILLIAM GOEBEL | |||
| William Goebel Chief Financial Officer (Principal Accounting and Financial Officer) | ||||
| Date: March 2, 2015 |
/s/ DAVID J. ADELMAN | |||
| David J. Adelman Director | ||||
| Date: March 2, 2015 |
/s/ GREGORY P. CHANDLER | |||
| Gregory P. Chandler Director | ||||
| Date: March 2, 2015 |
/s/ BARRY H. FRANK | |||
| Barry H. Frank Director | ||||
| Date: March 2, 2015 |
/s/ THOMAS J. GRAVINA | |||
| Thomas J. Gravina Director | ||||
| Date: March 2, 2015 |
/s/ MICHAEL J. HAGAN | |||
| Michael J. Hagan Director | ||||
| Date: March 2, 2015 |
/s/ JEFFREY K. HARROW | |||
| Jeffrey K. Harrow Director | ||||
| Date: March 2, 2015 |
/s/ MICHAEL HELLER | |||
| Michael Heller Director | ||||
| Date: March 2, 2015 |
/s/ PAUL MENDELSON | |||
| Paul Mendelson Director | ||||
| Date: March 2, 2015 |
/s/ PEDRO A. RAMOS | |||
| Pedro A. Ramos Director | ||||
174