Attached files
| file | filename |
|---|---|
| 8-K - 8-K - ASSOCIATED BANC-CORP | d814339d8k.htm |
 FOURTH QUARTER 2014
ASSOCIATED BANC-CORP
INVESTOR
PRESENTATION
Exhibit 99.1 |
 FORWARD-LOOKING STATEMENTS
Important note regarding forward-looking statements:
1
Statements made in this presentation which are not purely historical are
forward-looking statements, as defined in the Private Securities
Litigation Reform Act of 1995. This includes any statements regarding
management’s plans, objectives, or goals for future operations,
products
or
services,
and
forecasts
of
its
revenues,
earnings,
or
other measures
of performance.
Such forward-looking statements may be identified by the use of words such
as “believe”, “expect”, “anticipate”,
“plan”, “estimate”, “should”, “will”, “intend”, “outlook”, or
similar expressions.
Forward-looking statements are based on current management
expectations and, by their nature, are subject to risks and uncertainties. Actual
results may differ materially from those contained in the
forward-looking statements. Factors which may
cause actual results to differ materially from those contained in such
forward-looking statements include those identified in the
Company’s most recent Form 10-K and subsequent SEC filings.
Such factors are incorporated herein by reference.
*
* |
 INVESTMENT HIGHLIGHTS
Midwestern financial services company built upon a strong commitment to our
colleagues and the communities we serve
$26 billion in assets (Top 50 bank holding company in the U.S.)
225 banking offices serving approximately one million customers
Largest bank headquartered in Wisconsin
Franchise
Profitability
Asset quality
Capital and
liquidity
Capital ratios remain strong and above Basel III targets
Tier 1 common: 10.39%
TCE / TA: 7.57%
Robust loan growth and disciplined expense management resulting in attractive
shareholder returns
Return on Tier 1 Common Equity of 10.4% for the third quarter
Robust organic loan growth during 2014, managing towards 8.0% average loan
growth Well controlled expenses with initiatives which should continue to
benefit results Disciplined Underwriting & Risk Management Resulting in
Strong Asset Quality NCOs / avg loans: 0.06% YTD 3Q 2014, down from 2.84% in
2009 Non-accruals: 1.07% nonaccruals / loans in 3Q 2014, down from 7.63%
in 4Q 2009 Reserves / loans: 1.55% in 3Q 2014 compared to 4.06% in
2009 Ratings
Franchise evolution reflected in recent years’
positive ratings trajectory (now Baa1/BBB)
2 |
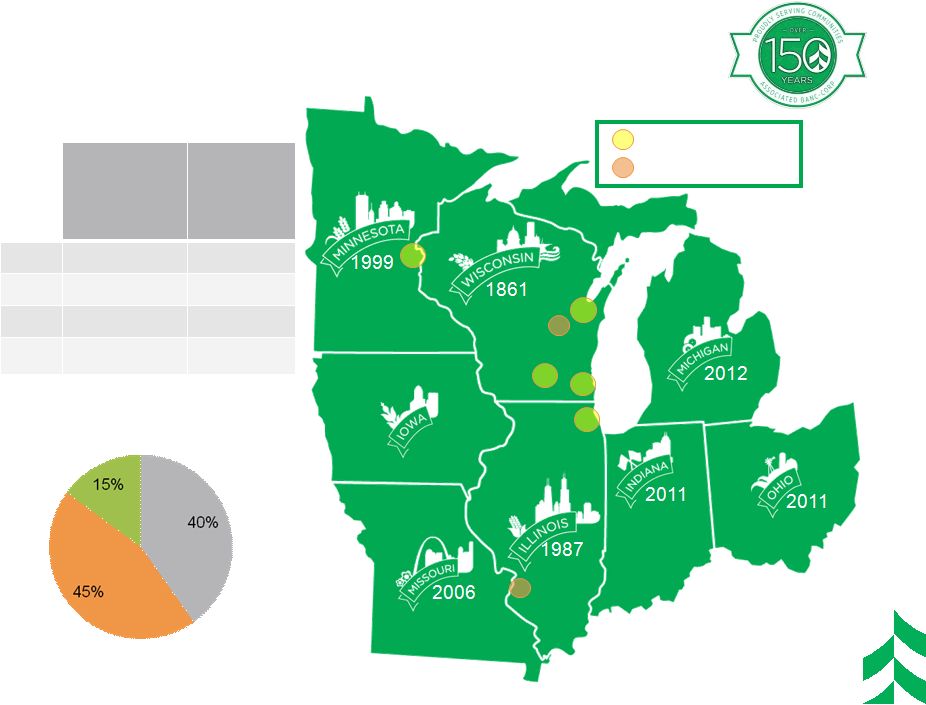 OUR
FOOTPRINT AND FRANCHISE ASBC
Deposits
($ in
billions)
ASBC
Branches
2
WI
$12.0
160
IL
$4.8
43
MN
$1.4
22
Total
$18.2
225
1
FDIC market share data 6/30/14
2
As of 9/30/14 (Period End)
>$1bn deposits
>$500mm deposits
3
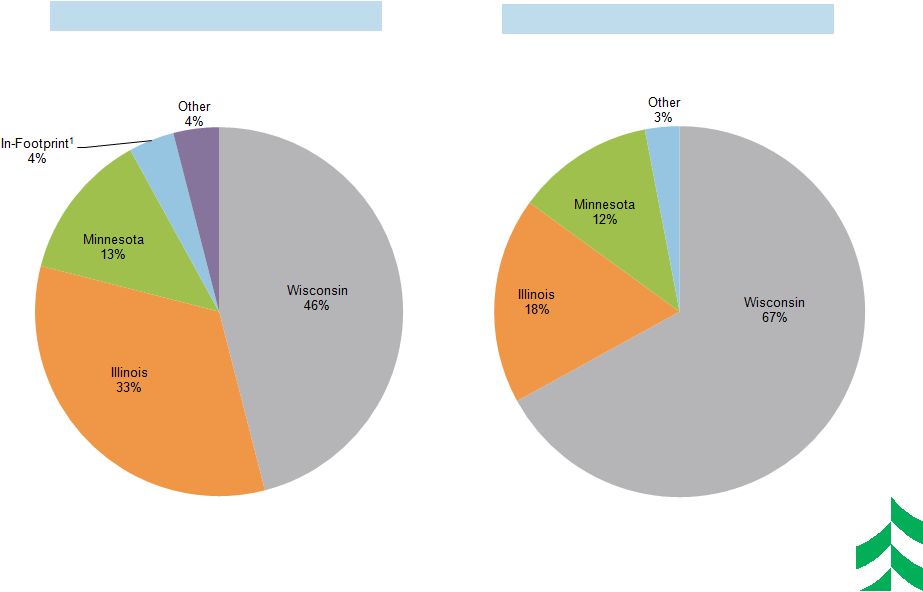
Total Loan Distribution
($17.2 billion –
Sept 2014 –
Period End)
Wisconsin
In Footprint
Other
1
1
2
*
* |
 *
*
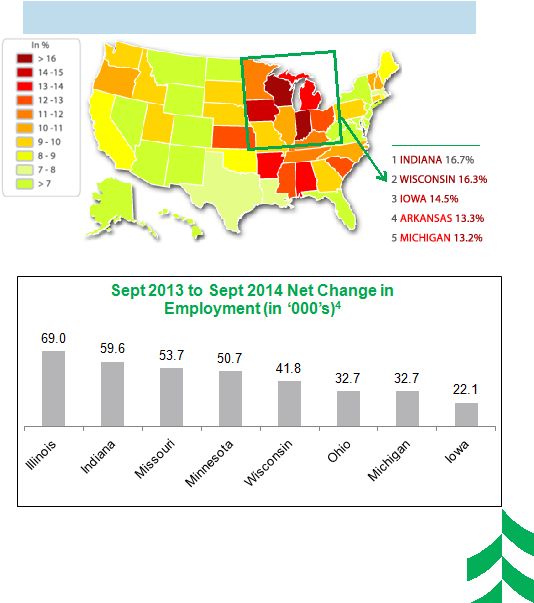
ATTRACTIVE MIDWEST MARKETS
•
Serve a Large Market Place:
(Footprint is ~ 20% of USA)
•
Manufacturing
Concentrated:
Top
3
states
(Indiana, Wisconsin, and Iowa)
for concentration of
manufacturing jobs and two
other states in the top 10
•
Favorable Employment
Dynamics:
Wisconsin,
Minnesota, Indiana, Iowa, and
Ohio all have unemployment
rates that are under 6%
•
Positive Economic Trends:
Continuing job growth across
the footprint
1
US Census Bureau 2012 ;
2
Area Development Online –
Author: Mark Crawford (Winter 2013); September 2014 US Bureau of
Labor Statistics;
4
Sept 2014 US Bureau of Labor Statistics -
“Regional and State Employment and Unemployment (Oct 21, 2014 News
Release) Manufacturing
Share
of
Non-Farm
Employment
4 of Top 5
4
2
1
3
3 |
 *
*
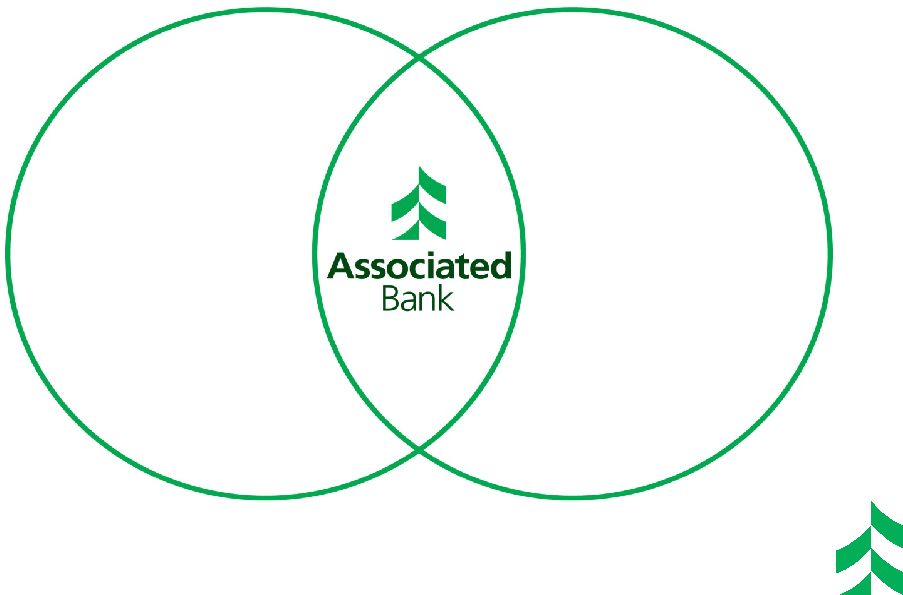
ASSOCIATED AT ITS CORE
Community
bank values,
flexibility,
decision-
making,
attention to
relationships
and service
Big bank
products,
strength,
lending limits,
efficiency,
innovation,
depth of
expertise
5 |
 DIVERSIFIED PORTFOLIO OF VALUE-ADDED
BUSINESSES
Corporate Banking
Consumer and
Commercial
Banking
Private Client and
Institutional
Services
Commercial
Deposits and
Treasury
Management
Capital Markets
Associated
Financial Group
Specialized
Lending
Verticals
Commercial Real
Estate
Specialized
Financial Services
Group
Branch
Banking
Commercial
Banking
Residential
Lending
Payments
and Direct
Channels
AIS -
Brokerage
Private Banking
Personal Trust
Asset
Management
Retirement Plan
Services
Community
Markets
6
* |
 Strong lending base in high-quality, low-volatility
diversified assets to provide foundation for
selective and prudent risk taking in higher risk
asset classes. (Meaningful allocations to
Mortgage, Multi-family and Manufacturing)
Core lending markets in Midwest with primary
emphasis placed on Wisconsin, Minnesota,
Illinois, Missouri, Iowa, Indiana, Ohio and
Michigan. (85% of Q3 2014 Loans)
•
Retail –
30-40%
•
C&I –
30-40%
•
CRE –
25-35%
DIVERSIFIED LOAN PORTFOLIO
7
Asset Mix
Geographic Mix
Industry Mix
Internal Portfolio Management Goals
•
We are building a diversified loan portfolio that we believe will perform well
through the next downturn in the credit cycle.
Current (Q3-2014)
•
Retail –
37%
•
C&I –
39%
•
CRE –
24%
* |
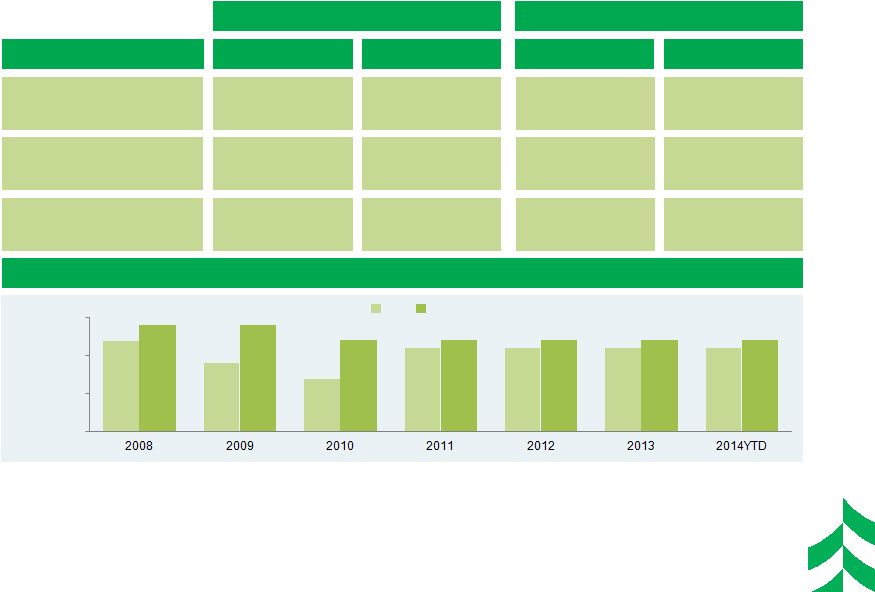
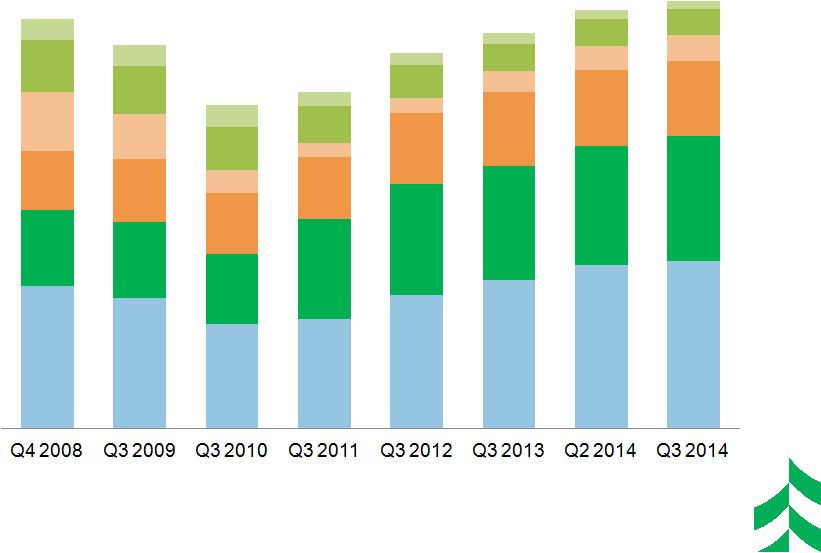 RESHAPING & REBUILDING THE LOAN
PORTFOLIO
1
Based on Average Balances, $ in Billions
Installment
HELOCs &
2 Liens
Residential
Mortgage &
HE 1
Liens
Construction
CRE
Investor
Commercial
& Business
Lending
$16.3
$15.2
$12.9
$14.9
$15.7
5%
7%
4%
11%
13%
13%
14%
14%
19%
35%
7%
17%
20%
32%
4%
18%
30%
33%
$16.6
$17.1
3%
9%
4%
19%
30%
35%
3%
7%
5%
19%
29%
37%
2%
6%
6%
18%
29%
39%
$13.4
6%
6%
18%
29%
39%
2%
34%
22%
19%
11%
13%
5%
8
nd
st
1
*
* |
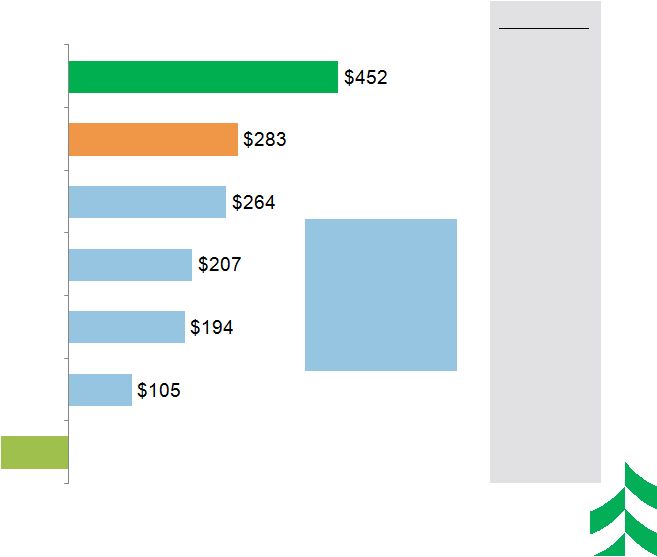 LOAN
PORTFOLIO GROWTH AVERAGE LOAN GROWTH OF $1.4 BILLION OR 9% GROWTH FROM 4Q
13 3Q 2014 vs. 4Q 2013 Change in Average Net Loan Balances by Category
($ in millions)
Home Equity & Installment
Commercial Real Estate
Residential Mortgage
Power & Utilities
Oil & Gas
Mortgage Warehouse
General Commercial Loans
Total
Commercial &
Business
Lending =
+13%
(+$770)
+12%
% Change
+101%
+8%
+6%
+47%
(5%)
+19%
9
($112)
*
* |
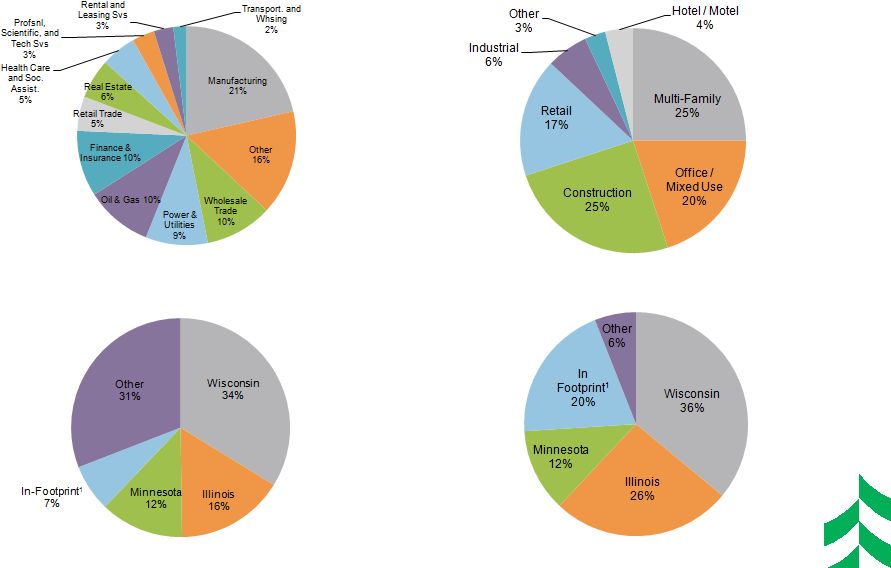 COMMERCIAL LOAN DETAIL
C&BL Loans by Industry
($6.7 billion –
Sept 2014 –
Period End)
C&BL Loans by State
1
Includes Missouri, Indiana, Ohio, Michigan, & Iowa
($6.7 billion –
Sept 2014 –
Period End)
CRE Loans by Industry
($4.0 billion –
Sept 2014 –
Period End)
CRE Loans by State
($4.0 billion –
Sept 2014 –
Period End)
10
*
* |
 RETAIL LOANS BY STATE
Residential Mortgage Loans
($4.3 billion –
Sept 2014 –
Period End)
Home Equity Loans
($1.7 billion –
Sept 2014 –
Period End)
1
Includes Missouri, Indiana, Ohio, Michigan, & Iowa
2
Approximately 40% is in first lien position
11
2
*
* |
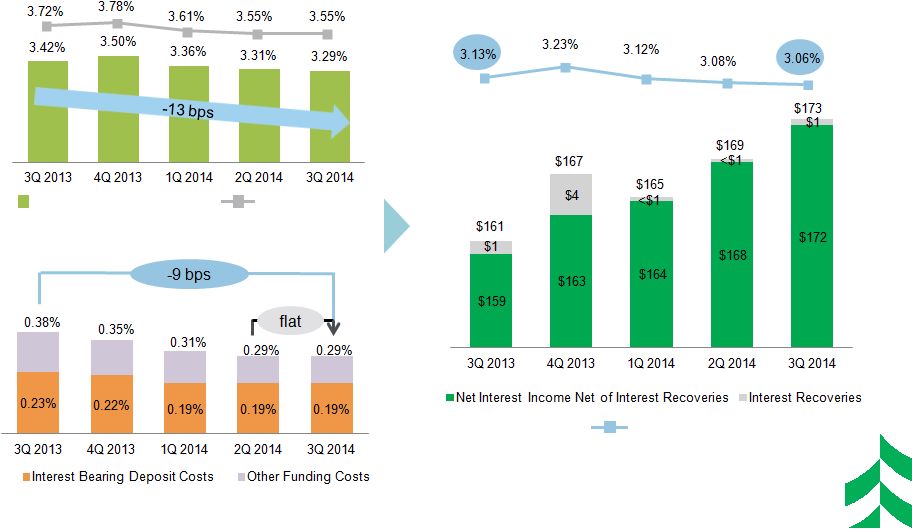 GROWING NET INTEREST INCOME WHILE
MARGIN COMPRESSES
Yield on Interest-earning Assets
Cost of Interest-bearing Liabilities
Net Interest Income & Net Interest Margin
($ in millions)
Net Interest Margin
Total Loan Yield
Total Interest-earning Yield
12
*
* |
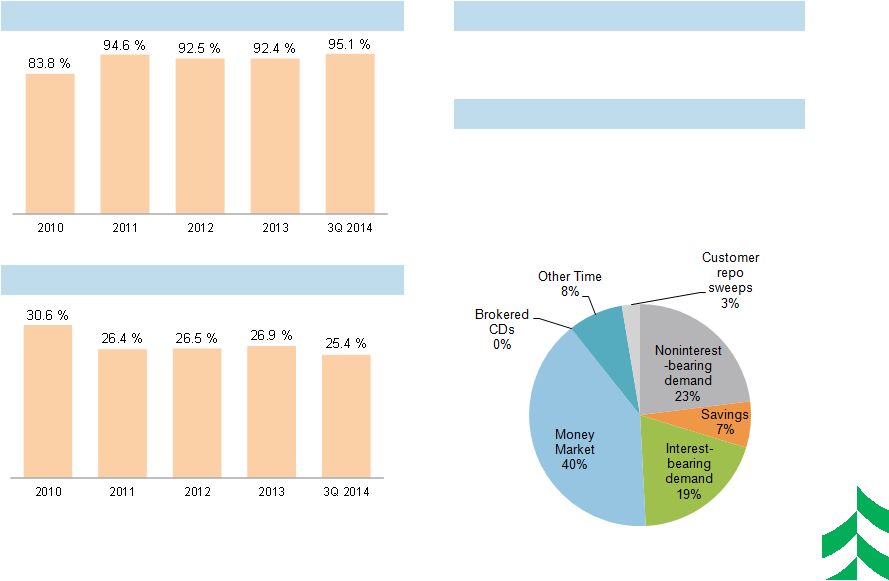 STABLE DEPOSIT AND LIQUIDITY PROFILE
Loans / Deposits
Securities / Earnings Assets
•
Bank holding company cash and liquid
investments of $117mm
Deposits and Customer Funding Mix
•
$18.7 billion at 9/30/2014
•
~990k deposit accounts with over $10 billion
of granular deposits (under $250k)
13
Strong Holding Company Liquidity
*
* |
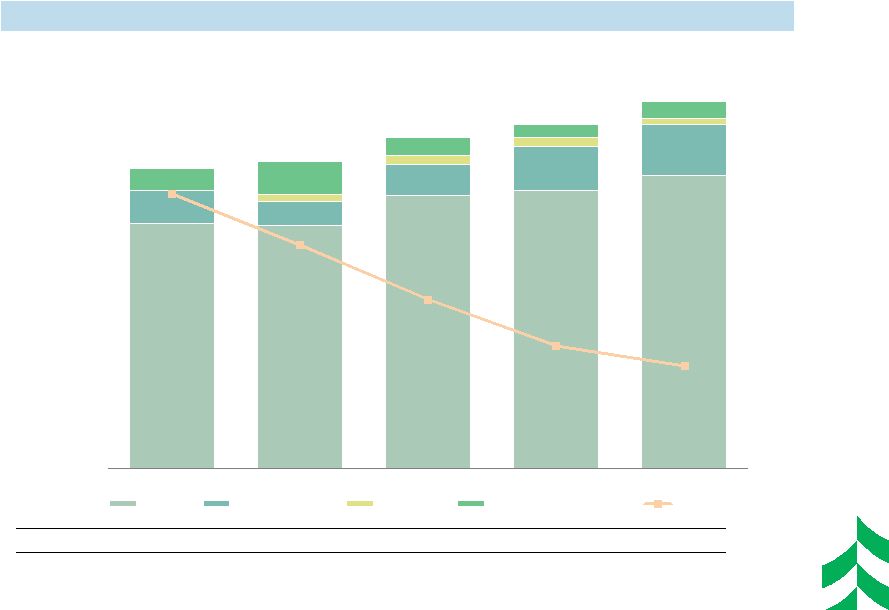 LOW-COST, CORE DEPOSIT FUNDING
Funding Composition Over Time
Cost of Deposits
0.63 %
0.46 %
0.27 %
0.18 %
0.15 %
•
Stable funding composition with 80% deposits and 20% from other low-cost
sources 14
$ 15,225
$ 15,091
$ 16,940
$ 17,267
$ 18,201
$ 2,001
$ 1,500
$ 1,925
$ 2,700
$ 3,105
$ 430
$ 585
$ 585
$ 430
$ 1,401
$ 2,037
$ 1,101
$ 783
$ 1,048
$ 18,627
$ 19,058
$ 20,551
$ 21,336
$ 22,784
0.89 %
0.70 %
0.49 %
0.31 %
0.24 %
2010
2011
2012
2013
3Q 2014
Deposits
FHLB Borrowings
Senior Debt
Other Wholesale Funding
Cost of Funds
*
* |
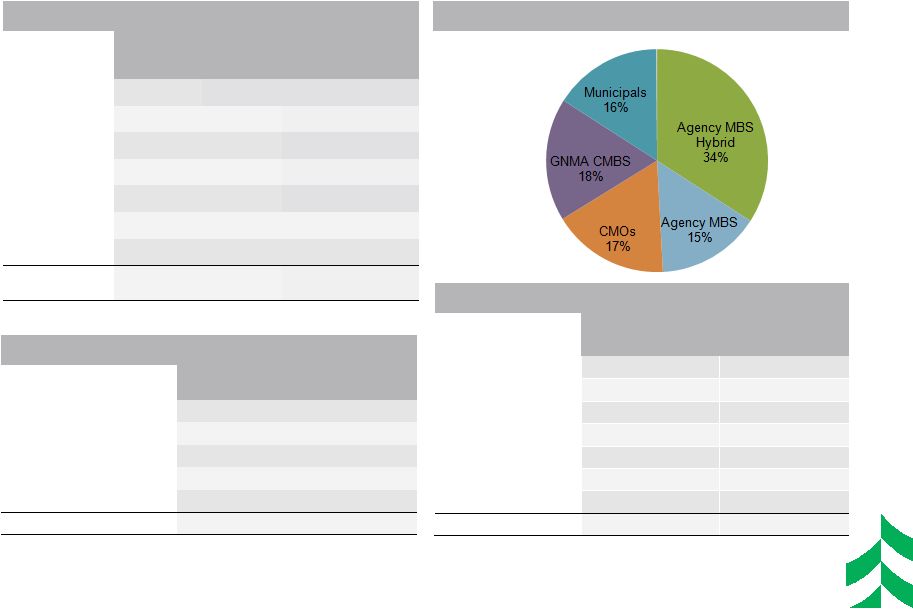 Amortized Cost Composition –
September 30, 2014
Investment Portfolio –
September 30, 2014
Credit Rating
($ in thousands)
Fair Value
(000’s)
% of Total
Govt & Agency
$4,722,638
83.5
AAA
105,712
1.9
AA
681,444
12.1
A
135,430
2.4
BAA1, BAA2 & BAA3
-
-
BA1 & Lower
1,889
0.0
Non-rated
6,190
0.1
TOTAL Market Value
$5,653,304
100.0%
Type
Amortized
Cost
(000’s)
Fair Value
(000’s)
TEY
(%)
Duration
(Yrs)
Govt & Agencies
$999
$996
0.67
2.36
Agency MBS
2,767,630
2,783,892
2.61
3.21
CMOs
960,063
959,630
2.36
2.96
GNMA CMBS
1,007,068
980,602
2.08
4.40
Municipals
890,196
922,318
5.07
4.88
Corporates
5,788
5,793
1.41
1.73
Other
18
73
TOTAL HTM &
AFS
$5,631,762
$5,653,304
2.86
3.64
INVESTMENT SECURITIES PORTFOLIO
Portfolio Ratings Composition –
September 30, 2014
Type
Fair Value
(000’s)
% of Total
0% RWA
$1,178,798
20.9
20% RWA
4,426,389
78.2
50% RWA
20,342
0.4
=>100% RWA
6,258
0.2
Not subject to RW
21,517
0.4
TOTAL Market Value
$5,653,304
100.0%
Risk Weighting Profile –
September 30, 2014
15
*
* |
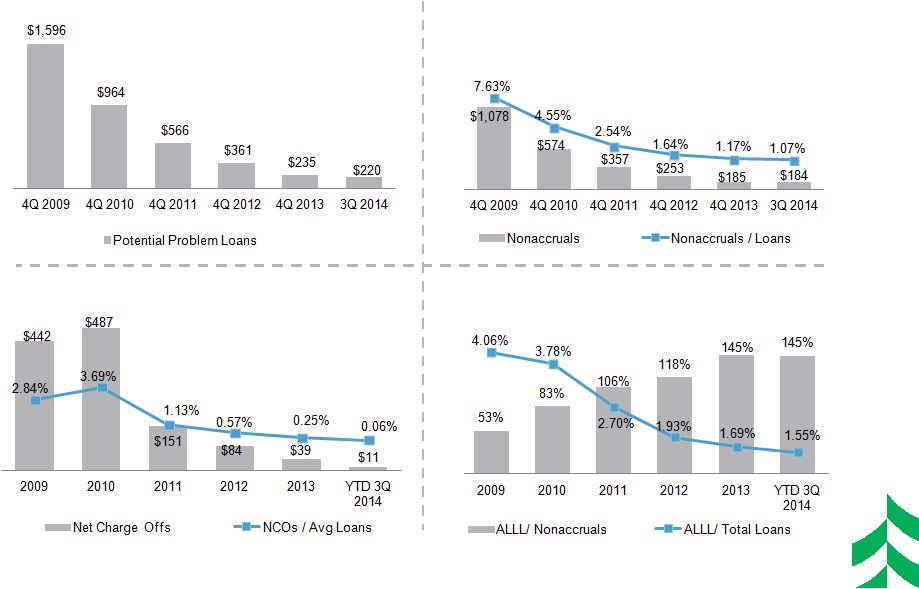 CREDIT QUALITY TRENDS
($ IN MILLIONS)
16
*
* |
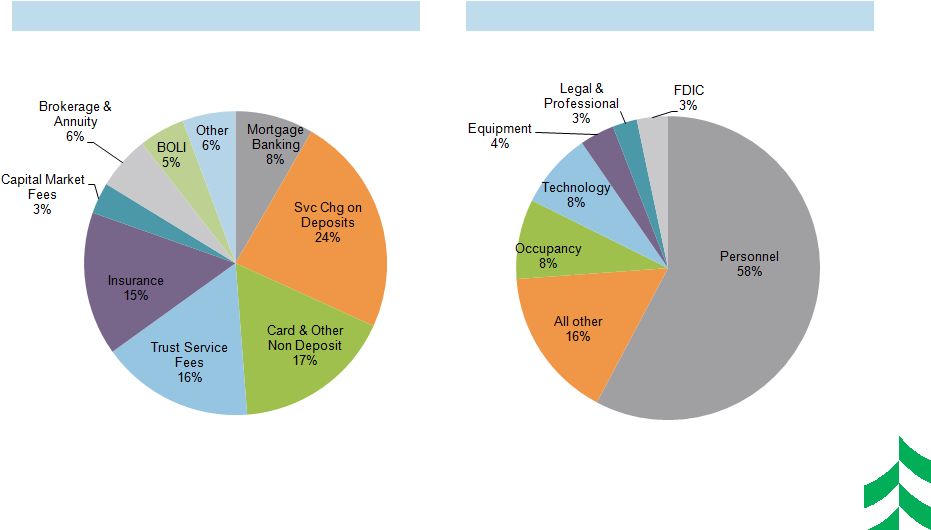 NONINTEREST INCOME AND EXPENSE
COMPOSITION
YTD SEPTEMBER 2014
Noninterest Income by Category
Noninterest Expense by Category
($221 million)
($507 million)
17
*
* |
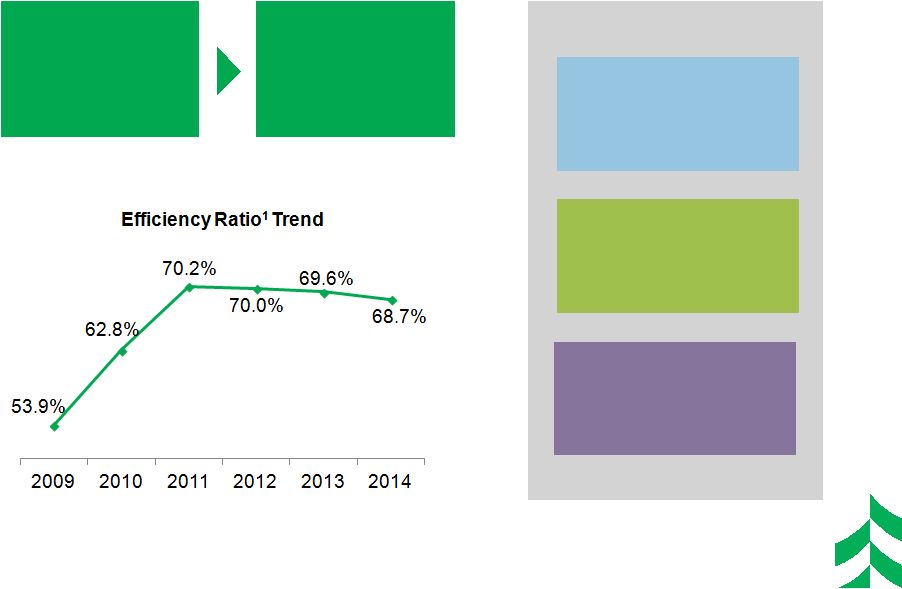 Areas of Focus
PURSUING EFFICIENCY GAINS
Efficiency Ratio¹
at 3Q 2014 =
69%
Goal =
Peer Average
or Better
1
–
Efficiency
ratio
=
Noninterest
expense,
excluding
other
intangible
amortization,
divided
by
sum
of
taxable equivalent net interest income plus noninterest income, excluding
investment securities gains/losses, net, and asset gains/losses, net.
This is a non-GAAP financial measure. Please refer to the appendix
for
a
reconciliation
of
this
measure.
Efficiency
Ratio
2014
is
YTD
Sept
2014.
Back Office Initiatives:
Implementing technology
solutions in labor intensive
processes
Real Estate Initiatives:
Actions to optimize our real
estate holdings and capacity
Distribution Initiatives:
Optimize the ways that we
interact with our customers
18
*
* |
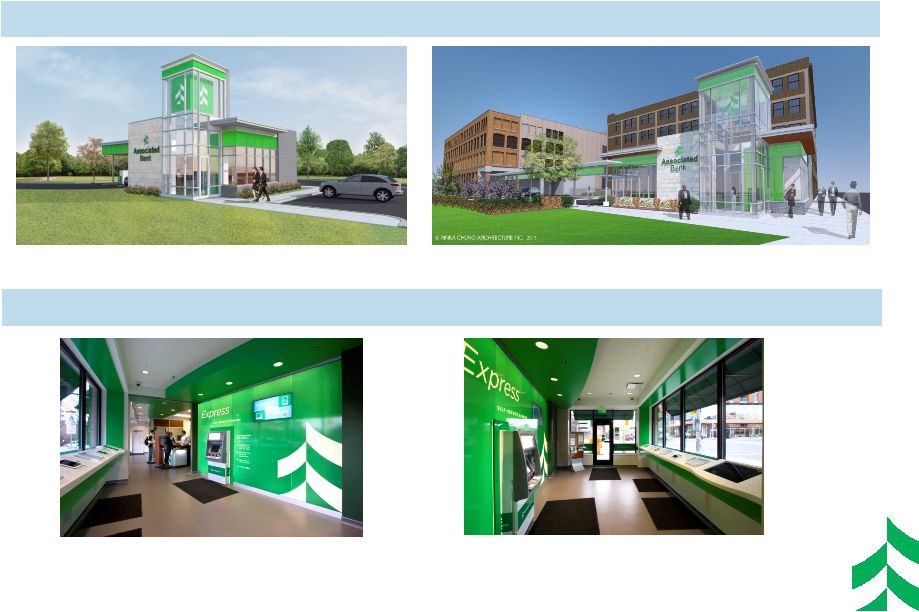 BRANCH EVOLUTION
•
Eagle River, Wisconsin
•
Milwaukee, Wisconsin
Branches coming in 2014: Lower construction costs, higher visibility profile
•
Madison, Wisconsin (UW Campus)
Express Branch: Demonstration Kiosk –
“Hands On”
& Automated Teller Machine
19
*
* |
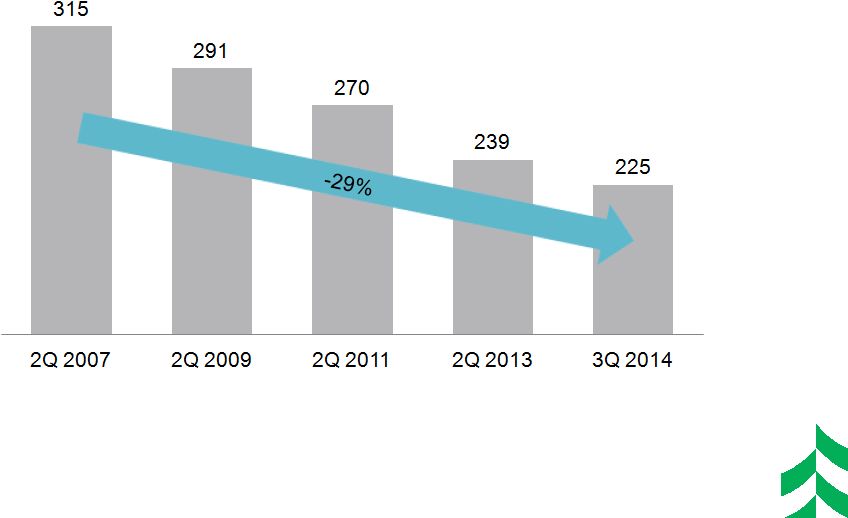 RATIONALIZING THE FOOTPRINT
Consolidated or sold 29% of branches since 2007
1
Branch counts are as of period end.
20
1
*
* |
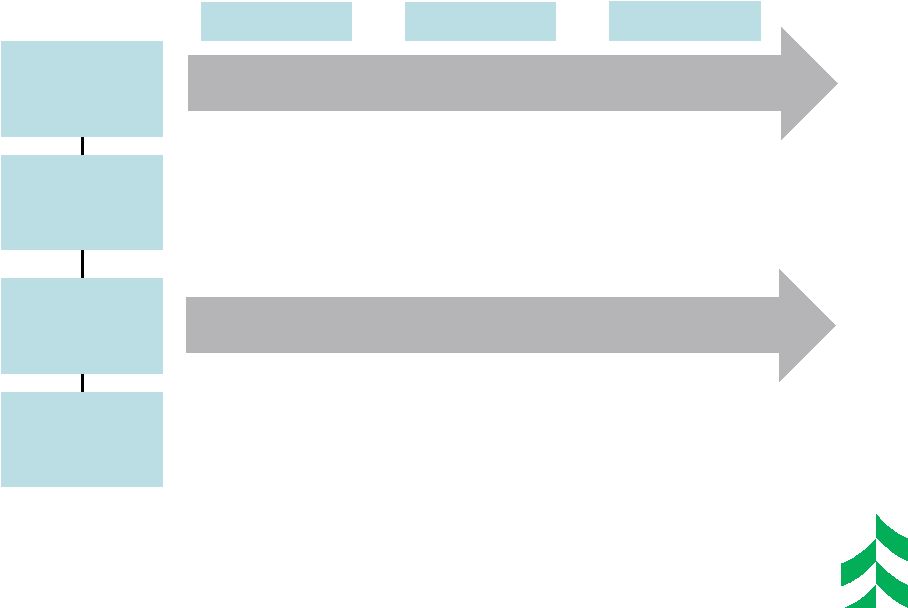 CAPITAL MANAGEMENT PRIORITIES
Funding
Organic Growth
Paying a
Competitive
Dividend
Non-organic
Growth
Opportunities
Share Buybacks
and
Redemptions
2012
2013
•
Fund Loan Growth and other Capital Investments
•
Repurchased $60
mm of Common
Stock
•
Redeemed $205
mm in Trust
Preferred
•
Repurchased
$120 mm of
Common Stock
•
Retired $26 mm
in Sub-Debt
•
Increased
quarterly dividend
in Q4 2012
•
Paid $0.23/
common share
•
Increased
quarterly dividend
in Q4 2013
•
Paid $0.33/
common share
•
Focused on Cost Take-out Driven Depository M&A
•
Maintaining Discipline in Pricing of any Transaction
2014
•
Repurchased $209
mm of Common Stock
through October 2014
•
Retired $155 mm in
Senior Notes in Q1
2014
•
Increased
quarterly dividend
in Q4 2014
•
Will pay $0.37/
common share
21
*
* |
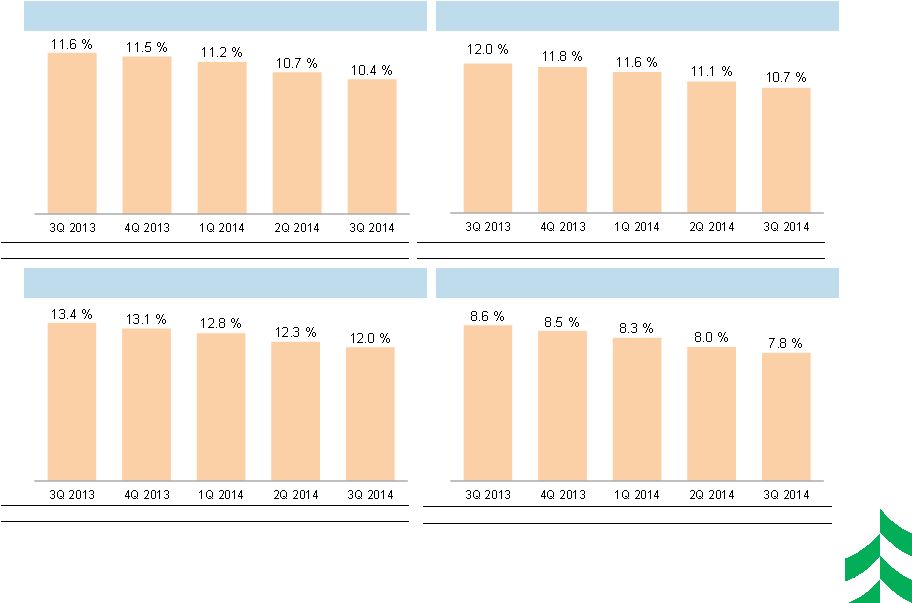 STRONG CAPITAL POSITION
($ IN MILLIONS)
Tier 1 Common
Tier 1 Risk Based Capital
Total Risk Based Capital
Tier 1 Leverage
($ mm)
$ 1,904
$ 1,913
$ 1,912
$ 1,920
$ 1,873
($ mm)
$ 1,966
$ 1,975
$ 1,974
$ 1,981
$ 1,935
($ mm)
$ 2,199
$ 2,185
$ 2,187
$ 2,205
$ 2,160
($ mm)
$ 1,966
$ 1,975
$ 1,974
$ 1,981
$ 1,935
22
*
* |
 RATINGS AGENGY PERSPECTIVE
Franchise turnaround reflected in improved ratings approaching pre-crisis
levels A1 / A+
Baa3 / BBB-
B2 / B
BBB+
A2
BB+
A2
BB-
Baa1
BBB
BBB
BBB
BBB
Baa1
Baa1
Baa1
Baa1
S&P
Moody’s¹
Source: S&P and Moody’s
¹
Provisional rating shown for Moody’s in 2008-2010
Associated Banc-Corp
Associated Bank NA
S&P
Moody’s
S&P
Moody’s
September 30, 2014
Senior unsecured
Subordinated debt
Outlook
BBB
BBB-
Stable
Baa1
Baa2
Stable
BBB+
NR
Stable
A3
NR
Stable
23
*
* |
 EXPERIENCED MANAGEMENT TEAM
24
Phil Flynn
CEO
Joined Associated
in 2009
•
30+ Years Banking Experience
•
Union Bank of California (Vice Chairman and Chief Operating Officer)
Oliver Bueschse
Chief Strategy Officer
Joined Associated
in 2010
•
10+ Years Banking Experience
•
Union Bank of California (Head of Strategy)
Christopher Del-Moral Niles
Chief Financial Officer
Joined Associated
in 2010
•
20+ Years Financial Services Experience
•
First American Trust Corporation (Corporate Treasurer)
•
Union Bank of California( Director of Liability Management)
Patrick Derpinghaus
Chief Audit Executive
Joined Associated
in 2011
•
30+ Years Banking Experience
•
US Bank (Audit Director), The Bankers Bank of Atlanta (Chief Financial
Officer) Judith Doctor
Chief Human Resources Officer
Joined Associated
in 1982
•
30+ Years Banking Experience
•
Associated Bank (Senior Management positions in Human Resources)
Randall Erickson
General Counsel and Corporate Secretary
Joined Associated
in 2012
•
30+ Years Leadership Experience
•
M&I
(
Chief
Administrative
Officer
and
General
Counsel),
Godfrey
&
Kahn
(Partner), McDermott, Will &
Emery
Breck Hanson
Head of Commercial Real Estate
Joined Associated
in 2010
•
35+ Years Banking Experience
•
Head of Real Estate for La Salle Bank
Arthur Heise
Chief Risk Officer
Joined Associated
in 2011
•
40+ Years of Leadership Experience
•
US Bank (Director of Enterprise Risk Services and Enterprise Security
Services) Scott Hickey
Chief Credit Officer
Joined Associated
in 2008
•
35+ Years Banking experience
•
US Bank (Chief Credit Officer)
Tim Lau
Head of Community Markets
Joined Associated
in 1989
•
25+ Years Banking Experience
•
Associated Bank (Senior Management positions in Retail Banking, Commercial Banking
and Private Client and Institutional Services)
Donna Smith
Head of Corporate Banking
Joined Associated
in 2011
•
30+ Years Banking Experience
•
LaSalle Bank ( Market Executive for Midwest)
David Stein
Head of Retail Banking
Joined Associated
in 2005
•
20+ Years Banking Experience
•
JPMorgan Chase / Bank One
John Utz
Head of Specialized Industries & Commercial Financial
Services
Joined Associated
in 2010
•
20+ Years Banking Experience
•
Union Bank of California (Head of Capital Markets)
James Yee
Chief Information and Operation Officer
Joined Associated
in 2010
•
35+ Years Operations and Technology Experience
•
Union Bank of California ( Chief Information Officer)
William Bohn
Head of PCIS and President of AFG
Joined Associated
in 1997
•
20+ Years Banking Experience
•
Firstar Trust Company ( Legal/Compliance Manager)
*
* |
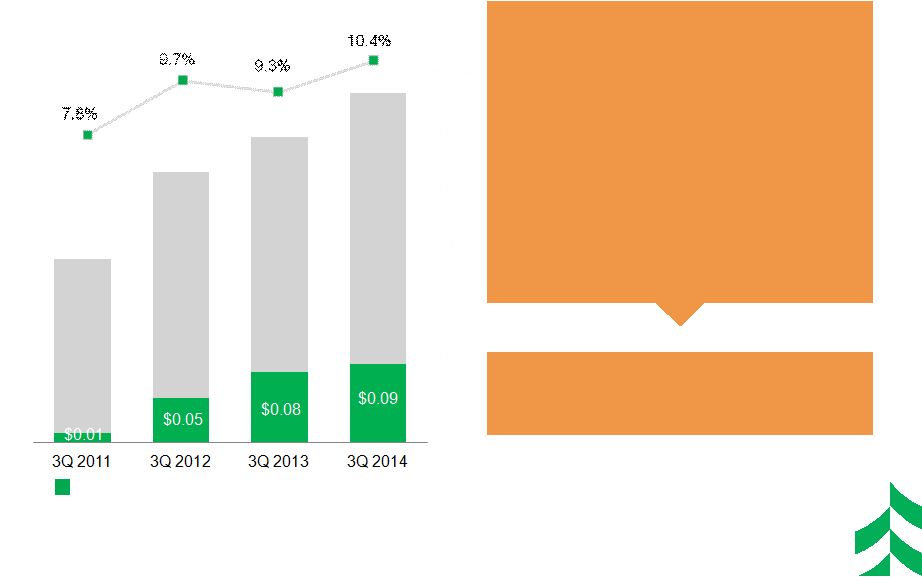 WHY
ASSOCIATED Reasons to Invest
1
–
Return
on
Tier
1
Common
Equity
(ROT1CE)
=
Management
uses
Tier
1
common
equity,
along
with
other
capital measures, to assess and monitor our capital position. This is a
non-GAAP financial measure. Please refer to the appendix for a
definition of this and other non-GAAP items. EPS and Dividends Paid &
ROT1CE Return on Tier 1
Common Equity
$0.20
$0.26
$0.27
$0.31
Diluted
Earnings
per
Common
Share
Dividends per Common Share
•
Leading Midwest Bank Operating in
Attractive Markets
•
Core Organic Growth Opportunity
•
Disciplined Loan and Deposit Pricing
•
Committed to Efficiency Ratio
Improvement
•
Strong Credit Quality and Capital Profile
•
Disciplined Capital Deployment
•
Improving Earnings Outlook
Management
Team
Focused
on
Creating
Long-Term Value
25
1
*
* |
 OUR
VISION ASSOCIATED
will
be
the
most
admired
Midwestern financial services company,
distinguished by sound, value-added financial
solutions with personal service for our customers,
built upon a strong commitment to our colleagues
and the communities we serve, resulting in
exceptional value for our shareholders.
26
*
* |
 APPENDIX
27
**************
**************
**************
**************
**************
**************
**************
**************
**************
**************
************** |
 RECONCILIATION AND DEFINITIONS OF
NON-GAAP ITEMS
3Q 2013
4Q 2013
1Q 2014
2Q 2014
3Q 2014
Efficiency Ratio Reconciliation:
Efficiency ratio (1)
71.45%
73.70%
70.41%
69.70%
69.44%
Taxable equivalent adjustment
(1.50)
(1.49)
(1.35)
(1.32)
(1.36)
Asset gains, net
0.59
0.80
0.22
0.26
1.36
Other intangible amortization
(0.44)
(0.42)
(0.42)
(0.41)
(0.40)
Efficiency ratio, fully taxable equivalent (1)
70.10%
72.59%
68.86%
68.23%
69.04%
2009
2010
2011
2012
2013
YTD 3Q 2014
Efficiency Ratio Reconciliation:
Efficiency ratio (1)
56.65%
65.68%
73.33%
72.92%
71.05%
69.85%
Taxable equivalent adjustment
(1.30)
(1.60)
(1.72)
(1.60)
(1.46)
(1.34)
Asset gains (losses), net
(0.93)
(0.79)
(0.95)
(0.90)
0.40
0.61
Other intangible amortization
(0.50)
(0.50)
(0.51)
(0.43)
(0.42)
(0.41)
Efficiency ratio, fully taxable equivalent (1)
53.92%
62.79%
70.15%
69.99%
69.57%
68.71%
28
*
*
(1)
Efficiency
ratio
is
defined
by
the
Federal
Reserve
guidance
as
noninterest
expense
divided
by
the
sum
of
net
interest
income
plus
noninterest
income, excluding investment securities gains / losses, net. Efficiency
ratio, fully taxable equivalent, is noninterest expense, excluding other
intangible amortization, divided by the sum of taxable equivalent net interest
income plus noninterest income, excluding investment securities gains /
losses, net and asset gains / losses, net. This efficiency ratio is presented on a taxable equivalent basis, which adjusts net interest income
for the tax-favored status of certain loans and investment securities.
Management believes this measure to be the preferred industry measurement of
net interest income as it enhances the comparability of net interest income arising from taxable and tax-exempt sources and it
excludes certain specific revenue items (such as investment securities gains /
losses, net and asset gains / losses, net). Tier
1
common
equity,
a
non-GAAP
financial
measure,
is
used
by
banking
regulators,
investors
and
analysts
to
assess
and
compare
the quality
and composition of our capital with the capital of other financial services
companies. Management uses Tier 1 common equity, along with other capital
measures, to assess and monitor our capital position. Tier 1 common equity (period end and average) is Tier 1 capital excluding
qualifying perpetual preferred stock and qualifying trust preferred
securities. |
 YTD
3Q 2014 HIGHLIGHTS AND OUTLOOK •
Loan Growth of ~ $1.4 bn YoY
•
Deposit Growth of ~ $300 mm YoY
–
Total average deposits of
$17.9 bn, up 2% YoY
•
3Q net interest income up $12 mm
or 8% YoY
•
Disciplined Expense Management
–
FTEs down 7% from 3Q13
•
Consistent Capital Deployment
–
Repurchased $159 mm of
common stock Sept YTD
2014 Highlights:
Outlook –
Growing the
Franchise & Creating Long-
Term Shareholder Value
•
Continued focus on organic
growth
•
Defending NIM compression in
low-rate environment
•
Strong focus on efficiency &
expense management
•
Disciplined focus on deploying
capital to drive long-term
shareholder value
29
Repurchased
$50
million
of common stock in
October 2014
Total
average
loans
of
$17.1
bn,
up
9%
YoY
*
* |
 SEGMENT PROFITABILITY
YTD SEPTEMBER 2014
Community and
Consumer Banking
Earning Assets* = $8.0 bn
Total Revenue = $407.2 mm
Net Income = $23.0 mm
ROT1CE: 5.4%
Risk Management &
Shared Services
Earning Assets* = $5.9 bn
Total Revenue = $76.8 mm
Net Income = $49.8 mm
ROT1CE: 10.5%
Corporate and
Commercial Banking
Earning Assets* = $8.6 bn
Total Revenue = $242.9 mm
Net Income = $69.0 mm
ROT1CE: 12.5%
ASBC –
Consolidated Total
Earning Assets* = $22.5 bn
Total Revenue = $727.0 mm
Net Income = $141.8 mm
ROT1CE: 9.8%
* Average Earning Assets
30
*
* |
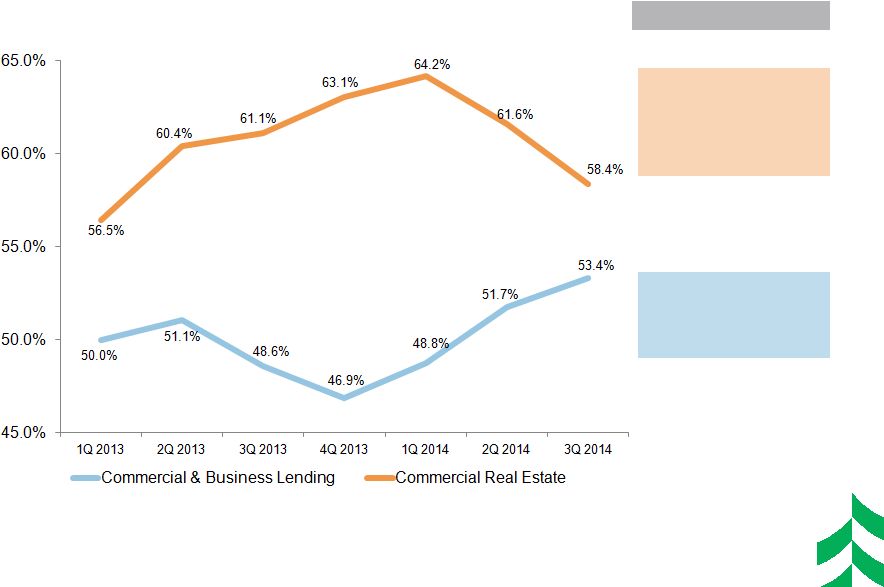 COMMERCIAL LINE UTILIZATION TRENDS
Line utilization increased in Commercial & Business Lending
Change from 2Q 14
Commercial Real
Estate (including
construction)
-
320 bps
Commercial &
Business Lending
+ 170 bps
31
*
* |
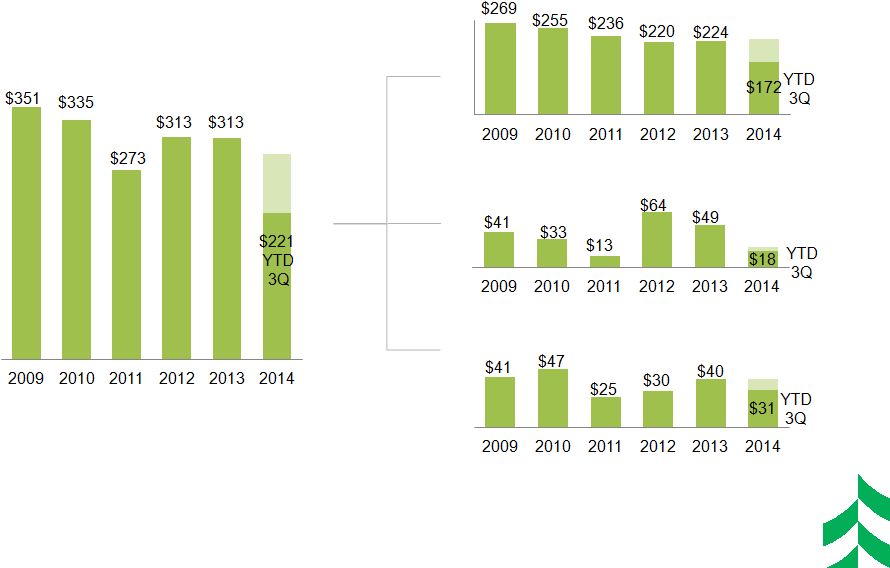 NONINTEREST INCOME TRENDS
($ IN MILLIONS)
Core Fee-based Revenue
Mortgage Banking (net) Income
Total Noninterest Income
1
–
Core
Fee-based
Revenue
=
Trust
service
fees
plus
Service
charges
on
deposit
accounts
plus
Card-based
and
other
nondeposit
fees
plus
Insurance
commissions
plus
Brokerage
and
annuity
commissions.
This
is
a
non-GAAP
measure.
Please
refer
to
the
press
release
tables
for
a
reconciliation
to
noninterest
income.
2
–
Other
Noninterest
Income
=
Total
Noninterest
Income
minus
Core
Fee-based
Revenue.
This
is
a
non-GAAP
measure.
Please
refer
to
the
press
release
tables
for
a
reconciliation
to
noninterest
income.
Other Noninterest Income
32
1
2
*
* |
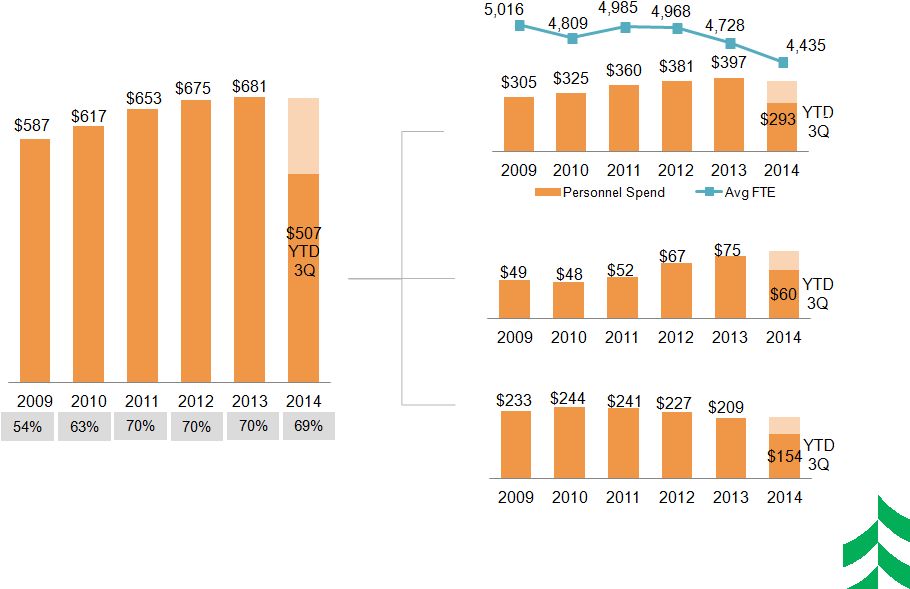 NONINTEREST EXPENSE TRENDS
($ IN MILLIONS)
Technology
Spend
Total Noninterest Expense
Other Non-Personnel Spend
Personnel Spend / FTE
Trend
1
–
Efficiency
ratio
=
Noninterest
expense,
excluding
other
intangible
amortization,
divided
by
sum
of
taxable
equivalent
net
interest
income
plus
noninterest
income,
excluding
investment
securities
gains/losses,
net,
and
asset
gains/losses,
net.
This
is
a
non-GAAP
financial
measure.
Please
refer
to
the
appendix
for
a
reconciliation
of
this
measure.
2
–
FTE
= Average Full Time Equivalent Employees
3
–
Technology
Spend
=
Technology
and
Equipment
expenses
4
–
Other
Non-Personnel
Spend
=
Total
Noninterest
Expense
less
Personnel
and
Technology
spend
Efficiency Ratio
33
1
4
3
2
*
* |
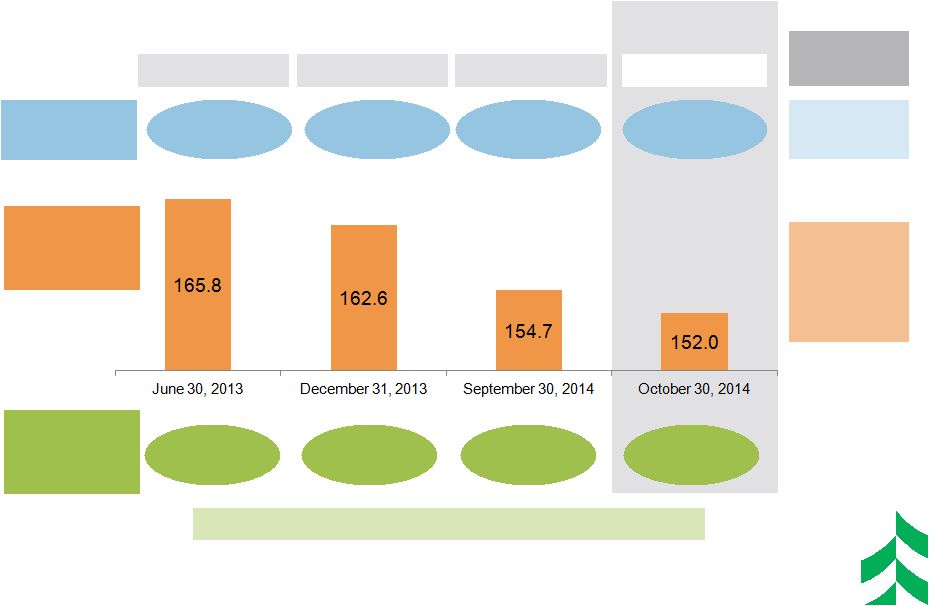 DISCIPLINED CAPITAL DEPLOYMENT
Jan –Jun 2013
Jul –Dec 2013
Jan –Sep 2014
Oct 2014
$60 mm
$60 mm
$159 mm
$50 mm
11.49%
11.46%
10.39%
9.93%
1
Estimated pro forma calculation; Basel I ratio calculation;
Shares repurchased
since end of 2012. Shares Outstanding on 12/31/2012 were 169.3 million.
•
ASBC
Basel
III
Tier
1
Common
Ratio
Goal
=
8
–
9.5%
$329 mm
Repurchased
19.4 mm
Shares
Repurchased
2013-2014
YTD Totals
$ Repurchased
Shares
Outstanding,
end of period
(in Millions)
Tier 1 Common
Ratio
34
2
3
1
2
3
Recent
Transactions
*
* |