Attached files
UNITED STATES
SECURITIES AND EXCHANGE COMMISSION
WASHINGTON, D.C. 20549
FORM 10-K
(Mark One)
| ☒ | ANNUAL REPORT PURSUANT TO SECTION 13 OR 15(d) OF THE SECURITIES EXCHANGE ACT OF 1934 |
For the fiscal year ended June 30, 2014
| ☐ | TRANSITION REPORT PURSUANT TO SECTION 13 OR 15(d) OF THE SECURITIES EXCHANGE ACT OF 1934 |
For the transition period from ______________to ______________
Commission File Number 000-54444
RED MOUNTAIN RESOURCES, INC.
(Exact Name of Registrant as Specified in Its Charter)
| Texas | 27-1739487 |
| (State or Other Jurisdiction of Incorporation or Organization) |
(I.R.S. Employer Identification Number) |
|
2515 McKinney Avenue, Suite 900 Dallas, TX |
75201 |
| (Address of Principal Executive Offices) | (Zip Code) |
(214) 871-0400
(Registrant’s Telephone Number, Including Area Code)
Securities registered pursuant to Section 12(b) of the Act: None
Securities registered pursuant to Section 12(g) of the Act:
Common Stock, par value $0.00001 per share
10.0% Series A Cumulative Redeemable Preferred Stock, par value $0.0001 per share
Warrants to purchase common stock
Indicate by check mark if the registrant is a well-known seasoned issuer, as defined in Rule 405 of the Securities Act. Yes ☐ No ☒
Indicate by check mark if the registrant is not required to file reports pursuant to Section 13 or 15(d) of the Exchange Act. Yes ☐ No ☒
Indicate by check mark whether the registrant (1) has filed all reports required to be filed by Section 13 or 15(d) of the Securities Exchange Act of 1934 during the preceding 12 months (or for such shorter period that the registrant was required to file such reports), and (2) has been subject to such filing requirements for the past 90 days. Yes ☒ No ☐
Indicate by check mark whether the registrant has submitted electronically and posted on its corporate Website, if any, every Interactive Data File required to be submitted and posted pursuant to Rule 405 of Regulation S-T (§ 232.405 of this chapter) during the preceding 12 months (or for such shorter period that the registrant was required to submit and post such files). Yes ☒ No ☐
Indicate by check mark if disclosure of delinquent filers pursuant to Item 405 of Regulation S-K (§ 229.405 of this chapter) is not contained herein, and will not be contained, to the best of registrant’s knowledge, in definitive proxy or information statements incorporated by reference in Part III of this Form 10-K or any amendment to this Form 10-K. ☐
Indicate by check mark whether the registrant is a large accelerated filer, an accelerated filer, a non-accelerated filer, or a smaller reporting company. See the definitions of “large accelerated filer,” “accelerated filer” and “smaller reporting company” in Rule 12b-2 of the Exchange Act.
| Large accelerated filer ☐ | Accelerated filer ☒ | |
| Non-accelerated filer ☐ (Do not check if a smaller reporting company) | Smaller reporting company ☐ |
Indicate by check mark whether the registrant is a shell company (as defined in Rule 12b-2 of the Act). Yes ☐ No ☒
As of December 31, 2013 (the last business day of the registrant’s most recently completed second fiscal quarter), the aggregate market value of the registrant’s common stock (based on a reported closing market price of $5.40 per share on the OTCQB) held by non-affiliates of the registrant was approximately $57.9 million. For purposes of this computation, all officers, directors and 10% beneficial owners of the registrant are deemed to be affiliates. Such determination should not be deemed to be an admission that such officers, directors or 10% beneficial owners are, in fact, affiliates of the registrant.
As of September 22, 2014, there were 14,857,488 shares of common stock, $0.00001 par value per share, outstanding.
DOCUMENTS INCORPORATED BY REFERENCE
Portions of the registrant’s proxy statement to be furnished to shareholders in connection with its 2014 Annual Meeting of Stockholders are incorporated by reference in Part III, Items 10-14 of this Annual Report on Form 10-K.
RED MOUNTAIN RESOURCES, INC.
FORM 10-K
TABLE OF CONTENTS
| i |
Forward-Looking Statements
This Annual Report on Form 10-K contains forward-looking statements within the meaning of Section 27A of the Securities Act of 1933, as amended, and Section 21E of the Securities Exchange Act of 1934, as amended (the “Exchange Act”). Statements that are not historical facts, including statements about our beliefs and expectations, are forward-looking statements. Forward-looking statements include statements preceded by, followed by or that include the words “may,” “could,” “would,” “should,” “believe,” “expect,” “anticipate,” “plan,” “estimate,” “target,” “project,” “intend,” “understand,” or similar expressions and the negative of such words and expressions, although not all forward-looking statements contain such words or expressions.
Forward-looking statements are only predictions and are not guarantees of performance. These statements generally relate to our plans, objectives and expectations for future operations and are based on management’s current beliefs and assumptions, which in turn are based on its experience and its perception of historical trends, current conditions and expected future developments as well as other factors it believes are appropriate under the circumstances. Although we believe that the plans, objectives and expectations reflected in or suggested by the forward-looking statements are reasonable, there can be no assurance that actual results will not differ materially from those expressed or implied in such forward-looking statements. Forward-looking statements also involve risks and uncertainties. Many of these risks and uncertainties are beyond our ability to control or predict and could cause results to differ materially from the results discussed in such forward-looking statements. Such risks and uncertainties include, but are not limited to, the following:
| ● | our ability to generate sufficient cash flow from operations, borrowings or other sources to enable us to fully develop and produce our oil and natural gas properties; |
| ● | declines or volatility in the prices we receive for our oil and natural gas; |
| ● | general economic conditions, whether internationally, nationally or in the regional and local market areas in which we do business; |
| ● | risks associated with drilling, including completion risks, cost overruns and the drilling of non-economic wells or dry holes; |
| ● | uncertainties associated with estimates of proved oil and natural gas reserves; |
| ● | the presence or recoverability of estimated oil and natural gas reserves and the actual future production rates and associated costs; |
| ● | risks and liabilities associated with acquired companies and properties; |
| ● | risks related to integration of acquired companies and properties; |
| ● | potential defects in title to our properties; |
| ● | cost and availability of drilling rigs, equipment, supplies, personnel and oilfield services; |
| ● | geological concentration of our reserves; |
| ● | environmental or other governmental regulations, including legislation of hydraulic fracture stimulation; |
| ● | our ability to secure firm transportation for oil and natural gas we produce and to sell the oil and natural gas at market prices; |
| ● | exploration and development risks; |
| 1 |
| ● | management’s ability to execute our plans to meet our goals; |
| ● | our ability to retain key members of our management team; |
| ● | weather conditions; |
| ● | actions or inactions of third-party operators of our properties; |
| ● | costs and liabilities associated with environmental, health and safety laws; |
| ● | our ability to find and retain highly skilled personnel; |
| ● | operating hazards attendant to the oil and natural gas business; |
| ● | competition in the oil and natural gas industry; and |
| ● | the other factors discussed under Item 1A. “Risk Factors” in this report. |
Forward-looking statements speak only as of the date hereof. All such forward-looking statements and any subsequent written and oral forward-looking statements attributable to us or any person acting on our behalf are expressly qualified in their entirety by the cautionary statements contained or referred to in this section and any other cautionary statements that may accompany such forward-looking statements. Except as otherwise required by applicable law, we disclaim any duty to update any forward-looking statements.
| 2 |
Glossary of Oil and Natural Gas Terms
The following are abbreviations and definitions of terms commonly used in the oil and natural gas industry and this Annual Report on Form 10-K.
“Bbl” One stock tank barrel or 42 U.S. gallons liquid volume of oil or other liquid hydrocarbons.
“Boe” One barrel of oil equivalent, determined using the ratio of six Mcf of natural gas to one Bbl of oil and 42 gallons of NGLs to one Bbl of oil.
“Boe/d” Boe per day.
“Btu” A British thermal unit is a measurement of the heat generating capacity of natural gas. One Btu is the heat required to raise the temperature of a one-pound mass of pure liquid water one degree Fahrenheit at the temperature at which water has its greatest density (39 degrees Fahrenheit).
“completion” The process of treating a drilled well followed by the installation of permanent equipment for the production of oil or natural gas, or in the case of a dry well, the reporting of abandonment to the appropriate agency.
“condensate” A mixture of hydrocarbons that exists in the gaseous phase at original reservoir temperature and pressure, but that, when produced, is in the liquid phase at surface pressure and temperature.
“developed acreage” The number of acres that are allocated or assignable to productive wells or wells capable of production.
“development costs” Costs incurred to obtain access to proved reserves and to provide facilities for extracting, treating, gathering and storing the oil and natural gas. More specifically, development costs, including depreciation and applicable operating costs of support equipment and facilities and other costs of development activities, are costs incurred to:
| ● | gain access to and prepare well locations for drilling, including surveying well locations for the purpose of determining specific development drilling sites, clearing ground, draining, road building, and relocating public roads, natural gas lines, and power lines, to the extent necessary in developing the proved reserves; |
| ● | drill and equip development wells, development-type stratigraphic test wells, and service wells, including the costs of platforms and of well equipment such as casing, tubing, pumping equipment, and the wellhead assembly; |
| ● | acquire, construct, and install production facilities such as lease flow lines, separators, treaters, heaters, manifolds, measuring devices, and production storage tanks, natural gas cycling and processing plants, and central utility and waste disposal systems; and |
| ● | provide improved recovery systems. |
“development well” A well drilled within the proved area of an oil or natural gas reservoir to the depth of a stratigraphic horizon known to be productive.
“dry well” A well found to be incapable of producing hydrocarbons in sufficient quantities such that proceeds from the sale of such production exceed production expenses and taxes.
“exploration costs” Costs incurred in identifying areas that may warrant examination and in examining specific areas that are considered to have prospects of containing oil and natural gas reserves, including costs of drilling exploratory wells and exploratory-type stratigraphic test wells.
| 3 |
“exploratory well” A well drilled for the purpose of discovering new reserves in unproven areas.
“field” An area consisting of a single reservoir or multiple reservoirs all grouped on, or related to, the same individual geological structural feature or stratigraphic condition. The field name refers to the surface area, although it may refer to both the surface and the underground productive formations.
“formation” A layer of rock which has distinct characteristics that differ from nearby rock.
“gross acres” The total acres in which a working interest is owned.
“Henry Hub” The pricing point for natural gas futures contracts traded on the NYMEX.
“horizontal well” A well that is drilled vertically to a certain depth and then drilled at a right angle within a specific interval.
“hydraulic fracturing” or “fracing” A process involving the injection of fluids, usually consisting mostly of water, but typically including small amounts of sand and other chemicals, in order to create fractures extending from the wellbore through the rock formation to enable oil or natural gas to move more easily through the rock pores to a production well.
“lease operating expenses” The expenses, usually recurring, which pay for operating the wells and equipment on a producing lease.
“MBbl” One thousand barrels of oil or other liquid hydrocarbons.
“MBoe” One thousand barrels of oil equivalent.
“Mcf” One thousand cubic feet of natural gas.
“Mcf/d” One thousand cubic feet of natural gas per day.
“MMBoe” One million barrels of oil equivalent.
“MMBtu” One million British thermal units.
“MMcf” One million cubic feet of natural gas.
“natural gas” Natural gas and NGLs.
“net acres” The sum of the fractional working interests owned in gross acres.
“net revenue interest” An owner’s interest in the revenues of a well after deducting proceeds allocated to royalty and overriding interests.
“NGL” Natural gas liquid.
“NYMEX” The New York Mercantile Exchange.
“oil” Oil and condensate.
“overriding royalty interest” An interest in an oil and/or natural gas property entitling the owner to a share of oil and natural gas production free of costs of production.
“PDP” Proved developed producing reserves.
| 4 |
“PDNP” Proved developed non-producing reserves.
“play” A term applied to a portion of the exploration and production cycle following the identification by geologists and geophysicists of areas with potential natural gas and oil reserves.
“plugging and abandonment” Refers to the sealing off of fluids in the strata penetrated by a well so that the fluids from one stratum will not escape into another or to the surface. Regulations of many states require plugging of abandoned wells.
“producing well” A well found to be capable of producing either oil or natural gas in sufficient quantities to justify completion as an oil or natural gas well.
“production costs” Costs incurred to operate and maintain wells and related equipment and facilities, including depreciation and applicable operating costs of support equipment and facilities and other costs of operating and maintaining those wells and related equipment and facilities. They become part of the cost of oil and natural gas produced. Examples of production costs (sometimes called lifting costs) are:
| ● | costs of labor to operate the wells and related equipment and facilities; |
| ● | repairs and maintenance; |
| ● | materials, supplies, and fuel consumed and supplies utilized in operating the wells and related equipment and facilities; |
| ● | property taxes and insurance applicable to proved properties and wells and related equipment and facilities; and |
| ● | severance taxes. |
“productive well” A well that is found to be capable of producing hydrocarbons in sufficient quantities such that proceeds from the sale of the production exceed production expenses and taxes.
“proved developed reserves” Reserves that can be expected to be recovered through existing wells with existing equipment and operating methods.
“proved properties” Properties with proved reserves.
“proved reserves” Those quantities of oil and natural gas, which, by analysis of geoscience and engineering data, can be estimated with reasonable certainty to be economically producible—from a given date forward, from known reservoirs, and under existing economic conditions, operating methods, and government regulations—prior to the time at which contracts providing the right to operate expire, unless evidence indicates that renewal is reasonably certain, regardless of whether deterministic or probabilistic methods are used for the estimation. The project to extract the hydrocarbons must have commenced or the operator must be reasonably certain that it will commence the project within a reasonable time. The area of the reservoir considered as proved includes (i) the area identified by drilling and limited by fluid contacts, if any, and (ii) adjacent undrilled portions of the reservoir that can, with reasonable certainty, be judged to be continuous with it and to contain economically producible oil or natural gas on the basis of available geoscience and engineering data. In the absence of data on fluid contacts, proved quantities in a reservoir are limited by the lowest known hydrocarbons, or LKH, as seen in a well penetration unless geoscience, engineering, or performance data and reliable technology establishes a lower contact with reasonable certainty. Where direct observation from well penetrations has defined a highest known oil, or HKO, elevation and the potential exists for an associated gas cap, proved oil reserves may be assigned in the structurally higher portions of the reservoir only if geoscience, engineering, or performance data and reliable technology establish the higher contact with reasonable certainty. Reserves which can be produced economically through application of improved recovery techniques (including, but not limited to, fluid injection) are included in the proved classification when (i) successful testing by a pilot project in an area of the reservoir with properties no more favorable than in the reservoir as a whole, the operation of an installed program in the reservoir or an analogous reservoir, or other evidence using reliable technology establishes the reasonable certainty of the engineering analysis on which the project or program was based, and (ii) the project has been approved for development by all necessary parties and entities, including governmental entities. Existing economic conditions include prices and costs at which economic producibility from a reservoir is to be determined. The price shall be the average price during the 12-month period prior to the ending date of the period covered by the report, determined as an unweighted arithmetic average of the first-day-of-the-month price for each month within such period, unless prices are defined by contractual arrangements, excluding escalations based upon future conditions.
| 5 |
“proved undeveloped reserves” Reserves that are expected to be recovered from new wells on undrilled acreage or from existing wells where a relatively major expenditure is required.
“PUD” Proved undeveloped reserves.
“PV-10” When used with respect to oil and natural gas reserves, PV-10 means the estimated future gross revenue to be generated from the production of proved reserves, net of estimated production and future development and abandonment costs, using prices and costs in effect at the determination date, before income taxes, and without giving effect to non-property-related expenses, discounted to a present value using an annual discount rate of 10% in accordance with the guidelines of the SEC.
“reasonable certainty” If deterministic methods are used, reasonable certainty means a high degree of confidence that the quantities will be recovered. If probabilistic methods are used, there should be at least a 90% probability that the quantities actually recovered will equal or exceed the estimate. A high degree of confidence exists if the quantity is much more likely to be achieved than not, and, as changes due to increased availability of geoscience (geological, geophysical, and geochemical), engineering, and economic data are made to estimated ultimate recovery, or EUR, with time, reasonably certain EUR is much more likely to increase or remain constant than to decrease.
“recompletion” The process of re-entering an existing wellbore that is either producing or not producing and completing new reservoirs in an attempt to establish or increase existing production.
“reserves” Estimated remaining quantities of oil and natural gas and related substances anticipated to be economically producible as of a given date by application of development prospects to known accumulations. In addition, there must exist, or there must be a reasonable expectation that there will exist, the legal right to produce or a revenue interest in the production, installed means of delivering oil and natural gas or related substances to market, and all permits and financing required to implement the project.
“reservoir” A porous and permeable underground formation containing a natural accumulation of producible natural gas and/or oil that is confined by impermeable rock or water barriers and is separate from other reservoirs.
“sand” A geological term for a formation beneath the surface of the Earth from which hydrocarbons are produced. Its make-up is sufficiently homogenous to differentiate it from other formations.
“shale” Fine-grained sedimentary rock composed mostly of consolidated clay or mud. Shale is the most frequently occurring sedimentary rock.
“spacing” The distance between wells producing from the same reservoir. Spacing is often expressed in terms of acres, e.g., 40-acre spacing, and is often established by regulatory agencies.
“standardized measure” The present value of estimated future cash inflows from proved oil and natural gas reserves, less future development, abandonment, production and income tax expenses, discounted at 10% per annum to reflect the timing of future cash flows and using the same pricing assumptions as were used to calculate PV-10. Standardized measure differs from PV-10 because standardized measure includes the effect of future income taxes.
| 6 |
“stratigraphic test well” A drilling effort, geologically directed, to obtain information pertaining to a specific geologic condition. Such wells customarily are drilled without the intention of being completed for hydrocarbon production.
“undeveloped acreage” Lease acreage on which wells have not been drilled or completed to a point that would permit the production of commercial quantities of oil and natural gas regardless of whether such acreage contains proved reserves.
“vertical well” An oil or natural gas wellbore that is drilled from the surface to the depth of interest without directional deviation.
“wellbore” The hole drilled by the bit that is equipped for oil or natural gas production on a completed well. Also called well or borehole.
“working interest” The right granted to the lessee of a property to explore for and to produce and own oil, natural gas, or other minerals. The working interest owners bear the exploitation, development, and operating costs on either a cash, penalty, or carried basis.
| 7 |
Unless the context otherwise requires, all references to “Red Mountain,” the “Company,” “we,” “our” and “us” refer to (i) Red Mountain Resources, Inc., a Texas corporation (“Red Mountain”), (ii) Red Mountain’s wholly owned subsidiaries, including Black Rock Capital, Inc. (“Black Rock”) and RMR Operating, LLC (“RMR Operating”), and (iii) subsequent to January 28, 2013, Cross Border Resources, Inc. (“Cross Border”). As of June 30, 2014, we owned 83% of the outstanding common stock of Cross Border. Acreage, reserves and production information presented subsequent to January 28, 2013 includes acreage, reserves and production represented by the 17% of Cross Border’s common stock not owned by us.
Our Company
We are a Dallas-based growth-oriented energy company engaged in the acquisition, development and exploration of oil and natural gas properties in established basins with demonstrable prolific producing zones. Currently, we have established acreage positions and production in the Permian Basin of West Texas and Southeast New Mexico and the onshore Gulf Coast of Texas. Additionally, we have an established and growing acreage position in Kansas.
We plan to grow production and reserves by acquiring, exploring and developing an inventory of long-life, low risk drilling opportunities with attractive rates of return. Our focus is on opportunities in and around producing oil and natural gas properties where we can enhance production and reserves through application of newer drilling and completion techniques, infill drilling targeting untapped but known productive hydrocarbon strata, and enhanced oil recovery applications.
As of June 30, 2014, we owned interests in 887,501 gross (310,392 net) mineral and lease acres in New Mexico, Texas and Kansas, of which 336,331 gross (30,926 net) acres are within the Permian Basin. We have successfully leased 9,868 net acres in Kansas located on the Central Kansas Uplift, and we also owned interests in over 1,405 net acres located on the Villarreal, Frost Bank, Resendez, Peal Ranch and La Duquesa Prospects in the onshore Gulf Coast of Texas.
On January 28, 2013, we closed the acquisition of 5,091,210 shares of common stock of Cross Border, bringing our total ownership to approximately 78% of the outstanding Cross Border common stock. Prior to the consolidation, we owned 47% of Cross Border’s outstanding common stock, and the investment was accounted for under the equity method of accounting. Subsequent to this transaction, we account for Cross Border as a consolidated subsidiary. As of June 30, 2014, we owned of record 14,327,767 shares of Cross Border common stock, representing 83% of Cross Border’s outstanding common stock.
History
Red Mountain, a Texas corporation, was formed on January 23, 2014. On January 31, 2014, we changed our state of incorporation from the State of Florida to the State of Texas by merging Red Mountain Resources, Inc., a Florida corporation (“RMR FL”), with and into Red Mountain Resources, Inc., a Texas corporation. RMR FL was originally formed in January 2010 as Teaching Time, Inc. in order to design, develop, and market instructional products and services for the corporate, education, government, and healthcare e-learning industries. In March 2011, Teaching Time, Inc. determined to enter into oil and natural gas exploration, development and production and changed its name to Red Mountain Resources, Inc. to better reflect that plan. On March 22, 2011, we entered into a Plan of Reorganization and Share Exchange Agreement, as amended on June 17, 2011 and June 20, 2011 (the “Share Exchange Agreement”), with Black Rock Capital, LLC, an entity wholly-owned by The StoneStreet Group, Inc. (“StoneStreet”). Alan W. Barksdale, our current president, chief executive officer and chairman of the board, was the president and the sole member of Black Rock Capital, LLC and sole owner and the president of StoneStreet. On June 22, 2011, we completed a reverse merger pursuant to the Share Exchange Agreement in which we issued 2,700,000 shares of common stock to StoneStreet in exchange for 100% of the interests in Black Rock Capital, LLC. Concurrently with the closing, we retired 22,500,000 shares of common stock for no additional consideration. In connection with the reverse merger, the management of Black Rock Capital, LLC became our management.
| 8 |
While we were the legal acquirer in the reverse merger, Black Rock Capital, LLC was treated as the accounting acquirer and the transaction was treated as a recapitalization. As a result, at the closing, the historical financial statements of Black Rock became those of the Company. The description of our business presented below is that of our current business and all discussions of periods prior to the reverse merger describe the business of Black Rock.
Black Rock was originally formed on October 28, 2005 as an Arkansas limited liability company under the name “Black Rock Capital, LLC.” From inception through May 2010, Black Rock had no operations. Effective June 1, 2010, Black Rock purchased two separate oil and natural gas fields out of the bankruptcy estate of MSB Energy, Inc. located in Zapata County and Duval County in the onshore Gulf Coast of Texas. Effective May 31, 2011, Black Rock acquired our current interests in the Madera Prospect. In June 2011, Black Rock Capital, LLC filed Articles of Conversion with the Secretary of State for the State of Arkansas to convert Black Rock Capital, LLC into a corporation. The conversion became effective July 1, 2011 and, accordingly, Black Rock Capital, LLC was converted to Black Rock Capital, Inc. As a result of the conversion, our 100% membership interest in Black Rock Capital, LLC became an interest in all of the outstanding common stock of Black Rock.
Recent Developments
Reverse Stock Split and Authorized Share Reduction. On January 31, 2014, RMR FL effected a reverse stock split of RMR FL’s common stock, par value $0.00001 per share (“RMR FL Common Stock”), at an exchange ratio of 1-for-10 (the “Reverse Stock Split”), together with a proportional reduction in the number of authorized shares of RMR FL Common Stock from 500.0 million shares to 50.0 million shares. The par value of RMR FL Common Stock did not change as a result of the Reverse Stock Split. As of January 31, 2014, every ten shares of RMR FL Common Stock were combined into one share of RMR FL Common Stock, reducing the number of outstanding shares of RMR FL Common Stock from approximately 134.0 million to approximately 13.4 million. In addition, a proportionate adjustment was made to the per share exercise price and the number of shares issuable upon the exercise of all outstanding warrants to purchase shares of RMR FL Common Stock. All share and per share amounts and calculations in this report have been retroactively adjusted to reflect the effects of the Reverse Stock Split.
Change of State of Incorporation. On January 31, 2014, RMR FL changed its state of incorporation from the State of Florida to the State of Texas by merging (the “Reincorporation”) with and into its wholly-owned subsidiary, Red Mountain, with Red Mountain continuing as the surviving corporation. As a result, as of January 31, 2014:
| (i) | RMR FL ceased to exist; |
| (ii) | shareholders of RMR FL automatically became shareholders of Red Mountain, without any action by such shareholders, and began to be governed by (a) the Texas Business Organizations Code, (b) Red Mountain’s Certificate of Formation, and (c) Red Mountain’s Bylaws; |
| (iii) | the name, business, management, fiscal year, accounting, location of the principal executive offices, assets and liabilities of RMR FL became the name, business, management, fiscal year, accounting, location of the principal executive offices, assets and liabilities of Red Mountain; and |
| (iv) | the directors and officers of RMR FL prior to the Reincorporation continued as the directors and officers of Red Mountain after the Reincorporation for an identical term of office. |
On January 31, 2014, our common stock commenced trading on a split-adjusted basis. As a result of the Reincorporation, Red Mountain became the successor corporation to RMR FL under the Exchange Act and succeeded to RMR FL’s reporting obligations thereunder. Pursuant to Rule 12g-3 promulgated under the Exchange Act, the common stock, preferred stock and warrants of Red Mountain were deemed to be registered under Section 12(g) of the Exchange Act.
| 9 |
Series A Preferred Stock Exchange. We exchanged 222,224 outstanding shares of our Series A Preferred Stock for the issuance of 1,388,898 shares of common stock effective as of April 1, 2014. As of June 30, 2014, we had 254,463 shares of Series A Preferred Stock outstanding with an aggregate redemption amount of $6.4 million.
Fiscal 2014 Fourth Quarter Operational Update
Net production sold for the quarter ended June 30, 2014 was 105.3 MBoe, or 1,157 Boe/d based on actual calendar days during the period, net of prior period adjustments.
Madera Prospect (Lea County, New Mexico). We own interests in 2,545 gross (1,132 net) acres in the Madera Prospect. We have seven producing wells, one disposal well, and one well awaiting completion in this area. The Madera 25 Federal 2H well, which is awaiting completion, was on hold pending resolution of a casing problem. We have resolved the casing issue, and we expect to complete the well with a 20 stage fracture stimulation in October 2014. We own an approximately 30% working interest and 23% net revenue interest in this well. The 1.5 sections and 1.5 miles long-lateral length well consists of a total measured depth of approximately 16,000 feet, and targets the Brushy Canyon reservoir. In addition to the Madera 25 Federal 2H well, we have eight gross (3.4 net) additional Brushy Canyon drilling locations, which includes six gross (2.9 net) long-lateral length well locations, each with a total measured depth of approximately 16,000 feet, and two gross (0.5 net) lateral wells, each with a total measured depth of approximately 14,000 feet.
We are currently evaluating the additional potential in the Avalon, Bone Spring, Upper Wolfcamp, and Middle Wolfcamp zones in the Madera Prospect. The four objectives provide 48 potential gross drilling locations (20.1 net), which include 32 gross (16.1 net) long lateral wells and 16 gross (4.0 net) single section lateral wells.
Tom Tom Area (Chaves and Roosevelt Counties, New Mexico). We own interests in 8,300 gross (6,200 net) acres in the Tom Tom Area. We have developed a workover program in the area. There are 28 gross wells (21.6 net) that we have identified with additional behind pipe pay, and an additional 21 gross wells (17.3 net) on which we have identified opportunities for acid and fracture stimulations.
In June 2014, we continued the workover program. This workover was on the Strange Federal 1 well in which we own a 100% working interest and an approximately 75% net revenue interest. We added perforations and treated the well with acid. Subsequently, in August 2014, we fracture stimulated the well and are awaiting flow back results. We are also awaiting results on the Wattam Federal 4 and Hahn Federal 7 wells. We added perforations to the Hahn Federal 7 well and treated both wells with acid. We own a 100% working interest and 77% net revenue interest in Wattam Federal 4, and an approximately 78% working interest and 64% net revenue interest in Hahn Federal 7.
Kansas (Rush County, Kansas). We lease 9,868 gross and net acres in Rush County, Kansas. We recently processed seismic data over this acreage. Our primary targets in this area include the Arbuckle, Basal Penn, Reagan, and Lansing-Kansas City formations. Our first well in this area, the Besperat 1, was spudded in early August 2014 and drilled to a depth of 3,850 feet. The next well, Koriel 1, was drilled immediately after. These wells did not encounter commercial hydrocarbons and will be considered for conversion to disposal wells. The total dry hole cost was approximately $100,000 each. The third well, Stalcup 1, was spud in late August 2014 and discovered hydrocarbons in the Arbuckle formation. The well was completed in September 2014 and we are awaiting flowback results. We also drilled the Gisick 1 well, which is awaiting completion, and are drilling the Elder 1 well. We own a 100% working interest and a net revenue interest ranging from 83% to 88% in these five wells.
Turkey Track Prospect (Eddy County, New Mexico). We own a non-operated interest in the Turkey Track Prospect. The operator of this acreage, Mewbourne Oil Company, is actively drilling horizontal 1st and 2nd Bone Spring wells. The most recent completion, the Zircon 2 B1EH State 2H, is the first well targeting the 1st Bone Spring. The well was completed in July 2014 and achieved a maximum 24-hour production rate of 632 Boe/d (of which 87% was oil) and a 10-day average production rate of 549 Boe/d (of which 81% was oil). We own an approximately 13% working interest and 9% net revenue interest in this well.
| 10 |
On July 20, 2014, the operator spudded the Bradley 31 B2DA Federal Com 1H well, a horizontal well targeting the 2nd Bone Spring. The well was completed in September 2014 and achieved a maximum 24-hour production rate of 889 Boe/d (of which 88% was oil) and a 10-day average production rate of 790 Boe/d (of which 88% was oil). We own an approximately 7% working interest and 5% net revenue interest in this well. We have 10 gross locations (1.0 net) remaining targeting the 2nd Bone Spring and 12 gross locations (0.9 net) targeting the 1st Bone Spring.
Perla Verde Area (Lea County, New Mexico). We own non-operated interests in the Perla Verde Area. We recently approved drilling four gross wells (0.2 net). These wells, the Perla Verde 31 State Com 1H, 2H, 3H and 4H wells, will be operated by XTO Energy, Inc. We own working interests ranging from 4.7% to 6.3% and net revenue interests ranging from 3.5% to 4.7% in these wells.
Red Lakes Area (Eddy County, New Mexico). We own a non-operated interest in the Red Lakes Area. In June 2014, LRE Operating completed two vertical wells targeting the Yeso formation, the Southern Union 30G State 3 well and the Horseshoe State 3 well. We own an approximately 14% working interest and 12% net revenue interest in the Southern Union 30G State 3 well and an approximately 13% working interest and 9% net revenue interest in the Horseshoe State 3 well. Early production rates from the wells were 137 Boe/d (of which 88% was oil) and 140 Boe/d (of which 86% was oil), respectively.
We recently approved the drilling of four additional gross wells (0.9 net) in the Red Lakes Area. These wells, the T Rex 31 State 1, 2, 3, and 4 wells, will be operated by Apache Corp. We own an approximately 22% working interest and 16% net revenue interest in each of these wells.
Our Business Strategies
Key elements of our business strategy include:
Increase Reserves and Production Through Low-Risk Drilling Program. We intend to achieve reserves and production growth over the next few years through our drilling program, which will focus on low risk opportunities with attractive rates of return. In addition to our proved reserve base of 4.1 MMBoe at July 1, 2014, we believe we have significant upside potential to convert our current probable and possible reserves into proved reserves.
Maintain a Conventional Balance Sheet and Capital Structure. We take a conventional approach to our drilling program and seek to find and develop geologically defined conventional prospects. Similarly, we intend to maintain a conventional balance sheet minimizing our risk and allowing us to maintain strong credit metrics. Further, we plan to use derivatives to hedge against falling commodity prices to ensure adequate cash flows to meet our corporate and drilling objectives.
Pursue Growth through Acquisitions that Leverage Our Expertise. Our primary acquisition strategy is to identify and acquire geologically defined, undercapitalized plays with development potential. At the same time, we continually review opportunities to acquire producing properties, undeveloped acreage and drilling prospects. We focus particularly on opportunities where we believe our operational efficiency, reservoir management and geological expertise will enhance value and performance.
Retain Operational Control. We intend to retain a high degree of operational control over our interests, through a high average working interest or acting as the operator in areas of significant exploration and development activity. This strategy is intended to provide us with controlling interests in a multi-year inventory of drilling locations, positioning us for reserve and production growth through drilling. We plan to control the timing, level and allocation of our drilling capital expenditures and the technology and methods utilized in the planning, drilling and completion process on related targets. We believe this flexibility to opportunistically pursue development on properties provides us with a meaningful competitive advantage.
| 11 |
Mitigate Operational and Financial Risk. Our goal is to generate attractive rates of return on every dollar invested. Concurrently, our goal is to manage risk by spreading our capital dollars over a significant number of wells to mitigate capital, geologic and mechanical concentration risk to any one project. The combination may prevent us from aggressively and continuously drilling in any one area but the participation in more projects allows us to better manage our production growth, effectively procure services, and provides ample time necessary to evaluate results in order to attempt to improve future wells.
Our Competitive Strengths
We believe that the following competitive strengths will help us successfully execute our business strategies and create substantial value:
Large Acreage Position Consisting of Mineral Ownership and Leases Held by Production. As of June 30, 2014, we controlled 310,392 net acres, 97% of which was in Texas and New Mexico. Included in this acreage position were approximately 290,000 net mineral acres within Southwest New Mexico and the Permian Basin region of Southeast New Mexico. This net mineral acreage carries no drilling commitments or leasehold obligations. Furthermore, 93% of our net leasehold acreage in the Permian Basin is currently held by existing production. The combination of perpetual mineral ownership and leases held by production provides us with ample time to exploit our drilling inventory in the Permian Basin.
Long-Life Reserves and Multi-Horizon Drilling Opportunities. One of the great attributes of the Permian Basin is that there are dozens of productive formations that lie deep into the Earth. Enhancements in drilling and completion technology have improved the economics of drilling and producing various hydrocarbon bearing strata that previously were uneconomic. We believe that much of our productive acreage has drilling opportunities into multiple hydrocarbon bearing zones that we have yet to evaluate which could provide substantial upside to our reserve base. Many of these zones are productive on nearby leases owned by other operators. Cash flow from our longer life reserve base combined with existing infrastructure should allow us to opportunistically test numerous potentially productive zones in the San Andres, Bone Spring, Brushy Canyon and other known horizons providing us with a multi-year drilling inventory.
Strong Management and Operations Team. Our team of managers, employees, consultants and directors combine to represent over 300 years of experience in the oil and natural gas industry as owners, investors, company builders, financiers, operators, geologists, service providers and petroleum engineers. In these various capacities, the Red Mountain team has participated in more than 10,000 wells in 20 states. We intend to utilize sophisticated geologic and 3-D seismic models to enhance the predictability and reproducibility of our operations. We also intend to utilize multi-zone, multi-stage hydraulic fracturing technology in completing wells to substantially increase near-term production, resulting in faster payback periods and higher rates of return and present values. Our team has applied these techniques to improve initial and ultimate production and returns for other organizations. We believe that the depth and breadth of our operations team coupled with a proven team in the areas of accounting, finance and capital markets, positions us well to take advantage of our large inventory of acreage and drilling opportunities.
Management with Meaningful Equity Ownership. As of September 1, 2014, our chairman of the board, chief executive officer and president, Alan Barksdale, beneficially owned 7.5% of our outstanding shares of common stock. As a result of his equity investment in us, we believe our management’s interests are highly aligned with our shareholders’ interests in stock price appreciation and profitable growth.
Existing Infrastructure. All of our properties are located within established oil and natural gas producing areas or existing fields. We seek to enhance existing production in these properties by using our engineering and geological expertise. These areas also have a fully developed transportation infrastructure, which allows us to transport our oil and natural gas to market without long-term delay or significant investment.
| 12 |
Our Properties
Currently, our oil and natural gas properties are concentrated in the Permian Basin, the onshore Gulf Coast of Texas, Southwest New Mexico and Kansas. The Permian Basin covers an area approximately 250 miles wide and 300 miles long in West Texas and Southeast New Mexico. The Permian Basin is one of the most prolific onshore oil and natural gas producing regions in the United States. It is characterized by an extensive production history, mature infrastructure, long reserve life and hydrocarbon potential in multiple producing formations. Our primary operations in the onshore Gulf Coast are in conventional fields that produce primarily from the Wilcox formation in Zapata and Duval counties of Texas.
Permian Basin. As of June 30, 2014, we had interests in 336,331 gross (30,926 net) acres in the Permian Basin, including of the Madera Prospect, Pawnee Prospect, Cowden Lease, Shafter Lake Lease, Martin Lease, Jackson Bough C Prospect, East Ranch Prospect and West Ranch Prospect. We are the operator of each of these properties. These interests include the oil and natural gas interests of Cross Border in the Permian Basin, a large portion of which is non-operated acreage located in the heart of the Bone Spring play in central Lea and Eddy counties of New Mexico. Cross Border also has non-operated acreage in the Yeso and Abo trends along the Northwest Shelf and in areas targeting the Queen, Grayburg, and San Andres reservoirs. Cross Border also holds acreage in the Tom Tom area, where it is the operator.
In the aggregate, as of June 30, 2014, these properties had 220 gross (94.2 net) producing wells and, during the three months ended June 30, 2014, had daily average net production of 1,006 Boe/d, 65% of which was oil. As of July 1, 2014, our Permian Basin properties had approximately 3,794 MBoe of proved reserves, of which 71% was oil. Of our proved reserves in the Permian Basin, 37% are from the Madera Prospect, 19% are from the Lusk Prospect, 12% are from the Tom Tom Prospect and 15% are from the Turkey Track Prospect. During the fiscal year ended June 30, 2014, we derived approximately 92% of our revenue from the Permian Basin.
Onshore Gulf Coast. As of June 30, 2014, we had interests in 4,776 gross (1,405 net) acres in the onshore Gulf Coast of Texas, consisting of the Villarreal Prospect, Frost Bank Prospect, Peal Ranch Prospect, Resendez Prospect and La Duquesa Prospect. We are the operator of each of these properties, other than the Villarreal Prospect, which is operated by ConocoPhillips Company, and the Peal Ranch Prospect, which is operated by White Oak Energy.
In the aggregate, as of June 30, 2014, these properties had 37 gross (12.8 net) producing wells and, during the three months ended June 30, 2014, had daily average net production of 151 Boe/d, substantially all of which was natural gas. As of July 1, 2014, our onshore Gulf Coast properties had approximately 325 MBoe of proved reserves, substantially all of which was natural gas. Of our proved reserves in the onshore Gulf Coast, 75% are from the Villarreal Prospect and 22% are from the Peal Ranch Prospect. During the fiscal year ended June 30, 2014, we derived approximately 8% of our revenue from the onshore Gulf Coast.
New Mexico Non-Permian Minerals. As of June 30, 2014, we owned 536,526 gross (268,193 net) mineral acres in DeBaca, Hidalgo, Grant, Sierra, and Socorro Counties, New Mexico. This mineral ownership carries no drilling commitments or leasehold obligations. As of July 1, 2014, this acreage had no proved reserves or production.
Kansas. As of June 30, 2014, we owned oil and natural gas interests in 9,868 gross and net acres in central Kansas. There are multiple target horizons in this prospect including the Arbuckle and the Lansing Kansas City formations. We own a 100% working interest and a net revenue interest ranging from 83% to 88%. RMR Operating is the operator. As of July 1, 2014, the Kansas acreage had no proved reserves or production.
For more detailed information on our properties, see “Item 2. Properties.”
Planned Development Program
During fiscal year 2015, we plan to spend between $15 million and $25 million for drilling, completion, workovers, and recompletion on our properties, including Cross Border’s non-operated acreage. Our planned fiscal 2015 development program is subject to change. See “Management’s Discussion and Analysis of Financial Condition and Results of Operations—Planned Development Program.”
| 13 |
Marketing and Customers
During the fiscal year ended June 30, 2014, we sold $5.0 million of oil to High Sierra Crude Oil & Marketing, LLC (“High Sierra”), representing 22.1% of our total revenues, $4.5 million of oil to Genesis Energy LP (“Genesis”), representing 20.0% of our total revenues, and $3.0 million of oil to Apache Corporation, representing 13.4% of our total revenues. We sell our oil to Genesis from our Good Chief State #1, Big Brave State #1, Madera 24 Federal 2H and 3H and Madera 19 Federal 4H wells pursuant to crude oil purchase contracts. The price of the oil delivered is based on the West Texas Intermediate price, subject to certain price adjustments. The purchase agreements continue until terminated by either party upon thirty days prior written notice. We believe that the loss of any of these customers would not have a material adverse effect on us because alternative purchasers are readily available.
Competition
The oil and natural gas industry is highly competitive and we compete with a substantial number of other companies that have greater resources than we do. The largest of these companies explore for, produce and market oil and natural gas, carry on refining operations and market the resultant products on a worldwide basis. The primary areas in which we encounter substantial competition are in our drilling and development operations, locating and acquiring prospective oil and natural gas properties and reserves and attracting and retaining highly skilled personnel. There is also competition between producers of oil and natural gas and other industries producing alternative energy and fuel. Furthermore, competitive conditions may be substantially affected by various forms of energy legislation and/or regulation considered from time to time by the United States government; however, it is not possible to predict the nature of any such legislation or regulation that may ultimately be adopted or its effects upon our future operations. Such laws and regulations may, however, substantially increase the costs of exploring for, developing or producing oil and natural gas and may prevent or delay the commencement or continuation of a given operation. The effect of these risks cannot be accurately predicted.
Insurance
We currently maintain oil and natural gas commercial general liability protection relating to all of our oil and natural gas operations (including environmental and pollution claims) with a total limit of coverage in the amount of $2.0 million (with no deductible) and excess liability protection with a total limit of $3.0 million (with a deductible of $10,000).
As is common in the oil and natural gas industry, we will not insure fully against all risks associated with our business either because such insurance is not available or because premium costs are considered prohibitive. In addition, pollution and environmental risks generally are not fully insurable. A loss not fully covered by insurance could have a material adverse effect on our business, financial condition and results of operations.
Employees
As of June 30, 2014, we had 33 full-time employees. We are not a party to any collective bargaining agreements and have not experienced any strikes or work stoppages. We believe our relationships with our employees are good.
Hydraulic Fracturing Policies and Procedures
We contract with third parties to conduct hydraulic fracturing as a means to maximize the productivity of our oil and natural gas wells in almost all of our wells. Hydraulic fracturing involves the injection of water, sand, gel and chemicals under pressure into formations to fracture the surrounding rock and stimulate production. All of our proved non-producing and proved undeveloped reserves associated with future drilling, completion and recompletion projects will require hydraulic fracturing.
| 14 |
Although average drilling and completion costs for each area will vary, as will the cost of each well within a given area, on average approximately 40% of the drilling and completion costs for our wells are associated with hydraulic fracturing activities. These costs are treated in the same way that all other costs of drilling and completing our wells are treated and are built into and funded through our normal capital expenditures budget. A change to any federal and state laws and regulations governing hydraulic fracturing could impact these costs and adversely affect our business and financial results. See “Risk Factors—Federal and state legislative and regulatory initiatives as well as governmental reviews relating to hydraulic fracturing could result in increased costs and additional operating restrictions or delays as well as adversely affect our level of production.”
The protection of groundwater quality is important to us. Our policy and practice is to ensure our service providers follow all applicable guidelines and regulations in the areas where we have hydraulic fracturing operations. In addition, we send at least one of our own engineers or an experienced consultant to the well site to personally supervise each hydraulic fracture treatment.
We believe that the hydraulic fracturing operations on our properties are conducted in compliance with all state and federal regulations and in accordance with industry standard practices for groundwater protection. These protective measures include setting surface casing at a depth sufficient to protect fresh water zones as determined by applicable state regulatory agencies, and cementing the casing to create a permanent isolating barrier between the casing pipe and surrounding geological formations. The casing plus the cement are intended to prevent contact between the fracturing fluid and any aquifers during the hydraulic fracturing or other well operations. For recompletions of existing wells, the production casing is pressure tested prior to perforating the new completion interval. Injection rates and pressures are monitored at the surface during our hydraulic fracturing operations. Pressure is monitored on both the injection string and the immediate annulus to the injection string.
The vast majority of hydraulic fracturing treatments are made up of water and sand or other kinds of man-made propping agents. Our service providers track and report chemical additives that are used in the fracturing operation as required by the applicable governmental agencies.
Hydraulic fracturing requires the use of a significant amount of water. All produced water, including fracture stimulation water, is disposed of in a way that does not impact surface waters. All produced water is disposed of in permitted and regulated disposal facilities.
Environmental Matters and Regulation
Our exploration, development and production operations are subject to various federal, state and local laws and regulations governing health and safety, the discharge of materials into the environment or otherwise relating to environmental protection. These laws and regulations may, among other things: require the acquisition of permits to conduct exploration, drilling and production operations; govern the amounts and types of substances that may be released into the environment in connection with oil and natural gas drilling and production; restrict the way we handle or dispose of our wastes or of naturally occurring radioactive materials generated by our operations; cause us to incur significant capital expenditures to install pollution control or safety related equipment operating at our facilities; limit or prohibit construction or drilling activities in sensitive areas such as wetlands, wilderness areas or areas inhabited by endangered or threatened species; impose specific health and safety criteria addressing worker protection; require investigatory and remedial actions to mitigate pollution conditions caused by our operations or attributable to former operations; impose obligations to reclaim and abandon well sites and pits and impose substantial liabilities on us for pollution resulting from our operations. Failure to comply with these laws and regulations may result in the assessment of administrative, civil and criminal penalties, the imposition of remedial obligations and the issuance of orders enjoining some or all of our operations in affected areas.
Additionally, the United States Congress and federal and state agencies frequently revise environmental, health and safety laws and regulations, and their interpretations thereof, and any changes that result in more stringent and costly operational requirements or waste handling, disposal, cleanup and remediation requirements for the oil and natural gas industry could have a significant impact on our operating costs. The trend in environmental regulation is to place more restrictions and limitations on activities that may affect the environment, and thus, any changes in environmental laws and regulations or new interpretations of enforcement policies that result in more stringent and costly waste handling, storage, transport, disposal or remediation requirements could have a material adverse effect on our financial condition and results of operations. We may be unable to pass on such increased compliance costs to our customers.
| 15 |
We believe that we are in substantial compliance with all existing environmental laws and regulations applicable to our current operations and that our continued compliance with existing requirements will not have a material adverse impact on our financial condition and results of operations. We have not incurred any material capital expenditures for remediation or pollution control activities during fiscal 2014, and we are not aware of any environmental issues or claims that will require material capital expenditures during fiscal 2015, other than the remediation plan for Cross Border’s Tom Tom and Tomahawk fields, or that will otherwise have a material impact on our financial condition and results of operations in the future. However, we cannot assure you that the passage of more stringent laws and regulations in the future will not have a negative impact on our business, financial condition or results of operations.
The following is a summary of the more significant existing environmental, health and safety laws and regulations to which our business is subject and for which compliance may have a material adverse impact on our capital expenditures, financial condition or results of operations.
Comprehensive Environmental Response, Compensation and Liability Act. Comprehensive Environmental Response, Compensation and Liability Act (“CERCLA”), also known as the “Superfund” law, and comparable state statutes impose strict and joint and several liability for costs of investigation and removal and remediation of previously disposed wastes (including wastes disposed of or released by prior owners or operators) or property contamination (including groundwater contamination), for natural resource damages and the cost of certain health studies without regard to fault or legality of the original conduct, on certain classes of persons with respect to the release into the environment of substances designated under CERCLA as hazardous substances. These classes of persons, or so-called potentially responsible parties (“PRPs”) include the current and past owners or operators of a site where the release occurred and anyone who transported or disposed or arranged for the transport or disposal of a hazardous substance found at the site. CERCLA also authorizes the U.S. Environmental Protection Agency (“EPA”) and, in some instances, third parties to take actions in response to threats to public health or the environment and to seek to recover from the PRPs the costs of such action. Additionally, it is not uncommon for neighboring landowners and other third parties to file claims for personal injury and property damage allegedly caused by the hazardous substances released into the environment. Many states have adopted comparable or more stringent state statutes.
Although CERCLA generally exempts “petroleum” from the definition of hazardous substance, in the course of our operations, we will generate, transport and dispose or arrange for the disposal of wastes that may fall within CERCLA’s definition of hazardous substances. Comparable state statutes may not contain a similar exemption for petroleum. We may also be the owner or operator of sites on which hazardous substances have been released.
Solid and Hazardous Waste Handling. The Resource Conservation and Recovery Act (“RCRA”) and comparable state statutes and regulations promulgated thereunder regulate the generation, transportation, treatment, storage, disposal and cleanup of solid and hazardous waste. With federal approval, the individual states administer some or all of the provisions of RCRA, sometimes in conjunction with their own, more stringent regulations. Although oil and natural gas waste generally is exempt from regulations as hazardous waste under RCRA, such wastes may constitute “solid wastes” that are subject to the less stringent requirements of non-hazardous waste provisions. Additionally, we will generate waste as a routine part of our operations that may be subject to RCRA and not all state and local laws contain a comparable exemption. Further, there is no guarantee that the EPA or individual states or local governments will not adopt more stringent requirements for the handling of non-hazardous waste or categorize some non-hazardous waste as hazardous in the future. Indeed, legislation has been proposed from time to time in Congress to re-categorize certain oil and natural gas exploration, development and production wastes as “hazardous wastes.” Any such change could result in an increase in our costs to manage and dispose of waste, which could have a material adverse effect on our financial condition and results of operations.
It is also possible that our oil and natural gas operations may require us to manage naturally occurring radioactive materials, or NORM. NORM is present in varying concentrations in sub-surface formations, including hydrocarbon reservoirs, and may become concentrated in scale, film and sludge in equipment that comes in contract with crude oil and natural gas production and processing streams. Some states have enacted regulations governing the handling, treatment, storage and disposal of NORM.
| 16 |
Administrative, civil and criminal penalties can be imposed for failure to comply with waste handling requirements. We believe that we are in substantial compliance with applicable requirements related to waste handling, and that we hold all necessary and up-to-date permits, registrations and other authorizations to the extent that our operations require them under such laws and regulations. Although we do not believe the current costs of managing our wastes, as presently classified, to be significant, any legislative or regulatory reclassification of oil and natural gas exploration and production wastes could increase our costs to manage and dispose of such wastes.
Water Discharges. The Federal Water Pollution Control Act of 1972, as amended, also known as the Clean Water Act (the “CWA”), the SDWA, the Oil Pollution Act (the “OPA”) and analogous state laws and regulations promulgated thereunder impose restrictions and strict controls regarding the unauthorized discharge of pollutants, including produced waters and other gas and oil wastes, into navigable waters of the United States, as well as state waters. The discharge of pollutants into regulated waters is prohibited, except in accordance with the terms of certain permits issued by the EPA or an analogous state agency. Spill prevention, control and countermeasure requirements under federal law require appropriate containment berms and similar structures to help prevent the contamination of navigable waters in the event of a petroleum hydrocarbon tank spill, rupture or leak. In addition, the CWA and analogous state laws require individual permits or coverage under general permits for discharges of storm water runoff from certain types of facilities. The CWA also prohibits the discharge of dredge and fill material in regulated waters, including wetlands, unless authorized by a permit issued by the United States Army Corps of Engineers. In addition, in October 2011, the EPA announced a schedule to develop pre-treatment standards for wastewater discharges produced by natural gas extraction from underground coalbed and shale formations. Hydraulic fracturing stimulation requires the use of a significant volume of water with some resulting flowback, as well as produced water. The EPA asserts that this water may contain radioactive materials and other pollutants and, therefore, may deteriorate drinking water quality if not properly treated before discharge. While the EPA has revised the scope of its rulemaking to exclude discharges associated with coalbed methane extraction, it is continuing to develop pre-treatment standards for wastewater discharges produced by natural gas extraction from shale formations, and a proposed rule is scheduled for publication in 2014. Costs may be associated with the treatment of wastewater or developing and implementing storm water pollution prevention plans, as well as for monitoring and sampling the storm water runoff from certain of our facilities. Some states also maintain groundwater protection programs that require permits for discharges or operations that may impact groundwater conditions.
Federal and state regulatory agencies can impose administrative, civil and criminal penalties, as well as require remedial or mitigation measures, for non–compliance with discharge permits or other requirements of the CWA and analogous state laws and regulations. In the event of an unauthorized discharge of wastes, we may be liable for penalties and costs of remediation. The OPA is the primary federal law for oil spill liability. The OPA imposes requirements on “responsible parties” related to the prevention of oil spills and liability for damages resulting from oil spills into or upon navigable waters, adjoining shorelines or in the exclusive economic zone of the United States. A “responsible party” under the OPA may include the owner or operator of an onshore facility. The OPA subjects responsible parties to strict, joint and several financial liability for removal costs and other damages, including natural resource damages, caused by an oil spill that is covered by the statute. It also imposes other requirements on responsible parties, such as the preparation of an oil spill contingency plan and maintaining certain significant levels of financial assurance to cover potential environmental cleanup and restoration costs. Failure to comply with the OPA may subject a responsible party to civil or criminal enforcement action. We may conduct operations on acreage located near, or that affects, navigable waters subject to the OPA. We believe that compliance with applicable requirements under the OPA will not have a material and adverse effect on us.
Hydraulic fracturing is a practice that is used to stimulate production of hydrocarbons, particularly natural gas, from tight formations. The process involves the injection of water, sand and chemicals under pressure into the formation to fracture the surrounding rock and stimulate production. Although hydraulic fracturing has historically been regulated by state oil and gas commissions the EPA recently asserted federal regulatory authority over the process under the SDWA’s Underground Injection Control (“UIC”) Program. Under this assertion of authority, the EPA requires facilities to obtain permits to use diesel fuel in hydraulic fracturing operations, specifically in Class II wells, which are those wells injecting fluids associated with oil and natural gas production activities. The U.S. Energy Policy Act of 2005, which exempts hydraulic fracturing from regulation under the SDWA, prohibits the use of diesel fuel in the fracturing process without a UIC permit. On February 12, 2014, the EPA released an interpretive memorandum and technical recommendations for implementing the UIC Program for oil and natural gas hydraulic fracturing activities using diesel fuel. The guidance document describes how Class II regulations may be tailored to address the purported unique risks of diesel fuel injection during the hydraulic fracturing process. Although EPA has delegated UIC permitting authority to many states, it is encouraging those states to review and consider use of this permit guidance.
| 17 |
The EPA is also evaluating a variety of environmental issues associated with hydraulic fracturing. On November 3, 2011, the EPA released its Plan to Study the Potential Impacts of Hydraulic Fracturing on Drinking Water Resources. The study will include both analysis of existing data and investigative activities designed to generate future data. The EPA issued a progress report in December 2012, and expects to release a final report for public comment and peer review in 2014. The EPA is also updating chloride water quality criteria for the protection of aquatic life under the Clean Water Act, which criteria are used by states for establishing acceptable discharge limits. In addition, on May 19, 2014, the EPA issued an advance notice of proposed rulemaking pursuant to the Toxic Substances Control Act, requesting comments on the information that should be reported or disclosed for hydraulic fracturing chemical substances and mixtures and the mechanism for obtaining this information. In addition, legislation is pending in Congress to repeal the hydraulic fracturing exemption from the SDWA, provide for federal regulation of hydraulic fracturing, and require public disclosure of the chemicals used in the fracturing process, and such legislation could be introduced in the current session of Congress. The agency also announced that one of its enforcement initiatives for 2014 to 2016 would be to focus on environmental compliance by the energy extraction sector. This additional regulatory scrutiny could make it difficult to perform hydraulic fracturing and increase our costs of compliance and doing business.
Many states have adopted, and other states are considering adopting, legislation or regulations requiring the disclosure of the chemicals used in hydraulic fracturing or otherwise restrict hydraulic fracturing in certain circumstances. For example, pursuant to legislation adopted by the State of Texas in June 2011, beginning February 1, 2012, companies were required to disclose to the Railroad Commission of Texas (the “RRC”) and the public the chemical components used in the hydraulic fracturing process, as well as the volume of water used. Furthermore, on May 23, 2013, the RRC issued the “well integrity rule,” which updates the RRC’s Rule 13 requirements for drilling, putting pipe down, and cementing wells. The rule also includes new testing and reporting requirements, such as (i) the requirement to submit to the RRC cementing reports after well completion or after cessation of drilling, whichever is later, and (ii) the imposition of additional testing on wells less than 1,000 feet below usable groundwater. The “well integrity rule” took effect in January 2014. In September 2010, the Wyoming Oil and Gas Conservation Commission also passed a rule requiring disclosure of hydraulic fracturing fluid. In addition, a number of states in which we plan to conduct, are currently conducting, or may in the future conduct, hydraulic fracturing operations regularly review hydraulic fracturing and new regulations from such reviews could restrict or limit our access to shale formations or could delay our operations or make them more costly. In addition to state law, local land use restrictions, such as city ordinances, may restrict or prohibit the performance of well drilling in general and/or hydraulic fracturing in particular.
Finally, with respect to our operations that occur on federally managed public lands, on May 16, 2013, the U.S. Department of Interior (“DOI”) issued a proposed rule that seeks to require companies operating on federal and Indian lands to (i) publicly disclose the chemicals used in the hydraulic fracturing process, (ii) confirm their wells meet certain construction standards and (iii) establish site plans to manage flowback water. The DOI plans to issue a final rule in 2014.
Air Emissions. Our operations are subject to federal regulations for the control of emissions from sources of air pollution under the Clean Air Act (“CAA”) and analogous state and local regulations. Federal and state laws require new and modified sources of air pollutants to obtain permits prior to commencing construction and also impose various monitoring and reporting requirements. Major sources of air pollutants are subject to more stringent, federally imposed requirements including additional permits. Federal and state laws designed to control hazardous or toxic air pollutants may require installation of additional controls. Administrative enforcement actions for failure to comply strictly with air pollution regulations or permits are generally resolved by payment of monetary fines and correction of any identified deficiencies. Alternatively, regulatory agencies could bring lawsuits for civil penalties or require us to forego construction, modification or operation of certain air emission sources.
| 18 |
In August 2012, the EPA adopted rules that subject oil and natural gas production, processing, transmission, and storage operations to regulation under the New Source Performance Standards (“NSPS”) and National Emission Standards for Hazardous Air Pollutants (“NESHAP”) programs. The rule includes NSPS standards for completions of hydraulically fractured gas wells and establishes specific new requirements for emissions from compressors, controllers, dehydrators, storage vessels, natural gas processing plants and certain other equipment. The final rule seeks to achieve a 95% reduction in VOCs emitted by requiring the use of reduced emission completions or “green completions” on all hydraulically-fractured wells constructed or refractured after January 1, 2015. These rules may require a number of modifications to our operations, including the installation of new equipment to control emissions from our wells by January 1, 2015. The EPA received numerous requests for reconsideration of these rules from both industry and the environmental community, and court challenges to the rules were also filed. The EPA intends to issue revised rules that are likely responsive to some of these requests. On September 23, 2013, the EPA finalized the portion of the rule addressing VOC emissions from storage tanks, including a phase-in period and an alternative emissions limit for older tanks. On July 1, 2014, the EPA announced proposed amendments and clarifications to the NSPS standards. These standards, as well as any future laws and their implementing regulations, may require us to obtain pre-approval for the expansion or modification of existing facilities or the construction of new facilities expected to produce air emissions, impose stringent air permit requirements, or utilize specific equipment or technologies to control emissions. Our failure to comply with these requirements could subject us to monetary penalties, injunctions, conditions or restrictions on operations and, potentially, criminal enforcement actions.
We have incurred additional capital expenditures to insure compliance with these new regulations as they come into effect. We may also be required to incur additional capital expenditures in the next few years for air pollution control equipment in connection with maintaining or obtaining operating permits addressing other air emission related issues, which may have a material adverse effect on our operations. Obtaining permits also has the potential to delay the development of oil and natural gas projects. We believe that we currently are in substantial compliance with all air emissions regulations and that we hold all necessary and valid construction and operating permits for our current operations.
Climate Change Legislation. In response to certain scientific studies suggesting that emissions of carbon dioxide, methane and other GHGs are contributing to the warming of the Earth’s atmosphere and other climatic changes, the United States Congress has considered legislation to reduce such emissions. To date, the United States Congress has failed to enact a comprehensive GHG program. Some states, either individually or on a regional level, have considered or enacted legal measures to reduce GHG emissions. Although most of the state-level initiatives have to date focused on large sources of GHG emissions, it is possible that smaller sources of emissions could become subject to GHG emission limitations. The cost of complying with these programs could be significant.
The EPA published finding that emissions of GHGs presented an endangerment to public health and the environment. These findings by the EPA allowed the agency to proceed through a rule-making process with the adoption and implementation of regulations that would restrict emissions of GHGs under existing provisions of the CAA. Consequently, the EPA adopted two sets of regulations that would require a reduction in emissions of GHGs from motor vehicles and could trigger permit review for GHG emissions from certain stationary sources. The EPA adopted the stationary source rule (or the “tailoring rule”) in May 2010. The tailoring rule established new GHG emissions thresholds that determine when stationary sources must obtain permits under the Prevention of Significant Deterioration, or PSD, and Title V programs of the Clean Air Act. On June 23, 2014, the Supreme Court held that the tailoring rule exceeded EPA’s authority under the CAA. The Court ruled that stationary sources could not become subject to PSD or Title V permitting merely by reason of their GHG emissions. The Court further ruled that the EPA may require installation of best available control technology for GHG emissions at sources otherwise subject to the PSD or Title V programs. The EPA has announced that it is currently evaluating the decision and awaiting further action by the courts, and that it will provide relevant guidance on GHG permitting requirements. The Court’s ruling does not affect the EPA’s exercise of authority under different sections of the CAA.
In September 2009, the EPA issued a final rule requiring the reporting of GHG emissions from specified large GHG emission sources in the U.S., including NGLs fractionators and local natural gas/distribution companies, beginning in 2011 for emissions occurring in 2010. In November 2010, the EPA published a final rule expanding the GHG reporting rule to include onshore oil and natural gas production, processing, transmission, storage and distribution facilities. This rule requires reporting of GHG emissions from such facilities on an annual basis, with reporting beginning in 2012 for emissions occurring in 2011. In addition, the EPA has continued to adopt GHG regulations of other industries, such as a September 2013 proposed GHG rule that, if finalized, would set NSPS standards for new fossil-fuel fired power plants. Finally, on June 2, 2014, the EPA issued the so-called Clean Power Plan proposed rules, which propose state-specific rate-based goals to reduce GHG emissions from existing fossil-fuel fired power plants. The adoption and implementation of any regulations imposing reporting obligations on, or limiting emissions of GHGs from, our equipment and operations could require us to incur costs to reduce emissions of GHGs associated with our operations or could adversely affect demand for the oil and natural gas we produce. Any one of these climate change regulatory and legislative initiatives could have a material adverse effect on our business, financial condition and results of operations.
| 19 |
Finally, it should be noted that some scientists have concluded that increasing concentrations of GHGs in the Earth’s atmosphere may produce climate changes that have significant physical effects, such as increased frequency and severity of storms, droughts and floods and other climatic events; if any such effects were to occur, they could have a material adverse effect on our business and results of operations.
OSHA and Other Laws and Regulations on Employee Health and Safety. To the extent not preempted by other applicable laws, we are subject to the requirements of the Occupational Safety and Health Act (“OSHA”) and comparable state statutes, where applicable. These laws and the implementing regulations strictly govern the protection of the health and safety of employees. The OSHA hazard communication standard, the EPA community right-to-know regulations under the Title III of CERCLA and similar state statutes, where applicable, require us to organize and maintain information about hazardous materials used or, as applicable, produced in our operations and that this information be provided to employees, state and local government authorities and, where applicable, citizens. OSHA may enforce workplace safety regulations through issuance of citations for violations of its standards, which include, but are not limited to, those regarding hazard communication, personal protective equipment, general environmental controls, and materials handling and storage. We believe that we are in substantial compliance with these requirements where applicable and with other applicable OSHA and comparable requirements.
National Environmental Policy Act. Oil and natural gas exploration and production activities on federal lands may be subject to the National Environmental Policy Act (“NEPA”) which requires federal agencies, including the DOI, to evaluate major agency actions having the potential to significantly impact the environment. In the course of such evaluations, an agency will prepare an Environmental Assessment that assesses the potential direct, indirect and cumulative impacts of a proposed project and, if necessary, will prepare a more detailed Environmental Impact Statement that may be made available for public review and comment. All of our current exploration and production activities, as well as proposed exploration and development plans, on federal lands require governmental permits that are subject to the requirements of NEPA. This process has the potential to delay or impose additional conditions upon the development of oil and natural gas projects.
Endangered Species Act. The Endangered Species Act, as amended (the “ESA”), and analogous state statutes restrict activities that may affect endangered and threatened species or their habitats. While some of our facilities may be located in areas that are designated as habitat for endangered or threatened species, we believe that we are in substantial compliance with the ESA. However, the designation of previously unidentified endangered or threatened species could cause us to incur additional costs or become subject to operating restrictions or bans in the affected areas.
Other Regulation of the Oil and Natural Gas Industry
The oil and natural gas industry is extensively regulated by numerous federal, state and local authorities. In particular, oil and natural gas production and related operations are, or have been, subject to price controls, taxes and numerous other laws and regulations. These laws and regulations may also restrict the rate of oil and natural gas production below the rate that would otherwise be possible. The regulatory burden on the oil and natural gas industry increases the cost of doing business in the industry and consequently affects profitability.
Failure to comply with applicable laws and regulations can result in substantial penalties and possibly cessation of drilling and production operations. The regulatory burden on the industry increases the cost of doing business and affects profitability. We believe that we are in substantial compliance with existing requirements and such compliance will not have a material adverse effect on our financial condition, cash flows or results of operations. Nevertheless, such laws and regulations are frequently amended or reinterpreted. Therefore, we are unable to predict the future costs or impact of compliance. Additional proposals and proceedings that affect the oil and natural gas industry are regularly considered by the United States Congress, the states, the Federal Energy Regulatory Commission (“FERC”) and the courts. We cannot predict when or whether any such proposals may become effective.
| 20 |
Drilling and Production. Our operations are subject to various types of regulation at the federal, state and local levels. These types of regulation include requiring permits for the drilling of wells, drilling bonds and reports concerning operations. The states and some counties and municipalities in which we operate also regulate one or more of the following:
| ● | the location of wells; |
| ● | the method of drilling and casing wells; |
| ● | the surface use and restoration of properties upon which wells are drilled; and |
| ● | the plugging and abandonment of wells. |
State laws, including Texas, regulate the size and shape of drilling and spacing units or proration units governing the pooling of oil and natural gas properties. Some states allow forced pooling or integration of tracts to facilitate exploitation while other states rely on voluntary pooling of lands and leases. In some instances, forced pooling or unitization may be implemented by third parties and may reduce our interest in the unitized properties. In addition, state conservation laws establish maximum rates of production from oil and natural gas wells, generally prohibit the venting or flaring of natural gas and impose requirements regarding the ratability of production. These laws and regulations may limit the amount of oil and natural gas we can produce from our wells or limit the number of wells or the locations at which we can drill. Moreover, each state generally imposes a production or severance tax with respect to the production and sale of oil and natural gas within its jurisdiction.
In addition, at least 11 states have enacted surface damage statutes (“SDAs”). These laws are designed to compensate for damage caused by mineral development. Most SDAs contain entry notification and negotiation requirements to facilitate contact between operators and surface owners and users. Most also contain bonding requirements and specific expenses for exploration and producing activities. Costs and delays associated with SDAs could impair operational effectiveness and increase development costs.
We do not control the availability of transportation and processing facilities used in the marketing of our production. For example, we may have to shut-in a productive natural gas well because of a lack of available natural gas gathering or transportation facilities.
If we conduct operations on federal, state or Indian oil and natural gas leases, these operations must comply with numerous regulatory restrictions, including various non-discrimination statutes, royalty and related valuation requirements, and certain of these operations must be conducted pursuant to certain on-site security regulations and other appropriate permits issued by the BLM, the Bureau of Ocean Energy Management, Bureau of Safety and Environmental Enforcement, or other appropriate federal or state agencies.
Transportation of Oil. Sales of oil are not currently regulated and are made at negotiated prices. Nevertheless, the United States Congress could reenact price controls in the future.
Our sales of oil are affected by the availability, terms and cost of transportation. The transportation of oil in common carrier pipelines is also subject to rate and access regulation. The FERC regulates interstate oil pipeline transportation rates under the Interstate Commerce Act. In general, interstate oil pipeline rates must be cost-based, although settlement rates agreed to by all shippers are permitted and market based rates may be permitted in certain circumstances. Effective January 1, 1995, the FERC implemented regulations establishing an indexing system (based on inflation) for transportation rates for oil that allowed for an annual increase or decrease in the cost of transporting oil to the purchaser, effective July 1 of each year. The FERC reviews the indexing methodology every five years. In its latest order on the methodology, issued in December 2010, the FERC concluded that an index level of the Producer Price Index for Finished Goods plus 2.65 percent should be established for the five-year period commencing July 1, 2011.
| 21 |
Intrastate oil pipeline transportation rates are subject to regulation by state regulatory commissions. The basis for intrastate oil pipeline regulation, and the degree of regulatory oversight and scrutiny given to intrastate oil pipeline rates, varies from state to state. Insofar as effective interstate and intrastate rates are equally applicable to all comparable shippers, we believe that the regulation of oil transportation rates will not affect our operations in any way that is of material difference from those of our competitors who are similarly situated.
Further, interstate and intrastate common carrier oil pipelines must provide service on a non- discriminatory basis. Under this open access standard, common carriers must offer service to all similarly situated shippers requesting service on the same terms and under the same rates. When shipper nominations exceed full capacity, access is governed by prorationing provisions set forth in the pipelines’ published tariffs. Accordingly, we believe that access to oil pipeline transportation services generally will be available to us to the same extent as to our similarly situated competitors.
Transportation and Sales of Natural Gas. The transportation of natural gas in interstate commerce by pipelines, and the sale for resale of natural gas in interstate commerce by pipelines or their affiliates and local distribution companies or their affiliates, are regulated by the FERC under the Natural Gas Act of 1938 (the “NGA”), the Natural Gas Policy Act of 1978 (the “NGPA”), and regulations issued under those statutes. In the past, the federal government has regulated the prices at which natural gas could be sold. While sales by producers of natural gas can currently be made at market prices (subject to anti-manipulation rules, which are discussed below), the United States Congress could reenact price controls in the future. Deregulation of wellhead natural gas sales began with the enactment of the NGPA and culminated in adoption of the Natural Gas Wellhead Decontrol Act which removed all price controls affecting wellhead sales of natural gas (so-called “first sales”) effective January 1, 1993.
FERC regulates interstate natural gas transportation rates, and terms and conditions of service, and this regulation affects the marketing of natural gas that we produce, as well as the revenues we receive for sales of our natural gas. Since 1985, the FERC has endeavored to make natural gas transportation more accessible to natural gas buyers and sellers on an open and non-discriminatory basis. The FERC has stated that open access policies are necessary to improve the competitive structure of the interstate natural gas pipeline industry and to create a regulatory framework that will put natural gas sellers into more direct contractual relations with natural gas buyers by, among other things, unbundling the sale of natural gas from the sale of transportation and storage services. Beginning with Order No. 636 in 1992, FERC adopted mandatory open access policies including mandatory standards of conduct governing communications and information sharing between affiliated natural gas transportation and gas marketing employees. As a result, the interstate pipelines’ traditional role of providing the sale and transportation of natural gas as a single service has been eliminated and replaced by a structure under which pipelines provide transportation and storage service on a non-discriminatory, open access basis to others who buy and sell natural gas. Although the FERC’s open access orders do not directly regulate natural gas producers, they are intended to foster increased competition within all phases of the natural gas industry.
The price at which we sell natural gas is not currently subject to federal rate regulation and, for the most part, is not subject to state regulation. However, with regard to our physical sales of these energy commodities, we are required to observe anti-market manipulation laws and related regulations enforced by the FERC and/or the Commodity Futures Trading Commission. See “—Other Federal Laws and Regulations Affecting Our Industry—Energy Policy Act of 2005.” Should we violate the anti-market manipulation laws and regulations, we could also be subject to related third party damage claims by, among others, sellers, royalty owners and taxing authorities.
| 22 |
FERC has jurisdiction under the NGA over some (but not all) sales for resale of physical gas. FERC has issued blanket certificates under the NGA that pre-authorize various sales for resale in interstate commerce. These blanket certificates preauthorize interstate sales for resale automatically, without the need to apply for the certificate, and without any conditions as to the price, purchaser, volume, term or other economic conditions of the sale. The blanket certificates also pre-authorize abandonment of the sale under the NGA upon expiration of the contract term or termination of the individualized sales arrangement. However, FERC retains NGA jurisdiction over all blanket certificate sales, meaning that FERC has the ability to add prospective terms and conditions to such certificates as future conditions warrant. FERC first exercised this authority in 2003, when in the wake of the market upheavals in California, FERC established a gas marketing “code of conduct” applicable to all blanket certificate sellers. The code of conduct for blanket certificate sellers includes price reporting provisions intended to address the problems that surfaced in gas markets concerning false transaction reports designed to manipulate price indices published by various publications. The code of conduct’s price reporting provision does not require any seller to report transactions to a publisher of natural gas price indices, but requires that any seller who chooses to do so must provide accurate information, not knowingly submit false or misleading information, or omit material information. Blanket certificate holders who violate the certificate conditions (including the code of conduct) are subject to potential suspension or revocation of the certificate. All blanket certificate sellers are subject to the regulatory risk associated with future FERC action to prescribe new conditions for transactions conducted under the certificate.
Pursuant to FERC Order No. 704, some of our operations may be required to annually report to the FERC on May 1 of each year for the previous calendar year. Order No. 704 has its genesis in the Energy Policy Act of 2005, which added section 23 of the NGA. Section 23 of the NGA, among other things, directs FERC “to facilitate price transparency in markets for the sale or transportation of physical natural gas in interstate commerce, having due regard for the public interest, the integrity of those markets, and the protection of consumers.” Order No. 704 requires market participants with reportable physical natural gas purchases or sales equal to or greater than 2.2 trillion British thermal units must comply with the reporting requirements. Reportable physical natural gas purchases include physical natural gas transactions that use an index or that contribute to or may contribute to the formation of a gas index.
The Energy Policy Act of 2005 amended the Natural Gas Act to give FERC authority to assess civil penalties to any person that violates the Natural Gas Act or any rule, regulation, restriction, condition, or order under the Act. Such penalties may be up to $1 million per day per violation. This significantly adds to the risk of FERC-regulated companies that violate the NGA or rules or orders thereunder as well as to non-regulated entities that directly or indirectly manipulate the purchase or sale of FERC-regulated natural gas or the purchase or sale of FERC-regulated transportation services. See “—Other Federal Laws and Regulations Affecting Our Industry—Energy Policy Act of 2005.”
Gathering services, which occur upstream of FERC jurisdictional gas transmission services, are regulated by the states. In addition, intrastate natural gas transportation and facilities are also subject to regulation by state regulatory agencies, and certain transportation services provided by intrastate pipelines are also regulated by the FERC. The basis for regulation of intrastate natural gas transportation and gathering and the degree of regulatory oversight and scrutiny given to intrastate natural gas pipeline and gathering pipeline rates and services varies from state to state. Insofar as such regulation within a particular state will generally affect all intrastate natural gas shippers within the state on a comparable basis, we believe that the regulation of similarly situated intrastate natural gas transportation in any states in which we operate and ship natural gas on an intrastate basis will not affect our operations in any way that is of material difference from those of our competitors. Like the regulation of interstate transportation rates, the regulation of intrastate transportation rates affects the marketing of natural gas that we produce, as well as the revenues we receive for sales of our natural gas.
State Natural Gas Regulation. Various states, including Texas, regulate the drilling for, and the production, gathering and sale of, natural gas, including imposing severance taxes and requirements for obtaining drilling permits. States also regulate the method of developing new fields, the spacing and operation of wells and the prevention of waste of natural gas resources. States may regulate rates of production and may establish maximum daily production allowables from natural gas wells based on market demand or resource conservation, or both. States do not regulate wellhead prices or engage in other similar direct economic regulation, but there can be no assurance that they will not do so in the future. The effect of these regulations may be to limit the amounts of natural gas that may be produced from our wells and to limit the number of wells or locations we can drill.
| 23 |
Other Federal Laws and Regulations Affecting Our Industry
Energy Policy Act of 2005. On August 8, 2005, President Bush signed into law the Energy Policy Act of 2005 (the “EPAct 2005”). The EPAct 2005 is a comprehensive compilation of tax incentives, authorized appropriations for grants and guaranteed loans, and significant changes to the statutory policy that affects all segments of the energy industry. Among other matters, the EPAct 2005 amends the NGA to add an anti manipulation provision which makes it unlawful for any entity to engage in prohibited behavior to be prescribed by the FERC, and furthermore provides the FERC with additional civil penalty authority. The EPAct 2005 provides the FERC with the power to assess civil penalties of up to $1.0 million per day for violations of the NGA and increases the FERC’s civil penalty authority under the NGPA from $5,000 per violation per day to $1.0 million per violation per day. On January 19, 2006, the FERC issued Order No. 670, a rule that implements the anti-manipulation provision of the EPAct 2005 and makes it unlawful for any entity, directly or indirectly, in connection with the purchase or sale of natural gas subject to the jurisdiction of the FERC, or the purchase or sale of transportation services subject to the jurisdiction of the FERC: (1) to use or employ any device, scheme or artifice to defraud; (2) to make any untrue statement of material fact or omit to make any such statement necessary to make the statements made not misleading; or (3) to engage in any act, practice, or course of business that operates as a fraud or deceit upon any person. The anti-manipulation rules and enhanced civil penalty authority reflect an expansion of the FERC’s NGA enforcement authority. Should we fail to comply with all applicable FERC administered statutes, rules, regulations and orders, we could be subject to substantial penalties and fines.
Executive Officers of the Registrant
| Name | Age | Position | ||
| Alan W. Barksdale | 37 | President, Chief Executive Officer and Chairman of the Board of Directors | ||
| Hilda D. Kouvelis | 51 | Chief Accounting Officer and Executive Vice President |
Alan W. Barksdale has been our President, Chief Executive Officer and a director since June 2011 and served as our Interim Acting Chief Financial Officer from June 2011 to August 2011. Mr. Barksdale has also served as President of Black Rock since its inception. Mr. Barksdale has also been the owner and president of StoneStreet and president and manager of StoneStreet Operating Company, LLC (“StoneStreet Operating”), advisory and management services and merchant banking firms, since 2008. Mr. Barksdale has also been the president of AWB Enterprises, Inc., a holding company that owns a percentage of StoneStreet Operating, since November 2011. From January 2004 to April 2010, Mr. Barksdale served as a director in the Capital Markets Group of Crews & Associates, an investment banking firm. From August 2003 to October 2003, Mr. Barksdale served as an investment banker at Stephens Inc., an investment banking firm. From 2002 to 2003, Mr. Barksdale was an investment banker at Crews & Associates. Mr. Barksdale has served as the Non-Executive Chairman of the Board for Cross Border since May 2012. We believe that Mr. Barksdale’s experience in operating, managing, financing and investing in more than 200 wells in Louisiana, New Mexico and Texas, combined with his over ten years of capital markets experience and contacts and relationships, provides our board of directors with management and operational direction.
Hilda D. Kouvelis has served as our Chief Accounting Officer since February 2012 and was appointed Executive Vice President in July 2012. Ms. Kouvelis has more than 25 years of industry accounting and finance experience. From January 2005 until June 2011, she was employed with TransAtlantic Petroleum Ltd., an international oil and natural gas company engaged in the acquisition, exploration, development and production of oil and natural gas, serving as its Chief Financial Officer from January 2007 until April 2011 and as its Vice President from May 2007 to April 2011. She also served as its controller from January 2005 to January 2007. Prior to joining TransAtlantic Petroleum, Ms. Kouvelis served as Controller for Ascent Energy, Inc. from 2001 to 2004 and as Financial Controller for the international operations at the headquarters of PetroFina, S.A. in Brussels, Belgium from 1998 through 2000.
| 24 |
Risks Related to Our Business
Our Credit Agreement contains various covenants that limit our management’s discretion in the operation of our business and can lead to an event of default that may adversely affect our business, financial condition and results of operations.
The operating and financial restrictions and covenants in our Credit Agreement may adversely affect our ability to finance future operations or capital needs or to engage in other business activities. The Credit Agreement contains various covenants that restrict our ability to, among other things, incur liens, incur additional indebtedness, enter into mergers, sell assets, make investments and pay dividends.
The Credit Agreement also requires us to maintain specified financial ratios. We were not in compliance with one or more of the financial ratios in the Credit Agreement at February 28, 2013 and May 31, 2013. In each case, the Lender waived the non-compliance, but the Lender may not waive future defaults. In addition, various risks, uncertainties and events beyond our control could affect our ability to comply with the covenants and financial ratios required by the Credit Agreement and could result in an event of default under the Credit Agreement.
Amounts outstanding under the revolving credit facility provided by the Credit Agreement (as amended, the “Credit Facility”) may be accelerated and become immediately due and payable upon specified events of default of Borrowers (as defined herein), including, among other things, a default in the payment of principal, interest or other amounts due under the Credit Facility, certain loan documents or hydrocarbon hedge agreements, a material inaccuracy of a representation or warranty, a default with regard to certain loan documents which remains unremedied for a period of 30 days following notice, a default in the payment of other indebtedness of the Borrowers of $200,000 or more, bankruptcy or insolvency, certain changes in control, failure of the Lender’s security interest in any portion of the collateral with a value greater than $500,000, cessation of any security document to be in full force and effect, or Alan Barksdale ceasing to be Red Mountain’s Chief Executive Officer or Chairman of Cross Border and not being replaced with an officer acceptable to the Lender within 30 days.
In the event of a default and acceleration of indebtedness under the Credit Facility, our business, financial condition and results of operations may be materially and adversely affected.
Prospects that we decide to drill may not yield oil or natural gas in commercially viable quantities.
Prospects that we decide to drill that do not yield oil or natural gas in commercially productive quantities will adversely affect our financial condition and results of operations. Our prospects are in various stages of evaluation, and may range from a prospect which is ready to drill to a prospect that will require substantial additional seismic data processing and interpretation and other technical analysis. There is no way to predict in advance of drilling and testing whether any particular prospect will yield oil or natural gas in sufficient quantities to recover drilling or completion costs or to be commercially productive. The use of seismic data and other technologies and the study of producing fields in the same area will not enable us to know conclusively prior to drilling whether oil or natural gas will be present or, if present, whether oil or natural gas will be present in commercial quantities. We cannot assure you that the analogies we draw from available data from other wells, more fully explored prospects or producing fields will be applicable to our drilling prospects.
Our producing properties are concentrated in the Permian Basin of Southeast New Mexico and West Texas, making us vulnerable to risks associated with operating in one major geographic area. In addition, we have a large amount of proved reserves attributable to a small number of producing horizons within this area.
Our producing properties are geographically concentrated in the Permian Basin of Southeast New Mexico and West Texas. At July 1, 2014, approximately 92% of our proved reserves were concentrated in this area. Additionally, for the fiscal year ended June 30, 2014, we derived 92% of our revenues from this area. As a result of this concentration, we may be disproportionately exposed to the impact of regional supply and demand factors, delays or interruptions of production from wells in this area caused by governmental regulation, processing or transportation capacity constraints, market limitations, water shortages or other drought related conditions or interruption of the processing or transportation of oil, natural gas or NGLs.
| 25 |
In addition to the geographic concentration of our producing properties described above, at July 1, 2014, approximately (i) 34% of our proved reserves were attributable to the Madera Prospect, (ii) 11% of our proved reserves were attributable to the Tom Tom Prospect. (iii) 17% of our proved reserves were attributable to the Lusk Prospect and (iv) 14% of our proved reserves were attributable to the Turkey Track Prospect. This concentration of assets within a small number of producing horizons exposes us to additional risks, such as changes in field-wide rules and regulations that could cause us to permanently or temporarily shut-in all of our wells within a field.
Approximately 49% of our total estimated proved reserves as of July 1, 2014 were classified as proved undeveloped and may not be ultimately developed or produced.
As of July 1, 2014, approximately 49% of our total estimated proved reserves were undeveloped. Recovery of proved undeveloped reserves requires significant capital expenditures and successful drilling operations. The future drilling of proved undeveloped reserves is highly dependent upon our ability to fund our capital expenditures, which we estimate will be between $15 million and $25 million for fiscal 2015. We cannot be sure that these estimated costs are accurate, and we may be unable to obtain sufficient capital. Further, our drilling efforts may be delayed or unsuccessful, and actual reserves may prove to be less than current reserve estimates, which could have a material adverse effect on our financial condition, future cash flows and results of operations.
Reserve estimates depend on many assumptions that may turn out to be inaccurate.
The calculation of reserves and estimating reserves are inherently imprecise. The accuracy of any reserve estimate is a function of the quality of available data, engineering interpretation and judgment and the assumptions used regarding the quantities of recoverable oil and natural gas and the future prices of oil and natural gas. Petroleum engineers consider many factors and make many assumptions in estimating reserves. Those factors and assumptions include, but are not limited to, the following: historical production from the area compared with production rates from similarly situated producing areas; the effects of governmental regulation; assumptions about future commodity prices, production and taxes; the availability of enhanced recovery techniques; and relationships with landowners, working interest partners, pipeline companies and others.
Any material inaccuracies in our reserve estimates or underlying assumptions could materially affect the quantities and present values of our reserves. The process of estimating oil and natural gas reserves is complex. It requires interpretations of available technical data and various assumptions, including assumptions relating to economic factors. Any significant inaccuracies in these interpretations or assumptions could materially affect the estimated quantities of reserves and amount of PV-10 and standardized measure that we may report. The process of preparing these estimates requires the projection of production rates and timing of development expenditures and analysis of available geological, geophysical, production and engineering data, and the extent, quality and reliability of this data can vary. The process also requires economic assumptions relating to matters such as oil and natural gas prices, drilling and operating expenses, capital expenditures, taxes and availability of funds.
Actual future production, oil and natural gas prices, revenues, taxes, development expenditures, operating expenses and quantities of recoverable oil and natural gas reserves most likely will vary from our estimates. Any significant variance could materially affect the estimated quantities of reserves and amount of PV-10 and standardized measure that we may report. In addition, we may adjust estimates of proved reserves and amount of PV-10 and standardized measure to reflect production history, results of exploration and development, prevailing oil and natural gas prices and other factors, many of which are beyond our control. Moreover, there can be no assurance that our reserves will ultimately be produced or that our proved undeveloped reserves will be developed within the periods anticipated. Any significant variance in the assumptions could materially affect the estimated quantity of our reserves and amount of PV-10 and standardized measure.
Investors should not assume that the PV-10 of our proved reserves is the current market value of our estimated oil and natural gas reserves. PV-10 is based on prices and costs in effect on the date of the estimate. Actual future prices, costs, and the volume of produced reserves may differ materially from those used in the PV-10 estimate.
| 26 |
Drilling for and producing oil and natural gas are speculative activities and involve numerous risks and substantial and uncertain costs that could adversely affect us.
Our future financial condition and results of operations will depend on the success of our acquisition, exploitation, development and production activities. Our oil and natural gas exploration and production activities are subject to numerous risks beyond our control, including the risk that drilling will not result in commercially productive oil or natural gas reservoirs. Our decisions to acquire, explore, develop or otherwise exploit drilling locations or properties will depend in part on the evaluation of data obtained through geophysical and geological analyses, production data and engineering studies, the results of which are often inconclusive or subject to varying interpretations. In addition, our cost of drilling, completing and operating wells is often uncertain before drilling commences. Overruns in budgeted expenditures are common risks that can make a particular project uneconomical. Further, many factors may curtail, delay or cancel our scheduled drilling projects, including the following:
| ● | shortages of or delays in obtaining equipment and qualified personnel; |
| ● | facility or equipment malfunctions; |
| ● | unexpected operational events; |
| ● | pressure or irregularities in geological formations; |
| ● | adverse weather conditions, such as flooding; |
| ● | reductions in oil and natural gas prices; |
| ● | delays imposed by or resulting from compliance with regulatory requirements; |
| ● | proximity to and capacity of transportation facilities; |
| ● | title problems; |
| ● | limitations in the market for oil and natural gas; and |
| ● | costs and availability of drilling rigs, equipment, supplies, personnel and oilfield services. |
Even if drilled, our completed wells may not produce reserves of oil or natural gas that are commercially productive or that meet our earlier estimates of economically recoverable reserves. A productive well may become uneconomic if water or other deleterious substances are encountered, which impair or prevent the production of oil and/or natural gas from the well. Our overall drilling success rate or our drilling success rate for activity within a particular project area may decline. Unsuccessful drilling activities could result in a significant decline in our production and revenues and materially harm our operations and financial condition by reducing our available cash and resources.
| 27 |
A substantial or extended decline in oil and natural gas prices may adversely affect our business, financial condition or results of operations and our ability to meet our capital expenditure obligations and financial commitments.
The price we receive for our oil and natural gas will heavily influence our revenue, profitability, access to capital and future rate of growth. Oil and natural gas are commodities and, therefore, their prices are subject to wide fluctuations in response to relatively minor changes in supply and demand. Historically, the markets for oil and natural gas have been volatile. These markets will likely continue to be volatile in the future. The prices we receive for our production depend on numerous factors beyond our control. These factors include the following:
| ● | worldwide and regional economic conditions impacting the global supply and demand for oil and natural gas; |
| ● | the price and quantity of imports of foreign oil and natural gas; |
| ● | the actions of the Organization of Petroleum Exporting Countries, or OPEC, and other state-controlled oil companies relating to oil and natural gas price and production control; |
| ● | political conditions in or affecting other oil-producing and natural gas-producing countries, including the current conflicts in the Middle East and conditions in South America and Russia; |
| ● | the level of global oil and natural gas inventories; |
| ● | localized supply and demand fundamentals; |
| ● | the availability of refining capacity; |
| ● | price and availability of transportation and pipeline systems with adequate capacity; |
| ● | weather conditions and natural disasters; |
| ● | governmental regulations; |
| ● | speculation as to the future price of oil and natural gas and the speculative trading of oil and natural gas futures contracts; |
| ● | price and availability of competitors’ supplies of oil and natural gas; |
| ● | energy conservation and environmental measures; |
| ● | technological advances affecting energy consumption; |
| ● | the price and availability of alternative fuels and energy sources; and |
| ● | domestic and international drilling activity. |
Declines in oil and natural gas prices may materially adversely affect our financial condition, liquidity, and ability to finance planned capital expenditures and results of operations and may reduce the amount of oil and natural gas that we can produce economically. There can be no assurance that the prices of oil and natural gas will increase in the future. If oil and natural gas prices decline, (i) our net cash flow attributable to current production will decline, (ii) our exploration and development activity may decline as some investments may become uneconomic and are either delayed or eliminated, and (iii) the value of proved developed producing reserves and proved undeveloped reserves could decline. It is impossible to predict future oil and natural gas price movements, and declines in oil and natural gas prices could have a material adverse effect on our liquidity and financial condition.
| 28 |
We cannot control the development of the properties we do not operate, which may adversely affect our production, revenues and results of operations.
We do not operate all of the properties in which we have an interest. As a result, we have limited ability to exercise influence over, and control the risks associated with, the operation of these properties. The success and timing of our drilling and development activities on those properties depend upon a number of factors outside of our control, including:
| ● | the timing and amount of capital expenditures; |
| ● | the operators’ expertise and financial resources; |
| ● | the approval of other participants in drilling wells; and |
| ● | the selection of suitable technology. |
As a result of any of the above or an operator’s failure to act in ways that are in our best interest, our allocated production revenues and results of operations could be adversely affected.
If oil and natural gas prices decrease, we may be required to take write-downs of the carrying values of our oil and natural gas properties.
We will review our proved oil and natural gas properties for impairment whenever events or changes in circumstances indicate that a decline in the recoverability of their carrying value may have occurred. Based on specific market factors and circumstances at the time of prospective impairment reviews, and the continuing evaluation of development plans, production data, economics and other factors, we may be required to write down the carrying value of our oil and natural gas properties, which may result in a decrease in the amount of future permitted indebtedness available. A write-down constitutes a non-cash charge to earnings. We may incur impairment charges in the future, which could have a material adverse effect on our results of operations for the periods in which such charges are taken.
Unless we replace oil and natural gas reserves, our production and cash flows will decline.
Our future success will depend on our ability to find, develop or acquire additional reserves that are commercially productive. If we are unable to replace reserves through drilling or acquisitions, our level of production and cash flows will be adversely affected. In general, production from oil and natural gas properties declines as reserves are depleted, with the rate of decline depending on reservoir characteristics. Our total proved reserves decline as reserves are produced unless we conduct other successful exploration and development activities or acquire properties containing proved reserves, or both. Our ability to make the necessary capital investment to maintain or expand our asset base of oil and natural gas reserves would be impaired to the extent cash flow from operations is reduced and external sources of capital become limited or unavailable. We may not be successful in exploring for, developing or acquiring additional reserves. We also may not be successful in raising funds to acquire, explore or develop additional reserves.
| 29 |
Our operations are subject to hazards inherent in the oil and natural gas industry.
We implement hydraulic fracturing in our operations, a process involving the injection of fluids—usually consisting mostly of water but typically including small amounts of several chemical additives—as well as sand in order to create fractures extending from the wellbore through the rock formation to enable oil or natural gas to move more easily through the rock pores to a production well. Risks inherent to our industry include the potential for significant losses associated with damage to the environment. Equipment design or operational failures, or vehicle operator error can result in explosions and discharges of toxic gases, chemicals and hazardous substances, and, in rare cases, uncontrollable flows of natural gas or well fluids into environmental media, as well as personal injury, loss of life, long-term suspension or cessation of operations and interruption of our business and/or the business or livelihood of third parties, damage to geologic formations, environmental media and natural resources, equipment and/or facilities and property. In addition, we use and generate hazardous substances and wastes in our operations and may become subject to claims relating to the release of such substances into the environment. In addition, some of our current properties could contain currently unknown contamination that could expose us to governmental requirements or claims relating to environmental remediation, personal injury and/or property damage. These conditions could expose us to liability for personal injury, wrongful death, property damage, loss of oil and natural gas production, pollution and other environmental damages and could materially impair our profitability, competitive position or viability. Depending on the frequency and severity of such liabilities or losses, it is possible that our operating costs, insurability and relationships with employees and regulators could be materially impaired.
The unavailability or high cost of drilling rigs, equipment, supplies, personnel and oilfield services could adversely affect our ability to execute exploration plans on a timely basis and within budget.
We are highly dependent upon third-party services. The cost of oilfield services typically fluctuates based on demand for those services. There is no assurance that we will be able to contract for such services on a timely basis or that the cost of such services will remain at a satisfactory or affordable level. Shortages or the high cost of drilling rigs, equipment, supplies or personnel could delay or adversely affect our exploration operations, which could have a material adverse effect on our business, financial condition or results of operations.
Our business and operations may be adversely affected by regulations affecting the oil and natural gas industry.
Our business and operations are subject to and impacted by a wide array of federal, state, and local laws and regulations on the exploration for and development, production, and marketing of oil and natural gas, the operation of oil and natural gas wells, taxation, and environmental and safety matters. Many laws and regulations require drilling permits and govern the spacing of wells, rates of production, prevention of waste and other matters. From time to time, regulatory agencies have imposed price controls and limitations on production in order to conserve supplies of oil and natural gas. In addition, the production, handling, storage, transportation and disposal of oil and natural gas, byproducts thereof and other substances and materials produced or used in connection with oil and natural gas operations are subject to regulation under federal, state and local laws and regulations.
Currently, federal regulations provide that drilling fluids, produced waters and other wastes associated with the exploration, development or production of oil and natural gas are exempt from regulation as “hazardous waste.” From time to time, legislation has been proposed to eliminate or modify this exemption. Should the exemption be modified or eliminated, wastes associated with oil and natural gas exploration and production would be subject to more stringent regulation. On the federal level, operations on our properties may be subject to various federal statutes, including the Natural Gas Act, the Comprehensive Environmental Response, Compensation and Liability Act, the Solid Waste Disposal Act, as amended by the Resource Conservation and Recovery Act, the Clean Air Act, the National Environmental Policy Act, the Endangered Species Act, the Toxic Substances Control Act, the Federal Water Pollution Control Act and the Oil Pollution Act, as well as by regulations promulgated pursuant to these actions.
These regulations may subject us to increased operating costs and potential liability associated with the use and disposal of hazardous materials. These laws and regulations may have a material adverse effect on our financial condition and results of operations as there can be no assurance that we will not be required to make material expenditures in the future. Moreover, the technical requirements of these laws and regulations are becoming increasingly stringent, complex and costly to implement. The high cost of compliance with applicable regulations may cause us to limit or discontinue our operation and development activities.
Changes in regulations and laws relating to the oil and natural gas industry could result in our operations being disrupted or curtailed by government authorities. For example, oil and natural gas exploration and production may become less cost effective and decline as a result of increasingly stringent environmental requirements (including land use policies responsive to environmental concerns and delays or difficulties in obtaining environmental permits). A decline in exploration and production, in turn could have a material adverse effect on our business, financial condition, results of operations and cash flows.
| 30 |
We may have difficulty managing growth in our business, which could adversely affect our financial condition and results of operations.
As a small company, growth in accordance with our business plan, including our fiscal 2015 development plan, if achieved, could place a significant strain on our financial, technical, operational and management resources. As we expand our activities, increase the number of projects we are evaluating or in which we participate, there will be additional demands on our financial, technical, operational and management resources. The failure to continue to upgrade our technical, administrative, operating and financial control systems or the occurrences of unexpected expansion difficulties, including the failure to recruit and retain experienced managers, geologists, engineers and other professionals in the oil and natural gas industry, could have a material adverse effect on our business, financial condition and results of operations and our ability to timely execute our business plan.
Federal and state legislative and regulatory initiatives as well as governmental reviews relating to hydraulic fracturing could result in increased costs and additional operating restrictions or delays as well as adversely affect our level of production.
Hydraulic fracturing is an important and common practice that is used to stimulate production of hydrocarbons from tight formations. The process involves the injection of water, sand and chemicals under pressure into formations to fracture the surrounding rock and stimulate production. The process is typically regulated by state oil and gas commissions. However, the EPA has asserted federal regulatory authority over certain hydraulic fracturing practices. Also, legislation has been introduced, but not enacted, in Congress to provide for federal regulation of hydraulic fracturing and to require disclosure of the chemicals used in the fracturing process. Certain states, including Texas, and municipalities have adopted, or are considering adopting, regulations that have imposed, or that could impose, more stringent permitting, disclosure, disposal and well construction requirements on hydraulic fracturing operations. For example, in June 2011, the State of Texas adopted regulations requiring public disclosure of all the chemicals in fluids used in the hydraulic fracturing process. Also, in May 2013, the Railroad Commission of Texas adopted new requirements for well construction and integrity testing. Local ordinances or other regulations may regulate or prohibit the performance of well drilling in general and hydraulic fracturing in particular. If new laws or regulations that significantly restrict or regulate hydraulic fracturing are adopted, such legal requirements could cause project delays and make it more difficult or costly for us to perform fracturing to stimulate production from a formation. These delays or additional costs could adversely affect the determination of whether a well is commercially viable. Restrictions on hydraulic fracturing could also reduce the amount of oil and natural gas that we are ultimately able to produce in commercial quantities.
In addition, a number of federal agencies are analyzing, or have been requested to review, a variety of environmental issues associated with hydraulic fracturing. On May 19, 2014, the EPA issued an advance notice of proposed rulemaking pursuant to the Toxic Substances Control Act, requesting comments on the information that should be reported or disclosed for hydraulic fracturing chemical substances and mixtures and the mechanism for obtaining this information. On November 3, 2011, the EPA released its Plan to Study the Potential Impacts of Hydraulic Fracturing on Drinking Water Resources. The study will include both analysis of existing data and investigative activities designed to generate future data. The EPA issued a progress report in December 2012, and expects to release a final report for public comment and peer review in 2014. The EPA is also updating chloride water quality criteria for the protection of aquatic life under the Clean Water Act, which criteria are used by states for establishing acceptable discharge limits. Moreover, the EPA announced in October 2011 that it was launching a study regarding wastewater resulting from hydraulic fracturing activities and currently plans to propose standards by 2014 that such wastewater must meet before being transported to a treatment plant. On August 16, 2012, the EPA published final rules under the CAA that, among other things, imposed NSPS for completions of hydraulically fractured natural gas wells, requiring the use of reduced emission completion techniques.
| 31 |
We are required to evaluate our internal control over financial reporting under Section 404 of the Sarbanes-Oxley Act of 2002 and any adverse results from such evaluation could result in a loss of investor confidence in our financial reports and have a material adverse effect on the price of our common stock.
Under Section 404 of the Sarbanes-Oxley Act of 2002, we are required to furnish a report by management on its assessment of our internal control over financial reporting. Such a report must contain, among other matters, an assessment of the effectiveness of our internal control over financial reporting, including a statement as to whether or not our internal control over financial reporting is effective. This assessment must include disclosure of any material weaknesses in our internal control over financial reporting identified by management. In addition, the report must contain a statement that our auditors have issued an attestation report on management’s assessment of such internal control over financial reporting. Our efforts to comply with the requirements of Section 404 may result in increased general and administrative expense and a diversion of management time and attention. We have in the past concluded that our internal controls were not effective, and we may not be able to conclude that we have effective internal controls in the future. Failure to have effective internal controls could lead to a misstatement of our financials. If, as a result of deficiencies in our internal controls, we cannot provide reliable financial reports, our business decision process may be adversely affected, our business and operating results could be harmed, investors could lose confidence in our reported financial information and the price of our common stock could decrease. In addition, failure to maintain effective internal control over financial reporting could result in investigations or sanctions by regulatory authorities.
Our business may suffer if we lose key personnel.
We depend to a large extent on the services of our key personnel, including Alan Barksdale, our President and Chief Executive Officer, and Hilda Kouvelis, our Chief Accounting Officer. These individuals have extensive experience and expertise in evaluating and analyzing producing oil and natural gas properties and drilling prospects, maximizing production from oil and natural gas properties and developing and executing financing strategies. Although we have an employment agreement with Ms. Kouvelis, we do not currently have an employment agreement with Mr. Barksdale and he is free to terminate his employment with us at any time and compete with us immediately thereafter. The loss of any of these individuals could have a material adverse effect on our operations. We do not maintain key-man life insurance with respect to any management personnel. Our success will be dependent on our ability to continue to retain and utilize skilled technical personnel.
Our business is difficult to evaluate because we have a limited operating history.
Prior to June 2010, we had no material operations. After our June 2010 acquisition of oil and natural gas properties in Zapata County and Duval County in the onshore Gulf Coast of Texas, we began to recognize revenue from our operations. Accordingly, we have a very short financial operating history and incurred a net loss attributable to Red Mountain of $9.5 million during the fiscal year ended June 30, 2014. As a result, there is only limited historical financial and operating information available upon which to base your evaluation of our performance.
| 32 |
Properties that we acquire may not produce as projected, and we may be unable to accurately predict reserve potential, identify liabilities associated with the properties or obtain protection from sellers against such liabilities.
As part of our growth strategy, we intend to acquire additional interests in oil and natural gas properties. Any future acquisitions will require an assessment of recoverable reserves, title, future oil and natural gas prices, operating costs, potential environmental hazards and liabilities, potential tax and Employee Retirement Income Security Act liabilities, and other liabilities and other similar factors. Generally, it is not feasible for us to review in detail every individual property involved in an acquisition, and our review efforts are normally focused on the higher-valued properties. Even a detailed review of properties and records may not reveal existing or potential problems, nor will it permit us to become sufficiently familiar with the properties to assess fully their deficiencies and capabilities. We do not inspect every well that we acquire. Potential problems, such as deficiencies in the mechanical integrity of equipment or environmental conditions that may require significant remedial expenditures, are not necessarily observable even when we inspect a well. Any unidentified problems could result in material liabilities and costs that negatively impact our financial condition and results of operations.
Even if we are able to identify problems with an acquisition, the seller may be unwilling or unable to provide effective contractual protection or indemnity against all or part of these problems. Even if a seller agrees to provide indemnity, the indemnity may not be fully enforceable and may be limited by floors and caps on such indemnity. In addition, we may acquire oil and natural gas properties that contain commercially productive reserves which are less than predicted. Any of these factors could have a material adverse effect on our results of operations and reserve growth.
Our failure to successfully identify, complete and integrate future acquisitions of properties or businesses could reduce our earnings and slow our growth.
There is intense competition for acquisition opportunities in our industry. Competition for acquisitions may increase the cost of, or cause us to refrain from, completing acquisitions. Our ability to complete acquisitions is dependent upon, among other things, our ability to obtain debt and equity financing and, in some cases, regulatory approvals. Further, these acquisitions may be in geographic regions in which we do not currently operate, which could result in unforeseen operating difficulties and difficulties in coordinating geographically dispersed operations, personnel and facilities. In addition, if we enter into new geographic markets, we may be subject to additional and unfamiliar legal and regulatory requirements. Compliance with regulatory requirements may impose substantial additional obligations on us and our management, cause us to expend additional time and resources in compliance activities and increase our exposure to penalties or fines for non-compliance with such additional legal requirements. Completed acquisitions could require us to invest further in operational, financial and management information systems and to attract, retain, motivate and effectively manage additional employees. The inability to effectively manage the integration of acquisitions could reduce our focus on subsequent acquisitions and current operations, which, in turn, could negatively impact our earnings and growth. Our financial position and results of operations may fluctuate significantly from period to period, based on whether or not significant acquisitions are completed in particular periods.
We could suffer the loss of all or part of the expenses that we prepay to the operators of our properties.
We may be required prepay to the operators of our properties our contractual share of acreage, geophysical and geological costs and other up-front expenses, and drilling and completion costs, on a well-by-well basis. Once a prepayment is made, the operator is under no requirement to keep such funds segregated from funds received by other working interest owners. As a result of any prepayment, we would become a general unsecured creditor of the operator and, therefore, could suffer the loss of all or part of the amount prepaid in the event that an operator has financial difficulties, liens are placed against the operator’s assets or the operator files for bankruptcy.
If we are unable to find purchasers of our natural gas, it could harm our profitability.
There generally are only a limited number of natural gas transmission companies with existing pipelines in the vicinity of a natural gas well or wells. In the event that producing natural gas properties are not subject to purchase contracts or that any such contracts terminate and other parties do not purchase our natural gas production, there is no assurance that we will be able to enter into purchase contracts with any transmission companies or other purchasers of natural gas and there can be no assurance regarding the price which such purchasers would be willing to pay for such natural gas. There presently exists an oversupply of natural gas in the marketplace, the extent and duration of which is not known. Such oversupply may result in reductions of purchases by principal natural gas pipeline purchasers.
| 33 |
We could lose leases on certain of our properties unless production is established and maintained on units containing the acreage or the leases are extended.
Oil and natural gas leases generally must be drilled before the end of the lease term or the leaseholder will lose the lease and any capital invested therein. In addition, leases may also be lost due to legal issues relating to the ownership of leases. Any delays in drilling or legal issues causing us to lose leases on properties could have a material adverse effect on our results of operations and reserve growth.
At June 30, 2014, of our total undeveloped leasehold acreage, 31.0% is currently not held by production and will expire during fiscal 2015 or fiscal 2016 unless production in paying quantities is established and maintained on units containing these leases during their primary terms or we obtain extensions of the leases. If our leases expire, we will lose our right to develop the related properties.
Our drilling plans for these areas are subject to change based upon various factors, including factors that are beyond our control. Such factors include drilling results, oil and natural gas prices, the availability and cost of capital, drilling and production costs, availability of drilling services and equipment, gathering system and pipeline transportation constraints, and regulatory approvals.
Our operations could be impacted by burdens and encumbrances on title to our properties.
Our leasehold acreage may be subject to existing oil and natural gas leases, liens for current taxes and other burdens, including other mineral encumbrances and restrictions customary in the oil and natural gas industry, that should not materially interfere with the use or otherwise affect the value of such properties. However, we cannot guarantee that we have or will have clear and unobstructed title to leases or other rights assigned to us. We also cannot guarantee that the mineral encumbrances and restrictions mentioned above will not materially interfere with the use of or affect the value of leasehold acreage. Any cloud on the title of the working interests, leases and other rights owned by us could have a material adverse effect on our operations.
Delays in obtaining permits by us for our operations could impact our business.
We are required to obtain permits from one or more governmental agencies in order to perform drilling and completion activities, including hydraulic fracturing. Such permits are typically required by state agencies, but can also be required by federal and local governmental agencies. As with all governmental permitting processes, there is a degree of uncertainty as to whether a permit will be granted, the time it will take for a permit to be issued, and the conditions which may be imposed in connection with the granting of the permit. Hydraulic fracturing activities, which we estimate will represent approximately 80% of our forecasted development costs for fiscal 2015, has been particularly scrutinized. In particular, there is a growing trend of local and municipal initiatives to regulate drilling and completion activities. For example, a number of municipalities in Colorado have initiated bans or moratoriums on certain drilling and completion activities, including hydraulic fracturing. In addition, some municipalities (including Denton, Texas) have adopted temporary moratoriums on gas well permits while longer-term measures are considered. In New York, numerous municipalities have enacted bans or moratoriums on hydraulic fracturing. Furthermore, on June 30, 2014, the New York State Court of Appeals, the highest court in the state, held that municipalities can effectively “zone out” oil and gas operations by passing zoning ordinances that ban oil and gas production activities, including hydraulic fracturing, within municipal boundaries. State governments have also taken actions to regulate hydraulic fracturing activities. New York, for example, has had a moratorium in place since 2008 prohibiting the issuance of oil and gas well permits for hydraulic fracturing. In addition, on May 16, 2012, the Governor of Vermont signed a bill banning hydraulic fracturing in the state of Vermont. To our knowledge, Texas is not currently considering such a measure. If we are unable to obtain the necessary permits for our operations or if we experience delays in obtaining permits, it could have a material adverse effect on our results of operations and profitability.
| 34 |
Market conditions or transportation impediments may hinder access to oil and natural gas markets or delay production.
Market conditions, the unavailability of satisfactory oil and natural gas transportation or the remote location of our drilling operations may restrict our access to oil and natural gas markets or delay production. The availability of a ready market for oil and natural gas production depends on a number of factors, including the demand for and supply of oil and natural gas, the proximity of reserves to pipelines or trucking and terminal facilities and the availability of trucks and other transportation equipment. We may be required to shut-in wells or delay initial production for lack of a viable market or because of inadequacy or unavailability of pipeline or gathering system capacity. When that occurs, we will be unable to realize revenue from those wells until the production can be tied to a gathering system. This can result in considerable delays from the initial discovery of a reservoir to the actual production of the oil and natural gas and realization of revenues.
Operating hazards, natural disasters or other interruptions of our operations could result in potential liabilities, which may not be fully covered by our insurance.
The oil and natural gas business generally, and our operations specifically, are subject to certain operating hazards such as:
| ● | accidents resulting in serious bodily injury and the loss of life or property; |
| ● | liabilities from accidents or damage by our equipment; |
| ● | well blowouts; |
| ● | cratering (catastrophic failure); |
| ● | explosions; |
| ● | uncontrollable flows of oil, natural gas or well fluids; |
| ● | abnormally pressurized formations; |
| ● | fires; |
| ● | reservoir damage; |
| ● | oil spills; |
| ● | pollution and other damage to the environment; and |
| ● | releases of toxic gas. |
In addition, our operations are susceptible to damage from natural disasters such as flooding or tornados, which involve increased risks of personal injury, property damage and marketing interruptions. The occurrence of one of these operating hazards may result in injury, loss of life, suspension of operations, environmental damage and remediation and/or governmental investigations and penalties. The payment of any of these liabilities could reduce, or even eliminate, the funds available for exploration and development, or could result in a loss of our properties. In addition, pollution and environmental risks generally are not fully insurable. If a significant accident or other event occurs and is not fully covered by insurance, it could materially adversely affect our financial condition, results of operations and cash flows.
Our insurance might be inadequate to cover our liabilities. Insurance costs are expected to continue to increase over the next few years, and we may decrease coverage and retain more risk to mitigate future cost increases. If we incur substantial liability, and the damages are not covered by insurance or are in excess of policy limits, then our business, results of operations and financial condition may be materially adversely affected.
| 35 |
Production of oil and natural gas could be materially and adversely affected by natural disasters or severe or unseasonable weather.
Production of oil and natural gas could be materially and adversely affected by natural disasters or severe weather. Weather related risks include earthquakes, hurricanes and other adverse weather and environmental conditions. The occurrence of one or more of these events could result in a decrease in production of oil and natural gas. Repercussions of natural disasters or severe weather conditions may include:
| ● | evacuation of personnel and curtailment of operations; |
| ● | damage to drilling rigs or other facilities, resulting in suspension of operations; |
| ● | inability to deliver materials to worksites; and |
| ● | damage to pipelines and other transportation facilities. |
In addition, our hydraulic fracturing operations require significant quantities of water. Texas recently has experienced drought conditions. Any diminished access to water for use in hydraulic fracturing, whether due to usage restrictions or drought or other weather conditions, could curtail our operations or otherwise result in delays in operations or increased costs.
We may not be able to keep pace with technological developments in our industry.
The oil and natural gas industry is characterized by rapid and significant technological advancements and introductions of new products and services using new technologies. As others use or develop new technologies, we may be placed at a competitive disadvantage or competitive pressures may force us to implement those new technologies at substantial costs. In addition, other oil and natural gas companies may have greater financial, technical and personnel resources that allow them to enjoy technological advantages and may in the future allow them to implement new technologies before we can. We may not be able to respond to these competitive pressures and implement new technologies on a timely basis or at an acceptable cost. If one or more of the technologies we use now or in the future were to become obsolete or if we are unable to use the most advanced commercially available technology, our business, financial condition and results of operations could be materially adversely affected.
Competition in the oil and natural gas industry is intense, and many of our competitors have resources that are greater than ours.
We operate in a highly competitive environment for developing and acquiring properties, marketing oil and natural gas and securing equipment and trained personnel. As a relatively small oil and natural gas company, many of our competitors, major and large independent oil and natural gas companies, possess and employ financial, technical and personnel resources substantially greater than ours. Those companies may be able to develop and acquire more prospects and productive properties than our financial or personnel resources permit. Our ability to acquire additional prospects and discover reserves in the future will depend on our ability to evaluate and select suitable properties and execute our exploration and development activities in a highly competitive environment. Also, there is substantial competition for capital available for investment in the oil and natural gas industry. Larger competitors may be better able to withstand sustained periods of unsuccessful drilling and absorb the burden of changes in laws and regulations more easily than we can, which would adversely affect our competitive position. We may not be able to compete successfully in the future in developing reserves, acquiring prospective oil and natural gas properties and reserves, attracting and retaining highly skilled personnel and raising additional capital.
We may be unable to diversify our operations to avoid any downturn in the oil and natural gas industry.
Because of our limited financial resources, it is unlikely that we will be able to diversify our operations the way companies with greater financial resources are able to do. Our inability to diversify our activities will subject us to economic fluctuations within the oil and natural gas industry and therefore increase the risks associated with our operations as limited to one industry.
| 36 |
Certain federal income tax deductions currently available with respect to oil and natural gas exploration and development may be eliminated as a result of future legislation.
President Obama’s proposed Fiscal Year 2014 Budget includes proposed legislation that would, if enacted into law, make significant changes to United States tax laws, including the elimination or postponement of certain key United States federal income tax incentives currently available to oil and natural gas exploration and production companies. These changes include, but are not limited to, (i) the repeal of the percentage depletion allowance for oil and natural gas properties, (ii) the elimination of the current deduction for intangible drilling and development costs, (iii) the elimination of the deduction for certain domestic production activities and (iv) an extension of the amortization period for certain geological and geophysical expenditures. It is unclear whether these or similar changes will be enacted and, if enacted, how soon any such changes could become effective. The passage of any legislation as a result of these proposals or any other similar changes in United States federal income tax laws could eliminate certain tax deductions that are currently available with respect to oil and natural gas exploration and development, which could have a material adverse effect on our business, financial condition, operations and cash flows.
Our business exposes us to liability and extensive regulation on environmental matters, which could result in substantial expenditures.
Our operations are subject to numerous U.S. federal, state and local laws and regulations relating to the protection of the environment, including those governing the discharge of materials into the water and air, the generation, management and disposal of hazardous substances and wastes and the clean-up of contaminated sites. We could incur material costs, including clean-up costs, fines and civil and criminal sanctions, injunctive relief and third-party claims for property damage and personal injury as a result of violations of, or liabilities under, environmental laws and regulations. Such laws and regulations not only expose us to liability for our own activities, but may also expose us to liability for the conduct of others or for actions by us that were in compliance with all applicable laws at the time those actions were taken.
For example, on February 11, 2013, the DOI Bureau of Land Management (the “BLM”) accepted a remediation plan submitted by Cross Border for its Tom Tom and Tomahawk fields. Pursuant to the remediation plan, Cross Border expects to spend up to $2.1 million during our fiscal 2015 to correct environmental issues on these fields.
In addition, we could incur substantial expenditures complying with environmental laws and regulations, including future environmental laws and regulations which may be more stringent, for example, than the regulation of greenhouse gases (“GHG”) emissions under the federal CAA, or state or regional regulatory programs.
Regulation of GHG emissions by the EPA, or various states in the United States in areas in which we conduct business, could have an adverse effect on our operations and demand for our oil and natural gas production. Moreover, the EPA has shown a general increased scrutiny on the oil and gas industry through its GHG, CAA and Safe Drinking Water Act (“SDWA”) regulations.
In August 2012, the EPA adopted rules that subject oil and natural gas production, processing, transmission, and storage operations to regulation under the New Source Performance Standards, or NSPS, and National Emission Standards for Hazardous Air Pollutants, or NESHAP, programs. The rule includes NSPS standards for completions of hydraulically fractured gas wells and establishes specific new requirements for emissions from compressors, controllers, dehydrators, storage vessels, natural gas processing plants and certain other equipment. The final rule seeks to achieve a 95% reduction in volatile organic compounds (“VOCs”) emitted by requiring the use of reduced emission completions or “green completions” on all hydraulically-fractured wells constructed or refractured after January 1, 2015. These rules may require a number of modifications to our operations, including the installation of new equipment to control emissions from our wells by January 1, 2015. The EPA received numerous requests for reconsideration of these rules from both industry and the environmental community, and court challenges to the rules were also filed. The EPA intends to issue revised rules responsive to some of these requests. On September 23, 2013, the EPA finalized the portion of the rule addressing VOC emissions from storage tanks, including a phase-in period and an alternative emissions limit for older tanks. On July 1, 2014, the EPA announced proposed amendments and clarifications to the NSPS standards. These standards, as well as any future laws and their implementing regulations, may require us to obtain pre-approval for the expansion or modification of existing facilities or the construction of new facilities expected to produce air emissions, impose stringent air permit requirements, or utilize specific equipment or technologies to control emissions. Our failure to comply with these requirements could subject us to monetary penalties, injunctions, conditions or restrictions on operations and, potentially, criminal enforcement actions. These new requirements may result in increased operating and compliance costs, increased regulatory burdens and delays in our operations.
| 37 |
The EPA’s implementation of climate change regulations could result in increased operating costs and reduced demand for our oil and natural gas production.
Although federal legislation regarding the control of emissions of GHGs, for the present, appears unlikely, the EPA has been implementing regulatory measures under existing CAA authority and some of those regulations may affect our operations. GHGs are certain gases, including carbon dioxide, a product of the combustion of natural gas, and methane, a primary component of natural gas, that may be contributing to the warming of the Earth’s atmosphere, resulting in climatic changes. These GHG regulations could require us to incur increased operating costs and could have an adverse effect on demand for our oil and natural gas production.
In May 2010, the EPA adopted its so-called GHG tailoring rule to phase in federal prevention of significant deterioration permit requirements for new sources and modifications, and Title V operating permits for all sources, that have the potential to emit specific quantities of GHGs. On June 23, 2014, the Supreme Court held that stationary sources of GHGs could not become subject to prevention of significant deterioration or Title V permitting merely by reason of their GHG emissions. The Court also ruled that the EPA may require installation of best available control technology for GHG emissions at sources otherwise subject to the PSD and Title V programs. The EPA has announced that it is currently evaluating the decision and awaiting further action by the courts, and that it will provide relevant guidance on GHG permitting requirements. Those permitting requirements, should they become applicable to our operations, could require controls or other measures to reduce GHG emissions from new or modified sources, and we could incur additional costs to satisfy those requirements.
In September 2009, the EPA also issued a final rule requiring the reporting of GHG emissions from specified large GHG emission sources in the U.S., including NGLs fractionators and local natural gas/distribution companies, beginning in 2011 for emissions occurring in 2010. In November 2010, the EPA published a final rule expanding the GHG reporting rule to include onshore oil and natural gas production, processing, transmission, storage and distribution facilities. This rule requires reporting of GHG emissions from such facilities on an annual basis, with reporting beginning in 2012 for emissions occurring in 2011. In addition, in September 2013, the EPA issued a proposed rule that, if finalized, would set NSPS standards for GHG emissions at new fossil-fuel fired power plants. Finally, on June 2, 2014, the EPA issued the so-called Clean Power Plan proposed rules, which propose state-specific rate-based goals to reduce GHG emissions from existing fossil-fuel fired power plants.
Our officers and directors are engaged in other business activities and conflicts of interest may arise in their daily activities which may not be resolved in our favor.
Various actual and potential conflicts of interest may exist between us and our officers and directors. Our officers and directors have other business interests to which they devote their attention, and we expect they will continue to do so, although our officers will devote the majority of their business time to our affairs. As a result, conflicts of interest or potential conflicts of interest may arise from time to time that can be resolved only through the officers or directors exercising such judgment as is consistent with fiduciary duties to their other business interests and to us. These conflicts of interest may not be resolved in our favor.
| 38 |
Compliance with changing regulation of corporate governance and public disclosure will result in additional expenses and pose challenges for our management.
Changing laws, regulations and standards relating to corporate governance and public disclosure, including the Dodd-Frank Act and the rules and regulations promulgated thereunder, the Sarbanes-Oxley Act and SEC regulations, have created uncertainty for public companies and significantly increased the costs and risks associated with accessing the U.S. public markets. Our management team will need to devote significant time and financial resources to comply with both existing and evolving standards for public companies, which will lead to increased general and administrative expenses and a diversion of management time and attention from revenue generating activities to compliance activities.
Our operations and the oil and gas industry may be materially adversely impacted by domestic and foreign acts of terrorism and war.
Terrorist attacks and the threat of terrorist attacks, whether domestic or foreign, as well as the military or other actions taken in response to such actions, may cause instability in the global financial and energy markets. Terrorism, the wars in Iraq and Afghanistan, political instability in Northern Africa and the Middle East and other sustained military campaigns could adversely affect us and the market price of oil and natural gas in unpredictable ways, or the possibility that the infrastructure on which the operators developing mineral properties rely could be a direct target or an indirect casualty of an act of terror. Any of these conditions could have a material adverse effect on our operations.
Risks Related to Our Common Stock
The price of our common stock may fluctuate significantly, which could negatively affect us and holders of our common stock.
The trading price of our common stock may fluctuate significantly in response to a number of factors, many of which are beyond our control. For instance, if our financial results are below the expectations of securities analysts and investors, the market price of our common stock could decrease, perhaps significantly. Other factors that may affect the market price of our common stock include:
| ● | actual or anticipated fluctuations in our quarterly results of operations; |
| ● | liquidity; |
| ● | sales of common stock by our stockholders; |
| ● | changes in oil and natural gas prices; |
| ● | changes in our cash flow from operations or earnings estimates; |
| ● | publication of research reports about us or the oil and natural gas exploration and production industry generally; |
| ● | competition for, among other things, capital, acquisition of reserves, undeveloped land and skilled personnel; |
| ● | increases in market interest rates which may increase our cost of capital; |
| ● | changes in applicable laws or regulations, court rulings and enforcement and legal actions; |
| ● | changes in market valuations of similar companies; |
| ● | adverse market reaction to any indebtedness we incur in the future; |
| ● | additions or departures of key management personnel; |
| ● | actions by our stockholders; |
| ● | commencement of or involvement in litigation; |
| 39 |
| ● | news reports relating to trends, concerns, technological or competitive developments, regulatory changes and other related issues in our industry; |
| ● | speculation in the press or investment community regarding our business; |
| ● | political conditions in oil and natural gas producing regions; |
| ● | general market and economic conditions; and |
| ● | domestic and international economic, legal and regulatory factors unrelated to our performance. |
In addition, the U.S. securities markets have experienced significant price and volume fluctuations. These fluctuations often have been unrelated to the operating performance of companies in these markets. Our common stock is traded on the OTCQB, which is subject to greater volatility than a national exchange or quotation system. This volatility may be caused by a variety of factors, including the lack of readily available price quotations, the absence of consistent administrative supervision of bid and ask quotations, lower trading volume, and market conditions.
Market fluctuations and broad market, economic and industry factors may negatively affect the price of our common stock, regardless of our operating performance. Any volatility or a significant decrease in the market price of our common stock could also negatively affect our ability to make acquisitions using common stock. Further, if we were to be the object of securities class action litigation as a result of volatility in our common stock price or for other reasons, it could result in substantial costs and diversion of our management’s attention and resources, which could negatively affect our financial results.
Offers or availability for sale of a substantial number of shares of our common stock by our shareholders may cause the market price of our common stock to decline.
The ability of our shareholders to sell shares of our common stock in the public market, or upon the expiration of any statutory holding period under Rule 144 of the Securities Act of 1933, as amended (the “Securities Act”), could create a circumstance commonly referred to as an “overhang,” which could cause the market price of our common stock to fall. The existence of an overhang, whether or not sales have occurred or are occurring, could make it more difficult for us to raise additional financing through future sales of equity or equity-related securities at a time and price that we deem reasonable or appropriate. Sales of a substantial number of shares of our common stock, or the perception that sales could occur, could adversely affect the market price of our common stock.
We may raise additional capital in the future through issuances of securities and such additional funding may be dilutive to shareholders or impose operational restrictions.
We may raise additional capital in the future to help fund our operations through sales of shares of our common stock or securities convertible into shares of our common stock, as well as issuances of debt. Such additional financing may be dilutive to our shareholders, and debt financing, if available, may involve restrictive covenants which may limit our operating flexibility, including the ability to pay dividends. If additional capital is raised through the issuances of shares of our common stock or securities convertible into shares of our common stock, the percentage ownership of existing shareholders will be reduced. These shareholders may experience additional dilution in net book value per share and any additional equity securities may have rights, preferences and privileges senior to those of the holders of our common stock.
| 40 |
We do not intend to pay dividends on our common stock in the future.
We have not paid dividends on our common stock and do not intend to pay dividends in the foreseeable future. The payment of cash dividends on our common stock in the future will be dependent on our revenues and earnings, if any, capital requirements and general financial condition and will be entirely within the discretion of our board of directors at such time. It is the present intention of our board of directors to retain earnings, if any, to fund our future growth, and there is no assurance we will ever pay dividends on our common stock in the future. As a result, any gain holders of our common stock will realize will result solely from the appreciation of such common stock.
As of August 31, 2014, we had 254,463 shares of Series A Preferred Stock outstanding, and our certificate of formation permit us to issue additional preferred stock, which could diminish the rights of holders of our common stock and restrict a takeover attempt that you may favor.
As of August 31, 2014, we had 254,463 shares of Series A Preferred Stock outstanding, and our certificate of formation authorizes the issuance of additional shares of preferred stock in one or more series on terms that may be determined at the time of issuance by our board of directors. The Series A Preferred Stock and any additional preferred stock may be issued on terms that are unfavorable to the holders of our common stock, including the grant of superior voting rights, the grant of preferences in favor of preferred shareholders in the payment of dividends and upon our liquidation and the designation of conversion rights that entitle holders of our preferred stock to convert their shares into our common stock on terms that are dilutive to holders of our common stock. The issuance of preferred stock in future offerings may make a takeover or change in control of us more difficult.
Because we are quoted on the OTC Bulletin Board instead of an exchange or national quotation system, our investors may have more difficulty selling their stock or may experience negative volatility in the market price of our stock.
Our common stock is traded on the OTCQB, which is subject to greater volatility than a national exchange or quotation system. This volatility may be caused by a variety of factors, including the lack of readily available price quotations, the absence of consistent administrative supervision of bid and ask quotations, lower trading volume, and market conditions. Investors in our common stock may experience high fluctuations in the market price and volume of the trading market for our securities. These fluctuations, when they occur, may have a negative effect on the market price for our common stock. Accordingly, our stockholders may not be able to realize a fair price from their shares when they determine to sell them or may have to hold them for a substantial period of time until the market for our common stock improves.
Trading in our common stock has been limited, and our stock price could potentially be subject to substantial fluctuations.
Trading in our common stock has been limited. Historically, our common stock price has been affected substantially by a relatively modest volume of transactions and could be again so affected. If our common stock price falls, our stockholders may not be able to sell their shares when desired or at desirable prices.
Risks Related to Our Series A Preferred Stock
The Series A Preferred Stock does not have an established trading market, which may negatively affect its market value and the ability to transfer or sell shares.
The Series A Preferred Stock does not have an established trading market, which may limit the ability of holders of Series A Preferred Stock to sell shares. An active trading market for the shares may not develop or, even if it develops, may not last, in which case the trading price of the shares could be adversely affected and the ability to transfer shares will be limited. The market value of the Series A Preferred Stock could be adversely affected by various factors. The trading price of the Series A Preferred Stock may depend on many factors, including, without limitation:
| 41 |
| ● | market liquidity; |
| ● | prevailing interest rates; |
| ● | the market for similar securities; |
| ● | general economic conditions; |
| ● | the sale of additional shares of Series A Preferred Stock; |
| ● | our financial condition, performance and prospects; and |
| ● | our issuance of additional preferred equity or debt securities. |
For example, higher market interest rates could cause the market price of the Series A Preferred Stock to decrease. The foregoing factors, among others, may affect the trading price of the Series A Preferred Stock, as well as limit the trading market and restrict ability of investors in the Series A Preferred Stock to transfer their shares.
We could be prevented from paying cash dividends on the Series A Preferred Stock.
Although dividends on the Series A Preferred Stock are cumulative and arrearages will accrue until paid, holders of shares of Series A Preferred Stock will only receive cash dividends on the Series A Preferred Stock when, as and if declared by our board of directors, and if we have funds legally available for the payment of dividends under Texas law and such payment is not restricted or prohibited by law or the terms of any of our agreements, including the documents governing our indebtedness. Pursuant to the terms of our Credit Agreement, we may pay cash dividends on the Series A Preferred Stock so long as we are not otherwise in default under the Credit Agreement and payment of such cash dividends would not cause us to be in default under the Credit Agreement. Future debt, contractual covenants or arrangements that we may enter into in the future may also restrict or prevent future dividend payments.
The payment of any future dividends will be determined by our board of directors in light of conditions then existing, including earnings, financial condition, capital requirements, restrictions or prohibitions in current or future agreements, business conditions and other factors affecting us as a whole. Accordingly, there is no guarantee that we will be able to pay any dividends on the Series A Preferred Stock.
The Series A Preferred Stock has not been rated and our payment obligations with respect to the shares of Series A Preferred Stock will be effectively subordinated to all of our existing and future debt.
The Series A Preferred Stock has not been rated by any nationally recognized statistical rating organization. In addition, with respect to dividend rights and rights upon our liquidation, winding-up or dissolution, the Series A Preferred Stock will be subordinated to all of our existing and future debt and all future capital stock designated as senior to the Series A Preferred Stock. As of August 31, 2014, our total outstanding indebtedness was approximately $31.6 million, consisting of $26.8 million under the Credit Facility and $4.8 million of Series A Preferred Stock, net of a discount of $1.6 million.
We may incur additional indebtedness in the future to finance acquisitions or the development of properties, and the terms of the Series A Preferred Stock do not require us to obtain the approval of the holders of the Series A Preferred Stock prior to incurring additional indebtedness. As a result, our existing and future indebtedness may be subject to restrictive covenants or other provisions that may prevent or otherwise limit our ability to make dividend or liquidation payments on the Series A Preferred Stock. Upon our liquidation, our obligations to our creditors would rank senior to the Series A Preferred Stock and would be required to be paid before any payments could be made to holders of the Series A Preferred Stock.
| 42 |
Holders of Series A Preferred Stock have extremely limited voting rights.
Except as expressly stated in our certificate of formation governing the Series A Preferred Stock, holders of Series A Preferred Stock do not have any relative, participating, optional or other special voting rights and powers and their approval is not required for the taking of any corporate action. For example, the approval of holders of Series A Preferred Stock is not required to elect members to our board of directors (except for a limited right to elect two directors upon a dividend default, or one director upon a listing default), or for any merger or consolidation in which we are involved or sale of all or substantially all of our assets, except to the extent that such transaction materially adversely changes the express powers, preferences, rights or privileges of the holders of Series A Preferred Stock. None of the provisions relating to the Series A Preferred Stock contains any provisions affording the holders of the Series A Preferred Stock protection in the event of a highly leveraged or other transaction, including a merger or the sale, lease or conveyance of all or substantially all of our assets or business, that might adversely affect the holders of the Series A Preferred Stock, so long as the terms and rights of the holders of Series A Preferred Stock are not materially and adversely changed.
The issuance in future offerings of preferred stock may adversely affect the value of the Series A Preferred Stock.
Our certificate of formation currently authorizes the issuance of up to 100,000,000 shares of preferred stock in one or more series on terms that may be determined at the time of issuance by our board of directors, including up to 1,200,000 shares of Series A Preferred Stock. We may offer for sale additional shares of Series A Preferred Stock in the future. Accordingly, we may issue additional shares of Series A Preferred Stock and/or stock that ranks on parity with the Series A Preferred Stock (“Parity Stock”) or, with the consent of the holders of the Series A Preferred Stock, stock that ranks senior to the Series A Preferred Stock (“Senior Stock”). The issuance of Series A Preferred Stock, Parity Stock or Senior Stock would dilute the interests of the holders of Series A Preferred Stock, and any issuance of Senior Stock could affect our ability to pay dividends on, redeem or pay the liquidation preference on the Series A Preferred Stock.
Holders of the Series A Preferred Stock may be unable to use the dividends-received deduction and may not be eligible for the preferential tax rates applicable to “qualified dividend income.”
We may not have sufficient current or accumulated earnings and profits during future fiscal years for the distributions on the Series A Preferred Stock (or our common stock should we determine to pay distributions on it) to qualify as dividends for U.S. federal income tax purposes. If the distributions fail to qualify as dividends, U.S. holders that are corporations would be unable to use the dividends-received deduction and may not be eligible for the preferential tax rates applicable to “qualified dividend income.” If any distributions on the Series A Preferred Stock with respect to any fiscal year are not eligible for the dividends-received deduction or preferential tax rates applicable to “qualified dividend income” because of insufficient current or accumulated earnings and profits, it is possible that a U.S holder that is a corporation could recognize capital gain income upon receipt of a distribution or upon disposition of shares of Series A Preferred Stock. Because of the way corporations are taxed on capital gain income, such capital gains, absent offsetting capital losses, would be effectively taxed to a corporate owner of our preferred stock (or common stock) at then current ordinary income tax rates.
The Series A Preferred Stock is not convertible.
The Series A Preferred Stock accrues dividends at a fixed rate and is not convertible into shares of our common stock. Accordingly, the market value of the Series A Preferred Stock may depend on dividend and interest rates for other preferred stock, debt securities and other investment alternatives, and our actual and perceived ability to pay dividends on, and in the event of dissolution satisfy the liquidation preference with respect to, the Series A Preferred Stock. Moreover, the mandatory redemption of Series A Preferred Stock on July 15, 2018 or upon a “change of control,” or our optional right to redeem the Series A Preferred Stock on or after July 15, 2014, could impose a ceiling on its value.
| 43 |
We may not be able to comply with the financial covenant for the Series A Preferred Stock.
We are required to have an asset coverage ratio of 2.0 or greater as of the date of any issuance of additional debt (excluding borrowings under the Credit Facility or any revolving credit facility in replacement thereof) Series A Preferred Stock, Senior Stock or Parity Stock (the “Financial Covenant”). If we fail to comply with the Financial Covenant, the dividend rate will be increased to 12.0%. Future debt arrangements that we enter into in the future may inhibit our ability to comply with the Financial Covenant, as well as also restrict or limit our ability to make future dividend payments.
We may not be able to comply with the listing covenant for the Series A Preferred Stock, and listing on a national securities exchange does not guarantee a market for the Series A Preferred Stock.
Our certificate of formation requires us to list the Series A Preferred Stock on a National Exchange prior to April 30, 2014. Because we are currently in default pursuant to this listing requirement, the dividend rate specified was increased by one-half percent on May 1, 2014 and shall be increased by one-half percent per quarter, up to a rate not to exceed 12.0%, until such listing occurs at which time the Dividend Rate shall revert to the rate of 10.0%.
Additionally, once the Series A Preferred Stock is listed on a national securities exchange, we are required to maintain the listing of the Series A Preferred Stock on such exchange. In the event we fail to maintain such listing for 180 consecutive days, then, until such failure is cured, (i) the dividend rate will increase, and (ii) the holders of Series A Preferred Stock have the right to elect one director to our board of directors. A national securities exchange could delist the Series A Preferred Stock, which may result in a listing default.
Item 1B. Unresolved Staff Comments
Not applicable.
| 44 |
Our Properties
Currently, our oil and natural gas properties are concentrated in the Permian Basin, the onshore Gulf Coast of Texas, Southwest New Mexico and Kansas. The Permian Basin covers an area approximately 250 miles wide and 300 miles long in West Texas and Southeast New Mexico. The Permian Basin is one of the most prolific onshore oil and natural gas producing regions in the United States. It is characterized by an extensive production history, mature infrastructure, long reserve life and hydrocarbon potential in multiple producing formations. Our primary operations in the onshore Gulf Coast are in conventional fields that produce primarily from the Wilcox formation in Zapata and Duval Counties of Texas.
The following map shows the locations of our core properties as of June 30, 2014.

| 45 |
Summary of Geographic Areas of Operations
The following table sets forth summary estimated reserve information attributable to our principal geographic areas of operations as of July 1, 2014. The following table includes reserves represented by the 17% of Cross Border not owned by us.
| PDP | PDNP | PUD | Total | |||||||||||||||||||||||||||||||||||||||||||||
| Oil (MBbls) | Natural Gas (MMcf) | Natural Gas Liquids (MBbls) | Oil (MBbls) | Natural Gas (MMcf) | Natural Gas Liquids (MBbls) | Oil (MBbls) | Natural Gas (MMcf) | Natural Gas Liquids (MBbls) | Oil (MBbls) | Natural Gas (MMcf) | Natural Gas Liquids (MBbls) | |||||||||||||||||||||||||||||||||||||
| Permian Basin | 1,037 | 2,530 | 142 | 132 | 221 | — | 1,534 | 2,261 | 114 | 2,703 | 5,012 | 256 | ||||||||||||||||||||||||||||||||||||
| Onshore Gulf Coast | 2 | 1,808 | — | — | 129 | — | — | — | — | 2 | 1,937 | — | ||||||||||||||||||||||||||||||||||||
| Total | 1,039 | 4,338 | 142 | 132 | 350 | — | 1,534 | 2,261 | 114 | 2,705 | 6,949 | 256 | ||||||||||||||||||||||||||||||||||||
Permian Basin
The following description of our properties in the Permian Basin is presented as of June 30, 2014.
Madera Prospect. The Madera Prospect consists of 2,545 gross (1,132 net) acres in Lea County, New Mexico. Our interests in the Madera Prospect include 7 gross (4.1 net) producing wells with an average working interest of 58.4% and an average net revenue interest of 44.4%. RMR Operating is the operator of the Madera Prospect.
We drilled and completed our first horizontal well, the Madera 24 Federal 2H, on the Madera Prospect in January 2012. The well was drilled to a vertical depth of 9,028 feet and a lateral length of 4,620 feet in the Brushy Canyon reservoir and initially produced at a rate of 1,043 Boe/d, comprised of 86% oil. As of June 30, 2014, the Madera 24 Federal 2H well has produced over 169 MBoe, of which 70% was oil. A portion of the other working interest owners elected not to participate in the drilling and completion of the Madera 24 Federal 2H well. As a result, we increased our ownership to an 81.5% working interest (60.6% net revenue interest). Our ownership will revert to a 23.3% working interest (17.5% net revenue interest) when we recover an amount equal to 300% of the costs to drill and complete the well plus operating costs through that date.
We commenced drilling our second horizontal well in the Madera Prospect, the Madera 24 Federal 3H, on February 6, 2013. This well is located just to the west of the Madera 24 Federal 2H well. We are the operator of the well and own a 32.5% working interest and 24.3% net revenue interest. The initial production rate from the Madera 24 Federal 3H well was 1,491 Boe/d, of which 81% was oil. The well has a total measured depth of 13,570 feet, including a true vertical depth of 9,062 feet and a lateral length of 4,508 feet. Our third horizontal Brushy Canyon well at the Madera Prospect, Madera 19 Federal 4H, was completed in March 2014 and had an initial production rate of 740 Boe/d, of which 86% was oil. The well was drilled to a measured depth of 15,843 feet, including a lateral length of 6,813 feet. We are the operator of the well and have an approximately 84% working interest and 63% net revenue interest. Another long lateral length well, the Madera 25 Federal 2H, in which we have an approximately 30% working interest and 23% net revenue interest, was drilled to measured depth of 15,827 feet, and is awaiting completion. The Madera Prospect contains an additional 5 proved undeveloped well locations (2.5 net) that target the Brushy Canyon reservoir.
As of July 1, 2014, the Madera Prospect had estimated proved reserves of 1,409 MBoe, of which 951 MBoe were proved undeveloped, and had net daily average production for the three months ended June 30, 2014 of 445 Boe/d, of which 62% was oil.
| 46 |
Tom Tom Area. We own oil and natural gas interests in approximately 8,300 gross (6,200 net) acres in the Tom Tom and Tomahawk fields in Chaves and Roosevelt Counties, New Mexico through our ownership of Cross Border. Cross Border is the operator of these leases. The target formation in the area is the San Andres reservoir, which is productive across the trend with the Cato field to the west and the Chaveroo field to the east. There are 66 gross wells (52.3 net) in the acreage, with an average working interest of 79% and an average net revenue interest of 66%. As of July 1, 2014, the Tom Tom area had estimated proved reserves of 448 MBoe, of which 74 MBoe were proved developed non-producing and 290 MBoe were proved undeveloped. The area had net daily average production sold for the three months ended June 30, 2014 of 20 Boe/d, all of which was oil production.
On February 11, 2013, the BLM accepted a remediation plan submitted by Cross Border for its Tom Tom and Tomahawk fields. Pursuant to the remediation plan, Cross Border expects to spend up to $2.1 million during our fiscal 2015 to correct environmental issues on these fields.
We commenced a workover program in May 2013 to re-enter existing wells, clean out the wellbores, open unperforated pay, increase pump efficiency and return inactive wells to production. There are 28 gross wells (21.6 net) that we have identified with additional behind pipe pay, and an additional 21 gross wells (17.3 net) on which we have identified opportunities for acid and fracture stimulation.
Turkey Track Area. We own interests in 2,508 gross acres (687 net) in the Lusk Area in Eddy County, New Mexico through Cross Border. The Turkey Track Area consists of 19 gross (2.2 net) producing wells with an average working interest of 11.7% and an average net revenue interest of 9.4%. The primary targets in the Turkey Track Prospect are the 1st and 2nd Bone Spring reservoirs. The operator of the Turkey Track Prospect is Mewbourne Oil Company. As of July 1, 2014, the Turkey Track Prospect had estimated proved reserves of 579 MBoe, of which 303 MBoe were proved undeveloped, and net daily average production sold for the three months ended June 30, 2014 of 164 Boe/d, of which 64% was oil.
Lusk Area. We own interests in 1,921 gross acres (632 net) in the Lusk Area in Lea County, New Mexico through Cross Border. The Lusk Area consists of 18 gross (4.9 net) producing wells with an average working interest of 27% and an average net revenue interest of 21%, The primary targets in the Lusk Prospect are the 2nd Bone Spring and Delaware reservoirs. We operate one vertical well (0.3 net) that is producing from the Delaware reservoir. The other operators in the Lusk Prospect are Occidental Petroleum Corporation, Apache Corp., Cimarex Energy Co., and Concho Resources Inc. As of July 1, 2014, the Lusk Prospect had estimated proved reserves of 702 MBoe, of which 146 MBoe were proved undeveloped, and net daily average production sold for the three months ended June 30, 2014 of 239 Boe/d, of which 69% was oil.
Cowden Lease. We own oil and natural gas interests in 760 gross (740 net) acres plus 48 acres of surface property in the Cowden Lease in Ector County, Texas. There are 19 gross (18.0 net) producing wells on the Cowden Lease with an average working interest of 94.7% and an average net revenue interest of 72.7%. The Cowden Lease is held by production. RMR Operating is the operator of the Cowden Lease. The Cowden Lease is located between the Harper and Donnelly San Andres fields on the Central Basin Platform and produces from the Grayburg and San Andres formations. It has three gross and net proved undeveloped drilling locations. As of July 1, 2014, the Cowden Lease had estimated proved reserves of 109 MBoe, of which 76 MBoe were proved undeveloped, and had net daily average production sold for the three months ended June 30, 2014 of 10 Boe/d, all of which was oil production.
Shafter Lake Lease. We own oil and natural gas interests in 322 gross (187 net) acres within the Shafter Lake San Andres field in Andrews County, Texas. The Shafter Lake Lease is horizontally severed at 4,520 feet and is held by production. We own all rights from the surface of the land to approximately 4,520 feet below the surface of the land. RMR Operating is the operator of the Shafter Lake Lease. There are three proved undeveloped locations on these leases (1.7 net wells) which target the Grayburg and San Andres formations. We hold a 58.1% working interest and a 39.7% net revenue interest in this acreage. As of July 1, 2014, our Shafter Lake Lease had estimated proved reserves of 81 MBoe, all of which were proved undeveloped, and no production.
Pawnee Prospect. We own oil and natural gas interests in 1,255 gross and net acres in the Pawnee Prospect in Lea County, New Mexico. The six gross and net producing wells have an average working interest of 100% and an average net revenue interest of 75%. This acreage targets the Tansill, Yates and Delaware formations. RMR Operating is the operator of the Pawnee Prospect. We drilled two wells on the Pawnee Prospect during fiscal 2012. We completed the Big Brave State #1 well in January 2012 and the Good Chief State #1 well in December 2011, with initial production rates of 52 Boe/d and 28 Boe/d, respectively, consisting of substantially all oil production. Both wells are marginal producers, and we are considering converting the wells to salt water disposal wells. As of July 1, 2014, the Pawnee Prospect had estimated proved reserves of 7 MBoe and had net daily average production sold for the three months ended June 30, 2014 of 4 Boe/d, all of which was oil production.
| 47 |
Other Non-Operated. Cross Border owns non-operated, oil and natural gas interests in 316,638 gross (18,131 net) acres in Chaves, Eddy, Lea and Roosevelt Counties, New Mexico of the Permian Basin. Current development of this acreage is focused on prospective Bone Spring acreage located in the heart of the 1st and 2nd Bone Spring play, which encompasses approximately 4,390 square miles across both New Mexico and Texas. Other non-operated development targets include the Queen, Grayburg, San Andres, Yeso, and Abo reservoirs. Our operating partners, which include Apache Corp., Mewbourne Oil Company, Concho Resources Inc., COG Operating LLC, LRE Operating, LLC, XTO Energy Inc., Cimarex Energy Co., and Occidental Petroleum Corporation, have significant footprints within these plays. As of July 1, 2014, this non-operated acreage had estimated proved reserves of 458 MBoe, of which 179 were proved undeveloped, and had net daily average production sold for the three months ended June 30, 2014 of 125 Boe/d, 61% of which was oil.
Onshore Gulf Coast
The following is a description of our properties in the onshore Gulf Coast as of June 30, 2014.
Villarreal Prospect. The Villarreal Prospect covers 1,099 gross (154 net) acres in Zapata County, Texas. We own an average working interest of 14.1% and an average net revenue interest of 10.6% in this acreage. We have 13 gross (1.8 net) wells on the prospect producing from the Wilcox formation. In August 2012, ConocoPhillips Company, the operator, drilled and completed the Villarreal #2 well, which had an initial production rate of 2,567 Mcf/d (428 Boe/d). As of July 1, 2014, the Villarreal Prospect had estimated proved reserves of 245 MBoe and had net daily average production sold for the three months ended June 30, 2014 of 134 Boe/d, substantially all of which was natural gas.
Frost Bank and Peal Ranch Prospects. The Frost Bank and Peal Ranch Prospects cover 2,926 gross (879 net) acres in Duval County, Texas. There are 17 gross (5.4 net) wells producing from the Wilcox formation. We own an average working interest of 32% and an average net revenue interest of 24% in this acreage. RMR Operating is the operator of the Frost Bank Prospect. The Peal Ranch Prospect is operated by White Oak Operating Company LLC. As of July 1, 2014, the Frost Bank and Peal Ranch Prospects have estimated proved reserves of 71 MBoe, of which 22 MBoe were proved developed non-producing, and had net daily average production sold for the three months ended June 30, 2014 of 19 Boe/d, 97% of which was natural gas.
Kansas
As of June 30, 2014, we owned oil and natural gas interests in 9,868 gross and net acres in central Kansas. There are multiple target horizons in this prospect including the Arbuckle and Lansing Kansas City. We own a 100% working interest and a net revenue interest ranging from 83% to 88%. RMR Operating is the operator.
We acquired seismic over this acreage in fiscal 2014, and subsequently commenced an initial seven well drilling program in July 2014. As of July 1, 2014, the Kansas acreage had no proved reserves or production.
New Mexico Non-Permian Minerals
Cross Border owns 536,526 gross (268,193 net) mineral acres in Hidalgo, Grant, Sierra, and Socorro Counties, New Mexico. This mineral ownership carries no drilling commitments or leasehold obligations. As of July 1, 2014, this acreage had no proved reserves or production.
Title to Properties
As is customary in the oil and natural gas industry, we generally conduct a preliminary title examination prior to the acquisition of properties or leasehold interests. Prior to commencement of operations on such acreage, a thorough title examination will usually be conducted and any significant defects will be remedied before proceeding with operations. We believe the title to our properties is good, defensible and customary with practices in the oil and natural gas industry, subject to such exceptions that we believe do not materially detract from the use of such properties. With respect to our properties of which we are not the record owner, we rely instead on contracts with the owner or operator of the property or assignment of leases, pursuant to which, among other things, we generally have the right to have our interest placed on record.
| 48 |
Our properties are generally subject to royalty, overriding royalty and other interests customary in the industry, liens incident to agreements, current taxes and other burdens, minor encumbrances, easements and restrictions. We do not believe any of these burdens will materially interfere with our use of these properties. Substantially all of the properties of the Company, Black Rock, RMR Operating and Cross Border are pledged as collateral under the Credit Agreement.
Summary of Oil and Natural Gas Reserves
Proved Reserves
The following table sets forth our estimated proved reserves.
| As of July 1, 2014 | ||||||||||||||||
| Reserves | ||||||||||||||||
| Estimated proved reserve data (1)(2) | Oil (MBbls) | Natural Gas (MMcf) | Natural Gas Liquids (MBbls) | Total (MBoe) | ||||||||||||
| Proved developed producing reserves | 1,039 | 4,338 | 142 | 1,903 | ||||||||||||
| Proved developed non-producing reserves | 132 | 350 | — | 191 | ||||||||||||
| Proved undeveloped reserves | 1,534 | 2,261 | 114 | 2,025 | ||||||||||||
| Total proved reserves | 2,705 | 6,649 | 256 | 4,119 | ||||||||||||
| (1) | Prices used are based on the 12-month unweighted arithmetic average of the first-day-of-the-month price for each month in the period July 2013 through June 2014. For oil volumes, the average NYMEX spot price is $100.27 per Bbl. For natural gas volumes, the average Henry Hub spot price is $4.10 per MMBtu. Prices are adjusted for basis differentials, hydrocarbon quality, and transportation, processing, and gathering fees resulting in an oil price of $92.83 per barrel, natural gas liquids price of $31.36 per barrel, and natural gas price of $5.06 per Mcf. The adjusted oil, NGL and natural gas prices are held constant throughout the lives of the properties. |
| (2) | Proved reserves include 100% of the reserve quantities attributable to Cross Border. |
The following table sets forth our estimated PV-10 and standardized measure of discounted net cash flows as of July 1, 2014.
| (in thousands) | As of July 1, 2014 | |||
| PV-10 (1) | $ | 89,598 | ||
| Standardized measure | $ | 79,000 | ||
| (1) | PV-10 is a non-GAAP financial measure as defined by the SEC. The closest GAAP measure to PV-10 is the standardized measure of discounted net cash flows. The standardized measure differs from PV-10 because standardized measure includes the effect of future income taxes. We believe that the presentation of PV-10 is relevant and useful to our investors as supplemental disclosure to the standardized measure, or after-tax amount, because it presents the discounted future net cash flows attributable to our proved reserves before taking into account future corporate income taxes and our current tax structure. The following table provides a reconciliation of our PV-10 to our standardized measure: |
| 49 |
| (in thousands) | As of July 1, 2014 | |||
| PV-10 | $ | 89,598 | ||
| Future income taxes | (23,306 | ) | ||
| Discount of future income taxes at 10% per annum | 12,708 | |||
| Standardized measure | $ | 79,000 | ||
Estimates of proved developed and undeveloped reserves are inherently imprecise and are continually subject to revision based on production history, results of additional exploration and development, price changes and other factors. See “—Qualifications of Technical Persons and Internal Controls Over Reserves Estimation Process.”
At July 1, 2014, our estimated proved reserves were 4.1 MMBoe, consisting of 66% oil, which is an increase of 16% compared to our proved reserves of 3.5 MMBoe at May 31, 2013. During fiscal 2014, we added estimated proved reserves of 0.9 MMBoe through field extensions primarily at our Madera and Turkey Track Prospects, which were offset by production of 0.4 MMBoe and minimal upward revisions in previous estimates.
Proved Undeveloped Reserves
At July 1, 2014, our estimated proved undeveloped reserves were 2.0 MMBoe, consisting of 76% oil, as compared to 1.6 MMBoe at May 31, 2013, consisting of 79% oil. During fiscal 2014, we added estimated proved undeveloped reserves of 0.5 MMBoe through field extensions primarily at our Madera and Turkey Track Prospects. We converted 0.1 MMBoe of proved undeveloped reserves to proved developed producing reserves, due to new wells drilled at our Turkey Track Prospect and our other non-operated properties. During the fiscal year ended June 30, 2014, we spent $1.0 million relating to the development of our proved undeveloped reserves. As of July 1, 2014, estimated future development costs relating to the development of our proved undeveloped reserves was $40.5 million. All of our currently identified proved undeveloped reserves are scheduled to be drilled by December 31, 2018.
Qualifications of Technical Persons and Internal Controls Over Reserves Estimation Process
Our July 1, 2014 reserve report was prepared by Cawley, Gillespie & Associates, Inc. (“CG&A”), independent petroleum engineers. CG&A estimated 100% of our proved reserves in accordance with petroleum engineering and evaluation principles set forth in the Standards Pertaining to the Estimating and Auditing of Oil and Gas Reserve Information promulgated by the Society of Petroleum Engineers (“SPE Standards”) and definitions and guidelines established by the SEC.
The technical persons responsible for preparing the reserves estimates presented herein meet the requirements regarding qualifications, independence, objectivity and confidentiality set forth in the SPE Standards.
The principal person at CG&A who prepared the reserve report is Mr. Zane Meekins. Mr. Meekins has been a practicing consulting petroleum engineer at CG&A since 1989. Mr. Meekins is a Registered Professional Engineer in the State of Texas (License No. 71055) and has over 27 years of practical experience in petroleum engineering, with over 25 years of experience in the estimation and evaluation of reserves. He graduated from Texas A&M University in 1987 with a Bachelor of Science degree in Petroleum Engineering. Mr. Meekins meets or exceeds the requirements regarding qualifications, independence, objectivity and confidentiality set forth in the SPE Standards. He is proficient in judiciously applying industry standard practices to engineering and geoscience evaluations as well as applying SEC and other industry reserve definitions and guidelines.
We have an internal staff of geoscience professionals who work closely with our independent petroleum engineers to ensure the integrity, accuracy and timeliness of data furnished to them in their reserves estimation process. Our technical team consults regularly with representatives of CG&A. We review with them our properties and discuss methods and assumptions used in their preparation of our reserves estimates. While we have no formal committee specifically designated to review reserves reporting and the reserves estimation process, a copy of the reserve report is reviewed with representatives of CG&A and our internal technical staff before we disseminate any of the information. Additionally, our senior management reviews and approves the reserve report and any internally estimated significant changes to our proved reserves on an annual basis.
| 50 |
Estimates of oil and natural gas reserves are projections based on a process involving an independent third party engineering firm’s collection of all required geologic, geophysical, engineering and economic data, and such firm’s complete external preparation of all required estimates and are forward-looking in nature. These reports rely upon various assumptions, including assumptions required by the SEC, such as constant oil and natural gas prices, operating expenses and future capital costs. The process also requires assumptions relating to availability of funds and timing of capital expenditures for development of our proved undeveloped reserves. These reports should not be construed as the current market value of our reserves. The process of estimating oil and natural gas reserves is also dependent on geological, engineering and economic data for each reservoir. Because of the uncertainties inherent in the interpretation of this data, we cannot be certain that the reserves will ultimately be realized. Our actual results could differ materially. See “Note 18 – Supplemental Information Relating to Oil and Natural Gas Producing Activities (Unaudited)” to our audited consolidated financial statements for additional information regarding our oil and natural gas reserves.
Under SEC rules, proved reserves are those quantities of oil and natural gas, which, by analysis of geoscience and engineering data, can be estimated with reasonable certainty to be economically producible from a given date forward, from known reservoirs, and under existing economic conditions, operating methods, and government regulations. The term “reasonable certainty” implies a high degree of confidence that the quantities of oil and/or natural gas actually recovered will equal or exceed the estimate. To achieve reasonable certainty, CG&A employs technologies consistent with the standards established by the Society of Petroleum Engineers. The technologies and economic data used in the estimation of our proved reserves include, but are not limited to, well logs, geologic maps and available downhole and production data, seismic data and well test data.
Summary of Oil and Natural Gas Properties and Projects
Production, Price and Cost History
The following table sets forth summary information regarding our oil and natural gas sales, net production sold, average sales prices and production costs and expenses for the fiscal years ended June 30, 2014 and May 31, 2013 and 2012.
| Fiscal Year Ended, | ||||||||||||
| June 30, 2014 | May 31, 2013 (1) | May 31, 2012 | ||||||||||
| Net Production sold | ||||||||||||
| Oil (Bbl) | 185,522 | 83,143 | 37,004 | |||||||||
| Natural gas (Mcf) | 882,606 | 645,609 | 795,659 | |||||||||
| Natural gas liquids (Bbl) | 27,208 | 7,427 | 5,438 | |||||||||
| Total (Boe) | 359,901 | 198,172 | 175,052 | |||||||||
| Total (Boe/d) (2) | 986 | 543 | 480 | |||||||||
| Average sales prices | ||||||||||||
| Oil ($/Bbl) | $ | 93.47 | $ | 81.26 | $ | 93.97 | ||||||
| Natural gas ($/Mcf) | 4.68 | 3.40 | 3.58 | |||||||||
| Natural gas liquids ($/Bbl) | 32.78 | 29.62 | 46.45 | |||||||||
| Total average price ($/Boe) | $ | 62.51 | $ | 46.28 | $ | 37.58 | ||||||
| Costs and expenses (per Boe) | ||||||||||||
| Exploration expense | $ | 3.31 | $ | 4.28 | $ | 1.51 | ||||||
| Production taxes | 5.88 | 2.70 | 2.31 | |||||||||
| Lease operating expenses | 8.96 | 8.93 | 5.39 | |||||||||
| Natural gas transportation and marketing expenses | 0.51 | 0.52 | 0.97 | |||||||||
| Depreciation, depletion, amortization and impairment | 26.94 | 22.78 | 29.42 | |||||||||
| Accretion of discount on asset retirement obligation | 0.74 | 0.76 | 0.24 | |||||||||
| General and administrative expense | 23.85 | 39.47 | 35.22 | |||||||||
| (1) | The results for the fiscal year ended May 31, 2013 only include results and estimated production from Cross Border since February 1, 2013. |
| (2) | Boe/d is calculated based on actual calendar days during the period. |
| 51 |
The following table provides a summary of our net production sold for oil and gas fields containing 15% or more of our total proved reserves as of June 30, 2014:
| Fiscal Year Ended, | ||||||||||||
| June 30, 2014 |
May 31, 2013 (1) |
May 31, 2012 |
||||||||||
| Madera Prospect | ||||||||||||
| Oil (Bbl) | 53,273 | 33,266 | 32,424 | |||||||||
| Natural gas (Mcf) | 180,815 | 51,151 | 88,499 | |||||||||
| Natural gas liquids (Bbl) | 14,531 | 4,357 | 4,484 | |||||||||
| Total (Boe) | 97,940 | 46,148 | 51,657 | |||||||||
| Total (Boe/d) | 268 | 126 | 141 | |||||||||
| Lusk Prospect | ||||||||||||
| Oil (Bbl) | 64,208 | 27,180 | — | |||||||||
| Natural gas (Mcf) | 107,855 | 38,425 | — | |||||||||
| Natural gas liquids (Bbl) | 10,358 | 1,226 | — | |||||||||
| Total (Boe) | 92,542 | 34,810 | — | |||||||||
| Total (Boe/d) | 254 | 95 | — | |||||||||
| (1) | The results for the fiscal year ended May 31, 2013 only include production from Cross Border since February 1, 2013. |
Developed and Undeveloped Acreage
The following table presents our total gross and net developed and undeveloped acreage by region as of June 30, 2014:
| Developed Acres | Undeveloped Acres | |||||||||||||||
| Gross (1) | Net (2) | Gross (1) | Net (2) | |||||||||||||
| Permian Basin (3) | 10,757 | 5,028 | 325,574 | 25,898 | ||||||||||||
| Onshore Gulf Coast | 4,776 | 1,405 | — | — | ||||||||||||
| New Mexico Non-Permian (4) | — | — | 536,526 | 268,193 | ||||||||||||
| Kansas | — | — | 9,868 | 9,868 | ||||||||||||
| Total | 15,533 | 6,433 | 871,968 | 303,959 | ||||||||||||
| (1) | “Gross” means the total number of acres in which we have a working interest. |
| (2) | “Net” means the sum of the fractional working interests that we own in gross acres. |
| (3) | Undeveloped acreage includes mineral ownership. |
| (4) | Reflects mineral ownership. |
The primary terms of our oil and natural gas leases expire at various dates. Much of our developed acreage is held by production, which means that these leases are active as long as we produce oil or natural gas from the acreage or comply with certain lease terms. Upon ceasing production, these leases will expire. The following table summarizes by year our gross and net undeveloped leasehold acreage scheduled to expire in the next five fiscal years.
| 52 |
| Undeveloped Leasehold Acres | % of Total Undeveloped Leasehold Acres | |||||||||||
| As of June 30, | Gross (1) | Net (2) | Net (2) | |||||||||
| 2015 | 8,768 | 8,648 | 24.0 | % | ||||||||
| 2016 | 2,513 | 2,513 | 7.0 | % | ||||||||
| 2017 | 332 | 332 | 0.9 | % | ||||||||
| 2018 | — | — | — | |||||||||
| 2019 | — | — | — | |||||||||
| (1) | “Gross” means the total number of acres in which we have a working interest. |
| (2) | “Net” means the sum of the fractional working interests that we own in gross acres. |
Productive Wells
The following table presents the total gross and net productive wells by area and by oil or natural gas completion as of June 30, 2014. Cross Border owns royalty interests in 16 gross wells (average of 0.43 net), which have been excluded from these well counts.
| Oil Wells | Natural Gas Wells | |||||||||||||||
| Gross (1) | Net (2) | Gross (1) | Net (2) | |||||||||||||
| Permian Basin | 179 | 88.2 | 41 | 6.0 | ||||||||||||
| Onshore Gulf Coast | — | — | 37 | 12.8 | ||||||||||||
| Total | 179 | 88.2 | 78 | 18.8 | ||||||||||||
| (1) | “Gross” means the total number of wells in which we have a working interest. |
| (2) | “Net” means the sum of the fractional working interests that we own in gross wells. |
Drilling Activity
At June 30, 2014, we had two gross wells (0.43 net) awaiting completion, one in the Madera Prospect and one in the Turkey Track Prospect.
The following table summarizes the number of net productive and dry development wells and net productive and dry exploratory wells we drilled during the periods indicated and refers to the number of wells completed during the period, regardless of when drilling was initiated.
| Development Wells | Exploratory Wells | |||||||||||||||
| Fiscal Year Ended, | Productive | Dry | Productive | Dry | ||||||||||||
| June 30, 2014 | 1.95 | — | — | — | ||||||||||||
| May 31, 2013 | 1.56 | — | — | — | ||||||||||||
| May 31, 2012 | — | — | 2.96 | — | ||||||||||||
Bloodworth Litigation
On May 4, 2011, Clifton M. (Marty) Bloodworth filed a lawsuit in the State District Court of Midland County, Texas, against Doral West Corp. d/b/a Doral Energy Corp. and Everett Willard Gray II. Mr. Bloodworth alleges that Mr. Gray, as CEO of Cross Border, made false representations which induced Mr. Bloodworth to enter into an employment contract that was subsequently breached by Cross Border. The claims that Mr. Bloodworth has alleged are: breach of his employment agreement with Doral West Corp, common law fraud, civil conspiracy breach of fiduciary duty, and violation of the Texas Deceptive Trade Practices-Consumer Protection Act. Mr. Bloodworth is seeking damages of approximately $280,000. Mr. Gray and Cross Border deny that Mr. Bloodworth’s claims have any merit.
| 53 |
KeyBanc Litigation
Cross Border was previously party to an engagement letter, dated February 7, 2012 (the “Engagement Letter”) with KeyBanc Capital Markets Inc. (“KeyBanc”) pursuant to which KeyBanc was to act as exclusive financial advisor to Cross Border’s board of directors in connection with a possible “Transaction” (as defined in the Engagement Letter). The Engagement Letter was formally terminated by Cross Border on August 21, 2012. The Engagement Letter provided that KeyBanc would be entitled to a fee upon consummation of a Transaction within a certain period of time following termination of the Engagement Letter. On May 16, 2013, KeyBanc delivered an invoice to Cross Border representing a fee and out-of-pocket expenses purportedly owed by Cross Border to KeyBanc as a result of the consummation of a purported Transaction that KeyBanc asserts had been consummated within the required time period. Cross Border disputed that any Transaction was consummated and that KeyBanc was entitled to any fees or out-of-pocket expenses. Cross Border filed a complaint seeking (i) a declaration that it was not liable to KeyBanc for any amounts in connection with the Engagement Letter, (ii) attorneys’ fees, and (iii) costs of suit. KeyBanc filed a counterclaim seeking (i) compensatory damages, (ii) interest, (iii) expenses and court costs, and (iv) reasonable and necessary attorneys’ fees. The matter was originally filed in the 44th Judicial District Court for the State of Texas, Dallas County on June 7, 2013 but was subsequently removed to the United States District Court for the Northern District of Texas, Dallas Division. On August 26, 2014, Cross Border entered into a settlement agreement with KeyBanc, settling a lawsuit between the parties. In connection with the settlement, Cross Border agreed to pay KeyBanc $900,000 in three equal installments on or before August 28, 2014, October 31, 2014 and December 31, 2014, and the parties agreed to mutual releases of liability related to the Engagement Letter.
SEC Subpoena
On August 27, 2014, the Company received a subpoena from the Securities and Exchange Commission (the “SEC”). The subpoena seeks the production of various documents and information by the Company during the period January 1, 2011 through the date of production. The accompanying letter from the SEC states that the subpoena “should not be construed as an indication by the Commission or its staff that any violation of law has occurred, nor as a reflection upon any person, entity or security.” At this point, the Company is unable to predict the duration, scope or result of the SEC’s investigation. The Company intends to cooperate fully with the SEC.
The Company’s application to list its shares of common stock and Series A Preferred Stock on the NASDAQ Capital Market has been put on hold during the pendency of the SEC subpoena.
Item 4. Mine Safety Disclosures
Not applicable.
| 54 |
Item 5. Market for Registrant’s Common Equity, Related Stockholder Matters and Issuer Purchases of Equity Securities
Market Price for Our Common Stock
Our common stock is quoted on the OTCQB under the symbol “RDMP.” The following table sets forth the range of high and low bid prices for our common stock for the periods indicated. The over-the-counter market quotations reflect inter-dealer prices, without retail mark-up, mark-down or commission and may not necessarily represent actual transactions.
| Price Range | ||||||||
| High | Low | |||||||
| Fiscal Year 2014: | ||||||||
| Fourth Quarter | $ | 5.30 | $ | 3.50 | ||||
| Third Quarter | $ | 5.80 | $ | 4.12 | ||||
| Second Quarter | $ | 6.50 | $ | 4.00 | ||||
| First Quarter (includes the one month ended June 30, 2013) | $ | 8.20 | $ | 4.80 | ||||
| Fiscal Year 2013: | ||||||||
| Fourth Quarter | $ | 9.10 | $ | 6.00 | ||||
| Third Quarter | $ | 9.50 | $ | 7.60 | ||||
| Second Quarter | $ | 13.00 | $ | 7.60 | ||||
| First Quarter | $ | 15.20 | $ | 11.60 | ||||
Holders
As of September 22, 2014, we had 14,857,488 shares of common stock outstanding, and our outstanding shares of common stock were held by approximately 75 stockholder accounts of record, including nominee holders such as banks and brokerage firms who hold shares for beneficial owners.
Dividends
We have not paid any cash dividends on our common stock to date. The payment of any dividends is within the discretion of our board of directors. It is the present intention of our board of directors to retain all earnings for use in the business operations and, accordingly, our board of directors does not anticipate declaring any dividends on our common stock in the foreseeable future.
Common Stock Performance Graph
The following performance graph compares the cumulative total shareholder return on our shares of common stock with the Russell 2000 Index and the S&P 600 Oil & Gas Exploration & Production Index. Each index assumes an investment of $100 on June 22, 2011, the date of the Company’s reverse merger, and is calculated assuming quarterly reinvestment of dividends and quarterly weighting by market capitalization.
| 55 |
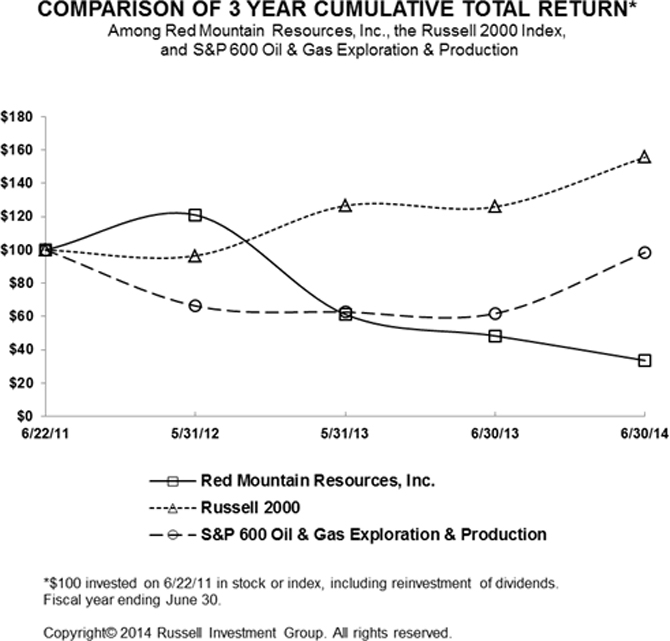
| 56 |
Item 6. Selected Financial Data
The following information should be read in conjunction with our consolidated financial statements and notes thereto contained in Item 8. Consolidated Financial Statements and Supplementary Data of this Annual Report on Form 10-K (in thousands, except for per unit and per share data).
| Fiscal Year Ended | One Month Ended | |||||||||||||||||||
| June 30, 2014 | May 31, 2013 | May 31, 2012 | May 31, 2011 | June 30, 2013 | ||||||||||||||||
| Consolidated Statement of Operations Data: | ||||||||||||||||||||
| Revenue | $ | 22,498 | $ | 8,982 | $ | 6,325 | $ | 3,712 | $ | 1,716 | ||||||||||
| Income (loss) from operations | (2,763 | ) | (6,763 | ) | (6,814 | ) | 2,131 | (342 | ) | |||||||||||
| Net income (loss) attributable to noncontrolling interest | 513 | 682 | — | — | (40 | ) | ||||||||||||||
| Net income (loss) attributable to Red Mountain Resources, Inc. | (9,508 | ) | (12,202 | ) | (12,432 | ) | 2,802 | (631 | ) | |||||||||||
| Basic and diluted net income (loss) per common share | (0.70 | ) | (1.20 | ) | (1.69 | ) | 1.00 | (0.05 | ) | |||||||||||
| Basic and diluted weighted average common shares outstanding | 13,626 | 10,133 | 7,378 | 2,700 | 12,691 | |||||||||||||||
| Certain Operations Data | ||||||||||||||||||||
| Net production sold: | ||||||||||||||||||||
| Oil (Bbl) | 185,522 | 83,143 | 37,004 | — | 18,303 | |||||||||||||||
| Natural gas (Mcf) | 882,606 | 645,609 | 795,659 | 900,332 | 71,844 | |||||||||||||||
| Natural gas liquids (Bbl) | 27,278 | 7,427 | 5,438 | 1,177 | 1,454 | |||||||||||||||
| Total (Boe) | 359,901 | 198,172 | 175,052 | 151,233 | 31,731 | |||||||||||||||
| Average sales prices | ||||||||||||||||||||
| Oil ($/Bbl) | $ | 93.47 | $ | 81.26 | $ | 93.97 | $ | — | $ | 78.67 | ||||||||||
| Natural gas ($/Mcf) | 4.68 | 3.40 | 3.58 | 4.12 | 2.95 | |||||||||||||||
| Natural gas liquids ($/Bbl) | 32.78 | 29.62 | 46.45 | 40.28 | 29.53 | |||||||||||||||
| Total average price ($/Boe) | 62.51 | 46.28 | 37.58 | 24.54 | 54.08 | |||||||||||||||
| Costs and expenses (per Boe) | ||||||||||||||||||||
| Production taxes | $ | 5.88 | $ | 2.70 | $ | 2.31 | $ | 1.06 | $ | 4.05 | ||||||||||
| Lease operating expenses | 8.96 | 8.93 | 5.39 | 1.09 | 19.99 | |||||||||||||||
| Natural gas transportation and marketing expenses | 0.51 | 0.52 | 0.97 | 1.56 | 1.59 | |||||||||||||||
| At June 30, | At May 31, | At June 30, | ||||||||||||||||||
| 2014 | 2013 | 2012 | 2011 | 2013 | ||||||||||||||||
| Consolidated Balance Sheet Data: | ||||||||||||||||||||
| Oil and natural gas properties, net | $ | 83,170 | $ | 75,132 | $ | 23,680 | $ | 8,815 | $ | 75,235 | ||||||||||
| Total assets | 97,226 | 89,230 | 35,052 | 13,616 | 89,022 | |||||||||||||||
| Line of credit | 26,800 | 19,800 | 1,787 | 2,003 | 19,800 | |||||||||||||||
| Long term liabilities | 37,541 | 25,538 | 2,462 | 240 | 25,579 | |||||||||||||||
| Total liabilities | 47,366 | 42,273 | 14,732 | 11,263 | 42,735 | |||||||||||||||
| Stockholders’ equity | 49,860 | 46,957 | 20,320 | 2,353 | 46,287 | |||||||||||||||
| 57 |
Item 7. Management’s Discussion and Analysis of Financial Condition and Results of Operations
Overview
We are a Dallas-based growth-oriented energy company engaged in the acquisition, development and exploration of oil and natural gas properties in established basins with demonstrable prolific producing zones. Currently, We are a Dallas-based growth-oriented energy company engaged in the acquisition, development and exploration of oil and natural gas properties in established basins with demonstrable prolific producing zones. Currently, we have established acreage positions and production in the Permian Basin of West Texas and Southeast New Mexico and the onshore Gulf Coast of Texas. Additionally, we have an established and growing acreage position in Kansas.
We plan to grow production and reserves by acquiring, exploring and developing an inventory of long-life, low risk drilling opportunities with attractive rates of return. Our focus is on opportunities in and around producing oil and natural gas properties where we can enhance production and reserves through application of newer drilling and completion techniques, infill drilling targeting untapped but known productive hydrocarbon strata, and enhanced oil recovery applications.
As of June 30, 2014, we owned interests in 887,501 gross (310,392 net) mineral and lease acres in New Mexico, Texas and Kansas, of which 336,331 gross (30,926 net) acres are within the Permian Basin. We have successfully leased 9,868 net acres in Kansas located on the Central Kansas Uplift, and we also owned interests in over 1,405 net acres located on the Villarreal, Frost Bank, Resendez, Peal Ranch and La Duquesa Prospects in the onshore Gulf Coast of Texas.
On January 28, 2013, we closed the acquisition of 5,091,210 shares of common stock of Cross Border, bringing our total ownership to approximately 78% of the outstanding Cross Border common stock. Prior to the consolidation, we owned 47% of Cross Border’s outstanding common stock, and the investment was accounted for under the equity method of accounting. Subsequent to this transaction, we account for Cross Border as a consolidated subsidiary. As of June 30, 2014, we owned of record 14,327,767 shares of Cross Border common stock, representing 83% of Cross Border’s outstanding common stock.
Planned Development Program
For fiscal year 2015, we plan to spend between $15 million and $25 million for continued drilling, completion, workovers and recompletions on our properties, including Cross Border’s non-operated acreage. The following sets forth our planned fiscal 2015 development program (dollars in millions):
| Target | Gross Wells | Net Wells | Cost | Percentage of Total Program | ||||||||||||
| Operated Properties: | ||||||||||||||||
| Madera (Brushy Canyon) | 3.0 | 1.4 | $ | 3.7 | 18 | % | ||||||||||
| Tom Tom (San Andres) | 31.0 | 26.2 | 9.4 | 47 | ||||||||||||
| Cowden (Grayburg, San Andres) | 2.0 | 2.0 | 0.8 | 4 | ||||||||||||
| Shafter Lake (San Andres) | 1.0 | 1.0 | 0.4 | 2 | ||||||||||||
| Kansas (Arbuckle, Lansing Kansas City) | 7.0 | 7.0 | 2.2 | 11 | ||||||||||||
| Non-Operated Properties: | ||||||||||||||||
| Turkey Track (1st and 2nd Bone Spring) | 3.0 | 0.3 | 1.4 | 7 | ||||||||||||
| Perla Verde (3rd Bone Spring) | 4.0 | 0.2 | 1.5 | 7 | ||||||||||||
| Red Lakes (Yeso) | 4.0 | 0.5 | 0.7 | 4 | ||||||||||||
| Total | 55.0 | 38.6 | $ | 20.1 | 100 | % | ||||||||||
| 58 |
Assuming successful and timely implementation of our current and planned development program, we expect cash on hand, borrowings under our Credit Facility and cash flow from operations will be sufficient to fund our fiscal 2015 development program. If not, we will either curtail our development program or seek other funding sources. Our planned fiscal 2015 development program is subject to change.
Critical Accounting Policies and Estimates
Our discussion and analysis of our financial condition and results of operations is based upon our consolidated financial statements, which have been prepared in accordance with U.S. generally accepted accounting principles (“GAAP”). The preparation of these consolidated financial statements requires management to make estimates and judgments that affect the reported amounts of assets, liabilities, revenue and expenses, and related disclosures. Our significant accounting policies are described in “Note 3 — Summary of Significant Accounting Policies” to our consolidated financial statements included elsewhere in this Annual Report on Form 10-K. We have identified below policies that are of particular importance to the portrayal of our financial position and results of operations and which require the application of significant judgment by management. These estimates are based on historical experience, information received from third parties, and on various other assumptions that are believed to be reasonable under the circumstances, the results of which form the basis for making judgments about the carrying values of assets and liabilities that are not readily apparent from other sources. Actual results may differ from these estimates under different assumptions or conditions.
We believe the following critical accounting policies affect the significant judgments and estimates used in the preparation of our consolidated financial statements.
Debentures - Held to Maturity
Our investments in non-performing debentures were initially recorded at cost which we believe was fair value. Management estimated cash flows expected to be collected considering the contractual terms of the loans, the nature and estimated fair value of collateral, and other factors it deemed appropriate. The estimated fair value of the loans at acquisition was significantly less than the contractual amounts due under the terms of the loan agreements.
Since, at the acquisition date, we expected to collect less than the contractual amounts due under the terms of the loans based, at least in part, on the assessment of the credit quality of the borrower, the loans are accounted for in accordance with Accounting Standards Codification (“ASC”) Topic 310-30, Loans and Debt Securities Acquired with Deteriorated Credit Quality (“ASC 310-30”). The difference between the contractually required payments on the loans as of the acquisition date and the total cash flows expected to be collected, or non-accretable difference, is not recognized.
Debentures are classified as non-accrual when management is unable to reasonably estimate the timing or amount of cash flows expected to be collected from the debentures or has serious doubts about further collectability of principal or interest. As of June 30, 2014 and 2013, all of our debentures were on non-accrual status since the borrower remains under the supervision of the bankruptcy court.
We periodically re-evaluate cash flows expected to be collected for each debenture based upon all available information as of the measurement date. Subsequent increases in cash flows expected to be collected are recognized prospectively through an adjustment to the debenture’s yield over its remaining life, which may result in a reclassification from non-accretable difference to accretable yield. Subsequent decreases in cash flows expected to be collected are evaluated to determine whether a provision for loan loss should be established. If decreases in expected cash flows result in a decrease in the estimated fair value of the debenture below its amortized cost, the debenture is deemed to be impaired and we will record a provision for impairment to write the debenture down to its estimated fair value.
Our investments in non-performing debentures are classified as held to maturity because we have the intent and ability to hold them until maturity.
| 59 |
Oil and Gas Properties
Effective June 1, 2011, we follow the successful efforts method of accounting for our oil and natural gas producing activities. The change in accounting principle has been applied retroactively to prior periods. Costs to acquire mineral interests in oil and natural gas properties and to drill and equip development wells and related asset retirement costs are capitalized. Costs to drill exploratory wells are capitalized pending determination of whether the wells have proved reserves. If we determine that the wells do not have proved reserves, the costs are charged to expense. There were no exploratory wells capitalized pending determination of whether the wells have proved reserves at July 1, 2014, June 1, 2013 or 2012. Geological and geophysical costs, including seismic studies and costs of carrying and retaining unproved properties, are charged to expense as incurred. We capitalize interest on expenditures for significant exploration and development projects that last more than six months while activities are in progress to bring the assets to their intended use. Through June 30, 2014, we had capitalized no interest costs because our exploration and development projects generally lasted less than six months. Costs incurred to maintain wells and related equipment are charged to expense as incurred.
On the sale or retirement of a complete unit of a proved property, the cost and related accumulated depreciation, depletion and amortization are eliminated from the property accounts, and the resultant gain or loss is recognized. On the retirement or sale of a partial unit of proved property, the cost is charged to accumulated depreciation, depletion and amortization, with a resulting gain or loss recognized in income.
Capitalized amounts attributable to proved oil and natural gas properties are depleted by the unit-of-production method over proved reserves using the unit conversion ratio of six Mcf of natural gas to one Boe. The ratio of six Mcf of natural gas to one Boe is based on energy equivalency, rather than price equivalency. Given current price differentials, the price for a Boe for natural gas differs significantly from the price for a barrel of oil.
It is common for operators of oil and natural gas properties to request that joint interest owners pay for large expenditures, typically for drilling new wells, in advance of the work commencing. This right to call for cash advances is typically found in the operating agreement that joint interest owners in a property adopt. We record these advance payments in prepaid and other current assets in a property account and release this account when the actual expenditure is later billed to us by the operator.
On the sale of an entire interest in an unproved property for cash or cash equivalents, gain or loss on the sale is recognized, taking into consideration the amount of any recorded impairment if the property had been assessed individually. If a partial interest in an unproved property is sold, the amount received is treated as a reduction of the cost of the interest retained.
Impairment of Long-Lived Assets
We evaluate our long-lived assets for potential impairment in their carrying values whenever events or changes in circumstances indicate such impairment may have occurred. Oil and natural gas properties are evaluated for potential impairment by field. Other properties are evaluated for impairment on a specific asset basis or in groups of similar assets, as applicable. An impairment on proved properties is recognized when the estimated undiscounted future net cash flows of an asset are less than its carrying value. If an impairment occurs, the carrying value of the impaired asset is reduced to its estimated fair value, which is generally estimated using a discounted cash flow approach. If the results of an assessment indicate that the properties are impaired, the amount of the impairment is added to the capitalized costs to be amortized.
Unproved oil and natural gas properties do not have producing properties. As reserves are proved through the successful completion of exploratory wells, the cost is transferred to proved properties. The cost of the remaining unproved basis is periodically evaluated by management to assess whether the value of a property has diminished. To do this assessment, management considers estimated potential reserves and future net revenues from an independent expert, our history in exploring the area, our future drilling plans per our capital drilling program prepared by our reservoir engineers and operations management and other factors associated with the area. Impairment is taken on the unproved property cost if it is determined that the costs are not likely to be recoverable. The valuation is subjective and requires management to make estimates and assumptions which, with the passage of time, may prove to be materially different from actual results.
| 60 |
Business Combinations
We account for business combinations under the acquisition method of accounting in accordance with ASC Topic 805, Business Combinations. The acquisition method requires that assets acquired and liabilities assumed including contingencies be recorded at their fair values as of the acquisition date. We have finalized the determination of the fair values of the assets acquired and liabilities assumed for Cross Border.
Noncontrolling Interests
We account for the noncontrolling interest in Cross Border in accordance with ASC Topic 810, Consolidation (“ASC 810”). ASC 810 establishes accounting and reporting standards for ownership interests in subsidiaries held by parties other than the parent, the amount of consolidated net income attributable to the parent and to the noncontrolling interest, changes in a parent’s ownership interest and the valuation of retained noncontrolling equity investments when a subsidiary is deconsolidated. ASC 810 also establishes reporting requirements that provide sufficient disclosures that clearly identify and distinguish between the interest of the parent and the interests of the noncontrolling owner. In addition, this guidance provides for increases and decreases in our controlling financial interests in consolidated subsidiaries to be reported in equity similar to treasury stock transactions.
Recent Accounting Pronouncements
In May 2014, the FASB issued Accounting Standards Update No. 2014-09, Revenue from Contracts with Customers (“ASU 2014-09”), which supersedes nearly all existing revenue recognition guidance under U.S. GAAP. The core principle of ASU 2014-09 is to recognize revenues when promised goods or services are transferred to customers in an amount that reflects the consideration to which an entity expects to be entitled for those goods or services. ASU 2014-09 defines a five step process to achieve this core principle and, in doing so, more judgment and estimates may be required within the revenue recognition process than are required under existing U.S. GAAP. The standard is effective for annual periods beginning after December 15, 2016, and interim periods therein, using either of the following transition methods: (i) a full retrospective approach reflecting the application of the standard in each prior reporting period with the option to elect certain practical expedients, or (ii) a retrospective approach with the cumulative effect of initially adopting ASU 2014-09 recognized at the date of adoption (which includes additional footnote disclosures). The Company is currently evaluating the impact of the adoption of ASU 2014-09 on its consolidated financial statements and have not yet determined the method by which it will adopt the standard in 2017.
Transition Period
On July 17, 2013, our board of directors approved a change in our fiscal year end from May 31 to June 30, effective as of June 30, 2013. In the following “Results of Operations,” we compare the results of the fiscal year ended June 30, 2014 with the previously reported fiscal year ended May 31, 2013. Financial information for the fiscal year ended June 30, 2013 has not been included for the following reasons: (i) the fiscal year ended May 31, 2013 provide a meaningful comparison for the fiscal year ended June 30, 2014; (ii) there are no significant factors, seasonal or other, that would impact the comparability of information if the results for the fiscal year ended June 30, 2013 were presented in lieu of results for the fiscal year ended May 31, 2013; and (iii) it was not practicable or cost justified to prepare this information.
| 61 |
Results of Operations
The following table sets forth summary information regarding our oil and natural gas sales, net production sold, average sales prices and production costs and expenses for the fiscal years ended June 30, 2014 and May 31, 2013 and 2012 and the one month ended June 30, 2013.
| Fiscal Year Ended | Fiscal Year Ended | One Month Ended | ||||||||||||||
| June 30, 2014 |
May 31, 2013 (1) | May 31, 2012 | June 30, 2013 | |||||||||||||
| Revenue | ||||||||||||||||
| Oil and natural gas sales (in thousands) | $ | 22,498 | $ | 8,982 | $ | 6,325 | $ | 1,716 | ||||||||
| Net Production sold | ||||||||||||||||
| Oil (Bbl) | 185,522 | 83,143 | 37,004 | 18,303 | ||||||||||||
| Natural gas (Mcf) | 882,606 | 645,609 | 795,659 | 71,844 | ||||||||||||
| Natural gas liquids (Bbl) | 27,278 | 7,427 | 5,438 | 1,454 | ||||||||||||
| Total (Boe) | 359,901 | 198,172 | 175,052 | 31,731 | ||||||||||||
| Total (Boe/d) (2) | 986 | 543 | 480 | 1,058 | ||||||||||||
| Average sales prices | ||||||||||||||||
| Oil ($/Bbl) | $ | 93.47 | $ | 81.26 | $ | 93.97 | $ | 78.67 | ||||||||
| Natural gas ($/Mcf) | 4.68 | 3.40 | 3.58 | 2.95 | ||||||||||||
| Natural gas liquids ($/Bbl) | 32.78 | 29.62 | 46.45 | 29.53 | ||||||||||||
| Total average price ($/Boe) | $ | 62.51 | $ | 46.28 | $ | 37.58 | $ | 54.08 | ||||||||
| Costs and expenses (per Boe) | ||||||||||||||||
| Exploration expense | $ | 3.31 | $ | 4.28 | $ | 1.51 | $ | 0.95 | ||||||||
| Production taxes | 5.88 | 2.70 | 2.31 | 4.05 | ||||||||||||
| Lease operating expenses | 8.96 | 8.93 | 5.39 | 19.99 | ||||||||||||
| Natural gas transportation and marketing expenses | 0.51 | 0.52 | 0.97 | 1.59 | ||||||||||||
| Depreciation, depletion, amortization and impairment | 26.94 | 22.78 | 29.42 | 20.94 | ||||||||||||
| Accretion of discount on asset retirement obligation | 0.74 | 0.76 | 0.24 | 0.68 | ||||||||||||
| General and administrative expense | 23.85 | 39.47 | 35.22 | 16.67 | ||||||||||||
| (1) | The results for the fiscal year ended May 31, 2013 only include results and estimated production from Cross Border since February 1, 2013. |
| (2) | Boe/d is calculated based on actual calendar days during the period. |
Fiscal Year Ended June 30, 2014 Compared to Fiscal Year Ended May 31, 2013
Revenues and Production
Oil and Natural Gas Production. During the fiscal year ended June 30, 2014, we had net production sold of 359,901 barrels of oil equivalent (“Boe”), compared to net production sold of 198,172 Boe during the fiscal year ended May 31, 2013. The increase in net production sold was primarily attributable to the consolidation of Cross Border and to new wells coming online during the past fiscal year. During the one month ended June 30, 2013, we had net production sold of 31,731 Boe. For the fiscal year ended June 30, 2014, 51.5% of our production was oil, 40.9% was natural gas and 7.6% was NGLs, compared to 42.0% oil, 54.3% natural gas and 3.7% NGLs for the fiscal year ended May 31, 2013. For the one month ended June 30, 2013, 57.7% of our production was oil, 37.7% was natural gas and 4.6% was NGLs.
Oil and Natural Gas Sales. During the fiscal year ended June 30, 2014, we had oil and natural gas sales of $22.5 million, as compared to $9.0 million during the fiscal year ended May 31, 2013. The increase in oil and natural gas sales was primarily attributable to the consolidation of Cross Border and to new wells coming online during the fiscal year ended June 30, 2014. Oil and natural gas sales for the one month ended June 30, 2013 included a $253,000 negative revision for finalization of ownership during the period related to the accounting for Cross Border’s production from 2007 through the date of consolidation. During the one month ended June 30, 2013, we had oil and natural gas sales of $1.7 million. These adjustments resulted in below market per unit average sales prices for the one month ended June 30, 2013.
| 62 |
Costs and Expenses
Exploration Expense. Exploration expense was $1.2 million for the fiscal year ended June 30, 2014, as compared to $0.8 million for the fiscal year ended May 31, 2013. Exploration expense was $30,000 for the one month ended June 30, 2013.
Production Taxes. Production taxes were $2.1 million for the fiscal year ended June 30, 2014, as compared to $0.5 million for the fiscal year ended May 31, 2013. Production taxes were $0.1 million for the one month ended June 30, 2013.
Lease Operating Expenses. During the fiscal year ended June 30, 2014, we incurred lease operating expenses of $3.2 million, as compared to $1.8 million during the fiscal year ended May 30, 2013. The increase in lease operating expenses was attributable to the consolidation of Cross Border and to new wells coming online during the fiscal year ended June 30, 2014. During the one month ended June 30, 2013, we incurred lease operating expenses of $0.6 million.
Natural Gas Transportation and Marketing Expenses. For the fiscal year ended June 30, 2014, natural gas transportation and marketing expenses was $0.2, as compared to $0.1 million for the fiscal year ended May 31, 2013. For the one month ended June 30, 2013, natural gas transportation and marketing expenses was $50,000.
Depreciation, Depletion, Amortization and Impairment. For the fiscal year ended June 30, 2014, depreciation, depletion, amortization and impairment was $9.7 million, as compared to $4.5 million for the fiscal year ended May 31, 2013. The increase in depreciation, depletion, amortization and impairment was attributable to the consolidation of Cross Border and the increase in production during the fiscal year ended June 30, 2014. For the one month ended June 30, 2013, depreciation, depletion, amortization and impairment was $0.7 million.
General and Administrative Expense. General and administrative expense was $8.6 million for the fiscal year ended June 30, 2014, as compared to $7.8 million for the fiscal year ended May 31, 2013. The increase in general and administrative expense was due primarily to costs incurred in the KeyBanc litigation. General and administrative expense was $0.5 million for the one month ended June 30, 2013.
Other Expense. Other expense was $6.2 million for the fiscal year ended June 30, 2014, as compared to other expense of $4.8 million for the fiscal year ended May 31, 2013. The increase in other expense was primarily attributable to loss on extinguishment of Series A Preferred Stock and increased interest expense during the fiscal year ended June 30, 2014, partially offset by unrealized loss on investment in Cross Border warrants and impairments on debentures and note receivable during the fiscal year ended May 31, 2013. Other expense was $0.3 million for the one month ended June 30, 2013.
Fiscal Year Ended May 31, 2013 Compared to Fiscal Year Ended May 31, 2012
Revenues and Production
Oil and Natural Gas Production. During the fiscal year ended May 31, 2013, we had net production sold of 198,172 Boe, compared to net production sold of 175,052 Boe during the fiscal year ended May 31, 2012. The increase in net production sold was primarily attributable to the consolidation of Cross Border, partially offset by production declines in the onshore Gulf Coast and our Madera 24 Federal 2H well being shut in for approximately 100 non-consecutive days during fiscal 2013. For the fiscal year ended May 31, 2013, 42.0% of our net production sold was oil, 54.3% was natural gas and 3.7% was NGLs, compared to 21.1% oil, 75.8% natural gas and 3.1% NGLs for the fiscal year ended May 31, 2012.
Oil and Natural Gas Sales. During the fiscal year ended May 31, 2013, we had oil and natural gas sales of $9.0 million, as compared to $6.3 million during the fiscal year ended May 31, 2012. The increase in oil and natural gas sales was primarily attributable to us producing approximately 46,000 additional barrels of oil in fiscal 2013, partically offset by a 14% decrease in the price received per barrel of oil.
| 63 |
Costs and Expenses
Exploration Expense. Exploration expense was $0.8 million for the fiscal year ended May 31, 2013, as compared to $0.3 million for the fiscal year ended May 31, 2012. Exploration expense increased due to a $0.4 million impairment of an unproved property in the fiscal year ended May 31, 2013.
Production Taxes. Production taxes were $0.5 million for the fiscal year ended May 31, 2013, as compared to $0.4 million for the fiscal year ended May 31, 2012.
Lease Operating Expenses. During the fiscal year ended May 31, 2013, we incurred lease operating expenses of $1.8 million, as compared to $0.9 million during the fiscal year ended May 31, 2012. The increase in lease operating expenses was partially attributable to the acquisition of Cross Border, which incurred $0.4 million of lease operating expense from the acquisition date through May 31, 2013. In addition, we incurred higher operating costs on our existing wells, such as salt water disposal costs.
Natural Gas Transportation and Marketing Expenses. For the fiscal year ended May 31, 2013, natural gas transportation and marketing expenses was $0.1 million, as compared to $0.2 million for the fiscal year ended May 31, 2012.
Depreciation, Depletion, Amortization and Impairment. For the fiscal year ended May 31, 2013, depreciation, depletion, amortization and impairment was $4.5 million, as compared to $5.1 million for the fiscal year ended May 31, 2012. The decrease in depreciation, depletion, amortization and impairment was primarily attributable to a $1.0 million impairment of our Pawnee Prospect in the fiscal year ended May 31, 2012 that did not recur in the fiscal year ended May 31, 2013.
General and Administrative Expense. General and administrative expense was $7.8 million for the fiscal year ended May 31, 2013, as compared to $6.2 million for the fiscal year ended May 31, 2012. The increase in general and administrative expense for the fiscal year ended May 31, 2013 was partially attributable to the acquisition of Cross Border, which incurred $0.3 million in general and administrative expenditures from the acquisition date through May 31, 2013. In addition, we incurred an additional $0.6 million in personnel related expenditures due to increased headcount.
Other Expense. Other expense was $4.8 million for the fiscal year ended May 31, 2013, as compared to $5.6 million for the fiscal year ended May 31, 2012. The decrease in other expense was primarily attributable to a $0.5 million gain on the change in the fair value of derivatives, an unrealized loss of $1.3 million on our investment in Cross Border warrants, a $1.0 million increase in interest expense, a $0.7 million gain on consolidation of Cross Border and a $0.5 million impairment of debentures for the fiscal year ended May 31, 2013. Also contributing to the decline in other expenses was a $1.9 million decline in impairment on notes receivable.
Liquidity and Capital Resources
General
Our primary sources of liquidity for fiscal 2014 were borrowings under our Credit Facility, proceeds from the sale of Units and common stock, and cash flow from operations. Our ability to fund planned capital expenditures and to make acquisitions depends upon our future operating performance, availability of borrowings under the Credit Facility, and availability of equity and debt financing, which is affected by prevailing economic conditions in our industry and financial, business and other factors, some of which are beyond our control. Our cash flow from operations is mainly influenced by the prices we receive for our oil and natural gas production and the quantity of oil and natural gas we produce. Prices for oil and natural gas are affected by national and international economic and political conditions, national and global supply and demand for hydrocarbons, seasonal weather influences and other factors beyond our control.
| 64 |
Capital Expenditures
Most of our capital expenditures are for the exploration, development, production and acquisition of oil and natural gas reserves. We anticipate cash capital expenditures of between $15 million and $25 million for fiscal year 2015. See “— Planned Development Program” for more information about our planned capital expenditures. Assuming successful and timely implementation of our current and planned development program, we expect cash on hand, borrowings under our Credit Facility and cash flow from operations will be sufficient to fund our fiscal 2015 development program. If not, we will either curtail our development program or seek other funding sources. Our planned fiscal 2015 development program is subject to change
Liquidity
At June 30, 2014, we had $1.7 million in cash and cash equivalents and $31.6 million of total indebtedness, consisting of $26.8 million under the Credit Facility and $4.8 million of Series A Preferred Stock, net of a discount of $1.6 million. At June 30, 2014, we had a working capital deficit of $2.4 million compared to a working capital deficit of $8.4 million at May 31, 2013. At June 30, 2013, we had a working capital deficit of $9.3 million.
We expect to have sufficient cash on hand, cash flow from operations and available borrowings under our Credit Facility to fund our operations for fiscal 2015.
Cash Flows
Net cash provided by operating activities was $2.9 million for the fiscal year ended June 30, 2014, compared to net cash used in operating activities of $10.2 million for the fiscal year ended May 31, 2013. The increase in net cash provided by operating activities was primarily due to the decrease in net loss and increase in depreciation, depletion, amortization, and impairment during the fiscal year ended June 30, 2014. In addition, the Company had $2.3 million of non-cash loss on extinguishment of shares of Series A Preferred Stock during the fiscal year ended June 30, 2014.
Net cash used in investing activities increased to $17.2 million for the fiscal year ended June 30, 2014 from $0.6 million for the fiscal year ended May 31, 2013 due to an increase in investment in our oil and gas properties, primarily in the Madera, Lusk and Turkey Track Prospects.
Net cash provided by financing activities was $15.5 million for the fiscal year ended June 30, 2014, as compared to $11.8 million for the fiscal year ended May 31, 2013. Net cash provided by financing activities for the fiscal year ended June 30, 2014 was primarily comprised of borrowings under our Credit Facility and offerings of Units and common stock, partially offset by payments of $7.0 million under our Credit Facility and notes payable.
Series A Preferred Stock Exchange
We exchanged 222,224 outstanding shares of our Series A Preferred Stock for the issuance of 1,388,898 shares of common stock effective as of April 1, 2014. As of June 30, 2014, we had 254,463 shares of Series A Preferred Stock outstanding with an aggregate redemption amount of $6.4 million.
Indebtedness
Credit Facility. The Credit Agreement with the Borrowers and the Lender provides for the Credit Facility with a maturity date of February 5, 2016. The borrowing base under the Credit Facility is determined at the discretion of the Lender based on, among other things, the Lender’s estimated value of the proved reserves attributable to the Borrowers’ oil and natural gas properties that have been mortgaged to the Lender, and is subject to regular redeterminations on September 30 and March 31 of each year, and interim redeterminations described in the Credit Agreement and potentially monthly commitment reductions, in each case which may reduce the amount of the borrowing base. As of June 30, 2014, the borrowing base was $30.0 million.
A portion of the Credit Facility, in an aggregate amount not to exceed $2.0 million, may be used to issue letters of credit for the account of Borrowers. The Borrowers may be required to prepay the Credit Facility in the event of a borrowing base deficiency as a result of over-advances, sales of oil and gas properties or terminations of hedging transactions.
| 65 |
Amounts outstanding under the Credit Facility bear interest at a rate per annum equal to the greater of (x) the U.S. prime rate as published in The Wall Street Journal’s “Money Rates” table in effect from time to time and (y) 4.0%. Interest is payable monthly in arrears on the last day of each calendar month. Borrowings under the Credit Facility are secured by first priority liens on substantially all the property of each of the Borrowers and are unconditionally guaranteed by Doral West Corp. and Pure Energy Operating, Inc., each a subsidiary of Cross Border.
Under the Credit Agreement, the Borrowers are required to pay fees consisting of (i) an unused facility fee equal to 0.5% multiplied by the average daily unused commitment amount, payable quarterly in arrears until the commitment is terminated; (ii) a fronting fee payable on the date of issuance of each letter of credit and annually thereafter or on the date of any increase or extension thereof, equal to the greater of (a) 2.0% per annum multiplied by the face amount of such letter of credit or (b) $1,000; and (iii) an origination fee (x) of $200,000, and (y) payable on any date the commitment is increased, an additional facility fee equal to 1.0% multiplied by any increase of the commitment above the highest previously determined or redetermined commitment.
The Credit Agreement contains negative covenants that may limit the Borrowers’ ability to, among other things, incur liens, incur additional indebtedness, enter into mergers, sell assets, make investments and pay dividends. The Credit Agreement permits the payment of cash dividends on our Series A Preferred Stock so long as we are not otherwise in default under the Credit Agreement and payment of such cash dividends would not cause us to be in default under the Credit Agreement.
The Credit Agreement also contains financial covenants, measured as of the last day of each fiscal quarter of Red Mountain, requiring the Borrowers to maintain a ratio of (i) the Borrowers’ and their consolidated subsidiaries’ consolidated current assets (inclusive of the unfunded commitment amount under the Credit Agreement) to consolidated current liabilities (exclusive of the current portion of long-term debt under the Credit Agreement) of at least 1.00 to 1.00; (ii) the Borrowers’ and their subsidiaries’ consolidated “Funded Debt” to consolidated EBITDAX (for the four fiscal quarter period then ended) of less than 3.50 to 1.00; and (iii) the Borrowers’ and their subsidiaries’ consolidated EBITDAX less paid and accrued dividends on the Series A Preferred Stock to interest expenses (each for the four fiscal quarter period then ended) of at least 3.00 to 1.00. Funded Debt is defined in the Credit Agreement as the sum of all debt for borrowed money, whether as a direct or reimbursement obligor, but excludes shares of Series A Preferred Stock. EBITDAX is defined in the Credit Agreement as (a) consolidated net income plus (b) (i) interest expense, (ii) income taxes, (iii) depreciation, (iv) depletion and amortization expenses, (v) dry hole and exploration expenses, (vi) non-cash losses or charges on any hedge agreements resulting from derivative accounting, (vii) extraordinary or non-recurring losses, (viii) expenses that could be capitalized under GAAP but by election of Borrowers are being expensed for such period under GAAP, (ix) costs associated with intangible drilling costs, (x) other non-cash charges, (xi) one-time expenses associated with transactions associated with (b)(i) through (iv), minus (c)(i) non-cash income on any hedge agreements resulting from FASB Statement 133, (ii) extraordinary or non-recurring income, and (iii) other non-cash income.
Amounts outstanding under the Credit Facility may be accelerated and become immediately due and payable upon specified events of default of Borrowers, including, among other things, a default in the payment of principal, interest or other amounts due under the Credit Facility, certain loan documents or hydrocarbon hedge agreements, a material inaccuracy of a representation or warranty, a default with regard to certain loan documents which remains unremedied for a period of 30 days following notice, a default in the payment of other indebtedness of the Borrowers of $200,000 or more, bankruptcy or insolvency, certain changes in control, failure of the Lender’s security interest in any portion of the collateral with a value greater than $500,000, cessation of any security document to be in full force and effect, or Alan Barksdale ceasing to be Red Mountain’s Chief Executive Officer or Chairman of Cross Border and not being replaced with an officer acceptable to the Lender within 30 days.
Pursuant to the Credit Agreement, at least one of the Borrowers is required to have acceptable hedge agreements in place at all times effectively hedging at least 50% of the oil volumes of the Borrowers. Pursuant to the terms of the Credit Agreement, Red Mountain has hedge agreements with various counterparties hedging a portion of the future oil production of the Borrowers.
| 66 |
As of June 30, 2014, the Borrowers had collectively borrowed $26.8 million and had availability of $3.2 million under the Credit Facility. The Company was in compliance with all of the financial covenants under the Credit Facility described above at June 30, 2014.
Series A Preferred Stock. As of June 30, 2014, we had 254,463 shares of Series A Preferred Stock outstanding. The Series A Preferred Stock is mandatorily redeemable and is not convertible into shares of our common stock. We classify the Series A Preferred Stock as a long-term liability, and we record dividends paid or accrued as interest expense in our condensed consolidated statements of operations.
In August 2013, we closed offerings of 376,685 Units. Each Unit consisted of one share of Series A Preferred Stock and one warrant to purchase up to 2.5 shares of common stock. The warrants are exercisable until the earlier of August 2016 or (ii) the first trading day that is at least 30 days after the date that we have provided notice to the holders of the warrants by filing a Current Report on Form 8-K stating that the common stock has (A) achieved a 20 trading day volume weighted average price of $15.00 per share or more and (B) traded, in the aggregate, 300,000 shares or more over the same 20 consecutive trading days for which the 20 trading day volume weighted average price was calculated; provided, that clause (ii) shall only be applicable so long as a warrant is exercisable for shares of common stock. The warrants have an exercise price of $10.00 per share. The warrants issued with the Series A Preferred Stock were valued at $2.4 million. The value of the warrants is treated as a discount to the Series A Preferred Stock and will be accreted over the life of the mandatorily redeemable preferred stock. Management determined the fair value using a probability weighted Black-Scholes option model with a volatility based on the historical closing price of common stock of industry peers and the closing price of our common stock on the OTCBB on the date of issuance. The volatility and remaining term was approximately 55% and three years, respectively.
The Series A Preferred Stock is mandatorily redeemable on July 15, 2018 at $25.00 per share, plus accrued and unpaid dividends to the redemption date, for a total redeemable value of $6.4 million.
For the fiscal year ended June 30, 2014, we recognized total interest expense of $1.8 million related to the Series A Preferred Stock, which includes accretion of discount and issuance cost of $0.6 million for the fiscal year ended June 30, 2014.
Contractual Obligations
The following table presents our contractual obligations at June 30, 2014 (in thousands):
| Payments Due by Period | ||||||||||||||||||||
| Total | Less than 1 Year | 1 – 3 Years | 3 – 5 Years | More than 5 Years | ||||||||||||||||
| Line of credit | $ | 28,497 | $ | 1,072 | $ | 27,425 | $ | — | $ | — | ||||||||||
| Series A Preferred Stock | 9,190 | 700 | 2,099 | 6,391 | — | |||||||||||||||
| Environmental remediation liability | 2,067 | 2,067 | — | — | — | |||||||||||||||
| Asset retirement obligations | 5,745 | 214 | 2,355 | 157 | 3,019 | |||||||||||||||
| Lease obligations | 444 | 218 | 226 | — | — | |||||||||||||||
| Total | $ | 45,943 | $ | 4,271 | $ | 32,105 | $ | 6,548 | $ | 3,019 | ||||||||||
Off-Balance Sheet Arrangements
As of June 30, 2014, we did not have any off-balance sheet arrangements as defined by Regulation S-K.
| 67 |
Item 7A. Quantitative and Qualitative Disclosures About Market Risk
Commodity Price Risk
Our major market risk exposure is the price we receive for our oil and natural gas production. Realized pricing is primarily driven by the prevailing price for oil and spot market prices for natural gas. Prices for oil and natural gas production are volatile and sometimes experience large fluctuations as a result of relatively small changes in supplies, weather conditions, economic conditions and government actions.
Pursuant to the Credit Agreement, at least one of the Borrowers is required to have acceptable hedge agreements in place at all times effectively hedging at least 50% of the oil volumes of the Borrowers. We have entered into derivative contracts, including costless collars, swaps, and puts, which hedge the price of oil for a portion of our expected production through January 2015.
The derivative contracts economically hedge against the variability in cash flows associated with the forecasted sale of our future oil production. While the use of the hedging arrangements will limit the downside risk of adverse price movements, it may also limit future gains from favorable movements.
The costless collars provide us with a lower limit “floor” price and an upper limit “ceiling” price on the hedged volumes. The floor price represents the lowest price we will receive for the hedged volumes while the ceiling price represents the highest price we will receive for the hedged volumes. The costless collars are settled monthly.
The swaps provide us with a fixed settlement price for our hedged volumes. The swaps are settled monthly.
The puts provide a fixed floor price on a notional amount of sales volumes while allowing full price appreciation if the relevant index price closes above the floor price.
We have elected not to designate our derivative financial instruments as hedges for accounting purposes, and accordingly, we record such contracts at fair value and recognize changes in such fair value in current earnings as they occur. Our commodity derivative contracts are carried at their fair value in earnings as they occur. We recognize unrealized and realized gains and losses related to these contracts on a mark-to-market basis in our condensed consolidated statements of operations under the captions “Unrealized gain (loss) on commodity derivatives” and “Realized gain (loss) on commodity derivatives,” respectively. Each derivative contract is evaluated separately to determine its own fair value. During the fiscal year ended June 30, 2014, we recorded a loss on commodity derivative contracts of $0.5 million.
The following table summarizes our outstanding derivatives contracts with respect to future oil production as of June 30, 2014:
| Commodity and Time Period | Contract Type | Volume Transacted | Contract Price | ||||
| Crude Oil | |||||||
| July 1, 2014—August 31, 2014 Collar—Minimum | Option | 1,437 Bbls/month | $ | 80.00/Bbl | |||
| July 1, 2014—August 31, 2014 Collar—Maximum | Option | 1,437 Bbls/month | $ | 100.50/Bbl | |||
| July 1, 2014—November 30, 2014 | Swap | 2,000 Bbls/month | $ | 93.50/Bbl | |||
| July 1, 2014—December 31, 2014 | Put | 1,979-8,330 Bbls/month | $95.00 - $100.00/Bbl | ||||
In July 2014, we entered into the following additional derivatives contract with respect to future oil production:
| Commodity and Time Period | Contract Type | Volume Transacted | Contract Price | ||||
| Crude Oil | |||||||
| July 1, 2014—January 31, 2015 | Put | 6,000 Bbls/month | $ | 95.00/Bbl |
The fair values of our commodity derivatives are largely determined by estimates of the forward curves of the relevant price indices. As of June 30, 2014 and September 1, 2014, a 10% increase or decrease in underlying commodity prices would neither reduce nor increase the fair value of these derivatives by a material amount.
| 68 |
Interest Rate Risk
The Credit Facility exposes us to interest risk associated with interest rate fluctuations on outstanding borrowings. At June 30, 2014, we had $26.8 million in outstanding borrowings under the Credit Facility. We incur interest on borrowings under the Credit Facility at a rate per annum equal to the greater of (x) the U.S. prime rate as published in The Wall Street Journal’s “Money Rates” table in effect from time to time and (y) 4.0% (which interest rate was 4.0% at June 30, 2014). A hypothetical 10% change in the interest rates we pay on our borrowings under the Credit Facility as of June 30, 2014 would result in an increase or decrease in our interest costs of approximately $107,000 per year.
Item 8. Financial Statements and Supplementary Data
Our consolidated financial statements required by this item are included in this report beginning on page F-1 and are incorporated herein by reference.
Item 9. Changes in and Disagreements with Accountants on Accounting and Financial Disclosure
Not applicable.
Item 9A. Controls and Procedures
Evaluation of Disclosure Controls and Procedures
Disclosure controls and procedures are controls and other procedures that are designed to ensure that information required to be disclosed by us in reports that we file or submit under the Exchange Act is recorded, processed, summarized and reported, within the time periods specified in the Securities and Exchange Commission’s rules and forms. Disclosure controls and procedures include, without limitation, controls and procedures designed to ensure that information required to be disclosed in the reports that we file or submit under the Exchange Act is accumulated and communicated to our management, including our principal executive and principal financial officers, or persons performing similar functions, as appropriate to allow timely decisions regarding required disclosure. There are inherent limitations to the effectiveness of any system of disclosure controls and procedures. Accordingly, even effective disclosure controls and procedures can only provide reasonable assurance of achieving their control objectives.
Under the supervision and with the participation of our management, including our principal executive officer and principal financial officer, we evaluated the effectiveness of our disclosure controls and procedures as of June 30, 2014 and, based on that evaluation, our principal executive officer and principal financial officer have concluded that our disclosure controls and procedures were effective at the reasonable assurance level.
Management’s Report on Internal Control Over Financial Reporting
Our management is responsible for establishing and maintaining adequate internal control over financial reporting as defined in Rules 13a-15(f) and 15d-15(f) under the Exchange Act. Internal control over financial reporting is designed to provide reasonable assurance regarding the reliability of our financial reporting and the preparation of our financial statements for external purposes in accordance with GAAP. Internal control over financial reporting includes policies and procedures that: (i) pertain to the maintenance of records that in reasonable detail accurately and fairly reflect the transactions and dispositions of our assets; (ii) provide reasonable assurance that transactions are recorded as necessary to permit preparation of our financial statements in accordance with GAAP, and that our receipts and expenditures are being made only in accordance with the authorizations of our management and board of directors and (iii) provide reasonable assurance regarding prevention or timely detection of unauthorized acquisition, use or disposition of our assets that could have a material effect on our financial statements.
| 69 |
Because of inherent limitations, internal control over financial reporting may not prevent or detect misstatements. Therefore, even those systems determined to be effective can provide only reasonable assurance with respect to financial statement preparation and presentation. Also, projections of any evaluation of effectiveness to future periods are subject to the risk that controls may become inadequate because of changes in conditions or that the degree of compliance with the policies or procedures may deteriorate. However, these inherent limitations are known features of the financial reporting process. Therefore, it is possible to design into the process safeguards to reduce, though not eliminate, this risk.
Our management, under the supervision and with the participation of our principal executive officer and principal financial and accounting officer, assessed the effectiveness of our internal control over financial reporting as of June 30, 2014 based on criteria established in Internal Control — Integrated Framework created by the Committee of Sponsoring Organizations of the Treadway Commission (COSO). Based on this assessment, our management concluded that our internal control over financial reporting was effective as of June 30, 2014.
The attestation report issued by Hein & Associates LLP, an independent registered public accounting firm, on the effectiveness of our internal control over financial reporting is included in their audit opinion included on page F-2 of this Annual Report on Form 10-K.
Changes in Internal Control Over Financial Reporting
There have been no changes in our internal control over financial reporting that occurred during our last fiscal quarter that have materially affected, or are reasonably likely to materially affect, our internal control over financial reporting.
None.
| 70 |
Item 10. Directors, Executive Officers and Corporate Governance
Certain information required in response to this Item 10 is contained under the heading “Executive Officers of the Registrant” in Part I of this Annual Report on Form 10-K. Other information required in response to this Item 10 is incorporated herein by reference to our definitive proxy statement to be filed with the SEC pursuant to Regulation 14A promulgated under the Exchange Act, not later than 120 days after the end of the fiscal year covered by this Annual Report on Form 10-K.
Code of Ethics
Our Board of Directors has adopted a code of ethics that applies to our directors, officers, and employees. A copy of our code of ethics is available on our website at www.redmountainresources.com/investor-information under the “Governance” heading. We intend to post any amendments to, or waivers from, our code of ethics that apply to our principal executive officer, principal financial officer, and principal accounting officer on our website at www.redmountainresources.com/investor-information.
Item 11. Executive Compensation
The information required in response to this Item 11 is incorporated herein by reference to our definitive proxy statement to be filed with the SEC pursuant to Regulation 14A promulgated under the Exchange Act not later than 120 days after the end of the fiscal year covered by this Annual Report on Form 10-K.
Item 12. Security Ownership of Certain Beneficial Owners and Management and Related Stockholder Matters
The information required in response to this Item 12 is incorporated herein by reference to our definitive proxy statement to be filed with the SEC pursuant to Regulation 14A promulgated under the Exchange Act not later than 120 days after the end of the fiscal year covered by this Annual Report on Form 10-K.
Item 13. Certain Relationships and Related Transactions, and Director Independence
The information required in response to this Item 13 is incorporated herein by reference to our definitive proxy statement to be filed with the SEC pursuant to Regulation 14A promulgated under the Exchange Act not later than 120 days after the end of the fiscal year covered by this Annual Report on Form 10-K.
Item 14. Principal Accountant Fees and Services
The information required in response to this Item 14 is incorporated herein by reference to our definitive proxy statement to be filed with the SEC pursuant to Regulation 14A promulgated under the Exchange Act not later than 120 days after the end of the fiscal year covered by this Annual Report on Form 10-K.
| 71 |
Item 15. Exhibits and Financial Statement Schedules
| (a) | The following documents are filed as part of this Annual Report on Form 10-K: |
| 1. | Report of Independent Registered Public Accounting Firm |
Consolidated Balance Sheets as of June 30, 2014, May 31, 2013 and June 30, 2013.
Consolidated Statements of Operations for the Fiscal Years Ended June 30, 2014, May 31, 2013 and 2012 and the One Month Ended June 30, 2013
Consolidated Statements of Cash Flows for the Fiscal Years Ended June 30, 2014, May 31, 2013 and 2012 and the One Month Ended June 30, 2013
Consolidated Statements of Stockholders’ and Members’ Equity for the Fiscal Years Ended June 30, 2014, May 31, 2013 and 2012 and the One Month Ended June 30, 2013
Notes to Consolidated Financial Statements
| 2. | Exhibits required to be filed by Item 601 of Regulation S-K |
The exhibits required to be filed by this Item 15 are set forth in the Exhibit Index accompanying this report.
| 72 |
INDEX TO CONSOLIDATED FINANCIAL STATEMENTS
REPORT OF INDEPENDENT REGISTERED PUBLIC ACCOUNTING FIRM
To the Board of Directors and Stockholders
Red Mountain Resources, Inc. and subsidiaries
We have audited the accompanying consolidated balance sheets of Red Mountain Resources, Inc. (“the Company”) and subsidiaries as of June 30, 2014 and 2013 and May 31, 2013, and the related consolidated statements of operations, stockholders’ and members’ equity, and cash flows for each of the years ended June 30, 2014, May 31, 2013, and May 31, 2012 and for the one-month transition period ended June 30, 2013. These consolidated financial statements are the responsibility of the Company’s management. Our responsibility is to express an opinion on these consolidated financial statements based on our audits.
We conducted our audits in accordance with the standards of the Public Company Accounting Oversight Board (United States). Those standards require that we plan and perform the audit to obtain reasonable assurance about whether the financial statements are free of material misstatement. An audit also includes examining, on a test basis, evidence supporting the amounts and disclosures in the financial statements, assessing the accounting principles used and significant estimates made by management, as well as evaluating the overall financial statement presentation. We believe that our audits provide a reasonable basis for our opinion.
In our opinion, the consolidated financial statements referred to above present fairly, in all material respects, the financial position of Red Mountain Resources, Inc. and subsidiaries as of June 30, 2014 and 2013 and May 31, 2013 and the consolidated results of their operations and their cash flows for each of the years ended June 30, 2014, May 31, 2013 and May 31, 2012 and for the one-month transition period ended June 30, 2013 in conformity with U.S. generally accepted accounting principles.
We have also audited, in accordance with the standards of the Public Company Accounting Oversight Board (United States), Red Mountain Resources, Inc. and subsidiaries’ internal control over financial reporting as of June 30, 2014 based on criteria established in Internal Control – Integrated Framework issued by the Committee of Sponsoring Organizations of the Treadway Commission in 2013, and our report dated September 30, 2014 expressed an unqualified opinion on the effectiveness of the Company’s internal control over financial reporting.
/s/ Hein & Associates LLP
Dallas, Texas
September 30, 2014
| F-1 |
Report of Independent Registered Public Accounting Firm
To the Board of Directors and Stockholders
Red Mountain Resources, Inc.
We have audited Red Mountain Resources, Inc. and subsidiaries’ (collectively, the “Company”) internal control over financial reporting as of June 30, 2014, based on criteria established in Internal Control – Integrated Framework issued by the Committee of Sponsoring Organizations of the Treadway Commission in 2013. The Company’s management is responsible for maintaining effective internal control over financial reporting and for its assessment of the effectiveness of internal control over financial reporting included in the accompanying Management’s Report on Internal Control over Financial Reporting. Our responsibility is to express an opinion on the Company’s internal control over financial reporting based on our audit.
We conducted our audit in accordance with the standards of the Public Company Accounting Oversight Board (United States). Those standards require that we plan and perform the audit to obtain reasonable assurance about whether effective internal control over financial reporting was maintained in all material respects. Our audit included obtaining an understanding of internal control over financial reporting, assessing the risk that a material weakness exists, and testing and evaluating the design and operating effectiveness of internal control based on the assessed risk. Our audit also included performing such other procedures as we considered necessary in the circumstances. We believe that our audit provides a reasonable basis for our opinion.
A company’s internal control over financial reporting is a process designed to provide reasonable assurance regarding the reliability of financial reporting and the preparation of financial statements for external purposes in accordance with generally accepted accounting principles. A company’s internal control over financial reporting includes those policies and procedures that (a) pertain to the maintenance of records that, in reasonable detail, accurately and fairly reflect the transactions and dispositions of the assets of the company; (b) provide reasonable assurance that transactions are recorded as necessary to permit preparation of financial statements in accordance with generally accepted accounting principles, and that receipts and expenditures of the company are being made only in accordance with authorizations of management and directors of the company; and (c) provide reasonable assurance regarding prevention or timely detection of unauthorized acquisition, use, or disposition of the company’s assets that could have a material effect on the financial statements.
Because of its inherent limitations, internal control over financial reporting may not prevent or detect misstatements. Also, projections of any evaluation of effectiveness to future periods are subject to the risk that controls may become inadequate because of changes in conditions, or that the degree of compliance with the policies or procedures may deteriorate.
In our opinion, the Company maintained, in all material respects, effective internal control over financial reporting as of June 30, 2014, based on criteria established in Internal Control – Integrated Framework issued by the Committee of Sponsoring Organizations of the Treadway Commission in 2013.
We have also audited, in accordance with the standards of the Public Company Accounting Oversight Board (United States), the consolidated balance sheets of Red Mountain Resources, Inc. and subsidiaries as of June 30, 2014 and 2013 and May 31, 2013, and the related consolidated statements of operations, changes in stockholders’ and members’ equity, and cash flows for each of the years ended June 30, 2014, May 31, 2013, and May 31, 2012 and for the one-month transition period ended June 30, 2013 and our report dated September 30, 2014 expressed an unqualified opinion.
/s/ Hein & Associates LLP
Dallas, Texas
September 30, 2014
| F-2 |
Red Mountain Resources, Inc. and Subsidiaries
(in thousands)
| ASSETS | June 30, 2014 | May 31, 2013 | June 30, 2013 | |||||||||
| Current Assets: | ||||||||||||
| Cash and cash equivalents | $ | 1,682 | $ | 1,112 | $ | 456 | ||||||
| Accounts receivable – oil and natural gas sales | 3,186 | 3,522 | 4,673 | |||||||||
| Accounts receivable – joint interest | 1,645 | 2,604 | 1,666 | |||||||||
| Debt issuance costs – current | — | 230 | 230 | |||||||||
| Prepaid expenses and other current assets | 527 | 420 | 400 | |||||||||
| Commodities derivative asset – current | 37 | 190 | 86 | |||||||||
| Deferred tax asset – current | 368 | 299 | 299 | |||||||||
| Total current assets | 7,445 | 8,377 | 7,810 | |||||||||
| Long-Term Investments: | ||||||||||||
| Debentures – held to maturity | 4,820 | 4,279 | 4,279 | |||||||||
| Oil and Natural Gas Properties, Successful Efforts Method: | ||||||||||||
| Proved properties | 82,362 | 63,891 | 64,539 | |||||||||
| Unproved properties | 19,109 | 19,539 | 19,622 | |||||||||
| Other property and equipment | 1,196 | 1,026 | 1,061 | |||||||||
| Less accumulated depreciation, depletion, amortization and impairment | (19,497 | ) | (9,324 | ) | (9,987 | ) | ||||||
| Oil and natural gas properties, net | 83,170 | 75,132 | 75,235 | |||||||||
| Other Assets: | ||||||||||||
| Commodities derivative asset, net of current portion | — | 75 | 46 | |||||||||
| Restricted cash, long-term | 493 | 452 | 452 | |||||||||
| Debt issuance costs, net of current portion | 1,101 | 450 | 409 | |||||||||
| Security deposit and other assets | 197 | 465 | 791 | |||||||||
| Total Assets | $ | 97,226 | $ | 89,230 | $ | 89,022 | ||||||
| LIABILITIES AND STOCKHOLDERS’ EQUITY | ||||||||||||
| Current Liabilities: | ||||||||||||
| Accounts payable | $ | 3,536 | $ | 9,354 | $ | 9,318 | ||||||
| Revenues payable | 1,673 | 774 | 1,137 | |||||||||
| Accrued expenses | 2,035 | 1,137 | 1,175 | |||||||||
| Commodities derivative liability | 121 | 34 | — | |||||||||
| Convertible notes payable, net of discount of $0, $442 and $352 | — | 3,308 | 3,398 | |||||||||
| Dividend payable | 179 | — | — | |||||||||
| Notes payable – current | — | 500 | 500 | |||||||||
| Asset retirement obligation – current | 214 | 228 | 228 | |||||||||
| Environmental remediation liability – current | 2,067 | 1,400 | 1,400 | |||||||||
| Total current liabilities | 9,825 | 16,735 | 17,156 | |||||||||
| Long-Term Liabilities: | ||||||||||||
| Mandatorily redeemable preferred stock, net of discount of $1,561 | 4,801 | — | — | |||||||||
| Line of credit, net of current portion | 26,800 | 19,800 | 19,800 | |||||||||
| Environmental remediation liability, net of current portion | — | 688 | 688 | |||||||||
| Deferred tax liability – long-term | 409 | 299 | 299 | |||||||||
| Asset retirement obligation, net of current portion | 5,531 | 4,751 | 4,792 | |||||||||
| Total long-term liabilities | 37,541 | 25,538 | 25,579 | |||||||||
| Total Liabilities | 47,366 | 42,273 | 42,735 | |||||||||
| Commitments and Contingencies (Note 14) | ||||||||||||
| Stockholders’ Equity: | ||||||||||||
| Common stock, $0.00001 par value; 50,000 shares authorized; 14,858 shares issued and outstanding as of June 30, 2014; 12,691 shares issued and 12,596 shares outstanding as of May 31, 2013; 12,692 shares issued and outstanding as of June 30, 2013 | 1 | 1 | 1 | |||||||||
| Noncontrolling interest | 6,076 | 5,603 | 5,564 | |||||||||
| Additional paid-in capital | 78,105 | 65,536 | 65,536 | |||||||||
| Accumulated deficit | (34,322 | ) | (24,183 | ) | (24,814 | ) | ||||||
| Total stockholders’ equity | 49,860 | 46,957 | 46,287 | |||||||||
| Total Liabilities and Stockholders’ Equity | $ | 97,226 | $ | 89,230 | $ | 89,022 | ||||||
The accompanying notes are an integral part of these consolidated financial statements.
| F-3 |
Red Mountain Resources, Inc. and Subsidiaries
Consolidated Statements of Operations
(in thousands, except per share amounts)
| For Each of the Fiscal Years Ended | For the One Month Ended | |||||||||||||||
| June 30, 2014 | May 31, 2013 | May 31, 2012 | June 30, 2013 | |||||||||||||
| Revenue: | ||||||||||||||||
| Oil and natural gas sales | $ | 22,498 | $ | 8,982 | $ | 6,325 | $ | 1,716 | ||||||||
| Operating Expenses: | ||||||||||||||||
| Exploration expense | 1,193 | 849 | 265 | 30 | ||||||||||||
| Production taxes | 2,116 | 536 | 403 | 128 | ||||||||||||
| Lease operating expenses | 3,224 | 1,769 | 943 | 634 | ||||||||||||
| Natural gas transportation and marketing expenses | 183 | 104 | 170 | 50 | ||||||||||||
| Depreciation, depletion, amortization and impairment | 9,694 | 4,515 | 5,149 | 665 | ||||||||||||
| Accretion of discount on asset retirement obligation | 267 | 150 | 44 | 22 | ||||||||||||
| General and administrative expense | 8,584 | 7,822 | 6,165 | 529 | ||||||||||||
| Total operating expenses | 25,261 | 15,745 | 13,139 | 2,058 | ||||||||||||
| Loss from Operations | (2,763 | ) | (6,763 | ) | (6,814 | ) | (342 | ) | ||||||||
| Other Income (Expense): | ||||||||||||||||
| Change in fair value of derivative liability | — | 496 | — | — | ||||||||||||
| Change in fair value of warrant liability | — | — | (763 | ) | — | |||||||||||
| Unrealized gain (loss) on investment in Cross Border Resources, Inc. warrants | — | (1,304 | ) | 282 | — | |||||||||||
| Equity in losses of Cross Border Resources, Inc. | — | (332 | ) | (316 | ) | — | ||||||||||
| Loss on extinguishment of mandatorily redeemable preferred stock | (2,281 | ) | — | — | — | |||||||||||
| Interest expense | (3,363 | ) | (2,989 | ) | (2,096 | ) | (225 | ) | ||||||||
| Gain on consolidation of Cross Border Resources, Inc. | — | 682 | — | — | ||||||||||||
| Gain (loss) on derivatives | (544 | ) | 49 | — | (104 | ) | ||||||||||
| Impairment on debentures | — | (503 | ) | — | — | |||||||||||
| Impairment on note receivable | — | (856 | ) | (2,725 | ) | — | ||||||||||
| Total Other Expense | (6,188 | ) | (4,757 | ) | (5,618 | ) | (329 | ) | ||||||||
| Loss Before Income Taxes | (8,951 | ) | (11,520 | ) | (12,432 | ) | (671 | ) | ||||||||
| Income tax provision | (44 | ) | — | — | — | |||||||||||
| Net loss | (8,995 | ) | (11,520 | ) | (12,432 | ) | (671 | ) | ||||||||
| Net income (loss) attributable to noncontrolling interest | 513 | 682 | — | (40 | ) | |||||||||||
| Net loss attributable to Red Mountain Resources, Inc. | $ | (9,508 | ) | $ | (12,202 | ) | $ | (12,432 | ) | $ | (631 | ) | ||||
| Basic and diluted loss per common share | $ | (0.70 | ) | $ | (1.20 | ) | $ | (1.69 | ) | $ | (0.05 | ) | ||||
| Basic and diluted weighted average common shares outstanding | 13,626 | 10,133 | 7,378 | 12,691 | ||||||||||||
The accompanying notes are an integral part of these consolidated financial statements.
| F-4 |
Red Mountain Resources, Inc. and Subsidiaries
Consolidated Statements of Cash Flows
(in thousands)
| For Each of the Fiscal Years Ended | For the One Month Ended | |||||||||||||||
| June 30, 2014 | May 31, 2013 | May 31, 2012 | June 30, 2013 | |||||||||||||
| Cash Flow From Operating Activities: | ||||||||||||||||
| Net loss | $ | (8,995 | ) | $ | (11,520 | ) | $ | (12,432 | ) | $ | (671 | ) | ||||
| Adjustments to reconcile net loss to net cash provided by (used in) operating activities: | ||||||||||||||||
| Depreciation, depletion, amortization and impairment | 9,694 | 4,515 | 5,149 | 665 | ||||||||||||
| Equity in losses of Cross Border Resources, Inc. | — | 332 | 316 | — | ||||||||||||
| Issuance of stock for consulting services | 194 | 229 | 152 | — | ||||||||||||
| Gain on consolidation of Cross Border Resources, Inc. | — | (682 | ) | — | — | |||||||||||
| Dividend declared for preferred shares | 179 | — | — | — | ||||||||||||
| Loss on extinguishment of mandatorily redeemable preferred stock | 2,281 | — | — | — | ||||||||||||
| Deferred income tax expense | 44 | — | — | — | ||||||||||||
| Accretion of discount on asset retirement obligation | 267 | 150 | 44 | 22 | ||||||||||||
| Amortization of debt issuance costs | 1,449 | 1,029 | 1,350 | 131 | ||||||||||||
| Loss on warrant liability | — | — | 763 | — | ||||||||||||
| Unrealized (gain) loss on investment in Cross Border Resources, Inc. warrants | — | 1,304 | (282 | ) | — | |||||||||||
| Impairment on note receivable | — | 856 | 2,725 | — | ||||||||||||
| Change in fair value of derivative liability | — | (281 | ) | — | — | |||||||||||
| Change in fair value of commodity derivatives | 216 | (215 | ) | — | 105 | |||||||||||
| Impairment on debentures | — | 503 | — | — | ||||||||||||
| Change in working capital: | ||||||||||||||||
| Accounts receivable—oil and natural gas sales | 1,487 | (1 | ) | (170 | ) | (1,151 | ) | |||||||||
| Accounts receivable—joint interest | 21 | (2,531 | ) | (73 | ) | 938 | ||||||||||
| Accounts receivable—related party | — | — | 25 | — | ||||||||||||
| Prepaid expenses and other current assets | 467 | 327 | (649 | ) | (304 | ) | ||||||||||
| Accounts payable | (5,268 | ) | (3,692 | ) | 1,474 | 320 | ||||||||||
| Accrued expenses | 858 | (324 | ) | 657 | 37 | |||||||||||
| Restricted cash | (41 | ) | (200 | ) | (252 | ) | — | |||||||||
| Accounts payable—related party | — | (12 | ) | 9 | — | |||||||||||
| Net cash provided by (used in) operating activities | 2,853 | (10,213 | ) | (1,194 | ) | 92 | ||||||||||
| Cash Flow From Investing Activities: | ||||||||||||||||
| Additions to oil and natural gas properties | (17,033 | ) | (699 | ) | (15,271 | ) | (714 | ) | ||||||||
| Acquisition of oil and natural gas properties | — | 255 | (2,134 | ) | — | |||||||||||
| Additions to other property and equipment | (136 | ) | (390 | ) | (530 | ) | (34 | ) | ||||||||
| Increase in Bamco note receivable | — | — | (44 | ) | — | |||||||||||
| Net cash acquired in Cross Border consolidation | — | 279 | — | — | ||||||||||||
| Settlement of asset retirement obligations | (2 | ) | (54 | ) | — | — | ||||||||||
| Investment in Cross Border Resources, Inc. | — | — | (288 | ) | — | |||||||||||
| Net cash used in investing activities | (17,171 | ) | (609 | ) | (18,267 | ) | (748 | ) | ||||||||
| Cash Flow From Financing Activities: | ||||||||||||||||
| Proceeds from issuance of common shares, net of issuance costs | 3,606 | 8,280 | 16,412 | — | ||||||||||||
| Exercise of warrants | — | 150 | — | — | ||||||||||||
| Draws on line of credit | 12,000 | 12,450 | 800 | — | ||||||||||||
| Payments under line of credit | (5,000 | ) | (3,187 | ) | (1,017 | ) | — | |||||||||
| Proceeds from notes payable, net of issuance costs | — | 2,400 | 4,457 | — | ||||||||||||
| Payments on notes payable | (2,000 | ) | (8,327 | ) | (3,776 | ) | — | |||||||||
| Issuance costs of notes payable | (157 | ) | — | — | — | |||||||||||
| Proceeds from convertible notes payable | — | — | 2,500 | — | ||||||||||||
| Issuance of preferred stock, net of expenses | 7,095 | — | — | — | ||||||||||||
| Reverse merger recapitalization | — | — | 132 | — | ||||||||||||
| Net cash provided by financing activities | 15,544 | 11,766 | 19,508 | — | ||||||||||||
| Net change in cash and equivalents | 1,226 | 944 | 47 | (656 | ) | |||||||||||
| Cash at beginning of period | 456 | 168 | 121 | 1,112 | ||||||||||||
| Cash at end of period | $ | 1,682 | $ | 1,112 | $ | 168 | $ | 456 | ||||||||
| Supplemental Disclosure of Cash Flow Information | ||||||||||||||||
| Cash paid during the period for interest | $ | 2,274 | $ | 684 | $ | 507 | $ | 64 | ||||||||
| Non-Cash Transactions | ||||||||||||||||
| Change in asset retirement obligation estimate | $ | 385 | $ | 705 | $ | 553 | $ | 18 | ||||||||
| Issuance of shares for investment in Cross Border Resources, Inc. | $ | — | $ | 15,236 | $ | 4,804 | $ | — | ||||||||
| Convertible notes payable derivative liability | $ | — | $ | 300 | $ | — | $ | — | ||||||||
| Issuance of shares | $ | — | $ | 10,076 | $ | 888 | $ | — | ||||||||
| Issuance of warrants | $ | — | $ | 334 | $ | — | $ | — | ||||||||
| Issuance of options | $ | — | $ | 529 | $ | — | $ | — | ||||||||
| Oil and natural gas properties included in accounts payable | $ | — | $ | 6,532 | $ | 914 | $ | — | ||||||||
| Issuance of shares for debentures | $ | 541 | $ | — | $ | — | $ | — | ||||||||
| Issuance of warrants with preferred stock | $ | 2,395 | $ | — | $ | — | $ | — | ||||||||
| Settlement of mandatorily redeemable preferred stock with common stock | $ | 5,833 | $ | — | $ | — | $ | — | ||||||||
| Issuance of replacement note for acquisition of Bamco note receivable | $ | — | $ | — | $ | 2,681 | $ | — | ||||||||
| Convertible notes payable beneficial conversion | $ | — | $ | — | $ | 1,603 | $ | — | ||||||||
The accompanying notes are an integral part of these consolidated financial statements.
| F-5 |
Red Mountain Resources, Inc. and Subsidiaries
Consolidated Statements of Stockholders’ and Members’ Equity
(in thousands)
| Common Stock | ||||||||||||||||||||||||||||
| Shares(1) | Amount(1) | Additional Paid-in Capital | Retained Earnings (Accumulated Deficit) | Share Subscription Receivable | Noncontrolling Interest | Total | ||||||||||||||||||||||
| Balance at June 1, 2011 | 2,700 | $ | 0.270 | $ | — | $ | 2,353 | $ | — | $ | — | $ | 2,353 | |||||||||||||||
| Recapitalization adjustment as a result of reverse merger | 3,687 | 0.369 | 5,777 | — | — | — | 5,778 | |||||||||||||||||||||
| Issuance of shares in private placement, net of offering costs of $3,687 | 1,014 | 0.101 | 6,449 | — | — | — | 6,449 | |||||||||||||||||||||
| Exercise of warrants | 704 | 0.070 | 9,460 | — | (150 | ) | — | 9,310 | ||||||||||||||||||||
| Issuance of shares to brokers | 31 | 0.003 | 314 | — | — | — | 314 | |||||||||||||||||||||
| Issuance of shares for debt issuance costs | 20 | 0.002 | 318 | — | — | — | 318 | |||||||||||||||||||||
| Issuance of warrants | — | — | 1,101 | — | — | — | 1,101 | |||||||||||||||||||||
| Issuance of shares for services | 10 | 0.001 | 152 | — | — | — | 152 | |||||||||||||||||||||
| Issuance of shares for investment in Cross Border Resources, Inc. | 480 | 0.048 | 4,804 | — | — | — | 4,804 | |||||||||||||||||||||
| Issuance of shares in other acquisitions | 57 | 0.006 | 570 | — | — | — | 570 | |||||||||||||||||||||
| Convertible notes payable beneficial conversion discount | — | — | 1,603 | — | — | — | 1,603 | |||||||||||||||||||||
| Cancellation of shares held by Black Rock Capital, Inc. | (10 | ) | (0.001 | ) | 0.001 | — | — | — | 0.001 | |||||||||||||||||||
| Net loss | — | — | — | (12,432 | ) | — | — | (12,432 | ) | |||||||||||||||||||
| Balance at May 31, 2012 | 8,693 | 0.869 | 30,548 | (10,079 | ) | (150 | ) | — | 20,320 | |||||||||||||||||||
| Issuance of shares in private placement, net of offering costs of $1,351 | 1,160 | 0.116 | 7,290 | — | (100 | ) | — | 7,190 | ||||||||||||||||||||
| Issuance of shares for investment in Cross Border Resources, Inc. | 1,573 | 0.157 | 15,236 | — | — | — | 15,236 | |||||||||||||||||||||
| Adjustment for consolidation of Cross Border Resources, Inc. | — | — | — | (1,902 | ) | — | 6,359 | 4,457 | ||||||||||||||||||||
| Acquisition of additional minority interest in Cross Border Resources, Inc. | 117 | 0.012 | 1,438 | — | — | (1,438 | ) | — | ||||||||||||||||||||
| Issuance of shares for investment in Cross Border Resources, Inc. subordinated debt | 194 | 0.019 | 1,744 | — | — | — | 1,744 | |||||||||||||||||||||
| Issuance of shares to settle Cross Border Resources, Inc. bankruptcy claims | 75 | 0.007 | 634 | — | — | — | 634 | |||||||||||||||||||||
| Issuance of warrants for investment in warrants of Cross Border Resources, Inc. | — | — | 37 | — | — | — | 37 | |||||||||||||||||||||
| Issuance of shares for acquisition of oil and gas properties | 238 | 0.024 | 2,232 | — | — | — | 2,232 | |||||||||||||||||||||
| Issuance of shares for equipment | 1 | — | 14 | — | — | — | 14 | |||||||||||||||||||||
| Issuance of shares for stock issuance liability | 8 | 0.001 | 68 | — | — | — | 68 | |||||||||||||||||||||
| Issuance of shares for debentures | 570 | 0.057 | 4,782 | — | — | — | 4,782 | |||||||||||||||||||||
| Issuance of shares for debt issuance costs | 12 | 0.001 | 161 | — | — | — | 161 | |||||||||||||||||||||
| Issuance of warrants for debt issuance costs | — | — | 133 | — | — | — | 133 | |||||||||||||||||||||
| Issuance of shares for services | 26 | 0.003 | 229 | — | — | — | 229 | |||||||||||||||||||||
| Issuance of shares to brokers | 25 | 0.003 | 212 | — | — | — | 212 | |||||||||||||||||||||
| Issuance of warrants to brokers | — | — | 249 | — | — | — | 249 | |||||||||||||||||||||
| Issuance of options | — | — | 529 | — | — | — | 529 | |||||||||||||||||||||
| Cash received for subscription receivable | — | — | — | — | 250 | — | 250 | |||||||||||||||||||||
| Net loss | — | — | — | (12,202 | ) | — | 682 | (11,520 | ) | |||||||||||||||||||
| Balance at May 31, 2013 | 12,692 | 1.269 | 65,536 | (24,183 | ) | — | 5,603 | 46,957 | ||||||||||||||||||||
| Net loss | — | — | — | (631 | ) | — | (40 | ) | (671 | ) | ||||||||||||||||||
| Balance at June 30, 2013 | 12,692 | 1.269 | 65,536 | (24,814 | ) | — | 5,563 | 46,286 | ||||||||||||||||||||
| Issuance of shares, net of offering costs of $895 | 643 | 0.064 | 3,606 | — | — | — | 3,606 | |||||||||||||||||||||
| Issuance of warrants with preferred stock | — | — | 2,395 | — | — | — | 2,395 | |||||||||||||||||||||
| Issuance of shares for debentures | 87 | 0.009 | 541 | — | — | — | 541 | |||||||||||||||||||||
| Issuance of shares for services | 47 | 0.005 | 194 | — | — | — | 194 | |||||||||||||||||||||
| Issuance of shares in exchange for preferred stock | 1,388 | 0.14 | 5,833 | — | — | — | 5,833 | |||||||||||||||||||||
| Net income (loss) | — | — | — | (9,508 | ) | — | 513 | (8,995 | ) | |||||||||||||||||||
| Balance at June 30, 2014 | 14,857 | $ | 1.487 | $ | 78,105 | $ | (34,322 | ) | $ | — | $ | 6,076 | $ | 49,860 | ||||||||||||||
The accompanying notes are an integral part of these consolidated financial statements.
| F-6 |
Red Mountain Resources, Inc. and Subsidiaries
Notes to Consolidated Financial Statements
1. Organization
Red Mountain Resources, Inc. is a Texas corporation formed on January 23, 2014. On January 31, 2014, the Company changed its state of incorporation from the State of Florida to the State of Texas by merging Red Mountain Resources, Inc., a Florida corporation (“RMR FL”), with and into Red Mountain Resources, Inc., a Texas corporation. Unless the context otherwise requires, the terms “Red Mountain” and “Company” refer to Red Mountain Resources, Inc. and its consolidated subsidiaries.
The Company is a Dallas-based growth-oriented energy company engaged in the acquisition, development and exploration of oil and natural gas properties in established basins with demonstrable prolific producing zones. Currently, the Company has established acreage positions and production in the Permian Basin of West Texas and Southeast New Mexico and the onshore Gulf Coast of Texas. Additionally, the Company has an established and growing acreage position in Kansas.
Reverse stock split
On January 31, 2014, RMR FL effected a reverse stock split of RMR FL’s common stock, par value $0.00001 per share (“RMR FL Common Stock”), at an exchange ratio of 1-for-10 (the “Reverse Stock Split”), together with a proportional reduction in the number of authorized shares of RMR FL Common Stock from 500.0 million shares to 50.0 million shares. The par value of RMR FL Common Stock did not change as a result of the Reverse Stock Split. As of January 31, 2014, every ten shares of RMR FL Common Stock were combined into one share of RMR FL Common Stock, reducing the number of outstanding shares of RMR FL Common Stock from approximately 134.0 million to approximately 13.4 million. In addition, a proportionate adjustment was made to the per share exercise price and the number of shares issuable upon the exercise of all outstanding warrants to purchase shares of RMR FL Common Stock. All share and per share amounts and calculations have been retroactively adjusted to reflect the effects of the Reverse Stock Split.
Change in fiscal year end
On July 17, 2013, the Company’s board of directors approved a change in the Company’s fiscal year end from May 31 to June 30, effective as of June 30, 2013. The change in the Company’s fiscal year end resulted in a one-month transition period that began on June 1, 2013 and ended on June 30, 2013. The unaudited one-month transition period was reported in the Quarterly Report on Form 10-Q for the quarter ended September 30, 2013 and the audited one-month transition period is included in this Annual Report on Form 10-K.
In the Consolidated Statements of Operations, the Company compares the fiscal year ended June 30, 2014 with the previously reported fiscal years ended May 31, 2013 and 2012. Financial information for the fiscal years ended June 30, 2013 and 2012 has not been included for the following reasons: (i) the fiscal years ended May 31, 2013 and 2012 provide a meaningful comparison for the fiscal year ended June 30, 2014; (ii) there are no significant factors, seasonal or other, that would impact the comparability of information if the results for the fiscal years ended June 30, 2013 and 2012 were presented in lieu of results for the fiscal years ended May 31, 2013 and 2012; and (iii) it was not practicable or cost justified to prepare this information.
2. Liquidity
The Company incurred a net loss attributable to Red Mountain Resources, Inc. of $9.5 million during the fiscal year ended June 30, 2014. At June 30, 2014, the outstanding principal amount of the Company’s indebtedness was $31.6 million, consisting of $26.8 million under its credit facility and $4.8 million of mandatorily redeemable preferred stock, net of a discount of $1.6 million, and the Company had a working capital deficit of $2.4 million. As of June 30, 2014, none of the Company’s debt was due within the next twelve months.
Assuming successful and timely implementation of the Company’s current and planned development program, the Company expects cash on hand, borrowings under its credit facility and cash flow from operations will be sufficient to fund its fiscal 2015 development program. If not, the Company will either curtail its development program or seek other funding sources.
3. Summary of Significant Accounting Policies
Consolidation, basis of presentation and significant estimates
The accompanying consolidated financial statements have been prepared in accordance with accounting principles generally accepted in the United States of America (“GAAP”) and include the accounts of the Company and its wholly and majority-owned subsidiaries. Intercompany accounts and transactions are eliminated. In preparing the accompanying financial statements, management has made certain estimates and assumptions that affect reported amounts in the financial statements and disclosures of contingencies. Significant assumptions are required in the valuation of proved oil and natural gas reserves, which affect the Company’s estimate of depletion expense as well as its impairment analyses. Significant assumptions also are required in the Company’s estimation of accrued liability, derivatives, environmental remediation liability and asset retirement obligations. Changes in facts and circumstances may result in revised estimates and actual results may differ from these estimates.
| F-7 |
Business combinations
The Company accounts for business combinations under the acquisition method of accounting in accordance with Accounting Standards Codification (“ASC”) Topic 805, Business Combinations (“ASC 805”). The acquisition method requires that assets acquired and liabilities assumed, including contingencies, be recorded at their fair values as of the acquisition date.
Noncontrolling interests
Subsequent to January 28, 2013, the Company accounts for the noncontrolling interest in Cross Border Resources, Inc. (“Cross Border”) in accordance with ASC Topic 810, Consolidation (“ASC 810”). ASC 810 establishes accounting and reporting standards for ownership interests in subsidiaries held by parties other than the parent, the amount of consolidated net income attributable to the parent and to the noncontrolling interest, changes in a parent’s ownership interest and the valuation of retained noncontrolling equity investments when a subsidiary is deconsolidated. ASC 810 also establishes reporting requirements that provide sufficient disclosures that clearly identify and distinguish between the interest of the parent and the interests of the noncontrolling owner. In addition, this guidance provides for increases and decreases in the Company’s controlling financial interests in consolidated subsidiaries to be reported in equity similar to treasury stock transactions.
Investments
Prior to January 28, 2013, the Company’s investment in Cross Border was accounted for under the equity method of accounting based on the Company’s significant influence. Whether or not the Company exercises significant influence with respect to an investee depends on an evaluation of several factors, including, among others, ownership level. Under the equity method of accounting, an investee company’s accounts are not reflected within the Company’s Consolidated Balance Sheets and Consolidated Statements of Operations; however, the Company’s share of the earnings or losses of the investee company is reflected in the Company’s Consolidated Statements of Operations and the Company’s carrying value in an equity method investee company is reflected in the Company’s Consolidated Balance Sheets. The Company evaluates these investments for other-than-temporary declines in value each quarterly period. Any impairment found to be other than temporary would be recorded through a charge to earnings.
Debentures - held to maturity
The Company’s investments in non-performing debentures were initially recorded at cost which the Company believes was fair value. Management estimated cash flows expected to be collected considering the contractual terms of the loans, the nature and estimated fair value of collateral, and other factors it deemed appropriate. The estimated fair value of the loans at acquisition was significantly less than the contractual amounts due under the terms of the loan agreements.
Since, at the acquisition date, the Company expected to collect less than the contractual amounts due under the terms of the loans based, at least in part, on the assessment of the credit quality of the borrower, the loans are accounted for in accordance with ASC Topic 310-30, Loans and Debt Securities Acquired with Deteriorated Credit Quality (“ASC 310-30”). The difference between the contractually required payments on the loans as of the acquisition date and the total cash flows expected to be collected, or non-accretable difference, is not recognized and totaled $2.1 million, $1.5 million and $1.5 million, plus accrued interest in arrears as of June 30, 2014, May 31, 2013 and June 30, 2013, respectively.
Debentures are classified as non-accrual when management is unable to reasonably estimate the timing or amount of cash flows expected to be collected from the debentures or has serious doubts about further collectability of principal or interest. As of June 30, 2014 and 2013, all of the Company’s debentures were on non-accrual status since the borrower remains under the supervision of the bankruptcy court.
The Company periodically re-evaluates cash flows expected to be collected for each debenture based upon all available information as of the measurement date. Subsequent increases in cash flows expected to be collected are recognized prospectively through an adjustment to the debenture’s yield over its remaining life, which may result in a reclassification from non-accretable difference to accretable yield. Subsequent decreases in cash flows expected to be collected are evaluated to determine whether a provision for loan loss should be established. If decreases in expected cash flows result in a decrease in the estimated fair value of the debenture below its amortized cost, the debenture is deemed to be impaired and the Company will record a provision for impairment to write the debenture down to its estimated fair value. The Company recorded impairment on debentures of $0.5 million during the fiscal year ended May 31, 2013. The Company did not record an impairment during the fiscal year ended June 30, 2014 or the one month ended June 30, 2013.
The Company’s investments in non-performing debentures are classified as held to maturity because the Company has the intent and ability to hold them until maturity.
| F-8 |
Cash and cash equivalents
The Company considers all highly liquid debt instruments purchased with an original maturity of three months or less to be cash equivalents. At times, the amount of cash and cash equivalents on deposit in financial institutions exceeds federally insured limits. The Company monitors the soundness of the financial institutions and believes the Company’s risk is negligible.
Restricted cash
Restricted cash is classified as long-term based on the terms of the agreement. Restricted cash at June 30, 2014, May 31, 2013 and June 30, 2013 represents cash held in U.S. banks as collateral for standby letters of credit issued in connection with the Company’s oil and natural gas production activities.
Financial instruments
The carrying amounts of financial instruments, including cash and cash equivalents, accounts receivable, accounts payable and accrued liabilities and long-term debt, approximate fair value as of June 30, 2014, May 31, 2013 and June 30, 2013.
Oil and natural gas properties
Effective June 1, 2011, the Company follows the successful efforts method of accounting for its oil and natural gas producing activities. The change in accounting principle has been applied retroactively to prior periods. Costs to acquire mineral interests in oil and natural gas properties and to drill and equip development wells and related asset retirement costs are capitalized. Costs to drill exploratory wells are capitalized pending determination of whether the wells have proved reserves. If the Company determines that the wells do not have proved reserves, the costs are charged to expense. There were no exploratory wells capitalized pending determination of whether the wells have proved reserves at June 30, 2014, May 31, 2013 and June 30, 2013. Geological and geophysical costs, including seismic studies and costs of carrying and retaining unproved properties, are charged to expense as incurred. The Company capitalizes interest on expenditures for significant exploration and development projects that last more than six months while activities are in progress to bring the assets to their intended use. Through June 30, 2014, the Company had capitalized no interest costs because its exploration and development projects generally lasted less than six months. Costs incurred to maintain wells and related equipment are charged to expense as incurred.
On the sale or retirement of a complete unit of a proved property, the cost and related accumulated depreciation, depletion and amortization are eliminated from the property accounts, and the resultant gain or loss is recognized. On the retirement or sale of a partial unit of proved property, the cost is charged to accumulated depreciation, depletion and amortization, with a resulting gain or loss recognized in income.
Capitalized amounts attributable to proved oil and natural gas properties are depleted by the unit-of-production method over proved reserves using the unit conversion ratio of six Mcf of gas to one barrel of oil equivalent (“Boe”). The ratio of six Mcf of natural gas to one Boe is based upon energy equivalency, rather than price equivalency. Given current price differentials, the price for a Boe for natural gas differs significantly from the price for a barrel of oil.
It is common for operators of oil and natural gas properties to request that joint interest owners pay for large expenditures, typically for drilling new wells, in advance of the work commencing. This right to call for cash advances is typically found in the operating agreement that joint interest owners in a property adopt. The Company records these advance payments in prepaid and other current assets in its property account and releases this account when the actual expenditure is later billed to it by the operator.
On the sale of an entire interest in an unproved property for cash or cash equivalents, gain or loss on the sale is recognized, taking into consideration the amount of any recorded impairment if the property had been assessed individually. If a partial interest in an unproved property is sold, the amount received is treated as a reduction of the cost of the interest retained.
Impairment of long-lived assets
The Company evaluates its long-lived assets for potential impairment in their carrying values whenever events or changes in circumstances indicate such impairment may have occurred. Oil and natural gas properties are evaluated for potential impairment by field. Other properties are evaluated for impairment on a specific asset basis or in groups of similar assets, as applicable. An impairment on proved properties is recognized when the estimated undiscounted future net cash flows of an asset are less than its carrying value. If an impairment occurs, the carrying value of the impaired asset is reduced to its estimated fair value, which is generally estimated using a discounted cash flow approach. If the results of an assessment indicate that the properties are impaired, the amount of the impairment is added to the capitalized costs to be amortized. During fiscal years ended June 30, 2014 and May 31, 2012, the Company recognized impairments on its proved properties of $0.3 million and $1.0 million, respectively. The Company did not recognize an impairment on its proved properties during the fiscal year ended May 31, 2013 or the one month ended June 30, 2013.
| F-9 |
Unproved oil and natural gas properties do not have producing properties. As reserves are proved through the successful completion of exploratory wells, the cost is transferred to proved properties. The cost of the remaining unproved basis is periodically evaluated by management to assess whether the value of a property has diminished. To do this assessment, management considers estimated potential reserves and future net revenues from an independent expert, the Company’s history in exploring the area, the Company’s future drilling plans per its capital drilling program prepared by the Company’s reservoir engineers and operations management and other factors associated with the area. Impairment is taken on the unproved property cost if it is determined that the costs are not likely to be recoverable. The valuation is subjective and requires management to make estimates and assumptions which, with the passage of time, may prove to be materially different from actual results. During fiscal years ended June 30, 2014, May 31, 2013 and 2012, the Company recognized impairments on its unproved properties of $0.2 million, $0.4 million and $1.0 million, respectively. The Company did not recognize an impairment on its unproved properties during the one month ended June 30, 2013.
Revenue and accounts receivable
The Company recognizes revenue for its production when the quantities are delivered to, or collected by, the purchaser. Prices for such production are generally defined in sales contracts and are readily determinable based on certain publicly available indices. All transportation costs are included in lease operating expense.
Accounts receivable — oil and natural gas sales consist of uncollateralized accrued revenues due under normal trade terms, generally requiring payment within 30 to 60 days of production. Accounts receivable — joint interest consist of amounts owed from interest owners of the Company’s operated wells. No interest is charged on past-due balances. Payments made on all accounts receivable are applied to the earliest unpaid items. The Company reviews accounts receivable periodically and reduces the carrying amount by a valuation allowance that reflects its best estimate of the amount that may not be collectible. No valuation allowance was recognized as of June 30, 2014, May 31, 2013 and June 30, 2013.
Dependence on major customers
For the fiscal year ended June 30, 2014, approximately 63% of the Company’s revenues were attributable to sales of oil to four customers, and approximately 18% of the Company’s revenues were received from one operator pursuant to a joint operating agreement. For the fiscal year ended May 31, 2013, approximately 85% of the Company’s revenues were attributable to sales of oil to two customers, and approximately 11% of the Company’s revenues were received from one operator pursuant to a joint operating agreement. For the fiscal year ended May 31, 2012, approximately 50% of the Company’s revenues were attributable to sales of oil to one customer, and approximately 41% of the Company’s revenues were received from one operator pursuant to a joint operating agreement. The Company believes that there are potential alternative purchasers and that it may be necessary to establish relationships with new purchasers. However, there can be no assurance that the Company can establish such relationships and that those relationships will result in an increased number of purchasers. Although the Company is exposed to a concentration of credit risk, the Company believes that all of its purchasers are creditworthy. The Company had no bad debt for the fiscal years ended June 30, 2014, May 31, 2013 and 2012 and the one month ended June 30, 2013.
Other property
Furniture, fixtures and equipment are carried at cost. Depreciation of furniture, fixtures and equipment is provided using the straight-line method over estimated useful lives ranging from three to ten years. Gain or loss on retirement or sale or other disposition of assets is included in income in the period of disposition.
Income taxes
The Company is subject to U.S. federal income taxes along with state income taxes in Texas, New Mexico and Arkansas. When tax returns are filed, it is highly certain that some positions taken would be sustained upon examination by the taxing authorities, while others are subject to uncertainty about the merits of the position taken or the amount of the position that would be ultimately sustained. The benefit of a tax position is recognized in the financial statements in the period during which, based on all available evidence, management believes it is more likely than not that the position will be sustained upon examination, including the resolution of appeals or litigation processes, if any. Tax positions taken are not offset or aggregated with other positions. Tax positions that meet the more-likely-than-not recognition threshold are measured as the largest amount of tax benefit that is more than 50% likely of being realized upon settlement with the applicable taxing authority. The portion of the benefits associated with tax positions taken that exceeds the amount measured as described above is reflected as a liability for unrecognized tax benefits in the accompanying Consolidated Balance Sheets along with any associated interest and penalties that would be payable to the taxing authorities upon examination. Interest and penalties associated with unrecognized tax benefits are classified as additional income taxes in the Company’s Consolidated Statements of Operations. The Company accrues interest and penalties, if any, related to unrecognized tax benefits as a component of income tax expense.
Deferred tax assets and liabilities are recognized for the estimated future tax consequences attributable to the differences between the financial statement carrying amounts of existing assets and liabilities and their respective tax bases. Deferred tax assets and liabilities are measured using the tax rate in effect for the year in which those temporary differences are expected to be recovered or settled. The effect of a change in tax rates on deferred tax assets and liabilities is recognized in income in the year of the enacted tax rate change. In addition, a valuation allowance is established to reduce any deferred tax asset for which it is determined that it is more likely than not that some portion of the deferred tax asset will not be realized.
| F-10 |
Asset retirement obligations
Asset retirement obligations (“AROs”) associated with the retirement of tangible long-lived assets are recognized as liabilities with an increase to the carrying amounts of the related long-lived assets in the period incurred. The cost of the tangible asset, including the asset retirement cost, is depreciated over the useful life of the asset. AROs are recorded at estimated fair value, measured by reference to the expected future cash outflows required to satisfy the retirement obligations discounted at the Company’s credit-adjusted risk-free interest rate. Accretion expense is recognized over time as the discounted liabilities are accreted to their expected settlement value. If estimated future costs of AROs change, an adjustment is recorded to both the ARO and the long-lived asset. Revisions to estimated AROs can result from changes in retirement cost estimates, revisions to estimated inflation rates and changes in the estimated timing of abandonment.
Earnings per common share
The Company reports basic earnings per common share, which excludes the effect of potentially dilutive securities, and diluted earnings per common share, which includes the effect of all potentially dilutive securities, unless their impact is anti-dilutive.
Derivative financial instruments
All derivative instruments are recorded on the Company’s Consolidated Balance Sheet at fair value. Historically, the Company has not designated its derivative instruments as cash-flow hedges. Although the Company has not designated its derivative instruments as cash-flow hedges, it uses those instruments to reduce its exposure to fluctuations in commodity prices related to its oil and natural gas production. Unrealized gains and losses, at fair value, are included on the Company’s Consolidated Balance Sheets as current or non-current assets or liabilities based on the anticipated timing of cash settlements under the related contracts. Changes in the fair value of the Company’s commodity derivative contracts and realized gains and losses are recorded in earnings as they occur and included in other income (expense) on the Company’s Consolidated Statements of Operations.
Recent accounting pronouncements
In May 2014, the FASB issued Accounting Standards Update No. 2014-09, Revenue from Contracts with Customers (“ASU 2014-09”), which supersedes nearly all existing revenue recognition guidance under U.S. GAAP. The core principle of ASU 2014-09 is to recognize revenues when promised goods or services are transferred to customers in an amount that reflects the consideration to which an entity expects to be entitled for those goods or services. ASU 2014-09 defines a five step process to achieve this core principle and, in doing so, more judgment and estimates may be required within the revenue recognition process than are required under existing U.S. GAAP. The standard is effective for annual periods beginning after December 15, 2016, and interim periods therein, using either of the following transition methods: (i) a full retrospective approach reflecting the application of the standard in each prior reporting period with the option to elect certain practical expedients, or (ii) a retrospective approach with the cumulative effect of initially adopting ASU 2014-09 recognized at the date of adoption (which includes additional footnote disclosures). The Company is currently evaluating the impact of the adoption of ASU 2014-09 on its consolidated financial statements and have not yet determined the method by which it will adopt the standard in 2017.
4. Investment in Cross Border Resources, Inc.
On May 23, 2011, the Company entered into a securities purchase agreement with Cross Border Resources, Inc. (“Cross Border”), pursuant to which the Company purchased 2,136,164 units of Cross Border for a purchase price of $3.2 million. Each unit included one share of common stock of Cross Border and one warrant to acquire an additional share of common stock of Cross Border. The warrants have an exercise price of $2.25 per share. The warrants are exercisable until May 26, 2016. As of May 31, 2011, the Company owned approximately 13.2% of Cross Border’s outstanding common stock valued at $4.8 million based on the closing market price on that date.
During the fiscal year ended May 31, 2012, the Company entered into several stock purchase and sale agreements with a limited number of stockholders pursuant to which the Company acquired 2,701,261 shares of common stock of Cross Border from such stockholders in exchange for the issuance of 480,396 shares of the Company’s common stock and $287,532 in cash. As of May 31, 2012, the Company owned approximately 30.0% of Cross Border’s outstanding common stock valued at $9.0 million based on the closing market price on that date.
Due to increased ownership in Cross Border during the fiscal year ended May 31, 2012, the Company retroactively applied the equity method of accounting to all prior periods presented. The difference between the Company’s gross investment of $7.6 million in Cross Border and equity share of net assets totaling $5.2 million has been allocated to the Company’s investment in Cross Border’s oil and natural gas properties. The excess basis of the Company’s gross investment over the equity share of net assets is depleted each quarter based upon Cross Border’s depletion rate calculated on its oil and natural gas properties. The depletion for the fiscal years ended May 31, 2013 and 2012 was $346,818 and $243,921, respectively.
| F-11 |
Due to timing differences in the Company’s and Cross Border’s fiscal year ends and quarterly periods and due to the lack of financial information for Cross Border for the current quarterly period, the Company books its share of Cross Border’s financial activity on a two-month lag. In accordance with the equity method of accounting, the investment is initially recorded at cost and adjusted to reflect the Company’s share of changes in Cross Border’s capital. It is further adjusted to recognize the Company’s share of Cross Border’s earnings as they occur, rather than as dividends or other distributions are received. The Company’s share of Cross Border’s earnings would also include any other-than-temporary declines in fair value recognized during the period. Changes in the Company’s proportionate share of the underlying equity of Cross Border which result from Cross Border’s issuance of additional equity securities are recognized as increases or decreases in stockholders’ equity, net of any related tax effects. The Company recognized losses in its equity investment in Cross Border for net loss by Cross Border of $14,390 and $71,998 for the period June 1, 2012 to January 28, 2013 and the fiscal year ended May 31, 2012, respectively, in the Company’s Consolidated Statements of Operations. The Company consolidated Cross Border beginning January 28, 2013. See Note 5 – Acquisitions for further discussion.
The following represents Cross Border’s summarized unaudited financial information as of and for the twelve months ended March 31, 2012:
| (in thousands) | March 31, 2012 | |||
| Assets: | ||||
| Total current assets | $ | 4,059 | ||
| Noncurrent assets | 31,878 | |||
| Total assets | $ | 35,937 | ||
| Liabilities: | ||||
| Total current liabilities | $ | 5,466 | ||
| Total long-term liabilities | 11,824 | |||
| Equity | 18,647 | |||
| Total liabilities and equity | $ | 35,937 | ||
| Revenues | $ | 9,320 | ||
| Income from operations | $ | 1,041 | ||
| Net income | $ | 21 | ||
As of June 30, 2014 and May 31, 2013, the Company held 2,502,831 common stock purchase warrants for the purchase of common stock of Cross Border. The warrants have an exercise price of $2.25 per share and are exercisable until May 26, 2016. As discussed in Note 5 - Acquisitions, Cross Border was consolidated as of January 28, 2013 and therefore the warrants had no value as of June 30, 2014 and May 31, 2013.
5. Acquisitions
Acquisition of properties
In April 2012, the Company acquired oil and natural gas interests in approximately 547 gross and net acres in the East Ranch Prospect in Pecos County, Texas for cash consideration of $421,000. In April 2012, the Company also acquired oil and natural gas interests in 989 gross and net acres in the West Ranch Prospect in Pecos County, Texas for cash consideration of $677,000. The Company owns a 100% working interest and an 80% net revenue interest in these properties.
The following transactions have been accounted for using the acquisition method of accounting which requires that, among other things, assets acquired and liabilities assumed be recorded at their fair values as of the acquisition date. The Company has finalized the determination of the fair values of the assets acquired and liabilities assumed in the acquisitions below.
Cross Border Resources, Inc.
On January 28, 2013, the Company acquired 5,091,210 shares of common stock of Cross Border from a limited number of stockholders of Cross Border in exchange for the issuance of 1,018,242 shares of common stock of the Company, bringing its total ownership to 78% of the outstanding Cross Border common stock. Prior to January 28, 2013, the Company accounted for its investment in Cross Border as an equity method investment. After January 28, 2013, the Company consolidates Cross Border and prior periods are not restated. The Company incurred transaction expense of $0.9 million and $0.6 million for the fiscal years ended May 31, 2013 and 2012 in connection with its acquisition of Cross Border.
| F-12 |
Prior to this acquisition, the Company owned 47% of Cross Border’s outstanding common stock. In accordance with ASC 805, the Company accounted for this transaction as a step acquisition, remeasured its previously held investment to fair value and recorded the approximately $0.7 million difference between fair value and its carrying value as gain on consolidation of Cross Border Resources, Inc. in the Company’s Consolidated Statements of Operations. The acquisition date fair value of the Company’s ownership of 78% of Cross Border’s outstanding common stock was approximately $21.3 million, and the carrying value was approximately $20.6 million. This fair value was determined using a market approach, which includes significant Level 3 unobservable inputs.
The Company consolidated the results of operations of Cross Border for the four month period from January 28, 2013 to May 31, 2013. Accordingly, the Company recorded a $2.0 million charge to accumulated deficit for the two-month lag resulting from differences in the Company’s and Cross Border’s fiscal year ends and quarterly periods.
On April 26, 2013, the Company issued 57,530 shares of common stock to certain shareholders of Cross Border as consideration for the purchase of 287,653 shares of Cross Border’s common stock. The aggregate value of the common stock issued was $460,245. Management determined the fair value based on the closing price of the Company’s common stock on the OTCBB on the date of issuance. The additional shares increased the Company’s ownership in Cross Border’s outstanding common stock to 83%.
The Company recorded the initial step acquisition as follows:
| (in thousands) | ||||
| Purchase Price: | ||||
| Fair value of 2,054 shares of the Company’s common stock exchanged for Cross Border common stock | $ | 18,282 | ||
| Cash acquisition of Cross Border common stock | 3,492 | |||
| Acquisition of Cross Border note payable and accrued interest | 697 | |||
| Total consideration paid | $ | 22,471 | ||
| Add: Estimated Fair Value of Liabilities Assumed: | ||||
| Accounts payable | $ | 4,794 | ||
| Asset retirement obligations | 3,329 | |||
| Environmental liability | 2,100 | |||
| Line of credit | 8,750 | |||
| Creditors payable | 1,353 | |||
| Accrued expense and other liabilities | 114 | |||
| Amount attributable to liabilities assumed | 20,440 | |||
| Noncontrolling interest | 6,359 | |||
| Total purchase price | $ | 49,270 | ||
| Estimated Fair Value of Net Assets Acquired: | ||||
| Cash | $ | 279 | ||
| Accounts receivable | 2,815 | |||
| Prepaid and other current assets | 451 | |||
| Derivative assets | 35 | |||
| Other property and equipment | 52 | |||
| Proved oil and gas properties | 29,376 | |||
| Unproved oil and gas properties | 16,208 | |||
| Other long-term assets | 54 | |||
| Amount attributable to net assets acquired | $ | 49,270 | ||
The Company and Cross Border are parties to a Technical Service Agreement under which the Company provides operational services, such as workovers, for Cross Border’s operated wells which costs are eliminated on consolidation.
Bamco Gas, LLC
On December 10, 2012, Red Mountain issued 237,500 shares of common stock to the indenture trustee of certain debentures of Bamco Gas, LLC (“Bamco”) pursuant to a purchase agreement in which the Company agreed to acquire certain assets of the receivership estate of Bamco, mainly consisting of working interests and claims and causes of action in or relating to certain oil and gas exploration projects in Duval, Johnson and Zapata Counties in Texas. Bamco was considered a related party prior to the transaction because Alan Barksdale, the chief executive officer and chairman of the board of the Company was the receiver for the receivership estate. As part of the consideration paid, the Company executed a waiver and release of a certain claim against the receivership estate of Bamco for a $2.7 million note receivable that the Company deemed uncollectible in 2011. Transaction expense incurred in the acquisition of Bamco’s assets was not material.
| F-13 |
The Company recorded the purchase price as follows:
| (in thousands) | ||||
| Purchase Price: | ||||
| Fair value of 238 shares of the Company’s common stock issued | $ | 2,232 | ||
| Asset retirement obligations assumed | 403 | |||
| Post-closing adjustments | 84 | |||
| Total purchase price | $ | 2,719 | ||
| Estimated Fair Value of Net Assets Acquired: | ||||
| Proved oil and gas properties | $ | 1,909 | ||
| Unproved oil and gas properties | 810 | |||
| Amount attributable to net assets acquired | $ | 2,719 | ||
Pro forma results of operations
The following table presents the unaudited pro forma results of operations as though the acquisitions of Cross Border and Bamco had occurred as of June 1, 2011 (in thousands, except per share amounts):
| Fiscal Year Ended May 31, | ||||||||
| 2013 | 2012 | |||||||
| Revenues | $ | 17,118 | $ | 18,101 | ||||
| Loss from operations | (13,821 | ) | (3,711 | ) | ||||
| Net loss | (18,709 | ) | (9,088 | ) | ||||
| Basic and diluted net loss per common share | $ | (1.80 | ) | $ | (0.90 | ) | ||
6. Oil and Natural Gas Properties and Other Property and Equipment
Oil and natural gas properties
The following table sets forth the capitalized costs under the successful efforts method for oil and natural gas properties:
| (in thousands) | June 30, 2014 | May 31, 2013 | June 30, 2013 | |||||||||
| Oil and natural gas properties: | ||||||||||||
| Proved | $ | 82,362 | $ | 63,891 | $ | 64,539 | ||||||
| Unproved | 19,109 | 19,539 | 19,622 | |||||||||
| Total oil and natural gas properties | 101,471 | 83,430 | 84,161 | |||||||||
| Less accumulated depletion and impairment | (19,138 | ) | (9,140 | ) | (9,788 | ) | ||||||
| Net oil and natural gas properties capitalized costs | $ | 82,333 | $ | 74,290 | $ | 74,373 | ||||||
At June 30, 2014, May 31, 2013 and June 30, 2013, the capitalized costs of the Company’s oil and natural gas properties included (i) $39.0 million, $39.2 million and $39.2 million, respectively, relating to acquisition costs of proved properties which are being amortized by the unit-of-production method using total proved reserves and (ii) $39.6 million, $21.9 million and $25.3 million, respectively, relating to exploratory well costs and additional development costs which are being amortized by the unit-of-production method using proved developed reserves.
During the fiscal years ended June 30, 2014, May 31, 2013 and 2012, the Company incurred approximately $1.2 million, $0.8 million and $0.3 million, respectively, in exploratory drilling costs, of which all amounts were included in exploration expense. During the one month ended June 30, 2013, the Company did not incur any significant exploratory drilling costs. The Company had no transfers of exploratory well costs to proved properties during the fiscal years ended June 30, 2014, May 31, 2013 and 2012 and the one month ended June 30, 2013.
In January 2013, the Company executed a Stipulation of Interest and Cross Conveyance Agreement with Chevron Midcontinent, L.P. (“Chevron”) which provided for the purchase and sale of oil and natural gas leasehold interests and associated wells across lands owned by the Company and Chevron in Lea County, New Mexico. In conjunction with the transaction, the Company received $255,000 and a working interest in a portion of the leasehold owned by Chevron, and Chevron received a working interest in a portion of the leasehold owned by the Company.
| F-14 |
The Company recorded $0.2 million of impairment related to its unproved oil and gas properties during the fiscal year ended June 30, 2014 related to expiring acreage. The Company recorded $0.4 million of impairment related to its unproved oil and natural gas properties during the fiscal year ended May 31, 2013 related to expiring acreage. The Company recorded a $1.0 million expense on its unproved oil and natural gas properties during the fiscal year ended May 31, 2012 attributable to expired leases on its Pawnee Prospect and the abandonment of its Bayou Darbonne Prospect. The expense is included in exploration expense in the Company’s Consolidated Statements of Operations. The Company recorded no impairment related to its unproved oil and natural gas properties during the one month ended June 30, 2013.
The Company recorded $0.3 million in impairment charges on its proved properties for the fiscal year ended June 30, 2014, primarily due to a decline in reserves and production associated with wells on its Pawnee and Walnut Creek Prospects, which was included in depreciation, depletion, amortization and impairment in the Company’s Consolidated Statements of Operations. The Company recorded $1.0 million in impairment charges on its proved properties for the fiscal year ended May 31, 2012, primarily due to a decline in reserves and production associated with wells on its Pawnee Prospect, which was included in depreciation, depletion, amortization and impairment in the Company’s Consolidated Statements of Operations. There was no impairment to the Company’s proved properties during the fiscal year ended May 31, 2013 and the one month ended June 30, 2013.
Other property and equipment
The historical cost of other property and equipment, presented on a gross basis with accumulated depreciation and amortization is summarized as follows:
| (in thousands) | June 30, 2014 | May 31, 2013 | June 30, 2013 | |||||||||
| Other property and equipment | $ | 1,196 | $ | 1,026 | $ | 1,061 | ||||||
| Less accumulated depreciation and amortization | (359 | ) | (184 | ) | (199 | ) | ||||||
| Net property and equipment | $ | 837 | $ | 842 | $ | 862 | ||||||
7. Asset Retirement Obligations
The following table presents the balance and activity of the Company’s ARO for the periods indicated:
| Fiscal Year Ended | One Month Ended | |||||||||||
| (in thousands) | June 30, 2014 | May 31, 2013 | June 30, 2013 | |||||||||
| Asset retirement obligations at beginning of period | $ | 5,020 | $ | 836 | $ | 4,979 | ||||||
| Liabilities incurred | 75 | 22 | 19 | |||||||||
| Liabilities settled | (2 | ) | (53 | ) | — | |||||||
| Acquisitions | — | 3,728 | — | |||||||||
| Accretion expense | 267 | 150 | 22 | |||||||||
| Revisions in estimated liabilities | 385 | 296 | — | |||||||||
| Asset retirement obligations at end of period | $ | 5,745 | $ | 4,979 | $ | 5,020 | ||||||
| Less: current portion | 214 | 228 | 228 | |||||||||
| Long-term portion | $ | 5,531 | $ | 4,751 | $ | 4,792 | ||||||
During the fiscal years ended June 30, 2014 and May 31, 2013, the Company recorded an upward revision to previous estimates for its ARO primarily due to changes in the estimated future cash outlays.
8. Derivatives
At June 30, 2014, the Company had the following commodity derivatives positions outstanding:
| Commodity and Time Period | Contract Type | Volume Transacted | Contract Price | ||||
| Crude Oil | |||||||
| July 1, 2014—August 31, 2014 Collar—Minimum | Option | 1,437 Bbls/month | $ | 80.00/Bbl | |||
| July 1, 2014—August 31, 2014 Collar—Maximum | Option | 1,437 Bbls/month | $ | 100.50/Bbl | |||
| July 1, 2014—November 30, 2014 | Swap | 2,000 Bbls/month | $ | 93.50/Bbl | |||
| July 1, 2014—December 31, 2014 | Put | 1,979-8,330 Bbls/month | $95.00 - $100.00/Bbl | ||||
| F-15 |
At May 31, 2013 and June 30, 2013, the Company had the following commodity derivatives positions outstanding:
| Commodity and Time Period | Contract Type | Volume Transacted | Contract Price | ||||
| Crude Oil | |||||||
| June 1, 2013—August 1, 2014 Collar - Minimum | Option | 437-1,936 Bbls/month | $ | 80.00/Bbl | |||
| June 1, 2013—August 1, 2014 Collar - Maximum | Option | 437-1,936 Bbls/month | $ | 100.50/Bbl | |||
| June 1, 2013—November 1, 2014 | Swap | 2,000 Bbls/month | $ | 93.50/Bbl | |||
| June 1, 2013—February 28, 2014 | Swap | 1,000 Bbls/month | $ | 106.50/Bbl | |||
The following table summarizes the fair value of the Company’s open commodity derivatives as of June 30, 2014, May 31, 2013 and June 30, 2013 (in thousands):
| Balance Sheet Location | Fair Value | |||||||||||||
| June 30, | May 31, | June 30, | ||||||||||||
| 2014 | 2013 | 2013 | ||||||||||||
| Derivatives not designated as hedging instruments | ||||||||||||||
| Commodity derivatives | Commodities derivative asset | $ | 37 | $ | 265 | $ | 132 | |||||||
| Commodity derivatives | Commodities derivative liabilities | $ | (121 | ) | $ | (34 | ) | $ | — | |||||
The following table summarizes the change in the fair value of the Company’s commodity derivatives (in thousands):
| Income Statement Location | Fiscal Year Ended | One Month Ended | ||||||||||||||||
| June 30, 2014 | May 30, 2013 | May 30, 2012 | June 30, 2013 | |||||||||||||||
| Derivatives not designated as hedging instruments | ||||||||||||||||||
| Commodity derivatives | Gain (loss) on derivatives | $ | (544 | ) | $ | 49 | $ | — | $ | (104 | ) | |||||||
Unrealized gains and losses, at fair value, are included on the Company’s Consolidated Balance Sheets as current or non-current assets or liabilities based on the anticipated timing of cash settlements under the related contracts. Changes in the fair value of the Company’s commodity derivatives contracts are recorded in earnings as they occur and included in other income (expense) on the Company’s Consolidated Statements of Operations. The Company estimates the fair values of swap contracts based on the present value of the difference in exchange-quoted forward price curves and contractual settlement prices multiplied by notional quantities. The Company internally valued the option contracts using industry-standard option pricing models and observable market inputs. The Company uses its internal valuations to determine the fair values of the contracts that are reflected on its Consolidated Balance Sheets. Realized gains and losses are also included in other income (expense) on its Consolidated Statements of Operations.
The Company is exposed to credit losses in the event of nonperformance by the counterparties on its commodity derivatives positions and has considered the exposure in its internal valuations. However, the Company does not anticipate nonperformance by the counterparties over the term of the commodity derivatives positions.
In connection with the closing of the Senior First Lien Secured Credit Agreement (as amended, the “Credit Agreement”) with Cross Border, Black Rock Capital, Inc. (“Black Rock”) and RMR Operating, LLC (collectively with the Company, the “Borrowers”) and Independent Bank, as Lender (the “Lender”), the Company was required to enter into hedging agreements effectively hedging at least 50% of the oil volumes of the Company and its subsidiaries. At the same time, the Company entered into a Novation Agreement with BP Energy Company that transferred Cross Border’s then-existing swap agreements to the Company. Pursuant to an Inter-Borrower Agreement among the Borrowers, the Company allocates these swap agreements back to Cross Border and may allocate future hedging agreements related to Cross Border’s production to Cross Border.
| F-16 |
9. Fair Value Measurements
Fair value measurements are based upon inputs that market participants use in pricing an asset or liability, which are classified into two categories: observable inputs and unobservable inputs. Observable inputs represent market data obtained from independent sources, whereas unobservable inputs reflect a company’s own market assumptions, which are used if observable inputs are not reasonably available without undue cost and effort. These two types of inputs are further prioritized into the following fair value input hierarchy:
| ● | Level 1 – quoted prices for identical assets or liabilities in active markets. |
| ● | Level 2 – quoted prices for similar assets or liabilities in active markets; quoted prices for identical or similar assets or liabilities in markets that are not active, inputs other than quoted prices that are observable for the asset or liability (e.g. interest rates) and inputs derived principally from or corroborated by observable market data by correlation or other means. |
| ● | Level 3 – unobservable inputs for the asset or liability. |
The fair value input hierarchy level to which an asset or liability measurement in its entirety falls is determined based on the lowest level input that is significant to the measurement in its entirety.
The following table summarizes the valuation of the Company’s financial assets and liabilities at June 30, 2014, May 31, 2013 and June 30, 2013:
| Fair Value Measurements at Reporting Date Using | ||||||||||||||||
| (in thousands) | Quoted
Prices in Active Markets for Identical Assets or Liabilities (Level 1) | Significant or Other Observable Inputs (Level 2) | Significant Unobservable Inputs (Level 3) | Fair Value at June 30, 2014 | ||||||||||||
| Assets: | ||||||||||||||||
| Commodities derivatives | $ | — | $ | 37 | $ | — | $ | 37 | ||||||||
| Oil and gas properties impairment (nonrecurring) | — | — | (487 | ) | (487 | ) | ||||||||||
| Total | $ | — | $ | 37 | $ | (487 | ) | $ | (450 | ) | ||||||
| Liabilities: | ||||||||||||||||
| Asset retirement obligations (non-recurring) | $ | — | $ | — | $ | (5,745 | ) | $ | (5,745 | ) | ||||||
| Commodities derivative liability | — | (121 | ) | — | (121 | ) | ||||||||||
| Environmental remediation liability | — | — | (2,067 | ) | (2,067 | ) | ||||||||||
| Total | $ | — | $ | (121 | ) | $ | (7,812 | ) | $ | (7,933 | ) | |||||
| Fair Value Measurements at Reporting Date Using | ||||||||||||||||
| (in thousands) | Quoted
Prices in Active Markets for Identical Assets or Liabilities (Level 1) | Significant or Other Observable Inputs (Level 2) | Significant Unobservable Inputs (Level 3) | Fair Value at May 31, 2013 | ||||||||||||
| Assets: | ||||||||||||||||
| Commodities derivatives | $ | — | $ | 265 | $ | — | $ | 265 | ||||||||
| Oil and gas properties impairment (nonrecurring) | — | — | (411 | ) | (411 | ) | ||||||||||
| Total | $ | — | $ | 265 | $ | (411 | ) | $ | (146 | ) | ||||||
| Liabilities: | ||||||||||||||||
| Asset retirement obligations (non-recurring) | $ | — | $ | — | $ | (4,979 | ) | $ | (4,979 | ) | ||||||
| Commodities derivative liability | — | (34 | ) | — | (34 | ) | ||||||||||
| Environmental remediation liability | — | — | (2,088 | ) | (2,088 | ) | ||||||||||
| Total | $ | — | $ | (34 | ) | $ | (7,067 | ) | $ | (7,101 | ) | |||||
| F-17 |
| Fair Value Measurements at Reporting Date Using | ||||||||||||||||
| (in thousands) | Quoted
Prices in Active Markets for Identical Assets or Liabilities (Level 1) | Significant or Other Observable Inputs (Level 2) | Significant Unobservable Inputs (Level 3) | Fair Value at June 30, 2013 | ||||||||||||
| Assets: | ||||||||||||||||
| Commodities derivative asset | $ | — | $ | 132 | $ | — | $ | 132 | ||||||||
| Total | $ | — | $ | 132 | $ | — | $ | 132 | ||||||||
| Liabilities: | ||||||||||||||||
| Asset retirement obligations (non-recurring) | $ | — | $ | — | $ | (5,020 | ) | $ | (5,020 | ) | ||||||
| Environmental remediation liability | — | — | (2,088 | ) | (2,088 | ) | ||||||||||
| Total | $ | — | $ | — | $ | (7,108 | ) | $ | (7,108 | ) | ||||||
The following is a summary of changes to fair value measurements using Level 3 inputs during the fiscal years ended June 30, 2014, May 31, 2013 and 2012 and the one month ended June 30, 2013:
| (in thousands) | Environmental Liability | |||
| Balance, May 31, 2012 | — | |||
| Acquisitions | (2,100 | ) | ||
| Settlement of liabilities | 12 | |||
| Acquired debentures | — | |||
| Unrealized gain (loss) recorded in earnings | — | |||
| Balance, May 31, 2013 | (2,088 | ) | ||
| Acquisitions | — | |||
| Settlement of liabilities | — | |||
| Acquired debentures | — | |||
| Unrealized gain (loss) recorded in earnings | — | |||
| Balance, June 30, 2013 | (2,088 | ) | ||
| Acquisitions | — | |||
| Settlement of liabilities | 21 | |||
| Acquired debentures | — | |||
| Unrealized gain (loss) recorded in earnings | — | |||
| Balance, June 30, 2014 | $ | (2,067 | ) | |
The Company accounts for additions to AROs and oil and natural gas properties at fair value on a non-recurring basis. The Company’s accounting policies for AROs are discussed in Note 3, and reconciliations of the Company’s AROs are provided in Note 7 for the periods presented. For purposes of fair value measurement, the Company determined that additions to AROs should be classified as Level 3. The Company recorded additions to AROs of approximately $75,000, $22,000, $632,000 and $19,000 in fiscal years ended June 30, 2014, May 31, 2013 and 2012 and the one month ended June 30, 2013, respectively.
The Company’s accounting policies for oil and gas properties are discussed in Note 3. For purposes of fair value measurement, the Company determined that oil and natural gas properties should be classified as Level 3. See Note 6 for a discussion of impairment recorded during fiscal years 2014, 2013 and 2012 and the one month ended June 30, 2013.
10. Debt
As of the dates indicated, the Company’s debt consisted of the following:
| (in thousands) | June 30, 2014 | May 31, 2013 | June 30, 2013 | |||||||||
| Credit Facility | $ | 26,800 | $ | 19,800 | $ | 19,800 | ||||||
| Subordinated Note | — | 500 | 500 | |||||||||
| Mandatorily redeemable preferred stock, net of discount of $1,561, $0, and $0, respectively | 4,801 | — | — | |||||||||
| Convertible promissory notes, net of discount of $0, $442 and $352 | — | 3,308 | 3,398 | |||||||||
| Total debt | 31,601 | 23,608 | 23,698 | |||||||||
| Less: short-term portion | — | 3,808 | 3,898 | |||||||||
| Long-term debt | $ | 31,601 | $ | 19,800 | $ | 19,800 | ||||||
| F-18 |
Credit Facility
On February 5, 2013, the Company entered into the Credit Agreement with the Borrowers and Lender. The Credit Agreement provides for an up to $100.0 million revolving credit facility (as amended, the “Credit Facility”) with a maturity date of February 5, 2016. The borrowing base under the Credit Facility is determined at the discretion of the Lender based on, among other things, the Lender’s estimated value of the proved reserves attributable to the Borrowers’ oil and natural gas properties that have been mortgaged to the Lender, and is subject to regular redeterminations on September 30 and March 31 of each year, and interim redeterminations described in the Credit Agreement and potentially monthly commitment reductions, in each case which may reduce the amount of the borrowing base. As of June 30, 2014, the borrowing base was $30.0 million.
A portion of the Credit Facility, in an aggregate amount not to exceed $2.0 million, may be used to issue letters of credit for the account of Borrowers. The Borrowers may be required to prepay the Credit Facility in the event of a borrowing base deficiency as a result of over-advances, sales of oil and gas properties or terminations of hedging transactions.
Amounts outstanding under the Credit Facility bear interest at a rate per annum equal to the greater of (x) the U.S. prime rate as published in The Wall Street Journal’s “Money Rates” table in effect from time to time and (y) 4.0% (4.0% at June 30, 2014). Interest is payable monthly in arrears on the last day of each calendar month. Borrowings under the Credit Facility are secured by first priority liens on substantially all the property of each of the Borrowers and are unconditionally guaranteed by Doral West Corp. and Pure Energy Operating, Inc., each a subsidiary of Cross Border.
Under the Credit Agreement, the Borrowers are required to pay fees consisting of (i) an unused facility fee equal to 0.5% multiplied by the average daily unused commitment amount, payable quarterly in arrears until the commitment is terminated; (ii) a fronting fee payable on the date of issuance of each letter of credit and annually thereafter or on the date of any increase or extension thereof, equal to the greater of (a) 2.0% per annum multiplied by the face amount of such letter of credit or (b) $1,000; and (iii) an origination fee (x) of $200,000, and (y) payable on any date the commitment is increased, an additional facility fee equal to 1.0% multiplied by any increase of the commitment above the highest previously determined or redetermined commitment.
The Credit Agreement contains negative covenants that may limit the Borrowers’ ability to, among other things, incur liens, incur additional indebtedness, enter into mergers, sell assets, make investments and pay dividends. The Credit Agreement permits the payment of cash dividends on the Company’s 10.0% Series A Convertible Redeemable Preferred Stock (the “Series A Preferred Stock”) so long as the Company is not otherwise in default under the Credit Agreement and payment of such cash dividends would not cause the Company to be in default under the Credit Agreement.
The Credit Agreement also contains financial covenants, measured as of the last day of each fiscal quarter of Red Mountain, requiring the Borrowers to maintain a ratio of (i) the Borrowers’ and their consolidated subsidiaries’ consolidated current assets (inclusive of the unfunded commitment amount under the Credit Agreement) to consolidated current liabilities (exclusive of the current portion of long-term debt under the Credit Agreement) of at least 1.00 to 1.00; (ii) the Borrowers’ and their subsidiaries’ consolidated “Funded Debt” to consolidated EBITDAX (for the four fiscal quarter period then ended) of less than 3.50 to 1.00; and (iii) the Borrowers’ and their subsidiaries’ consolidated EBITDAX less paid and accrued dividends on the Series A Preferred Stock to interest expenses (each for the four fiscal quarter period then ended) of at least 3.00 to 1.00. Funded Debt is defined in the Credit Agreement as the sum of all debt for borrowed money, whether as a direct or reimbursement obligor, but excludes shares of Series A Preferred Stock. EBITDAX is defined in the Credit Agreement as (a) consolidated net income plus (b) (i) interest expense, (ii) income taxes, (iii) depreciation, (iv) depletion and amortization expenses, (v) dry hole and exploration expenses, (vi) non-cash losses or charges on any hedge agreements resulting from derivative accounting, (vii) extraordinary or non-recurring losses, (viii) expenses that could be capitalized under GAAP but by election of Borrowers are being expensed for such period under GAAP, (ix) costs associated with intangible drilling costs, (x) other non-cash charges, (xi) one-time expenses associated with transactions associated with (b)(i) through (iv), minus (c)(i) non-cash income on any hedge agreements resulting from FASB Statement 133, (ii) extraordinary or non-recurring income, and (iii) other non-cash income.
Amounts outstanding under the Credit Facility may be accelerated and become immediately due and payable upon specified events of default of Borrowers, including, among other things, a default in the payment of principal, interest or other amounts due under the Credit Facility, certain loan documents or hydrocarbon hedge agreements, a material inaccuracy of a representation or warranty, a default with regard to certain loan documents which remains unremedied for a period of 30 days following notice, a default in the payment of other indebtedness of the Borrowers of $200,000 or more, bankruptcy or insolvency, certain changes in control, failure of the Lender’s security interest in any portion of the collateral with a value greater than $500,000, cessation of any security document to be in full force and effect, or Alan Barksdale ceasing to be Red Mountain’s Chief Executive Officer or Chairman of Cross Border and not being replaced with an officer acceptable to the Lender within 30 days.
Pursuant to the Credit Agreement, at least one of the Borrowers is required to have acceptable hedge agreements in place at all times effectively hedging at least 50% of the oil volumes of the Borrowers. Pursuant to the terms of the Credit Agreement, Red Mountain has hedge agreements with various counterparties hedging a portion of the future oil production of the Borrowers.
| F-19 |
As of June 30, 2014, the Borrowers had collectively borrowed $26.8 million and had availability of $3.2 million under the Credit Facility. The Company was in compliance with all of the financial covenants under the Credit Facility described above at June 30, 2014.
Subordinated Note
On February 6, 2013, the Company issued an Unsecured Subordinated Promissory Note (as amended, the “Subordinated Note”) in the aggregate principal amount of $500,000 payable to Hyman Belzberg, William Belzberg and Caddo Management, Inc. (the “Note Lender”). On July 30, 2013, the Company entered into Amendment No. 1 (the “Amendment”) to the Subordinated Note to extend the maturity date of the Subordinated Note from July 31, 2013 to August 31, 2013. The Subordinated Note accrued interest at a rate of 12% per annum, payable monthly. Upon an event of default, interest would accrue on all outstanding principal at a rate of the lesser of (i) 18% per annum or (ii) the maximum rate permitted by applicable law.
On August 28, 2013, the Company repaid the Subordinated Note with a portion of the proceeds from its common stock offering.
Convertible promissory notes
On November 25, 2011, the Company issued a $1.0 million convertible promissory note to Hohenplan Privatstiftung (the “2011 Hohenplan Note”), a $1.5 million convertible promissory note to Personalversorge der Autogrill Schweiz AG (the “Personalversorge Note”) and a $250,000 convertible promissory note to SST Advisors, Inc. (the “SST Note” and collectively with the 2011 Hohenplan Note and the Personalversorge Note, the “Convertible Notes”). The value of the beneficial conversion feature of the three Convertible Notes was $1.6 million at the date of issuance. The beneficial conversion feature was recorded as a discount to the Convertible Notes payable and to additional paid-in-capital and was amortized to interest expense over the life of the Convertible Notes. The Company amortized $0.4 million, $0.8 million and $66,000 of the discount to interest expense during the fiscal years ended June 30, 2014, May 31, 2013 and the one month ended June 30, 2013.
On July 30, 2012, the Company issued a $1.0 million convertible promissory note (the “2012 Hohenplan Note”) to Hohenplan Privatstiftung. The Company determined that the terms of the 2012 Hohenplan Note contained a down round provision under which the conversion price could be decreased as a result of future equity offerings. Accordingly, the conversion feature was accounted for as a derivative liability and discount on note payable. On February 5, 2013, the Company closed a private placement of 705,882 shares of common stock at a purchase price of $8.50 per share, from certain of the initial investors in the Company. As a result, the conversion price of the 2012 Hohenplan Note was adjusted from $15.00 to $8.50. The fair value of the discount on the 2012 Hohenplan Note was $34,000 and $0 as of May 31, 2013 and June 30, 2013, respectively, resulting in an unrealized gain of approximately $0.3 million and $29,000 during the fiscal year ended May 31, 2013 and the one month ended June 30, 2013, respectively. The Company determined the fair value of the discount using the Black-Scholes option pricing model. The Company amortized approximately $0.3 million and $25,000 of the discount to interest expense during the fiscal year ended May 31, 2013 and the one month ended June 30, 2013, respectively.
In connection with the issuance of the 2012 Hohenplan Note, the Company incurred $0.2 million of debt issuance costs related to the issuance to a broker of 12,500 shares of the Company’s common stock with a value of $161,000, and warrants to purchase 8,333 shares of the Company’s common stock at an exercise price of $15.00 per share, with a value of $49,000. The warrants expire on July 30, 2015. The shares issued to the broker were valued using the closing market price of the Company’s common stock on the OTCQB on the debt issuance date, which was July 30, 2012. The Company valued the warrants using the Black-Scholes valuation model with a volatility based on the historical closing price of common stock of industry peers. During the fiscal year ended May 31, 2013 and the one month ended June 30, 2013, the Company amortized approximately $0.3 million and $4,000, respectively, of the capitalized debt issuance costs to interest expense.
In August 2013, the Company issued 100,002 Units, each consisting of one share of Series A Preferred Stock and one warrant to purchase up to 2.5 shares of common stock at a price of $22.50 per Unit (the “Units”), in cancellation of the 2011 Hohenplan Note, the 2012 Hohenplan Note and the SST Note. In November 2013, the Company paid in full the Personalversorge Note with cash.
Mandatorily Redeemable Preferred Stock
The Company’s Series A Preferred Stock is mandatorily redeemable and is not convertible into shares of the Company’s common stock. The Company classifies the Series A Preferred Stock as a long-term liability, and the Company records dividends paid or accrued as interest expense in the Company’s Condensed Consolidated Statement of Operations.
| F-20 |
In August 2013, the Company closed offerings of 376,685 Units, raising net cash proceeds of $7.1 million. Each Unit consisted of one share of Series A Preferred Stock and one warrant to purchase up to 2.5 shares of common stock at a price of $22.50 per Unit. The warrants are exercisable until the earlier of (i) August 2016 or (ii) the first trading day that is at least 30 days after the date that the Company has provided notice to the holders of the warrants by filing a Current Report on Form 8-K stating that the common stock has (A) achieved a 20 trading day volume weighted average price of $15.00 per share or more and (B) traded, in the aggregate, 300,000 shares or more over the same 20 consecutive trading days for which the 20 trading day volume weighted average price was calculated; provided, that clause (ii) shall only be applicable so long as a warrant is exercisable for shares of common stock. The warrants have an exercise price of $10.00 per share. The warrants issued with the Series A Preferred Stock were valued at $2.4 million. The value of the warrants is treated as a discount to the Series A Preferred Stock and will be accreted over the life of the mandatorily redeemable preferred stock. Management determined the fair value using a probability weighted Black-Scholes option model with a volatility based on the historical closing price of common stock of industry peers and the closing price of the Company’s common stock on the OTCBB on the date of issuance. The volatility and remaining term was approximately 55% and three years, respectively.
The Series A Preferred Stock is mandatorily redeemable on July 15, 2018 at $25.00 per share, plus accrued and unpaid dividends to the redemption date, for a total redeemable value of $11.9 million at the time of issuance. The difference between the $11.9 million redeemable value and the $10.8 million of gross proceeds and canceled debt is treated as a discount and will be accreted over the life of the Series A Preferred Stock. Effective as of April 1, 2014, the Company agreed to exchange 222,224 outstanding shares of its Series A Preferred Stock for the issuance of 1,388,898 shares of common stock. After the exchange, the Company had 254,463 shares of Series A Preferred Stock outstanding with an aggregate redemption amount of $6.4 million as of June 30, 2014.
For the fiscal year ended June 30, 2014, the Company recognized total interest expense of $1.8 million related to the Series A Preferred Stock, which includes accretion of discount and issuance cost of $0.6 million for the fiscal year ended June 30, 2014.
The following is a schedule by year of future principal payments required under the Credit Facility and the redemption of the Series A Preferred Stock described above as of June 30, 2014:
| (in thousands) | ||||
| Fiscal Years Ending June 30, | ||||
| 2015 | $ | — | ||
| 2016 | 26,800 | |||
| 2017 | — | |||
| 2018 | — | |||
| 2019 | 6,362 | |||
| Total | 33,162 | |||
| Discount | (1,561 | ) | ||
| Total, net value | $ | 31,601 | ||
11. Earnings Per Share
The Company reports basic earnings per common share, which excludes the effect of potentially dilutive securities, and diluted earnings per common share, which includes the effect of all potentially dilutive securities unless their impact is anti-dilutive. The following are reconciliations of the numerators and denominators of basic and diluted earnings per share:
| (dollars in thousands, except per share amounts) | Fiscal Year Ended | One Month Ended | ||||||||||||||
| June 30, 2014 | May 31, 2013 | May 31, 2012 | June 30, 2013 | |||||||||||||
| Net loss (numerator): | ||||||||||||||||
| Net loss attributable to Red | ||||||||||||||||
| Mountain Resources, Inc.—basic | $ | (9,508 | ) | $ | (12,202 | ) | $ | (12,432 | ) | $ | (631 | ) | ||||
| Weighted average shares (denominator): | ||||||||||||||||
| Weighted average shares—basic | 13,626 | 10,133 | 7,378 | 12,691 | ||||||||||||
| Weighted average shares—diluted (1) (2) | 13,626 | 10,133 | 7,378 | 12,691 | ||||||||||||
| Loss per share: | ||||||||||||||||
| Basic | $ | (0.70 | ) | $ | (1.20 | ) | $ | (1.69 | ) | $ | (0.05 | ) | ||||
| Diluted | $ | (0.70 | ) | $ | (1.20 | ) | $ | (1.69 | ) | $ | (0.05 | ) | ||||
| (1) | Warrants to purchase approximately 1,349,051, 361,842 and 461,842 shares of the Company’s common stock were excluded from this calculation because they were anti-dilutive during the fiscal years ended June 30, 2014 and May 31, 2013 and the one month ended June 30, 2013. |
| (2) | Warrants to purchase approximately 161,759 shares of the Company’s common stock and 4,530 shares payable for director compensation were excluded from this calculation because they were anti-dilutive during the fiscal year ended May 31, 2012. |
| F-21 |
12. Equity
As of June 30, 2014, the Company was authorized to issue (i) 50,000,000 shares of common stock, par value $0.00001 per share, of which 14,857,488 shares were issued and outstanding, and (ii) 100,000,000 shares of preferred stock, par value $0.0001 per share, of which 254,463 shares of Series A Preferred Stock were outstanding.
On March 22, 2011, the Company entered into a Plan of Reorganization and Share Exchange Agreement, as amended on June 17, 2011 and June 20, 2011 (the “Share Exchange Agreement”), with Black Rock Capital, LLC, an entity wholly-owned by The StoneStreet Group, Inc. (“StoneStreet”). Alan W. Barksdale, the Company’s current president, chief executive officer and chairman of the board, was the president and the sole member of Black Rock Capital, LLC and the sole owner and the president of StoneStreet. On June 22, 2011, pursuant to the Share Exchange Agreement, the Company issued 2,700,000 shares of common stock to StoneStreet in exchange for 100% of the interests in Black Rock Capital, LLC. Concurrently with the closing, the Company retired 22,500,000 shares of common stock for no additional consideration.
On June 22, 2011, Mr. Barksdale and StoneStreet entered into a lock-up agreement with the Company with respect to 1,800,000 shares of common stock then held by StoneStreet. On September 12, 2011, StoneStreet assigned 700,000 shares subject to the lock-up agreement to several third parties after receiving the consent from the Company to release it from the lockup restrictions with respect to such shares. In connection with the assignment, the transferees agreed to have 10,000 shares of common stock cancelled in exchange for the Company releasing the shares from the lockup restrictions.
Beginning in March 2011, the Company commenced a private placement of its shares of common stock at an offering price of $10.00 per share, which terminated in November 2011. Through November 2011, the Company sold 1,620,600 shares of its common stock raising gross proceeds of $16.2 million, of which 1,013,600 shares of common stock were issued and $10.0 million was received subsequent to closing of the reverse merger with Black Rock in June 2011. Offering expenses for the private placement during the fiscal year ended May 31, 2012 totaled $3.7 million, consisting of $738,302 paid in cash and the issuance of 31,313 shares of the Company’s common stock and warrants to purchase 89,250 shares of common stock for commissions paid to brokers that participated in the transaction. The warrants were exercisable until April 30, 2014 and had an exercise price of $12.00 per share. On the date of issuance, the shares of common stock were valued at $171,250 and the warrants were valued at $555,504. Management determined the fair value of the shares consistent with the private placement value. Management determined the fair value of the warrants based upon the Black-Scholes option model with a volatility based on the historical closing price of common stock of industry peers, remaining term until April 30, 2014 and the closing price of the Company’s common stock on the OTCBB on the date of issuance. The range for volatility and remaining term was 83% to 94% and 2.3 to 2.7 years, respectively.
In connection with the private placement, on July 20, 2011 and September 12, 2011, the Company granted three investors each warrants to purchase an additional $3.0 million worth of shares of the Company’s common stock. If exercised, the shares would be sold to the investor at a price equal to the lesser of (i) $11.00 per share or (ii) the average closing price of the Company’s common stock during the period from five days prior to the investor exercising its right to purchase the shares and ending five days after such exercise. The Company accounts for the warrants as a derivative liability since the final exercise price is contingent upon market prices. Changes in fair value are recorded as unrealized gain on warrant liability in the Company’s Consolidated Statements of Operations. The Company recorded $2.2 million of issuance costs representing the grant date fair value. Management determined the fair value of the warrants using a probability weighted Black-Scholes option model with a volatility based on the historical closing price of common stock of industry peers and the closing price of the Company’s common stock on the OTCBB on the date of issuance. The range for volatility and remaining term was 93% to 94% and 0.3 years to 0.45 years, respectively.
On December 21, 2011, one investor exercised its right and purchased an aggregate of 272,727 shares of common stock at $11.00 per share raising gross proceeds of $3.0 million. The Company incurred cash and non-cash offering costs and broker commissions of $300,000 and $245,729, respectively. During February, March, and April of 2012, the other two investors (and their assignees) exercised a portion of their rights and purchased 431,082 shares of common stock at $11.00 per share raising gross proceeds of $4.7 million. At May 31, 2012, 13,636 of those shares had not yet been issued and 114,372 warrants expired unexercised. In connection with the exercises by the remaining investors (and their assignees) of their rights, the Company issued warrants to purchase an aggregate of 42,509 shares of common stock as a portion of commissions paid to the brokers that participated in the initial private placement. The warrants expired on April 30, 2014 and had an exercise price of $12.00 per share. Management determined the fair value based on the same methodology as the warrants issued to investors discussed above. The volatility and remaining term was 77% and two years, respectively.
In November 2011, the Company issued 20,000 shares of its common stock to a broker as payment for a fee related to obtaining the $4.0 million loan from the Lenders. On the date of issuance, the shares of common stock were valued at $318,000 based on the closing price of the Company’s common stock on the OTCBB on the date of issuance.
On December 30, 2011, the Company entered into a consulting agreement with St. Bernard Financial Services, Inc. In connection with the agreement, the Company paid the consultants $100,000 in cash and issued them 10,000 shares of common stock. On the date of issuance, the shares of common stock were valued at $152,000 based on the closing price of the Company’s common stock on the OTCBB on the date of issuance.
| F-22 |
During the fiscal years ended May 31, 2013 and 2012, the Company issued an aggregate of 1,959,548 and 480,396 shares, respectively, of common stock and paid an aggregate of $0 and $287,532 in cash, respectively, to certain shareholders of Cross Border as consideration for the purchase of an aggregate of 9,490,342 and 2,701,261 shares, respectively, of Cross Border’s common stock. The aggregate value of the common stock issued during the fiscal years ended May 31, 2013 and 2012 was $18.6 million and $4.8 million, respectively. Management determined the fair value based on the closing price of the Company’s common stock on the OTCBB on the date of issuance.
During the fiscal year ended May 31, 2013, the Company entered into debenture purchase agreements with holders of Series 2009A Debentures (the “2009A Debentures”) and holders of Series 2009B Debentures (the “2009B Debentures”) of O&G Leasing, LLC (“O&G”) pursuant to which the holders agreed to sell an aggregate of $3.8 million and $2.4 million principal amount of 2009A Debentures and 2009B Debentures, respectively, plus any accrued and unpaid interest, in exchange for the issuance of an aggregate of 569,329 shares of the Company’s common stock. The 2009A Debentures and 2009B Debentures are recorded as debentures – held to maturity on the Company’s Consolidated Balance Sheet. On the date of issuance, the shares of common stock were valued at $4.8 million based on the closing price of the Company’s common stock on the OTCBB on the date of issuance.
On February 5, 2013, the Company accepted subscriptions in a private placement for the purchase of an aggregate of 705,882 shares of common stock at a purchase price of $8.50 per share, for net proceeds to the Company of $5.5 million. On the date of issuance, the shares of common stock were valued at $6.0 million based on the closing price of the Company’s common stock on the OTCBB on the date of issuance.
On February 28, 2013, the Company entered into letter agreements with two creditors of Pure Energy Group, Inc. (“Pure Energy”), the predecessor to Cross Border. Pursuant to a plan of reorganization for Pure Energy approved by the United States Bankruptcy Court, the creditors were entitled to receive an aggregate of $1.3 million in fees for their claims from the future net revenues of Cross Border. Pursuant to the letter agreements, Cross Border paid half of the fees in cash, and the Company issued an aggregate of 74,585 shares of common stock to the creditors for payment of the other half of the fees. On the date of issuance, the shares of common stock were valued at $626,517 based on the closing price of the Company’s common stock on the OTCBB on the date of issuance.
On May 3, 2013, the Company closed a private placement for 352,941 shares of common stock at a purchase price of $8.50 per share, raising net proceeds of $2.8 million, pursuant to subscription agreements with certain of the initial investors in the Company. On May 3, 2013, the Company also issued (i) 25,000 shares of common stock to a broker as compensation for broker services provided in connection with a private placement of the Company’s common stock in February 2013; and (ii) an aggregate of 25,996 shares of common stock to certain consultants as compensation for consulting services provided to the Company. On the date of these issuances, the shares of common stock were valued at $3.4 million based on the closing price of the Company’s common stock on the OTCBB on the date of issuance.
During 2014, the Company entered into a Debenture Purchase Agreement with a holder of 2009A Debentures and 2009B Debentures for the purchase of an aggregate of $1.1 million principal amount of 2009A Debentures and 2009B Debentures, plus accrued and unpaid interest, in exchange for the issuance of 0.9 million shares of common stock of the Company.
In August 2013, the Company closed an offering of 642,857 shares of common stock, raising net cash proceeds of $3.6 million after issuance costs of $0.9 million.
13. Income Taxes
Income tax expense differs from the statutory amounts as follows:
| Fiscal Year Ended | One Month Ended | |||||||||||||||
| (dollars in thousands) | June 30, 2014 | May 31, 2013 | May 31, 2012 | June 30, 2013 | ||||||||||||
| Income taxes at U.S. statutory rate | $ | (3,044 | ) | $ | (4,149 | ) | $ | (4,227 | ) | $ | (215 | ) | ||||
| Deferred state income tax expense | (184 | ) | (268 | ) | (318 | ) | (4 | ) | ||||||||
| Change in tax status | (311 | ) | — | 530 | — | |||||||||||
| Permanent differences | 1,217 | 626 | 269 | — | ||||||||||||
| Change in valuation allowance | 2,366 | 3,791 | 3,746 | 219 | ||||||||||||
| Total tax expense | $ | 44 | $ | — | $ | — | $ | — | ||||||||
| F-23 |
Deferred taxes are provided for the temporary differences between the financial reporting bases and the tax bases of our assets and liabilities. The temporary differences that give rise to deferred tax assets and liabilities were as follows:
| (dollars in thousands) | June 30, 2014 | May 31, 2013 | June 30, 2013 | |||||||||
| Deferred tax assets and liabilities: | ||||||||||||
| Net operating loss carryforwards | $ | 19,879 | $ | 15,978 | $ | 16,254 | ||||||
| Oil and natural gas properties | (9,367 | ) | (9,706 | ) | (11,830 | ) | ||||||
| Derivatives | 32 | — | — | |||||||||
| Bad debt | — | 8 | 1,001 | |||||||||
| Capitalized transaction costs | 528 | 472 | 480 | |||||||||
| Environmental liabilities | 788 | 768 | 783 | |||||||||
| Equity in earnings from Cross Border | — | (13 | ) | (13 | ) | |||||||
| Conversion of preferred stock | — | — | — | |||||||||
| Other | — | — | — | |||||||||
| Gross deferred tax assets | 11,860 | 7,507 | 6,675 | |||||||||
| Valuation allowance | (11,901 | ) | (7,507 | ) | (6,675 | ) | ||||||
| Net deferred taxes | $ | (41 | ) | $ | — | $ | — | |||||
At June 30, 2014, the Company had approximately $32.2 million of pre-tax net operating loss carryforwards (“NOLs”). These carryforwards begin to expire in 2030. Due to the change in control of Cross Border on January 28, 2013, the Company’s ability to utilize the NOLs of Cross Border will be subject to limitations under applicable tax laws.
The Company continually assesses both positive and negative evidence to determine whether it is more likely than not that deferred tax assets can be realized prior to their expiration. Management monitors Company-specific, oil and natural gas industry and worldwide economic factors and assesses the likelihood that the Company’s NOLs and other deferred tax attributes in the United States, state, and local tax jurisdictions will be utilized prior to their expiration. The Company establishes a valuation allowance to reduce any deferred tax asset for which it is determined that it is more likely than not that some portion of the deferred tax asset will not be realized. At June 30, 2014, the Company had a valuation allowance of $11.9 million related to its deferred tax assets.
As of June 30, 2014, the Company had no unrecognized tax benefits. Black Rock Capital, LLC’s tax returns for the years ended December 31, 2011 – 2009 and stub period ended June 30, 2011, the Company’s tax returns for the fiscal years ended May 31, 2013 and 2012, stub period ended May 31, 2011, and the fiscal years ended January 31, 2011 and 2010, and Cross Border’s tax returns for the years ended December 31, 2013 – 2009, are open to examination by the major taxing jurisdictions to which the Company is subject.
14. Commitments and Contingencies
Litigation
On May 4, 2011, Clifton M. (Marty) Bloodworth filed a lawsuit in the State District Court of Midland County, Texas, against Doral West Corp. d/b/a Doral Energy Corp. and Everett Willard Gray II. Mr. Bloodworth alleges that Mr. Gray, as CEO of Cross Border, made false representations which induced Mr. Bloodworth to enter into an employment contract that was subsequently breached by Cross Border. The claims that Mr. Bloodworth has alleged are: breach of his employment agreement with Doral West Corp, common law fraud, civil conspiracy breach of fiduciary duty, and violation of the Texas Deceptive Trade Practices-Consumer Protection Act. Mr. Bloodworth is seeking damages of approximately $280,000. Mr. Gray and Cross Border deny that Mr. Bloodworth’s claims have any merit.
Cross Border was previously party to an engagement letter, dated February 7, 2012 (the “Engagement Letter”) with KeyBanc Capital Markets Inc. (“KeyBanc”) pursuant to which KeyBanc was to act as exclusive financial advisor to Cross Border’s board of directors in connection with a possible “Transaction” (as defined in the Engagement Letter). The Engagement Letter was formally terminated by Cross Border on August 21, 2012. The Engagement Letter provided that KeyBanc would be entitled to a fee upon consummation of a Transaction within a certain period of time following termination of the Engagement Letter. On May 16, 2013, KeyBanc delivered an invoice to Cross Border representing a fee and out-of-pocket expenses purportedly owed by Cross Border to KeyBanc as a result of the consummation of a purported Transaction that KeyBanc asserts had been consummated within the required time period. Cross Border disputed that any Transaction was consummated and that KeyBanc was entitled to any fees or out-of-pocket expenses. Cross Border filed a complaint seeking (i) a declaration that it was not liable to KeyBanc for any amounts in connection with the Engagement Letter, (ii) attorneys’ fees, and (iii) costs of suit. KeyBanc filed a counterclaim seeking (i) compensatory damages, (ii) interest, (iii) expenses and court costs, and (iv) reasonable and necessary attorneys’ fees. The matter was originally filed in the 44th Judicial District Court for the State of Texas, Dallas County but was subsequently removed to the United States District Court for the Northern District of Texas, Dallas Division. On August 26, 2014, Cross Border entered into a settlement agreement with KeyBanc, settling a lawsuit between the parties. In connection with the settlement, Cross Border agreed to pay KeyBanc $900,000 in three equal installments on or before August 28, 2014, October 31, 2014 and December 31, 2014, and the parties agreed to mutual releases of liability related to the Engagement Letter. The Company has accrued the settlement as of June 30, 2014.
In addition to the foregoing, in the ordinary course of business, the Company is periodically a party to various litigation matters that it does not believe will have a material adverse effect on its results of operations or financial condition.
| F-24 |
Environmental issues
The Company is subject to federal and state laws and regulations relating to the protection of the environment. Environmental risk is inherent in all oil and natural gas operations, and the Company could be subject to environmental cleanup and enforcement actions. The Company manages this environmental risk through appropriate environmental policies and practices to minimize the impact to the Company.
As of June 30, 2014, the Company had approximately $2.1 million in environmental remediation liabilities related to Cross Border’s operated Tom Tom and Tomahawk fields located in Chaves and Roosevelt counties in New Mexico. In February 2013, the Bureau of Land Management (“BLM”) accepted Cross Border’s remediation plan for the Tom Tom and Tomahawk fields. Cross Border is working in conjunction with the BLM to initiate remediation on a site-by-site basis. This is management’s best estimate of the costs of remediation and restoration with respect to these environmental matters, although the ultimate cost could differ materially. Inherent uncertainties exist in these estimates due to unknown conditions, changing governmental regulation, and legal standards regarding liability, and emerging remediation technologies for handling site remediation and restoration. Cross Border has incurred $33,000 in costs and expects to incur the remaining expenditures during our fiscal 2015.
Leases
As of June 30, 2014, the Company rented various office spaces in Dallas, Texas; Midland, Texas; and Lafayette, Louisiana under non-cancelable lease agreements. In the aggregate, these leases cover approximately 16,884 square feet at a cost of approximately $24,000 per month and have remaining lease terms ranging from 2 months to 27 months. The following is a schedule by year of future minimum rental payments required under these lease arrangements as of June 30, 2014:
| (in thousands) | ||||
| Fiscal Years Ending June 30, | ||||
| 2015 | $ | 218 | ||
| 2016 | 181 | |||
| 2017 | 45 | |||
| 2018 | — | |||
| 2019 | — | |||
| Total | $ | 444 | ||
Rent expense under the Company’s lease arrangements amounted to approximately $0.3 million, $0.3 million, $0.2 million, and $24,000 for the fiscal years ended June 30, 2014, May 31, 2013 and 2012, and the one month ended June 30, 2013, respectively.
15. Related Party Transactions
On September 15, 2011, the Company borrowed $100,000, interest free, from StoneStreet Operating Company, LLC (“StoneStreet Operating”) for working capital purposes, and the loan was repaid in full on September 26, 2011. On October 19, 2011, the Company borrowed an additional $180,000, interest free, from StoneStreet Operating for working capital purposes, and the loan was repaid in full on October 26, 2011. Mr. Barksdale is the president and manager of StoneStreet Operating.
StoneStreet Operating served as the operator for the Frost Bank, Resendez and La Duquesa properties from June 1, 2011 to December 31, 2011. Mr. Barksdale is the president and manager of StoneStreet Operating. For the fiscal year ended May 31, 2012, StoneStreet Operating paid the Company $146,166 of oil and natural gas revenues attributable to the properties, and the Company paid StoneStreet Operating $14,550 for acting as operator of the properties.
During the fiscal year ended May 31, 2012, the Company also paid StoneStreet Operating approximately $90,796 as reimbursement for operating and corporate expenses incurred by StoneStreet Operating on behalf of the Company and $20,260 as payment for condensate proceeds that were payable to StoneStreet Operating. At May 31, 2012, $11,629 was payable to StoneStreet Operating for reimbursement of expenses.
On January 28, 2011, Black Rock funded a $25,000 one year certificate of deposit in order for StoneStreet Operating to secure an additional letter of credit for the benefit of the Railroad Commission of Texas. Subsequent to funding, Black Rock assigned the certificate of deposit to StoneStreet Operating. The certificate of deposit was liquidated on November 2, 2011 and the proceeds of $25,141 were returned to Black Rock.
| F-25 |
On December 10, 2012, the Company entered into an Asset Purchase Agreement (the “Asset Purchase Agreement”) with Bamco. Mr. Barksdale was the receiver for the receivership estate of Bamco. Pursuant to the Asset Purchase Agreement, the Company agreed to acquire working interests and claims and causes of action in or relating to certain oil and gas exploration projects in Duval, Johnson and Zapata Counties in Texas (the “Bamco Properties”). On December 10, 2012, pursuant to the Asset Purchase Agreement, the Company issued 237,500 shares of common stock to the indenture trustee of certain debentures of Bamco, and executed a waiver and release of a claim against the receivership estate of Bamco for a $2.7 million note receivable that the Company deemed uncollectible in 2011.
The Company entered into an arrangement with R.K. Ford and Associates and Cabal Energy relating to the operations of the Good Chief State #1 and Big Brave State #1 wells, and a contract for drilling services with Western Drilling on the Company’s Madera 24-2H well. At the time, each of these entities were owned or partially owned by Randell K. Ford, a then-current director of the Company. Mr. Ford passed away in December 2013. During the fiscal years ended June 30, 2014, May 31, 2013 and 2012 and the one month ended June 30, 2013, the Company paid an aggregate of $2.9 million, $0.2 million, $5.0 million and $2,100, respectively, to these entities for engineering, drilling and completion services.
In addition, the Company was a party to a lease agreement with R.K. Ford and Associates, pursuant to which the Company leased office space in Midland, Texas. During the fiscal years ended June 30, 2014, May 31, 2013 and 2012 and the one month ended June 30, 2013, the Company paid $2,100, $25,200, $25,200 and $2,000, respectively, to R.K. Ford and Associates pursuant to the lease agreement. The lease agreement expired in July 2013.
The Company entered into a master service agreement with Integrity Well Services LLC (“Integrity”) pursuant to which Integrity provides well services to the Company. This entity is partially owned by Tommy Folsom, Executive Vice President and Director of Exploration and Production for RMR Operating, LLC, a subsidiary of the Company, and formerly the Executive Vice President and Director of Exploration and Production for the Company. During fiscal year ended June 30, 2014, the Company paid approximately $313,000 to Integrity pursuant to the master service agreement.
Enerstar Resources O&G, LLC (“Enerstar”), a company owned by Mr. Folsom, owns an overriding royalty interest in the Company’s Madera Prospect. During the fiscal years ended June 30, 2014, May 31, 2013 and May 31, 2012, the Company paid royalties of approximately $15,000, $8,700, and $6,800 respectively, to Enerstar.
16. Subsequent Events
Litigation settlement
On August 26, 2014, Cross Border entered into a settlement agreement with KeyBanc, settling a lawsuit between the parties. In connection with the settlement, Cross Border agreed to pay KeyBanc $900,000 in three equal installments on or before August 28, 2014, October 31, 2014 and December 31, 2014, and the parties agreed to mutual releases of liability related to the Engagement Letter. The Company has accrued the settlement as of June 30, 2014.
17. Supplemental Information Relating to Oil And Natural Gas Producing Activities (Unaudited)
Costs incurred in oil and natural gas property acquisition, exploration and development
Set forth below is certain information regarding the costs incurred for oil and natural gas property acquisition, development and exploration activities:
| Fiscal Year Ended | One Month Ended | |||||||||||||||
| (in thousands) | June 30, 2014 | May 31, 2013 | May 31, 2012 | June 30, 2013 | ||||||||||||
| Property acquisition costs: | ||||||||||||||||
| Unproved properties | $ | — | $ | 17,132 | $ | 2,786 | $ | — | ||||||||
| Proved properties | — | 32,395 | 1,045 | — | ||||||||||||
| Exploration costs | 1,193 | 849 | 265 | 30 | ||||||||||||
| Development costs (1) | 17,101 | 7,134 | 15,929 | 731 | ||||||||||||
| Total costs incurred | $ | 18,294 | $ | 57,510 | $ | 20,025 | $ | 761 | ||||||||
| (1) | For the fiscal years ended June 30, 2014, May 31, 2013 and 2012 and the one month ended June 30, 2013, development costs included $0.5 million, $0.3 million, $0.6 million and $20,000, respectively, in non-cash asset retirement obligations. |
Results of operations for oil and natural gas producing activities
Set forth below is certain information regarding the results of operations for oil and natural gas producing activities:
| Fiscal Year Ended | One Month Ended | |||||||||||||||
| (in thousands) | June 30, 2014 | May 31, 2013 | May 31, 2012 | June 30, 2013 | ||||||||||||
| Revenues | $ | 22,498 | $ | 8,982 | $ | 6,325 | $ | 1,716 | ||||||||
| Production costs | (5,340 | ) | (2,305 | ) | (1,346 | ) | (128 | ) | ||||||||
| Exploration expense | (1,193 | ) | (438 | ) | (265 | ) | (30 | ) | ||||||||
| Impairment | (487 | ) | (411 | ) | (1,051 | ) | — | |||||||||
| Depletion | (9,020 | ) | (4,515 | ) | (4,039 | ) | (665 | ) | ||||||||
| Income tax expense | — | — | — | — | ||||||||||||
| Results of operations | $ | 6,458 | $ | 1,313 | $ | (376 | ) | $ | 893 | |||||||
| F-26 |
Proved reserves
Cawley, Gillespie & Associates, Inc., independent petroleum engineers, estimated 100% of the Company’s proved reserve information as of July 1, 2014. The estimate of proved reserves and related valuations were prepared in accordance with the provisions of ASC 932, Extractive Activities.
Estimates of proved reserves are inherently imprecise and are continually subject to revision based on production history, results of additional exploration and development, price changes and other factors. All of the Company’s estimated oil and natural gas reserves are attributable to properties within the United States. As the Company’s natural gas liquids are not a significant component of their reserves they have been combined with the oil reserves below. A summary of the Company’s changes in quantities of proved oil and natural gas reserves for the fiscal years ended June 30, 2014 (including the one month ended June 30, 2013), May 31, 2013 and 2012:
| Oil (MBbls) | Natural Gas (MMcf) | Total (MBoe) | ||||||||||
| May 31, 2011 | 844 | 10,450 | 2,586 | |||||||||
| Acquisitions | 287 | 307 | 338 | |||||||||
| Revisions in previous estimates | (95 | ) | (3,423 | ) | (666 | ) | ||||||
| Production | (36 | ) | (843 | ) | (176 | ) | ||||||
| May 31, 2012 | 1,000 | 6,491 | 2,082 | |||||||||
| Acquisitions | 1,550 | 5,723 | 2,504 | |||||||||
| Reserves sold | (27 | ) | (180 | ) | (57 | ) | ||||||
| Revisions in previous estimates | (120 | ) | (4,028 | ) | (791 | ) | ||||||
| Production | (83 | ) | (646 | ) | (191 | ) | ||||||
| May 31, 2013 | 2,320 | 7,360 | 3,547 | |||||||||
| Extensions and discoveries | 711 | 1,398 | 944 | |||||||||
| Revisions in previous estimates | 163 | (823 | ) | 26 | ||||||||
| Production | (233 | ) | (987 | ) | (398 | ) | ||||||
| June 30, 2014 | 2,961 | 6,948 | 4,119 | |||||||||
| Proved Developed Reserves | ||||||||||||
| May 31, 2012 | 158 | 4,365 | 886 | |||||||||
| May 31, 2013 | 1,016 | 5,320 | 1,902 | |||||||||
| June 30, 2014 | 1,314 | 4,688 | 2,095 | |||||||||
| Proved Undeveloped Reserves | ||||||||||||
| May 31, 2012 | 842 | 2,126 | 1,196 | |||||||||
| May 31, 2013 | 1,304 | 2,041 | 1,644 | |||||||||
| June 30, 2014 | 1,648 | 2,261 | 2,025 | |||||||||
At June 30, 2014, the Company’s estimated proved reserves were 4.1 MMBoe, an increase of 16% compared to 3.5 MMBoe at May 31, 2013. During fiscal 2014, the Company added estimated proved reserves of 0.9 MMBoe through extensions and discoveries, which were offset by production of 0.4 MMBoe and minimal upward revisions in previous estimates.
At May 31, 2013, the Company’s estimated proved reserves were 3.5 MMBoe, an increase of 70% compared to 2.1 MMBoe at May 31, 2012. During fiscal 2013, the Company added estimated proved reserves of 2.5 MMBoe through acquisitions, which were offset by production of 0.2 MMBoe and downward revisions in previous estimates of 0.8 MMBoe. The downward revisions were primarily comprised of 0.2 MMBoe due to a revision to the proved undeveloped reserves at Cowden and 0.5 MMBoe due to a revision to the proved developed behind the pipe reserves at Frost Bank and Peal Ranch.
Standardized measure of discounted future net cash flows relating to proved reserves
Future cash inflows were computed by applying the average of the closing price on the first day of each month for the 12-month period prior to June 30, 2014 to estimated future production. For oil and natural gas liquid volumes, the average NYMEX spot price is $100.27 per Bbl. For natural gas volumes, the average Henry Hub spot price is $4.10 per MMBtu. Prices are adjusted for basis differentials, hydrocarbon quality, and transportation, processing, and gathering fees resulting in an oil price of $92.83 per barrel, natural gas liquids price of $31.36 per barrel, and natural gas price of $5.06 per Mcf. The adjusted oil, natural gas liquids and natural gas prices are held constant throughout the lives of the properties. Future production and development costs are computed by estimating the expenditures to be incurred in developing and producing the proved oil and natural gas reserves at year end, based on year-end costs and assuming continuation of existing economic conditions.
| F-27 |
Future income tax expenses are calculated by applying appropriate year-end tax rates to future pre-tax net cash flows relating to proved oil and natural gas reserves, less the tax basis of properties involved. Future income tax expenses give effect to permanent differences, tax credits and loss carryforwards relating to the proved oil and natural gas reserves. Future net cash flows are discounted at a rate of 10% annually to derive the standardized measure of discounted future net cash flows. This calculation procedure does not necessarily result in an estimate of the fair market value of the Company’s oil and natural gas properties.
The standardized measure of discounted future net cash flows relating to proved oil and natural gas reserves were as follows:
| Fiscal Year Ended May 31, | ||||||||||||
| (in thousands) | June 30, 2014 | May 31, 2013 | May 31, 2012 | |||||||||
| Future cash inflows | $ | 294,350 | $ | 229,688 | $ | 117,238 | ||||||
| Future production costs | (76,574 | ) | (58,869 | ) | (27,017 | ) | ||||||
| Future development costs | (42,357 | ) | (37,279 | ) | (27,457 | ) | ||||||
| Future income tax expense | (23,306 | ) | (23,027 | ) | (19,578 | ) | ||||||
| Future net cash flows | 152,113 | 110,513 | 43,186 | |||||||||
| 10% annual discount for estimated timing of cash flows | (73,113 | ) | (53,377 | ) | (28,485 | ) | ||||||
| Standardized measure of discounted future net cash flows | $ | 79,000 | $ | 57,136 | $ | 14,701 | ||||||
Changes in standardized measure of discounted future net cash flows
The changes in the standardized measure of discounted future net cash flows relating to proved oil and natural gas reserves are as follows:
| Fiscal Year Ended | ||||||||||||
| (in thousands) | June 30, 2014 | May 31, 2013 | May 31, 2012 | |||||||||
| Balance, beginning of period | $ | 57,136 | $ | 14,701 | $ | 35,311 | ||||||
| Net change in sales and transfer prices and in production (lifting) costs related to future production | 8,407 | 7,183 | (1,004 | ) | ||||||||
| Changes in estimated future development costs | 18,870 | 16,461 | (20,727 | ) | ||||||||
| Sales and transfers of oil and natural gas produced during the period | (17,879 | ) | (6,574 | ) | (4,979 | ) | ||||||
| Sale of reserves | — | (1,087 | ) | — | ||||||||
| Net change due to extensions and discoveries | 21,859 | — | — | |||||||||
| Net change due to purchase of minerals in place | — | 47,739 | 4,352 | |||||||||
| Net change due to revisions in quantity estimates | 601 | (15,082 | ) | (8,553 | ) | |||||||
| Previously estimated development costs incurred during the period | (16,755 | ) | (7,120 | ) | — | |||||||
| Accretion of discount | 6,763 | 2,677 | 5,389 | |||||||||
| Other | 106 | (3,340 | ) | 2,339 | ||||||||
| Net change in income taxes | 108 | 1,578 | 2,573 | |||||||||
| Balance, end of period | $ | 79,000 | $ | 57,136 | $ | 14,701 | ||||||
| F-28 |
18. Quarterly Financial Data (unaudited)
The following are summarized quarterly financial data for the fiscal years ended June 30, 2014 and May 31, 2013:
| 1st Qtr | 2nd Qtr | 3rd Qtr | 4th Qtr | |||||||||||||
| (in thousands, except per share data) | ||||||||||||||||
| For the fiscal year ended June 30, 2014: | ||||||||||||||||
| Oil and natural gas sales | $ | 5,774 | $ | 4,467 | $ | 5,270 | $ | 6,987 | ||||||||
| Income (loss) from operations | 182 | (1,322 | ) | (824 | ) | (799 | ) | |||||||||
| Net loss before income taxes | (1,129 | ) | (2,108 | ) | (1,790 | ) | (3,924 | ) | ||||||||
| Net loss attributable to Red Mountain Resources, Inc. | (1,275 | ) | (2,205 | ) | (1,984 | ) | (4,044 | ) | ||||||||
| Basic and diluted net loss per common share | $ | (0.09 | ) | $ | (0.16 | ) | $ | (0.15 | ) | $ | (0.39 | ) | ||||
| For the fiscal year ended May 31, 2013(1): | ||||||||||||||||
| Oil and natural gas sales | $ | 1,346 | $ | 1,108 | $ | 2,463 | $ | 4,065 | ||||||||
| Loss from operations | (3,221 | ) | (1,209 | ) | (1,400 | ) | (933 | ) | ||||||||
| Net loss | (3,709 | ) | (3,238 | ) | (3,048 | ) | (1,525 | ) | ||||||||
| Net loss attributable to Red Mountain Resources, Inc. | (3,709 | ) | (3,238 | ) | (3,392 | ) | (1,863 | ) | ||||||||
| Basic and diluted net loss per common share | $ | (0.42 | ) | $ | (0.36 | ) | $ | (0.33 | ) | $ | (0.12 | ) | ||||
| (1) | Financial information for the three months ended September 30, 2012, December 31, 2012 and March 31, 2013 (collectively, the “Calendar Quarters”) has not been included for the following reasons: (i) the three months ended August 31, 2012, November 30, 2012 and February 28, 2013 (collectively, the “Fiscal Quarters”) provide a meaningful comparison for the three months ended September 30, 2013, December 31, 2013 and March 31, 2014; (ii) there are no significant factors, seasonal or other, that would impact the comparability of information if the results for Calendar Quarters were presented in lieu of results for the Fiscal Quarters; and (iii) it was not practicable or cost justified to prepare this information. |
| F-29 |
Pursuant to the requirements of Section 13 or 15(d) of the Securities Exchange Act of 1934, the registrant has duly caused this report to be signed on its behalf by the undersigned, thereunto duly authorized.
RED MOUNTAIN RESOURCES, INC.
| Dated: September 30, 2014 | By: | /s/ Alan W. Barksdale |
| Alan W. Barksdale | ||
| Chief Executive Officer |
Pursuant to the requirements of the Securities Exchange Act of 1934, this report has been signed below by the following persons on behalf of the registrant and in the capacities and on the dates indicated.
|
Signature |
Title |
Date |
|
/s/ Alan W. Barksdale |
President, Chief Executive Officer | September 30, 2014 |
| Alan W. Barksdale | and Director (Principal Executive Officer) | |
|
/s/ Hilda D. Kouvelis |
Chief Accounting Officer | September 30, 2014 |
| Hilda D. Kouvelis |
(Principal Financial and Accounting Officer) |
|
|
/s/ David M. Heikkinen |
Director | September 30, 2014 |
| David M. Heikkinen | ||
|
/s/ Richard Y. Roberts |
Director | September 30, 2014 |
| Richard Y. Roberts | ||
|
/s/ Paul N. Vassilakos |
Director | September 30, 2014 |
| Paul N. Vassilakos | ||
|
/s/ Frank Yates, Jr. |
Director | September 30, 2014 |
| Frank Yates, Jr. |
| 73 |
EXHIBIT INDEX
| Exhibit No. | Name of Exhibit | |
| 2.1 | Plan of Reorganization and Share Exchange Agreement, dated March 22, 2011, by and between Black Rock Capital, LLC and Red Mountain Resources, Inc. (incorporated by reference to Exhibit 10.2 to the Company’s Current Report on Form 8-K, filed on March 31, 2011). | |
| 2.2 | Amendment to Plan of Reorganization and Share Exchange Agreement, dated June 17, 2011, by and among Red Mountain Resources Inc., Black Rock Capital, LLC and Black Rock Capital Shareholders (incorporated by reference to Exhibit 10.4 to the Company’s Current Report on Form 8-K, filed on June 23, 2011). | |
| 2.3 | Amendment to Plan of Reorganization and Share Exchange Agreement, dated June 20, 2011, by and among Red Mountain Resources Inc., Black Rock Capital, LLC and Black Rock Capital Shareholders (incorporated by reference to Exhibit 10.5 to the Company’s Current Report on Form 8-K, filed on June 23, 2011). | |
| 2.4 | Asset Purchase Agreement, dated July 19, 2012, by and among Hunter Drilling, LLC, First Security Bank, as Trustee for the Holders of the Senior Series 2009A Debentures and the Series 2009B Debentures, Red Mountain Resources, Inc., O&G Leasing, LLC and Performance Drilling Company, LLC (incorporated by reference to Exhibit 2.1 to the Company’s Current Report on Form 8-K filed on July 25, 2012). | |
| 3.1 | Certificate of Formation of Red Mountain Resources, Inc. (incorporated by reference to Exhibit 3.2 to the Company’s Current Report on Form 8-K filed on February 4, 2014). | |
| 3.2 | Certificate of Correction to the Certificate of Formation of Red Mountain Resources, Inc. (incorporated by reference to Exhibit 3.1 to the Company’s Current Report on Form 8-K filed on August 11, 2014). | |
| 3.3 | Bylaws of Red Mountain Resources, Inc. (incorporated by reference to Exhibit 3.3 to the Company’s Current Report on Form 8-K filed on February 4, 2014). | |
| 4.1 | Form of Common Stock Certificate of Red Mountain Resources, Inc. (incorporated by reference to Exhibit 4.1 to the Company’s Current Report on Form 8-K filed on February 4, 2014). | |
| 4.2 | Form of 10.0% Series A Cumulative Redeemable Preferred Stock Certificate of Red Mountain Resources, Inc. (incorporated by reference to Exhibit 4.2 to the Company’s Current Report on Form 8-K filed on February 4, 2014). | |
| 4.3 | Form of Warrant Certificate of Red Mountain Resources, Inc. (incorporated by reference to Exhibit 4.3 to the Company’s Current Report on Form 8-K filed on February 4, 2014). | |
| 4.4 | Form of Warrant Agreement between the Company and Broadridge Corporate Issuer Solutions, Inc. (incorporated by reference to Exhibit 4.4 to the Company’s Registration Statement on Form 8-A filed on July 24, 2013). | |
| 4.5 | Amendment No. 1 to Warrant Agreement, effective as of January 31, 2014, between Broadridge Corporate Issuer Solutions, Inc. and Red Mountain Resources, Inc. (incorporated by reference to Exhibit 10.1 to the Company’s Current Report on Form 8-K filed on February 4, 2014). | |
| 10.1 | Cross Border Resources, Inc. Common Stock Warrant (incorporated by reference to Exhibit 10.1 to the Company’s Annual Report on Form 10-K filed on September 13, 2012). | |
| 10.2† | Employment Agreement, effective June 17, 2011, by and between Red Mountain Resources, Inc. and Alan W. Barksdale (incorporated by reference to Exhibit 10.8 to the Company’s Current Report on Form 8-K, filed on June 28, 2011). | |
| 10.3† | Employment Agreement, dated February 7, 2012, by and between Red Mountain Resources, Inc. and Hilda D. Kouvelis (incorporated by reference to Exhibit 10.1 to the Company’s Current Report on Form 8-K, filed on February 8, 2012). | |
| 10.4† | Form of Indemnification Agreement between Red Mountain Resources, Inc. and its officers and directors (incorporated by reference to Exhibit 10.16 to the Company’s Annual Report on Form 10-K filed on September 13, 2012). | |
| 10.5† | Amendment to Employment Agreement, dated July 27, 2012, by and between Red Mountain Resources, Inc. and Hilda Kouvelis (incorporated by reference to Exhibit 10.19 to the Company’s Annual Report on Form 10-K filed on September 13, 2012). | |
| 10.6† | Red Mountain Resources, Inc. 2012 Long-Term Incentive Plan (incorporated by reference to Annex A to the Company’s Definitive Proxy Statement on Schedule 14A filed on September 26, 2012). |
| 74 |
| 10.7 | Senior First Lien Secured Credit Agreement, dated February 5, 2013, among the Company, Cross Border Resources, Inc., Black Rock Capital, Inc. and RMR Operating, LLC, as borrowers, and Independent Bank, as lender (incorporated by reference to Exhibit 10.1 to the Company’s Current Report on Form 8-K, filed on February 11, 2013). | |
| 10.8 | Inter-Borrower Agreement, dated February 5, 2013, among the Company, Cross Border Resources, Inc., Black Rock Capital, Inc. and RMR Operating, LLC (incorporated by reference to Exhibit 10.2 to the Company’s Current Report on Form 8-K, filed on February 11, 2013). | |
| 10.9 | Amendment and Waiver, dated May 2, 2013, among Red Mountain Resources, Inc., Cross Border Resources, Inc., Black Rock Capital, Inc. and RMR Operating, LLC and Independent Bank to that certain Senior First Lien Secured Credit Agreement (incorporated by reference to Exhibit 10.12 to the Company’s Annual Report on Form 10-K, filed on September 13, 2013). | |
| 10.10 | Amendment and Consent, dated July 19, 2013, to that certain Senior First Lien Secured Credit Agreement, dated February 5, 2013, among the Company, Cross Border Resources, Inc., Black Rock Capital, Inc. and RMR Operating, LLC, as borrowers, and Independent Bank, as lender (incorporated by reference to Exhibit 10.12 to the Company’s Quarterly Report on Form 10-Q, filed on November 18, 2013). | |
| 10.11 | Amendment and Waiver, effective as of September 12, 2013, by and among Independent Bank, as lender, and the Company, Cross Border Resources, Inc., Black Rock Capital, Inc. and RMR Operating, LLC, as borrowers (incorporated by reference to Exhibit 10.1 to the Company’s Current Report on Form 8-K filed on September 17, 2013). | |
| 10.12† | Form of Incentive Stock Option Agreement (incorporated by reference to Exhibit 10.1 to the Company’s Current Report on Form 8-K filed on May 6, 2013). | |
| 10.13† | Form of Nonqualified Stock Option Agreement (incorporated by reference to Exhibit 10.2 to the Company’s Current Report on Form 8-K filed on May 6, 2013). | |
| 21.1* | Subsidiaries of the Company. | |
| 23.1* | Consent of Hein & Associates LLP. | |
| 23.2* | Consent of Cawley, Gillespie & Associates, Inc. | |
| 31.1* | Certification by Principal Executive Officer pursuant to Section 302 of the Sarbanes-Oxley Act of 2002. | |
| 31.2* | Certification by Principal Financial Officer pursuant to Section 302 of the Sarbanes-Oxley Act of 2002. | |
| 32.1** | Certification by Principal Executive Officer and Principal Financial Officer pursuant to Section 906 of the Sarbanes-Oxley Act of 2002. | |
| 99.1* | Report of Cawley, Gillespie & Associates, Inc., dated as of August 20, 2014. | |
| 101.INS* | XBRL Instance Document | |
| 101.SCH* | XBRL Taxonomy Extension Schema Document | |
| 101.CAL* | XBRL Taxonomy Extension Calculation Linkbase Document | |
| 101.DEF* | XBRL Taxonomy Extension Definition Linkbase Document | |
| 101.LAB* | XBRL Taxonomy Extension Label Linkbase Document | |
| 101.PRE | XBRL Taxonomy Extension Presentation Linkbase Document |
* Filed herewith.
** Furnished herewith.
† Indicates a compensation contract or arrangement with management.
75