Attached files
| file | filename |
|---|---|
| EX-10.27 - EX-10.27 - NVR INC | nvr-ex1027_201412316.htm |
| EX-31.1 - EX-31.1 - NVR INC | nvr-ex311_201412319.htm |
| EX-23 - EX-23 - NVR INC | nvr-ex23_201412318.htm |
| EX-31.2 - EX-31.2 - NVR INC | nvr-ex312_2014123110.htm |
| EX-21 - EX-21 - NVR INC | nvr-ex21_201412317.htm |
| EX-32 - EX-32 - NVR INC | nvr-ex32_2014123111.htm |
| EXCEL - IDEA: XBRL DOCUMENT - NVR INC | Financial_Report.xls |
UNITED STATES
SECURITIES AND EXCHANGE COMMISSION
Washington, DC 20549
FORM 10-K
|
x |
ANNUAL REPORT PURSUANT TO SECTION 13 OR 15(d) OF THE SECURITIES EXCHANGE ACT OF 1934 |
For the fiscal year ended December 31, 2014
OR
|
¨ |
TRANSITION REPORT PURSUANT TO SECTION 13 OR 15(d) OF THE SECURITIES EXCHANGE ACT OF 1934 |
For the transition period from to
Commission file number 1-12378
NVR, Inc.
(Exact Name of Registrant as Specified in its Charter)
|
Virginia |
|
54-1394360 |
|
(State or Other Jurisdiction of Incorporation or Organization) |
|
(IRS Employer Identification Number) |
|
11700 Plaza America Drive, Suite 500 |
|
|
|
Reston, Virginia |
|
20190 |
|
(Address of Principal Executive Offices) |
|
(Zip Code) |
Registrant’s telephone number, including area code: (703) 956-4000
Securities registered pursuant to Section 12(b) of the Act:
|
Title of each class |
|
Name of each exchange on which registered |
|
Common stock, par value $0.01 per share |
|
New York Stock Exchange |
Securities registered pursuant to Section 12(g) of the Act: None
Indicate by check mark if the registrant is a well-known seasoned issuer, as defined in Rule 405 of the Securities Act. Yes x No ¨
Indicate by check mark if the registrant is not required to file reports pursuant to Section 13 or Section 15(d) of the Exchange Act. Yes ¨ No x
Indicate by check mark whether the registrant (1) has filed all reports required to be filed by Section 13 or 15(d) of the Securities Exchange Act of 1934 during the preceding 12 months (or for such shorter period that the registrant was required to file such reports), and (2) has been subject to such filing requirements for the past 90 days. Yes x No ¨
Indicate by check mark whether the registrant has submitted electronically and posted on its corporate Website, if any, every Interactive Data File required to be submitted and posted pursuant to Rule 405 of Regulation S-T (§232.405 of this chapter) during the preceding 12 months (or for such shorter period that the registrant was required to submit and post such files). Yes x No ¨
Indicate by check mark if disclosure of delinquent filers pursuant to Item 405 of Regulation S-K (§229.405) is not contained herein, and will not be contained, to the best of registrant’s knowledge, in definitive proxy or information statements incorporated by reference in Part III of this Form 10-K or any amendment to this Form 10-K. x
Indicate by check mark whether the registrant is a large accelerated filer, an accelerated filer, a non-accelerated filer, or a smaller reporting company. See the definitions of “large accelerated filer,” “accelerated filer” and “smaller reporting company” in Rule 12b-2 of the Exchange Act.
|
Large accelerated filer |
|
x |
|
Accelerated filer |
|
¨ |
|
|
|
|
|
|||
|
Non-accelerated filer |
|
¨ (Do not check if a Smaller Reporting Company) |
|
Smaller Reporting Company |
|
¨ |
Indicate by check mark whether the registrant is a shell company (as defined in Rule 12b-2 of the Act). Yes ¨ No x
The aggregate market value of the voting stock held by non-affiliates of NVR, Inc. on June 30, 2014, the last business day of NVR, Inc.’s most recently completed second fiscal quarter, was approximately $4,572,320,000.
As of February 17, 2015 there were 4,048,671 total shares of common stock outstanding.
DOCUMENTS INCORPORATED BY REFERENCE
Portions of the Proxy Statement of NVR, Inc. to be filed with the Securities and Exchange Commission pursuant to Regulation 14A of the Securities Exchange Act of 1934 on or prior to April 30, 2015 are incorporated by reference into Part III of this report.
INDEX
|
|
|
|
Page |
|
|||||
|
PART I |
|
|
|
|
|
||||
|
Item 1. |
|
|
2 |
|
|||||
|
Item 1A. |
|
|
6 |
|
|||||
|
Item 1B. |
|
|
10 |
|
|||||
|
Item 2. |
|
|
10 |
|
|||||
|
Item 3. |
|
|
11 |
|
|||||
|
Item 4. |
|
|
11 |
|
|||||
|
|
|
|
11 |
|
|||||
|
PART II |
|
|
|
|
|
||||
|
Item 5. |
|
|
12 |
|
|||||
|
Item 6. |
|
|
14 |
|
|||||
|
Item 7. |
|
Management’s Discussion and Analysis of Financial Condition and Results of Operations |
|
14 |
|
||||
|
Item 7A. |
|
|
32 |
|
|||||
|
Item 8. |
|
|
34 |
|
|||||
|
Item 9. |
|
Changes in and Disagreements with Accountants on Accounting and Financial Disclosure |
|
34 |
|
||||
|
Item 9A. |
|
|
34 |
|
|||||
|
Item 9B. |
|
|
34 |
|
|||||
|
PART III |
|
|
|
|
|
||||
|
Item 10. |
|
|
34 |
|
|||||
|
Item 11. |
|
|
34 |
|
|||||
|
Item 12. |
|
Security Ownership of Certain Beneficial Owners and Management and Related Stockholder Matters |
|
34 |
|
||||
|
Item 13. |
|
Certain Relationships and Related Transactions, and Director Independence |
|
35 |
|
||||
|
Item 14. |
|
|
35 |
|
|||||
|
PART IV |
|
|
|
|
|
||||
|
Item 15. |
|
|
35 |
|
|||||
1
PART I
General
NVR, Inc., a Virginia corporation, was formed in 1980 as NVHomes, Inc. Our primary business is the construction and sale of single-family detached homes, townhomes and condominium buildings, all of which are primarily constructed on a pre-sold basis. To more fully serve customers of our homebuilding operations, we also operate a mortgage banking and title services business. We conduct our homebuilding activities directly. Our mortgage banking operations are operated primarily through a wholly owned subsidiary, NVR Mortgage Finance, Inc. (“NVRM”). Unless the context otherwise requires, references to “NVR”, “we”, “us” or “our” include NVR, Inc. and its consolidated subsidiaries.
We are one of the largest homebuilders in the United States. We operate in multiple locations in fourteen states and Washington, D.C., primarily in the eastern part of the United States. During 2014, approximately 26% and 11% of our home settlements occurred in the Washington, D.C. and Baltimore, MD metropolitan areas, respectively, which accounted for approximately 33% and 13%, respectively, of our 2014 homebuilding revenues. Our homebuilding operations include the construction and sale of single-family detached homes, townhomes and condominium buildings under four trade names: Ryan Homes, NVHomes, Fox Ridge Homes and Heartland Homes. The Ryan Homes and Fox Ridge Homes products are marketed primarily to first-time and first-time move-up buyers. Ryan Homes operates in twenty-seven metropolitan areas located in Maryland, Virginia, Washington, D.C., West Virginia, Pennsylvania, New York, North Carolina, South Carolina, Florida, Ohio, New Jersey, Delaware, Indiana, Illinois and Tennessee. Fox Ridge Homes operates in the Nashville, TN metropolitan area. The NVHomes and Heartland Homes products are marketed primarily to move-up and up-scale buyers. NVHomes operates in Delaware and the Washington, D.C., Baltimore, MD, Philadelphia, PA and Raleigh, NC metropolitan areas. Heartland Homes operates in the Pittsburgh, PA metropolitan area. In 2014, our average price of a settled unit was approximately $368,500.
Historically, we generally have not engaged in land development (see discussion below on our limited land development activities). Instead, we typically acquire finished building lots at market prices from various development entities under fixed price purchase agreements (“purchase agreements”) that require deposits that may be forfeited if we fail to perform under the purchase agreements. The deposits required under the purchase agreements are in the form of cash or letters of credit in varying amounts and represent a percentage, typically ranging up to 10%, of the aggregate purchase price of the finished lots.
We believe that our lot acquisition strategy avoids the financial requirements and risks associated with direct land ownership and land development. We may, at our option, choose for any reason and at any time not to perform under these purchase agreements by delivering notice of our intent not to acquire the finished lots under contract. Our sole legal obligation and economic loss for failure to perform under these purchase agreements is limited to the amount of the deposit pursuant to the liquidated damage provision contained within the purchase agreements. We do not have any financial guarantees or completion obligations and we typically do not guarantee lot purchases on a specific performance basis under these purchase agreements. None of the creditors of any of the development entities with which we have entered these purchase agreements have recourse to our general credit. We generally seek to maintain control over a supply of lots believed to be suitable to meet our five-year business plan.
In addition to constructing homes primarily on a pre-sold basis and utilizing what we believe is a conservative lot acquisition strategy, we focus on obtaining and maintaining a leading market position in each market we serve. This strategy allows us to gain valuable efficiencies and competitive advantages in our markets, which we believe contributes to minimizing the adverse effects of regional economic cycles and provides growth opportunities within these markets. Our continued success is contingent upon our ability to control an adequate supply of finished lots on which to build. As a result, in certain specific strategic circumstances we deviate from our historical lot acquisition strategy and engage in joint venture arrangements with land developers or directly acquire raw ground already zoned for its intended use for development. Once we acquire control of any raw ground, we determine whether to sell the raw parcel to a developer and enter into a purchase agreement with the developer to purchase the finished lots, or whether to hire a developer to develop the land on our behalf. While joint venture arrangements and direct land development activity are not our preferred method of acquiring finished building lots, we may enter into additional transactions in the future on a limited basis where there exists a compelling strategic or prudent financial reason to do so. We expect, however, to continue to acquire substantially all of our finished lot inventory using purchase agreements with forfeitable deposits.
As of December 31, 2014, we controlled approximately 62,800 lots under purchase agreements with deposits in cash and letters of credit totaling approximately $348.4 million and $1.7 million, respectively. Included in the number of controlled lots are approximately 7,800 lots for which we have recorded a contract land deposit impairment reserve of approximately $56.1 million as of December 31, 2014. In addition, we had an aggregate investment totaling approximately $82.0 million in five separate joint venture limited liability corporations (“JVs”), expected to produce approximately 8,800 lots. Of the lots controlled by the JVs, approximately 3,300 were not under contract with us at December 31, 2014. Further, as of December 31, 2014, we directly owned four separate raw parcels of land, zoned for their intended use, with a current cost basis, including development costs, of approximately $33.7 million
2
that we intend to develop into approximately 480 finished lots for use in our homebuilding operations. Of the total finished lots expected to be developed, 94 lots are under contract to be sold to an unrelated party under lot purchase agreements. See Notes 3, 4 and 5 to the consolidated financial statements included herein for additional information regarding fixed price purchase agreements, JVs and land under development, respectively. Additionally, we have certain properties under contract with land owners that are expected to yield approximately 5,700 lots, which are not included in our number of total lots controlled. Some of these properties may require rezoning or other approvals to achieve the expected yield. These properties are controlled with deposits and letters of credit totaling approximately $2.3 million and $3.0 million, respectively as of December 31, 2014, of which approximately $2.6 million is refundable if we do not perform under the contract. We generally expect to assign the raw land contracts to a land developer and simultaneously enter into a lot purchase agreement with the assignee if the project is determined to be feasible.
In addition to building and selling homes, we provide a number of mortgage-related services through our mortgage banking operations. Through operations in each of our homebuilding markets, NVRM originates mortgage loans almost exclusively for our homebuyers. NVRM generates revenues primarily from origination fees, gains on sales of loans and title fees. NVRM sells all of the mortgage loans it closes into the secondary markets on a servicing released basis.
Segment information for our homebuilding and mortgage banking businesses is included in Note 2 in the accompanying consolidated financial statements.
Current Business Environment
The housing market recovery continues to be uneven. During 2014, the housing market experienced some weakness as existing home inventory increased and affordability decreased following increasing prices during 2013. There has also been an increase in the number of new home communities in many markets. These factors have resulted in weakness in housing prices in 2014. In addition, the housing market continues to face challenges from tightened mortgage underwriting standards. We believe that a continuation of the housing market recovery which began in 2012 is dependent upon a sustained overall economic recovery, driven by continued improvement in job growth and consumer confidence levels as well as improvement in wage growth and household formation. For additional information and analysis of recent trends in our operations and financial condition, see “Management’s Discussion and Analysis of Financial Condition and Results of Operations” in Item 7 of this Form 10-K.
Homebuilding
Products
We offer single-family detached homes, townhomes and condominium buildings with many different basic home designs. These home designs have a variety of elevations and numerous other options. Our homes combine traditional, transitional, cottage or urban exterior designs with contemporary interior designs and amenities, generally include two to four bedrooms and range from approximately 800 to 7,300 square feet. During 2014, the prices at which we settled homes ranged from approximately $120,000 to $1.5 million and averaged approximately $368,500. During 2013, our average price was approximately $349,100.
Markets
Our four reportable homebuilding segments operate in the following geographic regions:
|
Mid Atlantic: |
Maryland, Virginia, West Virginia, Delaware and Washington, D.C. |
|
North East: |
New Jersey and eastern Pennsylvania |
|
Mid East: |
New York, Ohio, western Pennsylvania, Indiana and Illinois |
|
South East: |
North Carolina, South Carolina, Tennessee and Florida |
Backlog
Backlog totaled 5,475 units and approximately $2.1 billion at December 31, 2014 compared to backlog of 4,945 units and approximately $1.8 billion at December 31, 2013. Backlog, which represents homes sold but not yet settled with the customer, may be impacted by customer cancellations for various reasons that are beyond our control, such as the customer’s failure to obtain mortgage financing, inability to sell an existing home, job loss or a variety of other reasons. In any period, a portion of the cancellations that we experience are related to new sales that occurred during the same period, and a portion are related to sales that occurred in prior periods and therefore appeared in the opening backlog for the current period. Expressed as the total of all cancellations during the period as a percentage of gross sales during the period, our cancellation rate was approximately 15% in each of 2014, 2013 and 2012. Additionally, during each of 2014, 2013 and 2012, approximately 6% of a reporting quarter’s opening backlog balance cancelled during the fiscal quarter. We can provide no assurance that our historical cancellation rates are indicative of the actual cancellation
3
rate that may occur in future periods. Other than those units that are cancelled, we expect to settle substantially all of our December 31, 2014 backlog during 2015. See “Risk Factors” in Item 1A and “Seasonality” in Item 7 of this Form 10-K.
Further discussion of settlements, new orders and backlog activity by our homebuilding reportable segment for each of the last three years can be found in “Management’s Discussion and Analysis of Financial Condition and Results of Operations” in Item 7 of this Form 10-K.
Construction
We utilize independent subcontractors under fixed price contracts to perform construction work on our homes. We use several independent subcontractors in our various markets and we are not dependent on any single subcontractor or on a small number of subcontractors.
Sales and Marketing
Our preferred marketing method is for customers to visit a furnished model home featuring many built-in options and a landscaped lot. The garages of these model homes are usually converted into temporary sales centers where alternative facades and floor plans are displayed and designs for other models are available for review. Sales representatives are compensated predominantly on a commission basis.
Regulation
We and our subcontractors must comply with various federal, state and local zoning, building, environmental, advertising and consumer credit statutes, rules and regulations, as well as other regulations and requirements in connection with our construction and sales activities. All of these regulations have increased the cost to produce and market our products, and in some instances, have delayed our developers’ ability to deliver finished lots to us. Counties and cities in which we build homes have at times declared moratoriums on the issuance of building permits and imposed other restrictions in the areas in which sewage treatment facilities and other public facilities do not reach minimum standards. In addition, our homebuilding operations are regulated in certain areas by restrictive zoning and density requirements that limit the number of homes that can be built within the boundaries of a particular area. To date, restrictive zoning laws and the imposition of moratoriums have not had a material adverse effect on our construction activities.
Competition and Market Factors
The housing industry is highly competitive. We compete with numerous homebuilders of varying size, ranging from local to national in scope, some of which have greater financial resources than we do. We also face competition from the home resale market. Our homebuilding operations compete primarily on the basis of price, location, design, quality, service and reputation. Historically, we have been one of the market leaders in each of the markets where we build homes.
The housing industry is cyclical and is affected by consumer confidence levels, prevailing economic conditions and interest rates. Other factors that affect the housing industry and the demand for new homes include the availability and the cost of land, labor and materials; changes in consumer preferences; demographic trends; and the availability of mortgage finance programs. See “Risk Factors” in Item 1A of this Form 10-K.
We are dependent upon building material suppliers for a continuous flow of raw materials. Whenever possible, we utilize standard products available from multiple sources. In the past, such raw materials have been generally available to us in adequate supply.
Mortgage Banking
We provide a number of mortgage related services to our homebuilding customers through our mortgage banking operations. Our mortgage banking operations also include separate subsidiaries that broker title insurance and perform title searches in connection with mortgage loan closings for which they receive commissions and fees. Because NVRM originates mortgage loans almost exclusively for our homebuilding customers, NVRM is dependent on our homebuilding segment. In 2014, NVRM closed approximately 9,100 loans with an aggregate principal amount of approximately $2.8 billion as compared to approximately 8,600 loans with an aggregate principal amount of approximately $2.5 billion in 2013.
NVRM sells all of the mortgage loans it closes to investors in the secondary markets on a servicing released basis, typically within 30 days from the loan closing. NVRM is an approved seller/servicer for Fannie Mae (“FNMA”) mortgage loans and an approved seller/issuer of Ginnie Mae (“GNMA”), Freddie Mac (“FHLMC”), Department of Veterans Affairs (“VA”) and Federal Housing Administration (“FHA”) mortgage loans.
4
Regulation
NVRM is an approved seller/servicer of FNMA mortgage loans and an approved seller/issuer of GNMA, FHLMC, VA and FHA mortgage loans, and is subject to all of those agencies’ rules and regulations. These rules and regulations restrict certain activities of NVRM. NVRM is currently eligible and expects to remain eligible to participate in such programs. In addition, NVRM is subject to regulation at the state and federal level, including regulations issued by the Consumer Financial Protection Bureau (the “CFPB”) with respect to specific origination, selling and servicing practices.
Competition and Market Factors
NVRM’s main competition comes from national, regional, and local mortgage bankers, mortgage brokers, credit unions and banks in each of these markets. NVRM competes primarily on the basis of customer service, variety of products offered, interest rates offered, prices of ancillary services and relative financing availability and costs.
Pipeline
NVRM’s mortgage loans in process that had not closed at December 31, 2014 and 2013 had an aggregate principal balance of approximately $1.4 billion and $1.1 billion, respectively. NVRM’s cancellation rate was approximately 31%, 35% and 36% in 2014, 2013 and 2012, respectively. We can provide no assurance that our historical loan cancellation rates are indicative of the actual loan cancellation rate that may occur in future periods. See “Risk Factors” in Item 1A in this Form 10-K.
Employees
At December 31, 2014, we employed 3,942 full-time persons. None of our employees are subject to a collective bargaining agreement and we have never experienced a work stoppage. We believe that our employee relations are good.
Available Information
We file annual, quarterly and current reports, proxy statements and other information with the Securities and Exchange Commission (the “SEC”). These filings are available to the public over the internet at the SEC’s website at http://www.sec.gov. All of the documents we file with the SEC may also be read and copied at the SEC’s public reference room located at 100 F Street, NE, Washington, DC 20549. Please call the SEC at 1-800-SEC-0330 for further information on the public reference room.
Our principal internet website can be found at http://www.nvrinc.com. We make available free of charge on or through our website, access to our annual report on Form 10-K, quarterly reports on Form 10-Q, current reports on Form 8-K, and amendments to those reports as soon as reasonably practicable after such material is electronically filed, or furnished, to the SEC.
Our website also includes a corporate governance section which contains our Corporate Governance Guidelines (which includes our Directors’ Independence Standards), Code of Ethics, Charters for the Audit, Compensation, Corporate Governance, Nominating and Qualified Legal Compliance Committees of our Board of Directors, Policies and Procedures for the Consideration of Board of Director Candidates, and Policies and Procedures Regarding Communications with the NVR, Inc. Board of Directors, the Independent Lead Director and the Non-Management Directors as a Group. Additionally, amendments to and waivers from a provision of the Code of Ethics that apply to our principal executive officer, principal financial officer, principal accounting officer or persons performing similar functions will be disclosed on our website.
Forward-Looking Statements
Some of the statements in this Form 10-K, as well as statements made by us in periodic press releases or other public communications, constitute “forward-looking statements” within the meaning of the Private Securities Litigation Reform Act of 1995, Section 27A of the Securities Act of 1933, as amended, and Section 21E of the Securities Exchange Act of 1934, as amended (the “Exchange Act”). Certain, but not necessarily all, of such forward-looking statements can be identified by the use of forward-looking terminology, such as “believes,” “expects,” “may,” “will,” “should,” or “anticipates” or the negative thereof or other comparable terminology. All statements other than of historical facts are forward looking statements. Forward looking statements contained in this document include those regarding market trends, NVR’s financial position, business strategy, the outcome of pending litigation, investigations or similar contingencies, projected plans and objectives of management for future operations. Such forward-looking statements involve known and unknown risks, uncertainties and other factors that may cause the actual results or performance of NVR to be materially different from future results, performance or achievements expressed or implied by the forward-looking statements. Such risk factors include, but are not limited to the following: general economic and business conditions (on both a national and regional level); interest rate changes; access to suitable financing by NVR and NVR’s customers; increased regulation in the mortgage banking industry; the ability of our mortgage banking subsidiary to sell loans it originates into the secondary market; competition; the
5
availability and cost of land and other raw materials used by NVR in its homebuilding operations; shortages of labor; weather related slow-downs; building moratoriums; governmental regulation; fluctuation and volatility of stock and other financial markets; mortgage financing availability; and other factors over which NVR has little or no control. NVR undertakes no obligation to update such forward-looking statements except as required by law.
Our business is affected by the risks generally incident to the residential construction business, including, but not limited to:
|
● |
the availability of mortgage financing; |
|
● |
actual and expected direction of interest rates, which affect our costs, the availability of construction financing, and long-term financing for potential purchasers of homes; |
|
● |
the availability of adequate land in desirable locations on favorable terms; |
|
● |
unexpected changes in customer preferences; and |
|
● |
changes in the national economy and in the local economies of the markets in which we have operations. |
All of these risks are discussed in detail below.
The homebuilding industry experienced a significant downturn from 2006 through 2011. Although housing industry conditions are improving, a deterioration in industry conditions could adversely affect our business and our results of operations.
During 2006 through 2011, the homebuilding industry experienced a significant downturn as a result of low consumer confidence driven by an economic recession, high unemployment levels, affordability issues and uncertainty as to the stability of home prices. As a result, we experienced reduced demand for new homes. Since 2011, we have experienced strengthening within the homebuilding industry with increasing sales. However, the housing market continues to face challenges from a tight mortgage lending environment and consumer confidence issues. If the improvements in the homebuilding industry do not continue or the industry suffers another downturn, our sales may decrease, which could have a material adverse effect on our profitability, stock performance, ability to service our debt obligations and future cash flows.
If the market value of our inventory or controlled lot position declines, our profit could decrease and we may incur losses.
Inventory risk can be substantial for homebuilders. The market value of building lots and housing inventories can fluctuate significantly as a result of changing market conditions. In addition, inventory carrying costs can be significant and can result in losses in a poorly performing project or market. We must, in the ordinary course of our business, continuously seek and make acquisitions of lots for expansion into new markets as well as for replacement and expansion within our current markets, which is generally accomplished by us entering fixed price purchase agreements and paying forfeitable deposits under the purchase agreement to developers for the contractual right to acquire the lots. In the event of adverse changes in economic or market conditions, we may cease further building activities in communities or restructure existing purchase agreements, resulting in forfeiture of some or all of any remaining land contract deposit paid to the developer. Either action may result in a loss which could have a material adverse effect on our profitability, stock performance, ability to service our debt obligations and future cash flows.
If the underwriting quality of our mortgage originations is found to be deficient, our profit could decrease and we may incur losses.
We originate several different loan products to our customers to finance the purchase of their home. We sell all of the loans we originate into the secondary mortgage market generally within 30 days from origination. All of the loans that we originate are underwritten to the standards and specifications of the ultimate investor. Insofar as we underwrite our originated loans to those standards, we bear no increased concentration of credit risk from the issuance of loans, except in certain limited instances where early payment default occurs. In the event that a substantial number of the loans that we have originated fall into default and the investors to whom we sold the loans determine that we did not underwrite the loans in accordance with their requirements, we could be required to repurchase the loans from the investor or indemnify the investor for any losses incurred. This may result in losses which could have a material adverse effect on our profitability, stock performance, ability to service our debt obligations and future cash flows.
We may be subject to claims on mortgage loans sold to third parties.
Our mortgage banking operations may be responsible for losses associated with mortgage loans originated and sold to investors in the event of errors or omissions relating to certain representations and warranties that the loans sold meet certain requirements, including representations as to underwriting standards, the type of collateral, the existence of primary mortgage insurance, and the
6
validity of certain borrower representations in connection with the loan. The resolution of claims related to alleged breaches of these representations and warranties and repurchase claims could have a material adverse effect on our financial condition, cash flows and results of operations and could exceed existing estimates and accruals. Because of the uncertainties inherent in estimating these matters, there can be no assurance that any amounts reserved will be adequate or that any potential inadequacies will not have a material adverse effect on our results of operations.
Because almost all of our customers require mortgage financing, the availability of suitable mortgage financing could impair the affordability of our homes, lower demand for our products, and limit our ability to fully deliver our backlog.
Our business and earnings depend on the ability of our potential customers to obtain mortgages for the purchase of our homes. In addition, many of our potential customers must sell their existing homes in order to buy a home from us. The tightening of credit standards and the availability of suitable mortgage financing could prevent customers from buying our homes and could prevent buyers of our customers’ homes from obtaining mortgages they need to complete that purchase, either of which could result in our potential customers’ inability to buy a home from us. If our potential customers or the buyers of our customers’ current homes are not able to obtain suitable financing, the result could have a material adverse effect on our sales, profitability, stock performance, ability to service our debt obligations and future cash flows.
If our ability to sell mortgages to investors is impaired, we may be required to fund these commitments ourselves, or may not be able to originate loans at all.
Our mortgage banking business sells all of the loans it originates into the secondary market usually within 30 days from the date of closing, and has up to approximately $25 million available in a repurchase agreement to fund mortgage closings. In the event that disruptions to the secondary markets tighten or eliminate the available liquidity within the secondary markets for mortgage loans, or the underwriting requirements by our secondary market investors continue to become more stringent, our ability to sell future mortgages could decline and we could be required, among other things, to fund our commitments to our buyers with our own financial resources, which is limited, or require our home buyers to find another source of financing. The result of such secondary market disruption could have a material adverse effect on our sales, profitability, stock performance, ability to service our debt obligations and future cash flows.
Interest rate movements, inflation and other economic factors can negatively impact our business.
High rates of inflation generally affect the homebuilding industry adversely because of their adverse impact on interest rates. High interest rates not only increase the cost of borrowed funds to homebuilders but also have a significant adverse effect on housing demand and on the affordability of permanent mortgage financing to prospective purchasers. We are also subject to potential volatility in the price of commodities that impact costs of materials used in our homebuilding business. Increases in prevailing interest rates could have a material adverse effect on our sales, profitability, stock performance, ability to service our debt obligations and future cash flows.
Our financial results also are affected by the risks generally incident to our mortgage banking business, including interest rate levels, the impact of government regulation on mortgage loan originations and servicing and the need to issue forward commitments to fund and sell mortgage loans. Our homebuilding customers account for almost all of our mortgage banking business. The volume of our continuing homebuilding operations therefore affects our mortgage banking business.
Our mortgage banking business also is affected by interest rate fluctuations. We also may experience marketing losses resulting from daily increases in interest rates to the extent we are unable to match interest rates and amounts on loans we have committed to originate with forward commitments from third parties to purchase such loans. Increases in interest rates may have a material adverse effect on our mortgage banking revenue, profitability, stock performance, ability to service our debt obligations and future cash flows.
Our operations may also be adversely affected by other economic factors within our markets such as negative changes in employment levels, job growth, wage growth, consumer confidence and household formation and availability of mortgage financing, one or all of which could result in reduced demand or price depression from current levels. Such negative trends could have a material adverse effect on homebuilding operations.
These factors and thus, the homebuilding business, have at times in the past been cyclical in nature. Any downturn in the national economy or the local economies of the markets in which we operate could have a material adverse effect on our sales, profitability, stock performance and ability to service our debt obligations. In particular, during 2014, approximately 26% and 11% of our home settlements occurred in the Washington, D.C. and Baltimore, MD metropolitan areas, respectively, which accounted for approximately 33% and 13%, respectively, of our 2014 homebuilding revenues. Thus, we are dependent to a significant extent on the economy and demand for housing in those areas.
7
Our inability to secure and control an adequate inventory of lots could adversely impact our operations.
The results of our homebuilding operations are dependent upon our continuing ability to control an adequate number of homebuilding lots in desirable locations. There can be no assurance that an adequate supply of building lots will continue to be available to us on terms similar to those available in the past, or that we will not be required to devote a greater amount of capital to controlling building lots than we have historically. An insufficient supply of building lots in one or more of our markets, an inability of our developers to deliver finished lots in a timely fashion due to their inability to secure financing to fund development activities or for other reasons, or our inability to purchase or finance building lots on reasonable terms could have a material adverse effect on our sales, profitability, stock performance, ability to service our debt obligations and future cash flows.
Volatility in the credit and capital markets may impact our ability to access necessary financing.
If we require working capital greater than that provided by our operations, we may be required to obtain alternative financing. No assurance can be given that additional financing will be available on terms that are favorable or acceptable. If we are required to seek financing to fund our working capital requirements, volatility in those markets may restrict our flexibility to access financing. If we are at any time unsuccessful in obtaining sufficient capital to fund our planned homebuilding expenditures, we may experience a substantial delay in the completion of homes then under construction, or we may be unable to control or purchase finished building lots. Any delay could result in cost increases and could have a material adverse effect on our sales, profitability, stock performance, ability to service our debt obligations and future cash flows.
Our mortgage banking operations are dependent in part on the availability, cost and other terms of mortgage financing facilities, and may be adversely affected by any shortage or increased cost of such financing. No assurance can be given that any additional or replacement financing will be available on terms that are favorable or acceptable. Our mortgage banking operations are also dependent upon the securitization market for mortgage-backed securities, and could be materially adversely affected by any fluctuation or downturn in such market.
Our current indebtedness may impact our future operations.
Our existing indebtedness contains restrictive covenants and any future indebtedness may also contain such covenants. These covenants include, or could include, restrictions on our ability to create, incur, assume or guarantee secured debt, enter into sale and leaseback transactions and conditions related to mergers and/or the sale of assets. Substantial losses by us or other action or inaction by us or our subsidiaries could result in the violation of one or more of these covenants, which could result in decreased liquidity or a default on our current or future indebtedness, thereby having a material adverse effect on our sales, profitability, stock performance, ability to service our debt obligations and future cash flows.
Government regulations and environmental matters could negatively affect our operations.
We are subject to various local, state and federal statutes, ordinances, rules and regulations concerning zoning, building design, construction and similar matters, including local regulations that impose restrictive zoning and density requirements in order to limit the number of homes that can eventually be built within the boundaries of a particular area. These regulations may further increase the cost to produce and market our products. In addition, we have from time to time been subject to, and may also be subject in the future to, periodic delays in our homebuilding projects due to building moratoriums in the areas in which we operate or delays in receiving the necessary governmental approvals. Changes in regulations that restrict homebuilding activities in one or more of our principal markets could have a material adverse effect on our sales, profitability, stock performance, ability to service our debt obligations and future cash flows.
In addition, new housing developments are often subject to various assessments or impact fees for schools, parks, streets, highways and other public improvements. The cost of these assessments is subject to substantial change and can cause increases in the construction cost of our homes, which, in turn, could reduce our profitability.
We are also subject to a variety of local, state and federal statutes, ordinances, rules and regulations concerning the protection of health and the environment. We are subject to a variety of environmental conditions that can affect our business and our homebuilding projects. The particular environmental laws that apply to any given homebuilding site vary greatly according to the location and environmental condition of the site and the present and former uses of the site and adjoining properties. Environmental laws and conditions may result in delays, cause us to incur substantial compliance and other costs, or prohibit or severely restrict homebuilding activity in certain environmentally sensitive regions or areas, thereby adversely affecting our sales, profitability, stock performance, ability to service our debt obligations and future cash flows.
8
Increased regulation of the mortgage industry could harm our future sales and earnings.
The mortgage industry remains under intense scrutiny and continues to face increasing regulation at the federal, state and local level. Potential changes to federal laws and regulations could have the effect of limiting the activities of FNMA and FHLMC, the entities that provide liquidity to the secondary mortgage market, which could lead to increases in mortgage interest rates. In addition, the Dodd-Frank Wall Street Reform and Consumer Protection Act, enacted on July 21, 2010, contains numerous provisions affecting residential mortgages and mortgage lending practices. The CFPB issued rules governing multiple issues in January 2013, including “Ability to Repay” underwriting provisions, definition and parameters of “Qualified Mortgages” and the establishment of certain protections from liability under “Ability to Repay” provisions for “Qualified Mortgages”. The CFPB’s rulemaking also included limitations on certain fees and loan officer compensation requirements. These rules were effective January 2014. In addition, the new requirements integrating disclosures under the Truth In Lending Act and the Real Estate Settlement Protection Act become effective August 1, 2015. The tighter underwriting requirements and fee restrictions and increasingly complex regulatory environment under these standards may negatively impact our mortgage loan origination business in the form of lower demand, decreased revenue and increased operating costs.
We are an approved seller/servicer of FNMA mortgage loans and an approved seller/issuer of GNMA, FHLMC, VA and FHA mortgage loans, and are subject to all of those agencies’ rules and regulations. Any significant impairment of our eligibility to sell/service these loans could have a material adverse impact on our mortgage operations. In addition, we are subject to regulation at the state and federal level with respect to specific origination, selling and servicing practices including the Real Estate Settlement and Protection Act. Adverse changes in governmental regulation may have a negative impact on our mortgage loan origination business.
We face competition in our homebuilding and mortgage banking operations.
The homebuilding industry is highly competitive. We compete with numerous homebuilders of varying size, ranging from local to national in scope, some of whom have greater financial resources than we do. We face competition:
|
● |
for suitable and desirable lots at acceptable prices; |
|
● |
from selling incentives offered by competing builders within and across developments; and |
|
● |
from the existing home resale market. |
Our homebuilding operations compete primarily on the basis of price, location, design, quality, service and reputation.
The mortgage banking industry is also competitive. Our main competition comes from national, regional and local mortgage bankers, credit unions, banks and mortgage brokers in each of these markets. Our mortgage banking operations compete primarily on the basis of customer service, variety of products offered, interest rates offered, prices of ancillary services and relative financing availability and costs.
There can be no assurance that we will continue to compete successfully in our homebuilding or mortgage banking operations. An inability to effectively compete may have an adverse impact on our sales, profitability, stock performance, ability to service our debt obligations and future cash flows.
A shortage of building materials or labor, or increases in materials or labor costs may adversely impact our operations.
The homebuilding business has from time to time experienced building material and labor shortages, including shortages in insulation, drywall, certain carpentry work and concrete, as well as fluctuating lumber prices and supply. In addition, strong construction market conditions could restrict the labor force available to our subcontractors and us in one or more of our markets. Significant increases in costs resulting from these shortages, or delays in construction of homes, could have a material adverse effect on our sales, profitability, stock performance, ability to service our debt obligations and future cash flows.
We rely on subcontractors to construct our homes. The failure of our subcontractors to properly construct our homes may be costly.
We engage subcontractors to perform the actual construction of our homes. Despite our quality control efforts, we may discover that our subcontractors were engaging in improper construction practices. The occurrence of such events could require us to repair the homes in accordance with our standards and as required by law. The cost of satisfying our legal obligations in these instances may be significant, and we may be unable to recover the cost of repair from subcontractors, suppliers and insurers.
9
Product liability litigation and warranty claims may adversely impact our operations.
Construction defect and home warranty claims are common and can represent a substantial risk for the homebuilding industry. The cost of insuring against construction defect and product liability related claims, as well as the claims themselves, can be high. In addition, insurance companies limit coverage offered to protect against these claims. Further restrictions on coverage availability, or significant increases in premium costs or claims, could have a material adverse effect on our financial results.
We are subject to litigation proceedings that could harm our business if an unfavorable ruling were to occur.
From time to time, we may become involved in litigation and other legal proceedings relating to claims arising from our operations in the normal course of business. As described in, but not limited to, Part I, Item 3, “Legal Proceedings” of this Form 10-K, we are currently subject to certain legal proceedings. Litigation is subject to inherent uncertainties, and unfavorable rulings may occur. We cannot assure you that these or other litigation or legal proceedings will not materially affect our ability to conduct our business in the manner that we expect or otherwise adversely affect us should an unfavorable ruling occur.
Our failure to maintain the security of our electronic and other confidential information could expose us to liability and materially adversely affect our financial condition and results of operations.
Privacy, security, and compliance concerns have continued to increase as technology has evolved. As part of our normal business activities, we collect and store certain confidential information, including personal information of homebuyers/borrowers and information about employees, vendors and suppliers. This information is entitled to protection under a number of federal and state laws. We may share some of this information with vendors who assist us with certain aspects of our business, particularly our mortgage and title businesses. Our failure to maintain the security of the data which we are required to protect, including via the penetration of our network security and the misappropriation of confidential and personal information, could result in business disruption, damage to our reputation, financial obligations to third parties, fines, penalties, regulatory proceedings and private litigation with potentially large costs, and also in deterioration in customers’ confidence in us and other competitive disadvantages, and thus could have a material adverse effect on our sales, profitability, stock performance, ability to service our debt obligations and future cash flows.
Weather-related and other events beyond our control may adversely impact our operations.
Extreme weather or other events, such as significant snowfalls, hurricanes, tornadoes, earthquakes, forest fires, floods, terrorist attacks or war may affect our markets, our operations and our profitability. These events may impact our physical facilities or those of our suppliers or subcontractors, causing us material increases in costs, or delays in construction of homes, which could have a material adverse effect upon our sales, profitability, stock performance, ability to service our debt obligations and future cash flows.
None.
Our corporate offices are located in Reston, Virginia, where we currently lease approximately 61,000 square feet of office space. The current corporate office lease expires in April 2026.
In connection with the operation of the homebuilding segment, we lease production facilities in the following six locations: Thurmont, Maryland; Burlington County, New Jersey; Farmington, New York; Kings Mountain, North Carolina; Darlington, Pennsylvania; and Portland, Tennessee. These facilities range in size from approximately 40,000 square feet to 400,000 square feet and total approximately one million square feet. Each of these leases contains various options for extensions of the lease and for the purchase of the facility. The Portland, Thurmont and Farmington leases expire in 2019, the Kings Mountain lease expires in 2022, the Burlington County lease expires in 2024 and the Darlington lease expires in 2025. In addition, we own a production facility with approximately 100,000 square feet in Dayton, Ohio. Our plant utilization was 35% of total capacity in both 2014 and 2013.
In connection with both our homebuilding and mortgage banking businesses, we also lease office space in multiple locations for homebuilding divisional offices and mortgage banking and title services branches under leases expiring at various times through 2023, none of which are individually material to our business. We anticipate that, upon expiration of existing leases, we will be able to renew them or obtain comparable facilities on terms acceptable to us.
10
In October 2004, Patrick Tracy, whom we had employed as a Sales and Marketing Representative (“SMR”), filed a lawsuit against us in the U.S. District Court for the Western District of New York alleging that we had misclassified him and other SMRs as outside sales personnel exempt from certain state and federal wage laws, including overtime pay requirements. Mr. Tracy’s attorneys subsequently filed several other lawsuits in various courts asserting substantially similar claims on behalf of various classes or groups of SMRs. None of those courts have held that the claims are appropriate for class, collective, or other group treatment, and the Western District of New York ruled in April 2013 that the claims in Mr. Tracy’s case could not proceed on such a basis. The Western District of New York reached the same conclusion in July 2014 regarding a separate case that Mr. Tracy’s attorneys brought on behalf of other SMRs.
In October 2013, Mr. Tracy’s individual claims were tried by a jury, which returned a unanimous verdict in our favor and found that we had properly classified Mr. Tracy as an exempt outside sales person. The plaintiff has sought review in the U.S. Court of Appeals for the Second Circuit, in which he challenges the legal standard that the trial court applied in crafting its jury instructions regarding the outside sales exemption, in addition to rulings that the trial court made at earlier stages of the case. That appeal is fully briefed, and the parties are awaiting a ruling or an oral argument date. The remainder of the cases noted above are in various stages of pre-trial proceedings, many of them stayed or administratively closed pending a final disposition of the Tracy action.
We believe that our compensation practices in regard to SMRs are entirely lawful and have vigorously defended all claims challenging those practices. In light of the points noted above, we have not recorded any associated liabilities on the accompanying condensed consolidated balance sheets in conjunction with any of those claims.
In June 2010, we received a Request for Information from the United States Environmental Protection Agency (“EPA”) pursuant to Section 308 of the Clean Water Act. The request sought information about storm water discharge practices in connection with homebuilding projects completed or underway by us in New York and New Jersey. We cooperated with this request, and provided information to the EPA. We were subsequently informed by the United States Department of Justice (“DOJ”) that the EPA forwarded the information on the matter to the DOJ, and the DOJ requested that we meet with the government to discuss the status of the case. Meetings took place in January 2012, August 2012 and November 2014 with representatives from both the EPA and DOJ. We have continued discussions with the EPA and DOJ. It is as yet unclear what next steps the DOJ will take in the matter. We intend to continue cooperating with any future EPA and/or DOJ inquiries. At this time, we cannot predict the outcome of this inquiry, nor can we reasonably estimate the potential costs that may be associated with its eventual resolution.
We are also involved in various other litigation arising in the ordinary course of business. In the opinion of management, and based on advice of legal counsel, this litigation is not expected to have a material adverse effect on our financial position, results of operations or cash flows. Legal costs incurred in connection with outstanding litigation are expensed as incurred.
None.
Executive Officers of the Registrant
|
Name |
|
Age |
|
|
Positions |
|
|
Paul C. Saville |
|
|
59 |
|
|
President and Chief Executive Officer of NVR |
|
Daniel D. Malzahn |
|
|
45 |
|
|
Vice President, Chief Financial Officer and Treasurer of NVR |
|
Robert W. Henley |
|
|
48 |
|
|
President of NVRM |
|
Eugene J. Bredow |
|
|
45 |
|
|
Vice President and Controller of NVR |
Paul C. Saville was named President and Chief Executive Officer of NVR effective July 1, 2005. Mr. Saville has been employed by NVR since 1981.
Daniel D. Malzahn was named Vice President, Chief Financial Officer and Treasurer of NVR effective February 20, 2013. Prior to February 20, 2013, Mr. Malzahn was Vice President of Planning and Investor Relations of NVR since February 1, 2004. Mr. Malzahn has been employed by NVR since 1994.
Robert W. Henley was named President of NVRM effective October 1, 2012. Mr. Henley had been serving as interim acting President of NVRM since June 1, 2012. Prior to June 1, 2012, Mr. Henley served as Vice President and Controller of NVR since July 1, 2005. Mr. Henley has been employed by NVR since 1994.
Eugene J. Bredow was named Vice President and Controller of NVR effective June 1, 2012. Prior to June 1, 2012, Mr. Bredow was the Vice President of Internal Audit and Corporate Governance of NVR since January 2008. Mr. Bredow has been employed by NVR since 2004.
11
PART II
|
Item 5. |
Market for Registrant’s Common Equity, Related Stockholder Matters and Issuer Purchases of Equity Securities. |
Our shares of common stock are listed and principally traded on the New York Stock Exchange under the ticker symbol “NVR.” The following table sets forth the high and low prices per share for our common stock for each fiscal quarter during the years ended December 31, 2014 and 2013:
|
|
|
HIGH |
|
|
LOW |
|
||
|
Prices per Share: |
|
|
|
|
|
|
|
|
|
2014 |
|
|
|
|
|
|
|
|
|
Fourth Quarter |
|
$ |
1,284.50 |
|
|
$ |
1,050.95 |
|
|
Third Quarter |
|
$ |
1,200.00 |
|
|
$ |
1,040.83 |
|
|
Second Quarter |
|
$ |
1,173.78 |
|
|
$ |
1,027.00 |
|
|
First Quarter |
|
$ |
1,220.95 |
|
|
$ |
991.05 |
|
|
2013 |
|
|
|
|
|
|
|
|
|
Fourth Quarter |
|
$ |
1,042.55 |
|
|
$ |
883.96 |
|
|
Third Quarter |
|
$ |
967.00 |
|
|
$ |
830.00 |
|
|
Second Quarter |
|
$ |
1,084.00 |
|
|
$ |
885.43 |
|
|
First Quarter |
|
$ |
1,100.00 |
|
|
$ |
920.00 |
|
As of the close of business on February 17, 2015, there were 303 shareholders of record.
We have never paid a cash dividend on our shares of common stock and have no current intention to do so in the future.
We had two stock repurchase authorizations outstanding during the quarter ended December 31, 2014. On December 17, 2013 and July 31, 2014, we publicly announced the Board of Directors’ approval for us to repurchase up to an aggregate of $300 million per authorization of our common stock in one or more open market and/or privately negotiated transactions. The repurchase authorizations do not have an expiration date. The following table provides information regarding common stock repurchases during the quarter ended December 31, 2014:
|
Period |
|
Total Number of Shares Purchased |
|
|
Average Price Paid per Share |
|
|
Total Number of Shares Purchased as Part of Publicly Announced Plans or Programs |
|
|
Maximum Number (or Approximate Dollar Value) of Shares that May Yet Be Purchased Under the Plans or Programs |
|
||||
|
October 1 - 31, 2014 |
|
|
76,663 |
|
|
$ |
1,127.91 |
|
|
|
76,663 |
|
|
$ |
242,220,702 |
|
|
November 1 - 30, 2014 |
|
|
— |
|
|
$ |
— |
|
|
|
— |
|
|
$ |
242,220,702 |
|
|
December 1 - 31, 2014 |
|
|
59,258 |
|
|
$ |
1,208.95 |
|
|
|
59,258 |
|
|
$ |
170,580,957 |
|
|
Total |
|
|
135,921 |
|
|
$ |
1,163.24 |
|
|
|
135,921 |
|
|
|
|
|
The October 2014 repurchase activity included 25,332 shares purchased under the December 17, 2013 authorization, which fully utilized that authorization. The remaining 51,331 shares were purchased under the July 31, 2014 authorization.
On February 18, 2015, the Board of Directors approved a repurchase authorization providing us authorization to repurchase up to an aggregate of $300 million of our common stock in one or more open market and/or privately negotiated transactions.
12
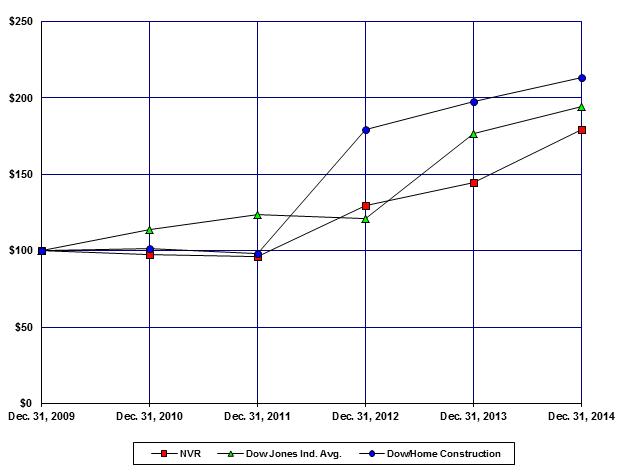
STOCK PERFORMANCE GRAPH
COMPARISON OF CUMULATIVE TOTAL EQUITYHOLDER RETURN ON EQUITY
The following chart graphs our performance in the form of cumulative total return to holders of our common stock since December 31, 2009 in comparison to the Dow Jones US Home Construction Index and the Dow Jones US Industrial Average Index for that same period, assuming that $100 was invested in NVR stock and the indices on December 31, 2009.
|
|
|
For the Year Ended December 31, |
|
|||||||||||||||||||||
|
Comparison of 5 Year Cumulative Total Return |
|
2009 |
|
|
2010 |
|
|
2011 |
|
|
2012 |
|
|
2013 |
|
|
2014 |
|
||||||
|
NVR, Inc. |
|
$ |
100 |
|
|
$ |
97 |
|
|
$ |
97 |
|
|
$ |
129 |
|
|
$ |
144 |
|
|
$ |
179 |
|
|
Dow Jones US Industrial Average |
|
$ |
100 |
|
|
$ |
114 |
|
|
$ |
124 |
|
|
$ |
121 |
|
|
$ |
177 |
|
|
$ |
194 |
|
|
Dow Jones US Home Construction |
|
$ |
100 |
|
|
$ |
101 |
|
|
$ |
98 |
|
|
$ |
179 |
|
|
$ |
197 |
|
|
$ |
213 |
|
13
(in thousands, except per share amounts)
The following tables set forth selected consolidated financial data. The selected income statement and balance sheet data have been derived from our consolidated financial statements for each of the periods presented and are not necessarily indicative of results of future operations. The selected financial data should be read in conjunction with, and are qualified in their entirety by, the accompanying consolidated financial statements and related notes included herein.
|
|
|
Year Ended December 31, |
|
|||||||||||||||||
|
|
|
2014 |
|
|
2013 |
|
|
2012 |
|
|
2011 |
|
|
2010 |
|
|||||
|
Consolidated Income Statement Data: |
|
|
|
|
|
|
|
|
|
|
|
|
|
|
|
|
|
|
|
|
|
Homebuilding data: |
|
|
|
|
|
|
|
|
|
|
|
|
|
|
|
|
|
|
|
|
|
Revenues |
|
$ |
4,375,059 |
|
|
$ |
4,134,481 |
|
|
$ |
3,121,244 |
|
|
$ |
2,611,195 |
|
|
$ |
2,980,758 |
|
|
Gross profit |
|
|
806,473 |
|
|
|
710,277 |
|
|
|
545,605 |
|
|
|
445,570 |
|
|
|
542,466 |
|
|
Mortgage Banking data: |
|
|
|
|
|
|
|
|
|
|
|
|
|
|
|
|
|
|
|
|
|
Mortgage banking fees |
|
|
69,509 |
|
|
|
76,786 |
|
|
|
63,406 |
|
|
|
47,954 |
|
|
|
61,134 |
|
|
Interest income |
|
|
4,940 |
|
|
|
4,983 |
|
|
|
4,504 |
|
|
|
5,702 |
|
|
|
5,411 |
|
|
Interest expense |
|
|
549 |
|
|
|
545 |
|
|
|
546 |
|
|
|
875 |
|
|
|
1,126 |
|
|
Consolidated data: |
|
|
|
|
|
|
|
|
|
|
|
|
|
|
|
|
|
|
|
|
|
Net Income |
|
|
281,630 |
|
|
|
266,477 |
|
|
|
180,588 |
|
|
|
129,420 |
|
|
|
206,005 |
|
|
Earnings per share: |
|
|
|
|
|
|
|
|
|
|
|
|
|
|
|
|
|
|
|
|
|
Basic |
|
$ |
65.83 |
|
|
$ |
56.25 |
|
|
$ |
36.04 |
|
|
$ |
23.66 |
|
|
$ |
34.96 |
|
|
Diluted |
|
$ |
63.50 |
|
|
$ |
54.81 |
|
|
$ |
35.12 |
|
|
$ |
23.01 |
|
|
$ |
33.42 |
|
|
Weighted average number of shares outstanding: |
|
|
|
|
|
|
|
|
|
|
|
|
|
|
|
|
|
|
|
|
|
Basic |
|
|
4,278 |
|
|
|
4,737 |
|
|
|
5,011 |
|
|
|
5,469 |
|
|
|
5,893 |
|
|
Diluted |
|
|
4,435 |
|
|
|
4,862 |
|
|
|
5,142 |
|
|
|
5,624 |
|
|
|
6,165 |
|
|
|
|
|
|
|
|
|
|
|
|
|
|
|
|
|
|
|
|
|
|
|
|
|
|
December 31, |
|
|||||||||||||||||
|
|
|
2014 |
|
|
2013 |
|
|
2012 |
|
|
2011 |
|
|
2010 |
|
|||||
|
Consolidated Balance Sheet Data: |
|
|
|
|
|
|
|
|
|
|
|
|
|
|
|
|
|
|
|
|
|
Homebuilding inventory |
|
$ |
869,486 |
|
|
$ |
738,565 |
|
|
$ |
678,131 |
|
|
$ |
533,150 |
|
|
$ |
431,329 |
|
|
Contract land deposits, net |
|
|
294,676 |
|
|
|
236,885 |
|
|
|
191,538 |
|
|
|
131,930 |
|
|
|
100,786 |
|
|
Total assets |
|
|
2,351,335 |
|
|
|
2,486,148 |
|
|
|
2,604,842 |
|
|
|
1,779,485 |
|
|
|
2,260,061 |
|
|
Notes and loans payable (1) |
|
|
599,166 |
|
|
|
599,190 |
|
|
|
599,745 |
|
|
|
1,613 |
|
|
|
92,089 |
|
|
Shareholders’ equity |
|
|
1,124,255 |
|
|
|
1,261,352 |
|
|
|
1,480,477 |
|
|
|
1,374,799 |
|
|
|
1,740,374 |
|
|
Cash dividends per share |
|
|
— |
|
|
|
— |
|
|
|
— |
|
|
|
— |
|
|
|
— |
|
|
|
|
(1) |
Balance does not include non-recourse debt related to the consolidated variable interest entity. |
(dollars in thousands, except per share data)
Results of Operations for the Years Ended December 31, 2014, 2013 and 2012
Overview
Business
Our primary business is the construction and sale of single-family detached homes, townhomes and condominium buildings, all of which are primarily constructed on a pre-sold basis. To fully serve customers of our homebuilding operations, we also operate a mortgage banking and title services business. We primarily conduct our operations in mature markets. Additionally, we generally grow our business through market share gains in our existing markets and by expanding into markets contiguous to our current active markets. Our four homebuilding reportable segments consist of the following regions:
|
Mid Atlantic: |
|
Maryland, Virginia, West Virginia, Delaware and Washington, D.C. |
|
North East: |
|
New Jersey and eastern Pennsylvania |
|
Mid East: |
|
New York, Ohio, western Pennsylvania, Indiana and Illinois |
|
South East: |
|
North Carolina, South Carolina, Tennessee and Florida |
14
Our lot acquisition strategy is predicated upon avoiding the financial requirements and risks associated with direct land ownership and development. Historically, we generally have not engaged in land development to obtain finished lots for use in our homebuilding operations. Instead, we have acquired finished lots at market prices from various third party land developers pursuant to fixed price purchase agreements. These purchase agreements require deposits, typically ranging up to 10% of the aggregate purchase price of the finished lots, in the form of cash or letters of credit that may be forfeited if we fail to perform under the purchase agreement. This strategy has allowed us to maximize inventory turnover, which we believe enables us to minimize market risk and to operate with less capital, thereby enhancing rates of return on equity and total capital.
In addition to constructing homes primarily on a pre-sold basis and utilizing what we believe is a conservative lot acquisition strategy, we focus on obtaining and maintaining a leading market position in each market we serve. This strategy allows us to gain valuable efficiencies and competitive advantages in our markets, which we believe contributes to minimizing the adverse effects of regional economic cycles and provides growth opportunities within these markets. Our continued success is contingent upon our ability to control an adequate supply of finished lots on which to build. As a result, in certain specific strategic circumstances we deviate from our historical lot acquisition strategy and engage in joint venture arrangements with land developers or directly acquire raw ground already zoned for its intended use for development. Once we acquire control of any raw ground, we determine whether to sell the raw parcel to a developer and enter into a fixed price purchase agreement with the developer to purchase the finished lots, or to hire a developer to develop the land on our behalf. While joint venture arrangements and direct land development activity are not our preferred method of acquiring finished building lots, we may enter into additional transactions in the future on a limited basis where there exists a compelling strategic or prudent financial reason to do so. We expect, however, to continue to acquire substantially all of our finished lot inventory using fixed price purchase agreements with forfeitable deposits.
As of December 31, 2014, we controlled approximately 62,800 lots under purchase agreements with deposits in cash and letters of credit totaling approximately $348,400 and $1,700, respectively. In addition, we controlled approximately 5,500 lots through joint venture limited liability corporations with an aggregate investment of approximately $82,000. Further, as of December 31, 2014, we had approximately $33,700 in land under development, that once fully developed will result in approximately 480 lots for use in our homebuilding operations. Of the total finished lots expected to be developed, 94 lots are under contract to be sold to an unrelated party under lot purchase agreements. Included in the number of controlled lots are approximately 7,800 lots for which we have recorded a contract land deposit impairment reserve of approximately $56,100 as of December 31, 2014. See Notes 3, 4 and 5 to the consolidated financial statements included herein for additional information regarding fixed price purchase agreements, joint ventures and land under development, respectively. Additionally, we have certain properties under contract with land owners that are expected to yield approximately 5,700 lots, which are not included in our number of total lots controlled. Some of these properties may require rezoning or other approvals to achieve the expected yield. These properties are controlled with deposits and letters of credit totaling approximately $2,300 and $3,000, respectively, as of December 31, 2014, of which approximately $2,600 is refundable if we do not perform under the contract. We generally expect to assign the raw land contracts to a land developer and simultaneously enter into a lot purchase agreement with the assignee if the project is determined to be feasible.
Current Business Environment and Key Financial Results
The housing market recovery continues to be uneven. During 2014, the housing market experienced some weakness as existing home inventory increased and affordability decreased following increasing prices during 2013. There has also been an increase in the number of new home communities in many markets. These factors have resulted in weakness in housing prices in 2014. The housing market also continues to face challenges from mortgage underwriting standards.
Our new orders, net of cancellations (“New Orders”) for 2014 increased 5% from 2013 while our average new order sales price increased 4% to $373.7 in 2014. Consolidated revenues for the year ended December 31, 2014 totaled $4,375,059, an increase of 6% from $4,134,481 in 2013. Our gross profit margin within our homebuilding business increased to 18.4% in 2014 compared to 17.2% in 2013. Gross profit in 2013 was negatively impacted by two previously disclosed service related accruals totaling approximately $31,600, a 76 basis point reduction to gross profit in 2013. Net income for 2014 increased 6% from 2013 to $281,630. Diluted earnings per share in 2014 was $63.50, an increase of 16% from 2013. Diluted earnings per share was favorably impacted by our ongoing share repurchase program, under which we repurchased 507,648 shares of our stock at an aggregate purchase price of $567,544 during 2014.
We believe that a continuation of the housing market recovery which began in 2012 is dependent upon a sustained overall economic recovery, driven by continued improvement in job growth and consumer confidence levels as well as improvement in wage growth and household formation. We expect to face a challenging market in 2015, as a result of the weakness in new home sales prices and increased competition associated with an expected increase in new home communities in our markets. Due to the strength of our balance sheet, we believe that we are well positioned to take advantage of opportunities that may arise from future economic and homebuilding market volatility.
15
Homebuilding Operations
The following table summarizes the results of our consolidated homebuilding operations and certain operating activity for each of the last three years:
|
|
|
Year Ended December 31, |
|
|||||||||
|
|
|
2014 |
|
|
2013 |
|
|
2012 |
|
|||
|
Revenues |
|
$ |
4,375,059 |
|
|
$ |
4,134,481 |
|
|
$ |
3,121,244 |
|
|
Cost of sales |
|
$ |
3,568,586 |
|
|
$ |
3,424,204 |
|
|
$ |
2,575,639 |
|
|
Gross profit margin percentage |
|
|
18.4 |
% |
|
|
17.2 |
% |
|
|
17.5 |
% |
|
Selling, general and administrative expenses |
|
$ |
358,851 |
|
|
$ |
313,029 |
|
|
$ |
301,184 |
|
|
Settlements (units) |
|
|
11,859 |
|
|
|
11,834 |
|
|
|
9,843 |
|
|
Average settlement price |
|
$ |
368.5 |
|
|
$ |
349.1 |
|
|
$ |
317.1 |
|
|
New orders (units) |
|
|
12,389 |
|
|
|
11,800 |
|
|
|
10,954 |
|
|
Average new order price |
|
$ |
373.7 |
|
|
$ |
360.4 |
|
|
$ |
328.8 |
|
|
Backlog (units) |
|
|
5,475 |
|
|
|
4,945 |
|
|
|
4,979 |
|
|
Average backlog price |
|
$ |
384.6 |
|
|
$ |
373.2 |
|
|
$ |
346.2 |
|
|
New order cancellation rate |
|
|
14.6 |
% |
|
|
14.9 |
% |
|
|
14.5 |
% |
Consolidated Homebuilding Revenues
Homebuilding revenues increased 6% in 2014 compared to 2013 primarily as a result of a 6% increase in the average settlement price, while the number of units settled was flat year over year. The increase in the average settlement price was primarily attributable to the average price of homes in backlog being approximately 8% higher entering 2014 compared to 2013 and a 5% higher average sales price of New Orders for the first six months of 2014 compared to the same period in 2013. The higher average price of homes in backlog entering 2014 was attributable to the aforementioned increasing prices in 2013.
Homebuilding revenues in 2013 increased 32% from 2012, as a result of a 20% increase in the number of homes settled and a 10% increase in the average settlement price year over year. The increase in the number of homes settled was primarily attributable to a 35% higher beginning backlog unit balance entering 2013 compared to 2012, offset partially by a lower backlog turnover rate in 2013 compared to 2012. Average settlement prices in 2013 were favorably impacted primarily by a 10% higher average price of homes in backlog entering 2013 compared to the average price of homes in backlog entering 2012 and a 10% higher average sales price of New Orders for the first six months of 2013 compared to 2012. The higher beginning backlog balance and average sales prices were driven by the favorable market conditions experienced in the second half of 2012.
Consolidated Homebuilding New Orders
The number of New Orders and the average sales price of New Orders increased 5% and 4%, respectively, during 2014 when compared to 2013. New Orders were higher due to the 8% increase in the average number of active communities year over year, offset partially by lower sales absorption rates in many of our markets. Average sales prices were higher in each of our market segments year over year as a result of favorable market conditions in 2013, which led to higher prices entering 2014.
The number of New Orders and the average sales price of New Orders in 2013 increased 8% and 10%, respectively, when compared to 2012. New Orders and the average sales price were higher year over year in each of our market segments. The increase in New Orders was driven by a 12% increase in the number of active communities year over year, offset partially by a lower absorption rate in 2013. In addition, our December 2012 acquisition of Heartland Homes added 355 New Orders in 2013. The increase in active communities and pricing in 2013 was attributable to the favorable market conditions through the first half of 2013.
Consolidated Homebuilding Gross Profit
Gross profit margins in 2014 increased to 18.4% compared to 17.2% in 2013. Gross profit margins were favorably impacted by our average settlement prices increasing at a higher rate than material and lot costs year over year, as well as by a relative shift in settlements to our Mid-Atlantic and North East segments which have higher average gross profit margins. As noted in the Overview section above, gross profit margins in 2013 were negatively impacted by two service related accruals which reduced the 2013 gross profit margin by 76 basis points. We expect continued gross margin pressure over the next several quarters due to weakness in sales prices.
Gross profit margins in 2013 decreased to 17.2% from 17.5% in 2012. Gross profit margins were negatively impacted in 2013 by two service related accruals totaling approximately $31,600 (see Note 13 in the accompanying consolidated financial statements for additional discussion of service accruals). Excluding these charges, gross profit margin was 17.9% in 2013, an increase of 46 basis points from the prior year. Gross profit margins were favorably impacted by higher settlement volume in 2013 allowing us to better
16
leverage our operating costs, partially offset by higher construction costs, including lumber and certain other commodity costs, year over year.
Consolidated Homebuilding Selling, General and Administrative (“SG&A”)
SG&A expenses in 2014 increased approximately $45,800, or 15%, compared to 2013 and increased as a percentage of revenue to 8.2% from 7.6% year over year. The increase in SG&A expenses was attributable to an approximate $26,000 increase in equity-based compensation expense and an approximate $14,100 increase in sales and marketing expenses in 2014. Equity-based compensation expense increased primarily due to the granting of non-qualified stock options (“Options”) under the 2014 Equity Incentive Plan (the “2014 Plan”) following shareholder approval of the 2014 Plan in May 2014 and restricted share unit (“RSUs”) grants in the second quarter of 2013. In addition, in 2013 we recorded a reversal of approximately $7,100 in equity-based compensation expense as a result of an adjustment to our stock option forfeiture rates based on our actual forfeiture experience. Sales and marketing expenses increased due primarily to an increase in model home expenditures attributable to the 8% increase in the number of active communities.
SG&A expenses in 2013 increased approximately $11,800, or 4%, compared to 2012, but as a percentage of revenue decreased to 7.6% in 2013 from 9.7% in 2012. The increase in SG&A expenses was attributable to increases of approximately $20,300 in personnel costs in 2013 due to an increase in headcount year over year. In addition, sales and marketing expenses were approximately $14,400 higher in 2013 due to the increase in the number of active communities. These cost increases were partially offset by an approximate $28,700 reduction in equity-based compensation expense in 2013 compared to 2012. Equity-based compensation expense was favorably impacted as a result of the restricted share units (“RSUs”) issued in 2010 becoming fully vested as of December 31, 2012 and the reversal of approximately $7,100 in equity-based compensation expense previously recorded to SG&A expense as we adjusted our stock option forfeiture rates based on our actual forfeiture experience. These reductions were offset partially by equity-based compensation expense incurred in 2013 related to RSUs issued in May 2013. The decrease in SG&A costs as a percentage of revenue was driven by the 32% increase in revenue in 2013, allowing us to better leverage our overhead costs.
Consolidated Homebuilding Backlog
Backlog units and dollars increased approximately 11% to 5,475 units and 14% to $2,105,635, respectively, as of December 31, 2014 compared to 4,945 units and $1,845,600, respectively, as of December 31, 2013. Backlog units were higher primarily due to a 13% increase in New Orders for the six month period ended December 31, 2014 compared to the same period in 2013. Backlog dollars were favorably impacted by the 11% increase in the backlog unit balance and a 3% higher average price of homes in backlog year over year. The average price of homes in backlog was favorably impacted by a 2% increase in the average sales price of New Orders for the six month period ended December 31, 2014 compared to the same period in 2013.
Backlog units decreased approximately 1% to 4,945 as of December 31, 2013 compared to 4,979 as of December 31, 2012, while backlog dollars increased approximately 7% to $1,845,600 from $1,723,914 as of December 31, 2013 and December 31, 2012, respectively. Backlog dollars were higher primarily due to a 10% increase in the average price of New Orders for the six-month period ended December 31, 2013 compared to the same period in 2012.
Backlog, which represents homes sold but not yet settled with the customer, may be impacted by customer cancellations for various reasons that are beyond our control, such as failure to obtain mortgage financing, inability to sell an existing home, job loss, or a variety of other reasons. In any period, a portion of the cancellations that we experience are related to new sales that occurred during the same period, and a portion are related to sales that occurred in prior periods and therefore appeared in the beginning backlog for the current period. Expressed as the total of all cancellations during the period as a percentage of gross sales during the period, our cancellation rate was approximately 15% in each of 2014, 2013 and 2012. Additionally, during each of 2014, 2013 and 2012, approximately 6% of a reporting quarter’s opening backlog cancelled during the fiscal quarter. We can provide no assurance that our historical cancellation rates are indicative of the actual cancellation rate that may occur in future years. Other than those units that are cancelled, we expect to settle substantially all of our December 31, 2014 backlog during 2015. See “Risk Factors” in Item 1A of this Form 10-K.
The backlog turnover rate is impacted by various factors, including, but not limited to, changes in New Order activity, internal production capacity, external subcontractor capacity and other external factors over which we do not exercise control.
Reportable Homebuilding Segments
Homebuilding profit before tax includes all revenues and income generated from the sale of homes, less the cost of homes sold, SG&A expenses, and a corporate capital allocation charge determined at the corporate headquarters. The corporate capital allocation charge eliminates in consolidation and is based on the segment’s average net assets employed. The corporate capital allocation charged to the operating segment allows the Chief Operating Decision Maker to determine whether the operating segment’s results are providing the desired rate of return after covering our cost of capital. We record charges on contract land deposits when we determine
17
that it is probable that recovery of the deposit is impaired. For segment reporting purposes, impairments on contract land deposits are generally charged to the operating segment upon the determination to terminate a finished lot purchase agreement with the developer or to restructure a lot purchase agreement resulting in the forfeiture of the deposit. We evaluate our entire net contract land deposit portfolio for impairment each quarter. For additional information regarding our contract land deposit impairment analysis, see the Critical Accounting Policies section within this Management Discussion and Analysis of Financial Condition and Results of Operations. For presentation purposes below, the contract land deposit reserve at December 31, 2014 and 2013 has been allocated to the reportable segments for the respective years to show contract land deposits on a net basis. The net contract land deposit balances below also include approximately $4,700 and $2,500 at December 31, 2014 and 2013, respectively, of letters of credit issued as deposits in lieu of cash. The following tables summarize certain homebuilding operating activity by reportable segment for each of the last three years:
Selected Segment Financial Data:
|
|
|
Year Ended December 31, |
|
|||||||||
|
|
|
2014 |
|
|
2013 |
|
|
2012 |
|
|||
|
Revenues: |
|
|
|
|
|
|
|
|
|
|
|
|
|
Mid Atlantic |
|
$ |
2,617,108 |
|
|
$ |
2,439,387 |
|
|
$ |
1,877,905 |
|
|
North East |
|
|
376,862 |
|
|
|
332,681 |
|
|
|
278,715 |
|
|
Mid East |
|
|
892,513 |
|
|
|
908,198 |
|
|
|
630,367 |
|
|
South East |
|
|
488,576 |
|
|
|
454,215 |
|
|
|
334,257 |
|
|
|
|
Year Ended December 31, |
|
|||||||||
|
|
|
2014 |
|
|
2013 |
|
|
2012 |
|
|||
|
Gross profit margin: |
|
|
|
|
|
|
|
|
|
|
|
|
|
Mid Atlantic |
|
$ |
499,172 |
|
|
$ |
461,481 |
|
|
$ |
345,009 |
|
|
North East |
|
|
70,462 |
|
|
|
45,860 |
|
|
|
48,329 |
|
|
Mid East |
|
|
141,146 |
|
|
|
142,331 |
|
|
|
103,128 |
|
|
South East |
|
|
89,544 |
|
|
|
77,277 |
|
|
|
55,788 |
|
|
|
|
Year Ended December 31, |
|
|||||||||
|
|
|
2014 |
|
|
2013 |
|
|
2012 |
|
|||
|
Segment profit: |
|
|
|
|
|
|
|
|
|
|
|
|
|
Mid Atlantic |
|
$ |
271,965 |
|
|
$ |
276,399 |
|
|
$ |
189,089 |
|
|
North East |
|
|
33,390 |
|
|
|
14,294 |
|
|
|
21,529 |
|
|
Mid East |
|
|
47,538 |
|
|
|
55,537 |
|
|
|
39,847 |
|
|
South East |
|
|
37,525 |
|
|
|
35,001 |
|
|
|
20,674 |
|
|
|
|
Year Ended December 31, |
|
|||||||||
|
|
|
2014 |
|
|
2013 |
|
|
2012 |
|
|||
|
Gross profit margin percentage: |
|
|
|
|
|
|
|
|
|
|
|
|
|
Mid Atlantic |
|
|
19.1 |
% |
|
|
18.9 |
% |
|
|
18.4 |
% |
|
North East |
|
|
18.7 |
% |
|
|
13.8 |
% |
|
|
17.3 |
% |
|
Mid East |
|
|
15.8 |
% |
|
|
15.7 |
% |
|
|
16.4 |
% |
|
South East |
|
|
18.3 |
% |
|
|
17.0 |
% |
|
|
16.7 |
% |
18
Segment Operating Activity:
|
|
|
Year Ended December 31, |
|
|||||||||||||||||||||
|
|
|
2014 |
|
|
2013 |
|
|
2012 |
|
|||||||||||||||
|
|
|
Units |
|
|
Average Price |
|
|
Units |
|
|
Average Price |
|
|
Units |
|
|
Average Price |
|
||||||
|
Settlements: |
|
|
|
|
|
|
|
|
|
|
|
|
|
|
|
|
|
|
|
|
|
|
|
|
|
Mid Atlantic |
|
|
6,129 |
|
|
$ |
426.3 |
|
|
|
6,029 |
|
|
$ |
404.0 |
|
|
|
5,047 |
|
|
$ |
372.1 |
|
|
North East |
|
|
1,089 |
|
|
$ |
346.1 |
|
|
|
1,013 |
|
|
$ |
328.4 |
|
|
|
889 |
|
|
$ |
313.5 |
|
|
Mid East |
|
|
2,845 |
|
|
$ |
313.6 |
|
|
|
3,023 |
|
|
$ |
300.4 |
|
|
|
2,472 |
|
|
$ |
255.0 |
|
|
South East |
|
|
1,796 |
|
|
$ |
271.9 |
|
|
|
1,769 |
|
|
$ |
256.7 |
|
|
|
1,435 |
|
|
$ |
232.8 |
|
|
Total |
|
|
11,859 |
|
|
$ |
368.5 |
|
|
|
11,834 |
|
|
$ |
349.1 |
|
|
|
9,843 |
|
|
$ |
317.1 |
|
|
|
|
Year Ended December 31, |
|
|||||||||||||||||||||
|
|
|
2014 |
|
|
2013 |
|
|
2012 |
|
|||||||||||||||
|
|
|
Units |
|
|
Average Price |
|
|
Units |
|
|
Average Price |
|
|
Units |
|
|
Average Price |
|
||||||
|
New orders, net of cancellations: |
|
|
|
|
|
|
|
|
|
|
|
|
|
|
|
|
|
|
|
|
|
|
|
|
|
Mid Atlantic |
|
|
6,365 |
|
|
$ |
431.4 |
|
|
|
6,056 |
|
|
$ |
416.7 |
|
|
|
5,757 |
|
|
$ |
382.9 |
|
|
North East |
|
|
1,182 |
|
|
$ |
347.8 |
|
|
|
1,075 |
|
|
$ |
335.5 |
|
|
|
946 |
|
|
$ |
325.3 |
|
|
Mid East |
|
|
2,963 |
|
|
$ |
320.6 |
|
|
|
2,903 |
|
|
$ |
309.5 |
|
|
|
2,625 |
|
|
$ |
264.2 |
|
|
South East |
|
|
1,879 |
|
|
$ |
278.1 |
|
|
|
1,766 |
|
|
$ |
265.9 |
|
|
|
1,626 |
|
|
$ |
243.7 |
|
|
Total |
|
|
12,389 |
|
|
$ |
373.7 |
|
|
|
11,800 |
|
|
$ |
360.4 |
|
|
|
10,954 |
|
|
$ |
328.8 |
|
|
|
|
Year Ended December 31, |
|
|||||||||||||||||||||
|
|
|
2014 |
|
|
2013 |
|
|
2012 |
|
|||||||||||||||
|
|
|
Units |
|
|
Average Price |
|
|
Units |
|
|
Average Price |
|
|
Units |
|
|
Average Price |
|
||||||
|
Backlog: |
|
|
|
|
|
|
|
|
|
|
|
|
|
|
|
|
|
|
|
|
|
|
|
|
|
Mid Atlantic |
|
|
2,946 |
|
|
$ |
434.2 |
|
|
|
2,710 |
|
|
$ |
422.7 |
|
|
|
2,683 |
|
|
$ |
394.2 |
|
|
North East |
|
|
588 |
|
|
$ |
349.1 |
|
|
|
495 |
|
|
$ |
345.5 |
|
|
|
433 |
|
|
$ |
330.2 |
|
|
Mid East |
|
|
1,150 |
|
|
$ |
340.2 |
|
|
|
1,032 |
|
|
$ |
323.0 |
|
|
|
1,152 |
|
|
$ |
297.8 |
|
|
South East |
|
|
791 |
|
|
$ |
290.7 |
|
|
|
708 |
|
|
$ |
276.5 |
|
|
|
711 |
|
|
$ |
253.4 |
|
|
Total |
|
|
5,475 |
|
|
$ |
384.6 |
|
|
|
4,945 |
|
|
$ |
373.2 |
|
|
|
4,979 |
|
|
$ |
346.2 |
|
Operating Data:
|
|
|
Year Ended December 31, |
|
|||||||||
|
|
|
2014 |
|
|
2013 |
|
|
2012 |
|
|||
|
New order cancellation rate: |
|
|
|
|
|
|
|
|
|
|
|
|
|
Mid Atlantic |
|
|
14.9 |
% |
|
|
14.9 |
% |
|
|
13.4 |
% |
|
North East |
|
|
14.8 |
% |
|
|
15.0 |
% |
|
|
16.8 |
% |
|
Mid East |
|
|
12.5 |
% |
|
|
13.5 |
% |
|
|
15.0 |
% |
|
South East |
|
|
16.6 |
% |
|
|
16.8 |
% |
|
|
16.0 |
% |
|
|
|
Year Ended December 31, |
|
|||||||||
|
|
|
2014 |
|
|
2013 |
|
|
2012 |
|
|||
|
Average active communities: |
|
|
|
|
|
|
|
|
|
|
|
|
|
Mid Atlantic |
|
|
245 |
|
|
|
220 |
|
|
|
198 |
|
|
North East |
|
|
44 |
|
|
|
39 |
|
|
|
38 |
|
|
Mid East |
|
|
127 |
|
|
|
125 |
|
|
|
105 |
|
|
South East |
|
|
72 |
|
|
|
67 |
|
|
|
63 |
|
|
Total |
|
|
488 |
|
|
|
451 |
|
|
|
404 |
|
19
Homebuilding Inventory:
|
|
|
As of December 31, |
|
|||||
|
|
|
2014 |
|
|
2013 |
|
||
|
Sold inventory: |
|
|
|
|
|
|
|
|
|
Mid Atlantic |
|
$ |
435,833 |
|
|
$ |
354,407 |
|
|
North East |
|
|
61,233 |
|
|
$ |
57,541 |
|
|
Mid East |
|
|
115,210 |
|
|
$ |
93,189 |
|
|
South East |
|
|
73,223 |
|
|
$ |
57,631 |
|
|
Total (1) |
|
$ |
685,499 |
|
|
$ |
562,768 |
|
|
|
|
As of December 31, |
|
|||||
|
|
|
2014 |
|
|
2013 |
|
||
|
Unsold lots and housing units inventory: |
|
|
|
|
|
|
|
|
|
Mid Atlantic |
|
$ |
103,685 |
|
|
$ |
77,266 |
|
|
North East |
|
|
5,528 |
|
|
$ |
3,881 |
|
|
Mid East |
|
|
8,953 |
|
|
$ |
12,772 |
|
|
South East |
|
|
12,051 |
|
|
$ |
8,834 |
|
|
Total (1) (2) |
|
$ |
130,217 |
|
|
$ |
102,753 |
|
|
(1) |
The reconciling items between segment inventory and consolidated inventory include certain consolidation adjustments necessary to convert the reportable segments’ results, which are predominantly maintained on a cash basis, to a full accrual basis for external financial statement presentation purposes and are not allocated to our operating segments. |
|
(2) |
The year over year increases in unsold inventory are primarily due to the transfer of costs attributable to completed lots from our land under development to unsold inventory. |
|
|
|
Year Ended December 31, |
|
|||||||||
|
|
|
2014 |
|
|
2013 |
|
|
2012 |
|
|||
|
Sold and unsold inventory impairments: |
|
|
|
|
|
|
|
|
|
|
|
|
|
Mid Atlantic |
|
$ |
530 |
|
|
$ |
222 |
|
|
$ |
349 |
|
|
North East |
|
|
21 |
|
|
|
47 |
|
|
|
19 |
|
|
Mid East |
|
|
649 |
|
|
|
923 |
|
|
|
72 |
|
|
South East |
|
|
— |
|
|
|
82 |
|
|
|
102 |
|
|
Total |
|
$ |
1,200 |
|
|
$ |
1,274 |
|
|
$ |
542 |
|
Lots Controlled and Land Deposits:
|
|
|
As of December 31, |
|
|||||
|
|
|
2014 |
|
|
2013 |
|
||
|
Total lots controlled: |
|
|
|
|
|
|
|
|
|
Mid Atlantic |
|
|
32,800 |
|
|
|
32,600 |
|
|
North East |
|
|
6,000 |
|
|
|
5,400 |
|
|
Mid East |
|
|
17,400 |
|
|
|
16,400 |
|
|
South East |
|
|
12,500 |
|
|
|
10,200 |
|
|
Total |
|
|
68,700 |
|
|
|
64,600 |
|
|
|
|
As of December 31, |
|
|||||
|
|
|
2014 |
|
|
2013 |
|
||
|
Lots included in impairment reserve: |
|
|
|
|
|
|
|
|
|
Mid Atlantic |
|
|
3,700 |
|
|
|
4,400 |
|
|
North East |
|
|
600 |
|
|
|
900 |
|
|
Mid East |
|
|
2,500 |
|
|
|
2,600 |
|
|
South East |
|
|
1,000 |
|
|
|
1,300 |
|
|
Total |
|
|
7,800 |
|
|
|
9,200 |
|
20
|
|
|
As of December 31, |
|
|||||
|
|
|
2014 |
|
|
2013 |
|
||
|
Contract land deposits, net: |
|
|
|
|
|
|
|
|
|
Mid Atlantic |
|
$ |
188,747 |
|
|
$ |
156,570 |
|
|
North East |
|
|
27,900 |
|
|
|
16,174 |
|
|
Mid East |
|
|
40,061 |
|
|
|
39,907 |
|
|
South East |
|
|
42,642 |
|
|
|
26,693 |
|
|
Total |
|
$ |
299,350 |
|
|
$ |
239,344 |
|
|
|
|
Year Ended December 31, |
|
|||||||||
|
|
|
2014 |
|
|
2013 |
|
|
2012 |
|
|||
|
Contract land deposit impairments (recoveries), net: |
|
|
|
|
|
|
|
|
|
|
|
|
|
Mid Atlantic |
|
$ |
1,098 |
|
|
$ |
(715 |
) |
|
$ |
464 |
|
|
North East |
|
|
1,647 |
|
|
|
803 |
|
|
|
1,588 |
|
|
Mid East |
|
|
149 |
|
|
|
173 |
|
|
|
1,075 |
|
|
South East |
|
|
493 |
|
|
|
119 |
|
|
|
203 |
|
|
Total |
|
$ |
3,387 |
|
|
$ |
380 |
|
|
$ |
3,330 |
|
Mid Atlantic
2014 versus 2013
The Mid Atlantic segment had an approximate $4,400, or 2%, decrease in segment profit in 2014 compared to 2013. Segment profit was negatively impacted by higher SG&A expense attributable to an 11% increase in the average number of active communities year over year and an increase in the corporate capital allocation due primarily to higher inventory levels. Segment revenues increased approximately $177,700, or 7%, year over year due primarily to a 6% increase in the average settlement price in 2014 compared to 2013. The average settlement price was favorably impacted by a 7% higher average price of homes in backlog entering 2014 compared to the same period in 2013. The Mid Atlantic segment’s gross profit margin percentage was flat year over year; however, as noted below, the gross profit margin in 2013 was negatively impacted by a service related accrual which reduced 2013 gross profit margin by 64 basis points. Excluding this charge, gross profit margin decreased 49 basis points to 19.1% in 2014. Current year gross profit margin was negatively impacted by an increase in certain material costs.
Segment New Orders and the average sales price for New Orders in 2014 increased 5% and 4%, respectively, compared to 2013. New Orders were favorably impacted by an 11% increase in the average number of active communities in 2014 compared to 2013, offset partially by lower absorption rates attributable to lower traffic levels year over year. The increase in the average sales price of New Orders was attributable to the favorable market conditions in 2013, which led to higher average sales prices entering 2014.
2013 versus 2012
The Mid Atlantic segment had an approximate $87,300, or 46%, increase in segment profit in 2013 compared to 2012. The increase in segment profit was driven by the increase of approximately $561,500, or 30%, in revenues year over year due to a 20% increase in the number of units settled and a 9% increase in the average settlement price. The increase in units settled was attributable to a 36% higher backlog unit balance entering 2013 compared to the backlog unit balance entering 2012, offset partially by a lower backlog turnover rate year over year. Settlements were also favorably impacted by a 14% increase in New Orders for the first six months of 2013 compared to the same period in 2012. Average settlement prices were higher due to a 6% higher average price of homes in backlog entering 2013 compared to the same period in 2012 and a 10% higher average sales price for New Orders during the first six months of 2013 compared to the same period in 2012. Gross profit margins in 2013 were negatively impacted by a previously disclosed service related accrual of approximately $15,600, or 64 basis points of revenue. Excluding this charge, gross profit margin increased 119 basis points to 19.6% in 2013 due to increased settlement volume, which allowed us to better leverage certain operating costs.
Segment New Orders and the average sales price increased 5% and 9%, respectively, in 2013 from 2012. New Orders increased due to an 11% increase in the number of active communities, partially offset by a lower absorption rate. The increase in the average sales price was attributable to a shift to higher priced communities in certain markets and favorable market conditions through the first half of 2013, which allowed us to increase prices in several markets within the Mid Atlantic segment.
21
North East
2014 versus 2013
The North East segment had an approximate $19,100, or 134%, increase in segment profit in 2014 compared to 2013. As discussed below, segment profit in 2013 was negatively impacted by a charge of approximately $12,700 related to a service related accrual. Excluding that charge in the prior year, segment profit increased approximately $6,400, or 24%, year over year. The increase in segment profit was driven by an increase of approximately $44,200, or 13%, in revenues year over year due to an 8% increase in the number of units settled, coupled with a 5% increase in the average settlement price. The increase in units settled was attributable to a 14% higher backlog unit balance entering 2014 compared to the backlog unit balance entering 2013. The increase in the average settlement price was driven by a 5% higher average price of homes in backlog entering 2014 compared to the same period in 2013 and a shift in settlements to higher priced markets. The North East segment’s gross profit margin increased to 18.7% in 2014 from 13.8% in 2013. Excluding the previously discussed service accrual which reduced gross profit margin in 2013 by 382 basis points, gross profit margin increased 109 basis points year over year. Gross profit margin was favorably impacted by a shift in settlements to higher priced markets with higher gross margins and by increased settlement volume, which allowed us to better leverage certain operating costs in 2014.
Segment New Orders and the average sales price of New Orders increased approximately 10% and 4%, respectively, in 2014 compared to 2013. The increase in New Orders was driven by an 11% increase in the average number of active communities. The increase in the average sales price of New Orders was attributable to a shift in sales to higher priced markets and to higher priced communities in certain markets.
2013 versus 2012
The North East segment had an approximate $7,200, or 34%, decrease in segment profit in 2013 compared to 2012. The decrease was attributable to a charge in the fourth quarter of 2013 to increase the warranty accrual for a previously disclosed non-recurring service issue. Excluding this charge to the segment of approximately $12,700, segment profit increased approximately $5,500, or 25%, compared to 2012. Revenues in the segment increased approximately $54,000, or 19%, year over year due to a 14% increase in the number of units settled, coupled with a 5% increase in the average settlement price. The increase in units settled was attributable to a 15% higher backlog unit balance entering 2013 as compared to the backlog unit balance entering 2012, in addition to a 15% increase in New Orders for the first six months of 2013 compared to the same period in 2012. The average settlement price increased year over year due to a 9% higher average price of homes in backlog entering 2013 compared to the same period in 2012, and a 1% higher average sales price for New Orders during the first six months of 2013 compared to 2012. The North East segment’s gross profit margin percentage was down 356 basis points year over year. Excluding the warranty accrual charge discussed above of approximately $12,700, or 382 basis points of revenue, gross profit margin for the segment was 17.6%, an increase of 27 basis points compared to 2012.
Segment New Orders and the average sales price increased approximately 14% and 3%, respectively, in 2013 from 2012. New Orders were favorably impacted by higher sales absorption levels attributable to favorable market conditions through the first half of 2013 and a decrease in the cancellation rate year over year.
Mid East
2014 versus 2013
The Mid East segment had an approximate $8,000, or 14%, decrease in segment profit in 2014 compared to 2013. The decrease in segment profit was driven by a decrease in revenues of approximately $15,700, or 2%, year over year due primarily to a 6% decrease in the number of units settled, offset partially by a 4% increase in the average settlement price. The decrease in settlements was primarily attributable to a 10% lower backlog unit balance entering 2014 compared to the backlog unit balance entering 2013. The average settlement price was favorably impacted by an 8% higher average price of homes in backlog entering 2014 compared to the same period in 2013 and a 3% higher average sales price for New Orders during the first six months of 2014 compared to the same period in 2013. The segment’s gross profit margin in 2014 of 15.8% was flat with 2013 as higher average settlement prices were offset by increases in certain material costs year over year. Segment New Orders and the average sales price of New Orders increased 2% and 4%, respectively, in 2014 compared to 2013.
2013 versus 2012
The Mid East segment had an approximate $15,700, or 39%, increase in segment profit in 2013 compared to 2012. The increase in segment profit was driven by an increase in revenues of approximately $277,800, or 44%, year over year due to a 22% increase in the number of units settled and an 18% increase in the average settlement price. The increase in settlements was primarily attributable to a 43% higher backlog unit balance entering 2013 compared to the same period in 2012, coupled with a 21% increase in New Orders during the first half of 2013 compared to the same period in 2012. The higher backlog balance entering 2013 was in part attributable to our Heartland Homes acquisition, which added approximately 200 units and $81,600 to backlog at December 31, 2013. Average
22
settlement prices were higher due to a 21% higher average price of homes in backlog entering 2013 compared to 2012 resulting from a shift in mix to higher priced communities as well as to the higher average price of homes in the backlog acquired from Heartland Homes. In addition, the average settlement price was favorably impacted by a 17% increase in the average New Order sales price during the first half of 2013 compared to the same period in 2012. Gross profit margin decreased to 15.7% in 2013 from 16.4% in 2012, due to the lower average gross profit margins associated with the Heartland Homes backlog acquired, and higher construction costs, including lumber and certain other commodity costs. These cost increases were partially offset by the favorable impact of increased settlement volume which allowed us to better leverage certain operating costs.
Segment New Orders and the average sales price for New Orders increased 11% and 17%, respectively, during 2013 compared to 2012. New Orders primarily increased due to 355 New Orders from Heartland Homes. The increase in the average New Order sales price was attributable to a shift in mix to higher priced communities in certain markets, including higher average sales prices associated with the Heartland Homes New Orders, coupled with favorable market conditions through the first half of 2013 which allowed us to increase prices in certain markets.
South East
2014 versus 2013
The South East segment had an approximate $2,500, or 7%, increase in segment profit in 2014 compared to 2013. Segment revenues increased approximately $34,400, or 8%, year over year due to a 2% increase in the number of units settled and a 6% increase in the average settlement price. The average settlement price in 2014 was favorably impacted by a 9% higher average price of homes in backlog entering 2014 compared to the same period in 2013. The South East segment’s gross profit margin increased to 18.3% in 2014 from 17.0% in 2013, due primarily to our average settlement prices increasing at a higher rate than lot and certain material costs year over year.
Segment New Orders and the average sales price for New Orders increased 6% and 5%, respectively, in 2014 compared to 2013. New Orders were favorably impacted by an 8% increase in the number of active communities in 2014 compared to 2013, offset partially by lower absorption levels attributable to lower traffic levels year over year. The increase in the average sales price for New Orders in 2014 was attributable to the introduction of our NVHomes product line in the Raleigh market in 2014, which sells at a higher price point, and to a shift in mix in New Orders to higher priced markets.
2013 versus 2012
The South East segment had an approximate $14,300, or 69%, increase in segment profit in 2013 compared to 2012, primarily due to an increase in revenues of approximately $120,000, or 36%, year over year. Segment revenues were higher due to a 23% increase in the number of units settled and a 10% increase in the average settlement price. The increase in settlements was attributable to a 37% higher backlog unit balance entering 2013 compared to 2012 and a 29% increase in New Orders for the first six months of 2013 compared to the same period in 2012. These increases were partially offset by a lower backlog turnover rate year over year. The average settlement price was favorably impacted by a 12% higher average price of homes in backlog entering 2013 compared to the same period in 2012, as well as by a 9% increase in the average sales price of homes in the first six months of 2013 compared to the same period in 2012. The South East segment’s gross profit margin increased 32 basis points in 2013 from 2012 primarily due to the favorable impact of increased settlement volume, which allowed us to better leverage certain operating costs.
Segment New Orders and the average sales price for New Orders each increased approximately 9% in 2013 from 2012. New Orders increased due to a 7% increase in the number of active communities and higher sales absorption levels driven by favorable market conditions through the first half of 2013. The increase in the average sales price for New Orders was attributable to a shift in mix of New Orders to higher priced communities in certain markets.
Homebuilding Segment Reconciliations to Consolidated Homebuilding Operations
In addition to the corporate capital allocation and contract land deposit impairments discussed above, the other reconciling items between homebuilding segment profit and homebuilding consolidated profit before tax include unallocated corporate overhead (which includes all management incentive compensation), equity-based compensation expense, consolidation adjustments and external corporate interest expense. Our overhead functions, such as accounting, treasury and human resources, are centrally performed and the costs are not allocated to our operating segments. Consolidation adjustments consist of such items to convert the reportable segments’ results, which are predominantly maintained on a cash basis, to a full accrual basis for external financial statement presentation purposes, and are not allocated to our operating segments. External corporate interest expense is primarily comprised of interest charges on our 3.95% Senior Notes due 2022 (the “Senior Notes”), and is not charged to the operating segments because the charges are included in the corporate capital allocation discussed above.
23
|
|
|
Year Ended December 31, |
|
|||||||||
|
|
|
2014 |
|
|
2013 |
|
|
2012 |
|
|||
|
Homebuilding Consolidated Gross Profit: |
|
|
|
|
|
|
|
|
|
|
|
|
|
Mid Atlantic |
|
$ |
499,172 |
|
|
$ |
461,481 |
|
|
$ |
345,009 |
|
|
North East |
|
|
70,462 |
|
|
|
45,860 |
|
|
|
48,329 |
|
|
Mid East |
|
|
141,146 |
|
|
|
142,331 |
|
|
|
103,128 |
|
|
South East |
|
|
89,544 |
|
|
|
77,277 |
|
|
|
55,788 |
|
|
Consolidation adjustments and other |
|
|
6,149 |
|
|
|
(16,672 |
) |
|
|
(6,649 |
) |
|
Consolidated homebuilding gross profit |
|
$ |
806,473 |
|
|
$ |
710,277 |
|
|
$ |
545,605 |
|
|
|
|
Year Ended December 31, |
|
|||||||||
|
|
|
2014 |
|
|
2013 |
|
|
2012 |
|
|||
|
Homebuilding Consolidated Profit Before Tax: |
|
|
|
|
|
|
|
|
|
|
|
|
|
Mid Atlantic |
|
$ |
271,965 |
|
|
$ |
276,399 |
|
|
$ |
189,089 |
|
|
North East |
|
|
33,390 |
|
|
|
14,294 |
|
|
|
21,529 |
|
|
Mid East |
|
|
47,538 |
|
|
|
55,537 |
|
|
|
39,847 |
|
|
South East |
|
|
37,525 |
|
|
|
35,001 |
|
|
|
20,674 |
|
|
Reconciling items: |
|
|
|
|
|
|
|
|
|
|
|
|
|
Contract land deposit impairment reserve (1) |
|
|
3,612 |
|
|
|
5,313 |
|
|
|
5,333 |
|
|
Equity-based compensation expense (2) |
|
|
(58,501 |
) |
|
|
(31,547 |
) |
|
|
(60,859 |
) |
|
Corporate capital allocation (3) |
|
|
152,140 |
|
|
|
116,457 |
|
|
|
91,507 |
|
|
Unallocated corporate overhead |
|
|
(61,108 |
) |
|
|
(72,703 |
) |
|
|
(70,258 |
) |
|
Consolidation adjustments and other |
|
|
23,867 |
|
|
|
2,362 |
|
|
|
10,858 |
|
|
Corporate interest expense (4) |
|
|
(22,544 |
) |
|
|
(21,743 |
) |
|
|
(6,796 |
) |
|
Reconciling items sub-total |
|
|
37,466 |
|
|
|
(1,861 |
) |
|
|
(30,215 |
) |
|
Homebuilding consolidated profit before taxes |
|
$ |
427,884 |
|
|
$ |
379,370 |
|
|
$ |
240,924 |
|
|
(1) |
This item represents changes to the contract land deposit impairment reserve, which are not allocated to the reportable segments. |
|
(2) |
The increase in equity-based compensation in 2014 is primarily attributable to the issuance of Options under the 2014 Plan in May 2014 and RSUs issued in the second quarter of 2013. Equity-based compensation expense was lower in 2013 due to RSUs issued in 2010 under the 2010 Equity Incentive Plan becoming fully vested effective December 31, 2012 and an approximate $7,450 pre-tax compensation expense reversal attributable to an adjustment of our option forfeiture rates based on our actual forfeiture experience. These reductions were partially offset by equity-based compensation expense incurred in 2013 related to RSUs issued in the second quarter of 2013 under the 2010 Equity Incentive Plan. |
|
(3) |
This item represents the elimination of the corporate capital allocation charge included in the respective homebuilding reportable segments. The corporate capital allocation charge is based on the segment’s monthly average asset balance and is as follows for the years presented: |
|
|
|
Year Ended December 31, |
|
|||||||||
|
|
|
2014 |
|
|
2013 |
|
|
2012 |
|
|||
|
Mid Atlantic |
|
$ |
96,328 |
|
|
$ |
72,271 |
|
|
$ |
59,144 |
|
|
North East |
|
|
12,107 |
|
|
|
9,461 |
|
|
|
8,187 |
|
|
Mid East |
|
|
26,299 |
|
|
|
22,580 |
|
|
|
15,039 |
|
|
South East |
|
|
17,406 |
|
|
|
12,145 |
|
|
|
9,137 |
|
|
Total |
|
$ |
152,140 |
|
|
$ |
116,457 |
|
|
$ |
91,507 |
|
|
(4) |
Corporate interest expense is attributable primarily to interest on our Senior Notes which were issued in the third quarter of 2012. |
24
Mortgage Banking Segment
We conduct our mortgage banking activity through NVRM, a wholly owned subsidiary. NVRM focuses almost exclusively on serving the homebuilding segment’s customer base. The following table summarizes the results of our mortgage banking operations and certain statistical data for each of the last three years:
|
|
|
Year Ended December 31, |
|
|||||||||
|
|
|
2014 |
|
|
2013 |
|
|
2012 |
|
|||
|
Loan closing volume: |
|
|
|
|
|
|
|
|
|
|
|
|
|
Total principal |
|
$ |
2,833,612 |
|
|
$ |
2,538,072 |
|
|
$ |
2,206,092 |
|
|
|
|
|
|
|
|
|
|
|
|
|
|
|
|
Loan volume mix: |
|
|
|
|
|
|
|
|
|
|
|
|
|
Adjustable rate mortgages |
|
|
17 |
% |
|
|
6 |
% |
|
|
5 |
% |
|
Fixed-rate mortgages |
|
|
83 |
% |
|
|
94 |
% |
|
|
95 |
% |
|
|
|
|
|
|
|
|
|
|
|
|
|
|
|
Operating profit: |
|
|
|
|
|
|
|
|
|
|
|
|
|
Segment profit |
|
$ |
30,388 |
|
|
$ |
42,075 |
|
|
$ |
38,135 |
|
|
Equity-based compensation expense |
|
|
(4,726 |
) |
|
|
(2,749 |
) |
|
|
(3,982 |
) |
|
Mortgage banking income before tax |
|
$ |
25,662 |
|
|
$ |
39,326 |
|
|
$ |
34,153 |
|
|
|
|
|
|
|
|
|
|
|
|
|
|
|
|
Capture rate: |
|
|
84 |
% |
|
|
81 |
% |
|
|
87 |
% |
|
|
|
|
|
|
|
|
|
|
|
|
|
|
|
Mortgage banking fees: |
|
|
|
|
|
|
|
|
|
|
|
|
|
Net gain on sale of loans |
|
$ |
47,791 |
|
|
$ |
56,528 |
|
|
$ |
47,019 |
|
|
Title services |
|
|
21,292 |
|
|
|
19,862 |
|
|
|
15,977 |
|
|
Servicing fees |
|
|
426 |
|
|
|
396 |
|
|
|
410 |
|
|
|
|
$ |
69,509 |
|
|
$ |
76,786 |
|
|
$ |
63,406 |
|
2014 versus 2013
Loan closing volume for the year ended December 31, 2014 increased 12% from 2013. The increase was primarily attributable to a 6% increase in the number of units closed and a 5% increase in the average loan amount year over year. The increase in the number of units closed is attributable to an increase in the number of loans closed by NVRM for our homebuyers who obtain a mortgage to purchase a home (“Capture Rate”). The Capture Rate increased from 81% in 2013 to 84% in 2014. The increase in the average loan amount is primarily attributable to the aforementioned increase in the homebuilding segment’s average settlement prices in 2014 as compared to 2013.
Segment profit for the year ended December 31, 2014 decreased approximately $11,700 from 2013. The decrease in segment profit was primarily attributable to an approximate $7,300 decrease in mortgage banking fees and an approximate $4,400 increase in general and administrative expenses. The decrease in mortgage banking fees was primarily attributable to a decrease in secondary marketing fees due to a product mix shift out of fixed rate government product due to increased consumer costs on FHA mortgage loans, and an increase in adjustable rate loans which generally are less profitable than fixed rate products. The relative product mix shift from fixed rate to adjustable rate products is attributable to interest rate volatility in 2014. The increase in general and administrative expenses was primarily attributable to an increase in compensation costs as a result of a 12% increase in average headcount in 2014 compared to 2013.
2013 versus 2012
Loan closing volume for the year ended December 31, 2013 increased 15% from 2012. The increase was primarily attributable to a 7% increase in the number of units closed and an 8% increase in the average loan amount year over year. The increase in the number of units closed and the increase in the average loan amount were primarily attributable to increases in the homebuilding segment’s number of units settled and average settlement prices in 2013 as compared to 2012, partially offset by a decrease in NVRM’s Capture Rate. The Capture Rate decreased from 87% in 2012 to 81% in 2013 primarily due to a more competitive market for mortgage loans as other lenders’ refinancing activity slowed.
25
Segment profit for the year ended December 31, 2013 increased approximately $3,900 from 2012. The increase in segment profit was primarily attributable to an approximate $13,400 increase in mortgage banking fees, partially offset by an approximate $10,000 increase in general and administrative expenses. The increase in mortgage banking fees was primarily attributable to a 15% increase in closed loan volume and an increase in secondary marketing fees. The increase in general and administrative expenses was primarily attributable to an increase in compensation costs as a result of a 43% increase in headcount compared to 2012.
Mortgage Banking – Other
We sell all of the loans we originate into the secondary mortgage market. Insofar as we underwrite our originated loans to the standards and specifications of the ultimate investor, we have no further financial obligations from the issuance of loans, except in certain limited instances where early payment default occurs. Those underwriting standards are typically equal to or more stringent than the underwriting standards required by FNMA, VA and FHA. Because we sell all of our loans and do not service them, there is often a substantial delay between the time that a loan goes into default and the time that the investor requests us to reimburse them for losses incurred because of the default. We believe that all of the loans that we originate are underwritten to the standards and specifications of the ultimate investor to whom we sell our originated loans. We employ a quality control department to ensure that our underwriting controls are effective, and further assess the underwriting function as part of our assessment of internal controls over financial reporting.
NVRM maintains an allowance for losses on mortgage loans originated that reflects our judgment of the present loss exposure from the loans that we have originated and sold. The allowance is calculated based on an analysis of historical experience and exposure. At December 31, 2014, we had an allowance for loan losses of approximately $10,000. Although we consider the allowance for loan losses reflected on the December 31, 2014 balance sheet to be adequate, there can be no assurance that this allowance will prove to be adequate to cover losses on loans previously originated.
NVRM is dependent on our homebuilding segment’s customers for business. If New Orders and sales prices of the homebuilding segment decline, NVRM’s operations will also be adversely affected. In addition, the mortgage segment’s operating results may be adversely affected in future periods due to the continued tightening and volatility of the credit markets, changes in investor funding times, as well as increased regulation of mortgage lending practices. The Dodd-Frank Wall Street Reform and Consumer Protection Act, enacted on July 21, 2010, contains numerous provisions affecting residential mortgages and mortgage lending practices. The CFPB implemented rules in January 2014, including “Ability to Repay” underwriting provisions, definition and parameters of “Qualified Mortgages” and the establishment of certain protections from liability under “Ability to Repay” provisions for “Qualified Mortgages”. The CFPB’s rulemaking also included limitations on certain fees and loan officer compensation requirements. Additional rules regarding loan estimates and the integrated mortgage disclosures consumers receive in connection with applying for and closing on a mortgage loan are scheduled to be implemented in August 2015. Although we do not expect these new requirements to significantly impact our mortgage business, increased regulation may impact the cost and availability of the mortgage services available to our homebuyers.
Seasonality
Overall, we do not experience material seasonal fluctuations in sales, settlements or loan closings.
Effective Tax Rate
Our consolidated effective tax rate in 2014, 2013 and 2012 was 37.90%, 36.36% and 34.35%, respectively. During 2014, we recognized income tax expense of approximately $7,000 due to the reversal of certain previously recognized tax deductions. During 2012, we reduced our provision for unrecognized tax benefits by $9,154, which reduced the 2012 effective tax rate. The reduction resulted from settlements with, and an audit by, certain taxing authorities during 2012 which led us to update our evaluation of the administrative practice in other states for similar uncertain tax positions to determine whether the positions taken in those states were effectively settled.
Recent Accounting Pronouncements Pending Adoption
In May 2014, the Financial Accounting Standards Board (“FASB”) issued Accounting Standards Update (“ASU”) 2014-09, Revenue from Contracts with Customers, which requires an entity to recognize the amount of revenue to which it expects to be entitled for the transfer of promised goods or services to customers. The standard will replace most existing revenue recognition guidance in U.S generally accepted accounting principles (“GAAP”) when it becomes effective. The standard is effective for the Company on January 1, 2017. Early adoption is not permitted. The standard permits the use of either the retrospective or cumulative effect transition method. We have not yet selected a transition method and are currently evaluating the effect that the standard will have on our consolidated financial statements and related disclosures.
26
In August 2014, FASB issued ASU 2014-15, Presentation of Financial Statements – Going Concern (Subtopic 205-40): Disclosure of Uncertainties about an Entity’s Ability to Continue as a Going Concern. The standard requires an entity’s management to evaluate at each annual and interim reporting period whether there are conditions or events that raise substantial doubt about the entity’s ability to continue as a going concern within one year after the date the financial statements are issued and to provide related footnote disclosures. The standard is effective for the first annual period ending after December 15, 2016, and interim periods thereafter. We do not believe that the adoption of this standard will have a material effect on our consolidated financial statements and related disclosures.
Liquidity and Capital Resources
Lines of Credit and Notes Payable
Our homebuilding business segment funds its operations from cash flows provided by operating activities and the public debt and equity markets. On September 5, 2012, we filed a Shelf Registration Statement (the “Shelf”) with the SEC to register for future offer and sale an unlimited amount of debt securities, common shares, preferred shares, depositary shares representing preferred shares and warrants. On September 10, 2012, we issued $600,000 aggregate principal amount of 3.95% Senior Notes due 2022 under the Shelf. The Senior Notes were issued at a discount to yield 3.97% and have been reflected net of the unamortized discount in the accompanying consolidated balance sheet. The offering of the Senior Notes resulted in aggregate net proceeds of approximately $593,900, after deducting offering expenses. The Senior Notes mature on September 15, 2022 and bear interest at 3.95%, payable semi-annually in arrears on March 15 and September 15. The Senior Notes are senior unsecured obligations and rank equally in right of payment with any of our existing and future unsecured senior indebtedness, will rank senior in right of payment to any of our future indebtedness that is by its terms expressly subordinated to the Senior Notes and will be effectively subordinated to any of our existing and future secured indebtedness to the extent of the value of the collateral securing such indebtedness. The indenture governing the Senior Notes does not contain any financial covenants; however, it does contain, among other items, and subject to certain exceptions, covenants that restrict our ability to create, incur, assume or guarantee secured debt, enter into sale and leaseback transactions and conditions related to mergers and/or the sale of assets. The proceeds from the Senior Notes issuance were used for general corporate purposes, which includes repurchases of our common shares.
Our mortgage subsidiary, NVRM, provides for its mortgage origination and other operating activities using cash generated from operations, borrowings from its parent company, NVR, as well as a revolving mortgage repurchase facility, which is non-recourse to NVR. On July 30, 2014, NVRM renewed and amended its repurchase agreement with U.S. Bank National Association which provides for loan purchases up to $25,000, subject to certain sub-limits (the “Repurchase Agreement”). The purpose of the Repurchase Agreement is to finance the origination of mortgage loans by NVRM. The Repurchase Agreement expires on July 29, 2015. Advances under the Repurchase Agreement carry a Pricing Rate based on the LIBOR Rate plus the LIBOR Margin, as determined under the Repurchase Agreement, provided that the Pricing Rate shall not be less than 2.825%. There are several restrictions on purchased loans, including that they cannot be sold to others, they cannot be pledged to anyone other than the agent, and they cannot support any other borrowing or repurchase agreement. The Repurchase Agreement contains various affirmative and negative covenants. The negative covenants include among others, certain limitations on transactions involving acquisitions, mergers, the incurrence of debt, sale of assets and creation of liens upon any of its Mortgage Notes. Additional covenants include (i) a tangible net worth requirement, (ii) a minimum liquidity requirement, (iii) a minimum net income requirement, and (iv) a maximum leverage ratio requirement. We were in compliance with all covenants under the Repurchase Agreement at December 31, 2014. At December 31, 2014, there was no debt outstanding under the Repurchase Agreement and there were no borrowing base limitations.
Equity Repurchases
In addition to funding growth in our homebuilding and mortgage banking operations, we historically have used a substantial portion of our excess liquidity to repurchase outstanding shares of our common stock in open market and privately negotiated transactions. This ongoing repurchase activity is conducted pursuant to publicly announced Board authorizations, and is typically executed in accordance with the safe-harbor provisions of Rule 10b-18 promulgated under the Securities Exchange Act of 1934, as amended. In addition, the Board resolutions authorizing us to repurchase shares of our common stock specifically prohibit us from purchasing shares from our officers, directors, Profit Sharing/401K Plan Trust or Employee Stock Ownership Plan Trust. The repurchase program assists us in accomplishing our primary objective, creating increases in shareholder value. See Item 5 of this Form 10-K for disclosure of amounts repurchased during the fourth quarter of 2014. For the year ended December 31, 2014, we repurchased 507,648 shares of our common stock at an aggregate purchase price of $567,544. As of December 31, 2014, we had approximately $170,600 available under a Board approved repurchase authorization.
27
Cash Flows
For the year ended December 31, 2014, cash and cash equivalents decreased by $320,834. Net cash provided by operating activities was $184,549. Cash was provided by homebuilding operations and net proceeds of $55,830 from mortgage loan activity. Cash was used to fund the increase in homebuilding inventory of $127,729, as a result of an increase in the number of units under construction at December 31, 2014 compared to December 31, 2013. Cash was also used to fund the $57,566 increase in contract land deposits year over year. Investing activities in 2014 used net cash of $19,082 due primarily to the addition of $31,672 in property, plant and equipment, offset partially by the receipt of $11,569 of capital distributions from unconsolidated joint ventures. Net cash used in financing activities was $486,301, due primarily to our repurchase of 507,648 shares of our common stock for an aggregate purchase price of $567,544 under our ongoing common stock repurchase program discussed above. This use of cash in financing activities was partially offset by $76,153 in proceeds from stock option exercises.
For the year ended December 31, 2013, cash and cash equivalents decreased by $287,254. Net cash provided by operating activities was $270,222. Cash was provided by homebuilding operations and by an increase of $114,456 in accounts payable, accrued expenses and customer deposits in 2013 compared to 2012. Accounts payables were higher due primarily to an increase in our inventory levels, while accrued expenses were higher due to increased warranty reserves and income taxes payable attributable to our increased earnings. Cash was used to fund the increase to homebuilding inventory of $52,861, due to increased units under construction at the end of 2013 compared to 2012. In addition, cash was used to fund the $40,034 increase in contract land deposits year over year. Investing activities during 2013 used net cash of $34,477, primarily as a result of investments in unconsolidated joint ventures totaling $22,850. Cash was also used for the purchase of property, plant and equipment totaling $19,016 during 2013. These uses of cash from investing activities were partially offset by capital distributions of $6,782 received from our unconsolidated joint ventures. Net cash used in financing activities was $522,999, due primarily to our purchase of treasury stock. During 2013, we repurchased 581,387 shares of our common stock for an aggregate purchase price of $554,491. This use of cash in financing activities was partially offset by $13,957 in proceeds from stock option exercises and the realization of $20,636 in excess income tax benefits from equity-based compensation plan activity and deferred compensation plan distributions.
For the year ended December 31, 2012, cash and cash equivalents increased by $672,713. Net cash provided by operating activities was $264,384. Cash was provided by homebuilding operations and by an approximate $63,400 decrease in mortgage loans held for sale. In addition, cash was provided by an increase of $110,396 in accounts payable, accrued expenses and customer deposits in 2012 compared to 2011. Payables were higher due primarily to an increase in our inventory levels. The increase in accrued expenses and customer deposits were attributable to increased management incentive accruals associated with improved financial results and an increase in customer deposits associated with increased sales volume. Cash provided by homebuilding operations was used to fund the increase to homebuilding inventory of $97,750, as a result of an increase in the units under construction at the end of 2012 compared to 2011. In addition, cash was used to fund the $53,942 increase in contract land deposits year over year. Investing activities during 2012 used net cash of $22,611, primarily as a result of the acquisition of Heartland Homes on December 31, 2012. In addition, cash was used for the purchase of property, plant and equipment totaling $12,365 during 2012. These uses of cash in investing activities were partially offset by capital distributions received from our unconsolidated joint ventures. Net cash provided by financing activities was $430,940, due primarily to the receipt of $593,866 in net proceeds from the issuance of the Senior Notes and $73,211 in proceeds from stock option exercises. During 2012, we spent $227,281 to repurchase 285,495 shares of our common stock. In addition, cash was used in the repayment of $21,910 of loans assumed in the acquisition of Heartland Homes.
At December 31, 2014 and 2013, the homebuilding segment had restricted cash of $24,106 and $20,563, respectively, which is included in “Other assets” on the accompanying consolidated balance sheets. The restricted cash balances relate primarily to holding requirements for outstanding letters of credit issued under our letter of credit agreement and customer deposits for certain home sales.
We believe that our current cash holdings, cash generated from operations and the public debt and equity markets will be sufficient to satisfy near and long term cash requirements for working capital and debt service in both our homebuilding and mortgage banking operations.
Off-Balance Sheet Arrangements
Lot Acquisition Strategy
We generally do not engage in land development. Instead, we typically acquire finished building lots at market prices from various land developers under fixed price purchase agreements that require deposits that may be forfeited if we fail to perform under the agreement. The deposits required under the purchase agreements are in the form of cash or letters of credit in varying amounts and represent a percentage, typically ranging up to 10%, of the aggregate purchase price of the finished lots.
We believe that our lot acquisition strategy reduces the financial requirements and risks associated with direct land ownership and land development. We may, at our option, choose for any reason and at any time not to perform under these purchase agreements by delivering notice of our intent not to acquire the finished lots under contract. Our sole legal obligation and economic loss for failure
28
to perform under these purchase agreements is limited to the amount of the deposit pursuant to the liquidated damage provision contained in the purchase agreements. We do not have any financial guarantees or completion obligations and we typically do not guarantee lot purchases on a specific performance basis under these purchase agreements.
At December 31, 2014, we controlled approximately 68,700 lots through lot purchase agreements, joint ventures and land under development, with an aggregate purchase price of approximately $6,300,000. These lots are controlled by making or committing to make deposits of approximately $425,300 in the form of cash and letters of credit. Our entire risk of loss pertaining to the aggregate purchase price contractual commitment resulting from our non-performance under the contracts is limited to our $350,100 in deposits paid, plus $75,200 related to deposits to be paid subsequent to December 31, 2014 assuming that contractual development milestones are met by the developers (see Contractual Obligations section below). Of the $350,100 deposit total, approximately $348,400 was in cash and approximately $1,700 was in letters of credit which had been issued as of December 31, 2014. As of December 31, 2014, we had recorded an impairment valuation allowance of approximately $56,100 related to certain cash deposits currently outstanding. Additionally, as of December 31, 2014, we had funding commitments totaling $11,850 to two of our joint ventures. In addition, we have certain properties under contract with land owners that are expected to yield approximately 5,700 lots, which are not included in our number of total lots controlled above. Some of these properties may require rezoning or other approvals to achieve the expected yield. These properties are controlled with cash deposits and letters of credit totaling approximately $2,300 and $3,000, respectively as of December 31, 2014, of which approximately $2,600 is refundable if we do not perform under the contract and the remainder is at risk of loss. We generally expect to assign the raw land contracts to a land developer and simultaneously enter into a lot purchase agreement with the assignee if the project is determined to be feasible. Please refer to Note 1 in the accompanying consolidated financial statements for a further discussion of the contract land deposits and Note 3 in the accompanying consolidated financial statements for a description of our lot acquisition strategy in relation to our accounting related to variable interest entities.
Bonds and Letters of Credit
We enter into bond or letter of credit arrangements with local municipalities, government agencies, or land developers to collateralize our obligations under various contracts. We had approximately $59,400 of contingent obligations under such agreements as of December 31, 2014, inclusive of the $4,700 of lot acquisition deposits in the form of letters of credit discussed above. We believe we will fulfill our obligations under the related contracts and do not anticipate any material losses under these bonds or letters of credit.
Mortgage Commitments and Forward Sales
In the normal course of business, our mortgage banking segment enters into contractual commitments to extend credit to buyers of single-family homes with fixed expiration dates. The commitments become effective when the borrowers “lock-in” a specified interest rate within time frames established by us. All mortgagors are evaluated for credit worthiness prior to the extension of the commitment. Market risk arises if interest rates move adversely between the time of the “lock-in” of rates by the borrower and the sale date of the loan to a broker/dealer. To mitigate the effect of the interest rate risk inherent in providing rate lock commitments to borrowers, we enter into optional or mandatory delivery forward sale contracts to sell whole loans and mortgage-backed securities to broker/dealers. The forward sale contracts lock in an interest rate and price for the sale of loans similar to the specific rate lock commitments. We do not engage in speculative or trading derivative activities. Both the rate lock commitments to borrowers and the forward sale contracts to broker/dealers are undesignated derivatives, and, accordingly, are marked to fair value through earnings. At December 31, 2014, we had contractual commitments to extend credit to borrowers aggregating $237,989 and open forward delivery contracts aggregating $424,966, which hedge both the rate lock loan commitments and closed loans held for sale (see Note 14 in the accompanying consolidated financial statements for a description of our fair value accounting).
Contractual Obligations
Our fixed, non-cancelable obligations as of December 31, 2014, were as follows:
|
|
|
Payments due by period |
|
|||||||||||||||||
|
|
|
Total |
|
|
Less than 1 year |
|
|
1-3 years |
|
|
3-5 years |
|
|
More than 5 years |
|
|||||
|
Debt (1) |
|
$ |
600,000 |
|
|
$ |
— |
|
|
$ |
— |
|
|
$ |
— |
|
|
$ |
600,000 |
|
|
Interest on debt (1) |
|
|
189,534 |
|
|
|
23,700 |
|
|
|
47,400 |
|
|
|
47,400 |
|
|
|
71,034 |
|
|
Operating leases (2) |
|
|
107,289 |
|
|
|
24,012 |
|
|
|
32,376 |
|
|
|
22,809 |
|
|
|
28,092 |
|
|
Purchase obligations (3) |
|
|
76,679 |
|
|
* |
|
|
* |
|
|
* |
|
|
* |
|
||||
|
Executive Officer employment contracts (4) |
|
|
2,625 |
|
|
|
2,625 |
|
|
|
— |
|
|
|
— |
|
|
|
— |
|
|
Uncertain tax positions (5) |
|
|
29,902 |
|
|
* |
|
|
* |
|
|
* |
|
|
* |
|
||||
|
Total |
|
$ |
1,006,029 |
|
|
$ |
50,337 |
|
|
$ |
79,776 |
|
|
$ |
70,209 |
|
|
$ |
699,126 |
|
29
|
(1) |
See Note 9 in the accompanying consolidated financial statements for additional information regarding the Senior Notes. |
|
(2) |
See Note 13 in the accompanying consolidated financial statements for additional information regarding operating leases. |
|
(3) |
Amount represents required payments of forfeitable deposits with land developers under existing fixed price purchase agreements, assuming that contractual development milestones are met by the developers, and specific performance guarantees. We expect to make all payments of these deposits within the next three years, but due to the nature of the contractual development milestones that must be met, we are unable to accurately estimate the portion of the deposit obligation that will be made within one year and that portion that will be made within one to three years. |
|
(4) |
We have entered into employment agreements with our four executive officers. Each of the agreements expires on January 1, 2016 and provides for payment of a minimum base salary, which may be increased at the discretion of the Compensation Committee of our Board of Directors (the “Compensation Committee”), and annual incentive compensation of up to 100% of base salary upon achievement of annual performance objectives established by the Compensation Committee. The agreements also provide for payment of severance benefits upon termination of employment, in amounts ranging from $0 to two times the executive officer’s then annual base salary, depending on the reason for termination, plus up to $100 in outplacement assistance. Accordingly, total payments under these agreements will vary based on length of service, any future increases to base salaries, annual incentive payments earned, and the reason for termination. The agreements have been reflected in the above table assuming the continued employment of the executive officers for the full term of the respective agreements, and at the executive officers’ current base salaries. The above balances do not include any potential annual incentive compensation. The actual amounts paid could differ from that presented. |
|
(5) |
Due to the nature of the uncertain tax positions, we are unable to make a reasonable estimate as to the period of settlement with the respective taxing authorities. |
Critical Accounting Policies
General
The preparation of financial statements in conformity with GAAP requires us to make estimates and assumptions that affect the reported amounts of assets and liabilities, the disclosure of contingent assets and liabilities at the date of the financial statements, and the reported amounts of revenues and expenses during the reporting periods. We continually evaluate the estimates we use to prepare the consolidated financial statements and update those estimates as necessary. In general, our estimates are based on historical experience, on information from third party professionals, and other various assumptions that are believed to be reasonable under the facts and circumstances. Actual results could differ materially from those estimates made by management.
Homebuilding Inventory
The carrying value of inventory is stated at the lower of cost or market value. Cost of lots and completed and uncompleted housing units represent the accumulated actual cost of the units. Field construction supervisors’ salaries and related direct overhead expenses are included in inventory costs. Interest costs are not capitalized into inventory, with the exception of land under development. Upon settlement, the cost of the unit is expensed on a specific identification basis. Cost of building materials is determined on a first-in, first-out basis.
Sold inventory is evaluated for impairment based on the contractual selling price compared to the total estimated cost to construct. Unsold inventory is evaluated for impairment by analyzing recent comparable sale prices within the applicable community compared to the costs incurred to date plus the expected costs to complete. Any calculated impairments are recorded immediately.
Land Under Development and Contract Land Deposits
Land Under Development
On a very limited basis, we directly acquire raw parcels of land already zoned for its intended use to develop into finished lots. Land under development includes the land acquisition costs, direct improvement costs, capitalized interest, where applicable, and real estate taxes.
Land under development, including the land under development held by our unconsolidated joint ventures and the related joint venture investments, is reviewed for potential write-downs when impairment indicators are present. In addition to considering market and economic conditions, we assess land under development impairments on a community-by-community basis, analyzing, as applicable, current sales absorption levels, recent sales’ gross profit, and the dollar differential between the projected fully-developed cost of the lots and the current market price for lots. If indicators of impairment are present for a community, we perform an analysis to determine if the undiscounted cash flows estimated to be generated by those assets are less than their carrying amounts, and if they are, impairment charges are required to be recorded in an amount by which the carrying amount of the assets exceeds the fair value of
30
the assets. Our determination of fair value is primarily based on discounting the estimated future cash flows at a rate commensurate with the inherent risks associated with the assets and related estimated cash flow streams.
At December 31, 2014, we had approximately $33,700 in land under development in four separate communities. In addition, at December 31, 2014, we had an aggregate investment totaling approximately $82,000 in five separate joint ventures that controlled land under development. None of the communities classified as land under development nor any of the undeveloped land held by the joint ventures had any indicators of impairment at December 31, 2014. As such, we do not believe that any of the land under development is impaired at this time. However, there can be no assurance that we will not incur impairment charges in the future due to unanticipated adverse changes in the economy or other events adversely affecting specific markets or the homebuilding industry.
Contract Land Deposits
We purchase finished lots under fixed price purchase agreements that require deposits that may be forfeited if we fail to perform under the contract. The deposits are in the form of cash or letters of credit in varying amounts and represent a percentage of the aggregate purchase price of the finished lots.
We maintain an allowance for losses on contract land deposits that reflects our judgment of the present loss exposure in the existing contract land deposit portfolio at the end of the reporting period. To analyze contract land deposit impairments, we utilize a loss contingency analysis that is conducted each quarter. In addition to considering market and economic conditions, we assess contract land deposit impairments on a community-by-community basis pursuant to the purchase contract terms, analyzing, as applicable, current sales absorption levels, recent sales’ gross profit, the dollar differential between the contractual purchase price and the current market price for lots, a developer’s financial stability, a developer’s financial ability or willingness to reduce lot prices to current market prices, and the contract’s default status by either us or the developer along with an analysis of the expected outcome of any such default.
Our analysis is focused on whether we can sell houses profitably in a particular community in the current market with which we are faced. Because we do not own the finished lots on which we had placed a contract land deposit, if the above analysis leads to a determination that we cannot sell homes profitably at the current contractual lot price, we then determine whether we will elect to default under the contract, forfeit our deposit and terminate the contract, or whether we will attempt to restructure the lot purchase contract, which may require us to forfeit the deposit to obtain contract concessions from a developer. We also assess whether an impairment is present due to collectability issues resulting from a developer’s non-performance because of financial or other conditions.
Although we consider the allowance for losses on contract land deposits reflected on the December 31, 2014 consolidated balance sheet to be adequate (see Note 1 to the accompanying consolidated financial statements included herein), there can be no assurance that this allowance will prove to be adequate over time to cover losses due to unanticipated adverse changes in the economy or other events adversely affecting specific markets or the homebuilding industry.
Warranty/Product Liability Accruals
Warranty and product liability accruals are established to provide for estimated future costs as a result of construction and product defects, product recalls and litigation incidental to our business. Liability estimates are determined based on our judgment considering such factors as historical experience, the likely current cost of corrective action, manufacturers’ and subcontractors’ participation in sharing the cost of corrective action, consultations with third party experts such as engineers, and evaluations by our General Counsel and outside counsel retained to handle specific product liability cases. Although we consider the warranty and product liability accrual reflected on the December 31, 2014 consolidated balance sheet to be adequate (see Note 13 to the accompanying consolidated financial statements included herein), there can be no assurance that this accrual will prove to be adequate over time to cover losses due to increased costs for material and labor, the inability or refusal of manufacturers or subcontractors to financially participate in corrective action, unanticipated adverse legal settlements, or other unanticipated changes to the assumptions used to estimate the warranty and product liability accrual.
Equity-Based Compensation Expense
Compensation costs related to our equity-based compensation plans are recognized within our income statement. The costs recognized are based on the grant-date fair value. Compensation cost for share-based grants is recognized on a straight-line basis over the requisite service period for the entire award (from the date of grant through the period of the last separately vesting portion of the grant). For the recognition of equity-based compensation expense, the Options which are subject to a performance condition are treated as a separate award from the “service-only” Options, and compensation expense is recognized when it becomes probable that the stated performance target will be achieved.
31
We calculate the fair value of our non-publicly traded, employee stock options using the Black-Scholes option-pricing model. While the Black-Scholes model is a widely accepted method to calculate the fair value of options, its results are dependent on input variables, two of which, expected term and expected volatility, are significantly dependent on management’s judgment. We have concluded that our historical exercise experience is the best estimate of future exercise patterns to determine an option’s expected term. To estimate expected volatility, we analyze the historical volatility of our common stock over a period equal to the option’s expected term. Changes in management’s judgment of the expected term and the expected volatility could have a material effect on the grant-date fair value calculated and expensed within the income statement. In addition, we are required to estimate future grant forfeitures when considering the amount of stock-based compensation costs to record. We have concluded that our historical forfeiture rate is the best measure to base our estimate of future forfeitures of equity-based compensation grants. However, there can be no assurance that our future forfeiture rate will not be materially higher or lower than our historical forfeiture rate, which would affect the aggregate cumulative compensation expense recognized.
In addition, when recognizing stock based compensation cost related to “performance condition” option grants, we are required to make a determination as to whether the performance conditions will be met prior to the completion of the actual performance period. The performance metric is based on our return on capital performance during 2014 through 2016. While we currently believe that this performance condition will be satisfied at the target level and are recognizing compensation expense related to such Options accordingly, our future expected activity levels could cause us to make a different determination, resulting in a change to the compensation expense to be recognized related to performance condition option grants that would otherwise have been recognized to date. Although we believe that the compensation costs recognized in 2014 are representative of the cumulative ratable amortization of the grant-date fair value of unvested options outstanding and expected to be exercised, changes to the estimated input values such as expected term and expected volatility and changes to the determination of whether performance condition grants will vest, could produce widely different fair values.
Mortgage Loan Loss Allowance
We originate several different loan products to our customers to finance the purchase of their home. We sell all of the loans we originate into the secondary mortgage market generally within 30 days from origination. All of the loans that we originate are underwritten to the standards and specifications of the ultimate investor. Insofar as we underwrite our originated loans to those standards, we bear no increased concentration of credit risk from the issuance of loans, except in certain limited instances where early payment default occurs. Those underwriting standards are typically equal to or more stringent than the underwriting standards required by FNMA, VA and FHA. We employ a quality control department to ensure that our underwriting controls are effectively operating, and further assess the underwriting function as part of our assessment of internal controls over financial reporting. We maintain an allowance for losses on mortgage loans originated that reflects our judgment of the present loss exposure in the loans that we have originated and sold. The allowance is calculated based on an analysis of historical experience and exposure. Although we consider the allowance for loan losses reflected on the December 31, 2014 consolidated balance sheet to be adequate (see Note 15 to the accompanying consolidated financial statements included herein), there can be no assurance that this allowance will prove to be adequate over time to cover losses due to unanticipated changes to the assumptions used to estimate the mortgage loan loss allowance.
Impact of Inflation, Changing Prices and Economic Conditions
See “Risk Factors” included in Item 1A herein for a description of the impact of inflation, changing prices and economic conditions on our business and our financial results. See also the discussion of the current business environment in the Overview section above.
Market risk is the risk of loss arising from adverse changes in market prices and interest rates. Our market risk arises from interest rate risk inherent in our financial instruments and debt obligations. Interest rate risk results from the possibility that changes in interest rates will cause unfavorable changes in net income or in the value of interest rate-sensitive assets, liabilities and commitments. Lower interest rates tend to increase demand for mortgage loans for home purchasers, while higher interest rates make it more difficult for potential borrowers to purchase residential properties and to qualify for mortgage loans. We have no market rate sensitive instruments held for speculative or trading purposes.
Our homebuilding segment is exposed to interest rate risk as it relates to its debt obligations. In September 2012, we issued $600,000 of Senior Notes. The Senior Notes mature on September 15, 2022 and bear interest at 3.95%, payable semi-annually in arrears on March 15 and September 15. Changes to interest rates generally affect the fair value of fixed-rate debt instruments, but not earnings or cash flows. We generally have no obligation to prepay the Senior Notes prior to maturity, and therefore, interest rate fluctuations should not have a significant impact on our fixed-rate debt.
32
Our mortgage banking segment is exposed to interest rate risk as it relates to its lending activities. The mortgage banking segment originates mortgage loans, which are sold through either optional or mandatory forward delivery contracts into the secondary markets. All of the mortgage banking segment’s loan portfolio is held for sale and subject to forward sale commitments. NVRM also sells all of its mortgages held for sale on a servicing released basis.
NVRM has available a mortgage Repurchase Agreement, which provides for loan repurchases up to $25,000, subject to certain sub limits. The Repurchase Agreement is used to fund NVRM’s mortgage origination activities. Advances under the Repurchase Agreement carry a Pricing Rate based on the LIBOR Rate plus the LIBOR Margin, as determined under the Repurchase Agreement, provided that the Pricing Rate shall not be less than 2.825%. At December 31, 2014, there was no debt outstanding under the Repurchase Agreement.
The following table represents the contractual balances of our on-balance sheet financial instruments at the expected maturity dates, as well as the fair values of those on-balance sheet financial instruments at December 31, 2014. The table does not include the debt of our consolidated joint venture as it is non-recourse to us. The expected maturity categories take into consideration the actual and anticipated amortization of principal and do not take into consideration the reinvestment of cash or the refinancing of existing indebtedness. Because we sell all of the mortgage loans we originate into the secondary markets, we have made the assumption that the portfolio of mortgage loans held for sale will mature in the first year. Consequently, advances outstanding under the Repurchase Agreement would also be assumed to mature in the first year.
|
|
|
Maturities (000's) |
|
|
|
|
|
|||||||||||||||||||||||||
|
|
|
|
|
|
|
|
|
|
|
|
|
|
|
|
|
|
|
|
|
|
|
|
|
|
|
|
|
|
|
Fair |
|
|
|
|
|
2015 |
|
|
2016 |
|
|
2017 |
|
|
2018 |
|
|
2019 |
|
|
Thereafter |
|
|
Total |
|
|
Value |
|
||||||||
|
Mortgage banking segment |
|
|
|
|
|
|
|
|
|
|
|
|
|
|
|
|
|
|
|
|
|
|
|
|
|
|
|
|
|
|
|
|
|
Interest rate sensitive assets: |
|
|
|
|
|
|
|
|
|
|
|
|
|
|
|
|
|
|
|
|
|
|
|
|
|
|
|
|
|
|
|
|
|
Mortgage loans held for sale |
|
$ |
203,305 |
|
|
|
— |
|
|
|
— |
|
|
|
— |
|
|
|
— |
|
|
|
— |
|
|
$ |
203,305 |
|
|
$ |
205,664 |
|
|
Average interest rate |
|
|
3.8 |
% |
|
|
— |
|
|
|
— |
|
|
|
— |
|
|
|
— |
|
|
|
— |
|
|
|
3.8 |
% |
|
|
|
|
|
|
|
|
|
|
|
|
|
|
|
|
|
|
|
|
|
|
|
|
|
|
|
|
|
|
|
|
|
|
|
|
|
|
|
Other: |
|
|
|
|
|
|
|
|
|
|
|
|
|
|
|
|
|
|
|
|
|
|
|
|
|
|
|
|
|
|
|
|
|
Forward trades of mortgage-backed securities (a) |
|
$ |
(909) |
|
|
|
— |
|
|
|
— |
|
|
|
— |
|
|
|
— |
|
|
|
— |
|
|
$ |
(909) |
|
|
$ |
(909) |
|
|
Forward loan commitments (a) |
|
$ |
2,374 |
|
|
|
— |
|
|
|
— |
|
|
|
— |
|
|
|
— |
|
|
|
— |
|
|
$ |
2,374 |
|
|
$ |
2,374 |
|
|
|
|
|
|
|
|
|
|
|
|
|
|
|
|
|
|
|
|
|
|
|
|
|
|
|
|
|
|
|
|
|
|
|
|
Homebuilding segment |
|
|
|
|
|
|
|
|
|
|
|
|
|
|
|
|
|
|
|
|
|
|
|
|
|
|
|
|
|
|
|
|
|
Interest rate sensitive assets: |
|
|
|
|
|
|
|
|
|
|
|
|
|
|
|
|
|
|
|
|
|
|
|
|
|
|
|
|
|
|
|
|
|
Interest-bearing deposits |
|
$ |
474,205 |
|
|
|
— |
|
|
|
— |
|
|
|
— |
|
|
|
— |
|
|
|
— |
|
|
$ |
474,205 |
|
|
$ |
474,205 |
|
|
Average interest rate |
|
|
0.3 |
% |
|
|
— |
|
|
|
— |
|
|
|
— |
|
|
|
— |
|
|
|
— |
|
|
|
0.3 |
% |
|
|
|
|
|
|
|
|
|
|
|
|
|
|
|
|
|
|
|
|
|
|
|
|
|
|
|
|
|
|
|
|
|
|
|
|
|
|
|
Interest rate sensitive liabilities: |
|
|
|
|
|
|
|
|
|
|
|
|
|
|
|
|
|
|
|
|
|
|
|
|
|
|
|
|
|
|
|
|
|
Fixed rate obligations (b) |
|
$ |
— |
|
|
|
— |
|
|
|
— |
|
|
|
— |
|
|
|
— |
|
|
$ |
600,00 |
0 |
|
$ |
600,000 |
|
|
$ |
622,800 |
|
|
Average interest rate |
|
|
— |
|
|
|
— |
|
|
|
— |
|
|
|
— |
|
|
|
— |
|
|
|
4.0 |
% |
|
|
4.0 |
% |
|
|
|
|
|
(a) |
Represents the fair value recorded pursuant to ASC 815, Derivatives and Hedging. |
|
(b) |
The Senior Notes mature in 2022. |
33
The financial statements listed in Item 15 are filed as part of this report and are incorporated herein by reference.
|
Item 9. |
Changes in and Disagreements with Accountants on Accounting and Financial Disclosure. |
None.
Evaluation of Disclosure Controls and Procedures
As of the end of the period covered by this report, an evaluation was performed under the supervision and with the participation of our management, including the principal executive officer and principal financial officer, of the effectiveness of the design and operation of our disclosure controls and procedures, as defined in Rules 13a-15(e) and 15d-15(e) under the Securities Exchange Act of 1934, as amended (“Exchange Act”).
Based on that evaluation, the principal executive officer and principal financial officer concluded that the design and operation of these disclosure controls and procedures as of December 31, 2014 were effective to provide reasonable assurance that information required to be disclosed in our reports under the Exchange Act, processed, summarized and reported within the time periods specified in the Securities and Exchange Commission’s rules and forms and that such information is accumulated and communicated to our management, including our principal executive officer and principal financial officer, as appropriate, to allow timely decisions regarding required disclosure.
Management’s Report on Internal Control Over Financial Reporting
Our management is responsible for establishing and maintaining adequate internal control over financial reporting, as such term is defined in Rule 13a-15(f) under the Exchange Act. Under the supervision and with the participation of our management, including our principal executive officer and principal financial officer, we conducted an evaluation of the effectiveness of our internal control over financial reporting based on the framework in Internal Control – Integrated Framework (2013) issued by the Committee of Sponsoring Organizations of the Treadway Commission. Based on our evaluation under the framework in Internal Control – Integrated Framework (2013), our management concluded that our internal control over financial reporting was effective as of December 31, 2014. There have been no changes in our internal controls over financial reporting identified in connection with the evaluation referred to above that have materially affected, or are reasonably likely to materially affect, our internal controls over financial reporting.
Our internal control over financial reporting as of December 31, 2014 has been audited by KPMG LLP, an independent registered public accounting firm, as stated in their attestation report which is included herein.
None
PART III
Item 10 is incorporated herein by reference to our Proxy Statement expected to be filed with the Securities and Exchange Commission on or prior to April 30, 2015. Reference is also made regarding our executive officers to “Executive Officers of the Registrant” following Item 4 of this Form 10-K.
Item 11 is incorporated herein by reference to our Proxy Statement expected to be filed with the Securities and Exchange Commission on or prior to April 30, 2015.
Item 12 is incorporated herein by reference to our Proxy Statement expected to be filed with the Securities and Exchange Commission on or prior to April 30, 2015.
34
Equity Compensation Plan Information
The table below sets forth information as of the end of our 2014 fiscal year for (i) all equity compensation plans approved by our shareholders and (ii) all equity compensation plans not approved by our shareholders:
|
Plan category |
|
Number of securities to be issued upon exercise of outstanding options, warrants and rights |
|
|
Weighted-average exercise price of outstanding options, warrants and rights |
|
|
Number of securities remaining available for future issuance under equity compensation plans (excluding securities reflected in the first column) |
|
|||
|
Equity compensation plans approved by security holders (1) |
|
|
1,086,851 |
|
|
$ |
945.26 |
|
|
|
362,123 |
|
|
Equity compensation plans not approved by security holders |
|
|
169,658 |
|
|
$ |
651.15 |
|
|
|
— |
|
|
Total |
|
|
1,256,509 |
|
|
$ |
905.54 |
|
|
|
362,123 |
|
|
(1) |
This category includes the RSUs authorized by the 2010 Equity Incentive Plan, which was approved by our shareholders at the May 4, 2010 Annual Meeting. At December 31, 2014, there are 55,494 RSUs outstanding, issued at a $0 exercise price. Of the total 362,123 shares remaining available for future issuance, up to 33,106 may be issued as RSUs. The weighted-average exercise price of outstanding options under security holder approved plans excluding outstanding RSUs was $996.12. |
Equity compensation plans approved by our shareholders include the NVR, Inc. 1998 Management Long-Term Stock Option Plan; the 1998 Directors’ Long-Term Stock Option Plan; the 2010 Equity Incentive Plan; and the 2014 Equity Incentive Plan. The only equity compensation plan that was not approved by our shareholders is the NVR, Inc. 2000 Broadly-Based Stock Option Plan. See Note 12 in the accompanying consolidated financial statements for a description of each of our equity compensation plans.
Item 13 is incorporated herein by reference to our Proxy Statement expected to be filed with the Securities and Exchange Commission on or prior to April 30, 2015.
Item 14 is incorporated herein by reference to our Proxy Statement expected to be filed with the Securities and Exchange Commission on or prior to April 30, 2015.
PART IV
The following documents are filed as part of this report:
|
1. |
Financial Statements |
NVR, Inc. - Consolidated Financial Statements
Reports of Independent Registered Public Accounting Firm
Consolidated Balance Sheets
Consolidated Statements of Income
Consolidated Statements of Shareholders’ Equity
Consolidated Statements of Cash Flows
Notes to Consolidated Financial Statements
|
2. |
Exhibits |
|
Exhibit |
|
Description |
|
3.1 |
|
Restated Articles of Incorporation of NVR, Inc. Filed as Exhibit 3.1 to NVR’s Annual Report on Form 10-K for the year ended December 31, 2010 and incorporated herein by reference. |
|
3.2 |
|
Bylaws, as amended, of NVR, Inc. Filed as Exhibit 3.2 to NVR’s Annual Report on Form 10-K for the year ended December 31, 2010 and incorporated herein by reference. |
35
|
Exhibit |
|
Description |
|
4.1 |
|
Indenture dated as of April 14, 1998 between NVR, Inc., as issuer and the Bank of New York as trustee. Filed as Exhibit 4.3 to NVR’s Current Report on Form 8-K filed on April 23, 1998 and incorporated herein by reference. |
|
4.2 |
|
Form of Note (included in Indenture filed as Exhibit 4.1). |
|
4.3 |
|
Fifth Supplemental Indenture dated September 10, 2012 among NVR, Inc. and U.S. Bank Trust National Association. Filed as Exhibit 4.1 to NVR’s Form 8-K filed on September 10, 2012 and incorporated herein by reference. |
|
4.4 |
|
Form of Global Note. Filed as Exhibit 4.2 to NVR’s Form 8-K filed on September 10, 2012 and incorporated herein by reference. |
|
10.1* |
|
Employment Agreement between NVR, Inc. and Paul C. Saville dated December 21, 2010. Filed as Exhibit 10.1 to NVR’s Form 8-K filed on December 21, 2010 and incorporated herein by reference. |
|
10.2* |
|
Employment Agreement between NVR, Inc. and Robert W. Henley dated December 21, 2010. Filed as Exhibit 10.4 to NVR’s Form 8-K filed on December 21, 2010 and incorporated herein by reference. |
|
10.3* |
|
Amendment No. 1 to the Employment Agreement between NVR, Inc. and Robert W. Henley dated December 21, 2010. Filed as Exhibit 10.1 to NVR’s Form 8-K filed on May 31, 2012 and incorporated herein by reference. |
|
10.4* |
|
Amendment No. 2 to the Employment Agreement between NVR, Inc. and Robert W. Henley dated December 21, 2010. Filed as Exhibit 10.5 to NVR’s Form 10-K filed on February 19, 2013 and incorporated herein by reference. |
|
10.5* |
|
Employment Agreement between NVR, Inc. and Eugene J. Bredow dated May 31, 2012. Filed as Exhibit 10.2 to NVR’s Form 8-K filed on May 31, 2012 and incorporated herein by reference. |
|
10.6* |
|
Amendment No. 1 to the Employment Agreement between NVR, Inc. and Eugene J. Bredow dated May 31, 2012. Filed as Exhibit 10.7 to NVR’s Form 10-K filed on February 19, 2013 and incorporated herein by reference. |
|
10.7* |
|
Employment Agreement between NVR, Inc. and Daniel D. Malzahn dated February 19, 2013. Filed as Exhibit 10.8 to NVR’s Form 10-K filed on February 19, 2013 and incorporated herein by reference. |
|
10.8* |
|
Profit Sharing Plan of NVR, Inc. and Affiliated Companies. Filed as Exhibit 4.1 to NVR’s Registration Statement on Form S-8 (No. 333-29241) filed on June 13, 1997 and incorporated herein by reference. |
|
10.9* |
|
Employee Stock Ownership Plan of NVR, Inc. Incorporated herein by reference to NVR’s Annual Report on Form 10-K/A for the year ended December 31, 1994. |
|
10.10* |
|
NVR, Inc. 1998 Management Long-Term Stock Option Plan. Filed as Exhibit 4 to NVR’s Registration Statement on Form S-8 (No. 333-79951) filed on June 4, 1999 and incorporated herein by reference. |
|
10.11* |
|
NVR, Inc. 1998 Directors’ Long-Term Stock Option Plan. Filed as Exhibit 4 to NVR’s Registration Statement on Form S-8 (No. 333-79949) filed on June 4, 1999 and incorporated herein by reference. |
|
10.12* |
|
NVR, Inc. 2000 Broadly-Based Stock Option Plan. Filed as Exhibit 99.1 to NVR’s Registration Statement on Form S-8 (No. 333-56732) filed on March 8, 2001 and incorporated herein by reference. |
|
10.13* |
|
NVR, Inc. Nonqualified Deferred Compensation Plan. Filed as Exhibit 10.1 to NVR’s Form 8-K filed on December 16, 2005 and incorporated herein by reference. |
|
10.14* |
|
Description of the Board of Directors’ compensation arrangement. Filed as Exhibit 10.27 to NVR’s Annual Report on Form 10-K for the year ended December 31, 2004 and incorporated herein by reference. |
|
10.15*
|
|
NVR, Inc. 2014 Equity Incentive Plan. Filed as Exhibit 10.1 to NVR’s Form S-8 (No. 333-195756) filed on May 7, 2014 and incorporated herein by reference. |
|
10.16*
|
|
The Form of Non-Qualified Stock Option Agreement (Management time-based grants) under the NVR, Inc. 2014 Equity Incentive Plan. Filed as Exhibit 10.1 to NVR’s Form 8-K filed on May 7, 2014 and incorporated herein by reference.
|
|
10.17*
|
|
The Form of Non-Qualified Stock Option Agreement (Director time-based grants) under the NVR, Inc. 2014 Equity Incentive Plan. Filed as Exhibit 10.2 to NVR’s Form 8-K filed on May 7, 2014 and incorporated herein by reference.
|
|
10.18*
|
|
The Form of Non-Qualified Stock Option Agreement (Management performance-based grants) under the NVR, Inc. 2014 Equity Incentive Plan. Filed as Exhibit 10.3 to NVR’s Form 8-K filed on May 7, 2014 and incorporated herein by reference. |
36
|
Exhibit |
|
Description |
|
10.19*
|
|
The Form of Non-Qualified Stock Option Agreement (Director performance-based grants) under the NVR, Inc. 2014 Equity Incentive Plan. Filed as Exhibit 10.4 to NVR’s Form 8-K filed on May 7, 2014 and incorporated herein by reference. |
|
10.20*
|
|
NVR, Inc. 2010 Equity Incentive Plan. Filed as Exhibit 10.1 to NVR’s Form S-8 (No. 333-166512) filed on May 4, 2010 and incorporated herein by reference. |
|
10.21* |
|
The Form of Non-Qualified Stock Option Agreement (Management grants) under the NVR, Inc. 2010 Equity Incentive Plan. Filed as Exhibit 10.1 to NVR’s Form 10-Q filed on July 30, 2013 and incorporated herein by reference. |
|
10.22* |
|
The Form of Non-Qualified Stock Option Agreement (Director grants) under the NVR, Inc. 2010 Equity Incentive Plan. Filed as Exhibit 10.2 to NVR’s Form 8-K filed on May 6, 2010 and incorporated herein by reference. |
|
10.23* |
|
The Form of Restricted Share Units Agreement (Management grants) under the NVR, Inc. 2010 Equity Incentive Plan. Filed as Exhibit 10.2 to NVR’s Form 10-Q filed on July 30, 2013 and incorporated herein by reference. |
|
10.24* |
|
The Form of Restricted Share Units Agreement (Director grants) under the NVR, Inc. 2010 Equity Incentive Plan. Filed as Exhibit 10.4 to NVR’s Form 8-K filed on May 6, 2010 and incorporated herein by reference. |
|
10.25* |
|
The Form of Non-Qualified Stock Option Agreement under the NVR, Inc. 2000 Broadly Based Stock Option Plan. Filed as Exhibit 10.1 to NVR’s Form 8-K filed on January 3, 2008 and incorporated herein by reference. |
|
10.26* |
|
The Form of Non-Qualified Stock Option Agreement under the 1998 Directors’ Long-Term Stock Option Plan. Filed as Exhibit 10.34 to NVR’s Annual Report on Form 10-K for the year ended December 31, 2007 and incorporated herein by reference. |
|
10.27* |
|
Summary of 2015 Named Executive Officer annual incentive compensation plan. Filed herewith. |
|
21 |
|
NVR, Inc. Subsidiaries. Filed herewith. |
|
23 |
|
Consent of KPMG LLP (Independent Registered Public Accounting Firm). Filed herewith. |
|
31.1 |
|
Certification of NVR’s Chief Executive Officer pursuant to Rule 13a-14(a). Filed herewith. |
|
31.2 |
|
Certification of NVR’s Chief Financial Officer pursuant to Rule 13a-14(a). Filed herewith. |
|
32 |
|
Certification of NVR’s Chief Executive Officer and Chief Financial Officer pursuant to 18 U.S.C. Section 1350, as adopted pursuant to Section 906 of the Sarbanes-Oxley Act of 2002. Filed herewith. |
|
101.INS |
|
XBRL Instance Document |
|
101.SCH |
|
XBRL Taxonomy Extension Schema Document |
|
101.CAL |
|
XBRL Taxonomy Extension Calculation Linkbase Document |
|
101.DEF |
|
XBRL Taxonomy Extension Definition Linkbase Document |
|
101.LAB |
|
XBRL Taxonomy Extension Label Linkbase Document |
|
101.PRE |
|
XBRL Taxonomy Extension Presentation Linkbase Document |
|
|
|
|
|
* |
Exhibit is a management contract or compensatory plan or arrangement. |
37
SIGNATURES
Pursuant to the requirements of Section 13 or 15(d) of the Securities Exchange Act of 1934, the registrant has duly caused this report to be signed on its behalf by the undersigned, thereunto duly authorized.
|
NVR, Inc. |
||
|
By: |
|
/s/ Paul C. Saville |
|
|
|
Paul C. Saville |
|
|
|
President and Chief Executive Officer |
Pursuant to the requirements of the Securities Exchange Act of 1934, this report has been signed by the following persons on behalf of the registrant and in the capacities and on the dates indicated.
|
Signature |
|
Title |
|
Date |
|
/s/ Dwight C. Schar |
|
Chairman |
|
February 19, 2015 |
|
Dwight C. Schar |
|
|
|
|
|
/s/ C. E. Andrews |
|
Director |
|
February 19, 2015 |
|
C. E. Andrews |
|
|
|
|
|
/s/ Robert C. Butler |
|
Director |
|
February 19, 2015 |
|
Robert C. Butler |
|
|
|
|
|
/s/ Timothy M. Donahue |
|
Director |
|
February 19, 2015 |
|
Timothy M. Donahue |
|
|
|
|
|
/s/ Thomas D. Eckert |
|
Director |
|
February 19, 2015 |
|
Thomas D. Eckert |
|
|
|
|
|
/s/ Alfred E. Festa |
|
Director |
|
February 19, 2015 |
|
Alfred E. Festa |
|
|
|
|
|
/s/ Ed Grier |
|
Director |
|
February 19, 2015 |
|
Ed Grier |
|
|
|
|
|
/s/ Manuel H. Johnson |
|
Director |
|
February 19, 2015 |
|
Manuel H. Johnson |
|
|
|
|
|
/s/ Mel Martinez |
|
Director |
|
February 19, 2015 |
|
Mel Martinez |
|
|
|
|
|
/s/ William A. Moran |
|
Director |
|
February 19, 2015 |
|
William A. Moran |
|
|
|
|
|
/s/ David A. Preiser |
|
Director |
|
February 19, 2015 |
|
David A. Preiser |
|
|
|
|
|
/s/ W. Grady Rosier |
|
Director |
|
February 19, 2015 |
|
W. Grady Rosier |
|
|
|
|
|
/s/ Paul W. Whetsell |
|
Director |
|
February 19, 2015 |
|
Paul W. Whetsell |
|
|
|
|
|
/s/ Paul C. Saville |
|
Principal Executive Officer |
|
February 19, 2015 |
|
Paul C. Saville |
|
|
|
|
|
/s/ Daniel D. Malzahn |
|
Principal Financial Officer |
|
February 19, 2015 |
|
Daniel D. Malzahn |
|
|
|
|
|
/s/ Eugene J. Bredow |
|
Principal Accounting Officer |
|
February 19, 2015 |
|
Eugene J. Bredow |
|
|
|
|
38
Report of Independent Registered Public Accounting Firm
The Board of Directors and Shareholders
NVR, Inc.:
We have audited the accompanying consolidated balance sheets of NVR, Inc. and subsidiaries as of December 31, 2014 and 2013, and the related consolidated statements of income, shareholders’ equity and cash flows for each of the years in the three-year period ended December 31, 2014. These consolidated financial statements are the responsibility of the Company’s management. Our responsibility is to express an opinion on these consolidated financial statements based on our audits.
We conducted our audits in accordance with the standards of the Public Company Accounting Oversight Board (United States). Those standards require that we plan and perform the audit to obtain reasonable assurance about whether the financial statements are free of material misstatement. An audit includes examining, on a test basis, evidence supporting the amounts and disclosures in the financial statements. An audit also includes assessing the accounting principles used and significant estimates made by management, as well as evaluating the overall financial statement presentation. We believe that our audits provide a reasonable basis for our opinion.
In our opinion, the consolidated financial statements referred to above present fairly, in all material respects, the financial position of NVR, Inc. and subsidiaries as of December 31, 2014 and 2013, and the results of their operations and their cash flows for each of the years in the three-year period ended December 31, 2014, in conformity with U.S. generally accepted accounting principles.
We also have audited, in accordance with the standards of the Public Company Accounting Oversight Board (United States), NVR, Inc.’s internal control over financial reporting as of December 31, 2014, based on criteria established in Internal Control - Integrated Framework (2013) issued by the Committee of Sponsoring Organizations of the Treadway Commission (COSO), and our report dated February 19, 2015 expressed an unqualified opinion on the effectiveness of the Company’s internal control over financial reporting.
KPMG LLP
McLean, Virginia
February 19, 2015
39
Report of Independent Registered Public Accounting Firm
The Board of Directors and Shareholders
NVR, Inc.:
We have audited NVR, Inc.’s internal control over financial reporting as of December 31, 2014, based on criteria established in Internal Control - Integrated Framework (2013) issued by the Committee of Sponsoring Organizations of the Treadway Commission (COSO). NVR, Inc.’s management is responsible for maintaining effective internal control over financial reporting and for its assessment of the effectiveness of internal control over financial reporting, included in the accompanying Management’s Report on Internal Control over Financial Reporting. Our responsibility is to express an opinion on the Company’s internal control over financial reporting based on our audit.
We conducted our audit in accordance with the standards of the Public Company Accounting Oversight Board (United States). Those standards require that we plan and perform the audit to obtain reasonable assurance about whether effective internal control over financial reporting was maintained in all material respects. Our audit included obtaining an understanding of internal control over financial reporting, assessing the risk that a material weakness exists, and testing and evaluating the design and operating effectiveness of internal control based on the assessed risk. Our audit also included performing such other procedures as we considered necessary in the circumstances. We believe that our audit provides a reasonable basis for our opinion.
A company’s internal control over financial reporting is a process designed to provide reasonable assurance regarding the reliability of financial reporting and the preparation of financial statements for external purposes in accordance with generally accepted accounting principles. A company’s internal control over financial reporting includes those policies and procedures that (1) pertain to the maintenance of records that, in reasonable detail, accurately and fairly reflect the transactions and dispositions of the assets of the company; (2) provide reasonable assurance that transactions are recorded as necessary to permit preparation of financial statements in accordance with generally accepted accounting principles, and that receipts and expenditures of the company are being made only in accordance with authorizations of management and directors of the company; and (3) provide reasonable assurance regarding prevention or timely detection of unauthorized acquisition, use, or disposition of the company’s assets that could have a material effect on the financial statements.
Because of its inherent limitations, internal control over financial reporting may not prevent or detect misstatements. Also, projections of any evaluation of effectiveness to future periods are subject to the risk that controls may become inadequate because of changes in conditions, or that the degree of compliance with the policies or procedures may deteriorate.
In our opinion, NVR, Inc. maintained, in all material respects, effective internal control over financial reporting as of December 31, 2014, based on criteria established in Internal Control - Integrated Framework (2013) issued by the Committee of Sponsoring Organizations of the Treadway Commission.
We also have audited, in accordance with the standards of the Public Company Accounting Oversight Board (United States), the consolidated balance sheets of NVR, Inc. and subsidiaries as of December 31, 2014 and 2013 and the related consolidated statements of income, shareholders’ equity and cash flows for each of the years in the three-year period ended December 31, 2014, and our report dated February 19, 2015 expressed an unqualified opinion on those consolidated financial statements.
KPMG LLP
McLean, Virginia
February 19, 2015
40
NVR, Inc.
Consolidated Balance Sheets
(in thousands, except share and per share data)
|
|
|
December 31, |
|
|||||
|
|
|
2014 |
|
|
2013 |
|
||
|
ASSETS |
|
|
|
|
|
|
|
|
|
|
|
|
|
|
|
|
|
|
|
Homebuilding: |
|
|
|
|
|
|
|
|
|
Cash and cash equivalents |
|
$ |
514,780 |
|
|
$ |
844,274 |
|
|
Receivables |
|
|
10,021 |
|
|
|
9,529 |
|
|
Inventory: |
|
|
|
|
|
|
|
|
|
Lots and housing units, covered under sales agreements with customers |
|
|
690,955 |
|
|
|
568,831 |
|
|
Unsold lots and housing units |
|
|
131,938 |
|
|
|
117,467 |
|
|
Land under development |
|
|
33,689 |
|
|
|
41,328 |
|
|
Building materials and other |
|
|
12,904 |
|
|
|
10,939 |
|
|
|
|
|
869,486 |
|
|
|
738,565 |
|
|
|
|
|
|
|
|
|
|
|
|
Assets related to consolidated variable interest entity |
|
|
3,590 |
|
|
|
7,268 |
|
|
Contract land deposits, net |
|
|
294,676 |
|
|
|
236,885 |
|
|
Property, plant and equipment, net |
|
|
46,242 |
|
|
|
32,599 |
|
|
Reorganization value in excess of amounts allocable to identifiable assets, net |
|
|
41,580 |
|
|
|
41,580 |
|
|
Goodwill and finite-lived intangible assets, net |
|
|
5,364 |
|
|
|
6,747 |
|
|
Deferred tax assets, net |
|
|
165,189 |
|
|
|
162,378 |
|
|
Other assets |
|
|
137,091 |
|
|
|
145,555 |
|
|
|
|
|
2,088,019 |
|
|
|
2,225,380 |
|
|
|
|
|
|
|
|
|
|
|
|
Mortgage Banking: |
|
|
|
|
|
|
|
|
|
Cash and cash equivalents |
|
|
30,158 |
|
|
|
21,311 |
|
|
Mortgage loans held for sale, net |
|
|
205,664 |
|
|
|
210,641 |
|
|
Property and equipment, net |
|
|
6,189 |
|
|
|
4,699 |
|
|
Reorganization value in excess of amounts allocable to identifiable assets, net |
|
|
7,347 |
|
|
|
7,347 |
|
|
Other assets |
|
|
13,958 |
|
|
|
16,770 |
|
|
|
|
|
263,316 |
|
|
|
260,768 |
|
|
Total assets |
|
$ |
2,351,335 |
|
|
$ |
2,486,148 |
|
|
|
|
|
|
|
|
|
|
|
|
LIABILITIES AND SHAREHOLDERS' EQUITY |
|
|
|
|
|
|
|
|
|
|
|
|
|
|
|
|
|
|
|
Homebuilding: |
|
|
|
|
|
|
|
|
|
Accounts payable |
|
$ |
204,622 |
|
|
$ |
181,687 |
|
|
Accrued expenses and other liabilities |
|
|
289,058 |
|
|
|
316,227 |
|
|
Liabilities related to consolidated variable interest entity |
|
|
1,618 |
|
|
|
1,646 |
|
|
Non-recourse debt related to consolidated variable interest entity |
|
|
64 |
|
|
|
3,365 |
|
|
Customer deposits |
|
|
106,755 |
|
|
|
101,022 |
|
|
Senior notes |
|
|
599,166 |
|
|
|
599,075 |
|
|
|
|
|
1,201,283 |
|
|
|
1,203,022 |
|
|
Mortgage Banking: |
|
|
|
|
|
|
|
|
|
Accounts payable and other liabilities |
|
|
25,797 |
|
|
|
21,774 |
|
|
|
|
|
25,797 |
|
|
|
21,774 |
|
|
Total liabilities |
|
|
1,227,080 |
|
|
|
1,224,796 |
|
|
|
|
|
|
|
|
|
|
|
|
Commitments and contingencies |
|
|
|
|
|
|
|
|
|
|
|
|
|
|
|
|
|
|
|
Shareholders' equity: |
|
|
|
|
|
|
|
|
|
Common stock, $0.01 par value; 60,000,000 shares authorized; 20,555,330 shares issued as of both December 31, 2014 and 2013 |
|
|
206 |
|
|
|
206 |
|
|
Additional paid-in capital |
|
|
1,325,495 |
|
|
|
1,212,050 |
|
|
Deferred compensation trust – 108,614 and 109,256 shares of NVR, Inc. common stock as of December 31, 2014 and 2013, respectively |
|
|
(17,333 |
) |
|
|
(17,741 |
) |
|
Deferred compensation liability |
|
|
17,333 |
|
|
|
17,741 |
|
|
Retained earnings |
|
|
4,887,187 |
|
|
|
4,605,557 |
|
|
Less treasury stock at cost – 16,506,229 and 16,121,605 shares as of December 31, 2014 and 2013, respectively |
|
|
(5,088,633 |
) |
|
|
(4,556,461 |
) |
|
Total shareholders' equity |
|
|
1,124,255 |
|
|
|
1,261,352 |
|
|
Total liabilities and shareholders' equity |
|
$ |
2,351,335 |
|
|
$ |
2,486,148 |
|
See notes to consolidated financial statements.
41
NVR, Inc.
Consolidated Statements of Income
(in thousands, except per share data)
|
|
|
Year Ended December 31, |
|
|||||||||
|
|
|
2014 |
|
|
2013 |
|
|
2012 |
|
|||
|
|
|
|
|
|
|
|
|
|
|
|
|
|
|
Homebuilding: |
|
|
|
|
|
|
|
|
|
|
|
|
|
Revenues |
|
$ |
4,375,059 |
|
|
$ |
4,134,481 |
|
|
$ |
3,121,244 |
|
|
Other income |
|
|
2,853 |
|
|
|
3,962 |
|
|
|
3,486 |
|
|
Cost of sales |
|
|
(3,568,586 |
) |
|
|
(3,424,204 |
) |
|
|
(2,575,639 |
) |
|
Selling, general and administrative |
|
|
(358,851 |
) |
|
|
(313,029 |
) |
|
|
(301,184 |
) |
|
Operating income |
|
|
450,475 |
|
|
|
401,210 |
|
|
|
247,907 |
|
|
Interest expense |
|
|
(22,591 |
) |
|
|
(21,840 |
) |
|
|
(6,983 |
) |
|
Homebuilding income |
|
|
427,884 |
|
|
|
379,370 |
|
|
|
240,924 |
|
|
|
|
|
|
|
|
|
|
|
|
|
|
|
|
Mortgage Banking: |
|
|
|
|
|
|
|
|
|
|
|
|
|
Mortgage banking fees |
|
|
69,509 |
|
|
|
76,786 |
|
|
|
63,406 |
|
|
Interest income |
|
|
4,940 |
|
|
|
4,983 |
|
|
|
4,504 |
|
|
Other income |
|
|
778 |
|
|
|
696 |
|
|
|
564 |
|
|
General and administrative |
|
|
(49,016 |
) |
|
|
(42,594 |
) |
|
|
(33,775 |
) |
|
Interest expense |
|
|
(549 |
) |
|
|
(545 |
) |
|
|
(546 |
) |
|
Mortgage banking income |
|
|
25,662 |
|
|
|
39,326 |
|
|
|
34,153 |
|
|
|
|
|
|
|
|
|
|
|
|
|
|
|
|
Income before taxes |
|
|
453,546 |
|
|
|
418,696 |
|
|
|
275,077 |
|
|
Income tax expense |
|
|
(171,916 |
) |
|
|
(152,219 |
) |
|
|
(94,489 |
) |
|
|
|
|
|
|
|
|
|
|
|
|
|
|
|
Net income |
|
$ |
281,630 |
|
|
$ |
266,477 |
|
|
$ |
180,588 |
|
|
|
|
|
|
|
|
|
|
|
|
|
|
|
|
Basic earnings per share |
|
$ |
65.83 |
|
|
$ |
56.25 |
|
|
$ |
36.04 |
|
|
|
|
|
|
|
|
|
|
|
|
|
|
|
|
Diluted earnings per share |
|
$ |
63.50 |
|
|
$ |
54.81 |
|
|
$ |
35.12 |
|
|
|
|
|
|
|
|
|
|
|
|
|
|
|
|
Basic weighted average shares outstanding |
|
|
4,278 |
|
|
|
4,737 |
|
|
|
5,011 |
|
|
|
|
|
|
|
|
|
|
|
|
|
|
|
|
Diluted weighted average shares outstanding |
|
|
4,435 |
|
|
|
4,862 |
|
|
|
5,142 |
|
See notes to consolidated financial statements.
42
NVR, Inc.
Consolidated Statements of Shareholders’ Equity
(in thousands)
|
|
|
Common Stock |
|
|
Additional Paid-In Capital |
|
|
Retained Earnings |
|
|
Treasury Stock |
|
|
Deferred Compensation Trust |
|
|
Deferred Compensation Liability |
|
|
Total |
|
|||||||
|
|
|
|
|
|
|
|
|
|
|
|
|
|
|
|
|
|
|
|
|
|
|
|
|
|
|
|
|
|
|
Balance, December 31, 2011 |
|
$ |
206 |
|
|
$ |
1,072,779 |
|
|
$ |
4,158,492 |
|
|
$ |
(3,856,678 |
) |
|
$ |
(25,581 |
) |
|
$ |
25,581 |
|
|
$ |
1,374,799 |
|
|
|
|
|
|
|
|
|
|
|
|
|
|
|
|
|
|
|
|
|
|
|
|
|
|
|
|
|
|
|
|
Net income |
|
|
— |
|
|
|
— |
|
|
|
180,588 |
|
|
|
— |
|
|
|
— |
|
|
|
— |
|
|
|
180,588 |
|
|
Deferred compensation activity |
|
|
— |
|
|
|
— |
|
|
|
— |
|
|
|
— |
|
|
|
250 |
|
|
|
(250 |
) |
|
|
— |
|
|
Purchase of common stock for treasury |
|
|
— |
|
|
|
— |
|
|
|
— |
|
|
|
(227,281 |
) |
|
|
— |
|
|
|
— |
|
|
|
(227,281 |
) |
|
Equity-based compensation |
|
|
— |
|
|
|
64,841 |
|
|
|
— |
|
|
|
— |
|
|
|
— |
|
|
|
— |
|
|
|
64,841 |
|
|
Tax benefit from equity benefit plan activity |
|
|
— |
|
|
|
14,319 |
|
|
|
— |
|
|
|
— |
|
|
|
— |
|
|
|
— |
|
|
|
14,319 |
|
|
Proceeds from stock options exercised |
|
|
— |
|
|
|
73,211 |
|
|
|
— |
|
|
|
— |
|
|
|
— |
|
|
|
— |
|
|
|
73,211 |
|
|
Treasury stock issued upon option exercise and restricted share vesting |
|
|
— |
|
|
|
(55,451 |
) |
|
|
— |
|
|
|
55,451 |
|
|
|
— |
|
|
|
— |
|
|
|
— |
|
|
Balance, December 31, 2012 |
|
|
206 |
|
|
|
1,169,699 |
|
|
|
4,339,080 |
|
|
|
(4,028,508 |
) |
|
|
(25,331 |
) |
|
|
25,331 |
|
|
|
1,480,477 |
|
|
|
|
|
|
|
|
|
|
|
|
|
|
|
|
|
|
|
|
|
|
|
|
|
|
|
|
|
|
|
|
Net income |
|
|
— |
|
|
|
— |
|
|
|
266,477 |
|
|
|
— |
|
|
|
— |
|
|
|
— |
|
|
|
266,477 |
|
|
Deferred compensation activity |
|
|
— |
|
|
|
— |
|
|
|
— |
|
|
|
— |
|
|
|
7,590 |
|
|
|
(7,590 |
) |
|
|
— |
|
|
Purchase of common stock for treasury |
|
|
— |
|
|
|
— |
|
|
|
— |
|
|
|
(554,491 |
) |
|
|
— |
|
|
|
— |
|
|
|
(554,491 |
) |
|
Equity-based compensation |
|
|
— |
|
|
|
34,296 |
|
|
|
— |
|
|
|
— |
|
|
|
— |
|
|
|
— |
|
|
|
34,296 |
|
|
Tax benefit from equity benefit plan activity |
|
|
— |
|
|
|
20,636 |
|
|
|
— |
|
|
|
— |
|
|
|
— |
|
|
|
— |
|
|
|
20,636 |
|
|
Proceeds from stock options exercised |
|
|
— |
|
|
|
13,957 |
|
|
|
— |
|
|
|
— |
|
|
|
— |
|
|
|
— |
|
|
|
13,957 |
|
|
Treasury stock issued upon option exercise and restricted share vesting |
|
|
— |
|
|
|
(26,538 |
) |
|
|
— |
|
|
|
26,538 |
|
|
|
— |
|
|
|
— |
|
|
|
— |
|
|
Balance, December 31, 2013 |
|
|
206 |
|
|
|
1,212,050 |
|
|
|
4,605,557 |
|
|
|
(4,556,461 |
) |
|
|
(17,741 |
) |
|
|
17,741 |
|
|
|
1,261,352 |
|
|
|
|
|
|
|
|
|
|
|
|
|
|
|
|
|
|
|
|
|
|
|
|
|
|
|
|
|
|
|
|
Net income |
|
|
— |
|
|
|
— |
|
|
|
281,630 |
|
|
|
— |
|
|
|
— |
|
|
|
— |
|
|
|
281,630 |
|
|
Deferred compensation activity |
|
|
— |
|
|
|
— |
|
|
|
— |
|
|
|
— |
|
|
|
408 |
|
|
|
(408 |
) |
|
|
— |
|
|
Purchase of common stock for treasury |
|
|
— |
|
|
|
— |
|
|
|
— |
|
|
|
(567,544 |
) |
|
|
— |
|
|
|
— |
|
|
|
(567,544 |
) |
|
Equity-based compensation |
|
|
— |
|
|
|
63,227 |
|
|
|
— |
|
|
|
— |
|
|
|
— |
|
|
|
— |
|
|
|
63,227 |
|
|
Tax benefit from equity benefit plan activity |
|
|
— |
|
|
|
9,437 |
|
|
|
— |
|
|
|
— |
|
|
|
— |
|
|
|
— |
|
|
|
9,437 |
|
|
Proceeds from stock options exercised |
|
|
— |
|
|
|
76,153 |
|
|
|
— |
|
|
|
— |
|
|
|
— |
|
|
|
— |
|
|
|
76,153 |
|
|
Treasury stock issued upon option exercise and restricted share vesting |
|
|
— |
|
|
|
(35,372 |
) |
|
|
— |
|
|
|
35,372 |
|
|
|
— |
|
|
|
— |
|
|
|
— |
|
|
Balance, December 31, 2014 |
|
$ |
206 |
|
|
$ |
1,325,495 |
|
|
$ |
4,887,187 |
|
|
$ |
(5,088,633 |
) |
|
$ |
(17,333 |
) |
|
$ |
17,333 |
|
|
$ |
1,124,255 |
|
See notes to consolidated financial statements
43
NVR, Inc.
Consolidated Statements of Cash Flows
(in thousands)
|
|
|
Year Ended December 31, |
|
|||||||||
|
|
|
2014 |
|
|
2013 |
|
|
2012 |
|
|||
|
|
|
|
|
|
|
|
|
|
|
|
|
|
|
Cash flows from operating activities: |
|
|
|
|
|
|
|
|
|
|
|
|
|
Net income |
|
$ |
281,630 |
|
|
$ |
266,477 |
|
|
$ |
180,588 |
|
|
Adjustments to reconcile net income to net cash provided by operating activities: |
|
|
|
|
|
|
|
|
|
|
|
|
|
Depreciation and amortization |
|
|
17,614 |
|
|
|
13,391 |
|
|
|
8,100 |
|
|
Excess income tax benefit from equity-based compensation |
|
|
(9,437 |
) |
|
|
(20,636 |
) |
|
|
(14,319 |
) |
|
Equity-based compensation expense |
|
|
63,227 |
|
|
|
34,296 |
|
|
|
64,841 |
|
|
Contract land deposit recoveries |
|
|
(225 |
) |
|
|
(5,313 |
) |
|
|
(2,003 |
) |
|
Gain on sale of loans |
|
|
(47,791 |
) |
|
|
(56,528 |
) |
|
|
(47,019 |
) |
|
Deferred tax (benefit) expense |
|
|
(4,176 |
) |
|
|
(16,848 |
) |
|
|
11,843 |
|
|
Mortgage loans closed |
|
|
(2,469,876 |
) |
|
|
(2,307,796 |
) |
|
|
(2,016,084 |
) |
|
Mortgage loans sold and principal payments on mortgage loans held for sale |
|
|
2,525,706 |
|
|
|
2,338,701 |
|
|
|
2,125,439 |
|
|
Distribution of earnings from unconsolidated joint ventures |
|
|
8,431 |
|
|
|
5,676 |
|
|
|
4,232 |
|
|
Net change in assets and liabilities: |
|
|
|
|
|
|
|
|
|
|
|
|
|
Increase in inventory |
|
|
(127,729 |
) |
|
|
(52,861 |
) |
|
|
(97,750 |
) |
|
Increase in contract land deposits |
|
|
(57,566 |
) |
|
|
(40,034 |
) |
|
|
(53,942 |
) |
|
Increase in receivables |
|
|
(533 |
) |
|
|
(260 |
) |
|
|
(1,818 |
) |
|
Increase in accounts payable and accrued expenses |
|
|
60 |
|
|
|
113,121 |
|
|
|
71,932 |
|
|
Increase in customer deposits |
|
|
5,733 |
|
|
|
1,335 |
|
|
|
38,464 |
|
|
Other, net |
|
|
(519 |
) |
|
|
(2,499 |
) |
|
|
(8,120 |
) |
|
Net cash provided by operating activities |
|
|
184,549 |
|
|
|
270,222 |
|
|
|
264,384 |
|
|
|
|
|
|
|
|
|
|
|
|
|
|
|
|
Cash flows from investing activities: |
|
|
|
|
|
|
|
|
|
|
|
|
|
Investments in and advances to unconsolidated joint ventures |
|
|
— |
|
|
|
(22,850 |
) |
|
|
(1,000 |
) |
|
Distribution of capital from unconsolidated joint ventures |
|
|
11,569 |
|
|
|
6,782 |
|
|
|
4,692 |
|
|
Purchase of property, plant and equipment |
|
|
(31,672 |
) |
|
|
(19,016 |
) |
|
|
(12,365 |
) |
|
Proceeds from the sale of property, plant and equipment |
|
|
1,021 |
|
|
|
607 |
|
|
|
319 |
|
|
Acquisition, net of cash acquired |
|
|
— |
|
|
|
— |
|
|
|
(14,257 |
) |
|
Net cash used in investing activities |
|
|
(19,082 |
) |
|
|
(34,477 |
) |
|
|
(22,611 |
) |
|
|
|
|
|
|
|
|
|
|
|
|
|
|
|
Cash flows from financing activities: |
|
|
|
|
|
|
|
|
|
|
|
|
|
Purchase of treasury stock |
|
|
(567,544 |
) |
|
|
(554,491 |
) |
|
|
(227,281 |
) |
|
Net repayments under note payable and credit lines |
|
|
(115 |
) |
|
|
(642 |
) |
|
|
(856 |
) |
|
Repayments on loans assumed in acquisition |
|
|
— |
|
|
|
— |
|
|
|
(21,910 |
) |
|
Repayments under non-recourse debt related to consolidated variable interest entity |
|
|
(3,301 |
) |
|
|
(4,314 |
) |
|
|
(6,566 |
) |
|
Borrowings under non-recourse debt related to consolidated variable interest entity |
|
|
— |
|
|
|
3,105 |
|
|
|
6,157 |
|
|
Distributions to partner in consolidated variable interest entity |
|
|
(931 |
) |
|
|
(1,250 |
) |
|
|
— |
|
|
Excess income tax benefit from equity-based compensation |
|
|
9,437 |
|
|
|
20,636 |
|
|
|
14,319 |
|
|
Proceeds from issuance of Senior Notes due 2022 |
|
|
— |
|
|
|
— |
|
|
|
598,962 |
|
|
Debt issuance costs for Senior Notes due 2022 |
|
|
— |
|
|
|
— |
|
|
|
(5,096 |
) |
|
Proceeds from the exercise of stock options |
|
|
76,153 |
|
|
|
13,957 |
|
|
|
73,211 |
|
|
Net cash (used in) provided by financing activities |
|
|
(486,301 |
) |
|
|
(522,999 |
) |
|
|
430,940 |
|
|
|
|
|
|
|
|
|
|
|
|
|
|
|
|
Net (decrease) increase in cash and cash equivalents |
|
|
(320,834 |
) |
|
|
(287,254 |
) |
|
|
672,713 |
|
|
Cash and cash equivalents, beginning of the year |
|
|
866,253 |
|
|
|
1,153,507 |
|
|
|
480,794 |
|
|
|
|
|
|
|
|
|
|
|
|
|
|
|
|
Cash and cash equivalents, end of the year |
|
$ |
545,419 |
|
|
$ |
866,253 |
|
|
$ |
1,153,507 |
|
|
|
|
|
|
|
|
|
|
|
|
|
|
|
|
Supplemental disclosures of cash flow information: |
|
|
|
|
|
|
|
|
|
|
|
|
|
Interest paid during the year, net of interest capitalized |
|
$ |
24,464 |
|
|
$ |
24,876 |
|
|
$ |
1,041 |
|
|
Income taxes paid during the year, net of refunds |
|
$ |
181,840 |
|
|
$ |
113,224 |
|
|
$ |
59,604 |
|
|
|
|
|
|
|
|
|
|
|
|
|
|
|
|
Supplemental disclosures of non-cash activities: |
|
|
|
|
|
|
|
|
|
|
|
|
|
Increase in assets in connection with acquisition |
|
$ |
— |
|
|
$ |
— |
|
|
$ |
55,759 |
|
|
Increase in liabilities in connection with acquisition |
|
$ |
— |
|
|
$ |
— |
|
|
$ |
41,502 |
|
See notes to consolidated financial statements.
44
NVR, Inc.
Notes to Consolidated Financial Statements
(dollars and shares in thousands, except per share data)
|
1. |
Summary of Significant Accounting Policies |
Principles of Consolidation
The accompanying consolidated financial statements include the accounts of NVR, Inc. and its subsidiaries (“NVR” or the “Company”) and certain other entities in which the Company is deemed to be the primary beneficiary (see Notes 3 and 4 herein for additional information). All significant intercompany transactions have been eliminated in consolidation.
Use of Estimates in the Preparation of Financial Statements
The preparation of financial statements in conformity with accounting principles generally accepted in the United States of America (“GAAP”) requires management to make estimates and assumptions that affect the reported amounts of assets and liabilities, the disclosure of contingent assets and liabilities at the date of the financial statements, and the reported amounts of revenues and expenses during the reporting periods. Management continually evaluates the estimates used to prepare the consolidated financial statements and updates those estimates as necessary. In general, the Company’s estimates are based on historical experience, on information from third party professionals, and other various assumptions that are believed to be reasonable under the facts and circumstances. Actual results could differ materially from those estimates made by management.
Reclassifications
Certain prior year amounts in the consolidated financial statements have been reclassified to conform to the 2014 presentation. Reclassifications did not impact net income, total assets or total liabilities, or statement of cash flow classifications.
Cash and Cash Equivalents
Cash and cash equivalents include short-term investments with original maturities of three months or less. At December 31, 2014 and 2013, $481 and $668, respectively, of cash related to a consolidated variable interest entity is included in “Assets related to consolidated variable interest entity” on the accompanying consolidated balance sheet.
The homebuilding segment had restricted cash of $24,106 and $20,563 at December 31, 2014 and 2013, respectively. Restricted cash in both 2014 and 2013 was attributable to holding requirements related to outstanding letters of credit issued under the Company’s letter of credit agreement as discussed further in Note 13 herein. In addition, restricted cash relates to customer deposits for certain home sales. Restricted cash is recorded in “Other assets” in the homebuilding section of the accompanying consolidated balance sheets.
The mortgage banking segment had restricted cash of $1,947 and $2,860 at December 31, 2014 and 2013, respectively, which included amounts collected from customers for loans in process and closed mortgage loans held for sale. The mortgage banking segment’s restricted cash is recorded in “Other assets” in the mortgage banking section of the accompanying consolidated balance sheets.
Homebuilding Inventory
The carrying value of inventory is stated at the lower of cost or market value. Cost of lots and completed and uncompleted housing units represent the accumulated actual cost of the units. Field construction supervisors’ salaries and related direct overhead expenses are included in inventory costs. Interest costs are not capitalized into inventory, with the exception of land under development and joint venture investments, as applicable (see below). Upon settlement, the cost of the unit is expensed on a specific identification basis. Cost of building materials is determined on a first-in, first-out basis.
Sold inventory is evaluated for impairment based on the contractual selling price compared to the total estimated cost to construct. Unsold inventory is evaluated for impairment by analyzing recent comparable sales prices within the applicable community compared to the costs incurred to date plus the expected costs to complete. Any calculated impairments are recorded immediately.
45
NVR, Inc.
Notes to Consolidated Financial Statements
(dollars and shares in thousands, except per share data)
Contract Land Deposits
The Company purchases finished lots under fixed price purchase agreements that require deposits that may be forfeited if NVR fails to perform under the contract. The deposits are in the form of cash or letters of credit in varying amounts and represent a percentage of the aggregate purchase price of the finished lots.
NVR maintains an allowance for losses on contract land deposits that reflects the Company’s judgment of the present loss exposure in the existing contract land deposit portfolio at the end of the reporting period. To analyze contract land deposit impairments, NVR utilizes an Accounting Standards Codification (“ASC”) 450, Contingencies, loss contingency analysis that is conducted each quarter. In addition to considering market and economic conditions, NVR assesses contract land deposit impairments on a community-by-community basis pursuant to the purchase contract terms, analyzing, as applicable, current sales absorption levels, recent sales’ gross profit, the dollar differential between the contractual purchase price and the current market price for lots, a developer’s financial stability, a developer’s financial ability or willingness to reduce lot prices to current market prices, and the contract’s default status by either the Company or the developer along with an analysis of the expected outcome of any such default.
NVR’s analysis is focused on whether the Company can sell houses profitably in a particular community in the current market with which the Company is faced. Because the Company does not own the finished lots on which the Company has placed a contract land deposit, if the above analysis leads to a determination that the Company cannot sell homes profitably at the current contractual lot price, the Company then determines whether it will elect to default under the contract, forfeit the deposit and terminate the contract, or whether the Company will attempt to restructure the lot purchase contract, which may require it to forfeit the deposit to obtain contract concessions from a developer. The Company also assesses whether impairment is present due to collectability issues resulting from a developer’s non-performance because of financial or other conditions.
For the years ended December 31, 2014, 2013 and 2012, the Company recognized pre-tax recoveries of approximately $225, $5,300 and $2,000, respectively, of contract land deposits previously determined to be uncollectible. The contract land deposit asset on the accompanying consolidated balance sheets is shown net of an approximate $56,100 and $59,800 impairment valuation allowance at December 31, 2014, and 2013, respectively.
Land Under Development
On a very limited basis, NVR directly acquires raw parcels of land already zoned for its intended use to develop into finished lots. Land under development includes the land acquisition costs, direct improvement costs, capitalized interest, where applicable, and real estate taxes.
Land under development, including the land under development held by the Company’s unconsolidated joint ventures and the related joint venture investments, is reviewed for potential write-downs when impairment indicators are present. In addition to considering market and economic conditions, the Company assesses land under development impairments on a community-by-community basis, analyzing, as applicable, current sales absorption levels, recent sales’ gross profit, and the dollar differential between the projected fully-developed cost of the lots and the current market price for lots. If indicators of impairment are present for a community, NVR performs an analysis to determine if the undiscounted cash flows estimated to be generated by those assets are less than their carrying amounts, and if so, impairment charges are required to be recorded if the fair value of such assets is less than their carrying amounts. For those assets deemed to be impaired, the impairment to be recognized is measured as the amount by which the carrying amount of the assets exceeds the fair value of the assets. The Company’s determination of fair value is primarily based on discounting the estimated future cash flows at a rate commensurate with the inherent risks associated with the assets and related estimated cash flow streams. NVR does not believe that any of the land under development is impaired at this time.
Property, Plant, and Equipment
Property, plant, and equipment are carried at cost less accumulated depreciation and amortization. Depreciation is based on the estimated useful lives of the assets using the straight-line method. Amortization of capital lease assets is included in depreciation expense. Model home furniture and fixtures are generally depreciated over a two-year period, office facilities and other equipment are depreciated over a period from three to ten years, production facilities are depreciated over periods of from five to forty years and property under capital leases is depreciated in a manner consistent with the Company’s depreciation policy for owned assets, or the lease-term if shorter.
46
NVR, Inc.
Notes to Consolidated Financial Statements
(dollars and shares in thousands, except per share data)
Intangible Assets
On December 31, 2012, the Company acquired substantially all of the assets of Heartland Homes, Inc., which resulted in the Company recording finite-lived intangible assets and goodwill. The Company completed its annual assessment for impairment of goodwill and management determined that there was no impairment. As of December 31, 2014 and 2013, finite-lived intangible assets attributable to the Heartland Homes, Inc. acquisition, net of accumulated amortization, totaled $4,923 and $6,306, respectively. As of both December 31, 2014 and 2013, the goodwill value was $441. The remaining finite-lived intangible assets will be amortized on a straight-line basis over a weighted average life of 4 years.
Warranty/Product Liability Accruals
The Company establishes warranty and product liability reserves to provide for estimated future expenses as a result of construction and product defects, product recalls and litigation incidental to NVR’s homebuilding business. Liability estimates are determined based on management’s judgment considering such factors as historical experience, the likely current cost of corrective action, manufacturers’ and subcontractors’ participation in sharing the cost of corrective action, consultations with third party experts such as engineers, and discussions with the Company’s General Counsel and outside counsel retained to handle specific product liability cases.
Mortgage Loans Held for Sale, Derivatives and Hedging Activities
NVR originates several different loan products to its customers to finance the purchase of a home through its wholly-owned mortgage subsidiary, NVR Mortgage Finance, Inc. (“NVRM”). NVRM sells all of the loans it originates into the secondary market on a servicing released basis, typically within 30 days from origination. All of the loans that NVRM originates are underwritten to the standards and specifications of the ultimate investor. Those underwriting standards are typically equal to or more stringent than the underwriting standards required by Fannie Mae (“FNMA”), Department of Veterans Affairs (“VA”) and the Federal Housing Administration (“FHA”). Insofar as NVRM underwrites its originated loans to those standards, NVRM bears no increased concentration of credit risk from the issuance of loans, except in certain limited instances where early payment default occurs. NVRM employs a quality control department to ensure that its underwriting controls are effectively operating, and further assesses the underwriting function as part of its assessment of internal controls over financial reporting. NVRM maintains an allowance for losses on mortgage loans originated that reflects NVR’s judgment of the present loss exposure in the loans that NVRM has originated and sold. The allowance is calculated based on an analysis of historical experience and exposure (see Note 15 herein for further information).
Mortgage loans held for sale are recorded at fair value at closing and thereafter are carried at the lower of cost or fair value, net of deferred origination costs, until sold.
In the normal course of business, NVRM enters into contractual commitments to extend credit to buyers of single-family homes with fixed expiration dates. The commitments become effective when the borrowers “lock-in” a specified interest rate within time frames established by NVRM. All mortgagors are evaluated for credit worthiness prior to the extension of the commitment. Market risk arises if interest rates move adversely between the time of the “lock-in” of rates by the borrower and the sale date of the loan to a broker/dealer. To mitigate the effect of the interest rate risk inherent in providing rate lock commitments to borrowers, NVRM enters into optional or mandatory delivery forward sale contracts to sell whole loans and mortgage-backed securities to broker/dealers. The forward sale contracts lock in an interest rate and price for the sale of loans similar to the specific rate lock commitments. NVRM does not engage in speculative or trading derivative activities. Both the rate lock commitments to borrowers and the forward sale contracts to broker/dealers are undesignated derivatives, and, accordingly, are marked to fair value through earnings. At December 31, 2014, there were contractual commitments to extend credit to borrowers aggregating $237,989, and open forward delivery sale contracts aggregating $424,966 (see Note 14 herein for a description of the Company’s fair value accounting).
47
NVR, Inc.
Notes to Consolidated Financial Statements
(dollars and shares in thousands, except per share data)
Earnings per Share
The following weighted average shares and share equivalents were used to calculate basic and diluted earnings per share for the years ended December 31, 2014, 2013 and 2012:
|
|
|
Year Ended December 31, |
|
|||||||||
|
|
|
2014 |
|
|
2013 |
|
|
2012 |
|
|||
|
Weighted average number of shares outstanding used to calculate basic EPS |
|
|
4,278 |
|
|
|
4,737 |
|
|
|
5,011 |
|
|
Dilutive securities: |
|
|
|
|
|
|
|
|
|
|
|
|
|
Stock options and restricted share units |
|
|
157 |
|
|
|
125 |
|
|
|
131 |
|
|
Weighted average number of shares and share equivalents outstanding used to calculate diluted EPS |
|
|
4,435 |
|
|
|
4,862 |
|
|
|
5,142 |
|
The assumed proceeds used in the treasury method for calculating NVR’s diluted earnings per share includes the amount the employee must pay upon exercise, the amount of compensation cost attributed to future services not yet recognized and the amount of tax benefits that would be credited or charged to additional paid-in-capital assuming exercise of the stock option or vesting of the restricted share unit. The assumed amount credited to additional paid-in-capital equals the tax benefit from assumed exercise of stock options or the assumed vesting of restricted share units after consideration of the intrinsic value upon assumed exercise or vesting less the actual stock-based compensation expense to be recognized in the income statement.
The following stock options and restricted share units issued under equity incentive plans were outstanding during the years ended December 31, 2014, 2013 and 2012; however, they were not included in the computation of diluted earnings per share because the effect would have been anti-dilutive.
|
|
|
Year Ended December 31, |
|
|||||||||
|
|
|
2014 |
|
|
2013 |
|
|
2012 |
|
|||
|
Anti-dilutive securities |
|
|
757 |
|
|
|
157 |
|
|
|
194 |
|
|
|
|
|
|
|
|
|
|
|
|
|
|
|
Revenues – Homebuilding Operations
NVR builds single-family detached homes, townhomes and condominium buildings, which generally are constructed on a pre-sold basis for the ultimate customer. Revenues are recognized at the time the unit is settled and title passes to the customer, adequate cash payment has been received and there is no continuing involvement. In situations where the buyer’s financing is originated by NVRM and the buyer has not made an adequate initial or continuing investment as prescribed by GAAP, the profit on such settlement is deferred until the sale of the related loan to a third-party investor has been completed.
Mortgage Banking Fees
Mortgage banking fees include income earned by NVRM for originating mortgage loans, servicing mortgage loans held on an interim basis, title fees, gains and losses on the sale of mortgage loans and mortgage servicing and other activities incidental to mortgage banking. Mortgage banking fees are generally recognized after the loan has been sold to an unaffiliated, third party investor.
Income Taxes
Income taxes are accounted for under the asset and liability method. Deferred tax assets and liabilities are recognized for the future tax consequences attributable to differences between the financial statement carrying amounts of existing assets and liabilities and their respective tax basis. Deferred tax assets and liabilities are measured using enacted tax rates expected to apply to taxable income in the years in which those temporary differences are expected to be recovered or settled. The effect on the deferred tax assets and liabilities of a change in tax rates is recognized in income in the period that includes the enactment date.
ASC 740-10, Income Taxes, provides that a tax benefit from an uncertain tax position may be recognized when it is more-likely-than-not (defined as a likelihood of more than 50%) that the position will be sustained upon examination, including resolution of any
48
NVR, Inc.
Notes to Consolidated Financial Statements
(dollars and shares in thousands, except per share data)
related appeals or litigation processes, based on the technical merits. If a tax position does not meet the more-likely-than-not recognition threshold, despite the Company’s belief that its filing position is supportable, the benefit of that tax position is not recognized in the statements of income. The Company recognizes interest related to unrecognized tax benefits as a component of income tax expense. Based on its historical experience in dealing with various taxing authorities, the Company has found that it is the administrative practice of the taxing authorities to not seek penalties from the Company for the tax positions it has taken on its returns, related to its unrecognized tax benefits. Therefore, the Company does not accrue penalties for the positions in which it has an unrecognized tax benefit. However, if such penalties were to be accrued, they would be recorded as a component of income tax expense. The Company recognizes unrecognized tax benefits in the period that the uncertainty is eliminated by either affirmative agreement of the uncertain tax position by the applicable taxing authority, by expiration of the applicable statute of limitation, or by determination in accordance with certain states’ administrative practices that the uncertain tax position has been effectively settled (see Note 11 herein for further information).
Financial Instruments
Except as otherwise noted herein, NVR believes that insignificant differences exist between the carrying value and the fair value of its financial instruments (see Note 14 herein for further information).
Equity-Based Compensation
The company accounts for its equity-based compensation in accordance with ASC 718, Compensation – Stock Compensation. ASC 718 requires an entity to recognize an expense within its income statement for all share-based payment arrangements, which includes employee stock option and restricted share unit plans. The expense is based on the grant-date fair value of the stock options and restricted share units granted, and is recognized ratably over the requisite service period. Recognition of compensation expense for the stock options which are subject to a performance condition are treated as a separate award from the “service-only” stock options, and expense is recognized when it becomes probable that the stated performance target will be achieved. The Company calculates the fair value of its non-publicly traded, employee stock options using the Black-Scholes option-pricing model. The grant date fair value of the restricted share units is the closing price of the Company’s common stock on the day immediately preceding the date of grant. The Company’s equity-based compensation programs are accounted for as equity-classified awards (see Note 12 herein for further discussion of equity-based compensation plans).
Comprehensive Income
For the years ended December 31, 2014, 2013 and 2012, comprehensive income equaled net income; therefore, a separate statement of comprehensive income is not included in the accompanying consolidated financial statements.
Recent Accounting Pronouncements
In May 2014, the Financial Accounting Standards Board (“FASB”) issued Accounting Standards Update (“ASU”) 2014-09, Revenue from Contracts with Customers, which requires an entity to recognize the amount of revenue to which it expects to be entitled for the transfer of promised goods or services to customers. The standard will replace most existing revenue recognition guidance in GAAP when it becomes effective. The standard is effective for the Company on January 1, 2017. Early adoption is not permitted. The standard permits the use of either the retrospective or cumulative effect transition method. The Company has not yet selected a transition method and is currently evaluating the effect that the standard will have on its consolidated financial statements and related disclosures.
In August 2014, FASB issued ASU 2014-15, Presentation of Financial Statements – Going Concern (Subtopic 205-40): Disclosure of Uncertainties about an Entity’s Ability to Continue as a Going Concern. The standard requires an entity’s management to evaluate at each annual and interim reporting period whether there are conditions or events that raise substantial doubt about the entity’s ability to continue as a going concern within one year after the date the financial statements are issued and to provide related footnote disclosures. The standard is effective for the first annual period ending after December 15, 2016, and interim periods thereafter. The Company does not believe that the adoption of this standard will have a material effect on its consolidated financial statements and related disclosures.
49
NVR, Inc.
Notes to Consolidated Financial Statements
(dollars and shares in thousands, except per share data)
|
2. |
Segment Information, Nature of Operations, and Certain Concentrations |
NVR’s homebuilding operations primarily construct and sell single-family detached homes, townhomes and condominium buildings under four trade names: Ryan Homes, NVHomes, Fox Ridge Homes and Heartland Homes. The Ryan Homes and Fox Ridge Homes products are marketed primarily to first-time and first-time move-up buyers. Ryan Homes operates in twenty-seven metropolitan areas located in Maryland, Virginia, Washington, D.C., West Virginia, Pennsylvania, New York, North Carolina, South Carolina, Florida, Ohio, New Jersey, Delaware, Indiana, Illinois and Tennessee. Fox Ridge Homes operates in the Nashville, TN metropolitan area. The NVHomes and Heartland Homes products are marketed primarily to move-up and up-scale buyers. NVHomes operates in Delaware and the Washington, D.C., Baltimore, MD, Philadelphia, PA and Raleigh, NC metropolitan areas. Heartland Homes operates in the Pittsburgh, PA metropolitan area. NVR derived approximately 33% and 13% of its 2014 homebuilding revenues from the Washington, D.C. and Baltimore, MD metropolitan areas, respectively.
NVR’s mortgage banking segment is a regional mortgage banking operation. Substantially all of the mortgage banking segment’s loan closing activity is for NVR’s homebuilding customers. NVR’s mortgage banking business generates revenues primarily from origination fees, gains on sales of loans, and title fees. A substantial portion of the Company’s mortgage operations is conducted in the Washington, D.C. and Baltimore, MD metropolitan areas.
The following disclosure includes four homebuilding reportable segments that aggregate geographically the Company’s homebuilding operating segments, and the mortgage banking operations presented as a single reportable segment. The homebuilding reportable segments are comprised of operating divisions in the following geographic areas:
Mid Atlantic: Maryland, Virginia, West Virginia, Delaware and Washington, D.C.
North East: New Jersey and eastern Pennsylvania
Mid East: New York, Ohio, western Pennsylvania, Indiana and Illinois
South East: North Carolina, South Carolina, Florida and Tennessee
Homebuilding profit before tax includes all revenues and income generated from the sale of homes, less the cost of homes sold, selling, general and administrative expenses, and a corporate capital allocation charge. The corporate capital allocation charge eliminates in consolidation and is based on the segment’s average net assets employed. The corporate capital allocation charged to the operating segment allows the Chief Operating Decision Maker (“CODM”) to determine whether the operating segment’s results are providing the desired rate of return after covering the Company’s cost of capital. In addition, certain assets including goodwill and intangible assets, and consolidation adjustments as discussed further below, are not allocated to the operating segments as those assets are not included in the operating segment’s corporate capital allocation charge, nor in the CODM’s evaluation of the operating segment’s performance. The Company records charges on contract land deposits when it is determined that it is probable that recovery of the deposit is impaired. For segment reporting purposes, impairments on contract land deposits are charged to the operating segment upon the determination to terminate a finished lot purchase agreement with the developer, or to restructure a lot purchase agreement resulting in the forfeiture of the deposit. Mortgage banking profit before tax consists of revenues generated from mortgage financing, title insurance and closing services, less the costs of such services and general and administrative costs. Mortgage banking operations are not charged a capital allocation charge.
In addition to the corporate capital allocation and contract land deposit impairments discussed above, the other reconciling items between segment profit and consolidated profit before tax include unallocated corporate overhead (including all management incentive compensation), equity-based compensation expense, consolidation adjustments and external corporate interest expense. NVR’s overhead functions, such as accounting, treasury and human resources are centrally performed and the costs are not allocated to the Company’s operating segments. Consolidation adjustments consist of such items necessary to convert the reportable segments’ results, which are predominantly maintained on a cash basis, to a full accrual basis for external financial statement presentation purposes, and are not allocated to the Company’s operating segments. External corporate interest expense is primarily comprised of interest charges on the Company’s 3.95% Senior Notes due 2022 (the “Senior Notes”) and is not charged to the operating segments because the charges are included in the corporate capital allocation discussed above.
50
NVR, Inc.
Notes to Consolidated Financial Statements
(dollars and shares in thousands, except per share data)
Following are tables presenting segment revenues, profit before taxes, assets, interest income, interest expense, depreciation and amortization and expenditures for property and equipment, with reconciliations to the amounts reported for the consolidated enterprise, where applicable:
|
|
|
Year Ended December 31, |
|
|||||||||
|
|
|
2014 |
|
|
2013 |
|
|
2012 |
|
|||
|
Revenues: |
|
|
|
|
|
|
|
|
|
|
|
|
|
Homebuilding Mid Atlantic |
|
$ |
2,617,108 |
|
|
$ |
2,439,387 |
|
|
$ |
1,877,905 |
|
|
Homebuilding North East |
|
|
376,862 |
|
|
|
332,681 |
|
|
|
278,715 |
|
|
Homebuilding Mid East |
|
|
892,513 |
|
|
|
908,198 |
|
|
|
630,367 |
|
|
Homebuilding South East |
|
|
488,576 |
|
|
|
454,215 |
|
|
|
334,257 |
|
|
Mortgage Banking |
|
|
69,509 |
|
|
|
76,786 |
|
|
|
63,406 |
|
|
Total consolidated revenues |
|
$ |
4,444,568 |
|
|
$ |
4,211,267 |
|
|
$ |
3,184,650 |
|
|
|
|
Year Ended December 31, |
|
|||||||||
|
|
|
2014 |
|
|
2013 |
|
|
2012 |
|
|||
|
Profit before taxes: |
|
|
|
|
|
|
|
|
|
|
|
|
|
Homebuilding Mid Atlantic |
|
$ |
271,965 |
|
|
$ |
276,399 |
|
|
$ |
189,089 |
|
|
Homebuilding North East |
|
|
33,390 |
|
|
|
14,294 |
|
|
|
21,529 |
|
|
Homebuilding Mid East |
|
|
47,538 |
|
|
|
55,537 |
|
|
|
39,847 |
|
|
Homebuilding South East |
|
|
37,525 |
|
|
|
35,001 |
|
|
|
20,674 |
|
|
Mortgage Banking |
|
|
30,388 |
|
|
|
42,075 |
|
|
|
38,135 |
|
|
Total segment profit |
|
|
420,806 |
|
|
|
423,306 |
|
|
|
309,274 |
|
|
Contract land deposit reserve adjustment (1) |
|
|
3,612 |
|
|
|
5,313 |
|
|
|
5,333 |
|
|
Equity-based compensation expense (2) |
|
|
(63,227 |
) |
|
|
(34,296 |
) |
|
|
(64,841 |
) |
|
Corporate capital allocation (3) |
|
|
152,140 |
|
|
|
116,457 |
|
|
|
91,507 |
|
|
Unallocated corporate overhead |
|
|
(61,108 |
) |
|
|
(72,703 |
) |
|
|
(70,258 |
) |
|
Consolidation adjustments and other |
|
|
23,867 |
|
|
|
2,362 |
|
|
|
10,858 |
|
|
Corporate interest expense (4) |
|
|
(22,544 |
) |
|
|
(21,743 |
) |
|
|
(6,796 |
) |
|
Reconciling items sub-total |
|
|
32,740 |
|
|
|
(4,610 |
) |
|
|
(34,197 |
) |
|
Consolidated profit before taxes |
|
$ |
453,546 |
|
|
$ |
418,696 |
|
|
$ |
275,077 |
|
|
|
|
As of December 31, |
|
|||||
|
|
|
2014 |
|
|
2013 |
|
||
|
Assets: |
|
|
|
|
|
|
|
|
|
Homebuilding Mid Atlantic |
|
$ |
917,689 |
|
|
$ |
810,270 |
|
|
Homebuilding North East |
|
|
103,631 |
|
|
|
84,958 |
|
|
Homebuilding Mid East |
|
|
192,781 |
|
|
|
172,167 |
|
|
Homebuilding South East |
|
|
144,939 |
|
|
|
106,389 |
|
|
Mortgage Banking |
|
|
255,969 |
|
|
|
253,421 |
|
|
Total segment assets |
|
|
1,615,009 |
|
|
|
1,427,205 |
|
|
Consolidated variable interest entity |
|
|
3,590 |
|
|
|
7,268 |
|
|
Cash and cash equivalents |
|
|
514,780 |
|
|
|
844,274 |
|
|
Deferred taxes |
|
|
165,189 |
|
|
|
162,378 |
|
|
Intangible assets and goodwill |
|
|
54,291 |
|
|
|
55,674 |
|
|
Contract land deposit reserve |
|
|
(56,074 |
) |
|
|
(59,761 |
) |
|
Consolidation adjustments and other |
|
|
54,550 |
|
|
|
49,110 |
|
|
Reconciling items sub-total |
|
|
736,326 |
|
|
|
1,058,943 |
|
|
Consolidated assets |
|
$ |
2,351,335 |
|
|
$ |
2,486,148 |
|
51
NVR, Inc.
Notes to Consolidated Financial Statements
(dollars and shares in thousands, except per share data)
|
|
|
Year Ended December 31, |
|
|||||||||
|
|
|
2014 |
|
|
2013 |
|
|
2012 |
|
|||
|
Interest Income: |
|
|
|
|
|
|
|
|
|
|
|
|
|
Mortgage Banking |
|
$ |
4,940 |
|
|
$ |
4,983 |
|
|
$ |
4,504 |
|
|
Total segment interest income |
|
|
4,940 |
|
|
|
4,983 |
|
|
|
4,504 |
|
|
Other unallocated interest income |
|
|
1,311 |
|
|
|
2,319 |
|
|
|
1,388 |
|
|
Consolidated interest income |
|
$ |
6,251 |
|
|
$ |
7,302 |
|
|
$ |
5,892 |
|
|
|
|
Year Ended December 31, |
|
|||||||||
|
|
|
2014 |
|
|
2013 |
|
|
2012 |
|
|||
|
Interest Expense: |
|
|
|
|
|
|
|
|
|
|
|
|
|
Homebuilding Mid Atlantic |
|
$ |
96,364 |
|
|
$ |
72,351 |
|
|
$ |
59,310 |
|
|
Homebuilding North East |
|
|
12,114 |
|
|
|
9,466 |
|
|
|
8,196 |
|
|
Homebuilding Mid East |
|
|
26,300 |
|
|
|
22,587 |
|
|
|
15,043 |
|
|
Homebuilding South East |
|
|
17,409 |
|
|
|
12,151 |
|
|
|
9,145 |
|
|
Mortgage Banking |
|
|
549 |
|
|
|
545 |
|
|
|
546 |
|
|
Total segment interest expense |
|
|
152,736 |
|
|
|
117,100 |
|
|
|
92,240 |
|
|
Corporate capital allocation |
|
|
(152,140 |
) |
|
|
(116,457 |
) |
|
|
(91,507 |
) |
|
Senior notes and other interest |
|
|
22,544 |
|
|
|
21,742 |
|
|
|
6,796 |
|
|
Consolidated interest expense |
|
$ |
23,140 |
|
|
$ |
22,385 |
|
|
$ |
7,529 |
|
|
|
|
Year Ended December 31, |
|
|||||||||
|
|
|
2014 |
|
|
2013 |
|
|
2012 |
|
|||
|
Depreciation and Amortization: |
|
|
|
|
|
|
|
|
|
|
|
|
|
Homebuilding Mid Atlantic |
|
$ |
6,489 |
|
|
$ |
4,784 |
|
|
$ |
3,886 |
|
|
Homebuilding North East |
|
|
1,208 |
|
|
|
853 |
|
|
|
631 |
|
|
Homebuilding Mid East |
|
|
3,212 |
|
|
|
1,911 |
|
|
|
1,473 |
|
|
Homebuilding South East |
|
|
1,715 |
|
|
|
1,008 |
|
|
|
808 |
|
|
Mortgage Banking |
|
|
1,089 |
|
|
|
669 |
|
|
|
397 |
|
|
Total segment depreciation and amortization |
|
|
13,713 |
|
|
|
9,225 |
|
|
|
7,195 |
|
|
Unallocated corporate |
|
|
3,901 |
|
|
|
4,166 |
|
|
|
905 |
|
|
Consolidated depreciation and amortization |
|
$ |
17,614 |
|
|
$ |
13,391 |
|
|
$ |
8,100 |
|
|
|
|
Year Ended December 31, |
|
|||||||||
|
|
|
2014 |
|
|
2013 |
|
|
2012 |
|
|||
|
Expenditures for Property and Equipment: |
|
|
|
|
|
|
|
|
|
|
|
|
|
Homebuilding Mid Atlantic |
|
$ |
9,047 |
|
|
$ |
7,947 |
|
|
$ |
3,595 |
|
|
Homebuilding North East |
|
|
2,311 |
|
|
|
1,454 |
|
|
|
1,703 |
|
|
Homebuilding Mid East |
|
|
6,982 |
|
|
|
3,282 |
|
|
|
1,886 |
|
|
Homebuilding South East |
|
|
3,472 |
|
|
|
2,662 |
|
|
|
1,260 |
|
|
Mortgage Banking |
|
|
2,580 |
|
|
|
2,933 |
|
|
|
1,169 |
|
|
Total segment expenditures for property and equipment |
|
|
24,392 |
|
|
|
18,278 |
|
|
|
9,613 |
|
|
Unallocated corporate |
|
|
7,280 |
|
|
|
738 |
|
|
|
2,752 |
|
|
Consolidated expenditures for property and equipment |
|
$ |
31,672 |
|
|
$ |
19,016 |
|
|
$ |
12,365 |
|
|
(1) |
This item represents changes to the contract land deposit impairment reserve, which are not allocated to the reportable segments. |
|
(2) |
The increase in equity-based compensation expense in 2014 is primarily attributable to the issuance of stock options under the NVR, Inc. 2014 Equity Incentive Plan (the “2014 Plan”) and restricted share units (“RSUs”) issued in the second quarter of 2013. Equity-based compensation expense was lower in 2013 due to RSUs issued in 2010 under the 2010 Equity Incentive Plan (the “2010 Plan”) becoming fully vested effective December 31, 2012 and an approximate $7,900 pre-tax compensation expense |
52
NVR, Inc.
Notes to Consolidated Financial Statements
(dollars and shares in thousands, except per share data)
|
reversal in 2013 attributable to an adjustment of the stock option forfeiture rates based on the Company’s actual forfeiture experience. These reductions were partially offset by equity-based compensation expense incurred in 2013 related to RSUs issued in the second quarter of 2013 under the 2010 Plan. |
|
(3) |
This item represents the elimination of the corporate capital allocation charge included in the respective homebuilding reportable segments. The corporate capital allocation charge is based on the segment’s monthly average asset balance, and was as follows for the years presented: |
|
|
|
Year Ended December 31, |
|
|||||||||
|
Corporate Capital Allocation Charge: |
|
2014 |
|
|
2013 |
|
|
2012 |
|
|||
|
Homebuilding Mid Atlantic |
|
$ |
96,328 |
|
|
$ |
72,271 |
|
|
$ |
59,144 |
|
|
Homebuilding North East |
|
|
12,107 |
|
|
|
9,461 |
|
|
|
8,187 |
|
|
Homebuilding Mid East |
|
|
26,299 |
|
|
|
22,580 |
|
|
|
15,039 |
|
|
Homebuilding South East |
|
|
17,406 |
|
|
|
12,145 |
|
|
|
9,137 |
|
|
Total |
|
$ |
152,140 |
|
|
$ |
116,457 |
|
|
$ |
91,507 |
|
|
(4) |
Corporate interest expense is attributable primarily to interest on the Senior Notes which were issued in the third quarter of 2012. |
|
3. |
Variable Interest Entities |
Fixed Price Purchase Agreements
NVR generally does not engage in the land development business. Instead, the Company typically acquires finished building lots at market prices from various development entities under fixed price purchase agreements. The purchase agreements require deposits that may be forfeited if NVR fails to perform under the agreements. The deposits required under the purchase agreements are in the form of cash or letters of credit in varying amounts, and typically range up to 10% of the aggregate purchase price of the finished lots.
NVR believes this lot acquisition strategy reduces the financial requirements and risks associated with direct land ownership and land development. NVR may, at its option, choose for any reason and at any time not to perform under these purchase agreements by delivering notice of its intent not to acquire the finished lots under contract. NVR’s sole legal obligation and economic loss for failure to perform under these purchase agreements is limited to the amount of the deposit pursuant to the liquidated damage provisions contained within the purchase agreements. In other words, if NVR does not perform under a purchase agreement, NVR loses only its deposit. None of the creditors of any of the development entities with which NVR enters fixed price purchase agreements have recourse to the general credit of NVR. NVR generally does not have any specific performance obligations to purchase a certain number or any of the lots, nor does NVR guarantee completion of the development by the developer or guarantee any of the developers’ financial or other liabilities.
NVR is not involved in the design or creation of any of the development entities from which the Company purchases lots under fixed price purchase agreements. The developer’s equity holders have the power to direct 100% of the operating activities of the development entity. NVR has no voting rights in any of the development entities. The sole purpose of the development entity’s activities is to generate positive cash flow returns to the equity holders. Further, NVR does not share in any of the profit or loss generated by the project’s development. The profits and losses are passed directly to the developer’s equity holders.
The deposit placed by NVR pursuant to the fixed price purchase agreement is deemed to be a variable interest in the respective development entities. Those development entities are deemed to be variable interest entities (“VIE”). Therefore, the development entities with which NVR enters fixed price purchase agreements, including the joint venture limited liability corporations, as discussed below, are evaluated for possible consolidation by NVR. An enterprise must consolidate a VIE when that enterprise has a controlling financial interest in the VIE. An enterprise is deemed to have a controlling financial interest if it has i) the power to direct the activities of a variable interest entity that most significantly impact the entity’s economic performance, and ii) the obligation to absorb losses of the VIE that could be significant to the VIE or the rights to receive benefits from the VIE that could be significant to the VIE.
NVR believes the activities that most significantly impact a development entity’s economic performance are the operating activities of the entity. Unless and until a development entity completes finished building lots through the development process to be
53
NVR, Inc.
Notes to Consolidated Financial Statements
(dollars and shares in thousands, except per share data)
able to sell, the process of which the development entities’ equity investors bear the full risk, the entity does not earn any revenues. The operating development activities are managed solely by the development entity’s equity investors.
The development entities with which NVR contracts to buy finished lots typically select the respective projects, obtain the necessary zoning approvals, obtain the financing required with no support or guarantees from NVR, select who will purchase the finished lots and at what price, and manage the completion of the infrastructure improvements, all for the purpose of generating a cash flow return to the development entity’s equity holders and all independent of NVR. The Company possesses no more than limited protective legal rights through the purchase agreement in the specific finished lots that it is purchasing, and NVR possesses no participative rights in the development entities. Accordingly, NVR does not have the power to direct the activities of a developer that most significantly impact the developer’s economic performance. For this reason, NVR has concluded that it is not the primary beneficiary of the development entities with which the Company enters fixed price purchase agreements, and therefore, NVR does not consolidate any of these VIEs.
As of December 31, 2014, NVR controlled approximately 62,800 lots through fixed price purchase agreements with deposits in cash and letters of credit totaling $348,400 and $1,700, respectively. As noted above, NVR’s sole legal obligation and economic loss for failure to perform under these purchase agreements is limited to the amount of the deposit pursuant to the liquidated damage provisions contained within the purchase agreements and in very limited circumstances, specific performance obligations. In addition, NVR has certain properties under contract with land owners that are expected to yield approximately 5,700 lots, which are not included in the number of total lots controlled. Some of these properties may require rezoning or other approvals to achieve the expected yield. These properties are controlled with deposits and letters of credit totaling approximately $2,300 and $3,000, respectively as of December 31, 2014, of which approximately $2,600 is refundable if NVR does not perform under the contract. NVR generally expects to assign the raw land contracts to a land developer and simultaneously enter into a lot purchase agreement with the assignee if the project is determined to be feasible. NVR’s total risk of loss related to contract land deposits as of December 31, 2014 and 2013 was as follows:
|
|
|
December 31, |
|
|||||
|
|
|
2014 |
|
|
2013 |
|
||
|
Contract land deposits |
|
$ |
350,750 |
|
|
$ |
296,646 |
|
|
Loss reserve on contract land deposits |
|
|
(56,074 |
) |
|
|
(59,761 |
) |
|
Contract land deposits, net |
|
|
294,676 |
|
|
|
236,885 |
|
|
Contingent obligations in the form of letters of credit |
|
|
4,674 |
|
|
|
2,459 |
|
|
Contingent specific performance obligations (1) |
|
|
1,505 |
|
|
|
1,707 |
|
|
Total risk of loss |
|
$ |
300,855 |
|
|
$ |
241,051 |
|
|
(1) |
At December 31, 2014 and 2013, the Company was committed to purchase 10 and 13 finished lots under specific performance obligations, respectively. |
|
4. |
Joint Ventures |
On a limited basis, NVR also obtains finished lots using joint venture limited liability corporations (“JVs”). The JVs are typically structured such that NVR is a non-controlling member and is at risk only for the amount the Company has invested, or committed to invest, in addition to any deposits placed under fixed price purchase agreements with the joint venture. NVR is not a borrower, guarantor or obligor on any debt of the JVs, as applicable. The Company enters into a standard fixed price purchase agreement to purchase lots from these JVs, and as a result has a variable interest in these JVs.
54
NVR, Inc.
Notes to Consolidated Financial Statements
(dollars and shares in thousands, except per share data)
At December 31, 2014, the Company had an aggregate investment totaling approximately $82,000 in five JVs that are expected to produce approximately 8,800 finished lots, of which approximately 3,300 were not under contract with NVR. In addition, NVR had additional funding commitments in the aggregate totaling $11,850 to two of the JVs at December 31, 2014. The Company has determined that it is not the primary beneficiary of four of the JVs because NVR and the other JV partner either share power or the other JV partner has the controlling financial interest. The aggregate investment in unconsolidated JVs was approximately $80,100 and $90,500 at December 31, 2014 and 2013, respectively, and is reported in the “Other assets” line item on the accompanying consolidated balance sheets. For the remaining JV, NVR has concluded that it is the primary beneficiary because the Company has the controlling financial interest in the JV.
The condensed balance sheets at December 31, 2014 and 2013 of the consolidated JV were as follows:
|
|
|
December 31, |
|
|||||
|
|
|
2014 |
|
|
2013 |
|
||
|
Cash |
|
$ |
481 |
|
|
$ |
668 |
|
|
Restricted cash |
|
|
160 |
|
|
|
248 |
|
|
Other assets |
|
|
332 |
|
|
|
542 |
|
|
Land under development |
|
|
2,617 |
|
|
|
5,810 |
|
|
Total assets |
|
$ |
3,590 |
|
|
$ |
7,268 |
|
|
Debt |
|
$ |
64 |
|
|
$ |
3,365 |
|
|
Accrued expenses |
|
|
1,231 |
|
|
|
862 |
|
|
Equity |
|
|
2,295 |
|
|
|
3,041 |
|
|
Total liabilities and equity |
|
$ |
3,590 |
|
|
$ |
7,268 |
|
During 2013, NVR invested an additional $11,000 in the Company’s existing JV with Morgan Stanley Real Estate Investing and $11,850 in a newly formed JV with an unrelated party. The newly formed JV is expected to produce approximately 1,300 lots with approximately 50% of those lots being sold to the Company. At December 31, 2013, the Company had an aggregate investment totaling approximately $92,700 in four JVs that were expected to produce approximately 9,300 finished lots, of which approximately 3,400 were not under contract with NVR. In addition, at December 31, 2013, NVR had additional funding commitments in the aggregate totaling $11,850 to two of the JVs.
Distributions received from the unconsolidated JVs are allocated between return of capital and distributions of earnings based on the ratio of capital contributed by NVR to the total expected returns for the respective JVs, and are classified within the accompanying consolidated statements of cash flows as cash flows from investing activities and operating activities, respectively.
|
5. |
Land Under Development |
As of December 31, 2014, NVR directly owned four separate raw parcels of land with a carrying value of $33,689 that it intends to develop into approximately 480 finished lots primarily for use in its homebuilding operations. Of the total finished lots, 94 lots are under contract to be sold to an unrelated party under lot purchase agreements. During 2014 and 2013, the Company sold 19 and 15 lots, respectively, to an unrelated party at an aggregate purchase price of approximately $3,100 and $2,600, respectively. The Company capitalizes interest costs to land under development during the active development of finished lots (see Note 6 for further discussion of capitalized interest). None of the raw parcels had any indicators of impairment as of December 31, 2014. Based on current market conditions, NVR may, on a limited basis, directly acquire additional raw parcels to develop into finished lots.
As of December 31, 2013, NVR directly owned five separate raw parcels of land with a carrying value of $41,328 and expected to produce approximately 650 finished lots.
|
6. |
Capitalized Interest |
The Company capitalizes interest costs to land under development during the active development of finished lots. In addition, the Company capitalizes interest costs to its joint venture investments while the investments are considered qualified assets pursuant to ASC 835-20, Interest. Capitalized interest is transferred to sold or unsold inventory as the development of finished lots is completed, then charged to cost of sales upon the Company’s settlement of homes and the respective lots. Interest incurred during the period in
55
NVR, Inc.
Notes to Consolidated Financial Statements
(dollars and shares in thousands, except per share data)
excess of the interest capitalizable based on the level of qualified assets is expensed in the period incurred. NVR’s interest costs incurred, capitalized, expensed and charged to cost of sales during the years ended December 31, 2014 and 2013 was as follows:
|
|
|
December 31, |
|
|||||
|
|
|
2014 |
|
|
2013 |
|
||
|
Interest capitalized, beginning of period |
|
$ |
3,294 |
|
|
$ |
893 |
|
|
Interest incurred |
|
|
24,994 |
|
|
|
25,048 |
|
|
Interest charged to interest expense |
|
|
(23,140 |
) |
|
|
(22,385 |
) |
|
Interest charged to cost of sales |
|
|
(1,076 |
) |
|
|
(262 |
) |
|
Interest capitalized, end of period |
|
$ |
4,072 |
|
|
$ |
3,294 |
|
|
7. |
Related Party Transactions |
During the year ended December 31, 2014, NVR entered into fixed price purchase agreements to purchase finished building lots for a total purchase price of approximately $40,800 with Elm Street Development, Inc. (“Elm Street”), which is controlled by one of the Company’s directors, William Moran. The independent members of the Company’s Board of Directors approved these transactions. During 2014, 2013 and 2012, NVR purchased developed lots at market prices from Elm Street for approximately $50,100, $38,400 and $54,600, respectively. The Company also continues to control a parcel of raw land expected to yield approximately 2,400 finished lots through a joint venture entered into with Elm Street during 2009. NVR did not make any additional capital contributions to that joint venture in 2014 or 2013. Further, during 2014, 2013 and 2012, the Company paid Elm Street $143 per year to manage the development of a property that the Company purchased from Elm Street in 2010.
|
8. |
Property, Plant and Equipment, net |
|
|
|
December 31, |
|
|||||
|
|
|
2014 |
|
|
2013 |
|
||
|
Homebuilding: |
|
|
|
|
|
|
|
|
|
Office facilities and other |
|
$ |
29,326 |
|
|
$ |
19,547 |
|
|
Model home furniture and fixtures |
|
|
28,945 |
|
|
|
22,432 |
|
|
Production facilities |
|
|
47,796 |
|
|
|
39,396 |
|
|
Property under capital leases |
|
|
— |
|
|
|
3,976 |
|
|
|
|
|
106,067 |
|
|
|
85,351 |
|
|
Less: accumulated depreciation |
|
|
(59,825 |
) |
|
|
(52,752 |
) |
|
|
|
$ |
46,242 |
|
|
$ |
32,599 |
|
|
Mortgage Banking: |
|
|
|
|
|
|
|
|
|
Office facilities and other |
|
$ |
10,508 |
|
|
$ |
8,118 |
|
|
Less: accumulated depreciation |
|
|
(4,319 |
) |
|
|
(3,419 |
) |
|
|
|
$ |
6,189 |
|
|
$ |
4,699 |
|
Certain property, plant and equipment listed above is collateral for certain debt of NVR as more fully described in Note 9 herein.
56
NVR, Inc.
Notes to Consolidated Financial Statements
(dollars and shares in thousands, except per share data)
|
9. |
Debt |
|
|
|
December 31, |
|
|||||
|
|
|
2014 |
|
|
2013 |
|
||
|
Homebuilding: |
|
|
|
|
|
|
|
|
|
Other term debt: |
|
|
|
|
|
|
|
|
|
Capital lease obligations due in monthly installments through 2014 (a) |
|
$ |
— |
|
|
$ |
115 |
|
|
Senior notes (b) |
|
$ |
599,166 |
|
|
$ |
599,075 |
|
|
|
|
|
|
|
|
|
|
|
|
Mortgage Banking: |
|
|
|
|
|
|
|
|
|
Master repurchase agreement (c) |
|
$ |
— |
|
|
$ |
— |
|
|
(a) |
The capital lease ended in March 2014. The capital lease obligation had a fixed interest rate of 13.0% and was collateralized by buildings and equipment with a net book value of approximately $47 at December 31, 2013. |
|
(b) |
On September 10, 2012, NVR completed an offering for $600,000 of Senior Notes under a shelf registration statement filed on September 5, 2012 with the Securities and Exchange Commission (the “SEC”). The Senior Notes were issued at a discount to yield 3.97% and have been reflected net of the unamortized discount in the accompanying consolidated balance sheet. The offering of the Senior Notes resulted in aggregate net proceeds of approximately $593,900, after deducting underwriting discounts and other offering expenses. The Senior Notes mature on September 15, 2022 and bear interest at 3.95%, payable semi-annually in arrears on March 15 and September 15. The Senior Notes are senior unsecured obligations and rank equally in right of payment with any of NVR’s existing and future unsecured senior indebtedness, will rank senior in right of payment to any of NVR’s future indebtedness that is by its terms expressly subordinated to the Senior Notes and will be effectively subordinated to any of NVR’s existing and future secured indebtedness to the extent of the value of the collateral securing such indebtedness. The indenture governing the Senior Notes has, among other items, and subject to certain exceptions, covenants that restrict the Company’s ability to create, incur, assume or guarantee secured debt, enter into sale and leaseback transactions and conditions related to mergers and/or the sale of assets. |
|
(c) |
On July 30, 2014, NVRM renewed and amended its revolving mortgage repurchase agreement with U.S. Bank National Association (the “Repurchase Agreement”). The purpose of the Repurchase Agreement is to finance the origination of mortgage loans by NVRM. The Repurchase Agreement provides for loan purchases up to $25,000, subject to certain sub limits. The Repurchase Agreement expires on July 29, 2015. |
|
|
Advances under the Repurchase Agreement carry a Pricing Rate based on the LIBOR Rate plus the LIBOR Margin, as determined under the Repurchase Agreement, provided that the Pricing Rate shall not be less than 2.825%. There are several restrictions on purchased loans, including that they cannot be sold to others, they cannot be pledged to anyone other than the agent, and they cannot support any other borrowing or repurchase agreement. As of December 31, 2014 and 2013, there was no debt outstanding under the Repurchase Agreement. There were no borrowing base limitations at December 31, 2014. |
|
|
The Repurchase Agreement contains various affirmative and negative covenants. The negative covenants include, among others, certain limitations on transactions involving acquisitions, mergers, the incurrence of debt, sale of assets and creation of liens upon any of its Mortgage Notes. Additional covenants include (i) a tangible net worth requirement, (ii) a minimum liquidity requirement, (iii) a minimum net income requirement, and (iv) a maximum leverage ratio requirement. The Company was in compliance with all covenants under the Repurchase Agreement at December 31, 2014. |
|
10. |
Common Stock |
There were approximately 4,049 and 4,434 common shares outstanding at December 31, 2014 and 2013, respectively. As of December 31, 2014, NVR had reacquired a total of approximately 23,800 shares of NVR common stock at an aggregate cost of approximately $5,876,000 since December 31, 1993.
The Company made the following share repurchases during the years indicated:
57
NVR, Inc.
Notes to Consolidated Financial Statements
(dollars and shares in thousands, except per share data)
|
|
|
Year Ended December 31, |
|
|||||||||
|
|
|
2014 |
|
|
2013 |
|
|
2012 |
|
|||
|
Aggregate Purchase Price |
|
$ |
567,544 |
|
|
$ |
554,491 |
|
|
$ |
227,281 |
|
|
Number of Shares Repurchased |
|
|
508 |
|
|
|
581 |
|
|
|
286 |
|
Since 1999, the Company has issued shares from the treasury for all stock option exercises. There have been approximately 7,287 shares reissued from the treasury in satisfaction of stock option exercises, vesting of restricted share units and other employee benefit obligations. The Company issued 123, 102 and 222 such shares during 2014, 2013 and 2012, respectively.
|
11. |
Income Taxes |
The provision for income taxes consists of the following:
|
|
|
Year Ended December 31, |
|
|||||||||
|
|
|
2014 |
|
|
2013 |
|
|
2012 |
|
|||
|
Current: |
|
|
|
|
|
|
|
|
|
|
|
|
|
Federal |
|
$ |
148,221 |
|
|
$ |
137,675 |
|
|
$ |
76,599 |
|
|
State |
|
|
28,881 |
|
|
|
30,352 |
|
|
|
3,066 |
|
|
Deferred: |
|
|
|
|
|
|
|
|
|
|
|
|
|
Federal |
|
|
(4,451 |
) |
|
|
(13,402 |
) |
|
|
13,086 |
|
|
State |
|
|
(735 |
) |
|
|
(2,406 |
) |
|
|
1,738 |
|
|
|
|
$ |
171,916 |
|
|
$ |
152,219 |
|
|
$ |
94,489 |
|
In addition to amounts applicable to income before taxes, the following income tax benefits were recorded in shareholders’ equity:
|
|
|
Year Ended December 31, |
|
|||||||||
|
|
|
2014 |
|
|
2013 |
|
|
2012 |
|
|||
|
Income tax benefits arising from compensation expense for tax purposes in excess of amounts recognized for financial statement purposes |
|
$ |
9,437 |
|
|
$ |
20,636 |
|
|
$ |
14,319 |
|
Deferred income taxes on NVR’s consolidated balance sheets were comprised of the following:
|
|
|
December 31, |
|
|||||
|
|
|
2014 |
|
|
2013 |
|
||
|
Deferred tax assets: |
|
|
|
|
|
|
|
|
|
Other accrued expenses and contract land deposit reserve |
|
$ |
84,817 |
|
|
$ |
90,372 |
|
|
Deferred compensation |
|
|
7,500 |
|
|
|
8,049 |
|
|
Equity-based compensation expense |
|
|
46,257 |
|
|
|
35,298 |
|
|
Inventory |
|
|
11,153 |
|
|
|
11,099 |
|
|
Unrecognized tax benefit |
|
|
24,485 |
|
|
|
23,784 |
|
|
Other |
|
|
5,847 |
|
|
|
4,200 |
|
|
Total deferred tax assets |
|
|
180,059 |
|
|
|
172,802 |
|
|
Less: deferred tax liabilities |
|
|
7,371 |
|
|
|
4,290 |
|
|
Net deferred tax position |
|
$ |
172,688 |
|
|
$ |
168,512 |
|
Deferred tax assets arise principally as a result of various accruals required for financial reporting purposes and equity-based compensation expense, which are not currently deductible for tax return purposes.
58
NVR, Inc.
Notes to Consolidated Financial Statements
(dollars and shares in thousands, except per share data)
Management believes that the Company will have sufficient available carry-backs and future taxable income to make it more likely than not that the net deferred tax assets will be realized. Federal taxable income is estimated to be approximately $388,000 for the year ended December 31, 2014, and was $362,978 for the year ended December 31, 2013.
A reconciliation of income tax expense in the accompanying consolidated statements of income to the amount computed by applying the statutory federal income tax rate of 35% to income before taxes is as follows:
|
|
|
Year Ended December 31, |
|
|||||||||
|
|
|
2014 |
|
|
2013 |
|
|
2012 |
|
|||
|
Income taxes computed at the federal statutory rate |
|
$ |
158,741 |
|
|
$ |
146,544 |
|
|
$ |
96,277 |
|
|
State income taxes, net of federal income tax benefit |
|
|
18,800 |
|
|
|
18,210 |
|
|
|
3,226 |
|
|
Other, net |
|
|
(5,625 |
) |
|
|
(12,535 |
) |
|
|
(5,014 |
) |
|
|
|
$ |
171,916 |
|
|
$ |
152,219 |
|
|
$ |
94,489 |
|
The Company’s effective tax rate in 2014, 2013 and 2012 was 37.90%, 36.36% and 34.35%, respectively. During 2014, the Company recognized income tax expense of approximately $7,000 due to the reversal of certain previously recognized tax deductions. During 2012, the Company reduced its provision for unrecognized tax benefits by $9,154, which reduced the 2012 effective tax rate. The reduction resulted from settlements with, and an audit by, certain taxing authorities during 2012 which led the Company to update its evaluation of the administrative practice in other states for similar uncertain tax positions to determine whether the positions taken in those states were effectively settled.
The Company files a consolidated U.S. federal income tax return, as well as state and local tax returns in all jurisdictions where the Company maintains operations. With few exceptions, the Company is no longer subject to income tax examinations by tax authorities for years prior to 2011.
A reconciliation of the beginning and ending amount of unrecognized tax benefits is as follows:
|
|
|
Year Ended December 31, |
|
|||||
|
|
|
2014 |
|
|
2013 |
|
||
|
Balance at beginning of year |
|
$ |
43,796 |
|
|
$ |
40,244 |
|
|
Additions based on tax positions related to the current year |
|
|
6,008 |
|
|
|
5,618 |
|
|
Reductions for tax positions of prior years |
|
|
(3,800 |
) |
|
|
(2,066 |
) |
|
Settlements |
|
|
— |
|
|
|
— |
|
|
Balance at end of year |
|
$ |
46,004 |
|
|
$ |
43,796 |
|
If recognized, the total amount of unrecognized tax benefits that would affect the effective tax rate (net of the federal tax benefit) is $29,902 as of December 31, 2014.
The Company recognizes interest related to unrecognized tax benefits as a component of income tax expense. For the year ended December 31, 2014, the Company recognized a net reversal of accrued interest on unrecognized tax benefits in the amount of $184. For the year ended December 31, 2013, the Company had a net addition to accrued interest on unrecognized tax benefits in the amount of $625. For the year ended December 31, 2012, the Company recognized a net reversal of accrued interest on unrecognized tax benefits in the amount of $4,116. As of December 31, 2014 and 2013, the Company had a total of $21,096 and $21,281, respectively, of accrued interest on unrecognized tax benefits which are included in “Accrued expenses and other liabilities” on the accompanying consolidated balance sheets. Based on its historical experience in dealing with various taxing authorities, the Company has found that it is the administrative practice of these authorities to not seek penalties from the Company for the tax positions it has taken on its returns, related to its unrecognized tax benefits. Therefore, the Company does not accrue penalties for the positions in which it has an unrecognized tax benefit. However, if such penalties were to be accrued, they would be recorded as a component of income tax expense.
The Company believes that within the next 12 months, it is reasonably possible that the unrecognized tax benefits as of December 31, 2014 will be reduced by approximately $6,339 due to statute expiration and effectively settled positions in various state jurisdictions. The Company is currently under audit by the state of Pennsylvania.
59
NVR, Inc.
Notes to Consolidated Financial Statements
(dollars and shares in thousands, except per share data)
|
12. |
Equity-Based Compensation, Profit Sharing and Deferred Compensation Plans |
Equity-Based Compensation Plans
NVR’s equity-based compensation plans provide for the granting of non-qualified stock options to purchase shares of NVR common stock (“Options”) and restricted share units (“RSUs”) to key management employees, including executive officers and Board members, of the Company. The exercise price of Options granted is equal to the closing price of the Company’s common stock on the New York Stock Exchange (the “NYSE”) on the day prior to the date of grant, and RSUs are issued at a $0 exercise price. Options are granted for a ten-year term and typically vest in separate tranches over periods of 3 to 6 years. The vesting for certain Options is contingent solely on continued employment or service as a Director, while vesting for other Options is contingent upon both continued employment or service as a Director and the achievement of a performance metric as discussed further in the summary description of the 2014 Plan below. RSUs generally vest in separate tranches over periods of 2 to 3 years, based solely on continued employment or continued service as a Director. At December 31, 2014, there was an aggregate of 1,201 options and 55 RSUs outstanding, and there were an additional 362 available shares to be granted under existing equity-based compensation plans. Of the available shares to be granted, up to 33 shares may be granted in the form of RSUs.
The following is a summary description of each of the Company’s equity-based compensation plans for any plan with grants outstanding at December 31, 2014:
|
● |
During 1999, the Company’s shareholders approved the 1998 Management Long-Term Stock Option Plan (the “1998 Option Plan”). There were 1,000 Options authorized under the 1998 Option Plan. All Options were granted at an exercise price equal to the closing price of the Company’s common stock on the NYSE on the day prior to the date of grant. The Options expire 10 years after the dates upon which they were granted, and were fully vested as of December 31, 2013. There are no grants remaining available to issue under the 1998 Option Plan. |
|
● |
During 1999, the Company’s shareholders approved the 1998 Directors’ Long Term Stock Option Plan (the “1998 Directors’ Plan”). There were 150 Options to purchase shares of common stock authorized for grant to the Company’s outside directors under the 1998 Directors’ Plan. All Options were granted at an exercise price equal to the closing price of the Company’s common stock on the NYSE on the day prior to the date of grant. The outstanding Options were granted for a 10-year term and were fully vested as of December 31, 2012. There are no grants remaining available to issue under the 1998 Directors’ Plan. |
|
● |
During 2000, the Board approved the 2000 Broadly-Based Stock Option Plan (the “2000 Plan”). The Company did not seek approval from its shareholders for the 2000 Plan. There were 2,000 Options authorized under the 2000 Plan. All Options were granted at an exercise price equal to the closing price of the Company’s common stock on the NYSE on the day prior to the date of grant. Grants under the 2000 Plan were available to both employees and members of the Board. Options granted under the 2000 Plan expire 10 years from the date of grant, and generally vest annually in 25% increments based on the date of grant. There are no grants remaining available to issue under the 2000 Plan. |
|
● |
During 2010, the Company’s shareholders approved the 2010 Equity Incentive Plan (the “2010 Plan”). The 2010 Plan authorizes the Company to issue Options and RSUs to key management employees, including executive officers and Board members, to acquire up to an aggregate of 700 shares of the Company’s common stock. Of the 700 aggregate shares available to issue, up to 240 may be granted in the form of RSUs. All Options are granted at an exercise price equal to the closing price of the Company’s common stock on the NYSE on the day prior to the date of grant, and all RSUs are granted at a $0 exercise price. The Options are granted for a 10-year term. The RSUs and Options initially granted under the 2010 Plan each vested annually in 50% increments beginning December 31, 2011 and December 31, 2013, respectively. At December 31, 2014, there were 41 shares available to be granted under the 2010 Plan, of which 33 may be granted as RSUs. |
|
● |
During 2014, the Company’s shareholders approved the NVR, Inc. 2014 Equity Incentive Plan (the “2014 Plan”). The 2014 Plan authorizes the Company to issue Options to key management employees, including executive officers and Board members, to acquire up to an aggregate 950 shares of the Company’s common stock. Option grants under the 2014 Plan are generally divided such that vesting for 50% of the Option grant is solely contingent upon continued employment or continued service as a Director, while vesting for the remaining 50% of the Option grant is contingent upon both continued employment or service as a Director and the achievement of a performance metric based on the Company’s return on capital performance during 2014 through 2016. Options granted under the 2014 Plan generally vest annually over four years in 25% increments beginning on December 31, 2016. All Options are granted at an exercise price equal to |
60
NVR, Inc.
Notes to Consolidated Financial Statements
(dollars and shares in thousands, except per share data)
|
the closing price of the Company’s common stock on the NYSE on the day prior to the date of grant. The Options are granted for a 10-year term. At December 31, 2014, there were 321 shares available to be granted under the 2014 Plan. |
During 2014, the Company issued 634 Options under the 2014 Plan. The Options were granted at an exercise price equal to the closing price of the Company’s common stock on the day prior to the date of grant. Substantially all of the Options granted in 2014 will vest annually over four years in 25% increments beginning on December 31, 2016. Vesting for 338 of the Options granted is contingent both upon continued employment or continued service as a director and the Company’s return on capital performance during the years 2014 through 2016. Vesting for the other 296 Options granted under the 2014 Plan is contingent solely upon continued employment or continued service as a director. The Options expire ten years from the date of grant.
During 2014, the Company also issued 49 Options under the 2010 Plan. The Options were granted at an exercise price equal to the closing price of the Company’s common stock on the day prior to the date of grant. Substantially all of the 2010 Plan Options granted during 2014 under the 2010 Plan will vest annually over four years in 25% increments beginning on December 31, 2016. The vesting for the Options granted under the 2010 Plan is based solely on continued employment. The Options expire ten years from the date of grant.
The Company also issued 16 RSUs from the 2010 Plan during 2014. Each RSU was granted at a $0 exercise price. The RSUs vest in 33% increments on December 31, 2016, 2017 and 2018, based solely on continued employment.
The following table provides additional information relative to NVR’s equity-based compensation plans for the year ended December 31, 2014:
|
|
|
Shares |
|
|
Weighted Avg. Per Share Exercise Price |
|
|
Weighted Avg. Remaining Contract Life (years) |
|
|
Aggregate Intrinsic Value |
|
||||
|
Stock Options |
|
|
|
|
|
|
|
|
|
|
|
|
|
|
|
|
|
Outstanding at December 31, 2013 |
|
|
667 |
|
|
$ |
740.18 |
|
|
|
|
|
|
|
|
|
|
Granted |
|
|
683 |
|
|
|
1,095.69 |
|
|
|
|
|
|
|
|
|
|
Exercised |
|
|
(118 |
) |
|
|
644.60 |
|
|
|
|
|
|
|
|
|
|
Forfeited |
|
|
(31 |
) |
|
|
910.36 |
|
|
|
|
|
|
|
|
|
|
Outstanding at December 31, 2014 |
|
|
1,201 |
|
|
$ |
947.39 |
|
|
|
7.9 |
|
|
$ |
393,866 |
|
|
Exercisable at December 31, 2014 |
|
|
346 |
|
|
$ |
676.37 |
|
|
|
5.1 |
|
|
$ |
207,487 |
|
|
|
|
|
|
|
|
|
|
|
|
|
|
|
|
|
|
|
|
RSUs (1) |
|
|
|
|
|
|
|
|
|
|
|
|
|
|
|
|
|
Outstanding at December 31, 2013 |
|
|
45 |
|
|
|
|
|
|
|
|
|
|
|
|
|
|
Granted |
|
|
16 |
|
|
|
|
|
|
|
|
|
|
|
|
|
|
Vested |
|
|
(5 |
) |
|
|
|
|
|
|
|
|
|
|
|
|
|
Forfeited |
|
|
(1 |
) |
|
|
|
|
|
|
|
|
|
|
|
|
|
Outstanding at December 31, 2014 |
|
|
55 |
|
|
|
|
|
|
|
|
|
|
$ |
70,773 |
|
|
Vested, but not issued at December 31, 2014 |
|
|
2 |
|
|
|
|
|
|
|
|
|
|
$ |
2,713 |
|
|
(1) |
RSU grants were issued at a $0 exercise price. |
To estimate the grant-date fair value of its Options, the Company uses the Black-Scholes option-pricing model (the “Pricing Model”). The Pricing Model estimates the per share fair value of an option on its date of grant based on the following factors: the option’s exercise price; the price of the underlying stock on the date of grant; the estimated dividend yield; a risk-free interest rate; the estimated option term; and the expected volatility. For the risk-free interest rate, the Company uses U.S. Treasury STRIPS which mature at approximately the same time as the option’s expected holding term. For expected volatility, NVR has concluded that its historical volatility over the option’s expected holding term provides the most reasonable basis for this estimate. The fair value of the Options granted during 2014, 2013 and 2012 was estimated on the grant date using the Pricing Model, based on the following assumptions:
61
NVR, Inc.
Notes to Consolidated Financial Statements
(dollars and shares in thousands, except per share data)
|
|
|
2014 |
|
|
2013 |
|
|
2012 |
|
|||
|
Estimated option life |
|
5.16 years |
|
|
5.20 years |
|
|
4.95 years |
|
|||
|
Risk free interest rate (range) |
|
1.06%-2.49% |
|
|
0.42%-2.10% |
|
|
0.35%-1.84% |
|
|||
|
Expected volatility (range) |
|
18.26%-30.57% |
|
|
17.98%-32.72% |
|
|
17.71%-34.43% |
|
|||
|
Expected dividend rate |
|
|
0.00% |
|
|
|
0.00% |
|
|
|
0.00% |
|
|
Weighted average grant-date fair value per share of options granted |
|
$ |
267.66 |
|
|
$ |
268.13 |
|
|
$ |
221.45 |
|
In accordance with ASC 718, Compensation – Stock Compensation, the fair value of the RSUs is measured as if they were vested and issued on the grant date. Additionally, under ASC 718, service-only restrictions on vesting of RSUs are not reflected in the fair value calculation at the grant date. As a result, the fair value of the RSUs was the closing price of the Company’s common stock on the day immediately preceding the date of grant. The weighted average fair value of the RSUs granted in the current year was $1,153.41 per share.
Compensation cost for Options and RSUs is recognized on a straight-line basis over the requisite service period for the entire award (from the date of grant through the period of the last separately vesting portion of the grant). For the recognition of equity-based compensation, the RSUs are treated as a separate award from the Options. Additionally, the Options which are subject to a performance condition are treated as a separate award from the “service-only” Options, and compensation expense is recognized when it becomes probable that the stated performance target will be achieved. The Company currently believes that it is probable that the performance condition will be satisfied at the target level and is recognizing compensation expense related to such Options accordingly. Compensation cost is recognized within the income statement in the same expense line as the cash compensation paid to the respective employees. ASC 718 also requires the Company to estimate forfeitures in calculating the expense related to equity-based compensation and requires that the compensation costs of equity-based awards be recognized net of estimated forfeitures. The impact on compensation costs due to changes in the expected forfeiture rate will be recognized in the period that they become known. In 2014, 2013 and 2012, the Company recognized approximately $63,227, $34,296, and $64,841 in equity-based compensation costs, respectively, and approximately $22,900, $12,100, and $23,900 in tax benefit related to equity-based compensation costs, respectively. In 2013, the Company reversed approximately $7,900 in equity-based compensation expense previously recorded to adjust stock option forfeiture rates based on actual forfeiture experience. The reversal was made to the accounts originally charged as follows; approximately $7,100 and $300 from homebuilding general and administrative and cost of sales expense, respectively, and approximately $500 from NVRM general and administrative expense.
As of December 31, 2014, the total unrecognized compensation cost for all outstanding Options and RSUs equaled approximately $195,400, net of estimated forfeitures. The unrecognized compensation cost will be recognized over each grant’s applicable vesting period with the latest vesting date being December 31, 2020. The weighted-average period over which the unrecognized compensation will be recorded is equal to approximately 2.7 years.
The Company settles Option exercises and vesting of RSUs by issuing shares of treasury stock to Option holders. Shares are relieved from the treasury account based on the weighted average cost of treasury shares acquired. During the years ended December 31, 2014, 2013 and 2012, the Company issued 123, 102 and 222 shares, respectively, from the treasury account for Option exercises and vesting of RSUs. Information with respect to the vested RSUs and exercised Options is as follows:
|
|
|
Year Ended December 31, |
|
|||||||||
|
|
|
2014 |
|
|
2013 |
|
|
2012 |
|
|||
|
Aggregate exercise proceeds (1) |
|
$ |
76,153 |
|
|
$ |
14,834 |
|
|
$ |
73,211 |
|
|
Aggregate intrinsic value on exercise dates |
|
$ |
62,136 |
|
|
$ |
84,908 |
|
|
$ |
101,334 |
|
|
(1) |
Aggregate exercise proceeds include the Option exercise price received in cash or the fair market value of NVR stock surrendered by the optionee in lieu of cash. |
Profit Sharing Plans
NVR has a trustee-administered, profit sharing retirement plan (the “Profit Sharing Plan”) and an Employee Stock Ownership Plan (“ESOP”) covering substantially all employees. The Profit Sharing Plan and the ESOP provide for annual discretionary contributions in amounts as determined by the NVR Board of Directors. The combined plan contribution for the years ended
62
NVR, Inc.
Notes to Consolidated Financial Statements
(dollars and shares in thousands, except per share data)
December 31, 2014, 2013 and 2012 was $16,980, $12,012 and $9,575, respectively. The ESOP purchased approximately 14 and 10 shares of NVR common stock in the open market for the 2014 and 2013 plan year contributions, respectively, using cash contributions provided by the Company. As of December 31, 2014, all shares held by the ESOP had been allocated to participants’ accounts. The 2014 plan year contribution was funded and fully allocated to participants in February 2015.
Deferred Compensation Plans
The Company has two deferred compensation plans (“Deferred Comp Plans”). The specific purpose of the Deferred Comp Plans is to i) establish a vehicle whereby named executive officers may defer the receipt of salary and bonus that otherwise would be nondeductible for Company tax purposes into a period where the Company would realize a tax deduction for the amounts paid, and ii) to enable certain employees who are subject to the Company’s stock holding requirements to acquire shares of the Company’s common stock on a pre-tax basis in order to more quickly meet, and maintain compliance with those stock holding requirements. Amounts deferred into the Deferred Comp Plans are invested in NVR common stock, held in a rabbi trust account, and are paid out in a fixed number of shares upon expiration of the deferral period.
The rabbi trust account held 109 shares of NVR common stock as of both December 31, 2014 and 2013. During 2013, 43 shares of NVR common stock were issued from the rabbi trust related to deferred compensation for which the deferral period ended. There were no shares of NVR common stock contributed to the rabbi trust in 2014 or 2013. Shares held by the Deferred Comp Plans are treated as outstanding shares in the Company’s earnings per share calculation for each of the years ended December 31, 2014, 2013 and 2012.
|
13. |
Commitments and Contingent Liabilities |
NVR is committed under multiple non-cancelable operating leases involving office space, model homes, production facilities, automobiles and equipment. Future minimum lease payments under these operating leases as of December 31, 2014 are as follows:
|
Year Ending December 31, |
|
|
|
|
|
2015 |
|
$ |
24,012 |
|
|
2016 |
|
|
17,352 |
|
|
2017 |
|
|
15,024 |
|
|
2018 |
|
|
11,654 |
|
|
2019 |
|
|
11,155 |
|
|
Thereafter |
|
|
28,092 |
|
|
|
|
|
107,289 |
|
|
Sublease income |
|
|
(282 |
) |
|
|
|
$ |
107,007 |
|
Total rent expense incurred under operating leases was $45,508, $39,608 and $33,399 for the years ended December 31, 2014, 2013 and 2012, respectively.
The Company generally does not engage in the land development business. Instead, the Company typically acquires finished building lots at market prices from various development entities under fixed price purchase agreements. The purchase agreements require deposits that may be forfeited if the Company fails to perform under the agreement. The deposits required under the purchase agreements are in the form of cash or letters of credit in varying amounts, and typically range up to 10% of the aggregate purchase price of the finished lots. The Company believes this lot acquisition strategy reduces the financial requirements and risks associated with direct land ownership and land development. The Company generally seeks to maintain control over a supply of lots believed to be suitable to meet its five-year business plan. At December 31, 2014, assuming that contractual development milestones are met, the Company is committed to placing additional forfeitable deposits with land developers under existing lot option contracts of approximately $75,200. The Company also has one specific performance contract pursuant to which the Company is committed to purchase 10 finished lots at an aggregate purchase price of approximately $1,500.
During the ordinary course of operating the homebuilding and mortgage banking businesses, the Company is required to enter into bond or letter of credit arrangements with local municipalities, government agencies, or land developers to collateralize its obligations under various contracts. The Company had approximately $59,400 of contingent obligations under such agreements,
63
NVR, Inc.
Notes to Consolidated Financial Statements
(dollars and shares in thousands, except per share data)
including approximately $11,400 for letters of credit issued under an uncommitted, collateralized letter of credit facility as of December 31, 2014. The Company believes it will fulfill its obligations under the related contracts and does not anticipate any material losses under these bonds or letters of credit.
The following table reflects the changes in the Company’s warranty reserve (see Note 1 herein for further discussion of warranty/product liability reserves):
|
|
|
Year Ended December 31, |
|
|||||||||
|
|
|
2014 |
|
|
2013 |
|
|
2012 |
|
|||
|
Warranty reserve, beginning of year |
|
$ |
101,507 |
|
|
$ |
62,742 |
|
|
$ |
64,008 |
|
|
Provision |
|
|
51,668 |
|
|
|
82,860 |
|
|
|
41,138 |
|
|
Payments |
|
|
(59,115 |
) |
|
|
(44,095 |
) |
|
|
(42,404 |
) |
|
Warranty reserve, end of year |
|
$ |
94,060 |
|
|
$ |
101,507 |
|
|
$ |
62,742 |
|
The warranty reserve provision for 2013 included two warranty accrual charges totaling approximately $31,600. The first charge of approximately $15,600 related to remediation of primarily water infiltration issues in a single completed community. The second charge of approximately $16,000 was recorded to increase the warranty accrual for a non-recurring service issue.
In October 2004, Patrick Tracy, whom NVR had employed as a Sales and Marketing Representative (“SMR”), filed a lawsuit against the Company in the U.S. District Court for the Western District of New York alleging that NVR had misclassified him and other SMRs as outside sales personnel exempt from certain state and federal wage laws, including overtime pay requirements. Mr. Tracy’s attorneys subsequently filed several other lawsuits in various courts asserting substantially similar claims on behalf of various classes or groups of SMRs. None of those courts have held that the claims are appropriate for class, collective, or other group treatment, and the Western District of New York ruled in April 2013 that the claims in Mr. Tracy’s case could not proceed on such a basis. The Western District of New York reached the same conclusion in July 2014 regarding a separate case that Mr. Tracy’s attorneys brought on behalf of other SMRs.
In October 2013, Mr. Tracy’s individual claims were tried by a jury, which returned a unanimous verdict in NVR’s favor and found that the Company had properly classified Mr. Tracy as an exempt outside sales person. The plaintiff has sought review in the U.S. Court of Appeals for the Second Circuit, in which he challenges the legal standard that the trial court applied in crafting its jury instructions regarding the outside sales exemption, in addition to rulings that the trial court made at earlier stages of the case. That appeal is fully briefed, and the parties are awaiting a ruling or an oral argument date. The remainder of the cases noted above are in various stages of pre-trial proceedings, many of them stayed or administratively closed pending a final disposition of the Tracy action.
The Company believes that the compensation practices in regard to SMRs are entirely lawful and have vigorously defended all claims challenging those practices. In light of the points noted above, the Company has not recorded any associated liabilities on the accompanying consolidated balance sheets in conjunction with any of those claims.
In June 2010, the Company received a Request for Information from the United States Environmental Protection Agency (“EPA”) pursuant to Section 308 of the Clean Water Act. The request sought information about storm water discharge practices in connection with homebuilding projects completed or underway by the Company in New York and New Jersey. The Company cooperated with this request, and provided information to the EPA. The Company was subsequently informed by the United States Department of Justice (“DOJ”) that the EPA forwarded the information on the matter to the DOJ, and the DOJ requested that the Company meet with the government to discuss the status of the case. Meetings took place in January 2012, August 2012 and November 2014 with representatives from both the EPA and DOJ. The Company has continued discussions with the EPA and DOJ. It is as yet unclear what next steps the DOJ will take in the matter. The Company intends to continue cooperating with any future EPA and/or DOJ inquiries. At this time, the Company cannot predict the outcome of this inquiry, nor can it reasonably estimate the potential costs that may be associated with its eventual resolution.
The Company and its subsidiaries are also involved in various other litigation arising in the ordinary course of business. In the opinion of management, and based on advice of legal counsel, this litigation is not expected to have a material adverse effect on the financial position, results of operations or cash flows of the Company. Legal costs incurred in connection with outstanding litigation are expensed as incurred.
64
NVR, Inc.
Notes to Consolidated Financial Statements
(dollars and shares in thousands, except per share data)
|
14. |
Fair Value |
Financial Instruments
The estimated fair value of NVR’s Senior Notes as of December 31, 2014 was $622,800. The estimated fair value is based on recent market prices of similar transactions, which is classified as Level 2 within the fair value hierarchy. The carrying value was $599,166 at December 31, 2014. Except as otherwise noted below, NVR believes that insignificant differences exist between the carrying value and the fair value of its financial instruments, which consists primarily of cash equivalents, due to their short term nature.
Derivative Instruments and Mortgage Loans Held for Sale
In the normal course of business, NVRM enters into contractual commitments to extend credit to buyers of single-family homes with fixed expiration dates. The commitments become effective when the borrowers “lock-in” a specified interest rate within time frames established by NVRM. All mortgagors are evaluated for credit worthiness prior to the extension of the commitment. Market risk arises if interest rates move adversely between the time of the “lock-in” of rates by the borrower and the sale date of the loan to a broker/dealer. To mitigate the effect of the interest rate risk inherent in providing rate lock commitments to borrowers, NVRM enters into optional or mandatory delivery forward sale contracts to sell whole loans and mortgage-backed securities to broker/dealers. The forward sale contracts lock in an interest rate and price for the sale of loans similar to the specific rate lock commitments. NVRM does not engage in speculative or trading derivative activities. Both the rate lock commitments to borrowers and the forward sale contracts to broker/dealers are undesignated derivatives and, accordingly, are marked to fair value through earnings. At December 31, 2014, there were contractual commitments to extend credit to borrowers aggregating $237,989 and open forward delivery contracts aggregating $424,966, which hedge both the rate lock loan commitments and closed loans held for sale.
GAAP assigns a fair value hierarchy to the inputs used to measure fair value. Level 1 inputs are quoted prices in active markets for identical assets and liabilities. Level 2 inputs are inputs other than quoted market prices that are observable for the asset or liability, either directly or indirectly. Level 3 inputs are unobservable inputs. The fair value of the Company’s rate lock commitments to borrowers and the related input levels includes, as applicable:
|
i) |
the assumed gain/loss of the expected resultant loan sale (Level 2); |
|
ii) |
the effects of interest rate movements between the date of the rate lock and the balance sheet date (Level 2); and |
|
iii) |
the value of the servicing rights associated with the loan (Level 2). |
The assumed gain/loss considers the amount, if any, that NVRM has discounted the price to the borrower from par for competitive reasons and the excess servicing to be received or buydown fees to be paid upon securitization of the loan. The excess servicing and buydown fees are calculated pursuant to contractual terms with investors. To calculate the effects of interest rate movements, NVRM utilizes applicable published mortgage-backed security prices, and multiplies the price movement between the rate lock date and the balance sheet date by the notional loan commitment amount. NVRM sells all of its loans on a servicing released basis, and receives a servicing released premium upon sale. Thus, the value of the servicing rights, which averaged 114 basis points of the loan amount as of December 31, 2014, is included in the fair value measurement and is based upon contractual terms with investors and varies depending on the loan type. NVRM assumes an approximate 11% fallout rate when measuring the fair value of rate lock commitments. Fallout is defined as locked loan commitments for which NVRM does not close a mortgage loan and is based on historical experience.
The fair value of NVRM’s forward sales contracts to broker/dealers solely considers the market price movement of the same type of security between the trade date and the balance sheet date (Level 2). The market price changes are multiplied by the notional amount of the forward sales contracts to measure the fair value.
Mortgage loans held for sale are recorded at fair value when closed, and thereafter are carried at the lower of cost or fair value, net of deferred origination costs, until sold. Fair value is measured using Level 2 inputs. The fair value of loans held for sale of $205,664 included on the accompanying consolidated balance sheet has been increased by $2,359 from the aggregate principal balance of $203,305.
65
NVR, Inc.
Notes to Consolidated Financial Statements
(dollars and shares in thousands, except per share data)
The undesignated derivative instruments are included on the accompanying consolidated balance sheet, as of December 31, 2014, as follows:
|
|
|
Balance Sheet Location |
|
Fair Value |
|
|
|
Derivative Assets: |
|
|
|
|
|
|
|
Rate lock commitments |
|
NVRM - Other assets |
|
$ |
2,374 |
|
|
Derivative Liabilities: |
|
|
|
|
|
|
|
Forward sales contracts |
|
NVRM - Accounts payable and other liabilities |
|
$ |
909 |
|
The fair value measurement as of December 31, 2014 was as follows:
|
|
|
Notional or Principal Amount |
|
|
Assumed Gain/(Loss) From Loan Sale |
|
|
Interest Rate Movement Effect |
|
|
Servicing Rights Value |
|
|
Security Price Change |
|
|
Total Fair Value Measurement Gain/(Loss) |
|
||||||
|
Rate lock commitments |
|
$ |
237,989 |
|
|
$ |
(602 |
) |
|
$ |
559 |
|
|
$ |
2,417 |
|
|
$ |
— |
|
|
$ |
2,374 |
|
|
Forward sales contracts |
|
$ |
424,966 |
|
|
|
— |
|
|
|
— |
|
|
|
— |
|
|
|
(909 |
) |
|
|
(909 |
) |
|
Mortgages held for sale |
|
$ |
203,305 |
|
|
|
(354 |
) |
|
|
423 |
|
|
|
2,290 |
|
|
|
— |
|
|
|
2,359 |
|
|
Total Fair Value Measurement |
|
|
|
|
|
$ |
(956 |
) |
|
$ |
982 |
|
|
$ |
4,707 |
|
|
$ |
(909 |
) |
|
$ |
3,824 |
|
For the years ended December 31, 2014 and 2013, NVRM recorded a fair value adjustment to income of $3,305 and $3,021, respectively. For the year ended December 31, 2012 NVRM recorded a fair value adjustment to expense of $2,431. Unrealized gains/losses from the change in the fair value measurements are included in earnings as a component of mortgage banking fees in the accompanying condensed consolidated statements of income. The fair value measurement will be impacted in the future by the change in the value of the servicing rights, interest rate movements, security price fluctuations, and the volume and product mix of NVRM’s closed loans and locked loan commitments.
|
15. |
Mortgage Loan Loss Allowance |
During the years ended December 31, 2014, 2013 and 2012, the Company recognized pre-tax charges for loan losses related to mortgage loans sold of approximately $2,400, $2,300 and $1,300, respectively. Included in the Mortgage Banking segment’s “Accounts payable and other liabilities” line item on the accompanying consolidated balance sheets is a mortgage loan loss allowance equal to approximately $10,000 and $8,200 at December 31, 2014 and 2013, respectively.
|
16. |
Quarterly Results (unaudited) |
The following table sets forth unaudited selected financial data and operating information on a quarterly basis for the years ended December 31, 2014 and 2013.
66
NVR, Inc.
Notes to Consolidated Financial Statements
(dollars and shares in thousands, except per share data)
|
|
|
Year Ended December 31, 2014 |
|
|||||||||||||
|
|
|
4th Quarter |
|
|
3rd Quarter |
|
|
2nd Quarter |
|
|
1st Quarter |
|
||||
|
|
|
|
|
|
|
|
|
|
|
|
|
|
|
|
|
|
|
Revenues – homebuilding operations |
|
$ |
1,306,632 |
|
|
$ |
1,185,160 |
|
|
$ |
1,084,080 |
|
|
$ |
799,187 |
|
|
Gross profit – homebuilding operations |
|
$ |
236,031 |
|
|
$ |
225,105 |
|
|
$ |
201,302 |
|
|
$ |
144,035 |
|
|
Mortgage banking fees |
|
$ |
21,406 |
|
|
$ |
18,006 |
|
|
$ |
17,974 |
|
|
$ |
12,123 |
|
|
Net income |
|
$ |
99,451 |
|
|
$ |
90,152 |
|
|
$ |
68,178 |
|
|
$ |
23,849 |
|
|
Diluted earnings per share |
|
$ |
23.24 |
|
|
$ |
20.70 |
|
|
$ |
15.17 |
|
|
$ |
5.16 |
|
|
Contracts for sale, net of cancellations (units) |
|
|
2,713 |
|
|
|
2,936 |
|
|
|
3,415 |
|
|
|
3,325 |
|
|
Settlements (units) |
|
|
3,469 |
|
|
|
3,236 |
|
|
|
2,943 |
|
|
|
2,211 |
|
|
Backlog, end of period (units) |
|
|
5,475 |
|
|
|
6,231 |
|
|
|
6,531 |
|
|
|
6,059 |
|
|
Loans closed |
|
$ |
881,930 |
|
|
$ |
803,125 |
|
|
$ |
675,625 |
|
|
$ |
472,933 |
|
|
|
|
Year Ended December 31, 2013 |
|
|||||||||||||
|
|
|
4th Quarter |
|
|
3rd Quarter |
|
|
2nd Quarter |
|
|
1st Quarter |
|
||||
|
|
|
|
|
|
|
|
|
|
|
|
|
|
|
|
|
|
|
Revenues – homebuilding operations |
|
$ |
1,223,808 |
|
|
$ |
1,167,595 |
|
|
$ |
992,210 |
|
|
$ |
750,868 |
|
|
Gross profit – homebuilding operations |
|
$ |
222,393 |
|
|
$ |
203,179 |
|
|
$ |
157,922 |
|
|
$ |
126,783 |
|
|
Mortgage banking fees |
|
$ |
18,344 |
|
|
$ |
21,372 |
|
|
$ |
17,682 |
|
|
$ |
19,388 |
|
|
Net income |
|
$ |
97,811 |
|
|
$ |
82,935 |
|
|
$ |
50,690 |
|
|
$ |
35,041 |
|
|
Diluted earnings per share |
|
$ |
21.15 |
|
|
$ |
17.67 |
|
|
$ |
10.11 |
|
|
$ |
6.84 |
|
|
Contracts for sale, net of cancellations (units) |
|
|
2,631 |
|
|
|
2,381 |
|
|
|
3,278 |
|
|
|
3,510 |
|
|
Settlements (units) |
|
|
3,342 |
|
|
|
3,342 |
|
|
|
2,878 |
|
|
|
2,272 |
|
|
Backlog, end of period (units) |
|
|
4,945 |
|
|
|
5,656 |
|
|
|
6,617 |
|
|
|
6,217 |
|
|
Loans closed |
|
$ |
721,926 |
|
|
$ |
695,930 |
|
|
$ |
646,450 |
|
|
$ |
473,766 |
|
67