Attached files
| file | filename |
|---|---|
| EX-31.2 - EXHIBIT 31.2 - MAM SOFTWARE GROUP, INC. | v389093_ex31-2.htm |
| EX-31.1 - EXHIBIT 31.1 - MAM SOFTWARE GROUP, INC. | v389093_ex31-1.htm |
| EX-32.1 - EXHIBIT 32.1 - MAM SOFTWARE GROUP, INC. | v389093_ex32-1.htm |
| EX-32.2 - EXHIBIT 32.2 - MAM SOFTWARE GROUP, INC. | v389093_ex32-2.htm |
| EXCEL - IDEA: XBRL DOCUMENT - MAM SOFTWARE GROUP, INC. | Financial_Report.xls |
UNITED STATES
SECURITIES AND EXCHANGE COMMISSION
WASHINGTON, DC 20549
FORM 10-K
ANNUAL REPORT PURSUANT TO SECTION 13 OR 15(d) OF THE
SECURITIES EXCHANGE ACT OF 1934
FOR THE FISCAL YEAR ENDED JUNE 30, 2014
TRANSITION REPORT PURSUANT TO SECTION 13 OR 15(d) OF THE
SECURITIES EXCHANGE ACT OF 1934
FOR THE TRANSITION PERIOD FROM ___________ TO ___________
Commission file number 000-27083
MAM Software Group, Inc.
(Exact name of registrant as specified in its charter)
| Delaware | 84-1108035 | |
|
(State or other jurisdiction of incorporation or organization) |
(IRS Employer Identification No.) |
Maple Park, Maple Court, Tankersley, Barnsley, U.K. S75 3DP
(Address of principal executive offices, including zip code)
Registrant’s telephone number, including area code: 011-44-122-635-2900
Securities registered pursuant to Section 12(b) of the Act:
| Title of each class: | Name of each exchange on which registered: | |
| Common Stock, $0.0001 par value | NASDAQ Capital Market |
Securities registered pursuant to Section 12(g) of the Act:
None
(Title of class)
Indicate by check mark if the registrant is a well-known seasoned issuer (as defined in Rule 405 of the Act).
Yes ¨ No þ
Indicate by check mark if the registrant is not required to file reports pursuant to Section 13 or Section 15(d) of the Act. Yes ¨ No þ
Indicate by check mark whether the registrant (1) has filed all reports required to be filed by Section 13 or 15(d) of the Securities Exchange Act of 1934 during the preceding 12 months (or for such shorter periods that the registrant was required to file such reports), and (2) has been subject to such filing requirements for the past 90 days.
Yes þ No ¨
Indicate by check mark whether the registrant has submitted electronically and posted on its corporate Web site, if any, every Interactive Data File required to be submitted and posted pursuant to Rule 405 of Regulation S-T (§232.405 of this chapter) during the preceding 12 months (or for such shorter period that the registrant was required to submit and post such files). Yes þ No ¨
Indicate by check mark if disclosure of delinquent filers pursuant to Item 405 of Regulation S-K is not contained herein, and will not be contained, to the best of registrant’s knowledge, in definitive proxy or information statements incorporated by reference in Part III or this Form 10-K or any amendment to this Form 10-K. ¨
Indicate by check mark whether the registrant is a large accelerated filer, an accelerated filer, a non-accelerated filer or a smaller reporting company. See the definitions of “large accelerated filer,” “accelerated filer” and “smaller reporting company” in Rule 12b-2 of the Exchange Act.
| Large accelerated filer ¨ | Accelerated filer ¨ |
| Non-accelerated filer ¨ | Smaller reporting company þ |
Indicate by check mark whether the registrant is a shell company (as defined in Rule 12b-2 of the Act).
Yes ¨ No þ
As of December 31, 2013 14,494,437 shares of common stock were outstanding. The aggregate market value of the common stock held by non-affiliates of the registrant, as of December 31, 2013, the last business day of the second fiscal quarter, was approximately $32,325,000, based on the average high and low price of $5.00 for the registrant’s common stock as quoted on NASDAQ Capital Market on that date. Shares of common stock held by each director, each officer and each person who owns 10% or more of the outstanding common stock have been excluded from this calculation in that such persons may be deemed to be affiliates. The determination of affiliate status is not necessarily conclusive.
The registrant had 14,298,053 shares of its common stock outstanding as of September 22, 2014.
DOCUMENTS INCORPORATED BY REFERENCE
None.
| 2 |
TABLE OF CONTENTS
| 3 |
CAUTIONARY NOTE REGARDING FORWARD-LOOKING STATEMENTS
This Annual Report on Form 10-K (this “Report”) contains “forward-looking statements” within the meaning of the Section 27A of the Securities Act of 1933, as amended (the “Securities Act”), and Section 21E of the Securities Exchange Act of 1934, as amended (the “Exchange Act”). Forward-looking statements discuss matters that are not historical facts. Because they discuss future events or conditions, forward-looking statements may include words such as “anticipate,” “believe,” “estimate,” “intend,” “could,” “should,” “would,” “may,” “seek,” “plan,” “might,” “will,” “expect,” “predict,” “project,” “forecast,” “potential,” “continue” negatives thereof or similar expressions. These forward-looking statements are found at various places throughout this Report and include information concerning possible or assumed future results of our operations; business strategies; future cash flows; financing plans; plans and objectives of management; any other statements regarding future operations, future cash needs, business plans and future financial results, and any other statements that are not historical facts.
From time to time, forward-looking statements also are included in our other periodic reports on Forms 10-Q and 8-K, in our press releases, in our presentations, on our website and in other materials released to the public. Any or all of the forward-looking statements included in this Report and in any other reports or public statements made by us are not guarantees of future performance and may turn out to be inaccurate. These forward-looking statements represent our intentions, plans, expectations, assumptions and beliefs about future events and are subject to risks, uncertainties and other factors. Many of those factors are outside of our control and could cause actual results to differ materially from the results expressed or implied by those forward-looking statements. In light of these risks, uncertainties and assumptions, the events described in the forward-looking statements might not occur or might occur to a different extent or at a different time than we have described. You are cautioned not to place undue reliance on these forward-looking statements, which speak only as of the date of this Report. All subsequent written and oral forward-looking statements concerning other matters addressed in this Report and attributable to us or any person acting on our behalf are expressly qualified in their entirety by the cautionary statements contained or referred to in this Report.
Except to the extent required by law, we undertake no obligation to update or revise any forward-looking statements, whether as a result of new information, future events, a change in events, conditions, circumstances or assumptions underlying such statements, or otherwise.
For discussion of factors that we believe could cause our actual results to differ materially from expected and historical results see “Item 1A — Risk Factors” below.
| 4 |
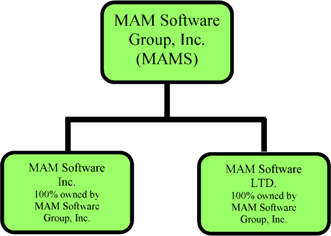
MAM Software Group, Inc. (“MAM,” the “Company,” “we,” “our,” or “us”) is a technology holding company that has one wholly owned subsidiary based in the U.S., MAM Software, Inc. (“MAM US”) which is located in Allentown, Pennsylvania, and one wholly owned subsidiary in the U.K., MAM Software Limited (“MAM Ltd.”) based in Tankersley, Barnsley, U.K. The subsidiaries operate independently from one another. We have and continue to market and develop business management software solutions that manage both the business and supply chain for small and medium-sized firms in the automotive aftermarket. The automotive aftermarket includes those businesses that supply servicing, parts, oil, tires, and performance extras to the retail market.
Our Company
MAM Software Group, Inc. is a leading provider of integrated information management solutions and services and a leading provider of cloud-based software solutions for the automotive aftermarket sector. We have a broad line of software solutions and services to address the information technology (“IT”) needs of virtually every significant sector of the automotive aftermarket sector in the United Kingdom and North America and are seeking to leverage this position into new industry verticals and new geographies around the world.
Our Markets
MAM Software Group, Inc. provides software, information and related services to businesses engaged in the automotive aftermarket in the U.S., Canada, U.K. and Ireland. The automotive aftermarket consists of businesses associated with the life cycle of a motor vehicle from when the original manufacturer’s warranty expires to when the vehicle is scrapped. Products sold by businesses engaged in this market include the parts, tires and auto services required to maintain and improve the performance or appeal of a vehicle throughout its useful life. The Company aims to meet the business needs of customers who are involved in the maintenance and repair of automobiles and light trucks in three key segments of the automotive aftermarket, namely parts, tires and auto service.
The Company’s customer base consists of wholesale parts and tire distributors, retailers, franchisees, cooperatives, auto service chains and single location auto service businesses with high customer service expectations and complex commercial relationships.
In the U.K. and Ireland, the Company also provides management solutions to businesses involved in the wholesale of construction materials. These vertical markets include plumbing, building, lumber, and electrical wholesale distribution companies.
Our Products and Services
The Company’s business management systems, information products and online services permit our customers to manage their critical day-to-day business operations through automated point-of-sale, information (content) products, inventory management, purchasing, general accounting and customer relationship management.
We provide professional IT services to our customers, including software and hardware installation, data conversion, and training and, at times, product modifications. We also provide continuing customer support services to ensure product performance and reliability, which provides us with long-term customer relationships and a significant base of recurring maintenance revenue.
| 5 |
The Company’s revenues are derived from the following:
| · | The sale of business management systems comprised of proprietary software applications, implementation and training. | |
| · | Providing subscription-based services, including software support and maintenance, and online services for a fee. | |
| · | Delivering our business management, commonly known as SaaS. | |
| · | Delivering our catalogue information as a service, commonly known as DaaS. |
Our Technologies
Our solutions are available as both 'on-premise' applications (sold via the traditional perpetual licensing model) and ‘cloud’ solutions that are delivered as a service over the Internet on a subscription basis.
Many of our business management applications are now available as SaaS, where software and associated data is centrally hosted on the cloud. Depending on the complexity of the application, MAM SaaS solutions are deployed using 'cloud hosting' or 'web application' technology:
SaaS cloud hosting - single tenants accessing fully-managed virtual servers via thin client (terminal services) connections (e.g. Autopart Online).
SaaS web application - multiple tenants accessing a dedicated website using a standard web browser (e.g. Autowork Online).
Our catalog information is also available in the cloud as DaaS. We centrally host and maintain the data, which is accessed by users via a desktop application, web application or integrated into their B2C website.
At present, most of our customers in the U.K. have our software installed in-house. However, market acceptance of cloud computing for mission critical enterprise applications has become increasingly common in recent years since software can be delivered cost-effectively, reliably, and securely to businesses over the Internet without the need for these businesses to purchase supporting software and hardware for an on-premise system or the need to keep IT people on staff to monitor and upgrade such a system.
We introduced our first subscription-based service solution over the Internet in 2005 in the U.K., and we began marketing our first cloud system to customers in North America in 2013. Since that time, we have significantly expanded our cloud-based offerings and are offering customers that maintain in-house installations significant incentives to move to our cloud-computing model. While transitioning our U.K. customers to a cloud computing model results in a decrease in our up-front revenue recognition, we believe that this is a necessary transition and is in the best interests of our customers and our own long-term business prospects as an increasing number of our customers in the U.K. are looking for solutions that are highly functional, easy to use, configurable, and fast.
Our cloud model is based on Microsoft .Net, HTML5 and SQL technologies that are both open and secure with support for user experiences on both desktop and mobile devices. Our customers that have moved away from traditional on-premise software to our cloud-based service applications benefit by substantially reducing the complexity typical of on-premise software implementations, customizations, and upgrades. Through cloud computing, we supply and manage the hardware, infrastructure, ongoing maintenance, and backup services for our customers. We install the latest version of our software for our customers, thereby reducing their need to buy and maintain their own IT resources. As a part of our cloud model, we also provide activation and training services to our customers as well as support services. In the North American market, where we have a smaller existing installed base of customers, the transition to offering cloud-based solutions will be an important part of our strategic growth in this market since we currently enjoy less market share and thus we anticipate that the near term impact will be a net-positive one as we work to increase that business in North America.
| 6 |
CORPORATE BACKGROUND
The Company’s principal executive office is located at Maple Park, Maple Court, Tankersley, Barnsley, U.K. S75 3DP and its phone number is 011-44-122-635-2900.
MAM is a former subsidiary of ADNW, a publicly traded company, the stock of which is currently traded on the pink sheets under the symbol ADNW.PK. ADNW transferred its software aftermarket services operating businesses to MAM (then known as Aftersoft Group, Inc.) and retained its database technology, Orbit.
On November 24, 2008, ADNW distributed a dividend of the 7,125,000 shares of MAM common stock that ADNW owned at such time in order to complete the spin-off of MAM’s businesses. The dividend shares were distributed in the form of a pro rata dividend to the holders of record as of November 17, 2008 (the “Record Date”) of ADNW’s common and convertible preferred stock. Each holder of record of shares of ADNW common and preferred stock as of the close of business on the Record Date was entitled to receive 0.06864782 shares of MAM’s common stock for each share of common stock of ADNW held at such time, and/or for each share of ADNW common stock that such holder would own, assuming the convertible preferred stock owned on the Record Date was converted in full. Prior to the spin-off, ADNW owned approximately 77% of MAM’s issued and outstanding common stock. Subsequent to and as a result of the spin-off, MAM is no longer a subsidiary of ADNW. The Company currently has the following wholly owned direct operating subsidiaries: MAM Software Limited in the U.K., and MAM Software, Inc. in the U.S. On April 21, 2010 shareholders approved the change of the Company’s name from Aftersoft Group, Inc. to MAM Software Group, Inc.
On March 25, 2011, (“the Effective Date”), the Company amended its Certificate of Incorporation to effectuate a one-for-one hundred reverse stock split, followed by a ten-for-one forward stock split. Pursuant to this transaction, every 100 shares of the Company's common stock were converted into one share of the Company's common stock. Immediately thereafter, a forward stock split was undertaken whereby each share of common stock was converted into 10 shares of common stock. Stockholders owning fewer than 100 shares of common stock whose interests were converted into fewer than 1 share of common stock pursuant to the reverse split, were converted into the right to receive an amount equal to the average daily closing price per share of the common stock on the OTC Bulletin Board (where the Company’s common stock was traded at the time) for the five trading days immediately before and including the Effective Date, without interest. Stockholders who held 100 or more shares as of the Effective Date received fractional shares in the reverse split and were not cashed out. Any fractional shares held after the ensuing forward split were rounded up to the nearest whole share.
| 7 |
MAM Software Group, Inc. Organization Chart
MAM Software Limited
MAM Ltd. is a provider of software to the automotive aftermarket in the U.K. and Ireland. MAM Ltd. specializes in providing reliable and competitive business management solutions to the motor factor (also known as jobber), retailing, and wholesale distribution sectors. It also develops applications for vehicle repair management and provides solutions to the retail and wholesale tire industry. All MAM Ltd. programs are based on the Microsoft Windows family of operating systems. Each program is fully compatible with the other applications in their range, enabling them to be combined to create a fully integrated package. MAM Ltd. is based in Tankersley, U.K.
MAM Software, Inc.
MAM US has two divisions, VAST and Autopart. The VAST Division develops open business management systems, and distribution channel e-commerce systems for the automotive aftermarket supply chain. These systems are used by leading aftermarket outlets, including tier one manufacturers, program groups, warehouse distributors, tire and service chains and independent installers. VAST products and services enable companies to generate new sales, operate more cost efficiently, accelerate inventory turns and maintain stronger relationships with suppliers and customers. MAM US, VAST Division and Autopart Divisions are based in Allentown, Pennsylvania.
The Autopart Division provides software solutions to the North American automotive aftermarket. It targets jobbers and warehouse distributors, supplying a localized version of the U.K.-developed software.
VAST specifically focuses on selling systems to the service and tire segment of the market, while Autopart focuses on the warehouse and jobber segment of the market.
Industry Overview
The Company serves the business needs of customers involved in the supply of parts, maintenance and repair of automobiles and light trucks in three key segments of the automotive aftermarket, namely parts, tires and auto service.
The industry is presently experiencing a level of consolidation in the lines that are being sold. The previous distinction of having parts and tires provided by two distinct suppliers is coming to an end, as our customers’ businesses need to offer their clients the widest range of products and services under one roof. As a result, what were previously parts-only stores, jobbers and warehouse, are now taking in tire inventory as well in order to satisfy their clients’ demands, and vice-versa. This in turn is causing owners of these businesses to evaluate their business systems to ensure they can compete over the short, medium and long term. An increase in the “do-it-yourself” market due to the “credit crunch” is requiring these systems, but at the same time a need to compete strongly with other parts stores is cutting margins as businesses attempt to attract new and return business. Longer warranties are still deferring the length of time until newer vehicles are entering the aftermarket, except for running spares and service parts, accident damage, and optional add-ons such as security, entertainment, performance and customization.
| 8 |
Continuing market conditions related to the overall downturn in the consumer market is also directly affecting the confidence and ability of businesses to invest in new systems. The industry’s response to this has been to introduce incentive and discount programs, but to date it is uncertain whether this approach will be successful long term.
The Company believes that growth in the automotive aftermarket will continue to be driven by the following factors:
| · | gradual growth in the aggregate number of vehicles in use; |
| · | an increase in the average age of vehicles in operation, now estimated to be 11.4 years; |
| · | growth in the total number of miles driven per vehicle per year; and |
| · | increased vehicle complexity. |
Products and Services
Meeting the needs of the automotive aftermarket requires a combination of business management systems, information products and online services that combine to deliver benefits for all parties involved in the timely repair of a vehicle. The Company provides systems and services that meet these needs and help its customers to meet their customers’ expectations. These products and services include:
| 1. | Business Management Systems comprised of the Company’s proprietary software applications, implementation and training and third-party hardware and peripherals; |
| 2. | Information Products such as an accessible catalog database related to parts, tires, labor estimates, scheduled maintenance, repair information, technical service bulletins, pricing and product features and benefits that are used by the different participants in the automotive aftermarket; |
| 3. | Online Services and products that provide online connectivity between manufacturers, warehouse distributors, retailers and automotive service providers. These products enable electronic data interchange throughout the automotive aftermarket supply chain between the different trading partners. They also enable procurement and business services to be projected over the Internet to an expanded business audience; and |
| 4. | Customer Support, Consulting and Training that provide phone and online support, implementation and training. |
Business Management Systems
MAM’s business management systems meet the needs of warehouse distributors, part stores and automotive service providers as follows:
Warehouse Distributors
Autopart. This is a U.K.-developed product that is sold and promoted both in the U.S. and in the U.K. In the U.S., it is sold by MAM Software, Inc. and in the U.K. by the MAM Software Limited. This product is designed for and targeted at warehouse distributors that seek to manage multiple locations and inventories on a single system for a regional area and are also suited to managing single location franchisees or buying group members. The product provides point of sale, inventory management, electronic purchasing capabilities, a fully integrated accounting module, a warehouse management module, and a business intelligence reporting module. It also allows the distributor to connect with their customers through our OpenWebs™ ecommerce solutions.
Autopart can be delivered as an on premise solution and sold via the traditional perpetual licensing model. Autopart Online is a hosted or ‘cloud’ based version of our Autopart solution and is delivered as a service over the Internet, commonly known as or SaaS.
DirectStep. This is our legacy product that was designed for warehouse distributors that seek to manage multiple locations and inventories on a single system. Although still actively supported, DirectStep is no longer promoted.
| 9 |
Parts Stores
Autopart. This is a U.K.-developed product that is sold in both the U.S. and U.K. In the U.S. it is sold by MAM Software, Inc. and in the U.K. by MAM Software Limited. This product is designed for and targeted at parts store chains that seek to manage multiple locations and inventories on a single system for a regional area. It is also suited to managing single location franchisees or buying group members. The product provides point of sale, inventory management, electronic purchasing capabilities a fully integrated accounting module and a business intelligence reporting module. It also allows parts stores to connect with their automotive service customers through the VAST, Autowork Online or, OpenWebs™ ecommerce solutions.
Autopart can be delivered as an on premise solution and sold via the traditional perpetual licensing model. Autopart Online is a hosted or ‘cloud’ based version of our Autopart solution and is delivered as a service over the Internet, commonly known as SaaS.
Automotive Service Providers
VAST. This product is designed for and targeted at large- to medium- sized automotive service and tire chains that seek to manage multiple locations and inventories for a regional area is also suited to managing single location stores that are part of a franchise or a buying group. VAST provides point-of-sale, inventory management, electronic purchasing and customer relationship management capabilities. It also allows the service provider to connect with parts and tires warehouse distributors and parts stores through either VAST’s online services and products or other industry connectivity solutions.
Autowork Online. This is a U.K.-developed product that is sold both in the U.S. and the U.K. In the U.S. it is sold by MAM Software, Inc. and in the U.K. by MAM Software Limited. This product is designed for and targeted at small single location automotive installers. The Autowork Online product provides estimate, job card, parts procurement and invoice capabilities. It also allows the automotive installer to connect with parts distributors to purchase components. Autowork Online is delivered as a service over the Internet, commonly known as SaaS, allowing customers to purchase the solution on a monthly basis but without the need to manage the system.
Vertical Markets
Trader. This is a U.K.-developed product that is sold by MAM Software Limited. This product is designed for and targeted at generic wholesalers and distributors. Based on the Autopart codebase, the product provides point of sale, inventory management, electronic purchasing capabilities and a fully integrated accounting module.
Information Products
The Company provides product catalog and vehicle repair information required to enable point-of-sale transactions. These proprietary database products and services generate recurring revenues through monthly or annual subscription fees.
MAM Software Limited develops and maintains proprietary information products that differentiate its products from those of the majority of its competitors in the U.K. In the U.S. and Canada, both MAM Software, Inc. and VAST develops and maintains a proprietary workflow capability that integrates information products sourced from its suppliers such as Epicor (formerly Activant), and WHI for its automotive parts and tire customers, including warehouse distributors, parts stores and automotive service providers. In April 2014, MAM Software, Inc. launched an information product developed specifically for the U.S. and Canada.
The principal information service for both MAM Software, Inc. and MAM Software Limited is Autocat+, an auto parts catalog that uses the DaaS distribution model. Autocat+ provides access to a database of automobile vehicle applications for the U.S. and U.K. markets that enables users to access information about parts quickly and accurately. The Autocat+ service is centrally hosted and data is accessed by users via MAM's business management software, a standalone desktop application, or web application. Data can also be 'consumed' via a Web Service for integration into B2C websites. Information in Autocat+ is maintained through an automatic verification and standardization process, with updates published daily.
| 10 |
In addition, information products developed or resold by VAST include Interchange Catalog, a database that provides cross references of original equipment manufacturer part numbers to aftermarket manufacturer part numbers; Price Updating, a service that provides electronic price updates following a price change by the part manufacturer; Labor Guide, a database used by automotive service providers to estimate labor hours for purposes of providing written estimates of repair costs to customers; Scheduled Service Intervals, a database of maintenance intervals; and Tire Sizing, a database that cross-references various tire products and applications.
Online Services
Both MAM Software, Inc. and MAM Software Limited offer online e-commerce services in the form of business to business and business to consumer implementations. These online services connect the automotive aftermarket from manufacturers through warehouse distributors and parts stores to automotive service providers for the purpose of purchasing parts and tires, fleet and national account transaction processing and online product price information.
OpenWebs™ e-Commerce Gateway Services
In the U.S. and Canada, VAST’s e-commerce gateway services use automotive industry standard messaging specifications to deliver online services that connect the automotive aftermarket supply chain for the purpose of purchasing parts and tires, fleet and national account transaction processing, online product and price updating for parts and tires.
OpenWebs™ e-Commerce Browser Services
In the U.S. and Canada, VAST’s e-commerce browser services enable warehouse distributors and parts stores to provide an online service to automotive service providers for the purpose of purchasing of parts and tires, accessing account information and other browser-based channel management services.
Autonet
In the U.K., MAM Ltd.’s Autonet online services connect manufacturers, warehouse distributors, parts stores and automotive service providers for the purpose of purchasing of parts and tires, fleet and national account transaction processing and product information and price distribution.
Customer Support and Consulting and Training
The Company provides support, consulting and training to its customers to ensure the successful use of its products and services. The Company believes this extra level of commitment and service builds customer relationships, enhances customer satisfaction and maximizes customer retention. These services consist of the following:
| · | Phone and online support. Customers can call dedicated support lines to speak with knowledgeable personnel who provide support and perform on-line problem solving as required. |
| · | Implementation, education and training consulting. Our consulting and training teams work together to minimize the disruption to a customer’s business during the implementation process of a new system and to maximize the customer’s benefit from the use of the system through training. |
Both MAM Software, Inc. and MAM Software Limited also provide a customer-only support portal that allows customers direct access to tutorials, on-line documentation and information related to products and services. New customers enter into support agreements, and most retain such service agreements for as long as they own the system. Monthly fees vary with the number of locations and the software modules, information products and online services subscribed to. The agreements are generally month-to-month agreements. The Company offers training at both MAM Software, Inc.’s and MAM Software Limited’s facilities, as well as the customer’s facilities and online for product updates or introduce specific new capabilities.
Both MAM Software, Inc. and MAM Software Limited’s catalog information products are delivered by its Autocat teams, based in Allentown, PA and Wareham, England. The Autocat product teams source, standardize and format data collected in an electronic format from over 300 automotive parts manufacturers in both regions and the data is provided to its customers via the Internet.
| 11 |
Distribution
There are two primary vertical distribution channels for aftermarket parts and tire distribution: the traditional wholesale channel and the retail channel.
Automotive Aftermarket Distribution Channels
| · | Traditional Wholesale Channel. The wholesale channel is the predominant distribution channel in the automotive aftermarket. It is characterized by the distribution of parts from the manufacturer to a warehouse distributor, to parts stores and then to automotive service providers. Warehouse distributors sell to automotive service providers through parts stores, which are positioned geographically near the automotive service providers they serve. This distribution method provides for the rapid distribution of parts. The Company has products and services that meet the needs of the warehouse distributors, parts stores and the automotive service providers. |
| · | Retail Channel. The retail channel is comprised of large specialty retailers, small independent parts stores and regional chains that sell to “do-it-yourself” customers. Larger specialty retailers, such as Advance Auto Parts, AutoZone, Inc., and O’Reilly Automotive, Inc. carry a greater number of parts and accessories at more attractive prices than smaller retail outlets and are gaining market share. The business management systems used in this channel are either custom developed by the large specialty retailers or purchased from business systems providers by small to medium-sized businesses. The Company has products and services that support the retail channel. |
In addition to these two primary channels, some aftermarket parts and tires end up being distributed to new car dealers. The business management systems used in this channel have unique functionality specific to new car dealerships. The Company sells a small number of products into the auto service provider side of car dealerships. Aftermarket wholesalers of parts and tires provide online purchasing capabilities to some new car dealerships.
Product Development
The Company’s goal is to add value to its customers’ businesses through products and services designed to create optimal efficiency. To accomplish this goal, the Company’s product development strategy consists of the following three key components:
| · | Integrating all of the Company’s products so that its software solutions work together seamlessly, thereby eliminating the need to switch between applications; |
| · | Enhancing the Company’s current products and services to support its changing customers’ needs; and |
| · | Providing a migration path to the Company’s business management systems, reducing a fear that many customers have that changing systems will disrupt business. |
Sales and Marketing
The Company’s sales and marketing strategy is to acquire customers and retain them by cross-selling and up-selling a range of commercially compelling business management systems, information products and online services.
Within the parts, tire and auto service provider segments, each division sells and markets through a combination of field sales, inside sales, and independent representatives. The Company seeks to partner with large customers or buying groups and leverage their relationships with their customers or members. Incentive pay is a significant portion of the total compensation package for all sales representatives and sales managers. Outside sales representatives focus primarily on identifying and selling to new customers complemented by an inside sales focus on selling upgrades and new software applications to its installed customer base.
The Company’s marketing approach aims to leverage its reputation for customer satisfaction and for delivering systems, information and services that improve a customer’s commercial results. The goal of these initiatives is to maximize customer retention and recurring revenues, to enhance the productivity of the field sales team, and to create the cross-selling and up-selling opportunities for its systems, information products and online services.
| 12 |
Research and Development
The Company spent approximately $3.7 million in fiscal 2014 on research and development, with approximately $0.9 million spent by MAM US and $2.8 million by MAM Ltd. The Company spent approximately $3.4 million in fiscal 2013 on research and development, with approximately $0.9 million spent by the VAST division, $0.3 million by the Autopart division, and $2.2 million by MAM Ltd.
Patent and Trademark
We rely on a combination of intellectual property laws, as well as confidentiality procedures and contractual provisions, to protect our proprietary technology and our brand. We have not sought patent protection for any of our products. We have registered our business name, “MAM Software,” with the U.S. Patent and Trademark office. The assets consist of intellectual property relating to our specific color and font design of our business logo. In addition we have also registered our tagline, “Driving Business Performance,” with the U.S. Patent and Trademark office.
Customers
During the years ended June 30, 2014 and 2013, no customer accounted for 10% of the Company’s total revenues. The Company’s top ten customers collectively accounted for 11% of total revenues during fiscal 2014 and 18% of total revenues during fiscal 2013. Some of top customers in North America include Autopart International, AutoZone, Monro Muffler Brake, Sullivan Tire & Auto Service, and U.S. AutoForce. In the U.K. and Irish markets, MAM Ltd.’s top customers include Dingbro, Euro Car Parts, Andrew Page LTD, Maccess Limited, and Alliance Automotive U.K. LTD.
Competition
In the U.S. and Canada, MAM US competes primarily with Epicor Inc. (formerly Activant, Inc.) and WHI and several smaller software companies, including Autologue, DST and Fuse 5. VAST competes primarily with Maddenco, ASA, Tasco and RO Writer who all provide similar products and services to the U.S. automotive aftermarket. Additionally, an ongoing competitive threat to the Company comes from custom, developed, in-house systems, information products and online services. For example, AutoZone, Inc. and Genuine Parts Company’s NAPA Parts Group, each have developed their own business management systems and electronic automotive parts catalogs for their stores and members, although the Company currently has a partnership agreement with each of these companies to supply their information products through the Company’s solutions.
In the U.S. and Canada, the Company expects to compete successfully against its competitors using two separate and complimentary strategies. First, the Company will continue to focus on selling and promoting the Company’s complete supply chain solutions that provide businesses with easy integration of the Company’s business management information systems into their existing supply chain structures. Second, the Company will continue its strategy of working with those businesses that already manage their own supply chains and information products (catalogs), such as AutoZone, helping to improve and compliment their systems with the Company’s products.
VAST, in the U.S. and Canada, competes with multiple products across different market segments, so its competitors vary by segment.
Within the warehouse distribution segment, the Company will continue to support its legacy system, Direct Step, a product which the Company developed many years ago which enables large warehouses with millions of parts to locate, manage, pack and deliver the parts with ease and efficiency. DirectStep is not a Microsoft Windows-based technology. The Company’s existing and prospective customers are moving towards modern solutions which integrate easily with Internet-based transactions and interactions, and the Company believes that its Autopart product provides that solution. The Company has been selling Autopart successfully in the U.K. and Ireland since 2000, and feels that the success this product in the U.K. and the successful installation of this product within the U.S. will enable the Company to promote and benefit quickly from this product.
The tire segment is comprised of three distinct elements: retail, wholesale and commercial. Within the tire segment and the auto service segment, the Company focuses on client and market requirements, which the Company believes will enable it to offer its clients the best solution, regardless of the size of a client’s business. By continually integrating and extending the functionality of its solutions across the entire supply chain, the Company believes that it will be able to offer existing and potential clients products that suit their present and future needs. Management believes that its products will present existing and potential clients the opportunity to move away from their older existing systems, which may restrict their market opportunities, and will permit integration into additional sales channels and reduce the costly maintenance of older systems.
| 13 |
The auto parts segment within the auto service space has many competitors who have developed applications for single location auto service shops. Many of these have been developed by parts distributors like NAPA and AutoZone. While these applications do well in a small single location store, they are not widely distributed in the multi-store location segment of the auto parts business. The Company believes that its Autowork Online product is highly suited to single store locations. The strategy for generating revenue in this sector of the market will be to establish reseller agreements with distributor partners. In addition, it will focus on multi-store locations for which its product VAST is highly suited. The Company believes that this multi-store ability offers strong opportunities to beat the competition in this area and quickly increase the Company’s customer base.
The last area that the Company plans to compete in is the e-commerce space, providing new tools and solutions for this expanding Internet marketplace. The goal of the Company’s OpenWebs™ product is to connect both parts and tire partners together in a real-time environment so they can perform electronic ordering, gauge inventory levels as well as disseminate information. Within the tire segment, the Company feels that it has a competitive advantage. The Company’s observation has led it to believe that most tire distributors either do not have a business-to-business solution or have developed solutions from independent sources. While the parts segment of this market is largely tied to Epicor, Inc. (formerly Activant, Inc.) at this time, the Company believes that customers are looking for solutions that simply integrate their supply chain, completely and without further restrictions. The Company’s OpenWebs™ solution will allow its customers to achieve these goals.
In the U.K., MAM Ltd. continues to compete primarily with Epicor, Inc., (formerly Activant, Inc.) in the component sector of automotive aftermarket. In the tyre sector, MAM Ltd. competes primarily with CAM Systems, Tyreman and Team Systems. In the vertical markets now being targeted by MAM Ltd. in the U.K., the company competes with Kerridge, Chatsworth, EDP, Blue Rock, OGL and Ramtac, The Company feels that it provides a range of solutions that combine proven concepts with cutting-edge technology that are functional, effective and reliable. The Company feels that its focus towards continuing to provide solutions that enable business to find new efficiencies and increase existing efficiencies, as the Company develops its own products, will provide it an advantage over the competition. These efforts, together with strong post-sales support and ongoing in depth product and market support, will assist the Company in generating and maintaining its position within the market.
Several large enterprise resource planning and software companies, including Microsoft Corporation, Oracle Corporation and SAP AG, continue to supply Enterprise Resource Planning (“ERP”) and Supply Chain Management (“SCM”) products to medium sized original equipment manufacturers and suppliers within the automotive market, but to date have not focused strongly on the aftermarket. The solutions that they have developed are mainly focused on the efficient management of the supply chain and to date do not appear to be looking to supply systems and solutions into the jobber and service segments of the aftermarket. However there can be no assurance that those companies will not develop or acquire a competitive product or service in the future.
Employees
The Company has 210 full-time employees: 2 at MAM Software Group, Inc., 61 at MAM US and 147 at MAM Ltd. comprised of 6 in management, 21 in sales and marketing, 39 in research and development, 74 in professional services and support and 7 in general and administration. MAM Software Group, Inc.’s 2 employees include one senior executive and one accountant. MAM US has 61 employees in the U.S. comprised of two in management, 10 in sales and marketing, 6 in research and development, 38 in professional services and support and 5 in general and administration.
All of the Company’s employees have executed customary confidentiality and restrictive covenant agreements. The Company believes it has a good relationship with its employees and is currently unaware of any key management or other personnel looking to either retire or leave the employment of the Company. During 2008, the Company adopted a 2007 Long Term Stock Incentive Plan, which was approved by the Company’s Board of Directors and stockholders.
| 14 |
Our business, financial condition and operating results are subject to a number of risk factors, both those that are known to U.S. and identified below and others that may arise from time to time. These risk factors could cause our actual results to differ materially from those suggested by forward-looking statements in this report and elsewhere, and may adversely affect our business, financial condition or operating results. If any of those risk factors should occur, moreover, the trading price of our securities could decline, and investors in our securities could lose all or part of their investment in our securities. These risk factors should be carefully considered in evaluating our prospects.
We may fail to address risks we face as a developing business which could adversely affect the implementation of our business plan.
We are prone to all of the risks inherent in the establishment of any new business venture. You should consider the likelihood of our future success to be highly speculative in light of our limited operating history, as well as the limited resources, problems, expenses, risks and complications frequently encountered by entities at our current stage of development.
To address these risks, we must, among other things:
| · | implement and successfully execute our business and marketing strategy; |
| · | continue to develop new products and upgrade our existing products; |
| · | respond to industry and competitive developments; |
| · | attract, retain, and motivate qualified personnel; and |
| · | obtain equity and debt financing on satisfactory terms and in timely fashion in amounts adequate to implement our business plan and meet our obligations. |
We may not be successful in addressing these risks. If we are unable to do so, our business prospects, financial condition and results of operations would be materially adversely affected.
Global market disruptions may adversely affect our business and results of operations.
Recent disruptions in the current global credit and financial markets have included diminished liquidity and credit availability, a decline in economic growth and uncertainty about economic stability. There can be no assurance that there will not be further deterioration in credit and financial markets and confidence in economic conditions. These economic uncertainties affect businesses such as ours in a number of ways, making it difficult to accurately forecast and plan our future business activities. We believe that the recent global economic slowdown and the resulting slow recovery have caused certain customers to reduce or delay capital spending plans, which, if prolonged, could impact our growth expectations as potential and existing customers continue to delay decisions to purchase or upgrade their systems. We are unable to predict the likely duration and severity of the current disruptions in the credit and financial markets and adverse global economic conditions and its potential impact on our business. If the current uncertain economic conditions continue or further deteriorate, our business and results of operations could be materially and adversely affected.
Financial difficulties or the bankruptcy of one or more of our major customers could adversely affect our results.
Our ability to collect our accounts receivable and future sales depends, in part, on the financial strength of our customers. We grant credit, generally without collateral, to our customers. Consequently, we are subject to credit risk related to changes in business and economic factors throughout the United Kingdom, the United States, and Canada. In the event customers experience financial difficulty, and particularly if bankruptcy results, our profitability may be adversely impacted by our failure to collect our accounts receivable in excess of our estimated allowance for uncollectible accounts. Additionally, our future revenues could be reduced by the loss of a customer due to bankruptcy. Our failure to collect accounts receivable and/or the loss of one or more major customers could have an adverse effect on our net income and financial condition. We were recently informed that one distributor in the United Kingdom, which accounted for approximately 5.7% of our global revenues for the year ended June 30, 2014, was sold pursuant to an insolvency proceeding, which is the British equivalent of U.S. bankruptcy proceedings. Our inability to secure a new distributor for those accounts or to enter into direct agreements with the end users previously serviced by that distributor could have significant impact on our future revenues.
| 15 |
We may fail to successfully develop, market and sell our products.
To achieve profitable operations, we, along with our subsidiaries, must continue successfully to improve market and sell existing products and develop, market and sell new products. Our product development efforts may not be successful. The development of new software products is highly uncertain and subject to a number of significant risks. The development cycle-from inception to installing the software for customers - can be lengthy and uncertain. The ability to market the product is unpredictable and may cause delays. Potential products may appear promising at early stages of development, and yet may not reach the market for a number of reasons.
Additional issuances of securities will dilute your stock ownership and could affect our stock price.
As of September 22, 2014, there were 14,971,734 shares of our common stock issued and 14,298,053 shares of our common stock outstanding. Our Certificate of Incorporation authorizes the issuance of an aggregate of 18,000,000 shares of common stock and 2,000,000 shares of Preferred Stock, on such terms and at such prices as our Board of Directors may determine. These shares are intended to provide us with the necessary flexibility to undertake and complete plans to raise funds if and when needed. In addition, we may pursue acquisitions that could include issuing equity, although we have no current arrangements to do so. Any such issuances of securities would have a dilutive effect on current ownership of MAM stock. The market price of our common stock could fall in response to the sale or issuance of a large number of shares, or the perception that sales of a large number of shares could occur.
We may encounter significant financial and operating risks if we grow our business through acquisitions.
As part of our growth strategy, we may seek to acquire or invest in complementary or competitive businesses, products or technologies. The process of integrating acquired assets into our operations may result in unforeseen operating difficulties and expenditures and may absorb significant management attention that would otherwise be available for the ongoing development of our business. We may allocate a significant portion of our available working capital to finance all or a portion of the purchase price relating to possible acquisitions although we have no immediate plans to do so. Any future acquisition or investment opportunity may require U.S. to obtain additional financing to complete the transaction. The anticipated benefits of any acquisitions may not be realized. In addition, future acquisitions by U.S. could result in potentially dilutive issuances of equity securities, the incurrence of debt and contingent liabilities and amortization expenses related to intangible assets, any of which could materially adversely affect our operating results and financial position. Acquisitions also involve other risks, including entering markets in which we have no or limited prior experience.
An increase in competition from other software manufacturers could have a material adverse effect on our ability to generate revenue and cash flow.
Competition in our industry is intense. Potential competitors in the U.S. and Europe are numerous. Most competitors have substantially greater capital resources, marketing experience, research and development staffs and facilities than we have. Our competitors may be able to develop products before U.S. or develop more effective products or market them more effectively which would limit our ability to generate revenue and cash flow.
The prices we charge for our products may decrease as a result of competition and our revenues could decrease as a result.
We face potential competition from very large software companies, including Microsoft Corporation, Oracle Corporation and SAP AG which supply ERP and SCM products to our target market of small to medium-sized businesses servicing the automotive aftermarket. To date we have directly competed with one of these larger software and service companies. There can be no assurance that these companies will not develop or acquire a competitive product or service in the future. Our business would be dramatically affected by price pressure if these larger software companies attempted to gain market share through the use of highly discounted sales and extensive marketing campaigns.
| 16 |
If we fail to keep up with rapid technological change, our technologies and products could become less competitive or obsolete.
The software industry is characterized by rapid and significant technological change. We expect that the software needs associated with the automotive technology will continue to develop rapidly, and our future success will depend on our ability to develop and maintain a competitive position through technological development.
We depend on patent and proprietary rights to develop and protect our technologies and products, which rights may not offer us sufficient protection.
The software industry places considerable importance on obtaining patent and trade secret protection for new technologies, products and processes. Our success will depend on our ability to obtain and enforce protection for products that we develop under U.S. and foreign patent laws and other intellectual property laws, preserve the confidentiality of our trade secrets and operate without infringing the proprietary rights of third parties.
We also rely upon trade secret protection for our confidential and proprietary information. Others may independently develop substantially equivalent proprietary information and techniques or gain access to our trade secrets or disclose our technology. We may not be able to meaningfully protect our trade secrets which could limit our ability to exclusively produce products.
We require our employees, consultants, and parties to collaborative agreements to execute confidentiality agreements upon the commencement of employment or consulting relationships or collaboration with U.S. These agreements may not provide meaningful protection of our trade secrets or adequate remedies in the event of unauthorized use or disclosure of confidential and proprietary information.
If we become subject to adverse claims alleging infringement of third-party proprietary rights, we may incur unanticipated costs and our competitive position may suffer.
We are subject to the risk that we are infringing on the proprietary rights of third parties. Although we are not aware of any infringement by our technology on the proprietary rights of others and are not currently subject to any legal proceedings involving claimed infringements, we cannot assure you that we will not be subject to such third-party claims, litigation or indemnity demands and that these claims will not be successful. If a claim or indemnity demand were to be brought against U.S., it could result in costly litigation or product shipment delays or force U.S. to stop selling such product or providing such services or to enter into royalty or license agreements.
Our software and information services could contain design defects or errors which could affect our reputation, result in significant costs to us and impair our ability to sell our products.
Our software and information services are highly complex and sophisticated and could, from time to time, contain design defects or errors. We cannot assure you that these defects or errors will not delay the release or shipment of our products or, if the defect or error is discovered only after customers have received the products, that these defects or errors will not result in increased costs, litigation, customer attrition, reduced market acceptance of our systems and services or damage to our reputation.
If we lose key management or other personnel our business will suffer.
We are highly dependent on the principal members of our management staff. We also rely on consultants and advisors to assist us in formulating our development strategy. Our success also depends upon retaining key management and technical personnel, as well as our ability to continue to attract and retain additional highly qualified personnel. We may not be successful in retaining our current personnel or hiring and retaining qualified personnel in the future. If we lose the services of any of our management staff or key technical personnel, or if we fail to continue to attract qualified personnel, our ability to acquire, develop or sell products would be adversely affected.
| 17 |
It may be difficult for shareholders to recover against those of our directors and officers that are not residents of the U.S.
One of our directors, who is also an executive officer, is a resident of the U.K. In addition, our significant operating subsidiary, MAM Software Limited is located in the U.K. Were one or more shareholders to bring an action against us in the U.S. and succeed, either through default or on the merits, and obtain a financial award against an officer or director of the Company, that shareholder may be required to enforce and collect on his or her judgment in the U.K., unless the officer or director owned assets which were located in the U.S. Further, shareholder efforts to bring an action in the U.K. against its citizens for any alleged breach of a duty in a foreign jurisdiction may be difficult, as prosecution of a claim in a foreign jurisdiction, and in particular a foreign nation, is fraught with difficulty and may be effectively, if not financially, unfeasible.
Our management and internal systems might be inadequate to handle our potential growth.
Our success will depend in significant part on the expansion of our operations and the effective management of growth. This growth will place a significant strain on our management and information systems and resources and operational and financial systems and resources. To manage future growth, our management must continue to improve our operational and financial systems and expand, train, retain and manage our employee base. Our management may not be able to manage our growth effectively. If our systems, procedures, controls, and resources are inadequate to support our operations, our expansion would be halted and we could lose our opportunity to gain significant market share. Any inability to manage growth effectively may harm our ability to institute our business plan.
The market for our common stock is limited and you may not be able to sell your common stock.
Our common stock is currently quoted on the NASDAQ Capital Market. The market for purchases and sales of the Company’s common stock is limited and therefore the sale of a relatively small number of shares could cause the price to fall sharply. Accordingly, it may be difficult to sell shares quickly without significantly depressing the value of the stock. Unless we are successful in developing continued investor interest in our stock, sales of our stock could continue to result in major fluctuations in the price of the stock.
The price of our common stock is likely to be volatile and subject to wide fluctuations.
The market price of the securities of software companies has been especially volatile. Thus, the market price of our common stock is likely to be subject to wide fluctuations. If our revenues do not grow or grow more slowly than we anticipate, or, if operating or capital expenditures exceed our expectations and cannot be adjusted accordingly, or if some other event adversely affects U.S., the market price of our common stock could decline. If the stock market in general experiences a loss in investor confidence or otherwise fails, the market price of our common stock could fall for reasons unrelated to our business, results of operations and financial condition. The market price of our stock also might decline in reaction to events that affect other companies in our industry even if these events do not directly affect U.S.
| 18 |
We have insurance coverage for the services we offer. However, a claim for damages may be made against us regardless of our responsibility for the failure, which could expose us to liability.
We provide business management solutions that we believe are critical to the operations of our customers’ businesses and provide benefits that may be difficult to quantify. Any failure of a customer’s system installed or of the services offered by us could result in a claim for substantial damages against us, regardless of our responsibility for the failure. Although we attempt to limit our contractual liability for damages resulting from negligent acts, errors, mistakes or omissions in rendering our services, we cannot assure you that the limitations on liability we include in our agreements will be enforceable in all cases, or that those limitations on liability will otherwise protect U.S. from liability for damages. In the event that the terms and conditions of our contracts which limit our liability are not sufficient, we have insurance coverage. This coverage of approximately $5,000,000 in the aggregate in the U.K. and in the U.S. insures the business for negligent acts, error or omission, failure of the technology services to perform as intended, and breach of warranties or representations. It also insures the services that we supply including, web services, consulting, analysis, design, installation, training, support, system integration, the manufacture, sale, licensing, distribution or marketing of software, the design and development of code, software and programming and the provision of software applications as a service, rental or lease. However, there can be no assurance that our insurance coverage will be adequate or that coverage will remain available at acceptable costs. Successful claims brought against U.S. in excess of our insurance coverage could seriously harm our business, prospects, financial condition and results of operations. Even if not successful, large claims against U.S. could result in significant legal and other costs and may be a distraction to our senior management.
Because we have international operations, we will be subject to risks of conducting business in foreign countries.
International operations constitute a significant part of our business, and we are subject to the risks of conducting business in foreign countries, including:
| • | difficulty in establishing or managing distribution relationships; |
| • | different standards for the development, use, packaging and marketing of our products and technologies; |
| • | our ability to locate qualified local employees, partners, distributors and suppliers; |
| • | the potential burden of complying with a variety of foreign laws and trade standards; and |
| • | general geopolitical risks, such as political and economic instability, changes in diplomatic and trade relations, and foreign currency risks and fluctuations. |
No assurance can be given that we will be able to positively manage the risks inherent in the conduct of our international operations or that such operations will not have a negative impact on our overall financial operations.
We do not intend to declare dividends on our common stock.
We will not distribute dividends to our stockholders until and unless we can develop sufficient funds from operations to meet our ongoing needs and implement our business plan. The time frame for that is inherently unpredictable, and you should not plan on it occurring in the near future, if at all.
Item 1B. Unresolved Staff Comments.
Not applicable.
Our corporate offices are located at Maple Park, Maple Court, Tankersley, Barnsley, U.K. S75 3DP.
| 19 |
MAM US VAST Division has an office at 3435 Winchester Rd, Ste. 100, Allentown PA, 18104 and the phone number at that office is 610-336-9045. The Allentown, Pennsylvania office is approximately 7,105 square feet in size and is leased for a monthly cost of $11,600.
MAM US Autopart Division shares office space with the VAST Division and the telephone number is 610-351-2928.
MAM Ltd. has three offices. It has headquarters at Maple Park, Maple Court, Tankersley, S75 3DP, U.K. The phone number is 0-11-44-122-635-2900. It also has a regional office at 15 Duncan Close, Red House Square, Moulton Park, Northampton, NN3 6WL, U.K. The phone number is 44-160-449-4001. It has second regional office at Leanne Business Centre, Sandford Lane, Wareham, Dorset, BH20 4DY, U.K. The phone number is 44-192-955-0922. MAM Software leases approximately 15,250 square feet at its company headquarters at a monthly cost of approximately $20,400. It leases approximately 1,223 square feet at its Northampton office at a monthly cost of approximately $1,700 and approximately 717 square feet at its Wareham office at a monthly cost of approximately $930.
Although there are no pending legal proceedings against the Company, from time to time, the Company may become involved legal proceedings, lawsuits, claims and regulations in the ordinary course of its business.
Item 4. Mine Safety Disclosures
Not applicable.
Item 5. Market for Registrant’s Common Equity, Related Stockholder Matters and Issuer Purchases of Equity Securities.
Our common stock is traded on the NASDAQ Capital Market under the symbol “MAMS.” As of June 30, 2014, there were approximately 359 shareholders of record and 15,077,830 shares of common stock issued and 14,404,149 shares outstanding. As of September 22, 2014, there were approximately 334 shareholders of record and 14,298,053 shares of common stock issued and outstanding.
On September 22, 2014, the bid and ask prices of our common stock were $5.81 and $6.00 per share, respectively, as reported by the NASDAQ Capital Market. The following table shows the range of high and low bids per share of our common stock as reported by the NASDAQ Capital Market for the fiscal year periods indicated. Such market quotations reflect inter-dealer prices, without retail mark-up, markdown or commission, and may not necessarily represent actual transactions.
On March 25, 2011, (“the Effective Date”), the Company amended its Certificate of Incorporation to effectuate a one-for-one hundred reverse stock split, followed by a ten-for-one forward stock split. Pursuant to this transaction, every 100 shares of the Company's common stock were converted into one share of the Company's common stock. Immediately thereafter, a forward stock split was undertaken whereby each share of common stock was converted into 10 shares of common stock. Stockholders owning fewer than 100 shares of common stock whose interests were converted into fewer than 1 share of common stock pursuant to the reverse split, were converted into the right to receive an amount equal to the average daily closing price per share of the common stock on the OTC Bulletin Board (which was the principal market for trading our common stock at that time) for the five trading days immediately before and including the Effective Date, without interest. Stockholders who held 100 or more shares as of the Effective Date received fractional shares in the reverse split and were not cashed out. Any fractional shares held after the ensuing forward split were rounded up to the nearest whole share.
| 20 |
| 2013 | ||||||||
| High | Low | |||||||
| 1st Quarter ended September 30, 2012 | $ | 2.75 | 2.11 | |||||
| 2nd Quarter ended December 31, 2012 | $ | 3.33 | 2.55 | |||||
| 3rd Quarter ended March 31, 2013 | $ | 3.84 | 2.85 | |||||
| 4th Quarter ended June 30, 2013 | $ | 5.00 | 3.40 | |||||
| 2014 | ||||||||
| High | Low | |||||||
| 1st Quarter ended September 30, 2013 | $ | 4.81 | 3.75 | |||||
| 2nd Quarter ended December 31, 2013 | $ | 5.39 | 3.35 | |||||
| 3rd Quarter ended March 31, 2014 | $ | 6.29 | 4.98 | |||||
| 4th Quarter ended June 30, 2014 | $ | 5.94 | 4.91 | |||||
Dividends
We have never declared or paid dividends on our common stock, and our board of directors does not intend to declare or pay any dividends on the common stock in the foreseeable future. Our earnings are expected to be retained for use in expanding our business. The declaration and payment in the future of any cash or stock dividends on the common stock will be at the discretion of the board of directors and will depend upon a variety of factors, including our future earnings, capital requirements, financial condition and such other factors as our board of directors may consider to be relevant from time to time.
Securities Authorized For Issuance under Equity Compensation Plans
Equity Compensation Plan Information as of June 30, 2014
| Plan Category | Number of Securities to Be Issued upon Exercise of Outstanding Options | Weighted Average Exercise Price of Outstanding Options | Number of Securities Remaining Available for Future Issuance under the Plan (2) | |||||||||
| (a) | (b) | (c) | ||||||||||
| Equity compensation plans approved by security holders (1) | 120,484 | $ | 1.23 | 1,940,138 | ||||||||
| Equity compensation plans not approved by security holders | - | - | - | |||||||||
| Total | 120,484 | $ | 1.23 | 1,940,138 | ||||||||
| (1) | Represents the shares authorized for issuance under the Aftersoft Group, Inc. 2007 Long-Term Incentive Plan, which was approved by the Company’s shareholders at the Annual Meeting held on June 12, 2008. The maximum aggregate number of shares of Common stock that may be issued under the Plan, including Stock Options, Stock Awards, and Stock Appreciation Rights is limited to 15% of the shares of common stock outstanding on the first trading day of any fiscal year, or 2,060,622 for fiscal 2015. |
| (2) | As of July 1, 2014. |
Recent Sales of Unregistered Securities
On April 3, 2014, the Company issued 3,118 shares of common stock to a certain directors in lieu of cash compensation, which were valued at approximately $17,000 based on the closing market price of the Company’s common stock on April 1, 2014.
On April 3, 2014, the Company issued 16,759 shares of common stock valued at approximately $43,000 to the non - management members of the Board of Directors under the Company’s 2007 LTIP.
| 21 |
During the quarter ended September 30, 2014, the Company issued 8,464 shares of common stock to employees, including officers, under the ESPP in lieu of compensation, which were valued at approximately $37,000 based on the closing market price of the Company’s common stock on January 2, 2014.
On July 8, 2014, the Company issued 16,765 shares of common stock to certain directors, which were valued at approximately $43,000 based on the closing market price of the Company’s common stock on the date of the grant.
On July 8, 2014, the Company issued 3,061 shares of common stock to certain directors, in lieu of cash compensation, which were valued at approximately $17,000 based on the closing market price of the Company’s common stock on the date of the grant.
On September 23, 2014, the Company released from escrow 174,804 shares of common stock to certain executives of the Company which vested pursuant to the terms of the April 20, 2012 grant as the market price threshold of the common stock had been achieved. The shares were issued pursuant to the Company’s LTIP and the executives employment agreements. The Company withheld 66,347 shares which were used to pay taxes and those shares were retired by the Company.
On September 23, 2014, the Company released from escrow 84,676 shares of common stock to an officer of a subsidiary of the Company which vested pursuant to the terms of the March 1, 2013 grant as the market price threshold of the common stock had been achieved. The shares were issued pursuant to the Company’s LTIP and the officer’s employment agreement. The Company withheld 44,455 shares which were used to pay taxes and those shares were retired by the Company.
On September 23, 2014, the Company released from escrow 50,178 shares of common stock to a certain executive of the Company which vested pursuant to the terms of the July 1, 2013 grant as the market price threshold of the common stock had been achieved. The shares were issued pursuant to the Company’s LTIP and the executive’s employment agreement. The Company withheld 23,584 shares which were used to pay taxes and those shares were retired by the Company.
These transactions were not registered under the Securities Act in reliance on an exemption from registration set forth in Section 4(a)(2) of the Securities Act in a transaction by the Company not involving a public offering as the shares were granted as compensation for services and the recipients had access to adequate current public information concerning the Company.
Item 6. Selected Financial Data.
Not applicable.
Item 7. Management Discussion and Analysis of Financial Condition and Results of Operations.
Some of the statements contained in this Annual Report on Form 10-K, which are not purely historical, are forward-looking statements, including, but not limited to, statements regarding the Company’s objectives, expectations, hopes, beliefs, intentions or strategies regarding the future. In some cases, you can identify forward-looking statements by the use of the words “may,” “will,” “should,” “expects,” “plans,” “intends,” “anticipates,” “believes,” “estimates,” “predicts,” “potential,” or “continue” or the negative of those terms or other comparable terminology. Although we believe that the expectations reflected in the forward-looking statements are reasonable, our actual results could differ materially from those disclosed in these statements due to various risk factors and uncertainties affecting our business. We caution you not to place undue reliance on these forward-looking statements. We do not assume responsibility for the accuracy and completeness of the forward-looking statements and we do not intend to update any of the forward-looking statements after the date of this report to conform them to actual results. You should read the following discussion in conjunction with our financial statements and related notes included elsewhere in this report.
| 22 |
Critical Accounting Policies
Our consolidated financial statements have been prepared in accordance with accounting principles generally accepted in the United States of America. The preparation of these consolidated financial statements requires us to make estimates and judgments that affect the reported amounts of assets, liabilities, revenues and expenses, and related disclosure of contingent assets and liabilities. We base our estimates on historical experience and on various other assumptions that are believed to be reasonable under the circumstances, the results of which form the basis of making judgments about the carrying values of assets and liabilities that are not readily apparent from other sources. Actual results may differ from these estimates under different assumptions or conditions.
We believe the following critical accounting policies, among others, affect our more significant judgments and estimates used in the preparation of our consolidated financial statements:
Fair Value of Financial Instruments
The Company’s financial instruments consist principally of cash and cash equivalents, accounts receivable, accounts payable, accrued expenses, and debt instruments.
Financial assets and liabilities that are remeasured and reported at fair value at each reporting period are classified and disclosed in one of the following three categories:
| · | Level 1 – Fair value based on quoted prices in active markets for identical assets or liabilities. |
| · | Level 2 – Fair value based on significant directly observable data (other than Level 1 quoted prices) or significant indirectly observable data through corroboration with observable market data. Inputs would normally be (i) quoted prices in active markets for similar assets or liabilities, (ii) quoted prices in inactive markets for identical or similar assets or liabilities or (iii) information derived from or corroborated by observable market data. |
| · | Level 3 – Fair value based on prices or valuation techniques that require significant unobservable data inputs. Inputs would normally be a reporting entity’s own data and judgments about assumptions that market participants would use in pricing the asset or liability. |
Allowance for Doubtful Accounts
We maintain allowances for doubtful accounts for estimated losses resulting from the inability of our customers to make required payments. The allowance for doubtful accounts is based on specific identification of customer accounts and our best estimate of the likelihood of potential loss, taking into account such factors as the financial condition and payment history of major customers. We evaluate the collectibility of our receivables at least quarterly. The allowance for doubtful accounts is subject to estimates based on the historical actual costs of bad debt experienced, total accounts receivable amounts, age of accounts receivable and any knowledge of the customers’ ability or inability to pay outstanding balances. If the financial condition of our customers were to deteriorate, resulting in impairment of their ability to make payments, additional allowances may be required. The differences could be material and could significantly impact cash flows from operating activities.
Software Development Costs
Costs incurred to develop computer software products to be sold or otherwise marketed are charged to expense until technological feasibility of the product has been established. Once technological feasibility has been established, computer software development costs (consisting primarily of internal labor costs) are capitalized and reported at the lower of amortized cost or estimated realizable value. Purchased software development cost is recorded at its estimated fair market value. When a product is ready for general release, its capitalized costs are amortized on a product-by-product basis. The annual amortization is the greater of the ratio that current gross revenue for a product bear to the total of current and anticipated future gross revenues for that product: and, the straight-line method over the remaining estimated economic life (a period of three years) of the product including the period being reported on. If the future market viability of a software product is less than anticipated, impairment of the related unamortized development costs could occur, which could significantly impact the Company’s results of operations.
| 23 |
Goodwill
Goodwill that has indefinite useful lives are not amortized but rather are tested at least annually for impairment. Goodwill is subject to impairment reviews by applying a fair-value-based test at the reporting unit level, which generally represents operations one level below the segments reported by the Company.
Long-Lived Assets
The Company’s management assesses the recoverability of long-lived assets (other than goodwill discussed above) upon the occurrence of a triggering event by determining whether the carrying value of the long-lived asset can be recovered through projected undiscounted future cash flows over its remaining life. The amount of long-lived asset impairment, if any, is measured based on fair value and is charged to operations in the period in which long-lived asset impairment is determined by management. At June 30, 2014, management believes there is no impairment of its long-lived assets. There can be no assurance, however, that market conditions will not change or demand for the Company’s products and services will continue, which could result in impairment of long-lived assets in the future.
Revenue Recognition
Software license revenue is recognized when persuasive evidence of an arrangement exists, delivery of the product component has occurred, the fee is fixed and determinable, and collectability is probable. If any of these criteria are not met, revenue recognition is deferred until such time as all of the criteria are met. The Company accounts for delivered elements in accordance with the selling price when arrangements include multiple product components or other elements and vendor-specific objective evidence exists for the value of all undelivered elements. Revenues on undelivered elements are recognized once delivery is complete.
In those instances in which arrangements include significant customization, contractual milestones, acceptance criteria or other contingencies (which represents the majority of the Company’s arrangements), the Company accounts for the arrangements using contract accounting, as follows:
| 1) | When customer acceptance can be estimated, but reliable estimated costs to complete cannot be determined, expenditures are capitalized as work-in process and deferred until completion of the contract at which time the costs and revenues are recognized. |
| 2) | When customer acceptance cannot be estimated based on historical evidence, costs are expensed as incurred and revenue is recognized at the completion of the contract when customer acceptance is obtained. |
The Company records amounts collected from customers in excess of recognizable revenue as deferred revenue in the accompanying consolidated balance sheets.
Revenues for maintenance agreements, software support, on-line services and information products are recognized ratably over the term of the service agreement.
Income Taxes
Deferred tax assets and liabilities are recognized for the future tax consequences attributable to differences between the financial statement carrying amounts of existing assets and liabilities and their respective tax bases. Deferred tax assets and liabilities are measured using enacted tax rates expected to apply to taxable income in the years in which those temporary differences are expected to be recovered or settled. The effect on deferred tax assets and liabilities of a change in tax rates is recognized in income in the period the enactment occurs. Deferred taxation is provided in full in respect of timing differences between the treatment of certain items for taxation and accounting purposes. Valuation allowances are established, when necessary, to reduce deferred tax assets to the amount expected to be realized.
| 24 |
Overview
MAM Software Group, Inc. (“MAM,” the “Company,” “we,” “our,” or “us”) is a technology holding company that has one wholly owned subsidiary based in the U.S., MAM Software, Inc. (“MAM US”) and one wholly owned subsidiary based in the U.K., MAM Software Limited (“MAM Ltd.”) based in Tankersley, Barnsley, U.K., which operate independently from one another.
MAM US has two divisions, VAST and Autopart, which are both based in Allentown, Pennsylvania. We have and continue to market and develop business management software solutions that manage both the business and supply chain for small- and medium-sized firms in the automotive aftermarket. The automotive aftermarket includes those businesses that supply servicing, parts, oil, tires, and performance extras to the retail market.
We believe that the largest single issue facing the automotive aftermarket at this time is the down turn of the global economy, especially the economies in which we operate. The constraint of credit within the U.S. and U.K. markets is forcing automobile owners to retain their existing automobiles far longer than they may have previously planned. This phenomenon is forcing owners to seek out more economic ways of maintaining their vehicles, and we believe this presents an opportunity to the Company. The need for consumers to maintain their vehicles longer requires service suppliers to offer a wide range of services at highly competitive prices. We believe that this can be achieved only by those businesses that are able to efficiently manage their businesses and find methods to reduce costs without affecting service levels, which may best be done through investments in ‘up to date’ management information systems, specifically those designed for the automotive market. However, we have recently noticed that some businesses wishing to invest in new management systems are also finding their access to credit reduced. This may have a detrimental effect on our revenues if customers are unable to fund purchases. We still believe that the aftermarket landscape will continue to change over the next 18 months, with the convergence of the aftermarket and tire markets, but this rate of change maybe slower than first expected.
Our revenue and income is derived primarily from the sale of business management software, data, ecommerce solutions and services and support. In the U.K., we also earn a percentage of our revenue and income from the sale of hardware systems to clients. In the year ended June 30, 2014 we generated revenues of $30,690,000 and had net income of $1,672,000; 73% of these revenues came from the U.K. market.
We are headquartered in Tankersley, Barnsley, U.K. and maintain additional offices for our U.S. operating subsidiary in Allentown, Pennsylvania, and, for our U.K. operating subsidiary, in Northampton and Wareham. The software that we sell is mainly a Microsoft WindowsTM based technology, although we do still have an older ‘Green Screen’ terminal-based product. The four main products that we support in the U.S. cover all of the components of the automotive aftermarket supply chain. First is “warehouse distribution.” Into this market we sell our Autopart product to new prospects and continue to support our Direct Step product. Both products enable large warehouses with hundreds of thousands of stock keeping units (sku’s) to locate, manage, pack and deliver the parts with ease and efficiency. Second, these parts are distributed to the next business in the chain, which is the “jobber.” Into this market segment we also sell our Autopart product, which manages a jobber’s whole business (i.e., financial, stock control and order management) but more importantly enables the jobber to quickly identify the parts that the jobber’s client needs, either via the Internet or telephone, so that the correct product for the vehicle on the ramp can be supplied. The third and next segment of the automotive aftermarket supply chain is the “installer,” which repairs and maintains automobiles. The installer needs systems that enable it to efficiently and simply manage his businesses, whether as a single entity or national multi-site franchise. Into this segment we sell VAST. The fourth segment is the “OpenWebs™.” This technology allows these three separate business solutions to connect to each other to allow, among other processes, ordering, invoicing and stock checking to take place in real- time both up and down the supply chain. The U.K. market differs from that of the U.S. in that it does not have the same number of large warehouse distribution centers, so we do not sell the Direct Step product in the U.K. We continue to sell the Autopart product to the jobber market, but sell Autowork Online to the installer market. In the U.K., we also sell our catalog solution, Autocat+, which is an Internet-based identification tool used by the warehouse distribution, jobber and installer.
To date, our management has identified five areas of focus to drive our business. The first area is the continued growth of revenues derived from delivering our business management, commonly known as SaaS. To date our Autowork Online, “installer” solution in the U.K and Autopart Online, our parts store solutions are being delivered in this way. Both products have been developed by MAM Ltd., our U.K. subsidiary, under the ‘cloud’ computing model. This is where software solutions are made available to end- users via the Internet and does not require them to purchase the software directly but ‘rent’ it over a fixed period of time. Our management believes that this will be a rapidly growing market for the U.K. as businesses continue to look for ways of reducing capital expenditures while maintaining levels of service. Autowork Online was launched in 2010 and as of June 30, 2014 we had 3,144 subscribers of this service. A white label version of this product has been successfully launched into the U.S. market in conjunction with ALLDATA LLC. Autopart Online was launched in August 2011, and as of June 30, 2014 we had 892 end users subscribing to this service.
| 25 |
The second area of focus is the sales and marketing strategy within the U.S. market. The U.S. business has a new marketing team and has developed an internal sales staff. Our management is committed to the continued development of the MAM brand.
The third area of focus relates to the launch of our information service, Autocat+ in the U.S. Autocat+ is an auto parts catalog that uses the DaaS distribution model. MAM Software Limited centrally hosts and maintains the data, which is accessed by users via MAM's business management software, a standalone desktop application, or web application. Data can also be 'consumed' via a Web Service for integration into B2C websites. Information in Autocat+ is maintained through an automatic verification and standardization process, with updates published daily.
In the U.K., there are approximately 11,500 end-users (warehouse distributors, parts stores and auto service providers) who use our information products, for which a monthly or annual subscription fee is charged. Our management believes that launching a U.S. version of Autocat+ will help to sell our business management software solutions.
The fourth area is within the U.K. market and we are continually working to sustain the levels of growth in the U.K. business by focusing on additional vertical markets, which share common issues to that of the automotive market. We have developed a reputation of high levels of service and knowledge within the automotive market; and are now working on replicating this reputation in these additional vertical markets. Our management intends to carefully monitor this expansion as a result of the current state of the global economy.
The fifth area is the continued investment in research and development that will allow us to deliver innovative new solutions and modules in support of the previous four key areas. During the year ended June 30, 2014, a number of new modules were launched including SalesRep, a new tablet APP for sales representatives, and a parts listing tool for eBay in the UK and Ireland that integrates seamlessly with Autopart.
At present, most of our customers in the U.K. have our software installed in-house. However, market acceptance of cloud computing for mission critical enterprise applications has become increasingly common in recent years since software can be delivered cost-effectively, reliably, and securely to businesses over the Internet without the need for these businesses to purchase supporting software and hardware for an on-premise system or the need to keep IT people on staff to monitor and upgrade such a system.
We introduced our first subscription-based service solution over the Internet in 2005 in the U.K., and we began marketing our first cloud system to customers in North America in 2013. Since that time, we have significantly expanded our cloud-based offerings and are offering customers that maintain in-house installations significant incentives to move to our cloud-computing model. While transitioning our U.K. customers to a cloud computing model results in a decrease in our up-front revenue recognition, we believe that this is a necessary transition and is in the best interests of our customers and our own long-term business prospects as an increasing number of our customers in the U.K. are looking for solutions that are highly functional, easy to use, configurable, and fast.
Impact of Currency Exchange Rate
Our net revenue derived from sales in currencies other than the U.S. dollar was 73% and 69% for the years ended June 30, 2014 and June 30, 2013, respectively. As the U.S. dollar weakens in relation to the Great Britain Pound (“GBP”), as it has recently done, our revenue and income, which is reported in U.S. dollars, is positively impacted. Changes in the currency values occur regularly and in some instances may have a significant effect on our results of operations.
Income and expenses of MAM Ltd. are translated at the average exchange rate. The exchange rate for MAM Ltd.’s operating results was US $1.6259 per GBP for the year ended June 30, 2014, compared with U.S. $1.5676 per GBP for the year ended June 30, 2013.
Assets and liabilities of MAM Ltd. are translated into U.S. dollars at the period-end exchange rates. The exchange rate used for translating MAM Ltd. was U.S. $1.7028 per GBP at June 30, 2014 and U.S. $1.5208 per GBP at June 30, 2013.
Currency translation (loss) adjustments are accumulated as a separate component of stockholders’ equity, which totaled ($152,000) and ($1,168,000) as of June 30, 2014 and 2013, respectively.
Backlog
As of June 30, 2014, we had a backlog of unfilled orders of business management systems of $2,047,000, compared to a backlog of $1,697,000 at June 30, 2013. We expect to fill approximately 65% of such backlog during the next six months.
| 26 |
Results of Operations
Our results of operations for the fiscal year ended June 30, 2014 compared with the year ended June 30, 2013 were as follows:
Revenues. Revenues increased $3,224,000 or 11.7% to $30,690,000 for the year ended June 30, 2014, compared with $27,466,000 for the year ended June 30, 2013. For the twelve months ended June 30, 2014, recurring revenues increased $3,035,000 or 15.7% to $22,380,000 from $19,345,000 and system sales increased $189,000 or 2.3% to $8,310,000 from $8,121,000.
Revenues in our U.K. operations were 13,753,000GBP for the year ended June 30, 2014 as compared to 12,043,000GBP for the year ended June 30, 2013. Revenues increased 1,710,000GBP or 14.2% primarily from increased recurring revenue and system sales. The U.S. dollar denominated revenue was $22,361,000 for 2014 as compared to $18,878,000 for 2013, an increase of $3,483,000 or 18.5%. For the twelve months ended June 30, 2014, U.K. recurring revenues increased 1,022,000GBP or 13% to 10,120,000GBP from 9,098,000GBP and systems sales increased 591,000GBP or 19% from 3,633,000GBP to 3,042,000GBP. The increase in recurring revenues is primarily the result of increased sales of our Autopart Online product. Autopart Online revenue increased $876,000 or 259% to $1,213,000 from $337,000.
Revenues in our U.S. operations decreased $258,000 or 3% to $8,329,000 in 2014 from $8,587,000 in 2013, the result of decreased software sales of $1,102,000 and increased recurring revenues of $844,000. U.S. revenue for VAST rental increased $41,000 or 32.5% to $164,000 from $126,000 compared to the same period last year.
Cost of Revenues. Total cost of revenues increased $2,576,000 or 22.6% to $13,968,000 for the year ended June 30, 2014, compared with $11,392,000 for the year ended June 30, 2013. Cost of revenues as a percentage of revenues increased from 45% for the year ended June 30, 2013 to 46% for the year ended June 30, 2014. The increased costs are directly related to the increase in revenue and from additional costs for salaries and related expenses as we continue to invest for the future. MAM Software Limited’s expenses increased 767,000GBP or 15% in 2014, to 5,773,000GBP from 5,006,000GBP in 2013. U.K. expenses reported in U.S. dollars increased $1,539,000 or 20% primarily due to higher direct costs of $800,000 that include an increase of $459,000 in hardware, additional payroll, related benefits and travel expenses of $280,000, additional salesforce.com related licensing costs of $207,000. The U.S. expenses increased $1,038,000 to $4,583,000 from $3,545,000 in 2013. The increased costs compared to the prior year in the U.S. was primarily due to increased payroll, benefit costs and related travel expenses of $590,000, and higher third party subscription costs for products we resell of $120,000.
Operating Expenses. The following tables set forth, for the periods indicated, our operating expenses and the variance thereof:
| For the Twelve Months Ended June 30, | ||||||||||||||||
| 2014 | 2013 | $ Variance | % Variance | |||||||||||||
| Research and development | $ | 3,743,000 | $ | 3,405,000 | $ | 338,000 | 9.9 | % | ||||||||
| Sales and marketing | 4,518,000 | 3,348,000 | 1,170,000 | 34.9 | % | |||||||||||
| General and administrative | 4,974,000 | 4,163,000 | 811,000 | 19.5 | % | |||||||||||
| Depreciation and amortization | 1,031,000 | 1,149,000 | (118,000 | ) | -10.4 | % | ||||||||||
| Total Operating Expenses | $ | 14,266,000 | $ | 12,065,000 | $ | 2,201,000 | 15.2 | % | ||||||||
Operating expenses increased by $2,201,000 or 15.2% for the year ended June 30, 2014 compared with the year ended June 30, 2013. This is due to the following:
Research and Development Expenses. Research and development expenses increased $338,000 or 9.9% for the year ended June 30, 2014, when compared with the previous fiscal year. This increase was due to an increase in engineering personnel and related costs of approximately $600,000 in the U.K. offset by approximately $275,000 in the U.S., compared to 2013.
| 27 |
Sales and Marketing Expenses. Sales and marketing expenses increased by $1,170,000 or 34.9% for the year ended June 30, 2014 compared with the year ended June 30, 2013. The U.K. business experienced an increase in expenses of approximately $260,000 from the addition of sales personnel. The U.S. business experienced an increase in expenses of approximately $600,000 from additions in advertising and show expenses of $192,000, approximately $280,000 for additional sales and marketing personnel including additional travel expenses and related expenses.
General and Administrative Expenses. General and administrative expenses increased by $811,000 or 19.5% to $4,975,000 for the year ended June 30, 2014 as compared from $4,163,000 for the year ended June 30, 2013. The increased expenses were the result of an addition to the reserve for bad debts in the U.K. of $283,000, and additional salaries and benefits for administration staff in the U.K. and U.S. business units. Additional expenses in the U.S. were approximately $336,000 for additional payroll and related expenses which included the new president for North America, additional officer’s equity compensation of $80,000, approximately $80,000 of expenses for the preparation of bid documents for a major contract, and $137,000 in travel expenses when compared to the year ended June 30, 2013.
Depreciation and Amortization Expenses. Depreciation and amortization expenses decreased by $118,000 for the year ended June 30, 2014 as compared with the same period in 2013.
Interest Expense. Interest expense decreased by $106,000 to $40,000 for the year ended June 30, 2014. The decrease in interest expense is primarily related to the reduction of our interest bearing loans. HSBC cash interest was approximately $25,000 for the year ended June 30, 2014 and debt issuance cost amortization was approximately $400, compared to cash interest of approximately $120,000 and debt issuance cost amortization of $11,000 for the year ended June 30, 2013.
Other Income (Expenses). There was no activity for other income (expenses) for the year ended June 30, 2014. Other income (expenses) for the year ended June 30, 2013 included an adjustment for the change in fair value of derivative liabilities of ($271,000), a gain on settlement of derivative liabilities of $131,000 and gain on the settlement of liabilities of $13,000.
Income Taxes. Income taxes increased $21,000 to $744,000 for the year ended June 30, 2014 as compared to $723,000 for the year ended June 30, 2013. This decrease was the result of a reduced tax expense for the U.K. business in fiscal 2014 when compared to 2013.
Net Income. We realized income of $1,672,000 for the year ended June 30, 2014 compared with income of $3,013,000 for the year ended June 30, 2013.
Liquidity and Capital Resources
Our principal sources of liquidity are cash on hand and cash generated from operations. To date, most of our profits have been generated in Europe, but with the introduction of new products and our successful efforts to streamline our U.S. operations, we expect the U.S business to increase revenue and profits. We expect this revenue trend to continue and look forward to an increase in overall revenues from our U.S. operations in fiscal 2015. We expect to invest in additional sales and marketing staff and to increase our professional services and support staff.
During the year ended June 30, 2014 we repaid approximately $325,000 on our HSBC Loan and on our secured notes. These payments were made from cash flow generated from operations. We purchased 167,392 shares of our common stock at a cost of $845,000 and were able to increase our cash position by $2,947,000. All interest bearing debt has been repaid.
We believe our existing cash balance, and the cash expected to be generated from operations, will be sufficient to meet our anticipated cash needs for at least the next 12 months. Our future capital requirements will depend on many factors, including our level of net sales, the timing and extent of expenditures to support our development activities and the continued market acceptance of our products. We could be required, or we may choose, to seek additional funding through public or private equity or debt financing. In addition, in connection with any future acquisitions, we may require additional funding which may be provided in the form of additional debt or equity financing or a combination of both. These additional funds may not be available on terms acceptable to us, or at all.
| 28 |
Working Capital
Working capital at June 30, 2014 was $5,599,000 compared to $3,502,000 at June 30, 2013. The working capital increase resulted primarily from a $2,947,000 increase in cash, a $346,000 increase in net accounts receivable, an increase of $12,000 in inventories, a decrease of $471,000 in prepaid expenses and other current assets, a $64,000 increase in accounts payable, a $331,000 increase in accrued expenses and other liabilities, a $506,000 increase in accrued payroll and other taxes, a $325,000 decrease in debt, an increase of $91,000 in the current portion of deferred revenue, an increase of $124,000 in sales tax payable, and an decrease of $67,000 in income tax payable.
Capital Expenditures
Capital expenditures for fiscal 2014 and 2013 were $747,000 and $679,000 respectively.
HSBC Bank plc.
On October 25, 2010, MAM Ltd., entered into a three-year term loan agreement with HSBC Bank plc. (“HSBC”) as lender (the “HSBC Term Loan”). The HSBC Term Loan provided for £1,324,550 (approximately $2.0 million at the exchange rate on October 25, 2010) with a term of three years from the date the HSBC Term Loan was first drawn down. The HSBC Term Loan was repaid in thirty-six (36) monthly installments, inclusive of interest, together with such sums in the final month to discharge the balance of the HSBC Term Loan.
The interest rate under the HSBC Term Loan was 2.9% per annum over HSBC’s Sterling Base Rate, as published from time to time, which totaled 3.4% at June 30, 2013.
The HSBC Term Loan was secured by the following instruments: a guarantee granted by the Company, VAST and Autopart in favor of HSBC pursuant to which each would guarantee the repayment of the HSBC Term Loan (the “Guarantee”); an all assets debenture granted by MAM Ltd. in favor of HSBC including a first fixed charge over book debts and stock, which would have created fixed and floating the charges over the assets and undertaking of MAM Ltd. for the provision of the HSBC Term Loan (“Debenture”); and a mortgage of the life insurance policies in favor of MAM Ltd. in relation to a Company employee and the Company’s CEO. The Company recorded debt issuance fees of approximately $60,000 related to the HSBC Term Loan, which was amortized over the life of the loan. Amortization expense was $1,000 and $11,000 for the years ended June 30, 2014 and 2013, respectively.
The HSBC Term Loan contains various financial covenants. As of June 30, 2013, the Company was in compliance with or obtained waivers for all such covenants. The Term Loan was repaid in October 2013.
Off Balance Sheet Arrangements
We do not have any relationships with unconsolidated entities or financial partnerships, such as entities often referred to as structured finance or special purpose entities, which would have been established for the purpose of facilitating off-balance sheet arrangements or other contractually narrow or limited purposes. In addition, we do not have any undisclosed borrowings or debt, and we have not entered into any synthetic leases. We are, therefore, not materially exposed to any financing, liquidity, market or credit risk that could arise if we had engaged in such relationships.
Current Products and Services
Meeting the needs of the automotive aftermarket requires a combination of business management systems, information products and online services that combine to deliver benefits for all parties involved in the timely repair of a vehicle. Our products and services include:
| · | Business management systems comprised of our proprietary software applications, implementation and training and third-party hardware and peripherals; |
| 29 |
| · | Information products such as an accessible catalog database related to parts, tires, labor estimates, scheduled maintenance, repair information, technical service bulletins, pricing and product features and benefits, which are used by the different participants in the automotive aftermarket; |
| · | Online services and products that connect manufacturers, warehouse distributors, retailers and automotive service providers via the Internet. These products enable electronic data interchange throughout the automotive aftermarket supply chain among the different trading partners. They also enable procurement and business services to be projected over the Internet to an expanded business audience. Some U.K. clients use our information products on their own websites and intranets; some clients in North America and the U.K. use our systems and branded software to obtain relevant and up-to-date information via the Internet; and |
| · | Customer support and consulting services that provide phone and online support, implementation and training. |
Need for Technology Solutions
A variety of factors drive the automotive market’s need for sophisticated technology solutions, including the following:
Inventory Management
Industry sources suggest that approximately 35% of parts produced are never sold and 30% of parts stocked are never sold. Approximately 25% of parts sold are eventually returned due to insufficient knowledge or capability by either the parts supplier counterman or the auto service provider installer. Clearly, there is substantial inefficiency in the automotive aftermarket supply chain. This inefficiency results in excess inventory carrying costs, logistical costs and the over-production of parts and tires at the manufacturer level. Overcoming these challenges requires the combination of business systems software, information products, and connectivity services we offer.
Competition
In the U.S., the need for technology solutions has been accelerated by the expansion of large specialty parts retailers such as Advance Auto Parts, Inc. and large auto service chains like Monro Muffler and Brake, Inc. This expansion has driven smaller competitors to computerize or upgrade their existing systems with more modern business management solutions enabled for information products and online services. Many of the systems used by smaller competitors today are older, character-based or systems developed in-house that have a limited ability to integrate current information products and online services.
Volume and Complexity of Information
Businesses in the automotive aftermarket manage large volumes of information from numerous sources with complex inter-relationships. There are over 4.5 million different stock-keeping units (“SKU”) available to parts sellers in the product catalogs used by the U.S. automotive aftermarket. The numbers of SKU increase in the order of some 5% each year. Moreover, manufacturers update product information and product prices with increasing frequency as they improve their internal processing and try to keep pace with consumer trends. As a result, most automotive aftermarket businesses require sophisticated inventory management systems, accurate and timely information on parts, tires, and repair delivered through online services to communicate, manage and present this volume of data effectively.
Customer Service Requirements
Consumer demand for same-day repair service and the need to maintain efficient use of repair bays, forces automotive service providers to demand prompt and accurate delivery of specific parts and tires from their suppliers. Getting the required product promptly depends on all the parties having access to timely information about product price and availability. To meet these demanding customer service requirements successfully, automotive aftermarket participants need business management systems, product information and online services that enable workers to reliably and accurately transact their business between warehouse distributors, parts stores and automotive service providers.
| 30 |
Regional Efficiencies
The use and availability of a combination of business management systems, information products and online services has resulted in the development of regional trading networks among auto service provider chains, stores and warehouse distributors of parts and tires. This enables participants to achieve the efficiencies and customer service levels that are critical to being competitive and successful against the larger retail and service chains in the automotive aftermarket.
Areas of Growth
We expect growth in the automotive aftermarket will continue to be driven by:
| · | gradual growth in the aggregate number of vehicles in use; |
| · | an increase in the average age of vehicles in operation; |
| · | growth in the total number of miles driven per vehicle per year; and |
| · | increased vehicle complexity. |
Plans for Growth
We see opportunities to expand the breadth of our client base within the automotive industry and diversify into new industries with similarly complex needs. We plan to offer tailored business management and distribution software to the wholesale distributor market of the automotive industry. We have also started to expand and diversify our client and product mix in the U.K. to serve the lumber and hardware industries, which we believe have an unmet need for the efficiency offered by our suite of business software solutions and services. Our growth plans include adapting and updating our software products to serve other vertical markets as well as through potential acquisitions.
Additional Vertical Markets: Plumbing Merchants, Electrical Wholesalers, Builders Merchants and Lumber Merchants.
We believe that construction-related businesses would benefit from the business management and distribution systems developed by MAM Software Limited for its customers in the automotive aftermarket. We already have over 50 clients in the U.K. and Ireland operating in the plumbing, building, lumber, and electrical wholesale distribution markets that are using a derivative of MAM Software Limited’s Autopart product, known as “Trader.” We originally moved the Autopart product into these additional vertical markets a number of years ago after being approached by companies operating within these vertical markets that could not find a management solution that satisfied their requirements. To date, these additional vertical markets have made only a limited contribution to the revenues of MAM Software Limited.
We have been increasing our promotion of the “Trader” product to these markets, specifically targeting small and medium sized businesses with revenues of between $500,000 and $10 million. We are, and intend to continue, doing this through a number of channels, Internet, direct marketing, advertorials and trade shows. We have also looked to raise awareness of the Trader product by placing advertisements in trade journals and will continue to look to have articles and editorial reviews written about the product and its advantages for those operating within these markets. We have also been targeting small and medium sized businesses within these vertical markets with direct mail pieces such as product fliers, and case studies from the small client base we have in this market. These have then been followed up by MAM’s existing internal sales team to generate qualified leads for the external sales representatives. We recognize that we will need increased industry experience to sell effectively within these markets and intend to recruit a suitably experienced and qualified sales manager to lead this development. In addition to direct marketing we have attended trade shows and exhibitions that have given us the opportunity to invite businesses that we have targeted previously while giving us exposure to additional businesses that have not been contacted through our direct marketing efforts.
| 31 |
Strategic Goals
We hope to increase our share of the U.S. and Canadian markets by (i) increasing the sales and marketing presence of our Autopart product, (ii), focusing on the service station element of the market (iii) and establishing OpenWebs™ as the e-commerce standard within the Automotive market. In the U.K. we expect to continue to grow our market share through (i) moving our supply chain management software into new vertical markets, (ii) alliances with major manufacturers and national retail chains within the automotive aftermarket, and (iii) an increased marketing presence.
We believe that our successful experience within the automotive market will translate well into other vertical markets that have similarly complex supply chains. By developing specific sales teams with relevant market experience and supporting with them suitable marketing collateral, we believe that within two years these teams will generate significant revenue and earnings. The Company plans, at this stage, to focus only on the U.K. for these additional vertical market opportunities.
Summary
We expect to see continued revenue growth from both the U.S. and U.K. operations during fiscal 2015 with increase operating income from the U.K. Our U.S. operating income will be negatively impacted by our investment in new staff for sales and marketing, and professional services and support. We have identified a number of opportunities to widen our client base within the automotive industry and are actively pursuing those at this time. We also expect to see increases in revenue over the next two quarters, specifically due to new products and modules being released as well as enhancements to existing products.
We intend to continue to work at maximizing customer retention by supplying and developing products that streamline and simplify customer operations, thereby increasing their profit margin. By supporting our customers’ recurring revenues, we expect to continue to build our own revenue stream. We believe that we can continue to grow our customer base through additional sales personnel, targeted media and marketing campaigns and products that completely fit clients’ requirements. We also intend to service existing clients at higher levels and increasingly partner with them so that together we both will achieve our goals.
MAM generated cash of approximately $4,433,000 from operations for the year ended June 30, 2014. Revenues in the U.K. are continuing to generate positive cash flow and free cash and the U.S. operations are also generating free cash flow but corporate expenses resulted in a negative cash flow for the year ended June 30, 2014. Our current plans still require us to hire additional sales and marketing staff and to support expanded operations overall.
We believe our plan will strengthen our relationships with our existing customers and provide new income streams by targeting additional English-speaking auto industry aftermarkets for our Autopart product. If we continue to experience negative cash flow we will be required to limit our growth plan.
| Item 7A. | Quantitative and Qualitative Disclosures about Market Risk. |
Not applicable.
| Item 8. | Financial Statements and Supplementary Data. |
The consolidated financial statements, notes to the consolidated financial statements and report of the Company’s independent registered accountant required to be filed in response to this Item 8 begin on page F-1.
| Item 9. | Changes in and Disagreements with Accountants on Accounting and Financial Disclosure. |
None.
| 32 |
| Item 9A. | Controls and Procedures |
| (a) | Evaluation of disclosure controls and procedures |
Under the supervision and with the participation of our management, including our principal executive officer and principal financial officer, we conducted an evaluation of our disclosure controls and procedures, as such term is defined in Rule 13a-15(e) under the Securities Exchange Act of 1934, as amended (the “Exchange Act”), as of June 30, 2014. Based on this evaluation, our principal executive officer and our principal financial officer concluded that our disclosure controls and procedures were effective to provide reasonable assurance that information required to be disclosed by us in reports we file or submit under the Exchange Act is recorded, processed, summarized and reported within the time periods specified in the SEC’s rules and forms, and is accumulated and communicated to our management, including our principal executive officer and principal financial officer, as appropriate to allow timely decisions regarding required disclosures.
| (b) | Management’s report on internal control over financial reporting |
Our management is responsible for establishing and maintaining adequate internal control over financial reporting, as such term is defined in Exchange Act Rule 13a-15(f). Under the supervision and with the participation of our management, including our principal executive officer and principal financial officer, we conducted an evaluation of the effectiveness of our internal control over financial reporting as of June 30, 2014 based on the criteria set forth in Internal Control—Integrated Framework issued by the Committee of Sponsoring Organizations of the Treadway Commission. Based on our evaluation under the criteria set forth in Internal Control—Integrated Framework, our management concluded that our internal control over financial reporting was effective as of June 30, 2014.
This Annual Report does not include an attestation report of our independent registered public accounting firm regarding internal control over financial reporting. We were not required to have, nor have we engaged our independent registered public accounting firm to perform, an audit on our internal control over financial reporting pursuant to temporary rules of the Securities and Exchange Commission that permit us to provide only management’s report in this Annual Report.
Inherent Limitations on Internal Control
A control system, no matter how well conceived and operated, can provide only reasonable, not absolute, assurance that the objectives of the control system are met. Further, the benefits of controls must be considered relative to their costs. Because of the inherent limitations in all control systems, no evaluation of controls can provide absolute assurance that all control issues and instances of fraud, if any, have been detected. These inherent limitations include the realities that judgments in decision making can be faulty, and that breakdowns can occur because of simple errors. Additionally, controls can be circumvented by the individual acts of some persons, by collusion of two or more people, or by management override of the control. The design of any system of controls is also based in part upon certain assumptions about the likelihood of future events, and there can be no assurance that any design will succeed in achieving its stated goals under all potential future conditions. Because of the inherent limitations in a cost-effective control system, misstatements due to error or fraud may occur and not be detected.
| (c) | Changes in internal control over financial reporting |
There were no changes in the Company’s internal control over financial reporting in the Company’s fourth fiscal quarter of the fiscal year ended June 30, 2014 covered by this Annual Report on Form 10-K, that have materially affected, or are reasonably likely to materially affect, the Company’s internal control over financial reporting.
| Item 9B. | Other Information |
None.
| 33 |
| Item 10. | Directors, Executive Officers and Corporate Governance |
Our executive officers, directors and other significant employees and their ages and positions are as follows:
| Name | Age | Position | ||
| Michael Jamieson | 47 | Chief Executive Officer and Director | ||
| Charles F. Trapp | 65 | Chief Financial Officer of the Company | ||
| Lee Broad | 41 | Chief Technology Officer | ||
| Dwight B. Mamanteo | 45 | Director | ||
| Frederick Wasserman | 60 | Director | ||
| Gerald M. Czarnecki | 74 | Chairman of the Board of Directors of the Company | ||
| W. Austin Lewis IV | 38 | Director | ||
| Peter H. Kamin | 52 | Director |
Michael Jamieson was appointed to the Board and to the position of interim Chief Executive Officer in February 2010. He became the Company’s CEO in June, 2010. Mr. Jamieson previously served as Chief Operating Officer and a director of the Company from December 2005 to March 2007. Mr. Jamieson has served as Managing Director of MAM’s subsidiary, MAM Software Limited, since 2004. Mr. Jamieson joined MAM Ltd. in 1991 in its installation and configuration department and has held a number of positions within MAM Ltd.'s implementation and support departments until his appointment as Department Manager for Workshop and Bodyshop Systems in 1995. Mr. Jamieson was promoted to the position of Associate Director of Workshop and Bodyshop Systems in 2002 before taking his role as Managing Director of MAM Ltd. in 2004. Mr. Jamieson brings to the Board significant expertise in the automotive aftermarket software industry, as well as experience in international business technology and extensive management and operating experience. Having in excess of 20 years’ experience with the Company, Mr. Jamieson brings unparalleled knowledge of the Company and its operations and understanding the markets the Company operates in as well as the challenges to opening up new markets whether in the United States or elsewhere around the world.
Charles F. Trapp was appointed Vice President of Finance and Chief Financial Officer on November 30, 2007, and Executive Vice President and Chief Financial Officer on July 1, 2010. Prior to his employment with the Company, Mr. Trapp was the co-founder and President of Somerset Kensington Capital Co., a Bridgewater, New Jersey-based investment firm that provided capital and expertise to help public companies restructure and reorganize from 1997 until November 2007. Earlier in his career, he served as CFO and/or a board member for a number of public companies, including AW Computer Systems, Vertex Electronics Corp., Worldwide Computer Services and Keystone Cement Co. His responsibilities have included accounting and financial controls, federal regulatory filings, investor relations, mergers and acquisitions, loan and labor negotiations, and litigation management. Mr. Trapp is a Certified Public Accountant and received his Bachelor of Science degree in Accounting from St. Peter’s College in Jersey City, New Jersey.
Lee Broad was appointed the Chief Technology Officer on July 1, 2013. Mr. Broad served as Director of Technical Development for MAM’s subsidiary, MAM Software Limited, from April 2004 to June 2013 and was the Software Development Manager from May 1999 to March 2004. Mr. Broad joined MAM Ltd. in April 1992 in its development department and was appointed lead developer for MAM Ltd.’s Autopart and Autocat product lines in November 1995. Mr. Broad brings unparalleled knowledge of the Company and its operations and has a wealth of technical expertise and knowledge of the automotive aftermarket.
| 34 |
Dwight B. Mamanteo became a Director of the Company on March 1, 2007. Mr. Mamanteo serves as the Chairman of the Company’s Compensation Committee and as a member of the Company’s Audit Committee and a member of the Company’s Governance and Nomination Committee. Since November 2004, Mr. Mamanteo has served as a Portfolio Manager at Wynnefield Capital, Inc., a private investment management firm. Since January 2014, Mr. Mamanteo has served on the Board of Directors of GlyEco, Inc. (OTCBB: GLYE), a green chemistry company with a patent-pending technology for recycling waste glycol, a hazardous material, into usable, clean glycol. Mr. Mamanteo serves as the Lead Director, the Chairman of the Governance and Nominating Committee, and as a member of the Audit and Compensation Committees. Since June 2013, Mr. Mamanteo has served on the Board of Directors of ARI Network Services, Inc. (NasdaqCM: ARIS), a provider of products and solutions that serve several vertical markets with a focus on the outdoor power, power sports, marine, RV, and appliance segments. Mr. Mamanteo serves as the Chairman of the Governance Committee and as a member of the Compensation Committee. From March 2012 to April 2012, Mr. Mamanteo served on the Board of Directors of CDC Software Corp. (NasdaqCM: CDCS), a provider of Enterprise CRM and ERP software designed to increase efficiencies and profitability. Mr. Mamanteo served as a member of the Audit Committee. From April 2009 to November 2010, Mr. Mamanteo served on the Board of Directors of EasyLink Services International Corporation (NasdaqCM: ESIC), a leading global provider of on-demand electronic messaging and transaction services that help companies optimize relationships with their partners, suppliers, customers, and other stakeholders. From December 2007 to November 2008, Mr. Mamanteo served on the Board of Directors and as the Chairman of PetWatch Animal Hospitals, Inc. (a private company), a provider of primary care and specialized services to companion animals through a network of fully owned veterinary hospitals. From September 2005 to November 2007, Mr. Mamanteo served on the Board of Directors of Sherpa Service Corps, Inc. (a private company), a service provider enabling subscribing institutions to accelerate academic and other institutions’ enrollment of international students and facilitating the institutions’ compliance with federal statutory obligations. Prior to joining Wynnefield Capital, Mr. Mamanteo worked in the field of technology for over 10 years in various positions for BEA Systems, VISA International, Ericsson, UNISYS, and as an independent consultant. Mr. Mamanteo received an M.B.A. from the Columbia University Graduate School of Business and a BS in Electrical Engineering from Concordia University (Montreal). Mr. Mamanteo brings to the Board valuable business and finance experience, particularly the experience of a professional who has had experience in other industries by virtue of his investing experience as well as related operational experience gained in such technology companies as BEA, Ericsson and UNISYS.
Frederick Wasserman became a Director of the Company on July 17, 2007. Mr. Wasserman is the Chairman of the Audit Committee and is a member of the Governance and Nomination Committee and Compensation Committee. Mr. Wasserman is President of FGW Partners, LLC, a financial management consulting firm he started, effective as of May 1, 2008. From August 2005 to December 2006, he served as Chief Operating and Chief Financial Officer of Mitchell & Ness Nostalgia Company, a manufacturer of licensed sportswear. From January 2001 to February 2005, he served as President and Chief Financial Officer of Goebel of North America, a subsidiary of the manufacturer of M.I. Hummel products, W. Goebel Porzellanfabrik Company. He also brings 13 years of public accounting experience, most notably work with each of Coopers & Lybrand and Eisner & Company. He received a Bachelor of Science degree in Economics from the University of Pennsylvania’s Wharton School, and has been a Certified Public Accountant. Mr. Wasserman also serves as a Director for the following companies: Breeze-Eastern Corporation (Chairman- Audit Committee; Compensation Committee), DLH Holdings Corp. (Chairman- Board of Directors); SMTC Corporation (Member of Audit and Compensation Committees; Chair of Governance and Nomination Committees); and National Holdings, Inc. (which acquired Gilman + Ciocia, Inc. on October 15, 2013) (Member- Audit Committee; Co-Chair- Strategy Committee). From December 2006 to August 2010, Mr. Wasserman served on the Board of Directors of Allied Defense Group (Member-Audit Committee, Ethics and Governance Committee). From July 2007 to August 2010, he served on the Board of Directors of Crown Crafts, Inc. Mr. Wasserman brings strong audit and accounting credentials to the Board, credentials, which in addition to enabling him to serve as our audit committee chairman and financial expert, also enable him to assure best accounting and financial management practices throughout the Company. In addition, his experience has a chief financial officer and/or financial consultant at several companies is an invaluable resource for the Board and Company.
Gerald M. Czarnecki became a lead Director of the Company on August 13, 2008 and Chairman of our Board of Directors on September 23, 2009. Mr. Czarnecki is an ex officio member of each of the Audit Committee, Compensation Committee and Governance and Nomination Committee. Mr. Czarnecki has been the Chairman and CEO of The Deltennium Group, Inc., a privately held consulting and direct investment firm, since its founding in 1995. From August 2007 until April 2012, Mr. Czarnecki has served as President and CEO of 02Media, Inc., a private organization providing direct response marketing campaign management and infomercial production, educational and branded entertainment TV programming and Internet marketing campaign management. From April 1, 2007 to January 15, 2008, Mr. Czarnecki served as interim President & CEO of Junior Achievement Worldwide, Inc., where he also serves on the board of directors, and as member of the Executive Committee, and Chairman of its Human Resources, Compensation and Pension Committees. Mr. Czarnecki is a member of the Board of Directors of State Farm Insurance Company and is Chairman of the Audit Committee, and a member of the Board of Directors of State Farm Bank and State Farm Fire & Casualty. He is also a member of the advisory board for Private Capital, Inc. and serves as a member of the Board of Trustees of National University and is Chairman of its Investment Committee. In addition he is Chairman of the Board of National Leadership Institute, a nonprofit organization dedication to facilitating quality leadership and governance in nonprofit organizations; Chairman of the National Association of Corporate Directors - Florida Chapter. Mr. Czarnecki holds a B.S. in Economics from Temple University, and M.A. in Economics from Michigan State University, a Doctor of Humane Letters from National University and is a Certified Public Accountant. Mr. Czarnecki is also the author of five books on Leadership and corporate governance. From June 2003 to April 2010, Mr. Czarnecki served on the Board of Directors of Del Global Technology, Inc., where he also served as the Chairman of its Audit Committee. From June 2006 to February 2010, Mr. Czarnecki served on the Board of Directors of Junior Achievement of South Florida, Inc. Mr. Czarnecki brings to the Board significant experience as a management change agent, corporate leadership, knowledge and experience in the information technology industry, and development of corporate strategy. His experience at companies as large as IBM or as small as the Company have enabled him to understand how to drive best practices across either large or small organizations and creation of a dynamic organization – capable of adapting to the new paradigm of constant change in business.
| 35 |
W. Austin Lewis IV was appointed to the Board on January 27, 2009. Mr. Lewis serves as a member of the Audit Committee and the Compensation Committee. He currently serves as CEO, CFO, and a director of Paid, Inc., an Internet e-commerce company, as well as the Chief Executive Officer of Lewis Asset Management Corp., an investment management company headquartered in New York City which he founded in 2004. From 2003 to 2004, Mr. Lewis was employed at Puglisi & Company, a New York based broker-dealer registered with FINRA, where he served as a registered representative and managed individual client accounts, conducted due diligence for investment banking activities and managed his own personal account. In 2002, Mr. Lewis co-founded Thompson Davis, & Company, Inc., a registered broker-dealer headquartered in Richmond, Virginia. From 1998 to 2002, Mr. Lewis was employed by Branch Cabell and Company, Inc. in Richmond, Virginia (“Branch Cabell”) where he was a registered representative. Following the November 2000 acquisition of Branch Cabell by Tucker Anthony Incorporated (“Tucker Anthony”), Mr. Lewis served as a Vice-President for Tucker Anthony and subsequently RBC Dain Rauscher, Inc. which acquired Tucker Anthony in August of 2001. Mr. Lewis received his Bachelor of Science degree in Finance and Financial Economics from James Madison University in 1998. Mr. Lewis brings to the Board significant experience as an early-stage investor, principally in the information technology industry through his position as CEO of Lewis Asset Management. In addition, his experience in several facets of the financial industry provide him with a unique perspective on the opportunities and challenges facing early stage companies.
Peter H. Kamin was appointed to the Board on May 18, 2012. Mr. Kamin serves as a member of the Compensation Committee and the Audit Committee. Peter H. Kamin is the founder and Managing Partner of 3K Limited Partnership. For the 11 years preceding the formation of 3K, Mr. Kamin was a founding member and Managing Partner of ValueAct Capital. Prior to founding ValueAct Capital in 2000, Mr. Kamin founded and managed Peak Investment L.P. Peak was a limited partnership, organized to make investments in a select number of domestic public and private companies. Mr. Kamin is presently a Director of Ambassadors Group, Inc., Rand Worldwide, Inc., Tile Shop Holdings, and several privately held companies. Mr. Kamin has previously served as a Director of a number of public and privately held companies. Mr. Kamin holds a BA from Tufts University and an MBA from Harvard’s Graduate School of Business. Mr. Kamin brings to the Board valuable business and finance expertise, due to his significant experience as a director of a publicly held companies and his substantial experience as an investor.
Board Committees
The Company’s Board of Directors has three standing committees of the Board: a Compensation Committee, an Audit Committee and Governance and Nomination Committee. The directors named above serve on the following Board committees:
| Governance and | ||||
| Compensation Committee: | Audit Committee | Nomination Committee | ||
| Dwight B. Mamanteo – Chair | Dwight B. Mamanteo | Dwight B. Mamanteo | ||
| Peter H. Kamin | Frederick Wasserman** – Chair | Frederick Wasserman | ||
| Gerald M. Czarnecki -ex officio member | Gerald M. Czarnecki -ex officio member | Gerald M. Czarnecki -ex officio member | ||
| W. Austin Lewis IV | W. Austin Lewis IV | W. Austin Lewis IV | ||
| Frederick Wasserman | Peter H. Kamin | Peter H. Kamin |
| ** | The Board of Directors has determined that Frederick Wasserman is a financial expert as defined in Regulation S-K promulgated under the Securities Act. |
Section 16(a) Beneficial Ownership Reporting Compliance
Under the securities laws of the United States, our directors, executive (and certain other) officers, and any persons holding ten percent or more of our Common stock must report on their ownership of the Common stock and any changes in that ownership to the Securities and Exchange Commission. Specific due dates for these reports have been established. During the fiscal year ended June 30, 2014, we believe that all reports required to be filed by such persons pursuant to Section 16(a) were filed on a timely basis.
| 36 |
Corporate Governance Principals and Board Matters
MAM is committed to maintaining the highest standards of business conduct and corporate governance, which we believe are essential to running our business efficiently, serving our stockholders well and maintaining MAM’s integrity in the marketplace. MAM maintains a code of business conduct and ethics for directors, officers (including MAM’s principal executive officer, principal financial officer and principal accounting officer) and employees, known as our Code of Ethics of Business Conduct. This document is available at www.mamsoftware.com/content/downloads/code-of-ethics-document-lo.pdf. MAM will post on this website any amendments to the Code of Ethics of Business Conduct or waivers of the Code of Ethics of Business Conduct for directors and executive officers. Stockholders may request free printed copies of the Code of Ethics of Business Conduct, the Corporate Governance Guidelines and the Board committee charters from:
MAM Software Group, Inc.
Attention: Investor Relations
3435 Winchester Road
Allentown, Pennsylvania 18104
(610) 336-9045
http://www.mamsoftware.com/content/downloads/code-of-ethics-document-lo.pdf
Item 11. Executive Compensation.
Employment Agreements - July 1, 2010
On July 13, 2010, the Compensation Committee of the Board of Directors approved employment agreements, including a bonus plan, with each of Michael Jamieson, our President and Chief Executive Officer and Charles F. Trapp, our Executive Vice President and Chief Financial Officer. Such employments agreements and bonus plans were entered into as of July 1, 2010 (the “Effective Date”), the first day of our 2011 fiscal year. Effective July 1, 2012, the Company extended the Employment Agreement from the original term of three (3) years to five (5) years, commencing July 1, 2012. As a result of the amendment, the employment terms now expire on June 30, 2015, as opposed to June 30, 2013.
Michael Jamieson Employment Agreement
The Employment Agreement with Mr. Jamieson (the “Jamieson Agreement”) was for an initial term of three years from the Effective Date, but as a result of the amendment, the employment term now expires June 30, 2015 as opposed to 2013 unless terminated by Mr. Jamieson or us. Mr. Jamieson received an annual base salary of 178,200GBP (approximately U.S. $290,000) for fiscal 2014 and will receive a base salary 178,200GBP for fiscal 2014 (approximately $290,000), payable in British Pounds Sterling.
Mr. Jamieson is eligible for a performance-based annual cash incentive bonus depending on the extent to which the applicable performance goal(s) of the Company, which are to be established by our Compensation Committee of our Board of Directors (“Compensation Committee”) or pursuant to a formal bonus plan, are achieved, subject to any operating covenants in place with respect to outstanding bank debt. The Compensation Committee established a Revenue related target, an EBITDA-related target, and Strategic targets for the fiscal year ended June 30, 2014, with respect to Mr. Jamieson’s potential incentive bonus for fiscal 2013.
In addition, Mr. Jamieson is entitled to participate in all of our benefit plans and our equity-based compensation plans, which currently consists of our 2007 Long-Term Incentive Plan (the “LTIP”). Pursuant to the Jamieson Agreement, Mr. Jamieson was awarded 50,000 restricted common shares under the LTIP (the “Stock Grant”). The shares vested ratably over a three-year period, with 20% vesting on the first anniversary of the Stock Grant, 30% vesting on the second anniversary of the Stock Grant, and 50% vesting on the third anniversary of the Stock Grant. As of June 30, 2011 10,000 shares vested, on June 30, 2012 15,000 shares vested and on June 30, 2013 25,000 shares vested. As of June 30, 2014, all shares have vested and 50,000 shares have been issued.
| 37 |
In July, 2010, the Compensation Committee granted Mr. Jamieson options to purchase 210,938 shares of our common stock under the LTIP (the “Option Grant”). These options will vest on the third anniversary of the grant date, at a strike price of $0.80 per share, depending on the extent to which certain performance targets have been met. The options expire ten years from the grant date, if vested. If the Company’s results: (i) amount to less than 80% of the established target(s), none of the Option Grant will vest; (ii) are equal to 80% of the established target(s), 25% of the Option Grant will vest; (iii) are equal to 100% of the established target(s), 50% of the award will vest; and (iv) are equal to or better than 120% of the established target(s), 100% of the Option Grant will vest. Results between these established parameters will be interpolated. The Option Grant would have vested immediately upon a Change of Control. The Option Grant was cancelled April 27, 2012.
In July 2011, the Compensation Committee approved a stock grant to Mr. Jamieson for 93,232 shares of our common stock under the LTIP (the “Stock Grant”). These shares will vest on the third anniversary of the grant date depending on the extent to which certain performance targets have been met. The grant expires three years from the issuance date, if vested. If the Company’s results: (i) amount to less than 80% of the established target(s), none of the Stock Grant will vest; (ii) are equal to 80% of the established target(s), 25% of the Stock Grant will vest; (iii) are equal to 100% of the established target(s), 50% of the award will vest; and (iv) are equal to or better than 120% of the established target(s), 100% of the Stock Grant will vest. Results between these established parameters will be interpolated. The Stock Grant would have vested immediately upon a Change of Control. The Stock Grant was cancelled April 27, 2012.
On April 27, 2012, the Board of Directors approved the issuance of 728,350 restricted shares of Company common Stock pursuant to the Company’s 2007 Long-term Incentive Plan. These shares were issued to Mr. Jamieson and the unvested shares are being held in escrow until they vest. On April 10, 2014, the Company released from escrow 291,340 shares of common stock to the officer which vested, as our Compensation Committee determined that the initial threshold had been met pursuant to the Company’s LTIP and the officers’ employment agreements. The Company withheld 85,217 shares which were used to pay income taxes and those shares were retired by the Company.
The remaining unvested restricted shares will vest according to the following schedule:
| - | 15% when the market price of the Company’s Common stock trades at or above $6 for the previous 30 day VWAP. |
| - | 15% when the market price of the Company’s Common stock trades at or above $7 for the previous 30 day VWAP. |
| - | 30% when the market price of the Company’s Common stock trades at or above $8 for the previous 30 day VWAP. |
The initial value of the common stock grant was approximately $244,000 and as of June 30, 2014, the amount of unamortized stock based compensation that has not been expensed related to the unvested common stock grant is approximately $55,000. The shares were valued using a Monte Carlo Simulation with a three year life, 124.8% volatility and a risk free interest rate of 0.39%.
Upon a Change of Control, as defined in Mr. Jamieson’s Employment Agreement effective as of July 1, 2010, all shares of Common stock with a price target of $5 per share as described above will immediately vest. All other shares issued pursuant to the Stock Grants will not vest upon a Change of Control.
The Jamieson Agreement provides that in the event Mr. Jamieson’s employment is terminated by the Company other than for Cause or Disability, or Mr. Jamieson shall terminate his employment for Good Reason, he is entitled to, among other things, a severance payment equal to his 12 months base salary.
Charles F. Trapp Employment Agreement
The Employment Agreement with Mr. Trapp (the “Trapp Agreement”) was for an initial term of three years from the Effective Date, but as a result of the amendment, the employment term now expires June 30, 2015 as opposed to 2013 unless terminated by Mr. Trapp or us. Mr. Trapp received an annual base salary of $225,000 for fiscal 2014, and will receive a base salary $225,200 for fiscal 2015 payable in U.S. dollars.
| 38 |
Mr. Trapp is eligible for a performance-based annual cash incentive bonus depending on the extent to which the applicable performance goal(s) of the Company, which are to be established by the Compensation Committee or pursuant to a formal bonus plan, are achieved, subject to any operating covenants in place with respect to outstanding bank debt. The Compensation Committee established a Revenue related target, an EBITDA-related target and Strategic targets for the fiscal year ended June 30, 2014, with respect to Mr. Trapp’s potential incentive bonus for fiscal 2014.
In addition, Mr. Trapp is entitled to participate in all of our benefit plans and equity-based compensation plans, which currently consists of the LTIP. Pursuant to the Trapp Agreement, Mr. Trapp was awarded 20,000 restricted common shares under the LTIP (the “Stock Grant”). The shares vested ratably over a three-year period, with 20% vesting on the first anniversary of the Stock Grant, 30% vesting on the second anniversary of the Stock Grant, and 50% vesting on the third anniversary of the Stock Grant. As of June 30, 2011 4,000 shares vested, on June 30, 2012 6,000 shares vested and on June 30, 2013 10,000 shares vested. As of June 30, 2014, all shares have vested and 20,000 shares have been issued.
In July, 2010, the Compensation Committee granted Mr. Trapp was granted options to purchase 182,813 shares of our common stock under the LTIP (the “Option Grant”). These options will vest on the third anniversary of the grant date, at a strike price of $0.80 per share, depending on the extent to which certain performance targets have been met. The options expire ten years from the grant date, if vested. If the Company’s results: (i) amount to less than 80% of the established target(s), none of the Option Grant will vest; (ii) are equal to 80% of the established target(s), 25% of the Option Grant will vest; (iii) are equal to 100% of the established target(s), 50% of the award will vest; and (iv) are equal to or better than 120% of the established target(s), 100% of the Option Grant will vest. Results between these established parameters will be interpolated. The Option Grant would have vested immediately upon a Change of Control. The Option Grant was cancelled April 27, 2012.
In July, 2011, the Compensation Committee issued to Mr. Trapp a stock grant for 80,801 shares of our common stock under the LTIP (the “Stock Grant”). These shares will vest on the third anniversary of the grant date depending on the extent to which certain performance targets have been met. The grant expires three years from the issuance date, if vested. If the Company’s results: (i) amount to less than 80% of the established target(s), none of the Stock Grant will vest; (ii) are equal to 80% of the established target(s), 25% of the Stock Grant will vest; (iii) are equal to 100% of the established target(s), 50% of the award will vest; and (iv) are equal to or better than 120% of the established target(s), 100% of the Stock Grant will vest. Results between these established parameters will be interpolated. The Stock Grant would have vested immediately upon a Change of Control. The Stock Grant was cancelled April 27, 2012.
On April 27, 2012 the Board of Directors approved the issuance of restricted 437,009 shares of Company common Stock pursuant to the Company’s 2007 Long-term Incentive Plan. These shares were issued to Mr. Trapp and are being held in escrow until they vest. On April 10, 2014, the Company released from escrow 178,804 shares of common stock to the officer which vested, as our Compensation Committee determined that the initial threshold had been met pursuant to the Company’s LTIP and the officers’ employment agreements. The Company withheld 66,589 shares which were used to pay income taxes and those shares were retired by the Company.
The remaining unvested restricted shares will vest according to the following schedule:
| - | 15% when the market price of the Company’s Common stock trades at or above $6 for the previous 30 day VWAP. |
| - | 15% when the market price of the Company’s Common stock trades at or above $7 for the previous 30 day VWAP. |
| - | 30% when the market price of the Company’s Common stock trades at or above $8 for the previous 30 day VWAP. |
The initial value of the common stock grant was approximately $146,000 and as of June 30, 2014, the amount of unamortized stock based compensation that has not been expensed related to the unvested common stock grant is approximately $33,000. The shares were valued using a Monte Carlo Simulation with a three year life, 124.8% volatility and a risk free interest rate of 0.39%.
| 39 |
The Trapp Agreement provides that in the event Mr. Trapp’s employment is terminated by the Company other than for Cause or Disability, or Mr. Trapp shall terminate his employment for Good Reason, he is entitled to, among other things, a severance payment equal to his 12 months base salary.
Lee Broad Employment Agreement
The Employment Agreement with Mr. Broad (the “Broad Agreement”) is for an initial term of two years from July 1, 2013, and is automatically renewable for successive one-year periods unless terminated by Mr. Broad or the Company. Mr. Broad received an annual base salary of 125,000GBP (approximately $200,000), payable in British Pound Sterling for fiscal 2014, and will receive a base salary of 125,000GBP (approximately $200,000) payable in British Pound Sterling.
Mr. Broad is eligible for a performance-based annual cash incentive bonus depending on the extent to which the applicable performance goal(s) of the Company, which are to be established by the Compensation Committee or pursuant to a formal bonus plan, are achieved, subject to any operating covenants in place with respect to outstanding bank debt.
In addition, Mr. Broad is entitled to participate in all of our benefit plans and equity-based compensation plans, which currently consists of the LTIP.
On July 1, 2013, the Board of Directors approved the issuance of restricted 250,892 shares of Company common stock pursuant to the Company’s 2007 Long-term Incentive Plan. These shares were issued to Mr. Broad and are being held in escrow until they vest. The restricted shares will vest according to the following schedule:
| - | 20% when the market price of the Company’s Common stock trades at or above $6 for the previous 30 day volume weighted average price (“VWAP”) |
| - | 30% when the market price of the Company’s Common stock trades at or above $7 for the previous 30 day VWAP. |
| - | 30% when the market price of the Company’s Common stock trades at or above $8 for the previous 30 day VWAP. |
| - | 20% when the market price of the Company’s Common stock trades at or above $9 for the previous 30 day VWAP. |
The initial value of the common stock grant was approximately $226,000, which will be amortized over the life of the employment agreement. As of June 30, 2014, the amount of unamortized stock based compensation that has not been expenses related to the unvested common stock grant is approximately $110,000. The shares were valued using a Monte Carlo Simulation with a two year life, 124.8% volatility and a risk free interest rate of 0.39%.
The Broad Agreement provides that in the event Mr. Broad’s employment is terminated by the Company other than for Cause or Disability, or Mr. Broad shall terminate his employment for Good Reason, he is entitled to, among other things, a severance payment equal to his 12 months base salary.
Severance Benefits
As described above, each of the employment agreements with our officers contains a severance benefit for that officer if he or she is terminated other than for cause or the officer leaves the Company after a change in control, provided they leave for “good reason.” We provide this benefit because we want executives to focus on the Company’s business and enhancing stockholder value without undue concern about any possible loss of their job.
Retirement Plans
We do not offer retirement plans for our officers.
| 40 |
Change in Control
Each officer’s employment agreement contains standard provisions that protect that officer in the event there is a change in control that has not been approved by our Board of Directors. In addition, our LTIP provides for acceleration of vesting in the event of a change in control.
The precise terms and conditions of each employment agreement are described above.
Perquisites
We offer limited perquisites for our executives. We may offer life insurance policies for our Named Executive Officers, but as of the date of this report, have yet to establish those policies.
Board Process
The Compensation Committee of the Board of Directors approves all compensation and awards to executive officers, which include the Chief Executive Officer, the Chief Financial Officer, and Chief Operating Officer, and any other Named Executive Officers. Generally, on its own initiative the Compensation Committee reviews the performance and compensation of the Chief Executive, Chief Financial Officer, and Chief Operating Officer and, following discussions with those individuals, establishes their compensation levels where it deems appropriate. For the remaining officers, the Chief Executive Officer makes recommendations to the Compensation Committee that generally, with such adjustments and modifications that are deemed necessary or appropriate by the Committee, are approved. With respect to equity-based compensation awarded to others, the Compensation Committee grants restricted stock, generally based upon the recommendation of the Chief Executive Officer.
The Compensation Committee believes that objectives cannot be established in a vacuum and thus invites management’s input into the establishment of milestones. Although Committee meetings are held in executive session, without management’s presence, the Committee (and from time to time individual members of the Committee) routinely meets with senior officers of the Company to discuss objectives, to explain the rationale for certain objectives or milestones, and to assure that it has management’s input in assessing the consequences of decisions made in Committee, for instance, the impact that its decisions may have on our financial statements. The Committee’s interactions with management seek to achieve a balance between receiving management’s buy-in for objectives and assuring that management is not actually or effectively establishing the terms and parameters for its own compensation.
Forward-Looking Statements
Disclosures in this Compensation Discussion & Analysis may contain certain forward-looking. Statements that do not relate strictly to historical or current facts are forward-looking and usually identified by the use of words such as “anticipate,” “estimate,” “approximate,” “expect,” “intend,” “plan,” “believe” and other words of similar meaning in connection with any discussion of future operating or financial matters.
Without limiting the generality of the foregoing, forward-looking statements contained in this report include the matters discussed regarding the expectation of compensation plans, strategies, objectives, and growth and anticipated financial and operational performance of the Company and its subsidiaries. A variety of factors could cause the Company’s actual results to differ materially from the anticipated results or other expectations expressed in the Company’s forward-looking statements. The risks and uncertainties that may affect the operations, performance and results of the Company’s business and forward-looking statements include, but are not limited to those set forth herein.
Any forward-looking statement speaks only as of the date on which such statement is made and the Company does not intend to correct or update any forward-looking statements, whether as a result of new information, future events or otherwise.
| 41 |
Summary Compensation Table for Fiscal Years 2014, 2013, and 2012
The following table sets forth information for the fiscal years ended June 30, 2014, 2013, and 2012 concerning the compensation paid and awarded to (a) our Chief Executive Officer, Michael G. Jamieson, as of the end of our fiscal year ended June 30, 2014, (b) our Chief Financial Officer, Charles F. Trapp, as of the end of our fiscal year ended June 30, 2014, and (c) our Chief Technology Officer, Lee Broad, as of the end of our fiscal year ended June 30, 2014.
| Non- | Non- | |||||||||||||||||||||||||||||||||||
| Equity | qualified | |||||||||||||||||||||||||||||||||||
| Incentive | Deferred | All | ||||||||||||||||||||||||||||||||||
| Stock | Option | Plan | Compensation | Other | ||||||||||||||||||||||||||||||||
| Name and | Fiscal | Salary | Bonus | Awards | Awards | Compensation | Earnings | Compensation | Total | |||||||||||||||||||||||||||
| Principal Position | Year | ($) | ($) | ($)(4) | ($) | ($) | ($) | ($)(5) | ($) | |||||||||||||||||||||||||||
| Michael G. Jamieson, (1) | 2014 | 287,000 | 27,000 | 1,471,000 | — | — | — | — | 1,785,000 | |||||||||||||||||||||||||||
| Chief Executive Officer, | 2013 | 259,000 | 25,900 | 20,000 | — | — | — | — | 304,900 | |||||||||||||||||||||||||||
| President and Director | 2012 | 237,660 | 83,650 | 12,000 | — | — | — | — | 249,660 | |||||||||||||||||||||||||||
| Charles F. Trapp (2) | 2014 | 225,230 | - | 883,000 | — | — | — | 7,650 | 1,115,930 | |||||||||||||||||||||||||||
| 2013 | 214,500 | 21,450 | 8,000 | — | — | — | 7,350 | 247,650 | ||||||||||||||||||||||||||||
| 2012 | 195,000 | 72,500 | 4,800 | — | — | — | 7,050 | 199,800 | ||||||||||||||||||||||||||||
| Lee Broad (3) | 2014 | 203,000 | — | — | — | — | — | — | 203,000 | |||||||||||||||||||||||||||
| (1) | Reflects salary paid to Mr. Jamieson for services rendered to us and our subsidiaries during fiscal 2014 as MAM’s Chief Executive Officer and President. Salary was paid by a subsidiary of the Company in British pounds at an annual salary of 178,200GPB per year. The amount shown for 2014 was translated to U.S. dollars based on a June 30, 2014 currency conversion rate of 1 GBP = US$1.6259 (or $290,000). Mr. Jamieson did not receive any additional compensation for his services as a director on our Board of Directors. Reflects salary paid to Mr. Jamieson for services rendered to us and our subsidiaries during fiscal 2014 as MAM’s Chief Executive Officer and President. Salary was paid by a subsidiary of the Company in British pounds at an annual salary of 165,000 GPB per year. The amount shown for 2013 was translated to U.S. dollars based on a June 30, 2013 currency conversion rate of 1GBP = US$1.5676 (or $259,000). Reflects salary paid to Mr. Jamieson for services rendered to us and our subsidiaries during fiscal 2012 as MAM’s Chief Executive Officer and President. Salary was paid by a subsidiary of the Company in British pounds at an annual salary of 150,000 GPB per year. The amount shown for 2012 was translated to U.S. dollars based on a June 30, 2012 currency conversion rate of 1 GBP = US$1.5844 (or $237,660). Mr. Jamieson did not receive any additional compensation for his services as a director on our Board of Directors. Mr. Jamieson did not receive any additional compensation for his services as a director on our Board of Directors. |
| (2) | Mr. Trapp was appointed Vice President Finance and Chief Financial Officer effective as of December 1, 2007. For the year ended June 30, 2014, the amount shown in the table reflects salary in the amount of $225,320 earned for services in these capacities and includes $23,000 contributed by Mr. Trapp to the Company’s plan established under section 401(k) of the Internal Revenue Code of 1986, as amended. For the year ended June 30, 2013, the amount shown in the table reflects salary in the amount of $214,500 earned for services in these capacities and includes $22,500 contributed by Mr. Trapp to the Company’s plan established under section 401(k) of the Internal Revenue Code of 1986, as amended. The amount also includes 11,900 shares of common stock valued at the market price on the date of issuance in lieu of $35,700. For the year ended June 30, 2012, the amount shown in the table reflects salary in the amount of $195,000 earned for services in these capacities and includes $22,000 contributed by Mr. Trapp to the Company’s plan established under section 401(k) of the Internal Revenue Code of 1986, as amended. The amount also includes 9,286 shares of common stock valued at the market price on the date of issuance in lieu of $16,250. | |
| (3) |
Reflects salary paid to Mr. Broad for services rendered to us and our subsidiaries during fiscal 2014 as MAM’s Chief Technology Officer. Salary was paid by a subsidiary of the Company in British pounds at an annual salary of 125,000GPB per year. The amount shown for 2014 was translated to U.S. dollars based on a June 30, 2014 currency conversion rate of 1 GBP = US$1.6259 (or $203,000). |
| 42 |
| (4) | For Mr. Jamieson, in 2014 the amount shown in the “Stock Awards” column reflects the vested date fair value of awards vesting during fiscal 2014 measured in accordance with Accounting Standards Codification Topic 718. On April 10, 2014, the Company released from escrow 291,340 shares of common stock valued at approximately $1,471,000 to Mr. Jamieson which vested, as our Compensation Committee determined that the initial threshold had been met pursuant to the Company’s LTIP and the officers’ employment agreements. The Company withheld 85,217 shares which were used to pay income taxes and those shares were retired by the Company.
For fiscal 2013 and 2012, the amount shown in the “Stock Awards” column reflects the grant date fair value of awards granted during fiscal 2013, and 2012 measured in accordance with Accounting Standards Codification Topic 718. For stock awards to Mr. Jamieson, stock awards represent an award on June 30, 2010 of 50,000 shares of Common stock with a grant date closing price of $0.80 per share. The shares vested ratably over a three-year period, with 20% vesting on the first anniversary of the Stock Grant, 30% vesting on the second anniversary of the Stock Grant, and 50% vesting on the third anniversary of the Stock Grant. On June 30, 2012, 15,000 shares vested and on June 30, 2013, 25,000 shares vested.
For Mr. Trapp, in 2014 the amount shown in the “Stock Awards” column reflects the vested date fair value of awards vesting during fiscal 2014 measured in accordance with Accounting Standards Codification Topic 718. On April 10, 2014, the Company released from escrow 174,804 shares of common stock valued at approximately $883,000 to Mr. Jamieson which vested, as our Compensation Committee determined that the initial threshold had been met pursuant to the Company’s LTIP and the officers’ employment agreements. The Company withheld 66,589 shares which were used to pay income taxes and those shares were retired by the Company.
For stock awards to Mr. Trapp in 2013 and 2012, ,the Stock Awards column represent an award on June 30, 2010 of 20,000 shares of Common stock with a grant date closing price of $0.80 per share. The shares vested ratably over a three-year period, with 20% vesting on the first anniversary of the Stock Grant, 30% vesting on the second anniversary of the Stock Grant, and 50% vesting on the third anniversary of the Stock Grant. On June 30, 2012, 6,000 shares vested and on June 30, 2013, 10,000 shares vested. |
| (5) | Includes contributions to the Company’s 401(k) Plan for the benefit of Mr. Trapp. |
Other Compensation
Other than as described above, there were no post-employment compensation, pension or nonqualified deferred compensation benefits earned by the executive officers during the year ended June 30, 2013. We do not have any retirement, pension, or profit-sharing programs for the benefit of our directors, officers or other employees. The Board of Directors may recommend adoption of one or more such programs in the future.
| 43 |
Outstanding Equity Awards at 2014 Fiscal Year End
The following table provides information relating to the vested and unvested option and stock awards held by the named executives as of June 30, 2014. Each award to each named executive is shown separately, with a footnote describing the award’s vesting schedule.
| Option Awards | Stock Awards | |||||||||||||||||||||||||||||||||||
| Name | Number of Securities Underlying Unexercised Options (# Exercisable) | Number of Securities Underlying Unexercised Option (# Unexercisable) | Equity Incentive Plan Awards: Number of Securities Underlying Unexercised Unearned Options (#) | Option Exercise Price ($) | Option Expiration Date | Number of Shares or Units of Stock That Have Not Vested (#) | Market Value of Shares or Units of Stock That Have Not Vested ($) | Equity Incentive Plan Awards: Number of Unearned Shares, Units or Other Rights That Have Not Vested (#) | Equity Incentive Plan Awards: Market or Payout Value of Unearned Shares, Units Or Other Rights That Have Not Vested ($) | |||||||||||||||||||||||||||
| Michael G. Jamieson | — | — | - | 437,010 | $ | 2,351,114 | (1) | |||||||||||||||||||||||||||||
| Charles F. Trapp | — | — | - | 262,205 | $ | 1,410,663 | (1) | |||||||||||||||||||||||||||||
| Lee Broad | — | — | - | 250,892 | $ | 1,347,799 | (1) | |||||||||||||||||||||||||||||
| (1) | Based on the closing price of $5.38 of the Company’s common stock on June 30, 2014. |
Director Compensation for Fiscal 2014
For the 2014 fiscal year, for the quarters ended September 30, 2013, December 31, 2013, March 31, 2014, and June 30, 2014, directors who were not officers of the Company received cash compensation ranging from $10,750 to $12,875 except for the Chairman of the Board of Directors, who received quarterly compensation of $13,250. The following table reflects all compensation awarded to, earned by or paid to the Company’s directors for the fiscal year ended June 30, 2014.
| Fees Earned or Paid in Cash ($) | Stock Awards ($)(1) | Options Awards ($) | Non-Equity Incentive Plan Compensation ($) | Nonqualified Deferred Compensation Earnings ($) | All Other Compen- sation ($) | Total ($) | ||||||||||||||||||||||
| Michael G. Jamieson | — | — | — | — | — | — | — | |||||||||||||||||||||
| Dwight B. Mamanteo | 51,0I0 | (2) | 38,667 | (3) | — | — | — | — | 89,667 | |||||||||||||||||||
| Frederick Wasserman | 51,500 | 38,829 | (4) | — | — | — | — | 90,329 | ||||||||||||||||||||
| Gerald M. Czarnecki | 53,000 | (5) | 43,581 | (6) | — | — | — | — | 96,581 | |||||||||||||||||||
| W. Austin Lewis IV | 45,000 | 36,665 | (7) | — | — | — | — | 81,665 | ||||||||||||||||||||
| Peter Kamin | 43,000 | 26,004 | (8) | — | — | — | — | 69,004 | ||||||||||||||||||||
| (1) | The amount shown in the table reflects the dollar amount recognized for fiscal 2014 financial statement reporting purposes of the outstanding stock awards held by the directors in accordance with ASC 718-10-25-5. Refer to the Company’s Consolidated Financial Statements for the Fiscal Years Ended June 30, 2014 and 2013, Note 1 “Stock Based Compensation” and Note 9 “Stockholders Equity” included in the Company’s Annual Report on Form 10-K for the fiscal year ended June 30, 2013 respect to valuation assumptions for this stock grant. The directors held no other stock or option awards at June 30, 2014. |
| (2) | Includes 4,670 shares of common stock valued at $25,000, issued in lieu of cash valued at market price on the date of issuance. |
| (3) | Includes 15,379 shares valued at market price on the date of grant. |
| (4) | Includes 15,420 shares valued at market price on the date of grant. |
| 44 |
| (5) | Includes 7,122 shares of common stock valued at $34,450, issued in lieu of cash valued at market price on the date of issuance. |
| (6) | Includes 16,504 shares, net after taxes, valued at market price on the date of grant, net of income taxes of $28,000. |
| (7) | Includes 14,832 shares valued at market price on the date of grant. | |
| (8) | Includes 9,128 shares valued at market price on the date of grant. |
| 45 |
| Item 12. | Security Ownership Of Certain Beneficial Owners And Management and Related Stockholder Matters |
The following table sets forth certain information regarding the beneficial ownership of our common stock as of September 22, 2014 by (a) each stockholder who is known to us to own beneficially 5% or more of our outstanding common stock; (b) all directors; (c) our executive officers, and (d) all executive officers and directors as a group. Except as otherwise indicated, all persons listed below have (i) sole voting power and investment power with respect to their shares of common Stock, except to the extent that authority is shared by spouses under applicable law, and (ii) record and beneficial ownership with respect to their shares of common stock. Unless otherwise identified, the address of our directors and officers is c/o MAM Software Group, Inc., Maple Park, Maple Court, Barnsley, U.K. S75 3DP.
| Amount and Nature of | Percent of class of | |||||||
| Name and address of beneficial owner | Beneficial Ownership | Common Stock (1) | ||||||
| Wynnefield Persons (2) c/o Wynnefield Capital Inc. and Affiliates 450 Seventh Ave., Suite 509 New York, NY 10123 | 3,547,027 | (3) | 24.81 | % | ||||
| Directors and Officers: | ||||||||
| Michael Jamieson Chief Executive Officer | 917,283 | (4) | 6.42 | % | ||||
| Charles F. Trapp Chief Financial Officer | 796,803 | (5) | 5.57 | % | ||||
| Lee Broad Chief Technology Officer | 267,008 | (6) | 1.87 | % | ||||
| Frederick Wasserman, Director | 121,954 | (7) | 0.85 | % | ||||
| Dwight B. Mamanteo, Director | 299,877 | (8) | 2.10 | % | ||||
| Gerald M. Czarnecki, Chairman | 402,010 | (9) | 2.81 | % | ||||
| Peter Kamin, Director | 872,574 | (10) | 6.10 | % | ||||
| W. Austin Lewis IV (11) c/o Lewis Asset Management Corp. 500 5th Avenue Suite 2240 New York, NY 10110 | 1,999,630 | (12) | 13.98 | % | ||||
| Directors and Officers as a group (7 persons) | 5,677,139 | 39.66 | % | |||||
| (1) | Based on a total of 14,298,053 shares of Common stock outstanding as of September 22, 2014. In accordance with Securities and Exchange Commission rules, each person’s percentage interest is calculated by dividing the number of shares that person owns by the sum of (a) the total number of shares outstanding as of September 22, 2014 plus (b) the number of shares such person has the right to acquire within sixty (60) days of September 22, 2014. |
| 46 |
| (2) | Comprised of Wynnefield Partners Small Cap Value, LP (“Wynnefield Partners”) and Wynnefield Partners Small Cap Value LP I (“Wynnefield Partners I”), and the general partner of each of these entities, Wynnefield Capital Management, LLC (“Wynnefield LLC”); Wynnefield Small Cap Value Offshore Fund Ltd. (“Wynnefield Offshore”) and its investment manager, Wynnefield Capital, Inc. (“Wynnefield Capital”); Wynnefield Capital, Inc. Profit Sharing & Money Purchase Plan (the “Plan”); Nelson Obus, who serves as principal and co-managing member of Wynnefield Capital Management, LLC, principal executive officer of Wynnefield Capital, Inc. and Joshua H. Landes, who serves as principal and co-managing member of Wynnefield Capital Management, LLC and executive officer of Wynnefield Capital, Inc. (collectively, the “Wynnefield Persons”). Dwight Mamanteo, one of the Company’s directors, is an investment analyst with Wynnefield Capital. Mr. Mamanteo exercises neither voting nor dispositive control over the shares beneficially owned by Wynnefield Capital. The Company has been informed that Nelson Obus and Joshua H. Landes share voting and investment control over the shares beneficially owned by Wynnefield Partners, Wynnefield Partners I, Wynnefield Offshore, Wynnefield LLC, and Wynnefield Capital and the Plan. Based upon information provided in a Form 4 filed on November 19, 2013. |
| (3) | Represents an aggregate of 3,547,027 shares of common stock, which are beneficially owned as follows: (i) 1,075,648 shares of common stock are beneficially owned by Wynnefield Partners; (ii) 1,625,780 shares of common stock are beneficially owned by Wynnefield Partners I; (iii) 841,125 shares of common stock owned by Wynnefield Offshore; and (iv) 4,474 shares of common stock are beneficially owned by the Wynnefield Capital, Inc. Profit Sharing & Money Purchase Plan Based upon information provided in a Form 4 filed with the SEC on November 19, 2013. |
| (4) | Includes 327,757 shares which have not vested. |
| (5) | Includes 196,654 shares which have not vested. |
| (6) | Includes 200,714 shares which have not vested. |
| (7) | Includes 3,251 shares which will vest within 60 days of September 19, 2014. |
| (8) | Includes 3,233 shares which will vest within 60 days of September 19, 2014. |
| (9) | Includes 3,682 shares which will vest within 60 days of September 19, 2014. |
| (10) | Includes 2,931 shares which will vest within 60 days of September 19, 2014. |
| (11) | W. Austin Lewis IV is the portfolio manager and general partner of Lewis Asset Management Corp., the investment manager of Lewis Opportunity Fund, LP and LAM Opportunity Fund, LTD. Accordingly, Mr. Lewis is deemed to be the beneficial owner of the shares owned by Lewis Opportunity Fund, LP and LAM Opportunity Fund, LTD. and beneficially owned by Lewis Asset Management Corp. |
| (12) | Represents (i) 657,530 shares owned directly by W. Austin Lewis IV, (ii) 1,339,094 shares of common stock owned by Lewis Opportunity Fund, LP; and (iii) 3,006 shares which will vest within 60 days of September 13, 2013. |
| 47 |
| Item 13. | Certain Relationships and Related Transactions, and Director Independence |
As part of the MAM share repurchase plan, during the quarter ended December 31, 2011, the Company purchased 33,466 shares of common stock at a cost of $56,000 from Channel Partners II L.P., an investment partnership affiliated with Wynnefield Capital, Inc. (see Note 7).
Director Independence
Our determination of independence of directors is made using the definition of “independent director” contained in Rule 5605(a)(2) of the Marketplace Rules of the NASDAQ Stock Market (“NASDAQ”), because we are listed on NASDAQ. We have determined that Dwight B. Mamanteo, Frederick Wasserman, Gerald Czarnecki, Peter Kamin, and W. Austin Lewis IV are “independent” within the meaning of such rules. Michael Jamieson is not “independent” under these rules, due to his position as our Chief Executive Officer.
| Item 14. | Principal Accounting Fees and Services. |
The following table presents aggregate fees for professional services rendered by our principal independent registered public accounting firm, KMJ Corbin & Company LLP for the audit of our annual consolidated financial statements for the fiscal year ended June 30, 2014 and 2013.
| For the Year Ended June 30, | ||||||||
| 2014 | 2013 | |||||||
| Audit fees (1) | $ | 121,000 | $ | 121,000 | ||||
| Total fees | $ | 121,000 | $ | 121,000 | ||||
| (1) | Audit fees are comprised of annual audit fees and quarterly review fees. |
| 48 |
Policy on Audit Committee Pre-Approval of Audit and Permissible Non-Audit Services of Independent Auditors
The Audit Committee pre-approves all audit and non-audit services provided by the independent auditors prior to the engagement of the independent auditors with respect to such services. The Chairman of the Audit Committee has been delegated the authority by the Committee to pre-approve interim services by the independent auditors other than the annual audit. The Chairman must report all such pre-approvals to the entire Audit Committee at the next Committee meeting.
| Item 15. | Exhibits, Financial Statement Schedules. |
(a) Exhibits:
The following exhibits are filed herewith or incorporated by reference herein.
| Exhibit No. |
Description of Exhibit | |
| 3(i) | Certificate of Incorporation of MAM Software Group, Inc., as amended (incorporated by reference to Exhibit 3(i) to the Company’s Registration Statement on Form S-1/A filed on July 15, 2008). | |
| 3(ii) | By laws (incorporated by reference to Exhibit 3(ii) to the Company’s Registration Statement on Form SB-2 filed on February 16, 2007). | |
| 4.1 | Form of Certificate of Common stock (incorporated by reference to Exhibit 4.1 to the Company’s Registration Statement on Form SB-2 filed on February 16, 2007). | |
| 10.1 | Share Sale Agreement relating to EXP Dealer Software Limited dated August 4, 2006 among Auto Data Network, Inc., MAM Software Group, Inc. and MAM Software Dealer Software Limited (incorporated by reference to Exhibit 10.1 to the Company’s Current Report on Form 8-K filed on August 31, 2006). | |
| 10.2 | Share Sale Agreement relating to Dealer Software and Services Limited dated February 1, 2007 between MAM Software Group, Inc. and Auto Data Network, Inc. (incorporated by reference to Exhibit 10.1 to the Company’s Current Report on Form 8-K filed on February 7, 2007). | |
| 10.4 | Form of Common stock Purchase Warrant (incorporated by reference to Exhibit 10.2 to the Company’s Current Report on Form 8-K filed July 6, 2007). | |
| 10.5 | Form of Registration Rights Agreement (incorporated by reference to Exhibit 10.3 to the Company’s Current Report on Form 8-K filed July 6, 2007). | |
| 10.6 | Settlement and Release Agreement between ASNA and Aidan J. McKenna (incorporated by reference to Exhibit 99.1 to the Company’s Current Report on Form 8-K filed August 6, 2007). | |
| 10.7 | Share Sale Agreement, dated November 12, 2007, between EU Web Services, Ltd., as Purchaser, MAM Software Group, Inc., as Vendor, and EXP Dealer Software Ltd. (incorporated by reference to Exhibit 99.1 of the Company’s Current Report on Form 8-K filed November 16, 2007) | |
| 10.8 | Revolving Credit and Term Loan Agreement dated as of December 21, 2007, by and between ComVest Capital LLC, as Lender, and MAM Software Group, Inc., as Borrower (incorporated by reference to Exhibit 10.1 of the Company’s Current Report on Form 8-K filed December 31, 2007). |
| 49 |
| 10.9 | Revolving Credit Note dated December 21, 2007 in the principal amount of $1,000,000 (incorporated by reference to Exhibit 10.2 of the Company’s Current Report on Form 8-K filed December 31, 2007). | |
| 10.10 | Convertible Term Note, dated December 21, 2007 in the principal amount of $5,000,000 (incorporated by reference to Exhibit 10.3 of the Company’s Current Report on Form 8-K filed December 31, 2007). | |
| 10.11 | Collateral Agreement dated as of December 21, 2007 by and among MAM Software Group, Inc., Aftersoft Network, N.A. Inc., MAM Software Ltd., MAM Software Group (U.K.) Ltd., AFS Warehouse Distribution Management, Inc., AFS Tire Management, Inc. and AFS Autoservice Inc., and ComVest Capital LLC (incorporated by reference to Exhibit 10.4 of the Company’s Current Report on Form 8-K filed December 31, 2007). | |
| 10.12 | Guaranty Agreement dated December 21, 2007 by Aftersoft Network, N.A. Inc., MAM Software Ltd., MAM Software Group (U.K.) Ltd., AFS Warehouse Distribution Management, Inc., AFS Tire Management, Inc. and AFS Autoservice Inc., in favor of ComVest Capital LLC (incorporated by reference to Exhibit 10.5 of the Company’s Current Report on Form 8-K filed December 31, 2007). | |
| 10.13 | Form of Validity Guaranty (incorporated by reference to Exhibit 10.6 of the Company’s Current Report on Form 8-K filed December 31, 2007). | |
| 10.14 | Warrant, dated as of December 21, 2007, to Purchase 1,000,000 Shares of Common stock of MAM Software Group, Inc. (incorporated by reference to Exhibit 10.7 of the Company’s Current Report on Form 8-K filed December 31, 2007). | |
| 10.15 | Warrant, dated as of December 21, 2007, to purchase 2,000,000 Shares of Common stock of MAM Software Group, Inc. (incorporated by reference to Exhibit 10.8 of the Company’s Current Report on Form 8-K filed December 31, 2007). | |
| 10.16 | Warrant, dated as of December 21, 2007, to purchase 2,083,333 Shares of Common stock of MAM Software Group, Inc. (incorporated by reference to Exhibit 10.9 of the Company’s Current Report on Form 8-K filed December 31, 2007). | |
| 10.17 | Registration Rights Agreement dated as of December 21, 2007 by MAM Software Group, Inc. for the benefit of the holders (incorporated by reference to Exhibit 10.10 of the Company’s Current Report on Form 8-K filed December 31, 2007). | |
| 10.18 | 2007 Long-Term Stock Incentive Plan (incorporated by reference to Exhibit D of the Company’s revised Definitive Proxy Statement filed on May 19, 2008). | |
| 10.19 | Employment Agreement dated as of December 1, 2008 between the Company and Ian Warwick (incorporated by reference to Exhibit 10.1 of the Company’s Current Report on Form 8-K filed December 5, 2008). | |
| 10.20 | Employment Agreement dated as of December 1, 2008 between the Company and Charles F. Trapp (incorporated by reference to Exhibit 10.2 of the Company’s Current Report on Form 8-K filed December 5, 2008). | |
| 10.21 | Employment Agreement dated as of December 1, 2008 between the Company and Simon Chadwick (incorporated by reference to Exhibit 10.3 of the Company’s Current Report on Form 8-K filed December 5, 2008). |
| 50 |
| 10.22 | May 15, 2008 Waiver and Amendment (incorporated by reference to Exhibit 10.1 of the Company’s Current Report on Form 8-K filed March 27, 2009). | |
| 10.23 | September 23, 2008 Waiver and Amendment (incorporated herein by reference to Exhibit 10.2 of the Company’s Current Report on Form 8-K filed March 27, 2009). | |
| 10.24 | February 10, 2009 Waiver and Amendment (incorporated herein by reference to Exhibit 10.3 of the Company’s Current Report on Form 8-K filed March 27, 2009). | |
| 10.25 | April 22, 2009 Amendment (incorporated by reference to Exhibit 10.1 of the Company’s current Report on Form 8-K filed April 23, 2009). | |
| 10.26 | Consulting Agreement with Commonwealth Associates LP dated June 3, 2008 (incorporated herein by reference to Exhibit 10.25 to the Company's Registration Statement on Form S-1/A filed on April 3, 2009). | |
| 14 | Code of Ethics (incorporated by reference to Exhibit 14 to the Company’s Annual report on Form 10-K/A for the fiscal year ended June 30, 2007 filed October 15, 2007.) | |
| 21 | List of subsidiaries (incorporated by reference to Exhibit 21 to the Company’s Registration Statement on Form S-1/A filed on July 15, 2008). | |
| 31.1 | Certification of Principal Executive Officer pursuant to Section 302 of the Sarbanes-Oxley Act of 2002 (filed herewith). | |
| 31.2 | Certification of Principal Financial Officer pursuant to Section 302 of the Sarbanes-Oxley Act of 2002 (filed herewith). | |
| 32.1 | Certification of Principal Executive Officer pursuant to 18 U.S.C. Section 1350, as adopted pursuant to Section 906 of the Sarbanes-Oxley Act of 2002 (filed herewith). | |
| 32.2 | Certification of Principal Financial Officer pursuant to 18 U.S.C. Section 1350, as adopted pursuant to Section 906 of the Sarbanes-Oxley Act of 2002 (filed herewith). |
| 101.INS * | XBRL Instance Document | |
| 101.SCH * | XBRL Taxonomy Schema | |
| 101.CAL * | XBRL Taxonomy Calculation Linkbase | |
| 101.DEF * | XBRL Taxonomy Definition Linkbase | |
| 101.LAB * | XBRL Taxonomy Label Linkbase | |
| 101.PRE * | XBRL Taxonomy Presentation Linkbase |
In accordance with SEC Release 33-8238, Exhibits 32.1 and 32.2 are being furnished and not filed.
* XBRL (Extensible Business Reporting Language) information is furnished and not filed or a part of a registration statement or prospectus for purposes of Sections 11 or 12 of the Securities Act of 1933, as amended, is deemed not filed for purposes of Section 18 of the Securities Exchange Act of 1934, as amended, and otherwise is not subject to liability under these sections.
| 51 |
Pursuant to the requirements of Section 13 or 15(d) of the Securities Exchange Act of 1934, the registrant has duly caused this report to be signed on its behalf by the undersigned, thereunto duly authorized.
| MAM Software Group, Inc. | ||
| Date: September 23, 2014 | By: | /s/ Michael G. Jamieson |
| Michael G. Jamieson | ||
| Chief Executive Officer (Principal Executive Officer) | ||
Pursuant to the requirements of the Securities Exchange Act of 1934, this report has been signed below by the following persons on behalf of the Registrant and in the capacities and on the dates indicated.
| Date: September 23, 2014 | By: | /s/ Michael G. Jamieson |
| Michael G. Jamieson | ||
| Chief Executive Officer and Director (Principal Executive Officer) | ||
| Date: September 23, 2014 | By: | /s/ Charles F. Trapp |
| Charles F. Trapp | ||
|
Chief Financial Officer Principal Accounting Officer) | ||
| Date: September 23, 2014 | By: | / S / Gerald M. Czarnecki |
| Gerald M. Czarnecki | ||
| Chairman of the Board, Lead Director, ex officio member of all committees | ||
| Date: September 23, 2014 | By: | /s/ Frederick Wasserman |
| Frederick Wasserman | ||
| Audit Committee Chair and Director | ||
| Date: September 23, 2014 | By: | /s/ Dwight Mamanteo |
| Dwight Mamanteo | ||
| Compensation Committee Chair and Director | ||
| Date: September 23, 2014 | By: | /s/ W. Austin Lewis IV |
| W. Austin Lewis IV | ||
| Compensation Committee Member and Director | ||
| Date: September 23, 2014 | By: | / S / Peter H. Kamin |
| Peter H. Kamin | ||
| Director |
| 52 |
FINANCIAL STATEMENTS
MAM SOFTWARE GROUP, INC.
CONSOLIDATED FINANCIAL STATEMENTS
FOR THE YEARS ENDED JUNE 30, 2014 AND 2013
Index to Consolidated Financial Statements
| F-1 |
REPORT OF INDEPENDENT REGISTERED PUBLIC ACCOUNTING FIRM
Board of Directors and Stockholders
MAM Software Group, Inc.
We have audited the accompanying consolidated balance sheets of MAM Software Group, Inc. (a Delaware corporation) and subsidiaries (the “Company”) as of June 30, 2014 and 2013, and the related consolidated statements of comprehensive income, stockholders’ equity and cash flows for the years then ended. These consolidated financial statements are the responsibility of the Company’s management. Our responsibility is to express an opinion on these consolidated financial statements based on our audits.
We conducted our audits in accordance with the standards of the Public Company Accounting Oversight Board (United States). Those standards require that we plan and perform the audits to obtain reasonable assurance about whether the consolidated financial statements are free of material misstatement. The Company is not required to have, nor were we engaged to perform, an audit of its internal control over financial reporting. Our audits included consideration of internal control over financial reporting as a basis for designing audit procedures that are appropriate in the circumstances, but not for the purpose of expressing an opinion on the effectiveness of the Company’s internal control over financial reporting. Accordingly, we express no such opinion. An audit includes examining, on a test basis, evidence supporting the amounts and disclosures in the consolidated financial statements. An audit also includes assessing the accounting principles used and significant estimates made by management, as well as evaluating the overall consolidated financial statement presentation. We believe that our audits provide a reasonable basis for our opinion.
In our opinion, the consolidated financial statements referred to above present fairly, in all material respects, the financial position of MAM Software Group, Inc. and subsidiaries as of June 30, 2014 and 2013, and the results of their operations and their cash flows for years then ended, in conformity with accounting principles generally accepted in the United States of America.
/s/ KMJ Corbin & Company LLP
Costa Mesa, California
September 23, 2014
| F-2 |
Consolidated Balance Sheets
(In thousands, except share and per share data)
| June 30, 2014 | June 30, 2013 | |||||||
| ASSETS | ||||||||
| Current Assets | ||||||||
| Cash and cash equivalents | $ | 7,008 | $ | 4,061 | ||||
| Accounts receivable, net of allowance of $473 and $114 | 3,857 | 3,511 | ||||||
| Inventories | 211 | 199 | ||||||
| Prepaid expenses and other current assets | 1,505 | 1,976 | ||||||
| Total Current Assets | 12,581 | 9,747 | ||||||
| Property and Equipment, Net | 692 | 689 | ||||||
| Other Assets | ||||||||
| Goodwill | 9,767 | 8,983 | ||||||
| Amortizable intangible assets, net | 118 | 640 | ||||||
| Software development costs, net | 1,553 | 1,248 | ||||||
| Other long-term assets | 34 | 34 | ||||||
| TOTAL ASSETS | $ | 24,745 | $ | 21,341 | ||||
| LIABILITIES AND STOCKHOLDERS’ EQUITY | ||||||||
| Current Liabilities | ||||||||
| Accounts payable | $ | 1,464 | $ | 1,400 | ||||
| Accrued expenses and other liabilities | 2,283 | 1,952 | ||||||
| Payroll and other taxes | 1,224 | 718 | ||||||
| Debt | - | 312 | ||||||
| Current portion of deferred revenue | 833 | 742 | ||||||
| Sales tax payable | 893 | 769 | ||||||
| Income tax payable | 285 | 352 | ||||||
| Total Current Liabilities | 6,982 | 6,245 | ||||||
| Long-Term Liabilities | ||||||||
| Deferred revenue, net of current portion | 242 | 154 | ||||||
| Deferred income taxes | 53 | 79 | ||||||
| Other | 193 | 241 | ||||||
| Total Liabilities | 7,470 | 6,719 | ||||||
| Commitments and Contingencies | ||||||||
| Stockholders' Equity | ||||||||
| Preferred stock: Par value $0.0001 per share; 2,000,000 shares authorized, none issued and outstanding | - | - | ||||||
| Common stock: Par value $0.0001 per share; 18,000,000 shares authorized, 15,077,830 shares issued and 14,404,149 shares outstanding at June 30, 2014 and 14,813,172 shares issued and 14,139,491 shares issued and outstanding at June 30, 2013 | 2 | 2 | ||||||
| Additional paid-in capital | 31,426 | 31,548 | ||||||
| Accumulated other comprehensive loss | (65 | ) | (1,168 | ) | ||||
| Accumulated deficit | (12,342 | ) | (14,014 | ) | ||||
| Treasury stock at cost, 673,681 shares at June 30, 2014 and June 30, 2013 | (1,746 | ) | (1,746 | ) | ||||
| Total Stockholders' Equity | 17,275 | 14,622 | ||||||
| TOTAL LIABILITIES AND STOCKHOLDERS' EQUITY | $ | 24,745 | $ | 21,341 | ||||
The Accompanying Notes Are an Integral Part of these Consolidated Financial Statements.
| F-3 |
Consolidated Statements of Comprehensive Income
(In thousands, except share and per share data)
| For the Years Ended June 30, | ||||||||
| 2014 | 2013 | |||||||
| Revenues | $ | 30,690 | $ | 27,466 | ||||
| Cost of revenues | 13,968 | 11,392 | ||||||
| Gross Profit | 16,722 | 16,074 | ||||||
| Operating Expenses | ||||||||
| Research and development | 3,743 | 3,405 | ||||||
| Sales and marketing | 4,518 | 3,348 | ||||||
| General and administrative | 4,974 | 4,163 | ||||||
| Depreciation and amortization | 1,031 | 1,149 | ||||||
| Total Operating Expenses | 14,266 | 12,065 | ||||||
| Operating Income | 2,456 | 4,009 | ||||||
| Other Income (Expense) | ||||||||
| Interest expense | (40 | ) | (146 | ) | ||||
| Change in fair value of derivative liabilities | - | (271 | ) | |||||
| Gain on settlement of derivative liabilities | - | 131 | ||||||
| Gain on settlement of liabilities | - | 13 | ||||||
| Total Other Expense, net | (40 | ) | (273 | ) | ||||
| Income before provision for income taxes | 2,416 | 3,736 | ||||||
| Provision for income taxes | 744 | 723 | ||||||
| Net Income | $ | 1,672 | $ | 3,013 | ||||
| Earnings per share attributed to common stockholders - basic | $ | 0.13 | $ | 0.24 | ||||
| Earnings per share attributed to common stockholders - diluted | $ | 0.13 | $ | 0.24 | ||||
| Weighted average common shares outstanding – basic | 13,060,638 | 12,708,766 | ||||||
| Weighted average common shares outstanding – diluted | 13,153,752 | 12,825,708 | ||||||
| Net Income | $ | 1,672 | $ | 3,013 | ||||
| Foreign currency translation income (loss) | 1,103 | (238 | ) | |||||
| Total Comprehensive Income | $ | 2,775 | $ | 2,775 | ||||
The Accompanying Notes Are an Integral Part of these Consolidated Financial Statements.
| F-4 |
Consolidated Statements of Stockholders’ Equity
(In thousands, except share data)
| Preferred Stock | Common Stock | Additional Paid-in | Treasury Stock | Accumulated Other Comprehensive | Accumulated | |||||||||||||||||||||||||||||||||||
| Shares | Amount | Shares | Amount | Capital | Shares | Amount | Loss | Deficit | Total | |||||||||||||||||||||||||||||||
| Balance July 1, 2012 | - | $ | - | 15,492,730 | $ | 2 | $ | 33,453 | (1,196,625 | ) | $ | (2,357 | ) | $ | (930 | ) | $ | (17,027 | ) | $ | 13,141 | |||||||||||||||||||
| Retirement of treasury stock | - | - | (1,145,759 | ) | - | (2,242 | ) | 1,145,759 | 2,242 | - | - | - | ||||||||||||||||||||||||||||
| Common stock issued as compensation – Includes 282,254 unvested shares and related amortization (See Notes 6 and 7 ) | - | - | 445,201 | - | 425 | - | - | - | - | 425 | ||||||||||||||||||||||||||||||
| Common stock issued for options exercise | - | - | 21,000 | - | 14 | - | - | - | - | 14 | ||||||||||||||||||||||||||||||
| Stock options issued in settlement of accrued liabilities | - | - | - | - | 40 | - | - | - | - | 40 | ||||||||||||||||||||||||||||||
| Repurchase of common stock | - | - | - | - | - | (622,815 | ) | (1,631 | ) | - | - | (1,631 | ) | |||||||||||||||||||||||||||
| Retirement of warrants | - | - | - | - | (142 | ) | - | - | - | - | (142 | ) | ||||||||||||||||||||||||||||
| Foreign currency translation | - | - | - | - | - | - | - | (238 | ) | - | (238 | ) | ||||||||||||||||||||||||||||
| Net income | - | - | - | - | - | - | - | - | 3,013 | 3,013 | ||||||||||||||||||||||||||||||
| Balance June 30, 2013 | - | $ | - | 14,813,172 | $ | 2 | $ | 31,548 | (673,681 | ) | $ | (1,746 | ) | $ | (1,168 | ) | $ | (14,014 | ) | $ | 14,622 | |||||||||||||||||||
| Retirement of treasury stock | - | - | - | - | - | - | - | - | - | - | ||||||||||||||||||||||||||||||
| Common stock issued as compensation – Includes 250,892 unvested shares and related amortization (See Notes 7 and 8 ) | - | - | 359,812 | - | 664 | - | - | - | - | 664 | ||||||||||||||||||||||||||||||
| Repurchase of common stock for treasury | - | - | - | - | - | (167,392 | ) | (845 | ) | - | - | (845 | ) | |||||||||||||||||||||||||||
| Retirement of treasury stock | - | - | (167,392 | ) | - | (845 | ) | 167,392 | 845 | - | - | - | ||||||||||||||||||||||||||||
| Common stock issued for options exercised | 52,238 | - | 43 | - | - | - | - | 43 | ||||||||||||||||||||||||||||||||
| Common stock issued in settlement of accrued liabilities | 20,000 | - | 16 | - | - | - | - | 16 | ||||||||||||||||||||||||||||||||
| Foreign currency translation | - | - | - | - | - | - | - | 1,103 | - | 1,016 | ||||||||||||||||||||||||||||||
| Net income | - | - | - | - | - | - | - | - | 1,672 | 1,672 | ||||||||||||||||||||||||||||||
| Balance June 30, 2014 | - | $ | - | 15,077,830 | $ | 2 | $ | 31,426 | (673,681 | ) | $ | (1,746 | ) | $ | (65 | ) | (12,342 | ) | $ | 17,275 | ||||||||||||||||||||
The Accompanying Notes Are an Integral Part of these Consolidated Financial Statements.
| F-5 |
Consolidated Statements of Cash Flows
| (In thousands) | For the Years Ended June 30, | |||||||
| 2014 | 2013 | |||||||
| CASH FLOWS FROM OPERATING ACTIVITIES : | ||||||||
| Net income | $ | 1,672 | $ | 3,013 | ||||
| Adjustments to reconcile net income to net cash provided by operating activities: | ||||||||
| Bad debt expense | 494 | 73 | ||||||
| Depreciation and amortization | 1,031 | 1,149 | ||||||
| Amortization of debt discount and debt issuance costs | 1 | 11 | ||||||
| Gain on settlement of derivative liabilities | - | (131 | ) | |||||
| Change in fair value of derivative liabilities | - | 271 | ||||||
| Gain on settlement of liabilities | - | (13 | ) | |||||
| Deferred income taxes | (26 | ) | (90 | ) | ||||
| Fair value of stock issued for services and compensation | 664 | 414 | ||||||
| Changes in assets and liabilities: | ||||||||
| Accounts receivable | (523 | ) | (147 | ) | ||||
| Inventories | 11 | 155 | ||||||
| Prepaid expenses and other assets | 529 | (1,033 | ) | |||||
| Accounts payable | (52 | ) | 99 | |||||
| Accrued expenses and other liabilities | 37 | (216 | ) | |||||
| Payroll and other taxes | 454 | 144 | ||||||
| Deferred revenue | 106 | 401 | ||||||
| Taxes payables | 35 | 80 | ||||||
| NET CASH PROVIDED BY OPERATING ACTIVITIES | 4,433 | 4,180 | ||||||
| CASH FLOWS FROM INVESTING ACTIVITIES: | ||||||||
| Purchase of property and equipment | (224 | ) | (292 | ) | ||||
| Capitalized software development costs | (523 | ) | (387 | ) | ||||
| NET CASH USED IN INVESTING ACTIVITIES | (747 | ) | (679 | ) | ||||
| CASH FLOWS FROM FINANCING ACTIVITIES: | ||||||||
| Proceeds from exercise of stock options | 43 | 14 | ||||||
| Retirement of outstanding warrants | - | (724 | ) | |||||
| Repurchase of common stock for treasury | (845 | ) | (1,631 | ) | ||||
| Payments on debt | (325 | ) | (725 | ) | ||||
| NET CASH USED IN FINANCING ACTIVITIES | (1,127 | ) | (3,066 | ) | ||||
| Effect of exchange rate changes | 388 | (2 | ) | |||||
| Net change in cash and cash equivalents | 2,947 | 433 | ||||||
| Cash and cash equivalents at beginning of year | 4,061 | 3,628 | ||||||
| Cash and cash equivalents at end of year | $ | 7,008 | $ | 4,061 | ||||
The Accompanying Notes Are an Integral Part of these Consolidated Financial Statements.
| F-6 |
MAM SOFTWARE GROUP, INC.
Consolidated Statements of Cash Flows (Continued)
| (In thousands) | For the Years Ended June 30, | |||||||
| 2014 | 2013 | |||||||
| Supplemental disclosures of cash flow information | ||||||||
| Cash paid during the year for : | ||||||||
| Interest | $ | 40 | $ | 120 | ||||
| Income taxes | $ | 838 | $ | 878 | ||||
| Supplemental disclosures of non-cash investing and financing activities: | ||||||||
| Issuance of stock options in settlement of accrued liabilities | $ | - | $ | 40 | ||||
| Issuance of common stock in settlement of accrued liabilities | $ | 16 | $ | 11 | ||||
| Treasury stock retired | $ | 845 | $ | 2,242 | ||||
The Accompanying Notes Are an Integral Part of these Consolidated Financial Statements.
| F-7 |
NOTES TO CONSOLIDATED FINANCIAL STATEMENTS
June 30, 2014 and 2013
NOTE 1. SUMMARY OF SIGNIFICANT ACCOUNTING POLICIES
Basis of Presentation
MAM Software Group, Inc. (the “Company”) is a leading provider of business and supply chain management solutions primarily to the automotive parts manufacturers, retailers, tire and service chains, independent installers and wholesale distributors in the automotive aftermarket. The Company conducts its business through wholly owned subsidiaries with operations in Europe and North America. MAM Software Ltd. (“MAM Ltd”) is based in Tankersley, Barnsley, United Kingdom (“U.K.”) and MAM Software, Inc. (“MAM US”) has offices in the United States (“U.S.”) in Allentown, Pennsylvania.
Principles of Consolidation
The consolidated financial statements of the Company include the accounts of the Company and its wholly owned subsidiaries. All significant intercompany accounts and transactions have been eliminated in the consolidated financial statements.
Concentrations of Credit Risk
The Company has no significant off-balance-sheet concentrations of credit risk such as foreign exchange contracts, options contracts or other foreign hedging arrangements.
Cash and Cash Equivalents
In the U.S., the Company maintains cash balances at financial institutions that are insured by Federal Deposit Insurance Corporation (“FDIC”) up to $250,000. At times deposits held with financial institutions in the U.S. may exceed the $250,000 limit.
In the U.K., the Company maintains cash balances at financial institutions that are insured by the Financial Services Compensation Scheme (“FSCS”) up to $145,000. At times deposits held with financial institutions in the U.K. may exceed the $145,000 limit.
The Company maintains its cash accounts at financial institutions which it believes to be credit worthy. The Company considers all highly liquid debt instruments purchased with a maturity of three months or less to be cash equivalents to the extent the funds are not being held for investment purposes.
Customers
The Company performs periodic evaluations of its customers and maintains allowances for potential credit losses as deemed necessary. The Company generally does not require collateral to secure its accounts receivable. Credit risk is managed by discontinuing sales to customers who are delinquent. The Company estimates credit losses and returns based on management’s evaluation of historical experience and current industry trends. Although the Company expects to collect amounts due, actual collections may differ from the estimated amounts. No customers accounted for more than 10% of the Company’s revenues for each of the years ended June 30, 2014 and 2013. One customer accounted for more than 10% or more of the Company’s accounts receivable at June 30, 2014 and no customers accounted for more than 10% or more of the Company’s accounts receivable at June 30, 2013.
| F-8 |
Segment Reporting
The Company operates in one reportable segment. The Company evaluates financial performance on a Company-wide basis. The Company’s chief operating decision-maker is the chief executive officer, who evaluates the Company as a single segment.
Geographic Concentrations
The Company conducts business in the U.S., Canada and the U.K. For customers headquartered in their respective countries, the Company derived 27% of its revenues from the U.S. and Canada, and 73% from its U.K. operations during the year ended June 30, 2014 compared to 31% of its revenues from the U.S. and Canada, and 69% from its U.K. operations during the year ended June 30, 2013.
At June 30, 2014, the Company maintained 75% of its net property and equipment in the U.K. and the remaining 25% in the U.S. At June 30, 2013, the Company maintained 69% of its net property and equipment in the U.K. and the remaining 31% in the U.S.
Use of Estimates
The preparation of consolidated financial statements in conformity with accounting principles generally accepted in the United States of America requires management to make estimates and assumptions that affect the reported amounts of assets and liabilities and disclosure of contingent assets and liabilities at the date of the consolidated financial statements, and the reported amounts of revenues and expenses during the reporting period. Significant estimates made by the Company’s management include, but are not limited to, the collectability of accounts receivable, the realizability of inventories, the recoverability of goodwill and other long-lived assets, valuation of deferred tax assets and liabilities, the estimated fair value of stock options, warrants and shares issued for non-cash consideration. Actual results could materially differ from those estimates.
Fair Value of Financial Instruments
The Company’s financial instruments consist principally of cash and cash equivalents, accounts receivable, accounts payable, accrued expenses and debt instruments. Financial assets and liabilities that are remeasured and reported at fair value at each reporting period are classified and disclosed in one of the following three categories:
• Level 1 – Fair value based on quoted prices in active markets for identical assets or liabilities.
• Level 2 – Fair value based on significant directly observable data (other than Level 1 quoted prices) or significant indirectly observable data through corroboration with observable market data. Inputs would normally be (i) quoted prices in active markets for similar assets or liabilities, (ii) quoted prices in inactive markets for identical or similar assets or liabilities or (iii) information derived from or corroborated by observable market data.
• Level 3 – Fair value based on prices or valuation techniques that require significant unobservable data inputs. Inputs would normally be a reporting entity’s own data and judgments about assumptions that market participants would use in pricing the asset or liability.
Determining which category an asset or liability falls within the hierarchy may require significant judgment. The Company evaluates its hierarchy disclosures each quarter. The Company believes that the carrying values of all financial instruments approximate their values due to their nature and respective durations.
| F-9 |
Inventories
Inventories are stated at the lower of cost or current estimated market value. Cost is determined using the first-in, first-out method. Inventories consist primarily of hardware that will be sold to customers. The Company periodically reviews its inventories and records a provision for excess and obsolete inventories based primarily on the Company’s estimated forecast of product demand and production requirements. Once established, write-downs of inventories are considered permanent adjustments to the cost basis of the obsolete or excess inventories.
Property and Equipment
Property and equipment are stated at cost, and are depreciated using the straight-line method over the estimated useful lives of the related assets, ranging from three to five years. Leasehold improvements are amortized using the straight-line method over the lesser of the estimated useful lives of the assets or the related lease terms. Equipment under capital lease obligations is depreciated over the shorter of the estimated useful lives of the related assets or the term of the lease. Maintenance and routine repairs are charged to expense as incurred. Significant renewals and betterments are capitalized. At the time of retirement or other disposition of property and equipment, the cost and accumulated depreciation are removed from the accounts and any resulting gain or loss is reflected in the consolidated statements of comprehensive income.
Software Development Costs
Costs incurred to develop computer software products to be sold or otherwise marketed are charged to expense until technological feasibility of the product has been established. Once technological feasibility has been established, computer software development costs (consisting primarily of internal labor costs) are capitalized and reported at the lower of amortized cost or estimated realizable value. Purchased software development cost is capitalized and recorded at its estimated fair market value. When a product is ready for general release, its capitalized costs are amortized on a product-by-product basis. The annual amortization is the greater of the amounts of: the ratio that current gross revenues for a product bear to the total of current and anticipated future gross revenues for that product; and, the straight-line method over the remaining estimated economic life (a period of three years) of the product including the period being reported on. If the future market viability of a software product is less than anticipated, impairment of the related unamortized development costs could occur, which could significantly impact the Company’s results of operations.
Amortizable Intangible Assets
Amortizable intangible assets consist of completed software technology, customer relationships and automotive data services and are recorded at cost. Completed software technology and customer relationships are amortized using the straight-line method over their estimated useful lives of 8 to 10 years, and automotive data services are amortized using the straight-line method over their estimated useful lives of 20 years.
Goodwill
Goodwill that has indefinite useful lives are not amortized but rather are tested at least annually for impairment.
Goodwill is subject to impairment reviews by applying a fair-value-based test at the reporting unit level, which generally represents operations one level below the segments reported by the Company. As of June 30, 2014, the Company does not believe there is an impairment of its goodwill. There can be no assurance, however, that market conditions will not change or demand for the Company’s products and services will continue which could result in additional impairment of goodwill in the future.
| F-10 |
Goodwill activity for the years ended June 30, 2014 and 2013 are as follows:
| Balance, July 1, 2012 | $ | 9,158,000 | ||
| Effect of exchange rate changes | (175,000 | ) | ||
| Balance, June 30, 2013 | $ | 8,983,000 | ||
| Effect of exchange rate changes | 784,000 | |||
| Balance, June 30, 2014 | $ | 9,767,000 |
Long-Lived Assets
The Company’s management assesses the recoverability of long-lived assets (other than goodwill discussed above) upon the occurrence of a triggering event by determining whether the carrying value of long-lived assets over their remaining lives can be recovered through projected undiscounted future cash flows over its remaining life. The amount of long-lived asset impairment, if any, is measured based on fair value and is charged to operations in the period in which long-lived asset impairment is determined by management. At June 30, 2014, management believes there is no impairment of its long-lived assets. There can be no assurance, however, that market conditions will not change or demand for the Company’s products and services will continue, which could result in impairment of long-lived assets in the future.
Issuance of Equity Instruments to Non-Employees
All issuances of the Company’s equity instruments to non-employees are measured at fair value based upon either the fair value of the equity instruments issued or the fair value of consideration received, whichever is more readily determinable. The majority of stock issuances for non-cash consideration pertains to services rendered by consultants and others and has been valued at the fair value of the equity instruments on the dates issued.
The measurement date for the fair value of the equity instruments issued is determined at the earlier of (i) the date at which a commitment for performance by the consultant or vendor is reached or (ii) the date at which the consultant or vendor’s performance is complete. In the case of equity instruments issued to consultants, the fair value of the equity instrument is recognized over the term of the consulting agreement. Assets acquired in exchange for the issuance of fully vested, non-forfeitable equity instruments is not presented or classified as an offset to equity on the grantor’s balance sheet once the equity instrument is granted for accounting purposes.
Stock-Based Compensation
For valuing stock options awards, the Company has elected to use the Black-Scholes Merton option pricing valuation model (“Black-Scholes”). For the expected term, the Company uses a simple average of the vesting period and the contractual term of the option. Volatility is a measure of the amount by which the Company’s stock price is expected to fluctuate during the expected term of the option. For volatility, the Company considers its own volatility as applicable for valuing its options and warrants. Forfeitures are estimated at the time of grant and revised, if necessary, in subsequent periods if actual forfeitures differ from those estimates. The risk-free interest rate is based on the relevant U.S. Treasury Bill Rate at the time of each grant. The dividend yield represents the dividend rate expected to be paid over the option’s expected term; the Company currently has no plans to pay dividends.
On June 12, 2008, the Company’s shareholders approved the Company’s 2007 Long-Term Stock Incentive Plan (“LTIP”). Stock awarded under the LTIP are accounted for in accordance with Financial Accounting Standards Board (“FASB”) Accounting Standards Codification (“ASC”) 718-10-25-5 because the awards were unilateral grants, the recipients do not have the ability to negotiate the key terms, and the conditions of the grant, and the key terms and conditions were communicated to the individual recipients within a relatively short period of time. Therefore the grant and measurement dates are May 13, 2008, July 1, 2008, July 1, 2009, July 1, 2010, July 1, 2011, July 1, 2012, and April 1, 2013 for each respective stock award. The maximum aggregate number of shares of common stock that may be issued under the LTIP, including stock awards and stock appreciation rights, is limited to 15% of the shares of common stock outstanding on the first trading day of any fiscal year. The Company issued restricted shares to management and board members in fiscal 2014 and 2013 and issued stock options to employees in fiscal 2013 under the LTIP (see Note 7).
| F-11 |
Revenue Recognition
Software license revenue is recognized when persuasive evidence of an arrangement exists, delivery of the product component has occurred, the fee is fixed and determinable, and collectability is probable. If any of these criteria are not met, revenue recognition is deferred until such time as all of the criteria are met.
The Company accounts for delivered elements in accordance with the selling price when arrangements include multiple product components or other elements and vendor-specific objective evidence exists for the value of all undelivered elements. Revenues on undelivered elements are recognized once delivery is complete.
In those instances in which arrangements include significant customization, contractual milestones, acceptance criteria or other contingencies (which represents the majority of the Company’s arrangements), the Company accounts for the arrangements using contract accounting, as follows:
| 1) | When customer acceptance can be estimated, but reliable estimated costs to complete cannot be determined, expenditures are capitalized as work-in process and deferred until completion of the contract at which time the costs and revenues are recognized. |
| 2) | When customer acceptance cannot be estimated based on historical evidence, costs are expensed as incurred and revenue is recognized at the completion of the contract when customer acceptance is obtained. |
The Company records amounts collected from customers in excess of recognizable revenue as deferred revenue in the accompanying consolidated balance sheets. Revenues for maintenance agreements, software support, on-line services and information products are recognized ratably over the term of the service agreement.
Advertising Expense
The Company expenses advertising costs as incurred. For the years ended June 30, 2014 and 2013, advertising expense totaled $564,000 and $353,000, respectively.
Gain on Settlement of Liabilities
The Company realized $13,000 of income from settlement with creditors during the year ended June 30, 2013, which is included in other income (expense) in the accompanying consolidated statements of income and comprehensive income.
Foreign Currency
Management has determined that the functional currency of its subsidiaries is the local currency. Assets and liabilities of the U.K. subsidiaries are translated into U.S. dollars at the year-end exchange rates. Income and expenses are translated at an average exchange rate for the year and the resulting translation gain (loss) adjustments are accumulated as a separate component of stockholders’ equity. The translation gain (loss) adjustment totaled $1,103,000 and $(238,000) for the years ended June 30, 2014 and 2013, respectively.
Foreign currency gains and losses from transactions denominated in other than respective local currencies are included in income. The Company had no foreign currency transaction gain (loss) for all periods presented.
Comprehensive Income
Comprehensive income includes all changes in equity (net assets) during a period from non-owner sources. For the years ended June 30, 2014 and 2013, the components of comprehensive income consist of foreign currency translation income (loss).
| F-12 |
Income Taxes
Deferred tax assets and liabilities are recognized for the future tax consequences attributable to differences between the financial statement carrying amounts of existing assets and liabilities and their respective tax bases. Deferred tax assets and liabilities are measured using enacted tax rates expected to apply to taxable income in the years in which those temporary differences are expected to be recovered or settled. The effect on deferred tax assets and liabilities of a change in tax rates is recognized in income in the period the enactment occurs. Deferred taxation is provided in full in respect of timing differences between the treatment of certain items for taxation and accounting purposes. Valuation allowances are established, when necessary, to reduce deferred tax assets to the amount expected to be realized. The Company’s practice is to recognize interest and/or penalties related to income tax matters in income tax expense. The Company had no accrual for interest or penalties on the Company’s consolidated balance sheets at June 30, 2014 and 2013, and has not recognized interest and/or penalties in the consolidated statements of comprehensive income for the years ended June 30, 2014 and 2013.
Basic and Diluted Earnings Per Share
Basic earnings per share (“BEPS”) is computed by dividing the net income by the weighted average number of common shares outstanding for the year. Diluted earnings per share (“DEPS”) is computed giving effect to all dilutive potential common shares outstanding during the year. Dilutive potential common shares consist of incremental shares issuable upon the exercise of stock options and warrants using the “treasury stock” method. The computation of DEPS does not assume conversion, exercise or contingent exercise of securities that would have an anti-dilutive effect on earnings. For the year ended June 30, 2014, there were 93,114, common share equivalents included in the computation of the diluted earnings per share. For the year ended June 30, 2014 there were no anti-dilutive common stock purchase warrants or stock options outstanding that were excluded from the computation of diluted loss per share. For the year ended June 30, 2013, there were 116,942 common share equivalents included in the computation of the diluted earnings per share. For the year ended June 30, 2013, a total of 62,502 common stock purchase warrants and stock options were excluded from the computation of diluted loss per share, as their effect would have been anti-dilutive.
In connection with the employment agreements with the Company’s Chief Executive Officer and Chief Financial Officer (see Note 6), on April 27, 2012, the Board of Directors approved the issuance of 1,165,359 shares of restricted stock. The shares vest based on the market price of the Company’s common stock. The Company issued these shares to the executives and they are being held by an escrow agent and will be released to the executives when they vest. On April 10, 2014, the Company released from escrow 466,144 shares of common stock to the executives which vested, as our Compensation Committee determined that the initial threshold had been met pursuant to the Company’s LTIP and the executives employment agreements. The Company withheld 151,806 shares which were used to pay income taxes and those shares were retired by the Company.
The Company excludes the remaining 699,215 of these escrow shares from the basic and diluted earnings per share calculations as the market price of the Company’s common stock did not trade at or above the target stock prices per the employment agreements during the reporting period.
In connection with the employment agreement with an officer of a Company subsidiary (see Note 7), on March 1, 2013, the Board of Directors approved the issuance of 282,254 shares of restricted stock. The shares vest based on the market price of the Company’s common stock. The Company issued these shares to the officer and they are being held by an escrow agent and will be released to the officer when they vest. On April 10, 2014, the Company released from escrow 56,451 shares of common stock to the officer which vested as our Compensation Committee determined that the initial threshold had been met pursuant to the Company’s LTIP and the officer’s employment agreements. The Company withheld 15,586 shares which were used to pay income taxes and those shares were retired by the Company.
The Company excludes the remaining 225,803 of these escrow shares from the basic and diluted earnings per share calculations as the market price of the Company’s common stock did not trade at or above the target stock prices per the employment agreements during the reporting period.
| F-13 |
In connection with the employment agreement with the Company’s Chief Technology Officer (see Note 6), on July 1, 2013, the Board of Directors approved the issuance of 250,892 shares of restricted stock. The shares vest based on the market price of the Company’s common stock. The Company issued these shares to the executive and they are being held by an escrow agent and will be released to the executive when they vest. The Company excludes these escrow shares from the basic and diluted earnings per share calculations as the market price of the Company’s common stock did not trade at or above the target stock prices per the employment agreement during the reporting period.
The following is a reconciliation of the numerators and denominators of the basic and diluted earnings per share computation for the years ended June 30:
| 2014 | 2013 | |||||||
| Numerator: | ||||||||
| Net income | $ | 1,672,000 | $ | 3,013,000 | ||||
| Denominator: | ||||||||
| Basic weighted-average shares outstanding | 13,060,638 | 12,708,766 | ||||||
| Effect of dilutive securities | 93,114 | 116,942 | ||||||
| Diluted weighted-average diluted shares | 13,153,752 | 12,825,708 | ||||||
| Basic earnings per common share | $ | 0.13 | $ | 0.24 | ||||
| Diluted earnings per common share | $ | 0.13 | $ | 0.24 | ||||
Derivative Liabilities
For purposes of determining whether certain instruments are derivatives for accounting treatment, the Company follows the accounting standard that provides guidance for determining whether an equity-linked financial instrument, or embedded feature, is indexed to an entity’s own stock. The standard applies to any freestanding financial instruments or embedded features that have the characteristics of a derivative, and to any freestanding financial instruments that are potentially settled in an entity’s own common stock.
The Company had certain common stock purchase warrants that were accounted for as derivative liabilities as they did not meet the requirements to be treated as equity instruments. On September 26, 2012, the Company repurchased a portion of the outstanding warrants that were accounted for as derivative liabilities having a fair value of $396,000 and $548,000 on June 30, 2012 and September 26, 2012, respectively. The fair value of these derivative liabilities increased during the period ended September 26, 2012 and as a result, the Company recognized a loss of approximately $152,000 from the change in fair value of the derivative liability for the period ended September 26, 2012. The Company repurchased the warrants for $475,000 and recorded a gain on settlement of derivative liabilities of $73,000 for the year ended June 30, 2013. On February 21, 2013, the Company repurchased the remaining outstanding warrants that were accounted for as derivative liabilities having a fair value of $46,000 and $165,000 on June 30, 2012 and February 21, 2013, respectively. The fair value of these derivative liabilities increased during the period ended February 21, 2013 and as a result, the Company recognized a loss of approximately $119,000, from the change in fair value of the derivative liability for the period ended February 21, 2013. The Company repurchased the warrants for $107,000 and recorded a gain on settlement of derivative liabilities of $58,000 for the year ended June 30, 2013. The total gain on the settlement of derivative liabilities was $131,000 for the year ended June 30, 2013.
| F-14 |
As of June 30, 2014 and 2013, the Company had no warrants outstanding that are treated as derivative liabilities. Prior to June 30, 2013, these warrants were treated as derivatives and changes in the fair value were recognized in earnings. These common stock purchase warrants did not trade in an active securities market, and as such, the Company estimated the fair value of these warrants using Black-Scholes and the following assumptions:
| June 30, | ||||
| 2013 | ||||
| Annual dividend yield | 0.0 | % | ||
| Expected life (years) | 0.86-1.25 | |||
| Risk-free interest rate | 0.15%– 0.18 | % | ||
| Expected volatility | 27% - 32 | % | ||
The fair value of these common stock purchase warrants was $442,000 on June 30, 2012. The total value of these derivative liabilities increased for the year ended June 30, 2013, and as a result, the Company recognized a loss of approximately $271,000 from the change in fair value of these warrants for the year ended June 30, 2013.
Expected volatility was based primarily on historical volatility. Historical volatility was computed using weekly pricing observations for recent periods. The Company believed this method produced an estimate that was representative of the Company’s expectations of future volatility over the expected term of these warrants. The Company had no reason to believe future volatility over the expected remaining life of these warrants was likely to differ materially from historical volatility. The expected life was based on the remaining contractual term of the warrants. The risk-free rate was based on the U.S. Treasury rate that corresponded to the expected term of the warrants.
The Company has no assets or liabilities that are measured at fair value on a recurring basis as of June 30, 2014 and 2013. There were no assets or liabilities measured at fair value on a non-recurring basis during the years ended June 30, 2014 and 2013.
Recent Accounting Pronouncements
In May 2014, the Financial Accounting Standards Board issued Accounting Standards Update No. 2014-09, Revenue from Contracts with Customers (Topic 606) (“ASU 2014-09”), which amends the existing accounting standards for revenue recognition. ASU 2014-09 is based on principles that govern the recognition of revenue at an amount an entity expects to be entitled when products are transferred to customers. ASU 2014-09 will be effective for the Company beginning in its first quarter of 2018. Early adoption is not permitted. The new revenue standard may be applied retrospectively to each prior period presented or retrospectively with the cumulative effect recognized as of the date of adoption. The Company is currently evaluating the impact of adopting the new revenue standard on its consolidated financial statements.
NOTE 2. PROPERTY AND EQUIPMENT
Property and equipment consist of the following:
| June 30, 2014 | June 30, 2013 | |||||||
| Leasehold improvements | $ | 793,000 | $ | 748,000 | ||||
| Computer and office equipment | 955,000 | 723,000 | ||||||
| Equipment under capital leases | 10,000 | 10,000 | ||||||
| Furniture and equipment | 349,000 | 304,000 | ||||||
| 2,107,000 | 1,785,000 | |||||||
| Less: Accumulated depreciation and amortization | (1,415,000 | ) | (1,096,000 | ) | ||||
| $ | 692,000 | $ | 689,000 | |||||
Depreciation and amortization expense on property and equipment for the years ended June 30, 2014 and 2013 was $232,000 and $195,000, respectively.
| F-15 |
NOTE 3. INTANGIBLE ASSETS
Intangible assets consist of the following:
| June 30, 2014 | June 30, 2013 | |||||||
| Assets not subject to amortization: | ||||||||
| Goodwill | $ | 9,767,000 | $ | 8,983,000 | ||||
| Assets subject to amortization: | ||||||||
| Completed software technology (9-10 years useful life) | $ | 3,150,000 | $ | 3,002,000 | ||||
| Customer contracts / relationships (10 years useful life) | 3,790,000 | 3,716,000 | ||||||
| Automotive data services (20 years useful life) | 334,000 | 298,000 | ||||||
| 7,274,000 | 7,016,000 | |||||||
| Less : Accumulated amortization | (7,156,000 | ) | (6,376,000 | ) | ||||
| Amortizable intangible assets, net | $ | 118,000 | $ | 640,000 | ||||
| Software development costs | $ | 4,204,000 | $ | 3,406,000 | ||||
| Less : Accumulated amortization | (2,651,000 | ) | (2,158,000 | ) | ||||
| Software development costs, net | $ | 1,553,000 | $ | 1,248,000 | ||||
For the years ended June 30, 2014 and 2013, the Company recognized amortization expense on its software development costs and other amortizable intangible assets of $799,000 and $954,000, respectively.
Estimated future amortization of software development costs and intangibles is as follows:
| Years Ending June 30, | ||||
| 2015 | 776,000 | |||
| 2016 | 37,000 | |||
| 2017 | 37,000 | |||
| 2018 | 37,000 | |||
| 2019 | 37,000 | |||
| Thereafter | 747,000 | |||
| Total | $ | 1,671,000 | ||
NOTE 4. LONG-TERM DEBT
Long-term debt consists of the following as of June 30:
| 2014 | 2013 | |||||||
| HSBC term loan | $ | - | $ | 292,000 | ||||
| Secured notes | - | 20,000 | ||||||
| - | 312,000 | |||||||
| Less current portion | - | (312,000 | ) | |||||
| Long term portion | $ | - | $ | - | ||||
HSBC Bank plc.
On October 25, 2010, MAM Ltd., entered into a three-year term loan agreement with HSBC Bank plc. (“HSBC”) as lender (the “HSBC Term Loan”). The HSBC Term Loan provided for £1,324,550 (approximately $2.0 million at the exchange rate on October 25, 2010) with a term of three years from the date the HSBC Term Loan was first drawn down. The HSBC Term Loan was repayable in thirty-six (36) monthly installments, inclusive of interest, together with such sums in the final month to discharge the balance of the HSBC Term Loan.
| F-16 |
The interest rate under the HSBC Term Loan was 2.9% per annum over HSBC’s Sterling Base Rate, as published from time to time, which totaled 3.4% at June 30, 2013.
The Company recorded debt issuance fees of $60,000 related to the HSBC Term Loan, which was being amortized over the life of the loan. Amortization expense was $1,000 and $11,000 for the years ended June 30, 2014 and 2013 respectively. The Company repaid the loan in October 2013.
Secured Notes
The Company had secured notes with monthly payments ranging from $980 to $2,700 which matured during fiscal 2014. The notes bore interest rates of 5.49% to 9.54% and were secured by equipment with a net carrying value of $237,000 as of June 30, 2013. The notes were repaid in fiscal 2014.
NOTE 5. INCOME TAXES
The Company is subject to taxation in the U.S., U.K. and various U.S. state jurisdictions. The Company’s tax years for 1999 and forward are subject to examination by the U.S. and state tax authorities due to losses incurred since inception. The company is currently not under examination by any taxing authorities.
The Company follows the provision of FASB ASC 740-10, Income Taxes, that defines a recognition threshold and measurement attributes for the financial recognition and measurement of a tax position taken or expected to be taken in a tax return. The Income Tax Topic also provides guidance on the de- recognition, classification, interest and penalties, accounting in interim periods, disclosure, and transition. Under the Income Tax Topic, the impact of an uncertain income tax income tax position on the income tax return must be recognized at the largest amount that is more-likely-than-not to be sustained upon audit by the relevant taxing authority. An uncertain income tax position will not be recognized if it has less than a 50% likely of being sustained.
Due to the recognition of a full valuation allowance, against these NOLs, future changes in the Company’s unrecognized tax benefits will not impact the Company’s tax provision.
The Company’s practice is to recognize interest and/or penalties related to income matters in income tax expense. During the twelve months ended June 30, 2014 and 2013, the Company did not recognize and interest or penalties.
The provision (benefit) for income taxes consists of the following for the years ended June 30, 2014 and 2013:
| U.S. Federal | U.S. State | U.K. Corporate | Total | |||||||||||||
| 2014 | ||||||||||||||||
| Current | $ | - | $ | 34,000 | 741,000 | 775,000 | ||||||||||
| Deferred | - | - | (31,000 | ) | (31,000 | ) | ||||||||||
| Total | $ | - | $ | 34,000 | 710,000 | 744,000 | ||||||||||
| 2013 | ||||||||||||||||
| Current | $ | (37,000 | ) | $ | 40,000 | 810,000 | 813,000 | |||||||||
| Deferred | - | - | (90,000 | ) | (90,000 | ) | ||||||||||
| Total | $ | (37,000 | ) | $ | 40,000 | 720,000 | 723,000 | |||||||||
At June 30, 2014, the Company had net U.S. deferred tax assets of approximately $5,157,000. Due to uncertainties surrounding the Company’s ability to generate future U.S. taxable income to realize these assets, a full valuation allowance has been established to offset carry-forwards of not only the net operating losses (“NOLs”), but also its capital losses due to investments previously written off. Additionally, the future utilization of the Company’s federal and state NOLs to offset future taxable income have been determined to be subject to an annual limitation pursuant to Internal Revenue Code (“IRC”) Sections 382 and 383 as a result of ownership changes that have previously occurred.
| F-17 |
Through its Section 382 study, the Company has analyzed any NOLs from its acquired subsidiaries to determine the maximum potential future tax benefit that might be available, and the corresponding limitation imposed based on IRC Section 382. As a result, by the year ended June 30, 2011, the Company adjusted the aforementioned net operating losses previously estimated. The outcome resulted in a determination that it could utilize, annually, approximately $560,000 of previously incurred NOLs; presuming, however, there is taxable income in future periods affording utilization prior to expiration.
At June 30, 2014, the Company had combined federal and state NOLs of approximately $8.4 million and $4.7 million, respectively. The federal and state tax loss carry-forwards will begin to expire in 2019 and 2013 respectively, unless previously utilized.
Significant components of the Company’s net deferred tax assets at June 30, 2014 and 2013 are shown below. A valuation allowance of $5.2 million and $5.2 million has been established to offset the net deferred tax assets as of June 30, 2014 and 2013, respectively, due to uncertainties surrounding the Company’s ability to generate future taxable income to realize these assets. The change in the valuation allowance is primarily attributable to the change in deferred tax assets and NOLs, as capital loss carry-forwards have not changed year to year.
The tax effects of temporary differences and carry-forwards that give rise to significant portions of deferred tax assets consist of the following at June 30, 2014 and 2013:
| June 30, 2014 | June 30, 2013 | |||||||
| Deferred tax assets: | ||||||||
| State taxes | $ | 2,000 | $ | 9,000 | ||||
| Net operating loss carry-forwards | 2,998,000 | 3,239,000 | ||||||
| Write-down of investments | 1,761,000 | 1,720,000 | ||||||
| Deferred revenue | - | - | ||||||
| Equity based compensation | - | - | ||||||
| Reserves and accruals | 177,000 | 210,000 | ||||||
| Deferred rent | 80,000 | 93,000 | ||||||
| Derivative liabilities | - | - | ||||||
| Total deferred tax assets | 5,018,000 | 5,271,000 | ||||||
| Deferred tax (liabilities): | - | |||||||
| Intangible and other long-lived assets | 86,000 | (107,000 | ) | |||||
| Total deferred tax (liabilities) | 5,104,000 | (107,000 | ) | |||||
| Valuation allowance | (5,157,000 | ) | (5,243,000 | ) | ||||
| Net deferred tax (liabilities) | $ | (53,000 | ) | $ | (79,000 | ) | ||
The provision for income taxes for the years ended June 30, 2014 and 2013 differs from the amount computed by applying the U.S. federal income tax rates to net income from continuing operations before taxes as a result of the following:
| June 30, | ||||||||
| 2014 | 2013 | |||||||
| Taxes at federal statutory rates | $ | 821,000 | $ | 1,270,000 | ||||
| State taxes, net of federal benefit | 26,000 | 18,000 | ||||||
| Rate changes | 12,000 | 1,039,000 | ||||||
| Adjustment to reserves and accruals | 57,000 | (309,000 | ) | |||||
| NOL expiration | 265,000 | - | ||||||
| Differential in U.K. corporate tax rate | (351,000 | ) | (321,000 | ) | ||||
| Change in valuation allowance –federal | (86,000 | ) | (974,000 | ) | ||||
| Provision for income taxes | $ | 744,000 | $ | 723,000 | ||||
| F-18 |
A provision has not been made at June 30, 2014 and 2013, for U.S. or additional foreign withholding taxes on undistributed earnings of its U.K. subsidiaries because it is the present intention of management to reinvest the undistributed earnings indefinitely in foreign operations. Generally, such earnings become subject to U.S. tax upon the remittance of dividends and under certain other circumstances. It is not practicable to estimate the amount of deferred tax liability on such undistributed earnings.
NOTE 6. COMMITMENTS AND CONTINGENCIES
Legal Matters
From time to time, the Company is subject to various legal claims and proceedings arising in the ordinary course of business. The ultimate disposition of these proceedings could have a material adverse effect on the consolidated financial position or results of operations of the Company.
Indemnities and Guarantees
The Company has made certain indemnities and guarantees, under which it may be required to make payments to a guaranteed or indemnified party, in relation to certain actions or transactions. The Company indemnifies its directors, officers, employees and agents, as permitted under the laws of the State of Delaware. In connection with its facility leases, the Company has indemnified its lessors for certain claims arising from the use of the facilities. In connection with its customers’ contracts the Company indemnifies the customer that the software provided does not violate any U.S. patent. The duration of the guarantees and indemnities varies, and is generally tied to the life of the agreement. These guarantees and indemnities do not provide for any limitation of the maximum potential future payments the Company could be obligated to make. Historically, the Company has not been obligated nor incurred any payments for these obligations and, therefore, no liabilities have been recorded for these indemnities and guarantees in the accompanying consolidated balance sheets.
Operating Leases
The Company leases its facilities and certain equipment pursuant to month-to-month and non-cancelable operating lease agreements that expire on various dates through October 2028. Terms of the leases provide for monthly payments ranging from $500 to $17,300. For the years ended June 30, 2014 and 2013, the Company incurred rent expense totaling approximately $374,000 and $413,000, respectively. Future annual minimum payments under non-cancelable operating leases are as follows:
| For the years ended June 30, | ||||
| 2015 | 393,000 | |||
| 2016 | 375,000 | |||
| 2017 | 233,000 | |||
| 2018 | 210,000 | |||
| 2019 | 245,000 | |||
| Thereafter | 2,587,000 | |||
| $ | 4,043,000 | |||
Employment Agreements
On July 13, 2010, the Compensation Committee of the Board of Directors (the “Compensation Committee”) approved employment agreements, including a bonus plan, with Michael Jamieson, the Company’s President and Chief Executive Officer and Charles F. Trapp, the Company’s Executive Vice President and Chief Financial Officer. Such employments agreements and bonus plans were entered into as of July 1, 2010 (the “Effective Date”), the first day of the 2011 fiscal year. Effective July 1, 2012, the Company agreed to extend the terms of the employment agreements, and as a result, the employment terms now expire on June 30, 2015, as opposed to June 30, 2014.
| F-19 |
Michael Jamieson Employment Agreement
The Employment Agreement with Mr. Jamieson (the “Jamieson Agreement”) is for an initial term of three years from the Effective Date, and is automatically renewable for successive one-year periods unless terminated by Mr. Jamieson or the Company. Mr. Jamieson will receive an annual base salary of 178,200 GBP (approximately U.S. $290,000), payable in British Pounds Sterling. Effective July 1, 2012, the Company extended the Employment Agreement from the original term of three (3) years to five (5) years, commencing July 1, 2012. As a result of the amendment, the employment terms now expire on June 30, 2015, as opposed to June 30, 2013.
Mr. Jamieson is eligible for a performance-based annual cash incentive bonus depending on the extent to which the applicable performance goal(s) of the Company, which are to be established by our Compensation Committee or pursuant to a formal bonus plan, are achieved, subject to any operating covenants in place with respect to outstanding bank debt. The Compensation Committee established a revenue related target, an EBITDA-related target and strategic targets for the fiscal year ended June 30, 2014 with respect to Mr. Jamieson’s potential incentive compensation for fiscal 2014. The Company paid approximately $27,000 to Mr. Jamieson for his fiscal 2014 incentive compensation.
In addition, Mr. Jamieson is entitled to participate in all of the Company’s benefit plans and our equity-based compensation plans, which currently consists of the Company’s LTIP. Pursuant to the Jamieson Agreement, Mr. Jamieson was awarded 50,000 restricted common shares under the LTIP (the “Stock Grant”). The shares vested ratably over a three-year period, with 20% vesting on the first anniversary of the Stock Grant, 30% vesting on the second anniversary of the Stock Grant, and 50% vesting on the third anniversary of the Stock Grant. As of June 30, 2013, the Company had recorded a cumulative expense of $40,000 from the vesting of the Stock Grant. As of June 30, 2014, all shares have vested and 50,000 shares have been issued.
On April 27, 2012, the Board of Directors approved the issuance of 728,350 restricted shares of Company common stock pursuant to the Company’s 2007 Long-term Incentive Plan. These shares were issued to Mr. Jamieson and are being held in escrow until they vest.
On April 10, 2014, the Company released from escrow 291,340 shares of common stock to the officer which vested, as our Compensation Committee determined that the initial threshold had been met pursuant to the Company’s LTIP and the officer’s employment agreement. The Company withheld 85,217 shares which were used to pay income taxes and those shares were retired by the Company.
The remaining unvested restricted shares will vest according to the following schedule:
| - | 15% when the market price of the Company’s common stock trades at or above $6 for the previous 30 day VWAP. | |
| - | 15% when the market price of the Company’s common stock trades at or above $7 for the previous 30 day VWAP. | |
| - | 30% when the market price of the Company’s common stock trades at or above $8 for the previous 30 day VWAP. |
| F-20 |
The initial value of the restricted shares was approximately $244,000, which is being amortized over the life of the employment agreement. As of June 30, 2014, the amount of unamortized stock based compensation that has not been expensed related to the unvested restricted shares is approximately $56,000. The Company recorded an expense $87,000 and $86,000 from the amortization of the restricted shares for the years ended June 30, 2014 and 2013, respectively. The shares were valued using a Monte Carlo Simulation with a three year life, 124.8% volatility and a risk free interest rate of 0.39%.
The Jamieson Agreement provides that in the event Mr. Jamieson’s employment is terminated by the Company other than for cause or disability, or Mr. Jamieson shall terminate his employment for good reason, he is entitled to, among other things, a severance payment equal to his 12 months base salary. In addition, under such circumstances, all of Mr. Jamieson’s stock appreciation rights and restricted stock will immediately vest and all vested stock options and stock appreciation rights shall be payable in shares of our common stock.
Charles F. Trapp Employment Agreement
The Employment Agreement with Mr. Trapp (the “Trapp Agreement”) is for an initial term of three years from the Effective Date, and is automatically renewable for successive one-year periods unless terminated by Mr. Trapp or the Company. Effective July 1, 2012, the Company extended the Employment Agreement from the original term of three (3) years to five (5) years, commencing July 1, 2012. Commencing July 1, 2013 Mr. Trapp will receive an annual base salary of $225,200, payable in U.S. dollars. As a result of the amendment, the employment terms now expire on June 30, 2015, as opposed to June 30, 2013.
Mr. Trapp is eligible for a performance-based annual cash incentive bonus depending on the extent to which the applicable performance goal(s) of the Company, which are to be established by the Compensation Committee or pursuant to a formal bonus plan, are achieved, subject to any operating covenants in place with respect to outstanding bank debt. The Compensation Committee established a revenue related target, an EBITDA-related target and a strategic targets for the fiscal year ended June 30, 2014, with respect to Mr. Trapp’s potential incentive compensation for fiscal 2014. The Company has accrued $0 for Mr. Trapp for his fiscal 2014 incentive compensation.
In addition, Mr. Trapp is entitled to participate in all of our benefit plans and equity-based compensation plans, which currently consists of the LTIP. Pursuant to the Trapp Agreement, Mr. Trapp was awarded 20,000 restricted common shares under the LTIP (the “Trapp Stock Grant”). The shares vested ratably over a three-year period, with 20% vesting on the first anniversary of the Stock Grant, 30% vesting on the second anniversary of the Trapp Stock Grant, and 50% vesting on the third anniversary of the Trapp Stock Grant. As of June 30, 2013, the Company recorded a cumulative expense of $16,000 from the vesting of the Trapp Stock Grant. As of June 30, 2013, all shares have vested and 20,000 shares have been issued.
On April 27, 2012 the Board of Directors approved the issuance of 437,009 restricted shares of Company common Stock pursuant to the Company’s 2007 Long-term Incentive Plan. These shares were issued to Mr. Trapp and are being held in escrow until they vest.
On April 10, 2014, the Company released from escrow 174,804 shares of common stock to the officer which vested, as our Compensation Committee determined that the initial threshold had been met pursuant to the Company’s LTIP and the officer’s employment agreement. The Company withheld 66,589 shares which were used to pay income taxes and those shares were retired by the Company.
The remaining unvested restricted shares will vest according to the following schedule:
| - | 15% when the market price of the Company’s common stock trades at or above $6 for the previous 30 day VWAP. | |
| - | 15% when the market price of the Company’s common stock trades at or above $7 for the previous 30 day VWAP. | |
| - | 30% when the market price of the Company’s common stock trades at or above $8 for the previous 30 day VWAP. |
| F-21 |
The initial value of the restricted shares was approximately $146,000, which will be amortized over the life of the employment agreement. As of June 30, 2014, the amount of unamortized stock based compensation that has not been expensed related to the unvested restricted shares is approximately $33,000. The Company recorded an expense of $52,000 and $42,000 from the amortization of the unvested restricted shares for the years ended June 30, 2014 and 2013, respectively. The shares were valued using a Monte Carlo Simulation with a three year life, 124.8% volatility and a risk free interest rate of 0.39%.
The Trapp Agreement provides that in the event Mr. Trapp’s employment is terminated by the Company other than for cause or disability, or Mr. Trapp shall terminate his employment for good reason, he is entitled to, among other things, a severance payment equal to his 12 months base salary. In addition, under such circumstances, all of Mr. Trapp’s stock appreciation rights and restricted stock will immediately vest and all vested stock options and stock appreciation rights shall be payable in shares of the Company’s common stock.
Lee Broad Employment Agreement
The Employment Agreement with Mr. Broad (the “Broad Agreement”) is for an initial term of two years from July 1, 2013, and is automatically renewable for successive one-year periods unless terminated by Mr. Broad or the Company. Mr. Broad received an annual base salary of 125,000GBP (approximately $203,000), payable in British Pound Sterling.
Mr. Broad is eligible for a performance-based annual cash incentive bonus depending on the extent to which the applicable performance goal(s) of the Company, which are to be established by the Compensation Committee or pursuant to a formal bonus plan, are achieved, subject to any operating covenants in place with respect to outstanding bank debt.
In addition, Mr. Broad is entitled to participate in all of our benefit plans and equity-based compensation plans, which currently consists of the LTIP.
On July 1, 2013, the Board of Directors approved the issuance of 250,892 restricted shares of Company common stock pursuant to the Company’s 2007 Long-term Incentive Plan. These shares were issued to Mr. Broad and are being held in escrow until they vest. The restricted shares will vest according to the following schedule:
| - | 20% when the market price of the Company’s Common stock trades at or above $6 for the previous 30 day volume weighted average price (“VWAP”) | |
| - | 30% when the market price of the Company’s common stock trades at or above $7 for the previous 30 day VWAP. | |
| - | 30% when the market price of the Company’s Common stock trades at or above $8 for the previous 30 day VWAP. | |
| - | 30% when the market price of the Company’s Common stock trades at or above $9 for the previous 30 day VWAP. |
The initial value of the common stock grant was approximately $265,000, which will be amortized over the life of the employment agreement. As of June 30, 2014, the amount of unamortized stock based compensation that has not been expensed related to the unvested restricted shares is $110,000. The Company recorded an expense of $155,000 from the amortization of the unvested restricted shares for the year ended June 30, 2014. The shares were valued using a Monte Carlo Simulation with a two year life, 124.8% volatility and a risk free interest rate of 0.39%.
The Broad Agreement provides that in the event Mr. Broad’s employment is terminated by the Company other than for cause or disability, or Mr. Broad shall terminate his employment for good reason, he is entitled to, among other things, a severance payment equal to his 12 months base salary.
| F-22 |
NOTE 7. STOCKHOLDERS’ EQUITY
Common Stock
During the quarter ended September 30, 2010, the Company approved the issuance of 155,625 shares of common stock to the non-management members of the Board of Directors under the Company’s 2007 LTIP in respect of quarterly compensation. The shares vest over a three year period and are issued quarterly. During the years ended June 30, 2014 and 2013, the Company issued 9,508 and 43,396 shares of common stock valued at $8,000 and $34,000, respectively.
During the quarter ended September 30, 2011, the Company approved the issuance of 88,398 shares of common stock to the non-management members of the Board of Directors under the Company’s 2007 LTIP in respect of quarterly compensation. The shares vest over a three year period and are issued quarterly. During the years ended June 30, 2014 and 2013, the Company issued 21,360 and 24,510 shares of common stock valued at $39,000 and $44,000, respectively.
During the quarter ended September 30, 2012, the Company approved the issuance of 98,654 shares of common stock to the non-management members of the Board of Directors under the Company’s 2007 LTIP in respect of quarterly compensation. The shares vest over a three year period and are issued quarterly. During the year ended June 30, 2014 and 2013, the Company issued 25,300 and 20,283 shares valued at $56,000 and $45,000.
During the quarter ended June 30, 2013, the Company approved the issuance of 66,169 shares to the non-management members of the Board of Directors under the Company’s 2007 LTIP in respect of quarterly compensation. The shares vest over a three year period and are issued quarterly. The shares were valued at approximately $244,000, based on the closing market price of the Company’s common stock on the date of the grant, April 1, 2013. During the year ended June 30, 2014, the Company issued 20,376 shares valued at approximately $75,000. No shares were issued during the year ended June 30, 2013.
During the years ended June 30, 2014 and 2013, the Company issued 12,769 and 6,063 shares of common stock to certain directors in lieu of quarterly cash compensation valued at $59,000 and $17,000, respectively.
On July 3, 2012, the Company issued 21,000 shares of common stock to officers of the Company in accordance with their employment agreements, which were valued at approximately $17,000 based on the closing market price of the Company’s common stock on the date of the grant.
On September 13, 2012, the Company issued 10,972 shares of common stock valued at $24,000 based on closing market price of the Company’s common stock on the date of the grant and 5,370 shares of common stock valued at $11,000 based on closing market price of the Company’s common stock on the date of the grant for payment of accrued compensation.
On January 4, 2013, the Company issued 1,155 shares of common stock to employees, under the ESPP in lieu of compensation, which were valued at approximately $2,000 based on the closing market price of the Company’s common stock on July 2, 2012.
On January 4, 2013, the Company issued 5,354 shares of common stock to a certain directors in lieu of compensation, which were valued at approximately $16,000 based on the closing market price of the Company’s common stock on January 3, 2013.
On January 4, 2013, the Company issued 11,900 shares of common stock to a certain officer in lieu of compensation, valued at approximately $36,000 based on the closing market price of the Company’s common stock on January 3, 2013.
On April 25, 2013 the Company received proceeds of approximately $14,000 from the exercise of 21,000 stock options.
On August 7, 2013, the Company issued 20,000 shares of common stock to officers of the Company in accordance with employment agreements, which were valued at $16,000 based on the closing market price of the common stock on the date of the grant.
| F-23 |
During the fiscal year ended June 30, 2014 the Company received proceeds of approximately $43,000 from the exercise of 52,238 stock options.
On March 1, 2013, the Board of Directors approved the issuance of 282,254 restricted shares of Company common stock to a certain subsidiary officer pursuant to the Company’s 2007 LTIP. These shares were issued to the officer and are being held in escrow until they vest. The restricted shares will vest according to the following schedule:
| - | 20% when the market price of the Company’s common stock trades at or above $5 for the previous 30 day volume weighted average price (“VWAP”) |
| - | 30% when the market price of the Company’s common stock trades at or above $6 for the previous 30 day VWAP. |
| - | 30% when the market price of the Company’s common stock trades at or above $7 for the previous 30 day VWAP. |
| - | 20% when the market price of the Company’s common stock trades at or above $8 for the previous 30 day VWAP. |
The initial value of the restricted shares was approximately $109,000, which will be amortized over the life of the employment agreement. As of June 30, 2014, the amount of unamortized stock based compensation related to the restricted shares is approximately $31,000. The shares were valued using a Monte Carlo Simulation with a two year life, 39.6% volatility and a risk free interest rate of 0.25%. The Company recognized $58,000 of expense for the year ended June 30, 2014. If there are any modifications or cancellations of the underlying unvested awards, the Company may be required to accelerate, increase or cancel any remaining unearned stock-based compensation expense or calculate and record additional expense. Future stock-based compensation expense and unearned stock-based compensation will increase to the extent that the Company grants additional common stock options or other stock-based awards common stock only upon the approval of the Company's shareholders to amend the Company's certificate of incorporation to increase the number of authorized shares.
On April 10, 2014, the Company released from escrow 56,451 shares of common stock to the officer which vested, as our Compensation Committee determined that the initial threshold had been met pursuant to the Company’s LTIP and the officer’s employment agreement. The Company withheld 15,586 shares which were used to pay income taxes and those shares were retired by the Company.
On July 1, 2013, the Board of Directors approved the issuance of 250,892 restricted shares of Company common stock pursuant to the Company’s 2007 Long-term Incentive Plan (See Note 6).
| F-24 |
Treasury Stock
From July 1, 2012 until June 30, 2013, the Company repurchased 622,815 shares of the common stock at a cost of approximately $1,631,000. On July 25, 2012, the Company retired 1,145,759 shares of common stock that were acquired at an approximate cost of $2,242,000.
From July 1, 2013 until June 30, 2014, the Company repurchased 167,392 shares of common stock at a cost of approximately $845,000. On April 10, 2014, the Company retired 167,392 shares of common stock that were acquired at an approximate cost of $845,000. As of June 30, 2014, the Company has a remaining approval to repurchase an additional $1,475,000 of treasury stock.
Stock-Based Compensation:
A summary of the Company's common stock option activity is presented below (shares in thousands):
| Options Outstanding | ||||||||||||||||
| Number of Shares (in thousands) | Weighted- Average Exercise Price | Weighted- Average Remaining Contractual Life (in years) | Aggregate Intrinsic Value (in thousands) | |||||||||||||
| Options outstanding - July 1, 2013 | 173 | $ | 1.11 | |||||||||||||
| Options granted | - | - | ||||||||||||||
| Options exercised | (52 | ) | 0.82 | |||||||||||||
| Options cancelled | - | - | ||||||||||||||
| Options outstanding - June 30, 2014 | 121 | $ | 1.23 | 7.0 | $ | 495 | ||||||||||
| Options exercisable - June 30, 2014 | 121 | $ | 1.23 | 7.0 | $ | 495 | ||||||||||
| Options exercisable and expected to vest - June 30, 2014 | 121 | $ | 1.23 | 7.0 | $ | 495 | ||||||||||
During the year ended June 30, 2014, the Company received proceeds of approximately $43,000 from the exercise of 52,238 stock options.
Employee Stock Purchase Plan
On September 21, 2011, the Company approved the MAM Software Group, Inc. Employee Stock Purchase Plan (“ESPP” or the “Plan”). On December 16, 2011 the shareholders approved the ESPP. Under the ESPP the Company will grant eligible employees the right to purchase common stock through payroll deductions at a price equal to the lesser of 85 percent of the fair market value of a share of common stock on the Exercise Date of the current Offering Period or 85 percent of the fair market value of our common stock on the Grant Date of the Offering Period. No employee will be granted an option to purchase more than $2,400 of fair market value common stock in a calendar year. The Plan is intended to be an “employee stock purchase plan” as defined in Section 423 of the Internal Revenue Code. The Plan covers a maximum of 100,000 shares of common Stock which will be offered to employees until January 2, 2022 or until the Plan is terminated by the Board of Directors. During the quarter ended March 31, 2014, the Company issued 9,442 shares of common stock to employees including an officer, under the ESPP in lieu of compensation, which were valued at approximately $44,000 based on the closing market price of the Company’s common stock on July 1, 2013. During the quarter ended September 30, 2013, the Company issued 10,165 shares of common stock to employees including an officer under the ESPP in lieu of compensation, which were valued at approximately $31,000 based on the closing market price of the Company’s common stock on January 2, 2013. During the quarter ended March 31, 2013, the Company issued 5,450 shares of common stock to employees, under the ESPP in lieu of compensation, which were valued at approximately $12,000 based on the closing market price of the Company’s common stock on July 1, 2012.
| F-25 |
Warrants:
The following is a summary of warrant activity for the year ended June 30, 2014:
| Balance as of June 30, 2013 | 71,854 | |||
| Warrants expired | (67,224 | ) | ||
| Warrants issued and outstanding at June 30, 2014 | 4,630 |
The outstanding warrants are all exercisable; have an exercise price of $0.80 and remaining life of 0.5 years. The weighted average exercise price is $0.80 per share and the weighted remaining life is 0.5 years.
During the year ended June 30, 2014, 67,224 warrants with an exercise price ranging from $0.80 to $10.00 expired.
During the year ended June 30, 2013, the Company repurchased 147,056 warrants with exercise prices from $0.80 to $3.00 for approximately $142,000 and reduced additional paid-in capital.
During the year ended June 30, 2013, 508,334 warrants, which were accounted for as derivative liabilities, with exercise prices from $0.92 to $2.49 and a weighted average exercise price of $1.57 were retired for approximately $582,000.
NOTE 8. 401(k) PLAN
The Company has a retirement plan that complies with Section 401(k) of the Internal Revenue Code. All U.S. employees are eligible to participate in the plan. The Company’s contribution to the 401(k) Plan is at the discretion of the Board of Directors. Starting January 1, 2013 the Company matches 100% of elective deferrals subject to a maximum of 3% of the participant’s eligible earnings. The Company’s matching contributions for the years ended June 30, 2014 and 2013 were $69,000 and $33,000, respectively.
NOTE 9. SUBSEQUENT EVENTS
During the quarter ended September 30, 2014, the Company issued 8,464 shares of common stock to employees, including officers, under the ESPP in lieu of compensation, which were valued at approximately $37,000 based on the closing market price of the Company’s common stock on January 2, 2014.
On July 8, 2014, the Company issued 16,765 shares of common stock to certain directors, which were valued at approximately $43,000 based on the closing market price of the Company’s common stock on the date of the grant.
On July 8, 2014, the Company issued 3,061 shares of common stock to certain directors, in lieu of cash compensation, which were valued at approximately $17,000 based on the closing market price of the Company’s common stock on the date of the grant.
On September 23, 2014, the Company released from escrow 174,804 shares of common stock to certain executives of the Company which vested pursuant to the terms of the April 20, 2012 grant as the market price threshold of the common stock had been achieved. The shares were issued pursuant to the Company’s LTIP and the executives employment agreements. The Company withheld 66,347 shares which were used to pay taxes and those shares were retired by the Company.
| F-26 |
On September 23, 2014, the Company released from escrow 84,676 shares of common stock to an officer of a subsidiary of the Company which vested pursuant to the terms of the March 1, 2013 grant as the market price threshold of the common stock had been achieved. The shares were issued pursuant to the Company’s LTIP and the officer’s employment agreement. The Company withheld 44,455 shares which were used to pay taxes and those shares were retired by the Company.
On September 23, 2014, the Company released from escrow 50,178 shares of common stock to a certain executive of the Company which vested pursuant to the terms of the July 1, 2013 grant as the market price threshold of the common stock had been achieved. The shares were issued pursuant to the Company’s LTIP and the executive’s employment agreement. The Company withheld 23,584 shares which were used to pay taxes and those shares were retired by the Company.
| F-27 |
EXHIBITS
| Exhibit Number | Description of Exhibit | |
| 3(i) | Certificate of Incorporation of MAM Software Group, Inc., as amended (incorporated by reference to Exhibit 3(i) to the Company’s Registration Statement on Form S-1/A filed on July 15, 2008). | |
| 3(ii) | By laws (incorporated by reference to Exhibit 3(ii) to the Company’s Registration Statement on Form SB-2 filed on February 16, 2007). | |
| 4.1 | Form of Certificate of Common Stock (incorporated by reference to Exhibit 4.1 to the Company’s Registration Statement on Form SB-2 filed on February 16, 2007). | |
| 10.1 | Share Sale Agreement relating to EXP Dealer Software Limited dated August 4, 2006 among Auto Data Network, Inc., MAM Software Group, Inc. and MAM Software Dealer Software Limited (incorporated by reference to Exhibit 10.1 to the Company’s Current Report on Form 8-K filed on August 31, 2006). | |
| 10.2 | Share Sale Agreement relating to Dealer Software and Services Limited dated February 1, 2007 between MAM Software Group, Inc. and Auto Data Network, Inc. (incorporated by reference to Exhibit 10.1 to the Company’s Current Report on Form 8-K filed on February 7, 2007). | |
| 10.4 | Form of Common Stock Purchase Warrant (incorporated by reference to Exhibit 10.2 to the Company’s Current Report on Form 8-K filed July 6, 2007). | |
| 10.5 | Form of Registration Rights Agreement (incorporated by reference to Exhibit 10.3 to the Company’s Current Report on Form 8-K filed July 6, 2007). | |
| 10.6 | Settlement and Release Agreement between ASNA and Aidan J. McKenna (incorporated by reference to Exhibit 99.1 to the Company’s Current Report on Form 8-K filed August 6, 2007). | |
| 10.7 | Share Sale Agreement, dated November 12, 2007, between EU Web Services, Ltd., as Purchaser, MAM Software Group, Inc., as Vendor, and EXP Dealer Software Ltd. (incorporated by reference to Exhibit 99.1 of the Company’s Current Report on Form 8-K filed November 16, 2007) | |
| 10.8 | Revolving Credit and Term Loan Agreement dated as of December 21, 2007, by and between ComVest Capital LLC, as Lender, and MAM Software Group, Inc., as Borrower (incorporated by reference to Exhibit 10.1 of the Company’s Current Report on Form 8-K filed December 31, 2007). | |
| 10.9 | Revolving Credit Note dated December 21, 2007 in the principal amount of $1,000,000 (incorporated by reference to Exhibit 10.2 of the Company’s Current Report on Form 8-K filed December 31, 2007). | |
| 10.10 | Convertible Term Note, dated December 21, 2007 in the principal amount of $5,000,000 (incorporated by reference to Exhibit 10.3 of the Company’s Current Report on Form 8-K filed December 31, 2007). | |
| 10.11 | Collateral Agreement dated as of December 21, 2007 by and among MAM Software Group, Inc., Aftersoft Network, N.A. Inc., MAM Software Ltd., MAM Software Group (U.K.) Ltd., AFS Warehouse Distribution Management, Inc., AFS Tire Management, Inc. and AFS Autoservice Inc., and ComVest Capital LLC (incorporated by reference to Exhibit 10.4 of the Company’s Current Report on Form 8-K filed December 31, 2007). |
| 53 |
| 10.12 | Guaranty Agreement dated December 21, 2007 by Aftersoft Network, N.A. Inc., MAM Software Ltd., MAM Software Group (U.K.) Ltd., AFS Warehouse Distribution Management, Inc., AFS Tire Management, Inc. and AFS Autoservice Inc., in favor of ComVest Capital LLC (incorporated by reference to Exhibit 10.5 of the Company’s Current Report on Form 8-K filed December 31, 2007). | |
| 10.13 | Form of Validity Guaranty (incorporated by reference to Exhibit 10.6 of the Company’s Current Report on Form 8-K filed December 31, 2007). | |
| 10.14 | Warrant, dated as of December 21, 2007, to Purchase 1,000,000 Shares of Common Stock of MAM Software Group, Inc. (incorporated by reference to Exhibit 10.7 of the Company’s Current Report on Form 8-K filed December 31, 2007). | |
| 10.15 | Warrant, dated as of December 21, 2007, to purchase 2,000,000 Shares of Common Stock of MAM Software Group, Inc. (incorporated by reference to Exhibit 10.8 of the Company’s Current Report on Form 8-K filed December 31, 2007). | |
| 10.16 | Warrant, dated as of December 21, 2007, to purchase 2,083,333 Shares of Common Stock of MAM Software Group, Inc. (incorporated by reference to Exhibit 10.9 of the Company’s Current Report on Form 8-K filed December 31, 2007). | |
| 10.17 | Registration Rights Agreement dated as of December 21, 2007 by MAM Software Group, Inc. for the benefit of the holders (incorporated by reference to Exhibit 10.10 of the Company’s Current Report on Form 8-K filed December 31, 2007). | |
| 10.18 | 2007 Long-Term Stock Incentive Plan (incorporated by reference to Exhibit D of the Company’s revised Definitive Proxy Statement filed on May 19, 2008). | |
| 10.19 | Employment Agreement dated as of December 1, 2008 between the Company and Ian Warwick (incorporated by reference to Exhibit 10.1 of the Company’s Current Report on Form 8-K filed December 5, 2008). | |
| 10.20 | Employment Agreement dated as of December 1, 2008 between the Company and Charles F. Trapp (incorporated by reference to Exhibit 10.2 of the Company’s Current Report on Form 8-K filed December 5, 2008). | |
| 10.21 | Employment Agreement dated as of December 1, 2008 between the Company and Simon Chadwick (incorporated by reference to Exhibit 10.3 of the Company’s Current Report on Form 8-K filed December 5, 2008). | |
| 10.22 | May 15, 2008 Waiver and Amendment (incorporated by reference to Exhibit 10.1 of the Company’s Current Report on Form 8-K filed March 27, 2009). | |
| 10.23 | September 23, 2008 Waiver and Amendment (incorporated herein by reference to Exhibit 10.2 of the Company’s Current Report on Form 8-K filed March 27, 2009). | |
| 10.24 | February 10, 2009 Waiver and Amendment (incorporated herein by reference to Exhibit 10.3 of the Company’s Current Report on Form 8-K filed March 27, 2009). | |
| 10.25 | April 22, 2009 Amendment (incorporated by reference to Exhibit 10.1 of the Company’s current Report on Form 8-K filed April 23, 2009). | |
| 10.26 | Consulting Agreement with Commonwealth Associates LP dated June 3, 2008 (incorporated herein by reference to Exhibit 10.25 to the Company's Registration Statement on Form S-1/A filed on April 3, 2009). |
| 54 |
| 14 | Code of Ethics (incorporated by reference to Exhibit 14 to the Company’s Annual report on Form 10-K/A for the fiscal year ended June 30, 2007 filed October 15, 2007.) | |
| 21 | List of subsidiaries (incorporated by reference to Exhibit 21 to the Company’s Registration Statement on Form S-1/A filed on July 15, 2008). | |
| 31.1 | Certification of Principal Executive Officer pursuant to Section 302 of the Sarbanes-Oxley Act of 2002 (filed herewith). | |
| 31.2 | Certification of Principal Financial Officer pursuant to Section 302 of the Sarbanes-Oxley Act of 2002 (filed herewith). | |
| 32.1 | Certification of Principal Executive Officer pursuant to 18 U.S.C. Section 1350, as adopted pursuant to Section 906 of the Sarbanes-Oxley Act of 2002 (filed herewith). | |
| 32.2 | Certification of Principal Financial Officer pursuant to 18 U.S.C. Section 1350, as adopted pursuant to Section 906 of the Sarbanes-Oxley Act of 2002 (filed herewith). |
| 101.INS * | XBRL Instance Document | |
| 101.SCH * | XBRL Taxonomy Schema | |
| 101.CAL * | XBRL Taxonomy Calculation Linkbase | |
| 101.DEF * | XBRL Taxonomy Definition Linkbase | |
| 101.LAB * | XBRL Taxonomy Label Linkbase | |
| 101.PRE * | XBRL Taxonomy Presentation Linkbase |
In accordance with SEC Release 33-8238, Exhibits 32.1 and 32.2 are being furnished and not filed.
* XBRL (Extensible Business Reporting Language) information is furnished and not filed or a part of a registration statement or prospectus for purposes of Sections 11 or 12 of the Securities Act of 1933, as amended, is deemed not filed for purposes of Section 18 of the Securities Exchange Act of 1934, as amended, and otherwise is not subject to liability under these sections.
| 55 |