Attached files
| file | filename |
|---|---|
| 8-K - CURRENT REPORT - ADVANCED DRAINAGE SYSTEMS, INC. | d786779d8k.htm |
| Exhibit 99.1
|
2014 RBC Capital Markets’ Global Industrials Conference
September 2014
LEADERSHIP • GROWTH • MOMENTUM THROUGH STRENGTH
|
|
Forward Looking Statements and Non-GAAP
Financial Measures
Certain statements in this presentation may be deemed to be forward-looking statements within the meaning of Section 27A of the Securities Act of 1933, as amended, and Section 21E of the Securities Exchange Act of 1934, as amended. These statements are not historical facts but rather are based on the Company’s current expectations, estimates and projections regarding the Company’s business, operations and other factors relating thereto. Words such as “may,” “will,” “could,” “would,” “should,” “anticipate,” “predict,” “potential,” “continue,” “expects,” “intends,” “plans,” “projects,” “believes,” “estimates” and similar expressions are used to identify these forward-looking statements. Factors that could cause actual results to differ from those reflected in forward-looking statements relating to our operations and business include: fluctuations in the price and availability of resins and other raw materials and our ability to pass any increased costs of raw materials on to our customers in a timely manner; volatility in general business and economic conditions in the markets in which we operate, including, without limitation, factors relating to availability of credit, interest rates, fluctuations in capital and business and consumer confidence; cyclicality and seasonality of the non-residential and residential construction markets and infrastructure spending; the risks of increasing competition in our existing and future markets, including competition from both manufacturers of high performance thermoplastic corrugated pipe and manufacturers of products using alternative materials; our ability to continue to convert current demand for concrete, steel and PVC pipe products into demand for our high performance thermoplastic corrugated pipe and Allied Products; the effect of weather or seasonality; the loss of any of our significant customers; the risks of doing business internationally; the risks of conducting a portion of our operations through joint ventures; our ability to expand into new geographic or product markets; our ability to achieve the acquisition component of our growth strategy; the risk associated with manufacturing processes; our ability to manage our assets; the risks associated with our product warranties; our ability to manage our supply purchasing and customer credit policies; the risks associated with our self-insured programs; our ability to control labor costs and to attract, train and retain highly-qualified employees and key personnel; our ability to protect our intellectual property rights; changes in laws and regulations, including environmental laws and regulations; our ability to project product mix; the risks associated with our current levels of indebtedness; our ability to meet future capital requirements and fund our liquidity needs; and the other risks and uncertainties described in the Company’s filings with the Securities and Exchange Commission. New risks and uncertainties emerge from time to time and it is not possible for the Company to predict all risks and uncertainties that could have an impact on the forward-looking statements contained in this press release. In light of the significant uncertainties inherent in the forward-looking information included herein, the inclusion of such information should not be regarded as a representation by the Company or any other person that the Company’s expectations, objectives or plans will be achieved in the timeframe anticipated or at all. Investors are cautioned not to place undue reliance on the Company’s forward-looking statements and the
Company undertakes no obligation to publicly update or revise any forward-looking statements, whether as a result of new information, future events or otherwise, except as required by law.
This presentation includes certain non-GAAP financial measures to describe the Company’s performance. The reconciliation of those measures to GAAP measures are provided within the appendix of the presentation. Those disclosures should not be viewed as a substitute for operating results determined in accordance with GAAP, nor are they necessarily comparable to non-GAAP performance measures that may be presented by other companies.
LEADERSHIP • GROWTH • MOMENTUM
THROUGH STRENGTH
2
|
|

Management Presenters
Joseph Chlapaty
Chairman, President & CEO
Years at the Company: 33
Years in the Industry: 33
Mark Sturgeon
Executive Vice President, Finance & CFO
Years at the Company: 33
Years in the Industry: 33
LEADERSHIP • GROWTH • MOMENTUM
THROUGH STRENGTH
3
|
|
ADS – An Industrial Growth Company
The leading player in the industry
The only complete solutions provider for the water management industry, with a history of product innovation
Track record of market share gains with material conversion growing steadily over time
Large addressable opportunity across diverse construction markets
Demonstrated ability to deliver above market growth, EBITDA margin expansion and strong cash flows
Experienced management team with significant ownership stake
LEADERSHIP • GROWTH • MOMENTUM
THROUGH STRENGTH
4
|
|
ADS At A Glance
Company Snapshot
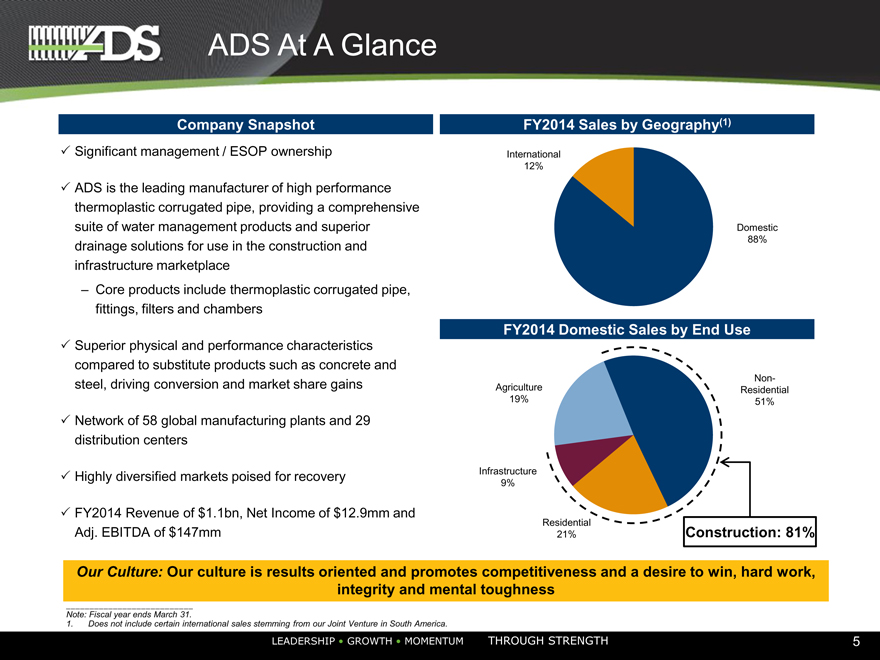
Significant management / ESOP ownership
ADS is the leading manufacturer of high performance thermoplastic corrugated pipe, providing a comprehensive suite of water management products and superior drainage solutions for use in the construction and infrastructure marketplace
Core products include thermoplastic corrugated pipe, fittings, filters and chambers
Superior physical and performance characteristics compared to substitute products such as concrete and steel, driving conversion and market share gains
Network of 58 global manufacturing plants and 29 distribution centers
Highly diversified markets poised for recovery
FY2014 Revenue of $1.1bn, Net Income of $12.9mm and Adj. EBITDA of $147mm
FY2014 Sales by Geography(1)
International
12%
Domestic
88%
FY2014 Domestic Sales by End Use
Non-
Agriculture Residential
19% 51%
Infrastructure
9%
Residential
21% Construction: 81%
Our Culture: Our culture is results oriented and promotes competitiveness and a desire to win, hard work, integrity and mental toughness
Note: Fiscal year ends March 31.
1. Does not include certain international sales stemming from our Joint Venture in South America.
LEADERSHIP • GROWTH • MOMENTUM THROUGH STRENGTH 5
|
|
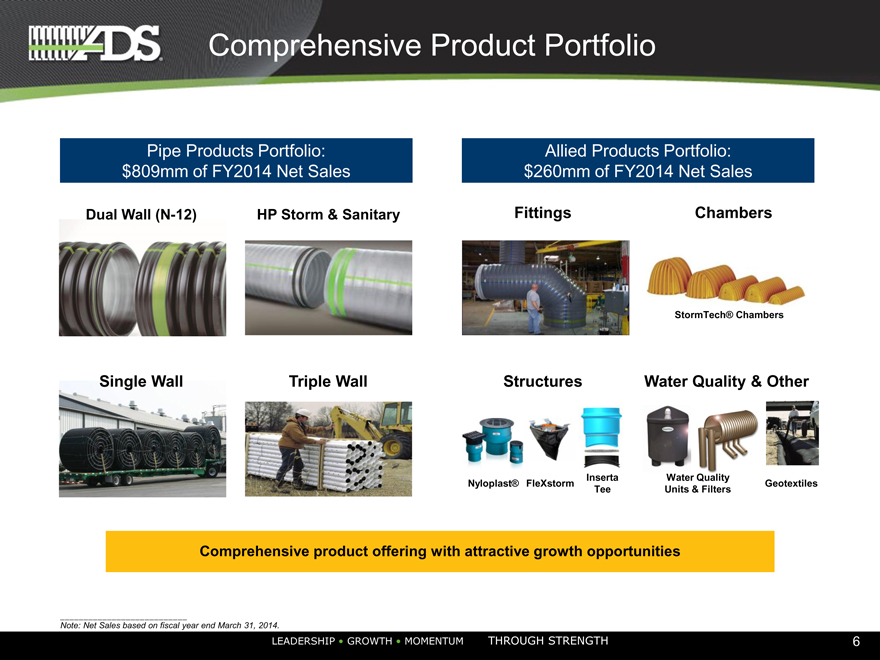
Comprehensive Product Portfolio
Pipe Products Portfolio: Allied Products Portfolio:
$809mm of FY2014 Net Sales $260mm of FY2014 Net Sales
Dual Wall (N-12) HP Storm & Sanitary Fittings Chambers
StormTech® Chambers
Single Wall Triple Wall Structures Water Quality & Other
Inserta Water Quality
Nyloplast® FleXstorm Geotextiles
Tee Units & Filters
Comprehensive product offering with attractive growth opportunities
Note: Net Sales based on fiscal year end March 31, 2014.
LEADERSHIP • GROWTH • MOMENTUM THROUGH STRENGTH
6
|
|
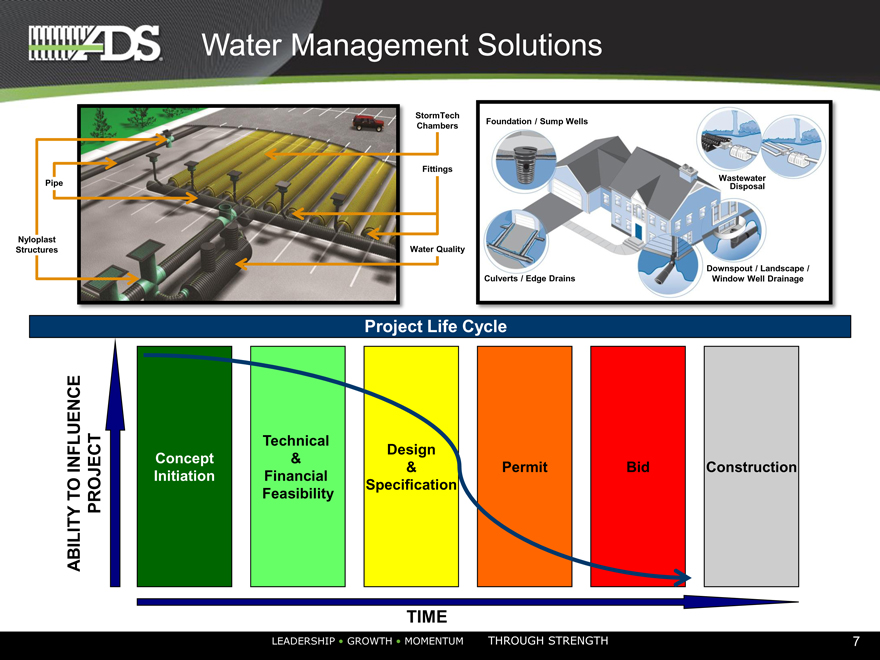
Water Management Solutions
StormTech
Chambers Foundation / Sump Wells
Fittings
Wastewater
Pipe Disposal
Nyloplast
Structures Water Quality
Downspout / Landscape /
Culverts / Edge Drains Window Well Drainage
Project Life Cycle
Technical Design
INFLUENCE Concept & & Permit Bid Construction
Initiation Financial
TO PROJECT Feasibility Specification
ABILITY
TIME
LEADERSHIP • GROWTH • MOMENTUM THROUGH STRENGTH 7
|
|
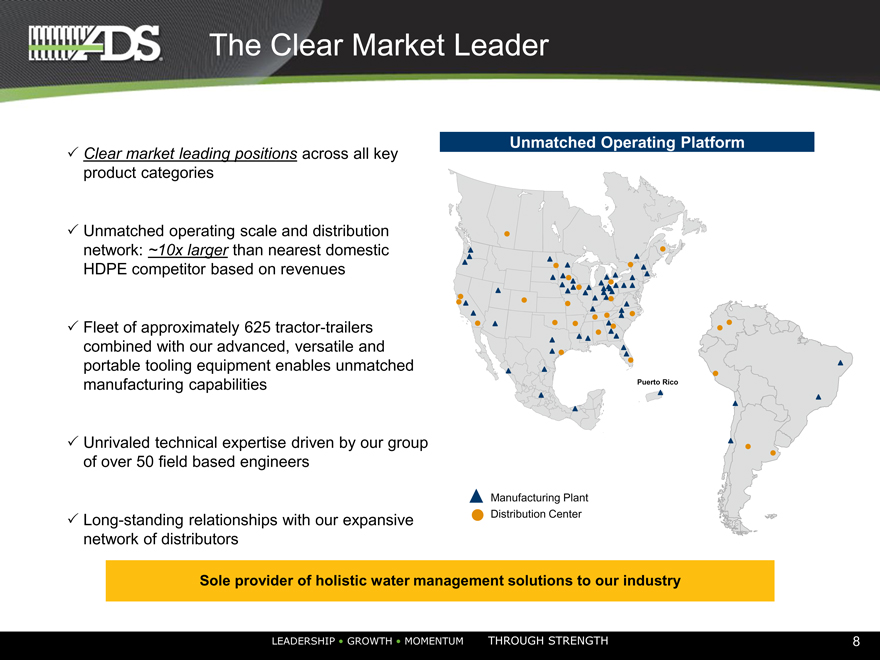
The Clear Market Leader
Unmatched Operating Platform
Clear market leading positions across all key product categories
Unmatched operating scale and distribution network: ~10x larger than nearest domestic HDPE competitor based on revenues
Fleet of approximately 625 tractor-trailers combined with our advanced, versatile and portable tooling equipment enables unmatched manufacturing capabilities Puerto Rico
Unrivaled technical expertise driven by our group of over 50 field based engineers
Manufacturing Plant
Long-standing relationships with our expansive Distribution Center network of distributors
Sole provider of holistic water management solutions to our industry
LEADERSHIP • GROWTH • MOMENTUM
THROUGH STRENGTH
8
|
|
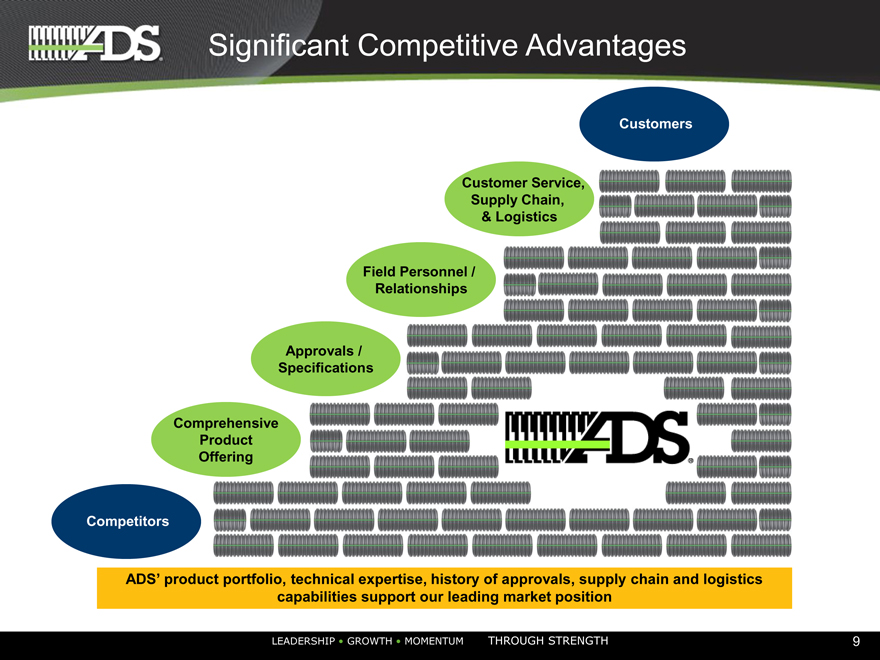
Significant Competitive Advantages
Customers
Customer Service,
Supply Chain,
& Logistics
Field Personnel /
Relationships
Approvals /
Specifications
Comprehensive
Product
Offering
Competitors
ADS’ product portfolio, technical expertise, history of approvals, supply chain and logistics capabilities support our leading market position
LEADERSHIP • GROWTH • MOMENTUM
THROUGH STRENGTH
9
|
|
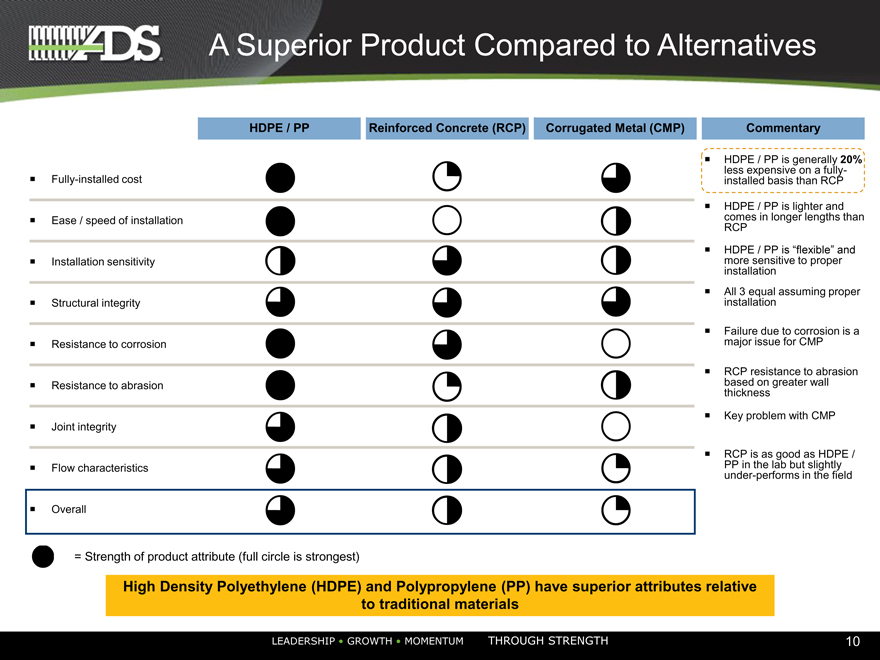
A Superior Product Compared to Alternatives
HDPE / PP
Reinforced Concrete (RCP)
Corrugated Metal (CMP)
Fully-installed cost
Ease / speed of installation
Installation sensitivity
Structural integrity
Resistance to corrosion
Resistance to abrasion
Joint integrity
Flow characteristics
Overall
= Strength of product attribute (full circle is strongest)
Commentary
HDPE / PP is generally 20% less expensive on a fully- installed basis than RCP
HDPE / PP is lighter and comes in longer lengths than RCP
HDPE / PP is “flexible” and more sensitive to proper installation
All 3 equal assuming proper installation
Failure due to corrosion is a major issue for CMP
RCP resistance to abrasion based on greater wall thickness
Key problem with CMP
RCP is as good as HDPE /PP
in the lab but slightly
under-performs in the field
High Density Polyethylene (HDPE) and Polypropylene (PP) have superior attributes relative to traditional materials
LEADERSHIP • GROWTH • MOMENTUM
THROUGH STRENGTH
10
|
|
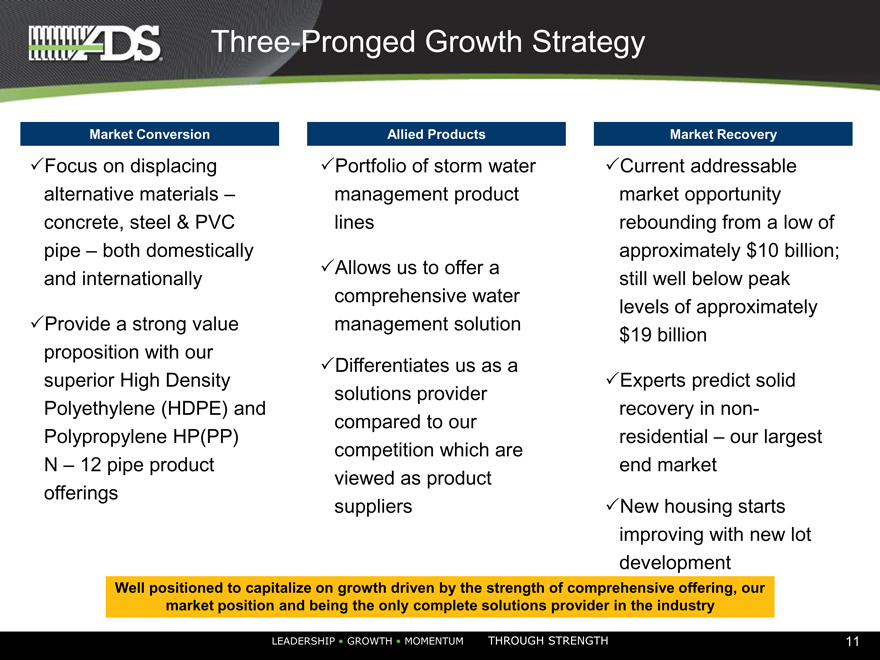
Three-Pronged Growth Strategy
Market Conversion
Focus on displacing alternative materials – concrete, steel & PVC pipe – both domestically and internationally
Provide a strong value proposition with our superior High Density Polyethylene (HDPE) and Polypropylene HP(PP) N – 12 pipe product
offerings
Allied Products
Portfolio of storm water management product lines
Allows us to offer a comprehensive water management solution
Differentiates us as a solutions provider compared to our competition which are viewed as product suppliers
Market Recovery
Current addressable market opportunity rebounding from a low of approximately $10 billion; still well below peak levels of approximately $19 billion
Experts predict solid recovery in non-residential – our largest
end market
New housing starts improving with new lot development
Well positioned to capitalize on growth driven by the strength of comprehensive offering, our market position and being the only complete solutions provider in the industry
LEADERSHIP • GROWTH • MOMENTUM
THROUGH STRENGTH
11
|
|
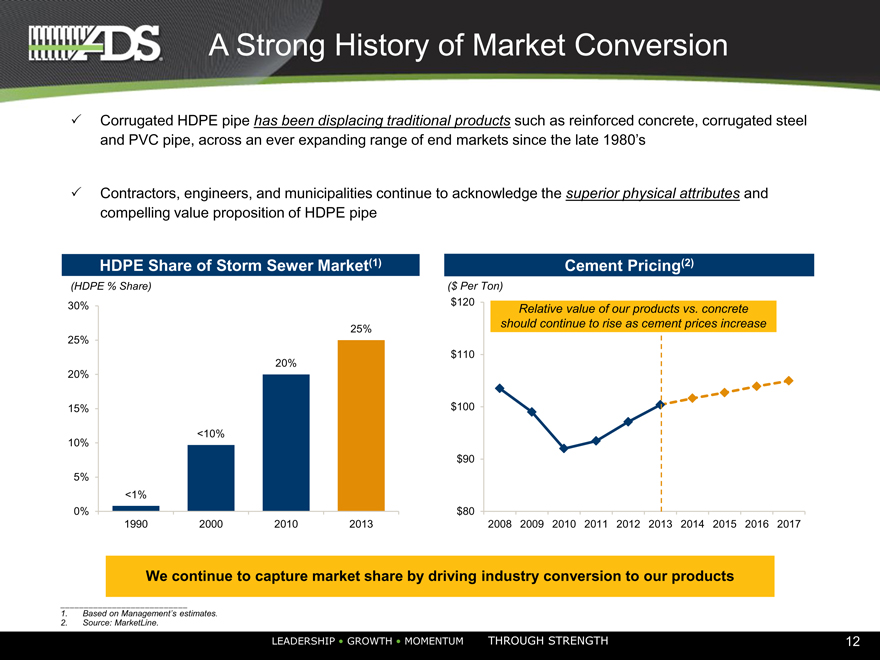
A Strong History of Market Conversion
Corrugated HDPE pipe has been displacing traditional products such as reinforced concrete, corrugated steel and PVC pipe, across an ever expanding range of end markets since the late 1980’s
Contractors, engineers, and municipalities continue to acknowledge the superior physical attributes and compelling value proposition of HDPE pipe
We continue to capture market share by driving industry conversion to our products
1. Based on Management’s estimates.
2. Source: MarketLine.
LEADERSHIP • GROWTH • MOMENTUM
HDPE share of strom sever market(1) Comment pricing(2)
THROUGH STRENGTH
12
|
|
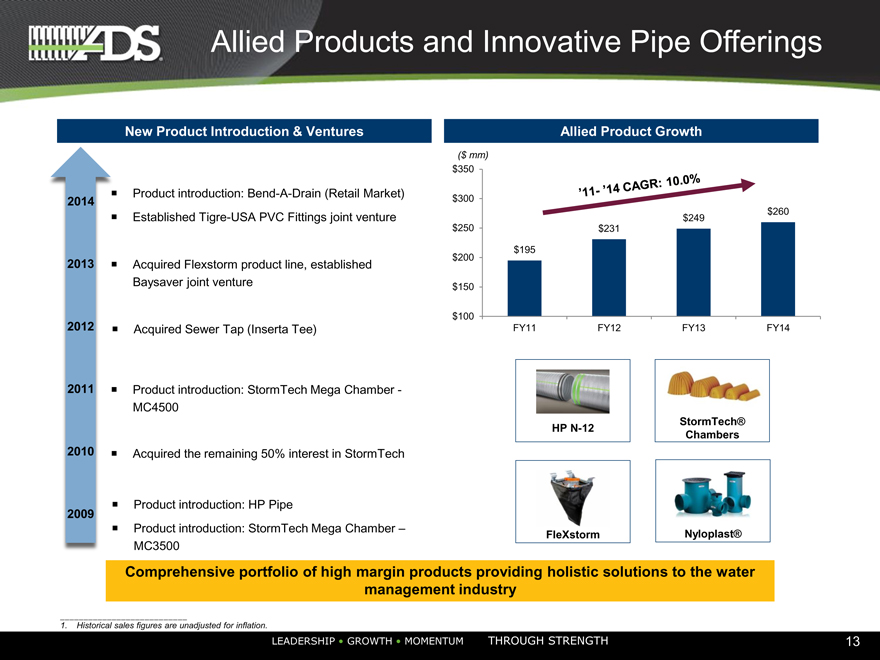
Allied Products and Innovative Pipe Offerings
New Product Introduction & Ventures
Product introduction: Bend-A-Drain (Retail Market)
2014
Established Tigre-USA PVC Fittings joint venture
2013 Acquired Flexstorm product line, established
Baysaver joint venture
2012 Acquired Sewer Tap (Inserta Tee)
2011 Product introduction: StormTech Mega Chamber -
MC4500
2010 Acquired the remaining 50% interest in StormTech
Product introduction: HP Pipe
2009
Product introduction: StormTech Mega Chamber –
MC3500
Allied Product Growth
($ mm)
$350
$300
$260
$249
$250 $231 ‘11 -’14 CAGR: 10.0%
$195
$200
$150
$100
FY11 FY12 FY13 FY14
HP N-12 StormTech®
Chambers
FleXstorm Nyloplast®
Comprehensive portfolio of high margin products providing holistic solutions to the water management industry
1. Historical sales figures are unadjusted for inflation.
LEADERSHIP • GROWTH • MOMENTUM
THROUGH STRENGTH
13
|
|
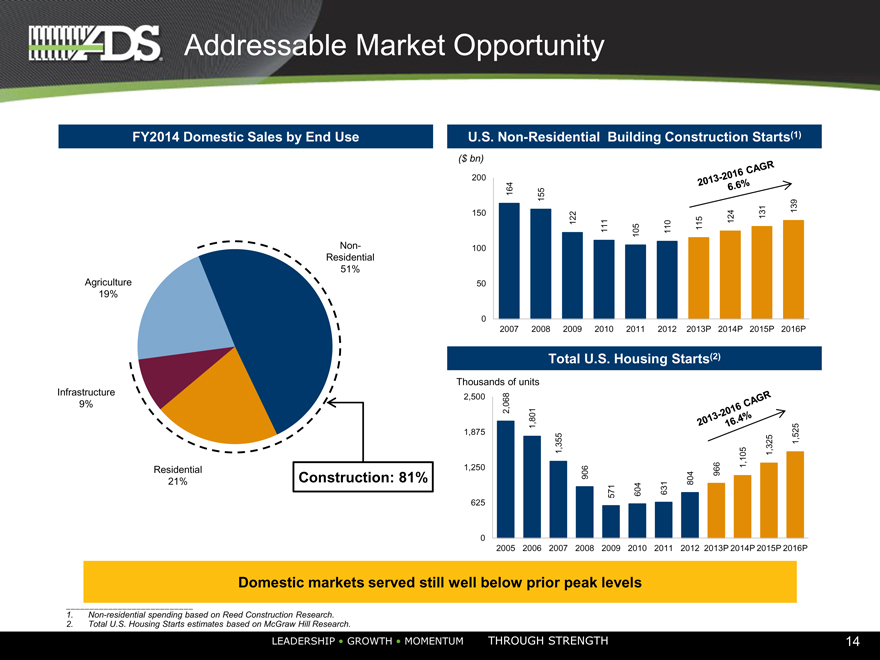
Addressable Market Opportunity
FY2014 Domestic Sales by End Use U.S. Non-Residential Building Construction Starts(1)
($ bn)
200
164 155
150 122 124 131 139
111 105 110 115
Non- 100
Residential
51%
Agriculture 50
19%
0
2007 2008 2009 2010 2011 2012 2013P 2014P 2015P 2016P
Total U.S. Housing Starts(2)
Thousands of units
Infrastructure 2,500
9% 2,068 1,801
1,875 1,525
1,355 1,325
Residential 1,250 966 1,105
21% Construction: 81% 906 804
571 604 631
625
0
2005 2006 2007 2008 2009 2010 2011 2012 2013P 2014P 2015P 2016P
Domestic markets served still well below prior peak levels
1. Non-residential spending based on Reed Construction Research.
2. Total U.S. Housing Starts estimates based on McGraw Hill Research.
LEADERSHIP • GROWTH • MOMENTUM
THROUGH STRENGTH
14
|
|
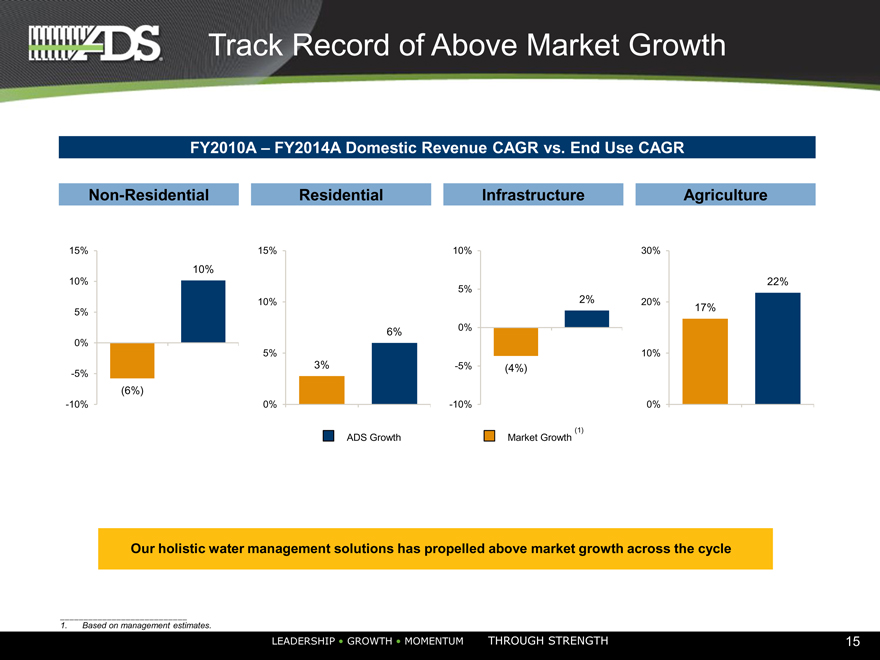
Track Record of Above Market Growth
FY2010A – FY2014A Domestic Revenue CAGR vs. End Use CAGR
Non-Residential Residential Infrastructure Agriculture
15% 15% 10% 30%
10%
10% 22%
5%
10% 2% 20%
5% 17%
6% 0%
0%
5% 10%
-5% 3% -5%(4%)
(6%)
-10% 0% -10% 0%
ADS Growth Market Growth (1)
Our holistic water management solutions has propelled above market growth across the cycle
1. Based on management estimates.
LEADERSHIP • GROWTH • MOMENTUM THROUGH STRENGTH 15
|
|
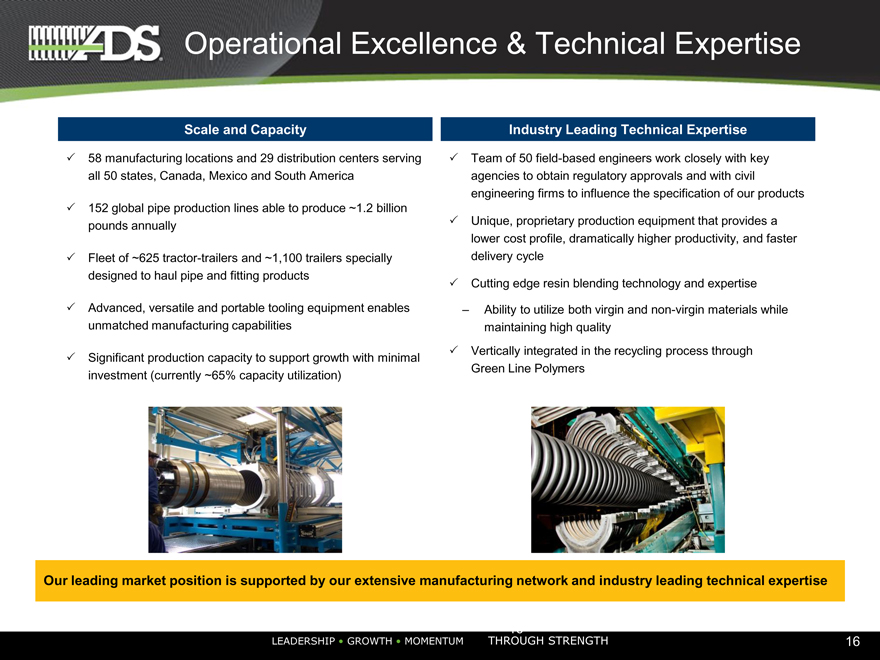
Operational Excellence & Technical Expertise
Scale and Capacity
58 manufacturing locations and 29 distribution centers serving all 50 states, Canada, Mexico and South America
152 global pipe production lines able to produce ~1.2 billion pounds annually
Fleet of ~625 tractor-trailers and ~1,100 trailers specially designed to haul pipe and fitting products
Advanced, versatile and portable tooling equipment enables unmatched manufacturing capabilities
Significant production capacity to support growth with minimal investment (currently ~65% capacity utilization)
Industry Leading Technical Expertise
Team of 50 field-based engineers work closely with key agencies to obtain regulatory approvals and with civil engineering firms to influence the specification of our products
Unique, proprietary production equipment that provides a lower cost profile, dramatically higher productivity, and faster delivery cycle
Cutting edge resin blending technology and expertise
Ability to utilize both virgin and non-virgin materials while maintaining high quality
Vertically integrated in the recycling process through Green Line Polymers
Our leading market position is supported by our extensive manufacturing network and industry leading technical expertise
16
LEADERSHIP • GROWTH • MOMENTUM THROUGH STRENGTH 16
|
|
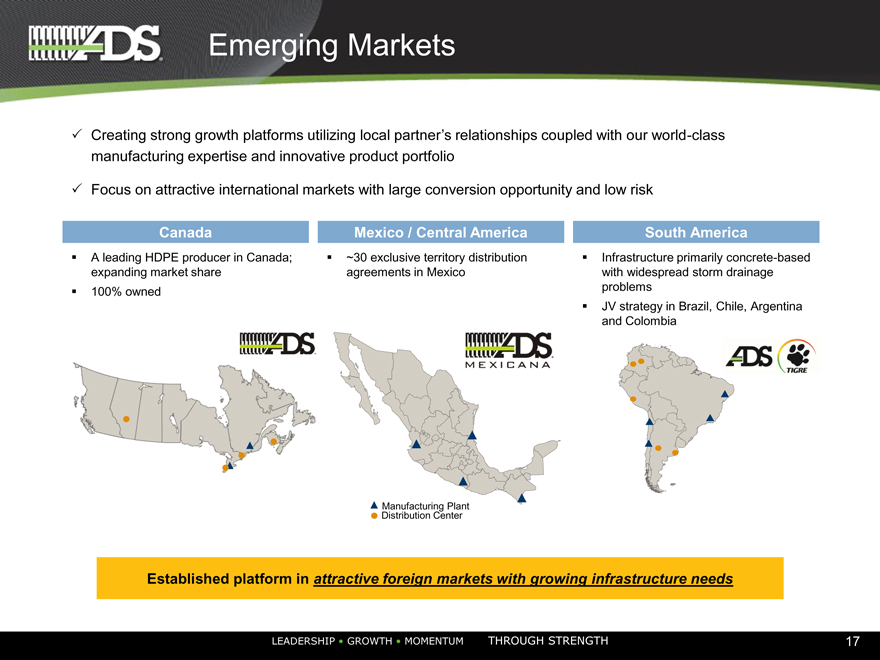
Emerging Markets
Creating strong growth platforms utilizing local partner’s relationships coupled with our world-class manufacturing expertise and innovative product portfolio
Focus on attractive international markets with large conversion opportunity and low risk
Canada
Mexico / Central America
South America
A leading HDPE producer in Canada; expanding market share
100% owned
~30 exclusive territory distribution agreements in Mexico
Infrastructure primarily concrete-based with widespread storm drainage problems
JV strategy in Brazil, Chile, Argentina and Colombia
Manufacturing Plant
Distribution Center
Established platform in attractive foreign markets with growing infrastructure needs
LEADERSHIP • GROWTH • MOMENTUM
THROUGH STRENGTH
17
|
|
Financial Overview
LEADERSHIP • GROWTH • MOMENTUM
THROUGH STRENGTH
|
|
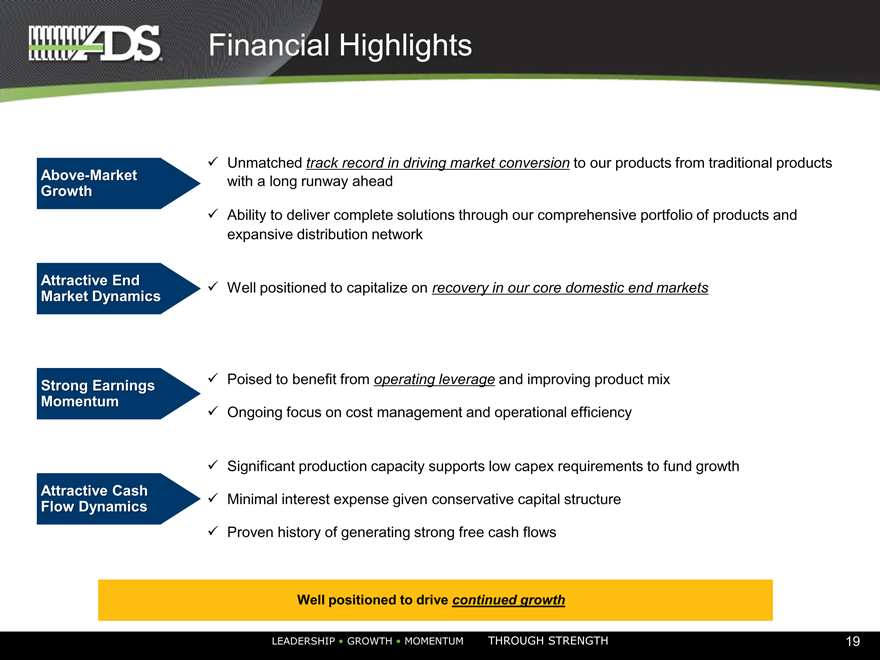
Financial Highlights
Above-Market Growth
Attractive End Market Dynamics
Strong Earnings Momentum
Attractive Cash Flow Dynamics
Unmatched track record in driving market conversion to our products from traditional products with a long runway ahead
Ability to deliver complete solutions through our comprehensive portfolio of products and expansive distribution network
Well positioned to capitalize on recovery in our core domestic end markets
Poised to benefit from operating leverage and improving product mix
Ongoing focus on cost management and operational efficiency
Significant production capacity supports low capex requirements to fund growth
Minimal interest expense given conservative capital structure
Proven history of generating strong free cash flows
Well positioned to drive continued growth
LEADERSHIP • GROWTH • MOMENTUM
THROUGH STRENGTH
19
|
|
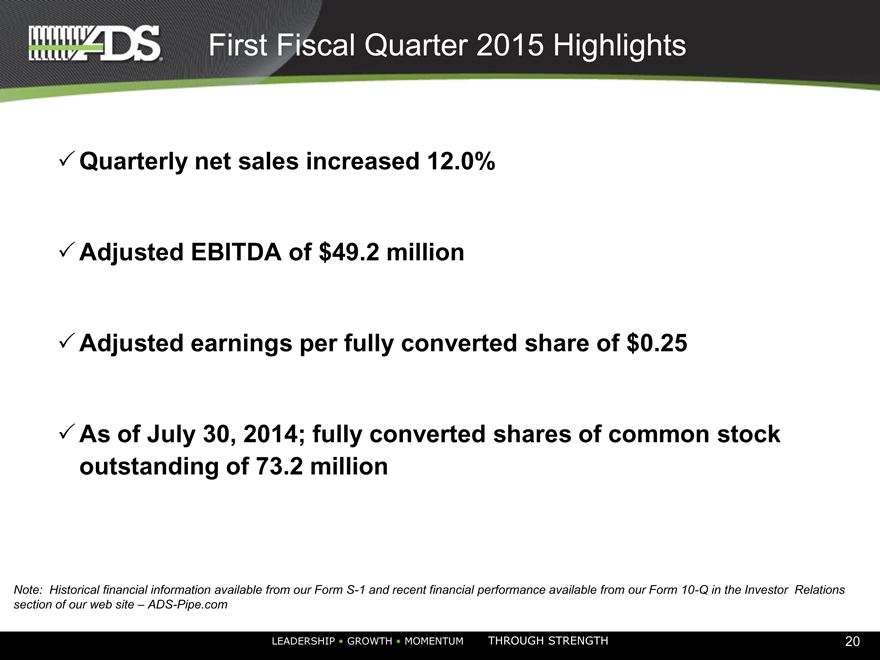
First Fiscal Quarter 2015 Highlights
Quarterly net sales increased 12.0%
Adjusted EBITDA of $49.2 million
Adjusted earnings per fully converted share of $0.25
As of July 30, 2014; fully converted shares of common stock outstanding of 73.2 million
Note: Historical financial information available from our Form S-1 and recent financial performance available from our Form 10-Q in the Investor Relations
section of our web site – ADS-Pipe.com
LEADERSHIP • GROWTH • MOMENTUM THROUGH STRENGTH 20
|
|
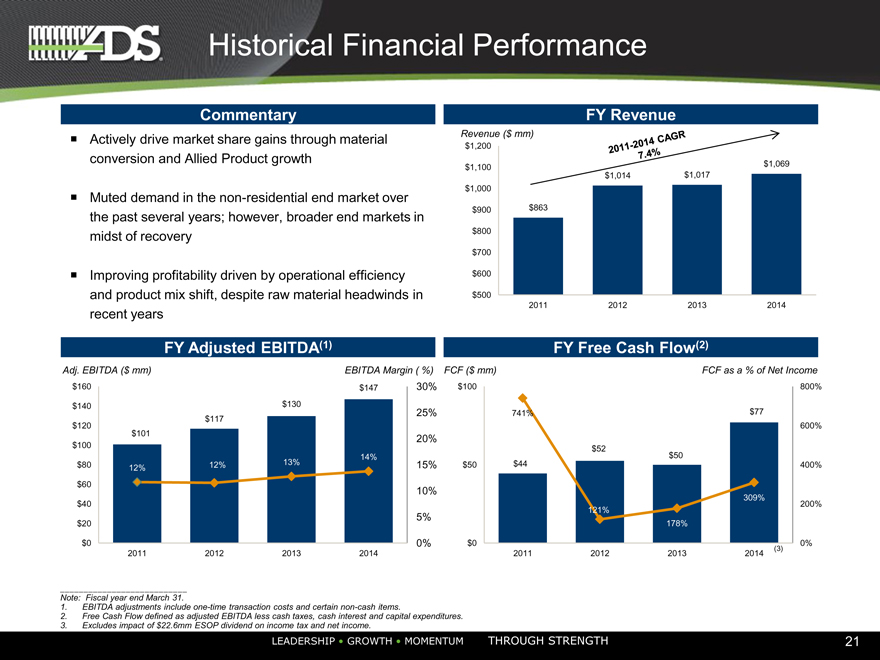
Historical Financial Performance
Commentary
Actively drive market share gains through material conversion and Allied Product growth
Muted demand in the non-residential end market over the past several years; however, broader end markets in midst of recovery
Improving profitability driven by operational efficiency and product mix shift, despite raw material headwinds in recent years
FY Revenue
Revenue ($ mm)
$1,200
$1,100 $1,069
$1,014 $1,017
$1,000
$900 $863
$800
$700
$600
$500
2011 2012 2013 2014
FY Adjusted EBITDA(1)
FY Free Cash Flow(2)
Adj. EBITDA ($ mm) EBITDA Margin ( %) FCF ($ mm) FCF as a % of Net Income
$160 $147 30% $100 800%
$140 $130
25% 741% $77
$117
$120 600%
$101 20%
$100 $52
14% $50
$80 12% 12% 13% 15% $50 $44 400%
$60
10%
309%
$40 200%
121%
5%
$20 178%
$0 0% $0 0%
(3)
2011 2012 2013 2014 2011 2012 2013 2014
Note: Fiscal year end March 31.
1. EBITDA adjustments include one-time transaction costs and certain non-cash items.
2. Free Cash Flow defined as adjusted EBITDA less cash taxes, cash interest and capital expenditures.
3. Excludes impact of $22.6mm ESOP dividend on income tax and net income.
LEADERSHIP • GROWTH • MOMENTUM
THROUGH STRENGTH
21
|
|
Appendix
LEADERSHIP • GROWTH • MOMENTUM
THROUGH STRENGTH
|
|
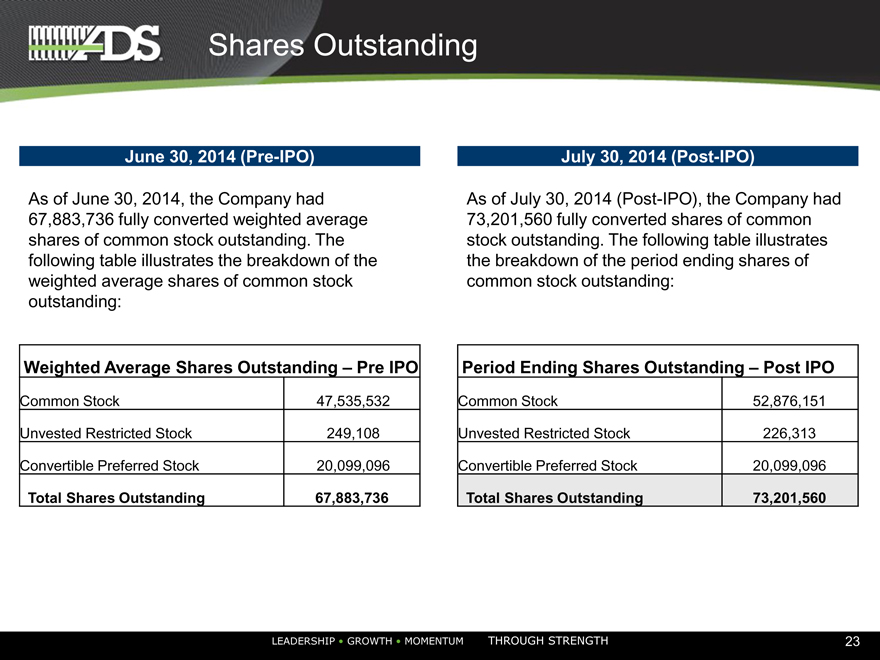
Shares Outstanding
June 30, 2014 (Pre-IPO)
As of June 30, 2014, the Company had 67,883,736 fully converted weighted average shares of common stock outstanding. The following table illustrates the breakdown of the weighted average shares of common stock outstanding:
Weighted Average Shares Outstanding – Pre IPO
Common Stock 47,535,532
Unvested Restricted Stock 249,108
Convertible Preferred Stock 20,099,096
Total Shares Outstanding 67,883,736
July 30, 2014 (Post-IPO)
As of July 30, 2014 (Post-IPO), the Company had 73,201,560 fully converted shares of common stock outstanding. The following table illustrates the breakdown of the period ending shares of common stock outstanding:
Period Ending Shares Outstanding – Post IPO
Common Stock 52,876,151
Unvested Restricted Stock 226,313
Convertible Preferred Stock 20,099,096
Total Shares Outstanding 73,201,560
LEADERSHIP • GROWTH • MOMENTUM
THROUGH STRENGTH
23
|
|
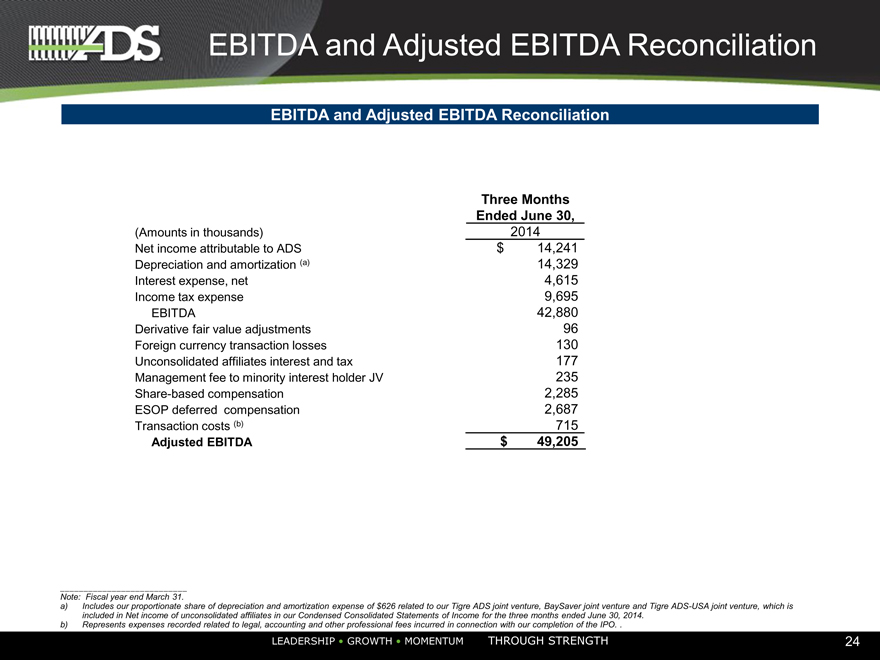
EBITDA and Adjusted EBITDA Reconciliation
EBITDA and Adjusted EBITDA Reconciliation
Three Months
Ended June 30,
(Amounts in thousands) 2014
Net income attributable to ADS $ 14,241
Depreciation and amortization (a) 14,329
Interest expense, net 4,615
Income tax expense 9,695
EBITDA 42,880
Derivative fair value adjustments 96
Foreign currency transaction losses 130
Unconsolidated affiliates interest and tax 177
Management fee to minority interest holder JV 235
Share-based compensation 2,285
ESOP deferred compensation 2,687
Transaction costs (b) 715
Adjusted EBITDA $ 49,205
Note: Fiscal year end March 31.
a) Includes our proportionate share of depreciation and amortization expense of $626 related to our Tigre ADS joint venture, BaySaver joint venture and Tigre ADS-USA joint venture, which is included in Net income of unconsolidated affiliates in our Condensed Consolidated Statements of Income for the three months ended June 30, 2014.
b) Represents expenses recorded related to legal, accounting and other professional fees incurred in connection with our completion of the IPO. .
LEADERSHIP • GROWTH • MOMENTUM
THROUGH STRENGTH
24
|
|
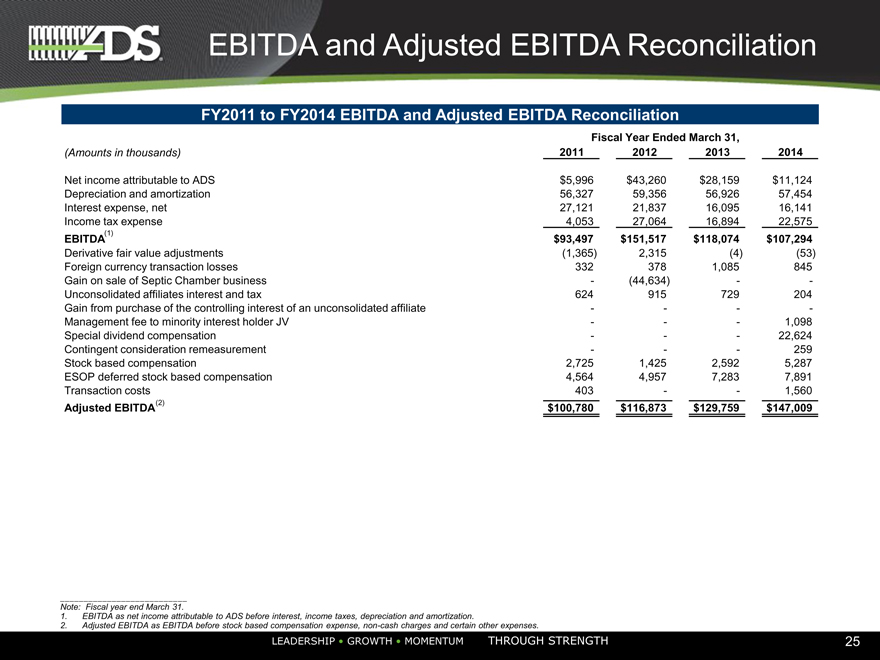
EBITDA and Adjusted EBITDA Reconciliation
FY2011 to FY2014 EBITDA and Adjusted EBITDA Reconciliation
Fiscal Year Ended March 31,
(Amounts in thousands) 2011 2012 2013 2014
Net income attributable to ADS $5,996 $43,260 $28,159 $11,124
Depreciation and amortization 56,327 59,356 56,926 57,454
Interest expense, net 27,121 21,837 16,095 16,141
Income tax expense 4,053 27,064 16,894 22,575
EBITDA(1) $93,497 $151,517 $118,074 $107,294
Derivative fair value adjustments(1,365) 2,315(4)(53)
Foreign currency transaction losses 332 378 1,085 845
Gain on sale of Septic Chamber business -(44,634) —
Unconsolidated affiliates interest and tax 624 915 729 204
Gain from purchase of the controlling interest of an unconsolidated affiliate — —
Management fee to minority interest holder JV ——1,098
Special dividend compensation ——22,624
Contingent consideration remeasurement ——259
Stock based compensation 2,725 1,425 2,592 5,287
ESOP deferred stock based compensation 4,564 4,957 7,283 7,891
Transaction costs 403 — 1,560
Adjusted EBITDA(2) $100,780 $116,873 $129,759 $147,009
Note: Fiscal year end March 31.
1.EBITDA as net income attributable to ADS before interest, income taxes, depreciation and amortization.
2. Adjusted EBITDA as EBITDA before stock based compensation expense, non-cash charges and certain other expenses.
LEADERSHIP • GROWTH • MOMENTUM
THROUGH STRENGTH
25
|
|
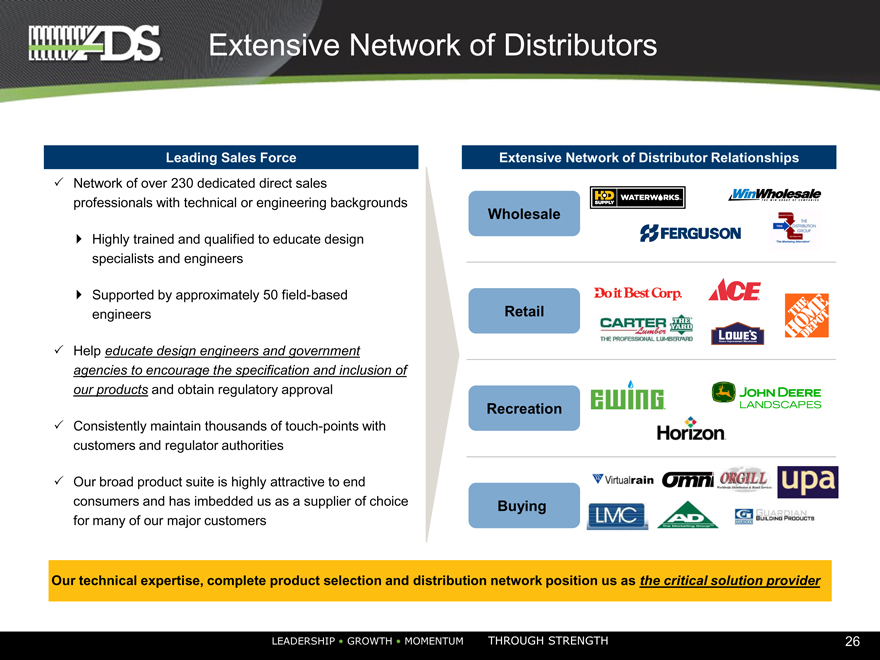
Extensive Network of Distributors
Leading Sales Force
Network of over 230 dedicated direct sales professionals with technical or engineering backgrounds
Highly trained and qualified to educate design specialists and engineers
Supported by approximately 50 field-based engineers
Help educate design engineers and government agencies to encourage the specification and inclusion of our products and obtain regulatory approval
Consistently maintain thousands of touch-points with customers and regulator authorities
Our broad product suite is highly attractive to end consumers and has imbedded us as a supplier of choice for many of our major customers
Extensive Network of Distributor Relationships
[Graphic Appears Here]
Our technical expertise, complete product selection and distribution network position us as the critical solution provider
RSHIP • GROWTH • MOMENTUM THROUGH STRENGTH 26