Attached files
| file | filename |
|---|---|
| EX-99.1 - BARCLAYS PRESENTATION - STONEGATE MORTGAGE CORP | barclaysconferencepresentati.pdf |
| 8-K - 8-K - STONEGATE MORTGAGE CORP | a8-krebarclaysconference09.htm |

Barclays Global Financial Services Conference September 8, 2014

Forward Looking Statements Various statements used in this presentation, including those that express a belief, expectation or intention, as well as those that are not statements of historical fact, are forward-looking statements. These forward-looking statements may include projections and estimates concerning the timing and success of specific projects and our future production, revenues, income and capital spending. Our forward- looking statements are generally accompanied by words such as "estimate," "project," "predict," "believe," "expect," "intend," "anticipate," "potential," "plan," "goal" or other words that convey the uncertainty of future events or outcomes. The forward- looking statements in this presentation speak only as of the date of this earnings release; we disclaim any obligation to update these statements unless required by law, and we caution you not to rely on them unduly. We have based these forward-looking statements on our current expectations and assumptions about future events. While we consider these expectations and assumptions to be reasonable, they are inherently subject to significant business, economic, competitive, regulatory and other risks, contingencies and uncertainties, most of which are difficult to predict and many of which are beyond our control. These and other important factors, including those discussed in the "Risk Factors" section within our 2013 Annual Report on Form 10-K filed on March 14, 2014, may cause our actual results, performance or achievements to differ materially from any future results, performance or achievements expressed or implied by these forward-looking statements.. 2

SCALABILITYLIQUIDITYACCESS Stonegate Highlights 3 ServicingOrigination Financing (NattyMac) Stonegate Mortgage (NYSE:SGM) is an integrated, non-bank mortgage company focused on originating, financing and servicing U.S. residential mortgage loans (1) As of July 31, 2014. Retail (distributed and direct-to-consumer) Third Party Origination (2000+ clients) Agency and non-agency Warehouse lending Syndicated Finance • Repo • Participations Prime Fannie/Freddie and GNMA “Capital-light”

Return cash purchases to normalized level through product innovation Economic/jobs recovery continues to improve the housing market Pent-up demand of first-time home buyers reentering the market Industry Dynamics Creates Opportunity for SGM Rising home values builds equity and creates ability to move 4 Emerging market (non-agency jumbo origination market share increasing) (1) (1) Source: Inside Mortgage Finance. Banks deconsolidating due to changes in capital requirements

Integrated Business Model Characteristics 5 ServicingOrigination Financing Leverage 20:1 15:1 2:1 Valuation Method PEG PEG FMV Return Potential (ROE) 20%+ 20%+ 8-10% Risk High Moderate Moderate Tax Impact OMSRs generate NOLs Spread and fee income generate taxable income Fees generate taxable income Key Differentiators No bulk/flow purchases Non-agency Multi-channel creates diversification Integrated with origination business to grow wallet share Non-agency High-quality, SGM- originated portfolio Each of our businesses has different risk and return characteristics; we are therefore tasked with finding the optimal use of our capital • Origination offers the most attractive risk and return characteristics of the three businesses (particularly true for non-agency origination)

Unlock the remaining market through licensing and mature in the new markets consistent with prior experience Geographic Expansion and Maturation Non-agency Provide innovative products that meet borrowers’ demands and investors return threshold Ability to distribute through Retail and TPO Structure to give investors access to asset class Warehouse Financing Opportunities to Grow Business “Capital-Light” MSR Financing Monetizing the MSR cash flow stream opens up additional origination capabilities Reduces required equity to hold MSRs Lower cost of capital than alternative vehicle (i.e. a REIT) Providing access to efficient sources of capital strengthens relationships with small to mid-size correspondents and results in additional origination volume Increases fee income opportunities 6

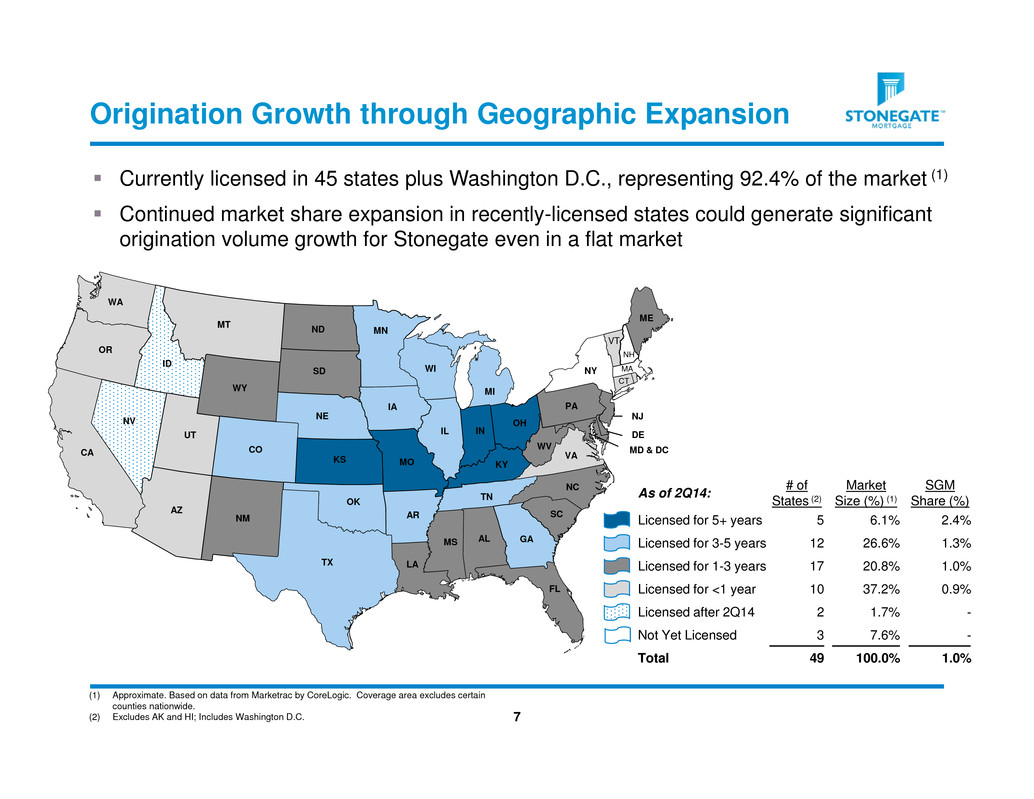
Origination Growth through Geographic Expansion 7 Currently licensed in 45 states plus Washington D.C., representing 92.4% of the market (1) Continued market share expansion in recently-licensed states could generate significant origination volume growth for Stonegate even in a flat market SC NC GA OH IN KY TN IL TX MO AR OK KS NE CO IA WI MI NJ WV VA MD & DC MN DE PA ND WY SD NY LA MS AL FL ME CT VT MA CA OR ID UT NM MT WA NV AZ NH As of 2Q14: # of States (2) Market Size (%) (1) SGM Share (%) Licensed for 5+ years 5 6.1% 2.4% Licensed for 3-5 years 12 26.6% 1.3% Licensed for 1-3 years 17 20.8% 1.0% Licensed for <1 year 10 37.2% 0.9% Licensed after 2Q14 2 1.7% - Not Yet Licensed 3 7.6% - Total 49 100.0% 1.0% (1) Approximate. Based on data from Marketrac by CoreLogic. Coverage area excludes certain counties nationwide. (2) Excludes AK and HI; Includes Washington D.C.

2 7 12 20 27 30 39 54 64 79 87 89 92 1 1 3 6 11 19 24 28 37 44 50 59 0 10 20 30 40 50 60 70 80 90 100 Number of NattyMac customers and commitments continuing to grow • Current commitments (1) total $364 million to 97 approved accounts (or 12% of total approved correspondent accounts) Multiple participants providing wholesale funding As of June 30, 2014, NattyMac clients’ locks increased 74% on average three months after receiving a warehouse line compared to the three months’ average prior NattyMac Increases “Wallet Share” NattyMac Customers 8 (1) As of July 31, 2014. (2) Funded at least one loan through on a NattyMac warehouse line in the last 90 days. Approved Accounts Active Accounts (2) $921 $1,088 $1,167 $1,203 $1,443 $1,488 $1,602 $500 $800 $1,100 $1,400 $1,700 Approval Month -3 Approval Month -2 Approval Month -1 Approval Month Approval Month +1 Approval Month +2 Approval Month +3 Locks per Month

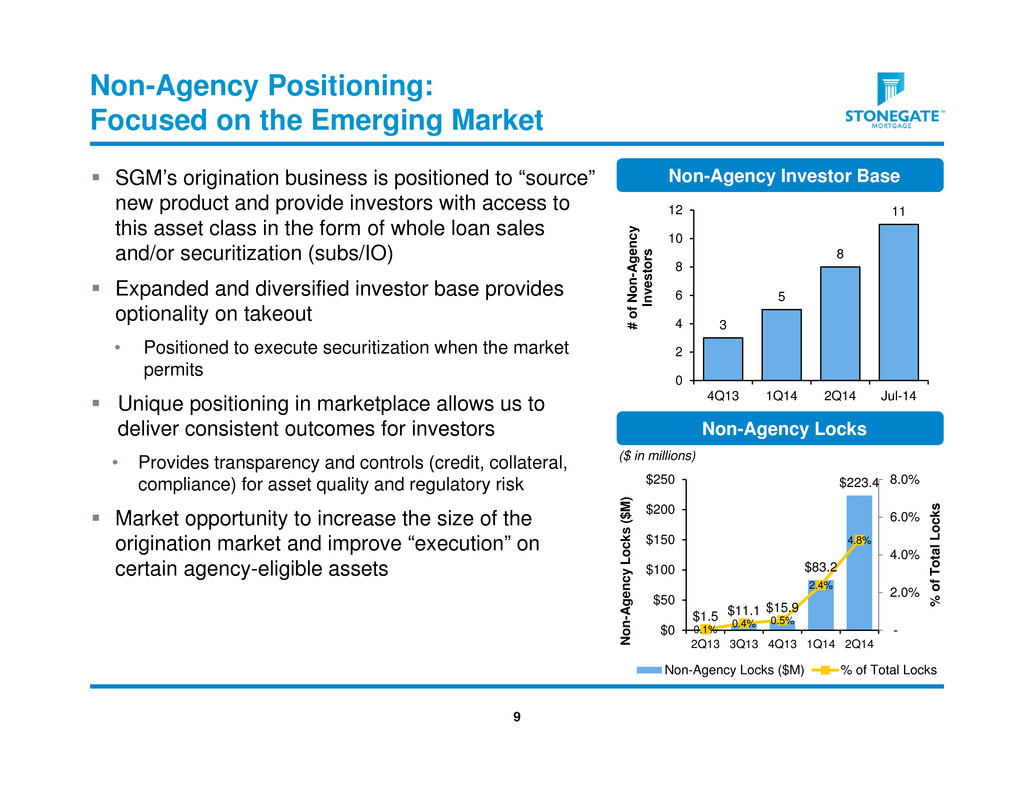
Non-Agency Positioning: Focused on the Emerging Market SGM’s origination business is positioned to “source” new product and provide investors with access to this asset class in the form of whole loan sales and/or securitization (subs/IO) Expanded and diversified investor base provides optionality on takeout • Positioned to execute securitization when the market permits Unique positioning in marketplace allows us to deliver consistent outcomes for investors • Provides transparency and controls (credit, collateral, compliance) for asset quality and regulatory risk Market opportunity to increase the size of the origination market and improve “execution” on certain agency-eligible assets 9 Non-Agency Investor Base 3 5 8 11 0 2 4 6 8 10 12 4Q13 1Q14 2Q14 Jul-14 # o f N o n - A g e n c y I n v e s t o r s Non-Agency Locks ($ in millions) $1.5 $11.1 $15.9 $83.2 $223.4 0.1% 0.4% 0.5% 2.4% 4.8% - 2.0% 4.0% 6.0% 8.0% $0 $50 $100 $150 $200 $250 2Q13 3Q13 4Q13 1Q14 2Q14 % o f T o t a l L o c k s N o n - A g e n c y L o c k s ( $ M ) Non-Agency Locks ($M) % of Total Locks

(1) On May 22, 2014, Stonegate executed a Loan and Security Agreement with Barclays that allows Stonegate to borrow up to $100 million against its Fannie Mae and Freddie Mac Mortgage Servicing Rights (“MSRs”). Structured as a sub-limit to Stonegate’s existing $300 million Master Repurchase Agreement with Barclays. Barclays will lend up to 60% of an estimate of the valuation of the MSRs at any one time. Current facilities provide attractive terms for interim financing • FNMA/FHLMC – L+525 with 50% advance rate against FMV of the MSR (1) • GNMA – L+450 with 50% advance rate against FMV of the MSR (2) Currently structuring a longer-term financing solution that will allow us to: • Monetize MSR cash flow to reinvest back into more attractive origination and financing businesses • Maintain relationships with borrowers to retain recapture potential and escrow balances MSR Financing Creates “Capital-Light” Servicing Financing & Origination NCO of 100 bps or less does not require equity to be tied up in the MSR MSR: Strategic Buyer REITs Hedge funds Insurance companies Banks Gross Strip + Ancillary Fees + Escrows - Cost to Service = Net Servicing Strip Generates Average life of cash flow is approximately 7 to 10 years Strategic Buyer Pays SGM 100 bps (3) Stonegate retains servicing rights Recapture potential Escrow balances 10 (2) On August 29, 2014, Stonegate executed a three-year agreement to borrow against its Ginnie Mae MSRs at LIBOR + 450 with no pre-payment penalty and a 50% advance rate against the fair market value of the MSR. (3) For illustrative purposes only; there is no assurance that the estimated 5x multiple will be achieved.

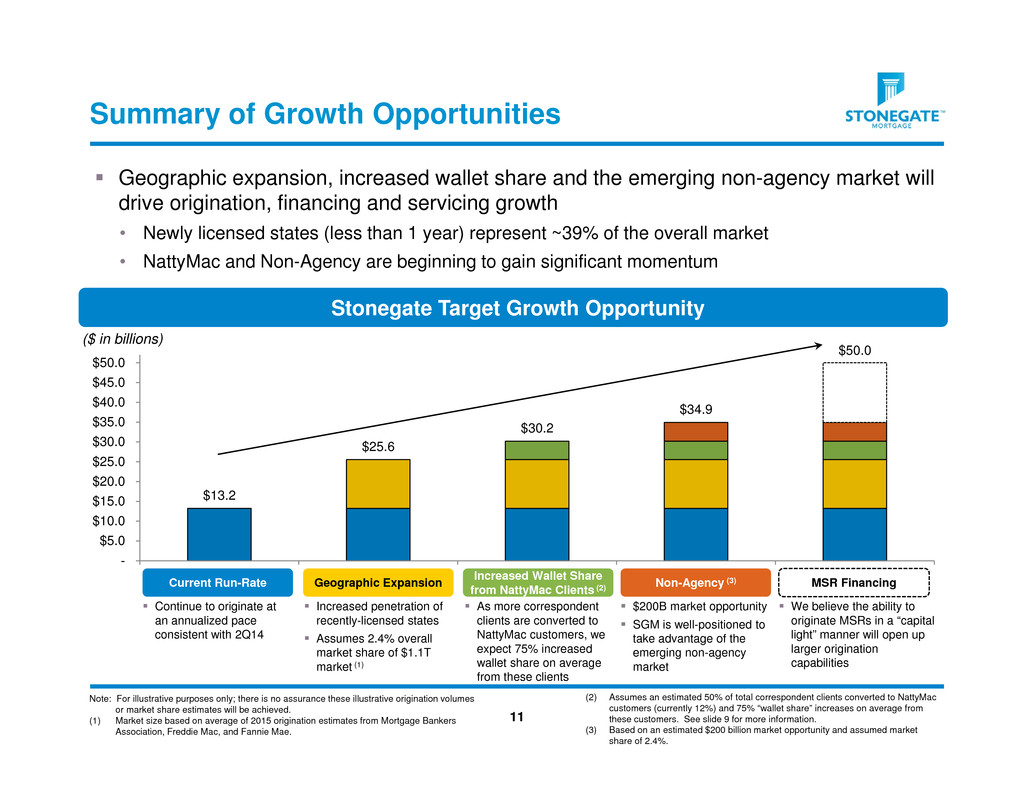
$13.2 $25.6 $30.2 $34.9 $50.0 - $5.0 $10.0 $15.0 $20.0 $25.0 $30.0 $35.0 $40.0 $45.0 $50.0 Summary of Growth Opportunities 11 Note: For illustrative purposes only; there is no assurance these illustrative origination volumes or market share estimates will be achieved. (1) Market size based on average of 2015 origination estimates from Mortgage Bankers Association, Freddie Mac, and Fannie Mae. Stonegate Target Growth Opportunity Current Run-Rate Non-Agency (3)Increased Wallet Share from NattyMac Clients (2) Continue to originate at an annualized pace consistent with 2Q14 $200B market opportunity SGM is well-positioned to take advantage of the emerging non-agency market As more correspondent clients are converted to NattyMac customers, we expect 75% increased wallet share on average from these clients ($ in billions) (2) Assumes an estimated 50% of total correspondent clients converted to NattyMac customers (currently 12%) and 75% “wallet share” increases on average from these customers. See slide 9 for more information. (3) Based on an estimated $200 billion market opportunity and assumed market share of 2.4%. Geographic expansion, increased wallet share and the emerging non-agency market will drive origination, financing and servicing growth • Newly licensed states (less than 1 year) represent ~39% of the overall market • NattyMac and Non-Agency are beginning to gain significant momentum Geographic Expansion Increased penetration of recently-licensed states Assumes 2.4% overall market share of $1.1T market (1) MSR Financing We believe the ability to originate MSRs in a “capital light” manner will open up larger origination capabilities
