Attached files
| file | filename |
|---|---|
| EX-32 - EXHIBIT 32 - EMULEX CORP /DE/ | elx062914ex32.htm |
| EX-31.1B - EXHIBIT 31.1B - EMULEX CORP /DE/ | elx062914ex311b.htm |
| EX-31.1 A - EXHIBIT 31.1A - EMULEX CORP /DE/ | elx062914ex311a.htm |
| EX-21 - EXHIBIT 21 - EMULEX CORP /DE/ | elx062914ex21.htm |
| EX-12 - EXHIBIT 12 - EMULEX CORP /DE/ | elx062914ex12.htm |
| EX-23 - EXHIBIT 23 - EMULEX CORP /DE/ | elx062924ex23.htm |
| EXCEL - IDEA: XBRL DOCUMENT - EMULEX CORP /DE/ | Financial_Report.xls |
UNITED STATES SECURITIES AND EXCHANGE COMMISSION
Washington, D.C. 20549
Form 10-K
(Mark One)
þ | ANNUAL REPORT PURSUANT TO SECTION 13 OR 15(d) OF THE SECURITIES EXCHANGE ACT OF 1934 For the fiscal year ended June 29, 2014 |
Or
¨ | TRANSITION REPORT PURSUANT TO SECTION 13 OR 15(d) OF THE SECURITIES EXCHANGE ACT OF 1934 For the transition period from to |
Commission File No. 001-31353
EMULEX CORPORATION
(Exact name of registrant as specified in its charter)
Delaware | 51-0300558 | |
(State or other jurisdiction of incorporation or organization) | (I.R.S. Employer Identification No.) | |
3333 Susan Street Costa Mesa, California | 92626 | |
(Address of principal executive offices) | (Zip Code) | |
(714) 662-5600
(Registrant’s telephone number, including area code)
Securities registered pursuant to Section 12(b) of the Act:
Title of Each Class | Name of Each Exchange on Which Registered | |
Common Stock, Par Value $0.10 Per Share Preferred Stock Purchase Rights | New York Stock Exchange New York Stock Exchange | |
Securities registered pursuant to Section 12(g) of the Act:
NONE
Indicate by check mark if the registrant is a well-known seasoned issuer, as defined in Rule 405 of the Securities Act. Yes þ No ¨
Indicate by check mark if the registrant is not required to file reports pursuant to Section 13 or 15(d) of the Act. Yes ¨ No þ
Indicate by check mark whether the registrant (1) has filed all reports required to be filed by Section 13 or 15(d) of the Securities Exchange Act of 1934 during the preceding 12 months (or for such shorter period that the registrant was required to file such reports), and (2) has been subject to such filing requirements for the past 90 days. Yes þ No ¨
Indicate by check mark if disclosure of delinquent filers pursuant to Item 405 of Regulation S-K is not contained herein, and will not be contained, to the best of the registrant’s knowledge, in the definitive proxy or information statements incorporated by reference in Part III of this Form 10-K or any amendment to this Form 10-K. þ
Indicate by check mark whether the registrant has submitted electronically and posted on its corporate Web site, if any, every Interactive Data File required to be submitted and posted pursuant to Rule 405 of Regulation S-T (§ 232.405 of this chapter) during the preceding 12 months (or for such shorter period that the registrant was required to submit and post such files). Yes þ No ¨
Indicate by check mark whether the registrant is a large accelerated filer, an accelerated filer, a non-accelerated filer, or a smaller reporting company. See the definitions of “large accelerated filer,” “accelerated filer” and “smaller reporting company” in Rule 12b-2 of the Exchange Act. (Check one):
Large accelerated filer x | Accelerated filer o | Non-accelerated filer o | Smaller reporting company o | |||
(Do not check if a smaller reporting company) | ||||||
Indicate by check mark whether the registrant is a shell company (as defined in Rule 12b-2 of the Act). Yes ¨ No þ
The aggregate market value of the voting stock held by non-affiliates of the registrant, based on the closing price of the registrant’s common stock on the New York Stock Exchange on December 27, 2013, which was the last trading day of the second quarter of fiscal 2014, of $6.95 was $552,138,677.
As of August 20, 2014, the registrant had 70,963,390 shares of common stock outstanding.
DOCUMENTS INCORPORATED BY REFERENCE
Portions of the registrant’s definitive proxy statement relating to the registrant’s 2014 Annual Meeting of Stockholders to be filed pursuant to Regulation 14A within 120 days after the Registrant's fiscal year end of June 29, 2014, are incorporated by reference into Part III of this Annual Report on Form 10-K.
2
CAUTIONARY STATEMENT RELATED TO FORWARD LOOKING STATEMENTS
Certain statements contained in this Form 10-K may constitute “forward-looking statements” within the meaning of the Private Securities Litigation Reform Act of 1995. We may also make forward-looking statements in other reports filed with the Securities and Exchange Commission, in materials delivered to stockholders and in press releases. In addition, our representatives may from time to time make oral forward-looking statements. Forward-looking statements provide current expectations of future events based on certain assumptions and include any statement that does not directly relate to any historical or current fact. Words such as “anticipates,” “in the opinion,” “believes,” “intends,” “expects,” “may,” “will,” “should,” “could,” “plans,” “forecasts,” “estimates,” “predicts,” “projects,” “potential,” “continue,” and similar expressions may be intended to identify forward-looking statements.
Actual future results could differ materially from those described in the forward-looking statements as a result of a variety of factors, including those discussed in the section entitled “Risk Factors” in Part I, Item 1A, “Legal Proceedings” in Part I, Item 3, and “Management’s Discussion and Analysis of Financial Condition and Results of Operations” in Part II, Item 7 of this Annual Report on Form 10-K included elsewhere herein. We expressly disclaim any obligation or undertaking to release publicly any updates or changes to these forward-looking statements that may be made to reflect any future events or circumstances. We wish to caution readers that a number of important factors could cause actual results to differ materially from those in the forward-looking statements. These factors include the possibility that our previously announced cost savings initiatives will not be realized on a timely basis. The assumptions on which the cost savings and related capital return goals and expectations are based involve judgments with respect to, among other things, economic, competitive and financial market conditions and the impact of the cost savings initiative on our customers, all of which are difficult or impossible to predict and many of which are beyond the Company’s control. These factors also include the possibility that we may not realize the anticipated benefits from the acquisition of Endace Limited (Endace) on a timely basis or at all, and may be unable to integrate the technology, operations and personnel of Endace into our existing operations in a timely and efficient manner. In addition, intellectual property claims, with or without merit, could result in costly litigation, cause product shipment delays, require us to indemnify customers, or require us to enter into royalty or licensing agreements, which may or may not be available. Furthermore, we have in the past obtained, and may be required in the future to obtain, licenses of technology owned by other parties. We cannot be certain that the necessary licenses will be available or that they will be obtainable on commercially reasonable terms. If we were to fail to obtain such royalty or licensing agreements in a timely manner and on reasonable terms, our business, results of operations and financial condition could be materially adversely affected. Lawsuits present inherent risks, any of which could have a material adverse effect on our business, financial condition, or results of operations. Such potential risks include continuing expenses of litigation, loss of patent rights, monetary damages, injunctions against the sale of products incorporating the technology in question, counterclaims, attorneys’ fees, incremental costs associated with product or component redesigns, liabilities to customers under reimbursement agreements or contractual indemnification provisions, and diversion of management’s attention from other business matters. In addition, the fact that the economy generally, and the network connectivity and visibility market segments specifically, have been in a state of uncertainty makes it difficult to determine if past experience is a good guide to the future and makes it impossible to determine if markets will grow or shrink in the short term. Continued weakness in domestic and worldwide macro-economic conditions, including related disruptions in world credit and equity markets, and the resulting economic uncertainty for our customers, as well as the overall network connectivity and visibility markets, has and could continue to adversely affect our revenues and results of operations. As a result of these uncertainties, we are unable to predict our future results with any accuracy. Other factors affecting these forward-looking statements include but are not limited to the following: faster than anticipated declines in the storage networking market, slower than expected growth of the converged networking market or the failure of our Original Equipment Manufacturer (OEM) customers to successfully incorporate our products into their systems; our dependence on a limited number of customers and the effects of the loss of, decrease in or delays of orders by any such customers, or the failure of such customers to make timely payments; the emergence of new or stronger competitors as a result of consolidation movements in the market; the timing and market acceptance of our products or our OEM customers’ new or enhanced products; costs associated with entry into new areas of the network connectivity and visibility markets; the variability in the level of our backlog and the variable and seasonal procurement patterns of our customers; any inadequacy of our intellectual property protection and the costs of actual or potential third-party claims of infringement and any related indemnity obligations or adverse judgments; the effect of any actual or potential unsolicited offers to acquire us; proxy contests or the activities of activist investors; impairment charges, including but not limited to goodwill and intangible assets; changes in tax rates or legislation; the effects of acquisitions; the effects of terrorist activities, natural disasters, and any resulting disruption in our supply chain or customer purchasing patterns or any other resulting economic or political instability; the highly competitive nature of the markets for our products as well as pricing pressures that may result from such competitive conditions; the effect of rapid migration of customers towards newer, lower cost product platforms; transitions from board or box level to application specific integrated circuit (ASIC) solutions for selected applications; a shift in unit product mix from higher-end to lower-end or mezzanine card products; a faster than anticipated decrease in the average unit selling prices or an increase in the manufactured
3
cost of our products; delays in product development; our reliance on third-party suppliers and subcontractors for components and assembly; our ability to attract and retain key technical personnel; our ability to benefit from our research and development activities as well as government grants related thereto; our dependence on international sales and internationally produced products; changes in accounting standards; and any resulting regulatory changes on our business. These and other factors could cause actual results to differ materially from those in the forward-looking statements and are discussed elsewhere in this Annual Report on Form 10-K, in our other filings with the Securities and Exchange Commission or in materials incorporated therein by reference.
4
PART I
All references contained in this Annual Report on Form 10-K to years refer to our fiscal years ended June 29, 2014, June 30, 2013, and July 1, 2012, as applicable, unless the calendar year is specified. References to “Emulex,” the “Company,” the “Registrant,” “we,” “our” and “us,” refer to Emulex Corporation and its subsidiaries, unless referring to specific segment information.
Item 1. Business.
Introduction and Company History
Emulex is a leader in network connectivity, monitoring and management products, providing solutions for global networks that support enterprise, cloud, government and telecommunications. Emulex products enable industry-leading end-to-end application visibility, optimization and acceleration in the data center. Our portfolio of input/output (I/O) connectivity offerings, including the line of ultra high-performance Ethernet and Fibre Channel-based connectivity products, have been designed into server and storage solutions from leading Original Equipment Manufacturers (OEMs), including Cisco Systems, Inc. (Cisco), Dell Inc. (Dell), EMC Corporation (EMC), Fujitsu Ltd. (Fujitsu), Hewlett-Packard Company (Hewlett-Packard), Hitachi Data Systems (HDS), Huawei Technologies Company Ltd. (Huawei), International Business Machines Corporation (IBM), Network Appliance, Inc. (NetApp) and Oracle Corporation (Oracle), and can be found in the data centers of nearly all of the Fortune 1000. Our monitoring and management solutions, including our portfolio of network visibility and recording products, provide organizations with complete network performance management at speeds up to 100Gb Ethernet.
Emulex, a Delaware corporation, completed its initial public offering in 1981 and additional public offerings of its common stock in 1983 and 1989. Emulex’s common stock trades on the New York Stock Exchange (NYSE) under symbol ELX.
Emulex corporate headquarters are located at 3333 Susan Street, Costa Mesa, California 92626, and our telephone number is (714) 662-5600. Our Internet address is www.emulex.com. Our annual report on Form 10-K, quarterly reports on Form 10-Q, current reports on Form 8-K, and amendments to those reports filed or furnished pursuant to Section 13(a) or 15(d) of the Exchange Act are available free of charge through our website as soon as reasonably practicable after such reports are electronically filed with, or furnished to, the Securities and Exchange Commission (SEC). The public may read and copy any materials the Company files with the SEC at the SEC’s Public Reference Room at 100 F Street, NE, Washington, DC 20549. The public may obtain information about the operation of the public reference room by calling the SEC at 1-800-SEC-0330. The SEC also maintains an internet site that contains reports, proxy and information statements, and other information regarding issuers that file electronically with the SEC. The website of the SEC is www.sec.gov.
Market Segments
Fibre Channel (FC)
Beginning in the late 1990s, FC emerged as the first storage networking technology to be widely adopted by the world’s leading server and storage systems manufacturers and is now available in 2, 4, 8 and 16 Gb per second (Gb/s) FC solutions. FC is the primary I/O connectivity for transaction-intensive applications like email, databases and highly virtualized environments that require high throughput and low latency. Its advanced capabilities enabled new architectures such as Storage Area Networks (SANs) which connect multiple host computers to one or more storage arrays. A SAN essentially transforms dedicated servers and storage devices into network resources, greatly improving the performance and scalability beyond the capabilities of direct attached enterprise storage. By providing shared server access, the cost of expensive enterprise servers and storage can be spread across entire organizations. SANs are deployed to support a wide range of applications such as Local Area Network (LAN) free and serverless back-up, storage virtualization and disaster recovery.
Typical deployments of FC include enterprise-class disk, storage virtualization, data protection and archiving solutions. An emerging segment for FC deployments is solid state disk (SSD) and flash storage, for application performance and performance acceleration of databases, and data warehouses, with improved throughput and application response time. Emulex has developed strong partnerships for joint flash/SSD-based solutions with EMC Corporation and Fusion-io, Inc. Additionally, FC has been deployed within storage arrays to provide internal connectivity for disk drives, enabling enhanced performance and greater scalability.
Network Attached Storage (NAS)
The NAS architecture offers an easily deployable and scalable storage solution by providing hard disk storage that is set up with its own network address rather than being attached to a department computer that is serving applications to network workstation users. In high-end environments characterized by NAS file delivery to servers, a SAN may be deployed behind a
5
NAS, making NAS and SAN solutions complementary. The majority of NAS and SAN solutions installed today are delivered to end users via integrated systems solutions offered by storage and computer system OEMs.
Internet Protocol (IP)
The IP suite is the set of communications protocols used for the Internet and similar networks, and generally the most popular protocol stack for Wide Area Networks (WANs). It is commonly known as Transmission Control Protocol over Internet Protocol (TCP/IP), because of its most important protocols: TCP and IP, which were the first networking protocols defined in this standard. TCP/IP provides end-to-end connectivity specifying how data should be formatted, addressed, transmitted, routed and received at the destination. It has four abstraction layers, each with its own protocols. From lowest to highest, the layers include: the link layer (commonly Ethernet), which contains communication technologies for a local network; the Internet layer (IP) which connects local networks, thus establishing internetworking; the transport layer (TCP) handles host-to-host communication; and the application layer contains all protocols for specific data communications services on a process-to-process level (for example, how a web browser communicates with a web server). The TCP/IP model and related protocols are maintained by the Internet Engineering Task Force (IETF).
Internet Small Computer System Interface (iSCSI)
The iSCSI protocol, ratified by the IETF in 2003, brought SANs within the reach of small and mid-sized businesses. The protocol encapsulates native Small Computer System Interface (SCSI) commands using TCP/IP and transmits the packets over the Ethernet network infrastructure. The range of iSCSI connectivity solutions spans simple Ethernet NICs that are commonly used for Ethernet LAN applications, up to high performance 10Gb Ethernet (10GbE) NICs that offer full protocol processing offload from the host computer. The emergence of 10GbE addresses the bandwidth and latency issues of 1GbE and is laying the foundation for greater adoption of network convergence in the data center. As Ethernet speeds further increase to 40GbE and 100GbE, we expect such convergence to become more widespread.
Fibre Channel Over Ethernet (FCoE)
There are two key standards in the FCoE Converged Network Adapter (CNA) market that have been developed by the International Committee for Information Technology Standards (INCITS) T11.3 working group. One is for host-based CNAs and the other is for 10GbE networking. A complementary standard, Data Center Bridging (DCB), which covers multi-hop switching (IEEE 802.1Qaz) has also been developed. FCoE combines the efficiency and enterprise hardened features of the FC protocol with the ubiquity of an Ethernet network, while leveraging the robust storage management software and tools available with FC. FCoE transports native FC frames over a “no drop” or lossless Ethernet infrastructure, allowing existing FC SAN management tools, skills, and processes to remain intact. It allows an evolutionary approach toward I/O consolidation by preserving all FC constructs, maintaining the same latency, security, and traffic management attributes of FC while preserving investments in FC drivers, tools, training, and SANs. The main value proposition of FCoE is the ability to streamline server connectivity using lossless Ethernet while protecting the substantial investments made in FC SANs during the past 15 years.
Remote Direct Memory Access (RDMA) over Converged Ethernet (RoCE)
RoCE is a network protocol that allows remote direct memory access over an Ethernet network. RoCE is a link layer protocol and hence allows communication between any two hosts in the same Ethernet broadcast domain. The RoCE protocol benefits from the characteristics of a converged Ethernet networks, the protocol can also be used on a traditional or non-converged Ethernet network. High performance network applications, including high frequency trading, networked storage or cluster computing need a network infrastructure with a high bandwidth and low latency. The advantages of RDMA are lower latency, lower CPU load and higher bandwidth.
Data Packet Capture (DPC)
The ability to respond efficiently to network problems and establish the true root cause of service-affecting issues is critical for large organizations that depend on their network for business continuity. There is an ever-increasing demand from enterprise and wireless carriers for better application performance and zero network downtime. In addition, real-time data, social networks, video, virtualization, cloud, and Voice over IP (VoIP) are all raising network throughput for both enterprises and carriers. As a result, traditional software tools used for security, network and application performance visibility are being challenged. DPC technology acquires data packets that are crossing or moving over a specific computer network, enabling IT teams to accurately capture, record, index and search on captured traffic, enabling them to use their existing analysis tools and techniques to analyze captured network traffic. With 10GbE becoming the industry standard for data center network connectivity, specialized hardware-based DPC technology is now required in order to accurately acquire packet data from the network for the purpose of monitoring performance, troubleshooting issues and analyzing information. As network speeds continue to increase beyond 10Gbp/s, inaccuracies caused in the event of packet loss will be further accentuated. As a result,
6
organizations are making investments in hardware-based data packet capture technology, the key enabler for the growing Network Recording Market (NRM).
Storage I/O Interconnects
In recent years, the hard disk drive (HDD) industry has utilized I/O interconnects, such as Serial Attached SCSI (SAS) and Serial Advanced Technology Attachment (SATA) for the disk drive I/O interface. Serial I/O technologies utilize a single wire over which all control and user data passes, providing higher performance, expanded connectivity and lower cost.
SATA has already increased in line speed from 1.5 Gb/s to 3 Gb/s and 6 Gb/s. SAS is designed for the corporate and enterprise market as a replacement for parallel SCSI, allowing for much higher speed data transfers than previously available. Though SAS uses serial communication instead of the parallel method found in traditional SCSI devices, it still uses SCSI commands for interacting with SAS end devices.
Our Products
We are a leading designer, developer and supplier of ultra high-performance Ethernet and Fibre Channel-based connectivity products which have been designed into server and storage solutions from leading OEMs. Emulex monitoring and management solutions, including our portfolio of network visibility and recording products, provide organizations with complete network performance management at speeds up to 100Gb Ethernet (100GbE). In fiscal 2004, the acquisition of Vixel Corporation (Vixel) enabled us to enter the embedded storage market. In fiscal 2006, the acquisition of Aarohi Communications, Inc. (Aarohi) facilitated the addition of intelligent data center infrastructure products, such as our CNAs. In fiscal 2007, we broadened our embedded footprint adding embedded storage bridges with the acquisition of Sierra Logic, Inc. (Sierra Logic). In fiscal 2009, we entered into a multi-year partnership (including a multi-year joint development and supply agreement) with ServerEngines Corporation (ServerEngines) to deliver converged networking solutions. In fiscal 2011, we acquired ServerEngines. The combination of Emulex and ServerEngines’ technology created a unique offering that delivers a foundation for converged networking solutions, including adapter, LAN on Motherboard (LOM) and iBMC solutions. In fiscal 2013, we acquired Endace Limited (Endace), a leading supplier of network visibility infrastructure products.
Leveraging our expertise and experience in networking and I/O technology, we have approached the storage market opportunity with a networking perspective to maximize the performance and management capabilities of our solutions. We believe the performance of our products is among the highest in the industry. Furthermore, our products support high performance connectivity features to enhance data integrity. Lastly, our products offer investment protection for our OEM customers, who often develop specialized software to interface with our adapters, as we have maintained a stable application programming interface (API) since our first generation of Host Bus Adapters (HBAs) was introduced in 1996. More recently, we have expanded the functionality in our products to deliver high availability and remote centralized management that may be embedded in OEM and independent software vendors (ISV) SAN management products.
We are a world leader in network visibility and network recording and our hardware-based systems are trusted by large organizations all over the world to measure, monitor, analyze, protect and troubleshoot some of the fastest and most complex networks on earth. Our business is built on developing tools that provide organizations with 100 percent accurate visibility and history, from the basic physical connections right through to the software applications that use the network. Our solutions utilize two basic technologies, instrumentation and analysis (EndaceProbe™ Intelligent Network Recorders and EndaceVision™ Network Visibility Software), and 100 percent packet capture hardware (EndaceDAG Data Capture Cards). This broad capability provides analysis that can not only drive faster resolution of performance problems, but also establish proactive methods to prevent problems from occurring in the future. As 10GbE networking has become the norm rather than the exception and the volume of traffic being moved around corporate networks has exploded, organizations have effectively become wholly dependent on their networks. Network performance monitoring will play an increasingly important role with the increased adaption of 10GbE. The combination of Emulex networking and I/O technology and network visibility products provides this functionality with 100 percent accuracy at speeds up to 100 GbE. With the move to 10GbE and 40GbE, the market for network performance monitoring will become more relevant.
Business Operating Segments
With our acquisition of Endace, our network connectivity, monitoring and management solutions are now broken into two business operating segments consisting of three product lines. Our Connectivity Segment consists of our legacy Emulex products and includes Network Connectivity Products (NCP) and Storage Connectivity and Other Products (SCOP). Our Visibility Segment consists of our Network Visibility Products (NVP) that were acquired through the Endace acquisition.
Connectivity Segment
Networking Connectivity Products
7
NCP includes industry standard Fibre Channel and Ethernet-based solutions that provide server I/O and target storage array connectivity to create networks for mission-critical enterprise and cloud data centers. These products enable servers to reliably and efficiently connect to LANs, SANs, and NAS by offloading data communication processing tasks from the server as information is delivered and sent to the network. Our NCP use industry standard protocols including Fibre Channel Protocol (FCP), IP, TCP/IP, iSCSI, FCoE, overlay networking standards including Network Virtualization using Generic Routing Encapsulation (NVGRE) and Virtual Extensible Local Area Network (VXLAN), and RoCE. RoCE is a network protocol that allows RDMA over an Ethernet network. RoCE is a link layer protocol and allows communication between any two computers in the same Ethernet broadcast domain. RoCE brings many of the same low-latency capabilities typically associated with InfiniBand (IB) to Ethernet networks. NVGRE and VXLAN support overlay networks, which is a computer network which is built on the top of another network. Our Ethernet-based products include OneConnect® Converged Network Adapters (CNAs) and Local Area Network on Motherboard (LOM) application specific integrated circuits, and custom form factor solutions for OEM blade servers that enable high performance, scalable networks and convergence. The OneConnect® CNA is a multi-function adapter that provides server connectivity for network and storage traffic and is designed to address the key challenges of evolving data center networks and improve the overall efficiency of data center operations. Unlike first generation CNAs that only provide FCoE convergence, the OneConnect® CNA provides optimized performance for all protocols (TCP/IP, FCoE, and, iSCSI) enabling one card for all applications and all leading server architectures to allow data center managers to consolidate multiple 1GbE links on to a single 10GbE link. The use of multiple protocol accelerators/offload engines allows the OneConnect® CNAs to deliver maximum performance, regardless of the mix of protocol traffic. This diverse applicability of the OneConnect® CNA simplifies server hardware configurations and reduces server sprawl in the data center.
Our Emulex OneConnect® 10GbE Network Xceleration™ solutions are designed for enterprise applications with ultra-low latency, superior message rate or packet pacing requirements, such as financial/high frequency trading (HFT) network analytics (security, financial, and network optimization) and video content delivery (Video on Demand, Peer-to-Peer IPTV), and leverage kernel bypass operations that reduce latency and transaction times.
Our FC based products include LightPulse® HBAs, FC application specific integrated circuits (ASICs), and custom -form factor solutions for OEM blade servers. Our LightPulse® FC HBAs connect host computers to a FC network. Our adapters support a wide range of operating systems and host computer system interfaces, including Peripheral Component Interconnect (PCI) and PCI Express-based platforms. Our FC HBA offerings include single, dual, and quad port adapters at throughput speeds of 2, 4, 8 and 16Gb FC for use in enterprise data centers. The LightPulse HBAs are based on the Emulex Engine™ (XE) 201 I/O Controller technology, which is a multi-fabric product, capable of both Fibre Channel and Ethernet-based connectivity. The XE201 enables the ability to choose a combination of up to four ports of native 8GFC and 16GFC, or 10GbE and 40GbE for the ultimate in design flexibility.
Storage Connectivity and Other Products
SCOP includes our InSpeed® switch-on-a-chip (SOC) and back-end connectivity, bridge, router products, Pilot™ Integrated Baseboard Management Controllers (iBMCs), certain legacy products and other products and services. SCOP is deployed inside storage arrays, tape libraries, and other storage appliances, and connects storage controllers to storage capacity, delivering improved performance, reliability, and connectivity. SCOP uses industry standard protocols including FC, SAS, and SATA, and support the broadest range of HDD and Solid Stated Drives (SSD) technologies. In recent years, we have significantly reduced our engineering investment in new SCOP products to focus on other areas of the overall networking and storage market including Ethernet and FCoE technologies. As a result, we expect that revenues for this product line will continue to decrease as a percentage of overall revenues in the future. Baseboard Management Controllers (BMCs) are at the heart of reducing costs associated with managing servers. Our Pilot™ iBMC solutions revolutionized the industry for enterprise servers by integrating the BMC, super I/O, graphics controller and Remote Keyboard, Video, Mouse and Storage (KVMS) functionality into a single ASIC, providing significant cost savings to data center managers. Like a standard BMC, when embedded in a server system or appliance, the iBMC simplifies the management of the remote server systems and appliances, whether physical or virtual servers, thereby reducing operational costs.
Visibility Segment
Network Visibility Products
NVP consists entirely of the recently acquired Endace® family of visibility and recording infrastructure products that address NRM for high speed networks. The EndaceProbe™ Intelligent Network Recorder (INR) captures, indexes and stores network traffic history in order to help organizations troubleshoot problems and respond to network security breaches. EndaceVision™ is a browser-based network traffic search engine that provides users with a unique ‘window’ into high speed networks. Through EndaceVision™, users can search and receive packets of interest from anywhere across a globally distributed network of Endace Systems through a single, browser-based user interface. The EndaceODE™ Open Application Platform, also known as ODE systems, are designed specifically to host packet-processing applications in managed data center environments. These flexible and scalable systems are used extensively by organizations that demand the very highest levels of
8
packet capture accuracy and processing performance for their hosting platforms. EndaceAccess™ Head-End systems give organizations access to 40GbE and 100GbE network segments that they need to measure, monitor and protect their networks with industry standard 1 Gb/s capable monitoring and security tools.
The EndaceFlow™ NetFlow Generator Appliances (NGAs) are designed specifically to offload the work from network elements and deliver 100 percent accurate NetFlow in the right format to the tools that need to consume it.
Underpinning all of the Emulex family of network visibility and recording products are the EndaceDAG Data Capture Cards that are integrated into the EndaceProbe™ INRs and sold as stand-alone components for use in a wide range of monitoring and security systems. We believe EndaceDAG Data Capture Cards have established a reputation for being among the most accurate, reliable and best performing PCI-based packet capture cards available.
Intellectual Property
Our ability to compete depends in part upon our ability to protect our proprietary information and intellectual property. Emulex primarily relies on patent, copyright, trademark, and trade secret laws, as well as contractual agreements with our employees, customers, suppliers and consultants that include confidentiality and non-disclosure provisions for such protection. Despite these precautions, no assurance can be made that the laws of certain countries outside of United States in which our products are developed, manufactured or sold will protect our intellectual property rights and that competitors or unauthorized third parties will not otherwise be able to infringe or misappropriate our intellectual property.
We have a number of issued patents and pending patent applications in the U.S. and abroad. Most of our issued patents and pending patent applications relate to our storage and networking technology or products. We maintain an active program of obtaining patent protection for our inventions as development occurs and as new products are introduced. As a result of the rate of change of technology in our industry, we believe that the duration of the patent protection available to us for our products is adequate to cover the expected market duration for such products.
All of our software, drivers, and firmware, which are embedded within or provided exclusively for use with our hardware products, are marked with copyright notices listing our company as the copyright owner. We have been granted a number of registrations of trademarks in the U.S. and abroad. We also have a number of pending trademark registrations in the U.S. and abroad. We maintain an active practice of marking our products with trademark notices and renewing trademarks so that the duration of trademark protection is maintained for as long as needed. Additionally, we rely on trade secret law and contractual provisions to protect unique intellectual property we possess which we have determined unnecessary or uneconomical to patent or copyright, or which is not otherwise capable of more formal protection.
We have received third party claims of intellectual property infringement in the past and there can be no assurance that we will not receive additional claims of intellectual property infringement from competitors or other third parties in the future. Such litigation may result in substantial costs and diversion of resources, and may result in an injunction against the sale or distribution of our products incorporating the underlying intellectual property or require the licensing of such intellectual property from the third party initiating the lawsuit, all of which could have a material adverse effect on our business, financial condition and results of operations. See Note 10 in the accompanying notes to consolidated financial statements included in Part IV, Item 15(a) of this Annual Report on Form 10-K for additional information on our intellectual property litigation. Also see “Risk Factors” in Part I, Item 1A of this Annual Report on Form 10-K for additional discussion of our intellectual property risks.
Engineering and Development
Emulex operates in an industry that is subject to rapid and frequent technological developments, evolving industry standards and changing customer requirements. Our ability to successfully compete in this industry is dependent upon our ability to timely design, develop and introduce products that support current and emerging industry standards that enhance the performance of storage and server networks for our customers. As a result, we plan to continue to invest in research and development activities for the foreseeable future.
We maintain several design centers throughout the United States and abroad including California, Texas, New Zealand and India. Engineering and development expenses were approximately $155.9 million, $168.4 million, and $163.6 million in fiscal 2014, fiscal 2013, and fiscal 2012, respectively.
Selling and Marketing
We sell our products worldwide to OEMs, Original Design Manufacturers (ODMs), end users, and through other distribution channels including value added resellers (VARs), systems integrators, industrial distributors, direct market resellers and other resellers. As the storage and networking markets are dominated by OEMs, our focus is to use sales specialists to expand opportunities with our existing OEMs, as well as to develop new OEM and ODM relationships. However, we are also expanding our distribution efforts, leveraging worldwide distribution channels through technical distributors such as VARs and
9
systems integrators, to complement our core OEM relationships. In some cases, OEM partners leverage the distribution channel to deliver solutions to end users, making our distribution efforts complementary with our OEM focused strategy.
During fiscal 2014, most of our revenues were derived from a mix of connectivity products based largely on Fibre Channel and Ethernet technologies sold to OEMs and through distribution channels. Our significant OEM customers include the world’s leading server and storage providers, including Cisco Systems, Inc. (Cisco), Dell Inc. (Dell), EMC Corporation (EMC), Fujitsu Ltd. (Fujitsu), Hewlett-Packard Company (Hewlett-Packard), Hitachi Data Systems (HDS), Hitachi Limited (Hitachi), Hon Hai Precision Industry Co., LTD (Hon-Hai), Huawei Technologies Company Ltd. (Huawei), Intel Corporation (Intel), International Business Machines Corporation (IBM), Lenovo, Micron Technology, Inc. (Micron), NEC Corporation (NEC), Network Appliance Inc. (NetApp), Oracle Corporation (Oracle), and Unisys Corporation (Unisys). Our significant distribution partners include ASI Computer Technologies, Inc. (ASI), Avnet, Inc. (Avnet), Digital China Technology Limited, Info X Distribution, LLC (Info X), Ingram Micro Inc. (Ingram Micro), SYNNEX Corporation (SYNNEX), and Tech Data Corporation (Tech Data). The market for networking infrastructure solutions is concentrated among large OEMs, and as such, a significant portion of our revenues are generated from sales to a limited number of customers.
Seasonality
Our business fluctuates as a result of various factors, including but not limited to economic conditions, new product introductions, IT spending, industry demand, and seasonality. Although we do not consider our business to be highly seasonal, we do believe that seasonality has and may impact our business. To the extent that we do experience seasonality in our business, it would most likely have a negative impact on the sequential growth rate of our net revenues during the first and third quarters of our fiscal year.
Order Backlog
Due to an industry practice that allows customers to cancel or change orders with limited advance notice prior to shipment, we do not believe that backlog is a reliable indicator of future revenue levels. Furthermore, purchase order release lead times depend upon the scheduling practices of the individual customer, and the rate of booking new orders fluctuates from month to month. Therefore, the level of backlog at any one time is not necessarily indicative of trends in our business nor is it a meaningful indicator of future long-term revenues.
Concentration of Customers, Revenue by Operating Segments, Product Families and Geographic Area
See Note 15, “Operating Segments and Revenue by Product Families, Geographic Area and Significant Customers,” in the accompanying notes to consolidated financial statements included in Part IV, Item 15(a) of this Annual Report on Form 10-K for information regarding concentration of our customers as well as information regarding our revenue by operating segments, product family and geographic area. Also see “Risk Factors” contained within Part I, Item 1A of this Annual Report on Form 10-K for a discussion of the risks associated with the concentration of our customers, as well as the risks associated with our revenue by operating segments, product family and geographic area.
Competition
The market for our products remains intensely competitive and is characterized by frequent new product introductions, rapid technological change, changing customer preferences, evolving technology, and industry standards.
We believe the competitive factors for our Network Connectivity Products include price/performance, interoperability, reliability, scalability, silicon integration, technical support, time to market, product roadmap, and the extent of the installed base. We believe that we compete favorably with respect to these factors. Some of our other competitive advantages include our robust time-proven FC drivers, our single chip multi-protocol architecture, our workforce of highly experienced researchers and designers, and our intellectual property. While we believe we have historically had a competitive strength in the alliances we have built with OEM distribution channels, the growth of white box manufacturers and web giants has shifted server market share away from OEMs and enterprise end-users in recent years.
One of our largest competitors for HBA and CNA products is QLogic Corporation (QLogic). In addition, Cisco competes in the CNA market.
In some markets, CNAs face competition from NIC/iSCSI suppliers that are supplied by established Fibre Channel and Ethernet competitors as well as new entrants, including Intel Corporation (Intel), Chelsio Communications, Inc. (Chelsio), Mellanox Technologies, Ltd. (Mellanox) and other private and public companies who have invested in various aspects of data center networking. Across all storage networking technologies, we face the threat of potential competition from new entrants into the storage networking market, including large technology companies that may develop or acquire differentiating technology and then apply their resources, including established distribution channels and brand recognition, to obtain significant market share.
10
We believe that the principal basis of competition for our Storage Connectivity and Other Products presently includes interoperability, reliability, scalability, price, silicon integration, performance, technical support, and backwards compatible Application Programmable Interfaces (APIs). We believe that we compete favorably with respect to these factors. We also believe that we have a competitive strength in our close relationships with OEM customers and our OEMs’ investment in storage software.
Our Storage Connectivity and Other Products, including InSpeed®, bridge and router products compete against products supplied by LSI Corporation/Avago Technologies (LSI/Avago), Marvell Technology Group Ltd. (Marvell), Maxim Integrated Products, Inc. (Maxim), and PMC-Sierra, Inc. (PMC-Sierra). Across all embedded storage technologies, we face the threat of potential competition from new entrants into the embedded storage market, including large technology companies that may develop or acquire differentiating technology and then apply their resources, including established distribution channels and brand recognition, to obtain significant market share.
We believe that the principal basis of competition for our Network Visibility Products includes Napatech and SolarFlare for the DAG technology. Our primary competitors for network recording systems (EndaceProbe™ INRs and EndaceVision™) include NetScout, Solera Networks, Riverbed, Niksun, Network Instruments and Fluke Networks.
Manufacturing and Suppliers
Our products include board level assemblies that consist primarily of electronic component parts assembled on printed circuit boards (PCBs) and system level products consisting of board level assemblies, cables, and power sources contained within an enclosure. Most component parts can be purchased from two or more sources. However, some key components that we use in our products (including our ASICs) may only be available from single sources with which we may not have contracts. In addition, we design ASICs that are embedded in our assembled products and are also sold directly to OEM customers. These ASICs are typically sole-sourced and manufactured by third party semiconductor foundries. The majority of our ASICs are manufactured under the direction of LSI/Avago, using a variety of qualified semiconductor, assembly, and test suppliers. We also purchase ASICs from eSilicon Corporation, Intel Corporation, Renesas Electronics America Inc., and Toshiba Corporation. In addition to hardware, we design software and firmware, which are provided as embedded programs within our hardware products.
The Company utilizes third party electronic manufacturing service (EMS) providers for the manufacturing and assembling of the majority of our products. The assembly operations required by our products are typical of the electronics industry, and no unusual methods, procedures or equipment are required. The sophisticated nature of the products, in most cases, requires extensive testing by specialized test devices operated by skilled personnel. Our providers perform this testing. However, we also maintain an internal test-engineering group for continuing support of test operations.
During fiscal 2014, Benchmark Electronics, Inc. (Benchmark) manufactured for us at their facilities in Korat, Thailand; Flextronics Telecom Systems, LTD. (Flextronics) manufactured for us at their facility in Zhuhai, China; GPC Electronics manufactured for us at their facility in Christchurch, New Zealand; UNICOM Engineering, Inc. (formerly NEI) manufactured for us at their facility in Canton, Massachusetts; and Wistron Corporation (Wistron) manufactured for us at their facility in Zhongshan, China. Through our continuing strategic relationships with our EMS suppliers, we believe we have a strong global manufacturing operation that supports our growing global customer base and provides us with increased supply chain efficiency, flexibility, and security.
Employees
As of June 29, 2014, we employed 1,122 employees. Other than the employee in our Brazil office, none of our employees are represented by a labor union, and we believe our employee relations are good.
Executive Officers of the Registrant
The executive and certain other officers of the Company or its principal operating subsidiaries as of June 29, 2014 were as follows:
Name | Position | Age | ||
Jeffrey W. Benck | Director, President and Chief Executive Officer | 49 | ||
Kyle B. Wescoat | Senior Vice President, Chief Financial Officer and Treasurer | 62 | ||
Margie Evashenk (1) | Senior Vice President, Chief Development Executive | 48 | ||
Jeffrey L. Hoogenboom (1) | Senior Vice President, Worldwide Sales | 48 | ||
Perry M. Mulligan (1) | Senior Vice President, Operations | 56 | ||
Randall G. Wick (2) | Senior Vice President, General Counsel and Secretary | 61 | ||
11
_____________
(1) These persons serve in the indicated capacities as SEC Section 16 officers of the Registrant, but are not officers of the Registrant or its subsidiaries, and are considered a "significant employee."
(2) Mr. Wick serves as an officer of the Registrant's principal operating subsidiaries; he is the Secretary of the Registrant, but is not otherwise an officer of the Registrant. Also, Mr. Wick serves in the indicated capacity as a SEC Section 16 officer of the Registrant.
Mr. Benck currently serves as a Director, President and Chief Executive Officer and President of Emulex. Mr. Benck joined Emulex in May 2008 as Executive Vice President and Chief Operating Officer and was subsequently appointed to President and Chief Operating Officer in August 2010. Mr. Benck was named a Director of Emulex and President and Chief Executive Officer of the Company in July 2013. Prior to joining the Company, Mr. Benck was President and Chief Operating Officer of QLogic Corporation, a supplier of storage networking solutions. Prior to that, Mr. Benck worked for International Business Machines (IBM) Corporation, a global leader in information technology and services, for 18 years, in his last role serving as Vice President of xSeries BladeCenter and Retail Store Solutions development. While at IBM, Mr. Benck's focus included growth initiatives, product development, marketing and strategy, portfolio management and customer relationships. Mr. Benck is widely known for his role in establishing IBM's blade server product line leadership.
Mr. Wescoat joined the Company in January 2014 as Senior Vice President, Chief Financial Officer and Treasurer. Prior to joining the Company, Mr. Wescoat serves as Senior Vice President and Chief Financial Officer of Skullcandy, Inc., a publicly traded headphone, gaming and accessories company. From February 2008 to May 2011, Mr. Wescoat served as the Vice President of Finance and Chief Financial Officer of Vizio, Inc., a producer of consumer electronics. Prior to that, Mr. Wescoat served as the Chief Administrative Officer of the Los Angeles Dodgers. Mr. Wescoat also previously served as the Vice President of Finance and Chief Financial Officer of Cherokee Inc., a multi-brand retail direct licensor, and Vans, Inc. a teen oriented, multi-channel lifestyle company.
Ms. Evashenk joined the Company in October 2006 as Senior Vice President of Engineering and was subsequently promoted to Senior Vice President, Chief Development Executive of the Company in May 2011. Although no specific departure date or terms have been agreed to, Ms. Evashenk has expressed an interest in retiring from her service with Emulex by the end of calendar year 2014 and the Company is currently working with her to develop a mutually agreeable transition plan. Prior to Emulex’s acquisition of Sierra Logic, Inc. (Sierra Logic) in October 2006, Ms. Evashenk was a Co-Founder and Vice President of Engineering for Sierra Logic. Prior to joining Sierra Logic, Ms. Evashenk held various positions in engineering and management at Hewlett-Packard Company and Agilent Technologies, Inc.
Mr. Hoogenboom joined the Company in January 2009 as Senior Vice President of Worldwide Sales. Prior to joining the Company, Mr. Hoogenboom was Vice President of Emerging Business Sales of Cadence Design Systems, Inc. from January 2008 to December 2008. From January 2007 to January 2008, Mr. Hoogenboom was Executive Vice President of Sales of LSI Corporation. Prior to joining LSI Corporation, Mr. Hoogenboom spent 18 years at Intel Corporation where he held multiple sales and marketing positions including Vice President, General Manager of Reseller Channel Sales and Vice President of Embedded Sales.
Mr. Mulligan joined the Company in July 2013 as Senior Vice President of Operations. Prior to joining the Company, Mr. Mulligan served as the Senior Vice President of Operations at QLogic Corporation. Prior to that, Mr. Mulligan spent nine years in the electronic manufacturing services industry, at Solectron and Celestica. At Solectron, he served as Senior Vice President of supply chain management and chief procurement officer, and at Celestica, he held roles as Vice President of supply chain management and president of commodity management for Asia. Prior to entering the electronics manufacturing services industry, Mr. Mulligan held a number of management positions at Nortel in operations, information technology and materials management.
Mr. Wick joined the Company in June 2002 and serves as Senior Vice President and General Counsel. Prior to joining the Company, Mr. Wick served as Vice President, Chief Operating Officer and General Counsel of TelOptics Corporation, a high technology privately held company, since November 2000. Previously, Mr. Wick served as a legal consultant for his own firm and held the positions of Vice President and General Counsel for Samsung Electronics America, Inc. from 1998 to 1999 and AST Research, Inc. from 1990 to 1998.
12
Item 1A. Risk Factors.
Our operating results are difficult to forecast resulting in significant fluctuations from quarter to quarter.
Our fiscal 2014 restructuring plans may not yield the targeted cost savings on a timely basis or at all even though we incurred charges relating to such cost savings initiatives. In addition, our share repurchase program may not be completed within the expected timeframe. The assumptions on which our cost savings initiatives, share repurchase and capital return goals are based involve judgments with respect to, among other things, economic, competitive and financial market conditions and the impact of the cost savings initiative on our customers, all of which are difficult or impossible to predict and many of which are beyond the Company’s control.
Our revenues and results of operations have historically varied on a quarterly basis and may vary significantly in the future. Accordingly, we believe that period-to-period comparisons of our results of operations are not necessarily meaningful, and you should not rely on such comparisons as indications of our future performance. We may be unable to maintain our current levels of growth or profitability in the future. Our revenues and results of operations are difficult to forecast and could be adversely affected in any given quarter by many factors, including, but not limited to:
• | Changes in the size, mix, timing and terms of OEM or other customer orders; |
• | Changes in the sales and deployment cycles for our products or desired inventory levels for our products; |
• | Acquisitions or strategic investments by our customers, competitors or us; |
• | Timing and market acceptance of new or enhanced product introductions, including the next generation of server platforms based on the Intel® XEON® family and chipsets used by us, our OEM customers or competitors; |
• | Market share losses or difficulty in gaining incremental market share; |
• | Reduced demand from our customers if there is a shortage of, or difficulties in, acquiring components or other products, such as microprocessors, disk drives, switches, and optical modules, used in conjunction with the deployment of systems containing our products; |
• | Seasonality or non-linearity of revenue from period to period; |
• | Changes in general social and macroeconomic conditions, including but not limited to natural disasters, terrorism, public health crises, slower than expected market growth, reduced economic activity, delayed economic recovery, loss of consumer confidence, increased energy costs, adverse business conditions and liquidity concerns, concerns about inflation or deflation, recession, and reduced business profits and capital spending, with resulting changes in customer technology budgeting and spending; |
• | Fluctuations in product development, procurement, resource utilization and other operating expenses; |
• | Inability to realize anticipated efficiencies resulting from increased revenues; |
• | Difficulties controlling costs, including operating expenses, as revenues increase; |
• | Inability of our electronics manufacturing service providers (EMS) or suppliers to produce and distribute our products in a timely fashion; |
• | Difficulties with updates, changes or additions to our information technology systems; |
• | Breaches of our network security, including viruses; and |
• | Any of these factors could yield losses or actual results to vary from forecast in the future which may trigger an impairment of our long-lived assets and goodwill. |
Order deferrals and cancellations by our customers, declining average sales prices, changes in the mix of products sold, shortages of materials, delays in the introduction of new products and longer than anticipated sales cycles for our products have adversely affected our business, financial condition and results of operations in the past. Despite these factors, we, along with our EMS providers, maintain significant finished goods, work-in-progress and raw materials inventory to meet estimated order forecasts. If our customers purchase less than their forecasted orders or cancel or delay existing purchase orders, there will be higher levels of inventory that face a greater risk of obsolescence. If our customers choose to purchase products in excess of the forecasted amounts or in a different product mix, we could experience inadequate inventory or manufacturing capacity to meet such demand.
As a result of these and other unexpected factors or developments, future operating results may fall below the expectations of investors or market analysts, which would have a material adverse effect on our stock price.
We may fail to realize the anticipated benefits from future acquisitions and strategic investments.
Our future performance will depend in part on our ability to realize the anticipated benefits from acquisitions, including Endace Limited (Endace), and strategic investments, and whether we can successfully integrate, operate or partner these businesses with our existing operations in an effective and efficient manner. Integrating our operations with acquired businesses is a complex, time-consuming and expensive process and involves a number of risks and uncertainties. In addition, in order to position ourselves to take advantage of growth opportunities, we have made, and may continue to make, other strategic
13
acquisitions that involve significant risks and uncertainties. The risks and uncertainties relating to acquisitions and/or strategic investments include, but are not limited to:
• | The difficulty in integrating any newly acquired businesses and operations in an efficient and effective manner; |
• | The risk of diverting our resources and the attention of our senior management from the operations of our existing business; |
• | Additional demands on management related to the increase in the size and scope of our company following the acquisition; |
• | Complexities in creating and maintaining uniform standards, controls, procedures, and policies; |
• | Difficulties in combining corporate cultures; |
• | Difficulties in the assimilation and retention of key employees; |
• | The risks of potential disputes concerning indemnities and other obligations that could result in substantial costs; |
• | Unknown defects of an acquired company’s products or assets that may not be identified due to the inherent limitations involved in the due diligence process of an acquisition; |
• | Costs and expenses associated with any undisclosed or potential liabilities of acquired businesses; |
• | Delays, difficulties or unexpected costs in the integration, assimilation, implementation or modification of platforms, business information systems, functions, technologies and infrastructure to support the combined business, as well as maintaining uniform standards, controls (including internal accounting controls), procedures and policies; |
• | The challenges in achieving strategic objectives, cost savings and other benefits expected from any acquisitions; |
• | The risk that the financial returns on acquisitions will not support the expenditures incurred to acquire such businesses or the capital expenditures needed to develop such businesses; |
• | The risks of entering markets in which we have less experience; |
• | The risk that markets do not evolve as anticipated and the technologies acquired do not prove to be those needed to be successful in those markets; |
• | Difficulties in maintaining relationships with present and potential customers, distributors and suppliers of the acquired business; and |
• | The risk that the goodwill in the Visibility and Connectivity reporting unit could become impaired in the near term due to lower than expected revenues and profits. |
Furthermore, to complete future acquisitions or strategic investments, we may need to issue equity securities, incur additional debt, assume contingent liabilities or recognize amortization expenses and write-downs of acquired assets, which could cause our earnings per share to decline.
Third party claims of intellectual property infringement could adversely affect our business.
On occasion, we receive communications from third parties alleging patent infringement, and there is always the chance that third parties may assert infringement claims against us. As we enter into technology markets where we have not participated before, where there are entrenched incumbents, and where our entrance into the market is disruptive, such incumbents may assert infringement claims in order to deter our competition. Any such claims, with or without merit, could result in costly litigation, cause product shipment delays, result in temporary restraining orders or injunctions concerning the sale of products in certain countries, require the redesign of products to design around asserted claims, require us to indemnify or reimburse our customers, or require us to enter into royalty or licensing agreements, which may or may not be available on commercially reasonable terms. Any such claims, with or without merit, may also cause customers to be deterred from purchasing products from us. We have obtained contractual commitments from our suppliers concerning the defense and indemnification of claims relating to certain technology provided by such suppliers, but we cannot be certain that such defense and indemnification obligations will be honored by such suppliers. Furthermore, we have in the past obtained, and may be required in the future to obtain, licenses of technology owned by other parties. We cannot be certain that the necessary licenses will be available or that they can be obtained on commercially reasonable terms. We have participated in technology standardization activities which provide for licenses being available on reasonable and non-discriminatory terms, but we cannot be certain that such licenses will actually and promptly be made available to us. If we were to fail to obtain such royalty or licensing agreements in a timely manner and on reasonable terms, our business, results of operations, and financial condition could be materially adversely affected.
Broadcom Corporation (Broadcom) filed a consolidated patent infringement suit against us during fiscal 2010. After a nearly three week trial that ended October 6, 2011, the jury reached a partial verdict involving two out of the six patents. The Court determined that one of the patents (U.S. Patent 7,058,150) [the ‘150 patent] had been infringed by us, and the jury rendered an advisory verdict on October 12, 2011 to the District Court that it is not invalid, and awarded approximately $0.4 million in damages with respect to that patent. The jury reached a unanimous verdict of non-infringement on another patent relating to Emulex Fibre Channel switch products. A mistrial was declared concerning the remaining four patents for which no
14
unanimous verdict was reached. On December 15, 2011, the District Court issued judgments as a matter of law (JMOL) that the two patents, on which the jury had rendered advisory verdicts were not invalid. On December 16, 2011 the District Court issued an additional JMOL that one of the patents (U.S. Patent 7,471,691) [the‘691 patent] had been infringed by us. Effective March 30, 2014, Emulex and Broadcom entered into a Dismissal Agreement pursuant to which Emulex and Broadcom entered into certain understandings with respect to the outstanding claims relating to and arising out of the patent infringement suit. Pursuant to the terms of the Dismissal Agreement, we agreed to pay Broadcom a non-refundable, non-cancelable dismissal and standstill fee in the amount of $5 million.
See Note 10, “Commitments and Contingencies,” in the notes to the consolidated financial statements under the caption “Litigation” in Part IV, Item 15(a) of this Annual Report on Form 10-K. Also see "We are dependent on sole source and limited source third party suppliers and EMS providers for our products" elsewhere in this Item 1A - Risk Factors.
Specific risks related to the Broadcom infringement litigation, Settlement Agreement and Dismissal Agreement include:
• | Design changes (sometimes referred to as design-arounds) that may be used as alternatives for the patents for which there have been findings of infringement or for which infringement may be found, may present unforeseen technical problems for implementation, result in significant internal design costs, as well as third party non-recurring engineering costs, or may not adequately address infringement findings; |
• | Total costs related to our product redesign activities may exceed our current expectations; |
• | Our suppliers, on whom we rely for SerDes changes for chip spins, may require more time to complete redesigns which would restrict our ability to continue to sell products until redesigned products are available; |
• | There may be technical resource and equipment availability shortages impeding our ASIC component suppliers from completing chip spins, and our OEM customers and end users from completing testing of redesigned products; |
• | Our sales and support for products sold outside the United States may be affected by injunction, although such sales were previously found to be outside the scope of the suit; |
• | Our continuing support and sales for products previously provided to customers and end users may be affected by injunction, although technical support is not prohibited by the 2012 Permanent Injunction for products subject to the jury verdict award of damages, or permitted under the sunset period; |
• | The 2012 Permanent Injunction may cause our customers to exclude us from new product opportunities; |
• | Our customers may approach us and request or demand reimbursements of expenses incurred by them related to the requalification of our products, their obligations to Broadcom under licensing agreements related to appendices of the amended 2012 Permanent Injunction, or other amounts under the indemnification provisions of our supply agreements; |
• | Royalties or other payments associated with the 2012 Permanent Injunction may make our costs too high to meet market pricing requirements set by our customers; |
• | Our July 3, 2012 Settlement Agreement with Broadcom requires us to maintain certain records, as well as provide certain written notices and reports, and such activities may cause additional costs and limitations for us not borne by our competitors; |
• | Our March 30, 2014 Dismissal Agreement with Broadcom was made without prejudice to Broadcom filing future lawsuits against us or our customers or suppliers; |
• | Broadcom may choose to not assert the patents against our competitors, thus leaving us with a competitive disadvantage relative to future business that may not be borne by our competitors; |
• | The interpretation of the provisions of the 2012 Permanent Injunction may be unfavorable to us, resulting in part because of the complexity of the business practices used by our customers, including a large quantity of different customer product models, customer platforms, and design configurations, and the complexity of the supply chains, support implementations, and product distribution networks used by our customers, each of which may result in the need for further hearings before the Court; |
• | Our supply to customers in the United States may continue to be disrupted by the 2012 Permanent Injunction affecting our Ethernet based products that include our BE2 or BE3 chips (collectively referred to as the affected products); |
• | The injunction has and is expected to continue to have an adverse impact on our sales in the United States until our new redesigned products become available; |
• | The content of the 2012 Permanent Injunction, and its Appendix, may be modified by the Court in ways that are unfavorable to us; |
• | The Court may amend the Appendix to the 2012 Permanent Injunction to exclude certain device/customer product combinations; and |
• | Broadcom could file additional lawsuits against us, asserting additional claims from the same patents involved in the lawsuit, or additional patents, or file other proceedings with commissions such as the International Trade Commission. |
Lawsuits, such as the action brought by Broadcom, present inherent risks, including continuing expenses of litigation; risk of loss of patent rights and/or monetary damages; risk of injunction against the sale of products incorporating the
15
technology in question, including substantial costs and difficulties in implementing design changes and the associated customer re-qualification thereof or maintaining favorable working relationships with our suppliers of SerDes modules; counterclaims, attorneys’ fees, potential liabilities to customers under reimbursement agreements or contractual indemnification provisions, and diversion of management’s attention from other business matters. Such lawsuits and the related risks thereof could have a material adverse effect on our business, financial condition, or results of operations.
We may not be able to generate enough cash flow from our operations to service our indebtedness, and we may incur additional indebtedness in the future, which could adversely affect our business, financial condition and results of operations.
In November 2013, we issued $175.0 million aggregate principal amount of 1.75% convertible senior notes due November 15, 2018, in a private placement offering. See Note 11 “Convertible Senior Notes,” in the notes to the consolidated financial statements in Part IV, Item 15(a) of this Annual Report on Form 10-K. Our ability to make payments on and to refinance our debt will depend on our ability to generate cash in the future. This, to a certain extent, is subject to general economic, business, financial, competitive, legislative, regulatory and other factors that are beyond our control.
We cannot assure that our business will generate sufficient cash flow from operations or that future borrowings will be available to us in an amount sufficient to enable us to pay our debt or to fund our other liquidity needs. We may need to refinance all or a portion of our debt on or before maturity. We cannot assure that we will be able to refinance any of our debt on commercially reasonable terms or at all. If such financings were not available on favorable terms, our business results of operations and financial condition could be materially adversely affected.
Unsolicited takeover proposals, governance change proposals, and proxy contests may be disruptive to our business.
We received an unsolicited takeover proposal in the past from Broadcom (and related proposals to change our governance and board of directors) that resulted in a proxy contest, and there can be no assurance a third party, such as a competitor or activist investor, will not make an unsolicited takeover proposal, propose to change our governance or board of directors, or make other proposals concerning takeovers in the future. The review and consideration of any takeover proposal or proposal to change our governance or board of directors may be a significant distraction for our management and employees and could require the expenditure of significant time and resources by us.
Moreover, any unsolicited takeover proposal, proxy contest or actions by an activist investor may create uncertainty for our employees and this uncertainty may adversely affect our ability to retain key employees and to hire new talent. Any such takeover proposal, proxy contest or actions by an activist investor may also create uncertainty for our customers, suppliers and other business partners, which may cause them to terminate, or not to renew or enter into, arrangements with us. The uncertainty arising from unsolicited takeover proposals, proxy contests, or actions by an activist investor, and any related costly and time-consuming litigation may disrupt our business, which could result in an adverse effect on our operating results. Management and employee distraction related to any such takeover proposal, proxy contest or actions by an activist investor also may adversely impact our ability to optimally conduct our business and pursue our strategic objectives.
We have entered into Key Employee Retention Agreements with one of our current executive officers, and adopted a Change in Control Retention Plan, in which currently an additional 23 key employees participate. The participants of these retention arrangements may be entitled to severance payments and benefits, based on a period of between twelve months and two years, upon a termination of their employment by us without cause or by them for good reason in connection with a change of control of our company (each as defined in the applicable agreement or plan). These retention arrangements may not be adequate to allow us to retain critical employees during a time when a change in control is being proposed or is imminent.
The current macroeconomic environment continues to result in a reduction in information technology spending.
The demand for our network connectivity and visibility products has been driven by the demand for high performance networking products and solutions that support enterprise computing applications, including on-line transaction processing, data mining, data warehousing, multimedia, networking and monitoring and internet applications. The current weakness in domestic and worldwide economic conditions and related disruptions in world credit and equity markets, as well as the European debt crisis, have resulted in a global downturn in spending on information technology. If the continuing weakness and uncertainty in the global economy result in significant reductions in the demand for our products, solutions, and applications, it will adversely affect our business, results of operations, and financial condition in the near term and possibly beyond. The adverse effects of any sustained reductions in information technology spending on our operating results may be exacerbated by our research and development investments, strategic investments and merger and acquisition activity, as well as customer service and support, which we may need to continue despite any such reductions in demand.
16
Our business is highly competitive.
The markets for our products are highly competitive and are characterized by rapid technological advances, price erosion, frequent new product introductions, and evolving industry standards. Our current and potential competition consists of major domestic and international companies, some of which have substantially greater financial, technical, marketing, and distribution resources than we have. We currently compete against QLogic, Brocade and PMC Sierra, for our Fibre Channel (FC) products. For Ethernet products, we compete against the leading integrated circuits (IC) vendors including Intel, Broadcom, QLogic and Mellanox. Our competitors for combined Ethernet and FC products include Brocade and QLogic. For our visibility and recording infrastructure products, we compete against Napatech, SolarFlare, NetScout, Solera Networks, EMC NetWitness, Riverbed, Niksun, Network Instruments, WildPackets and Fluke Networks.
We expect that our markets will continue to attract new competition. Additional companies, including but not limited to our suppliers, strategic partners, Original Equipment Manufacturer (OEM) customers and emerging companies, may enter the markets in which we compete and new or stronger competitors may emerge as a result of consolidation in the marketplace. Additionally, our existing competitors continue to introduce products with improved price/performance characteristics, and we may have to do the same to remain competitive. Furthermore, competitors may introduce new products to the market before we do, and thus obtain a time-to-market advantage over us. Increased competition could result in increased price competition, reduced revenues, lower profit margins or loss of market share, any of which could have a material adverse effect on our business, results of operations, and financial condition.
A significant portion of our business depends upon the continued growth of the networking market.
The size of our potential market is largely dependent on the overall demand for network connectivity and visibility products and in particular, upon the broadening acceptance of our converged network and networking recording technologies. The market will also be dependent on the evolving technical nature of network recorders. We believe that our investment in multi-protocol solutions that address the high performance needs of the converged networking market, as well as our investments in network performance management solutions, provide the greatest opportunity for our future revenue growth and profitability. However, the market for converged networking products may not gain broader acceptance and customers may choose alternative technologies that we are not investing in, or products supplied by other companies. Interest continues for other storage networking technologies such as Internet Small Computer Systems Interface (iSCSI) and iSCSI Extensions for RDMA (iSER), which may satisfy some Input/Output (I/O) connectivity requirements through standard Ethernet adapters and software at little or no incremental cost to end users. The software only iSCSI solutions compete with our Network Connectivity Products, particularly in the low end of the market. We have also launched Converged Network Adapters (CNAs) using Fibre Channel over Ethernet (FCoE) or iSCSI protocols which may be used by the same customers impacting our network product revenues more than we anticipate.
In addition, the market for FC products may shrink as more storage subsystems adopt SAS based connectivity for external and direct attached storage devices. Furthermore, FCoE may not be adopted at the rate or extent that we anticipate, and adoption of FCoE is largely dependent on third-party vendors and end users. While the usage of FCoE has increased since its first specifications were completed in 2009, continued adoption of FCoE is dependent on continued collaboration and cooperation among information technology solutions providers. Since our products are sold as parts of integrated systems, demand for our products is driven by the demand for such integrated systems, including other companies’ complementary products. A lack of demand for these integrated systems or a lack of complementary products required for these integrated systems to be deployed could have a material adverse effect on our business, results of operations, and financial condition. Furthermore, our results of operations and financial condition could be materially adversely affected if the 10G and 40G Ethernet market grows at a slower rate than the historical high growth rate. If the converged networking market does not grow, grows more slowly than we anticipate, declines, or attracts more competitors than we expect, or if our products do not achieve continued market acceptance, our business, results of operations, and financial condition could be materially adversely affected.
A significant portion of our revenue is generated from sales to a limited number of customers, none of which are subject to exclusive or long-term contracts.
We rely almost exclusively on OEMs and sales through distribution channels for our revenue. For the fiscal year ended June 29, 2014, we derived approximately 84% of our net revenues from sales to OEM customers and approximately 13% from sales through distribution. Furthermore, as some of our sales through distribution channels consist of OEM products, OEM customers effectively generated approximately 88% of our revenue for the fiscal year ended June 29, 2014. Moreover, direct and indirect sales to our top five customers (including customer-specific models purchased or marketed indirectly through distributors, resellers and other third parties) accounted for approximately 76% of our net revenues for the fiscal year ended June 29, 2014. If we are unable to retain our current OEM and distributor customers, recruit additional or replacement customers, or timely collect amounts due from our customers, or if demand from our customers is reduced due to difficulties in their ability to acquire components or other products such as microprocessors, disk drives, switches and optical modules used in
17
conjunction with our products or in the deployments of their products, our business, results of operations, and financial condition could be materially adversely affected.
As is common in the technology industry, our agreements with OEMs and distributors are typically non-exclusive, have no volume commitments, and often may be terminated by either party without cause. It is increasingly commonplace for our OEM and distributor customers to utilize or carry competing product lines. If we were to lose business from one or more significant OEM or distributor customers to a competitor, our business, results of operations, and financial condition could be materially adversely affected. In addition, our OEMs may elect to change their business practices in ways that affect the timing of our revenues, which may materially adversely affect our business, results of operations, and financial condition. This includes transitioning to new inventory geographies or markets.
In January 2014, our largest customer announced the proposed sale of their x86-based server business to an overseas competitor. Once complete, they plan to exit this sector of the Server market. Although both companies have publicly stated the close of the proposed sale is expected to be completed during the 2014 calendar year, there are no guarantees this will occur. In advance of and during any related transition period, we may be exposed to elevated levels of demand fluctuation, forecasting uncertainty and other business risk.
Although we continue to expand our base of customers, we believe our revenues in the future will still be derived from a limited number of customers. As a result, to the extent that sales to any of our significant customers do not increase in accordance with our expectations or are reduced or delayed, or if we are unable to collect our accounts receivables from our customers, our business, results of operations, and financial condition could be materially adversely affected.
Our industry is subject to rapid technological change.
The markets for our products are characterized by rapidly changing technology, evolving industry standards, and the frequent introduction of new products and enhancements. Our future success depends in large part on our ability to enhance our existing products and to introduce new products on a timely basis to meet changes in customer preferences and evolving industry standards. Currently, new and proposed technologies such as 32 Gb/s Fibre Channel solutions; FCoE; 40GbE and 100GbE solutions; Remote Direct Memory Access (RDMA) over Converged Ethernet (RoCE) and low latency Ethernet Solutions; PCI Express Advanced Switching; 10G base T; 6 Gb/s and 12 Gb/s SAS; and Solid State Drives (SSDs) are in development by many companies and their ultimate acceptance and deployment in the market is uncertain. While we are developing some of these technologies, we cannot be sure that the technologies we chose to develop will achieve market acceptance, or that technologies that we chose not to develop will be available for purchase or license from third parties or will be immaterial to our business.
These developments or enhancements, such as the migration of our next generation products from 40nm to 28nm or lower geometry process technologies, may be late, may have technical problems, may fail to meet customer or market specifications and may not be competitive with other products using alternative technologies that offer comparable performance and functionality. We may be unable to successfully develop additional next generation products, new products or product enhancements. Our next generation products or any new products or product enhancements may not be accepted in new or existing markets. Our business will suffer if we fail to continue to develop and introduce new products or product enhancements in a timely manner or on a cost-effective basis.
Furthermore, if our products are not available in time for the qualification cycle at an OEM, we may be forced to wait for the next qualification cycle or may miss the market window. In addition, new products and enhancements developed by us may not be backwards compatible to existing equipment already installed in the market. If we are unable, for technological or other reasons, to develop new products, enhance or sell existing products, or consume raw materials in a timely and cost effective manner in response to technological and market changes, our business, results of operations, and financial condition may be materially adversely affected.
We may be unsuccessful in our expansion into new segments of the network connectivity and visibility markets, and the costs associated with our expansion may be greater than anticipated.
To remain a significant supplier of networking technologies, we will need to continue to expand the range of products and solutions offered to our current and new OEM customers. Expansion into other areas of the connectivity and visibility markets, whether by acquisition or through internal growth, and the resulting increases in expenditures to support these new areas may be greater than anticipated and we may experience potential disruptions in our expansion caused by our downsize activities. If we fail to successfully expand into new areas of the storage, server and network recording technology markets with products that we do not currently offer, or effectively address new market opportunities, we may lose market share and revenue opportunities to our competitors, including in the 25G Ethernet market. Any such loss of opportunities or any failure by us to effectively manage the costs associated with expanding into new markets may have an adverse effect on our business and financial condition.
18
Further, although most of our revenues have historically been derived from products based on FC technology, we expect that a significant portion of the future growth of our business will be driven through our offerings of converged networking solutions. We believe that our FC products and converged networking solutions will, at least initially, have similar customers and other marketing requirements that should produce certain synergies and cost savings as we expand our converged network solutions business. However, if the expansion of our converged networking solutions business does not produce the synergies and cost savings with our core FC business that we anticipate, our marketing and other business expenses relating to our converged network solutions business could be greater than anticipated and our financial condition could be adversely affected.
The timing of migration by our customers toward emerging technologies and newer product platforms varies. Any failure of our OEM customers to keep up with rapid technological change and to successfully market and sell systems that incorporate new technologies could adversely affect our business.
A significant portion of our revenues depend upon the ability and willingness of our OEM customers to commit significant resources to develop, promote, and deliver products that incorporate our technology. In addition, if our customers’ products are not commercially successful, it would have a materially adverse effect on our business, results of operations, and financial condition.
As our customers migrate from one platform to the enhanced price/performance of the next platform, we may experience reduced revenue, gross profit, or gross margin levels associated with lower average selling prices or higher relative product costs associated with improved performance. While we regularly compare forecasted demand for our products against inventory on hand and open purchase commitments, to the extent that customers migrate more quickly than anticipated, the corresponding reduction in demand for older product platforms may result in excess or obsolete inventory and related charges which could potentially have a material adverse effect on our financial condition and results of operations.
Our customers may elect to substitute low-end adapter card solutions and chip only options for use in high-end environments or applications.
We supply FC and Ethernet I/O solutions that target separate high-end, midrange and small to medium sized end users. Historically, the majority of our revenues have come from our high-end enterprise server and storage solutions. If customers elect to utilize midrange HBA and CNAs in higher-end environments or applications, or migrate to chip only solutions faster than we anticipate, our business, results of operations and financial condition could be negatively affected.
Advancement of storage device capacity technology may not allow for additional revenue growth.
Storage device density continues to improve rapidly and at some point in the future, the industry may experience a period where the advancement in technology may increase storage device capacity to a level that may equal or exceed the need for digital data storage requirements. This would result in a situation where the number of units of storage devices required in the marketplace may level out or even decrease. To the extent that growth in storage device unit demand slows or decreases, our business, financial condition and results of operations may be materially adversely affected.
Our average unit selling prices may decrease at a faster rate than we are able to realize cost reductions in our products.
We continue to experience downward pressure on the average unit selling prices of our products. Furthermore, we may provide pricing discounts to customers based upon volume purchase criteria, and achievement of such discounts may reduce our average unit selling prices. To the extent that growth in unit demand fails to offset decreases in average unit selling prices, our revenues and financial performance could materially decline. Although we have historically achieved offsetting cost reductions, our gross margins and financial performance could be materially adversely affected to the extent that average unit selling prices of our products decrease without a corresponding decrease in the costs of such products. Our gross margins could also be adversely affected by a shift in the mix of product sales to lower gross margin products. Furthermore, as our products are manufactured internationally, cost reductions would be more difficult to achieve if the value of the U.S. dollar were to deteriorate. Moreover, if the manufactured cost of our products were to increase due to inflation or other factors and we are unable to pass along such increase in our costs to our customers, our gross margins and financial performance could be materially adversely affected.
Our international business activities subject us to increased business risks.
For the fiscal year ended June 29, 2014, sales in Asia Pacific accounted for approximately 59% of our total net revenues, sales in the United States accounted for approximately 26% of our total net revenues, and sales in Europe, Middle East, Africa and the rest of the world accounted for approximately 15% of our total net revenues based on billed-to address. We expect that our sales will continue to increase outside of the United States as our customers are migrating towards using contract manufacturers located internationally, predominantly in Asia Pacific. However, because we sell to OEMs and distributors who ultimately resell our products to their customers, the geographic mix of our sales based on billed-to address may not be
19
reflective of the geographic mix of end-user demand or installations. Since the majority of our sales are currently denominated in U.S. dollars, if the value of the U.S. dollar increases relative to foreign currencies, our products could become less competitive in international markets.
In addition, as we continue to expand our international operations and with our recent acquisition of Endace, an increasing amount of our expenses are incurred in currencies other than U.S. dollars, including the India Rupee and the New Zealand Dollar. Therefore, we are required from time to time to convert currencies to meet our expense obligations for such international operations, including taxes.
Although we generally purchase our inventory in U.S. dollars, our suppliers also are increasingly located outside of the U.S., and a significant portion of our products are produced at our EMS providers’ production facilities in China, Thailand and New Zealand.
As a result, we are subject to numerous risks inherent in international operations. Our international business activities could be affected, limited or disrupted by a variety of factors, including, but not limited to:
• | Fluctuations in freight costs and potential disruptions in the transportation infrastructure for our products and components; |
• | Longer accounts receivable payment cycles; |
• | Increased travel, infrastructure, accounting, and legal compliance costs associated with multiple international locations; |
• | Difficulty in locating, hiring and retaining personnel with requisite skill sets and knowledge; |
• | Difficulty maintaining management oversight and control of remote locations; |
• | Changes in the value of local currencies relative to the U.S. dollar and other functional currencies; |
• | Costs and risks of localizing products for international countries; |
• | Import and export restrictions; |
• | Limitations on the amount and nature of foreign investment, including restrictions on the structure and/or permissible forms of investment; |
• | Imposition of or changes in governmental controls, taxes, tariffs, trade restrictions, and regulatory requirements to our current or future operations; |
• | Potential restrictions on transferring funds between countries and difficulties associated with repatriating cash generated or held outside of the U.S. in a tax-efficient manner; |
• | Taxation in multiple jurisdictions; |
• | Bureaucratic intrusions and delays, government corruption, political instability, war, and/or terrorism; and |
• | General economic and social conditions within international countries. |
All of these factors could harm future sales of our products to international customers or production of our products outside of the United States, and have a material adverse effect on our business, results of operations, and financial condition.
We may experience delays in our product development cycle and the introduction of new products.
We have experienced delays in product development in the past and may experience similar delays in the future. Such delays may result from numerous factors, which include, but are not limited to:
• | Difficulties in hiring and retaining necessary employees and independent contractors; |
• | Difficulties in reallocating engineering resources and other resource limitations; |
• | Unanticipated or lengthy redevelopment efforts to make design changes resulting from unintentional intellectual product infringement and related injunctions; |
• | Unanticipated engineering or manufacturing complexity, including complexity arising from third party suppliers of intellectual property such as foundries of our ASICs; |
• | Undetected errors or failures in our products; |
• | Changing OEM product specifications; |
• | Delays in the acceptance or shipment of products by OEM customers; and |
• | Changing market or competitive product requirements. |
We expect to continue to engage in product development alignment activities with customers, companies we have investments in or receivables from, and other third parties. These product development alignment activities can magnify several risks for us, including the loss of control over development activities and the timing of product availability. Accordingly, we face increased risk that such product development alignment activities will result in products that are not commercially successful or that are not available in a timely fashion.
Given the short product life cycles in the markets for our products and the relatively long product development cycles, any delay or unanticipated difficulty associated with new product introductions or product enhancements could have a material adverse effect on our business, results of operations, and financial condition.
20
We are dependent on sole source and limited source third party suppliers and EMS providers for our products.
We rely on third party suppliers for components and the manufacture of our products. A number of these components and products are only available from a single or limited number of suppliers. We also purchase certain components and products from single or limited suppliers and EMS providers to drive volume discounts. As a result, we have experienced delays or difficulty in securing components and finished goods in the past, as well as additional costs related to such issues. Delays or difficulty in securing components or finished goods at reasonable cost may be caused by numerous factors including, but not limited to:
• | Natural disasters, such as the significant flooding in Thailand in October 2011; |
• | Discontinued production by a supplier; |
• | Required long-term purchase commitments; |
• | Undetected errors, failures or production quality issues, including projected failures that may constitute epidemic failure rates specified in agreements with our customers or that may require us to make concessions or accommodations for continuing customer relationships; |
• | Timeliness of product delivery; |
• | Increases in manufacturing costs due to lower volumes or more complex manufacturing process; |
• | Sole sourcing of components made by a small number of suppliers, including the inability to obtain components and finished goods at reasonable cost from such sources and suppliers; |
• | Market shortages; |
• | Changes in business strategies of our suppliers and EMS providers; |
• | Financial stability and viability of our suppliers and EMS providers; |
• | Inability or unwillingness of our suppliers or EMS providers to continue their business with us; |
• | Environmental, tax or legislative changes in the location where our products are produced or delivered; |
• | Disruption in shipping channels; |
• | Labor shortages or labor strikes at our suppliers or EMS providers; |
• | Intellectual property controversies; and |
• | Difficulties associated with international operations. |
We utilize third-party EMS providers located inside and outside the United States to manufacture and test the majority of our products. These EMS providers also procure and manage most of the components used in our board and system level products. We may introduce new EMS providers and new locations into our supply chain from time to time. These transitions introduce security of supply risks as we ramp down the supply from one source and ramp up the supply from the new source. As a result of our reliance on third-party EMS providers, we may not be able to directly control product delivery schedules and the quality of our products which could have a material adverse effect on our business, results of operations, and financial condition. If our EMS providers are unable to respond in a timely fashion to changes in customer demand, we may be unable to produce enough products to respond to sudden increases in demand, resulting in lost revenues. Alternatively, in the case of order cancellations or decreases in demand, we may be liable for excess or obsolete inventory or cancellation charges resulting from contractual purchase commitments that we have with our EMS providers. We regularly provide rolling forecasts of our requirements to our EMS providers for planning purposes, pursuant to our agreements, a portion of which is binding upon us. Additionally, we are committed to accept delivery on the forecasted terms for a portion of the rolling forecast. Cancellations of orders or changes to the forecasts provided to any of our EMS providers may result in cancellation costs payable by us. In the past, we have been required to take delivery of materials from our EMS providers that were in excess of our requirements, and we have previously recognized charges and expenses related to such excess material. We expect that we will continue to incur such costs in the future.
We also purchase ASICs and field-programmable gate arrays (FPGAs) from sole source suppliers, including LSI Corporation/Avago Technologies (LSI/Avago), Marvell Technology Group Ltd., Intel Corporation, Renesas Electronics America Inc., Toshiba Corporation, Altera Corporation, and Xilinx Inc., who in turn rely on a limited number of suppliers and foundries to manufacture the ASICs and FPGAs. This creates risks in assuring the availability of such ASICs and FPGAs. While we have multiple ASIC suppliers, we sole source each of our ASICs and FPGAs, and we use the same supplier for more than one of our ASICs and FPGAs. The inability of the Company or our EMS providers to obtain these ASICs and FPGAs in sufficient quantities or in the desired time periods could delay the production and delivery of our products which, in turn, could result in lost revenue due to customer cancellations and have a material adverse effect on our business, results of operations, and financial condition.
The use of third party ASIC suppliers may also create risks relating to intellectual property controversies including the possible need to redesign ASICs provided changes by such ASIC component supplier in response to such controversies. For example, on September 14, 2009, Broadcom Corporation filed two separate patent infringement lawsuits against the Company in the U.S. District Court in the Central District of California that were subsequently amended and consolidated. The
21
consolidated lawsuit includes claims related to the use of multiple lanes of phase interpolators, clock and data recovery (CDR) circuits and other circuitry used to deserialize signals in SerDes modules included within an ASIC supplied by third party ASIC suppliers. See Note 10, “Commitments and Contingencies,” in the notes to the consolidated financial statements under the caption “Litigation” in Part IV, Item 15(a) of this Annual Report on Form 10-K. Also see “Third party claims of intellectual property infringement could adversely affect our business” elsewhere in this Item 1A — Risk Factors.
Our intellectual property protections may be inadequate.
We believe that our continued success depends primarily on continuing innovation, marketing, and technical expertise, as well as the quality of product support and customer relations. At the same time, our success is partially dependent on the proprietary technology contained in our products. We currently rely on a combination of patents, copyrights, trademarks, trade secret laws, and contractual provisions to establish and protect our intellectual property rights in our products.
We cannot be certain that the steps we take to protect our intellectual property will adequately protect our proprietary rights, that others will not independently develop or otherwise acquire equivalent or superior technology, or that we can maintain such technology as trade secrets. In addition, the laws of some of the countries in which our products are or may be developed, manufactured, or sold may not protect our products and intellectual property rights to the same extent as the laws of the United States, or at all. Furthermore, we enter into various development projects and arrangements with other companies. In some cases, these arrangements allow for the sharing or use of our intellectual property. Our failure to protect our intellectual property rights could have a material adverse effect on our business, results of operations, and financial condition. We attempt to mitigate this risk by obtaining indemnification from others, where possible.
Certain of our software (as well as that of our customers) may be derived from “open source” software that is generally made available to the public by its authors and/or other third parties. Such open source software is often made available to us under licenses, such as the GNU General Public License, which impose certain obligations on us in the event we were to distribute derivative works of the open source software. These obligations may require us to make source code for the derivative works available to the public, or license such derivative works under a particular type of license, rather than the forms of licenses customarily used to protect our intellectual property. In the event the copyright holder of any open source software were to successfully establish in court that we had not complied with the terms of a license for a particular work, we could be required to release the source code of that work to the public and/or stop distribution of that work.
We may be unable to attract, motivate or retain key managerial and technical personnel.
Our success depends to a significant degree upon the performance and continued service of key managers, as well as engineers involved in the development of our storage networking technologies and technical support of our products and customers. Competition for such highly skilled employees is intense in the communities in which we operate, as well as our industry, and we cannot be certain that we will be successful in recruiting, training, and retaining such personnel. In addition, employees may leave us and subsequently compete against us, and we may incur costs relating to their departure. Also, many of these key managerial and technical personnel receive stock-based compensation incentives as part of our employee retention initiatives. The number of shares authorized under stock based plans may be insufficient and shareholders may not approve to increase the number of authorized shares. New regulations, volatility in the stock market, and other factors could diminish the value of our stock-based compensation incentives, putting us at a competitive disadvantage and forcing us to use more cash compensation. If we are unable to attract new managerial and technical employees, or are unable to retain and motivate our current key managerial and technical employees, or are forced to use more cash compensation to retain or replace key personnel, our business, results of operations, and financial condition could be materially adversely affected.
Our stock price is volatile, which has and may result in lawsuits against us and our officers and directors.
The stock market in general and the stock prices of technology companies in particular, have experienced extreme volatility that often has been unrelated to the operating performance of any specific public company. The market price of our common stock has fluctuated in the past and is likely to continue to fluctuate in the future. For example, during the twelve month period ended June 29, 2014, the sales price of our common stock ranged from a low of $4.51 per share to a high of $8.99 per share. Factors that could have a significant impact on the market price of our stock include, but are not limited to, the following:
• | Actual or alleged intellectual property infringement; |
• | Quarterly variations in customer demand and operating results; |
• | The gain or loss of significant customers or design wins; |
• | Pricing pressures; |
• | General conditions in the computer, storage, or communications markets; |
• | Events affecting other companies that investors deem to be comparable to us; |
22
• | Announcements of new products by us or our competitors; |
• | Offers to buy us or a competitor for a premium over recent trading prices; |
• | Changes in analysts’ earnings estimates; |
• | Changes in analyst recommendations, price targets, or other parameters that may not be related to earnings estimates; |
• | Rumors or dissemination of false information; |
• | Dilution resulting from conversion of outstanding convertible senior notes into shares of our common stock; and |
• | Short selling of our common stock. |
In addition, a takeover proposal by any third party to acquire the outstanding shares of our common stock may result in further volatility in the price of our common stock. If a takeover does not occur following announcement of a takeover proposal, for any reason, the market price of our common stock may decline.
In the past, companies, including us, that have experienced volatility in the market price of their stock have been subject to securities class action litigation. If we were to be the subject of similar litigation in the future or experience unfavorable outcomes in any of our pending litigations, as discussed in Note 10 in the accompanying notes to our consolidated financial statements under the caption "Litigation" in part IV, Item 15(a) of this Annual Report on Form 10-K, it could have a material adverse effect on our business, results of operations, and financial condition. Such litigation would also divert management’s attention from other business matters.
Our results of operations could vary as a result of the methods, estimates, and judgments that we use in applying our accounting policies.
The methods, estimates, and judgments that we use in applying our accounting policies have a significant impact on our results of operations. Such methods, estimates, and judgments are, by their nature, subject to substantial risks, uncertainties, and assumptions, and factors may arise over time that lead us to change our methods, estimates, and judgments. Changes in those methods, estimates, and judgments could significantly affect our results of operations. See “Critical Accounting Policies” contained in Part II, Item 7 of this Annual Report on Form 10-K.
The final determination of our income tax liability may be materially different from our income tax provisions and accruals.
We are subject to income taxes in both the United States and international jurisdictions. Significant judgment is required in determining our worldwide provision for income taxes. In the ordinary course of our business, there are many transactions where the ultimate tax determination is uncertain. Additionally, our calculations of income taxes are based on our interpretations of applicable tax laws in the jurisdictions in which we file.
Our provision for income taxes is subject to volatility and could be adversely affected by numerous factors including:
• | Earnings being lower than anticipated in countries that have lower tax rates and higher than anticipated in countries that have higher tax rates; |
• | Changes in the allocation of income and expenses related to cost sharing arrangements, including adjustments related to changes in our corporate structure, acquisitions or tax law changes; |
• | Tax effects of increases in nondeductible compensation; |
• | Changes in transfer pricing regulations; |
• | Changes in domestic and foreign tax laws including possible U.S. changes to the taxation of earnings of foreign subsidiaries, the deductibility of expenses attributable to foreign income and changes to foreign tax credit rules; |
• | Changes in accounting rules or principles, and changes in the valuation of deferred tax assets and liabilities; |
• | Unfavorable results from income tax audits; and |
• | Expiration or lapses of federal and state research credits. |
We have adopted transfer-pricing policies between our affiliated entities. Our policies call for the licensing of intellectual property, the provision of services, and the sale of products from one affiliate to another at prices that we believe are equivalent to an arm’s length negotiated price. If the U.S. Internal Revenue Service (IRS) or the taxing authorities of any other jurisdiction were to successfully challenge our transfer pricing practices resulting in adjustments for prior or future tax years, we could become subject to higher taxes and our earnings would be adversely affected. Any redetermination of income allocations or modification of transfer pricing laws could result in an income tax assessment on the portion of income deemed to be derived from the U.S. or other taxing jurisdictions.
Although we believe our tax estimates are reasonable, there is no assurance that the final determination of our income tax liability will not be materially different than what is reflected in our income tax provisions and accruals. Significant judgment is required to determine the recognition and measurement of tax liabilities prescribed in the accounting guidance for uncertainty in income taxes. The accounting guidance for uncertainty in income taxes applies to all income tax positions, including the
23
potential recovery of previously paid taxes, which, if settled unfavorably, could adversely impact our provision for income taxes. In addition, we are subject to the continuous examination of our income tax returns by the IRS and other foreign, state and local tax authorities. We are currently under audit by the IRS for fiscal years 2008 and 2009 and an amended return for fiscal 2007, and by the California Franchise Tax Board for fiscal years 2008 and 2009. In March 2014, we received a 30-Day letter from the IRS, proposing an adjustment related to the amount of "buy-in-payments" made by one of our international subsidiaries to the Company in connection with the cost-share agreement entered into by the Company and our international subsidiary in fiscal year 2008. The incremental tax liability asserted in the 30-Day Letter is approximately $70.0 million, excluding interest and penalties. We regularly assess the likelihood of adverse outcomes resulting from these examinations to determine the adequacy of our provision for income taxes. Upon the 30th day from the issuance of the 30-Day Letter from the IRS, we began accruing additional interest and will continue to do so until resolution, which may adversely impact the Company’s tax provision, net income/(loss) and cash flows. There can be no assurance that the outcomes from these continuous examinations will not have an adverse effect on our operating results and financial condition. We regularly assess the likelihood of adverse outcomes resulting from these examinations to determine the adequacy of our provision for income taxes. There can be no assurance that the outcomes from these continuous examinations will not have an adverse effect on our operating results and financial condition.
We may not realize the full benefits of the New Zealand research and development grants.
We are entitled to reimbursement of certain New Zealand based research and development costs through various grant programs offered by the New Zealand government that were assumed as part of our acquisition of Endace. The receipt and amount of funds under these programs are subject to our satisfaction of certain terms and conditions. As of June 29, 2014, Endace has received an aggregate of approximately $6.9 million in credits to research and development expenses and approximately $1.1 million in credits related to capital expenditures pursuant to these grants. If we do not to satisfy the terms and conditions of any of these grant programs, expenses incurred in respect of the relevant research and development projects may not be approved for reimbursement, we may be required to return amounts previously paid to us under such grant programs, and further grants may not be available to us in the future.
Our corporate offices, principal product development facilities, EMS providers, suppliers and customers are located in regions that are subject to earthquakes and other natural disasters.
Our California facilities, which include our corporate offices and principal product development facilities, are located near major earthquake faults. Any disruption in our business activities, personal injury, or damage to the facilities in excess of our currently insured amounts as a result of earthquakes or other such natural disasters, could have a material adverse effect on our business, results of operations, and financial condition. In addition, natural disasters such as hurricanes, tsunamis, flooding, and earthquakes, such as the flooding in Thailand in October 2011 and the earthquake off the coast of Japan and the resulting tsunami in March 2011, could disrupt manufacturing operations of our EMS providers, component suppliers and customers or the downstream suppliers that are located in such impacted areas, resulting in lost revenue opportunities in the near term and/or long term.
We currently do not carry earthquake or flood insurance. However, we do carry various other lines of insurance that may or may not be adequate to protect our business in the case of a natural disaster.
Our certificate of incorporation and the related provisions under Delaware law could adversely affect the performance of our stock.
Provisions of our certificate of incorporation and Delaware General Corporation Law could make it more difficult for a third party to acquire us, even if doing so would be beneficial to our shareholders. In addition, although we do not currently maintain a shareholders rights plan, we have maintained such a plan in the past and it is possible that we may adopt a shareholders rights plan in the future should general business, market or other conditions, opportunities and risks arise. The provisions of our certificate of incorporation, Delaware law, and any shareholders rights plan are generally intended to encourage potential acquirers to negotiate with us and allow our Board of Directors the opportunity to consider alternative proposals in the interest of maximizing shareholder value. However, such provisions may also discourage acquisition proposals or delay or prevent a change in control, which could harm our stock price.
24
We may be subject to theft, misuse of our electronic data or cyber attacks, which could result in third-party claims and harm our business and results of operations.
We may experience attempts by others that try to gain unauthorized access through the Internet to our information technology systems, such as when they masquerade as authorized users or surreptitiously introduce software. These attempts, which might be the result of industrial or other espionage, or actions by hackers seeking to harm us, our products, or our end users. We seek to detect and investigate these security incidents and to prevent their recurrence, but in some cases we might be unaware of an incident or its magnitude and effects. The theft or unauthorized use or publication of our trade secrets and other confidential business information as a result of such cyber threats could adversely affect our competitive position and reduce marketplace acceptance of our products; the value of our investment in research and development and marketing could be reduced; and third parties might assert against us or our customers claims related to resulting losses of confidential or proprietary information or end-user data, or system reliability. Any such event could have a material adverse effect on our business, results of operations, and financial condition.
Our system of internal controls may be inadequate.
We maintain a system of internal controls in order to ensure we are able to collect, process, summarize, and disclose the information required by the Securities and Exchange Commission within the time periods specified. Any system of controls, however well designed and operated, can provide only reasonable, and not absolute, assurance that the objectives of the system are met. In addition, the design of any control system is based in part upon certain assumptions about the likelihood of future events. Due to these and other inherent limitations of control systems, there can be no assurance that any design will succeed in achieving its stated goals under all potential future conditions, regardless of how remote. Additionally, public companies in the United States are required to review their Internal Controls Over Financial Reporting (ICOFR) under the Sarbanes-Oxley Act of 2002. If our ICOFR are not adequate or fail to perform as anticipated, we may be required to restate our financial statements, receive an adverse audit opinion on the effectiveness of our internal controls, or take other actions that will divert significant financial and managerial resources, as well as subject us to fines or other government enforcement actions. Furthermore, the price of our stock could be adversely affected.
Changes in laws, regulations, and financial accounting standards may affect our reported results of operations.
As our common stock is publicly traded, we are subject to certain rules and regulations of federal, state and financial market exchange entities charged with the protection of investors and the oversight of companies whose securities are publicly traded. These entities, including the Public Company Accounting Oversight Board, SEC and NYSE, have implemented requirements and regulations and continue developing additional regulations and requirements in response to corporate scandals and laws enacted by Congress, most notably the Sarbanes-Oxley Act of 2002. Our efforts to comply with these regulations have resulted in, and are likely to continue resulting in, increased general and administrative expenses and diversion of management time and attention from revenue-generating activities to compliance activities.
A change in accounting standards or practices and varying interpretations of existing accounting pronouncements, such as the increased use of fair value measures, revenue recognition, lease accounting, financial instruments and other accounting standards, and the potential requirement that U.S. registrants prepare financial statements in accordance with International Financial Reporting Standards (IFRS), could have a significant effect on our reported financial results or the way we conduct our business. Implementation of accounting regulations and related interpretations and policies, particularly those related to revenue and expense recognition, could cause us to defer revenue recognition or accelerate the timing of expense recognition, which would adversely affect our reported financial results, and could have an adverse effect on our stock price.
As new and modified laws, regulations, and standards are subject to varying interpretations due in part to their lack of specificity, their application in practice may evolve over time as new guidance is provided by regulatory and governing bodies. This evolution may result in continuing uncertainty regarding compliance matters and additional costs necessitated by ongoing revisions to our disclosure and governance practices.
Global warming issues may cause us to alter the way we conduct our business.
The general public is becoming more aware of global warming issues, and as a result, governments around the world are beginning to focus on addressing this issue. This may result in new environmental regulations that may unfavorably impact us, our suppliers, and our customers in how we conduct our business including the design, development, and manufacturing of our products. The cost of meeting these requirements may have an adverse impact on our results of operations and financial condition.
Item 1B. Unresolved Staff Comments.
None.
25
Item 2. Properties.
Our corporate offices and principal product development facilities are currently located in approximately 180,000 square feet of buildings in Costa Mesa, California which are owned by us. In addition, we lease facilities in California, Colorado, Texas, Washington, India, and New Zealand primarily for engineering and development and approximately 10 other remote offices throughout the world, primarily for sales.
Our future facilities requirements will depend upon our business, but we believe additional space, if required, may be obtained on reasonable terms.
Item 3. Legal Proceedings.
The information set forth under Note 10, “Commitments and Contingences,” in the notes to the consolidated financial statements under the caption “Litigation” included in Part IV, Item 15(a) of this Annual Report on Form 10-K is incorporated herein by reference.
Item 4. Mine Safety Disclosures
Not applicable.
26
PART II
Item 5. Market for Registrant’s Common Equity, Related Stockholder Matters, and Issuer Purchases of Equity Securities.
Principal Market and Prices
The Company’s common stock is traded on the New York Stock Exchange under the symbol ELX. The following table sets forth the high and low per share sales prices for our common stock for the indicated periods, as reported on the New York Stock Exchange.
High | Low | ||||||
2014 | |||||||
Fourth Quarter | $ | 7.64 | $ | 4.51 | |||
Third Quarter | 7.74 | 6.93 | |||||
Second Quarter | 8.24 | 6.79 | |||||
First Quarter | 8.99 | 6.53 | |||||
2013 | |||||||
Fourth Quarter | $ | 6.82 | $ | 5.72 | |||
Third Quarter | 7.73 | 6.35 | |||||
Second Quarter | 7.45 | 6.10 | |||||
First Quarter | 7.98 | 5.85 | |||||
Number of Common Stockholders
The approximate number of holders of record of our common stock as of August 20, 2014 was 362.
Dividends
We have never paid cash dividends on our common stock and do not anticipate paying any cash dividends in the foreseeable future. We currently intend to retain our earnings for the development of our business.
Issuer Purchases of Equity Securities
In November 2013, our Board of Directors authorized a plan to repurchase up to $200.0 million of our outstanding common stock. The plan superseded the existing share repurchase program authorized in August 2008. The share repurchases are authorized to be completed through the combination of individually negotiated transactions, accelerated share buybacks and open market purchases.
On November 13, 2013, we entered an accelerated share buyback agreement ("ASB") with Goldman Sachs to repurchase an aggregate of $44.3 million of our outstanding common stock. The total number of shares subject to repurchase under the ASB was determined based on the daily volume weighted average market price of our common stock over the course of a calculation period, less a discount, and was subject to certain adjustments under the ASB. Under the ASB we paid approximately $44.3 million to Goldman Sachs on November 18, 2013 and Goldman Sachs delivered to us 4.6 million shares of common stock reflecting 80% of the $44.3 million paid. Goldman Sachs delivered to us the remaining 20%, or 1.5 million shares of common stock, upon final settlement of the ASB on April 30, 2014.
Through June 29, 2014, the Company repurchased approximately 22.5 million shares of its common stock for an aggregate purchase price of approximately $150.0 million at an average purchase price of $6.68 per share under this plan. We may repurchase additional shares under this plan from time-to-time in open market purchases or privately negotiated transactions. The share repurchases will be financed by available cash balances and cash from operations.
27
Period | Total Number of Shares Purchased | Average Price Paid per Share | Total Number of Shares Purchased as Part of Publicly Announced Plans or Programs | Approximate Dollar Value of Shares That May Yet Be Purchased Under the Plans or Programs | |||||||||
March 31, 2014 — April 27, 2014 | 277,416 | $ | 7.41 | 277,416 | $ | 94,539,525 | |||||||
April 28, 2014 — May 25, 2014 | 5,830,798 | 5.35 | 5,830,798 | $ | 72,208,582 | ||||||||
May 26, 2014 — June 29, 2014 | 4,100,995 | 5.42 | 4,100,995 | $ | 50,000,000 | ||||||||
Total | 10,209,209 | 5.43 | 10,209,209 | ||||||||||
Sales of Unregistered Securities
There were no sales of unregistered securities for the three months ended June 29, 2014. However, in November 2013, we issued an aggregate principal amount of $175.0 million in 1.75% Convertible Senior Notes due November 2018 (Convertible Senior Notes). The Convertible Senior Notes are convertible into shares of our common stock at an initial conversion rate of approximately 97.13 per share of our common stock per $1,000 principal amounts of the Convertible Senior Notes. The initial conversion price is approximately $10.30 per share of our common stock. See Note 11 "Convertible Senior Notes" in Part IV, Item 15(a) of this Annual Report on Form 10-K.
Equity Compensation Plan Information
See Part III, Item 12 — “Security Ownership of Certain Beneficial Owners and Management” of this Annual Report on Form 10-K for certain information regarding our equity compensation plans.
28
Stock Performance Graph
The graph below compares the cumulative total stockholder return on the Company’s common stock with the cumulative total return on the Standard & Poor’s 500 Index and the S&P 500 Computer Storage and Peripherals Index for the period of five fiscal years commencing June 30, 2009 and ended June 29, 2014.
COMPARISON OF FIVE-YEAR CUMULATIVE TOTAL RETURN*
EMULEX CORPORATION COMMON STOCK, S&P 500 INDEX AND
S&P 500 TECHNOLOGY HARDWARE, STORAGE AND PERIPHERALS INDEX
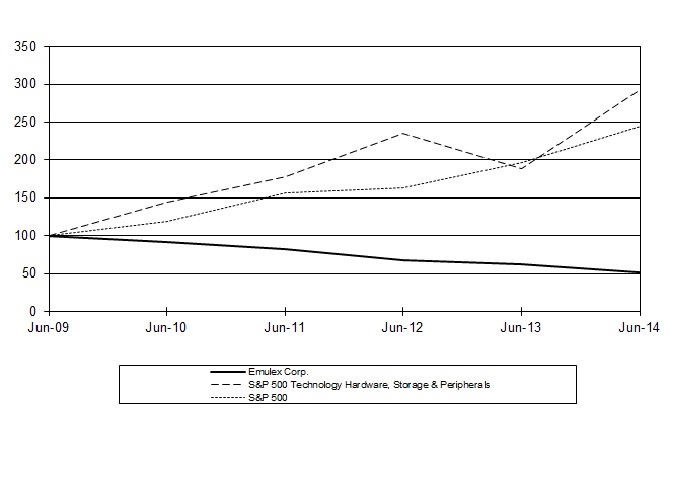
* | Assumes the value of the investment in the Company’s common stock and each index was $100 on June 30, 2009. |
Item 6. Selected Financial Data.
The following table summarizes certain selected consolidated financial data. On August 25, 2010, we completed the acquisition of ServerEngines, and on February 26, 2013, we completed the acquisition of Endace.
29
Selected Consolidated Statements of Operations Data
Year Ended | |||||||||||||||||||
June 29, 2014 | June 30, 2013 | July 1, 2012 | July 3, 2011 | June 27, 2010 | |||||||||||||||
(In thousands, except per share data) | |||||||||||||||||||
Net revenues: | |||||||||||||||||||
Network Connectivity Products | $ | 318,940 | $ | 360,974 | $ | 362,315 | $ | 346,665 | $ | 289,990 | |||||||||
Storage Connectivity & Other Products | 94,515 | 104,409 | 139,454 | 105,878 | 109,160 | ||||||||||||||
Network Visibility Products | 33,878 | 13,184 | — | — | — | ||||||||||||||
Total net revenues | 447,333 | 478,567 | 501,769 | 452,543 | 399,150 | ||||||||||||||
Cost of goods sold : | |||||||||||||||||||
Cost of goods sold | 153,994 | 173,004 | 184,593 | 167,280 | 133,554 | ||||||||||||||
Amortization of core and developed technology intangible assets | 24,916 | 21,800 | 24,031 | 33,127 | 18,904 | ||||||||||||||
Patent litigation settlement, damages, and royalties | 7,426 | 4,963 | 37,310 | — | — | ||||||||||||||
Total cost of sales | 186,336 | 199,767 | 245,934 | 200,407 | 152,458 | ||||||||||||||
Gross profit | 260,997 | 278,800 | 255,835 | 252,136 | 246,692 | ||||||||||||||
Operating expenses: | |||||||||||||||||||
Engineering and development | 155,909 | 168,446 | 163,552 | 170,845 | 126,850 | ||||||||||||||
Selling and marketing | 77,757 | 66,235 | 59,990 | 58,635 | 56,554 | ||||||||||||||
General and administrative | 41,115 | 38,893 | 35,658 | 56,133 | 50,454 | ||||||||||||||
Amortization of other intangible assets | 6,375 | 5,935 | 6,569 | 9,334 | 6,792 | ||||||||||||||
In-process research and development impairment | — | — | — | 6,000 | — | ||||||||||||||
Total operating expenses | 281,156 | 279,509 | 265,769 | 300,947 | 240,650 | ||||||||||||||
Operating (loss) income | (20,159 | ) | (709 | ) | (9,934 | ) | (48,811 | ) | 6,042 | ||||||||||
Non-operating (expense) income, net: | |||||||||||||||||||
Interest income | 26 | 34 | 97 | 96 | 286 | ||||||||||||||
Interest expense | (5,860 | ) | (24 | ) | (15 | ) | (373 | ) | (7 | ) | |||||||||
Impairment of strategic investment | — | — | — | (9,184 | ) | — | |||||||||||||
Other (expense) income, net | (193 | ) | (4,884 | ) | 350 | (575 | ) | 23 | |||||||||||
Total non-operating (expense) income, net | (6,027 | ) | (4,874 | ) | 432 | (10,036 | ) | 302 | |||||||||||
(Loss) income before income taxes | (26,186 | ) | (5,583 | ) | (9,502 | ) | (58,847 | ) | 6,344 | ||||||||||
Income tax provision (benefit) | 3,346 | (369 | ) | 1,578 | 24,763 | (17,276 | ) | ||||||||||||
Net (loss) income | $ | (29,532 | ) | $ | (5,214 | ) | $ | (11,080 | ) | $ | (83,610 | ) | $ | 23,620 | |||||
Net (loss) income per share: | |||||||||||||||||||
Basic | $ | (0.35 | ) | $ | (0.06 | ) | $ | (0.13 | ) | $ | (0.97 | ) | $ | 0.29 | |||||
Diluted | $ | (0.35 | ) | $ | (0.06 | ) | $ | (0.13 | ) | $ | (0.97 | ) | $ | 0.29 | |||||
Number of shares used in per share computations: | |||||||||||||||||||
Basic | 83,917 | 90,271 | 86,585 | 86,038 | 80,097 | ||||||||||||||
Diluted | 83,917 | 90,271 | 86,585 | 86,038 | 81,282 | ||||||||||||||
30
Selected Consolidated Balance Sheet Data
Year Ended | |||||||||||||||||||
June 29, 2014 | June 30, 2013 | July 1, 2012 | July 3, 2011 | June 27, 2010 | |||||||||||||||
(In thousands) | |||||||||||||||||||
Total current assets | $ | 281,496 | $ | 239,313 | $ | 363,238 | $ | 302,152 | $ | 417,551 | |||||||||
Total current liabilities | 67,945 | 71,586 | 102,589 | 71,242 | 60,430 | ||||||||||||||
Working capital | 213,551 | 167,727 | 260,649 | 230,910 | 357,121 | ||||||||||||||
Total assets | 717,923 | 710,709 | 712,959 | 702,839 | 689,450 | ||||||||||||||
Total debt obligations | 146,478 | — | — | — | — | ||||||||||||||
Accumulated deficit | (501,886 | ) | (472,354 | ) | (467,140 | ) | (456,060 | ) | (372,450 | ) | |||||||||
Total stockholders’ equity | 454,646 | 587,625 | 575,103 | 588,691 | 591,182 | ||||||||||||||
Item 7. Management’s Discussion and Analysis of Financial Condition and Results of Operations.
The following discussion and analysis should be read in conjunction with the “Selected Financial Data” included in Part I, Item 6, and the consolidated financial statements and the accompanying notes included in Part IV, Item 15 of this Annual Report on Form 10-K. This discussion and analysis contains certain forward-looking statements. The realization of which may be impacted by various factors including, but not limited to, the “Risk Factors” included in Part I, Item 1A of this Annual Report on Form 10-K.
Executive Overview
Emulex designs and markets high speed network connectivity, monitoring, and management products, providing solutions for global networks that support enterprise, cloud, government and telecommunications and enable end-to-end application visibility, optimization and acceleration in the data center. The world’s leading server and storage OEMs depend on our broad range of products to help build high performance, highly reliable, and scalable Fibre Channel Storage Area Networks (SAN) and Ethernet Converged Networking solutions, and our products can be found in the data centers of nearly all Fortune 1000. Our monitoring and management solutions, including our portfolio of network visibility and recording products, provide organizations with complete network performance management at speeds up to 100 Gb Ethernet.
With our acquisition of Endace, we have two business operating segments consisting of three product lines. Our Connectivity Segment consists of our legacy Emulex products and includes Network Connectivity Products (NCP) and Storage Connectivity and Other Products (SCOP). Our Visibility Segment consists of our Network Visibility Products (NVP) that were acquired through the Endace acquisition.
Customers in the NCP market use our industry standard Fibre Channel and Ethernet solutions to provide server Input/Output (I/O) and target storage array connectivity to create networks for mission-critical enterprise and cloud data centers. These products enable servers to reliably and efficiently connect to Local Area Networks (LANs), SANs, and Network Attached Storage (NAS) by offloading data communication processing tasks from the server as information is delivered and sent to the network. Our products use industry standard protocols including Fibre Channel Protocol (FCP), Internet Protocol (IP), Transmission Control Protocol (TCP)/IP, internet Small Computer System Interface (iSCSI), NAS, and Fibre Channel over Ethernet (FCoE).
Our Ethernet products include our OneConnect® Converged Network Adapters (CNAs), Local Area Network on Motherboard (LOM) application specific integrated circuits, and custom form factor solutions for OEM blade servers that enable high performance, scalable networks and convergence. Our Fibre Channel based products include LightPulse® Host Bus Adaptors (HBAs), Fibre Channel application specific integrated circuits (ASICs), and custom form factor solutions for OEM blade servers.
SCOP includes our InSpeed®, switch-on-a-chip (SOC) and backend connectivity, bridge, router products, Pilot™ Integrated Baseboard Management Controllers (iBMC), certain legacy products and other products and services. SCOP is deployed inside storage arrays, tape libraries, and other storage appliances, and connect storage controllers to storage capacity, delivering improved performance, reliability, and connectivity. SCOP uses industry standard protocols including Fibre Channel, Serial Attached Small Computer Interface (SAS), and Serial Advanced Technology Attachment (SATA), and support the broadest range of Hard Disk Drive (HDD) and Solid State Disk (SSD) technologies.
NVP consists entirely of the recently acquired Endace® family of network visibility and recording infrastructure products that address NRM for high speed networks. Our NVP products include EndaceProbe™ Intelligent Network Recorder,
31
EndaceVision™, EndaceODE™ Open Application Platform, EndaceAccess™ Network Visibility Head-End system, EndaceFlow™ NetFlow Generator Appliance and EndaceDAG Data Capture Cards.
We rely almost exclusively on OEMs and sales through distribution partners for our Networking segment revenue and sales to end-users and through distribution partners for our Visibility segment revenue. Our significant OEM customers include the world’s leading server and storage providers, including Cisco, Dell, EMC, Fujitsu, HDS, Hewlett-Packard, Hitachi, Huawei, Intel, IBM, NEC, NetApp, Oracle, and Xyratex. Our significant distributors include ASI, Avnet, BT, Digital China Technology Limited, Info X, Ingram Micro, Macnica, Netmarks, SYNNEX, Tech Data, and TED. The market for networking infrastructure solutions is concentrated among large OEMs, and as such, a significant portion of our revenues are generated from sales to a limited number of customers.
As of June 29, 2014, we had a total of 1,122 employees.
We use a 52 to 53 week fiscal year that ends on the Sunday nearest to June 30. Therefore, every fifth or sixth fiscal year will be a 53-week fiscal year. The last 53 week fiscal year was fiscal 2011.
Exit and Disposal Activities
During the fourth quarter of fiscal 2014, we recorded restructuring charges of approximately $1.1 million, primarily consisting of workforce reductions. The severance related charges are expected to be substantially paid in cash by the first quarter of fiscal 2015.
During the second quarter of fiscal 2014, we initiated a restructuring plan designed to streamline business operations and reduce operating expenses. The restructuring actions include a reduction in workforce of approximately 15%, the consolidation of certain engineering facilities, and the closure of our Bolton, Massachusetts facility. The total restructuring charge was approximately $8.1 million.
During the fourth quarter of fiscal 2013, we took certain actions with respect to our operations, primarily consisting of workforce reductions, and recorded approximately $2.7 million in severance costs during fiscal 2013, the majority of which was paid in July 2013.
See Note 8, "Restructuring," in the notes to consolidated financial statements in Part IV, Item 15(a) of this Annual Report on Form 10-K for details of the restructuring actions taken during fiscal 2014 and 2013.
Business Combinations
On February 26, 2013, we acquired 89.6% of the outstanding common stock and all of the outstanding stock options of Endace for cash consideration of approximately $110.4 million. As of April 25, 2013, we had acquired the outstanding noncontrolling interest for approximately $12.0 million and obtained 100% ownership of Endace. Our consolidated financial statements include the results of operations for Endace commencing as of the acquisition date. Emulex’s software-defined convergence architecture and Endace’s network visibility infrastructure are expected to provide customers with new and innovative ways to solve the challenges of network complexity and ensure application-level performance at speeds of 10Gb and beyond.
Endace was a New Zealand based company that was publicly traded on London AIM Stock Exchange as of February 26, 2013, and subsequently delisted effective March 27, 2013. Endace provides network visibility infrastructure including network monitoring appliances, network analytics software and ultra-high speed network access switching. Emulex’s software-defined convergence architecture and Endace’s network visibility infrastructure are expected to provide customers with new and innovative ways to solve the challenges of network complexity and ensure application-level performance at speeds of 10Gb and beyond. The ability of Endace’s network visibility technology to record, visualize and monitor network traffic provides customers with the ability to dynamically optimize application delivery across the infrastructure. The combination of Emulex’s and Endace’s technology is expected to provide customers the solutions to connect, monitor and manage high-performance networks.
Product Redesign Activities and Potential Royalty Obligations
Broadcom Corporation (Broadcom) filed a consolidated patent infringement suit against us during fiscal 2010. After a nearly three week trial that ended October 6, 2011, the jury reached a partial verdict involving two out of the six patents. The Court determined that one of the patents (U.S. Patent 7,058,150) [the ‘150 patent] had been infringed by us, and the jury rendered an advisory verdict on October 12, 2011 to the Court that it is not invalid, and awarded approximately $0.4 million in damages with respect to that patent. The jury reached a unanimous verdict of non-infringement on another patent relating to Emulex Fibre Channel switch products. A mistrial was declared concerning the remaining four patents for which no unanimous verdict was reached. On December 15, 2011, the Court issued judgments as a matter of law (JMOL) that the two patents, on
32
which the jury had rendered advisory verdicts, were not invalid. On December 16, 2011, the Court issued an additional JMOL that one of the patents (U.S. Patent 7,471,691) [the ‘691 patent] had been infringed by us. On March 16, 2012, the Court issued a decision concerning injunctive relief for the ‘150 and the ‘691 patents. The decision provided, in part, for a sunset period of 18 months relating to the ‘150 patent, starting on October 12, 2011. The decision further provided for a sunset period of 18 months relating to the ‘691 patent, starting on December 16, 2011. The sunset period allows us to sell the affected products to existing customers for specific customer devices, subject to limitations relating to when the products had been qualified and when certain firm orders had been placed. On April 3, 2012, the Court issued a permanent injunction (2012 Permanent Injunction) which, with respect to both the ‘150 and the ‘691 patents, further describes the prohibited activities, contains sunset provision terms including royalty rates and computations, limits the territory to allow sales of products that are manufactured outside the U.S. to customers located outside the U.S., permits design around efforts including modifications and design, development, and testing to eliminate infringement, and permits service and technical support for certain products.
Through June 29, 2014, we have incurred approximately $21.7 million, in mitigation, product redesign and appeal related expenses of which approximately $4.5 million, $8.6 million and $3.6 million were recorded during fiscal 2014, 2013, and 2012, respectively. The Company expects to incur incremental mitigation, product redesign, and appeal related expenses during fiscal 2015 up to $1 million, to be recorded within operating expenses. Engineering and development costs will include expenses for activities to redesign, design around, modify, design, develop, test and requalify certain of our affected products during the sunset period, and to implement our end of life processes in the U.S. for certain other affected products. Sales and marketing costs are likely to include expenses for customer support, pre-production samples, education and training, and other miscellaneous costs. In addition, we have agreed to participate in certain customer royalty obligations arising under their licensing agreements with Broadcom related to certain Emulex infringing products. Through June 29, 2014, the Company has recorded approximately $4.4 million in cost of sales related to such customer obligations, of which approximately $3.4 million and $0.9 million related to such payments were recorded to cost of sales in fiscal 2014 and 2013, respectively. The Company may incur additional amounts related to these obligations of approximately $5 million in future periods, all of which will reduce gross margins in the periods accrued.
Effective March 30, 2014, Emulex and Broadcom entered into a Dismissal and Standstill Agreement (the "Dismissal Agreement") pursuant to which Emulex and Broadcom entered into certain understandings with respect to the outstanding claims relating to and arising out of the patent infringement suit. Pursuant to the terms of the Dismissal Agreement, we agreed to pay Broadcom a non-refundable, non-cancelable dismissal and standstill fee in the amount of $5 million reflected in the accompanying financial statements in General and Administrative expense.
See Note 10 “Commitments and Contingencies,” in the notes to the consolidated financial statements under the caption “Litigation” in Part IV, Item 15(a) of this Annual Report on Form 10-K for additional information.
Results of Operations for Emulex Corporation and Subsidiaries
The following discussion and analysis should be read in conjunction with the selected consolidated financial data set forth in Item 6 — “Selected Consolidated Financial Data,” and our Consolidated Financial Statements and notes thereto included elsewhere in this Annual Report on Form 10-K. All references to years refer to our fiscal years ended June 29, 2014, June 30, 2013 and July 1, 2012, as applicable, unless the calendar year is specified. The following table sets forth certain financial data for the years indicated as a percentage of net revenues.
33
Percentage of Net Revenues | ||||||||
2014 | 2013 | 2012 | ||||||
Net revenues: | ||||||||
Network Connectivity Products | 71 | % | 75 | % | 72 | % | ||
Storage Connectivity & Other Products | 21 | 22 | 28 | |||||
Network Visibility Products | 8 | 3 | — | |||||
Total net revenues | 100 | 100 | 100 | |||||
Cost of sales: | ||||||||
Cost of goods sold | 34 | 36 | 37 | |||||
Amortization of core and developed technology intangible assets | 6 | 5 | 5 | |||||
Patent litigation settlement, damages and sunset period royalties | 2 | 1 | 7 | |||||
Total cost of sales | 42 | 42 | 49 | |||||
Gross profit | 58 | 58 | 51 | |||||
Operating expenses: | ||||||||
Engineering and development | 35 | 35 | 33 | |||||
Selling and marketing | 17 | 14 | 12 | |||||
General and administrative | 9 | 8 | 7 | |||||
Amortization of other intangible assets | 1 | 1 | 1 | |||||
Total operating expenses | 62 | 58 | 53 | |||||
Operating (loss) income | (4 | ) | — | (2 | ) | |||
Non-operating (expense) income, net: | ||||||||
Interest income | — | — | — | |||||
Interest expense | (1 | ) | — | — | ||||
Impairment of strategic investment | — | — | — | |||||
Other (expense) income, net | — | (1 | ) | — | ||||
Total non-operating (expense) income, net | (1 | ) | (1 | ) | — | |||
(Loss) income before income taxes | (5 | ) | (1 | ) | (2 | ) | ||
Income tax benefit (provision) | (1 | ) | — | — | ||||
Net (loss) income | (6 | )% | (1 | )% | (2 | )% | ||
Fiscal 2014 versus Fiscal 2013
Net Revenues. Net revenues for fiscal 2014 decreased approximately $31.2 million, or 7%, to approximately $447.3 million, compared to approximately $478.6 million in fiscal 2013.
Net Revenues by Product Line
The following chart details our net revenues by product line for fiscal 2014 and fiscal 2013:
Net Revenues by Product Line | ||||||||||||||||||||
2014 | Percentage of Net Revenues | 2013 | Percentage of Net Revenues | Increase/ (Decrease) | Percentage Change | |||||||||||||||
(Dollars in thousands) | ||||||||||||||||||||
Net revenues: | ||||||||||||||||||||
Connectivity Segment: | ||||||||||||||||||||
Network Connectivity Products | $ | 318,940 | 71 | % | $ | 360,974 | 75 | % | $ | (42,034 | ) | (12 | )% | |||||||
Storage Connectivity & Other Products | 94,515 | 21 | % | 104,409 | 22 | % | (9,894 | ) | (9 | )% | ||||||||||
Total Connectivity Segment | 413,455 | 92 | % | 465,383 | 97 | % | (51,928 | ) | (11 | )% | ||||||||||
Visibility Segment: | ||||||||||||||||||||
Network Visibility Products | 33,878 | 8 | % | 13,184 | 3 | % | 20,694 | NM | ||||||||||||
Total net revenues | $ | 447,333 | 100 | % | $ | 478,567 | 100 | % | $ | (31,234 | ) | (7 | )% | |||||||
34
Connectivity segment revenues decreased by approximately 11% in fiscal 2014 compared to fiscal 2013. The decrease in revenues was primarily due to weakness in the UNIX server and high-end storage markets.
NCP primarily consists of standup HBAs, mezzanine cards, I/O ASICs, LOMs, and UCNAs. Within NCP, Fibre Channel based product revenues accounted for the majority, ranging from 70% - 80% of total NCP revenues. Fibre Channel based product revenue decreased by approximately 16% reflecting a decrease in units shipped of approximately 13% and a decrease in average selling price of approximately 3%. The decrease in Fibre Channel based product revenues was partially offset by an increase in Ethernet based product revenues. The increase in Ethernet based product revenues of approximately 3% reflects an increase in average selling price of approximately 8% and a decrease in units shipped of approximately 5%.
SCOP primarily consists of our InSpeed®, SOC and backend connectivity, bridge and router products, iBMCs, certain legacy products and other products and services. Our SCOP revenues decreased by approximately $9.9 million, or 9%, in fiscal 2014 compared to fiscal 2013, due to products entering the end-of-life phase. Revenue from backend connectivity products decreased approximately 19% and revenue from bridging products decreased approximately 8%.
The Visibility segment resulted from our acquisition of Endace on February 26, 2013 and consists solely of NVP. NVP revenues in fiscal 2014 were approximately $33.9 million compared to $13.2 million during the four months from the acquisition date to the end of fiscal 2013, and include network visibility and intelligent network recording products.
Net Revenues by Major Customers
In addition to direct sales, some of our larger OEM customers purchase or market products indirectly through distributors, resellers or other third parties. If these indirect sales are purchases of customer-specific models, we are able to track these sales. However, if these indirect sales are purchases of our standard models, we are not able to distinguish them by OEM customer. Customers whose direct net revenues, or total direct and indirect net revenues (including customer-specific models purchased or marketed indirectly through distributors, resellers and other third parties), exceeded 10% of our fiscal year net revenues were as follows:
Net Revenues by Major Customers | |||||||||||
Direct Revenues | Total Direct and Indirect Revenues(2) | ||||||||||
2014 | 2013 | 2014 | 2013 | ||||||||
Net revenue percentage(1) | |||||||||||
OEM: | |||||||||||
EMC | — | — | 10 | % | 11 | % | |||||
Hewlett-Packard | 16 | % | 19 | % | 22 | % | 23 | % | |||
Hon Hai Precision Industry Co., Ltd. (Foxconn Technology Group)(3) | 13 | % | 12 | % | — | — | |||||
IBM | 29 | % | 32 | % | 33 | % | 35 | % | |||
(1) | Amounts less than 10% are not presented. |
(2) | Customer-specific models purchased or marketed indirectly through distributors, resellers, and other third parties are included with the OEM’s revenues in these columns rather than as revenue for the distributors, resellers or other third parties. |
(3) | Hon Hai Precision Industry Co., Ltd. is a contract manufacturer that performed manufacturing for some of our OEM customers. |
Direct sales to our top five customers accounted for approximately 65% and 71% of total net revenues for fiscal years 2014 and 2013, respectively. Direct and indirect sales to our top five customers accounted for approximately 76% and 81% of total net revenues for fiscal years 2014 and 2013, respectively. Our net revenues from customers can be significantly impacted by changes to our customers’ business and their business models.
Net Revenues by Sales Channel
Net revenues by sales channel were as follows:
35
Net Revenues by Sales Channel | ||||||||||||||||||||
2014 | Percentage of Net Revenues | 2013 | Percentage of Net Revenues | Increase/ (Decrease) | Percentage Change | |||||||||||||||
(Dollars in thousands) | ||||||||||||||||||||
OEM | $ | 374,270 | 84 | % | $ | 421,530 | 88 | % | $ | (47,260 | ) | (11 | )% | |||||||
Distribution | 57,066 | 13 | % | 50,181 | 11 | % | 6,885 | 14 | % | |||||||||||
End-users and Other | 15,997 | 3 | % | 6,856 | 1 | % | 9,141 | NM | ||||||||||||
Total net revenues | $ | 447,333 | 100 | % | $ | 478,567 | 100 | % | $ | (31,234 | ) | (7 | )% | |||||||
The decrease in OEM net revenues for fiscal 2014 compared to fiscal 2013 reflected a decrease of approximately 12% in in both NCP and SCOP revenues. The increase in distribution net revenues during 2014 compared to fiscal 2013 was primarily due to NVP net revenues generated through distribution partners, partially offset by a decrease of approximately 10% in NCP net revenues generated through distribution partners. The increase in end-users and other net revenues during fiscal 2014 compared to fiscal 2013 was primarily due to NVP net revenues generated from end-users. We believe that a majority of our net revenues are driven by product certifications and qualifications with our OEM customers, which take products directly and indirectly through distribution and contract manufacturers. Although we view product certifications and qualifications as an important indicator of future revenue opportunities and growth for the Company, they do not necessarily ensure continued market acceptance of our products by our OEM customers. It is also very difficult to determine the future impact, if any, of product certifications and qualifications on our revenues.
Net Revenues by Geographic Territory
Our net revenues by geographic territory based on billed-to location were as follows:
Net Revenues by Geographic Territory | ||||||||||||||||||||
2014 | Percentage of Net Revenues | 2013 | Percentage of Net Revenues | Increase/ (Decrease) | Percentage Change | |||||||||||||||
(Dollars in thousands) | ||||||||||||||||||||
Asia Pacific | $ | 264,771 | 59 | % | $ | 284,064 | 60 | % | $ | (19,293 | ) | (7 | )% | |||||||
United States | 114,427 | 26 | % | 121,719 | 25 | % | (7,292 | ) | (6 | )% | ||||||||||
Europe, Middle East, and Africa | 65,286 | 14 | % | 66,457 | 14 | % | (1,171 | ) | (2 | )% | ||||||||||
Rest of the world | 2,849 | 1 | % | 6,327 | 1 | % | (3,478 | ) | (55 | )% | ||||||||||
Total net revenues | $ | 447,333 | 100 | % | $ | 478,567 | 100 | % | $ | (31,234 | ) | (7 | )% | |||||||
The decrease in revenues across all territories was due to a decrease in NCP net revenues. Asia Pacific net revenues as a percentage of total revenues remained relatively consistent compared to fiscal 2013 as our OEM customers continue to migrate towards using contract manufacturers that are predominately located in Asia Pacific. However, since we sell to OEMs and distributors who ultimately resell our products to their customers, the geographic mix of our net revenues may not be reflective of the geographic mix of end-user demand or installations.
Gross Profit. Gross profit consists of net revenues less cost of sales. Our gross profit by segment for fiscal 2014 and fiscal 2013 were as follows (dollars in thousands):
Gross Profit | ||||||||||||||||||||
2014 | Gross Profit Margin | 2013 | Gross Profit Margin | Increase/(Decrease) | Percentage Change | |||||||||||||||
Connectivity | $ | 241,068 | 58 | % | $ | 272,061 | 58 | % | $ | (30,993 | ) | — | % | |||||||
Visibility | 19,929 | 59 | % | 6,739 | 51 | % | 13,190 | 8 | % | |||||||||||
Total Gross Profit | $ | 260,997 | 58 | % | $ | 278,800 | 58 | % | $ | (17,803 | ) | — | % | |||||||
Cost of sales includes the cost of producing, supporting, and managing our supply of quality finished products. Approximately $0.7 million and $1.0 million of share-based compensation expense and approximately $24.9 million and $21.8 million of amortization of technology intangible assets were included in cost of sales for fiscal 2014 and fiscal 2013, respectively. Our consolidated gross margin percentage was comparable to the prior year due to favorable product mix partially offset by an increase in royalty expense of approximately $2.5 million related to the amended 2012 Permanent Injunction.
We will continue to recognize amortization expense for technology intangible assets over their remaining useful lives, patent license fees related to the Settlement Agreement over the remaining patent license term (which expires on July 1, 2020)
36
and royalty expense and other costs related to the amended 2012 Permanent Injunction and certain customer licensing agreements with Broadcom related to the amended 2012 Permanent Injunction. We expect our consolidated and Connectivity gross margin percentage to trend downward as the portion of our revenues generated from lower margin products increases as a percentage of total revenues, primarily due to a shift within our product mix.
Engineering and Development. Engineering and development expenses consist primarily of salaries and related expenses for personnel engaged in the design, development, and support of our products. These expenses also include third-party fees paid to consultants, prototype development expenses, and computer service costs related to supporting computer tools used in the design process. Expenses for fiscal 2014 and fiscal 2013 were as follows (dollars in thousands):
Engineering and Development | ||||||||||
2014 | Percentage of Net Revenues | 2013 | Percentage of Net Revenues | Increase/ (Decrease) | Percentage Points Change | |||||
$155,909 | 35% | $168,446 | 35% | $(12,537) | —% | |||||
Engineering and development expenses for fiscal 2014 compared to fiscal 2013 decreased by approximately $12.5 million, or 7%. Approximately $5.6 million and $9.8 million of share-based compensation expense was included in engineering and development costs for fiscal 2014 and fiscal 2013, respectively. New product development decreased by approximately $7.9 million in fiscal 2014 compared to the prior year. Additionally, salary and related expenses decreased approximately $2.6 million due to a reduction in headcount. During fiscal 2014, we recorded approximately $5.7 million in severance costs, which were offset by cost reductions previously taken and efforts to controls costs.
Selling and Marketing. Selling and marketing expenses consist primarily of salaries, commissions, and related expenses for personnel engaged in the marketing and sales of our products, as well as samples, trade shows, product literature, promotional support costs, and other advertising related costs. Expenses for fiscal 2014 and fiscal 2013 were as follows (dollars in thousands):
Selling and Marketing | ||||||||||
2014 | Percentage of Net Revenues | 2013 | Percentage of Net Revenues | Increase/ (Decrease) | Percentage Points Change | |||||
$77,757 | 17% | $66,235 | 14% | $11,522 | 3% | |||||
Selling and marketing expenses for fiscal 2014 increased approximately $11.5 million, or 17%, compared to fiscal 2013. Approximately $3.9 million and $3.6 million of share-based compensation expense was included in selling and marketing costs for fiscal 2014 and fiscal 2013, respectively. Salary and related expenses and commissions increased approximately $6.8 million and $2.4 million, respectively, primarily due to the acquisition of Endace in February 2013 and approximately $1.5 million of severance costs. Further, pre-production samples increased approximately $2.0 million related to our mitigation activities for the 2012 Permanent Injunction.
General and Administrative. Ongoing general and administrative expenses consist primarily of salaries and related expenses for executives, financial accounting support, human resources, administrative services, professional fees, and other corporate expenses. Expenses for fiscal 2014 and fiscal 2013 were as follows (dollars in thousands):
General and Administrative | ||||||||||
2014 | Percentage of Net Revenues | 2013 | Percentage of Net Revenues | Increase/ (Decrease) | Percentage Points Change | |||||
$41,115 | 9% | $38,893 | 8% | $2,222 | 1% | |||||
General and administrative expenses for fiscal 2014 compared to fiscal 2013 increased approximately $2.2 million, or 6%. Approximately $5.1 million and $7.4 million of share-based compensation expense was included in general and administrative costs for fiscal 2014 and fiscal 2013, respectively. General and administrative expenses increased due to the $5 million dismissal and standstill fee payable to Broadcom pursuant to the Dismissal Agreement. See Note 10, "Commitments and Contingencies," in the notes to consolidated financial statements in Part IV, Item 15(a) of this Annual Report on Form 10-K. In addition, rent expense increased approximately $2.8 million due to approximately $0.7 million in contract termination costs, the expansion of facilities in India, and the full year impact of the Endace acquisition. The increase in general and administrative expenses was partially offset by a decrease of approximately $3.0 million in legal and accounting fees related to the acquisition of Endace acquisition in the prior year.
Amortization of Other Intangible Assets. Amortization of other intangible assets consists of amortization of intangible assets such as patents, customer relationships, and tradenames with estimable lives. Our amortization expense for fiscal 2014 and fiscal 2013 was as follows (dollars in thousands):
37
Amortization of Other Intangible Assets | ||||||||||
2014 | Percentage of Net Revenues | 2013 | Percentage of Net Revenues | Increase/ (Decrease) | Percentage Points Change | |||||
$6,375 | 1% | $5,935 | 1% | $440 | —% | |||||
Amortization of other intangible assets for fiscal 2014 compared to fiscal 2013 increased by approximately $0.4 million, or 7%. The increase was primarily due to an increase in amortization of other intangibles assets associated with assets acquired from Endace, partially offset by a decrease due to a lower unamortized intangible assets balance at the beginning of fiscal 2014 as a result of certain intangible assets being fully amortized in fiscal 2013.
Non-operating (Expense) Income, net. Non-operating (expense) income, net, consists primarily of interest income, interest expense, and other non-operating income and expense items. Our non-operating (expense) income, net for fiscal 2014 and fiscal 2013 was as follows (dollars in thousands):
Non-operating (Expense) Income, Net | ||||||||||
2014 | Percentage of Net Revenues | 2013 | Percentage of Net Revenues | (Increase)/ Decrease | Percentage Points Change | |||||
$(6,027) | (1)% | $(4,874) | (1)% | $(1,153) | —% | |||||
Our non-operating (expense) income, net, for fiscal 2014 compared to fiscal 2013 increased by approximately $1.2 million primarily due to interest expense and amortization of issuance costs and debt discount of approximately $5.8 million related to the Convertible Senior Notes issued in November 2013 (see Note 11, "Convertible Senior Notes," in the notes to consolidated financial statements in Part IV, Item 15(a) of this Annual Report on Form 10-K) offset by a non-recurring foreign exchange transaction loss in the prior year of approximately $4.7 million related to the cash consideration paid to acquire Endace.
Income taxes. Our income tax provision for fiscal 2014 and fiscal 2013 was as follows (dollars in thousands):
Income Taxes | ||||||||||
2014 | Percentage of Net Revenues | 2013 | Percentage of Net Revenues | Increase/ (Decrease) | Percentage Points Change | |||||
$3,346 | (1)% | $(369) | —% | $3,715 | (1)% | |||||
Income tax expense for fiscal 2014 was approximately $3.3 million, compared to income tax benefit of approximately $0.4 million. We generate the majority of our taxable earnings in countries other than the U.S., our tax expense and effective tax rates reflect the mix of our earnings and losses in our U.S. and various international jurisdictions, including India, Ireland, Isle of Man and New Zealand, as well as our valuation allowance recorded against our U.S. deferred tax assets. The change in our effective tax rate between years was primarily driven by tax expense of $3.2 million related to taxable unrealized currency exchange gain resulting from outstanding inter-company loans and a tax expense of $1.2 million related to nondeductible interest from our issuance of convertible debt. This tax expense was partially offset by a reduction to our tax expense of approximately $0.9 million related to uncertain tax positions being effectively settled during the fiscal year. We may recognize taxable income/loss on the unrealized foreign exchange gains/losses on our intercompany loans for tax reporting purposes in the future. We have made no provision for U.S. income taxes or foreign withholding taxes on the earnings of our foreign subsidiaries as these amounts are intended to be indefinitely reinvested in operations outside the U.S. We also do not forecast discrete events, such as a settlement of tax audits with governmental authorities or changes in tax laws, due to their inherent uncertainty.
Fiscal 2013 versus Fiscal 2012
Net Revenues. Net revenues for fiscal 2013 decreased approximately $23.2 million, or 5%, to approximately $478.6 million, compared to approximately $501.8 million in fiscal 2012.
38
Net Revenues by Product Line
The following chart details our net revenues by product line for fiscal years 2013 and 2012:
Net Revenues by Product Line | ||||||||||||||||||||
2013 | Percentage of Net Revenues | 2012 | Percentage of Net Revenues | Increase/ (Decrease) | Percentage Change | |||||||||||||||
(Dollars in thousands) | ||||||||||||||||||||
Net revenues: | ||||||||||||||||||||
Connectivity Segment: | ||||||||||||||||||||
Network Connectivity Products | $ | 360,974 | 75 | % | $ | 362,315 | 72 | % | $ | (1,341 | ) | — | % | |||||||
Storage Connectivity & Other Products | 104,409 | 22 | % | 139,454 | 28 | % | (35,045 | ) | (25 | )% | ||||||||||
Total Connectivity Segment | 465,383 | 97 | % | 501,769 | 100 | % | (36,386 | ) | (7 | )% | ||||||||||
Visibility Segment: | ||||||||||||||||||||
Network Visibility Products | 13,184 | 3 | % | — | — | % | 13,184 | NM | ||||||||||||
Total net revenues | $ | 478,567 | 100 | % | $ | 501,769 | 100 | % | $ | (23,202 | ) | (5 | )% | |||||||
Networking segment revenues decreased by approximately 7% in fiscal 2013 compared to fiscal 2012. The decrease in revenues was primarily due to continuing weakness in the server and storage technology markets resulting from continuing concern over the global macroeconomic climate.
Fibre Channel based product revenues, which accounted for approximately 70% - 80% of total NCP revenues for fiscal 2013 and fiscal 2012 increased by approximately 2% primarily an increase in units shipped of approximately 8% partially offset by a decrease in average selling price of approximately 7% in fiscal 2013 compared to fiscal 2012. Ethernet based product revenues decreased by approximately 8% primarily due to a decrease in units shipped of approximately 29%, arising principally from lower customer demand for 10Gb LOM products as customers consumed residual inventory purchased in fiscal 2012, as well as the impact of the 2012 Permanent Injunction. This decrease was partially offset by an increase in average selling price of approximately 16% due to a change in product mix.
Our SCOP revenues decreased by approximately $35.1 million, or 25%, in fiscal 2013 compared to fiscal 2012. This decrease was primarily due to a decline in backend connectivity product shipments due to last-time buys of certain products reaching end of life during fiscal 2012.
The Visibility segment resulted from our acquisition of Endace on February 26, 2013 and consists solely of NVP. NVP revenues in fiscal 2013 were approximately $13.2 million during the four months since the acquisition date compared to no revenues in fiscal 2012, and include network visibility and intelligent network recording products.
Net Revenues by Major Customers
In addition to direct sales, some of our larger OEM customers purchase or market products indirectly through distributors, resellers or other third parties. If these indirect sales are purchases of customer-specific models, we are able to track these sales. However, if these indirect sales are purchases of our standard models, we are not able to distinguish them by OEM customer. Customers whose direct net revenues, or total direct and indirect net revenues (including customer-specific models purchased or marketed indirectly through distributors, resellers and other third parties), exceeded 10% of our fiscal year net revenues were as follows:
Net Revenues by Major Customers | |||||||||||
Direct Revenues | Total Direct and Indirect Revenues (2) | ||||||||||
2013 | 2012 | 2013 | 2012 | ||||||||
Net revenue percentage(1) | |||||||||||
OEM: | |||||||||||
EMC | — | — | 11 | % | — | ||||||
Hewlett-Packard | 19 | % | 22 | % | 23 | % | 24 | % | |||
Hon Hai Precision Industry Co., Ltd. (Foxconn Technology Group)(3) | 12 | % | — | — | — | ||||||
IBM | 32 | % | 32 | % | 35 | % | 37 | % | |||
(1) | Amounts less than 10% are not presented. |
39
(2) | Customer-specific models purchased or marketed indirectly through distributors, resellers, and other third parties are included with the OEM’s revenues in these columns rather than as revenue for the distributors, resellers or other third parties. |
(3) | Hon Hai Precision Industry Co., Ltd. is a contract manufacturer that performed manufacturing for some of our OEM customers. |
Direct sales to our top five customers accounted for approximately 71% and 70% of total net revenues for fiscal years 2013 and 2012, respectively. Direct and indirect sales to our top five customers accounted for approximately 81% of total net revenues for both fiscal years 2013 and 2012. Our net revenues from customers can be significantly impacted by changes to our customers’ business and their business models.
Net Revenues by Sales Channel
Net revenues by sales channel were as follows:
Net Revenues by Sales Channel | ||||||||||||||||||||
2013 | Percentage of Net Revenues | 2012 | Percentage of Net Revenues | Increase/ (Decrease) | Percentage Change | |||||||||||||||
(Dollars in thousands) | ||||||||||||||||||||
OEM | $ | 421,530 | 88 | % | $ | 455,141 | 91 | % | $ | (33,611 | ) | (7 | )% | |||||||
Distribution | 50,181 | 11 | % | 46,385 | 9 | % | 3,796 | 8 | % | |||||||||||
End-users and Other | 6,856 | 1 | % | 243 | — | % | 6,613 | NM | ||||||||||||
Total net revenues | $ | 478,567 | 100 | % | $ | 501,769 | 100 | % | $ | (23,202 | ) | (5 | )% | |||||||
The decrease in OEM net revenues for fiscal 2013 compared to fiscal 2012 reflected a decrease of approximately 25% in SCOP revenues. The increase in distribution net revenues during 2013 compared to fiscal 2012 was primarily due to NVP net revenues generated through distribution partners, partially offset by a decrease of approximately 4% in NCP net revenues generated through distribution partners. The increase in end-users and other net revenues during fiscal 2013 compared to fiscal 2012 was primarily due to NVP net revenues generated from end-users.
Net Revenues by Geographic Territory
Our net revenues by geographic territory based on billed-to location were as follows:
Net Revenues by Geographic Territory | ||||||||||||||||||||
2013 | Percentage of Net Revenues | 2012 | Percentage of Net Revenues | Increase/ (Decrease) | Percentage Change | |||||||||||||||
(Dollars in thousands) | ||||||||||||||||||||
Asia Pacific | $ | 284,064 | 60 | % | $ | 286,572 | 57 | % | $ | (2,508 | ) | (1 | )% | |||||||
United States | 121,719 | 25 | % | 137,504 | 28 | % | (15,785 | ) | (11 | )% | ||||||||||
Europe, Middle East, and Africa | 66,457 | 14 | % | 76,394 | 15 | % | (9,937 | ) | (13 | )% | ||||||||||
Rest of the world | 6,327 | 1 | % | 1,299 | — | % | 5,028 | NM | ||||||||||||
Total net revenues | $ | 478,567 | 100 | % | $ | 501,769 | 100 | % | $ | (23,202 | ) | (5 | )% | |||||||
We believe the decrease in the percentage of revenue in the United States and Europe, Middle East and Africa continues to be driven by the continuing migration of our OEM customers’ production to contract manufacturers predominately located in Asia Pacific. We expect this trend to continue. However, since we sell to OEMs and distributors who ultimately resell our products to their customers, the geographic mix of our net revenues may not be reflective of the geographic mix of end-user demand or installations.
Gross Profit. Our gross profit by segment for fiscal 2013 and fiscal 2012 were as follows (dollars in thousands):
Gross Profit | ||||||||||||||||||||
2013 | Gross Profit Margin | 2012 | Gross Profit Margin | Increase/(Decrease) | Percentage Change | |||||||||||||||
Connectivity | $ | 272,061 | 58 | % | $ | 255,835 | 51 | % | $ | 16,226 | 7 | % | ||||||||
Visibility | 6,739 | 51 | % | — | — | 6,739 | NM | |||||||||||||
Total Gross Profit | $ | 278,800 | 58 | % | $ | 255,835 | 51 | % | $ | 22,965 | 7 | % | ||||||||
40
Cost of sales includes the cost of producing, supporting, and managing our supply of quality finished products. Approximately $1.0 million and $1.3 million of share-based compensation expense and approximately $21.8 million and $24.0 million of amortization of technology intangible assets were included in cost of sales for fiscal 2013 and fiscal 2012, respectively. Of these amounts, approximately $1.2 million of amortization of technology intangible assets in fiscal 2013 related to Endace. The increase in our gross profit was primarily due to the non-recurrence of certain one-time expenses incurred during fiscal 2012 that are discussed further below.
During fiscal 2013, we recorded sunset period royalty and patent license fee amortization expenses of $5.0 million related to the Settlement Agreement entered into with Broadcom on July 3, 2012 compared to $37.3 million in fiscal 2012. The $37.3 million was comprised of $36.8 million patent litigation settlement expense, $0.4 million patent litigation damages and $0.1 million of sunset royalty expense. During fiscal 2012, we also incurred approximately $2.3 million of additional expedite and freight charges in connection with our activities to mitigate the impact of the October 2011 flooding in Thailand that affected one of our contract manufacturers. The additional expenses in fiscal 2012 were partially offset by higher volume and favorable product mix during each year. We will continue to recognize license fee amortization related to the Settlement Agreement entered into with Broadcom on July 3, 2012, over the remaining nine year patent license term and increased royalty expense related to the amended injunction during fiscal 2014. We also expect the trend toward increased sales of lower margin products to continue in the future.
Engineering and Development. Engineering and development expenses for fiscal 2013 and fiscal 2012 were as follows (dollars in thousands):
Engineering and Development | ||||||||||
2013 | Percentage of Net Revenues | 2012 | Percentage of Net Revenues | Increase/ (Decrease) | Percentage Points Change | |||||
$168,446 | 35% | $163,552 | 33% | $4,894 | 2% | |||||
Engineering and development expenses for fiscal 2013 compared to fiscal 2012 increased by approximately $4.9 million, or 3%. Approximately $9.8 million and $11.9 million of share-based compensation expense were included in engineering and development costs for fiscal 2013 and fiscal 2012, respectively. Engineering and development expenses increased due to increased salary and related expenses of approximately $5.9 million related to headcount and severance costs of approximately $1.7 million. Product redesign expenses also increased by approximately $4.7 million related to our mitigation activities for the 2012 Permanent Injunction. The year over year increase was partially offset by a decrease in outside services and consulting of approximately $2.9 million as well as lower tool and software license costs resulting from optimized usage and improved pricing.
Selling and Marketing. Selling and marketing expenses for fiscal 2013 and fiscal 2012 were as follows (dollars in thousands):
Selling and Marketing | ||||||||||
2013 | Percentage of Net Revenues | 2012 | Percentage of Net Revenues | Increase/ (Decrease) | Percentage Points Change | |||||
$66,235 | 14% | $59,990 | 12% | $6,245 | 2% | |||||
Selling and marketing expenses for fiscal 2013 increased approximately $6.2 million, or 10%, compared to fiscal 2012. Approximately $3.6 million of share-based compensation expense was included in selling and marketing costs for both fiscal 2013 and fiscal 2012. Salary and related expenses increased by approximately $5.5 million due to an increase in headcount, partially due to the Endace acquisition in February 2013. Also included in the increase in salary and related expenses was $0.6 million of severance costs. Further, selling and marketing expenses increased due to increases of approximately $1.3 million in performance-based compensation, approximately $0.7 million in travel expenses, approximately $0.6 million in depreciation expense and approximately $0.4 million in outside services. The net increase in selling and marketing expenses was partially offset by a decrease in advertising costs of approximately $3.5 million.
General and Administrative. General and administrative expenses for fiscal 2013 and fiscal 2012 were as follows (dollars in thousands):
General and Administrative | ||||||||||
2013 | Percentage of Net Revenues | 2012 | Percentage of Net Revenues | Increase/ (Decrease) | Percentage Points Change | |||||
$38,893 | 8% | $35,658 | 7% | $3,235 | 1% | |||||
General and administrative expenses for fiscal 2013 compared to fiscal 2012 increased approximately $3.2 million, or 9%. Approximately $7.4 million and $5.4 million of share-based compensation expense were included in general and
41
administrative costs for fiscal 2013 and fiscal 2012, respectively. Included in general and administrative expenses was an increase of approximately $3.0 million in legal and accounting costs related to the Endace acquisition and an increase of approximately $1.4 million in other legal and consulting expenses, partially offset by a decrease of approximately $3.5 million in litigation costs related to our ongoing patent litigation dispute with Broadcom. Salary and related expenses increased by approximately $1.0 million compared to fiscal 2012, due to an increase in headcount, primarily related to the acquisition of Endace in February 2013.
Amortization of Other Intangible Assets. Amortization of other intangible assets expense for fiscal 2013 and fiscal 2012 was as follows (dollars in thousands):
Amortization of Other Intangible Assets | ||||||||||
2013 | Percentage of Net Revenues | 2012 | Percentage of Net Revenues | Increase/ (Decrease) | Percentage Points Change | |||||
$5,935 | 1% | $6,569 | 1% | $(634) | —% | |||||
Amortization of other intangible assets for fiscal 2013 compared to fiscal 2012 decreased by approximately $0.6 million, or 10%. The decrease was primarily due to a lower unamortized intangible assets balance at the beginning of fiscal 2013 as a result of certain intangible assets being fully amortized in fiscal 2012. The decrease was partially offset by an increase of approximately $0.4 million in amortization of other intangibles assets associated with assets acquired from Endace.
Non-operating (Expense) Income, net. Our non-operating (expense) income, net for fiscal 2013 and fiscal 2012 was as follows (dollars in thousands):
Non-operating (Expense) Income, Net | ||||||||||
2013 | Percentage of Net Revenues | 2012 | Percentage of Net Revenues | Increase/ (Decrease) | Percentage Points Change | |||||
$(4,874) | (1)% | $432 | —% | $(5,306) | (1)% | |||||
Our non-operating (expense) income, net, for fiscal 2013 compared to fiscal 2012 decreased by approximately $5.3 million primarily due to a non-recurring foreign exchange transaction loss of approximately $4.7 million related to the cash changes in the value of the British Pound Sterling (GBP) relative to the U.S. Dollar (USD) between the date the funds to acquire Endace were converted to GBP and the dates the funds were disbursed.
Income taxes. Our income tax provision for fiscal 2013 and fiscal 2012 was as follows (dollars in thousands):
Income Taxes | ||||||||||
2013 | Percentage of Net Revenues | 2012 | Percentage of Net Revenues | Increase/ (Decrease) | Percentage Points Change | |||||
$(369) | —% | $1,578 | —% | $(1,947) | —% | |||||
Our effective tax expense/(benefit) rate was approximately (7%) and 17% for fiscal 2013 and fiscal 2012, respectively. The change in our effective tax expense rate for fiscal 2013 compared to fiscal 2012 was primarily due to the continuing impact of our previously recorded U.S. deferred tax asset valuation allowance, the impact of our fiscal 2013 U.S. losses that will be carried back to prior tax years, and changes in the mix of earnings in international versus U.S. tax jurisdictions. We continue to generate the majority of our taxable earnings in countries other than the U.S., including India, Ireland, and Isle of Man, where such earnings are generally subject to significantly lower tax rates than the U.S. We expect this trend to continue in the future. We have made no provision for U.S. income taxes or foreign withholding taxes on the earnings of our foreign subsidiaries as these amounts are intended to be indefinitely reinvested in operations outside the U.S.
As a result of the global scope of our operations and the complexity of global tax and transfer pricing rules and regulations, the tax liabilities in each of the countries in which we operate may differ materially from our estimates and impact our expected tax rate in the future. In addition, our future effective tax rate may be
impacted by other items including newly enacted tax legislation, stock-based compensation, uncertain tax positions and examinations by various tax authorities.
Critical Accounting Policies
The preparation of our consolidated financial statements requires estimation and judgment that affect the reported amounts of net revenues, expenses, assets, and liabilities in accordance with accounting principles generally accepted in the United States. We base our estimates on historical experience and on various other assumptions that we believe to be reasonable under the circumstances and which form the basis for making judgments about the carrying values of assets and liabilities at the date of the financial statements and the reported amounts of revenues and expenses for the periods presented. Critical accounting policies are defined as those that are reflective of significant judgments and uncertainties.
42
Changes in judgments and uncertainties relating to these estimates could potentially result in materially different results under different assumptions and conditions. If these estimates differ significantly from actual results, the impact to the consolidated financial statements may be material. We believe that the critical accounting policies that are the most significant for purposes of fully understanding and evaluating our reported financial results include the following:
Inventories. Inventories are stated at the lower of cost, on a first-in, first-out basis, or market. We use a standard cost system to determine cost. The standard costs are adjusted periodically to represent actual cost. We regularly compare forecasted demand against inventory on hand and open purchase commitments in an effort to ensure that the carrying value of inventory does not exceed net realizable value. Accordingly, we may have to reduce the carrying value of excess and obsolete inventory if forecasted demand decreases.
Intangible Assets and Other Long-Lived Assets. Intangible assets resulting from acquisitions or licensing agreements are carried at cost less accumulated amortization and impairment charges, if any. For assets with determinable useful lives, amortization is computed using the straight-line method over the estimated economic lives of the respective intangible assets, ranging from one to twelve years. Acquired in-process research and development (IPR&D) is recorded at fair value as an indefinite-lived intangible asset at the acquisition date until the completion or abandonment of the associated research and development efforts or impairment. IPR&D projects relate to in-process projects that have not reached technological feasibility as of the acquisition date and have no alternative future use. Upon completion of development, acquired in-process research and development assets are transferred to finite-lived intangible assets and amortized over their useful lives.
We assess whether our intangible assets and other long-lived assets should be tested for recoverability whenever events or circumstances indicate that their carrying value may not be recoverable. The amount of impairment, if any, is measured based on fair value, which is determined using projected discounted future operating cash flows. Assets to be disposed of are reported at the lower of the carrying amount or fair value less selling costs.
Goodwill. Goodwill is recorded as the difference, if any, between the aggregate consideration paid for an acquisition and the fair value of the acquired net tangible and intangible assets. Goodwill is not amortized, but instead, is tested at least annually for impairment, or more frequently when events or changes in circumstances indicate that goodwill might be impaired. In assessing goodwill impairment for each of its reporting units, we have the option to first assess the qualitative factors to determine whether the existence of events or circumstances leads to a determination that the fair value of such reporting unit is less than its carrying amount. The Company’s qualitative assessment of the recoverability of goodwill considers various macro-economic, industry-specific and company-specific factors. These factors include: (i) severe adverse industry or economic trends; (ii) significant company-specific actions, including exiting an activity in conjunction with restructuring of operations; (iii) current, historical or projected deterioration of the Company’s financial performance; or (iv) a sustained decrease in the Company’s market capitalization below its net book value. If, after assessing the totality of events or circumstances, we determine it is unlikely that the fair value of such reporting unit is less than its carrying amount, then performing the two-step impairment test is unnecessary. However, if we conclude otherwise, then we are required to perform the first step of the two-step impairment test by comparing the fair value of the reporting unit with its carrying amount, including goodwill. If the fair value of the reporting unit exceeds its carrying amount, goodwill is not considered impaired; otherwise, goodwill is considered impaired and the loss is measured by performing step two. Under step two, the impairment loss is measured by comparing the implied fair value of the reporting unit goodwill with the carrying amount of goodwill. We also have the option to bypass the qualitative assessment and proceed directly to performing the first step of the two-step goodwill impairment test. We may resume performing the qualitative assessment in any subsequent period.
Fair value of our reporting units is determined using the market approach, the income approach, or a combination thereof. Under the market approach, fair value is based on peer multiples and applying an appropriate control premium. The control premium used in the market approach or a combined approach is determined by considering control premiums offered as part of acquisitions that have occurred in the reporting units’ comparable market segments. Under the income approach, fair value is dependent on a discounted cash-flow analysis. The material assumptions used in performing the discounted cash-flow analysis include our operating forecasts, which are based on historical data, various internal estimates, and a variety of external sources, and are developed as part of our regular long-range planning process, as well as revenue growth rates, terminal value and risk-commensurate discount rates. The discount rates are based on estimates of a market weighted-average cost-of-capital for the reporting unit, as well as a specific assessment of the risk inherent in the respective reporting units, and were estimated to be 19% for the Connectivity reporting unit and 21% for the Visibility reporting unit. The Company based its fair value estimates on assumptions it believes to be reasonable, but are inherently uncertain.
The annual impairment test is performed during the fourth fiscal quarter. Our recent impairment test indicated that our Connectivity reporting unit’s fair value exceeded its carrying value by approximately 6%, or $31.3 million and our Visibility reporting unit's fair value exceeded its carrying value by approximately 7%, or $8.0 million.
43
The following table summarizes the approximate impact that a change in these principal key assumptions would have on the estimated fair value of the Connectivity reporting unit, leaving all other assumptions unchanged:
Excess/(Shortfall) of Fair Value over Carrying Value | ||||
Change | (in thousands) | |||
Discount rate | ± 1% | $22,000 - $41,000 | ||
Terminal value multiplier | ± 1% | $38,000 - $24,000 | ||
The following table summarizes the approximate impact that a change in principal key assumptions would have on the estimated fair value of the Visibility reporting unit, leaving all other assumptions unchanged:
Excess/(Shortfall) of Fair Value over Carrying Value | ||||
Change | (in thousands) | |||
Discount rate | ± 1% | $1,000 - $14,000 | ||
Revenue growth projections | ± 1% | $14,000 - $2,000 | ||
Terminal value exit multiple | ± 0.5x | $13,000 - $2,000 | ||
As part of our annual test, we compare the aggregate fair value of our reporting units to the fair value of the Company as a whole based on our market capitalization. Assumptions and estimates about fair values of our goodwill are complex and subjective. They can be affected by a variety of factors, including external factors such as industry and economic trends, and internal factors such as changes in our business strategy and out internal forecasts. Our ongoing consideration of all factors described previously could result in material impairment charges in the future. Although our annual test resulted in no impairment, given the recent volatility of our market capitalization, the inherent uncertainty in forecasts, and the fact that the fair value of each reporting unit did not exceed it carrying value by a substantial margin, it is possible that our goodwill could become impaired in the near term. See Note 6, “Goodwill and Intangible Assets, Net,” in the accompanying notes to consolidated financial statements included in Part IV, Item 15(a) of this Annual Report on Form 10-K for additional information.
Income Taxes. We account for income taxes using the asset and liability method, under which we recognize deferred tax assets and liabilities for the future tax consequences attributable to temporary differences between the financial statement carrying amounts of existing assets and liabilities and their respective tax bases and for net operating loss and tax credit carryforwards. Tax positions that meet a more-likely-than-not recognition threshold are recognized in the first reporting period that it becomes more-likely-than-not such tax position will be sustained upon examination. A tax position that meets this more-likely-than-not recognition threshold is recorded at the largest amount of tax benefit that has a greater than 50% likelihood of being realized upon ultimate settlement. Previously recognized income tax positions that fail to meet the recognition threshold in a subsequent period are derecognized in that period. Differences between actual results and our assumptions, or changes in our assumptions in future periods, are recorded in the period they become known. We record potential accrued interest and penalties related to unrecognized tax benefits in income tax expense.
As a multinational corporation, we are subject to complex tax laws and regulations in various jurisdictions. The application of tax laws and regulations is subject to legal and factual interpretation, judgment, and uncertainty. Tax laws themselves are subject to change as a result of changes in fiscal policy, changes in legislation, evolution of regulations and court rulings. Therefore, the actual liability for U.S. or foreign taxes may be materially different from our estimates, which could result in the need to record additional liabilities or potentially to reverse previously recorded tax liabilities.
Deferred tax assets and liabilities are measured using enacted tax rates expected to apply to taxable income in the years in which those temporary differences are expected to be recovered or settled. The effect on deferred tax assets and liabilities of a change in tax rates is recognized in the period that includes the enactment date. A valuation allowance is recorded against any deferred tax assets when, in the judgment of management, it is more likely than not that all of or part of a deferred tax asset will not be realized. In assessing the need for a valuation allowance, we consider all positive and negative evidence, including recent financial performance, scheduled reversals of temporary differences, projected future taxable income, availability of taxable income in carryback periods and tax planning strategies. Based on a review of such information, we believe that insufficient positive evidence exists to support that we will more likely than not be able to realize the majority of our U.S. federal and state
44
deferred tax assets. Therefore, we have recorded a valuation allowance against our deferred tax assets to the extent that they are not expected to be recoverable against taxes previously paid in available carryback periods.
Litigation Costs and Contingencies. We record a charge equal to at least the minimum estimated liability for a loss contingency or litigation settlement when both of the following conditions are met: (i) information available prior to issuance of the financial statements indicates that it is probable that a liability had been incurred at the date of the financial statements and (ii) the range of loss can be reasonably estimated. The determination of whether a loss contingency or litigation settlement is probable or reasonably possible involves a significant amount of management judgment, as does the estimation of the range of loss given the nature of contingencies. Liabilities related to litigation settlements with multiple elements are recorded based on the fair value of each element. Legal and other litigation related costs are recognized as the services are provided. We record insurance and other indemnity recoveries for litigation costs when both of the following conditions are met: (i) the recovery is probable and (ii) collectability is reasonably assured. There are many uncertainties associated with any litigation, and we cannot provide assurance that any actions or other third party claims against us will be resolved without costly litigation or substantial settlement charges. If any of those events were to occur, our business, financial condition and results of operations could be materially and adversely affected. See Note 10, “Commitments and Contingencies,” in the notes to consolidated financial statements in Part IV, Item 15(a) of this Annual Report on Form 10-K.
Recently Adopted and Recently Issued Accounting Standards
See Note 1, “Summary of Significant Accounting Policies”, in the accompanying notes to consolidated financial statements included in Part IV, Item 15(a) of this Annual Report on Form 10-K for a description of the recently adopted and recently issued accounting standards.
Liquidity and Capital Resources
Our principal sources of liquidity consist of our existing cash balances and investments, as well as funds expected to be generated from operations. At June 29, 2014, we had approximately $213.6 million in working capital and approximately $158.4 million in cash and cash equivalents, as compared to approximately $167.7 million in working capital and approximately $105.6 million in cash and cash equivalents at June 30, 2013. In November 2013, we issued $175.0 million aggregate principal amount of 1.75% Convertible Senior Notes due November 2018. We received proceeds of $169.7 million from the issuance of the Convertible Senior Notes, net of debt issuance costs of approximately $5.3 million.
Our cash balances and investments are held in numerous locations throughout the world. As of June 29, 2014, our international subsidiaries held approximately 15% of our total cash, cash equivalents and investment securities, which will be used to repay obligations to U.S. affiliate entities that arise in the normal course of business and would not result in incremental U.S. tax liabilities when paid.
Cash Flows
The following table summarizes our cash flows for fiscal years 2014 and 2013:
2014 | 2013 | ||||||
(In thousands) | |||||||
Net cash provided by (used in): | |||||||
Operating activities | $ | 47,783 | $ | 10,597 | |||
Investing activities | (15,983 | ) | (94,466 | ) | |||
Financing activities | 20,541 | (11,200 | ) | ||||
Effect of foreign currency translation on cash and cash equivalents | 461 | (342 | ) | ||||
Increase (decrease) in cash and cash equivalents: | $ | 52,802 | $ | (95,411 | ) | ||
Operating Activities
Cash provided by operating activities during fiscal 2014 was approximately $47.8 million compared to approximately $10.6 million for fiscal 2013. Prior year cash flows from operating activities includes a payment of $58.0 million made during fiscal 2013 related to the Settlement Agreement entered into with Broadcom on July 3, 2012. See Note 10, “Commitments and Contingencies,” in the accompanying notes to consolidated financial statements under the caption, “Litigation” included in Part IV, Item 15(a) of this Annual Report on Form 10-K. The current period cash provided by operating activities also benefits from higher income tax refunds received of approximately $2.0 million in comparison to the prior year. The current period cash provided by operating activities resulted from net loss of approximately $29.5 million, non-cash adjustments for amortization of intangible assets of approximately $31.3 million, depreciation and amortization of approximately $19.0 million, share-based
45
compensation expense of approximately $15.3 million, and accretion of debt discount and amortization of debt issuance costs of approximately $3.9 million related to the Convertible Senior Notes; and the timing of net working capital requirements.
Investing Activities
Cash used in investing activities during fiscal 2014 was approximately $16.0 million compared to approximately $94.5 million for fiscal 2013. The current period usage of cash was related to purchases of property and equipment of approximately $16.0 million. We currently expect a similar level of investment in property and equipment in the future to support our strategic objectives, although the timing may be impacted by certain project timelines and other factors. The prior period usage of cash was primarily related to our acquisition of Endace for approximately $107.7 million and purchases of property and equipment of approximately $15.7 million, offset by the maturities of investments, net of purchases, of approximately $28.9 million.
Financing Activities
Cash provided by financing activities for fiscal 2014 was approximately $20.5 million compared to cash used of approximately $11.2 million for fiscal 2013. During fiscal 2014, we issued $175.0 million aggregate principal amount of 1.75% Convertible Senior Notes due November 2018 partially offset by our repurchase of approximately 22.5 million of the Company's common shares for an aggregate of approximately $150.0 million. In connection with the Convertible Senior Notes, we incurred approximately $5.3 million of issuance costs.
Prospective Capital Needs
In November 2013, we issued $175.0 million aggregate principal amount of 1.75% Convertible Senior Notes due November 2018 (Convertible Senior Notes). Interest is payable semi-annually in arrears on May 15 and November 15 of each year, commencing May 15, 2014. The initial conversion rate is approximately 97.13 per share of our common stock per $1,000 principal amounts of the Convertible Senior Notes. The initial conversion price is approximately $10.30 per share of our common stock. See Note 11, "Convertible Senior Notes," in the notes to consolidated financial statements in Part IV, Item 15(a) of this Annual Report on Form 10-K. We used a portion of net proceeds from the offering to repurchase approximately $150.0 million of our common stock at a price per share equal to $6.68 during fiscal 2014. See Note 12, "Share Repurchase Programs," in the notes to consolidated financial statements in Part IV, Item 15(a) of this Annual Report on Form 10-K. We intend to use the remaining net proceeds from the offering and a portion of our other available capital for additional share repurchases. In November 2013, our Board of Directors approved a $200.0 million share repurchase program. At June 29, 2014, we have the authority to repurchase an additional approximately $50.0 million pursuant to this authorization.
In November 2013, we announced a cost savings program designed to streamline business operations and achieve operating expense reductions. We plan to continue our cost savings program, which includes simplifying our product portfolio, discontinuing additional programs with lower returns on investment, pursuing consolidation opportunities and identifying further efficiencies which will accordingly impact our strategic investment in research and development, sales and marketing, capital equipment, and facilities. We may also consider internal and external investment opportunities in order to achieve our growth and market leadership goals, including licensing and product development alignment agreements with our suppliers, customers, and other third parties. We believe that our existing cash and cash equivalents, and anticipated cash flows from operating activities will be sufficient to support our working capital needs, capital expenditure requirements and stock repurchases for at least the next 12 months and the foreseeable future based on currently forecasted trends. We may need to pursue additional financing if our business does not generate sufficient cash flow from operations to enable us to pay the principal amount of our Convertible Senior Notes or to fund other liquidity needs.
We have disclosed outstanding legal proceedings in Note 10, “Commitments and Contingencies,” in the accompanying notes to consolidated financial statements included in Part IV, Item 15(a) of this Annual Report on Form 10-K, including the consolidated patent infringement lawsuit filed by Broadcom against us. On July 3, 2012, we entered into a Settlement Agreement pursuant to which both parties agreed to settle and release certain claims related to the patent infringement litigation. The Settlement Agreement provided for certain amendments to the April 3, 2012 Permanent Injunction, and dismissals of certain allegations of the lawsuit, including portions of the scheduled re-trial. We also received a worldwide limited license to the ‘691 patent, the ‘150 patent, the ‘194 patent and related families for certain fields of use including Fibre Channel applications. Effective March 30, 2014, Emulex and Broadcom entered into a Dismissal Agreement pursuant to which Emulex and Broadcom entered into certain understandings with respect to the outstanding claims relating to and arising out of the patent infringement suit. Pursuant to the terms of the Dismissal Agreement, we agreed to pay Broadcom a non-refundable, non-cancelable dismissal and standstill fee in the amount of $5 million.
We continue to evaluate certain customer royalty obligations arising under the licensing agreements with Broadcom that could result in additional costs of approximately $5 million in future periods. Such costs will reduce gross margins in the periods accrued. See “Product Redesign Activities and Potential Royalty Obligations” in Part II, Item 7 of this Annual Report
46
on Form 10-K. Also see “Third party claims of intellectual property infringement could adversely affect our business” and “We are dependent on sole source and limited source third party suppliers and EMS providers for our products” in Part I, Item 1A — Risk Factors, of this Annual Report on Form 10-K for a description of certain risks relating to the litigation with Broadcom that could impact our liquidity and prospective capital needs.
Off-Balance Sheet Arrangements
As part of our ongoing business, we do not participate in transactions that generate material relationships with unconsolidated entities or financial partnerships, such as entities often referred to as structured finance or special purpose entities, which would have been established for the purpose of facilitating off-balance sheet arrangements or for other contractually narrow or limited purposes. As of June 29, 2014, we did not have any off-balance sheet arrangements, as defined in Item 303(a)(4)(ii) of SEC Regulation S-K.
Contractual Obligations and Commercial Commitments
The following summarizes our contractual obligations as of June 29, 2014, and the effect such obligations are expected to have on our liquidity in future periods. The estimated payments reflected in this table are based on management’s estimates and assumptions about these obligations. Because these estimates and assumptions are necessarily subjective, the actual cash outflows in future periods will vary, possibly materially, from those reflected in the table.
Payments Due by Period | |||||||||||||||||||||||||||
Total | 2015 | 2016 | 2017 | 2018 | 2019 | Thereafter | |||||||||||||||||||||
(In thousands) | |||||||||||||||||||||||||||
Debt (1) | $ | 175,000 | $ | — | $ | — | $ | — | $ | — | $ | 175,000 | $ | — | |||||||||||||
Debt interest (2) | 13,783 | 3,063 | 3,063 | 3,063 | 3,063 | 1,531 | — | ||||||||||||||||||||
Leases(3) | 19,323 | 6,393 | 5,209 | 3,385 | 2,735 | 1,497 | 104 | ||||||||||||||||||||
Purchase commitments(4) | 34,719 | 34,719 | — | — | — | — | — | ||||||||||||||||||||
Other commitments(5) | 13,254 | 11,748 | 1,506 | — | — | — | — | ||||||||||||||||||||
Total(7)(6) | $ | 256,079 | $ | 55,923 | $ | 9,778 | $ | 6,448 | $ | 5,798 | $ | 178,028 | $ | 104 | |||||||||||||
(1) | See Note 11, "Convertible Senior Notes," in the accompanying notes to consolidated financial statements included in Part IV, Item 15(a) of this Annual Report on Form 10-K. |
(2) | Includes only the cash payable component of interest in our Convertible Senior Notes. |
(3) | Lease payments include common area maintenance (CAM) charges. |
(4) | Purchase commitments represent an estimate of all open purchase orders and contractual obligations in the ordinary course of business for which we have not received the goods or services as of June 29, 2014. Although open purchase orders are considered enforceable and legally binding, the terms generally allow us the option to cancel, reschedule and adjust our requirements based on our business needs prior to the delivery of goods or performance of services. |
(5) | Other commitments consist primarily of commitments for software license fees of approximately $4.4 million, $1.5 million of non-recurring engineering expenses and $3.8 million of the dismissal and standstill fee payable to Broadcom. See Note 10, "Commitments and Contingencies," in the accompanying notes to consolidated financial statements included in Part IV, Item 15(a) of this Annual Report on Form 10-K. |
(6) | Excludes approximately $40.2 million of liabilities for uncertain tax positions for which we cannot make a reasonably reliable estimate of the period of payment. See Note 14, “Income Taxes,” in the accompanying notes to consolidated financial statements included in Part IV, Item 15(a) of this Annual Report on Form 10-K. |
(7) | The expected timing of payments for the obligations discussed above is estimated based on current information. Timing of payment and actual amounts paid may be different depending on the time of receipt of goods or services or changes to agreed-upon amounts for some obligations. Amounts disclosed as contingent or milestone based obligations depend on the achievement of the milestones or the occurrence of the contingent events and can vary significantly. |
Item 7A. Qualitative and Quantitative Disclosures about Market Risk.
Interest Rate Sensitivity
We do not believe our cash equivalents are subject to significant interest rate risk due to their short terms to maturity. As of June 29, 2014, the carrying value of our cash equivalents approximated fair value. The $175.0 million Convertible Senior Notes due November 15, 2018 have a fixed interest rate of 1.75%.
Exchange Rate Risk
47
Currently, sales to customers and arrangements with third-party manufacturers generally provide for pricing and payment in U.S. dollars (USD), and, therefore, are not subject to exchange rate fluctuations. Increases in the value of the USD relative to other currencies could make our products more expensive, which could negatively impact our ability to compete. Conversely, decreases in the value of the USD relative to other currencies could result in our suppliers raising their prices to continue doing business with us.
In addition, we are also exposed to foreign exchange rate risk specific to our intercompany loans denominated in a currency other than the local tax reporting currency, which results in tax expense or benefit on the unrealized exchange gain or loss in the local jurisdiction. The potential effect on net loss as of June 29, 2014 resulting from a hypothetical 10% adverse change in currency exchange rates is approximately $4.1 million of incremental tax expense. As a result, fluctuations in currency exchange rates have affected, and could continue to affect our business and results of operations.
Item 8. Financial Statements and Supplementary Data.
The information required by this Item is included herein as part of Part IV, Item 15(a) Financial Statements and Schedules of this Annual Report on Form 10-K.
Item 9. Changes in and Disagreements with Accountants on Accounting and Financial Disclosure.
None.
Item 9A. Controls and Procedures.
Conclusion Regarding the Effectiveness of Disclosure Controls and Procedures
The Company maintains disclosure controls and procedures to ensure that information we are required to disclose in reports that we file or submit under the Securities Exchange Act of 1934, as amended (Exchange Act) is recorded, processed, summarized and reported within the time periods specified in Securities and Exchange Commission rules and forms. In designing and evaluating our disclosure controls and procedures, our management recognizes that any controls and procedures, no matter how well designed and operated, can provide only reasonable assurance of achieving the desired control objectives, and our management is required to apply their judgment in evaluating the cost-benefit relationship of possible controls and procedures. The design of any system of internal control is based, in part, on assumptions about the likelihood of future events, and there can be only reasonable, and not absolute, assurance that any design will succeed in achieving its stated goals under all potential events and conditions. Over time, controls may become inadequate because of changes in circumstances or the degree of compliance with the policies and procedures may deteriorate.
As of June 29, 2014, our management evaluated, with the participation of our Chief Executive Officer and our Chief Financial Officer, the effectiveness of our disclosure controls and procedures, as such term is defined under Rule 13a-15(e) promulgated under the Exchange Act, to ensure that information required to be disclosed is accumulated and communicated to our management, including our principal executive and financial officers, as appropriate to allow timely decisions regarding required disclosures. Based on this evaluation, our Chief Executive Officer and our Chief Financial Officer have concluded that our disclosure controls and procedures were not effective as of June 29, 2014 as a result of the material weakness that existed in our internal control over financial reporting as described below in "Management’s Report on Internal Control over Financial Reporting."
Notwithstanding the material weaknesses discussed below, our management, including our Chief Executive Officer and our Chief Financial Officer, concluded that the consolidated financial statements in this Annual Report on Form 10-K fairly present, in all material respects, the Company's financial condition, results of operations and cash flows for the periods presented, in conformity with U.S. generally accepted accounting principles.
Management’s Report on Internal Control Over Financial Reporting
Our management is responsible for establishing and maintaining adequate internal control over financial reporting, as defined in Rule 13a-15(f) promulgated under the Exchange Act. Internal control over financial reporting is designed to provide reasonable assurance regarding the reliability of financial reporting and the preparation of financial statements for external purposes in accordance with generally accepted accounting principles. Because of its inherent limitations, internal control over financial reporting may not prevent or detect misstatements. Also, projections of any evaluation of effectiveness to future periods are subject to the risk that controls may become inadequate because of changes in conditions, or that the degree of compliance with the policies or procedures may deteriorate.
Our management evaluated the effectiveness of our internal control over financial reporting using the criteria set forth by the Committee of Sponsoring Organizations of the Treadway Commission in Internal Control-Integrated Framework (1992).
48
Based on this assessment, management identified a material weakness in our internal control over financial reporting as of June 29, 2014 as further described below.
A material weakness is a deficiency, or combination of deficiencies, in internal control over financial reporting, such that there is a reasonable possibility that a material misstatement of the Company’s annual or interim financial statements will not be prevented or detected on a timely basis. Management has identified the following control deficiency that constitutes a material weakness in our internal control over financial reporting as of June 29, 2014:
The Company’s internal controls over its annual goodwill impairment test were not designed effectively, as management’s review controls over the third-party valuation analyses were not designed at a precise enough level to sufficiently address the reasonableness of (i) certain assumptions estimated by management (ii) certain assumptions and calculations performed by the third-party valuation specialist, and (iii) the allocation of net assets assigned to each reporting unit. Further, in light of the fact that there was a change in the personnel performing the reviews and an additional reporting unit on which a third party valuation needed to be performed, the design of the controls did not provide for adequate time in which to effectively conduct the reviews in the current year. Although adjustments were made to the fair value and/or the carrying value of each reporting unit as a result of correcting the underlying assumptions, the adjustments did not impact the conclusion that each reporting unit passed step 1 of the annual impairment test. Therefore, the deficiency in our internal controls had no impact on our consolidated financial statements as of or for the year ended June 29, 2014, although we did modify and enhance our disclosure surrounding goodwill valuation in our critical accounting policies.
The independent registered public accounting firm that audited the consolidated financial statements included in this annual report has issued an audit report on management’s assessment of our internal control over financial reporting. See Part IV, Item 15(a) Financial Statement and Schedules of this Annual Report on Form 10-K.
Plans for Remediation of Material Weakness
Management is actively engaged in the planning for, and implementation of, remediation efforts to address the material weakness identified above. Management intends to take the following actions to address the material weakness:
Re-designing its controls, including the implementation of new controls, relating to the annual goodwill impairment analysis, including: (i) more robust and critical review of internal assumptions and inputs, (ii) specific review procedures with defined precision levels over third-party valuation assumptions and calculations, and (iii) overall assessment of the valuation conclusions.
Changes in Internal Control Over Financial Reporting
During the third quarter of 2014, management identified that system administrator access was not properly restricted within one of its subsidiary’s ERP system. This subsidiary comprises less than 10% of consolidated revenues. Management determined the risks of a material error stemming from this deficiency to be mitigated by compensating controls. Management remediated the deficiency by removing the inappropriate administrator access rights in the fourth quarter.
There were no other changes in our internal control over financial reporting identified in connection with the evaluation required by paragraph (d) of Rule 13a-15 or Rule 15d-15 that has materially affected, or is reasonably likely to materially affect, our internal control over financial reporting.
Item 9B. Other Information.
None.
PART III
Item 10. Directors, Executive Officers, and Corporate Governance.
The information required by this Item will be included in an amendment to this annual report on Form 10-K or incorporated by reference from our definitive proxy statement to be filed pursuant to Regulation 14A.
We have adopted the Emulex Corporation Business Ethics and Confidentiality Policy (the Code of Ethics), a code of ethics that applies to all of our directors and officers, including our Chief Executive Officer, Chief Financial Officer, Corporate Controller, and other finance organization employees. This Code of Ethics is publicly available on our website at www.emulex.com. If we make any substantive amendments to the Code of Ethics or grant any waiver, including any implicit
49
waiver, from a provision of the Code of Ethics to our Chief Executive Officer, Chief Financial Officer or Corporate Controller, we will disclose the nature of such amendment or waiver on that website or in a report on Form 8-K.
Item 11. Executive Compensation.
The information required by this Item will be included in an amendment to this annual report on Form 10-K or incorporated by reference from our definitive proxy statement to be filed pursuant to Regulation 14A.
Item 12. Security Ownership of Certain Beneficial Owners and Management.
The following table gives information about our common stock that may be issued upon the exercise of options, warrants and rights under all of our equity compensation plans as of June 29, 2014.
Plan Category | Number of Securities to be Issued Upon Exercise of Outstanding Options, Warrants and Rights | Weighted-Average Exercise Price of Outstanding Options, Warrants and Rights | Number of Securities Remaining Available for Future Issuance Under Equity Compensation Plans (Excluding Securities Related in Column (a)) | |||||||
(a) | (b) | (c) | ||||||||
Equity compensations plans approved by security holders(1) | 6,501,090 | $ | 4.01 | 8,520,800 | (4) | |||||
Employee stock purchase plan approved by security holders(2) | — | — | 3,648,423 | |||||||
Equity compensations plans not approved by security holders(3) | 146,979 | $ | 5.32 | 56,176 | ||||||
Total | 6,648,069 | $ | 4.04 | 12,225,399 | ||||||
(1) | Consists of the Emulex Corporation Employee Stock Option Plan, the Emulex Corporation 2005 Equity Incentive Plan, the Emulex Corporation 2004 Employee Stock Incentive Plan, and the Emulex Corporation Stock Award Plan for Non-Employee Directors. |
(2) | The Emulex Employee Stock Purchase Plan enables employees to purchase our common stock at a 15% discount to the lower of market value at the beginning or end of each six month offering period. As such, the number of shares that may be issued during a given six month period and the purchase price of such shares cannot be determined in advance. See Note 13, “Stock-based Compensation,” in the accompanying notes to consolidated financial statements included in Part IV, Item 15(a) of this Annual Report on Form 10-K. |
(3) | Consists of the ServerEngines Corporation (ServerEngines) Amended and Restated 2008 Stock Option Plan, Sierra Logic, Inc. (Sierra Logic) 2001 Stock Option Plan, Aarohi Communications Inc. (Aarohi) 2001 Stock Option Plan. Options issued under these plans were converted into options to purchase Emulex Corporation common stock as a result of the acquisitions of ServerEngines, Sierra Logic, and Aarohi. |
(4) | Includes net unvested stock granted of 3,599,134 shares that are not deemed issued for accounting purposes until vested. |
Item 13. Certain Relationships and Related Transactions.
The information required by this Item will be included in an amendment to this annual report on Form 10-K or incorporated by reference from our definitive proxy statement to be filed pursuant to Regulation 14A.
Item 14. Principal Accountant Fees and Services.
The information required by this Item will be included in an amendment to this annual report on Form 10-K or incorporated by reference from our definitive proxy statement to be filed pursuant to Regulation 14A.
PART IV
Item 15. Exhibits and Financial Statement Schedules.
(a) Financial Statements and Schedules
1. Consolidated Financial Statements
50
The consolidated financial statements listed in the accompanying Index to Consolidated Financial Statements and Schedule are filed as part of this report.
2. Financial Statement Schedule
The financial statement schedule listed in the accompanying Index to Consolidated Financial Statements and Schedule is filed as part of this report.
3. Exhibits
See Item 15(b) below.
(b) Exhibits
See Exhibit Index attached to this report and incorporated herein by this reference.
51
EMULEX CORPORATION AND SUBSIDIARIES
ANNUAL REPORT — FORM 10-K
Items 8, 15(a)(1) and 15(a)(2)
Index to Consolidated Financial Statements and Schedule
June 29, 2014, June 30, 2013 and July 1, 2012
(With Report of Independent Registered Public Accounting Firm Thereon)
Page Number | |
Consolidated Financial Statements | |
Schedule | |
All other schedules are omitted because the required information is not applicable or the information is presented in the consolidated financial statements or notes thereto.
52
REPORT OF INDEPENDENT REGISTERED PUBLIC ACCOUNTING FIRM
The Board of Directors and Stockholders
Emulex Corporation:
We have audited the accompanying consolidated balance sheets of Emulex Corporation and subsidiaries as of June 29, 2014 and June 30, 2013, and the related consolidated statements of operations, comprehensive loss, stockholders’ equity, and cash flows for each of the years in the three‑year period ended June 29, 2014. In connection with our audits of the consolidated financial statements, we also have audited the financial statement schedule of valuation and qualifying accounts listed in the accompanying index. These consolidated financial statements and financial statement schedule are the responsibility of the Company’s management. Our responsibility is to express an opinion on these consolidated financial statements and financial statement schedule based on our audits.
We conducted our audits in accordance with the standards of the Public Company Accounting Oversight Board (United States). Those standards require that we plan and perform the audit to obtain reasonable assurance about whether the financial statements are free of material misstatement. An audit includes examining, on a test basis, evidence supporting the amounts and disclosures in the financial statements. An audit also includes assessing the accounting principles used and significant estimates made by management, as well as evaluating the overall financial statement presentation. We believe that our audits provide a reasonable basis for our opinion.
In our opinion, the consolidated financial statements referred to above present fairly, in all material respects, the financial position of Emulex Corporation and subsidiaries as of June 29, 2014 and June 30, 2013, and the results of their operations and their cash flows for each of the years in the three‑year period ended June 29, 2014, in conformity with U.S. generally accepted accounting principles. Also in our opinion, the related financial statement schedule, when considered in relation to the basic consolidated financial statements taken as a whole, presents fairly, in all material respects, the information set forth therein.
We also have audited, in accordance with the standards of the Public Company Accounting Oversight Board (United States), Emulex Corporation’s internal control over financial reporting as of June 29, 2014, based on criteria established in Internal Control - Integrated Framework (1992) issued by the Committee of Sponsoring Organizations of the Treadway Commission (COSO), and our report dated August 28, 2014 expressed an adverse opinion on the effectiveness of the Company’s internal control over financial reporting.
/s/ KPMG LLP
Irvine, California
August 28, 2014
53
REPORT OF INDEPENDENT REGISTERED PUBLIC ACCOUNTING FIRM
The Board of Directors and Stockholders
Emulex Corporation:
We have audited Emulex Corporation’s internal control over financial reporting as of June 29, 2014, based on criteria established in Internal Control ‑ Integrated Framework (1992) issued by the Committee of Sponsoring Organizations of the Treadway Commission (COSO). Emulex Corporation’s management is responsible for maintaining effective internal control over financial reporting and for its assessment of the effectiveness of internal control over financial reporting, included in the accompanying Management’s Report on Internal Control over Financial Reporting appearing under Item 9A. Our responsibility is to express an opinion on the Company’s internal control over financial reporting based on our audit.
We conducted our audit in accordance with the standards of the Public Company Accounting Oversight Board (United States). Those standards require that we plan and perform the audit to obtain reasonable assurance about whether effective internal control over financial reporting was maintained in all material respects. Our audit included obtaining an understanding of internal control over financial reporting, assessing the risk that a material weakness exists, and testing and evaluating the design and operating effectiveness of internal control based on the assessed risk. Our audit also included performing such other procedures, as we considered necessary in the circumstances. We believe that our audit provides a reasonable basis for our opinion.
A company’s internal control over financial reporting is a process designed to provide reasonable assurance regarding the reliability of financial reporting and the preparation of financial statements for external purposes in accordance with generally accepted accounting principles. A company’s internal control over financial reporting includes those policies and procedures that (1) pertain to the maintenance of records that, in reasonable detail, accurately and fairly reflect the transactions and dispositions of the assets of the company; (2) provide reasonable assurance that transactions are recorded as necessary to permit preparation of financial statements in accordance with generally accepted accounting principles, and that receipts and expenditures of the company are being made only in accordance with authorizations of management and directors of the company; and (3) provide reasonable assurance regarding prevention or timely detection of unauthorized acquisition, use, or disposition of the company’s assets that could have a material effect on the financial statements.
Because of its inherent limitations, internal control over financial reporting may not prevent or detect misstatements. Also, projections of any evaluation of effectiveness to future periods are subject to the risk that controls may become inadequate because of changes in conditions, or that the degree of compliance with the policies or procedures may deteriorate.
A material weakness is a deficiency, or a combination of deficiencies, in internal control over financial reporting, such that there is a reasonable possibility that a material misstatement of the company’s annual or interim financial statements will not be prevented or detected on a timely basis. A material weakness related to the Company’s ineffective design of internal controls over the review of its annual goodwill impairment analysis has been identified and included in management’s assessment appearing under Item 9A. We also have audited, in accordance with the standards of the Public Company Accounting Oversight Board (United States), the consolidated balance sheets of Emulex Corporation and subsidiaries as of June 29, 2014 and June 30, 2013, and the related consolidated statements of operations, comprehensive loss, stockholders’ equity, and cash flows for each of the years in the three-year period ended June 29, 2014. This material weakness was considered in determining the nature, timing, and extent of audit tests applied in our audit of the 2014 consolidated financial statements, and this report does not affect our report dated August 28, 2014, which expressed an unqualified opinion on those consolidated financial statements.
In our opinion, because of the effect of the aforementioned material weakness on the achievement of the objectives of the control criteria, Emulex Corporation has not maintained effective internal control over financial reporting as of June 29, 2014, based on criteria established in Internal Control-Integrated Framework (1992) issued by the Committee of Sponsoring Organizations of the Treadway Commission (COSO).
We do not express an opinion or any other form of assurance on management’s statements referring to corrective actions taken after June 29, 2014, relative to the aforementioned material weakness in internal control over financial reporting.
/s/ KPMG LLP
Irvine, California
August 28, 2014
54
EMULEX CORPORATION AND SUBSIDIARIES
CONSOLIDATED BALANCE SHEETS
June 29, 2014 and June 30, 2013
2014 | 2013 | ||||||
(In thousands, except share data) | |||||||
ASSETS | |||||||
Current assets: | |||||||
Cash and cash equivalents | $ | 158,439 | $ | 105,637 | |||
Accounts receivable, net of allowance for doubtful accounts of $1,079 and $1,293 at June 29, 2014 and June 30, 2013, respectively | 76,974 | 82,363 | |||||
Inventories | 25,831 | 23,897 | |||||
Income tax receivable | — | 8,587 | |||||
Prepaid expenses and other current assets | 20,029 | 15,692 | |||||
Deferred income taxes | 223 | 3,137 | |||||
Total current assets | 281,496 | 239,313 | |||||
Property and equipment, net | 59,908 | 62,415 | |||||
Goodwill | 248,519 | 248,519 | |||||
Intangible assets, net | 108,007 | 139,298 | |||||
Other assets | 19,993 | 21,164 | |||||
Total assets | $ | 717,923 | $ | 710,709 | |||
LIABILITIES AND STOCKHOLDERS’ EQUITY | |||||||
Current liabilities: | |||||||
Accounts payable | $ | 25,762 | $ | 27,725 | |||
Accrued and other current liabilities | 42,183 | 43,861 | |||||
Total current liabilities | 67,945 | 71,586 | |||||
Convertible senior notes | 146,478 | — | |||||
Other liabilities | 6,842 | 4,924 | |||||
Deferred income taxes | 15,550 | 17,048 | |||||
Accrued taxes | 26,462 | 29,526 | |||||
Total liabilities | 263,277 | 123,084 | |||||
Commitments and contingencies (Note 10) | |||||||
Stockholders’ equity: | |||||||
Preferred stock, $0.01 par value; 1,000,000 shares authorized (150,000 shares designated as Series A Junior Participating Preferred Stock); none issued and outstanding | — | — | |||||
Common stock, $0.10 par value; 240,000,000 shares authorized; 110,976,299 and 108,896,648 issued, 70,931,827 and 91,304,326 outstanding, at June 29, 2014 and June 30, 2013, respectively | 11,098 | 10,890 | |||||
Additional paid-in capital | 1,325,677 | 1,279,839 | |||||
Accumulated deficit | (501,886 | ) | (472,354 | ) | |||
Accumulated comprehensive loss | (1,863 | ) | (2,370 | ) | |||
Treasury stock, at cost; 40,044,472 and 17,592,322 shares at June 29, 2014 and June 30, 2013, respectively | (378,380 | ) | (228,380 | ) | |||
Total stockholders’ equity | 454,646 | 587,625 | |||||
Total liabilities and stockholders’ equity | $ | 717,923 | $ | 710,709 | |||
See accompanying notes to consolidated financial statements.
55
EMULEX CORPORATION AND SUBSIDIARIES
CONSOLIDATED STATEMENTS OF OPERATIONS
Years Ended June 29, 2014, June 30, 2013 and July 1, 2012
2014 | 2013 | 2012 | |||||||||
(In thousands, except per share data) | |||||||||||
Net revenues | $ | 447,333 | $ | 478,567 | $ | 501,769 | |||||
Cost of sales: | |||||||||||
Cost of goods sold | 153,994 | 173,004 | 184,593 | ||||||||
Amortization of core and developed technology intangible assets | 24,916 | 21,800 | 24,031 | ||||||||
Patent litigation settlement, damages, and royalties | 7,426 | 4,963 | 37,310 | ||||||||
Total cost of sales | 186,336 | 199,767 | 245,934 | ||||||||
Gross profit | 260,997 | 278,800 | 255,835 | ||||||||
Operating expenses: | |||||||||||
Engineering and development | 155,909 | 168,446 | 163,552 | ||||||||
Selling and marketing | 77,757 | 66,235 | 59,990 | ||||||||
General and administrative | 41,115 | 38,893 | 35,658 | ||||||||
Amortization of other intangible assets | 6,375 | 5,935 | 6,569 | ||||||||
Total operating expenses | 281,156 | 279,509 | 265,769 | ||||||||
Operating loss | (20,159 | ) | (709 | ) | (9,934 | ) | |||||
Non-operating (expense) income, net: | |||||||||||
Interest income | 26 | 34 | 97 | ||||||||
Interest expense | (5,860 | ) | (24 | ) | (15 | ) | |||||
Other (expense) income, net | (193 | ) | (4,884 | ) | 350 | ||||||
Total non-operating (expense) income, net | (6,027 | ) | (4,874 | ) | 432 | ||||||
Loss before income taxes | (26,186 | ) | (5,583 | ) | (9,502 | ) | |||||
Income tax provision (benefit) | 3,346 | (369 | ) | 1,578 | |||||||
Net loss | $ | (29,532 | ) | $ | (5,214 | ) | $ | (11,080 | ) | ||
Net loss per share: | |||||||||||
Basic | $ | (0.35 | ) | $ | (0.06 | ) | $ | (0.13 | ) | ||
Diluted | $ | (0.35 | ) | $ | (0.06 | ) | $ | (0.13 | ) | ||
Number of shares used in per share computations: | |||||||||||
Basic | 83,917 | 90,271 | 86,585 | ||||||||
Diluted | 83,917 | 90,271 | 86,585 | ||||||||
See accompanying notes to consolidated financial statements.
56
EMULEX CORPORATION AND SUBSIDIARIES
CONSOLIDATED STATEMENTS OF COMPREHENSIVE LOSS
Years Ended June 29, 2014, June 30, 2013 and July 1, 2012
2014 | 2013 | 2012 | |||||||||
(In thousands, except per share data) | |||||||||||
Net loss | $ | (29,532 | ) | $ | (5,214 | ) | $ | (11,080 | ) | ||
Other comprehensive income (loss) | |||||||||||
Foreign currency translation adjustments | 507 | (697 | ) | (1,435 | ) | ||||||
Comprehensive loss | $ | (29,025 | ) | $ | (5,911 | ) | $ | (12,515 | ) | ||
See accompanying notes to consolidated financial statements
57
EMULEX CORPORATION AND SUBSIDIARIES
CONSOLIDATED STATEMENTS OF STOCKHOLDERS’ EQUITY
Years Ended June 29, 2014, June 30, 2013 and July 1, 2012
Common Stock | Additional Paid in Capital | Accumulated Deficit | Accumulated Comprehensive Loss | Treasury Stock | Total Stockholder’s Equity | |||||||||||||||||||||
Shares Outstanding | Amount | |||||||||||||||||||||||||
(In thousands, except share data) | ||||||||||||||||||||||||||
Balance at July 3, 2011 | 87,998,852 | $ | 10,266 | $ | 1,243,045 | $ | (456,060 | ) | $ | (238 | ) | $ | (208,322 | ) | $ | 588,691 | ||||||||||
Net loss | — | — | — | (11,080 | ) | — | — | (11,080 | ) | |||||||||||||||||
Other comprehensive income | — | — | — | — | (1,435 | ) | — | (1,435 | ) | |||||||||||||||||
Share-based compensation expense | — | — | 22,084 | — | — | — | 22,084 | |||||||||||||||||||
Stock awards vested | 1,708,164 | 170 | (170 | ) | — | — | — | — | ||||||||||||||||||
Payroll tax withholdings on behalf of employees for restricted stock | (661,663 | ) | (66 | ) | (5,153 | ) | — | — | — | (5,219 | ) | |||||||||||||||
Tax shortfall from exercise of stock options | — | — | (5,619 | ) | — | — | — | (5,619 | ) | |||||||||||||||||
Issuance of common stock under employee stock purchase plan | 830,199 | 83 | 5,689 | — | — | — | 5,772 | |||||||||||||||||||
Exercise of stock options | 242,638 | 24 | 1,943 | — | — | — | 1,967 | |||||||||||||||||||
Issuance of contingent consideration related to ServerEngines | 1,997,477 | 200 | (200 | ) | — | — | — | — | ||||||||||||||||||
Purchase of treasury stock | (2,936,080 | ) | — | — | — | — | (20,058 | ) | (20,058 | ) | ||||||||||||||||
Balance at July 1, 2012 | 89,179,587 | 10,677 | 1,261,619 | (467,140 | ) | (1,673 | ) | (228,380 | ) | 575,103 | ||||||||||||||||
Net loss | — | — | — | (5,214 | ) | — | — | (5,214 | ) | |||||||||||||||||
Other comprehensive loss | — | — | — | — | (697 | ) | — | (697 | ) | |||||||||||||||||
Share-based compensation expense | — | — | 20,516 | — | — | — | 20,516 | |||||||||||||||||||
Stock awards vested | 1,806,155 | 180 | (180 | ) | — | — | — | — | ||||||||||||||||||
Payroll tax withholdings on behalf of employees for restricted stock | (583,954 | ) | (58 | ) | (3,991 | ) | — | — | — | (4,049 | ) | |||||||||||||||
Tax shortfall from exercise of stock options | — | — | (2,732 | ) | — | — | — | (2,732 | ) | |||||||||||||||||
Issuance of common stock under employee stock purchase plan | 875,857 | 88 | 4,734 | — | — | — | 4,822 | |||||||||||||||||||
Exercise of stock options | 26,681 | 3 | 71 | — | — | — | 74 | |||||||||||||||||||
Excess of cash paid over book value for non controlling interest in Endace | — | — | (198 | ) | — | — | — | (198 | ) | |||||||||||||||||
Balance at June 30, 2013 | 91,304,326 | 10,890 | 1,279,839 | (472,354 | ) | (2,370 | ) | (228,380 | ) | 587,625 | ||||||||||||||||
Net loss | — | — | — | (29,532 | ) | — | — | (29,532 | ) | |||||||||||||||||
Other comprehensive loss | — | — | — | — | 507 | — | 507 | |||||||||||||||||||
Share-based compensation expense | — | — | 14,145 | — | — | — | 14,145 | |||||||||||||||||||
Stock awards vested | 1,720,540 | 172 | (172 | ) | — | — | — | — | ||||||||||||||||||
Payroll tax withholdings on behalf of employees for restricted stock | (587,931 | ) | (59 | ) | (4,158 | ) | — | — | — | (4,217 | ) | |||||||||||||||
Issuance of common stock under employee stock purchase plan | 852,144 | 85 | 4,577 | — | — | — | 4,662 | |||||||||||||||||||
Exercise of stock options | 94,898 | 10 | 403 | — | — | — | 413 | |||||||||||||||||||
Purchase of treasury stock | (22,452,150 | ) | — | — | — | — | (150,000 | ) | (150,000 | ) | ||||||||||||||||
Equity component of Convertible Senior Notes issuance | — | — | 31,043 | — | — | — | 31,043 | |||||||||||||||||||
Balance at June 29, 2014 | 70,931,827 | $ | 11,098 | $ | 1,325,677 | $ | (501,886 | ) | $ | (1,863 | ) | $ | (378,380 | ) | $ | 454,646 | ||||||||||
See accompanying notes to consolidated financial statements
58
EMULEX CORPORATION AND SUBSIDIARIES
CONSOLIDATED STATEMENTS OF CASH FLOWS
Years Ended June 29, 2014, June 30, 2013 and July 1, 2012
2014 | 2013 | 2012 | |||||||||
(In thousands, except per share data) | |||||||||||
Cash flows from operating activities: | |||||||||||
Net loss | $ | (29,532 | ) | $ | (5,214 | ) | $ | (11,080 | ) | ||
Adjustments to reconcile net loss to net cash provided by operating activities: | |||||||||||
Depreciation and amortization of property and equipment | 19,036 | 18,200 | 18,064 | ||||||||
Share-based compensation expense | 15,257 | 21,802 | 22,169 | ||||||||
Amortization of intangible assets | 31,291 | 27,735 | 30,600 | ||||||||
Provision for losses on accounts receivables | (214 | ) | (473 | ) | 23 | ||||||
Accretion of debt discount on convertible senior notes and amortization of debt issuance costs | 3,914 | — | — | ||||||||
Accrued interest income, net | — | (60 | ) | 177 | |||||||
Loss on disposal of property and equipment | 68 | 265 | 142 | ||||||||
Deferred income taxes | 1,415 | 1,886 | (6,757 | ) | |||||||
Excess tax benefits from share-based compensation | — | (48 | ) | (246 | ) | ||||||
Foreign currency adjustments | (863 | ) | 107 | 51 | |||||||
Changes in assets and liabilities net of acquisitions: | |||||||||||
Accounts receivables | 5,603 | 4,515 | (9,982 | ) | |||||||
Inventories | (1,965 | ) | 1,137 | 105 | |||||||
Prepaid expenses, prepaid income taxes and other assets | 9,392 | (18,004 | ) | 10,757 | |||||||
Accounts payable, accrued and other liabilities | (2,555 | ) | (43,264 | ) | 25,708 | ||||||
Accrued taxes | (3,064 | ) | 2,013 | (687 | ) | ||||||
Net cash provided by operating activities | 47,783 | 10,597 | 79,044 | ||||||||
Cash flows from investing activities: | |||||||||||
Net proceeds from sale of property and equipment | 2 | 26 | 158 | ||||||||
Purchases of property and equipment | (15,985 | ) | (15,722 | ) | (14,936 | ) | |||||
Acquisitions, net of cash acquired | — | (107,709 | ) | — | |||||||
Purchases of investments | — | (14,030 | ) | (28,938 | ) | ||||||
Proceeds from maturities of investments | — | 42,969 | 52,072 | ||||||||
Net cash (used in) provided by investing activities | (15,983 | ) | (94,466 | ) | 8,356 | ||||||
Cash flows from financing activities: | |||||||||||
Issuance of convertible senior notes | 175,000 | — | — | ||||||||
Repurchase of common stock and accelerated share repurchase forward contract | (150,000 | ) | — | (20,058 | ) | ||||||
Purchases of noncontrolling interest in Endace Limited | — | (11,828 | ) | — | |||||||
Debt issuance costs | (5,317 | ) | — | — | |||||||
Payroll tax withholdings on behalf of employees for restricted stock | (4,217 | ) | (4,049 | ) | (4,837 | ) | |||||
Proceeds from issuance of common stock under stock plans | 5,075 | 4,896 | 7,739 | ||||||||
Excess tax benefits from share-based compensation | — | 48 | 246 | ||||||||
Change in restricted cash | — | (267 | ) | — | |||||||
Net cash provided by (used in) financing activities | 20,541 | (11,200 | ) | (16,910 | ) | ||||||
Effect of exchange rates on cash and cash equivalents | 461 | (342 | ) | (602 | ) | ||||||
Net increase (decrease) in cash and cash equivalents | 52,802 | (95,411 | ) | 69,888 | |||||||
Cash and cash equivalents at beginning of year | 105,637 | 201,048 | 131,160 | ||||||||
Cash and cash equivalents at end of year | $ | 158,439 | $ | 105,637 | $ | 201,048 | |||||
See accompanying notes to consolidated financial statements.
59
EMULEX CORPORATION AND SUBSIDIARIES
NOTES TO CONSOLIDATED FINANCIAL STATEMENTS
Note 1. Summary of Significant Accounting Policies
Description of Business
Emulex Corporation (Emulex or the Company), a Delaware corporation, creates high-performance network connectivity, monitoring and management products, providing solutions for global networks that support enterprise, cloud, government and telecommunications. The Company’s products enable industry leading end-to-end application visibility, optimization, and acceleration in the data center and have been designed into server and storage solutions from leading Original Equipment Manufacturers (OEMs).
Emulex’s storage and server networking offerings include host bus adapters (HBAs), mezzanine cards for blade servers, Converged Network Adapters (CNAs), Universal Converged Network Adapters (UCNAs), Local Area Network on Motherboards (LOMs), embedded storage bridges, routers, and switches, storage Input/Output controllers (IOCs), and data center networking solutions. HBAs and mezzanine cards are the data communication products that enable servers to connect to storage networks by offloading communication processing tasks as information is delivered and sent to the storage network. CNAs efficiently move data between local area networks and storage area networks using Ethernet and Fibre Channel over Ethernet protocols. UCNAs provide for efficiency of data center operations by consolidating the usage of single protocol cards into using a single card to handle multiple protocol traffic for all applications and leading server architectures. LOMs are Ethernet Controllers targeting enterprise applications requiring high wire-speed performance, multi-protocol offload capabilities, and advanced Input/Output virtualization. Embedded storage bridges, routers, switches, and IOCs are deployed inside storage arrays, tape libraries and other storage appliances.
The Company’s monitoring and management solutions, including its portfolio of Intelligent Network Recorders (INR) and network visibility products, provide organizations with complete network performance management at speeds up to 100 gigabit (Gb) Ethernet. INR technology provides data packet capture ability to respond efficiently to network problems and establish the true root cause of service-affecting issues, which is critical for large organizations that depend on their networks for business continuity.
Principles of Consolidation
The consolidated financial statements include the accounts of Emulex Corporation, and its wholly-owned subsidiaries. Material intercompany transactions and balances have been eliminated in consolidation.
Basis of Presentation
The Company operates under a 52 to 53 week fiscal year that ends on the Sunday nearest to June 30. Accordingly, every fifth or sixth fiscal year will be a 53-week fiscal year. The last 53 week fiscal year was fiscal 2011. All references to years in these notes to consolidated financial statements represent fiscal years unless otherwise noted.
Certain reclassifications have been made to prior year amounts to conform to current year’s presentation on the consolidated balance sheets, and in Notes 7, 14 and 15 and Schedule II.
Use of Estimates
The preparation of the consolidated financial statements, notes, and related disclosures in conformity with U.S. generally accepted accounting principles requires management to make a number of estimates and assumptions relating to the reported amount of assets and liabilities, and the disclosure of contingent assets and liabilities at the date of the consolidated financial statements and the reported amounts of revenues and expenses during the period. Estimates are used for, but not limited to, valuation of goodwill; deferred taxes and any associated valuation allowances; tax uncertainties; allowances for doubtful accounts; sales allowances; inventory valuation; warranty and other accrued liabilities; cost of an acquired entity and allocation of purchase price; fair value measurements; and litigation costs and related accruals. Actual results could differ materially from management’s estimates.
Foreign Currency Translation
Assets and liabilities are translated into U.S. dollars at the exchange rate at each balance sheet date, whereas revenues and expenses are translated into U.S. dollars at the average exchange rate for the reporting period. Translation adjustments are included in accumulated other comprehensive income (loss) and realized transaction gains and losses are recorded within other income (expense), net in the consolidated statements of operations. Foreign exchange (losses)/gains were approximately $(0.2) million, $(5.0) million and $0.4 million in fiscal 2014, 2013 and 2012, respectively.
60
EMULEX CORPORATION AND SUBSIDIARIES
NOTES TO CONSOLIDATED FINANCIAL STATEMENTS — (Continued)
Cash Equivalents
Cash equivalents consist of short term, highly liquid investments with original maturities of three months or less.
Restricted Cash
Restricted cash primarily represents deposits under lien to secure bank rental guarantees and letters of credit. Restricted cash was approximately $0.3 million at both June 29, 2014 and June 30, 2013, and is included within prepaid expenses and other current assets in the Consolidated Balance Sheets.
Accounts Receivable
Accounts receivable are recorded at the invoiced amount and do not bear interest. The Company maintains an allowance for doubtful accounts for estimated losses resulting from the inability of the Company’s customers to make requested payments based upon historical write-offs as a percentage of net revenues and management’s review of outstanding accounts receivable. Amounts due from customers are charged against the allowance for doubtful accounts when management believes the collectability of the amount is unlikely. Although the Company has not experienced significant losses on accounts receivable historically, its accounts receivable are concentrated with a small number of customers. Consequently, any write-off associated with one of these customers could have a significant impact on the Company’s allowance for doubtful accounts and results of operations.
Inventories
Inventories are stated at the lower of cost on a first-in, first-out basis or market. The Company regularly compares forecasted demand for its products against inventory on hand and open purchase commitments and adjusts the carrying value of inventories to their net realizable value.
Property and Equipment
Property and equipment are stated at cost. Depreciation is calculated using the straight-line method over estimated useful lives of 1 to 5 years for building improvements, up to 39 years for buildings and land improvements, 1 to 7 years for production and test equipment, and 1 to 10 years for furniture and fixtures. Leasehold improvements are amortized using the straight-line method over the shorter of the remaining lease term or the estimated useful life of the asset. Depreciation expense related to property and equipment used in the production process is recorded in cost of sales. Depreciation expense related to property and equipment used in all other activities is recorded in operating expenses.
Goodwill
Goodwill is recorded as the difference, if any, between the aggregate consideration paid for an acquisition and the fair value of the acquired net tangible and intangible assets. Goodwill is not amortized, but instead, is tested at least annually for impairment, or more frequently when events or changes in circumstances indicate that goodwill might be impaired. In assessing goodwill impairment for each of its reporting units, the Company has the option to first assess the qualitative factors to determine whether the existence of events or circumstances leads to a determination that it is more likely than not that the fair value of a reporting unit is less than its carrying amount. The Company’s qualitative assessment of the recoverability of goodwill considers various macroeconomic, industry-specific and company-specific factors including: (i) severe adverse industry or economic trends; (ii) significant company-specific actions; (iii) current, historical or projected deterioration of the Company’s financial performance; or (iv) a sustained decrease in the Company’s market capitalization below its net book value. If, after assessing the totality of events or circumstances, the Company determines it is unlikely that the fair value of a reporting unit is less than its carrying amount, then performing the two-step impairment test is unnecessary. However, if the Company concludes otherwise, then the Company is required to perform the first step of the two-step impairment test by comparing the fair value of the reporting unit, determined using future projected discounted operating cash flows, with its carrying amount, including goodwill. If the fair value of the reporting unit exceeds its carrying amount, goodwill is not considered impaired; otherwise, goodwill is considered impaired and the loss is measured by performing step two. Under step two, the impairment loss is measured by comparing the implied fair value of the reporting unit goodwill with the carrying amount of goodwill. The Company also has the option to bypass the qualitative assessment and proceed directly to performing the first step of the two-step goodwill impairment test. The Company may resume performing the qualitative assessment in any subsequent period. The annual impairment test is performed during the fourth fiscal quarter. See Note 6, “Goodwill and Intangible Assets, Net,” for additional information.
Intangible Assets and Other Long-Lived Assets
Intangible assets resulting from acquisitions or licensing agreements are carried at cost less accumulated amortization and impairment charges, if any. For assets with determinable useful lives, amortization is computed using the straight-line method
61
EMULEX CORPORATION AND SUBSIDIARIES
NOTES TO CONSOLIDATED FINANCIAL STATEMENTS — (Continued)
over the estimated economic lives of the respective intangible assets, ranging from one to thirteen years. Acquired in-process research and development (IPR&D) is recorded at fair value as an indefinite-lived intangible asset at the acquisition date until the completion or abandonment of the associated research and development efforts or impairment. IPR&D projects relate to in-process projects that have not reached technological feasibility as of the acquisition date and have no alternative future use. Upon completion of development, acquired in-process research and development assets are transferred to finite-lived intangible assets and amortized over their useful lives.
Intangible assets and other long-lived assets are tested for recoverability whenever events or circumstances indicate that their carrying value may not be recoverable. The amount of impairment, if any, is measured based on fair value, which is determined using future projected discounted operating cash flows. Assets to be disposed of are reported at the lower of the carrying amount or fair value less selling costs.
Revenue Recognition
The majority of the Company’s hardware sales are made to OEM customers. Emulex generally recognizes revenue for hardware sales at the time of shipment when title and risk of loss have passed, evidence of an arrangement has been obtained, pricing is fixed or determinable, and collectability is reasonably assured. Additionally, the Company maintains sales related reserves for its expected returns and sales incentive programs. Based on the specific program criteria, the Company classifies the costs of these incentive programs as a reduction to revenue, a cost of sale, or an operating expense.
The Company makes certain sales through two tier distribution channels using selected distributors and Master Value Added Resellers (collectively, Distributors). These Distributors are subject to distribution agreements that may be terminated upon written notice by either party, and that generally provide privileges to return a portion of inventory and to participate in price protection and cooperative marketing programs that limit the Company's ability to reasonably estimate product returns and the final price of inventory sold to distributors. Accordingly, the Company recognizes revenue on standard non-OEM specific products sold to its Distributors based on a sell-through model. OEM specific models sold to Distributors are generally governed under the related OEM agreements rather than under these distribution agreements; accordingly, the Company generally recognizes revenue at the time of shipment for OEM specific products shipped to its Distributors.
The Company also enters into certain sales transactions, referred to as multiple-element arrangements, which generally include the sale of hardware with standalone value that includes embedded software that is essential to the functionality of such hardware, and related maintenance services for a period of one to three years. These sale arrangements do not include return rights or contingent payment terms. The Company uses the following hierarchy to determine the selling price to be used for allocating revenue to each deliverable: (i) vendor-specific evidence (VSOE) of fair value, if available, (ii) third-party evidence (TPE) of selling price if VSOE is not available, and (iii) best estimate of the selling price (BESP) if neither VSOE nor TPE is available. BESPs reflect the Company’s best estimates of what the selling prices of elements would be if they were sold regularly on a stand-alone basis. The Company utilizes BESP as VSOE and TPE was determined not to exist for its deliverables in these arrangements. The Company’s process for determining its BESPs considers multiple factors including prices charged by the Company for similar offerings; historical pricing practices; and product-specific profit objectives. Such factors can impact the timing and amount of revenues and net income recognized over the term of the contract. Consideration allocated to equipment is recognized in accordance with our general revenue recognition criteria for product sales discussed above. Consideration allocated to the maintenance element is recognized on a straight-line basis over the term of the maintenance agreement. Amounts received in advance of revenue recognition are recorded as deferred revenues.
Warranty
The Company provides a warranty of between one and five years on its products. The Company records a provision for estimated warranty related costs at the time of sale based on historical product return rates and the Company’s estimates of future costs of fulfilling its warranty obligations. The Company evaluates its ongoing warranty obligation on a quarterly basis.
Research and Development
Research and development costs, including costs related to the development of new products and process technology, are expensed as incurred.
Advertising Expenses
Advertising costs are expensed as incurred. Advertising expenses amounted to approximately $6.9 million, $5.0 million, $6.3 million and for fiscal years 2014, 2013 and 2012, respectively.
Income Taxes
62
EMULEX CORPORATION AND SUBSIDIARIES
NOTES TO CONSOLIDATED FINANCIAL STATEMENTS — (Continued)
The Company accounts for income taxes using the asset and liability method, under which the Company recognizes deferred tax assets and liabilities for the future tax consequences attributable to temporary differences between the financial statement carrying amounts of existing assets and liabilities and their respective tax bases and for net operating loss and tax credit carryforwards. Tax positions that meet a more-likely-than-not recognition threshold are recognized in the first reporting period that it becomes more-likely-than-not such tax position will be sustained upon examination. A tax position that meets this more-likely-than-not recognition threshold is recorded at the largest amount of tax benefit that has a greater than 50% likelihood of being realized upon ultimate settlement. Previously recognized income tax positions that fail to meet the recognition threshold in a subsequent period are derecognized in that period. Differences between actual results and the Company's assumptions, or changes in the assumptions in future periods, are recorded in the period they become known. The Company records potential accrued interest and penalties related to unrecognized tax benefits in income tax expense.
As a multinational corporation, the Company is subject to complex tax laws and regulations in various jurisdictions. The application of tax laws and regulations is subject to legal and factual interpretation, judgment, and uncertainty. Tax laws themselves are subject to change as a result of changes in fiscal policy, changes in legislation, evolution of regulations and court rulings. Therefore, the actual liability for U.S. or foreign taxes may be materially different from the Company's estimates, which could result in the need to record additional liabilities or potentially to reverse previously recorded tax liabilities.
Deferred tax assets and liabilities are measured using enacted tax rates expected to apply to taxable income in the years in which those temporary differences are expected to be recovered or settled. The effect on deferred tax assets and liabilities of a change in tax rates is recognized in the period that includes the enactment date. A valuation allowance is recorded against any deferred tax assets when, in the judgment of management, it is more likely than not that all of or part of a deferred tax asset will not be realized. In assessing the need for a valuation allowance, the Company considers all positive and negative evidence, including recent financial performance, scheduled reversals of temporary differences, projected future taxable income, availability of taxable income in carryback periods, and tax planning strategies.
Stock-Based Compensation
The Company accounts for its stock-based awards to employees and non-employees using the fair value method. Although the Company grants unvested stock awards, cash-settled stock unit awards and stock options, the majority of the awards granted and stock based compensation recognized consists of unvested stock awards. The fair value of each unvested stock award is determined based on the closing price of the underlying common stock on the date of grant. The fair value of each cash-settled stock unit award is determined based on the closing price of the Company's common stock upon vesting, and therefore, is subject to remeasurement at each reporting period until the award is vested. For stock options, the fair value of each option is based on several criteria including, but not limited to, the valuation model used and associated input factors including principally stock price volatility and, to a lesser extent, expected term, dividend rate, and risk-free interest rate. The input factors used in the valuation model are based on subjective future expectations combined with management judgment. Expected volatilities are based on methodologies utilizing equal weighting involving both historical periods equal to the expected term and implied volatilities based on traded options to buy the Company’s common stock. Stock-based compensation expense is recognized on a straight-line basis over the requisite service period for each separate vesting tranche of the award. A forfeiture rate assumption is applied in computing stock-based compensation expense related to both unvested stock awards and stock options based on future expectations. In addition, a probability assessment is applied to unvested performance-based stock awards. These adjustments may materially impact the Company's results of operations in the period such changes are made.
Litigation Costs
The Company records a charge equal to at least the minimum estimated liability for a loss contingency or litigation settlement when both of the following conditions are met: (i) information available prior to issuance of the financial statements indicates that it is probable that a liability had been incurred at the date of the financial statements and (ii) the range of loss can be reasonably estimated. Liabilities related to litigation settlements with multiple elements are recorded based on the fair value of each element. Legal and other litigation related costs are recognized as the services are provided. The Company records insurance and other indemnity recoveries for litigation costs when both of the following conditions are met: (i) the recovery is probable and (ii) collectability is reasonably assured. There are many uncertainties associated with any litigation, and the Company cannot provide assurance that any actions or other third party claims against the Company will be resolved without costly litigation or substantial settlement charges. If any of those events were to occur, the Company’s business, financial condition and results of operations could be materially and adversely affected.
Net Income (Loss) per Share
Basic net income (loss) per share is computed by dividing net income (loss) by the weighted average number of common shares outstanding during the period. Diluted net income (loss) per share is computed by dividing adjusted net income (loss) by
63
EMULEX CORPORATION AND SUBSIDIARIES
NOTES TO CONSOLIDATED FINANCIAL STATEMENTS — (Continued)
the weighted average number of common shares outstanding during the period increased to include, if dilutive, the number of additional common shares that would be outstanding if the dilutive potential common shares and unvested stock from stock option plans. In periods with net income, the dilutive effect of outstanding stock options and unvested stock is reflected in diluted net income per share by application of the treasury stock method.
Supplemental Cash Flow Information
Cash paid during the year for:
2014 | 2013 | 2012 | |||||||||
(In thousands) | |||||||||||
Interest | $ | 1,538 | $ | 24 | $ | 14 | |||||
Income taxes | 4,486 | 3,611 | 6,966 | ||||||||
Non-cash investing and financing activities: | |||||||||||
Purchases of property and equipment not paid, net | 594 | 353 | 336 | ||||||||
Accrued payroll tax withholdings for shares issued to employees | — | — | 382 | ||||||||
Release of In-Process Research & Development (IPRD) to Developed Technology | 13,800 | — | — | ||||||||
Comprehensive Income (Loss)
Comprehensive income (loss) represents the net change in stockholders’ equity during a period from sources other than transactions with stockholders and, as such, includes net income (loss) and other specified components. For the Company, the only component of comprehensive income (loss), other than net income (loss), is the change in the cumulative foreign currency translation adjustments recognized in stockholders’ equity.
Fair Value of Financial Instruments
Fair value is defined as the exchange price that would be received for an asset or paid to transfer a liability (an exit price) in the principal or most advantageous market for the asset or liability in an orderly transaction between market participants on the measurement date. Valuation techniques used to measure fair value must maximize the use of observable inputs and minimize the use of unobservable inputs. The fair value hierarchy is based on three levels of inputs, that may be used to measure fair value, of which the first two are considered observable and the last unobservable. A description of the three levels of inputs is as follows:
Level 1 — Quoted prices in (unadjusted) active markets for identical assets or liabilities;
Level 2 — Observable inputs other than Level 1 prices, such as quoted prices for similar assets or liabilities; quoted prices in markets that are not active; or other inputs that are observable or can be corroborated by observable market data for substantially the full term of the assets or liabilities; and
Level 3 — Unobservable inputs that are supported by little or no market activity and that are significant to the fair value of the assets or liabilities.
Business and Credit Concentration
Financial instruments that potentially subject the Company to concentrations of credit risk consist primarily of cash and cash equivalents, investments, and accounts receivable. Cash and cash equivalents are primarily maintained at three major financial institutions in the United States. Deposits held with banks may exceed the amount of insurance provided on such deposits, if any.
The majority of the Company’s revenues are derived from sales to OEMs in the computer storage and server industry. Consequently, the Company’s net revenues and accounts receivable are highly concentrated among a few customers. Direct sales to the Company’s top five customers accounted for 65%, 71% and 70% of total net revenues in fiscal years 2014, 2013 and 2012, respectively. The level of sales to any single customer may vary and the loss of any one of these customers, or a decrease in the level of sales to any one of these customers, could have a material adverse impact on the Company. In addition, the recent growth of white box manufacturers and web giants has shifted server market share away from the Company’s traditional OEM customers, which may also impact future revenue. Although the Company sells to customers throughout the world, sales in the United States and Asia Pacific accounted for approximately 85% of the Company’s net revenues in fiscal years 2014, 2013 and 2012, and the Company expects for the foreseeable future, these sales will account for the substantial majority of the Company’s revenues. The Company maintains an allowance for doubtful accounts, and has not historically experienced significant loss on its accounts receivable. The majority of sales are denominated in U.S. dollars. Consequently, the
64
EMULEX CORPORATION AND SUBSIDIARIES
NOTES TO CONSOLIDATED FINANCIAL STATEMENTS — (Continued)
Company believes its foreign currency risk is minimal. The Company performs ongoing credit evaluations of its customers’ financial condition and generally requires no collateral from its customers.
Additionally, the Company currently relies on limited supply sources for several key components used in the manufacturing of its products. Also, the Company relies on five Electronics Manufacturing Services (EMS) providers for the manufacturing of its products. The inability or unwillingness of any single and limited source suppliers or the inability or unwillingness of any of the Company’s EMS providers to fulfill supply and production requirements, respectively, could materially impact future operating results.
Segment Information
Emulex has two reportable business segments, Connectivity and Visibility. The Visibility segment was formed as a result of the acquisition of Endace on February 26, 2013. The Connectivity segment includes the operating results of Network Connectivity Products (NCP) and Storage Connectivity and Other Products (SCOP). The Visibility segment includes the operating results of Network Visibility Products (NVP) arising from the Endace acquisition. See Note 15.
Recently Issued Accounting Standards
On May 28, 2014, the Financial Accounting Standards Board issued Accounting Standards Update 2014-09, "Revenue from Contracts with Customers" (ASU 2014-09). The Company is currently evaluating the impact on its financial statements of the new revenue recognition guidance, which will become effective for the Company beginning in fiscal 2018.
Note 2. Business Combinations
Acquisition of Endace Limited
On February 26, 2013, the Company acquired 89.6% of the outstanding common stock and all outstanding stock options of Endace for cash consideration of approximately $110.4 million. As of April 25, 2013, Emulex acquired the outstanding non-controlling interest for approximately $12.0 million and obtained ownership of 100% of Endace for a total of approximately $122.4 million. Endace's results of operations have been included in the consolidated statements of operations of the Company since the date of acquisition.
65
EMULEX CORPORATION AND SUBSIDIARIES
NOTES TO CONSOLIDATED FINANCIAL STATEMENTS — (Continued)
Note 3. Fair Value Measurements
Assets and Liabilities Measured at Fair Value on a Recurring Basis
Assets and liabilities measured at fair value on a recurring basis as of June 29, 2014 and June 30, 2013 are as follows:
June 29, 2014 | |||||||||||||||||||
Cost | Gross Unrealized Gains | Gross Unrealized Losses | Fair Value | Cash and Cash Equivalents | |||||||||||||||
(In thousands) | |||||||||||||||||||
Cash | $ | 128,439 | $ | — | $ | — | $ | 128,439 | $ | 128,439 | |||||||||
Level 1: | |||||||||||||||||||
Money market funds | 30,000 | — | — | 30,000 | 30,000 | ||||||||||||||
Level 2: | |||||||||||||||||||
None | — | — | — | — | — | ||||||||||||||
Level 3: | |||||||||||||||||||
None | — | — | — | — | — | ||||||||||||||
$ | 158,439 | $ | — | $ | — | $ | 158,439 | $ | 158,439 | ||||||||||
June 30, 2013 | |||||||||||||||||||
Cash | $ | 75,637 | $ | — | $ | — | $ | 75,637 | $ | 75,637 | |||||||||
Level 1: | |||||||||||||||||||
Money market funds | 30,000 | — | — | 30,000 | 30,000 | ||||||||||||||
Level 2: | |||||||||||||||||||
None | — | — | — | — | — | ||||||||||||||
Level 3: | |||||||||||||||||||
None | — | — | — | — | — | ||||||||||||||
$ | 105,637 | $ | — | $ | — | $ | 105,637 | $ | 105,637 | ||||||||||
There were no transfers between Level 1, Level 2, or Level 3 securities in either fiscal 2014 or fiscal 2013.
Assets and Liabilities Measured at Fair Value on a Non-recurring Basis
The Company measures the fair value of its assets acquired and liabilities assumed in a business combination, and goodwill and other long lived assets when they are held for sale or determined to be impaired. See Note 6 for a discussion of the fair value measurements of goodwill.
Fair Value of Financial Instruments Not Measured at Fair Value
The total fair value of the Convertible Senior Notes at June 29, 2014 was $159.4 million, which was estimated based on recent market transaction prices, a Level 2 fair value measurement.
Note 4. Inventories
Inventories are summarized as follows:
2014 | 2013 | ||||||
(In thousands) | |||||||
Raw materials | $ | 7,797 | $ | 6,585 | |||
Finished goods | 18,034 | 17,312 | |||||
$ | 25,831 | $ | 23,897 | ||||
66
Note 5. Property and Equipment
Components of property and equipment, net, are as follows:
2014 | 2013 | ||||||
(In thousands) | |||||||
Equipment | $ | 106,267 | $ | 102,062 | |||
Furniture and fixtures | 52,530 | 49,927 | |||||
Buildings and improvements | 46,359 | 43,836 | |||||
Land | 12,532 | 12,532 | |||||
217,688 | 208,357 | ||||||
Less: accumulated depreciation and amortization | (157,780 | ) | (145,942 | ) | |||
$ | 59,908 | $ | 62,415 | ||||
Note 6. Goodwill and Intangible Assets, Net
The activities in goodwill during the twelve months ended June 29, 2014 and June 30, 2013 are as follows:
Connectivity Segment | Visibility Segment | Total | |||||||||
(In thousands) | |||||||||||
Goodwill, as of July 1, 2012 | $ | 177,290 | $ | — | $ | 177,290 | |||||
Goodwill from acquisition | — | 71,229 | 71,229 | ||||||||
Goodwill, as of June 30, 2013 | 177,290 | 71,229 | 248,519 | ||||||||
Goodwill from acquisition | — | — | — | ||||||||
Goodwill, as of June 29, 2014 | $ | 177,290 | $ | 71,229 | $ | 248,519 | |||||
The goodwill addition to the Visibility segment for the twelve months ended June 30, 2013 resulted from the Endace acquisition that is described in Note 2.
The Company tests goodwill for impairment annually during the fourth fiscal quarter and at other times if events have occurred or circumstances exist that indicate the carrying value of goodwill may no longer be recoverable. Goodwill impairment testing is performed at the reporting unit level, Connectivity and Visibility.
Fair value of the reporting units is determined using the market approach, the income approach, or a combination thereof. Under the market approach, fair value is based on peer multiples and applying an appropriate control premium. The control premium used in the market approach or a combined approach is determined by considering control premiums offered as part of acquisitions that have occurred in the reporting units’ comparable market segments. Under the income approach, fair value is dependent on a discounted cash-flow analysis. The material assumptions used in performing the discounted cash-flow analysis include the Company's operating forecasts, which are based on historical data, various internal estimates, and a variety of external sources, and are developed as part of the Company's regular long-range planning process, as well as revenue growth rates, terminal value and risk-commensurate discount rates. The discount rates are based on estimates of a market weighted-average cost-of-capital for the reporting unit, as well as a specific assessment of the risk inherent in the respective reporting units, and were estimated to be 19% for the Connectivity reporting unit and 21% for the Visibility reporting unit. The Company based its fair value estimates on assumptions it believes to be reasonable, but are inherently uncertain.
The Company’s recent impairment test indicated that the Connectivity reporting unit’s fair value exceeded its carrying value by approximately 6%, or $31.3 million and the Visibility reporting unit's fair value exceeded its carrying value by approximately 7%, or $8.0 million. Accordingly, the two-step impairment test was not conducted for either reporting unit. As part of the annual test, the Company compared the aggregate fair value of the reporting units to the fair value of the Company as a whole based on the Company’s market capitalization. Although our annual test resulted in no impairment, given the recent volatility of our market capitalization, the inherent uncertainty in forecasts, and the fact that the fair value of each reporting unit did not exceed it carrying value by a substantial margin, it is possible that our goodwill could become impaired in the near term.
67
EMULEX CORPORATION AND SUBSIDIARIES
NOTES TO CONSOLIDATED FINANCIAL STATEMENTS — (Continued)
Intangible assets, net, are as follows:
June 29, 2014 | June 30, 2013 | ||||||||||||||||||||||
Gross | Accumulated Amortization | Net | Gross | Accumulated Amortization | Net | ||||||||||||||||||
(In thousands) | |||||||||||||||||||||||
Amortizable intangible assets: | |||||||||||||||||||||||
Core technology and patents | $ | 77,345 | $ | (76,172 | ) | $ | 1,173 | $ | 77,345 | $ | (71,132 | ) | $ | 6,213 | |||||||||
Developed technology | 254,900 | (152,850 | ) | 102,050 | 241,100 | (127,934 | ) | 113,166 | |||||||||||||||
Customer relationships | 4,900 | (3,089 | ) | 1,811 | 4,900 | (2,197 | ) | 2,703 | |||||||||||||||
Tradenames | 8,439 | (5,524 | ) | 2,915 | 8,439 | (5,179 | ) | 3,260 | |||||||||||||||
Other | 287 | (229 | ) | 58 | 837 | (681 | ) | 156 | |||||||||||||||
Total amortizable intangible assets | 345,871 | (237,864 | ) | 108,007 | 332,621 | (207,123 | ) | 125,498 | |||||||||||||||
In-process research and development | — | — | — | 13,800 | — | 13,800 | |||||||||||||||||
Total intangible assets, net | $ | 345,871 | $ | (237,864 | ) | $ | 108,007 | $ | 346,421 | $ | (207,123 | ) | $ | 139,298 | |||||||||
Aggregated amortization expense for intangible assets for fiscal years 2014, 2013 and 2012, was approximately $31.3 million, $27.7 million and $30.6 million, respectively. Approximately $24.9 million, $21.8 million and $24.0 million of such amortization expense related to core technology and developed technology for fiscal years 2014, 2013 and 2012, respectively, and has been included in cost of sales within the consolidated statements of operations.
The following table presents the estimated aggregated future amortization expense of intangible assets as of the end of fiscal 2014 (in thousands):
2015 | $ | 27,746 | |
2016 | 26,603 | ||
2017 | 10,076 | ||
2018 | 6,678 | ||
2019 | 6,678 | ||
Thereafter | 30,226 | ||
$ | 108,007 | ||
Note 7. Accrued and Other Current Liabilities
Components of accrued and other current liabilities are as follows:
2014 | 2013 | ||||||
(In thousands) | |||||||
Payroll and related costs | $ | 16,369 | $ | 22,267 | |||
Warranty liability | 2,798 | 2,660 | |||||
Accrued rebates | 1,782 | 1,868 | |||||
Sales allowances | 1,778 | 2,294 | |||||
Deferred revenues | 4,749 | 5,363 | |||||
Restructuring | 3,236 | — | |||||
Dismissal Agreement, patent litigation settlement, damages and royalties payable to Broadcom Corporation(1) | 4,970 | 831 | |||||
Other | 6,501 | 8,578 | |||||
$ | 42,183 | $ | 43,861 | ||||
(1) | See Note 10. |
Changes to the warranty liability in fiscal years 2014 and 2013 are as follows:
68
2014 | 2013 | ||||||
(In thousands) | |||||||
Balance at beginning of period | $ | 2,660 | $ | 2,463 | |||
Accrued warranties assumed with the acquisition of Endace | — | 35 | |||||
Accrual for warranties issued | 1,402 | 1,959 | |||||
Changes to pre-existing warranties (including changes in estimates) | (599 | ) | (81 | ) | |||
Settlements made (in cash or in kind) | (665 | ) | (1,716 | ) | |||
Balance at end of period | $ | 2,798 | $ | 2,660 | |||
Note 8. Restructuring
Fourth Quarter of Fiscal 2014 Restructuring
During the fourth quarter of fiscal 2014, the Company recorded restructuring charges of approximately $1.1 million primarily consisting of workforce reductions. The severance related charges are expected to be substantially paid in cash by the first quarter of fiscal 2015.
Second Quarter of Fiscal 2014 Restructuring
During the second quarter of fiscal 2014, the Company initiated a restructuring plan designed to streamline business operations and reduce operating expenses. The restructuring actions include a reduction in workforce of approximately 15%, the consolidation of certain engineering facilities, and the closure of the Company's Bolton, Massachusetts facility. All restructuring actions impacted the Connectivity segment. The restructuring plan is expected to be substantially completed by the end of the first quarter of fiscal 2015.
A summary of the restructuring and other related charges, the remaining balance of which is included within Accrued and Other Current Liabilities on the Company's Consolidated Balance Sheets, consisted of the following:
One-time employee termination benefits | Contract termination costs | Total | ||||||||||
(in thousands) | ||||||||||||
Balance at July 1, 2013 | $ | — | $ | — | $ | — | ||||||
Charges | 8,489 | 663 | 9,152 | |||||||||
Payments | (5,253 | ) | (663 | ) | (5,916 | ) | ||||||
Balance at June 29, 2014 | $ | 3,236 | $ | — | $ | 3,236 | ||||||
A summary of the restructuring costs, by functional line item in the condensed consolidated statements of operations is as follows:
2014 | |||
(in thousands) | |||
Cost of goods sold | $ | 279 | |
Engineering and development | 5,741 | ||
Selling and marketing | 1,540 | ||
General and administrative | 1,592 | ||
$ | 9,152 | ||
Fourth Quarter of Fiscal 2013 Restructuring
During the fourth quarter of fiscal 2013, the Company decided to take certain actions with respect to its operations, consisting primarily of workforce reductions, and recorded approximately $2.7 million in severance costs during fiscal 2013, the majority of which was paid in July 2013.
Note 9. Employee Retirement Savings Plans
The Company maintains a pretax savings and profit sharing plan under Section 401(k) of the Internal Revenue Code (IRC) (the Plan) covering substantially all U.S. domestic employees. Under the Plan, eligible employees are able to contribute
69
up to 75% of their compensation not to exceed the maximum IRC deferral amount. In addition, Company discretionary contributions match up to four percent of a participant’s compensation. The Company’s matching contributions under this plan were approximately $1.4 million, $1.5 million and $1.6 million in fiscal years 2014, 2013 and 2012, respectively. Under the terms of the Plan, the Company may also make discretionary profit sharing contributions. The Company’s discretionary profit sharing contributions under this Plan were approximately $0.7 million in fiscal 2012. The Company did not make any discretionary profit sharing contributions during fiscal years 2014 or 2013.
The Company also maintains similar retirement plans in certain international locations. The total expense and total obligation of the Company for these plans were not material to the accompanying consolidated financial statements for any period presented.
Note 10. Commitments and Contingencies
Leases
The Company leases certain facilities and equipment under long-term non-cancelable operating lease agreements, expiring at various dates through 2019. Rent expense for the Company under operating leases, including month-to-month rentals, totaled approximately $7.8 million, $5.0 million and $5.2 million in fiscal years 2014, 2013 and 2012, respectively. The Company records rent expense on a straight-line basis based on contractual lease payments. Allowances from lessors for tenant improvements have been included in the straight-line rent expense for the applicable locations.
Future minimum non-cancelable operating lease commitments are as follows (in thousands):
Operating Leases | |||
Fiscal year: | |||
2015 | $ | 6,388 | |
2016 | 5,204 | ||
2017 | 3,382 | ||
2018 | 2,735 | ||
2019 | 1,497 | ||
Thereafter | 104 | ||
Total minimum lease payments | $ | 19,310 | |
Litigation
Broadcom Patent Infringement Litigation
On September 14, 2009, Broadcom Corporation (Broadcom) filed a patent infringement lawsuit against the Company in the United States District Court in the Central District of California (District Court). The original complaint alleged infringement by the Company of ten Broadcom patents covering certain data and storage networking technologies. On January 11, 2010, the Court set a trial date of September 20, 2011. On February 23, 2010, Broadcom filed a first amended complaint adding allegations of infringement for one additional Broadcom patent. The first amended complaint sought unspecified damages and injunctive relief. On March 25, 2010, the Company filed its answer and affirmative defenses to the first amended complaint alleging that it believed that the Broadcom patents at issue were invalid or not infringed, or both. In addition, the Company asserted counterclaims for declaratory judgment of invalidity and non-infringement against each of the Broadcom patents at issue, and sought award of attorneys’ fees, costs, and expenses.
On May 26, 2010, Broadcom filed a separate patent infringement lawsuit against the Company in the District Court. The 2010 lawsuit alleged infringement of a Broadcom patent covering certain data and storage networking technologies by certain Emulex products. Broadcom sought a judgment for damages, injunctive relief, and an award of attorneys’ fees and costs.
On June 30, 2010, the Court consolidated the 2009 and 2010 patent cases into a single case. On October 14, 2010, the Court issued an order on the parties’ joint stipulation dismissing three patents from the case. On November 1, 2010, the Court issued an order allowing Broadcom to make infringement assertions against additional Emulex products. In a Court ruling dated December 17, 2010, the Court provided interpretations of certain terms contained in the claims of the patents being asserted by Broadcom. In February and May 2011, the Court issued separate orders on the parties’ joint stipulations collectively dismissing two patents from the case (leaving seven patents in the case). The Court heard the parties’ respective motions for summary judgment and subsequently issued a ruling on August 3, 2011 barring Broadcom’s claim for infringement on one patent, leaving six patents in the case. On August 25, 2011, the Company met with a mediator and representatives of Broadcom concerning
70
EMULEX CORPORATION AND SUBSIDIARIES
NOTES TO CONSOLIDATED FINANCIAL STATEMENTS — (Continued)
potential settlement of the case. On September 2, 2011, the parties submitted a joint summary of the mediation proceedings in which they stated that the mediation proceedings continued for a full day, but the parties were unable to reach a settlement agreement.
After a nearly three week trial that ended October 6, 2011, the jury reached a partial verdict involving two out of the six patents. The Court determined that one of the patents (U.S. Patent 7,058,150) [the ‘150 patent] had been infringed by Emulex, and the jury rendered an advisory verdict on October 12, 2011 to the Court that it is not invalid, and awarded approximately $0.4 million in damages with respect to that patent. The jury reached a unanimous verdict of non-infringement on another patent relating to Emulex Fibre Channel switch products. A mistrial was declared concerning the remaining four patents (U.S. Patent 7,471,691) [the ‘691 Patent] and (U.S. Patents 6,424,194; 7,486,124 and 7,724,057) [collectively, the ‘194 Patent family], for which no unanimous verdict was reached. On December 15, 2011, the Court issued judgments as a matter of law (JMOL) that the two patents, on which the jury had rendered advisory verdicts, were not invalid. On December 16, 2011, the Court issued an additional JMOL that the ‘691 patent had been infringed by Emulex. The ‘150 patent, particularly Claim 8 considered at the trial, pertains to the use of multiple lanes of phase interpolators, and products that utilize clock and data recovery (CDR) circuits in SerDes modules on an application specific integrated circuit (ASIC). The ‘691 patent, particularly Claim 7 considered at the trial, pertains to fibre channel arbitrated loop switch crossbars and scoreboards, and products that utilize specialized ASICs used in storage arrays and pass-through modules. The Company has filed an appeal for both the ‘150 patent and ‘691 patent infringement findings with the U.S. Court of Appeals for the Federal Court (Appeals Court), which affirmed the jury's and District Court's findings.
On March 16, 2012, the Court issued a decision concerning injunctive relief for the ‘150 and the ‘691 patents. The decision provided, in part, for a sunset period of 18 months relating to the ‘150 patent, starting on October 12, 2011. The decision further provided for a sunset period of 18 months relating to the ‘691 patent, starting on December 16, 2011. The affected products for the ‘150 patent include the BE2, BE3, XE201, and SOC 442 ASICs, products containing them, and products not colorably different from them. The affected products for the ‘691 patent include the SOC 320, SOC 422, and SOC 442 ASICs, products containing them, and products not colorably different from them. The sunset period allows the Company to sell the affected products to existing customers for specific customer devices, subject to limitations relating to when the products had been qualified and when certain firm orders had been placed. The decision further provided for the Company to pay a royalty of nine percent on all sales of such products made during the sunset period, and also provided that foreign sales (outside the U.S.) are beyond the scope of the suit. On April 3, 2012, the Court issued a permanent injunction (2012 Permanent Injunction) which, with respect to both the ‘150 and ‘691 patents, further describe the prohibited activities, contain sunset provision terms including royalty rates and computations, limit the territory to allow sales of products that are manufactured outside the U.S. to customers located outside the U.S., permit design around efforts including modifications and design, development, and testing to eliminate infringement, and permit service and technical support for certain products.
On May 30, 2012, the Court issued an order requiring the parties to submit the Appendix to the 2012 Permanent Injunction, and excluded from the sunset provision any customer who is a distributor and not an OEM, with distributor exceptions for needs of an end user affecting health of the public, public safety, and governmental agencies engaged in the national defense. The May 30, 2012, order provided that, not later than 90 days from the date of that order, Broadcom may move the Court for exclusion of certain device/customer product combinations from the Appendix. An Appendix was filed by Emulex and Broadcom with the Court under seal on June 10, 2012.
On July 3, 2012, Broadcom and the Company entered into a Patent License and Release Agreement (Settlement Agreement) pursuant to which both parties agreed to settle and release certain claims related to patent infringement litigation in exchange for a lump sum payment of $58.0 million. The Settlement Agreement provided for certain amendments to the 2012 Permanent Injunction, and dismissals of certain allegations of the lawsuit, including portions of the scheduled re-trial. The Company also received a worldwide limited license to the ‘691 patent, the ‘150 patent, the ‘194 patent and related families for certain fields of use including Fibre Channel applications. The fields of use licensed to Emulex are related, in part, to the Emulex XE201 (Lancer) ASICs, that are capable of Fibre Channel and Ethernet, 16Gbps Fibre Channel HBAs, Fibre Channel SOCs and other Fibre Channel products. On July 18, 2012, pursuant to the Settlement Agreement, the Court issued an amended Permanent Injunction with an amended appendix, and approved a stipulation to dismiss certain allegations in the lawsuit. The amended Permanent Injunction provides for a Sunset Provision under which the injunction is stayed until April 11, 2013, subject to limitations. The current Permanent Injunction permits major OEMs to obtain continued supply beyond the sunset period, providing them time to re-qualify products resulting from the design around efforts.
During the first quarter of fiscal 2013, the Company made the payment of $58.0 million to Broadcom pursuant to the Settlement Agreement, approximately $36.8 million of which was expensed in fiscal 2012. The remainder of approximately $21.2 million was recorded as prepaid license fees and is being amortized to cost of goods sold over the 10 year license term in proportion to the estimated future revenues of such licensed technology. As of June 29, 2014, the unamortized prepaid license fee was approximately $13.1 million, of which approximately $3.8 million was recorded in prepaid expenses and other current
71
EMULEX CORPORATION AND SUBSIDIARIES
NOTES TO CONSOLIDATED FINANCIAL STATEMENTS — (Continued)
assets and approximately $9.3 million was recorded in other assets. The Company recognized approximately $4.0 million and $4.1 million of amortization expense related to such prepaid license fees expenses during fiscal 2014 and 2013, respectively.
While the Company has contractual commitments from its suppliers concerning the defense and indemnification of certain Broadcom claims relating to certain technology provided by such suppliers, it cannot be certain that such defense and indemnification obligations will be honored by such suppliers. This lawsuit continues to present risks with respect to U.S. sales of certain Ethernet products that could have a material adverse effect on the Company’s business, financial condition, or results of operations, including loss of patent rights, monetary damages, potential reimbursement of customer indemnification liabilities or royalty obligations, and injunction against the sale of accused products. The Company continues to present a vigorous defense against this ongoing lawsuit, as well as the previous infringement verdicts, damages and judgments.
Through June 29, 2014, the Company has incurred approximately $21.7 million of mitigation, product redesign and appeal related expenses, of which approximately $4.5 million, $8.6 million and $3.6 million were recorded in fiscal 2014, 2013 and 2012, respectively and the Company expects to incur incremental mitigation, product redesign, and appeal related expenses during fiscal 2015 up to $1 million, all recorded within operating expenses. Engineering and development costs included expenses for activities to redesign, design around, modify, design, develop, test and requalify certain of the affected products, and to implement the end of life processes in the U.S. for certain other affected products. Sales and marketing costs included expenses for customer support, pre-production samples, education and training, and other miscellaneous costs. In addition, the Company has agreed to participate in certain customer royalty obligations arising under licensing agreements with Broadcom with respect to the infringing products. Through June 29, 2014, the Company has recorded approximately $4.4 million in cost of sales related to such customer obligations, of which approximately $3.4 million and $0.9 million related to such payments were recorded to cost of sales in fiscal 2014 and 2013, respectively. The Company may incur additional amounts related to these obligations of approximately $5 million in future periods, all of which will reduce gross margins in the periods accrued.
Effective March 30, 2014, the Company and Broadcom entered into a Dismissal and Standstill Agreement (the "Dismissal Agreement") pursuant to which the Company and Broadcom entered into certain understandings with respect to outstanding claims relating to and arising out of the patent infringement suit identified as Broadcom Corporation v. Emulex Corporation, Civil Action No. 8:09-cv-01058 (C.D.Cal.) brought by Broadcom against Emulex.
Pursuant to the terms of the Dismissal Agreement, Emulex has agreed to pay Broadcom, a non-refundable, non-cancelable dismissal and standstill fee for $5 million reflected in the accompanying financial statements in General and Administrative expense for the twelve months ended June 29, 2014, of which approximately $3.8 million was included in Accrued and Other Current Liabilities as of June 29, 2014.
Pursuant to the terms of the Dismissal Agreement, both parties agreed to dismiss, without prejudice, the unresolved claims by Broadcom, which were to be considered in a retrial scheduled for September 2014 (the "Dismissal Claims"). Emulex and Broadcom jointly submitted a request for Order on Joint Stipulation to Dismiss Claims Without Prejudice and Vacate Trial Date to the relevant court, and the court issued such Order on Joint Stipulation to Dismiss Claims Without Prejudice and Vacate Trial Date on April 2, 2014.
Broadcom agreed for a period of one year from entering into the Dismissal Agreement to provide advance notice to Emulex of future patent assertions and to participate in good faith dispute resolution procedures; and agreed to a one-year standstill in making any claims against Emulex, its subsidiaries or customers, or any third party suppliers of serializer/deserializer (SerDes) function blocks to Emulex. The standstill applies only to the extent the Broadcom claims would allege infringement on the SerDes Patents (as defined below) based solely on the use, manufacture, sale or import of certain Emulex products that were accused in the suit (Standstill Products). For purposes of the Dismissal Agreement, SerDes Patents means (i) U.S. Patent Nos. 6,424,194; 7,038,516; 7,125,169; 7,486,124; and 7,724,057, and any reissues, foreign counterparts, continuations, continuations-in-part, divisionals or reexaminations of the patents listed in clause (i) to the Dismissal Agreement. The Dismissal Agreement does not prevent, after the expiration of the one year standstill, Broadcom from bringing an infringement claim seeking an injunction or damages with respect to infringement of the SerDes Patents relating to the Standstill Products.
Shareholder Lawsuits
On May 21, 2014, a derivative shareholder complaint was filed in the United States District Court in the Central District of California (Case No. 8:14-cv-0076-DOC-JCG) alleging damages by Emulex and eight of the Company's eleven directors. The lawsuit alleges that Emulex was damaged by expenses for the repurchases of Emulex stock and by the implementation of cost reductions. An amended federal complaint was filed on July 14, 2014 in which the original plaintiff was dropped from the complaint and a different plaintiff was added. On August 15, 2014, the Company filed a motion to dismiss the complaint, which is scheduled to be heard on November 10, 2014. Management is unable to determine whether any loss will occur or to estimate the range of such loss. Therefore, no amount of loss has been accrued.
72
EMULEX CORPORATION AND SUBSIDIARIES
NOTES TO CONSOLIDATED FINANCIAL STATEMENTS — (Continued)
On July 17, 2014, a derivative shareholder complaint was filed in the Superior Court of the State of California for the County of Orange (Case No. 30-2014-00734802-CU-SL-CXC) alleging damages by Emulex and eight of the Company's eleven directors. The lawsuit alleges that Emulex was damaged by expenses for the repurchases of Emulex stock and by the implementation of cost reductions. On August 7, 2014, the parties filed a stipulation to stay the State Derivative Action pending the resolution of the motion to dismiss the Federal Derivative Action. A status conference in the State Derivative Action is scheduled for September 17, 2014. Management is unable to determine whether any loss will occur or to estimate the range of such loss. Therefore, no amount of loss has been accrued.
In addition to the ongoing litigation discussed above, the Company is involved in various claims and legal actions arising in the ordinary course of business. In the opinion of management, the ultimate disposition of the open matters will not have a material adverse effect on the Company’s consolidated financial position, results of operations or liquidity.
Other Commitments and Contingencies
In addition, the Company provides limited indemnification in selected circumstances within its various customer contracts whereby the Company indemnifies the parties to whom it sells its products with respect to the Company’s product infringement of certain intellectual property, and in some limited cases against bodily injury or damage to real or tangible personal property caused by a defective Company product. It is not possible to predict the maximum potential amount of future payments under these or similar agreements, due to the conditional nature of the Company’s obligations and the unique facts and circumstances involved in each particular agreement. As of June 29, 2014, the Company has not incurred any significant costs related to indemnification of its customers.
Note 11. Convertible Senior Notes
In November 2013, the Company issued $175.0 million aggregate principal amount of 1.75% Convertible Senior Notes due November 15, 2018 ("Convertible Senior Notes") in a private placement offering at a price equal to 100% of the principal amount thereof. Interest is payable semi-annually in arrears on May 15 and November 15 of each year, commencing May 15, 2014. The Company may be required to pay additional interest upon occurrence in certain events as outlined in the indenture governing the Convertible Senior Notes. The Convertible Senior Notes are unsecured and rank senior to the Company's future indebtedness that is expressly subordinated to the Convertible Senior Notes, equal with existing and future indebtedness that are not so subordinated and junior to any future secured indebtedness, all existing and future debt and other liabilities of the Company's subsidiaries. As of June 29, 2014, the remaining term of the Convertible Senior Notes is 4.4 years.
The Convertible Senior Notes are convertible, subject to certain conditions, into shares of the Company's common stock at an initial conversion price of approximately $10.30 per share, or 97.13 shares of the Company's common stock per $1,000 in principal amount of the Convertible Senior Notes. The conversion rate is subject to adjustment for certain events as outlined in the indenture governing the Convertible Senior Notes. On or prior to August 15, 2018, holders may convert their Convertible Senior Notes at their option under the following circumstances: (1) during any fiscal quarter after December 29, 2013, if the closing price of the Company's common stock for at least 20 trading days during the period of 30 consecutive trading days ending on the last trading day of the immediately preceding calendar quarter is greater than or equal to 130% of the conversion price on each applicable trading day; (2) during the five business day period after any five consecutive trading day period in which the trading price per $1,000 principal amount of Convertible Senior Notes was less than 98% of the product of the last reported sale price of the Company's common stock and the applicable conversion rate on such date; or (3) upon the occurrence of certain corporate transactions or specified distributions described in the indenture. Upon conversion, the principal amount of the Convertible Senior Notes will be paid in cash and the conversion spread will be paid in shares or cash at the Company’s election. As of June 29, 2014, the “if-converted” value of the Convertible Senior Notes did not exceed its principal amount and none of the conditions allowing holders of the Convertible Senior Notes to convert had been met.
The Company may not redeem the Convertible Senior Notes prior to maturity. However, in the event of a fundamental change, as defined in the indenture, the holders of the Convertible Senior Notes have the option to require the Company to repurchase all or a portion of their Convertible Senior Notes at a purchase price equal to 100% of the principal amount of the Convertible Senior Notes, plus accrued and unpaid interest. Holders who convert their Convertible Senior Notes in connection with a make-whole fundamental change, as defined in the indenture, may be entitled to an increase in the conversion rate.
Based on the terms of the embedded stock conversion option, the conversion option was determined to be indexed to the Company's stock. Accordingly, the conversion option was not accounted for separately as a derivative.
At the date of issuance, the Company separated the Convertible Senior Notes into liability and equity components. The liability component was determined by measuring the fair value of a similar instrument excluding the conversion feature. The equity component, which reflects the value of the conversion feature at issuance, was recognized as the difference between the proceeds from the issuance of the Convertible Senior Notes and the fair value of the liability component, and recorded as additional paid-in capital. The excess of the principal amount of the liability component over its carrying amount of
73
EMULEX CORPORATION AND SUBSIDIARIES
NOTES TO CONSOLIDATED FINANCIAL STATEMENTS — (Continued)
approximately $32.0 million is being amortized to interest expense over the term of the Convertible Senior Notes, using the effective interest rate method. The equity component is not remeasured as long as it continues to meet the conditions of equity classification.
The Company recorded total issuance costs of approximately $5.3 million, which have been allocated on a pro-rata basis to the debt and equity components, consistent with the allocation of the Convertible Senior Notes. The debt issuance costs attributable to the liability component of approximately $4.3 million were recorded in other assets and are being amortized over the term of the Convertible Senior Notes. The debt issuance costs attributable to the equity component of approximately $1.0 million were netted against the equity component of the Convertible Senior Notes and recorded as a reduction to additional paid-in capital. Debt issuance costs, net of amortization, were approximately $3.9 million as of June 29, 2014.
The carrying values of the liability and equity components of the Convertible Senior Notes consisted of the following as of June 29, 2014:
(in thousands) | ||||
Liability component: | ||||
Principal amount | $ | 175,000 | ||
Less: Unamortized debt discount | (28,522 | ) | ||
Net carrying amount | 146,478 | |||
Equity component | $ | 31,043 | ||
The following table sets forth total interest expense recognized related to the Convertible Senior Notes during fiscal 2014:
(in thousands) | |||
Contractual coupon interest expense | $ | 1,914 | |
Amortization of debt issuance costs | 417 | ||
Accretion of debt discount | 3,497 | ||
Total | $ | 5,828 | |
Effective interest rate | 6.62 | % | |
Note 12. Share Repurchase Programs
In November 2013, the Company's Board of Director's approved a $200.0 million share repurchase program that superseded the existing share repurchase program authorized in August 2008. The share repurchases are authorized to be completed through the combination of individually negotiated transactions, accelerated share buybacks, and open market purchases.
On November 13, 2013, the Company entered into an accelerated stock buyback agreement ("ASB") with Goldman, Sachs & Co. (Goldman Sachs) to repurchase an aggregate of approximately $44.3 million of outstanding common stock. The total aggregate number of shares repurchased pursuant to the ASB was based on the daily volume weighted average market price (VWAP) of the Company's common stock over the course of a calculation period, less a discount, and was subject to certain adjustments under the ASB. Under the ASB, the Company paid approximately $44.3 million to Goldman Sachs on November 18, 2013, and Goldman Sachs delivered to the Company approximately 4.6 million shares of common stock, reflecting 80% of the $44.3 million paid. The ASB was completed on April 30, 2014 and the Company received an additional 1.5 million shares of outstanding common stock, representing the 20% holdback. In total, approximately 6.1 million shares of the Company's outstanding common stock were delivered under the ASB at an average price of $7.27 per share.
During fiscal 2014, the Company repurchased approximately 22.5 million shares, at an average price of $6.68 per share, for a total of $150.0 million, recorded as treasury stock, which included the 6.1 million shares repurchased through the ASB for approximately $44.3 million and approximately 16.4 million shares from the open market and individually negotiated transactions for approximately $105.7 million.
As of June 29, 2014, approximately $50.0 million remains under the authorized repurchase program.
74
EMULEX CORPORATION AND SUBSIDIARIES
NOTES TO CONSOLIDATED FINANCIAL STATEMENTS — (Continued)
Note 13. Stock-Based Compensation
As of June 29, 2014, the Company had three stock-based plans for employees and directors that are open for future awards and are described below. In addition, the Company had nine stock-based plans, including seven plans assumed in connection with acquisitions, each of which is closed for future grants but has options outstanding.
Amounts recognized in the financial statements with respect to these plans for fiscal 2014, 2013 and 2012 are as follows:
2014 | 2013 | 2012 | |||||||||
(in thousands) | |||||||||||
Cost of stock-based payment plans during the period(1)(2) | $ | 15,226 | $ | 21,844 | $ | 22,084 | |||||
Amounts capitalized in inventory during the period | (427 | ) | (549 | ) | (527 | ) | |||||
Amounts recognized in income for amounts previously capitalized in inventory | 458 | 507 | 612 | ||||||||
Amounts charged against income, before income tax benefit | $ | 15,257 | $ | 21,802 | $ | 22,169 | |||||
Amount of related income tax benefit recognized in income(3) | $ | — | $ | — | $ | — | |||||
(1) | Includes approximately $4.8 million and $4.1 million of stock-based compensation related to the ServerEngines contingent consideration tied to future employment and related 2012 modification in fiscal 2013 and 2012, respectively. |
(2) | Includes Cash-Settled Unit Awards of approximately $1.1 million and $1.3 million in fiscal 2014 and 2013, respectively classified as a liability since these awards are settled in cash and do not impact shareholders’ equity. |
(3) | There was no tax benefit recognized in income in fiscal 2014, 2013 or 2012 due to the Company’s valuation allowance for deferred tax assets (see Note 14). |
Employee Stock Purchase Plan
The Employee Stock Purchase Plan (the ESPP) was adopted by the Board of Directors and approved by the stockholders in 2000 and became effective on January 1, 2001. The ESPP was further amended in 2007 (effective on November 15, 2007) and in 2014 (effective November 21, 2013) (Amended ESPP). The Compensation Committee of the Board of Directors administers the Amended ESPP. Under the Amended ESPP, employees of the Company who elect to participate have the right to purchase common stock at a 15% discount from the lower of the market value of the common stock at the beginning or the end of each six month offering period. The six month offering periods are May 1 to October 31 and November 1 to April 30 of each year. In August 2014, the Board of Directors approved a change to the participation periods for the Amended ESPP. The six month offering periods are now May 8 to November 7 and November 8 to May 7 (other than with respect to 2014, during which the period is May 1 to November 7). Employees purchase common stock using payroll deductions, which may not exceed 10% of their eligible compensation (the amount may be increased from time to time by the Company but may not exceed 15% of eligible compensation). In addition, the maximum number of shares that an employee may purchase in each six month period is 1,000 shares with the maximum dollar amount of $25,000 in any calendar year. On February 6, 2014, the Company’s stockholders approved an amendment to increase the number of shares authorized for issuance under the Amended ESPP by 3,250,000 shares and extend the termination date of the Amended ESPP to October 23, 2018. The Company reserved a total of 9,700,000 shares of common stock for issuance under the Amended ESPP. As of June 29, 2014, 3,648,423 shares were available for future award grants under the Amended ESPP.
2005 Equity Incentive Plans
On December 1, 2005, the Company’s shareholders ratified and approved the Emulex Corporation 2005 Equity Incentive Plan (the Equity Incentive Plan). The Company’s Equity Incentive Plan permits the grant of stock options, restricted stock awards and restricted stock units (collectively, unvested stock awards), and stock appreciation rights to its domestic and international employees. The aggregate number of shares that may be granted under the Equity Incentive Plan consists of 2,937,475 shares of common stock, plus the number of shares underlying options that were outstanding on the effective date of the Equity Incentive Plan (October 24, 2005) that expire, are forfeited, cancelled or terminate for any reason under the Employee Stock Option Plan and the 2004 Employee Stock Incentive Plan without having been exercised in full. From fiscal 2007 to fiscal 2014, the Company’s stockholders approved an aggregate of 6,500,000 in shares authorized for issuance under the Equity Incentive Plan.
The Equity Incentive Plan is administered by the Board of Directors, or at the discretion of the Board, by a committee consisting of two or more independent directors of the Company (the Committee). As of June 29, 2014, 4,338,234 shares were
75
EMULEX CORPORATION AND SUBSIDIARIES
NOTES TO CONSOLIDATED FINANCIAL STATEMENTS — (Continued)
available for future award grants under the Equity Incentive Plan, including the shares available for grant under the Employee Stock Option Plan, 2004 Employee Stock Incentive Plan, Aarohi Communications, Inc. 2001 Stock Option Plan (the Aarohi Plan), the Sierra Logic, Inc. 2001 Stock Option Plan (the Sierra Plan), and the ServerEngines Corporation Amended and Restated 2008 Stock Option Plan (the ServerEngines Plan).
Stock option awards are granted with an exercise price not less than fair market value of the Company’s stock at the date of grant; these awards generally vest over three years of continuous service and have a six year contractual term. Certain stock option awards provide for accelerated vesting if there is a change in control (as defined in the Equity Incentive Plan) or achieving certain performance targets within the meaning of Section 162(m) of the Internal Revenue Code and the regulations thereunder.
Unvested stock awards may be awarded (or sold at a purchase price determined by the Board or Committee) upon terms established by the Board or Committee at its sole discretion. The vesting provisions of unvested stock awards will be determined individually by the Board or Committee for each grant, but generally vest 30%, 30%, and 40% on the first, second and third anniversaries of the date of grant, respectively. As of June 29, 2014, 3,477,565 shares of unvested stock awards were outstanding.
Performance-based stock awards are subject to the attainment of performance goals established by the Board or Committee, the periods during which performance is to be measured, and all other limitations and conditions applicable to the awarded shares. Performance goals are based on a pre-established objective formula or standard that specifies the manner of determining the number of performance awards that will be granted if the performance goal is attained. The Company started granting performance-based stock awards to certain employees in August 2010 under the Equity Incentive Plan. As of June 29, 2014, 121,569 shares of performance awards were outstanding.
During fiscal 2014 and 2013, the Company granted unvested stock awards that will be settled in cash upon vesting (Cash-Settled Unit Awards). Such awards are liability classified as they will be settled in cash. The Cash-Settled Unit Awards vest 30%, 30%, and 40% on the first, second and third anniversaries of the date of grant, respectively. Some of these awards are tied to the achievement of certain performance goals established by the Board of Directors. As of June 29, 2014, the liability related to Cash-Settled Unit Awards was approximately $1.0 million and will continue to be remeasured at each reporting date until the awards vest. As of June 29, 2014, 322,870 shares of Cash-Settled Unit Awards were outstanding.
Unrestricted stock awards are free of any vesting provisions. As of June 29, 2014, there were no unrestricted stock awards outstanding.
Stock appreciation rights entitle the holder to receive the appreciation in the value of common stock underlying the stock appreciation right. The Board or Committee may grant a stock appreciation right either as a standalone right, or if such right does not provide for the deferral of compensation within the meaning of Section 409A of the Internal Revenue Code of 1986, as amended, in tandem with all or any part of the shares of common stock that may be purchased by the exercise of a stock option. As of June 29, 2014, there were no stock appreciation rights outstanding.
Non-Employee Director Plan
The Company’s Stock Award Plan for Non-Employee Directors (the Director Plan) was amended and approved by the stockholders on November 30, 2006 to allow for a maximum of 1,880,000 shares of common stock to be issued. Non-employee directors receive two annual grants. Beginning in fiscal 2011, the first annual grant is an unvested stock award with an aggregate market value on the date of grant equal to $200,000. In addition, on December 2 of each year, each non-employee director receives a second annual unvested stock award with an aggregate market value on the date of grant equal to $125,000; provided, however, that the first annual grant will be reduced pro rata (based on the percentage of a year served as a director prior to the date of the first annual grant) if the annual unvested stock award is granted within less than one year after the grant of the $200,000 initial unvested stock award described above. The annual unvested stock award grants to non-employee directors vest 50% on the date of grant and 50% six months thereafter. No options granted under the Director Plan shall be exercisable after the expiration of the earlier of (i) ten years following the date the option is granted or (ii) one year following the date the optionee ceases to be a director of the Company for any reason. The administrator of the Director Plan has the discretion to grant additional awards in the form of unvested stock awards or stock appreciation rights or to substitute unvested stock awards or stock appreciation rights for the formula grants described above. Options granted under the Director Plan are non-qualified stock awards. On November 20, 2012, the Company’s stockholders approved an amendment to increase the number of shares authorized for issuance under the plan by 500,000 shares. As of June 29, 2014, 639,608 shares were available for future award grants under the Director Plan.
Employee Stock Option Plan and 2004 Employee Stock Incentive Plan
76
EMULEX CORPORATION AND SUBSIDIARIES
NOTES TO CONSOLIDATED FINANCIAL STATEMENTS — (Continued)
The Company’s shareholder-approved Employee Stock Option Plan (the Plan) permitted the grant of stock options and unvested stock to its domestic and international employees for up to approximately 33.7 million shares of common stock. Stock option awards were granted under the plan with an exercise price not less than the fair market value of the Company’s stock at the date of grant. With the approval and adoption of the Equity Incentive Plan on December 1, 2005, the Plan became closed for future grants of options.
The Company’s shareholder-approved 2004 Employee Stock Incentive Plan (the 2004 Plan) permitted the grant of stock options and unvested or unrestricted shares to its employees for up to 2,000,000 shares of common stock. The purchase price for the shares subject to any option granted under the 2004 Plan was not permitted to be less than 100% of the fair market value of the shares of common stock of the Company on the date the option was granted. With the approval and adoption of the Equity Incentive Plan on December 1, 2005, the 2004 Plan became closed for future award grants.
Options granted under the Plan and the 2004 Plan prior to August 2005 had a 10 year contractual term and vested 25% on the first anniversary of the date of grant with an additional 6.25% vesting after the end of each consecutive calendar quarter thereafter with continuous service, except when otherwise provided by the Board of Directors or the Compensation Committee. Beginning with awards granted in August 2005, each option granted generally has a six year contractual term and vests 30% on the first anniversary of the grant date, 7.5% vesting at the end of each of the next four consecutive calendar quarters and 10% vesting at the end of each of the next four consecutive quarters thereafter with continuous service, except when otherwise provided by the Board of Directors or the Compensation Committee.
Acquisition Plans
In connection with the acquisition of ServerEngines on August 25, 2010, the Company assumed the ServerEngines Plan. The ServerEngines options were replaced with Emulex options based on the acquisition exchange ratio and continue to be subject to the terms of the ServerEngines Plan. The options have lives of up to 10 years and generally vest over a 4 or 5 year period. The ServerEngines Plan is closed for future grants. There were 472,732 options issued in exchange for the options assumed. The Company also assumed the Sierra Plan and the Aarohi Plan (collectively, the Acquisition Plans). Shares previously authorized for issuance under the Acquisition Plans are no longer available for future grants, but options previously granted under these plans remain outstanding. Shares that expired, forfeited, cancelled or terminated for any reason under the ServerEngines Plan, the Sierra Plan and the Aarohi Plan may be granted under the Equity Incentive Plan.
Adequacy of Available Shares for All Plans
As of June 29, 2014, we anticipate that the number of shares authorized under the Equity Incentive Plan, the Director Plan, and the Amended ESPP are sufficient to cover future stock option exercises and shares that will be purchased during the next six month plan period from May 1, 2014 to October 31, 2014 under the Amended ESPP.
Valuation of Stock-Based Compensation
The assumptions used to compute the fair value of the compensatory element related to the Amended ESPP for fiscal 2014, 2013 and 2012 were:
2014 | 2013 | 2012 | |||
Expected volatility | 24% - 30% | 35% - 45% | 45% | ||
Weighted average expected volatility | 27% | 39% | 45% | ||
Expected dividends | —% | — | — | ||
Expected term (in years) | 0.5 | 0.5 | 0.5 | ||
Weighted average expected term (in years) | 0.5 | 0.5 | 0.5 | ||
Risk-free interest rate | 0.05% - 0.08% | 0.08% - 0.16% | 0.06% - 0.14% | ||
The assumptions used to compute the fair value of stock option grants under the Equity Incentive Plan for fiscal 2014, 2013 and 2012 were:
2014 | 2013 | 2012 | |||
Expected volatility | 37% - 42% | 40% - 47% | 45% - 47% | ||
Weighted average expected volatility | 39% | 45% | 46% | ||
Expected dividends | — | — | — | ||
Expected term (in years) | 3.8 - 5.9 | 3.8 - 5.8 | 3.6 - 5.6 | ||
Weighted average expected term (in years) | 4.6 | 4.6 | 4.4 | ||
Risk-free interest rate | 1.07% - 2.04% | 0.53% - 1.48% | 0.67% - 1.22% | ||
77
EMULEX CORPORATION AND SUBSIDIARIES
NOTES TO CONSOLIDATED FINANCIAL STATEMENTS — (Continued)
Stock-Based Awards Activity
A summary of stock option activity under the plans for fiscal 2014 is presented below:
Options | Weighted Average Exercise Price | Weighted Average Remaining Contractual Term (Years) | Aggregate Intrinsic Value | |||||||||
(in millions) | ||||||||||||
Options outstanding at June 30, 2013 | 4,220,262 | $ | 12.28 | 2.47 | $ | 0.6 | ||||||
Options granted | 525,374 | 7.35 | ||||||||||
Options exercised | (94,898 | ) | 4.35 | |||||||||
Options expired | (1,721,281 | ) | 15.37 | |||||||||
Options forfeited | (117,538 | ) | 7.65 | |||||||||
Options outstanding at June 29, 2014 | 2,811,919 | $ | 9.95 | 2.47 | $ | 0.2 | ||||||
Options vested and expected to vest at June 29, 2014 | 2,785,309 | $ | 9.99 | 2.43 | $ | 0.2 | ||||||
Options exercisable at June 29, 2014 | 2,122,022 | $ | 10.80 | 1.77 | $ | 0.2 | ||||||
A summary of outstanding and unvested stock award activity for fiscal 2014 is presented below:
Number of Shares | Weighted Average Grant Date Fair Value | |||||
Awards outstanding and unvested at June 30, 2013 | 3,413,522 | $ | 7.74 | |||
Awards granted | 2,562,867 | 7.45 | ||||
Awards vested | (1,696,243 | ) | 8.29 | |||
Awards forfeited | (681,012 | ) | 7.63 | |||
Awards outstanding and unvested at June 29, 2014 | 3,599,134 | $ | 7.29 | |||
Awards vested and expected to vest at June 29, 2014 | 3,158,034 | |||||
A summary of Cash-Settled Unit Award activity for fiscal 2014 is as follows:
Number of Shares | Weighted Average Grant Date Fair Value | |||||
Awards outstanding and unvested at June 30, 2013 | 552,723 | $ | 7.41 | |||
Awards granted | 29,359 | 6.43 | ||||
Awards vested | (190,301 | ) | 7.47 | |||
Awards forfeited | (68,911 | ) | 7.58 | |||
Awards outstanding and unvested at June 29, 2014 | 322,870 | $ | 7.25 | |||
Awards vested and expected to vest at June 29, 2014 | 295,611 | |||||
As of June 29, 2014, there was approximately $13.8 million of total unrecognized compensation cost related to nonvested share-based compensation arrangements granted under the plans. This cost is expected to be recognized over a weighted-average service period of approximately 1.2 years.
The weighted average grant date fair value of options granted in fiscal 2014, 2013 and 2012 was $2.60, $2.80 and $2.95, respectively. The weighted average grant date fair value of unvested stock awards granted in fiscal 2014, 2013 and 2012 was $7.45, $6.87 and $7.59, respectively. The total intrinsic value of stock options exercised in fiscal 2014, 2013 and 2012 was approximately $0.3 million, $0.1 million and $0.5 million, respectively. The total fair value of unvested stock awards that vested in fiscal 2014, 2013 and 2012 was approximately $12.2 million, $12.3 million and $13.3 million, respectively. Cash received from stock option exercises under stock-based plans and shares purchased under the Purchase Plan in fiscal 2014, 2013 and 2012 was approximately $5.0 million, $4.9 million and $7.7 million, respectively. The actual tax benefit realized for the tax deductions from option exercises and vested stock awards was approximately $5.0 million, $4.4 million and $5.2 million in fiscal 2014, 2013 and 2012, respectively.
78
EMULEX CORPORATION AND SUBSIDIARIES
NOTES TO CONSOLIDATED FINANCIAL STATEMENTS — (Continued)
Note 14. Income Taxes
(Loss) income before income taxes consists of the following components:
2014 | 2013 | 2012 | |||||||||
(In thousands) | |||||||||||
United States | $ | (37,613 | ) | $ | (27,473 | ) | $ | (60,627 | ) | ||
International | 11,427 | 21,890 | 51,125 | ||||||||
Total loss before income taxes | $ | (26,186 | ) | $ | (5,583 | ) | $ | (9,502 | ) | ||
A reconciliation of the income tax provision (benefit) with the amount computed by applying the federal statutory tax rate to income before income taxes is as follows:
2014 | 2013 | 2012 | |||||||||
(In thousands) | |||||||||||
Expected income tax (benefit) expense at the statutory rate | $ | (9,165 | ) | $ | (1,954 | ) | $ | (3,325 | ) | ||
State income tax (benefit) expense, net of federal tax | 116 | 138 | (38 | ) | |||||||
Change in valuation allowance | 10,753 | 10,767 | 12,730 | ||||||||
Tax rate differential on foreign earnings | (5,140 | ) | (6,404 | ) | (8,554 | ) | |||||
Reversal of uncertain tax position accruals | (889 | ) | — | — | |||||||
Research and other credits | (2,664 | ) | (7,350 | ) | (2,571 | ) | |||||
Stock-based compensation | 2,088 | 2,150 | 1,921 | ||||||||
Section 199 deduction | — | 1,357 | — | ||||||||
Tax impact on unrealized foreign currency gains (losses) on monetary assets and liabilities | 3,204 | (281 | ) | — | |||||||
Expiration of capital loss carryforward | 1,741 | — | — | ||||||||
Non-deductible interest | 1,161 | — | — | ||||||||
Other | 2,141 | 1,208 | 1,415 | ||||||||
Total income tax expense (benefit) | $ | 3,346 | $ | (369 | ) | $ | 1,578 | ||||
During fiscal 2014, the Company recognized a tax expense of $1.2 million related to the nondeductible interest from its issuance of convertible debt and $1.7 million related to the expiration of capital loss carryforwards which had been fully offset by a valuation allowance in previous fiscal years. This increase in tax expense was partially offset by a reduction to our tax expense of approximately $0.9 million related to uncertain tax positions being effectively settled during the fiscal year. In addition, during the fourth quarter of fiscal 2014, the Company identified an impact to the tax provision related to intercompany loans between subsidiaries. In accordance with local jurisdiction tax laws, the Company must recognize as taxable income/loss the unrealized currency exchange gain/loss resulting from outstanding inter-company loans. As a result, the Company recognized total net tax expense for this matter of approximately $3.2 million during the fourth quarter, the liability of which will be settled through the utilization of its net operating losses.
During fiscal 2013, President Obama signed The American Taxpayer Relief Act of 2012 into law which contained a provision extending the federal credit for increasing research activities (Research and Development Tax Credit) retroactively from January 1, 2012 through December 31, 2013. As a result of this legislation, the Company recorded additional Research and Development Tax Credit carryforwards during fiscal 2013 for amounts generated in fiscal 2012 of approximately $2.4 million. This increase in deferred tax assets relating to these research and development tax credit carryforwards was fully offset by a valuation allowance. In addition, as a result of the Company’s fiscal 2013 taxable loss that was carried back to fiscal 2011, the Company recorded tax expense of approximately $1.4 million in fiscal 2013 reflecting Section 199 deductions recognized in fiscal 2011 that were no longer available as a result of the carryback claim.
In fiscal 2012, primarily as a result of its Settlement Agreement with Broadcom, the Company determined that there was insufficient positive evidence to support a more likely than not recovery of its remaining U.S. federal and state deferred tax assets for amounts greater than the amount of taxes previously paid in available carryback periods. As a result, the Company recorded an increase to its valuation allowance of approximately $16.4 million. In addition, the Company was also only able to recognize tax benefits associated with the U.S. federal research credit for the first half of fiscal 2012 due to the expiration of such tax credit at the end of calendar year 2011.
79
EMULEX CORPORATION AND SUBSIDIARIES
NOTES TO CONSOLIDATED FINANCIAL STATEMENTS — (Continued)
The components of income taxes are as follows:
2014 | 2013 | 2012 | |||||||||
(In thousands) | |||||||||||
Current: | |||||||||||
Federal | $ | (21 | ) | $ | (7,882 | ) | $ | 4,514 | |||
State | 116 | (118 | ) | 401 | |||||||
Foreign | 1,836 | 5,745 | 3,420 | ||||||||
Total current | 1,931 | (2,255 | ) | 8,335 | |||||||
Deferred: | |||||||||||
Federal | — | 6,261 | (7,850 | ) | |||||||
State | — | 256 | (299 | ) | |||||||
Foreign | 1,415 | (4,631 | ) | 1,392 | |||||||
Total deferred | 1,415 | 1,886 | (6,757 | ) | |||||||
Total income tax expense (benefit) | $ | 3,346 | $ | (369 | ) | $ | 1,578 | ||||
The Company’s deferred tax assets and liabilities are comprised of the following major components:
2014 | 2013 | ||||||
(In thousands) | |||||||
Deferred tax assets: | |||||||
Reserves and accruals not currently deductible | $ | 5,455 | $ | 6,810 | |||
Share-based compensation | 6,495 | 9,474 | |||||
Net operating loss carryforwards | 27,908 | 25,070 | |||||
General business credit carryforwards | 43,923 | 40,383 | |||||
Capitalized research and development expenditures | 2,873 | 3,366 | |||||
Capital loss carryforwards | 3,392 | 5,161 | |||||
Intangible assets | 3,852 | 4,310 | |||||
Other | 2,241 | 354 | |||||
Total gross deferred tax assets | 96,139 | 94,928 | |||||
Valuation allowance | (72,100 | ) | (60,091 | ) | |||
Total deferred tax assets, net of valuation allowance | 24,039 | 34,837 | |||||
Deferred tax liabilities: | |||||||
Property and equipment | $ | 2,636 | $ | 4,173 | |||
Intangible assets | 34,651 | 43,453 | |||||
Other | 2,079 | 1,123 | |||||
Total gross deferred tax liabilities | 39,366 | 48,749 | |||||
Net deferred tax liabilities | $ | (15,327 | ) | $ | (13,912 | ) | |
Deferred income taxes reflect the net tax effects of tax carryforwards and temporary differences between the carrying amount of assets and liabilities for tax and financial reporting purposes. As of June 29, 2014, the Company has recorded approximately $15.3 million in deferred tax liabilities related to its foreign operations. Based on available positive and negative evidence including the Company’s historical results of operations, scheduled reversals of temporary differences, and available tax planning strategies, management concluded that it was more likely than not that the Company’s U.S. federal and state deferred tax assets will not be realizable, and accordingly, has recorded a valuation allowance of approximately $72.1 million as of June 29, 2014.
The Company had approximately $9.2 million of capital loss carryforwards available as of June 29, 2014. If unused, these carryforwards will expire in fiscal year 2016.
As of June 29, 2014, the Company had federal, California, and international net operating loss carryforwards of approximately $55.3 million, $52.9 million, and $12.3 million, respectively, available to offset future federal, state, and international taxable income. If unused, the federal net operating loss carryforwards will expire during the fiscal years 2022 through 2034, and the state net operating loss carryforwards will begin to expire in fiscal 2016. Included in the federal net
80
EMULEX CORPORATION AND SUBSIDIARIES
NOTES TO CONSOLIDATED FINANCIAL STATEMENTS — (Continued)
operating loss carryforwards are ServerEngines losses of approximately $28.6 million, Aarohi Communications, Inc. losses of approximately $19.2 million and Sierra Logic, Inc. losses of approximately $0.4 million. The annual utilization of these net operating loss carryforwards is limited due to restrictions imposed under federal law due to a change in ownership.
The Company had federal and state research and experimentation credit carryforwards as of June 29, 2014, of approximately $16.5 million and $27.4 million, respectively, which are available to reduce federal and state income taxes. If unused, the federal carryforwards will expire during fiscal years 2015 through 2034, and certain state carryforwards will begin to expire in fiscal 2029.
The Company has made no provision for U.S. income taxes or foreign withholding taxes on the earnings of its foreign subsidiaries, as these amounts are intended to be indefinitely reinvested in operations outside the United States. As of June 29, 2014, there are no cumulative amounts of undistributed earnings at the Company’s foreign subsidiaries.
The Company files federal, state, and foreign income tax returns in jurisdictions with varying statutes of limitations. The Company’s federal income tax returns for fiscal years 2008 to 2013 and California income tax returns for fiscal years 2008 to 2013 are open as the statutes of limitations have not yet expired or have been extended. The Company’s California income tax return for fiscal years 2008 and 2009 are currently under examination by the California Franchise Tax Board. In addition, the Company is currently under audit by various state and international taxing authorities. In foreign jurisdictions, with few exceptions, the Company is subject to examinations for all years subsequent to fiscal 2010. The Company does not expect any audits for these foreign jurisdictions to have a material effect on the results of operations of financial position.
The Internal Revenue Service (IRS) completed its examination of the Company’s federal income tax returns for fiscal years 2008 and 2009 and the amended return filed for fiscal year 2007 and issued a 30-Day Letter in March 2014. In the 30-Day Letter, the IRS proposed adjustments related to the amount of "buy-in-payments" made by one of the international subsidiaries to the Company in connection with the cost-share agreement entered into by the Company and its international subsidiary in fiscal 2008. The incremental tax liability asserted in the 30-Day Letter is approximately $70.0 million, excluding interest and penalties. Upon the 30th day from the issuance of the 30-Day Letter from the IRS, the Company began accruing additional interest and will continue to do so until resolution. The Company responded to the 30-Day Letter in May 2014, disagreeing with the IRS' proposed adjustments and the basis for its positions, and will administratively appeal to the IRS Appeals Office.
The Company has previously accrued for what it believes are adequate amounts of tax and related interest, if any, that may result from these state and federal examinations. Such accruals are reviewed quarterly and adjusted as events occur that affect potential liabilities for additional taxes, such as lapsing of applicable statutes of limitations, proposed assessments by tax authorities, negotiations with tax authorities, identification of new issues, and issuance of new regulations or case law. If the ultimate resolution of these examinations are substantially different from the Company’s estimate of any potential associated liabilities, the resulting adjustments could have a material adverse effect on Emulex’s tax provision, net income/(loss) and cash flows.
For fiscal years ended June 29, 2014 and June 30, 2013, the Company had total unrecognized tax benefits of approximately $40.2 million and $42.7 million, respectively. If fully recognized, approximately $26.5 million of the $40.2 million would impact the Company’s effective tax rate. Absent any resolution of the on-going audit by the IRS discussed above, the Company does not expect that the liability for unrecognized tax benefits will change significantly within the next 12 months.
A rollforward of the activity in the gross unrecognized tax benefits for fiscal years 2014 and 2013 is as follows:
2014 | 2013 | ||||||
(In thousands) | |||||||
Balance at beginning of year | $ | 42,730 | $ | 39,757 | |||
Additions based on tax positions related to the current year | 1,110 | 1,917 | |||||
Additions for tax positions of prior years | — | 1,056 | |||||
Reductions for tax positions of prior years | (616 | ) | — | ||||
Reductions for tax positions due to a lapse in statute | — | — | |||||
Reductions for tax positions due to settlements | (2,979 | ) | — | ||||
Balance at end of year | $ | 40,245 | $ | 42,730 | |||
The decrease in unrecognized tax benefits was primarily due to the effective settlement of audits. In addition to the unrecognized tax benefits noted above, the Company had accrued interest and penalties related to unrecognized tax benefits included in other liabilities of approximately $3.7 million and $3.0 million as of June 29, 2014 and June 30, 2013, respectively.
81
EMULEX CORPORATION AND SUBSIDIARIES
NOTES TO CONSOLIDATED FINANCIAL STATEMENTS — (Continued)
Note 15. Operating Segments and Revenue by Product Families, Geographic Area and Significant Customers
Reporting Segment Information and Revenues by Product Families
Emulex has two reportable business segments, Connectivity and Visibility. The Connectivity segment includes the operating results of NCP and SCOP. The Visibility segment includes the operating results of NVP.
Customers in the NCP market use the Company’s industry standard Fibre Channel and Ethernet solutions to provide server I/O and target storage array connectivity to create networks for mission critical enterprise and cloud data centers. These products enable servers to reliably and efficiently connect to LANs, SANs, and NAS by offloading data communication processing tasks from the server as information is delivered and sent to the network. The Ethernet based NCP products include LOM application specific integrated circuits, OneConnect® UCNAs, and custom form factor solutions for OEM blade servers that enable high performance, scalable networks and convergence. The Fibre Channel based NCP products include FC ASICs, LightPulse® HBAs, and custom form factor solutions for OEM blade servers.
SCOP include InSpeed®, SOC or backend connectivity, bridge, router products, iBMC, certain legacy products and other products and services. SCP are deployed inside storage arrays, tape libraries, and other storage appliances, and connect storage controllers to storage capacity, delivering improved performance, reliability, and connectivity.
NVP consists entirely of the recently acquired Endace® family of network visibility and intelligent network recording products.
The Company’s net revenues by segment and product lines are:
2014 | 2013 | 2012 | |||||||||
(In thousands) | |||||||||||
Net revenues: | |||||||||||
Connectivity Segment: | |||||||||||
Network Connectivity Products | $ | 318,940 | $ | 360,974 | $ | 362,315 | |||||
Storage Connectivity & Other Products | 94,515 | 104,409 | 139,454 | ||||||||
Total Connectivity Segment | 413,455 | 465,383 | 501,769 | ||||||||
Visibility Segment: | |||||||||||
Network Visibility Products | 33,878 | 13,184 | — | ||||||||
Total net revenues | $ | 447,333 | $ | 478,567 | $ | 501,769 | |||||
Other segment information is as follows:
82
EMULEX CORPORATION AND SUBSIDIARIES
NOTES TO CONSOLIDATED FINANCIAL STATEMENTS — (Continued)
2014 | 2013 | 2012 | |||||||||
(In thousands) | |||||||||||
Adjusted operating income (loss): | |||||||||||
Connectivity Segment: | $ | 64,353 | $ | 71,711 | $ | 84,871 | |||||
Visibility Segment: | (9,387 | ) | (2,217 | ) | — | ||||||
Subtotal | $ | 54,966 | $ | 69,494 | $ | 84,871 | |||||
Reconciling items: | |||||||||||
Stock-based compensation | (15,257 | ) | (21,802 | ) | (22,169 | ) | |||||
Amortization of intangibles | (31,291 | ) | (27,735 | ) | (30,600 | ) | |||||
Patent litigation settlement, damages, and royalties | (7,426 | ) | (4,963 | ) | (37,310 | ) | |||||
Mitigation expenses related to the Broadcom patents | (9,458 | ) | (8,606 | ) | (3,584 | ) | |||||
Site closure and other restructuring costs | (9,152 | ) | (2,704 | ) | — | ||||||
Other | (2,541 | ) | (4,393 | ) | (1,142 | ) | |||||
Reconciling items | (75,125 | ) | (70,203 | ) | (94,805 | ) | |||||
Operating loss | (20,159 | ) | (709 | ) | (9,934 | ) | |||||
Depreciation: | |||||||||||
Connectivity Segment: | $ | 16,316 | $ | 17,303 | $ | 18,064 | |||||
Visibility Segment: | 2,720 | 897 | — | ||||||||
$ | 19,036 | $ | 18,200 | $ | 18,064 | ||||||
Amortization | |||||||||||
Connectivity Segment: | $ | 25,832 | $ | 26,137 | $ | 30,600 | |||||
Visibility Segment: | 5,459 | 1,598 | — | ||||||||
$ | 31,291 | $ | 27,735 | $ | 30,600 | ||||||
Capital Expenditures | |||||||||||
Connectivity Segment: | $ | 13,262 | $ | 15,037 | $ | 14,936 | |||||
Visibility Segment: | 2,723 | 685 | — | ||||||||
$ | 15,985 | $ | 15,722 | $ | 14,936 | ||||||
2014 | 2013 | ||||||
(In thousands) | |||||||
Total Assets | |||||||
Connectivity Segment: | $ | 568,709 | $ | 549,443 | |||
Visibility Segment: | 149,214 | 161,266 | |||||
$ | 717,923 | $ | 710,709 | ||||
Geographic Operations
The Company’s consolidated net revenues by geographic area based on bill-to location are:
2014 | 2013 | 2012 | ||||||||||||||||||
(In thousands) | ||||||||||||||||||||
Asia Pacific | $ | 264,771 | 59 | % | $ | 284,064 | 60 | % | $ | 286,572 | 57 | % | ||||||||
United States | 114,427 | 26 | % | 121,719 | 25 | % | 137,504 | 28 | % | |||||||||||
Europe, Middle East, and Africa | 65,286 | 14 | % | 66,457 | 14 | % | 76,394 | 15 | % | |||||||||||
Rest of the world | 2,849 | 1 | % | 6,327 | 1 | % | 1,299 | — | % | |||||||||||
Total net revenues | $ | 447,333 | 100 | % | $ | 478,567 | 100 | % | $ | 501,769 | 100 | % | ||||||||
Individual international countries with more than 10% of consolidated net revenue based on bill-to location are:
Net Revenues | ||||||||
2014 | 2013 | 2012 | ||||||
Singapore | 34 | % | 39 | % | 39 | % | ||
Taiwan | 13 | % | 12 | % | 10 | |||
83
EMULEX CORPORATION AND SUBSIDIARIES
NOTES TO CONSOLIDATED FINANCIAL STATEMENTS — (Continued)
No other individual country in Asia Pacific, Europe, Middle East, Africa or the rest of the world accounted for more than 10% of net revenues during these periods.
The Company’s consolidated long-lived assets and net assets by geographic area are:
Long-Lived Assets | |||||||
2014 | 2013 | ||||||
United States | $ | 49,138 | $ | 53,014 | |||
International | 10,770 | 9,401 | |||||
$ | 59,908 | $ | 62,415 | ||||
Net Assets | |||||||
2014 | 2013 | ||||||
United States | $ | 218,021 | $ | 330,422 | |||
International | 236,625 | 257,203 | |||||
$ | 454,646 | $ | 587,625 | ||||
Significant Customers
The following table represents direct sales to customers accounting for greater than 10% of the Company’s consolidated net revenues or customer accounts receivable accounting for greater than 10% of the Company’s accounts receivable. Revenues and related accounts receivable from these customers are derived under Networking Segment contracts.
Net Revenues | Accounts Receivable | |||||||||||||
2014 | 2013 | 2012 | 2014 | 2013 | ||||||||||
Hewlett-Packard | 16 | % | 19 | % | 22 | % | 12 | % | 17 | % | ||||
Hon Hai Precision Industry Co., Ltd. (Foxconn Technology Group)(1) | 13 | % | 12 | % | — | 11 | % | 13 | % | |||||
IBM | 29 | % | 32 | % | 32 | % | 32 | % | 36 | % | ||||
(1) | Hon Hai Precision Industry Co., Ltd. is a contract manufacturer that performed manufacturing for some of our OEM customers. |
In addition to direct sales, some of the Company’s larger OEM customers purchase products indirectly through distributors, resellers, or other third parties. Customers with total direct and indirect revenues, including customer specific models purchased indirectly through distributors, resellers, and other third parties, of more than 10% in the current fiscal year were as follows:
Net Revenues | ||||||||
2014 | 2013 | 2012 | ||||||
EMC | 10 | % | 11 | % | — | |||
Hewlett-Packard | 22 | % | 23 | % | 24 | % | ||
IBM | 33 | % | 35 | % | 37 | % | ||
Note 16. Net (Loss) Income per Share
The following table sets forth the computation of basic and diluted net (loss) income per share:
84
2014 | 2013 | 2012 | |||||||||
(In thousands, except per share data) | |||||||||||
Numerator — Net (loss) income | $ | (29,532 | ) | $ | (5,214 | ) | $ | (11,080 | ) | ||
Less: Undistributed earnings allocated to participating securities | — | — | — | ||||||||
Undistributed earnings allocated to common shareholders for basic net (loss) income per share | $ | (29,532 | ) | $ | (5,214 | ) | $ | (11,080 | ) | ||
Add: Adjustment for interest expense on convertible senior notes, net of tax | $ | — | $ | — | $ | — | |||||
Undistributed earnings allocated to the Company's common stockholders for diluted net (loss) income per share | $ | (29,532 | ) | $ | (5,214 | ) | $ | (11,080 | ) | ||
Denominator: | |||||||||||
Denominator for basic net (loss) income per share — weighted average shares outstanding | 83,917 | 90,271 | 86,585 | ||||||||
Dilutive options outstanding, unvested stock units and ESPP | — | — | — | ||||||||
Dilutive common shares from the conversion spread of convertible senior notes | — | — | — | ||||||||
Denominator for diluted net (loss) income per share — adjusted weighted average shares outstanding | 83,917 | 90,271 | 86,585 | ||||||||
Basic net (loss) income per share | $ | (0.35 | ) | $ | (0.06 | ) | $ | (0.13 | ) | ||
Diluted net (loss) income per share | $ | (0.35 | ) | $ | (0.06 | ) | $ | (0.13 | ) | ||
Antidilutive options and unvested stock awards excluded from the computations | 5,300 | 6,167 | 7,226 | ||||||||
Average market price of common stock | $ | 7.13 | $ | 6.75 | $ | 8.19 | |||||
The antidilutive stock options and unvested stock were excluded from the computation of diluted net (loss) income per share due to the Company incurring a net loss for the periods presented.
As the principal amount of the Convertible Senior Notes (Note 11) will be settled in cash upon conversion, only the conversion spread related to the Convertible Senior Notes will be included in the calculation of diluted net income per common share. As such, the Convertible Senior Notes will have no impact on diluted net income per common share until the price of the Company's common stock exceeds the conversion price (initially $10.30, subject to adjustments) of the Convertible Senior Notes. When the market price of the Company's stock exceeds the conversion price, the effect of the additional shares that may be issued upon conversion of the Convertible Senior Notes will be included in the diluted net income per common share calculation. During fiscal 2014, there were no anti-dilutive shares resulting from the Convertible Senior Notes as the price of the Company's common stock did not exceed the conversion price.
Note 17. Unaudited Quarterly Consolidated Financial Data
Selected unaudited quarterly consolidated financial data for fiscal years 2014 and 2013 are as follows:
85
Net Revenues | Gross Profit | Net Income (Loss) | Diluted Net Income (Loss) per Share | ||||||||||||
2014 | |||||||||||||||
Fourth quarter | $ | 99,775 | $ | 57,575 | $ | (14,665 | ) | (1) | $ | (0.19 | ) | ||||
Third quarter | 109,730 | 63,648 | (7,199 | ) | $ | (0.09 | ) | ||||||||
Second quarter | 122,996 | 72,290 | (4,027 | ) | $ | (0.05 | ) | ||||||||
First quarter | 114,832 | 67,484 | (3,641 | ) | $ | (0.04 | ) | ||||||||
Total | $ | 447,333 | $ | 260,997 | $ | (29,532 | ) | ||||||||
2013 | |||||||||||||||
Fourth quarter | $ | 120,369 | $ | 69,840 | $ | (4,610 | ) | $ | (0.05 | ) | |||||
Third quarter | 116,786 | 68,418 | (6,844 | ) | $ | (0.08 | ) | ||||||||
Second quarter | 122,145 | 71,566 | 5,583 | $ | 0.06 | ||||||||||
First quarter | 119,267 | 68,976 | 657 | $ | 0.01 | ||||||||||
Total | $ | 478,567 | $ | 278,800 | $ | (5,214 | ) | ||||||||
(1) Includes tax expense of approximately $3.2 million related to taxable net unrealized foreign exchange gains on an intercompany loan between our international subsidiaries.
86
Schedule II
EMULEX CORPORATION AND SUBSIDIARIES
VALUATION AND QUALIFYING ACCOUNTS
Years ended June 29, 2014, June 30, 2013 and July 1, 2012
COL. A | COL. B | COL. C | COL. D | COL. E | |||||||||||
Description | Balance at beginning of period | Additions charged to expense and other accounts | Amounts charged against reserve | Balance at end of period | |||||||||||
(In thousands) | |||||||||||||||
Year ended June 29, 2014: | |||||||||||||||
Allowance for doubtful accounts | $ | 1,293 | $ | 33 | $ | 247 | (1) | $ | 1,079 | ||||||
Sales allowances | $ | 2,294 | $ | 9,079 | $ | 9,595 | $ | 1,778 | |||||||
Valuation allowance on deferred tax asset | $ | 60,091 | $ | 12,009 | $ | — | $ | 72,100 | |||||||
Year ended June 30, 2013: | |||||||||||||||
Allowance for doubtful accounts | $ | 1,766 | $ | (471 | ) | $ | 2 | (1) | $ | 1,293 | |||||
Sales allowances | $ | 3,915 | $ | 8,430 | $ | 10,051 | $ | 2,294 | |||||||
Valuation allowance on deferred tax asset | $ | 44,596 | $ | 15,495 | $ | — | $ | 60,091 | |||||||
Year ended July 1, 2012: | |||||||||||||||
Allowance for doubtful accounts | $ | 1,743 | $ | 128 | $ | 105 | (1) | $ | 1,766 | ||||||
Sales allowances | $ | 3,375 | $ | 10,290 | $ | 9,750 | $ | 3,915 | |||||||
Valuation allowance on deferred tax asset | $ | 28,231 | $ | 15,939 | $ | (426 | ) | $ | 44,596 | ||||||
(1) | Primarily includes amounts written-off as uncollectible. |
87
SIGNATURES
Pursuant to the requirements of Section 13 or 15(d) of the Securities Exchange Act of 1934, the Registrant has duly caused this report to be signed on its behalf by the undersigned, thereunto duly authorized.
EMULEX CORPORATION
By: | /s/ JEFFREY W. BENCK | |
Jeffrey W. Benck President and Chief Executive Officer | ||
Date: August 28, 2014
Pursuant to the requirements of the Securities Exchange Act of 1934, this report has been signed below by the following persons on behalf of the Registrant and in the capacities indicated on August 28, 2014.
Signature | Title | |
/s/ JEFFREY W. BENCK (Jeffrey W. Benck) | President, Chief Executive Officer and Director (Principal Executive Officer) | |
/s/ KYLE B. WESCOAT (Kyle B. Wescoat) | Executive Vice President, Chief Financial Officer and Secretary (Principal Financial and Accounting Officer) | |
/s/ GREGORY S. CLARK (Gregory S. Clark) | Director | |
/s/ GARY J. DAICHENDT (Gary J. Daichendt) | Director | |
/s/ BRUCE C. EDWARDS (Bruce C. Edwards) | Director | |
/s/ PAUL F. FOLINO (Paul F. Folino) | Director | |
/s/ EUGENE J. FRANTZ (Eugene J. Frantz) | Director | |
/s/ BEATRIZ V. INFANTE (Beatriz V. Infante) | Director | |
/s/ JOHN A. KELLEY, JR. (John A. Kelley, Jr.) | Director | |
/s/ RAHUL N. MERCHANT (Rahul N. Merchant) | Director | |
/s/ NERSI NAZARI (Nersi Nazari) | Director | |
/s/ DEAN A. YOOST (Dean A. Yoost) | Director | |
88
EXHIBIT INDEX
Exhibit No. | Description of Exhibit | |
3.1 | Certificate of Incorporation, as amended (incorporated by reference to Exhibit 3.1 to the Company’s 1997 Annual Report on Form 10-K). | |
3.2 | Certificate of Amendment of Certificate of Incorporation of the Company (incorporated by reference to Exhibit 3.4 to the Company's Quarterly Report on Form 10-Q for the quarterly period ended December 31, 2000). | |
3.3 | Amended and Restated Bylaws of the Company (incorporated by reference to Exhibit 3.1 to the Company’s Current Report on Form 8-K filed with the Securities and Exchange Commission on August 12, 2013). | |
3.4 | Amended and Restated Certificate of Designations, Preferences and Rights of Series A Junior Participating Preferred Stock of Emulex Corporation, incorporated by reference to Exhibit 3.1 to the Company’s Form 8-K filed with the Securities and Exchange Commission on January 16, 2009. | |
4.1 | Indenture (including form of Note) with respect to Emulex Corporation's 1.75% Convertible Senior Notes due 2018, dated as of November 18, 2013, by and between Emulex Corporation and U.S. Bank, National Association (incorporated by reference to Exhibit 4.1 to the Company's Current Report on Form 8-K filed on November 18, 2013). | |
10.1* | Appendix to the Restricted Stock Unit Award Agreement for Non-U.S. Grantees under the Emulex Corporation Amended and Restated 2005 Equity Incentive Plan (incorporated by reference to Exhibit 10.1 to the Company’s 2013 Annual Report on Form 10-K, filed on August 29, 2013). | |
10.2* | Emulex Corporation Employee Stock Option Plan, as amended (incorporated by reference to Appendix B to the Company’s Definitive Proxy Statement for its Annual Meeting of Stockholders held on November 21, 2002). | |
10.3* | Emulex Corporation Stock Award Plan for Non-Employee Directors, as amended (incorporated by reference to Appendix B to the Company’s definitive proxy statement for its Annual Meeting of Stockholders held on October 9, 2012). | |
10.4* | Emulex Corporation Employee Stock Purchase Plan, as amended (incorporated by reference to Appendix A to Emulex Corporation’s proxy statement on Schedule 14A for the 2013 annual meeting of its stockholders filed with the Securities and Exchange Commission on December 23, 2013). | |
10.5* | Emulex Corporation 2004 Employee Stock Incentive Plan (incorporated by reference to Appendix B to the Company’s Definitive Proxy Statement for its Annual Meeting of Stockholders held on November 18, 2004). | |
10.6* | Form of Key Employee Retention Agreement between the Company and its executive officers other than Jeffrey W. Benck (incorporated by reference to Exhibit 10.7 to the Company’s Quarterly Report on Form 10-Q for the quarterly period ended December 31, 2006). | |
10.7 | Form of Indemnification Agreement (incorporated by reference to Exhibit 10.1 to the Company’s current Report on Form 8-K filed May 17, 2005). | |
10.8* | Form of Director Stock Option Agreement and related form of Grant Summary for grants made pursuant to the Stock Award Plan for Non-Employee Directors (incorporated by reference to Exhibit 10.1 to the Company’s Current Report on Form 8-K filed August 30, 2005). | |
10.9* | Form of Incentive Stock Option Agreement for grants made pursuant to the Employee Stock Option Plan (incorporated by reference to Exhibit 10.2 to the Company’s Current Report on Form 8-K filed August 30, 2005). | |
10.10* | Form of Non-Qualified Stock Option Agreement for grants made pursuant to the Employee Stock Option Plan (incorporated by reference to Exhibit 10.3 to the Company’s Current Report on Form 8-K filed August 30, 2005). | |
10.11* | Form of Incentive Stock Option Agreement for grants made pursuant to the 2004 Employee Stock Incentive Plan (incorporated by reference to Exhibit 10.4 to the Company’s Current Report on Form 8-K filed August 30, 2005). | |
10.12* | Form of Non-Qualified Stock Option Agreement for grants made pursuant to the 2004 Employee Stock Incentive Plan (incorporated by reference to Exhibit 10.5 to the Company’s Current Report on Form 8-K filed August 30, 2005). | |
10.13* | Form of Notice of Grant of Stock Options and Stock Option Agreement for grants made pursuant to both the Employee Stock Option Plan and 2004 Employee Stock Incentive Plan (incorporated by reference to Exhibit 10.6 to the Company’s Current Report on Form 8-K filed August 30, 2005). | |
10.14* | Form of Amendment to Incentive Stock Option Agreements under the Amended and Restated 2005 Equity Incentive Plan (incorporated by reference to Exhibit 10.25 to the Company’s 2010 Annual Report on Form 10-K, filed August 26, 2010). | |
10.15* | Executive Incentive Compensation Plan of the Company, as amended, incorporated by reference to Exhibit 10.1 to the Company’s Form 10-Q filed with the Securities and Exchange Commission on October 31, 2013. | |
10.16* | Aarohi Communications, Inc. 2001 Stock Option Plan (incorporated by reference to Exhibit 99.1 to the Company’s Registration Statement on Form S-8 filed May 8, 2006). | |
89
10.17* | Form of Aarohi Communications, Inc. Stock Option Agreement (incorporated by reference to Exhibit 99.2 to the Company’s Registration Statement on Form S-8 filed May 8, 2006). | |
10.18* | Form of Aarohi Communications, Inc. Stock Option Agreement (alternate form) (incorporated by reference to Exhibit 99.3 to the Company’s Registration Statement on Form S-8 filed May 8, 2006). | |
10.19* | Form of Aarohi Communications, Inc. Notice of Grant of Stock Option (incorporated by reference to Exhibit 99.4 to the Company’s Registration Statement on Form S-8 filed May 8, 2006). | |
10.20* | Form of Emulex Corporation Stock Option Assumption Documents for holders of options granted under the Aarohi Communications, Inc. 2001 Stock Option Plan (incorporated by reference to Exhibit 99.5 to the Company’s Registration Statement on Form S-8 filed May 8, 2006). | |
10.21* | Amended and Restated Emulex Corporation 2005 Equity Incentive Plan (incorporated by reference to Appendix A to Emulex Corporation’s proxy statement on Schedule 14A for the 2012 annual meeting of its stockholders filed on October 9, 2012). | |
10.22* | Form of 2005 Equity Incentive Plan Restricted Stock Award Agreement (incorporated by reference to Exhibit 10.1 to the Company’s Quarterly Report on Form 10-Q for the period ended April 2, 2006). | |
10.23* | Form of Notice of Grant of Restricted Stock Award under 2005 Equity (incorporated by reference to Exhibit 10.2 to the Company’s Quarterly Report on Form 10-Q for the period ended April 2, 2006). | |
10.24* | Sierra Logic, Inc. 2001 Stock Option Plan (incorporated by reference to Exhibit 99.1 to the Company’s Registration Statement on Form S-8 filed on October 5, 2006). | |
10.25* | Form of Sierra Logic, Inc. Stock Option Agreement and Notice of Grant of Stock Option (incorporated by reference to Exhibit 99.2 to the Company’s Registration Statement on Form S-8 filed on October 5, 2006). | |
10.26* | Form of Emulex Corporation Stock Option Assumption Documents for holders of options granted under the Sierra Logic, Inc. 2001 Stock Option Plan (incorporated by reference to Exhibit 99.3 to the Company’s Registration Statement on Form S-8 filed on October 5, 2006). | |
10.27* | Offer letter, dated May 4, 2008, from the Company to Jeffrey W. Benck (incorporated by reference to Exhibit 10.1 to the Company’s Current Report on Form 8-K filed on May 12, 2008). | |
10.28* | Form of Amendment to Non-Qualified Stock Option Agreement (incorporated by reference to Exhibit 10.2 to the Company’s Form 8-K filed with the Securities and Exchange Commission on January 16, 2009). | |
10.29* | Form of Amendment to Restricted Stock Award Agreement incorporated by reference to Exhibit 10.3 to the Company’s Form 8-K filed with the Securities and Exchange Commission on January 16, 2009. | |
10.30* | Form of Notice of Grant of Restricted Stock Unit under the Amended and Restated 2005 Equity Incentive Plan (incorporated by reference to Exhibit 10.3 to the Company’s Form 10-Q filed with the Securities and Exchange Commission on January 30, 2009). | |
10.31* | Form of Restricted Stock Unit Award Agreement under the Amended and Restated 2005 Equity Incentive Plan (incorporated by reference to Exhibit 10.4 to the Company’s Form 10-Q filed with the Securities and Exchange Commission on January 30, 2009). | |
10.32* | Form of Restricted Stock Unit Award Agreement for Non-U.S. Grantees under the Amended and Restated 2005 Equity Incentive Plan (incorporated by reference to Exhibit 10.6 to the Company’s Form 10-Q filed with the Securities and Exchange Commission on January 30, 2009). | |
10.33* | Form of Amendment to Restricted Stock Unit Agreements under the Amended and Restated 2005 Equity Incentive Plan (incorporated by reference to Exhibit 10.52 to the Company’s 2010 Annual Report on Form 10-K, filed August 26, 2010). | |
10.34* | Form of Performance Stock Unit Award Agreement under the Amended and Restated 2005 Equity Incentive Plan (incorporated by reference to Exhibit 10.52 to the Company’s 2012 Annual Report on Form 10-K, filed on August 30, 2012). | |
10.35* | Amendment to Key Employee Retention Agreement between the Company and Jeffrey W. Benck, dated July 12, 2013 (incorporated by reference to Exhibit 10.3 to the Company’s Current Report on Form 8-K filed on July 15, 2013). | |
10.36** | Patent License and Release Agreement, dated July 3, 2012, between the Company and Broadcom Corporation (incorporated by reference to Exhibit 10.52 to the Company’s 2012 Annual Report on Form 10-K, filed on August 30, 2012). | |
10.37*** | Dismissal and Standstill Agreement, dated March 30, 2014, by and between Broadcom Corporation and the Company (incorporated by reference to Exhibit 10.3 to the Company's Form 10-Q filed on May 2, 2014). | |
10.38* | Amended and restated Key Employee Retention Agreement of Jeffrey W. Benck, effective as of January 1, 2013 (incorporated by reference to Exhibit 10.2 to the Company’s Form 10-Q filed on October 29, 2012). | |
10.39* | Amended Emulex Corporation Change in Control Retention Plan (incorporated by reference to Exhibit 10.5 to the Company’s Form 10-Q filed on October 29, 2012). | |
90
10.40* | Employment Letter, dated January 3, 2014, between Emulex Corporation and Kyle Wescoat (incorporated by reference to Exhibit 10.1 to the Company's Current Report on Form 8-K filed on January 7, 2014). | |
10.41* | Severance Agreement, dated January 6, 2014, between Emulex Corporation and Kyle Wescoat (incorporated by reference to Exhibit 10.2 to the Company's Current Report on Form 8-K filed on January 7, 2014). | |
10.42* | Form Performance Cash Settled Unit Award Agreement under the Amended and Restated 2005 Equity Incentive Plan (incorporated by reference to Exhibit 10.2 to the Company’s 10-Q filed on May 10, 2013). | |
10.43* | Form Cash-Settled Restricted Stock Unit Award Agreement under the Amended and Restated 2005 Equity Incentive Plan (incorporated by reference to Exhibit 10.3 to the Company’s 10-Q filed on May 10, 2013). | |
10.44* | Form of Amended and Restated Appendix to Restricted Stock Award Agreement , Restricted Stock Unit Award Agreement, Non-Qualified Stock Option Agreement, Incentive Stock Option Agreement, Cash Settled Restricted Stock Unit Award Agreement, and Performance Stock Unit Award Agreement for Change in Control Retention Plan Participants or Employees Covered by a Key Employee Retention Agreement under the Amended and Restated 2005 Equity Incentive Plan (incorporated by reference to Exhibit 10.4 to the Company’s Form 10-Q filed on May 10, 2013). | |
10.45* | Form of Amended and Restated Appendix to Restricted Stock Unit Award Agreement for Non-U.S. Grantees under the Amended and Restated 2006 Equity Incentive Plan (incorporated by reference to Exhibit 10.5 to the Company’s Form 10-Q filed on May 10, 2013). | |
10.46* | Employment Agreement, dated July 12, 2013, between Emulex Corporation and James M. McCluney (incorporated by reference to Exhibit 10.1 to the Company’s Current Report on Form 8-K filed on July 15, 2013). | |
10.47* | Severance Agreement, dated July 12, 2013, between Emulex Corporation and Jeffrey W. Benck (incorporated by reference to Exhibit 10.2 to the Company’s Current Report on Form 8-K filed on July 15, 2013). | |
10.48* | Letter, dated November 11, 2013, from Jeffrey W. Benck to James M. McCluney (incorporated by reference to Exhibit 10.3 to the Company’s Current Report on Form 8-K filed on November 12, 2013). | |
10.49 | Settlement Agreement, by and between the Company and Elliott Associates, L.P., dated November 11, 2013 (incorporated by reference to Exhibit 10.1 to the Company's Current Report on Form 8-K filed on November 12, 2013). | |
12 | Computation of Ratio of Earnings to Fixed Charges. | |
21 | List of Company subsidiaries. | |
23 | Consent of Independent Registered Public Accounting Firm. | |
31A | Certification of the Principal Executive Officer Pursuant to 17 CFR 240.13a-14(a), as Adopted Pursuant to §302 of the Sarbanes-Oxley Act of 2002. | |
31B | Certification of the Principal Financial Officer Pursuant to 17 CFR 240.13a-14(a), as Adopted Pursuant to §302 of the Sarbanes-Oxley Act of 2002. | |
32 | Certification Pursuant to 18 U.S.C. Section 1350, as Adopted Pursuant to §906 of the Sarbanes-Oxley Act of 2002. | |
101.INS | XBRL Instance Document | |
101.SCH | XBRL Taxonomy Extension Schema Document | |
101.CAL | XBRL Taxonomy Extension Calculation Linkbase Document | |
101.DEF | XBRL Taxonomy Extension Definition Linkbase Document | |
101.LAB | XBRL Taxonomy Extension Label Linkbase Document | |
101.PRE | XBRL Taxonomy Extension Presentation Linkbase Document | |
* | Indicates a management contract or compensation plan or arrangement. | |
** | Confidential treatment has been granted with respect to the redacted portions of the referenced exhibit. | |
*** | Confidential treatment has been requested with respect to the redacted portions of the referenced exhibit. | |
91