Attached files
| file | filename |
|---|---|
| EXCEL - IDEA: XBRL DOCUMENT - DELTA NATURAL GAS CO INC | Financial_Report.xls |
| EX-23 - EXHIBIT 23 - DELTA NATURAL GAS CO INC | dgas-2014630xkexhibit23.htm |
| EX-32.1 - EXHIBIT 32.1 - DELTA NATURAL GAS CO INC | dgas-2014630xex321.htm |
| EX-31.1 - EXHIBIT 31.1 - DELTA NATURAL GAS CO INC | dgas-2014630xex311.htm |
| EX-32.2 - EXHIBIT 32.2 - DELTA NATURAL GAS CO INC | dgas-2014630xex322.htm |
| EX-12 - EXHIBIT 12 - DELTA NATURAL GAS CO INC | dgas-2014630xkexhibit12.htm |
| EX-31.2 - EXHIBIT 31.2 - DELTA NATURAL GAS CO INC | dgas-2014630xex312.htm |
| EX-10.35 - EXHIBIT 10.35 - DELTA NATURAL GAS CO INC | dgas-2014630xexhibit1035.htm |
UNITED STATES
SECURITIES AND EXCHANGE COMMISSION
Washington, DC 20549
______________
FORM 10-K
______________
(Mark one)
x | ANNUAL REPORT PURSUANT TO SECTION 13 OR 15(d) OF THE SECURITIES EXCHANGE ACT OF 1934 |
For the fiscal year ended June 30, 2014
o | TRANSITION REPORT PURSUANT TO SECTION 13 OR 15(d) OF THE SECURITIES EXCHANGE ACT OF 1934 |
For the transition period from _______ to ________
Commission File No. 0-8788
______________
DELTA NATURAL GAS COMPANY, INC.
(Exact name of registrant as specified in its charter)
______________
Kentucky | 61-0458329 |
(State or other jurisdiction of incorporation or organization) | (I.R.S. Employer Identification No.) |
3617 Lexington Road, Winchester, Kentucky | 40391 |
(Address of principal executive offices) | (Zip code) |
859-744-6171
(Registrant's telephone number, including area code)
(Registrant's telephone number, including area code)
Securities registered pursuant to Section 12(b) of the Act:
Title of each class | Name of each exchange on which registered |
Common Stock $1 Par Value | NASDAQ |
Securities registered pursuant to Section 12(g) of the Act:
None
Indicate by check mark if the registrant is a well-known seasoned issuer, as defined in Rule 405 of the Securities Act. Yes £ No x
Indicate by check mark if the registrant is not required to file reports pursuant to Section 13 or 15 (d) of the Act. Yes £ No x
Indicate by check mark whether the registrant (1) has filed all reports required to be filed by Section 13 or 15(d) of the Securities Exchange Act of 1934 during the preceding 12 months (or for such shorter period that the registrant was required to file such reports), and (2) has been subject to such filing requirements for the past 90 days. Yes £ No x
Indicate by check mark whether the registrant has submitted electronically and posted on its corporate Website, if any, every Interactive Data File required to be submitted and posted pursuant to Rule 405 of Regulation S-T (Section 232.405 of this chapter) during the preceding 12 months (or for such shorter period that the registrant was required to submit and post such files). Yes x No £
Indicate by check mark if disclosure of delinquent filers pursuant to Item 405 of Regulation S-K (Section 229.405 of this chapter) is not contained herein, and will not be contained, to the best of registrant's knowledge, in definitive proxy or information statements incorporated by reference in Part III of this Form 10-K or any amendment to this Form 10-K. £
Indicate by check mark whether the registrant is a large accelerated filer, an accelerated filer, a non-accelerated filer, or a smaller reporting company. See definitions of "large accelerated filer", "accelerated filer", and "smaller reporting company" in Rule 12b-2 of the Exchange Act.
Large accelerated filer £ | Accelerated filer x |
Non-accelerated filer £ (Do not check if a smaller reporting company) | Smaller reporting company £ |
Indicate by check mark whether the registrant is a shell company (as defined in Rule 12b-2 of the Exchange Act). Yes £ No x
State the aggregate market value of the voting and non-voting common equity held by non-affiliates computed by reference to the price at which the common equity was last sold, or the average bid and asked price of such common equity, as of the last business day of the registrant's most recent completed second fiscal quarter. $155,037,002.
Indicate the number of shares outstanding of each of the registrant's classes of common stock, as of the latest practicable date. As of August 15, 2014, Delta Natural Gas Company, Inc. had outstanding 6,943,547 shares of common stock $1 par value.
DOCUMENTS INCORPORATED BY REFERENCE
The Registrant's definitive proxy statement, to be filed with the Commission not later than 120 days after June 30, 2014, is incorporated by reference in Part III of this Report.
TABLE OF CONTENTS
Page Number | ||||
1
PART I
Item 1. Business
References to “Delta”, “the Company”, “we”, “us” and “our” refer to Delta Natural Gas Company, Inc. and its consolidated subsidiaries, except as otherwise stated. We were incorporated under the laws of the Commonwealth of Kentucky on October 7, 1949. Unless otherwise stated, “2014”, “2013” and “2012” refers to the respective twelve month periods ending June 30.
General
Delta Natural Gas Company, Inc. (“Delta” or “the Company”) (Nasdaq: DGAS) distributes or transports natural gas to approximately 36,000 customers. Our distribution and transmission systems are located in central and southeastern Kentucky, and we own and operate an underground natural gas storage field in southeastern Kentucky. We transport natural gas to our industrial customers who purchase their natural gas in the open market. We also transport natural gas on behalf of local producers and customers not on our distribution system and sell liquids extracted from natural gas in our storage field and on our pipeline systems. We have three wholly-owned subsidiaries. Delta Resources, Inc. (“Delta Resources”) buys natural gas and resells it to industrial or large use customers on Delta's system. Delgasco, Inc. (“Delgasco”) buys natural gas and resells it to Delta Resources and to customers not on Delta's system. Enpro, Inc. (“Enpro”) owns and operates natural gas production properties and undeveloped acreage.
We seek to provide dependable, high-quality service to our customers while steadily enhancing value for our shareholders. Our efforts have been focused on developing a balance of regulated and non-regulated businesses to contribute to our earnings by profitably selling, transporting, producing and processing natural gas in our service territory.
We strive to achieve operational excellence through economical, reliable service with an emphasis on responsiveness to customers. We continue to invest in facilities for the distribution, transportation and storage of natural gas. We believe that our responsiveness to customers and the dependability of the service we provide afford us additional opportunities for growth. While we seek those opportunities, we will continue a conservative strategy of minimizing our exposure to market risk arising from fluctuations in the prices of natural gas.
We operate through two segments, a regulated segment and a non-regulated segment.
Our executive offices are located at 3617 Lexington Road, Winchester, Kentucky 40391. Our telephone number is (859) 744-6171. Our website is www.deltagas.com.
Regulated Operations
Distribution and Transportation
Through our regulated segment, we distribute natural gas to our retail customers in 23 predominantly rural counties. In addition, our regulated segment transports natural gas to industrial customers on our system who purchase their natural gas in the open market. Our regulated segment also transports natural gas on behalf of local producers and other customers not on our distribution system.
The economy of our service area is based principally on coal mining, farming and light industry. The communities we serve typically contain populations of less than 20,000. Our three largest service areas are Nicholasville, Corbin and Berea, Kentucky. In Nicholasville we serve approximately 8,000 customers, in Corbin we serve approximately 6,000 customers and in Berea we serve approximately 4,000 customers. Some of the communities we serve continue to expand, resulting in growth opportunities for us. Industrial parks have been developed in our service areas, which could result in additional growth in industrial customers.
The Kentucky Public Service Commission exercises regulatory authority over our retail natural gas distribution and transportation services. Their regulation of our business includes approving the rates we are permitted to charge our regulated customers. The impact of this regulation is further discussed in Note 14 of the Notes to Consolidated Financial Statements, in Item 8. Financial Statements and Supplementary Data and under “Regulatory Matters” in Item 1. Business.
2
Factors that affect our regulated revenues include the rates we charge our customers, economic conditions in our service areas, competition, the cost of natural gas and weather. Our current rate design lessens the impact weather has on our regulated revenues as our rates include both a fixed monthly customer charge and a volumetric rate which has a weather normalization provision that adjusts rates due to variations in weather. Market risk arising from fluctuations in the price of natural gas is mitigated through the natural gas cost recovery rate mechanism which permits us to pass through to our regulated customers changes in the price we must pay for our natural gas supply. However, increases in our rates may cause our customers to conserve or to use alternative energy sources.
Our regulated sales are seasonal and temperature-sensitive, since the majority of the natural gas we sell is used for heating. During 2014, 76% of the regulated volumes were sold during the heating season (December through April). Variations in the average temperature during the winter impact our volumes sold. The Kentucky Public Service Commission, through a weather normalization provision in our tariff, permits us to adjust the rates we charge our customers in response to winter weather that is warmer or colder than normal temperatures.
We compete with alternate sources of energy for our regulated distribution customers. These alternate sources include electricity, geo-thermal, coal, oil, propane, wood and solar.
Our larger regulated customers can obtain their natural gas supply by purchasing directly from interstate suppliers, local producers or marketers. Customers for whom we transport natural gas could by-pass our transportation system to directly connect to interstate pipelines or other transportation providers. Customers may undertake such a by-pass in order to seek lower prices for their natural gas and/or transportation services. Our larger customers who are in close proximity to alternative supply would be most likely to consider taking this action. Additionally, some of our industrial customers are able to switch to alternative sources of energy. These are competitive concerns that we continue to address by utilizing our non-regulated segment to offer these customers natural gas supply at competitive market-based rates.
Some natural gas producers in our service area can access pipeline delivery systems other than ours, which generates competition for our transportation services. We continue our efforts to purchase or transport natural gas that is produced in reasonable proximity to our transportation facilities through our regulated segment.
As an active participant in many areas of the natural gas industry, we plan to continue efforts to expand our natural gas transmission and distribution system and customer base. We continue to consider acquisitions of other natural gas systems, some of which are contiguous to our existing service areas, as well as expansion within our existing service areas.
Gas Supply
We maintain an active gas supply management program that emphasizes long-term reliability and the pursuit of cost-effective sources of natural gas for our customers. We purchase our natural gas from a combination of interstate and Kentucky sources. In our fiscal year ended June 30, 2014, we purchased approximately 99% of our natural gas from interstate sources.
Interstate Natural Gas Supply
Our regulated segment acquires its interstate natural gas supply from gas marketers. We currently have commodity requirements agreements with Atmos Energy Marketing (“Atmos”) for our Columbia Gas Transmission Corporation (“Columbia Gas”), Columbia Gulf Transmission Corporation (“Columbia Gulf”), Tennessee Gas Pipeline (“Tennessee”) and Texas Eastern Transmission Corporation (“Texas Eastern”) supplied areas. Under these commodity requirements agreements, Atmos is obligated to supply the volumes consumed by our regulated customers in defined sections of our service areas. We are not obligated to purchase any minimum quantities from Atmos or purchase natural gas from them for any period longer than one month at a time. The natural gas we purchase under these agreements is priced at index-based prices, NYMEX or at mutually agreed-to fixed prices based on forward market prices. The index-based market prices are determined based on the prices published on the first of each month in Platts' Inside FERC's Gas Market Report for the indices that relate to the pipelines through which the natural gas will be transported, plus or minus an agreed-to fixed price adjustment per million British Thermal Units of natural gas purchased. Consequently, the price we pay for interstate natural gas is based on current market prices.
Our agreements with Atmos for the Columbia Gas, Columbia Gulf, Tennessee and Texas Eastern supplied service areas continue year to year unless canceled by either party by written notice at least sixty days prior to the annual anniversary date (April 30) of the agreement. In our fiscal year ended June 30, 2014, approximately 37% of our regulated natural gas supply was purchased under our agreements with Atmos.
3
Our regulated segment purchases natural gas from Midwest Energy Services, LLC (“Midwest”) for injection into our underground natural gas storage field and to supply a portion of our system. We are not obligated to purchase any minimum quantities from Midwest, nor are we required to purchase natural gas for any periods longer than one month at a time. The natural gas is priced at index-based market prices or at mutually agreed-to fixed prices based on forward market prices. Our agreement with Midwest may be terminated upon 30 days prior written notice by either party. In our fiscal year ended June 30, 2014, approximately 61% of our regulated natural gas supply was purchased under our agreement with Midwest.
We also purchase interstate natural gas from other natural gas marketers as needed at either current market prices, determined by industry publications, or at forward market prices.
Transportation of Interstate Natural Gas Supply
Our interstate natural gas supply is transported to us from market hubs, production fields and storage fields by Tennessee, Columbia Gas, Columbia Gulf and Texas Eastern.
Our agreements with Tennessee currently extend through October, 2019 and thereafter automatically renew for subsequent five-year terms unless Delta notifies Tennessee of its intent not to renew the agreements at least one year prior to the expiration of any renewal terms. We intend to renew our agreements with Tennessee. Subject to the terms of Tennessee's Federal Energy Regulatory Commission natural gas tariff, Tennessee is obligated under these agreements to transport up to 19,600 thousand cubic feet (“Mcf”) per day for us. During fiscal 2014, Tennessee transported for us a total of 1,100,000 Mcf, or approximately 23% of our regulated supply requirements, under these agreements. We have natural gas storage agreements with Tennessee under the terms of which we reserve a defined storage space in Tennessee's storage fields, which we have assigned to Atmos, and we reserve the right to withdraw daily natural gas volumes up to certain specified fixed quantities. These natural gas storage agreements renew on the same schedule as our transportation agreements with Tennessee.
Under our agreements with Columbia Gas and Columbia Gulf, Columbia Gas is obligated to transport, including utilization of our defined storage space as required, up to 12,600 Mcf per day for us, and Columbia Gulf is obligated to transport up to a total of 4,300 Mcf per day for us. During fiscal 2014, Columbia Gas and Columbia Gulf transported for us a total of 675,000 Mcf, or approximately 14% of our regulated natural gas supply requirements, under all of our agreements with them. Our transportation agreements with Columbia Gas and Columbia Gulf extend through 2015. After 2015, our agreement with Columbia Gas continues on a year-to-year basis unless terminated by one of the parties, but may be extended by mutual agreement.
Columbia Gulf also transported additional volumes under agreements it has with Midwest to a point of interconnection between Columbia Gulf and us where we purchase the natural gas to inject into our storage field. The amounts transported and sold to us under the agreements Columbia Gulf has with Midwest for fiscal 2014 constituted approximately 61% of our regulated gas supply. We are not a party to any of these separate transportation agreements on Columbia Gulf.
We have no direct agreement with Texas Eastern. However, Atmos has an arrangement with Texas Eastern to transport the natural gas to us that we purchase from Atmos to supply our customers' requirements in specific geographic areas. In our fiscal year ended June 30, 2014, Texas Eastern transported approximately 18,000 Mcf of natural gas to our system, which constituted less than 1% of our natural gas supply.
Kentucky Natural Gas Supply
We have an agreement with Vinland Energy Operations LLC (“Vinland”) to purchase natural gas on a year-to-year basis unless terminated by one of the parties. We purchased 45,000 Mcf from Vinland during fiscal 2014. The price for the natural gas we purchase from Vinland is based on the index price of spot gas delivered to Columbia Gas in the relevant region as reported in Platts' Inside FERC's Gas Market Report. Vinland delivers this natural gas to our customer meters directly from its own pipelines. In fiscal 2014, the natural gas we purchased from Vinland constituted less than 1% of our regulated natural gas supply.
Natural Gas in Storage
We own and operate an underground natural gas storage field that we use to store a significant portion of our natural gas supply needs. This storage capability permits us to purchase and store natural gas during the non-heating months and then withdraw and sell the natural gas during the peak usage months. We have a legal obligation to retire wells located at this underground natural gas storage facility. However, since we expect to utilize the storage facility as long as we provide natural gas to our customers, we have determined the wells have an indeterminate life and have therefore not recorded a liability associated with the cost to retire the wells.
4
Regulatory Matters
The Kentucky Public Service Commission exercises regulatory authority over our retail natural gas distribution and transportation services. Their regulation of our business includes approving the rates we are permitted to charge our regulated customers. We monitor our need to file requests with them for a general rate increase for our natural gas and transportation services. They have historically utilized cost-of-service ratemaking where our base rates are established to recover normal operating expenses, exclusive of gas costs, and a reasonable rate of return. We do not have any matters pending before the Kentucky Public Service Commission which would have a material impact on our results of operations, financial positions or cash flows.
We have a pipe replacement program which allows us to adjust our regulated rates annually to earn a return on capital expenditures incurred subsequent to our last rate case which are associated with the replacement of pipe and related facilities. The pipe replacement program is designed to additionally recover the costs associated with the mandatory retirement or relocation of facilities.
The Kentucky Public Service Commission allows us a natural gas cost recovery clause, which permits us to adjust the rates charged to our customers to reflect changes in our natural gas supply costs and any bad debt expense related to natural gas cost. Although we are not required to file a general rate case to adjust rates pursuant to the natural gas cost recovery clause, we are required to make quarterly filings with the Kentucky Public Service Commission. Under and over-recovered natural gas costs are collected or refunded through adjustments to customer bills beginning three months after the end of the quarter in which the actual natural gas costs were incurred.
Additionally, we have a weather normalization provision in our tariffs, approved by the Kentucky Public Service Commission, which provides for the adjustment of our rates to residential and small non-residential customers to reflect variations from thirty year average weather for our December through April billing cycles. These adjustments to customer bills are made on a real time basis such that there is no lag in collecting from or refunding to customers the related dollar amounts.
The Kentucky Public Service Commission also allows us a conservation and efficiency program for our residential customers. Through this program, we perform energy audits, promote conservation awareness and provide rebates on the purchase of certain high efficiency appliances. The program helps to align our interests with our residential customers' interests by reimbursing us for the margins on lost sales due to the program and providing incentives for us to promote customer conservation. Our rates are adjusted annually to recover the costs incurred under these programs, the reimbursement of margins on lost sales and the incentives provided to us.
In addition to regulation by the Kentucky Public Service Commission, we may obtain non-exclusive franchises from the cities in which we operate authorizing us to place our facilities in the streets and public grounds. No utility may obtain a franchise until it has obtained approval from the Kentucky Public Service Commission to bid on such franchise. We hold franchises in five of the cities we serve, and we continue to operate under the conditions of expired franchises in four other cities we serve. In the other cities and areas we serve, there are no governmental organizations authorized to grant franchises or the city governments do not require a franchise. We attempt to acquire or reacquire franchises whenever feasible. Without a franchise, a city could require us to cease our occupation of the streets and public grounds or prohibit us from extending our facilities into any new area of that city. To date, the absence of a franchise has not adversely affected our operations.
Non-Regulated Operations
Natural Gas Marketing
Our non-regulated segment includes three wholly-owned subsidiaries. Two of these subsidiaries, Delta Resources and Delgasco, purchase natural gas in the open market, including natural gas from Kentucky producers. We resell this natural gas to industrial customers on our distribution system and to others not on our system.
Factors that affect our non-regulated revenues include the rates we charge our customers, our supply cost for the natural gas we purchase for resale, economic conditions in our service areas, weather and competition.
Our larger non-regulated customers can obtain their natural gas supply by purchasing directly from interstate suppliers, local producers or marketers and arranging for alternate transportation of the natural gas to their plants or facilities. Additionally, some of our industrial customers are able to switch economically to alternative sources of energy. We continue to address these competitive concerns by offering these customers natural gas supply at competitive market based rates.
5
In our fiscal year ended June 30, 2014, approximately 94% of our non-regulated revenue was derived from our natural gas marketing activities. In our non-regulated segment, three customers each provided more than 5% of our operating revenues for 2014 and two customers each provided more than 5% for 2013 and 2012. Seminole Energy provided approximately $9,494,000, $17,866,000 and $12,450,000 of non-regulated revenues during 2014, 2013 and 2012, respectively. Atmos provided approximately $5,206,000, $5,390,000 and $6,815,000 of non-regulated revenues during 2014, 2013 and 2012, respectively. Greystone, LLC provided approximately $12,569,000 of non-regulated revenues during 2014. There is no assurance that revenues from these customers will continue at these levels.
Natural Gas Production
Our subsidiary, Enpro, produces natural gas that is sold to Delgasco for resale in the open market. Item 2. Properties further describes Enpro's oil and natural gas leases and production properties. Enpro produced a total of 80,000 Mcf of natural gas during 2014 which was approximately 1% of our non-regulated volumes sold.
Natural Gas Liquids
To improve the operations of our distribution, transmission and storage system, we operate a facility that is designed to extract liquids from the natural gas in our system. We sell these natural gas liquids at a price determined by a national unregulated market. In our fiscal year ended June 30, 2014, approximately 5% of our non-regulated revenue was derived from the sale of natural gas liquids.
Natural Gas Supply
Our non-regulated segment purchases natural gas from M & B Gas Services (“M&B”) and Midwest. Our underlying agreements with M&B and Midwest do not obligate us to purchase any minimum quantities from M&B or Midwest, nor to purchase natural gas from either company for any periods longer than one month at a time. The natural gas is priced at index-based market prices or at mutually agreed-to fixed prices based on forward market prices. Our agreements with both M&B and Midwest may be terminated upon 30 days prior written notice by either party. Any purchase agreements to supply our unregulated sales activities may have longer terms or multiple month purchase commitments. In our fiscal year ended June 30, 2014, 1% and 90% of our non-regulated natural gas supply was purchased under our agreements with M&B and Midwest, respectively.
Additionally, our non-regulated segment purchases natural gas from Atmos as needed. This spot gas purchasing arrangement is pursuant to an agreement with Atmos containing an “evergreen” clause which permits either party to terminate the agreement by providing not less than sixty days written notice. Our purchases from Atmos under this spot purchase agreement are generally month-to-month. However, we have the option of forward-pricing natural gas for one or more months. The price of natural gas under this agreement is based on current market prices. In our fiscal year ended June 30, 2014, approximately 9% of our non-regulated natural gas supply was purchased under our agreement with Atmos.
We also purchase intrastate natural gas from Kentucky producers as needed at either current market prices, determined by industry publications, or at forward market prices.
We anticipate continuing our non-regulated activities and intend to pursue and increase these activities wherever practicable.
Capital Expenditures
Capital expenditures during 2014 were $8.1 million and for 2015 are estimated to be $10.8 million. Our expenditures include system extensions as well as the replacement and improvement of existing transmission, distribution, gathering, storage and general facilities.
Financing
Our capital expenditures and operating cash requirements are met through the use of internally generated funds and a short-term bank line of credit. The current available line of credit is $40 million, all of which was available at June 30, 2014.
6
Our current bank line of credit extends through June 30, 2015 and will be utilized to meet capital expenditure and operating cash requirements. The amounts and types of future long-term debt and equity financings will depend upon our capital needs and market conditions.
We currently have long-term debt of $55,000,000 in the form of our Series A Notes. The Series A Notes are unsecured, bear interest at 4.26% per annum and mature on December 20, 2031. Accrued interest on the Series A Notes is payable quarterly and we are required to make a $1,500,000 principal reduction payment on the Series A Notes each December.
Employees
On June 30, 2014, we had 150 full-time employees. We consider our relationship with our employees to be satisfactory. Our employees are not represented by unions nor are they subject to any collective bargaining agreements.
Available Information
We make available free of charge on our Internet website http://www.deltagas.com under our “Investor Relations” tab, our Business Code of Conduct and Ethics, annual report on Form 10-K, quarterly reports on Form 10-Q, current reports on Form 8-K and amendments to those reports filed or furnished pursuant to 13(a) or 15(d) of the Exchange Act as soon as reasonably practicable after we electronically file such material with, or furnish it to, the Securities and Exchange Commission (“SEC”). The SEC also maintains an Internet site http://www.sec.gov that contains reports, proxy and information statements and other information regarding Delta. The public may read and copy any materials the Company files with the SEC at the SEC's Public Reference Room at 100 F Street, NE, Washington, DC 20549. The SEC's phone number is 1-800-732-0330.
7
Consolidated Statistics | ||||||||||||||
For the Years Ended June 30, | 2014 | 2013 | 2012 | 2011 | 2010 | |||||||||
Average Regulated Customers Served | ||||||||||||||
Residential | 29,588 | 29,755 | 29,929 | 30,420 | 30,575 | |||||||||
Commercial | 4,861 | 4,906 | 4,890 | 4,949 | 4,957 | |||||||||
Industrial | 41 | 40 | 41 | 44 | 46 | |||||||||
Total | 34,490 | 34,701 | 34,860 | 35,413 | 35,578 | |||||||||
Operating Revenues ($000) (a) | ||||||||||||||
Regulated (b) | ||||||||||||||
Residential sales | 29,867 | 24,342 | 22,720 | 25,800 | 23,783 | |||||||||
Commercial sales | 20,294 | 15,849 | 14,026 | 16,672 | 15,894 | |||||||||
Industrial sales | 1,381 | 1,011 | 914 | 1,199 | 1,075 | |||||||||
On-system transportation | 5,416 | 5,237 | 4,780 | 4,830 | 4,421 | |||||||||
Off-system transportation | 3,747 | 3,800 | 3,595 | 3,670 | 3,650 | |||||||||
Other | 390 | 333 | 324 | 303 | 294 | |||||||||
Total regulated revenues | 61,095 | 50,572 | 46,359 | 52,474 | 49,117 | |||||||||
Non-regulated sales | 38,792 | 34,238 | 31,423 | 34,343 | 30,746 | |||||||||
Intersegment eliminations (c) | (4,041 | ) | (4,145 | ) | (3,704 | ) | (3,777 | ) | (3,441 | ) | ||||
Total | 95,846 | 80,665 | 74,078 | 83,040 | 76,422 | |||||||||
System Throughput (Million Cu. Ft.) (a) | ||||||||||||||
Regulated | ||||||||||||||
Residential sales | 1,814 | 1,659 | 1,331 | 1,737 | 1,756 | |||||||||
Commercial sales | 1,420 | 1,291 | 1,027 | 1,310 | 1,331 | |||||||||
Industrial sales | 117 | 107 | 90 | 120 | 111 | |||||||||
On-system transportation | 4,807 | 4,988 | 4,724 | 4,830 | 4,533 | |||||||||
Off-system transportation | 11,616 | 11,795 | 11,225 | 11,531 | 11,039 | |||||||||
Total regulated throughput | 19,774 | 19,840 | 18,397 | 19,528 | 18,770 | |||||||||
Non-regulated sales | 7,241 | 7,650 | 6,455 | 6,010 | 4,787 | |||||||||
Intersegment eliminations (c) | (7,096 | ) | (7,497 | ) | (6,326 | ) | (5,890 | ) | (4,692 | ) | ||||
Total | 19,919 | 19,993 | 18,526 | 19,648 | 18,865 | |||||||||
Average Annual Consumption Per | ||||||||||||||
Average Residential Customer | ||||||||||||||
(Thousand Cu. Ft.) | 61 | 56 | 44 | 57 | 57 | |||||||||
Lexington, Kentucky Degree Days | ||||||||||||||
Actual | 4,855 | 4,667 | 3,797 | 4,725 | 4,782 | |||||||||
Percent of 30 year average | 107 | 104 | 83 | 103 | 104 | |||||||||
(a) Additional financial information related to our segments can be found in Management's Discussion and Analysis of Financial Condition and Results of Operations and Note 15 of the Notes to Consolidated Financial Statements.
(b) We implemented new regulated base rates, as approved by the Kentucky Public Service Commission in October, 2010, which were designed to generate additional annual revenue of $3,513,000.
(c) Intersegment eliminations represent the natural gas transportation costs from the regulated segment to the non-regulated segment at our tariff rates.
8
Item 1A. Risk Factors
The risk factors below should be carefully considered.
WEATHER CONDITIONS MAY CAUSE OUR REVENUES TO VARY FROM YEAR TO YEAR.
Our revenues vary from year to year, depending on weather conditions. We estimate that approximately 76% of our annual natural gas sales are temperature sensitive. As a result, mild winter temperatures can cause a decrease in the amount of natural gas we sell in any year, which would reduce our revenues and profits. The weather normalization provision in our tariff, approved by the Kentucky Public Service Commission, only partially mitigates this risk. Under our weather normalization provision in our tariff, we adjust our rates for our residential and small non-residential customers to reflect variations from thirty year average weather for our December through April billing cycles.
OUR ABILITY TO MEET CUSTOMERS' NATURAL GAS REQUIREMENTS MAY BE IMPAIRED IF CONTRACTED NATURAL GAS SUPPLIES AND INTERSTATE PIPELINE SERVICES ARE NOT AVAILABLE, ARE NOT DELIVERED IN A TIMELY MANNER OR IF FEDERAL REGULATIONS DECREASE OUR AVAILABLE CAPACITY.
We are responsible for acquiring sufficient natural gas supplies, interstate pipeline capacity and storage capacity to meet
current and future customers' annual and seasonal natural gas requirements. We purchase almost all of our natural gas supply from interstate sources and rely on interstate pipelines to transport natural gas to our system. The Federal Energy Regulatory Commission regulates the transportation of the natural gas we receive from interstate sources, and it could increase our transportation costs or decrease our available pipeline capacity by changing its regulatory policies. Additionally, federal legislation could restrict or limit drilling which could decrease the supply of available natural gas. A decrease in interstate pipeline capacity available to us or an increase in competition for interstate pipeline transportation service could reduce our normal interstate supply of natural gas. If we are not able to maintain a reliable and adequate natural gas supply and sufficient pipeline capacity to deliver that supply, we may be unable to meet our customers' requirements resulting in a loss of customers and decrease in profits.
OUR CUSTOMERS ARE ABLE TO BY-PASS OUR DISTRIBUTION AND TRANSMISSION SYSTEMS.
Our larger customers can obtain their natural gas supply by purchasing directly from interstate suppliers, local producers or marketers. Customers for whom we transport natural gas could by-pass our transportation system to directly connect to interstate pipelines or other transportation providers. Customers may undertake such by-passes in order to achieve lower prices for their natural gas and/or transportation services. Our larger customers who are in close proximity to alternative supply would be most likely to consider taking this action. This potential to by-pass our distribution and transportation systems creates a risk of the loss of large customers and thus could result in lower revenues and profits.
ACTIONS BY OUR REGULATORS COULD DECREASE FUTURE PROFITABILITY.
We are regulated by the Kentucky Public Service Commission. Our regulated segment generates a significant portion of our operating revenues. We face the risk that the Kentucky Public Service Commission may fail to grant us adequate and timely rate increases, may decrease our rates or may take other actions that would cause a reduction in our income from operations, such as limiting our ability to pass on to our customers our increased costs of natural gas. Such regulatory actions would decrease our revenues and our profitability. Additionally, our consolidated financial statements reflect the application of regulatory accounting standards by our regulated segment. Our regulated segment has recognized regulatory assets representing costs incurred in prior periods that are probable of recovery from customers in future rates. Disallowance of such costs in future proceedings before the Kentucky Public Service Commission could require us to write-off regulatory assets, which could have a material impact on our income and consolidated financial statements.
VOLATILITY IN PRICES COULD REDUCE OUR PROFITS.
Significant increases or lack of stability in the price of natural gas will likely cause our regulated retail customers to increase conservation or switch to alternate sources of energy. Any decrease in the volume of natural gas we sell that is caused by such actions will reduce our revenues and profits. Higher prices also make it more difficult to add new customers. Significant decreases in the price of natural gas will likely cause our non-regulated segment's gross margins to decrease. The price of natural gas liquids is determined by a national unregulated market, and decreases in the price could result in a decrease in our non-regulated gross margins.
9
DERIVATIVES LEGISLATION COULD ADVERSELY AFFECT OUR ABILITY TO HEDGE RISKS ASSOCIATED WITH OUR BUSINESS OR OTHERWISE HAVE A MATERIAL AND ADVERSE EFFECT ON OUR FINANCIAL POSITION, RESULTS OF OPERATIONS OR CASH FLOWS.
We currently use, and historically have used, forward commodity contracts, which meet the criteria of a derivative. The Dodd-Frank Wall Street Reform and Consumer Protection Act (“Dodd-Frank Act”) adopted a comprehensive framework for the regulation of over-the-counter swaps (“OTC swaps”). The Dodd-Frank Act divides regulatory authority over swap agreements between the SEC and the Commodity Futures Trading Commission (“CFTC”) and requires that most OTC swaps be cleared through a registered clearing facility and traded on a designated exchange or swap execution facility. While the SEC and CFTC have adopted numerous regulations relating to OTC swaps, they are still in the process of rulemaking to address all of the requirements regarding OTC swaps under the Dodd-Frank Act. Current and future legal and regulatory requirements, restrictions and regulations imposed under the Dodd-Frank Act could increase the operational and transactional cost of derivatives contracts and could affect the number and/or creditworthiness of available counterparties, which could affect our ability to hedge our business risk.
INTERSTATE AND OTHER PIPELINES DELTA INTERCONNECTS WITH CAN IMPOSE RESTRICTIONS ON THEIR PIPELINE.
The pipelines interconnected to Delta's system are owned and operated by third parties who can impose restrictions on the quantity and quality of natural gas they will accept into their pipelines. To the extent natural gas on Delta's system does not conform to these restrictions, Delta could experience a decrease in volumes sold or transported to these pipelines.
FUTURE PROFITABILITY OF THE NON-REGULATED SEGMENT IS DEPENDENT ON A FEW INDUSTRIAL AND OTHER LARGE-VOLUME CUSTOMERS.
Our larger non-regulated customers are primarily industrial and other large-volume customers. Fluctuations in the natural gas requirements of these customers can have a significant impact on the profitability of the non-regulated segment.
A DECLINE IN THE LIQUIDS PRESENT IN OUR NATURAL GAS SUPPLY, OR LIQUIDS SALES PRICES, COULD REDUCE OUR NON-REGULATED REVENUES.
To improve the operations of our distribution, transmission and storage system, we operate a facility that is designed to extract liquids from the natural gas in our system. We are able to sell these liquids at a price determined by a national unregulated market. A reduction in the quantity of liquids present in our natural gas supply, or reductions in the prices we receive for such liquids sales, could result in a reduction of the earnings of our non-regulated segment.
WE RELY ON ACCESS TO CAPITAL TO MAINTAIN LIQUIDITY.
To the extent that internally generated cash coupled with short-term borrowings under our bank line of credit is not sufficient for our operating cash requirements and normal capital expenditures, we may need to obtain additional financing. Additionally, market disruptions may increase our cost of borrowing or adversely affect our access to capital markets. Such disruptions could include: economic downturns, the bankruptcy of an unrelated energy company, general capital market conditions, market prices for natural gas, terrorist attacks or the overall financial health of the energy industry. There is no guarantee we could obtain needed capital in the future.
POOR INVESTMENT PERFORMANCE OF PENSION PLAN HOLDINGS AND OTHER FACTORS IMPACTING PENSION PLAN COSTS COULD UNFAVORABLY IMPACT OUR LIQUIDITY AND RESULTS OF OPERATIONS.
Our cost of providing a non-contributory defined benefit pension plan is dependent upon a number of factors, such as the rates of return on plan assets, discount rates, the level of interest rates used to measure the required minimum funding level of the plan, future government regulation and our required or voluntary contributions made to the plan. Without sustained growth in the pension investments over time to increase the value of the plan assets and depending upon the other factors impacting our costs as listed above, we could be required to fund our plan with additional significant amounts of cash. Such cash funding obligations could have a material impact on our financial position, results of operations or cash flows.
10
WE ARE EXPOSED TO CREDIT RISKS OF CUSTOMERS AND OTHERS WITH WHOM WE DO BUSINESS.
Adverse economic conditions affecting, or financial difficulties of, customers and others with whom we do business could impair the ability of these customers and others to pay for our services or fulfill their contractual obligations or cause them to delay such payments or obligations. We depend on these customers and others to remit payments on a timely basis. Any delay or default in payment could adversely affect our cash flows, financial position or results of operations.
SUBSTANTIAL OPERATIONAL RISKS ARE INVOLVED IN OPERATING A NATURAL GAS DISTRIBUTION, TRANSPORTATION, LIQUIDS EXTRACTION AND STORAGE SYSTEM AND SUCH OPERATIONAL EVENTS COULD REDUCE OUR REVENUES AND INCREASE EXPENSES.
There are substantial risks associated with the operation of a natural gas distribution, transportation, liquids extraction and storage system, such as operational hazards and unforeseen interruptions caused by events beyond our control. These include adverse weather conditions, accidents, the breakdown or failure of equipment or processes, the performance of pipeline and storage facilities below expected levels of capacity and efficiency and catastrophic events such as explosions, fires, earthquakes, floods, landslides or other similar events beyond our control. These risks could result in injury or loss of life, extensive property damage or environmental pollution, which in turn could lead to substantial financial losses to us. In accordance with customary industry practice, we maintain insurance against some, but not all, of these risks. Liabilities incurred that are not fully covered by insurance could adversely affect our results of operations and financial condition. Additionally, interruptions to the operation of our natural gas distribution, transmission, liquids extraction or storage system caused by such events could reduce our revenues and increase our expenses.
WE MAY FACE CERTAIN REGULATORY AND FINANCIAL RISKS RELATED TO PIPELINE SAFETY LEGISLATION.
Increased regulatory oversight over pipeline operations and increased investment to inspect pipeline facilities, upgrade pipeline facilities, or control the impact of a breach of such facilities at the federal level could require additional operating expenses and capital expenditures to remain in compliance with any increased federal oversight. While we cannot predict with certainty the extent of these expenses and expenditures or when they might become effective, this could result in significant additional compliance costs to us and we may be unable to recover from our customers, through the regulatory process, all or some of these costs and an authorized rate of return on these costs.
HURRICANES, EXTREME WEATHER OR WELL-HEAD DISASTERS COULD DISRUPT OUR NATURAL GAS SUPPLY AND INCREASE NATURAL GAS PRICES.
Hurricanes, extreme weather or well-head disasters could damage production or transportation facilities, which could result in decreased supplies of natural gas, increased supply costs for us and higher prices for our customers. Such events could also result in new governmental regulations or rules that limit production or raise production costs.
OUR BORROWING ARRANGEMENTS INCLUDE VARIOUS FINANCIAL AND NEGATIVE COVENANTS AND A PREPAYMENT PENALTY THAT COULD RESTRICT OUR ACTIVITIES.
Our bank line of credit and Series A Notes contain financial covenants. A default on the performance of any single obligation incurred in connection with our borrowings, or a default on other indebtedness that exceeds $2,500,000, simultaneously creates an event of default with the bank line of credit and the Series A Notes. If we breach any of the financial covenants under these agreements, our debt repayment obligations under the bank line of credit and Series A Notes could be accelerated. For example, if we default we may not be able to refinance, repay all our indebtedness, pay dividends or have sufficient liquidity to meet our operating and capital expenditure requirements, all of which could result in a material adverse effect on our business, results of operations and financial condition.
OUR LONG-TERM DEBT ARRANGEMENTS LIMIT THE AMOUNT OF DIVIDENDS WE MAY PAY AND OUR ABILITY TO REPURCHASE OUR STOCK.
Under the terms of our 4.26% Series A Notes, the aggregate amount we may pay in dividends on our common stock and to repurchase our common stock is limited based on our cumulative net income and dividends paid. Consequently, as of June 30, 2014 our Series A Notes permit us to pay up to $22,778,000 in dividends and for the repurchase of our common stock. However, if we fail to generate sufficient net income in the future, our ability to continue to pay our regular quarterly dividend may be impaired and the value of our common stock would likely decline.
11
A SECURITY BREACH COULD DISRUPT OUR INFORMATION TECHNOLOGY SYSTEMS, INTERRUPT THE NATURAL GAS SERVICE WE PROVIDE TO OUR CUSTOMERS, COMPROMISE THE SAFETY OF OUR NATURAL GAS DISTRIBUTION, TRANSMISSION, LIQUIDS EXTRACTION AND STORAGE SYSTEMS OR EXPOSE CONFIDENTIAL PERSONAL INFORMATION.
Security breaches of our information technology infrastructure, including cyber-attacks and cyber-terrorism, could lead to information system disruptions or shutdowns, result in the interruption of our ability to provide natural gas to our customers or compromise the safety of our distribution, transmission, liquids extraction and storage systems. If such an attack or security breach were to occur, our business, results of operations and financial condition could be materially adversely affected. In addition, such an attack could affect our ability to service our indebtedness, our ability to raise capital and our future growth opportunities.
Additionally, a breakdown or a breach in our systems that results in the unauthorized release of individually identifiable customer, employee, vendor, investor or other sensitive data could have a material adverse effect on our reputation, operating results and financial condition. We could also be exposed to claims by persons harmed by such a breakdown or breach. Such a breakdown or breach could also materially increase the costs we incur to protect against such risks. There is no guarantee that the procedures that we have implemented to protect against unauthorized access to secured data are adequate to safeguard against all data security breaches.
FAILURE TO ATTRACT AND RETAIN AN APPROPRIATELY QUALIFIED WORKFORCE COULD UNFAVORABLY IMPACT OUR RESULTS OF OPERATIONS.
Certain situations, such as an aging workforce, mismatch of skill sets to complement future needs, or unavailability of a qualified workforce, may lead to increased operational risks and costs. As a result, we may be unable to hire enough individuals who are knowledgeable about the natural gas industry and/or face a lengthy time period associated with skill development and knowledge transfer. Failure to address this risk may result in increased operational and safety risks as well as increased costs. Even if we have reasonable plans in place to address succession planning and workforce training, we cannot control the future availability of qualified labor. If we are unable to successfully attract and retain an appropriately qualified workforce, our financial position or results of operations could be negatively affected.
NEW LAWS OR REGULATIONS COULD HAVE A NEGATIVE IMPACT ON OUR FINANCIAL POSITION, RESULTS OF OPERATIONS OR CASH FLOWS.
Changes in laws and regulations, including new accounting standards and tax laws, could change the way in which we are required to record revenues, expenses, assets and liabilities. Additionally, governing bodies may choose to re-interpret laws and regulations. These changes could have a negative impact on our financial position, cash flows, results of operations or access to capital.
WE MAY FACE CERTAIN REGULATORY AND FINANCIAL RISKS RELATED TO CLIMATE CHANGE LEGISLATION.
Future proposals to limit greenhouse gas emissions, measured in carbon dioxide equivalent units, could adversely affect our operating and service costs and demand for our product. In the past, the United States Congress has considered legislative proposals to limit greenhouse gas emissions and the United States Environmental Protection Agency has adopted regulations to limit carbon emissions. Future legislation and the implementation of existing regulations could increase utility costs and prices charged to utility customers. Unless we are able to timely recover the costs of such impacts from customers through the regulatory process, costs associated with any such regulatory or legislative changes could adversely affect our results of operations, financial condition and cash flows.
Item 1B. Unresolved Staff Comments
None.
Item 2. Properties
We own our corporate headquarters in Winchester, Kentucky. We own eleven buildings used for field operations in the cities we serve.
12
We own approximately 2,500 miles of natural gas gathering, transmission, distribution and storage lines. These lines range in size up to twelve inches in diameter.
We hold leases for the storage of natural gas under 8,000 acres located in Bell County, Kentucky. We developed this property for the underground storage of natural gas.
We use all the properties described in the three paragraphs immediately above principally in connection with our regulated segment, as further discussed in Item 1. Business.
Through our wholly-owned subsidiary, Enpro, we produce natural gas as part of the non-regulated segment of our business. Enpro owns interests in oil and natural gas leases on 10,300 acres located in Bell, Knox and Whitley Counties. Thirty-five gas wells are producing from these properties. The remaining proved, developed natural gas reserves on these properties are estimated at 2.5 million Mcf. Also, Enpro owns the natural gas underlying 15,400 additional acres in Bell, Clay and Knox Counties. These properties have been leased to others for further drilling and development. We have performed no reserve studies on these properties. Enpro produced a total of 80,000 Mcf of natural gas during fiscal 2014 from all the properties described in this paragraph.
A producer plans to conduct further exploration activities on part of Enpro's developed holdings. Enpro reserves the option to participate in wells drilled by this producer and also retains certain working and royalty interests in any production from future wells.
Our assets have no significant encumbrances.
Item 3. Legal Proceedings
We are not currently a party to any legal proceedings that are expected to have a materially adverse impact on our liquidity, financial position or results of operations.
Item 4. Mine Safety Disclosures
None.
PART II
Item 5. Market for Registrant's Common Equity, Related Stockholder Matters and Issuer Purchases of Equity Securities
We have paid cash dividends on our common stock each year since 1964. The frequency and amount of future dividends will depend upon our earnings, financial requirements and other relevant factors, including limitations imposed by our Series A Notes as described in Note 10 of the Notes to Consolidated Financial Statements.
Our common stock is listed on NASDAQ and trades under the symbol “DGAS”. There were 1,482 record holders of our common stock as of August 26, 2014. The accompanying table sets forth, for the periods indicated, the high and low sales prices for the common stock on the NASDAQ stock market and the cash dividends declared per share.
13
Range of Stock Prices ($) | Dividends | |||||
High | Low | Per Share ($) | ||||
Quarter | ||||||
Fiscal 2014 | ||||||
First | 25.02 | 18.50 | .19 | |||
Second | 22.90 | 19.98 | .19 | |||
Third | 22.29 | 18.44 | .19 | |||
Fourth | 22.13 | 18.43 | .19 | |||
Fiscal 2013 | ||||||
First | 24.82 | 18.41 | .18 | |||
Second | 22.16 | 17.08 | .18 | |||
Third | 22.08 | 18.88 | .18 | |||
Fourth | 24.18 | 19.99 | .18 | |||
The sales prices shown above reflect prices between dealers and do not include markups or markdowns or commissions and may not necessarily represent actual transactions.
14
Comparison of Five-Year Cumulative Total Shareholder Return
The following graph sets forth a comparison of five year cumulative total shareholder returns (equal to dividends plus stock price appreciation) among our common shares, the Dow Jones Utilities Index and the Russell 3000 Stock Index during the past five fiscal years. Information reflected on the graph assumes an investment of $100 on June 30, 2009 in each of our common shares, the Dow Jones Utilities Index and the Russell 3000 Stock Index. Cumulative total return assumes quarterly reinvestment of dividends. The total shareholder returns shown are not necessarily indicative of future returns.
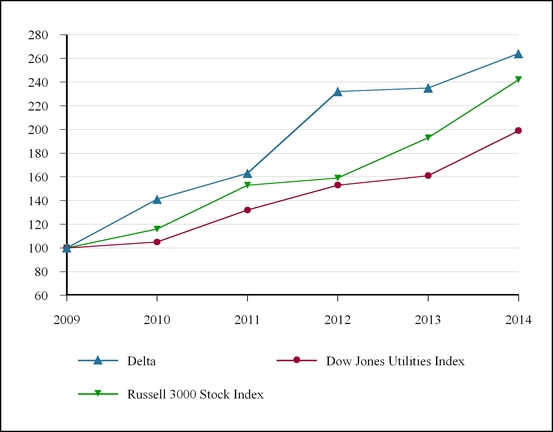
2009 | 2010 | 2011 | 2012 | 2013 | 2014 | ||||||
Delta | 100 | 141 | 163 | 232 | 235 | 264 | |||||
Dow Jones Utilities Index | 100 | 105 | 132 | 153 | 161 | 199 | |||||
Russell 3000 Stock Index | 100 | 116 | 153 | 159 | 193 | 242 | |||||
15
Item 6. Selected Financial Data
The following selected financial data is derived from the Company's audited consolidated financial statements and should be read in conjunction with those financial statements and notes thereto.
For the Years Ended June 30, | 2014 | 2013 | 2012 | 2011 | 2010 | ||||||
Summary of Operations ($) | |||||||||||
Operating revenues (a) | 95,845,871 | 80,664,837 | 74,078,322 | 83,040,251 | 76,422,068 | ||||||
Operating income (a) | 15,603,439 | 13,188,679 | 13,265,228 | 14,061,794 | 12,904,494 | ||||||
Net income (a)(b) | 8,275,128 | 7,200,776 | 5,783,998 | 6,364,895 | 5,651,817 | ||||||
Earnings per common share (a)(b) | |||||||||||
Basic and diluted | 1.19 | 1.05 | .85 | .95 | .85 | ||||||
Cash dividends declared per common share | .76 | .72 | .70 | .68 | .65 | ||||||
Weighted Average Number of Common Shares | |||||||||||
Basic | 6,918,725 | 6,843,455 | 6,777,186 | 6,707,224 | 6,652,320 | ||||||
Diluted | 6,918,725 | 6,843,455 | 6,777,186 | 6,712,804 | 6,652,320 | ||||||
Total Assets ($) | 186,025,161 | 183,930,015 | 182,895,363 | 174,896,239 | 168,632,420 | ||||||
Capitalization ($) | |||||||||||
Common shareholders' equity | 74,728,352 | 70,005,415 | 66,220,407 | 63,767,184 | 60,760,170 | ||||||
Long-term debt | 53,500,000 | 55,000,000 | 56,500,000 | 56,751,006 | 57,112,000 | ||||||
Total capitalization | 128,228,352 | 125,005,415 | 122,720,407 | 120,518,190 | 117,872,170 | ||||||
Short-Term Debt ($) (c) | 1,500,000 | 1,500,000 | 1,500,000 | 1,200,000 | 1,200,000 | ||||||
Other Items ($) | |||||||||||
Capital expenditures | 8,077,642 | 7,179,473 | 7,337,115 | 8,123,479 | 5,275,194 | ||||||
Total property, plant and equipment | 229,367,319 | 223,545,925 | 217,172,542 | 211,409,336 | 204,248,520 | ||||||
(a) | We implemented new regulated base rates as approved by the Kentucky Public Service Commission in October, 2010 and the rates were designed to generate additional annual revenue of $3,513,000, with a $1,770,000 increase in annual depreciation expense. |
(b) | In 2012, $877,000 of interest expense was accrued relating to a tax assessment. In 2013, the assessment was resolved and the previously accrued interest was reversed. |
(c) | Includes current portion of long-term debt. |
16
Item 7. Management's Discussion and Analysis of Financial Condition and Results of Operations
Overview of 2014 and Future Outlook
Overview
The following is a discussion of the segments we operate, our corporate strategy for the conduct of our business within these segments and significant events that have occurred during 2014. Our Company has two segments: (i) a regulated natural gas distribution and transmission segment, and (ii) a non-regulated segment which participates in related activities, consisting of natural gas marketing, natural gas production and the sale of liquids extracted from natural gas.
Earnings from the regulated segment are primarily influenced by sales and transportation volumes, the rates we charge our customers and the expenses we incur. In order for us to achieve our strategy of maintaining reasonable long-term earnings, cash flow and stock value, we must successfully manage each of these factors. Regulated sales volumes are temperature-sensitive. Our regulated sales volumes in any period reflect the impact of weather, with colder temperatures generally resulting in increased sales volumes. The impact of winter temperatures on our revenues is partially reduced by our ability to adjust our winter rates for residential and small non-residential customers based on the degree to which actual winter temperatures deviate from historical average temperatures.
Our non-regulated segment markets natural gas to large-volume customers. We endeavor to enter sales agreements matching supply with estimated demand while providing an acceptable gross margin. The non-regulated segment also produces natural gas and sells liquids extracted from natural gas.
Consolidated earnings per common share for 2014 increased $0.14 per common share as compared to 2013. We experienced a winter that was colder than the preceding year resulting in increased volumes of natural gas sold. Additionally, sales of natural gas liquids increased, as compared to the prior year. Other factors which influenced our 2014 consolidated earnings per common share are further discussed in the Results of Operations.
Future Outlook
Future profitability of the regulated segment is contingent on the adequate and timely adjustment of the rates we charge our regulated customers. The Kentucky Public Service Commission sets these rates, and we monitor our need to file rate cases with the Kentucky Public Service Commission for a general rate increase for our regulated services. The regulated segment's largest expense is natural gas supply, which we are permitted to pass through to our customers. We manage remaining expenses through budgeting, approval and review.
Future profitability of the non-regulated segment is dependent on the business plans of some of our industrial and other large-volume customers and the market prices of natural gas and natural gas liquids, all of which are out of our control. We anticipate our non-regulated segment will continue to contribute to our consolidated net income in fiscal 2015. If natural gas prices increase, we would expect to experience a corresponding increase in our non-regulated segment gross margins related to our natural gas production and marketing activities. However, if natural gas prices decrease, we would expect a decrease in our non-regulated gross margins related to our natural gas production and marketing activities. The profitability of selling natural gas liquids is dependent on the amount of liquids extracted and the pricing for any such liquids, which is determined by a national unregulated market.
Liquidity and Capital Resources
Sources and Uses of Cash
Operating activities provide our primary source of cash. Cash provided by operating activities consists of net income adjusted for non-cash items, including depreciation, amortization, deferred income taxes, share-based compensation and changes in working capital. Our sales and cash requirements are seasonal. The largest portion of our sales occurs during the heating months (December - April), whereas significant cash requirements for the purchase of natural gas for injection into our storage field and capital expenditures occur during non-heating months. Therefore, when cash provided by operating activities is not sufficient to meet our capital requirements, our ability to maintain liquidity depends on our bank line of credit. The current bank line of credit with Branch Banking and Trust Company extends through June 30, 2015 and permits borrowings up to $40,000,000. There were no borrowings outstanding on the bank line of credit as of June 30, 2014 or June 30, 2013.
17
Cash and cash equivalents were $13,676,000 at June 30, 2014 compared with $10,360,000 at June 30, 2013 and $9,741,000 at June 30, 2012. These changes in cash and cash equivalents are summarized in the following table:
$(000) | 2014 | 2013 | 2012 | |||||
Provided by operating activities | 17,340 | 13,557 | 13,514 | |||||
Used in investing activities | (7,870 | ) | (7,108 | ) | (7,012 | ) | ||
Used in financing activities | (6,155 | ) | (5,829 | ) | (4,102 | ) | ||
Increase in cash and cash equivalents | 3,315 | 620 | 2,400 | |||||
In 2014, cash provided by operating activities increased $3,783,000 (28%), as compared to 2013, due to increased cash received from customers as a result of increased sales, partially offset by increased amounts paid for natural gas.
In 2013, there was not a significant change in cash provided by operating activities as compared to 2012.
Changes in cash used in investing activities result primarily from changes in the level of capital expenditures between years.
In 2014, there was not a significant change in cash used in financing activities, as compared to 2013.
In 2013, cash used in financing activities increased $1,727,000 (42%) , as compared to 2012, due to the first annual $1,500,000 repayment on our 4.26% Series A Notes.
Cash Requirements
Our capital expenditures result in a continued need for cash. These capital expenditures are being made for system extensions and for the replacement and improvement of existing transmission, distribution, gathering, storage and general facilities. We expect our capital expenditures for fiscal 2015 to be approximately $10.8 million.
The following is provided to summarize our contractual cash obligations for indicated periods after June 30, 2014:
Payments Due by Fiscal Year | |||||||||||||||
$(000) | 2015 | 2016 - 2017 | 2018 - 2019 | After 2019 | Total | ||||||||||
Interest payments (a) | 2,360 | 4,427 | 4,171 | 20,249 | 31,207 | ||||||||||
Long-term debt (b) | 1,500 | 3,000 | 3,000 | 47,500 | 55,000 | ||||||||||
Pension contributions (c) | 500 | 1,000 | 1,000 | 4,500 | 7,000 | ||||||||||
Natural gas purchases (d) | 140 | — | — | — | 140 | ||||||||||
Total contractual obligations (e) | 4,500 | 8,427 | 8,171 | 72,249 | 93,347 | ||||||||||
(a) | Our long-term debt, notes payable, customers' deposits and unrecognized tax positions all require interest payments. Interest payments are projected based on fiscal 2014 interest payments until the underlying obligation is satisfied. As of June 30, 2014, we have also accrued $5,000 of interest related to uncertain tax positions. These amounts have been excluded from the above table of contractual obligations as the timing of such payments is uncertain. |
(b) | See Note 10 of the Notes to Consolidated Financial Statements for a description of this debt. |
(c) | This represents currently projected contributions to the defined benefit plan through 2028, as recommended by our actuary. |
(d) | As of June 30, 2014, we had a contract which had a minimum purchase obligation. The contract term expires December, 2014. The remainder of our natural gas purchase contracts are either requirements-based contracts, or contracts with a minimum purchase obligation extending for a time period not exceeding one month. |
18
(e) | We have other long-term liabilities which include deferred income taxes ($40,538,000), regulatory liabilities ($1,165,000), asset retirement obligations ($3,261,000) and deferred compensation ($907,000). Based on the nature of these items their expected settlement dates cannot be estimated. |
All of our operating leases are year-to-year and cancelable at our option.
See Note 13 of the Notes to Consolidated Financial Statements for other commitments and contingencies.
Sufficiency of Future Cash Flows
Our ability to maintain liquidity, finance capital expenditures and pay dividends is contingent on the adequate and timely adjustment of the regulated rates we charge our customers. The Kentucky Public Service Commission sets these rates and we monitor our need to file for rate increases for our regulated segment. Our regulated base rates were most recently adjusted in our 2010 rate case and became effective in October, 2010. We expect that cash provided by operations will be sufficient to satisfy our operating and normal capital expenditure requirements and to pay dividends for the next twelve months and the foreseeable future. To the extent that internally generated cash is not sufficient to satisfy seasonal operating and capital expenditure requirements and to pay dividends, we rely on our bank line of credit.
In December, 2011, we refinanced our 5.75% Insured Quarterly Notes and 7% Debentures from the proceeds of a private debt financing. Under the Note Purchase and Private Shelf Agreement, we issued $58,000,000 of Series A Notes, for which the purchasers paid 100% of the face principal amount. The proceeds from the sale of the Series A Notes were used to fund the redemption of our 5.75% Insured Quarterly Notes Due April 1, 2021, which had an outstanding principal balance of $38,450,000, and our 7% Debentures Due February 1, 2023, which had an outstanding principal balance of $19,410,000.
Our Series A Notes are unsecured, bear interest at a rate of 4.26% per annum, which is payable quarterly, and mature on December 20, 2031. We are required to make an annual $1,500,000 principal payment on the Series A Notes each December. Any refinance of the Series A Notes, or any additional prepayments of principal, may be subject to a prepayment penalty.
With our bank line of credit agreement and Series A Notes, we have agreed to certain financial covenants. Noncompliance with these covenants can make the obligations immediately due and payable. We have agreed to the following financial covenants:
• | The Company must at all times maintain a tangible net worth of at least $25,800,000. |
• | The Company must at the end of each fiscal quarter maintain a total debt to capitalization ratio of no more than 70%. The total debt to capitalization ratio is calculated as the ratio of (i) the Company's total debt to (ii) the sum of the Company's shareholders' equity plus total debt. |
• | The Company must maintain a fixed charge coverage ratio for the twelve months ending each quarter of not less than 1.20x. The fixed charge coverage ratio is calculated as the ratio of (i) the Company's earnings adjusted for certain unusual or non-recurring items, before interest, taxes, depreciation and amortization plus rental expense to (ii) the Company's interest and rental expense. |
• | The Company may not pay aggregate dividends on its capital stock (plus amounts paid in redemption of its capital stock) in excess of the sum of $15,000,000 plus the Company's cumulative earnings after September 30, 2011 adjusted for certain unusual or non-recurring items. |
19
The following table shows the required and actual financial covenants under our Series A Notes as of June 30, 2014:
Requirement | Actual | |||||
Tangible net worth | no less than $25,800,000 | $ | 73,961,000 | |||
Debt to capitalization ratio | no more than 70% | 42 | % | |||
Fixed charge coverage ratio | no less than 1.20x | 8.79 | x | |||
Dividends paid | no more than $36,594,000 | $ | 13,816,000 | |||
Our 4.26% Series A Notes restrict us from:
• | with limited exceptions, granting or permitting liens on or security interests in our properties, |
• | selling a subsidiary, except in limited circumstances, |
• | incurring secured debt, or permitting a subsidiary to incur debt or issue preferred stock to any third party, in an aggregate amount that exceeds 10% of our tangible net worth, |
• | changing the general nature of our business, |
• | merging with another company, unless (i) we are the survivor of the merger or the survivor of the merger is another domestic company that assumes the 4.26% Series A Notes, (ii) there is no event of default under the 4.26% Series A Notes and (iii) the continuing company has a tangible net worth at least as high as our tangible net worth immediately prior to such merger, or |
• | selling or transferring assets, other than (i) the sale of inventory in the ordinary course of business, (ii) the transfer of obsolete equipment and (iii) the transfer of other assets in any 12 month period where such assets constitute no more than 5% of the value of our tangible assets and, over any period of time, the cumulative value of all assets transferred may not exceed 15% of our tangible assets. |
Without the consent of the bank that has extended to us our bank line of credit or terminating our bank line of credit, we may not:
• | merge with another entity; |
• | sell a material portion of our assets other than in the ordinary course of business, |
• | issue stock which in the aggregate exceeds thirty-five percent (35%) of our outstanding shares of common stock, or |
• | permit any person or group of related persons to hold more than twenty percent (20%) of the Company's outstanding shares of stock. |
Furthermore, the agreement governing our 4.26% Series A Notes contains a cross-default provision which provides that we will be in default under the 4.26% Series A Notes if we are in default on any other outstanding indebtedness that exceeds $2,500,000. Similarly, the loan agreement governing the bank line of credit contains a cross-default provision which provides that we will be in default under the bank line of credit if we are in default under our 4.26% Series A Notes and fail to cure the default within ten days of notice from the bank. We were in compliance with the covenants under our bank line of credit and 4.26% Series A Notes for all periods presented in the Consolidated Financial Statements.
Critical Accounting Policies and Estimates
Preparation of financial statements and related disclosures in compliance with generally accepted accounting principles requires the use of assumptions and estimates regarding future events, including the likelihood of success of particular investments or initiatives, estimates of future prices or rates, legal and regulatory challenges and anticipated recovery of costs. Therefore, the possibility exists for materially different reported amounts under different conditions or assumptions. We consider an accounting
20
estimate to be critical if (i) the accounting estimate requires us to make assumptions about matters that were reasonably uncertain at the time the accounting estimate was made and (ii) changes in the estimate are reasonably likely to occur from period to period.
These critical accounting estimates should be read in conjunction with the Notes to Consolidated Financial Statements. We have other accounting policies that we consider to be significant; however, these policies do not meet the definition of critical accounting estimates, because they generally do not require us to make estimates or judgments that are particularly difficult or subjective.
Regulatory Accounting
Our accounting policies reflect the effects of the rate-making process in accordance with regulatory accounting standards. Our regulated segment continues to be cost-of-service rate regulated, and we believe the application of regulatory accounting standards to that segment is appropriate. If, as a result of a change in circumstances, it is determined that the regulated segment no longer meets the criteria of regulatory accounting, that segment will have to discontinue regulatory accounting and write-off the respective regulatory assets and liabilities. Such a write-off could have a material impact on our consolidated financial statements.
The application of regulatory accounting standards results in recording regulatory assets and liabilities. Regulatory assets represent the deferral of incurred costs that are probable of future recovery in customer rates. In some cases, we record regulatory assets before approval for recovery has been received from the Kentucky Public Service Commission. We must use judgment to conclude that costs deferred as regulatory assets are probable of future recovery. We base this conclusion on certain factors, including changes in the regulatory environment, recent rate orders issued by the Kentucky Public Service Commission and the status of any potential new legislation. Regulatory liabilities represent revenues received from customers to fund expected costs that have not yet been incurred, or they represent probable future refunds to customers.
We use our best judgment when recording regulatory assets and liabilities; however, regulatory commissions can reach different conclusions about the recovery of costs, and those conclusions could have a material impact on our consolidated financial statements. We believe it is probable that we will recover the regulatory assets that have been recorded.
Pension
We have a non-contributory, defined benefit retirement plan covering all eligible employees hired prior to May 9, 2008. The net periodic benefit costs (“pension costs”) for our defined benefit plan as described in Note 6 of the Notes to Consolidated Financial Statements are dependent upon numerous factors resulting from actual plan experience and assumptions concerning future experience. These costs, for example, are impacted by employee demographics (including age, compensation levels and employment periods), the level of contributions we make to the plan and earnings on plan assets. Additionally, changes made to the provisions of the plan may impact current and future pension costs. Pension costs may also be significantly affected by changes in key actuarial assumptions, including anticipated rates of return on plan assets and the discount rates used in determining the projected benefit obligation and pension costs. For the years ended June 30, 2014, 2013 and 2012, we recorded pension costs for our defined benefit pension plan of $750,000, $980,000 and $481,000, respectively.
Changes in pension obligations associated with the above factors may not be immediately recognized as pension costs in the Consolidated Statements of Income, but may be deferred and amortized in the future over the average remaining service period of active plan participants. As of June 30, 2014, $5,824,000 of net losses have been deferred for amortization as pension costs into future periods.
Our pension plan assets are principally comprised of equity and fixed income investments. Differences between actual portfolio returns and expected returns will result in increased or decreased pension costs in future periods. Likewise, changes in assumptions regarding current discount rates and expected rates of return on plan assets could also increase or decrease pension costs in future periods.
In selecting our discount rate assumption we considered rates of return on high-quality fixed-income investments that are expected to be available through the maturity dates of the pension benefits. Our expected long-term rate of return on pension plan assets was 6% for 2014 and was based on our targeted asset allocation assumption for 2014 of approximately 70% equity investments and approximately 30% fixed income investments. Our targeted investment allocation for equity investments includes allocations to domestic, global and real estate markets. For additional diversification, we also invest in absolute return strategy mutual funds, which include both equity and fixed income securities. Our asset allocation is designed to achieve a moderate level of overall portfolio risk in keeping with our desired risk objective. We regularly review our asset allocation and periodically rebalance our investments to our targeted allocation as appropriate.
21
The funded status of our plan reflects investment gains or losses in the year in which they occur based on the market value of assets at the measurement date.
Based on an assumed long-term rate of return of 6%, discount rate of 4.25%, and various other assumptions, we estimate that our pension costs associated with our defined benefit pension plan will decrease from $750,000 in 2014 to $493,000 in 2015. Modifying the expected long-term rate of return on our pension plan assets by .25% would change pension costs for 2015 by approximately $71,000. Increasing the discount rate assumption by .25% would decrease pension costs by approximately $100,000. Decreasing the discount rate assumption by .25% would increase pension costs by approximately $106,000.
Unbilled Revenues and Gas Costs
At each month-end, we estimate the natural gas service that has been rendered from the date the customer's meter was last read to month-end. This estimate of unbilled usage is based on projected base load usage for each day unbilled plus projected weather-sensitive usage for each degree day during the unbilled period. Unbilled revenues and natural gas costs are calculated from the estimate of unbilled usage multiplied by the rates in effect at month-end. Actual usage patterns may vary from these assumptions and may impact operating income.
Asset Retirement Obligations
We have accrued asset retirement obligations for gas well plugging and abandonment costs. Additionally, we have recorded asset retirement obligations required pursuant to regulations related to the retirement of our service lines and mains, although the timing of such retirements is uncertain. The fair value of our retirement obligations is recorded at the time the obligations are incurred. We do not recognize asset retirement obligations relating to assets with indeterminate useful lives. Upon initial recognition of an asset retirement obligation, we increase the carrying amount of the long-lived asset by the same amount as the liability. Over time the liabilities accrete for the change in their present value, and the initial capitalized costs depreciate over the useful lives of the related assets. For asset retirement obligations attributable to assets of our regulated operations, the accretion and depreciation are deferred as a regulatory asset. We must use judgment to identify all appropriate asset retirement obligations. The underlying assumptions used for the value of the retirement obligations and related capitalized costs can change from period to period. These assumptions include the estimated future retirement costs, the estimated retirement dates and the assumed credit-adjusted risk-free interest rates. Our asset retirement obligations are further discussed in Note 4 of the Notes to Consolidated Financial Statements.
New Accounting Pronouncements
Significant management judgment is generally required during the process of adopting new accounting pronouncements. See Note 2 of the Notes to Consolidated Financial Statements for a discussion of these pronouncements.
Forward-Looking Statements
Management's Discussion and Analysis of Financial Condition and Results of Operations and the other sections of this report contain forward-looking statements that relate to future events or our future performance. We have attempted to identify these statements by using words such as “estimates”, “attempts”, “expects”, “monitors”, “plans”, “anticipates”, “intends”, “continues”, “could”, “strives” ,”seeks”, “will rely”, “believes” and similar expressions.
22
These forward-looking statements include, but are not limited to, statements about:
· | operational plans, |
· | the cost and availability of our natural gas supplies, |
· | capital expenditures, |
· | sources and availability of funding for our operations and expansion, |
· | anticipated growth and growth opportunities through system expansion and acquisition, |
· | competitive conditions that we face, |
· | production, storage, gathering, transportation, marketing and natural gas liquids activities, |
· | acquisition of service franchises from local governments, |
· | pension plan costs and management, |
· | contractual obligations and cash requirements, |
· | management of our natural gas supply and risks due to potential fluctuation in the price of natural gas, |
· | revenues, income, margins and profitability, |
· | efforts to purchase and transport locally produced natural gas, |
· | recovery of regulatory assets, |
· | litigation and other contingencies, |
· | regulatory and legislative matters, and |
· | dividends. |
Such statements are “forward-looking statements” within the meaning of the Private Securities Litigation Reform Act of 1995. Our forward-looking statements are not guarantees of future performance and are based upon currently available competitive, financial and economic data along with our operating plans.
Item 1A. Risk Factors lists factors that, among others, could cause future results to differ materially from those expressed in or implied by the forward-looking statements or historical results.
Results of Operations
Gross Margins
Our operating revenues are derived primarily from the sale of natural gas and natural gas liquids and the provision of natural gas transportation services. We define “gross margins” as natural gas sales less the corresponding purchased natural gas expenses, plus transportation, natural gas liquids and other revenues. We view gross margins as an important performance measure of the core profitability of our operations and believe investors benefit from having access to the same financial measures that our management uses. Gross margin can be derived directly from our Consolidated Statements of Income included in Item 8. Financial Statements and Supplemental Data, as follows:
($000) | 2014 | 2013 | 2012 | |||||
Operating revenues | 95,846 | 80,665 | 74,078 | |||||
Regulated purchased natural gas | (27,215 | ) | (17,825 | ) | (15,703 | ) | ||
Non-regulated purchased natural gas | (29,059 | ) | (26,011 | ) | (23,380 | ) | ||
Consolidated gross margins | 39,572 | 36,829 | 34,995 | |||||
Operating Income, as presented in the Consolidated Statements of Income, is the most directly comparable financial measure calculated and presented in accordance with accounting principles generally accepted in the United States ("GAAP"). Gross margin is a “non-GAAP financial measure”, as defined in accordance with SEC rules.
Natural gas prices are determined by an unregulated national market. Therefore, the price that we pay for natural gas fluctuates with national supply and demand. See Item 7A. Quantitative and Qualitative Disclosures About Market Risk for discussion of our forward contracts.
23
In the following table we set forth variations in our gross margins for the last two years compared with the same periods in the preceding year. The variation amounts and percentages presented in the following tables for regulated and non-regulated gross margins include intersegment transactions. These intersegment revenues and expenses are eliminated in the Consolidated Statements of Income.
($000) | 2014 compared to 2013 | 2013 compared to 2012 | |||
Increase (decrease) in gross margins | |||||
Regulated segment | |||||
Natural gas sales | 950 | 1,420 | |||
On-system transportation | 179 | 457 | |||
Off-system transportation | (53 | ) | 205 | ||
Other | 57 | 9 | |||
Intersegment elimination (a) | 104 | (441 | ) | ||
Total | 1,237 | 1,650 | |||
Non-regulated segment | |||||
Natural gas sales | 1,053 | (256 | ) | ||
Natural gas liquids | 529 | 41 | |||
Other | 28 | (42 | ) | ||
Intersegment elimination (a) | (104 | ) | 441 | ||
Total | 1,506 | 184 | |||
Increase in consolidated gross margins | 2,743 | 1,834 | |||
Percentage increase (decrease) in volumes | |||||
Regulated segment | |||||
Natural gas sales (Mcf) | 10 | 25 | |||
On-system transportation (Mcf) | (4 | ) | 6 | ||
Off-system transportation (Mcf) | (2 | ) | 5 | ||
Non-regulated segment | |||||
Natural gas sales (Mcf) | (5 | ) | 19 | ||
Natural gas liquids (gallons) | 39 | 34 | |||
(a) | Intersegment eliminations represent the natural gas transportation costs from the regulated segment to the non-regulated segment. |
Heating degree days were 107% of the normal thirty year average temperatures for fiscal 2014, as compared with 104% and 83% of normal temperatures for 2013 and 2012, respectively. A heating degree day is the equivalent for each degree that the average of the high and the low temperatures for a day is below 65 degrees in a specific geographic location. Heating degree days are used in the natural gas industry to measure the relative coldness of weather and to estimate the demand for natural gas. Normal degree days are based on historical thirty-year average heating degree days, as calculated from data provided by the National Weather Service for the same geographic location.
In 2014, consolidated gross margins increased $2,743,000 (7%), as compared to 2013, due to increased non-regulated and regulated gross margins of $1,506,000 and $1,237,000, respectively. Non-regulated gross margins increased due to the increased sales of the non-regulated segment's natural gas production inventory and increased sales of natural gas liquids extracted from the natural gas in our system. Regulated gross margins increased due to a 10% increase in volumes sold to our regulated customers
24
as a result of colder weather and increased amounts billed through our pipe replacement program tariff. Partially offsetting these increases are decreased rates billed through our weather normalization tariff.
In 2013, consolidated gross margins increased $1,834,000 (5%), as compared to 2012, due to increased regulated and non-regulated gross margins of $1,650,000 and $184,000, respectively. Regulated gross margins increased due to a 25% increase in volumes sold to our regulated customers as a result of colder weather and an increase in volumes transported as a result of an increase in our transportation customers' gas requirements. Partially offsetting these increases are decreased rates billed through our weather normalization tariff.
Operation and Maintenance
In 2014 there were no significant changes in operation and maintenance as compared to 2013.
In 2013, operation and maintenance increased $1,556,000 (11%) due to a $1,230,000 increase in labor and employee benefits resulting from an increase in pension expense and share-based compensation and a $369,000 increase in uncollectible expense.
Depreciation and Amortization
In 2014 and 2013, there were no significant changes in depreciation and amortization, as compared to 2013 and 2012, respectively.
Taxes Other Than Income Taxes
In 2014 and 2013, there were no significant changes in taxes other than income taxes, as compared to 2013 and 2012, respectively.
Interest on Long-Term Debt
In 2014, there were no significant changes in interest on long-term debt, as compared to 2013.
In 2013, interest on long-term debt decreased $546,000 (18%) as a result of refinancing our 5.75% Insured Quarterly Notes and 7% Debentures (as further discussed in Note 10 of the Notes to Consolidated Financial Statements).
Other Interest (Income) Expense
In 2014, other interest (income) expense increased $874,000 (106%), as compared to 2013 due to a decrease in interest accrued in the prior year relating to a resolution of a tax assessment (as further discussed in Note 13 of the Notes to Consolidated Financial Statements).
In 2013, other interest (income) expense decreased $1,807,000 (183%) due to a decrease in interest accrued for a tax assessment issued to Delta Resources by the Kentucky Department of Revenue (as further discussed in Note 13 of the Notes to Consolidated Financial Statements).
Income Tax Expense
In 2014, income tax expense increased $590,000 (14%) due to an increase in net income before taxes. There were no significant changes in our effective tax rate for 2014, as compared to 2013.
In 2013, income tax expense increased $1,011,000 (31%) due to an increase in net income before income taxes. There were no significant changes in our effective tax rate for 2013, as compared to 2012.
Basic and Diluted Earnings Per Common Share
For 2014 and 2013, our basic and diluted earnings per common share changed as a result of changes in net income and an increase in the number of our common shares outstanding. We increased our number of common shares outstanding as a result of shares issued through our Dividend Reinvestment and Stock Purchase Plan as well as those awarded through our Incentive
25
Compensation Plan. Our computation of basic and diluted earnings per share is set forth in Note 11 of the Notes to Consolidated Financial Statements.
Under our Incentive Compensation Plan, recipients of performance share awards receive unvested non-participating shares, as further discussed in Note 17 of the Notes to Consolidated Financial Statements. Unvested non-participating shares become dilutive in the interim quarter-end in which the performance objective is met. If the performance objective continues to be met through the end of the performance period, these shares become unvested participating shares as of the fiscal year-end. The weighted average number of unvested non-participating shares outstanding during a period is included in the diluted earnings per common share calculation using the treasury stock method, unless the effect of including such shares would be antidilutive. There were no unvested non-participating shares outstanding as of June 30, 2014 and 2013.
Certain unvested awards under our shareholder approved incentive compensation plan, as further discussed in Note 17 of the Notes to Consolidated Financial Statements, provide the recipients of the awards all the rights of a shareholder of Delta Natural Gas Company, Inc. including the right to dividends declared on common shares. Any unvested shares which are participating in dividends are considered participating securities and are included in our computation of basic and diluted earnings per share using the two-class method unless the effect of including such shares would be antidilutive, as further discussed in Note 11 of the Notes to Consolidated Financial Statements. There were 74,000 and 68,000 unvested participating shares outstanding as of June 30, 2014 and 2013, respectively. There were no antidilutive shares as of June 30, 2014 and 2013.
Item 7A. Quantitative and Qualitative Disclosures About Market Risk
We purchase our natural gas supply primarily through forward natural gas contracts. The price we pay for our natural gas supply acquired under these purchase contracts is fixed prior to the delivery of the natural gas. Additionally, we inject some of our natural gas purchases into our underground natural gas storage facility in the non-heating months and withdraw this natural gas from storage for delivery to customers during the heating months. For our regulated segment, we have minimal price risk resulting from forward purchase and storage of natural gas because we are permitted to pass these natural gas costs on to our regulated customers through our natural gas cost recovery rate mechanism, approved quarterly by the Kentucky Public Service Commission.
Price risk for the non-regulated business is mitigated by efforts to balance supply and demand. However, there are greater risks in the non-regulated segment because of the practical limitations on the ability to perfectly predict demand. In addition, we are exposed to changes in the market price of natural gas on uncommitted natural gas inventory of our non-regulated segment. The pricing of the natural gas liquids sold by our non-regulated segment is determined in the national unregulated market.
None of our natural gas contracts are accounted for using the fair value method of accounting. While some of our natural gas purchase and natural gas sales contracts meet the definition of a derivative, we have designated these contracts as normal purchases and normal sales. As of June 30, 2014, we had a forward purchase contract totaling $140,000 that expires in December, 2014. The forward purchase contract is at a fixed price and not impacted by changes in the market price of natural gas.
When we have a balance outstanding on our variable rate bank line of credit, we are exposed to risk resulting from changes in interest rates. The interest rate on our bank line of credit with Branch Banking and Trust Company is benchmarked to the monthly London Interbank Offered Rate. There were no borrowings outstanding on our bank line of credit as of June 30, 2014 or June 30, 2013. The weighted average interest rate on our bank line of credit was 1.3% as of June 30, 2014 and June 30, 2013, respectively. During 2014, we borrowed and repaid $691,000 from the bank line of credit, having a weighted average interest rate of 1.4%. A one percent (one hundred basis point) increase in our average interest rate would not have had a significant impact on our annual pre-tax net income. We did not have any borrowings on our bank line of credit during 2013.
26
Item 8. Financial Statements and Supplementary Data
INDEX TO CONSOLIDATED FINANCIAL STATEMENTS AND SCHEDULE | PAGE |
Report of Independent Registered Public Accounting Firm | |
Consolidated Statements of Income for the years ended June 30, 2014, 2013 and 2012 | |
Consolidated Statements of Cash Flows for the years ended June 30, 2014, 2013 and 2012 | |
Consolidated Balance Sheets as of June 30, 2014 and 2013 | |
Consolidated Statements of Changes in Shareholders' Equity for the years ended June 30, 2014, 2013 and 2012 | |
Notes to Consolidated Financial Statements | |
Schedule II - Valuation and Qualifying Accounts for the years ended June 30, 2014, 2013 and 2012 | |
Schedules other than those listed above are omitted because they are not required, are not applicable or the required information is shown in the financial statements or notes thereto.
27
Item 9. Changes in and Disagreements with Accountants on Accounting and Financial Disclosure
None.
Item 9A. Controls and Procedures
Disclosure Controls and Procedures
Disclosure controls and procedures are our controls and other procedures that are designed to provide reasonable assurance that information required to be disclosed by us in the reports that we file or submit under the Securities Exchange Act of 1934 (“Exchange Act”) is recorded, processed, summarized, and reported within the time periods specified in the SEC's rules and forms. Disclosure controls and procedures include, without limitation, controls and procedures designed to provide reasonable assurance that information required to be disclosed by us in the reports that we file under the Exchange Act is accumulated and communicated to our management, including our Chief Executive Officer and Chief Financial Officer, as appropriate to allow timely decisions regarding required disclosure.
Under the supervision and with the participation of our management, including our Chief Executive Officer and Chief Financial Officer, we have evaluated the effectiveness of our disclosure controls and procedures (as such term is defined in Rule 13a-15(e) and 15d-15(e) under the Exchange Act) as of June 30, 2014 and based upon this evaluation, our Chief Executive Officer and Chief Financial Officer have concluded that these controls and procedures are effective in providing reasonable assurance of compliance.
Changes in Internal Control over Financial Reporting
Under the supervision and with the participation of our management, including our Chief Executive Officer and Chief Financial Officer, we have evaluated any changes in our internal control over financial reporting (as such term is defined in Rules 13a-15(f) and 15d-15(f) under the Exchange Act) during the fiscal year ended June 30, 2014 and found no change that has materially affected, or is reasonably likely to materially affect, our internal control over financial reporting.
Our management is responsible for establishing and maintaining an adequate system of internal control over financial reporting, as such term is defined in Exchange Act Rules 13a-15(f) and 15d-15(f). Our internal control system was designed to provide reasonable assurance regarding the reliability of financial reporting and the preparation of financial statements for external purposes, in accordance with generally accepted accounting principles.
Management's Annual Report on Internal Control over Financial Reporting
Our management, including our Chief Executive Officer and Chief Financial Officer, has conducted an evaluation of the effectiveness of our internal control over financial reporting as of June 30, 2014 based on the framework in Internal Control - Integrated Framework issued in 1992 by the Committee of Sponsoring Organizations of the Treadway Commission. Based on that evaluation, management concluded that our internal control over financial reporting was effective as of June 30, 2014.
Because of its inherent limitations, internal control over financial reporting may not prevent or detect misstatements. Also, projections of any evaluation of effectiveness to future periods are subject to the risk that controls may become inadequate because of changes in conditions, or that the degree of compliance with the policies and procedures may deteriorate.
Deloitte & Touche LLP, our independent registered public accounting firm, has issued an attestation report on our internal control over financial reporting. That report immediately follows:
28
REPORT OF INDEPENDENT REGISTERED PUBLIC ACCOUNTING FIRM
To the Board of Directors and Shareholders of
Delta Natural Gas Company, Inc.
Winchester, Kentucky:
We have audited the internal control over financial reporting of Delta Natural Gas Company, Inc. and subsidiaries (the "Company") as of June 30, 2014, based on criteria established in Internal Control - Integrated Framework (1992) issued by the Committee of Sponsoring Organizations of the Treadway Commission. The Company's management is responsible for maintaining effective internal control over financial reporting and for its assessment of the effectiveness of internal control over financial reporting, included in the accompanying Management's Annual Report on Internal Control over Financial Reporting. Our responsibility is to express an opinion on the Company's internal control over financial reporting based on our audit.
We conducted our audit in accordance with the standards of the Public Company Accounting Oversight Board (United States). Those standards require that we plan and perform the audit to obtain reasonable assurance about whether effective internal control over financial reporting was maintained in all material respects. Our audit included obtaining an understanding of internal control over financial reporting, assessing the risk that a material weakness exists, testing and evaluating the design and operating effectiveness of internal control based on the assessed risk, and performing such other procedures as we considered necessary in the circumstances. We believe that our audit provides a reasonable basis for our opinion.
A company's internal control over financial reporting is a process designed by, or under the supervision of, the company's principal executive and principal financial officers, or persons performing similar functions, and effected by the company's board of directors, management, and other personnel to provide reasonable assurance regarding the reliability of financial reporting and the preparation of financial statements for external purposes in accordance with generally accepted accounting principles. A company's internal control over financial reporting includes those policies and procedures that (1) pertain to the maintenance of records that, in reasonable detail, accurately and fairly reflect the transactions and dispositions of the assets of the company; (2) provide reasonable assurance that transactions are recorded as necessary to permit preparation of financial statements in accordance with generally accepted accounting principles, and that receipts and expenditures of the company are being made only in accordance with authorizations of management and directors of the company; and (3) provide reasonable assurance regarding prevention or timely detection of unauthorized acquisition, use, or disposition of the company's assets that could have a material effect on the financial statements.
Because of the inherent limitations of internal control over financial reporting, including the possibility of collusion or improper management override of controls, material misstatements due to error or fraud may not be prevented or detected on a timely basis. Also, projections of any evaluation of the effectiveness of the internal control over financial reporting to future periods are subject to the risk that the controls may become inadequate because of changes in conditions, or that the degree of compliance with the policies or procedures may deteriorate.
In our opinion, the Company maintained, in all material respects, effective internal control over financial reporting as of June 30, 2014, based on the criteria established in Internal Control - Integrated Framework (1992) issued by the Committee of Sponsoring Organizations of the Treadway Commission.
We have also audited, in accordance with the standards of the Public Company Accounting Oversight Board (United States), the consolidated financial statements and financial statement schedule as of and for the year ended June 30, 2014 of the Company and our report dated August 26, 2014 expressed an unqualified opinion on those financial statements and financial statement schedule.
/s/ DELOITTE & TOUCHE LLP
Indianapolis, Indiana
August 26, 2014
29
Item 9B. Other Information
None.
PART III
Item 10. Directors, Executive Officers and Corporate Governance
We have a Business Code of Conduct and Ethics that applies to all directors, officers and employees, including our principal executive officer, principal financial officer and principal accounting officer. Our Business Code of Conduct and Ethics can be found on our website by going to the following address: http://www.deltagas.com/investor_relations.html. We will post any amendments to the Business Code of Conduct and Ethics, as well as any waivers that are required to be disclosed by the rules of either the Securities and Exchange Commission or the NASDAQ OMX Group, on our website.
Our Board of Directors has adopted charters for the Audit, Corporate Governance and Compensation and Executive Committees of the Board of Directors as well as Corporate Governance Guidelines. These documents can be found on our website by going to the following address: http://www.deltagas.com/corporate_governance.html.
A printed copy of any of the materials referred to above can be obtained by contacting us at the following address:
Delta Natural Gas Company, Inc. |
Attn: John B. Brown |
3617 Lexington Road |
Winchester, KY 40391 |
(859) 744-6171 |
The Audit Committee of our Board of Directors is an “audit committee” for purposes of Section 3(a)(58) of the Securities Exchange Act of 1934.
The other information required by this Item is contained under the captions “Election of Directors”, “Board Leadership, Committees and Meetings”, “Executive Officers”, “Certain Relationships and Related Transactions” and “Section 16(a) Beneficial Ownership Reporting Compliance” in our definitive Proxy Statement for the 2014 Annual Meeting of Shareholders, which will be filed with the Securities and Exchange Commission no later than 120 days after June 30, 2014. We incorporate that information in this document by reference.
Item 11. Executive Compensation
Information in response to this item is contained under the captions “Director Compensation”, “Corporate Governance and Compensation Committee Interlocks and Insider Participation”, “Compensation Discussion and Analysis”, “Compensation Risks”, “Corporate Governance and Compensation Committee Report”, “Summary Compensation Table”, “Grants of Plan Based Awards”, “Outstanding Equity Awards at Fiscal Year-End”, “Retirement Benefits”, “Potential Payments Upon Termination Or Change in Control” and “Termination Table” in our definitive Proxy Statement for the 2014 Annual Meeting of Shareholders, which will be filed with the Securities and Exchange Commission no later than 120 days after June 30, 2014. We incorporate that information in this document by reference.
30
Item 12. Security Ownership of Certain Beneficial Owners and Management and Related Stockholder Matters
Equity Compensation Plans
Pursuant to our shareholder approved incentive compensation plan, we have the ability to grant stock, performance shares and restricted stock to employees, officers and directors. The plan does not provide for the awarding of options, warrants or rights. We do not have any equity compensation plans which have not been approved by our shareholders.
The following table sets forth certain information with respect to our equity compensation plan at June 30, 2014:
Column A | Column B | Column C | ||
Number of securities to be issued upon exercise of outstanding options, warrants and rights | Weighted-average exercise price of outstanding options, warrants and rights | Number of securities remaining available for future issuance under equity compensation plans (excluding securities reflected in Column A) | ||
— | — | 793,760 | ||
The other information required by this Item is contained under the captions “Security Ownership of Certain Beneficial Owners” and "Security Ownership of Management" in our definitive Proxy Statement for the 2014 Annual Meeting of Shareholders, which will be filed with the Securities and Exchange Commission no later than 120 days after June 30, 2014. We incorporate that information in this document by reference.
Item 13. Certain Relationships and Related Transactions, and Director Independence
The information required by this item is contained under the captions “Election of Directors”, “Board Leadership, Committees and Meetings” and “Certain Relationships and Related Transactions” in our definitive Proxy Statement for the 2014 Annual Meeting of Shareholders, which will be filed with the Securities and Exchange Commission no later than 120 days after June 30, 2014. We incorporate that information in this document by reference.
Item 14. Principal Accountant Fees and Services
The information required by this item is contained under the caption “Audit Committee Report” in our definitive Proxy Statement for the 2014 Annual Meeting of Shareholders, which will be filed with the Securities and Exchange Commission no later than 120 days after June 30, 2014. We incorporate that information in this document by reference.
31
PART IV
Item 15. Exhibits and Financial Statement Schedule
(a) | Financial Statements, Schedule and Exhibits | |
(1) | Financial Statements See Index at Item 8 | |
(2) | Financial Statement Schedule See Index at Item 8 | |
(3) | Exhibits | |
Exhibit No. | ||
3.1 | Registrant's Amended and Restated Articles of Incorporation (dated November 16, 2006) are incorporated herein by reference to Exhibit 3(i) to Registrant's Form 10-K/A (File No. 000-08788) for the period ended June 30, 2007. | |
3.2 | Registrant's Amended and Restated By-Laws (dated August 15, 2014) are incorporated herein by reference to Exhibit 3.1 to Registrant's Form 8-K (File No. 000-8788) dated August 19, 2014. | |
4 | Note Purchase and Private Shelf Agreement dated December 8, 2011 in respect of 4.26% Senior Notes, Series A, due December 20, 2031, is incorporated herein by reference to Exhibit 10.01 to Registrant's Form 8-K (File No. 000-08788) dated December 13, 2011. | |
10.01 | Natural Gas Sales Agreement, dated May 1, 2000 by and between Atmos Energy Marketing, LLC and Registrant is incorporated herein by reference to Exhibit 10(c) to Registrant's Form S-2/A (Reg. No. 333-100852) dated December 13, 2002. | |
10.02 | Base Contract for Short-Term Sale and Purchase of Natural Gas, dated January 1, 2002, by and between M & B Gas Services, Inc. and Registrant, is incorporated herein by reference to Exhibit 10(n) to Registrant's Form S-2 (Reg. No. 333-104301) dated April 4, 2003. | |
10.03 | Natural Gas Sales Agreement, dated May 1, 2003, by and between Atmos Energy Marketing, LLC and Registrant is incorporated herein by reference to Exhibit 10(d) to Registrant's Form 10-K (File No. 000-08788) for the period ended June 30, 2003. | |
10.04 | Natural Gas Sales Agreement, dated May 1, 2010, by and between Atmos Energy Marketing, LLC and Registrant is incorporated herein by reference to Exhibit 10.04 to Registrant's Form 10-K (File No. 000-08788) for the period ended June 30, 2012. | |
10.05 | Base contracts for the Sale and Purchase of Natural Gas, dated May 1, 2013, by and between Midwest Energy L.L.C. and Registrant are incorporated herein by reference to Registrant's Form 10-K (File No. 000-08788) for the period ended June 30, 2013. | |
10.06 | Natural Gas Transportation Agreement (Service Package 9069), dated December 19, 1994, by and between Tennessee Gas Pipeline Company and Registrant is incorporated herein by reference to Exhibit 10(e) to Registrant's Form S-2/A (Reg. No. 333-100852) dated December 13, 2002. | |
10.07 | Agreement to transport natural gas between Nami Resources Company L.L.C. and Registrant, dated March 10, 2005, is incorporated herein by reference to Exhibit 10(a) to Registrant's Form 8-K (File No. 000-08788) dated March 23, 2005. | |
10.08 | Amendment, dated July 22, 2010, of agreement to transport natural gas between Nami Resources Company, L.L.C. and Registrant incorporated herein by reference to Exhibit 10(f) to Registrant's Form 10-K (File No. 000-08788), for the period ended June 30, 2010. | |
10.09 | GTS Service Agreements, dated November 1, 1993 (Service Agreement Nos. 37,813, 37,814 and 37,815), and Appendix A to respective Service Agreements, effective November 1, 2010, by and between Columbia Gas Transmission Corporation and Registrant incorporated herein by reference to Exhibit 10(g) to Registrant's Form 10-K (File No. 000-08788), for the period ended June 30, 2010. | |
10.10 | FTS1 Service Agreements, dated October 4, 1994, (Service Agreement Nos. 43,827, 43,828 and 43,829), and Appendix A to respective Service Agreements, effective November 1, 2010, by and between Columbia Gulf Transmission Corporation and Registrant incorporated herein by reference to Exhibit 10(h) to Registrant's Form 10-K (File No. 000-08788), for the period ended June 30, 2010. | |
10.11 | Underground Natural Gas Storage Lease and Agreement, dated March 9, 1994, by and between Equitable Resources Exploration, a division of Equitable Resources Energy Company, and Lonnie D. Ferrin and Amendment No. 1 and Novation to Underground Natural Gas Storage Lease and Agreement, dated March 22, 1995, by and between Equitable Resources Exploration, Lonnie D. Ferrin and Registrant, is incorporated herein by reference to Exhibit 10(m) to Registrant's Form S-2 (Reg. No. 333-104301) dated April 4, 2003. | |
32
10.12 | Oil and Natural Gas Lease, dated July 19, 1995, by and between Meredith J. Evans and Helen Evans and Paddock Oil and Gas, Inc.; Assignment, dated June 15, 1995, by Paddock Oil and Gas, Inc., as assignor, to Lonnie D. Ferrin, as assignee; Assignment, dated August 31, 1995, by Paddock Oil and Gas, Inc., as assignor, to Lonnie D. Ferrin, as assignee; and Assignment and Assumption Agreement, dated November 10, 1995, by and between Lonnie D. Ferrin and Registrant, is incorporated herein by reference to Exhibit 10(o) to Registrant's Form S-2 (Reg. No. 333-104301) dated April 4, 2003. | |
10.13 | Natural Gas Storage Lease, dated October 4, 1995, by and between Judy L. Fuson, Guardian of Jamie Nicole Fuson, a minor, and Lonnie D. Ferrin and Assignment and Assumption Agreement, dated November 10, 1995, by and between Lonnie D. Ferrin and Registrant is incorporated herein by reference to Exhibit 10(j) to Registrant's Form S-2 (Reg. No. 333-104301) dated April 4, 2003. | |
10.14 | Natural Gas Storage Lease, dated November 6, 1995, by and between Thomas J. Carnes, individually and as Attorney-in-fact and Trustee for the individuals named therein, and Registrant, is incorporated herein by reference to Exhibit 10(k) to Registrant's Form S-2 (Reg. No. 333-104301) dated April 4, 2003. | |
10.15 | Deed and Perpetual Natural Gas Storage Easement, dated December 21, 1995, by and between Katherine M. Cornelius, William Cornelius, Frances Carolyn Fitzpatrick, Isabelle Fitzpatrick Smith and Kenneth W. Smith and Registrant is incorporated herein by reference to Exhibit 10(l) to Registrant's Form S-2 (Reg. No. 333-104301) dated April 4, 2003. | |
10.16 | Loan Agreement, dated October 31, 2002, by and between Branch Banking and Trust Company and Registrant is incorporated herein by reference to Exhibit 10(i) to Registrant's Form S-2/A (Reg. No. 333-100852) dated December 13, 2002. | |
10.17 | Promissory Note, in the original principal amount of $40,000,000, made by Registrant to the order of Branch Banking and Trust Company, is incorporated herein by reference to Exhibit 10(a) to Registrant's Form 10-Q (File No. 000-08788) for the period ended September 30, 2002. | |
10.18 | Modification Agreement extending to October 31, 2004 the Promissory Note and Loan Agreement dated October 31, 2002 between Branch Banking and Trust Company and Registrant, is incorporated herein by reference to Exhibit 10(a) to Registrant's Form 10-Q (File No. 000-08788) for the period ended September 30, 2003. | |
10.19 | Modification Agreement extending to October 31, 2005 the Promissory Note and Loan Agreement dated October 31, 2002 between Branch Banking and Trust Company and Registrant, is incorporated herein by reference to Exhibit 10(a) to Registrant's Form 10-Q (File No. 000-08788) for the period ended September 30, 2004. | |
10.20 | Modification Agreement extending to October 31, 2007 the Promissory Note and Loan Agreement dated October 31, 2002 between Branch Banking and Trust Company and Registrant, is incorporated herein by reference to Exhibit 10(a) to Registrant's Form 8-K (File No. 000-08788) dated August 19, 2005. | |
10.21 | Modification Agreement extending to October 31, 2009 the Promissory Note and Loan Agreement dated October 31, 2002 between Branch Banking and Trust Company and Registrant, is incorporated herein by reference to Exhibit 10(a) to Registrant's Form 10-Q (File No. 000-08788) for the period ended September 30, 2007. | |
10.22 | Modification Agreement extending to June 30, 2011 the Promissory Note and Loan Agreement dated October 31, 2002 between Branch Banking and Trust Company and Registrant, is incorporated herein by reference to Exhibit 10(a) to Registrant's Form 8-K (File No. 000-08788) dated June 30, 2009. | |
10.23 | Modification Agreement extending to June 30, 2013 the Promissory Note and Loan Agreement dated October 31, 2002 between Branch Banking and Trust Company and Registrant, is incorporated herein by reference to Exhibit 10(a) to Registrant's Form 8-K (File No. 000-08788) dated June 30, 2011. | |
10.24 | Modification Agreement extending to June 30, 2015 the Promissory Note and Loan Agreement dated October 31, 2002 between Branch Banking and Trust Company and Registrant, is incorporated herein by reference to Exhibit 10(a) to Registrant's Form 8-K (File No. 000-08788) dated June 30, 2013. | |
10.25 | Employment agreement dated March 1, 2000, between Glenn R. Jennings, Registrant's Chairman of the Board, President and Chief Executive Officer, and Registrant, is incorporated herein by reference to Exhibit (k) to Registrant's Form 10-Q (File No. 000-08788) dated March 31, 2000. | |
10.26 | Officer agreements dated March 1, 2000, between two officers, those being John B. Brown and Johnny L. Caudill, and Registrant, are incorporated herein by reference to Exhibit 10(k) to Registrant's Form 10‑Q (File No. 000-08788) for the period ended March 31, 2000. | |
10.27 | Officer agreement dated November 20, 2008, between Brian S. Ramsey and Registrant is incorporated herein by reference to Exhibit 10(a) to Registrant's Form 8-K (File No. 000-08788) dated November 21, 2008. | |
10.28 | Officer agreement dated November 19, 2010, between Matthew D. Wesolosky and Registrant is incorporated herein by reference to Exhibit 10(a) to Registrant's Form 8-K (File No. 000-08788) dated November 24, 2010. | |
33
10.29 | Supplemental retirement benefit agreement and trust agreement between Glenn R. Jennings and Registrant is incorporated herein by reference to Exhibit 10(a) to Registrant's Form 8-K (File No. 000-08788) dated February 25, 2005. | ||
10.30 | Registrant's Amended and Restated Dividend Reinvestment and Stock Purchase Plan, dated November 17, 2005, is incorporated herein by reference to Exhibit 99(b) to Registrant's S-3D (Reg. No. 333-130301) dated December 14, 2005 and Post-Effective Amendment No. 1 to Registrant's S-3 (Reg. No. 333-130301) dated August 29, 2012. | ||
10.31 | Registrant's Incentive Compensation Plan, dated January 1, 2008, is incorporated herein by reference to Exhibit 4.1 to Registrant's S-8 (Reg. No. 333-165210) dated March 4, 2010. | ||
10.32 | Notices of Performance Shares Award between five officers, those being John B. Brown, Johnny L. Caudill, Glenn R. Jennings, Brian S. Ramsey and Matthew D. Wesolosky and Registrant, are incorporated herein by reference to Exhibits 10.1, 10.2, 10.3, 10.4 and 10.5, respectively, of Registrant's Form 8-K (File No. 000-08788) dated August 16, 2011. | ||
10.33 | Notices of Performance Shares Award between five officers, those being John B. Brown, Johnny L. Caudill, Glenn R. Jennings, Brian S. Ramsey and Matthew D. Wesolosky and Registrant, are incorporated herein by reference to Exhibit 10.1, 10.2, 10.3, 10.4 and 10.5, respectively, of Registrant's Form 8-K (File No. 000-08788) dated August 21, 2012. | ||
10.34 | Notices of Performance Shares Award between five officers, those being John B. Brown, Johnny L. Caudill, Glenn R. Jennings, Brian S. Ramsey and Matthew D. Wesolosky and Registrant, are incorporated herein by reference to Exhibit 10.1, 10.2, 10.3, 10.4 and 10.5, respectively, of Registrant's Form 8-K (File No. 000-08788) dated August 21, 2013. | ||
10.35 | Form of Notice of Performance Shares Award is filed herewith. | ||
12 | Computation of the Consolidated Ratio of Earnings to Fixed Charges. | ||
21 | Subsidiaries of the Registrant. | ||
23 | Consent of Independent Registered Public Accounting Firm. | ||
31.1 | Certification of the Chief Executive Officer pursuant to Section 302 of the Sarbanes-Oxley Act of 2002. | ||
31.2 | Certification of the Chief Financial Officer pursuant to Section 302 of the Sarbanes-Oxley Act of 2002. | ||
32.1 | Certification of the Chief Executive Officer pursuant to 18 U.S.C. Section 1350 as adopted pursuant to Section 906 of the Sarbanes-Oxley Act of 2002. | ||
32.2 | Certification of the Chief Financial Officer pursuant to 18 U.S.C. Section 1350 as adopted pursuant to Section 906 of the Sarbanes-Oxley Act of 2002. | ||
101.INS | XBRL Instance Document | ||
101.SCH | XBRL Taxonomy Extension Schema | ||
101.CAL | XBRL Taxonomy Extension Calculation Linkbase | ||
101.DEF | XBRL Taxonomy Extension Definition Database | ||
101.LAB | XBRL Taxonomy Extension Label Linkbase | ||
101.PRE | XBRL Taxonomy Extension Presentation Linkbase | ||
Attached as Exhibit 101 to this Annual Report are the following documents formatted in extensible business reporting language (XBRL): | |||
(i) | Document and Entity Information; | ||
(ii) | Consolidated Statements of Income for the years ended June 30, 2014, 2013 and 2012; | ||
(iii) | Consolidated Statements of Cash Flows for the years ended June 30, 2014, 2013 and 2012; | ||
(iv) | Consolidated Balance Sheets as of June 30, 2014 and 2013; | ||
(v) | Consolidated Statements of Changes in Shareholders' Equity for the years ended June 30, 2014, 2013 and 2012; | ||
(vi) | Notes to Consolidated Financial Statements; | ||
(vii) | Schedule II – Valuation and Qualifying Accounts for the years ended June 30, 2014, 2013 and 2012. | ||
Pursuant to Rule 406T of Regulation S-T, these interactive data files are deemed not filed or part of a registration statement or prospects for purposes of Sections 11 or 12 of the Securities Act of 1933 or Section 18 of the Securities Exchange Act of 1934 and otherwise are not subject to liability. We also make available on our web site the Interactive Data Files submitted as Exhibit 101 to this Annual Report. | |||
34
SIGNATURES
Pursuant to the requirements of Section 13 or 15(d) of the Securities Exchange Act of 1934, the Registrant has duly caused this report to be signed on its behalf by the undersigned, thereunto duly authorized, on the 26th day of August, 2014.
DELTA NATURAL GAS COMPANY, INC. | |
By: /s/Glenn R. Jennings | |
Glenn R. Jennings | |
Chairman of the Board, President and Chief Executive Officer | |
Pursuant to the requirements of the Securities Exchange Act of 1934, this report has been signed below by the following persons on behalf of the Registrant and in the capacities and on the dates indicated.
(i) Principal Executive Officer: | ||
/s/Glenn R. Jennings | Chairman of the Board, President | August 26, 2014 |
(Glenn R. Jennings) | and Chief Executive Officer | |
(ii) Principal Financial Officer: | ||
/s/John B. Brown | Chief Financial Officer, | August 26, 2014 |
(John B. Brown) | Treasurer and Secretary | |
(iii) Principal Accounting Officer: | ||
/s/Matthew D. Wesolosky | Vice President - Controller | August 26, 2014 |
(Matthew D. Wesolosky) | ||
(iv) A Majority of the Board of Directors: | ||
/s/Glenn R. Jennings | Chairman of the Board, President | August 26, 2014 |
(Glenn R. Jennings) | and Chief Executive Officer | |
/s/Sandra C. Gray | Director | August 26, 2014 |
(Sandra C. Gray) | ||
/s/Edward J. Holmes | Director | August 26, 2014 |
(Edward J. Holmes) | ||
/s/Michael J. Kistner | Director | August 26, 2014 |
(Michael J. Kistner) | ||
/s/Lewis N. Melton | Director | August 26, 2014 |
(Lewis N. Melton) | ||
/s/Arthur E. Walker, Jr. | Director | August 26, 2014 |
(Arthur E. Walker, Jr.) | ||
/s/Michael R. Whitley | Director | August 26, 2014 |
(Michael R. Whitley) | ||
35
REPORT OF INDEPENDENT REGISTERED PUBLIC ACCOUNTING FIRM
To the Board of Directors and Shareholders of
Delta Natural Gas Company, Inc.
Winchester, Kentucky:
We have audited the accompanying consolidated balance sheets of Delta Natural Gas Company, Inc. and subsidiaries (the "Company") as of June 30, 2014 and 2013, and the related consolidated statements of income, changes in shareholders' equity, and cash flows for each of the three years in the period ended June 30, 2014. Our audits also included the financial statement schedule listed in the Index at Item 8. These financial statements and financial statement schedule are the responsibility of the Company's management. Our responsibility is to express an opinion on the financial statements and financial statement schedule based on our audits.
We conducted our audits in accordance with the standards of the Public Company Accounting Oversight Board (United States). Those standards require that we plan and perform the audit to obtain reasonable assurance about whether the financial statements are free of material misstatement. An audit includes examining, on a test basis, evidence supporting the amounts and disclosures in the financial statements. An audit also includes assessing the accounting principles used and significant estimates made by management, as well as evaluating the overall financial statement presentation. We believe that our audits provide a reasonable basis for our opinion.
In our opinion, such consolidated financial statements present fairly, in all material respects, the financial position of Delta Natural Gas Company, Inc. and subsidiaries as of June 30, 2014 and 2013, and the results of their operations and their cash flows for each of the three years in the period ended June 30, 2014, in conformity with accounting principles generally accepted in the United States of America. Also, in our opinion, such financial statement schedule, when considered in relation to the basic consolidated financial statements taken as a whole, present fairly, in all material respects, the information set forth therein.
We have also audited, in accordance with the standards of the Public Company Accounting Oversight Board (United States), the Company's internal control over financial reporting as of June 30, 2014, based on the criteria established in Internal Control-Integrated Framework (1992) issued by the Committee of Sponsoring Organizations of the Treadway Commission and our report dated August 26, 2014 expressed an unqualified opinion on the Company's internal control over financial reporting.
/s/ DELOITTE & TOUCHE LLP
Indianapolis, Indiana
August 26, 2014
36
Delta Natural Gas Company, Inc.
Consolidated Statements of Income
For the Year Ended June 30, | 2014 | 2013 | 2012 | ||||||||
Operating Revenues | |||||||||||
Regulated revenues | $ | 57,054,180 | $ | 46,427,203 | $ | 42,655,378 | |||||
Non-regulated revenues | 38,791,691 | 34,237,634 | 31,422,944 | ||||||||
Total operating revenues | $ | 95,845,871 | $ | 80,664,837 | $ | 74,078,322 | |||||
Operating Expenses | |||||||||||
Regulated purchased natural gas | $ | 27,215,425 | $ | 17,825,487 | $ | 15,703,114 | |||||
Non-regulated purchased natural gas | 29,059,426 | 26,011,164 | 23,380,426 | ||||||||
Operation and maintenance | 15,495,537 | 15,208,162 | 13,651,689 | ||||||||
Depreciation and amortization | 6,147,618 | 6,092,651 | 5,923,775 | ||||||||
Taxes other than income taxes | 2,324,426 | 2,338,694 | 2,154,090 | ||||||||
Total operating expenses | $ | 80,242,432 | $ | 67,476,158 | $ | 60,813,094 | |||||
Operating Income | $ | 15,603,439 | $ | 13,188,679 | $ | 13,265,228 | |||||
Other Income and Deductions, Net | $ | 201,462 | $ | 150,816 | $ | 75,170 | |||||
Interest Charges | |||||||||||
Interest on long-term debt | $ | 2,373,024 | $ | 2,438,325 | $ | 2,984,413 | |||||
Other interest (income) expense | 51,563 | (822,190 | ) | 984,612 | |||||||
Amortization of debt expense | 246,600 | 253,800 | 329,231 | ||||||||
Total interest charges | $ | 2,671,187 | $ | 1,869,935 | $ | 4,298,256 | |||||
Net Income Before Income Taxes | $ | 13,133,714 | $ | 11,469,560 | $ | 9,042,142 | |||||
Income Tax Expense | 4,858,586 | 4,268,784 | 3,258,144 | ||||||||
Net Income | $ | 8,275,128 | $ | 7,200,776 | $ | 5,783,998 | |||||
Earnings Per Common Share (Note 11) | |||||||||||
Basic and Diluted | $ | 1.19 | $ | 1.05 | $ | .85 | |||||
Dividends Declared Per Common Share | $ | .76 | $ | .72 | $ | .70 | |||||
The accompanying Notes to Consolidated Financial Statements are an integral part of these statements.
37
Delta Natural Gas Company, Inc.
Consolidated Statements of Cash Flows
For the Year Ended June 30, | 2014 | 2013 | 2012 | ||||||||
Cash Flows From Operating Activities | |||||||||||
Net income | $ | 8,275,128 | $ | 7,200,776 | $ | 5,783,998 | |||||
Adjustments to reconcile net income to net | |||||||||||
cash from operating activities | |||||||||||
Depreciation and amortization | 6,420,525 | 6,428,051 | 6,334,647 | ||||||||
Deferred income taxes and investment | |||||||||||
tax credits | (515,492 | ) | 1,959,741 | 2,513,400 | |||||||
Change in cash surrender value of officer's | |||||||||||
life insurance | (67,722 | ) | (27,300 | ) | 153 | ||||||
Share-based compensation | 1,111,966 | 921,709 | 712,144 | ||||||||
Excess tax deficiency from share-based compensation | (8,967 | ) | (8,946 | ) | — | ||||||
(Increase) decrease in assets | |||||||||||
Accounts receivable | 2,216,925 | (841,574 | ) | (1,407,711 | ) | ||||||
Natural gas in storage | (1,644,186 | ) | 1,451,494 | (121,547 | ) | ||||||
Deferred natural gas cost | 3,197,921 | (536,552 | ) | (7,581 | ) | ||||||
Materials and supplies | (288,597 | ) | 9,256 | (51,724 | ) | ||||||
Prepayments | (1,253,798 | ) | 893,490 | (2,606,809 | ) | ||||||
Other assets | 11,556 | (177,919 | ) | (548,470 | ) | ||||||
Increase (decrease) in liabilities | |||||||||||
Accounts payable | 169,226 | 2,725,470 | (3,518,540 | ) | |||||||
Accrued taxes | 83,528 | (2,757,561 | ) | 2,695,526 | |||||||
Asset retirement obligations | (553,612 | ) | (493,946 | ) | 1,085,920 | ||||||
Other liabilities | 185,805 | (3,189,770 | ) | 2,650,640 | |||||||
Net cash provided by operating activities | $ | 17,340,206 | $ | 13,556,419 | $ | 13,514,046 | |||||
Cash Flows From Investing Activities | |||||||||||
Capital expenditures | $ | (8,077,642 | ) | $ | (7,179,473 | ) | $ | (7,337,115 | ) | ||
Proceeds from sale of property, plant and equipment | 268,082 | 131,545 | 183,678 | ||||||||
Other | (60,000 | ) | (60,000 | ) | 141,530 | ||||||
Net cash used in investing activities | $ | (7,869,560 | ) | $ | (7,107,928 | ) | $ | (7,011,907 | ) | ||
The accompanying Notes to Consolidated Financial Statements are an integral part of these statements.
38
Delta Natural Gas Company, Inc.
Consolidated Statements of Cash Flows (continued)
For the Year Ended June 30, | 2014 | 2013 | 2012 | ||||||||
Cash Flows From Financing Activities | |||||||||||
Dividends on common shares | $ | (5,289,911 | ) | $ | (4,951,002 | ) | $ | (4,762,257 | ) | ||
Issuance of common shares | 595,249 | 587,359 | 697,775 | ||||||||
Debt issuance costs | — | — | (107,904 | ) | |||||||
Issuance of long-term debt | — | — | 58,000,000 | ||||||||
Excess tax benefit from share-based compensation | 39,472 | 35,112 | 21,563 | ||||||||
Repayment of long-term debt | (1,500,000 | ) | (1,500,000 | ) | (57,951,006 | ) | |||||
Borrowings on bank line of credit | 691,157 | — | 17,697,829 | ||||||||
Repayment of bank line of credit | (691,157 | ) | — | (17,697,829 | ) | ||||||
Net cash used in financing activities | $ | (6,155,190 | ) | $ | (5,828,531 | ) | $ | (4,101,829 | ) | ||
Net Increase in Cash and Cash Equivalents | $ | 3,315,456 | $ | 619,960 | $ | 2,400,310 | |||||
Cash and Cash Equivalents, Beginning of Year | 10,360,462 | 9,740,502 | 7,340,192 | ||||||||
Cash and Cash Equivalents, End of Year | $ | 13,675,918 | $ | 10,360,462 | $ | 9,740,502 | |||||
Supplemental Disclosures of Cash Flow Information | |||||||||||
Cash paid during the year for | |||||||||||
Interest | $ | 2,436,435 | $ | 2,509,962 | $ | 3,795,590 | |||||
Income taxes (net of refunds) | $ | 5,819,956 | $ | 1,573,321 | $ | 1,011,138 | |||||
Significant non-cash transactions | |||||||||||
Accrued capital expenditures | $ | 328,638 | $ | 301,679 | $ | 336,543 | |||||
Loss on extinguishment of debt recognized as a regulatory asset (Note 10) | $ | — | $ | — | $ | 1,896,000 | |||||
The accompanying Notes to Consolidated Financial Statements are an integral part of these statements.
39
Delta Natural Gas Company, Inc.
Consolidated Balance Sheets
As of June 30, | 2014 | 2013 | |||||
Assets | |||||||
Current Assets | |||||||
Cash and cash equivalents | $ | 13,675,918 | $ | 10,360,462 | |||
Accounts receivable, less accumulated allowances for doubtful | 6,681,964 | 8,700,982 | |||||
accounts of $360,000 and $536,000 in 2014 and 2013, | |||||||
respectively | |||||||
Natural gas in storage, at average cost (Notes 1 and 16) | 7,125,499 | 5,481,313 | |||||
Deferred natural gas costs (Notes 1 and 14) | 724,923 | 3,922,844 | |||||
Materials and supplies, at average cost | 574,699 | 561,270 | |||||
Prepayments | 3,491,257 | 1,987,855 | |||||
Total current assets | $ | 32,274,260 | $ | 31,014,726 | |||
Property, Plant and Equipment | $ | 229,367,319 | $ | 223,545,925 | |||
Less - Accumulated provision for depreciation | (93,551,799 | ) | (88,429,625 | ) | |||
Net property, plant and equipment | $ | 135,815,520 | $ | 135,116,300 | |||
Other Assets | |||||||
Cash surrender value of life insurance | |||||||
(face amount of $948,000 and $945,000 in 2014 and 2013, respectively) | $ | 402,147 | $ | 334,425 | |||
Prepaid pension (Note 6) | 3,291,974 | 2,679,864 | |||||
Regulatory assets (Note 1) | 13,198,199 | 13,770,011 | |||||
Unamortized debt expense (Notes 1 and 10) | 90,304 | 97,104 | |||||
Other non-current assets | 952,757 | 917,585 | |||||
Total other assets | $ | 17,935,381 | $ | 17,798,989 | |||
Total assets | $ | 186,025,161 | $ | 183,930,015 | |||
The accompanying Notes to Consolidated Financial Statements are an integral part of these statements.
40
Delta Natural Gas Company, Inc.
Consolidated Balance Sheets (continued)
As of June 30, | 2014 | 2013 | |||||
Liabilities and Shareholders' Equity | |||||||
Current Liabilities | |||||||
Accounts payable | $ | 6,706,021 | $ | 7,417,789 | |||
Current portion of long-term debt (Note 10) | 1,500,000 | 1,500,000 | |||||
Accrued taxes | 1,553,670 | 1,433,666 | |||||
Customers' deposits | 593,010 | 646,375 | |||||
Accrued interest on debt | 120,712 | 132,560 | |||||
Accrued vacation | 752,905 | 730,867 | |||||
Deferred income taxes | 39,718 | 1,339,287 | |||||
Other liabilities | 591,606 | 435,064 | |||||
Total current liabilities | $ | 11,857,642 | $ | 13,635,608 | |||
Long-Term Debt (Note 10) | $ | 53,500,000 | $ | 55,000,000 | |||
Long-Term Liabilities | |||||||
Deferred income taxes | $ | 40,537,879 | $ | 39,623,563 | |||
Investment tax credits | 24,600 | 40,600 | |||||
Regulatory liabilities (Note 1) | 1,165,260 | 1,252,629 | |||||
Asset retirement obligations (Note 4) | 3,260,721 | 3,547,441 | |||||
Other long-term liabilities | 950,707 | 824,759 | |||||
Total long-term liabilities | $ | 45,939,167 | $ | 45,288,992 | |||
Commitments and Contingencies (Note 13) | |||||||
Total liabilities | $ | 111,296,809 | $ | 113,924,600 | |||
Shareholders' Equity | |||||||
Common shares ($1.00 par value), 20,000,000 shares authorized; 6,942,758 and 6,864,253 shares outstanding at June 30, 2014 and June 30, 2013, respectively | $ | 6,942,758 | $ | 6,864,253 | |||
Premium on common shares | 47,182,338 | 45,523,123 | |||||
Retained earnings | 20,603,256 | 17,618,039 | |||||
Total shareholders' equity | $ | 74,728,352 | $ | 70,005,415 | |||
Total liabilities and shareholders' equity | $ | 186,025,161 | $ | 183,930,015 | |||
The accompanying Notes to Consolidated Financial Statements are an integral part of these statements.
41
Delta Natural Gas Company, Inc.
Consolidated Statements of Changes in Shareholders' Equity
Year Ended June 30, 2014 | |||||||||||||||
Common Shares | Premium on Common Shares | Retained Earnings | Shareholders' Equity | ||||||||||||
Balance, beginning of year | $ | 6,864,253 | $ | 45,523,123 | $ | 17,618,039 | $ | 70,005,415 | |||||||
Net income | — | — | 8,275,128 | 8,275,128 | |||||||||||
Issuance of common shares | 28,809 | 566,440 | — | 595,249 | |||||||||||
Issuance of common shares under the | |||||||||||||||
incentive compensation plan | 49,696 | 299,930 | — | 349,626 | |||||||||||
Share-based compensation expense | — | 762,340 | — | 762,340 | |||||||||||
Tax benefit from share-based compensation | — | 30,505 | — | 30,505 | |||||||||||
Dividends on common shares | — | — | (5,289,911 | ) | (5,289,911 | ) | |||||||||
Balance, end of year | $ | 6,942,758 | $ | 47,182,338 | $ | 20,603,256 | $ | 74,728,352 | |||||||
Year Ended June 30, 2013 | |||||||||||||||
Common Shares | Premium on Common Shares | Retained Earnings | Shareholders' Equity | ||||||||||||
Balance, beginning of year | $ | 6,803,941 | $ | 44,048,201 | $ | 15,368,265 | $ | 66,220,407 | |||||||
Net income | — | — | 7,200,776 | 7,200,776 | |||||||||||
Issuance of common shares | 28,436 | 558,923 | — | 587,359 | |||||||||||
Issuance of common shares under the | |||||||||||||||
incentive compensation plan | 31,876 | 232,226 | — | 264,102 | |||||||||||
Share-based compensation expense | — | 657,607 | — | 657,607 | |||||||||||
Tax benefit from share-based compensation | — | 26,166 | — | 26,166 | |||||||||||
Dividends on common shares | — | — | (4,951,002 | ) | (4,951,002 | ) | |||||||||
Balance, end of year | $ | 6,864,253 | $ | 45,523,123 | $ | 17,618,039 | $ | 70,005,415 | |||||||
Year Ended June 30, 2012 | |||||||||||||||
Common Shares | Premium on Common Shares | Retained Earnings | Shareholders' Equity | ||||||||||||
Balance, beginning of year | $ | 6,732,344 | $ | 42,688,316 | $ | 14,346,524 | $ | 63,767,184 | |||||||
Net income | — | — | 5,783,998 | 5,783,998 | |||||||||||
Issuance of common shares | 38,929 | 658,846 | — | 697,775 | |||||||||||
Issuance of common shares under the | |||||||||||||||
incentive compensation plan | 32,668 | 304,373 | — | 337,041 | |||||||||||
Share-based compensation expense | — | 375,103 | — | 375,103 | |||||||||||
Tax benefit from share-based compensation | — | 21,563 | — | 21,563 | |||||||||||
Dividends on common shares | — | — | (4,762,257 | ) | (4,762,257 | ) | |||||||||
Balance, end of year | $ | 6,803,941 | $ | 44,048,201 | $ | 15,368,265 | $ | 66,220,407 | |||||||
The accompanying Notes to Consolidated Financial Statements are an integral part of these statements.
42
DELTA NATURAL GAS COMPANY, INC.
NOTES TO CONSOLIDATED FINANCIAL STATEMENTS
(1) Summary of Significant Accounting Policies
Principles of Consolidation
Delta Natural Gas Company, Inc. (“Delta” or “the Company”) distributes or transports natural gas to approximately 36,000 customers. Our distribution and transportation systems are located in central and southeastern Kentucky and we own and operate an underground storage field in southeastern Kentucky. We transport natural gas to our industrial customers who purchase their gas in the open market. We also transport natural gas on behalf of local producers and customers not on our distribution system and sell liquids extracted from natural gas in our storage field and our pipeline systems. We have three wholly-owned subsidiaries. Delta Resources, Inc. buys natural gas and resells it to industrial or other large use customers on Delta's system. Delgasco, Inc. buys natural gas and resells it to Delta Resources, Inc. and to customers not on Delta's system. Enpro, Inc. owns and operates natural gas production properties and undeveloped acreage. All subsidiaries of Delta are included in the consolidated financial statements. Intercompany balances and transactions have been eliminated.
Use of Estimates
The preparation of financial statements in conformity with accounting principles generally accepted in the United States requires management to make estimates and assumptions that affect the reported amounts of assets and liabilities and disclosure of contingent assets and liabilities at the date of the financial statements and the reported amounts of revenues and expenses during the reporting period. Actual results could differ from those estimates.
Cash Equivalents
For the purposes of the Consolidated Statements of Cash Flows, all temporary cash investments with a maturity of three months or less at the date of purchase are considered cash equivalents.
Property, Plant and Equipment and Depreciation
Property, plant and equipment is stated at original cost, which includes materials, labor, labor related costs and an allocation of general and administrative costs. A betterment or replacement of a unit of property is accounted for as an addition of utility plant. Construction work in progress has been included in the rate base for determining customer rates, and therefore an allowance for funds used during construction has not been recorded. The cost of regulated plant retired or disposed of in the normal course of business is deducted from plant accounts and such cost, less salvage value, is charged to the accumulated provision for depreciation.
Property, plant and equipment is comprised of the following major classes of assets:
($000) | 2014 | 2013 | |||
Regulated segment | |||||
Distribution, transmission and storage | 203,969 | 197,251 | |||
General, miscellaneous and intangibles | 22,421 | 22,009 | |||
Construction work in progress | 381 | 1,711 | |||
Total regulated segment | 226,771 | 220,971 | |||
Non-regulated segment | 2,596 | 2,575 | |||
Total property, plant and equipment | 229,367 | 223,546 | |||
All expenditures for maintenance and repairs of units of property are charged to the appropriate maintenance expense accounts in the month incurred.
43
We determine the provision for depreciation using the straight-line method and by the application of rates to various classes of utility plant. The rates are based upon the estimated service lives of the properties and were equivalent to composite rates of 2.8%, 2.9% and 2.9% of average depreciable plant for 2014, 2013 and 2012, respectively.
As approved by the Kentucky Public Service Commission, we accrue asset removal costs for certain types of property through depreciation expense with a corresponding increase to regulatory liabilities on the Consolidated Balance Sheet. When depreciable utility plant and equipment is retired any related removal costs incurred are charged against the regulatory liability.
We have a pipe replacement program approved by the Kentucky Public Service Commission, which allows us to adjust rates annually to earn a return on capital expenditures for the replacement of pipe and related facilities incurred subsequent to the test year in our most recent rate case. The pipe replacement program is designed to additionally recover the costs associated with the mandatory retirement or relocation of facilities.
Impairment of Long-Lived Assets
We evaluate long-lived assets for impairment when events or changes in circumstances indicate that the carrying value of such assets may not be recoverable. The determination of whether an impairment has occurred is based on an estimate of undiscounted future cash flows attributable to the assets, as compared with the carrying value of the assets. If an impairment has occurred, the amount of the impairment recognized is determined by estimating the fair value of the assets and recording a provision for an impairment loss if the carrying value is greater than the fair value. In the opinion of management, our long-lived assets are appropriately valued in the accompanying consolidated financial statements. There were no impairments of long-lived assets during 2014, 2013 or 2012.
Natural Gas In Storage
We operate a natural gas underground storage field that we utilize to inject and store natural gas during the non-heating season, and we then withdraw natural gas during the heating season to meet our customers' needs. The potential exists for differences between actual volumes stored versus our perpetual records primarily due to differences in measurement of injections and withdrawals or the risks of gas escaping from the field. We periodically analyze the volumes, pressure and other data relating to the storage field in order to substantiate the natural gas inventory carried in our perpetual inventory records. The periodic analysis of the storage field data utilizes trends in the underlying data and can require multiple periods of observation to determine if differences exist. The analysis can result in adjustments to our perpetual inventory records. The natural gas in storage inventory is recorded at average cost.
Revenue and Accounts Receivable
Revenues and accounts receivable arise primarily from sales of natural gas to customers and from transportation services for others. We bill our customers on a monthly meter reading cycle. At the end of each month, natural gas service which has been rendered from the date the customer's meter was last read to the month-end is unbilled.
Unbilled revenues and gas costs include the following:
(000) | 2014 | 2013 | |||
Unbilled revenues ($) | 1,788 | 1,435 | |||
Unbilled gas costs ($) | 622 | 390 | |||
Unbilled volumes (Mcf) | 63 | 47 | |||
Unbilled revenues are included in accounts receivable and unbilled gas costs are included in deferred gas costs on the accompanying Consolidated Balance Sheets.
Provisions for doubtful accounts are recorded to reflect the expected net realizable value of accounts receivable. Accounts receivable are charged off when deemed to be uncollectible or when turned over to a collection agency to pursue.
Excise Taxes
Certain excise taxes levied by state or local governments are collected by Delta from our customers. These taxes are accounted for on a net basis and therefore are not included as revenues in the accompanying Consolidated Statements of Income.
44
Regulated Purchased Natural Gas Expense
Our regulated natural gas rates include a gas cost recovery clause approved by the Kentucky Public Service Commission which provides for a dollar-tracker that matches revenues and natural gas costs and provides eventual dollar-for-dollar recovery of all natural gas costs incurred by the regulated segment and recovery of the uncollectible natural gas cost portion of bad debt expense. We expense natural gas costs based on the amount of natural gas costs recovered through revenue. Any differences between actual natural gas costs and those natural gas costs billed are deferred and reflected in the computation of future billings to customers using the natural gas cost recovery mechanism.
Rate Regulated Basis of Accounting
We account for our regulated segment in accordance with applicable regulatory guidance. The economic effects of regulation can result in a regulated company recovering costs from customers in a period different from the period in which the costs would be charged to expense by an unregulated enterprise. When this results, costs are deferred as assets on the Consolidated Balance Sheets (“regulatory assets”) and recorded as expenses when such amounts are reflected in rates. Additionally, regulators can impose liabilities upon a regulated company for amounts previously collected from customers and for current collection in rates of costs that are expected to be incurred in the future (“regulatory liabilities”). The amounts recorded as regulatory assets and regulatory liabilities are as follows:
($000) | 2014 | 2013 | |||
Regulatory assets | |||||
Current assets | |||||
Deferred natural gas costs | 725 | 3,923 | |||
Other assets | |||||
Conservation/efficiency program expenses | 164 | 198 | |||
Loss on extinguishment of debt | 3,149 | 3,389 | |||
Asset retirement obligations | 4,377 | 3,788 | |||
Accrued pension | 5,508 | 6,369 | |||
Regulatory case expenses | — | 26 | |||
Total other assets | 13,198 | 13,770 | |||
Total regulatory assets | 13,923 | 17,693 | |||
Regulatory liabilities | |||||
Long-term liabilities | |||||
Accrued cost of removal on long-lived assets | 355 | 328 | |||
Regulatory liability for deferred income taxes | 810 | 925 | |||
Total regulatory liabilities | 1,165 | 1,253 | |||
All of our regulatory assets and liabilities have been approved for recovery by the Kentucky Public Service Commission and are currently being recovered or refunded through our regulated natural gas rates. In addition, the unrecovered balance of the loss on extinguishment of debt is included in rate base and, therefore, earns a return. The weighted average recovery period of the other regulatory assets which are not earning a return is 32 years.
Derivatives
Certain of our natural gas purchase and sale contracts qualify as derivatives. All such contracts have been designated as normal purchases and sales and as such are accounted for under the accrual basis and are not recorded at fair value in the accompanying consolidated financial statements.
Marketable Securities
We have a supplemental retirement benefit agreement with Glenn R. Jennings, our Chairman of the Board, President and Chief Executive Officer, that is a non-qualified deferred compensation plan. The agreement establishes an irrevocable rabbi trust,
45
in which the assets of the trust are earmarked to pay benefits under the agreement. We have recognized a liability related to the obligation to pay these benefits to Mr. Jennings. We make discretionary contributions to the trust in order to fully fund the related deferred compensation liability.
The assets of the trust consist of exchange traded securities and exchange traded mutual funds and are classified as trading securities. The assets are recorded at fair value on the Consolidated Balance Sheets based on observable market prices from active markets. Net realized and unrealized gains and losses are included in earnings each period to effectively offset the corresponding earnings impact associated with the change in the fair value of the deferred compensation liability to which the assets relate.
Fair Value
Fair value is defined as the exchange price in an orderly transaction between market participants to sell an asset or transfer a liability at the measurement date. Fair value focuses on an exit price, which is the price that would be received by us to sell an asset or paid to transfer a liability versus an entry price, which would be the price paid to acquire an asset or received to assume a liability.
We determine fair value based on the following fair value hierarchy which prioritizes the inputs to valuation techniques used to measure fair value into three levels:
• | Level 1 - Observable inputs consisting of quoted prices in active markets for identical assets or liabilities; |
• | Level 2 - Inputs, other than quoted prices in active markets, that are observable either directly or indirectly; and |
• | Level 3 - Unobservable inputs which require the reporting entity to develop its own assumptions. |
Although accounting standards permit entities to elect to measure many financial instruments and certain other items at fair value, we do not currently have any financial assets or financial liabilities for which this provision has been elected. However, in the future, we may elect to measure certain financial instruments at fair value in accordance with these standards.
(2) New Accounting Pronouncements
In December, 2011, the Financial Accounting Standards Board issued guidance requiring additional disclosure of the effect or potential effect of financial instruments and derivative instruments which have rights of setoff where an entity offsets the assets and liabilities of such instruments. The guidance, effective for our quarter ending December 31, 2013, did not require any additional disclosures with respect to our results of operations, financial position or cash flows, as we have no such financial instruments or derivative instruments.
In September, 2013, the Internal Revenue Service ("IRS") issued final regulations regarding the tax treatment of amounts paid to acquire, produce or improve tangible property, which update temporary regulations issued by the IRS in December, 2011. In 2014, the IRS plans to issue further guidance for specific industry sectors, including natural gas. The final regulations are effective for our tax year beginning July 1, 2014; however, we do not expect compliance with the final regulations and industry specific guidance to have a material impact on our results of operations, financial position or cash flows.
In May, 2014, the Financial Accounting Standards Board issued guidance revising the principles and standards for revenue recognition. The standard creates a framework for recognizing revenue to improve comparability of revenue recognition practices across entities and industries. The guidance is effective for our quarterly report ending September 30, 2017 and we are evaluating the methods of adoption allowed by the new standard and the effect the standard is expected to have on our results of operations, financial position and cash flow.
In June, 2014, the Financial Accounting Standards Board issued guidance on share-based payments where performance targets can be achieved subsequent to the requisite service period. The guidance, effective for our quarter ending September 30, 2015, is not expected to have a material impact on our results of operations, financial position or cash flows.
(3) Fair Value Measurements
Our financial assets and liabilities measured at fair value on a recurring basis consist of the assets of our supplemental retirement benefit trust, which are included in other non-current assets on the Consolidated Balance Sheets. Contributions to the trust are presented in other investing activities on the Consolidated Statements of Cash Flows. The assets of the trust are recorded
46
at fair value and consist of exchange traded securities and exchange traded mutual funds. The securities and mutual funds are recorded at fair value using observable market prices from active markets, which are categorized as Level 1 in the fair value hierarchy. In fiscal 2014, upon changing investment advisors for the supplemental retirement benefit trust, we adopted a new asset allocation model which resulted in the reallocation of assets in the trust. The fair value of the trust assets are as follows:
($000) | 2014 | 2013 | |||
Trust assets | |||||
Money market | 44 | 9 | |||
U.S. equity securities | 379 | 486 | |||
Foreign equity funds | 167 | — | |||
U.S. fixed income funds | 121 | 244 | |||
Foreign fixed income funds | 53 | — | |||
Absolute return strategy mutual funds | 143 | — | |||
907 | 739 | ||||
The carrying amounts of our other financial instruments including cash equivalents, accounts receivable, notes receivable and accounts payable approximate their fair value. The fair value of the assets in our defined benefit retirement plan are disclosed in Note 6 of the Notes to Consolidated Financial Statements.
Our Series A Notes, presented as current portion of long-term debt and long-term debt on the Consolidated Balance Sheets, are stated at historical cost. Fair value of our long-term debt is based on the expected future cash flows of the debt discounted using a credit adjusted risk-free rate. The credit adjusted risk-free rate for our 4.26% Series A Notes is the estimated cost to borrow a debt instrument with the same terms from a private lender at the measurement date. The fair value of our long-term debt is categorized as Level 3 in the fair value hierarchy.
2014 | 2013 | ||||||||||
Carrying | Fair | Carrying | Fair | ||||||||
($000) | Amount | Value | Amount | Value | |||||||
4.26% Series A Notes | 55,000 | 55,576 | 56,500 | 55,150 | |||||||
(4) Asset Retirement Obligations
Legal obligations
As of June 30, 2014 and 2013, we have accrued liabilities and related assets, net of accumulated depreciation, relative to the legal obligation to retire certain natural gas wells, storage tanks, mains and services. For asset retirement obligations related to regulated assets, accretion of the liability and depreciation of the asset retirement costs are recorded as regulatory assets, pursuant to regulatory accounting standards, as we recover the cost of removing our regulated assets through our depreciation rates.
The following is a summary of our asset retirement obligations as shown as asset retirement obligations on the accompanying Consolidated Balance Sheets:
($000) | 2014 | 2013 | |||
Balance, beginning of year | 3,547 | 3,824 | |||
Liabilities incurred | 138 | 20 | |||
Liabilities settled | (567 | ) | (616 | ) | |
Accretion | 258 | 267 | |||
Revisions in estimated cash flows | (115 | ) | 52 | ||
Balance, end of year | 3,261 | 3,547 | |||
47
We have an additional asset retirement obligation related to the retirement of wells located at our underground natural gas storage facility. Since we expect to utilize the storage facility as long as we provide natural gas to our customers, we have determined the underlying asset has an indeterminate life. Therefore, we have not recorded a liability associated with the cost to retire the wells.
Non-legal obligations
In accordance with established regulatory practices, we accrue costs of removal on long-lived assets through depreciation expense to the extent recovery of such costs is granted by our regulator even though such costs do not represent legal obligations. In accordance with regulatory accounting standards, $355,000 and $328,000 of such accrued cost of removal was recorded as a regulatory liability on the accompanying Consolidated Balance Sheets as of June 30, 2014 and 2013, respectively.
(5) Income Taxes
We provide for income taxes on temporary differences resulting from the use of alternative methods of income and expense recognition for financial and tax reporting purposes. The differences result primarily from the use of accelerated tax depreciation methods for certain properties versus the straight-line depreciation method for financial reporting purposes, differences in capitalization thresholds for tax reporting purposes versus financial reporting purposes, differences in recognition of purchased natural gas costs and certain accruals which are not currently deductible for income tax purposes. Investment tax credits were deferred for certain periods prior to fiscal 1987 and are being amortized to income over the estimated useful lives of the applicable properties. We utilize the asset and liability method for accounting for income taxes, which requires that deferred income tax assets and liabilities be computed using tax rates that will be in effect when the book and tax temporary differences reverse. Changes in tax rates applied to accumulated deferred income taxes are not immediately recognized in operating results because of ratemaking treatment. A regulatory liability has been established to recognize the regulatory obligation to refund these excess deferred taxes through customer rates. The current portion of the net accumulated deferred income tax liability is shown as current liabilities and the long-term portion is included in long-term liabilities on the accompanying Consolidated Balance Sheets. The temporary differences which gave rise to the net accumulated deferred income tax liability for the periods are as follows:
48
($000) | 2014 | 2013 | |||
Deferred Tax Liabilities | |||||
Current | |||||
Deferred natural gas cost | (275 | ) | (1,459 | ) | |
Prepaid expenses | (359 | ) | (304 | ) | |
(634 | ) | (1,763 | ) | ||
Non-Current | |||||
Accelerated depreciation | (36,903 | ) | (36,004 | ) | |
Pension | (1,240 | ) | (908 | ) | |
Regulatory assets - asset retirement obligations | (820 | ) | (736 | ) | |
Regulatory assets - loss on extinguishment of debt | (1,196 | ) | (1,287 | ) | |
Regulatory assets - unrecognized accrued pension | (2,091 | ) | (2,418 | ) | |
Regulatory liabilities | (1,268 | ) | (1,268 | ) | |
Other | (954 | ) | (1,040 | ) | |
(44,472 | ) | (43,661 | ) | ||
Total deferred tax liabilities | (45,106 | ) | (45,424 | ) | |
Deferred Tax Assets | |||||
Current | |||||
Accrued employee benefits | 405 | 313 | |||
Bad debt reserve | 99 | 58 | |||
Other | 90 | 53 | |||
594 | 424 | ||||
Non-Current | |||||
Accrued employee benefits | 992 | 855 | |||
Asset retirement obligations | 1,176 | 1,284 | |||
Investment tax credits | 15 | 25 | |||
Regulatory liabilities | 1,570 | 1,610 | |||
Section 263(a) capitalized costs | 105 | 182 | |||
Other | 76 | 81 | |||
3,934 | 4,037 | ||||
Total deferred tax assets | 4,528 | 4,461 | |||
Net accumulated deferred income tax liability | (40,578 | ) | (40,963 | ) | |
49
The components of the income tax provision are comprised of the following for the years ended June 30:
($000) | 2014 | 2013 | 2012 | |||||
Current | ||||||||
Federal | 4,532 | 1,940 | 525 | |||||
State | 842 | 390 | 220 | |||||
Total | 5,374 | 2,330 | 745 | |||||
Deferred | (515 | ) | 1,939 | 2,513 | ||||
Income tax expense | 4,859 | 4,269 | 3,258 | |||||
Reconciliation of the statutory federal income tax rate to the effective income tax rate is shown in the table below:
(%) | 2014 | 2013 | 2012 | |||||
Statutory federal income tax rate | 34.0 | 34.0 | 34.0 | |||||
State income taxes, net of federal benefit | 4.0 | 4.0 | 4.0 | |||||
Amortization of investment tax credits | (0.1 | ) | (0.2 | ) | (0.3 | ) | ||
Other differences, net | (0.9 | ) | (0.6 | ) | (1.7 | ) | ||
Effective income tax rate | 37.0 | 37.2 | 36.0 | |||||
We recognize the income tax benefit from an uncertain tax position only if it is more likely than not that the tax position will be sustained on examination by the taxing authorities, based on the technical merits of the position. The tax benefits recognized in the financial statements from such a position are measured based on the largest benefit that has a greater than fifty percent likelihood of being realized upon ultimate settlement. The liability for unrecognized tax benefits expected to be recognized within the next twelve months has partially offset our prepaid income taxes and been presented in prepayments on the Consolidated Balance Sheets. The liability for unrecognized tax benefits not expected to be recognized within the next twelve months has been presented in other long-term liabilities on the Consolidated Balance Sheets. Interest and penalties on tax uncertainties are classified in income tax expense in the Consolidated Statements of Income.
As of June 30, 2014, we did not have any unrecognized tax positions, which, if recognized, would impact the effective tax rate. As of June 30, 2013, the amount of unrecognized tax benefits, net of tax, which, if recognized, would impact the effective tax rate was $31,000. As of June 30, 2014, we have accrued interest of $5,000 on unrecognized tax positions. We recognized interest income of $4,000 and $1,000 on unrecognized tax positions on the Consolidated Statements of Income for 2014 and 2013, respectively.
The following is a reconciliation of our unrecognized tax benefits:
($000) | 2014 | 2013 | |||
Balance, beginning of year | 101 | 200 | |||
Gross decreases - tax positions in prior period | (37 | ) | (99 | ) | |
Balance, end of year | 64 | 101 | |||
We file income tax returns in federal and Kentucky jurisdictions. Tax years previous to June 30, 2012 and June 30, 2011 are no longer subject to examination for federal and Kentucky income taxes, respectively.
50
(6) Employee Benefit Plans
Defined Benefit Retirement Plan
We have a trusteed, noncontributory, defined benefit retirement plan covering all eligible employees hired prior to May 9, 2008. Retirement income is based on the number of years of service and annual rates of compensation. The Company has historically made annual contributions to fund the plan adequately.
Generally accepted accounting principles (“GAAP”) require employers who sponsor defined benefit plans to recognize the funded status of a defined benefit pension plan on the balance sheet and to recognize through comprehensive income the changes in the funded status in the year in which the changes occur. However, regulatory accounting standards provide that regulated entities can defer recoverable costs that would otherwise be charged to expense or equity by non-regulated entities. Current cost-of-service ratemaking in Kentucky allows recovery of net periodic benefit cost as determined under GAAP. The Kentucky Public Service Commission has been clear and consistent with its historical treatment of such rate recovery; therefore, we have recorded a regulatory asset representing the probable recovery of the portion of the change in funded status of the defined benefit plan that is expected to be recognized in future net periodic benefit cost. The regulatory asset is adjusted annually as prior service cost and actuarial losses are recognized in net periodic benefit cost.
Our obligations and the funded status of our plan, measured at June 30, 2014 and June 30, 2013, respectively, are as follows:
($000) | 2014 | 2013 | |||
Change in Benefit Obligation | |||||
Benefit obligation at beginning of year | 23,521 | 23,278 | |||
Service cost | 1,023 | 1,116 | |||
Interest cost | 1,038 | 913 | |||
Actuarial (gain)/loss | 1,810 | (1,271 | ) | ||
Benefits paid | (1,009 | ) | (515 | ) | |
Benefit obligation at end of year | 26,383 | 23,521 | |||
Change in Plan Assets | |||||
Fair value of plan assets at beginning of year | 26,201 | 20,971 | |||
Actual return on plan assets | 3,983 | 2,945 | |||
Employer contributions | 500 | 2,800 | |||
Benefits paid | (1,009 | ) | (515 | ) | |
Fair value of plan assets at end of year | 29,675 | 26,201 | |||
Recognized Amounts | |||||
Projected benefit obligation | (26,383 | ) | (23,521 | ) | |
Plan assets at fair value | 29,675 | 26,201 | |||
Funded status | 3,292 | 2,680 | |||
Net amount recognized as prepaid pension on the Consolidated Balance Sheets | 3,292 | 2,680 | |||
Items Not Yet Recognized as a Component of Net Periodic Benefit Cost | |||||
Prior service cost | (316 | ) | (403 | ) | |
Net loss | 5,824 | 6,772 | |||
Amounts recognized as regulatory assets | 5,508 | 6,369 | |||
The accumulated benefit obligation was $22,810,000 and $20,508,000 for 2014 and 2013, respectively.
51
($000) | 2014 | 2013 | 2012 | |||||
Components of Net Periodic Benefit Cost | ||||||||
Service cost | 1,023 | 1,116 | 921 | |||||
Interest cost | 1,038 | 913 | 921 | |||||
Expected return on plan assets | (1,567 | ) | (1,578 | ) | (1,474 | ) | ||
Amortization of unrecognized net loss | 342 | 615 | 200 | |||||
Amortization of prior service cost | (86 | ) | (86 | ) | (87 | ) | ||
Net periodic benefit cost | 750 | 980 | 481 | |||||
Weighted-Average % Assumptions Used to Determine Benefit Obligations | ||||||||
Discount rate | 4.25 | 4.5 | 4.0 | |||||
Rate of compensation increase | 4.0 | 4.0 | 4.0 | |||||
Weighted-Average % Assumptions Used to Determine Net Periodic Benefit Cost | ||||||||
Discount rate | 4.5 | 4.0 | 5.25 | |||||
Expected long-term return on plan assets | 6.0 | 7.0 | 7.0 | |||||
Rate of compensation increase | 4.0 | 4.0 | 4.0 | |||||
Plan Assets
Our target investment allocations have been developed using an asset allocation model which weighs risk versus return of various investment indices to create a target asset allocation to maximize return subject to a moderate amount of portfolio risk. Risk tolerance is established through careful consideration of plan liabilities, plan funded status and corporate financial condition. The investment portfolios contain a diversified blend of equity and fixed income investments. Our target investment allocations are approximately 70% equity investments and 30% fixed income investments. Our equity investment target allocations are heavily weighted toward domestic equity securities, with allocations to domestic real estate securities and foreign equity securities for the purposes of diversification. Fixed income securities primarily include U.S. government obligations and corporate debt securities. For additional diversification, we invest in absolute return strategy mutual funds, which include both equity and fixed income securities, with the objective of providing a return greater than inflation. We regularly review our asset allocation and periodically rebalance our investments to our targeted allocations as appropriate.
The assets of the plan are comprised of investments in individual securities and mutual funds. In June, 2013, upon changing investment advisors for our defined benefit plan, we adopted a new asset allocation model and in 2014 transitioned to our target allocations for plan assets and reallocated our investments from mutual funds to individual securities. Previously, each individual mutual fund had been selected based on its investment strategy, which approximates a specific asset class within our target allocations.
Target | Actual Allocations | ||||
(%) | Allocations | 2014 | 2013 | ||
Asset Class | |||||
Cash and cash equivalents | 3 | 3 | 3 | ||
Equity Securities | |||||
U.S. equity securities | 36 | 43 | 53 | ||
Foreign equity securities | 20 | 19 | 11 | ||
Domestic real estate | 5 | 5 | 6 | ||
61 | 67 | 70 | |||
Fixed Income Securities | |||||
U. S. fixed income security | 15 | 12 | 27 | ||
Foreign fixed income security | 8 | 6 | — | ||
23 | 18 | 27 | |||
Other Securities | |||||
Absolute return strategy mutual funds | 13 | 12 | — | ||
100 | 100 | 100 | |||
52
Individual exchange traded equity securities, exchange traded mutual funds and treasury securities are categorized as Level 1 in the fair value hierarchy as the fair value of the investments is determined based on the quoted market price of each investment. Mutual funds are categorized based on their primary investment strategy. The respective level within the fair value hierarchy is determined as described in Note 1 of the Notes to Consolidated Financial Statements. Corporate bonds, municipal bonds and U.S. agency securities are valued based on a calculation using interest rate curves and credit spreads applied to the terms of the debt (maturity and coupon rate) supported by observable transactions and are categorized as Level 2 in the fair value hierarchy. The following represents the fair value of plan assets:
($000) | 2014 | Level 1 | Level 2 | Level 3 | ||||||||
Asset Class | ||||||||||||
Cash | 1,026 | 1,026 | — | — | ||||||||
Equity Securities | ||||||||||||
U.S. equity securities | 13,828 | 13,828 | — | — | ||||||||
Foreign equity securities | 5,706 | 5,706 | — | — | ||||||||
19,534 | 19,534 | — | — | |||||||||
Fixed Income Securities | ||||||||||||
U.S. treasury securities | 593 | 593 | — | — | ||||||||
High yield funds | 1,773 | 1,773 | — | — | ||||||||
Foreign bond funds | 1,771 | 1,771 | — | — | ||||||||
U.S. corporate bonds | 714 | — | 714 | — | ||||||||
Other | 577 | — | 337 | 577 | — | |||||||
5,428 | 4,137 | 1,291 | — | |||||||||
Other Securities | ||||||||||||
Absolute return strategy mutual funds | 3,687 | 3,687 | — | — | ||||||||
Total | 29,675 | 28,384 | 1,291 | — | ||||||||
($000) | 2013 | Level 1 | Level 2 | Level 3 | ||||||||
Asset Class | ||||||||||||
Cash | 778 | 778 | — | — | ||||||||
Exchange Traded Mutual Funds | ||||||||||||
U.S. equity securities | 14,191 | 14,191 | — | — | ||||||||
Fixed income securities | 6,969 | 6,969 | — | — | ||||||||
Foreign equity securities | 2,756 | 2,756 | — | — | ||||||||
Domestic real estate securities | 1,507 | 1,507 | — | — | ||||||||
25,423 | 25,423 | — | — | |||||||||
Total | 26,201 | 26,201 | — | — | ||||||||
We determined the expected long-term rate of return for plan assets with input from plan actuaries and investment consultants based upon many factors including asset allocations, historical asset returns and expected future market conditions. The discount rates used by the Company for valuing pension liabilities are based on a review of high quality corporate bond yields with maturities approximating the remaining life of the projected benefit obligations.
We made a $500,000 discretionary contribution to the defined benefit plan in fiscal 2014. We expect to contribute $500,000 to the defined benefit plan in fiscal 2015.
53
The following benefit payments, which reflect expected future service, as appropriate, are expected to be paid:
($000) | ||
2015 | 3,099 | |
2016 | 729 | |
2017 | 735 | |
2018 | 1,616 | |
2019 | 1,503 | |
2020 - 2024 | 7,384 | |
Effective May 9, 2008, any employees hired on and after that date were not eligible to participate in our defined benefit plan. Freezing the defined benefit plan for new entrants did not impact the level of benefits for existing participants.
We do not provide postretirement or postemployment benefits other than the defined benefit retirement plan for retired employees and the supplemental retirement plan described below.
Employee Savings Plan
We have an Employee Savings Plan (“Savings Plan”) under which eligible employees may elect to contribute a portion of their annual compensation up to the maximum amount permitted by law. The Company matches 100% of the employee's contribution up to a maximum company contribution of 4% of the employee's annual compensation. Employees hired after May 9, 2008, who are not eligible to participate in the defined benefit retirement plan, annually receive an additional 4% non-elective contribution into their Savings Plan account. Company contributions are discretionary and subject to change with approval from our Board of Directors. For 2014, 2013 and 2012, our Savings Plan expense was $350,000, $313,000 and $325,000, respectively.
Supplemental Retirement Agreement
We sponsor a nonqualified defined contribution supplemental retirement agreement for Glenn R. Jennings, Delta's Chairman of the Board, President and Chief Executive Officer. Delta makes discretionary contributions into an irrevocable trust until Mr. Jennings' retirement. At retirement, the trustee will make annual payments of $100,000 to Mr. Jennings until the trust is depleted. For 2014, 2013 and 2012 Delta contributed $60,000 each year to the trust. As of June 30, 2014 and 2013, the irrevocable trust assets are $907,000 and $739,000, respectively. These amounts are included in other non-current assets on the accompanying Consolidated Balance Sheets. Liabilities, in corresponding amounts, are included in other long-term liabilities on the accompanying Consolidated Balance Sheets.
(7) Dividend Reinvestment and Stock Purchase Plan
Our Dividend Reinvestment and Stock Purchase Plan (“Reinvestment Plan”) provides that shareholders of record can reinvest dividends and also make limited additional investments of up to $50,000 per year in shares of common stock of the Company. Under the Reinvestment Plan we issued 28,809, 28,436 and 38,929 shares in 2014, 2013 and 2012, respectively. We registered 400,000 shares for issuance under the Reinvestment Plan in 2006, and as of June 30, 2014 there were approximately 93,000 shares available for issuance.
(8) Risk Management and Derivative Instruments
To varying degrees, our regulated and non-regulated segments are exposed to commodity price risk. We purchase our natural gas supply primarily through forward purchase contracts. We mitigate price risk by efforts to balance supply and demand. For our regulated segment we have minimal price risk resulting from these forward natural gas purchases because we are permitted to pass these gas costs on to our regulated customers through the natural gas cost recovery rate mechanism, approved quarterly by the Kentucky Public Service Commission. None of our natural gas contracts are accounted for using the fair value method of accounting. While some of our natural gas purchase contracts and natural gas sales contracts meet the definition of a derivative, we have designated these contracts as normal purchases and normal sales.
54
(9) Notes Payable
The current bank line of credit with Branch Banking and Trust Company permits borrowings up to $40,000,000, all of which was available as of June 30, 2014 and June 30, 2013. The maximum amount borrowed during 2014 was $691,000. We did not borrow from the bank line of credit during 2013. The bank line of credit extends through June 30, 2015. The interest rate on the used line of credit is the London Interbank Offered Rate plus 1.15%. The annual cost of the unused bank line of credit is 0.125%. Our most restrictive covenants are discussed in Note 10 of the Notes to Consolidated Financial Statements.
(10) Long-Term Debt
In December, 2011, we refinanced and redeemed our 5.75% Insured Quarterly Notes ($38,450,000) and 7% Debentures ($19,410,000) from the proceeds of a private debt financing. Under the Note Purchase and Private Shelf Agreement we issued $58,000,000 of Series A Notes, for which the purchasers paid 100% of the face principal amount. Unamortized debt expense of $1,896,000 related to the 5.75% Insured Quarterly Notes and 7% Debentures was reclassified from unamortized debt expense to regulatory assets on the accompanying Consolidated Balance Sheet. The $1,896,000 regulatory asset representing the loss on extinguishment of the 5.75% Insured Quarterly Notes and 7% Debentures, combined with $1,872,000 of unamortized loss on extinguishment of debt recognized from prior refinancings, will be amortized over the life of the 4.26% Series A Notes consistent with treatment approved by the Kentucky Public Service Commission.
Our Series A Notes are unsecured, bear interest at a rate of 4.26% per annum, which is payable quarterly, and mature on December 20, 2031. We are required to make an annual $1,500,000 principal payment on the Series A Notes each December. The following table summarizes the contractual maturities of our Series A Notes by fiscal year:
($000) | ||
2015 | 1,500 | |
2016 | 1,500 | |
2017 | 1,500 | |
2018 | 1,500 | |
Thereafter | 49,000 | |
Total long-term debt | 55,000 | |
Any additional prepayment of principal by the Company may be subject to a prepayment premium which varies depending on the yields of United States Treasury securities with a maturity equal to the remaining average life of the Series A Notes.
We amortize debt issuance expenses over the life of the related debt using the effective interest method. At June 30, 2014 and 2013, the unamortized balance was $3,240,000 and $3,486,000, respectively. Loss on extinguishment of debt of $3,149,000 and $3,389,000 included in the above has been deferred as a regulatory asset and is being amortized over the term of the related debt consistent with regulatory accounting as further discussed in Note 1 of the Notes to Consolidated Financial Statements.
With our bank line of credit and Series A Notes, we have agreed to certain financial and other covenants. Noncompliance with these covenants can make the obligations immediately due and payable. Our financial covenants include covenants related to our tangible net worth, total debt to capitalization ratio and fixed charge ratio. Additionally, the Company may not pay aggregate dividends on its capital stock (plus amounts paid in redemption of its capital stock) in excess of the sum of $15,000,000 plus the Company's cumulative earnings after September 30, 2011 adjusted for certain unusual or non-recurring items. We believe we were in compliance with the financial covenants under our bank line of credit and 4.26% Series A Notes for all periods presented in the Consolidated Financial Statements.
Furthermore, the agreement governing our 4.26% Series A Notes contains a cross-default provision which provides that we will be in default under the 4.26% Series A Notes if we are in default on any other outstanding indebtedness that exceeds $2,500,000. Similarly, the loan agreement governing the bank line of credit contains a cross-default provision which provides that we will be in default under the bank line of credit if we are in default under our 4.26% Series A Notes and fail to cure the default within ten days of notice from the bank.
55
(11) Earnings per Share
The following table sets forth the computation of basic and diluted earnings per share:
2014 | 2013 | 2012 | ||||||
Numerator - Basic and Diluted ($000) | ||||||||
Net income | 8,275 | 7,201 | 5,784 | |||||
Dividends paid | (5,290 | ) | (4,951 | ) | (4,762 | ) | ||
Undistributed earnings | 2,985 | 2,250 | 1,022 | |||||
Allocated to common shares: | ||||||||
Percentage allocated to common shares (a) | 99.4 | % | 99.4 | % | 99.6 | % | ||
Undistributed earnings | 2,966 | 2,238 | 1,018 | |||||
Dividends paid | 5,263 | 4,930 | 4,747 | |||||
Net income available to common shares | 8,229 | 7,168 | 5,765 | |||||
Denominator - Basic and Diluted | ||||||||
Weighted average common shares (b) | 6,918,725 | 6,843,455 | 6,777,186 | |||||
Net Income per Common Share - Basic and Diluted ($) | 1.19 | 1.05 | 0.85 | |||||
(a) Percentage allocated to weighted average common shares outstanding:
Common shares outstanding | 6,918,725 | 6,843,455 | 6,777,186 | |||||
Unvested participating shares outstanding (c) | 44,750 | 38,417 | 28,082 | |||||
Total | 6,963,475 | 6,881,872 | 6,805,268 | |||||
Percentage allocated to common shares | 99.4 | % | 99.4 | % | 99.6 | % | ||
(b) Under our Incentive Compensation Plan, recipients of performance share awards receive unvested non-participating shares, as further discussed in Note 17 of the Notes to Consolidated Financial Statements. Unvested non-participating shares become dilutive in the interim quarter-end in which the performance objective is met. If the performance objective continues to be met through the end of the performance period, these shares become unvested participating shares as of the fiscal year-end, as further discussed in (c). The weighted average number of unvested non-participating shares outstanding during a period is included in the diluted earnings per common share calculation using the treasury stock method, unless the effect of including such shares would be antidilutive. There were no unvested non-participating shares outstanding as of June 30, 2014, 2013 and 2012.
(c) Certain awards under our shareholder approved incentive compensation plan, as further discussed in Note 17 of the Notes to Consolidated Financial Statements, provide the recipients of the awards all the rights of a shareholder of Delta including the right to dividends declared on common shares. Any unvested shares which are participating in dividends are considered participating securities and are included in our computation of basic and diluted earnings per share using the two-class method unless the effect of including such shares would be antidilutive. There were no antidilutive shares in 2014, 2013 and 2012. There were 74,000, 68,000 and 48,000 unvested participating shares outstanding as of June 30, 2014, 2013 and 2012, respectively.
56
(12) Operating Leases
We have no non-cancellable operating leases. Our operating leases relate primarily to well and compressor station site leases and are cancellable at our option. Rental expense under operating leases was $68,000, $71,000 and $70,000 for the years ended June 30, 2014, 2013 and 2012, respectively.
(13) Commitments and Contingencies
We have entered into an employment agreement with our Chairman of the Board, President and Chief Executive Officer and change in control agreements with our other four officers. The agreements expire or may be terminated at various times. The agreements provide for continuing monthly payments or lump sum payments and the continuation of specified benefits over varying periods in certain cases following defined changes in ownership of the Company. In the event all of these agreements were exercised in the form of lump sum payments, approximately $4.2 million would be paid in addition to continuation of specified benefits for up to five years. Additionally, upon a change in control, all unvested shares awarded under our Incentive Compensation Plan, as further discussed in Note 17 of the Notes to Consolidated Financial Statements, would immediately vest.
Our June 30, 2012 Consolidated Income Statement included the accrual of $877,000 of interest expense related to an assessment of a license tax. The assessment was resolved in 2013 and the previously accrued interest was reversed.
We are not a party to any material pending legal proceedings.
We have entered into a forward purchase agreement for natural gas beginning in July, 2014 and expiring in December, 2014. The agreement requires us to purchase minimum amounts of natural gas throughout the term of the agreements. The agreement is established in the normal course of business to ensure adequate natural gas supply to meet our customers' natural gas requirements. The agreement has an aggregate minimum purchase obligation of $140,000 for our fiscal year ending June 30, 2015.
(14) Regulatory Matters
The Kentucky Public Service Commission exercises regulatory authority over our retail natural gas distribution and transportation services. Their regulation of our business includes setting the rates we are permitted to charge our regulated customers. We monitor our need to file requests with them for a general rate increase for our natural gas and transportation services. They have historically utilized cost-of-service ratemaking where our base rates are established to recover normal operating expenses, exclusive of natural gas costs, and a reasonable rate of return. Our regulated rates were most recently adjusted in our 2010 rate case and became effective in October, 2010. We do not have any matters before the Kentucky Public Service Commission that would have a material impact on our results of operations, financial position or cash flows.
We have a pipe replacement program which allows us to adjust rates annually to earn a return on capital expenditures incurred subsequent to our last rate case which are associated with the replacement of pipe and related facilities. The pipe replacement program is designed to additionally recover the costs associated with the mandatory retirement or relocation of facilities.
The Kentucky Public Service Commission allows us a natural gas cost recovery clause, which permits us to adjust the rates charged to our customers to reflect changes in our natural gas supply costs and any bad debt expense related to natural gas cost. Although we are not required to file a general rate case to adjust rates pursuant to the natural gas cost recovery clause, we are required to make quarterly filings with the Kentucky Public Service Commission. Under and over-recovered natural gas costs are collected or refunded through adjustments to customer bills beginning three months after the end of the quarter in which the actual natural gas costs were incurred.
Additionally, we have a weather normalization provision in our tariffs, approved by the Kentucky Public Service Commission, which allows us to adjust our rates to residential and small non-residential customers to reflect variations from thirty year average weather for our December through April billing cycles. These adjustments to customer bills are made on a real time basis such that there is no lag in collecting from or refunding to customers the related dollar amounts.
The Kentucky Public Service Commission allows us a conservation and efficiency program for our residential customers. The program provides for us to perform energy audits, promote conservation awareness and provide rebates on the purchase of
57
certain high-efficiency appliances. The program helps to align our interests with our residential customers' interests by reimbursing us for the margins on lost sales due to the program and providing incentives for us to promote customer conservation. Our rates are adjusted annually to recover the costs incurred under these programs, the reimbursement of margins on lost sales and the incentives provided to us.
In addition to regulation by the Kentucky Public Service Commission, we may obtain non-exclusive franchises from the cities in which we operate authorizing us to place our facilities in the streets and public grounds. No utility may obtain a franchise until it has obtained approval from the Kentucky Public Service Commission to bid on such franchise. We hold franchises in five of the cities we serve, and we continue to operate under the conditions of expired franchises in four other cities we serve. In the other cities and areas we serve, the areas served do not have governmental organizations authorized to grant franchises or the city governments do not require a franchise. We attempt to acquire or reacquire franchises whenever feasible. Without a franchise, a city could require us to cease our occupation of the streets and public grounds or prohibit us from extending our facilities into any new area of that city. To date, the absence of a franchise has not adversely affected our operations.
(15) Segment Information
Our Company has two reportable segments: (i) a regulated natural gas distribution and transmission segment and (ii) a non-regulated segment that participates in related ventures, consisting of natural gas marketing, natural gas production and sales of natural gas liquids. Virtually all of the revenues recorded under both segments come from the sale or transportation of natural gas, or related sales of natural gas liquids. The regulated segment serves residential, commercial and industrial customers in the single geographic area of central and southeastern Kentucky. Price risk for the regulated segment is mitigated through our natural gas cost recovery clause, approved quarterly by the Kentucky Public Service Commission. Price risk for the non-regulated segment is mitigated by efforts to balance supply and demand. However, there are greater risks in the non-regulated segment because of the practical limitations on the ability to perfectly predict our demand. In addition, we are exposed to price risk resulting from changes in the market price of natural gas, natural gas liquids and uncommitted natural gas inventory of our non-regulated companies.
In our non-regulated segment, three customers each provided more than 5% of our operating revenues. Our largest customer provided approximately $12,569,000 of nonregulated revenues during 2014. Our second largest customer provided approximately $9,494,000, $17,866,000 and $12,450,000 of non-regulated revenues during 2014, 2013 and 2012, respectively. Our third largest customer provided approximately $5,206,000, $5,390,000 and $6,815,000 of non-regulated revenues during 2014, 2013 and 2012, respectively. There is no assurance that revenues from these customers will continue at these levels.
We purchased approximately 96% and 98% of our natural gas from Atmos Energy Marketing, M & B Gas Services and Midwest Energy Services in 2014 and 2013, respectively. In 2012, we purchased approximately 99% of our natural gas from Atmos Energy Marketing and M & B Gas Services.
The reportable segments follow the accounting policies as described in the Summary of Significant Accounting Policies in Note 1 of the Notes to Consolidated Financial Statements. Intersegment revenues and expenses represent the natural gas transportation costs from the regulated segment to the non-regulated segment at our tariff rates. Operating expenses, taxes and interest are allocated to the non-regulated segment.
58
Segment information is shown in the following table:
($000) | 2014 | 2013 | 2012 | |||||
Operating Revenues | ||||||||
Regulated | ||||||||
External customers | 57,054 | 46,427 | 42,655 | |||||
Intersegment | 4,041 | 4,145 | 3,704 | |||||
Total Regulated | 61,095 | 50,572 | 46,359 | |||||
Non-regulated | ||||||||
External customers | 38,792 | 34,238 | 31,423 | |||||
Eliminations for intersegment | (4,041 | ) | (4,145 | ) | (3,704 | ) | ||
Total operating revenues | 95,846 | 80,665 | 74,078 | |||||
Operating Expenses | ||||||||
Regulated | ||||||||
Purchased natural gas | 27,215 | 17,825 | 15,703 | |||||
Depreciation and amortization | 6,068 | 6,023 | 5,871 | |||||
Other | 15,285 | 14,701 | 13,909 | |||||
Total regulated | 48,568 | 38,549 | 35,483 | |||||
Non-regulated | ||||||||
Purchased natural gas | 29,059 | 26,011 | 23,380 | |||||
Depreciation and amortization | 80 | 70 | 53 | |||||
Other | 6,576 | 6,990 | 5,601 | |||||
Total non-regulated | 35,715 | 33,071 | 29,034 | |||||
Eliminations for intersegment | (4,041 | ) | (4,145 | ) | (3,704 | ) | ||
Total operating expenses | 80,242 | 67,476 | 60,813 | |||||
Other Income and Deductions, Net | ||||||||
Regulated | 183 | 151 | 77 | |||||
Non-regulated | 18 | — | (2 | ) | ||||
Total other income and deductions, net | 201 | 151 | 75 | |||||
Interest Charges | ||||||||
Regulated | 2,633 | 2,688 | 3,366 | |||||
Non-regulated | 38 | (818 | ) | 932 | ||||
Total interest charges | 2,671 | 1,870 | 4,298 | |||||
Income Tax Expense | ||||||||
Regulated | 3,907 | 3,676 | 2,772 | |||||
Non-regulated | 952 | 593 | 486 | |||||
Total income tax expense | 4,859 | 4,269 | 3,258 | |||||
Net Income | ||||||||
Regulated | 6,407 | 5,970 | 4,990 | |||||
Non-regulated | 1,868 | 1,231 | 794 | |||||
Total net income | 8,275 | 7,201 | 5,784 | |||||
Assets | ||||||||
Regulated | 181,530 | 177,662 | 174,454 | |||||
Non-regulated | 4,495 | 6,268 | 8,441 | |||||
Total assets | 186,025 | 183,930 | 182,895 | |||||
Capital Expenditures | ||||||||
Regulated | 8,078 | 6,983 | 7,163 | |||||
Non-regulated | — | 196 | 174 | |||||
Total capital expenditures | 8,078 | 7,179 | 7,337 | |||||
(16) Insurance Proceeds
In September, 2011, we received $300,000 of insurance proceeds relating to a natural gas inventory adjustment recorded in fiscal 2009 for the Company's underground natural gas storage field. These proceeds are included in operation and maintenance in the 2012 Consolidated Statement of Income.
(17) Share-Based Compensation
We have a shareholder approved incentive compensation plan (the “Plan”) that provides for compensation payable in shares of our common stock. The Plan is administered by our Corporate Governance and Compensation Committee of our Board of Directors, which has complete discretion in determining our employees, officers and outside directors who shall be eligible to participate in the Plan, as well as the type, amount, terms and conditions of each award, subject to the limitations of the Plan.
The number of shares of our common stock which may be issued pursuant to the Plan may not exceed in the aggregate 1,000,000 shares. As of June 30, 2014, approximately 794,000 shares of common stock were available for issuance under the Plan. Shares of common stock may be issued from authorized but unissued shares, shares reacquired by us or shares that we purchase in the open market.
Compensation expense for share-based compensation is recorded in the non-regulated segment and included in operation and maintenance expense in the Consolidated Statements of Income based on the fair value of the awards at the grant date and is amortized over the requisite service period. Fair value is the closing price of our common shares at the grant date. The grant date is the date at which our commitment to issue the share-based awards arises, which is generally when the award is approved and the terms of the awards are communicated to the employee or director. We initially recognize expense for our performance shares when it is probable that any stipulated performance criteria will be met. Our share-based compensation expense was $1,112,000, $922,000 and $712,000 for 2014, 2013 and 2012, respectively.
Tax benefits of $31,000 and $26,000 were recognized as a premium on common shares on our 2014 and 2013 Consolidated Balance Sheets, respectively, which decreased our taxes payable as the deduction for income tax purposes exceeds the compensation expense recognized for financial reporting purposes. The excess tax benefits can be utilized to offset tax deficiencies related to share-based compensation in subsequent periods.
Stock Awards
In 2014, 2013 and 2012, common stock was awarded to virtually all Delta employees and directors having grant date fair values of $350,000 (17,000 shares), $264,000 (12,000 shares) and $337,000 (22,000 shares), respectively. The recipients vested in the awards shortly after the awards were granted, but during the time between the grant dates and the vesting dates the shares awarded were not transferable by the holders. Once the shares were vested, the shares received under the stock awards were immediately transferable.
Performance Shares
In 2014, 2013 and 2012, performance shares were awarded to the Company's executive officers having grant date fair values of $801,000 (39,000 shares) and $844,000 (39,000 shares) and $552,000 (36,000 shares), respectively. The performance share awards vest only if the performance objectives of the awards are met, which are based on the Company's earnings per common share for the fiscal year in which the performance shares are awarded, before any cash bonuses or share-based compensation. Upon satisfaction of the performance objectives, unvested shares are issued to the recipients and vest in one-third increments each August 31 subsequent to achieving the performance objectives as long as the recipients are employees throughout each such service period. The recipients of the awards also become vested as a result of certain events such as death or disability of the holders. The unvested shares have both dividend participation rights and voting rights during the remaining terms of the awards. Holders of performance shares may not sell, transfer or pledge their shares until the shares vest.
As of June 30, 2014 the performance objectives for the performance shares awarded in 2014 have been satisfied and subject to further limitations of the plan, up to 39,000 unvested shares will be issued to the recipients, subject to a service condition whereby a recipient of the award shall vest in one-third increments each year beginning August 31, 2013 and annually each August 31 thereafter until fully vested as long as the recipient is an employee throughout each such service period. The performance
59
objectives for the performance shares awarded in 2013 were met and 39,000 unvested shares were issued on August 31, 2013, of which 26,000 shares remain unvested as of June 30, 2014.
For 2014, 2013 and 2012, compensation expense related to the performance shares was $762,000, $658,000 and $375,000, respectively. Compensation expense of $469,000 is expected to be recognized between 2015 and 2017 for the unvested shares.
Our performance shares have graded vesting schedules, and each separate annual vesting tranche is treated as a separate award for expense recognition. Compensation expense is amortized over the vesting period of the individual awards based on the probable outcome of meeting the performance objectives.
Since the performance condition has been satisfied, the holder of performance shares will have both dividend participation rights and voting rights during the remaining term of the awards. The holder becomes vested as a result of certain events such as death or disability of the holder. Subject to the satisfaction of the performance condition, the weighted average expected remaining vesting period at June 30, 2014 is 1.6 years.
The following summarizes the activity for performance shares:
Performance shares | |||||
Number of shares | Weighted-average grant date fair value ($ per share) | ||||
Unvested shares at June 30, 2013 | 67,668 | 18.85 | |||
Granted (a) | 39,000 | 20.53 | |||
Vested | (32,668 | ) | (17.62 | ) | |
Unvested shares at June 30, 2014 | 74,000 | 20.28 | |||
(a) | Represents the maximum number of shares which could be issued based on achieving the performance criteria. |
60
(18) Quarterly Financial Data (Unaudited)
The quarterly data reflects, in the opinion of management, all normal recurring adjustments necessary to present fairly the results for the interim periods.
Quarter Ended | Operating Revenues | Operating Income | Net Income (Loss) | Basic and Diluted Earnings (Loss) per Common Share | |||||||||||||
Fiscal 2014 | |||||||||||||||||
September 30 | $ | 13,041,272 | $ | 692,098 | $ | 79,409 | $ | 0.01 | |||||||||
December 31 | 25,810,664 | 5,624,971 | 3,134,729 | 0.45 | |||||||||||||
March 31 | 40,435,516 | 8,886,123 | 5,173,624 | 0.74 | |||||||||||||
June 30 | 16,558,419 | 400,247 | (112,634 | ) | (0.01 | ) | |||||||||||
Fiscal 2013 | |||||||||||||||||
September 30 | $ | 11,452,315 | $ | 415,946 | $ | (158,903 | ) | $ | (0.02 | ) | |||||||
December 31 | 22,106,691 | 4,967,855 | 3,249,376 | 0.47 | |||||||||||||
March 31 | 31,133,349 | 7,323,064 | 4,242,677 | 0.62 | |||||||||||||
June 30 | 15,972,482 | 481,814 | (132,374 | ) | (0.02 | ) | |||||||||||
(19) Subsequent Events
In August, 2014, 22,000 shares of common stock were awarded to virtually all Delta employees and directors having a grant date fair value of $443,000. Additionally, in August, 2014, performance shares were awarded to the Company's executive officers. The performance share awards vest only if the performance objective of the awards is met, which is based on the Company's fiscal 2015 audited earnings per share, before any cash bonuses or share-based compensation. Subject to further limitations described in the Plan, all performance shares paid shall be in the form of unvested shares, which contain a service condition whereby recipients of the awards shall vest in one-third increments each year beginning on August 31, 2015, and annually each August 31 thereafter until fully vested as long as the recipient is an employee throughout each such service period. The maximum number of shares which could be issued under the performance awards is 39,000, having a grant date fair value of $772,980.
61
SCHEDULE II
DELTA NATURAL GAS COMPANY, INC.
VALUATION AND QUALIFYING ACCOUNTS
FOR THE YEARS ENDED JUNE 30, 2014, 2013 and 2012
Column C | Column D | |||||||||||||||||||
Column A | Column B | Additions | Deductions | Column E | ||||||||||||||||
Charged to | ||||||||||||||||||||
Balance at | Charged to | Other | Amounts | |||||||||||||||||
Beginning of | Costs and | Accounts - | Charged Off | Balance at | ||||||||||||||||
Description | Period | Expenses | Recoveries | Or Paid | End of Period | |||||||||||||||
Deducted From the Asset to Which it Applies - Allowance for doubtful accounts for the years ended: | ||||||||||||||||||||
June 30, 2014 | $ | 536,255 | $ | 107,131 | $ | 225,502 | $ | 508,888 | $ | 360,000 | ||||||||||
June 30, 2013 | 157,000 | 496,512 | 140,178 | 257,435 | 536,255 | |||||||||||||||
June 30, 2012 | 190,000 | 127,891 | 168,204 | 329,095 | 157,000 | |||||||||||||||
62