Attached files
| file | filename |
|---|---|
| 8-K - 8-K - SCANSOURCE, INC. | a2014-q4form8xk.htm |
| EX-99.1 - EXHIBIT 99.1 - SCANSOURCE, INC. | a2014-q4exhibit991.htm |

Q4 FY 2014 AND FULL YEAR FINANCIAL RESULTS CONFERENCE CALL August 21, 2014 at 5:00 pm ET Exhibit 99.2

Safe Harbor This presentation may contain certain comments, which are “forward-looking” statements that involve plans, strategies, economic performance and trends, projections, expectations, or beliefs about future events and other statements that are not descriptions of historical facts, may be forward-looking statements within the meaning of the Private Securities Litigation Reform Act of 1995, Section 27A of the Securities Act of 1933 and Section 21E of the Securities Exchange Act of 1934. Forward-looking information is inherently subject to risks and uncertainties; these statements are subject to the safe harbor created by the Private Securities Litigation Reform Act of 1995. Any number of factors could cause actual results to differ materially from anticipated results. For more information concerning factors that could cause actual results to differ from anticipated results, see the “Risk Factors” included in the Company’s annual report on Form 10-K for the fiscal year ended June 30, 2013, as well as the quarterly report on Form 10-Q for the quarter ended March 31, 2014, filed with the Securities and Exchange Commission (“SEC”). Although ScanSource believes the expectations reflected in its forward-looking statements are reasonable, it cannot guarantee future results, levels of activity, performance or achievements. ScanSource disclaims any intentions or obligation to update or revise any forward-looking statements, whether as a result of new information, future events, or otherwise, except as may be required by law. In addition to disclosing results that are determined in accordance with United States Generally Accepted Accounting Principles (“GAAP”), the Company also discloses certain non-GAAP measures, including adjusted net income and adjusted diluted EPS, return on invested capital (“ROIC”) and the percentage change in net sales excluding the impact of foreign currency exchange rates. A reconciliation of the Company's non-GAAP financial information to GAAP financial information is provided in the Company’s Form 8-K, filed with the SEC, with the quarterly earnings press release for the period indicated. 2

Highlights – Q4 FY14 3 Fourth quarter 2014 net sales of $ 758 million, up 6% Y/Y, and adjusted EPS of $0.60*; both above our expected range Record sales quarter for Worldwide Barcode & Security, up 10% Y/Y Record sales quarters for North America POS & Barcode and Security Another solid sales growth quarter for Brazil and Europe Worldwide Communications & Services sales unchanged from the prior year Strong rebound from previous quarter, up 18% Q/Q Record sales quarter for North America Communications unit Fourth quarter 2014 return on invested capital of 13.9%* adjusted to exclude legal recovery, net of attorney fees Announced agreement to acquire Network1, Brazil’s leading value-added communications distributor, and letter of intent to acquire Imago, Europe’s leading value-added video and voice communications distributor * See Appendix for calculation of adjusted EPS and ROIC, non-GAAP measures.

About Network1 Description Leading value-added distributor of communications products and services in Brazil Established in 2004; HQ in Brazil (Sao Paulo) Key Vendors ~ 65 vendors and >8,000 customers Avaya, Checkpoint, Dell, Extreme, F5, HP, Juniper, Microsoft, Polycom, Riverbed, Schneider-Electric Key Talent/ Employees Rafael Paloni, Network1’s CEO and controlling shareholder, to lead ScanSource’s Communications business in Latin America Nearly 400 employees Location Local branches: Brazil, Mexico, Colombia, Chile, Peru, and Miami Export Platform for value-added distribution in Latin America Financials Calendar year 2014 net sales estimated at ~ R$850 million (approximately US$376 million) Demonstrated double-digit sales growth with operating margins consistent with ScanSource’s Communications business Note: Reais converted into USD using 0.442 exchange rate. 4

Announces Agreement to Acquire Network1 Great fit with existing Brazil operations; adds Communications and platform for Latin America business Aligned with leading vendors and growth technologies in attractive LATAM markets Transaction summary: Purchase Price All-cash share purchase Debt-free/cash-free initial purchase price R$160 million (52% of purchase price) (approximately US$71 million) Earn-out payments based on EBITDA over 4 years (12% annually) Multiple Adjusted EBITDA multiple: Initial 7x; Earnouts 7.1x, 7.3x, 7.5x, 7.7x Accretion Expected to be accretive to EPS and ROIC in the first year after closing, excluding one-time acquisition costs Funding Funded with cash on hand Closing Announced 8/15/14 Subject to completion of due diligence and regulatory approvals Expect to close by the end of calendar year 2014 Note: Reais converted into USD using 0.442 exchange rate. 5

About Imago Description Europe’s leading value-added video and voice communications distributor Established in 1991; HQ in UK (Thatcham, Berkshire) Key Vendors Largest Polycom distributor in Europe Polycom, Barco, Samsung, NEC Key Talent/ Employees Ian Vickerage, Imago’s Managing Director, founder, and majority owner, to continue to lead the company Nearly 120 employees Location Operations in UK and France Recent acquisition of Vitec, a videoconferencing distributor in Germany (6/14) Financials Sales for fiscal year ended 7/31/14 estimated at ~ GBP 50 million (approximately US$83 million) Demonstrated double-digit sales growth with operating margins consistent with ScanSource’s Communications business 6 Note: GBP converted into USD using 1.667 exchange rate.

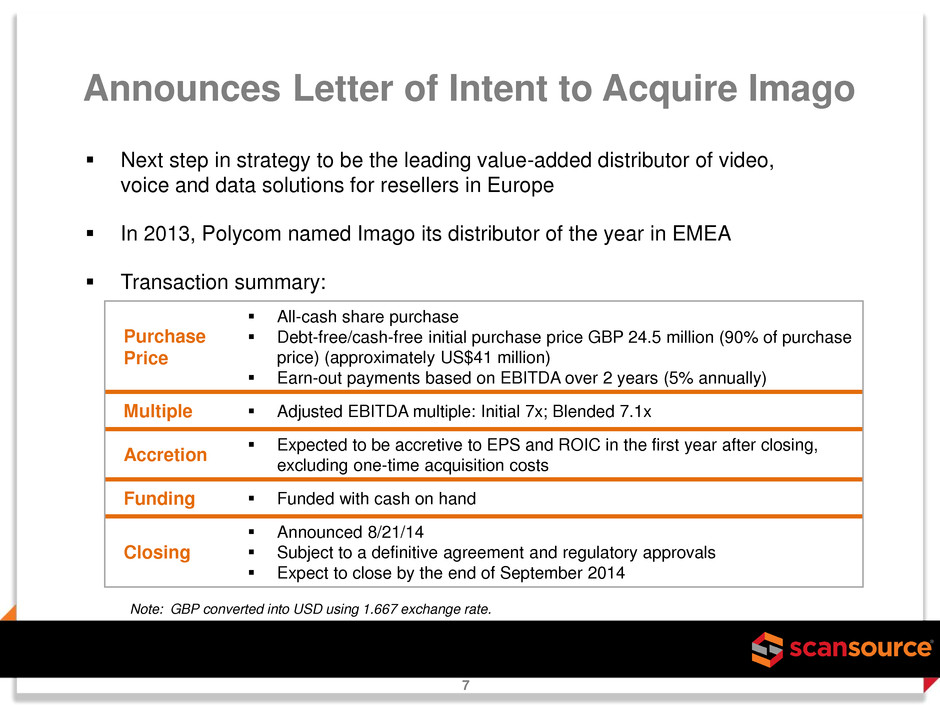
Announces Letter of Intent to Acquire Imago Next step in strategy to be the leading value-added distributor of video, voice and data solutions for resellers in Europe In 2013, Polycom named Imago its distributor of the year in EMEA Transaction summary: Purchase Price All-cash share purchase Debt-free/cash-free initial purchase price GBP 24.5 million (90% of purchase price) (approximately US$41 million) Earn-out payments based on EBITDA over 2 years (5% annually) Multiple Adjusted EBITDA multiple: Initial 7x; Blended 7.1x Accretion Expected to be accretive to EPS and ROIC in the first year after closing, excluding one-time acquisition costs Funding Funded with cash on hand Closing Announced 8/21/14 Subject to a definitive agreement and regulatory approvals Expect to close by the end of September 2014 7 Note: GBP converted into USD using 1.667 exchange rate.

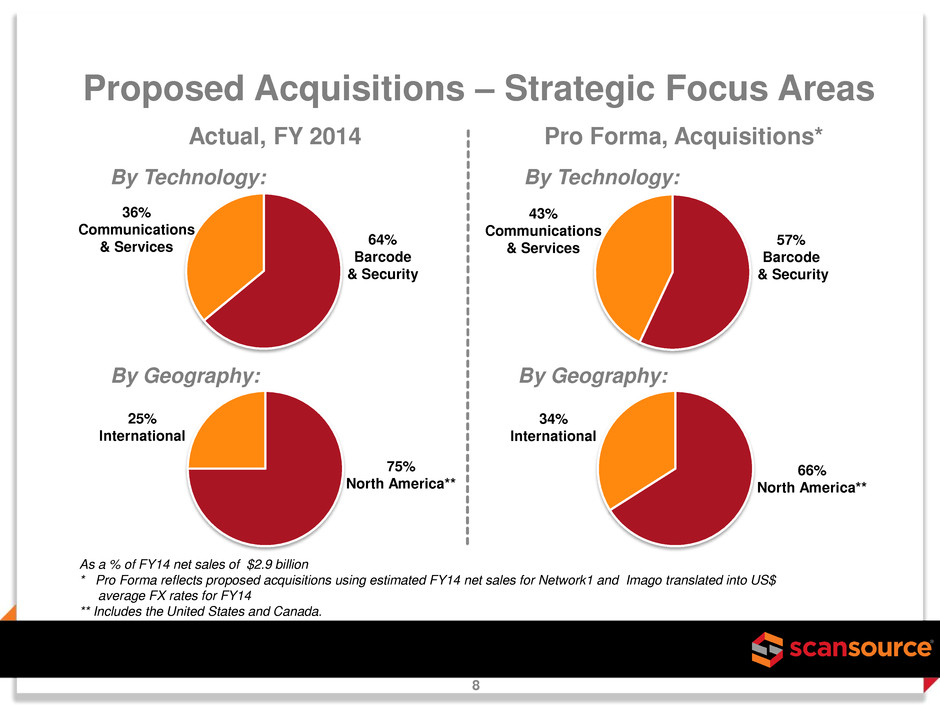
Proposed Acquisitions – Strategic Focus Areas As a % of FY14 net sales of $2.9 billion * Pro Forma reflects proposed acquisitions using estimated FY14 net sales for Network1 and Imago translated into US$ average FX rates for FY14 ** Includes the United States and Canada. 64% Barcode & Security 75% North America** 36% Communications & Services 8 Actual, FY 2014 Pro Forma, Acquisitions* By Technology: By Technology: By Geography: By Geography: 25% International 43% Communications & Services 57% Barcode & Security 34% International 66% North America**

Q4 FY14 Q4 FY13 GAAP Non- GAAP* GAAP Non- GAAP* Y/Y Change (non-GAAP): Net sales $758.1 $758.1 $712.7 $712.7 6.4% increase Gross margin % (of net sales) 9.8% 9.8% 10.6% 10.6% 86 bp margin decrease SG&A expenses $49.0 $49.0 $46.8 $46.8 4.5% higher SG&A Legal recovery, net (15.5) -- -- -- Impairment charges -- -- 48.8 -- Change, FV contingent consideration 0.1 0.1 0.4 0.4 Operating income 40.4 24.9 (20.4) 28.4 12% decrease Operating income % (of net sales) 5.33% 3.29% (2.86)% 3.98% 69 bp margin decrease Net income $27.1 $17.3 $(13.3) $19.9 13% decrease Diluted EPS $0.94 $0.60 $(0.48) $0.71 15% decrease Income Statement Highlights – Fourth Qtr In millions, except EPS 9 * Excluding legal recovery, net of attorney fees for Q4 FY14 and impairment charges for Q4 FY13; see Appendix for reconciliation of GAAP to non-GAAP measures.

FY14 FY13 GAAP Non- GAAP* GAAP Non- GAAP* Y/Y Change (non-GAAP): Net sales $2,914 $2,914 $2,877 $2,877 1.3% increase Gross margin % (of net sales) 10.3% 10.3% 10.2% 10.2% 15 bp margin increase SG&A expenses $192.5 $192.5 $189.1 $189.1 1.8% higher SG&A Legal recovery, net (15.5) -- -- -- Impairment charges/Belgian costs -- -- 50.9 -- Change, FV contingent consideration 2.3 2.3 1.8 1.8 Operating income 121.8 106.3 51.0 101.9 4% increase Operating income % (of net sales) 4.18% 3.65% 1.77% 3.54% 11 bp margin increase Net income $81.8 $72.0 $34.7 $69.3 4% increase Diluted EPS $2.86 $2.52 $1.24 $2.47 2% increase Income Statement Highlights – Full Year In millions, except EPS 10 * Excluding legal recovery, net of attorney fees for FY14 and impairment charges and Belgian tax compliance/ personnel replacement costs for FY13; see Appendix for reconciliation of GAAP to non-GAAP measures.

Q4 FY14 Sales Mix Barcode & Security = Worldwide Barcode and Security Communications & Services = Worldwide Communications and Services As a % of Q4 FY14 net sales of $758.1 million * Includes the United States and Canada. 65% Barcode & Security 76% North America* 35% Communications & Services 11 By Technology By Geography 24% International

Q4 FY14 Q4 FY13 Net sales $490.5 $444.8 Gross profit $41.7 $43.3 Gross margin 8.5% 9.7% Operating income (loss) $12.8 $(1.7) Impairment charge – goodwill -- 15.1 Adjusted operating income $12.8 $13.5 Operating income % 2.6% 3.0% $445 $491 Q4 FY13 Q4 FY14 WW Barcode & Security Net Sales, $ in millions Up 10.3% Excluding FX, Up 10.0% $ in millions 12 * See Appendix for reconciliation of net sales excluding impact of foreign exchange to a GAAP measure.

FY14 FY13 Net sales $1,873.2 $1.828.2 Gross profit $168.2 $168.1 Gross margin 9.0% 9.2% Operating income $51.5 $34.7 Impairment charge – goodwill -- 15.1 Adjusted operating income $51.5 $49.8 Operating income % 2.8% 2.7% $1,828 $1,873 FY13 FY14 WW Barcode & Security Net Sales, $ in millions Up 2.5% Excluding FX, Up 2.5% $ in millions 13 * See Appendix for reconciliation of net sales excluding impact of foreign exchange to a GAAP measure.

Q4 FY14 Q4 FY13 Net sales $267.6 $267.9 Gross profit $32.3 $32.3 Gross margin 12.1% 12.1% Operating income $12.2 $9.5 Impairment charge – goodwill -- 5.4 Adjusted operating income $12.2 $14.9 Operating income % 4.5% 5.6% $268 $268 Q4 FY13 Q4 FY14 WW Communications & Services Net Sales, $ in millions Down (0.1)% Excluding FX, Down (0.4)% $ in millions 14 * See Appendix for reconciliation of net sales excluding impact of foreign exchange to a GAAP measure.

FY14 FY13 Net sales $1,040.5 $1,048.7 Gross profit $132.9 $124.8 Gross margin 12.8% 11.9% Operating income $54.8 $44.6 Impairment charge – goodwill -- 5.4 Adjusted operating income $54.8 $50.0 Operating income % 5.3% 4.8% $1,049 $1,040 FY13 FY14 WW Communications & Services Net Sales, $ in millions Down (0.8)% Excluding FX, Down (1.1)% $ in millions 15 * See Appendix for reconciliation of net sales excluding impact of foreign exchange to a GAAP measure.

Q4 FY14 Q3 FY14 Q4 FY13 Return on invested capital (“ROIC”)* 13.9% 14.8% 17.2% Cash and cash equivalents (Q/E) $194.9 $183.6 $148.2 Uncleared checks (included in accounts payable) $84.2 $53.2 $65.9 Operating cash flow, trailing 12-months $47.7 $86.1 $129.4 Days sales outstanding in receivables 55 55 55 Inventory (Q/E) $504.8 $479.9 $402.3 Inventory turns 5.6 5.1 6.2 Paid for inventory days 10.9 15.3 5.7 Q4 FY14 Key Measures $ in millions 16 * See Appendix for calculation of ROIC, a non-GAAP measure.

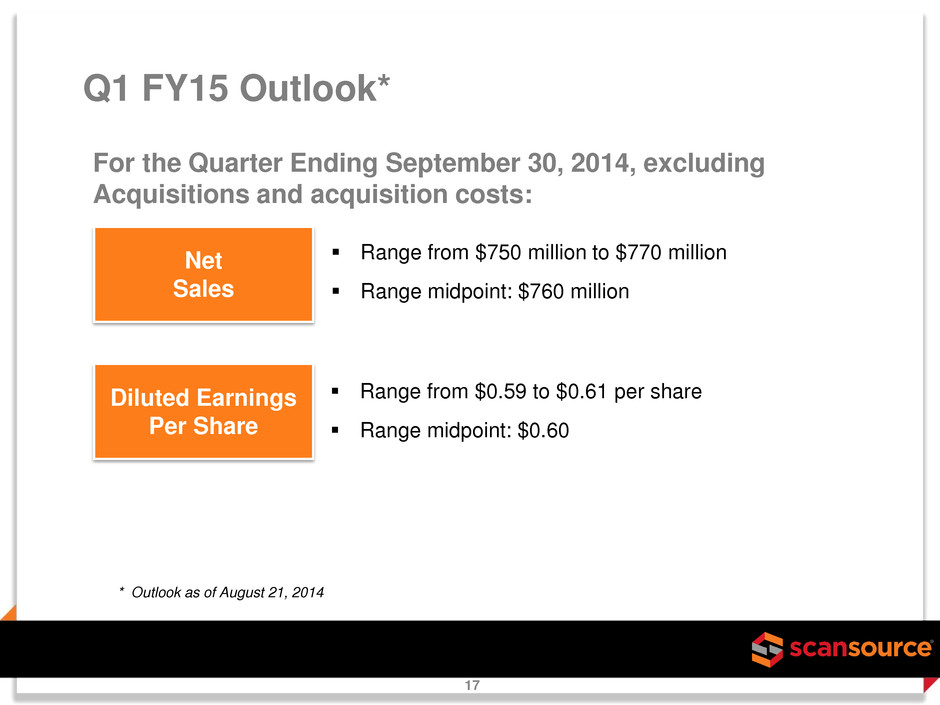
Q1 FY15 Outlook* For the Quarter Ending September 30, 2014, excluding Acquisitions and acquisition costs: Net Sales Diluted Earnings Per Share Range from $750 million to $770 million Range midpoint: $760 million Range from $0.59 to $0.61 per share Range midpoint: $0.60 * Outlook as of August 21, 2014 17

WW Barcode & Security Highlights Net Sales, $ in millions Up 10.3% Excluding FX, Up 10.0% 18 * See Appendix for reconciliation of net sales excluding impact of foreign exchange to a GAAP measure. 65% of overall sales Record sales quarter for the segment Y/Y sales growth for all geographies, except Miami export business Strong big deal quarter Record sales quarter for North America POS & Barcode and Security business units Another quarter of strong sales growth for Brazil, up 8% Y/Y or 17% in local currency $445 $491 Q4 FY13 Q4 FY14

WW Communications & Services Highlights Net Sales, $ in millions Down (0.1)% Excluding FX, Down (0.4)% 19 * See Appendix for reconciliation of net sales excluding impact of foreign exchange to a GAAP measure. 35% of overall sales Increased 18% sequentially with Q/Q increases for all business units Strong performance from networking vendors Good sales quarter for vendor service contracts Record sales quarter for ScanSource Communications in North America ScanSource Services Group increased configuration services for IP phones and key injections $268 $268 Q4 FY13 Q4 FY14

Appendix: Non-GAAP Financial Information 20 Q4 FY14 Q3 FY14 Q4 FY13 Return on invested capital (ROIC), annualized (a) 13.9% 14.8% 17.2% Reconciliation of Net Income (Loss) to EBITDA Net income (loss) - GAAP $ 27,105 $ 16,949 $ (13,315) Plus: Income taxes 13,774 9,031 (6,352) Plus: Interest expense 33 217 419 Plus: Depreciation and amortization 1,985 1,743 1,594 EBITDA 42,897 27,940 (17,654) Legal recovery, net of attorney fees (15,490) - - Impairment charges - - 48,772 Adjusted EBITDA (numerator for ROIC)(non-GAAP) $ 27,407 $ 27,940 $ 31,118 Invested Capital Calculation Equity - beginning of the quarter $ 772,786 $ 751,446 $ 709,912 Equity - end of quarter 802,643 772,786 695,956 Add: Legal recovery, net of attorney fees and impairment charges, net of tax (9,756) - 33,216 Average equity 782,837 762,116 719,542 Average funded debt (b) 5,429 5,429 5,429 Invested capital (denominator for ROIC)(non-GAAP) $ 788,266 $ 767,545 $ 724,971 Notes: (a) Calculated as net income plus interest expense, income taxes, depreciation and amortization (EBITDA), annualized and divided by invested capital for the period. (b) Average daily amounts outstanding on short-term and long-term interest-bearing debt.

Appendix: Non-GAAP Financial Information 21 Year Ended June 30. 2014 2013 Return on invested capital (ROIC), annualized (a) 15.4% 16.0% Reconciliation of Net Income (Loss) to EBITDA Net income - GAAP $ 81,789 $ 34,662 Plus: Income taxes 41,318 18,364 Plus: Interest expense 731 775 Plus: Depreciation and amortization 7,375 8,457 EBITDA 131,213 62,258 Legal recovery, net of attorney fees (15,490) - Impairment charges - 48,772 Belgian tax compliance/personnel costs - 2,121 Adjusted EBITDA (numerator for ROIC)(non-GAAP) $ 115,723 $ 113,151 Invested Capital Calculation Equity - beginning of the quarter $ 695,956 $ 652,311 Equity - end of quarter 802,643 695,956 Add: Legal recovery, net of attorney fees, impairment charges, and Belgian costs, net of tax (9,756) 34,616 Average equity 744,422 691,442 Average funded debt (b) 5,429 15,405 Invested capital (denominator for ROIC)(non-GAAP) $ 749,851 $ 706,847 Notes: (a) Calculated as net income plus interest expense, income taxes, depreciation and amortization (EBITDA), annualized and divided by invested capital for the period. (b) Average daily amounts outstanding on short-term and long-term interest-bearing debt.

Appendix: Non-GAAP Financial Information 22 Worldwide Barcode & Security Net sales, excluding impact of foreign exchange (FX) - Y/Y Change: Q4 2014 net sales $ 490.5 Foreign exchange impact (1.1) Q4 2014 net sales, excluding FX impact $ 489.4 Q4 2013 sales $ 444.8 % Change 10.0% FY 2014 net sales $ 1,873.2 Foreign exchange impact 1.5 FY 2014 net sales, excluding FX impact $ 1,874.7 FY 2013 sales $ 1,828.2 % Change 2.5% Worldwide Communications & Services Net sales, excluding impact of foreign exchange (FX) - Y/Y Change: Q4 2014 net sales $ 267.6 Foreign exchange impact (0.7) Q4 2014 net sales, excluding FX impact $ 266.9 Q4 2013 sales $ 267.9 % Change -0.4% FY 2014 net sales $ 1,040.5 Foreign exchange impact (2.9) FY 2014 net sales, excluding FX impact $ 1,037.6 FY 2013 sales $ 1,048.7 % Change -1.1%
