Attached files
| file | filename |
|---|---|
| 8-K - 8-K - McEwen Mining Inc. | a14-18714_18k.htm |
Exhibit 99.1

MCEWEN MINING Q2 2014
FINANCIAL & OPERATING RESULTS
(All Amounts in US Dollars Unless Otherwise Stated)
TORONTO, ONTARIO - (August 7, 2014) - McEwen Mining Inc. (NYSE: MUX) (TSX: MUX) is pleased to provide a summary of the Company’s Q2 2014 financial and operating results.
Summary
· Still on track to meet full-year production guidance of 135,000 to 140,000 gold equivalent ounces as production is expected to increase in Q4 2014 due to: 1) 50% more processing capacity at El Gallo 1 compared to the first half of 2014; and 2) higher grades at San José and El Gallo 1 compared to the first half of 2014.
· The El Gallo 1 mine expansion construction was completed in the quarter and commissioning has commenced. The expansion is expected to be fully operational in Q4 2014. As a result of the expansion and mining higher grade ore, El Gallo 1 production is expected to increase from 37,500 to 75,000 gold equivalent ounces in 2015.
Q2 2014 Highlights
· Gold equivalent production* for El Gallo 1 totaled 8,167 ounces (8,113 gold ounces and 3,275 silver ounces). Production decreased due to lower gold grades and downtime at the process plant associated with the commissioning of the mine expansion.
· McEwen Mining’s share of gold equivalent production* for San José totaled 23,033 gold equivalent ounces (10,750 gold ounces and 737,001 silver ounces). Production was slightly lower due to a decrease in planned silver grades.
· Total cash costs** and all-in sustaining costs** were $840 and $1,283 per gold equivalent ounce sold. Total cash costs were higher due to lower production and one time costs and repairs at El Gallo 1. The anticipated increase in ounces in Q4 2014 will have a positive impact on full-year costs.
· Gold Bar has received sufficient underground water rights from the Nevada Division of Water Resources to perform all mine related activities. This permit approval is a significant development for advancing the project.
· Reported a net loss of $104 million or ($0.35) per share in Q2 2014. The net loss for the period is primarily due to an after-tax impairment charge of $98 million related to our Los Azules copper project in Argentina. The Company also spent approximately $3 million on both exploration and general and administrative expenses.


Q3 2014 Outlook
· We expect Q3 production at El Gallo 1 to remain at current levels due to continuation of the rainy season and crusher availability issues experienced in mid-July. Midway through the third quarter we expect to be mining significantly higher grade ore at El Gallo 1. The grade is expected to increase from 1.1 gpt (grams per tonne) in Q2 to an average of 1.9 gpt for the second half of 2014.
· Q3 production at San José will be at similar levels to Q2 due to continued low silver grades. In July, the mine also experienced a work stoppage that lasted 3 days; however, the mine remains on track for 2014 production guidance due to anticipated higher grades in Q4.
* Gold equivalent calculated by converting silver into gold using a 60:1 exchange ratio. In 2013, 52:1 exchange ratio was used to calculate gold equivalent production and costs. Figures from 2013, including total cash costs, all-in sustaining costs, and all-in costs on a per gold equivalent ounce basis, have been adjusted to 60:1 for comparison purposes.
** Adjusted net loss, earnings from mining operations, total cash costs, all-in sustaining costs, and all-in costs are financial performance measures with no standardized definition under generally accepted accounting principles in the United States of America (“Non-GAAP measure”). See “Cautionary Note Regarding Non-GAAP Measures” for additional information.
Financial Highlights
Adjusted Loss
Removing the impact of the impairments in the current and comparative periods, as well as the impact of foreign exchange fluctuations, adjusted net loss for the second quarter was $8.6 million, compared to $11.7 million for the comparable period in 2013.
Mines Remain Profitable
Earnings from mining operations during the quarter totaled $6.6 million versus $7.8 million in Q2 2013 and $11.4 million in Q1 2014. Earnings from mining operations were lower compared to Q1 2014 due to lower realized gold and silver prices and lower grades at both the San José and El Gallo 1 mines.
Good Balance Sheet Liquidity
At June 30, 2014, McEwen Mining had cash and liquid assets of $16.6 million, comprised of cash, $15.2 million, and precious metals of $1.4 million. In July 2014, the Company incurred $4 million in debt by replacing its cash bonding with surety bonds of $4.8 million. This represents a contingent liability to the Company. The annual fees are 1.5% of the value of the surety bonds, with an upfront 10% deposit.
Cash Flow from Argentina
During Q2 2014, McEwen Mining received $3.2 million in dividends from its 49% interest in the San José mine, with the majority having been repatriated back to the Company’s head office in Canada. In July 2014, the Company received an additional dividend of $1 million.
Mexican Tax Rebate Pending
McEwen Mining is awaiting a refund totaling $14.5 million in value added taxes (“VAT” or “IVA” as known locally) from the Mexican government for amounts paid to local vendors and suppliers.
San José Mine, Argentina (49%)
Production for McEwen Mining’s 49% share in the San José mine during Q2 2014 was 23,033 gold equivalent ounces (converting silver into gold using a 60:1 ratio), consisting of 10,750 gold ounces and 737,001 silver ounces. This was 9% lower than the comparable period in 2013 and 1% higher than Q1 2014. Production was lower year-over-year due to lower gold and silver grades.
Gold equivalent total cash costs in Q2 2014 were $836 per ounce sold. This is 3% higher than Q2 2013 and 2% higher than Q1 2014. The increase in total cash costs is primarily due to lower silver grades, high inflationary pressures and an increase in ground support costs.
All-in sustaining costs totaled $1,165 per gold equivalent ounce sold and was 11% higher than Q2 2013 and 17% higher than Q1 2014. The increase in all-in sustaining costs was also due to lower silver grades, which are expected to recover during the second half of 2014. Further, all-in sustaining costs on a per ounce basis were lower in 2013 than in 2014 due to a significantly higher number of ounces sold, therefore resulting in a lower cost per ounce. Sales in the second quarter of 2013 were unusually high due to a build-up of inventory in the preceding quarter. The average realized prices for gold and silver during Q2 2014 were $1,268/oz. and $19.30/oz., respectively.
Q3 production at San José will be at similar levels to Q2 due to continued low silver grades. In July, the mine also experienced a work stoppage that lasted 3 days. However; the mine remains on track for 2014 production guidance due to anticipated higher grades in Q4.
Production guidance for our share of production from San José in 2014 remains at 97,500 gold equivalent ounces. Cash costs and all-in sustaining costs are estimated at $800 and $1,100 per gold equivalent ounce in 2014.
San José Mine Production Results
|
|
|
Q2 2014 |
|
Q1 2014 |
|
Q2 2013 |
|
Year to |
|
|
San José — 100%* |
|
|
|
|
|
|
|
|
|
|
Ore production (tonnes processed) |
|
142,074 |
|
134,589 |
|
140,816 |
|
276,663 |
|
|
Average grade gold (gpt) |
|
5.45 |
|
5.77 |
|
6.34 |
|
5.60 |
|
|
Average head silver (gpt) |
|
378 |
|
391 |
|
407 |
|
385 |
|
|
Average gold recovery (%) |
|
87.6 |
|
88.1 |
|
89.3 |
|
88.1 |
|
|
Average silver recovery (%) |
|
87.1 |
|
86.9 |
|
85.5 |
|
87.0 |
|
|
Gold produced (ounces) |
|
21,938 |
|
21,974 |
|
25,610 |
|
43,912 |
|
|
Silver produced (ounces) |
|
1,504,084 |
|
1,471,081 |
|
1,575,442 |
|
2,975,165 |
|
|
Gold sold (ounces) |
|
20,954 |
|
22,298 |
|
31,974 |
|
43,252 |
|
|
Silver sold (ounces) |
|
1,511,314 |
|
1,492,687 |
|
1,991,030 |
|
3,004,001 |
|
|
Co-product total cash cost Au (US$/oz) |
|
889 |
|
872 |
|
878 |
|
881 |
|
|
Co-product total cash cost Ag (US$/oz) |
|
13.19 |
|
12.75 |
|
12.40 |
|
12.96 |
|
|
Gold equivalent total cash cost (US$/oz) |
|
836 |
|
816 |
|
810 |
|
826 |
|
|
Co-product all-in sustaining cash cost Au (US$/oz) |
|
1,239 |
|
1,060 |
|
1,137 |
|
1,149 |
|
|
Co-product all-in sustaining cash cost Ag (US$/oz) |
|
18.38 |
|
15.51 |
|
16.06 |
|
16.92 |
|
|
Gold equivalent co-product all-in sustaining cash cost (US$/oz) |
|
1,165 |
|
992 |
|
1,049 |
|
1,077 |
|
|
McEwen Mining — 49% Share |
|
|
|
|
|
|
|
|
|
|
Gold produced (ounces) |
|
10,750 |
|
10,767 |
|
12,549 |
|
21,517 |
|
|
Silver produced (ounces) |
|
737,001 |
|
720,830 |
|
771,967 |
|
1,457,831 |
|
|
Gold equivalent produced (ounces) |
|
23,033 |
|
22,781 |
|
25,415 |
|
45,814 |
|
* McEwen Mining holds a 49% attributable interest in the San José mine.
El Gallo 1 Mine, Mexico (100%)
In Q2 2014 the El Gallo 1 mine produced 8,167 gold equivalent ounces, consisting of 8,113 gold ounces and 3,275 silver ounces. This was 4% lower than Q2 2013 and 13% lower than Q1 2014. Production was lower due to lower gold grades and downtime at the process plant that was associated with commissioning of the expansion.
Total cash costs in Q2 2014 were $852 per gold equivalent ounce, 19% higher than Q2 2013 and 18% higher than Q1 2014. The increase in total cash costs is primarily due to a higher strip ratio in the areas being mined in 2014, coupled with lower ounces produced in Q2. Haulage costs have increased slightly year-over-year, as we are currently mining pits that are further away from both the processing plant and the waste dumps as per the mine plan. The Company also incurred additional expenditures to repair and improve the solution pond liners and the ADR plant.
All-in sustaining costs totaled $1,257 per gold equivalent ounce in Q2 2014, which was 4% higher than Q2 2013 and 20% higher than Q1 2014. The average realized prices for gold and silver during Q2 2014 were $1,291/oz. and $19.58/oz., respectively.
The Company expects Q3 production at El Gallo 1 to remain at current levels due to continuation of the rainy season and crusher availability issues experienced in mid-July.
By mid-Q3 2014 we expect to be mining significantly higher grade ore at El Gallo 1. The grade is expected to increase from 1.1 gpt in Q2 to an average of 1.9 gpt for the second half of 2014. The grade coupled with the expanded rate of production will have a positive impact in Q4.
In 2014, El Gallo 1 is forecasted to produce 37,500 gold equivalent ounces. Total cash costs and all-in sustaining costs have been estimated at $775 and $1,100 per gold equivalent ounce, respectively.
In 2015, cash costs and all-in sustaining costs are forecasted to fall from $775 to $575 per gold equivalent ounce and $1,100 to $850 per gold equivalent ounce, respectively because of the expansion at El Gallo 1. The increased capacity, combined with higher grades as mining moves deeper in the pit, is expected to increase production from 37,500 gold equivalent ounces in 2014, to 75,000 gold equivalent ounces in 2015.
El Gallo 1 Mine Production Results
|
|
|
Q2 2014 |
|
Q1 2014 |
|
Q2 2013 |
|
Year to Date |
|
|
Ore production (tonnes processed) |
|
368,223 |
|
359,402 |
|
346,896 |
|
727,625 |
|
|
Average grade gold (gpt) |
|
1.10 |
|
1.16 |
|
1.34 |
|
1.13 |
|
|
Gold produced (ounces) |
|
8,113 |
|
9,295 |
|
8,439 |
|
17,408 |
|
|
Silver produced (ounces) |
|
3,275 |
|
4,195 |
|
6,341 |
|
7,470 |
|
|
Gold equivalent produced (ounces) |
|
8,167 |
|
9,365 |
|
8,545 |
|
17,532 |
|
|
Gold sold (ounces) |
|
8,911 |
|
8,563 |
|
7,897 |
|
17,474 |
|
|
Silver sold (ounces) |
|
6,760 |
|
1,600 |
|
6,400 |
|
8,360 |
|
|
Gold equivalent total cash cost (US$) |
|
852 |
|
720 |
|
714 |
|
788 |
|
|
Gold equivalent co-product all-in sustaining cash cost (US$) |
|
1,257 |
|
1,046 |
|
1,204 |
|
1,154 |
|
Note: Gold recoveries are projected to reach 70% through on-going leaching.
El Gallo 2, Mexico (100%)
We are waiting for a higher silver price of $23-$25 per ounce before proceeding with the construction of El Gallo 2. The higher silver price should lower our cost of capital and will provide a much superior rate of return. In preparation for the construction decision, the Company has been evaluating possible financing alternatives while advancing the construction of the ball mill, which is the longest lead-time item associated with the project. The ball mill is 75% complete and will be ready for delivery in Q4 2014.
Based on on-going cost savings studies, we believe approximately $150 million in financing would be required in order to complete the mine. The El Gallo 2 feasibility study has not been updated to reflect these possible changes.
Los Azules, Argentina (100%)
During the second quarter of 2014, the Company recorded an impairment charge of $120 million relating to its Los Azules copper exploration project (“Los Azules Project”). The impairment was considered prudent and reasonable due to the recently announced acquisition of Lumina Copper Corp. by First Quantum Minerals Ltd., for approximately $430 million. Lumina’s only significant asset is the Taca Taca copper project located in Salta, Argentina. While there are some notable differences between Taca Taca and Los Azules, we believe the similarities in project scale and location within Argentina warrant consideration for the Lumina transaction to be a triggering event for an impairment analysis. The Company engaged a third party valuator who used the observed market value per pound of copper equivalent based on this recent and other comparable transactions to estimate the fair value of the Los Azules Project. The carrying value of the property exceeded its estimated fair value, resulting in an impairment charge of $120 million, along with a resulting deferred income tax recovery of $22 million, for a net impairment charge of $98 million for the three and six months ended June 30, 2014. The book value of the Los Azules Project is now $310 million.
Gold Bar Project, Nevada (100%)
McEwen Mining continues to advance the Gold Bar permitting process for construction and production. Gold Bar is forecasted to produce 50,000 ounces gold per year for 8 years at a cash cost of $700 per ounce and an all-in sustaining cost of $850 per ounce.
Gold Bar has received sufficient underground water rights from the Nevada Division of Water Resources to perform all mine related activities. This permit approval is a significant development for advancing the project.
McEwen Mining submitted the Plan of Operations “POO” during the fourth quarter of 2013. The POO was determined complete and the BLM has determined that an Environmental Impact Statement (EIS) is necessary to fulfill the requirements under the National Environmental Protection Act (NEPA). Upon completion of the environmental analysis the BLM will be able to proceed with the approval determination of the POO. A request for proposal has been issued to select a third-party contractor to assist the BLM in the preparation of an EIS for the Gold Bar project. Final permit approval is scheduled for first quarter of 2016.
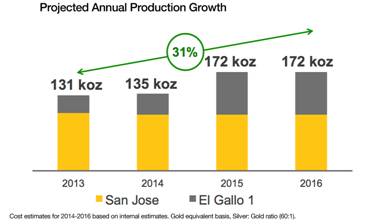
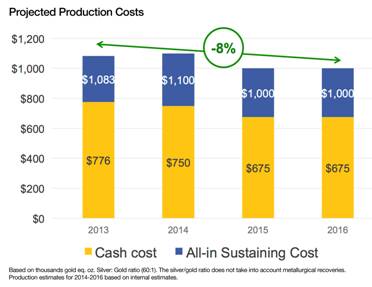
Summary Production 2015 & 2016
Our expected annual production profile and costs are shown in the graphs below. Gold equivalent ounces are projected to increase by 31% from 2013 to 2016. In the same timeframe, all-in sustaining costs are projected to drop by 8%.
Q2 2014 Conference Call Details
McEwen Mining will be hosting a conference call to discuss the Q2 2014, results and project developments on Friday August 8, 2014 11 am EDT
WEBCAST:
http://www.gowebcasting.com/lobby/5835
TELEPHONE:
Participant dial-in number(s): 647-788-4922 / 877-223-4471
Conference ID: 76213182
REPLAY:
Dial-in number(s): 416-621-4642 / 800-585-8367
Conference ID: 76213182
ABOUT MCEWEN MINING (www.mcewenmining.com)
The goal of McEwen Mining is to qualify for inclusion in the S&P 500 by creating a profitable gold producer focused in the Americas. McEwen Mining’s principal assets consist of the San José mine in Santa Cruz, Argentina (49% interest); the El Gallo complex in Sinaloa, Mexico; the Gold Bar project in Nevada, US; the Los Azules project in San Juan, Argentina. McEwen Mining has 297,417,091 shares issued and outstanding at August 7, 2014. Rob McEwen, Chief Owner, Chairman and CEO owns 25% of the shares of the Company.
TECHNICAL INFORMATION
This news release has been reviewed and approved by William Faust, PE, McEwen Mining’s Chief Operating Officer, who is a Qualified Person as defined by National Instrument 43-101 (“NI 43-101).
El Gallo: for additional information about the El Gallo complex see the technical report titled “Resource Estimate for the El Gallo Complex, Sinaloa State, Mexico” dated August 30, 2013 with an effective date of June 30, 2013, prepared by John Read, C.P.G., and Luke Willis, P. Geo. Mr. Read and Mr. Willis are not considered independent of the Company as defined by NI 43-101
Gold Bar: For information about the Gold Bar project see the technical report titled “NI 43-101 Technical Report on Resources and Reserves Gold Bar Project, Eureka County, Nevada” dated February 24, 2012 with an effective date of November 28, 2011, prepared by J. Pennington, C.P.G., MSc., Frank Daviess, MAusIMM, Registered SME, Eric Olin, MBA, RM-SME, MSc, Herb Osborn, P.E, Joanna Poeck, MMSA, B. Eng., Kent Hartley P.E. Mining, SME, BSc, Mike Levy, P.E, P.G, MSc., Evan Nikirk, P. E., Mark Allan Willow, M.Sc, C.E.M. and Neal Rigby, CEng, MIMMM, PhD, all of whom are qualified persons and all of whom are independent of McEwen Mining, each as defined by NI 43-101.
San José: for additional information about the San José mine see the technical report titled “Technical Report on San José Silver-Gold Mine, Santa Cruz, Argentina” dated August 15, 2013 with an effective date of December 31 2012, prepared by Eugene Puritch , P.Eng., David Burga , P.Geo., Alfred Hayden , P.Eng., James L. Pearson , P.Eng., and Fred H. Brown , P.Geo., all of whom are qualified persons and all of whom are independent of McEwen Mining, each as defined by NI 43-101.The foregoing news release and technical report are available under the Corporation’s profile on SEDAR (www.sedar.com).
The foregoing news release and technical reports are available under the Corporation’s profile on SEDAR (www.sedar.com).
There are significant risks and uncertainty associated with commencing production or changing production plans without a feasibility, pre-feasibility or scoping study. The expansion to El Gallo 1 has not and may not be explored, developed or analyzed in sufficient detail to complete an independent feasibility or pre-feasibility study. Further, although the subject of a 2012 feasibility study, the Company does not have a current feasibility study on the El Gallo 2 project. As such, each of the foregoing may ultimately be determined to lack one or more geological, engineering, legal, operating, economic, social, environmental, and other relevant factors reasonably required to serve as the basis for a final decision to complete the expansion or construction of all or part of these projects.
RELIABILITY OF INFORMATION REGARDING THE SAN JOSÉ MINE
Minera Santa Cruz S.A., the owner of the San José mine, is responsible for and has supplied to the Company all reported results from the San José mine. McEwen Mining’s joint venture partner, a subsidiary of Hochschild Mining plc, and its affiliates other than MSC do not accept responsibility for the use of project data or the adequacy or accuracy of this release.
CAUTIONARY NOTE REGARDING NON-GAAP MEASURES
In this report, we have provided information prepared or calculated according to U.S. GAAP, as well as provided some non-U.S. GAAP (“non-GAAP”) performance measures. Because the non-GAAP performance measures do not have any standardized meaning prescribed by U.S. GAAP, they may not be comparable to similar measures presented by other companies.
(1) Total Cash Costs and All-in Sustaining
Total cash costs consist of mining, processing, on-site general and administrative costs, community and permitting costs related to current explorations, royalty costs, refining and treatment charges (for both doré and concentrate products), sales costs, export taxes and operational stripping costs. All-in sustaining cash costs consist of total cash costs (as described above), plus environmental rehabilitation costs, mine site exploration and development costs, and sustaining capital expenditures. In order to arrive at our consolidated all-in sustaining costs, we also include corporate general and administrative expenses. Depreciation is excluded from both total cash costs and all-in sustaining cash costs. Total cash cost and all-in sustaining cash cost per ounce sold are calculated on a co-product basis by dividing the respective proportionate share of the total cash costs and all-in sustaining cash costs for the period attributable to each metal by the ounces of each respective metal sold. We use and report these measures to provide additional information regarding operational efficiencies both on a consolidated and an individual mine basis, and believe these measures provide investors and analysts with useful information about our underlying costs of operations. A reconciliation to the nearest U.S. GAAP measure is provided in McEwen Mining’s Quarterly Report on Form 10-Q for the quarter ended June 30, 2014.
(2) Adjusted net income (loss)
Adjusted net income (loss) excludes the following items from net income (loss): impairment charges, net of tax; foreign currency gains and losses, including the impact of the devaluation Argentine peso relative to the U.S. dollar; other non-recurring items, if applicable. We use and report this measure because we believe it provides investors and analysts with a useful measure of the underlying operating performance of our core mining business. A reconciliation to the nearest U.S. GAAP measure is provided in McEwen Mining’s Quarterly Report on Form 10-Q for the quarter ended June 30, 2014.
(3) Earnings from mining operations
The term Earnings from Mining Operations used in this report is a non-GAAP financial measure. We use and report this measure because we believe it provides investors and analysts with a useful measure of the underlying earnings from our mining operations.
We define Earnings from Mining Operations as Gold and Silver Revenues from our El Gallo 1 mine and our 49% attributable share of the San José mine’s Net Sales, less their respective Production Costs Applicable to Sales. To the extent that Production Costs Applicable to Sales may include depreciation and amortization expense related to the fair value increments on historical business acquisitions (fair value paid in excess of the carrying value of the underlying assets and liabilities assumed on the date of acquisition), we deduct this
expense in order to arrive at Production Costs Applicable to Sales that only include depreciation and amortization expense incurred at the mine-site level. The San José mine Net Sales and Production Costs Applicable to Sales are presented, on a 100% basis, in Note 4 of McEwen Mining’s Quarterly Report on Form 10-Q for the quarter ended June 30, 2014.
CAUTIONARY NOTE TO US INVESTORS REGARDING RESOURCE ESTIMATION
McEwen Mining prepares its resource estimates in accordance with standards of the Canadian Institute of Mining, Metallurgy and Petroleum referred to in Canadian National Instrument 43-101 (NI 43-101). These standards are different from the standards generally permitted in reports filed with the SEC. Under NI 43-101, McEwen Mining reports measured, indicated and inferred resources, measurements, which are generally not permitted in filings made with the SEC. The estimation of measured resources and indicated resources involve greater uncertainty as to their existence and economic feasibility than the estimation of proven and probable reserves. U.S. investors are cautioned not to assume that any part of measured or indicated resources will ever be converted into economically mineable reserves. The estimation of inferred resources involves far greater uncertainty as to their existence and economic viability than the estimation of other categories of resources.
CAUTION CONCERNING FORWARD-LOOKING STATEMENTS
This news release contains certain forward-looking statements and information, including “forward-looking statements” within the meaning of the Private Securities Litigation Reform Act of 1995. The forward-looking statements and information expressed, as at the date of this news release, McEwen Mining Inc.’s (the “Company”) estimates, forecasts, projections, expectations or beliefs as to future events and results. Forward-looking statements and information are necessarily based upon a number of estimates and assumptions that, while considered reasonable by management, are inherently subject to significant business, economic and competitive uncertainties, risks and contingencies, and there can be no assurance that such statements and information will prove to be accurate. Therefore, actual results and future events could differ materially from those anticipated in such statements and information. Risks and uncertainties that could cause results or future events to differ materially from current expectations expressed or implied by the forward-looking statements and information include, but are not limited to, factors associated with fluctuations in the market price of precious metals, mining industry risks, political, economic, social and security risks associated with foreign operations, the ability of the corporation to receive or receive in a timely manner permits or other approvals required in connection with operations, risks associated with the construction of mining operations and commencement of production and the projected costs thereof, risks related to litigation, the state of the capital markets, environmental risks and hazards, uncertainty as to calculation of mineral resources and reserves and other risks. Readers should not place undue reliance on forward-looking statements or information included herein, which speak only as of the date hereof. The Company undertakes no obligation to reissue or update forward-looking statements or information as a result of new information or events after the date hereof except as may be required by law. See McEwen Mining’s Annual Report on Form 10-K for the fiscal year ended December 31, 2013 and Quarterly Report on Form 10-Q for the quarter ended June 30, 2014 and other filings with the Securities and Exchange Commission, under the caption “Risk Factors”, for additional information on risks, uncertainties and other factors relating to the forward-looking statements and information regarding the Company. All forward-looking statements and information made in this news release are qualified by this cautionary statement.
The NYSE and TSX have not reviewed and do not accept responsibility for the adequacy or accuracy of the contents of this news release, which has been prepared by management of McEwen Mining Inc.
|
For further information contact: |
|
|
|
|
|
Sheena Scotland Director, Investor Relations Tel: (647) 258-0395 ext 410 Toll Free: (866) 441-0690 Fax: (647) 258-0408
Facebook: facebook.com/mcewenrob Twitter: twitter.com/mcewenmining
|
Mailing Address 150 King Street West Suite 2800,P.O. Box 24 Toronto, Ontario, Canada M5H 1J9 E-mail: info@mcewenmining.com
|