Attached files
| file | filename |
|---|---|
| EXCEL - IDEA: XBRL DOCUMENT - VISTEON CORP | Financial_Report.xls |
| EX-32.1 - EXHIBIT 32.1 - VISTEON CORP | ex-3212014q210xq.htm |
| EX-32.2 - EXHIBIT 32.2 - VISTEON CORP | ex-3222014q210xq.htm |
| EX-31.2 - EXHIBIT 31.2 - VISTEON CORP | ex-3122014q210xq.htm |
| EX-31.1 - EXHIBIT 31.1 - VISTEON CORP | ex-3112014q210xq.htm |
UNITED STATES
SECURITIES AND EXCHANGE COMMISSION
Washington D.C. 20549
________________
FORM 10-Q
(Mark One)
þ | QUARTERLY REPORT PURSUANT TO SECTION 13 OR 15(d) |
OF THE SECURITIES EXCHANGE ACT OF 1934
For the quarterly period ended June 30, 2014,
OR
¨ | TRANSITION REPORT PURSUANT TO SECTION 13 OR 15(d) |
OF THE SECURITIES EXCHANGE ACT OF 1934
For the transition period from ____________ to ____________
Commission file number 001-15827
VISTEON CORPORATION
(Exact name of registrant as specified in its charter)
State of Delaware | 38-3519512 |
(State or other jurisdiction of incorporation or organization) | (I.R.S. Employer Identification No.) |
One Village Center Drive, Van Buren Township, Michigan | 48111 |
(Address of principal executive offices) | (Zip code) |
Registrant’s telephone number, including area code: (800)-VISTEON
Not applicable
(Former name, former address and former fiscal year, if changed since last report)
Indicate by check mark whether the registrant: (1) has filed all reports required to be filed by Section 13 or 15(d) of the Securities Exchange Act of 1934 during the preceding 12 months (or for such shorter period that the Registrant was required to file such reports), and (2) has been subject to such filing requirements for the past 90 days. Yes ü No__
Indicate by check mark whether the registrant: has submitted electronically and posted on its corporate Web site, if any, every Interactive Data File required to be submitted and posted pursuant to Rule 405 of Regulation S-T (§232.405 of this chapter) during the preceding 12 months (or for such shorter period that the registrant was required to submit and post such files). Yes ü No __
Indicate by check mark whether the registrant is a large accelerated filer, an accelerated filer, a non-accelerated filer, or a smaller reporting company. See the definitions of “large accelerated filer," "accelerated filer” and "smaller reporting company" in Rule 12b-2 of the Exchange Act.
Large accelerated filer ü Accelerated filer __ Non-accelerated filer __ Smaller reporting company __
Indicate by check mark whether the registrant is a shell company (as defined in Rule 12b-2 of the Exchange Act). Yes __ No ü
Indicate by check mark whether the registrant has filed all documents and reports required to be filed by Sections 12, 13 or 15(d) of the Securities Exchange Act of 1934 subsequent to the distribution of securities under a plan confirmed by a court. Yes ü No__
As of July 31, 2014, the registrant had outstanding 43,983,847 shares of common stock.
Exhibit index located on page number 55.
1
Index
Part I - Financial Information | Page | |
2
Part I
Financial Information
Item 1. | Consolidated Financial Statements |
VISTEON CORPORATION AND SUBSIDIARIES
CONSOLIDATED STATEMENTS OF COMPREHENSIVE (LOSS) INCOME
(Dollars in Millions Except Per Share Amounts)
(Unaudited)
Three Months Ended June 30 | Six Months Ended June 30 | ||||||||||||||
2014 | 2013 | 2014 | 2013 | ||||||||||||
Sales | $ | 1,782 | $ | 1,610 | $ | 3,500 | $ | 3,196 | |||||||
Cost of sales | 1,588 | 1,447 | 3,127 | 2,883 | |||||||||||
Gross margin | 194 | 163 | 373 | 313 | |||||||||||
Selling, general and administrative expenses | 84 | 77 | 165 | 150 | |||||||||||
Interest expense | 8 | 10 | 18 | 23 | |||||||||||
Interest income | 2 | 2 | 4 | 5 | |||||||||||
Equity in net income of non-consolidated affiliates | 11 | 42 | 13 | 86 | |||||||||||
Loss on debt extinguishment | 23 | — | 23 | — | |||||||||||
Restructuring expenses | 13 | 2 | 14 | 21 | |||||||||||
Other expenses (income) | 14 | (3 | ) | 20 | 8 | ||||||||||
Income from continuing operations before income taxes | 65 | 121 | 150 | 202 | |||||||||||
Provision for income taxes | 41 | 39 | 72 | 36 | |||||||||||
Net income from continuing operations | 24 | 82 | 78 | 166 | |||||||||||
(Loss) income from discontinued operations, net of tax | (165 | ) | 4 | (171 | ) | 4 | |||||||||
Net (loss) income | (141 | ) | 86 | (93 | ) | 170 | |||||||||
Net income attributable to non-controlling interests | 14 | 21 | 43 | 36 | |||||||||||
Net (loss) income attributable to Visteon Corporation | $ | (155 | ) | $ | 65 | $ | (136 | ) | $ | 134 | |||||
Basic (loss) earnings per share | |||||||||||||||
Continuing operations | $ | (0.04 | ) | $ | 1.24 | $ | 0.51 | $ | 2.60 | ||||||
Discontinued operations | (3.31 | ) | 0.06 | (3.40 | ) | 0.04 | |||||||||
Basic (loss) earnings per share attributable to Visteon Corporation | $ | (3.35 | ) | $ | 1.30 | $ | (2.89 | ) | $ | 2.64 | |||||
Diluted (loss) earnings per share | |||||||||||||||
Continuing operations | $ | (0.04 | ) | $ | 1.23 | $ | 0.49 | $ | 2.57 | ||||||
Discontinued operations | (3.31 | ) | 0.06 | (3.30 | ) | 0.04 | |||||||||
Diluted (loss) earnings per share attributable to Visteon Corporation | $ | (3.35 | ) | $ | 1.29 | $ | (2.81 | ) | $ | 2.61 | |||||
Comprehensive (loss) income: | |||||||||||||||
Comprehensive (loss) income | $ | (107 | ) | $ | 50 | $ | (80 | ) | $ | 90 | |||||
Comprehensive (loss) income attributable to Visteon Corporation | $ | (131 | ) | $ | 38 | $ | (124 | ) | $ | 79 | |||||
See accompanying notes to the consolidated financial statements.
3
VISTEON CORPORATION AND SUBSIDIARIES
CONSOLIDATED BALANCE SHEETS
(Dollars in Millions)
(Unaudited)
June 30 | December 31 | ||||||
2014 | 2013 | ||||||
ASSETS | |||||||
Cash and equivalents | $ | 1,285 | $ | 1,677 | |||
Restricted cash | 12 | 25 | |||||
Accounts receivable, net | 1,129 | 1,227 | |||||
Inventories, net | 462 | 472 | |||||
Assets held for sale | 432 | — | |||||
Other current assets | 305 | 352 | |||||
Total current assets | 3,625 | 3,753 | |||||
Property and equipment, net | 1,280 | 1,414 | |||||
Intangible assets, net | 416 | 447 | |||||
Investments in non-consolidated affiliates | 160 | 228 | |||||
Other non-current assets | 168 | 185 | |||||
Total assets | $ | 5,649 | $ | 6,027 | |||
LIABILITIES AND EQUITY | |||||||
Short-term debt, including current portion of long-term debt | $ | 127 | $ | 106 | |||
Accounts payable | 1,036 | 1,207 | |||||
Accrued employee liabilities | 152 | 202 | |||||
Liabilities held for sale | 344 | — | |||||
Other current liabilities | 274 | 287 | |||||
Total current liabilities | 1,933 | 1,802 | |||||
Long-term debt | 801 | 624 | |||||
Employee benefits | 418 | 440 | |||||
Deferred tax liabilities | 128 | 137 | |||||
Other non-current liabilities | 148 | 151 | |||||
Stockholders’ equity: | |||||||
Preferred stock (par value $0.01, 50 million shares authorized, none outstanding at June 30, 2014 and December 31, 2013) | — | — | |||||
Common stock (par value $0.01, 250 million shares authorized, 54 million and 54 million shares issued, 44 million and 48 million shares outstanding at June 30, 2014 and December 31, 2013, respectively) | 1 | 1 | |||||
Stock warrants | 6 | 6 | |||||
Additional paid-in capital | 1,236 | 1,291 | |||||
Retained earnings | 820 | 956 | |||||
Accumulated other comprehensive loss | — | (12 | ) | ||||
Treasury stock | (752 | ) | (322 | ) | |||
Total Visteon Corporation stockholders’ equity | 1,311 | 1,920 | |||||
Non-controlling interests | 910 | 953 | |||||
Total equity | 2,221 | 2,873 | |||||
Total liabilities and equity | $ | 5,649 | $ | 6,027 | |||
See accompanying notes to the consolidated financial statements.
4
VISTEON CORPORATION AND SUBSIDIARIES
CONSOLIDATED STATEMENTS OF CASH FLOWS 1
(Dollars in Millions)
(Unaudited)
Six Months Ended June 30 | |||||||
2014 | 2013 | ||||||
Operating Activities | |||||||
Net (loss) income | $ | (93 | ) | $ | 170 | ||
Adjustments to reconcile net income to net cash provided from operating activities: | |||||||
Impairment of long-lived assets | 173 | — | |||||
Depreciation and amortization | 130 | 132 | |||||
Loss on debt extinguishment | 23 | — | |||||
Equity in net income of non-consolidated affiliates, net of dividends remitted | 5 | (82 | ) | ||||
Stock-based compensation | 6 | 11 | |||||
Other non-cash items | 5 | (5 | ) | ||||
Changes in assets and liabilities: | |||||||
Accounts receivable | (78 | ) | (87 | ) | |||
Inventories | (18 | ) | (43 | ) | |||
Accounts payable | 21 | 183 | |||||
Accrued income taxes | 12 | (56 | ) | ||||
Other assets and other liabilities | (59 | ) | (65 | ) | |||
Net cash provided from operating activities | 127 | 158 | |||||
Investing Activities | |||||||
Capital expenditures | (127 | ) | (114 | ) | |||
Proceeds from asset sales and business divestitures | 60 | 39 | |||||
Other | (4 | ) | — | ||||
Net cash used by investing activities | (71 | ) | (75 | ) | |||
Financing Activities | |||||||
Short-term debt, net | 35 | 43 | |||||
Proceeds from issuance of debt, net of issuance costs | 590 | 204 | |||||
Repurchase of long-term notes | (419 | ) | — | ||||
Repurchase of common stock | (500 | ) | (125 | ) | |||
Dividends paid to non-controlling interests | (45 | ) | (22 | ) | |||
Other | 3 | (4 | ) | ||||
Net cash (used by) provided from financing activities | (336 | ) | 96 | ||||
Effect of exchange rate changes on cash and equivalents | 2 | (21 | ) | ||||
Net (decrease) increase in cash and equivalents | (278 | ) | 158 | ||||
Cash and equivalents at beginning of period | 1,677 | 825 | |||||
Cash and equivalents at end of period | $ | 1,399 | $ | 983 | |||
1 The Company has combined cash flows from discontinued operations with cash flows from continuing operations within the operating, investing and financing categories. As such, cash and equivalents above include amounts reflected in assets held for sale on the Consolidated Balance Sheets.
See accompanying notes to the consolidated financial statements.
5
VISTEON CORPORATION AND SUBSIDIARIES
NOTES TO CONSOLIDATED FINANCIAL STATEMENTS
NOTE 1. Basis of Presentation
Description of Business: Visteon Corporation (the “Company” or “Visteon”) is a global supplier of automotive systems, modules and components to global automotive original equipment manufacturers (“OEMs”). Headquartered in Van Buren Township, Michigan, Visteon has a workforce of approximately 24,000 employees and a network of manufacturing operations, technical centers and joint ventures in every major geographic region of the world with its operations organized by global product lines including Climate, Electronics and Interiors.
Interim Financial Statements: The unaudited consolidated financial statements of the Company have been prepared in accordance with the rules and regulations of the U.S. Securities and Exchange Commission ("SEC"). Certain information and footnote disclosures normally included in financial statements prepared in accordance with accounting principles generally accepted in the United States ("U.S. GAAP") have been condensed or omitted pursuant to such rules and regulations. These interim consolidated financial statements include all adjustments (consisting of normal recurring adjustments, except as otherwise disclosed) that management believes are necessary for a fair presentation of the results of operations, financial position and cash flows of the Company for the interim periods presented. Interim results are not necessarily indicative of full-year results.
Use of Estimates: The preparation of the financial statements in conformity with U.S. GAAP requires management to make estimates, judgments and assumptions that affect amounts reported herein. Management believes that such estimates, judgments and assumptions are reasonable and appropriate. However, due to the inherent uncertainty involved, actual results may differ from those provided in the Company's consolidated financial statements.
Reclassifications: Certain prior period amounts have been reclassified to conform to the current period presentation.
Principles of Consolidation: The consolidated financial statements include the accounts of the Company and all subsidiaries that are more than 50% owned and over which the Company exercises control. Investments in affiliates of greater than 20% and for which the Company exercises significant influence but does not exercise control are accounted for using the equity method. All other investments in non-consolidated affiliates are accounted for using the cost method.
Restricted Cash: Restricted cash represents amounts designated for uses other than current operations and includes $10 million of collateral for the Letter of Credit Facility with US Bank National Association, and $2 million related to cash collateral for other corporate purposes at June 30, 2014.
Recent Accounting Pronouncements: In April 2014, the Financial Accounting Standards Board ("FASB") issued Accounting Standards Update ("ASU") No. 2014-8, "Reporting Discontinued Operations and Disclosures of Disposals of Components of an Entity". This ASU changes the requirements for reporting discontinued operations to disposals of components of an entity that represent strategic shifts that have a major effect on an entity’s operations and financial results. The standard also expands the disclosures for discontinued operations and requires new disclosures related to individually material disposals that do not qualify for discontinued operations reporting. The guidance is effective for interim and annual periods beginning after December 15, 2014, and should be applied prospectively. Early adoption is permitted. The Company is currently evaluating the impact of adoption of this ASU on its consolidated financial statements and did not early adopt this standard for purposes of the discontinued operations disclosed in Note 2.
In May 2014, the FASB issued ASU No. 2014-9, "Revenue from Contracts with Customers", which stipulates that an entity should recognize revenue to depict the transfer of promised goods or services to customers in an amount that reflects the consideration to which the entity expects to be entitled in exchange for those goods or services. The ASU also requires additional disclosure about the nature, amount, timing and uncertainty of revenue and cash flows arising from customer contracts, including significant judgments and changes in judgments and assets recognized from costs incurred to obtain or fulfill a contract. This new guidance is effective for annual reporting periods beginning after December 15, 2016, including interim periods within that reporting period. Early adoption is not permitted. The Company is currently evaluating the impact of the adoption of this ASU on its consolidated financial statements.
NOTE 2. Interiors Transaction
Overview
On May 1, 2014, the Company entered into a Master Purchase Agreement (the “Purchase Agreement”) pursuant to which, Visteon will reorganize substantially all of its global Interiors business under a newly-formed holding company (the “Reorganization”)
6
and will sell all of the equity of that holding company (the “Interiors Transaction”) in exchange for the assumption of certain pension and other liabilities related to the Company's Interiors business and the payment of nominal cash consideration. Visteon agreed to contribute up to $95 million (the "Cash Contribution") to the Interiors business and the Purchase Agreement includes net working capital adjustments whereby the Cash Contribution will be effectively adjusted based on the actual net working capital levels as of the closing date. Visteon also agreed to support the buyer in establishing external credit facilities. To the extent that $90 million of external credit facilities are not available to the Interiors business by the date of closing, Visteon is required to provide a seller-backed revolving credit facility in the amount of any shortfall. Draws under any such seller-backed facility will only be available if certain of the external credit facilities are fully drawn, and any draws on the seller-backed facility generally must be repaid prior to the repayment of the external credit facilities. The seller-backed facility will have a maturity of three years and will have a default rate of interest for any interest and/or principal payment defaults.
The closing of the Interiors Transaction is expected to occur by December 31, 2014 and is subject to various conditions, including the completion of the Reorganization, regulatory and antitrust approvals, receipt of other third party consents and approvals and other closing conditions. As part of the Reorganization, Visteon will separate the portion of its Interiors business conducted through its facilities in Chennai and Pune, India into a new legal entity, which will be transferred to the holding company and sold to the buyer as part of the Interiors Transaction. Due to the time required to effect such separation under Indian law, the consummation of the Indian portion of the Interiors Transaction may occur subsequent to the closing of the balance of the Interiors Transaction.
Interiors Assets and Liabilities Held for Sale
The Company determined that assets and liabilities subject to the Interiors Transaction met the "held for sale" criteria during the quarterly period ended June 30, 2014. As the fair value of the assets and liabilities subject to the Interiors Transaction was less than the carrying value, the long-lived assets were reduced to zero, which resulted in an impairment loss of $173 million. The Company expects to record additional losses in connection with the Interiors Transaction upon closing, which are estimated to range from $150 million to $200 million, including the Cash Contribution, net working capital adjustments, and other contractual obligations resulting from the closing. Additionally, the held for sale Interiors assets and liabilities were reclassified in the Consolidated Balance Sheets to Assets held for sale or Liabilities held for sale, respectively, as the sale of such assets and liabilities is expected to close by December 31, 2014. Assets and liabilities held for sale are summarized as follows:
Assets | June 30 2014 | Liabilities | June 30 2014 | |||||||
(Dollars in Millions) | (Dollars in Millions) | |||||||||
Cash and equivalents | $ | 114 | Short-term debt | $ | 31 | |||||
Restricted cash | 14 | Accounts payable | 211 | |||||||
Accounts receivable, net | 199 | Accrued employee liabilities | 45 | |||||||
Inventories, net | 30 | Long-term debt | 1 | |||||||
Other assets | 75 | Employee benefits | 17 | |||||||
Total assets held for sale | $ | 432 | Other liabilities | 39 | ||||||
Total liabilities held for sale | $ | 344 | ||||||||
The short-term debt held for sale includes an arrangement, through a subsidiary in France, to sell accounts receivable with recourse on an uncommitted basis. The Company is required to repay any amounts outstanding under this facility as of the transaction close date.
Interiors Discontinued Operations
The operations subject to the Interiors Transaction met conditions required to qualify for discontinued operations reporting. Accordingly, the results of operations for Interiors business subject to the Interiors Transaction have been reclassified to (Loss) income from discontinued operations, net of tax in the consolidated statements of comprehensive (loss) income for the three and six-month periods ended June 30, 2014 and June 30, 2013. While the Interiors Transaction represents the substantial majority of the Company's Interiors operations, other operations previously reported within the Company's Interiors reporting segment were excluded from the scope of the Interiors Transaction. These other operations have been classified within the Other reportable segment. The Company's goal is to complete the disposal of its remaining Interiors business during 2014. Due to certain liabilities and capital requirements of the remaining business, Visteon may be required to contribute cash to such business in connection with any disposition and such amounts could be material.
7
Discontinued operations are summarized as follows:
Three Months Ended June 30 | Six Months Ended June 30 | ||||||||||||||
2014 | 2013 | 2014 | 2013 | ||||||||||||
(Dollars in Millions) | |||||||||||||||
Sales | $ | 258 | $ | 282 | $ | 522 | $ | 552 | |||||||
Cost of sales | 229 | 260 | 477 | 526 | |||||||||||
Gross margin | 29 | 22 | 45 | 26 | |||||||||||
Selling, general and administrative expenses | 14 | 14 | 27 | 27 | |||||||||||
Long-lived asset impairment | 173 | — | 173 | — | |||||||||||
Other expenses | 9 | 4 | 14 | 10 | |||||||||||
(Loss) income from discontinued operations before income taxes | (167 | ) | 4 | (169 | ) | (11 | ) | ||||||||
(Benefit from) provision for income taxes | (2 | ) | — | 2 | (15 | ) | |||||||||
(Loss) income from discontinued operations, net of tax | (165 | ) | 4 | (171 | ) | 4 | |||||||||
Net (loss) income attributable to non-controlling interests | (12 | ) | 1 | (11 | ) | 2 | |||||||||
Net (loss) income from discontinued operations attributable to Visteon | $ | (153 | ) | $ | 3 | $ | (160 | ) | $ | 2 | |||||
NOTE 3. Yanfeng Transactions
On August 12, 2013, Visteon entered into a Master Agreement (the “Master Agreement”) with Huayu Automotive Systems Company Limited (“HASCO”), Yanfeng Visteon Automotive Trim Systems Co., Ltd. (“Yanfeng”) and Yanfeng Visteon Automotive Electronics Co., Ltd. (“YFVE”), pursuant to which, among other things, Visteon and HASCO agreed to modify their existing interests in automobile interiors and electronics joint ventures in the People’s Republic of China, including Yanfeng and YFVE.
On December 17, 2013, Visteon completed the sale of its 50% ownership interest in Yanfeng for cash proceeds of $928 million (before applicable taxes). On November 7, 2013, Visteon made a cash payment of $58 million to subscribe to an additional 11% ownership interest in YFVE, increasing Visteon's direct ownership interest in YFVE from a non-controlling 40% direct ownership interest to a controlling 51% direct ownership interest. From that date, the financial position, results of operations and cash flows of YFVE have been consolidated into the Company's financial statements as part of the Electronics business unit.
During the first quarter of 2014 and in accordance with the Master Agreement, YFVE completed the sale of its ownership interests in certain joint ventures to Yanfeng Visteon Electronics (China) Investment Co., Ltd. ("YFVIC") for cash proceeds of $33 million. No gains or losses were recorded on these transactions by YFVE due to the Company's 50% ownership interest in YFVIC. Differences between carrying value and proceeds on these investments, if any, have been deferred as a basis adjustment to the Company's investment in YFVIC.
NOTE 4. Non-Consolidated Affiliates
The Company recorded equity in the net income of non-consolidated affiliates of $11 million and $42 million for the three-month periods ended June 30, 2014 and 2013, respectively. For the six-month periods ended June 30, 2014 and 2013, the Company recorded $13 million and $86 million, respectively. Investments in non-consolidated affiliates were $160 million and $228 million at June 30, 2014 and December 31, 2013, respectively. At June 30, 2014, non-consolidated affiliates accounted for under the equity method totaled $121 million and non-consolidated affiliates accounted for under the cost method totaled $39 million. Effective December 17, 2013 and in accordance with the Master Agreement, the Company, among other things, completed the sale of its 50% ownership interest in Yanfeng and changed from the equity method to the cost method of accounting for certain Yanfeng related Interiors joint ventures, including Yanfeng Visteon Jinqiao Automotive Trim Systems Co., Ltd.
The Company monitors its investments in the net assets of non-consolidated affiliates for indicators of other-than-temporary declines in value on an ongoing basis. If the Company determines that such a decline has occurred, an impairment loss is recorded, which is measured as the difference between carrying value and fair value. In April 2014, Visteon completed the sale of its 50% ownership stake in Duckyang, a Korean automotive interiors joint venture for total cash of $31 million.
8
NOTE 5. Restructuring Expenses
The Company previously announced a $100 million restructuring program designed to reduce fixed costs and to improve operational efficiency by addressing certain under-performing operations. In connection with that program, the Company announced plans to restructure three European Interiors facilities, to consolidate its Climate operations and to realign its corporate and administrative functions directly to their corresponding operational beneficiary. Through June 30, 2014, the Company recorded approximately $95 million of restructuring expenses under this program. The Company expects to record additional costs related to this program in future periods as underlying plans are finalized.
During the second quarter of 2014, the Company recorded $17 million of restructuring expenses related to employee and severance termination benefits, including amounts associated with discontinued operations, including the following activities.
• | The closure of a Climate facility located in Quilmes, Argentina. In connection with the closure, the Company recorded $10 million of restructuring expenses, primarily related to severance and termination benefits associated with approximately 270 employees, which remains accrued as of June 30, 2014. |
• | The closure of a Climate facility located in Port Elizabeth, South Africa. In connection with the closure, the Company recorded $2 million of restructuring expenses, primarily related to severance and termination benefits associated with approximately 90 employees, which remains accrued as of June 30, 2014. |
• | In connection with the previously announced restructuring of three Interiors facilities in France, the Company recorded an additional $5 million of restructuring expenses. This amount remains accrued as of June 30, 2014, as part of the Other product group, in addition to $8 million associated with previously announced programs including the fundamental reorganization of operations at a facility in Brazil. |
During the first quarter of 2013, the Company recorded $20 million of restructuring expenses, net of reversal, primarily related to severance and termination benefits associated with approximately 140 employees, including $14 million in connection with the reorganization of the Company's Climate operations in France and $6 million related to the transformation of its corporate and administrative functions. The Company recorded $2 million of additional restructuring expenses associated with these programs during the first quarter of 2014.
Restructuring reserve balances of $26 million and $29 million at June 30, 2014 and December 31, 2013, respectively, are classified as Other current liabilities on the consolidated balance sheets. The Company anticipates that the activities associated with these reserves will be substantially completed by the end of 2014. The following is a summary of the Company’s restructuring reserves and related activity, including amounts attributable to discontinued operations, for the six months ended June 30, 2014:
Climate | Other | Corporate | Total | ||||||||||||
(Dollars in Millions) | |||||||||||||||
Balance at December 31, 2013 | $ | 1 | $ | 25 | $ | 3 | $ | 29 | |||||||
Expenses | 1 | — | 1 | 2 | |||||||||||
Utilization | (1 | ) | (6 | ) | (3 | ) | (10 | ) | |||||||
Balance at March 31, 2014 | $ | 1 | $ | 19 | $ | 1 | $ | 21 | |||||||
Expenses | 12 | 5 | — | 17 | |||||||||||
Utilization | — | (11 | ) | (1 | ) | (12 | ) | ||||||||
Balance at June 30, 2014 | $ | 13 | $ | 13 | $ | — | $ | 26 | |||||||
Given the economically-sensitive and highly competitive nature of the automotive industry, the Company continues to closely monitor current market factors and industry trends taking action as necessary, including but not limited to, additional restructuring actions. However, there can be no assurance that any such actions will be sufficient to fully offset the impact of adverse factors on the Company or its results of operations, financial position and cash flows.
9
NOTE 6. Other Expenses (Income)
Other expenses (income) consist of the following:
Three Months Ended June 30 | Six Months Ended June 30 | ||||||||||||||
2014 | 2013 | 2014 | 2013 | ||||||||||||
(Dollars in Millions) | |||||||||||||||
Transformation costs | $ | 8 | $ | 2 | $ | 14 | $ | 13 | |||||||
Provision for losses on recoverable taxes | 8 | — | 8 | — | |||||||||||
Gain on sale of equity interest | (2 | ) | (5 | ) | (2 | ) | (5 | ) | |||||||
$ | 14 | $ | (3 | ) | $ | 20 | $ | 8 | |||||||
Transformation Activities
Business transformation costs of $8 million and $14 million were incurred during the three-month and six-month periods ended June 30, 2014, respectively, related to financial and advisory services associated with continued execution of the Company's comprehensive value creation plan, including the following activities:
• | Climate consolidation - During the first quarter of 2013, Visteon completed the sale of certain subsidiaries and intellectual property of its global climate business to Halla Climate Control Corporation, a majority-owned subsidiary of the Company, for approximately $410 million. With effect from February 1, 2013, this combined climate business has been operating under the name of Halla Visteon Climate Control Corporation ("HVCC"). HVCC is headquartered in South Korea. |
• | Electronics optimization - On January 13, 2014, Visteon reached an agreement to acquire the automotive electronics business of Johnson Controls for cash of $265 million and the acquisition was completed on July 1, 2014. During the fourth quarter of 2013, the Company made a cash payment of $58 million to subscribe to an additional 11% ownership interest in YFVE, resulting in a controlling 51% direct ownership interest. Additionally, the Company invested $48 million during the fourth quarter of 2013, in a non-consolidated electronics holding company owned 50% by Visteon and 50% by Yanfeng. |
• | Interiors strategy - On May 1, 2014, the Company entered a Master Purchase Agreement to sell substantially all of its global Interiors operations for nominal cash consideration. Transformation costs associated with the Interiors strategy have been classified as discontinued operations for the three and six-month periods ended June 30, 2014 and 2013, respectively. In April 2014, Visteon completed the sale of its 50% ownership stake in Duckyang, a Korean automotive interiors joint venture for total cash of $31 million. On December 17, 2013, Visteon completed the sale of its 50% ownership interest in Yanfeng, a significant interiors equity investee, for cash proceeds of $928 million (before applicable taxes). The Company's goal is to complete the disposal of its remaining Interiors business during 2014. Due to certain liabilities and capital requirements of the remaining business, Visteon may be required to contribute cash to such business in connection with any disposition and such amounts could be material. |
Provision for Losses on Recoverable Taxes
The Company recorded $8 million during the three months ended June 30, 2014 to adjust recoverable value-added taxes to net realizable value attributable to business exit activities.
Gain on Sale of Equity Interest
In April 2014, the Company completed the sale of its 50% ownership interest in Duckyang Industry Co., Ltd. ("Duckyang"), a Korean automotive interiors supplier. In connection with the transaction, the Company received total cash of approximately $31 million, including $6 million of dividends. The Company recorded a pre-tax gain of approximately $2 million on this transaction during the three months ended June 30, 2014.
In June 2013, the Company completed the sale of its 20% equity interest in Dongfeng Visteon Automotive Trim Systems Co., Ltd. ("Dongfeng") for proceeds of approximately $20 million and recognized a gain of $5 million during the three months ended June 30, 2013.
10
NOTE 7. Inventories
Inventories are stated at the lower of cost, determined on a first-in, first-out basis, or market. A summary of inventories is provided below:
June 30 | December 31 | ||||||
2014 | 2013 | ||||||
(Dollars in Millions) | |||||||
Raw materials | $ | 217 | $ | 204 | |||
Work-in-process | 165 | 191 | |||||
Finished products | 102 | 104 | |||||
Valuation reserves | (22 | ) | (27 | ) | |||
$ | 462 | $ | 472 | ||||
NOTE 8. Property and Equipment
Property and equipment, net consists of the following:
June 30 | December 31 | ||||||
2014 | 2013 | ||||||
(Dollars in Millions) | |||||||
Land | $ | 149 | $ | 162 | |||
Buildings and improvements | 278 | 301 | |||||
Machinery, equipment and other | 1,237 | 1,309 | |||||
Construction in progress | 134 | 145 | |||||
Total property and equipment | 1,798 | 1,917 | |||||
Accumulated depreciation | (589 | ) | (580 | ) | |||
1,209 | 1,337 | ||||||
Product tooling, net of amortization | 71 | 77 | |||||
Property and equipment, net | $ | 1,280 | $ | 1,414 | |||
Property and equipment is depreciated principally using the straight-line method of depreciation over the related asset's estimated useful life. Generally, buildings and improvements are depreciated over a 40-year estimated useful life, leasehold improvements are depreciated on a straight-line basis over the initial lease term period, and machinery, equipment and other are depreciated over estimated useful lives ranging from 3 to 15 years. Product tooling is amortized using the straight-line method over the estimated life of the tool, generally not exceeding six years. Depreciation and amortization expense for property and equipment, inclusive of amounts attributable to discontinued operations, is as follows:
Three Months Ended June 30 | Six Months Ended June 30 | ||||||||||||||
2014 | 2013 | 2014 | 2013 | ||||||||||||
(Dollars in Millions) | |||||||||||||||
Depreciation | $ | 49 | $ | 52 | $ | 99 | $ | 106 | |||||||
Amortization | 2 | 3 | 5 | 5 | |||||||||||
$ | 51 | $ | 55 | $ | 104 | $ | 111 | ||||||||
11
NOTE 9. Intangible Assets
Intangible assets, net are summarized as follows:
Estimated Weighted Average Useful Life (years) | June 30, 2014 | December 31, 2013 | |||||||||||||||||||||||
Gross Carrying Value | Accumulated Amortization | Net Carrying Value | Gross Carrying Value | Accumulated Amortization | Net Carrying Value | ||||||||||||||||||||
(Dollars in Millions) | |||||||||||||||||||||||||
Definite-Lived | |||||||||||||||||||||||||
Developed technology | 8 | $ | 214 | $ | 100 | $ | 114 | $ | 219 | $ | 88 | $ | 131 | ||||||||||||
Customer related | 10 | 214 | 57 | 157 | 214 | 45 | 169 | ||||||||||||||||||
Other | 39 | 30 | 9 | 21 | 32 | 9 | 23 | ||||||||||||||||||
Subtotal | $ | 458 | $ | 166 | $ | 292 | $ | 465 | $ | 142 | $ | 323 | |||||||||||||
Indefinite-Lived | |||||||||||||||||||||||||
Goodwill | $ | 96 | $ | 97 | |||||||||||||||||||||
Trade names | 28 | 27 | |||||||||||||||||||||||
Subtotal | 124 | 124 | |||||||||||||||||||||||
Total | $ | 416 | $ | 447 | |||||||||||||||||||||
The Company recorded approximately $13 million and $26 million of amortization expense related to definite-lived intangible assets for the three-month and six-month periods ended June 30, 2014, respectively. The Company currently estimates annual amortization expense to be $50 million for 2014, $49 million for 2015, $49 million for 2016, $47 million for 2017 and $41 million for 2018. Indefinite-lived intangible assets, including goodwill and trade names are not amortized but are tested for impairment at least annually, or earlier when events and circumstances indicate that it is more likely than not that such assets have been impaired.
Goodwill is summarized by product group in the table below.
Climate | Electronics | Total | |||||||||
(Dollars in Millions) | |||||||||||
Balance at December 31, 2013 | $ | 46 | $ | 51 | $ | 97 | |||||
Foreign currency and other | — | (1 | ) | (1 | ) | ||||||
Balance at March 31, 2014 | $ | 46 | $ | 50 | $ | 96 | |||||
Foreign currency and other | — | — | — | ||||||||
Balance at June 30, 2014 | $ | 46 | $ | 50 | $ | 96 | |||||
12
NOTE 10. Debt
The Company’s short and long-term debt consists of the following:
June 30 2014 | December 31 2013 | ||||||
(Dollars in Millions) | |||||||
Short-term debt | |||||||
Current portion of Term Facility | $ | 6 | $ | — | |||
Current portion of other long-term debt | 12 | 2 | |||||
Short-term borrowings | 109 | 104 | |||||
Total short-term debt | $ | 127 | $ | 106 | |||
Long-term debt | |||||||
6.75% Senior notes due April 15, 2019 | $ | — | $ | 396 | |||
Term Facility due April 9, 2021 | 585 | — | |||||
HVCC USD term loan due May 30, 2016 | 100 | 100 | |||||
HVCC KRW term loan due May 30, 2016 | 99 | 95 | |||||
Other | 17 | 33 | |||||
Total long-term debt | $ | 801 | $ | 624 | |||
On April 9, 2014, the Company entered into a new credit agreement (the “Credit Agreement”), by and among the Company as borrower, each lender from time to time party thereto, each letter of credit issuer from time to time party thereto and Citibank, N.A. as administrative agent (the “Administrative Agent”), which provides for (i) delayed draw term loans in an aggregate principal of $600 million (the “Term Facility”) and (ii) a $200 million revolving credit facility (the “Revolving Facility”). The Company and certain of its subsidiaries have granted a security interest in substantially all of their respective property, subject to certain limitations.
At the Company’s option, loans under the Term Facility and Revolving Facility may be maintained from time to time at an interest rate equal to the applicable rate (“Applicable Rate”) plus the applicable domestic rate (“Base Rate”) or the LIBOR-based rate (“Eurodollar Rate”). The Base Rate shall be a fluctuating rate per annum equal to the highest of (i) the rate equal to the weighted average of the rates on overnight federal funds transactions with members of the Federal Reserve System arranged by federal funds brokers, as published by the Federal Reserve Bank of New York on the following Business Day, plus 0.50%; (ii) the rate established by the Administrative Agent as its “prime rate” at its principal U.S. office and (iii) the Eurodollar Rate (which, for the purposes of establishing the Base Rate, shall not be less than 0.75%) plus 1%. The Eurodollar Rate shall be equal to the quotient obtained by dividing (a) the ICE Benchmark Administration Limited LIBOR Rate by (b) the difference between 1.00 and the reserve percentage under regulations issued from time to time by the Board of Governors of the Federal Reserve System of the United States for determining the maximum reserve requirement with respect to Eurocurrency funding. The Applicable Rate varies based on certain corporate credit ratings at the time of borrowing, and ranges from 1.00% to 1.75% for Base Rate loans and 2.00% to 2.75% for Eurodollar Rate loans.
Up to $75 million of the Revolving Facility is available for the issuance of letters of credit, and any such issuance of letters of credit will reduce the amount available for loans under the Revolving Facility. Up to $20 million of the Revolving Facility is available for swing line advances, and any such swing line advances will reduce the amount available for loans under the Revolving Facility. The Company may request increases in the limits under the Term Facility and the Revolving Facility and may request the addition of one or more term loan facilities under the Credit Agreement.
The Term Facility shall mature on April 9, 2021 (the “Term Facility Maturity Date”), and the Revolving Facility shall mature on April 9, 2019 (the “Revolving Facility Maturity Date”). Loans made under the Term Facility are due and payable in full on the Term Facility Maturity Date. Loans made under the Revolving Facility are due and payable in full on the Revolving Facility Maturity Date. Outstanding borrowings may be prepaid without penalty (other than borrowings made for the purpose of reducing the effective interest rate margin or weighted average yield of the loans) in $100,000 increments over $500,000 for loans maintained under the Base Rate and in $250,000 increments over $1,000,000 for loans maintained under the Eurodollar Rate. In the event the Company makes a prepayment of the term loans in connection with a repricing transaction at any time prior to the six month anniversary of the closing date, the Company must pay a prepayment premium equal to 1.0% of the principal amount of term loans prepaid or repaid to the applicable lenders under the Term Facility. There are mandatory prepayments of principal in connection with: (i) excess cash flow sweeps (in the amount of 50%, with step downs to 25% and 0% of the excess cash flow, depending on
13
the then-applicable leverage), (ii) certain asset sales or other dispositions (including as a result of casualty or condemnation), (iii) certain refinancings of indebtedness and (iv) over-advances under the Revolving Facility. The Company is also required to repay quarterly 0.25% of the initial term loan drawn.
The Credit Agreement requires the Company and its subsidiaries to comply with customary affirmative and negative covenants, including financial covenants and contains customary events of default. The Term Facility and the Revolving Facility require that, as of the last day of any four consecutive fiscal quarters of the Company last ended (commencing as of June 30, 2014), the Company maintain a total net leverage ratio no greater than 3.00:1.00 (the “Financial Maintenance Covenant”). During any period when the Company’s corporate and family ratings meet certain specified ratings, certain of the negative covenants shall be suspended and the Financial Maintenance Covenant shall only be tested with respect to the Revolving Facility. As of June 30, 2014, the Company was in compliance with the Financial Maintenance Covenant.
All obligations under the Credit Agreement and obligations in respect of certain cash management services and swap agreements with the lenders and their affiliates are unconditionally guaranteed by certain of the Company’s subsidiaries. In connection with the Credit Agreement, on April 9, 2014, (i) the Company, certain of its subsidiaries and the Administrative Agent entered into a Security Agreement (the “Security Agreement”), (ii) certain subsidiaries of the Company and the Administrative Agent entered into a Guaranty Agreement (the “Guaranty Agreement”) and (iii) the Company, certain of its subsidiaries and the Administrative Agent entered into an Intellectual Property Security Agreement (the “Intellectual Property Security Agreement” and, together with the Security Agreement and the Guaranty Agreement, the “Security Documents”). Pursuant to the Security Documents, all obligations under the Credit Agreement are secured by a first-priority perfected lien (subject to certain exceptions) in substantially all of the property of the Company and the subsidiaries party to the Security Agreement, subject to certain limitations.
In connection with signing of the Credit Agreement, on April 9, 2014, the Company terminated its $130 million revolving loan credit agreement dated October 1, 2010.
On June 23, 2014, the Company drew the $600 million term loan, net of an original issue discount of $9 million. As of June 30, 2014, $600 million was outstanding under the Term Facility, and there were no outstanding borrowings under the Revolving Facility.
6.75% Senior Notes Due April 15, 2019
The Company's 6.75% senior notes due April 15, 2019 (the"Senior Notes"), were issued under an Indenture (the “Indenture”) among the Company, the subsidiary guarantors named therein, and The Bank of New York Mellon Trust Company, N.A., as trustee. The Indenture and the form of Senior Notes provide, among other things, that prior to April 15, 2014, the Company had the option to redeem up to 10% of the Senior Notes during any 12-month period from the issue date until April 15, 2014, for a 103% redemption price, plus accrued and unpaid interest to the redemption date. On April 10, 2014, the Company exercised this right and redeemed $50 million, or 10%, of its Senior Notes. Additionally, the Company had the option to redeem a portion or all of the Senior Notes beginning on April 15, 2014, for a 105.063% redemption price, plus accrued and unpaid interest to the redemption date. On April 9, 2014, the Company exercised this right and issued a call notice and redeemed the remaining $350 million of its Senior Notes on May 9, 2014. The Company recorded a $23 million loss on extinguishment of debt in the three months ended June 30, 2014 related to the premium paid on the debt redemption and unamortized original issue discount, debt fees and other debt issue costs associated with the Senior Notes.
HVCC Term Loans
During the first quarter of 2013, HVCC entered into and fully drew on two unsecured bilateral term loan credit agreements with aggregate available borrowings of approximately $195 million. As of June 30, 2014, the U.S. dollar ("USD") equivalent of these agreements was $199 million. Both credit agreements mature in May 2016, and are subject to financial covenants requiring total debt to EBITDA of not greater than 3.2x and a net interest coverage test of more than 3x. The Company was in compliance with such covenants at June 30, 2014.
Short-term debt
Short-term borrowings are primarily related to the Company's non-U.S. operations and are payable in various currencies. As of June 30, 2014, the Company had international affiliate short-term borrowings of $109 million, approximately $83 million of which is related to HVCC. As of December 31, 2013, the Company had international affiliate short-term borrowings of $104 million, approximately $68 million of which is related to HVCC. These borrowings are payable in both USD and non-U.S. currencies including, but not limited to, the Euro, Korean Won, Turkish Lira, and Chinese Yuan.
14
Short-term borrowings at December 31, 2013 include an arrangement, through a subsidiary in France, to sell accounts receivable with recourse on an uncommitted basis. The amount of financing available is dependent on the amount of receivables less customary reserves. The Company pays a 25 basis points servicing fee on all receivables sold, as well as a financing fee of three-month Euribor plus 95 basis points on the advanced portion. Outstanding borrowings under the facility at June 30, 2014 were $31 million with $47 million of receivables pledged as security, both of which were classified as held for sale. At December 31, 2013, there were $31 million outstanding borrowings under the facility with $52 million of receivables pledged as security.
NOTE 11. Employee Benefit Plans
Defined Benefit Plans
The Company's net periodic benefit costs for the three-month periods ended June 30, 2014 and 2013 were as follows:
U.S. Plans | Non-U.S. Plans | ||||||||||||||
2014 | 2013 | 2014 | 2013 | ||||||||||||
(Dollars in Millions) | |||||||||||||||
Costs Recorded in Income | |||||||||||||||
Service cost | $ | — | $ | — | $ | 6 | $ | 6 | |||||||
Interest cost | 13 | 12 | 6 | 7 | |||||||||||
Expected return on plan assets | (16 | ) | (15 | ) | (4 | ) | (5 | ) | |||||||
Net pension (income) expense | $ | (3 | ) | $ | (3 | ) | $ | 8 | $ | 8 | |||||
The Company's net periodic benefit costs for the six-month periods ended June 30, 2014 and 2013 were as follows:
U.S. Plans | Non-U.S. Plans | ||||||||||||||
2014 | 2013 | 2014 | 2013 | ||||||||||||
(Dollars in Millions) | |||||||||||||||
Costs Recorded in Income | |||||||||||||||
Service cost | $ | — | $ | — | $ | 12 | $ | 12 | |||||||
Interest cost | 25 | 24 | 12 | 14 | |||||||||||
Expected return on plan assets | (31 | ) | (31 | ) | (8 | ) | (10 | ) | |||||||
Amortization of actuarial losses | — | — | 1 | 1 | |||||||||||
Net pension (income) expense | $ | (6 | ) | $ | (7 | ) | $ | 17 | $ | 17 | |||||
During the six-month period ended June 30, 2014, the Company made cash contributions to non-U.S. defined benefit pension plans of $13 million. During 2014, the Company expects to make additional cash contributions to its U.S. and non-U.S. defined benefit pension plans of $5 million and $29 million, respectively. The Company’s expected 2014 contributions may be revised.
Defined Contribution Plans
Most U.S. salaried employees and certain non-U.S. employees are eligible to participate in defined contribution plans by contributing a portion of their compensation, which is partially matched by the Company. The expense related to matching contributions was approximately $3 million and $2 million for the three-month periods ended June 30, 2014 and 2013, respectively. The expense related to matching contributions was approximately $8 million and $6 million for the six-month periods ended June 30, 2014 and 2013, respectively.
Annuity Purchase
On July 16, 2014, the Company entered into an agreement to transfer certain U.S. pension assets to Prudential Insurance Company of America, to settle approximately $350 million of its U.S. outstanding pension obligation. The Company expects to record a settlement gain estimated to be approximately $20 million during the three months ending September 30, 2014.
15
NOTE 12. Income Taxes
During the three and six-month periods ended June 30, 2014, the Company recorded income tax provisions of $41 million and $72 million, respectively, which includes income tax expense in countries where the Company is profitable, withholding taxes, changes in uncertain tax benefits, and the inability to record a tax benefit for pre-tax losses in the U.S. and certain other jurisdictions to the extent not offset by other categories of income. Pre-tax losses from continuing operations in jurisdictions where valuation allowances are maintained and no income tax benefits are recognized totaled $64 million and $31 million, for the three months ended June 30, 2014 and 2013, respectively, resulting in an increase in the Company's effective tax rate in those years. The Company provides for U.S. and non-U.S. income taxes and non-U.S. withholding taxes on the projected future repatriations of the earnings from its non-U.S. operations that are not considered permanently reinvested at each tier of the legal entity structure. During the three-month periods ended June 30, 2014 and 2013, the Company recognized expense of $2 million and $8 million, respectively, reflecting the Company's forecasts which contemplate numerous financial and operational considerations that impact future repatriations.
The Company's provision for income taxes in interim periods is computed by applying an estimated annual effective tax rate against income before income taxes, excluding equity in net income of non-consolidated affiliates for the period. Effective tax rates vary from period to period as separate calculations are performed for those countries where the Company's operations are profitable and whose results continue to be tax-effected and for those countries where full deferred tax valuation allowances exist and are maintained. The Company is also required to record the tax impact of certain other non-recurring tax items, including changes in judgments about valuation allowances and effects of changes in tax laws or rates, in the interim period in which they occur.
The need to maintain valuation allowances against deferred tax assets in the U.S. and other affected countries will continue to cause variability in the Company's quarterly and annual effective tax rates. Full valuation allowances against deferred tax assets in the U.S. and applicable foreign countries will be maintained until sufficient positive evidence exists to reduce or eliminate them. The factors considered by management in its determination of the probability of the realization of the deferred tax assets include, but are not limited to, recent adjusted historical financial results, historical taxable income, projected future taxable income, the expected timing of the reversals of existing temporary differences and tax planning strategies. If, based upon the weight of available evidence, it is more likely than not the deferred tax assets will not be realized, a valuation allowance is recorded.
Unrecognized Tax Benefits
Gross unrecognized tax benefits were $83 million at June 30, 2014, and $73 million at December 31, 2013, of which approximately $39 million and $30 million, respectively, represent the amount of unrecognized tax benefits that, if recognized, would impact the effective tax rate. The gross unrecognized tax benefit differs from that which would impact the effective tax rate due to uncertain tax positions embedded in other deferred tax attributes carrying a full valuation allowance. Since the uncertainty is expected to be resolved while a full valuation allowance is maintained, these uncertain tax positions should not impact the effective tax rate in current or future periods. During the three-month period ended June 30, 2014, the Company increased its gross unrecognized tax benefits to reflect the remeasurement of prior year uncertain tax positions as a result of completed reviews with updated financial and other measurement criteria in connection with certain incentives received by the Company's affiliates in Asia. The Company records interest and penalties on uncertain tax positions as a component of income tax expense and related amounts accrued at June 30, 2014 and December 31, 2013 were $27 million and $23 million, respectively.
With few exceptions, the Company is no longer subject to U.S. federal tax examinations for years before 2009 or state and local, or non-U.S. income tax examinations for years before 2003. Although it is not possible to predict the timing of the resolution of all ongoing tax audits with accuracy, it is reasonably possible that certain tax proceedings in Asia (including Korea) could conclude within the next twelve months and result in a significant increase or decrease in the balance of gross unrecognized tax benefits. Given the number of years, jurisdictions and positions subject to examination, the Company is unable to estimate the full range of possible adjustments to the balance of unrecognized tax benefits.
16
A reconciliation of unrecognized tax benefits, including amounts attributable to discontinued operations, is as follows:
Six Months Ended June 30, 2014 | |||
(Dollars in Millions) | |||
Beginning balance | $ | 73 | |
Additions to tax positions related to current period | 4 | ||
Additions to tax positions related to prior periods | 7 | ||
Settlements with tax authorities | (1 | ) | |
Ending balance | $ | 83 | |
During 2012, South Korean tax authorities commenced a review of the Company's South Korean affiliates (including Halla) for tax years 2007 through 2012, and issued formal notice of assessments, including penalties, of approximately $25 million for alleged underpayment of withholding tax on dividends paid and other items, including certain management service fees charged by Visteon. The Company's South Korean affiliates have paid approximately $25 million to the tax authorities in 2013 and 2012, as required under South Korean tax regulations, to pursue the appeals process. The Company believes that it is more likely than not that it will receive a favorable ruling when all of the available appeals have been exhausted.
During 2012, Brazilian tax authorities issued tax assessment notices to Visteon Sistemas Automotivos (“Sistemas”) of approximately $15 million related to the sale of its chassis business to a third party. During 2013, after attempts to reopen an appeal of the administrative decision failed, Sistemas opened a judicial proceeding against the government to address the notice which required a deposit in the amount of the assessment in order to suspend the debt and allow Sistemas to operate regularly before the tax authorities. The Company believes that the risk of a negative outcome is remote once the matter is fully litigated at the highest judicial level. These appeal payments in South Korea and Brazil, as well as contingent income tax refund claims associated with other jurisdictions, including applicable accrued interest income, totaled $48 million as of June 30, 2014, and were included in Other non-current assets on the consolidated balance sheet.
NOTE 13. Stockholders’ Equity and Non-controlling Interests
Changes in equity attributable to Visteon and equity attributable to non-controlling interests ("NCI") for the three months ended June 30, 2014 and 2013 are as follows:
2014 | 2013 | ||||||||||||||||||||||
Visteon | NCI | Total | Visteon | NCI | Total | ||||||||||||||||||
(Dollars in Millions) | |||||||||||||||||||||||
Three Months Ended June 30: | |||||||||||||||||||||||
Stockholders' equity beginning balance | $ | 1,931 | $ | 912 | $ | 2,843 | $ | 1,306 | $ | 733 | $ | 2,039 | |||||||||||
Net income from continuing operations | (2 | ) | 26 | 24 | 62 | 20 | 82 | ||||||||||||||||
Net (loss) income from discontinued operations | (153 | ) | (12 | ) | (165 | ) | 3 | 1 | 4 | ||||||||||||||
Net (loss) income | (155 | ) | 14 | (141 | ) | 65 | 21 | 86 | |||||||||||||||
Other comprehensive income (loss) | |||||||||||||||||||||||
Foreign currency translation adjustments | 17 | 7 | 24 | (23 | ) | (10 | ) | (33 | ) | ||||||||||||||
Benefit plans | — | — | — | 1 | 2 | 3 | |||||||||||||||||
Unrealized hedging gains | 7 | 3 | 10 | (5 | ) | (1 | ) | (6 | ) | ||||||||||||||
Total other comprehensive income (loss) | 24 | 10 | 34 | (27 | ) | (9 | ) | (36 | ) | ||||||||||||||
Stock-based compensation, net | 11 | — | 11 | 5 | — | 5 | |||||||||||||||||
Warrant exercises | — | — | — | 3 | — | 3 | |||||||||||||||||
Share repurchase | (500 | ) | — | (500 | ) | — | — | — | |||||||||||||||
Dividends declared to non-controlling interests | — | (26 | ) | (26 | ) | — | — | — | |||||||||||||||
Stockholders' equity ending balance | $ | 1,311 | $ | 910 | $ | 2,221 | $ | 1,352 | $ | 745 | $ | 2,097 | |||||||||||
17
Changes in equity attributable to Visteon and equity attributable to non-controlling interests ("NCI") for the six months ended June 30, 2014 and 2013 are as follows:
2014 | 2013 | ||||||||||||||||||||||
Visteon | NCI | Total | Visteon | NCI | Total | ||||||||||||||||||
(Dollars in Millions) | |||||||||||||||||||||||
Six Months Ended June 30: | |||||||||||||||||||||||
Stockholders' equity beginning balance | $ | 1,920 | $ | 953 | $ | 2,873 | $ | 1,385 | $ | 756 | $ | 2,141 | |||||||||||
Net income from continuing operations | 24 | 54 | 78 | 132 | 34 | 166 | |||||||||||||||||
Net (loss) income from discontinued operations | (160 | ) | (11 | ) | (171 | ) | 2 | 2 | 4 | ||||||||||||||
Net (loss) income | (136 | ) | 43 | (93 | ) | 134 | 36 | 170 | |||||||||||||||
Other comprehensive income (loss) | |||||||||||||||||||||||
Foreign currency translation adjustments | 6 | (1 | ) | 5 | (54 | ) | (20 | ) | (74 | ) | |||||||||||||
Benefit plans | 1 | — | 1 | 10 | — | 10 | |||||||||||||||||
Unrealized hedging gains | 5 | 2 | 7 | (11 | ) | (5 | ) | (16 | ) | ||||||||||||||
Total other comprehensive income (loss) | 12 | 1 | 13 | (55 | ) | (25 | ) | (80 | ) | ||||||||||||||
Stock-based compensation, net | 15 | — | 15 | 10 | — | 10 | |||||||||||||||||
Warrant exercises | — | — | — | 3 | — | 3 | |||||||||||||||||
Share repurchase | (500 | ) | — | (500 | ) | (125 | ) | — | (125 | ) | |||||||||||||
Dividends declared to non-controlling interests | — | (87 | ) | (87 | ) | — | (22 | ) | (22 | ) | |||||||||||||
Stockholders' equity ending balance | $ | 1,311 | $ | 910 | $ | 2,221 | $ | 1,352 | $ | 745 | $ | 2,097 | |||||||||||
Non-controlling Interests
NCI in the Visteon Corporation economic entity are as follows:
June 30 | December 31 | ||||||
2014 | 2013 | ||||||
(Dollars in Millions) | |||||||
HVCC | $ | 777 | $ | 777 | |||
YFVE | 104 | 139 | |||||
Visteon Interiors Korea, Ltd. | 14 | 22 | |||||
Other | 15 | 15 | |||||
Total non-controlling interests | $ | 910 | $ | 953 | |||
On June 30, 2014, HVCC agreed to purchase the automotive thermal and emissions product line of Cooper-Standard Automotive Inc., a subsidiary of Cooper-Standard Holdings Inc., to expand its thermal energy management product portfolio and further diversify its customer base. The cash transaction, valued at $46 million and subject to adjustment and certain regulatory and other approvals, is targeted for completion in the third quarter of 2014.
HVCC, a 70% owned subsidiary of Visteon, declared a dividend of $97 million during the three months ended March 31, 2014, of which, $29 million was attributable to NCI in HVCC. During 2014 and in connection with the Master Agreement, YFVE, a 51% owned subsidiary of Visteon, declared a dividend of $89 million, of which, $44 million was attributable to NCI in YFVE. HVCC Beijing, an 80% owned subsidiary of HVCC, declared and paid a dividend of $60 million during 2014, of which, $12 million was attributable to non-controlling ownership interests. HVCC Nanchang, an 80% owned subsidiary of HVCC, declared a dividend of $10 million during 2014, of which, $2 million was attributable to non-controlling ownership interests.
Stock Options
During the three and six month periods ended June 30, 2014, the Company received payments of $8 million and $10 million related to the exercise of 98,337 and 121,942 stock options, respectively.
Share Repurchase Program
Since July 2012, the Company's board of directors has authorized a total of $1.175 billion in share repurchases. On May 8, 2014, the Company announced an accelerated stock buyback ("ASB") program with a third-party financial institution to purchase shares of common stock for an aggregate purchase price of $500 million. Under the program, the Company paid the financial institution $500 million and received an initial delivery of 3,394,157 shares of common stock using a reference price of $92.07, and an additional delivery of 1,129,001 shares of common stock following the conclusion of the hedge period which determined a certain minimum amount of shares guaranteed under a portion of the program that had a maximum per share price of $100.54. The final settlement will be generally based on the volume-weighted average price of the Company's common stock over a period of up to approximately 12 months, less a negotiated discount, 50 percent of which will be subject to a maximum per share price. As of June 30, 2014, $375 million remained authorized and available for repurchase through December 31, 2015. The Company anticipates that additional repurchases of common stock, if any, would occur from time to time in open market transactions or in privately negotiated transactions depending on market and economic conditions, share price, trading volume, alternative uses of capital and other factors.
Accumulated Other Comprehensive Income (loss)
Changes in Accumulated other comprehensive income (loss) (“AOCI”) and reclassifications out of AOCI by component includes:
Three Months Ended | Six Months Ended | ||||||||||||||
June 30 | June 30 | ||||||||||||||
2014 | 2013 | 2014 | 2013 | ||||||||||||
(Dollars in Millions) | |||||||||||||||
Changes in AOCI: | |||||||||||||||
Beginning balance | $ | (24 | ) | $ | (118 | ) | $ | (12 | ) | $ | (90 | ) | |||
Other comprehensive income (loss) before reclassification, net of tax | 35 | (27 | ) | 22 | (50 | ) | |||||||||
Amounts reclassified from AOCI | (11 | ) | — | (10 | ) | (5 | ) | ||||||||
Ending balance | $ | — | $ | (145 | ) | $ | — | $ | (145 | ) | |||||
Changes in AOCI by component: | |||||||||||||||
Foreign currency translation adjustments | |||||||||||||||
Beginning balance | $ | (48 | ) | $ | (20 | ) | $ | (37 | ) | $ | 11 | ||||
Other comprehensive income (loss) before reclassification, net of tax | 17 | (22 | ) | 6 | (52 | ) | |||||||||
Amounts reclassified from AOCI (a) | — | (1 | ) | — | (2 | ) | |||||||||
Ending balance | (31 | ) | (43 | ) | (31 | ) | (43 | ) | |||||||
Benefit plans | |||||||||||||||
Beginning balance | 26 | (99 | ) | 25 | (108 | ) | |||||||||
Other comprehensive income before reclassification, net of tax (b) | — | 1 | — | 9 | |||||||||||
Amounts reclassified from AOCI (c) | — | — | 1 | 1 | |||||||||||
Ending balance | 26 | (98 | ) | 26 | (98 | ) | |||||||||
Unrealized hedging gains (loss) | |||||||||||||||
Beginning balance | (2 | ) | 1 | — | 7 | ||||||||||
Other comprehensive income (loss) before reclassification, net of tax (d) | 18 | (6 | ) | 16 | (7 | ) | |||||||||
Amounts reclassified from AOCI (e) | (11 | ) | 1 | (11 | ) | (4 | ) | ||||||||
Ending balance | 5 | (4 | ) | 5 | (4 | ) | |||||||||
AOCI ending balance | $ | — | $ | (145 | ) | $ | — | $ | (145 | ) | |||||
(a) Amount included in Other expenses in Consolidated Statements of Comprehensive (Loss) Income.
(b) Net tax expense of $0 million and $1 million are related to benefit plans for the three months ended June 30, 2014 and 2013, respectively. Net tax expense of $0 million and $3 million are related to benefit plans for the six months ended June 30, 2014 and 2013, respectively.
(c) Amount included in the computation of net periodic pension cost. See Note 11 Employee benefit plans for additional details.
(d) Net tax expense (benefit) of $3 million and $(2) million are related to unrealized hedging gains (loss) for the three months ended June 30, 2014 and 2013, respectively. Net tax expense (benefit) of $2 million and $(5) million are related to unrealized hedging gains (loss) for the six months ended June 30, 2014 and 2013, respectively.
(e) Amount is included in Cost of sales in Consolidated Statements of Comprehensive (Loss) Income.
NOTE 14. Earnings Per Share
The Company uses the two-class method in computing basic and diluted earnings per share. Basic earnings per share is calculated by dividing net income attributable to Visteon, after deducting undistributed income allocated to participating securities, by the weighted average number of shares of common stock outstanding. Diluted earnings per share is computed by dividing net income by the weighted average number of common and potential dilutive common shares outstanding after deducting undistributed income allocated to participating securities. Performance based share units are considered contingently issuable shares, and are included in the computation of diluted earnings per share based on the number of shares that would be issuable if the reporting date were the end of the contingency period and if the result would be dilutive.
The table below provides details underlying the calculations of basic and diluted (loss) earnings per share:
Three Months Ended June 30 | Six Months Ended June 30 | ||||||||||||||
2014 | 2013 | 2014 | 2013 | ||||||||||||
(In Millions, Except Per Share Amounts) | |||||||||||||||
Numerator: | |||||||||||||||
(Loss) income from continuing operations | $ | (2 | ) | $ | 62 | $ | 24 | $ | 132 | ||||||
(Loss) income from discontinued operations | (153 | ) | 3 | (160 | ) | 2 | |||||||||
Net (loss) income attributable to Visteon Corporation | $ | (155 | ) | $ | 65 | $ | (136 | ) | $ | 134 | |||||
Denominator: | |||||||||||||||
Average common stock outstanding - basic | 46.2 | 50.0 | 47.1 | 50.8 | |||||||||||
Dilutive effect of warrants and performance stock units | — | 0.5 | 1.3 | 0.5 | |||||||||||
Diluted shares | 46.2 | 50.5 | 48.4 | 51.3 | |||||||||||
Basic and Diluted (Loss) Earnings Per Share Data: | |||||||||||||||
Basic (loss) earnings per share attributable to Visteon: | |||||||||||||||
Continuing operations | $ | (0.04 | ) | $ | 1.24 | $ | 0.51 | $ | 2.60 | ||||||
Discontinued operations | (3.31 | ) | 0.06 | (3.40 | ) | 0.04 | |||||||||
Basic (loss) earnings per share attributable to Visteon | $ | (3.35 | ) | $ | 1.30 | $ | (2.89 | ) | $ | 2.64 | |||||
Diluted (loss) earnings per share attributable to Visteon: | |||||||||||||||
Continuing operations | $ | (0.04 | ) | $ | 1.23 | $ | 0.49 | $ | 2.57 | ||||||
Discontinued operations | (3.31 | ) | 0.06 | (3.30 | ) | 0.04 | |||||||||
Diluted (loss) earnings per share attributable to Visteon | $ | (3.35 | ) | $ | 1.29 | $ | (2.81 | ) | $ | 2.61 | |||||
The effect of certain common stock equivalents including warrants, performance-based share units, and stock options were excluded from the computation of weighted average diluted shares outstanding as inclusion of such items would be anti-dilutive, summarized
below. All common stock equivalents were dilutive in the six months ended June 30, 2014.
Three Months Ended June 30 | Three Months Ended June 30 | Six Months Ended June 30 | |||||||||||||||||||||
2014 | 2013 | 2013 | |||||||||||||||||||||
(In Millions, Except Per Share Amounts) | |||||||||||||||||||||||
Number of warrants | 0.5 | — | 1.5 | ||||||||||||||||||||
Exercise price | $58.80 | $— | $58.80 | ||||||||||||||||||||
Number of performance stock units | 0.8 | — | — | ||||||||||||||||||||
Number of stock options | — | 0.3 | 0.3 | ||||||||||||||||||||
Exercise price | $ | — | - | $ | — | $ | 44.55 | - | $ | 74.08 | $ | 44.55 | - | $ | 74.08 | ||||||||
20
NOTE 15. Fair Value Measurements and Financial Instruments
Financial assets and liabilities are categorized, based on the inputs to the valuation technique, into a three-level fair value hierarchy. The fair value hierarchy gives the highest priority to the quoted prices in active markets for identical assets and liabilities and lowest priority to unobservable inputs.
The three-levels of the fair value hierarchy are as follows:
• | Level 1 – Financial assets and liabilities whose values are based on unadjusted quoted market prices for identical assets and liabilities in an active market that the Company has the ability to access. |
• | Level 2 – Financial assets and liabilities whose values are based on quoted prices in markets that are not active or model inputs that are observable for substantially the full term of the asset or liability. |
• | Level 3 – Financial assets and liabilities whose values are based on prices or valuation techniques that require inputs that are both unobservable and significant to the overall fair value measurement. |
The Company's fair value of debt excluding debt included in Liabilities held for sale was approximately $924 million and $755 million at June 30, 2014 and December 31, 2013, respectively. Fair value estimates were based on quoted market prices or current rates for the same or similar issues, or on the current rates offered to the Company for debt of the same remaining maturities. Accordingly, the Company's debt is classified as Level 1, "Market Prices" and Level 2, "Other Observable Inputs" in the fair value hierarchy, respectively.
Financial Instruments
The Company’s net cash inflows and outflows exposed to the risk of changes in foreign currency exchange rates arise from the sale of products in countries other than the manufacturing source, foreign currency denominated supplier payments, debt and other payables, subsidiary dividends and investments in subsidiaries. Where possible, the Company utilizes derivative financial instruments, including forward and option contracts, to protect the Company’s cash flow from changes in exchange rates. Foreign currency exposures are reviewed monthly and any natural offsets are considered prior to entering into a derivative financial instrument. The Company’s primary hedged foreign currency exposures include the Euro, Korean Won, Czech Koruna, Hungarian Forint, Indian Rupee and Mexican Peso. Where possible, the Company utilizes a strategy of partial coverage for transactions in these currencies.
As of June 30, 2014 and December 31, 2013, the Company had forward contracts to hedge changes in foreign currency exchange rates with notional amounts of approximately $457 million and $625 million, respectively. Fair value estimates of these contracts are based on quoted market prices and other observable inputs. A portion of these instruments have been designated as cash flow hedges with the effective portion of the gain or loss reported in the AOCI component of Stockholders’ equity in the Company’s consolidated balance sheets. The ineffective portion of these instruments is recorded as Cost of sales in the Company’s consolidated statements of comprehensive (loss) income.
Foreign currency hedge instruments are measured at fair value on a recurring basis under an income approach using industry-standard models that consider various assumptions, including time value, volatility factors, current market and contractual prices for the under lying and non-performance risk. Substantially all of these assumptions are observable in the marketplace throughout the full term of the instrument, can be derived from observable data, or are supported by observable levels at which transactions are executed in the marketplace. Accordingly, the Company's foreign currency instruments are classified as Level 2, "Other Observable Inputs" in the fair value hierarchy.
21
Financial Statement Presentation
The Company presents its derivative positions and any related material collateral under master netting agreements on a net basis. Derivative financial instruments designated and non-designated as hedging instruments are included in the Company’s consolidated balance sheets at June 30, 2014 and December 31, 2013, as follows:
Assets | Liabilities | |||||||||||||||||||
Risk Hedged | Classification | June 30 2014 | December 31 2013 | Classification | June 30 2014 | December 31 2013 | ||||||||||||||
(Dollars in Millions) | ||||||||||||||||||||
Designated | ||||||||||||||||||||
Foreign currency | Other current assets | $ | 12 | $ | 4 | Other current assets | $ | 1 | $ | — | ||||||||||
Foreign currency | Other current liabilities | — | 2 | Other current liabilities | — | 4 | ||||||||||||||
Non-designated | ||||||||||||||||||||
Foreign currency | Other current assets | 6 | 3 | Other current assets | — | 1 | ||||||||||||||
$ | 18 | $ | 9 | $ | 1 | $ | 5 | |||||||||||||
Gross Amount Recognized | Gross Amount Offset in the Statement of Financial Position | Net Amount Presented in the Statement of Financial Position | ||||||||||||||||||||||
June 30 | December 31 | June 30 | December 31 | June 30 | December 31 | |||||||||||||||||||
Foreign currency derivatives | 2014 | 2013 | 2014 | 2013 | 2014 | 2013 | ||||||||||||||||||
(Dollars in Millions) | ||||||||||||||||||||||||
Assets | ||||||||||||||||||||||||
Designated | $ | 12 | $ | 4 | $ | 1 | $ | — | $ | 11 | $ | 4 | ||||||||||||
Non-designated | 6 | 3 | — | 1 | 6 | 2 | ||||||||||||||||||
$ | 18 | $ | 7 | $ | 1 | $ | 1 | $ | 17 | $ | 6 | |||||||||||||
Liabilities | ||||||||||||||||||||||||
Designated | $ | — | $ | 4 | $ | — | $ | 2 | $ | — | $ | 2 | ||||||||||||
$ | — | $ | 4 | $ | — | $ | 2 | $ | — | $ | 2 | |||||||||||||
Gains and losses on derivative financial instruments recorded in Cost of sales for the three and six-month periods ended June 30, 2014 and 2013, were as follows:
Recorded in AOCI, net of tax | Reclassified from AOCI into Income | Recorded in Income | |||||||||||||||||||||
2014 | 2013 | 2014 | 2013 | 2014 | 2013 | ||||||||||||||||||
(Dollars in Millions) | |||||||||||||||||||||||
Three Months Ended June 30: | |||||||||||||||||||||||
Cash flow hedges | $ | 7 | $ | (5 | ) | $ | 11 | $ | (1 | ) | $ | — | $ | — | |||||||||
Non-designated cash flow hedges | — | — | — | — | 1 | — | |||||||||||||||||
$ | 7 | $ | (5 | ) | $ | 11 | $ | (1 | ) | $ | 1 | $ | — | ||||||||||
Six Months Ended June 30: | |||||||||||||||||||||||
Cash flow hedges | $ | 5 | $ | (11 | ) | $ | 11 | $ | 4 | $ | — | $ | — | ||||||||||
Non-designated cash flow hedges | — | — | — | — | (1 | ) | 1 | ||||||||||||||||
$ | 5 | $ | (11 | ) | $ | 11 | $ | 4 | $ | (1 | ) | $ | 1 | ||||||||||
22
Concentrations of Credit Risk
Financial instruments including cash equivalents, marketable securities, derivative contracts, and accounts receivable, expose the Company to counter-party credit risk for non-performance. The Company’s counterparties for cash equivalents, marketable securities and derivative contracts are banks and financial institutions that meet the Company’s requirement of high credit standing. The Company’s counterparties for derivative contracts are investment and commercial banks with significant experience using such derivatives. The Company manages its credit risk through policies requiring minimum credit standing and limiting credit exposure to any one counter-party and through monitoring counter-party credit risks. The Company’s concentration of credit risk related to derivative contracts at June 30, 2014 and December 31, 2013, is not material. With the exceptions below, the Company’s credit risk with any individual customer does not exceed ten percent of total accounts receivable at June 30, 2014 and December 31, 2013, respectively.
June 30 2014 | December 31 2013 | ||
Ford and its affiliates | 24% | 20% | |
Hyundai Mobis Company | 15% | 15% | |
Hyundai Motor Company | 10% | 9% | |
Management periodically performs credit evaluations of its customers and generally does not require collateral.
Items Measured at Fair Value on a Non-recurring Basis
In addition to items that are measured at fair value on a recurring basis, the Company measures certain assets and liabilities at fair value on a non-recurring basis. As further described in Note 2, "Interiors Transaction", the fair value of the assets and liabilities subject to the Interiors Transaction was less than the carrying value. As a result, the long-lived assets were reduced to zero and an impairment loss of $173 million was recorded in the three and six month periods ended June 30, 2014. As the impairment was determined using other observable inputs, the fair value measurements are classified within Level 2 of the fair value hierarchy.
NOTE 16. Commitments and Contingencies
Litigation and Claims
In 2003, the Local Development Finance Authority of the Charter Township of Van Buren, Michigan (the “Township”) issued approximately $28 million in bonds maturing in 2032, the proceeds of which were used at least in part to assist in the development of the Company’s U.S. headquarters located in the Township. During January 2010, the Company and the Township entered into a settlement agreement (the “Settlement Agreement”) that, among other things, reduced the taxable value of the headquarters property to current market value and facilitated certain claims of the Township in the Company’s chapter 11 proceedings. The Settlement Agreement also provided that the Company would continue to negotiate in good faith with the Township in the event that property tax payments was inadequate to permit the Township to meet its payment obligations with respect to the bonds. In September 2013, the Township notified the Company in writing that it is estimating a shortfall in tax revenues of between $25 million and $36 million, which could render it unable to satisfy its payment obligations under the bonds, but made no specific monetary demand of the Company. The Company disputes the factual and legal assertions made by the Township and intends to vigorously defend the matter should the Township seek to commence a legal proceeding against the Company. The Company is not able to estimate the possible loss or range of loss in connection with this matter.
On March 29, 2012, the Korean Supreme Court ruled that regular bonuses should be included for purposes of calculating the ordinary wage of applicable employees, which was contrary to previous legal precedent and the position of the Korean Ministry of Employment and Labor. On December 18, 2013, the Korean Supreme Court issued an en banc decision clarifying that (i) regular bonuses should be included for purposes of calculating such ordinary wage, and (ii) certain incentive pay and family allowances may also be included for purposes of calculating such ordinary wage if they were paid to employees as consideration for the labor actually provided by them. The court also indicated that employers could be excused from liability for excluding such regular bonuses from ordinary wages where an express or implied management-labor agreement or practice to exclude such amounts existed and to require such payment would cause “serious managerial difficulty.” The Company is evaluating the potential financial impact of these new court rulings, and is not able to determine at this time whether it will have a material impact on the results of operations and cash flows of its South Korean subsidiaries. In addition, on May 24, 2013, Halla Visteon Climate Control Union in Korea, representing 891 hourly employees of HVCC, filed a legal petition with Seoul Southern District Court, claiming unpaid statutory benefits for the past three years based on the initial Supreme Court ruling. The plaintiffs have informed the court on that
23
they intend to submit a revised claim amount based on the Supreme Court en banc decision. The Company is in the process of evaluating these claims, but at this time is not able to estimate the possible loss or range of loss in connection with this matter.
In November 2013, the Company and HVCC, jointly filed an Initial Notice of Voluntary Self-Disclosure statement with the U.S. Treasury Department’s Office of Foreign Assets Control (“OFAC”) regarding certain sales of automotive HVAC components by a minority-owned, Chinese joint venture of HVCC into Iran. The Company updated that notice in December 2013, and subsequently filed a voluntary self-disclosure regarding these sales with OFAC in March 2014. In May 2014, the Company voluntarily filed a supplementary self-disclosure identifying additional sales of automotive HVAC components by the Chinese joint venture, as well as similar sales involving an HVCC subsidiary in China, totaling approximately $12 million, and requesting additional time to investigate additional Chinese operations of HVCC. OFAC is currently reviewing the results of the Company’s investigation. Following that review, OFAC may conclude that the disclosed sales resulted in violations of U.S. economic sanctions laws and warrant the imposition of civil penalties, such as fines, limitations on our ability to export products from the United States, and/or referral for further investigation by the U.S. Department of Justice. Any such fines or restrictions may be material to the Company’s financial results in the period in which they are imposed. Additionally, disclosure of this conduct and any fines or other action relating to this conduct could harm the Company’s reputation and have a material adverse effect on our business, operating results and financial condition. The Company cannot predict when OFAC will conclude its own review of our voluntary self-disclosures or whether it may impose any of the potential penalties described above.
Toyota Industries Corporation ("TICO") filed a patent infringement claim with the Seoul Central District Court on March 18, 2014, requesting HVCC to discontinue production of its RS compressors and dispose of inventories and manufacturing facilities. HVCC received the original of TICO's claim submission on March 31, 2014, and is planning to file for a patent invalidation trial before the Korean Intellectual Property Tribunal in response. The first court hearing was held in June 2014, and the next hearing is scheduled for August 2014. The Company is in the process of evaluating these claims, but at this time is not able to estimate the possible loss or range of loss in connection with this matter.
The Company's operations in Brazil are subject to highly complex labor, tax, customs and other laws. While the Company believes that it is in compliance with such laws, it is periodically engaged in litigation regarding the application of these laws. As of June 30, 2014, the Company maintained accruals of approximately $10 million for claims aggregating approximately $161 million. The amounts accrued represent claims that are deemed probable of loss and are reasonably estimable based on the Company's assessment of the claims and prior experience with similar matters.
Several current and former employees of Visteon Deutschland GmbH (“Visteon Germany”) filed civil actions against Visteon Germany in various German courts beginning in August 2007, seeking damages for the alleged violation of German pension laws that prohibit the use of pension benefit formulas that differ for salaried and hourly employees without adequate justification. Several of these actions have been joined as pilot cases. In a written decision issued in April 2010, the Federal Labor Court issued a declaratory judgment in favor of the plaintiffs in the pilot cases. To date, more than 750 current and former employees have filed similar actions or have inquired as to or been granted additional benefits, and an additional 600 current and former employees are similarly situated. The Company's remaining reserve for unsettled cases is approximately $8 million and is based on the Company’s best estimate as to the number and value of the claims that will be made in connection with the pension plan. However, the Company’s estimate is subject to many uncertainties which could result in Visteon Germany incurring amounts in excess of the reserved amount of up to approximately $9 million.
On May 28, 2009, the Company filed voluntary petitions in the Court seeking reorganization relief under the provisions of chapter 11 of the Bankruptcy Code and continued to operate as debtors-in-possession until emergence on October 1, 2010. Substantially all pre-petition liabilities and claims relating to rejected executory contracts and unexpired leases have been settled under the plan of reorganization, however, the ultimate amounts to be paid in settlement of each those claims will continue to be subject to the uncertain outcome of litigation, negotiations and Bankruptcy Court decisions for a period of time after the emergence date.
In December of 2009, the Court granted the Debtors' motion in part authorizing them to terminate or amend certain other postretirement employee benefits, including health care and life insurance. On December 29, 2009, the IUE-CWA, the Industrial Division of the Communications Workers of America, AFL-CIO, CLC, filed a notice of appeal of the Court's order with the District Court. By order dated March 31, 2010, the District Court affirmed the Court's order in all respects. On April 1, 2010, the IUE filed a notice of appeal. On July 13, 2010, the Circuit Court reversed the order of the District Court as to the IUE-CWA and directed the District Court to, among other things, direct the Court to order the Company to take whatever action is necessary to immediately restore terminated or modified benefits to their pre-termination/modification levels. On July 27, 2010, the Company filed a Petition for Rehearing or Rehearing En Banc requesting that the Circuit Court review the panel’s decision, which was denied. By orders dated August 30, 2010, the Court ruled that the Company should restore certain other postretirement employee benefits to the
24
appellant-retirees and also to salaried retirees and certain retirees of the International Union, United Automobile, Aerospace and Agricultural Implement Workers of America (“UAW”).
On September 1, 2010, the Company filed a Notice of Appeal to the District Court of the Court's decision to include non-appealing retirees, and on September 15, 2010, the UAW filed a Notice of Cross-Appeal. On July 25, 2012, the District Court ruled in favor of the Company on both appeals, and the UAW has appealed this ruling to the Circuit Court. In May 2014, the Circuit Court heard oral arguments on the appeals. The Company reached an agreement with the original appellants in late-September 2010, which resulted in the Company not restoring other postretirement employee benefits of such retirees. On September 30, 2010, the UAW filed a complaint, which it amended on October 1, 2010, in the United States District Court for the Eastern District of Michigan seeking, among other things, a declaratory judgment to prohibit the Company from terminating certain other postretirement employee benefits for UAW retirees after October 1, 2010. The parties reached a preliminary settlement agreement in January 2013, but it was later terminated by the plaintiffs. On October 22, 2013, the U.S. District Court for the Eastern District of Michigan issued an order denying the Company's motion to dismiss the UAW's complaint and granted its motion to transfer the case to the U.S. District Court for the District of Delaware. The UAW filed a petition for a writ of mandamus with the U.S. Court of Appeals for the Sixth Circuit, requesting the court vacate the transfer of the case. In May 2014, the U.S. Court of Appeals for the Sixth Circuit denied the UAW's petition. The UAW has requested a panel rehearing or rehearing en banc. As of June 30, 2014, the Company maintains an accrual for claims that are deemed probable of loss and are reasonably estimable.
While the Company believes its accruals for litigation and claims are adequate, the final amounts required to resolve such matters could differ materially from recorded estimates and the Company's results of operations and cash flows could be materially affected.
Product Warranty and Recall
Amounts accrued for product warranty and recall claims are based on management’s best estimates of the amounts that will ultimately be required to settle such items. The Company’s estimates for product warranty and recall obligations are developed with support from its sales, engineering, quality and legal functions and include due consideration of contractual arrangements, past experience, current claims and related information, production changes, industry and regulatory developments and various other considerations. The Company can provide no assurances that it will not experience material claims in the future or that it will not incur significant costs to defend or settle such claims beyond the amounts accrued or beyond what the Company may recover from its suppliers.
The following table provides a reconciliation of changes in the product warranty and recall claims liability for the selected periods:
Six Months Ended June 30 | |||||||
2014 | 2013 | ||||||
(Dollars in Millions) | |||||||
Beginning balance | $ | 49 | $ | 57 | |||
Accruals for products shipped | 8 | 8 | |||||
Changes in estimates | — | (3 | ) | ||||
Currency | — | (2 | ) | ||||
Settlements | (8 | ) | (8 | ) | |||
Reclassified to held for sale | (2 | ) | — | ||||
Ending balance | $ | 47 | $ | 52 | |||
Environmental Matters
The Company is subject to the requirements of federal, state, local and foreign environmental and occupational safety and health laws and regulations and ordinances. These include laws regulating air emissions, water discharge and waste management. The Company is also subject to environmental laws requiring the investigation and cleanup of environmental contamination at properties it presently owns or operates and at third-party disposal or treatment facilities to which these sites send or arranged to send hazardous waste. The Company is aware of contamination at some of its properties. These sites are in various stages of investigation and cleanup. The Company currently is, has been, and in the future may become the subject of formal or informal enforcement actions or procedures.
Costs related to environmental assessments and remediation efforts at operating facilities, previously owned or operated facilities, or other waste site locations are accrued when it is probable that a liability has been incurred and the amount of that liability can
25
be reasonably estimated. Estimated costs are recorded at undiscounted amounts, based on experience and assessments, and are regularly evaluated. The liabilities are recorded in Other current liabilities and Other non-current liabilities in the consolidated balance sheets. At June 30, 2014, the Company has recorded a reserve of approximately $1 million for environmental matters. However, estimating liabilities for environmental investigation and cleanup is complex and dependent upon a number of factors beyond the Company’s control and which may change dramatically. Accordingly, although the Company believes its reserve is adequate based on current information, the Company cannot provide any assurance that its ultimate environmental investigation and cleanup costs and liabilities will not exceed the amount of its current reserve.
Other Contingent Matters
Various legal actions, governmental investigations and proceedings and claims are pending or may be instituted or asserted in the future against the Company, including those arising out of alleged defects in the Company’s products; governmental regulations relating to safety; employment-related matters; customer, supplier and other contractual relationships; intellectual property rights; product warranties; product recalls; and environmental matters. Some of the foregoing matters may involve compensatory, punitive or antitrust or other treble damage claims in very large amounts, or demands for recall campaigns, environmental remediation programs, sanctions, or other relief which, if granted, would require very large expenditures. The Company enters into agreements that contain indemnification provisions in the normal course of business for which the risks are considered nominal and impracticable to estimate.
Contingencies are subject to many uncertainties, and the outcome of individual litigated matters is not predictable with assurance. Reserves have been established by the Company for matters discussed in the immediately foregoing paragraph where losses are deemed probable and reasonably estimable. It is possible, however, that some of the matters discussed in the foregoing paragraph could be decided unfavorably to the Company and could require the Company to pay damages or make other expenditures in amounts, or a range of amounts, that cannot be estimated at June 30, 2014, and that are in excess of established reserves. The Company does not reasonably expect, except as otherwise described herein, based on its analysis, that any adverse outcome from such matters would have a material effect on the Company’s financial condition, results of operations or cash flows, although such an outcome is possible.
NOTE 17. Segment Information
The Company’s reportable segments are as follows:
• | Climate - The Company’s Climate product line includes climate air handling modules, powertrain cooling modules, heat exchangers, compressors, fluid transport and engine induction systems. |
• | Electronics - The Company’s Electronics product line includes audio systems, infotainment systems, driver information systems, powertrain and feature control modules, climate controls, and electronic control modules. |
• | Other - The Company’s Other product line includes certain South America programs and European operations previously associated with the Interiors business but not subject to discontinued operations classification. |
Financial results for the Company's reportable segments have been prepared using a management approach, which is consistent with the basis and manner in which financial information is evaluated by the Company's chief operating decision-making group in allocating resources and in assessing performance. The Company’s chief operating decision making group, comprised of the Chief Executive Officer and Chief Financial Officer, evaluates the performance of the Company’s segments primarily based on net sales, before elimination of inter-company shipments, Adjusted EBITDA (non-GAAP financial measure) and operating assets.
26
Segment Sales
Three Months Ended June 30 | Six Months Ended June 30 | ||||||||||||||
2014 | 2013 | 2014 | 2013 | ||||||||||||
(Dollars in Millions) | |||||||||||||||
Climate | $ | 1,332 | $ | 1,247 | $ | 2,600 | $ | 2,475 | |||||||
Electronics | 443 | 354 | 882 | 719 | |||||||||||
Other | 32 | 52 | 71 | 99 | |||||||||||
Eliminations | (25 | ) | (43 | ) | (53 | ) | (97 | ) | |||||||
Total consolidated sales | $ | 1,782 | $ | 1,610 | $ | 3,500 | $ | 3,196 | |||||||
Segment Adjusted EBITDA
The Company defines Adjusted EBITDA as net income attributable to the Company, plus net interest expense, provision for income taxes and depreciation and amortization, as further adjusted to eliminate the impact of equity in net income of non-consolidated affiliates, net income attributable to non-controlling interests, assets impairment, gains or losses on divestitures, net restructuring expenses and other reimbursable costs, non-cash stock-based compensation expense, certain employee charges and benefits, reorganization items and other non-operating gains and losses.
Through December 31, 2013, the Company’s definition of Adjusted EBITDA was inclusive of net income attributable to non-controlling interests and equity in net income of non-consolidated affiliates. Following the December 17, 2013, disposition of its 50% ownership interest in Yanfeng, the Company modified its definition of Adjusted EBITDA to exclude net income attributable to non-controlling interests and equity in net income of non-consolidated affiliates as management believes this measure is most reflective of the operational performance of the Company's operating segments. Accordingly, Adjusted EBITDA for historical periods has been recast on basis consistent with the current definition.
Adjusted EBITDA is presented as a supplemental measure of the Company's financial performance that management believes is useful to investors because the excluded items may vary significantly in timing or amounts and/or may obscure trends useful in evaluating and comparing the Company's operating activities across reporting periods. Not all companies use identical calculations and, accordingly, the Company's presentation of Adjusted EBITDA may not be comparable to other similarly titled measures of other companies. Adjusted EBITDA is not a recognized term under U.S. GAAP and does not purport to be a substitute for net income as an indicator of operating performance or cash flows from operating activities as a measure of liquidity. Adjusted EBITDA has limitations as an analytical tool and is not intended to be a measure of cash flow available for management's discretionary use, as it does not consider certain cash requirements such as interest payments, tax payments and debt service requirements. In addition, the Company uses Adjusted EBITDA (i) as a factor in incentive compensation decisions, (ii) to evaluate the effectiveness of the Company's business strategies and (iii) because the Company's credit agreements use measures similar to Adjusted EBITDA to measure compliance with certain covenants.
Segment Adjusted EBITDA is summarized below:
Three Months Ended June 30 | Six Months Ended June 30 | ||||||||||||||
2014 | 2013 | 2014 | 2013 | ||||||||||||
(Dollars in Millions) | |||||||||||||||
Climate | $ | 147 | $ | 136 | $ | 264 | $ | 261 | |||||||
Electronics | 50 | 30 | 107 | 56 | |||||||||||
Other | (4 | ) | (3 | ) | (4 | ) | (5 | ) | |||||||
Total segment Adjusted EBITDA | 193 | 163 | 367 | 312 | |||||||||||
Reconciling Items: | |||||||||||||||
Interiors discontinued operations | 18 | 14 | 27 | 12 | |||||||||||
Corporate | (18 | ) | (14 | ) | (31 | ) | (20 | ) | |||||||
Total consolidated Adjusted EBITDA | $ | 193 | $ | 163 | $ | 363 | $ | 304 | |||||||
27
The reconciliation of Adjusted EBITDA to Net (loss) income attributable to Visteon is as follows:
Three Months Ended June 30 | Six Months Ended June 30 | ||||||||||||||
2014 | 2013 | 2014 | 2013 | ||||||||||||
(Dollars in Millions) | |||||||||||||||
Total Adjusted EBITDA | $ | 193 | $ | 163 | $ | 363 | $ | 304 | |||||||
Interest expense, net | 6 | 8 | 14 | 18 | |||||||||||
Provision for income taxes | 41 | 39 | 72 | 36 | |||||||||||
Depreciation and amortization | 61 | 59 | 121 | 119 | |||||||||||
Net income attributable to non-controlling interests | 14 | 21 | 43 | 36 | |||||||||||
Equity in net income of non-consolidated affiliates | (11 | ) | (42 | ) | (13 | ) | (86 | ) | |||||||
Loss on debt extinguishment | 23 | — | 23 | — | |||||||||||
Restructuring expenses | 13 | 2 | 14 | 21 | |||||||||||
Other expenses (income) | 14 | (3 | ) | 20 | 8 | ||||||||||
Non-cash, stock-based compensation expense | 3 | 4 | 6 | 10 | |||||||||||
Other | 1 | — | 1 | — | |||||||||||
Discontinued operations | 183 | 10 | 198 | 8 | |||||||||||
Net (loss) income attributable to Visteon Corporation | $ | (155 | ) | $ | 65 | $ | (136 | ) | $ | 134 | |||||
Segment Operating Assets
Inventories, net | Property and Equipment, net | ||||||||||||||
June 30 2014 | December 31 2013 | June 30 2014 | December 31 2013 | ||||||||||||
(Dollars in Millions) | |||||||||||||||
Climate | $ | 350 | $ | 324 | $ | 1,064 | $ | 1,046 | |||||||
Electronics | 107 | 106 | 178 | 163 | |||||||||||
Other | 5 | 42 | 24 | 190 | |||||||||||
Total segment operating assets | 462 | 472 | 1,266 | 1,399 | |||||||||||
Corporate | — | — | 14 | 15 | |||||||||||
Total consolidated operating assets | $ | 462 | $ | 472 | $ | 1,280 | $ | 1,414 | |||||||
Other segment operating assets as of December 31, 2013 are inclusive of amounts associated with assets subject to the Interiors Transaction, which were reclassified to assets held for sale as of June 30, 2014.
NOTE 18. Subsequent Event
On July 1, 2014, the Company completed the acquisition of substantially all of the global automotive electronics business of Johnson Controls Inc., in exchange for the payment of $265 million in cash (subject to working capital, net cash and other adjustments). Net sales for the acquired electronics business were approximately $1.3 billion for the annual period ended September 30, 2013 and no further interim financial information is available subsequent to that date. Due to the timing of the transaction closing, the Company has not completed consolidation of the acquired electronics business nor has business combination purchase accounting been completed, which includes the determination of estimated fair values of assets and liabilities acquired.
28
Item 2. | Management's Discussion and Analysis of Financial Condition and Results of Operations |
Management’s Discussion and Analysis (“MD&A”) is intended to help the reader understand the results of operations, financial condition and cash flows of Visteon Corporation (“Visteon” or the “Company”). MD&A is provided as a supplement to, and should be read in conjunction with, the Company’s Annual Report on Form 10-K for the fiscal year ended December 31, 2013, filed with the Securities and Exchange Commission on February 25, 2014, and the financial statements and accompanying notes to the financial statements included elsewhere herein.
Executive Summary
Overview
Visteon is a global supplier of climate, electronics and interiors systems, modules and components to automotive original equipment manufacturers (“OEMs”) including BMW, Chrysler, Daimler, Ford, General Motors, Honda, Hyundai, Kia, Nissan, PSA Peugeot Citroën, Renault, Toyota and Volkswagen. The Company has an international network of manufacturing operations, technical centers and joint venture operations, supported by approximately 24,000 employees dedicated to the design, development, manufacture and support of its product offerings and its global customers.
Interiors Transaction
On May 1, 2014, the Company entered into a Master Purchase Agreement (the “Purchase Agreement”) pursuant to which, Visteon will reorganize substantially all of its global Interiors business under a newly-formed holding company (the “Reorganization”) and will sell all of the equity of that holding company (the “Interiors Transaction”) in exchange for the assumption of certain pension and other liabilities related to the Company's Interiors business and the payment of nominal cash consideration. Visteon agreed to contribute up to $95 million (the "Cash Contribution") to the Interiors business and the Purchase Agreement includes net working capital adjustments whereby the Cash Contribution will be effectively adjusted based on the actual net working capital levels as of the closing date. Visteon also agreed to support the buyer in establishing external credit facilities. To the extent that $90 million of external credit facilities are not available to the Interiors business by the date of closing, Visteon is required to provide a seller-backed revolving credit facility in the amount of any shortfall. Draws under any such seller-backed facility will only be available if certain of the external credit facilities are fully drawn, and any draws on the seller-backed facility generally must be repaid prior to the repayment of the external credit facilities. The seller-backed facility will have a maturity of three years and will have a default rate of interest for any interest and/or principal payment defaults.
The closing of the Interiors Transaction is expected to occur by December 31, 2014 and is subject to various conditions, including the completion of the Reorganization, regulatory and antitrust approvals, receipt of other third party consents and approvals and other closing conditions. As part of the Reorganization, Visteon will separate the portion of its Interiors business conducted through its facilities in Chennai and Pune, India into a new legal entity, which will be transferred to the holding company and sold to the buyer as part of the Interiors Transaction. Due to the time required to effect such separation under Indian law, the consummation of the Indian portion of the Interiors Transaction may occur subsequent to the closing of the balance of the Interiors Transaction.
The Company determined that assets and liabilities subject to the Interiors Transaction met the "held for sale" criteria during the quarterly period ended June 30, 2014. As the fair value of the assets and liabilities subject to the Interiors Transaction was less than the carrying value, the long-lived assets were reduced to zero, which resulted in an impairment loss of $173 million. The Company expects to record additional losses in connection with the Interiors Transaction upon closing, which are estimated to range from $150 million to $200 million, including the Cash Contribution, net working capital adjustments, and other contractual obligations resulting from the closing. The results of operations for Interiors business subject to the Interiors Transaction have been reclassified as discontinued operations. While the Interiors Transaction represents the substantially majority of the Company's Interiors operations, other operations previously reported within the Company's Interiors reporting segment were excluded from the scope of the Interiors Transaction. These other operations have been classified within the Other reportable segment. The Company's goal is to complete the disposal of its remaining Interiors business during 2014. Due to certain liabilities and capital requirements of the remaining business, Visteon may be required to contribute cash to such business in connection with any disposition and such amounts could be material.
Electronics Acquisition
On July 1, 2014, the Company completed the acquisition of substantially all of the global automotive electronics business of Johnson Controls Inc., in exchange for the payment of $265 million in cash (subject to working capital, net cash and other adjustments). Net sales for the acquired electronics business were approximately $1.3 billion for the annual period ended September 30, 2013. On a combined basis, the Company's Electronics business is expected to have annual sales in excess of $3 billion.
29
Financial Results Summary
Visteon recorded net sales of $1,782 million for the second quarter of 2014, an increase of $172 million from the same period in 2013. For the six months ended June 30, 2014, the Company recorded sales of $3,500 million, an increase of $304 million from the same period in 2014. The increase in sales for the three and six months ended June 30, 2014, was primarily due to higher production volumes and favorable product mix for the Climate product group and the acquisition of a controlling ownership interest in Yanfeng Visteon Electronics Co., Ltd. ("YFVE") with effect from November 2013. The Company's sales for the three and six months ended June 30, 2014, were distributed by product group, geographic region, and customer as follows:
Three Months Ended June 30, 2014

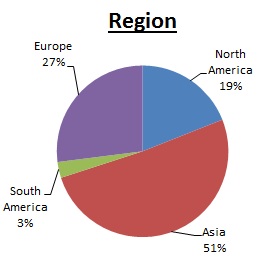

Six Months Ended June 30, 2014
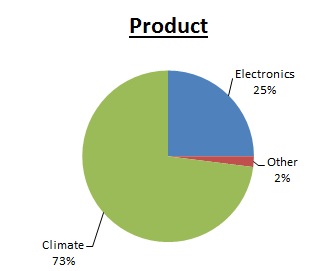
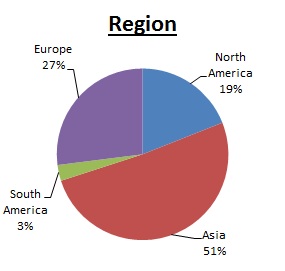
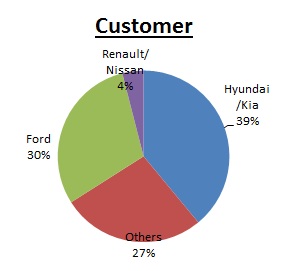
The Company's sales are significantly impacted by global light vehicle production volumes. A summary of global light vehicle production levels for the three and six months ended June 30, 2014 and 2013, are presented below by geographic region.
Three Months Ended June 30 | Six Month Ended June 30 | ||||||||||||||||
2014 | 2013 | Change | 2014 | 2013 | Change | ||||||||||||
(Units in Millions) | |||||||||||||||||
Global | 21.9 | 21.4 | 2.4 | % | 44.1 | 42.5 | 3.9 | % | |||||||||
North America | 4.4 | 4.3 | 3.6 | % | 8.6 | 8.3 | 4.2 | % | |||||||||
South America | 0.9 | 1.3 | (24.2 | )% | 1.9 | 2.3 | (16.8 | )% | |||||||||
Europe | 5.3 | 5.2 | 1.9 | % | 10.5 | 10 | 5.0 | % | |||||||||
China | 5.7 | 5.1 | 11.0 | % | 11.3 | 10.3 | 9.9 | % | |||||||||
Japan/Korea | 3.4 | 3.3 | 2.3 | % | 7.0 | 6.6 | 6.1 | % | |||||||||
India | 0.9 | 0.9 | (0.5 | )% | 1.8 | 1.9 | (5.7 | )% | |||||||||
ASEAN | 1.0 | 1.0 | (7.3 | )% | 2.0 | 2.2 | (7.2 | )% | |||||||||
Source: IHS Automotive | |||||||||||||||||
Gross margin was $194 million, or 10.9% of sales, for the three months ended June 30, 2014, compared to $163 million, or 10.1% of sales, for the same period of 2013. The increase was primarily attributable to the acquisition of a controlling ownership interest in YFVE with effect from November 2013 and higher production volumes and favorable cost performance.
30
Net loss attributable to Visteon was $155 million for the three months ended June 30, 2014 representing a decrease of $220 million when compared to the same period in 2013. The decrease was due to the Interiors asset impairment loss of $173 million, a decrease in equity in net income of non-consolidated affiliates of $31 million, and a loss on debt extinguishment of $23 million incurred in connection with the redemption of the Company's 6.75% senior notes due April 2019.
Including discontinued operations, the Company generated $127 million of cash from operating activities during the six months ended June 30, 2014, a decrease of $31 million when compared to the same period of 2013. As of June 30, 2014, the Company had total cash balances of $1,425 million, including $12 million of restricted cash, $114 million of cash held for sale and $14 million of restricted cash held for sale. The Company had total debt balances of $960 million, including $32 million of debt held for sale. As of June 30, 2014, the Company had $465 million of cash in excess of total debt.
Share Repurchase Program
Since July 2012, the Company's board of directors has authorized a total of $1.175 billion in share repurchases. On May 8, 2014, the Company announced an accelerated stock buyback ("ASB") program with a third-party financial institution to purchase shares of common stock for an aggregate purchase price of $500 million. Under the program, the Company paid the financial institution $500 million and received an initial delivery of 3,394,157 shares of common stock using a reference price of $92.07, and an additional delivery of 1,129,001 shares of common stock following the conclusion of the hedge period which determined a certain minimum amount of shares guaranteed under a portion of the program that had a maximum per share price of $100.54. The final settlement will be generally based on the volume-weighted average price of the Company's common stock over a period of up to approximately 12 months, less a negotiated discount, 50 percent of which will be subject to a maximum per share price. As of June 30, 2014, $375 million remained authorized and available for repurchase through December 31, 2015. The Company anticipates that additional repurchases of common stock, if any, would occur from time to time in open market transactions or in privately negotiated transactions depending on market and economic conditions, share price, trading volume, alternative uses of capital and other factors.
Pension Settlement
On July 16, 2014, the Company entered into an agreement to transfer certain U.S. pension assets to Prudential Insurance Company of America, to settle approximately $350 million of its U.S. outstanding pension obligation. The Company expects to record a settlement gain estimated to be approximately $20 million during the three months ending September 30, 2014.
31
Consolidated Results of Operations - Three Months Ended June 30, 2014 and 2013
The Company's consolidated results of operations for the three months ended June 30, 2014 and 2013 were as follows:
Three Months Ended June 30 | |||||||||||
2014 | 2013 | Change | |||||||||
(Dollars in Millions) | |||||||||||
Sales | $ | 1,782 | $ | 1,610 | $ | 172 | |||||
Cost of sales | 1,588 | 1,447 | 141 | ||||||||
Gross margin | 194 | 163 | 31 | ||||||||
Selling, general and administrative expenses | 84 | 77 | 7 | ||||||||
Interest expense, net | 6 | 8 | (2 | ) | |||||||
Equity in net income of non-consolidated affiliates | 11 | 42 | (31 | ) | |||||||
Loss on debt extinguishment | 23 | — | 23 | ||||||||
Restructuring expenses | 13 | 2 | 11 | ||||||||
Other expenses (income) | 14 | (3 | ) | 17 | |||||||
Provision for income taxes | 41 | 39 | 2 | ||||||||
Net income from continuing operations | 24 | 82 | (58 | ) | |||||||
(Loss) income from discontinued operations, net of tax | (165 | ) | 4 | (169 | ) | ||||||
Net (loss) income | (141 | ) | 86 | (227 | ) | ||||||
Net income attributable to non-controlling interests | 14 | 21 | (7 | ) | |||||||
Net (loss) income attributable to Visteon Corporation | $ | (155 | ) | $ | 65 | $ | (220 | ) | |||
Adjusted EBITDA* | $ | 193 | $ | 163 | $ | 30 | |||||
* Adjusted EBITDA is a Non-GAAP financial measure, as further discussed below. | |||||||||||
Sales
Sales for the three-month period ended June 30, 2014, totaled $1,782 million, which represents an increase of $172 million compared with the same period of 2013. Sales increased $82 million primarily due to favorable customer volumes and product mix in the Company's Climate and Electronics product groups. The acquisition of a controlling ownership interest in YFVE increased sales $79 million. Favorable currency of $32 million increased sales, primarily attributable to the strengthening Euro and Korean Won, partially offset by the weakening Indian Rupee, Thai Baht and Chinese Yuan. Other reductions of $21 million were associated with customer pricing, net of design savings, commercial agreements and other customer settlements.
Cost of Sales
Cost of sales increased $141 million for the three-month period ended June 30, 2014, when compared with the same period in 2013. The increase includes $72 million attributable to increased production volumes and changes in product mix, representing the variable nature of material and labor costs. The acquisition of a controlling ownership interest in YFVE increased cost of sales $64 million. Foreign currency increased cost of sales by $37 million including year over year impacts of the mix of receivables and payables denominated in currencies other than functional currencies. These increases were partially offset by $32 million of efficiencies including material, design, and usage economics and other costs.
Gross Margin
The Company's gross margin was $194 million for the three-month period ended June 30, 2014, compared to $163 million for the same period of 2013. The increase in gross margin included $15 million from YFVE, $11 million attributable to favorable cost performance and $10 million from favorable volume and mix. These increases were partially offset by $5 million of unfavorable currency.
Selling, General and Administrative Expenses
Selling, general, and administrative expenses were $84 million and $77 million during the three-month period ended June 30,
32
2014 and 2013, respectively. The increase included $4 million from YFVE and the non-recurrence of cost recoveries associated with divested businesses of $4 million.
Interest Expense, Net
Interest expense for the three-month period ended June 30, 2014, of $8 million included $3 million associated with the Company's 6.75% Senior Notes due April 15, 2019, $3 million associated with affiliate debt, $1 million associated with the Term Facility, and $1 million associated with commitment fees and amortization of debt issuance costs. During the three-month period ended June 30, 2013, interest expense was $10 million, including $8 million on the 6.75% Senior Notes due April 15, 2019, $1 million associated with affiliate debt, and $1 million for commitment fees and amortization of debt issuance costs. Interest expense associated with the 6.75% senior notes due April 2019 decreased by $5 million as compared to the three months ended June 30, 2013 due to lower interest owed as a result of the redemption of $50 million of notes in December 2013, $50 million of notes in April 2014, and the remaining $350 million of notes in May 2014. Interest income was $2 million for both the three-month period ended June 30, 2014 and June 30, 2013.
Equity in Net Income of Non-Consolidated Affiliates
Equity in net income of non-consolidated affiliates decreased $31 million comparing the three-month periods ended June 30, 2014 and 2013. The decrease was primarily attributable to the sale of the Company's 50% ownership interest in Yanfeng during the fourth quarter of 2013.
Loss on Debt Extinguishment
Loss on debt extinguishment of $23 million during the three months ended June 30, 2014 reflected the redemption premium and unamortized original issue discount, debt fees and other debt issue costs associated with the redemption of all of the remaining $400 million 6.75% Senior Notes due April 2019. $50 million of the 6.75% senior notes was redeemed at a 103% premium on April 10, 2014, and $350 million was redeemed at a 105.063% premium on May 9, 2014. In compliance with Accounting Standards Codification ("ASC") 470 "Debt", the redemption of the senior notes qualified as a debt extinguishment.
Restructuring Expenses
The Company's restructuring reserves and activity, including amounts attributable to discontinued operations, are summarized below for the three-month period ended June 30, 2014.
Climate | Other | Corporate | Total | ||||||||||||
Restructuring reserve - March 31, 2014 | $ | 1 | $ | 19 | $ | 1 | $ | 21 | |||||||
Expenses | 12 | 5 | — | 17 | |||||||||||
Utilization | — | (11 | ) | (1 | ) | (12 | ) | ||||||||
Restructuring reserve - June 30, 2014 | $ | 13 | $ | 13 | $ | — | $ | 26 | |||||||
During the second quarter of 2014, the Company recorded $17 million of restructuring expenses related to employee and severance termination benefits, including amounts associated with discontinued operations, including the following activities.
• | The Company recorded $10 million of restructuring expenses, primarily related to severance and termination benefits associated with approximately 270 employees in connection with the closure of a Climate facility located in Quilmes, Argentina. |
• | The Company recorded $2 million of restructuring expenses, primarily related to severance and termination benefits associated with approximately 90 employees in connection with the closure of a Climate facility located in Port Elizabeth, South Africa. |
• | In connection with the previously announced restructuring of three Interiors facilities in France, the Company recorded an additional $5 million of restructuring expenses, which remains accrued as of June 30, 2014, as part of the Other product group, in addition to $8 million associated with previously announced programs including the fundamental reorganization of operations at a facility in Brazil. |
33
During the second quarter of 2013, the Company recorded $3 million of restructuring expenses, including amounts associated with discontinued operations, primarily related to severance and termination benefits associated with approximately 40 employees under a previously announced $100 million program designed to reduce fixed costs and to improve operational efficiency.
Other Expenses (Income)
Other expenses (income) consist of the following:
Three Months Ended June 30 | |||||||
2014 | 2013 | ||||||
(Dollars in Millions) | |||||||
Transformation costs | $ | 8 | $ | 2 | |||
Provision for losses on recoverable taxes | 8 | — | |||||
Gain on sale of equity interest | (2 | ) | (5 | ) | |||
$ | 14 | $ | (3 | ) | |||
The Company recorded transformation costs of $8 million and $2 million for the three months ended June 30, 2014 and 2013, respectively, related to financial and advisory services associated with continued execution of its comprehensive shareholder value creation plan.
The Company recorded $8 million during the three months ended June 30, 2014 to adjust recoverable value-added taxes to net realizable value attributable to business exit activities.
In April 2014, the Company completed the sale of its 50% ownership interest in Duckyang Industry Co., Ltd. ("Duckyang"), a Korean automotive interiors supplier. In connection with the transaction, the Company received total cash of approximately $31 million, including $6 million of dividends. The Company recorded a pre-tax gain of approximately $2 million on this transaction during the three months ended June 30, 2014.
In February 2013, the Company entered into an agreement to sell its 20% equity interest in Dongfeng Visteon Automotive Trim Systems Co. Ltd, for cash proceeds of approximately $20 million. The Company recognized a gain of approximately $5 million upon completion of the sale in the second quarter of 2013.
Income Taxes
The Company's provision for income taxes of $41 million for the three-month period ended June 30, 2014, represents an increase of $2 million when compared with an income tax provision of $39 million in the same period of 2013. The increase in income tax expense reflects changes in uncertain tax benefits primarily related to uncertainty surrounding the incentives associated with the Company's research and development activities in Asia, $8 million, partially offset by the year-over-year reduction in withholding taxes due to the elimination of Yanfeng equity earnings in December 2013 and other items.
Discontinued Operations
On May 1, 2014, the Company reached an agreement for the sale of substantially all of its global Interiors operations for de minimis proceeds (the "Interiors Transaction"). Accordingly, the results of operations of the Interiors business subject to the Interiors Transaction have been reclassified to (Loss)/income from discontinued operations, net of tax in the Consolidated Statements of Comprehensive Income for the three-month period ended June 30, 2014.
34
The results of operations for the discontinued Interiors business for the three months ended June 30, 2014 and 2013 are as follows:
Three Months Ended June 30 | |||||||
2014 | 2013 | ||||||
(Dollars in Millions) | |||||||
Sales | $ | 258 | $ | 282 | |||
Cost of sales | 229 | 260 | |||||
Gross margin | 29 | 22 | |||||
Selling, general and administrative expenses | 14 | 14 | |||||
Long-lived asset impairment | 173 | — | |||||
Other expenses | 9 | 4 | |||||
(Loss) income from discontinued operations before income taxes | (167 | ) | 4 | ||||
Benefit from income taxes | (2 | ) | — | ||||
(Loss) income from discontinued operations, net of tax | $ | (165 | ) | $ | 4 | ||
Net (Loss) Income
Net loss attributable to Visteon was $155 million for the three-month period ended June 30, 2014, compared to net income attributable to Visteon of $65 million for the same period of 2013, for a decrease of $220 million. The decrease was largely due to the long-lived asset impairment charge of $173 million recognized in the loss from discontinued operations in relation to the sale of the majority of the Company's Interiors operations, lower equity in net income of non-consolidated affiliates of $31 million related to the disposition of the Company's 50% ownership interest in Yanfeng, and a loss on debt extinguishment of $23 million incurred in connection with the redemption of 6.75% senior notes due April 2019.
Adjusted EBITDA (a non-GAAP financial measure, as defined below) was $193 million and $163 million, for the three-month periods ended June 30, 2014 and 2013, respectively. The Company defines Adjusted EBITDA as net income attributable to the Company, plus net interest expense, provision for income taxes and depreciation and amortization, as further adjusted to eliminate the impact of equity in net income of non-consolidated affiliates, net income attributable to non-controlling interests, assets impairment, gains or losses on divestitures, net restructuring expenses and other reimbursable costs, non-cash stock-based compensation expense, certain employee charges and benefits, reorganization items and other non-operating gains and losses.
Through December 31, 2013, the Company’s definition of Adjusted EBITDA was inclusive of net income attributable to non-controlling interests and equity in net income of non-consolidated affiliates. Following the December 17, 2013 disposition of its 50% ownership interest in Yanfeng, the Company modified its definition of Adjusted EBITDA to exclude net income attributable to non-controlling interests and equity in net income of non-consolidated affiliates as management believes this measure is most reflective of its operational performance. Accordingly, Adjusted EBITDA for historical periods has been recast on basis consistent with the current definition.
Adjusted EBITDA is not a recognized term under accounting principles generally accepted in the United States and does not purport to be a substitute for net income as an indicator of operating performance or cash flows from operating activities as a measure of liquidity. Adjusted EBITDA has limitations as an analytical tool and is not intended to be a measure of cash flow available for management's discretionary use, as it does not consider certain cash requirements such as interest payments, tax payments and debt service requirements. In addition, the Company uses Adjusted EBITDA (i) as a factor in incentive compensation decisions, (ii) to evaluate the effectiveness of the Company's business strategies and (iii) because the Company's credit agreements use measures similar to Adjusted EBITDA to measure compliance with certain covenants. Adjusted EBITDA, as determined and measured by the Company should not be compared to similarly titled measures reported by other companies.
35
The reconciliation of Adjusted EBITDA to net income attributable to Visteon for the three-month periods ended June 30, 2014 and 2013 is as follows:
Three Months Ended June 30 | |||||||||||
2014 | 2013 | Change | |||||||||
(Dollars in Millions) | |||||||||||
Adjusted EBITDA | $ | 193 | $ | 163 | $ | 30 | |||||
Interest expense, net | 6 | 8 | (2 | ) | |||||||
Provision for income taxes | 41 | 39 | 2 | ||||||||
Depreciation and amortization | 61 | 59 | 2 | ||||||||
Net income attributable to non-controlling interests | 14 | 21 | (7 | ) | |||||||
Equity in net income of non-consolidated affiliates | (11 | ) | (42 | ) | 31 | ||||||
Loss on debt extinguishment | 23 | — | 23 | ||||||||
Restructuring expenses | 13 | 2 | 11 | ||||||||
Other expenses (income) | 14 | (3 | ) | 17 | |||||||
Non-cash, stock-based compensation expense | 3 | 4 | (1 | ) | |||||||
Other | 1 | — | 1 | ||||||||
Discontinued operations | 183 | 10 | 173 | ||||||||
Net (loss) income attributable to Visteon Corporation | $ | (155 | ) | $ | 65 | $ | (220 | ) | |||
Segment Results of Operations - Three Months Ended June 30, 2014 and 2013
Sales by Segment
Climate | Electronics | Other | Eliminations | Total | |||||||||||||||
(Dollars in Millions) | |||||||||||||||||||
Three months ended June 30, 2013 | $ | 1,247 | $ | 354 | $ | 52 | $ | (43 | ) | $ | 1,610 | ||||||||
Volume and mix | 70 | 16 | (22 | ) | 18 | 82 | |||||||||||||
Currency | 28 | 2 | 2 | — | 32 | ||||||||||||||
YFVE consolidation | — | 79 | — | — | 79 | ||||||||||||||
Other | (13 | ) | (8 | ) | — | — | (21 | ) | |||||||||||
Three months ended June 30, 2014 | $ | 1,332 | $ | 443 | $ | 32 | $ | (25 | ) | $ | 1,782 | ||||||||
Climate sales increased during the three months ended June 30, 2014, by $85 million. Higher production volumes in Asia and Europe increased sales by $70 million. Favorable currency resulted in an increase of $28 million, primarily related to the Korean Won and Euro, partially offset by the India Rupee, Chinese Yuan and Argentinian Peso. Other reductions of $13 million were associated with customer pricing, net of design changes, partially offset by a commercial settlement of $12 million.
Electronics sales increased during the three months ended June 30, 2014, by $89 million. The acquisition of a controlling ownership interest in YFVE with effect from November 2013, increased sales by $79 million. Higher production volumes increased sales by $16 million, driven by net new business wins in Asia and Europe. Favorable currency, primarily related to the Euro, partially offset by the Thai Baht and Indian Rupee, increased product sales by $2 million. Other reductions, totaling $8 million, primarily reflected customer pricing, net of design changes.
Other segment sales decreased during the three months ended June 30, 2014, by $20 million, including unfavorable volume and product mix of $22 million primarily reflecting the wind down of certain programs in South America. Favorable currency related to the Euro increased sales by $2 million.
36
Cost of Sales by Segment
Climate | Electronics | Other | Eliminations | Total | |||||||||||||||
(Dollars in Millions) | |||||||||||||||||||
Three months ended June 30, 2013 | $ | 1,126 | $ | 313 | $ | 51 | $ | (43 | ) | $ | 1,447 | ||||||||
Material | 72 | 1 | (12 | ) | 18 | 79 | |||||||||||||
Freight and duty | (2 | ) | (1 | ) | (1 | ) | — | (4 | ) | ||||||||||
Labor and overhead | (6 | ) | — | (1 | ) | — | (7 | ) | |||||||||||
Depreciation and amortization | 1 | — | — | — | 1 | ||||||||||||||
YFVE consolidation | — | 64 | — | — | 64 | ||||||||||||||
Other | 7 | 2 | (1 | ) | — | 8 | |||||||||||||
Three months ended June 30, 2014 | $ | 1,198 | $ | 379 | $ | 36 | $ | (25 | ) | $ | 1,588 | ||||||||
Climate material costs increased by $72 million, including $97 million related to higher production volumes, partially offset by $25 million of manufacturing efficiencies and purchasing improvements. Labor and overhead decreased by $6 million, including $1 million related to production volumes and currency and $5 million related to lower manufacturing costs, net of efficiencies. Other increases of $7 million primarily related to currency.
Electronics cost of sales increased $64 million attributable to the acquisition of a controlling ownership interest in YFVE with effect from November 2013.
Other segment material costs decreased by $12 million, related to production wind down for certain programs in South America and currency. Other labor costs and freight and duty costs both also decreased by $1 million in connection with lower production volumes.
Adjusted EBITDA by Segment
Adjusted EBITDA by segment for the three months ended June 30, 2014 and 2013 is presented in the table below:
Three Months Ended June 30 | |||||||||||
2014 | 2013 | Change | |||||||||
(Dollars in Millions) | |||||||||||
Climate | $ | 147 | $ | 136 | $ | 11 | |||||
Electronics | 50 | 30 | 20 | ||||||||
Other | (4 | ) | (3 | ) | (1 | ) | |||||
Total Segment Adjusted EBITDA | $ | 193 | $ | 163 | $ | 30 | |||||
Reconciling Items: | |||||||||||
Discontinued Operations | 18 | 14 | 4 | ||||||||
Corporate | (18 | ) | (14 | ) | (4 | ) | |||||
Total consolidated | $ | 193 | $ | 163 | $ | 30 | |||||
37
Changes in Adjusted EBITDA by segment are presented in the table below:
Climate | Electronics | Other | Total | ||||||||||||
(Dollars in Millions) | |||||||||||||||
Three months ended June 30, 2013 | $ | 136 | $ | 30 | $ | (3 | ) | $ | 163 | ||||||
Volume and mix | 8 | 3 | (1 | ) | 10 | ||||||||||
Currency | (10 | ) | 4 | — | (6 | ) | |||||||||
YFVE consolidation | — | 16 | — | 16 | |||||||||||
Other | 13 | (3 | ) | — | 10 | ||||||||||
Three months ended June 30, 2014 | $ | 147 | $ | 50 | $ | (4 | ) | 193 | |||||||
Reconciling Items: | |||||||||||||||
Discontinued Operations | 18 | ||||||||||||||
Corporate | (18 | ) | |||||||||||||
Total | $ | 193 | |||||||||||||
Adjusted EBITDA for the Climate segment for the three months ended June 30, 2014, increased by $11 million compared to the same period of 2013. Volume and mix increased Climate Adjusted EBITDA by $8 million, largely related to net new business wins including Hyundai / Kia in Asia, North America and Europe. Currency had a $10 million negative impact on Climate Adjusted EBITDA, largely related to the strengthening Korean Won and weakening Indian Rupee, which more than offset the positive impact of a stronger Euro. Other changes of $13 million reflected a commercial claim settlement of $12 million.
Electronics Adjusted EBITDA for the three months ended June 30, 2014, increased by $20 million compared to the same period of 2013. YFVE increased Adjusted EBITDA by $16 million. Higher volumes in Asia and Europe and currency, largely related to a stronger Euro partially offset by a weaker Thai Baht and Indian Rupee, also had favorable impacts of $3 million and $4 million, respectively. Other reductions of $3 million reflected customer pricing, net of design changes partially offset by material, design and other cost efficiencies.
Other Adjusted EBITDA decreased during the three months ended June 30, 2014, by $1 million, including unfavorable currency and lower volumes.
38
Consolidated Results of Operations - Six Months Ended June 30, 2014 and 2013
The Company's consolidated results of operations for the six months ended June 30, 2014 and 2013 were as follows:
Six Months Ended June 30 | |||||||||||
2014 | 2013 | Change | |||||||||
(Dollars in Millions) | |||||||||||
Sales | $ | 3,500 | $ | 3,196 | $ | 304 | |||||
Cost of sales | 3,127 | 2,883 | 244 | ||||||||
Gross margin | 373 | 313 | 60 | ||||||||
Selling, general and administrative expenses | 165 | 150 | 15 | ||||||||
Interest expense, net | 14 | 18 | (4 | ) | |||||||
Equity in net income of non-consolidated affiliates | 13 | 86 | (73 | ) | |||||||
Loss on debt extinguishment | 23 | — | 23 | ||||||||
Restructuring expenses | 14 | 21 | (7 | ) | |||||||
Other expenses | 20 | 8 | 12 | ||||||||
Provision for income taxes | 72 | 36 | 36 | ||||||||
Net income from continuing operations | 78 | 166 | (88 | ) | |||||||
(Loss) income from discontinued operations, net of tax | (171 | ) | 4 | (175 | ) | ||||||
Net (loss) income | (93 | ) | 170 | (263 | ) | ||||||
Net income attributable to non-controlling interests | 43 | 36 | 7 | ||||||||
Net (loss) income attributable to Visteon Corporation | $ | (136 | ) | $ | 134 | $ | (270 | ) | |||
Adjusted EBITDA* | $ | 363 | $ | 304 | $ | 59 | |||||
* Adjusted EBITDA is a Non-GAAP financial measure, as further discussed below. | |||||||||||
Sales
Sales for the six-month period ended June 30, 2014, totaled $3,500 million, which represents an increase of $304 million compared with the same period of 2013. Sales increased $158 million primarily due to favorable customer volumes and product mix in the Company's Climate and Electronics product groups. The acquisition of a controlling ownership interest in YFVE increased sales $166 million. Favorable currency of $31 million increased sales, primarily attributable to the strengthening Korean Won and Euro, partially offset by the weakening of the Indian Rupee, Thai Baht, Argentinian Peso and Chinese Yuan. Other reductions of $51 million were associated with customer pricing, net of design savings, commercial agreements and other customer settlements.
Cost of Sales
Cost of sales increased $244 million for the six-month period ended June 30, 2014, when compared with the same period in 2013. The increase includes $141 million attributable to increased production volumes and changes in product mix, representing the variable nature of material and labor costs. The acquisition of a controlling ownership interest in YFVE increased cost of sales $124 million. Foreign currency increased cost of sales by $51 million including year over year impacts of the mix of receivables and payables denominated in currencies other than functional currencies. These increases were partially offset by $72 million of efficiencies including material, design, and usage economics and other costs.
Gross Margin
The Company's gross margin was $373 million for the six-month period ended June 30, 2014, compared to $313 million for the same period of 2013. The increase in gross margin included $42 million from YFVE, $21 million attributable to favorable cost performance and $17 million from favorable volume and mix. These increases were partially offset by $20 million of unfavorable currency.
Selling, General and Administrative Expenses
Selling, general, and administrative expenses were $165 million and $150 million during the six-month period ended June 30,
39
2014 and 2013, respectively. The increase included $9 million from YFVE and the non-recurrence of cost recoveries associated with divested businesses of $8 million.
Interest Expense, Net
Interest expense for the six-month period ended June 30, 2014, of $18 million included $10 million associated with the Company's 6.75% Senior Notes due April 15, 2019, $6 million associated with affiliate debt, $1 million associated with the Term Facility, and $1 million associated with commitment fees and amortization of debt issuance costs. During the six-month period ended June 30, 2013, interest expense was $23 million, including $16 million on the 6.75% Senior Notes due April 15, 2019, $4 million associated with affiliate debt, and $3 million for commitment fees and amortization of debt issuance costs. Interest expense associated with the 6.75% senior notes due April 2019 decreased by $6 million as compared to the six months ended June 30, 2013 due to lower interest owed as a result of the redemption of $50 million of notes in December 2013, $50 million of notes in April 2014, and the remaining $350 million of notes in May 2014. Interest income of $4 million for the six-month period ended June 30, 2014, decreased by $1 million when compared to $5 million for the same period of 2013 primarily due to lower interest rates.
Equity in Net Income of Non-Consolidated Affiliates
Equity in net income of non-consolidated affiliates decreased $73 million comparing the six-month periods ended June 30, 2014 and 2013. The decrease was primarily attributable to the sale of the Company's 50% ownership interest in Yanfeng during the fourth quarter of 2013.
Loss on Debt Extinguishment
Loss on debt extinguishment of $23 million during the six months ended June 30, 2014 reflected the redemption premium and unamortized original issue discount, debt fees and other debt issue costs associated with the redemption of the all of the remaining $400 million 6.75% Senior Notes due April 2019. $50 million of the 6.75% senior notes was redeemed at a 103% premium on April 10, 2014, and $350 million was redeemed at a 105.063% premium on May 9, 2014. In compliance with ASC 470 "Debt", the redemption of the senior notes qualified as a debt extinguishment.
Restructuring Expenses
The Company's restructuring reserves and related activity, including discontinued operations, is summarized below for the six-month period ended June 30, 2014.
Climate | Other | Corporate | Total | ||||||||||||
(Dollars in Millions) | |||||||||||||||
Restructuring reserve - December 31, 2013 | $ | 1 | $ | 25 | $ | 3 | $ | 29 | |||||||
Expenses | 13 | 5 | 1 | 19 | |||||||||||
Utilization | (1 | ) | (17 | ) | (4 | ) | (22 | ) | |||||||
Restructuring reserve - June 30, 2014 | $ | 13 | $ | 13 | $ | — | $ | 26 | |||||||
During the six months ended June 30, 2014, the Company recorded $19 million of restructuring expenses related to employee and severance termination benefits, including amounts associated with discontinued operations, including the following activities.
• | The Company recorded $10 million of restructuring expenses, primarily related to severance and termination benefits associated with approximately 270 employees in connection with the closure of Climate operation in Quilmes, Argentina. |
• | The Company recorded $2 million of restructuring expenses, primarily related to severance and termination benefits associated with approximately 90 employees in connection with the closure of Climate operations in Port Elizabeth, South Africa. |
• | In connection with the previously announced restructuring of three Interiors facilities in France, the Company recorded an additional $5 million of restructuring expenses, which remains accrued as of June 30, 2014, as part of the Other product group, in addition to $8 million associated with previously announced programs including the fundamental reorganization of operations at a facility in Brazil. |
• | During the first quarter of 2014, the Company recorded $2 million of restructuring expenses in connection with previously announced restructuring program designed to reduce fixed costs and to improve operational efficiency. |
40
During the six months ended June 30, 2013, the Company recorded $23 million of restructuring expenses related to severance and termination benefits, including amounts associated with discontinued operations, for approximately 180 employees under a previously announced $100 million program designed to reduce fixed costs and to improve operational efficiency.
Other Expenses
Other expenses consist of the following:
Six Months Ended June 30 | |||||||
2014 | 2013 | ||||||
(Dollars in Millions) | |||||||
Transformation costs | $ | 14 | $ | 13 | |||
Provision for losses on recoverable taxes | 8 | — | |||||
Gain on sale of equity interest | (2 | ) | (5 | ) | |||
$ | 20 | $ | 8 | ||||
The Company recorded transformation costs of $14 million and $13 million for the six months ended June 30, 2014 and 2013, respectively, related to financial and advisory services associated with continued execution of its comprehensive shareholder value creation plan.
The Company recorded $8 million during the six months ended June 30, 2014 to adjust recoverable value-added taxes to net realizable value attributable to business exit activities.
In April 2014, the Company completed the sale of its 50% ownership interest in Duckyang Industry Co., Ltd. ("Duckyang"), a Korean automotive interiors supplier. In connection with the transaction, the Company received total cash of approximately $31 million, including $6 million of dividends. The Company recorded a pre-tax gain of approximately $2 million on this transaction during the six months ended June 30, 2014.
In February 2013, the Company entered into an agreement to sell its 20% equity interest in Dongfeng Visteon Automotive Trim Systems Co. Ltd, for cash proceeds of approximately $20 million. The Company recognized a gain of approximately $5 million upon completion of the sale in the second quarter of 2013.
Income Taxes
The Company's provision for income taxes of $72 million for the six-month period ended June 30, 2014, represents an increase of $36 million when compared with an income tax provision of $36 million in the same period of 2013. The increase in income tax expense reflects a year-over-year $45 million increase in expenses related to uncertain tax benefits, which includes the non-recurrence of a $35 million benefit, including interest and penalties, primarily attributable to reevaluating transfer pricing-related exposures in Europe and the United States due to audit closures in the first quarter of 2013, and uncertainty surrounding the incentives associated with the Company's research and development activities in Asia recorded during the second quarter of 2014. These increases were partially offset by the year-over-year reduction in withholding taxes due to the elimination of Yanfeng equity earnings in December 2013 and other items.
Discontinued Operations
On May 1, 2014, the Company reached an agreement for the sale of substantially all of its global Interiors operations for de minimis proceeds (the "Interiors Transaction"). Accordingly, the results of operations of the Interiors business subject to the Interiors Transaction have been reclassified to Loss/(income) from discontinued operations, net of tax in the Consolidated Statements of Comprehensive Income for the six-month period ended June 30, 2014.
41
The results of operations for the discontinued Interiors business for the six months ended June 30, 2014 and 2013 are as follows:
Six Months Ended June 30 | |||||||
2014 | 2013 | ||||||
(Dollars in Millions) | |||||||
Sales | $ | 522 | $ | 552 | |||
Cost of sales | 477 | 526 | |||||
Gross margin | 45 | 26 | |||||
Selling, general and administrative expenses | 27 | 27 | |||||
Long-lived asset impairment | 173 | — | |||||
Other expenses | 14 | 10 | |||||
Loss from discontinued operations before income taxes | (169 | ) | (11 | ) | |||
Provision for (benefit from) income taxes | 2 | (15 | ) | ||||
Loss/(income) from discontinued operations, net of tax | $ | (171 | ) | $ | 4 | ||
Net Loss (Income)
Net loss attributable to Visteon was $136 million for the six-month period ended June 30, 2014, compared to net income attributable to Visteon of $134 million for the same period of 2013, for a decrease of $270 million. The decrease was largely due to the long-lived asset impairment charge of $173 million recognized in the loss from discontinued operations in relation to the agreement to sell the majority of the Company's Interiors operations in the second quarter of 2014, lower equity in net income of non-consolidated affiliates related to the disposition of the Company's 50% ownership interest in Yanfeng, and the non-recurrence of an income tax benefit, including interest and penalties, attributable to reevaluating transfer pricing-related exposures in Europe and the United States in connection with audit closures in the first quarter of 2013.
Adjusted EBITDA (a non-GAAP financial measure, as defined below) was $363 million and $304 million, for the six-month periods ended June 30, 2014 and 2013, respectively. The Company defines Adjusted EBITDA as net income attributable to the Company, plus net interest expense, provision for income taxes and depreciation and amortization, as further adjusted to eliminate the impact of equity in net income of non-consolidated affiliates, net income attributable to non-controlling interests, assets impairment, gains or losses on divestitures, net restructuring expenses and other reimbursable costs, non-cash stock-based compensation expense, certain employee charges and benefits, reorganization items and other non-operating gains and losses.
Through December 31, 2013, the Company’s definition of Adjusted EBITDA was inclusive of net income attributable to non-controlling interests and equity in net income of non-consolidated affiliates. Following the December 17, 2013, disposition of its 50% ownership interest in Yanfeng, the Company modified its definition of Adjusted EBITDA to exclude net income attributable to non-controlling interests and equity in net income of non-consolidated affiliates as management believes this measure is most reflective of its operational performance. Accordingly, Adjusted EBITDA for historical periods has been recast on basis consistent with the current definition.
Adjusted EBITDA is not a recognized term under accounting principles generally accepted in the United States and does not purport to be a substitute for net income as an indicator of operating performance or cash flows from operating activities as a measure of liquidity. Adjusted EBITDA has limitations as an analytical tool and is not intended to be a measure of cash flow available for management's discretionary use, as it does not consider certain cash requirements such as interest payments, tax payments and debt service requirements. In addition, the Company uses Adjusted EBITDA (i) as a factor in incentive compensation decisions, (ii) to evaluate the effectiveness of the Company's business strategies and (iii) because the Company's credit agreements use measures similar to Adjusted EBITDA to measure compliance with certain covenants. Adjusted EBITDA, as determined and measured by the Company should not be compared to similarly titled measures reported by other companies.
42
The reconciliation of Adjusted EBITDA to net income attributable to Visteon for the six-month periods ended June 30, 2014 and 2013 is as follows:
Six Months Ended June 30 | |||||||||||
2014 | 2013 | Change | |||||||||
(Dollars in Millions) | |||||||||||
Adjusted EBITDA | $ | 363 | $ | 304 | $ | 59 | |||||
Interest expense, net | 14 | 18 | (4 | ) | |||||||
Provision for income taxes | 72 | 36 | 36 | ||||||||
Depreciation and amortization | 121 | 119 | 2 | ||||||||
Net income attributable to non-controlling interests | 43 | 36 | 7 | ||||||||
Equity in net income of non-consolidated affiliates | (13 | ) | (86 | ) | 73 | ||||||
Loss on debt extinguishment | 23 | — | 23 | ||||||||
Restructuring expenses | 14 | 21 | (7 | ) | |||||||
Other expenses | 20 | 8 | 12 | ||||||||
Non-cash, stock-based compensation expense | 6 | 10 | (4 | ) | |||||||
Other | 1 | — | 1 | ||||||||
Discontinued operations | 198 | 8 | 190 | ||||||||
Net (loss) income attributable to Visteon Corporation | $ | (136 | ) | $ | 134 | $ | (270 | ) | |||
Segment Results of Operations - Six Months Ended June 30, 2014 and 2013
Sales by Segment
Climate | Electronics | Other | Eliminations | Total | |||||||||||||||
(Dollars in Millions) | |||||||||||||||||||
Six months ended June 30, 2013 | $ | 2,475 | $ | 719 | $ | 99 | $ | (97 | ) | $ | 3,196 | ||||||||
Volume and mix | 131 | 14 | (31 | ) | 44 | 158 | |||||||||||||
Currency | 30 | (2 | ) | 3 | — | 31 | |||||||||||||
YFVE consolidation | — | 166 | — | — | 166 | ||||||||||||||
Other | (36 | ) | (15 | ) | — | — | (51 | ) | |||||||||||
Six months ended June 30, 2014 | $ | 2,600 | $ | 882 | $ | 71 | $ | (53 | ) | $ | 3,500 | ||||||||
Climate sales increased during the six months ended June 30, 2014, by $125 million. Higher production volumes in Asia and Europe, increased sales by $131 million. Favorable currency resulted in an increase of $30 million, primarily related to the Euro, and Korean Won, partially offset by the Indian Rupee, Argentinian Peso and Thai Baht. Other reductions of $36 million were associated with customer pricing, net of design changes, partially offset by a $12 million commercial settlement.
Electronics sales increased during the six months ended June 30, 2014, by $163 million. The acquisition of a controlling ownership interest in YFVE with effect from November 2013, increased sales by $166 million. Higher production volumes increased sales by $14 million, reflecting incremental new business in Asia and Europe. Unfavorable currency, primarily related to the Indian Rupee, Japanese Yen, and Brazilian Real, partially offset by the Euro, decreased product sales by $2 million. Other changes, totaling $15 million, reflected customer pricing net of design changes.
Other sales decreased during the six months ended June 30, 2014, by $28 million, including unfavorable volume and product mix of $31 million primarily reflecting the wind down of certain South America business. Currency increased sales by $3 million, largely related to the Euro.
43
Cost of Sales by Segment
Climate | Electronics | Other | Eliminations | Total | |||||||||||||||
(Dollars in Millions) | |||||||||||||||||||
Six months ended June 30, 2013 | $ | 2,242 | $ | 641 | $ | 97 | $ | (97 | ) | $ | 2,883 | ||||||||
Material | 98 | (19 | ) | (19 | ) | 44 | 104 | ||||||||||||
Freight and duty | (8 | ) | (2 | ) | (1 | ) | — | (11 | ) | ||||||||||
Labor and overhead | 3 | 3 | — | — | 6 | ||||||||||||||
Depreciation and amortization | (3 | ) | (1 | ) | — | — | (4 | ) | |||||||||||
YFVE consolidation | — | 124 | — | — | 124 | ||||||||||||||
Other | 29 | (1 | ) | (3 | ) | — | 25 | ||||||||||||
Six months ended June 30, 2014 | $ | 2,361 | $ | 745 | $ | 74 | $ | (53 | ) | $ | 3,127 | ||||||||
Climate material costs increased by $98 million, including $152 million related to higher production volumes, partially offset by $54 million of manufacturing efficiencies and purchasing improvements. Freight and duty decreased $8 primarily related to the non-recurrence of premium freight charges in Europe and China. Labor and overhead increased by $3 million, including $9 million related to production volumes and currency and $6 million related to lower manufacturing costs. Other increases of $29 million include currency impacts of the mix of receivables and payables denominated in currencies other than functional currencies.
Electronics material costs decreased by $19 million, including manufacturing efficiencies and purchasing improvements. Cost of sales increased $124 million, net of inter-segment eliminations of $74 million, for the acquisition of a controlling ownership interest in YFVE with effect from November 2013. Other decreases of $1 million primarily related to the impact of manufacturing efficiencies, purchasing improvements, and timing of engineering recoveries.
Other material and freight and duty decreased by $19 million and $1 million, respectively, primarily related to lower production volumes in connection with the wind down of certain South America programs and currency.
Adjusted EBITDA by Segment
Adjusted EBITDA by segment for the six months ended June 30, 2014 and 2013 is presented in the table below:
Six Months Ended June 30 | |||||||||||
2014 | 2013 | Change | |||||||||
(Dollars in Millions) | |||||||||||
Climate | $ | 264 | $ | 261 | $ | 3 | |||||
Electronics | 107 | 56 | 51 | ||||||||
Other | (4 | ) | (5 | ) | 1 | ||||||
Total Segment Adjusted EBITDA | 367 | 312 | 55 | ||||||||
Reconciling Items: | |||||||||||
Discontinued Operations | 27 | 12 | 15 | ||||||||
Corporate | (31 | ) | (20 | ) | (11 | ) | |||||
Total consolidated | $ | 363 | $ | 304 | $ | 59 | |||||
44
Changes in Adjusted EBITDA by segment are presented in the table below:
Climate | Electronics | Other | Total | ||||||||||||
(Dollars in Millions) | |||||||||||||||
Six months ended June 30, 2013 | $ | 261 | $ | 56 | $ | (5 | ) | $ | 312 | ||||||
Volume and mix | 12 | 4 | 1 | 17 | |||||||||||
Currency | (28 | ) | 6 | — | (22 | ) | |||||||||
YFVE consolidation | — | 43 | — | 43 | |||||||||||
Other | 19 | (2 | ) | — | 17 | ||||||||||
Six months ended June 30, 2014 | $ | 264 | $ | 107 | $ | (4 | ) | 367 | |||||||
Reconciling Items: | |||||||||||||||
Discontinued Operations | 27 | ||||||||||||||
Corporate | (31 | ) | |||||||||||||
Total | $ | 363 | |||||||||||||
Adjusted EBITDA for the Climate segment for the six months ended June 30, 2014, increased by $3 million compared to the same period of 2013. The increase in Climate Adjusted EBITDA reflected increased volume of $12 million associated with net new business including Hyundai in Asia and Europe. Currency had a $28 million negative impact on Climate Adjusted EBITDA, largely related to the strengthening Korean Won and Euro and weakening Indian Rupee, Argentinian Peso and Thai Baht, as well as currency impacts of the mix of receivables and payables denominated in currencies other than functional currencies. Other changes of $19 million reflect a commercial settlement of $12 million as well as material, design and other cost efficiencies, partially offset by customer price productivity.
Electronics Adjusted EBITDA for the six months ended June 30, 2014, increased by $51 million compared to the same period of 2013. The YFVE consolidation during the fourth quarter of 2013, increased Adjusted EBITDA by $43 million. Higher volumes in Asia and Europe and currency, largely related to a stronger Euro, also had favorable impacts of $4 million and $6 million, respectively. Other reductions of $2 million reflected other material, design and other cost efficiencies offset by customer pricing, net of design changes.
Other Adjusted EBITDA, decreased during the six months ended June 30, 2014, by $1 million, due to lower production volumes.
Liquidity
The Company’s primary liquidity needs are related to the funding of general business requirements, including working capital, capital expenditures, debt service, employee retirement benefits and restructuring actions. The Company's primary sources of liquidity are cash flows from operations, existing cash balances, asset sales, and borrowings under available credit facilities, if necessary. To the extent the Company generates discretionary cash flow, it will be evaluated for and may be used for optional prepayments of existing indebtedness, strategic acquisitions, additional share repurchases, and/or general corporate purposes.
Credit Facilities
On March 11, 2014, the Company issued a call notice to redeem $50 million, or 10%, of its 6.75% senior notes due April 15, 2019 (the "Senior Notes"). The Senior Notes were issued under an Indenture (the “Indenture”) among the Company, the subsidiary guarantors named therein, and The Bank of New York Mellon Trust Company, N.A., as trustee. The Indenture and the form of Senior Notes provide, among other things, that prior to April 15, 2014, the Company had the option to redeem up to 10% of the Senior Notes during any 12-month period from the issue date until April 15, 2014, for a 103% redemption price, plus accrued and unpaid interest to the redemption date. On April 10, 2014, the Company made a cash settlement payment of approximately $52 million in connection with this redemption. Pursuant to the Indenture, the Company also had the option to redeem a portion or all of the Senior Notes beginning on April 15, 2014, for a 105.063% redemption price, plus accrued and unpaid interest to the redemption date. On April 9, 2014, the Company issued a call notice to redeem the remaining $350 million of its Senior Notes. On May 9, 2014, the Company made a cash settlement payment of approximately $369 million in connection with this redemption.
On April 9, 2014, the Company entered into a new credit agreement, which provides for (i) delayed draw term loans in an aggregate principal amount of $600 million that mature on April 9, 2021, and (ii) a $200 million revolving credit facility that matures on April 9, 2019. In connection with the execution of the new credit agreement, the Company terminated its $130 million asset-based revolving loan credit agreement dated October 1, 2010, under which there were no outstanding borrowings or letter of credit
45
obligations at termination. Up to $75 million of the Revolving Facility is available for the issuance of letters of credit, and any such issuance of letters of credit will reduce the amount available for loans under the Revolving Facility. Up to $20 million of the Revolving Facility is available for swing line advances, and any such swing line advances will reduce the amount available for loans under the Revolving Facility. The Company may request increases in the limits under the Term Facility and the Revolving Facility and may request the addition of one or more term loan facilities under the Credit Agreement. The facilities were rated as BB- and B1 by S&P and Moody's, respectively. On June 23, 2014, the Company drew the $600 million term loan. As of June 30, 2014, $600 million was outstanding under the Term Facility, and there were no outstanding borrowings under the Revolving Facility.
Availability under outstanding affiliate credit facilities, excluding the Interiors discontinued operations, as of June 30, 2014 is approximately $303 million and certain of these facilities have pledged receivables, inventory or equipment as security. Access to additional capital through the debt or equity markets is influenced by the Company's credit ratings. At June 30, 2014, the Company's corporate credit ratings were B1 by Moody's with a stable outlook and B+ by S&P with a positive outlook.
The Interiors business has an arrangement, through a subsidiary in France, to sell accounts receivable on an uncommitted basis. The amount of financing available is contingent upon the amount of receivables less certain reserves. As of June 30, 2014, there was $31 million of outstanding borrowings under this facility which were recorded as Liabilities held for sale on the consolidated balance sheet with $47 million of receivables pledged as security which were recorded as Assets held for sale on the consolidated balance sheet.
Cash Balances
As of June 30, 2014, the Company had total cash balances of $1,425 million, including $12 million of restricted cash, $114 million of cash held for sale and $14 million of restricted cash held for sale. Cash balances totaling $732 million were located in jurisdictions outside of the United States, of which approximately $390 million is considered permanently reinvested for funding ongoing operations outside of the U.S. If such permanently reinvested funds are needed for operations in the U.S., the Company would be required to accrue additional tax expense, primarily related to foreign withholding taxes. During the six months ended June 30, 2014, the Company received $60 million of cash from asset sales and business divestitures, including $33 million proceeds generated from the sale of four YFVE interiors joint ventures to the non-consolidated Yanfeng Visteon Electronics (China) Investment Co. Ltd. ("YFVIC") owned 50% by the Company and $25 million from the sale of the Company's sale its 50% ownership interest in Duckyang Industries Co., Ltd.
Share Repurchase Program
On May 8, 2014, the Company announced an ASB program with a third-party financial institution to repurchase shares of common stock for an aggregate purchase price of $500 million. Under the program, the Company paid the financial institution $500 million and received an initial delivery of 3,394,157 shares of common stock using a reference price of $92.07, and an additional delivery of 1,129,001 shares of common stock following the conclusion of the hedge period which determined a certain minimum amount of shares guaranteed under a portion of the program that had a maximum per share price of $100.54. The final settlement will be generally based on the volume-weighted average price of the Company's common stock over a period of up to approximately 12 months, less a negotiated discount, 50 percent of which will be subject to a maximum per share price. As of June 30, 2014, $375 million remained authorized and available for repurchase through December 31, 2015. The Company anticipates that additional repurchases of common stock, if any, would occur from time to time in open market transactions or in privately negotiated transactions depending on market and economic conditions, share price, trading volume, alternative uses of capital and other factors.
Electronics Acquisition
In connection with the Company's shareholder value creation strategy, Visteon continues to invest in the optimization of its Electronics business. On January 13, 2014, Visteon reached an agreement to acquire the automotive electronics business of Johnson Controls for cash of $265 million, subject to adjustment. The acquisition was completed on July 1, 2014 for $265 million, plus certain working capital, net cash and other adjustments.
Interiors Divestiture
On May 1, 2014, the Company reached an agreement for the sale of substantially all of its global Interiors operations for nominal proceeds. The closing of the Interiors sale transaction is expected to occur by December 31, 2014, and is subject to various conditions, including regulatory and antitrust approvals, receipt of other third party consents and approvals and other customary closing conditions. In connection with the transaction, Visteon has agreed to contribute up to $95 million to the business and has
46
agreed to support the establishment of external credit facilities for the business and, if $90 million of external credit facilities are not available to the business by the closing date, to provide a seller-backed revolving credit facility in the amount of any shortfall to support the liquidity of the business. Draws under any such seller-backed facility will only be available if certain of the external credit facilities are fully drawn, and any draws on the seller-backed facility generally must be repaid prior to the repayment of the external credit facilities. The seller-backed facility will have a maturity of three years and, if drawn, will be repaid once additional committed facilities are in place after the transaction closes.
Additionally, during April 2014, the Company completed the sale its 50% ownership interest in Duckyang Industries Co., Ltd., for total cash proceeds of $31 million, including $6 million of dividends. The Company's goal is to complete the disposal of its remaining Interiors business during 2014. Due to certain liabilities and capital requirements of the remaining business, Visteon may be required to contribute cash to such business in connection with any disposition, which amounts could be material.
Restructuring and Other
At June 30, 2014, the Company had restructuring accruals totaling $26 million which are expected to be settled in cash during 2014. These accruals include $23 million associated with activities related to the Company's previously announced $100 million restructuring program designed to reduce fixed costs and to improve operational efficiency by addressing certain under-performing operations. The Company anticipates that it will record additional restructuring and other charges related to this program of up to $5 million in future periods as related plans are finalized. The Company estimates cash requirements for restructuring programs during the full year ending December 31, 2014, to be approximately $65 million.
During 2012, South Korean tax authorities commenced a review of the Company's South Korean affiliates (including Halla) for tax years 2007 through 2012 and issued formal notice of assessments, including penalties, of approximately $25 million for alleged underpayment of withholding tax on dividends paid and other items, including certain management service fees charged by Visteon. The Company's South Korean affiliates have paid approximately $25 million to the tax authorities in 2013 and 2012, as required under South Korean tax regulations, to pursue the appeals process. The Company believes that it is more likely than not that it will receive a favorable ruling when all of the available appeals have been exhausted. Also during 2012, Brazilian tax authorities issued tax assessment notices to Visteon Sistemas Automotivos (“Sistemas”) of approximately $15 million related to the sale of its chassis business to a third party. During 2013, after attempts to reopen an appeal of the administrative decision failed, Sistemas opened a judicial proceeding against the government to address the notice which required a deposit in the amount of the assessment in order to suspend the debt and allow Sistemas to operate regularly before the tax authorities. The Company believes that the risk of a negative outcome is remote once the matter is fully litigated at the highest judicial level. These appeal payments in South Korea and Brazil, as well as contingent income tax refund claims associated with other jurisdictions, including applicable accrued interest income, totaled $48 million as of June 30, 2014, and were included in Other non-current assets on the consolidated balance sheet.
The Company expects to make cash contributions to its U.S. retirement plans of $5 million in 2014. Contributions to non-U.S. retirement plans are expected to be $42 million during 2014. Estimated cash contributions for 2015 through 2017, under current regulations and market assumptions and including amounts associated to plans within the Interiors business, are approximately $161 million.
Cash Flows
The Company has combined cash flows from discontinued operations with cash flows from continuing operations within the operating, investing and financing categories in the Consolidated Statements of Cash Flows of our consolidated financial statements in this Quarterly Report on Form 10-Q for all periods presented. As such, the discussion below includes both continuing and discontinued operations.
Operating Activities
The Company generated $127 million of cash from operating activities during the six months ended June 30, 2014, compared to $158 million during the same period of 2013, for a decrease of $31 million. Higher trade accounts payable disbursements during the six months ended June 30, 2014, as compared to the same period of 2013, related to contractual payment due dates contributed approximately $80 million to the decrease. Higher employee benefit related payments of $20 million and the non-recurrence of changes in receivable terms for certain customers in Asia of $16 million also contributed to the decrease. These decreases were partially offset by the non-recurrence of a $22 million payment to Korean tax authorities that occurred in 2013, incremental value-added tax collections of $19 million, higher dividends from non-consolidated affiliates of $14 million and lower cash taxes of $9 million. The remaining difference was driven by higher collections as compared to payments related to increased profitability from favorable cost performance, volume and mix including the impact of YFVE.
47
Investing Activities
Cash used by investing activities during the six months ended June 30, 2014 totaled $71 million, compared to a use of $75 million for the same period in 2013. Cash used by investing activities during the six months ended June 30, 2014 included $127 million of capital spending partially offset by $60 million of proceeds from asset sales which included proceeds from the sale of various interests owned by YFVE and the sale of the Company's 50% ownership interest in Duckyang Industries Co., Ltd. Cash used by investing activities during the six months ended June 30, 2013 included $114 million of capital spending partially offset by $39 million of proceeds from asset sales including the Company's 50% ownership interest in Visteon TYC Corporation and 20% equity interest in Dongfeng Visteon Automotive Trim Systems Co., Ltd.
Financing Activities
Cash used by financing activities during the six months ended June 30, 2014 totaled $336 million, compared to $96 million provided by financing activities for the same period in 2013. Cash used by financing activities during the six months ended June 30, 2014 included $500 in share repurchases related to an accelerated stock buyback program, the Company's redemption of $350 million of outstanding 6.75% Senior Notes due 2019 at 105.063% and $50 million at 103% of par, and $45 million of dividends paid to non-controlling interests. This was partially offset by $590 million of net proceeds from the draw on the Company's Term Facility and a net increase in other affiliate short-term debt of $35 million. Financing activities during the six months ended June 30, 2013 included $195 million of proceeds related to the two HVCC unsecured bilateral term loan credit agreements completed in January 2013 and an increase in other affiliate debt, partially offset by $125 million in share repurchases related to an accelerated stock buyback program and $22 million of dividends paid to non-controlling interests.
Debt and Capital Structure
The Company's 6.75% senior notes due April 15, 2019 (the"Senior Notes") were issued under an Indenture (the “Indenture”) among the Company, the subsidiary guarantors named therein, and The Bank of New York Mellon Trust Company, N.A., as trustee. The Indenture and the form of Senior Notes provide, among other things, that prior to April 15, 2014, the Company had the option to redeem up to 10% of the Senior Notes during any 12-month period from the issue date until April 15, 2014, for a 103% redemption price, plus accrued and unpaid interest to the redemption date. On April 10, 2014, the Company exercised this right and redeemed $50 million, or 10%, of its Senior Notes. Additionally, the Company had the option to redeem a portion or all of the Senior Notes beginning on April 15, 2014, for a 105.063% redemption price, plus accrued and unpaid interest to the redemption date. On April 9, 2014, in conjunction with the closing of a new term loan facility, the Company exercised this right and issued a call notice and redeemed the remaining $350 million of its Senior Notes on May 9, 2014.
On April 9, 2014, the Company entered into a new credit agreement, by and among the Company as borrower, each lender from time to time party thereto, each letter of credit issuer from time to time party thereto and Citibank, N.A. as administrative agent, which provides for (i) delayed draw term loans in an aggregate principal of $600 million and (ii) a $200 million revolving credit facility. The Company and certain of its subsidiaries have granted a security interest in substantially all of their respective property, subject to certain limitations. On June 23, 2014, the Company drew the $600 million term loan.
Additional information related to the Company’s debt is set forth in Note 10, “Debt” to the consolidated financial statements included herein under Item 1. For additional information, refer to the Company's Annual Report on Form 10-K for the year ended December 31, 2013, for specific debt agreements and additional information related to covenants and restrictions.
Off-Balance Sheet Arrangements
The Company has a $15 million Letter of Credit ("LOC") Facility with US Bank National Association, which expires on September 30, 2015. Under the terms of the LOC facility, the Company must maintain a collateral account with U.S. Bank equal to 103% of the aggregated stated amount of the issued LOCs (or 110% for non-U.S. currencies) with reimbursement for any draws. As of June 30, 2014, the Company had $10 million of outstanding letters of credit issued under this facility and secured by restricted cash. In addition, the Company had $21 million of locally issued letters of credit to support various customs arrangements and other obligations at its local affiliates, including amounts attributable to discontinued operations, of which $15 million are secured by cash collateral.
48
Fair Value Measurements
The Company uses fair value measurements in the preparation of its financial statements, which utilize various inputs including those that can be readily observable, corroborated or generally unobservable. The Company utilizes market-based data and valuation techniques that maximize the use of observable inputs and minimize the use of unobservable inputs. Additionally, the Company applies assumptions that market participants would use in pricing an asset or liability, including assumptions about risk. The primary financial instruments that are recorded at fair value in the Company's financial statements are derivative instruments.
The Company’s use of derivative instruments creates exposure to credit loss in the event of nonperformance by the counterparty to the derivative financial instruments. The Company limits this exposure by entering into agreements directly with a variety of major financial institutions with high credit standards and that are expected to fully satisfy their obligations under the contracts. Fair value measurements related to derivative assets take into account the non-performance risk of the respective counterparty, while derivative liabilities take into account the non-performance risk of Visteon and its foreign affiliates. The hypothetical gain or loss from a 100 basis point change in non-performance risk would be less than $1 million for the fair value of foreign currency derivatives as of June 30, 2014.
Recent Accounting Pronouncements
See Note 1 “Basis of Presentation” to the accompanying consolidated financial statements under Item 1 “Financial Statements" of this Quarterly Report on Form 10-Q for a discussion of recent accounting pronouncements.
Forward-Looking Statements
Certain statements contained or incorporated in this Quarterly Report on Form 10-Q which are not statements of historical fact constitute “Forward-Looking Statements” within the meaning of the Private Securities Litigation Reform Act of 1995 (the “Reform Act”). Forward-looking statements give current expectations or forecasts of future events. Words such as “anticipate”, “expect”, “intend”, “plan”, “believe”, “seek”, “estimate” and other words and terms of similar meaning in connection with discussions of future operating or financial performance signify forward-looking statements. These statements reflect the Company’s current views with respect to future events and are based on assumptions and estimates, which are subject to risks and uncertainties including those discussed in Item 1A under the heading “Risk Factors” and elsewhere in this report. Accordingly, undue reliance should not be placed on these forward-looking statements. Also, these forward-looking statements represent the Company’s estimates and assumptions only as of the date of this report. The Company does not intend to update any of these forward-looking statements to reflect circumstances or events that occur after the statement is made and qualifies all of its forward-looking statements by these cautionary statements.
You should understand that various factors, in addition to those discussed elsewhere in this document, could affect the Company’s future results and could cause results to differ materially from those expressed in such forward-looking statements, including:
• | Visteon’s ability to satisfy its future capital and liquidity requirements; Visteon’s ability to access the credit and capital markets at the times and in the amounts needed and on terms acceptable to Visteon; Visteon’s ability to comply with covenants applicable to it; and the continuation of acceptable supplier payment terms. |
• | Visteon’s ability to satisfy its pension and other postretirement employee benefit obligations, and to retire outstanding debt and satisfy other contractual commitments, all at the levels and times planned by management. |
• | Visteon’s ability to access funds generated by its foreign subsidiaries and joint ventures on a timely and cost effective basis. |
• | Changes in the operations (including products, product planning and part sourcing), financial condition, results of operations or market share of Visteon’s customers. |
• | Changes in vehicle production volume of Visteon’s customers in the markets where it operates, and in particular changes in Ford’s and Hyundai Kia’s vehicle production volumes and platform mix. |
• | Increases in commodity costs or disruptions in the supply of commodities, including steel, resins, aluminum, copper, fuel and natural gas. |
• | Visteon’s ability to generate cost savings to offset or exceed agreed upon price reductions or price reductions to win additional business and, in general, improve its operating performance; to achieve the benefits of its restructuring actions; and to recover engineering and tooling costs and capital investments. |
• | Visteon’s ability to compete favorably with automotive parts suppliers with lower cost structures and greater ability to rationalize operations; and to exit non-performing businesses on satisfactory terms, particularly due to limited flexibility under existing labor agreements. |
49
• | Restrictions in labor contracts with unions that restrict Visteon’s ability to close plants, divest unprofitable, noncompetitive businesses, change local work rules and practices at a number of facilities and implement cost-saving measures. |
• | The costs and timing of facility closures or dispositions, business or product realignments, or similar restructuring actions, including potential asset impairment or other charges related to the implementation of these actions or other adverse industry conditions and contingent liabilities. |
• | Significant changes in the competitive environment in the major markets where Visteon procures materials, components or supplies or where its products are manufactured, distributed or sold. |
• | Legal and administrative proceedings, investigations and claims, including shareholder class actions, inquiries by regulatory agencies, product liability, warranty, employee-related, environmental and safety claims and any recalls of products manufactured or sold by Visteon. |
• | Changes in economic conditions, currency exchange rates, changes in foreign laws, regulations or trade policies or political stability in foreign countries where Visteon procures materials, components or supplies or where its products are manufactured, distributed or sold. |
• | Shortages of materials or interruptions in transportation systems, labor strikes, work stoppages or other interruptions to or difficulties in the employment of labor in the major markets where Visteon purchases materials, components or supplies to manufacture its products or where its products are manufactured, distributed or sold. |
• | Changes in laws, regulations, policies or other activities of governments, agencies and similar organizations, domestic and foreign, that may tax or otherwise increase the cost of, or otherwise affect, the manufacture, licensing, distribution, sale, ownership or use of Visteon’s products or assets. |
• | Possible terrorist attacks or acts of war, which could exacerbate other risks such as slowed vehicle production, interruptions in the transportation system or fuel prices and supply. |
• | The cyclical and seasonal nature of the automotive industry. |
• | Visteon’s ability to comply with environmental, safety and other regulations applicable to it and any increase in the requirements, responsibilities and associated expenses and expenditures of these regulations. |
• | Visteon’s ability to protect its intellectual property rights, and to respond to changes in technology and technological risks and to claims by others that Visteon infringes their intellectual property rights. |
• | Visteon’s ability to quickly and adequately remediate control deficiencies in its internal control over financial reporting. |
• | Other factors, risks and uncertainties detailed from time to time in Visteon’s Securities and Exchange Commission filings. |
50
Item 3. | Quantitative and Qualitative Disclosures About Market Risk |
The primary market risks to which the Company is exposed include changes in foreign currency exchange rates, interest rates and certain commodity prices. The Company manages these risks through derivative instruments and various operating actions including fixed price contracts with suppliers and cost sourcing arrangements with customers. The Company's use of derivative instruments is limited to hedging activities and such instruments are not used for speculative or trading purposes, as per clearly defined risk management policies. Additionally, the Company's use of derivative instruments creates exposure to credit loss in the event of nonperformance by the counter-party to the derivative financial instruments. The Company limits this exposure by entering into agreements directly with a variety of major financial institutions with high credit standards and that are expected to fully satisfy their obligations under the contracts. Additionally, the Company's ability to utilize derivatives to manage market risk is dependent on credit conditions and market conditions given the current economic environment.
Foreign Currency Risk
The Company's net cash inflows and outflows exposed to the risk of changes in exchange rates arise from the sale of products in countries other than the manufacturing source, foreign currency denominated supplier payments, debt and other payables, subsidiary dividends and investments in subsidiaries. Where possible, the Company utilizes derivative financial instruments to manage foreign currency exchange rate risks. Forward and option contracts may be utilized to protect the Company's cash flow from adverse movements in exchange rates. Foreign currency exposures are reviewed periodically and any natural offsets are considered prior to entering into a derivative financial instrument. The Company's primary hedged operating exposures include the Euro, Korean Won, Czech Koruna, Hungarian Forint, Indian Rupee and Mexican Peso. Where possible, the Company utilizes a strategy of partial coverage for transactions in these currencies. As of June 30, 2014 and December 31, 2013, the net fair value of foreign currency forward contracts was an asset of $17 million and $4 million, respectively.
The hypothetical pre-tax gain or loss in fair value from a 10% favorable or adverse change in quoted currency exchange rates would be approximately $46 million and $63 million as of June 30, 2014 and December 31, 2013, respectively. These estimated changes assume a parallel shift in all currency exchange rates and include the gain or loss on financial instruments used to hedge loans to subsidiaries. Because exchange rates typically do not all move in the same direction, the estimate may overstate the impact of changing exchange rates on the net fair value of the Company's financial derivatives. It is also important to note that gains and losses indicated in the sensitivity analysis would generally be offset by gains and losses on the underlying exposures being hedged.
In addition to the transactional exposure described above, the Company's operating results are impacted by the translation of its foreign operating income into U.S. dollars. The Company does not enter into foreign exchange contracts to mitigate this exposure.
Interest Rate Risk
The Company is subject to interest rate risk, principally in relation to fixed rate debt. The Company may use derivative financial instruments to manage exposure to fluctuations in interest rates. However, as of June 30, 2014, the Company had no outstanding interest rate derivative instruments.
Approximately 3% and 58% of the Company's borrowings were effectively on a fixed rate basis as of June 30, 2014 and December 31, 2013, respectively. The Company continues to evaluate its interest rate exposure and may use swaps or other derivative instruments again in the future.
Commodity Risk
The Company's exposures to market risk from changes in the price of production material are managed primarily through negotiations with suppliers and customers, although there can be no assurance that the Company will recover all such costs. The Company continues to evaluate derivatives available in the marketplace and may decide to utilize derivatives in the future to manage select commodity risks if an acceptable hedging instrument is identified for the Company's exposure level at that time, as well as the effectiveness of the financial hedge among other factors.
51
Item 4. | Controls and Procedures |
Disclosure Controls and Procedures
The Company maintains disclosure controls and procedures that are designed to ensure that information required to be disclosed in periodic reports filed with the SEC under the Securities Exchange Act of 1934 is recorded, processed, summarized, and reported within the time periods specified in the SEC’s rules and forms, and that such information is accumulated and communicated to the Company’s management, including its Chief Executive Officer and Chief Financial Officer, as appropriate, to allow timely decisions regarding required disclosure.
As noted in our Annual Report on Form 10-K for the fiscal year ended December 31, 2013, management excluded Yanfeng Visteon Automotive Electronics Co., Ltd. (“YFVE”) from its assessment of the effectiveness of the Company's disclosure controls and procedures as the Company acquired an additional 11% ownership interest in YFVE resulting in a 51% controlling equity interest in November 2013.
As of June 30, 2014, an evaluation was performed under the supervision and with the participation of the Company’s management, including its Chief Executive and Financial Officers, of the effectiveness of the design and operation of disclosure controls and procedures, excluding YFVE. Based on that evaluation, the Chief Executive Officer and the Chief Financial Officer concluded that the Company’s disclosure controls and procedures were effective as of June 30, 2014.
Internal Control over Financial Reporting
There were no changes in the Company's internal control over financial reporting during the quarterly period ended June 30, 2014, that have materially affected, or are reasonably likely to materially affect, the Company's internal control over financial reporting. The Company is integrating YFVE into the Company's operations, compliance programs and internal control processes. Specifically, as permitted by SEC rules and regulations, the Company has excluded YFVE from management's evaluation of internal controls over financial reporting as of December 31, 2013.
Part II
Other Information
Item 1. | Legal Proceedings |
See the information above under Note 16, "Commitments and Contingencies," to the consolidated financial statements which is incorporated herein by reference.
Item 1A. | Risk Factors |
For information regarding factors that could affect the Company's results of operations, financial condition and liquidity, see the risk factors discussed in Part I, "Item 1A. Risk Factors" in the Company's Annual Report on Form 10-K for the year ended December 31, 2013. See also, "Forward-Looking Statements" included in Part I, Item 2 of this Quarterly Report on Form 10-Q.
Item 2. | Unregistered Sales of Equity Securities and Use of Proceeds |
The following table summarizes information relating to purchases made by or on behalf of the Company, or an affiliated purchaser, of shares of the Company’s common stock during the second quarter of 2014:
Period | Total Number of Shares (or Units) Purchased (1) | Average Price Paid per Share (or Unit) | Total Number of Shares (or units) Purchased as Part of Publicly Announced Plans or Programs (2) | Approximate Dollar Value of Shares (or Units) that May Yet Be Purchased Under the Plans or Programs (2) (in millions) | |||||
Apr. 1, 2014 to Apr. 30, 2014 | — | $0.00 | — | $875 | |||||
May 1, 2014 to May 31, 2014 | 4,523,312 | $94.18 | 4,523,158 | $375 | |||||
Jun. 1, 2014 to Jun. 30, 2014 | — | $0.00 | — | $375 | |||||
Total | 4,523,312 | $0.00 | 4,523,158 | $375 | |||||
52
(1) | This column includes 154 shares surrendered to the Company by employees to satisfy tax withholding obligations in connection with the vesting of restricted share and stock unit awards made pursuant to the Visteon Corporation 2010 Incentive Plan. |
(2) | On August 11, 2013, the board of directors increased its share repurchase program authorization by $875 million to a total authorization to repurchase up to $1 billion of the Company's common stock thereafter until December 31, 2015. In May 2014, the Company entered into an accelerated stock buyback ("ASB") program with a third-party financial institution to repurchase shares of common stock for an aggregate purchase price of $500 million. Under the ASB program, the Company paid the financial institution $500 million and received an initial delivery of 3,394,157 shares of common stock using a reference price of $92.07, and an additional delivery of 1,129,001 shares of common stock following the conclusion of the hedge period which determined a certain minimum amount of shares guaranteed under a portion of the program that had a maximum per share price of $100.54. The program is expected to be concluded between the fourth quarter of 2014 and the second quarter of 2015. The Company anticipates that additional repurchases of common stock, if any, would occur from time to time in open market transactions, non-discretionary programs or in privately negotiated transactions depending on market and economic conditions, share price, trading volumes, alternative uses of capital and other factors. |
Item 6. | Exhibits |
See Exhibit Index on Page 55.
53
Signatures
Pursuant to the requirements of Section 13 of the Securities Exchange Act of 1934, the registrant has duly caused this Report to be signed on its behalf by the undersigned, thereunto duly authorized.
VISTEON CORPORATION | ||
By: | /s/ Michael J. Widgren | |
Michael J. Widgren | ||
Senior Vice President, Corporate Controller and Chief Accounting Officer | ||
Date: August 6, 2014
54
Exhibit Index
Exhibit No. | Description | |
2.1 | Master Purchase Agreement, dated as of May 1, 2014, by and among Visteon Corporation, VIHI, LLC and Promontoria Holding 103 B.V. (incorporated by reference to Exhibit 2.1to the Current Report on Form 8-K of Visteon Corporation filed on May 7, 2014). *** | |
10.1 | Purchase Agreement, dated as of January 12, 2014, by and between Johnson Controls, Inc. and Visteon Corporation (incorporated by reference to Exhibit 10.1to the Current Report on Form 8-K of Visteon Corporation filed on January 15, 2014). | |
10.2 | Credit Agreement, dated as of April 9, 2014, among Visteon Corporation, each lender from time to time party thereto, each L/C Issuer from time to time party thereto and Citibank, N.A. as Administrative Agent (incorporated by reference to Exhibit 10.1 to the Current Report on Form 8-K of Visteon Corporation filed on April 14, 2014). | |
10.3 | Amendment to Employment Agreement, dated June 12, 2014, between Visteon Corporation and Timothy D. Leuliette (incorporated by reference to Exhibit 10.1 to the Current Report on Form 8-K of Visteon Corporation filed on June 16, 2014).* | |
31.1 | Rule 13a-14(a) Certification of Chief Executive Officer dated August 6, 2014. | |
31.2 | Rule 13a-14(a) Certification of Chief Financial Officer dated August 6, 2014. | |
32.1 | Section 1350 Certification of Chief Executive Officer dated August 6, 2014. | |
32.2 | Section 1350 Certification of Chief Financial Officer dated August 6, 2014. | |
101.INS | XBRL Instance Document.** | |
101.SCH | XBRL Taxonomy Extension Schema Document.** | |
101.CAL | XBRL Taxonomy Extension Calculation Linkbase Document.** | |
101.LAB | XBRL Taxonomy Extension Label Linkbase Document.** | |
101.PRE | XBRL Taxonomy Extension Presentation Linkbase Document.** | |
101.DEF | XBRL Taxonomy Extension Definition Linkbase Document.** | |
* | Indicates that exhibit is a management contract or compensatory plan or arrangement. |
** Pursuant to Rule 406T of Regulation S-T, the Interactive Data Files as Exhibit 101 hereto are deemed not filed or part of a registration
statement or prospectus for purposes of Sections 11 or 12 of the Securities Act of 1933, as amended, are deemed not filed for purposes
of Section 18 of the Securities and Exchange Act of 1934, as amended, and otherwise are not subject to liability under those sections.
*** Schedules and exhibits omitted pursuant to Item 601(b)(2) of Regulation S-K. Registrant agrees to furnish supplementally a copy of
any such schedules or exhibits to the Securities and Exchange Commission upon request.
55