Attached files
| file | filename |
|---|---|
| EX-32.2 - EXHIBIT 32.2 - VISTEON CORP | ex-322q3201710xq.htm |
| EX-32.1 - EXHIBIT 32.1 - VISTEON CORP | ex-321q3201710xq.htm |
| EX-31.2 - EXHIBIT 31.2 - VISTEON CORP | ex-312q3201710xq.htm |
| EX-31.1 - EXHIBIT 31.1 - VISTEON CORP | ex-311q3201710xq.htm |
UNITED STATES
SECURITIES AND EXCHANGE COMMISSION
Washington D.C. 20549
________________
FORM 10-Q
(Mark One)
þ | QUARTERLY REPORT PURSUANT TO SECTION 13 OR 15(d) |
OF THE SECURITIES EXCHANGE ACT OF 1934
For the quarterly period ended September 30, 2017
OR
¨ | TRANSITION REPORT PURSUANT TO SECTION 13 OR 15(d) |
OF THE SECURITIES EXCHANGE ACT OF 1934
For the transition period from ____________ to ____________
Commission file number 001-15827
VISTEON CORPORATION
(Exact name of registrant as specified in its charter)
State of Delaware | 38-3519512 |
(State or other jurisdiction of incorporation or organization) | (I.R.S. Employer Identification No.) |
One Village Center Drive, Van Buren Township, Michigan | 48111 |
(Address of principal executive offices) | (Zip code) |
Registrant’s telephone number, including area code: (800)-VISTEON
Not applicable
(Former name, former address and former fiscal year, if changed since last report)
Indicate by check mark whether the registrant: (1) has filed all reports required to be filed by Section 13 or 15(d) of the Securities Exchange Act of 1934 during the preceding 12 months (or for such shorter period that the Registrant was required to file such reports), and (2) has been subject to such filing requirements for the past 90 days. Yes ü No__
Indicate by check mark whether the registrant: has submitted electronically and posted on its corporate Web site, if any, every Interactive Data File required to be submitted and posted pursuant to Rule 405 of Regulation S-T (§232.405 of this chapter) during the preceding 12 months (or for such shorter period that the registrant was required to submit and post such files). Yes ü No __
Indicate by check mark whether the registrant is a large accelerated filer, an accelerated filer, a non-accelerated filer, a smaller reporting company, or an emerging growth company. See the definitions of “large accelerated filer," "accelerated filer,” "smaller reporting company" and “emerging growth company" in Rule 12b-2 of the Exchange Act.
Large accelerated filer ü Accelerated filer __ Non-accelerated filer __ Smaller reporting company __
Emerging growth company __
If an emerging growth company, indicate by check mark if the registrant has elected not to use the extended transition period for complying with any new or revised financial accounting standards provided pursuant to Section 13(a) of the Exchange Act. __
Indicate by check mark whether the registrant is a shell company (as defined in Rule 12b-2 of the Exchange Act). Yes __ No ü
Indicate by check mark whether the registrant has filed all documents and reports required to be filed by Sections 12, 13 or 15(d) of the Securities Exchange Act of 1934 subsequent to the distribution of securities under a plan confirmed by a court. Yes ü No__
As of October 19, 2017, the registrant had outstanding 31,098,830 shares of common stock.
Exhibit index located on page number 49.
1
Visteon Corporation and Subsidiaries
Index
Page | ||
2
Part I
Financial Information
Item 1. | Consolidated Financial Statements |
VISTEON CORPORATION AND SUBSIDIARIES
CONSOLIDATED STATEMENTS OF COMPREHENSIVE INCOME
(Dollars in Millions Except Per Share Amounts)
(Unaudited)
Three Months Ended September 30 | Nine Months Ended September 30 | ||||||||||||||
2017 | 2016 | 2017 | 2016 | ||||||||||||
Sales | $ | 765 | $ | 770 | $ | 2,349 | $ | 2,345 | |||||||
Cost of sales | 649 | 665 | 1,990 | 2,010 | |||||||||||
Gross margin | 116 | 105 | 359 | 335 | |||||||||||
Selling, general and administrative expenses | 54 | 53 | 158 | 163 | |||||||||||
Restructuring expense | 6 | 5 | 10 | 22 | |||||||||||
Interest expense | 4 | 6 | 15 | 14 | |||||||||||
Interest income | 1 | 1 | 3 | 4 | |||||||||||
Equity in net income of non-consolidated affiliates | 1 | — | 6 | 3 | |||||||||||
Other (income) expense, net | (1 | ) | 12 | (3 | ) | 16 | |||||||||
Income before income taxes | 55 | 30 | 188 | 127 | |||||||||||
Provision for income taxes | 8 | 5 | 34 | 27 | |||||||||||
Net income from continuing operations | 47 | 25 | 154 | 100 | |||||||||||
Income (loss) from discontinued operations, net of tax | — | 7 | 8 | (15 | ) | ||||||||||
Net income | 47 | 32 | 162 | 85 | |||||||||||
Net income attributable to non-controlling interests | 4 | 4 | 11 | 12 | |||||||||||
Net income attributable to Visteon Corporation | $ | 43 | $ | 28 | $ | 151 | $ | 73 | |||||||
Basic earnings (loss) per share: | |||||||||||||||
Continuing operations | $ | 1.38 | $ | 0.62 | $ | 4.50 | $ | 2.47 | |||||||
Discontinued operations | — | 0.21 | 0.25 | (0.42 | ) | ||||||||||
Basic earnings per share attributable to Visteon Corporation | $ | 1.38 | $ | 0.83 | $ | 4.75 | $ | 2.05 | |||||||
Diluted earnings (loss) per share: | |||||||||||||||
Continuing operations | $ | 1.35 | $ | 0.61 | $ | 4.43 | $ | 2.44 | |||||||
Discontinued operations | — | 0.20 | 0.25 | (0.41 | ) | ||||||||||
Diluted earnings per share attributable to Visteon Corporation | $ | 1.35 | $ | 0.81 | $ | 4.68 | $ | 2.03 | |||||||
Comprehensive income: | |||||||||||||||
Comprehensive income | $ | 59 | $ | 35 | $ | 205 | $ | 106 | |||||||
Comprehensive income attributable to Visteon Corporation | $ | 53 | $ | 31 | $ | 190 | $ | 96 | |||||||
See accompanying notes to the consolidated financial statements.
3
VISTEON CORPORATION AND SUBSIDIARIES
CONSOLIDATED BALANCE SHEETS
(Dollars in Millions)
(Unaudited) | |||||||
September 30 | December 31 | ||||||
2017 | 2016 | ||||||
ASSETS | |||||||
Cash and equivalents | $ | 732 | $ | 878 | |||
Restricted cash | 3 | 4 | |||||
Accounts receivable, net | 506 | 505 | |||||
Inventories, net | 174 | 151 | |||||
Other current assets | 181 | 170 | |||||
Total current assets | 1,596 | 1,708 | |||||
Property and equipment, net | 361 | 345 | |||||
Intangible assets, net | 128 | 129 | |||||
Investments in non-consolidated affiliates | 40 | 45 | |||||
Other non-current assets | 154 | 146 | |||||
Total assets | $ | 2,279 | $ | 2,373 | |||
LIABILITIES AND EQUITY | |||||||
Short-term debt, including current portion of long-term debt | $ | 44 | $ | 36 | |||
Accounts payable | 429 | 463 | |||||
Accrued employee liabilities | 102 | 103 | |||||
Other current liabilities | 235 | 309 | |||||
Total current liabilities | 810 | 911 | |||||
Long-term debt | 347 | 346 | |||||
Employee benefits | 305 | 303 | |||||
Deferred tax liabilities | 22 | 20 | |||||
Other non-current liabilities | 62 | 69 | |||||
Stockholders’ equity: | |||||||
Preferred stock (par value $0.01, 50 million shares authorized, none outstanding as of September 30, 2017 and December 31, 2016) | — | — | |||||
Common stock (par value $0.01, 250 million shares authorized, 55 million shares issued, 31 and 33 million shares outstanding as of September 30, 2017 and December 31, 2016, respectively) | 1 | 1 | |||||
Additional paid-in capital | 1,333 | 1,327 | |||||
Retained earnings | 1,420 | 1,269 | |||||
Accumulated other comprehensive loss | (194 | ) | (233 | ) | |||
Treasury stock | (1,945 | ) | (1,778 | ) | |||
Total Visteon Corporation stockholders’ equity | 615 | 586 | |||||
Non-controlling interests | 118 | 138 | |||||
Total equity | 733 | 724 | |||||
Total liabilities and equity | $ | 2,279 | $ | 2,373 | |||
See accompanying notes to the consolidated financial statements.
4
VISTEON CORPORATION AND SUBSIDIARIES
CONSOLIDATED STATEMENTS OF CASH FLOWS
(Dollars in Millions)
(Unaudited)
Nine Months Ended September 30 | |||||||
2017 | 2016 | ||||||
Operating Activities | |||||||
Net income | $ | 162 | $ | 85 | |||
Adjustments to reconcile net income to net cash provided from operating activities: | |||||||
Depreciation and amortization | 62 | 62 | |||||
Equity in net income of non-consolidated affiliates, net of dividends remitted | (6 | ) | (2 | ) | |||
Non-cash stock-based compensation | 9 | 6 | |||||
Gain on India operations repurchase | (7 | ) | — | ||||
(Gains) losses on divestitures and impairments | (4 | ) | 5 | ||||
Other non-cash items | 2 | 15 | |||||
Changes in assets and liabilities: | |||||||
Accounts receivable | 29 | 15 | |||||
Inventories | (15 | ) | 15 | ||||
Accounts payable | (39 | ) | (45 | ) | |||
Other assets and other liabilities | (62 | ) | (118 | ) | |||
Net cash provided from operating activities | 131 | 38 | |||||
Investing Activities | |||||||
Capital expenditures, including intangibles | (69 | ) | (56 | ) | |||
India operations repurchase | (47 | ) | — | ||||
Payments for acquisition and divestiture of businesses | (2 | ) | (15 | ) | |||
Settlement of net investment hedge | 5 | — | |||||
Proceeds from asset sales and business divestitures | 15 | 15 | |||||
Climate Transaction withholding tax refund | — | 356 | |||||
Short-term investments | — | 47 | |||||
Loans to non-consolidated affiliates, net of repayments | — | (8 | ) | ||||
Other | 1 | — | |||||
Net cash (used by) provided from investing activities | (97 | ) | 339 | ||||
Financing Activities | |||||||
Short-term debt, net | 8 | (11 | ) | ||||
Principal payments on debt | (2 | ) | (2 | ) | |||
Distribution payments | (1 | ) | (1,736 | ) | |||
Repurchase of common stock | (170 | ) | (500 | ) | |||
Dividends paid to non-controlling interests | (29 | ) | — | ||||
Stock based compensation tax withholding payments | (1 | ) | (11 | ) | |||
Other | (2 | ) | — | ||||
Net cash used by financing activities | (197 | ) | (2,260 | ) | |||
Effect of exchange rate changes on cash and equivalents | 17 | 6 | |||||
Net decrease in cash and equivalents | (146 | ) | (1,877 | ) | |||
Cash and equivalents at beginning of the period | 878 | 2,729 | |||||
Cash and equivalents at end of the period | $ | 732 | $ | 852 | |||
See accompanying notes to the consolidated financial statements.
5
VISTEON CORPORATION AND SUBSIDIARIES
NOTES TO CONSOLIDATED FINANCIAL STATEMENTS
NOTE 1. Description of Business
Visteon Corporation (the "Company" or "Visteon") is a global automotive supplier that designs, engineers and manufactures innovative electronics products for nearly every original equipment vehicle manufacturer ("OEM") worldwide including Ford, Mazda, Nissan/Renault, General Motors, Honda, BMW and Daimler. Visteon is headquartered in Van Buren Township, Michigan and has an international network of manufacturing operations, technical centers and joint venture operations, supported by approximately 10,000 employees, dedicated to the design, development, manufacture and support of its product offerings and its global customers. The Company's manufacturing and engineering footprint is principally located outside of the United States. Visteon delivers value for its customers and stockholders through its technology-focused core vehicle cockpit electronics business. The Company's cockpit electronics product portfolio includes instrument clusters, information displays, infotainment systems, audio systems, telematics solutions, and head up displays. The Company's vehicle cockpit electronics business is comprised of and reported under the Electronics segment. In addition to the Electronics segment, the Company had operations in South America and Europe associated with the former Climate business, not subject to discontinued operations classification, that comprised Other, and were exited by December 31, 2016.
NOTE 2. Summary of Significant Accounting Policies
The unaudited consolidated financial statements of the Company have been prepared in accordance with the rules and regulations of the U.S. Securities and Exchange Commission. Certain information and footnote disclosures normally included in financial statements prepared in accordance with accounting principles generally accepted in the United States ("U.S. GAAP") have been condensed or omitted pursuant to such rules and regulations. These interim consolidated financial statements include all adjustments (consisting of normal recurring adjustments, except as otherwise disclosed) that management believes are necessary for a fair presentation of the results of operations, financial position and cash flows of the Company for the interim periods presented. Interim results are not necessarily indicative of full-year results.
Reclassifications: Certain prior period amounts have been reclassified to conform to the current period presentation.
Other (Income) Expense, Net:
Three Months Ended September 30 | Nine Months Ended September 30 | ||||||||||||||
2017 | 2016 | 2017 | 2016 | ||||||||||||
(Dollars in Millions) | |||||||||||||||
Transformation initiatives | $ | 1 | $ | — | $ | 1 | $ | 3 | |||||||
Gain on non-consolidated affiliate transactions, net | (2 | ) | (1 | ) | (4 | ) | (1 | ) | |||||||
Foreign currency translation charge | — | 11 | — | 11 | |||||||||||
Loss on asset contribution | — | 2 | — | 2 | |||||||||||
Transaction exchange losses | — | — | — | 1 | |||||||||||
$ | (1 | ) | $ | 12 | $ | (3 | ) | $ | 16 | ||||||
Transformation initiative costs include information technology separation costs, integration of acquired business, and financial and advisory services incurred in connection with the Company's transformation into a pure play cockpit electronics business. The gain on non-consolidated affiliate transactions represents the Company's sale of three cost method investments and an equity method investment during the nine months ended September 30, 2017 as further described in Note 5, "Non-Consolidated Affiliates."
During the three and nine months ended September 30, 2016, the Company recorded a charge of approximately $11 million related to foreign currency translation amounts recorded in accumulated other comprehensive loss associated with the agreement to sell the Company's South Africa climate operations. In connection with the closure of the Climate facility in Argentina, the Company entered into an agreement, during the third quarter of 2016, to contribute land and building with a net book value of $2 million to the local municipality.
Restricted Cash: Restricted cash represents amounts designated for uses other than current operations and includes $2 million related to the Letter of Credit Facility, and $1 million related to cash collateral for other corporate purposes as of September 30, 2017.
6
Recently Issued Accounting Pronouncements: In May 2014, the Financial Accounting Standards Board ("FASB") issued Accounting Standards Update ("ASU") No. 2014-9, "Revenue from Contracts with Customers," which is the new comprehensive revenue recognition standard that will supersede existing revenue recognition guidance under U.S. GAAP. The standard's core principle is that a company will recognize revenue when it transfers promised goods or services to a customer in an amount that reflects the consideration to which the company expects to be entitled in exchange for those goods and services. This ASU allows for both retrospective and prospective methods of adoption.
The Company has, with other industry leaders, interacted with the FASB on certain interpretation issues as well as interacted with non-authoritative industry groups with respect to the implementation of the standard and will continue to monitor the interactions between its industry group and the standard setters. The Company does not expect any changes to how it accounts for reimbursements of pre-production costs, currently accounted for as a cost reduction. In addition, the Company continues to evaluate its contracts with customers analyzing the impact, if any, on revenue from the sale of production parts, particularly in regards to material rights, variable consideration and the impact of termination clauses on the timing of revenue recognition. The Company will adopt this standard January 1, 2018 and has selected the modified retrospective transition method for any impacts that might arise. Under the modified retrospective method, the Company will recognize the cumulative effect of initially applying the standard as an adjustment to opening retained earnings at the date of initial application. While the Company continues to evaluate a significant number of contracts with customers, the Company does not expect the cumulative adjustment to be material. As policy elections, the Company plans to exclude from revenue all value added tax ("VAT"), a consumption tax placed on certain products in countries outside the U.S. In addition, the Company will elect not to identify shipping and handling as a separate performance obligation.
In February 2016, the FASB issued ASU 2016-02, "Leases (Topic 842)." The amendments in Topic 842 supersede current lease requirements in Topic 840 which require lessees to recognize most leases on their balance sheets as lease liabilities with corresponding right-of-use assets. The objective of Topic 842 is to establish the principles that lessees and lessors shall apply to report useful information to users of financial statements about the amount, timing, and uncertainty of cash flows arising from a lease. This new guidance is effective for interim and annual reporting periods beginning after December 15, 2018, with early adoption permitted. The Company is currently evaluating the impact of adopting this standard on its consolidated financial statements.
In March 2016, the FASB issued ASU 2016-09, "Compensation - Stock Compensation (Topic 718): Improvements to Employee Share-Based Payment Accounting." The ASU includes multiple provisions intended to simplify various aspects of the accounting for share-based payments. While aimed at reducing the cost and complexity of the accounting for share-based payments, these amendments are not expected to significantly impact net income, earnings per share, and the statement of cash flows. This new guidance was effective for interim and annual reporting periods beginning after December 15, 2016, with early adoption permitted. The Company's adoption of this standard did not have a material impact on its consolidated financial statements. The Company has adopted an entity-wide accounting policy election to account for forfeitures in compensation cost when they occur.
In August 2016, the FASB issued ASU 2016-15, "Statement of Cash Flows (Topic 230): Classification of certain cash receipts and cash payments." The ASU addresses eight specific cash flow issues with the objective of reducing the existing diversity in practice in how certain transactions are classified in the statement of cash flows. The ASU will be applied using a retrospective transition method to each period presented. This new guidance is effective for interim and annual reporting periods beginning after December 15, 2017 with early adoption permitted. The Company is currently evaluating the impact of adopting this standard on its consolidated financial statements.
In March 2017, the FASB issued ASU 2017-07, “Compensation - Retirement Benefits (Topic 715): Improving the presentation of net periodic pension cost and net periodic postretirement benefit cost." The ASU requires entities to present the service cost component of the net periodic benefit cost in the same income statement line item(s) as other employee compensation costs arising from services rendered during the period. In addition, only the service cost component will be eligible for capitalization in assets. Entities will present the other components separately from the line item(s) that includes the service cost and outside of any subtotal of operating income, and disclose the line(s) used to present the other components of net periodic benefit cost, if the components are not presented separately in the income statement. The standard will be applied retrospectively for the presentation of the service cost component and the other components of net periodic pension cost and net periodic postretirement benefit cost in the income statement and prospectively, for the guidance limiting the capitalization of net periodic benefit cost in assets to the service cost. This new guidance is effective for interim and annual reporting periods beginning after December 15, 2017 and interim periods, with early adoption permitted. The Company is currently evaluating the impact of adopting this standard on its consolidated financial statements.
In May 2017, the FASB issued ASU 2017-09, "Compensation - Stock Compensation (Topic 718): Scope of Modification Accounting." The ASU amends the scope of modification accounting for share-based payment arrangements, provides guidance
7
on the types of changes to the terms or conditions of share-based payment awards to which an entity would be required to apply modification accounting. The new guidance will allow companies to make certain changes to awards without accounting for them as modifications. It does not change the accounting for modifications. The new guidance will be applied prospectively to awards modified on or after the adoption date. This new guidance is effective for interim and annual reporting periods beginning after December 15, 2017 with early adoption permitted. The Company is currently evaluating the impact of adopting this standard on its consolidated financial statements.
In July 2017, the FASB issued ASU 2017-11, "Earnings Per Share (Topic 260): Distinguishing Liabilities from Equity (Topic 480); Derivatives and Hedging (Topic 815): (Part I) Accounting for certain financial instruments with down round features, (Part II)Replacement of the indefinite deferral for mandatory redeemable financial instruments of certain Nonpublic entities and certain mandatory Non-controlling interests with a scope exception." The amendments in Part I of this update change the classification analysis of certain equity-linked financial instruments (or embedded features) with down round features. When determining whether certain financial instruments should be classified as liabilities or equity instruments, a down round feature no longer precludes equity classification when assessing whether the instrument is indexed to an entity’s own stock. The amendments also clarify existing disclosure requirements for equity-classified instruments. This new guidance is effective for interim and annual reporting periods beginning after December 15, 2018 and interim periods, with early adoption permitted. The Company is currently evaluating the impact of adopting this standard on its consolidated financial statements.
In August 2017, the FASB issued ASU 2017-12, "Derivative and Hedging (Topic 815): Targeted improvements to accounting for hedging activities." The ASU was created to better align accounting rules with a company’s risk management activities to better reflect the economic results of hedging in the financial statements; and simplify hedge accounting treatment. This new guidance is effective for interim and annual reporting periods beginning after December 15, 2018 and interim periods, with early adoption permitted. The Company is currently evaluating the impact of adopting this standard on its consolidated financial statements.
NOTE 3. Business Acquisition
On July 8, 2016 Visteon acquired AllGo Embedded Systems Private Limited, a leading developer of embedded multimedia system solutions to global vehicle manufacturers, for a purchase price of $17 million ("AllGo Purchase") including $2 million of contingent consideration payable upon completion of certain technology milestones, achieved and paid on July 6, 2017. In addition, the purchase agreement includes contingent payments of $5 million if key employees remain employed through July 2019. The AllGo Purchase was a strategic acquisition to add greater scale and depth to the Company's infotainment software capabilities.
The AllGo Purchase was accounted for as a business combination, with the purchase price allocation reflecting the final valuation results, is shown below (dollars in millions):
Assets Acquired: | Liabilities Assumed: | |||||||
Accounts receivable | $ | 1 | Deferred tax liabilities | $ | 2 | |||
Intangible assets | 7 | Total liabilities assumed | 2 | |||||
Goodwill | 11 | |||||||
Total assets acquired | $ | 19 | Purchase price | $ | 17 | |||
Assets acquired and liabilities assumed were recorded at estimated fair values based on management's estimates, available information, and reasonable and supportable assumptions. Additionally, the Company utilized a third-party to assist with certain estimates of fair values. Fair values for intangible assets were based on the income approach including excess earnings and relief from royalty methods. These fair value measurements are classified within level 3 of the fair value hierarchy. The purchase price allocation resulted in goodwill of $11 million, which is not deductible for income tax purposes; however, purchase accounting requires the establishment of deferred tax liabilities on the fair value increments related primarily to intangible assets that will be recognized as a future income tax benefit as the related assets are amortized.
The pro forma effects of the AllGo acquisitions does not materially impact the Company's reported results for any period presented, and as a result no pro forma financial statements are presented.
NOTE 4. Discontinued Operations
During 2014 and 2015, the Company divested the majority of its global Interiors business (the "Interiors Divestiture") and completed the sale of its Argentina and Brazil interiors operations on December 1, 2016. Separately, the Company completed the sale of the majority of its global Climate business (the "Climate Transaction") during 2015. As the operations subject to the Interiors Divestiture and Climate Transaction met conditions required to qualify for discontinued operations reporting, the results of operations for the
8
Interiors and Climate businesses have been reclassified to income (loss) from discontinued operations, net of tax in the consolidated statements of comprehensive income for the three and nine month periods ended September 30, 2017 and 2016.
Discontinued operations are summarized as follows:
Three Months Ended September 30 | Nine Months Ended September 30 | ||||||||||||||
2017 | 2016 | 2017 | 2016 | ||||||||||||
(Dollars in Millions) | |||||||||||||||
Sales | $ | — | $ | 14 | $ | — | $ | 34 | |||||||
Cost of sales | — | 20 | — | 48 | |||||||||||
Gross margin | — | (6 | ) | — | (14 | ) | |||||||||
Selling, general and administrative expenses | — | 2 | — | 4 | |||||||||||
(Gain) loss on Climate Transaction | — | — | (7 | ) | 2 | ||||||||||
Loss and impairment on Interiors Divestiture | — | — | — | 2 | |||||||||||
Other expense, net | — | 1 | — | 2 | |||||||||||
(Loss) income from discontinued operations before income taxes | — | (9 | ) | 7 | (24 | ) | |||||||||
Benefit for income taxes | — | (16 | ) | (1 | ) | (9 | ) | ||||||||
Net income (loss) from discontinued operations, net of tax, attributable to Visteon | $ | — | $ | 7 | $ | 8 | $ | (15 | ) | ||||||
In connection with the Climate Transaction, the Company completed the repurchase of the electronics operations located in India during the first quarter of 2017 for $47 million, recognizing a $7 million gain on settlement of purchase commitment contingencies. The Company had previously consolidated the India operations based on the Company's controlling financial interest as a result of the repurchase obligation, operating control, and the obligation to fund losses or benefit from earnings.
During the nine months ended September 30, 2016, the Company recorded currency impacts of $8 million in connection with the Korean capital gains withholding tax recovered during the first quarter of 2016. During the third quarter of 2016, the Company recorded a $17 million income tax benefit to reflect change in estimates associated with the filing of the Company’s U.S. tax returns that resulted in a reduction in U.S. income tax related to the 2015 Climate Transaction.
NOTE 5. Non-Consolidated Affiliates
Non-Consolidated Affiliate Transactions
Visteon and Yangfeng Automotive Trim Systems Co. Ltd. ("YF") each own 50% of a joint venture under the name of Yanfeng Visteon Investment Co., Ltd. ("YFVIC"). In October 2014, YFVIC completed the purchase of YF’s 49% direct ownership in Yanfeng Visteon Automotive Electronics Co., Ltd ("YFVE") a consolidated joint venture of the Company. The purchase by YFVIC was financed through a shareholder loan from YF and external borrowings which were guaranteed by Visteon, of which $15 million is outstanding as of September 30, 2017. The guarantee contains standard non-payment provisions to cover the borrowers in event of non-payment of principal, accrued interest, and other fees, and the loan is expected to be fully paid by September 2019.
During the first quarter of 2017, the Company completed the sale of its 50% interest in an equity method investment for proceeds of $7 million, consistent with its carrying value.
During 2017 the Company disposed of its remaining cost method investments. In the first half of of 2017, the Company sold two cost method investments for proceeds of approximately $6 million and recorded a net pretax gain of $2 million. On July 11, 2017, the Company sold a cost method investment for proceeds of approximately $2 million and recorded a pretax gain of $2 million. The gain on sale of the cost method investments are included in the Company's consolidated statements of comprehensive income as "Other (income) expense, net" for the three and nine months ended September 30, 2017.
During the third quarter of 2016, the Company agreed to sell a 50% interest in an equity investment for approximately $7 million. The Company recorded a loss in the investment of $5 million during the three and nine months ended September 30, 2016 related to this transaction. Also in the third quarter 2016, the Company sold a cost method investment to a third party for proceeds of approximately $11 million. The Company recorded a pre-tax gain of $6 million during the three and nine months ended September 30, 2016 related to this transaction. The net $1 million gain on the sale of non-consolidated affiliates is included in the Company's consolidated statements of comprehensive income as "Other (income) expense, net" for the three and nine months ended September 30, 2016.
9
Investments in Affiliates
The Company recorded equity in net income of affiliates of $1 million for the three month period ended September 30, 2017. For the nine month periods ended September 30, 2017 and 2016, the Company recorded net income of affiliates of $6 million and $3 million, respectively.
Investments in affiliates were $40 million and $45 million as of September 30, 2017 and December 31, 2016, respectively. As of December 31, 2016, investments in affiliates accounted for under the cost method and equity method totaled $5 million and $40 million, respectively.
Variable Interest Entities
The Company determines whether joint ventures in which it has invested are Variable Interest Entities (“VIE”) at the start of each new venture and when a reconsideration event has occurred. An enterprise must consolidate a VIE if it is determined to be the primary beneficiary of the VIE. The primary beneficiary has both the power to direct the activities of the VIE that most significantly impact the entity’s economic performance and the obligation to absorb losses or the right to receive benefits from the VIE that could potentially be significant to the VIE.
The Company determined that YFVIC, is a VIE. The Company holds a variable interest in YFVIC primarily related to its ownership interests and subordinated financial support. The Company and YF each own 50% of YFVIC and neither entity has the power to control the operations of YFVIC, therefore the Company is not the primary beneficiary of YFVIC and does not consolidate the joint venture.
A summary of the Company's investments in YFVIC is provided below.
September 30 | December 31 | ||||||
2017 | 2016 | ||||||
(Dollars in Millions) | |||||||
Payables due to YFVIC | $ | 9 | $ | 14 | |||
Exposure to loss in YFVIC | |||||||
Investment in YFVIC | $ | 27 | $ | 22 | |||
Receivables due from YFVIC | 28 | 15 | |||||
Subordinated loan receivable | 22 | 22 | |||||
Loan guarantee | 15 | 22 | |||||
Maximum exposure to loss in YFVIC | $ | 92 | $ | 81 | |||
NOTE 6. Restructuring Activities
Given the economically-sensitive and highly competitive nature of the automotive electronics industry, the Company continues to closely monitor current market factors and industry trends, taking action as necessary which may include restructuring actions. However, there can be no assurance that any such actions will be sufficient to fully offset the impact of adverse factors on the Company or its results of operations, financial position and cash flows. During the three and nine months ended September 30, 2017, the Company recorded $6 million and $10 million of restructuring expenses, net of reversals, respectively.
Electronics
During the fourth quarter of 2016, the Company announced a restructuring program impacting engineering and administrative functions to further align the Company's engineering and related administrative footprint with its core product technologies and customers. Through September 30, 2017, the Company has recorded approximately $37 million of restructuring expenses, net of reversals, under this program, and expects to incur up to $45 million of restructuring costs associated with approximately 250 employees. During the three and nine months ended September 30, 2017, the Company has recorded approximately $6 million and $10 million, respectively, of restructuring expenses under this program, and $18 million remains accrued as of September 30, 2017. The Company expects to record additional restructuring costs related to this program as the underlying plan is finalized.
During the first quarter of 2016, the Company announced a restructuring program to transform the Company's engineering organization and supporting functional areas to focus on execution and technology. The organization will be comprised of regional engineering, product management and advanced technologies, and global centers of competence. For the three and nine month
10
periods ended September 30, 2016, the Company recorded $1 million and $13 million, respectively, of restructuring expenses under this program, associated with approximately 100 employees. As of September 30, 2017 the plan is considered substantially complete.
Other and Discontinued Operations
During the three and nine months ended September 30, 2016, the Company recorded $4 million and $11 million, respectively, of restructuring expenses, related to severance and termination benefits, in connection with the wind-down of certain operations in South America. As of September 30, 2017, the plan is considered substantially complete.
As of September 30, 2017, the Company retained approximately $6 million of restructuring reserves as part of the Interiors Divestiture associated with previously announced programs for the fundamental reorganization of operations at facilities in Brazil and France.
Restructuring Reserves
Restructuring reserve balances of $26 million and $40 million as of September 30, 2017 and December 31, 2016, respectively, are classified as "Other current liabilities" on the consolidated balance sheets. The Company anticipates that the activities associated with the current restructuring reserve balance will be substantially complete within one year. The Company’s consolidated restructuring reserves and related activity are summarized below, including amounts associated with discontinued operations.
Electronics | Other | Total | |||||||||
(Dollars in Millions) | |||||||||||
December 31, 2016 | $ | 31 | $ | 9 | $ | 40 | |||||
Expense | 1 | — | 1 | ||||||||
Utilization | (8 | ) | (1 | ) | (9 | ) | |||||
March 31, 2017 | 24 | 8 | 32 | ||||||||
Expense | 6 | — | 6 | ||||||||
Utilization | (6 | ) | (1 | ) | (7 | ) | |||||
Reversals | (2 | ) | (1 | ) | (3 | ) | |||||
Foreign currency | 2 | — | 2 | ||||||||
June 30, 2017 | 24 | 6 | 30 | ||||||||
Expense | 7 | — | 7 | ||||||||
Utilization | (11 | ) | — | (11 | ) | ||||||
Reversals | (1 | ) | — | (1 | ) | ||||||
Foreign currency | 1 | — | 1 | ||||||||
September 30, 2017 | $ | 20 | $ | 6 | $ | 26 | |||||
NOTE 7. Inventories
Inventories consist of the following components:
September 30 | December 31 | ||||||
2017 | 2016 | ||||||
(Dollars in Millions) | |||||||
Raw materials | $ | 109 | $ | 83 | |||
Work-in-process | 33 | 34 | |||||
Finished products | 32 | 34 | |||||
$ | 174 | $ | 151 | ||||
11
NOTE 8. Other Assets
Other current assets are comprised of the following components:
September 30 | December 31 | ||||||
2017 | 2016 | ||||||
(Dollars in Millions) | |||||||
Recoverable taxes | $ | 61 | $ | 60 | |||
Joint venture receivables | 37 | 39 | |||||
Prepaid assets and deposits | 36 | 35 | |||||
Notes receivable | 28 | 18 | |||||
Contractually reimbursable engineering costs | 15 | 7 | |||||
Foreign currency hedges | 1 | 6 | |||||
Other | 3 | 5 | |||||
$ | 181 | $ | 170 | ||||
The Company receives bank notes from certain of its customers in China to settle trade accounts receivable. The Company may hold such bank notes until maturity, exchange them with suppliers to settle liabilities, or sell them to third party financial institutions in exchange for cash. The Company has entered into arrangements with financial institutions to sell certain bank notes, generally maturing within nine months. Notes are sold with recourse, but qualify as a sale as all rights to the notes have passed to the financial institution. The Company sold $11 million during the nine months ended September 30, 2017 to financial institutions, $5 million of which occurred in the third quarter and will mature within the first half of 2018. The collection of such bank notes are included in operating cash flows based on the substance of the underlying transactions, which are operating in nature.
Other non-current assets are comprised of the following components:
September 30 | December 31 | ||||||
2017 | 2016 | ||||||
(Dollars in Millions) | |||||||
Deferred tax assets | $ | 49 | $ | 48 | |||
Recoverable taxes | 36 | 34 | |||||
Joint venture receivables | 26 | 25 | |||||
Contractually reimbursable engineering costs | 19 | 11 | |||||
Long term notes receivable | 10 | 10 | |||||
Other | 14 | 18 | |||||
$ | 154 | $ | 146 | ||||
In conjunction with the Interiors Divestiture, the Company entered into a three year term loan with the buyer for $10 million, which matures on December 1, 2019.
Current and non-current contractually reimbursable engineering costs of $15 million and $19 million, respectively, as of September 30, 2017 and $7 million and $11 million, respectively, as of December 31, 2016, are related to pre-production design and development costs incurred pursuant to long-term supply arrangements that are contractually guaranteed for reimbursement by customers. The Company expects to receive cash reimbursement payments of approximately $8 million during the remainder of 2017, $10 million in 2018, $9 million in 2019, $2 million in 2020 and $5 million in 2021.
12
NOTE 9. Intangible Assets, net
Intangible assets, net as of September 30, 2017 and December 31, 2016, are comprised of the following:
September 30, 2017 | December 31, 2016 | ||||||||||||||||||||||||
Estimated Weighted Average Useful Life (years) | Gross Carrying Value | Accumulated Amortization | Net Carrying Value | Gross Carrying Value | Accumulated Amortization | Net Carrying Value | |||||||||||||||||||
(Dollars in Millions) | |||||||||||||||||||||||||
Definite-Lived: | |||||||||||||||||||||||||
Developed technology | 10 | $ | 41 | $ | 28 | $ | 13 | $ | 40 | $ | 25 | $ | 15 | ||||||||||||
Customer related | 9 | 85 | 31 | 54 | 83 | 25 | 58 | ||||||||||||||||||
Capitalized software development | 3 | 6 | — | 6 | 4 | — | 4 | ||||||||||||||||||
Other | 32 | 10 | 1 | 9 | 8 | 1 | 7 | ||||||||||||||||||
Subtotal | 142 | 60 | 82 | 135 | 51 | 84 | |||||||||||||||||||
Indefinite-Lived: | |||||||||||||||||||||||||
Goodwill | 46 | — | 46 | 45 | — | 45 | |||||||||||||||||||
Total | $ | 188 | $ | 60 | $ | 128 | $ | 180 | $ | 51 | $ | 129 | |||||||||||||
The Company recorded approximately $3 million and $9 million of amortization expense related to definite-lived intangible assets for the three and nine months ended September 30, 2017. The Company currently estimates annual amortization expense to be $13 million for 2017, $14 million for 2018 and 2019, $11 million for 2020, and $9 million for 2021. Indefinite-lived intangible assets are not amortized but are tested for impairment at least annually, or earlier when events and circumstances indicate that it is more likely than not that such assets have been impaired. There were no indicators of potential impairment during the nine months ended September 30, 2017.
During the three months ended September 30, 2017, the Company contributed $2 million to a non-profit corporation who is building a state of the art research and development facility. The contribution provides the Company certain rights regarding access to the facility for three years. The Company will use the facility for autonomous driving research and development activities for multiple products and therefore capitalized the contribution as an intangible asset. The Company expects to make a second contribution of $2 million during the first half of 2018 when the facility is substantially complete. The asset will be amortized over a 36 month period on a straight-line basis beginning in January 2018 when the term of the arrangement begins.
The Company capitalizes software development costs after the software product development reaches technological feasibility and until the software product becomes releasable to customers. During the nine months ended September 30, 2017, the Company capitalized $2 million related to software development cost intended for external use. The capitalized software development costs are amortized over the useful life of the technology on a straight-line basis.
A roll-forward of the carrying amounts of intangible assets is presented below:
Definite-lived intangibles | Indefinite-lived intangibles | ||||||||||||||||||||||
Developed Technology | Customer Related | Capitalized Software Development | Other | Goodwill | Total | ||||||||||||||||||
(Dollars in Millions) | |||||||||||||||||||||||
December 31, 2016 | $ | 15 | $ | 58 | $ | 4 | $ | 7 | $ | 45 | $ | 129 | |||||||||||
Additions | — | — | 2 | 2 | — | 4 | |||||||||||||||||
Foreign currency | 1 | 2 | — | — | 1 | 4 | |||||||||||||||||
Amortization | (3 | ) | (6 | ) | — | — | — | (9 | ) | ||||||||||||||
September 30, 2017 | $ | 13 | $ | 54 | $ | 6 | $ | 9 | $ | 46 | $ | 128 | |||||||||||
13
NOTE 10. Other Liabilities
Other current liabilities are summarized as follows:
September 30 | December 31 | ||||||
2017 | 2016 | ||||||
(Dollars in Millions) | |||||||
Product warranty and recall accruals | $ | 39 | $ | 43 | |||
Contribution payable | 35 | 31 | |||||
Restructuring reserves | 26 | 40 | |||||
Rent and royalties | 23 | 23 | |||||
Foreign currency hedges | 22 | 7 | |||||
Deferred income | 14 | 14 | |||||
Distribution payable | 14 | 15 | |||||
Dividends payable | 12 | 5 | |||||
Income taxes payable | 11 | 22 | |||||
Joint venture payables | 10 | 22 | |||||
Non-income taxes payable | 3 | 8 | |||||
Electronics operations repurchase commitment | — | 50 | |||||
Other | 26 | 29 | |||||
$ | 235 | $ | 309 | ||||
On December 1, 2015, Visteon completed the sale and transfer of its equity ownership in Visteon Deutschland GmbH, which operated the Berlin, Germany interiors plant ("Germany Interiors Divestiture"). The Company contributed cash, of approximately $141 million, assets of $27 million, and liabilities of $198 million including pension related liabilities. The Company will make a final contribution payment of approximately $35 million anticipated during 2017 upon fulfillment of buyer contractual commitments.
On January 22, 2016 the Company paid to shareholders a special distribution of $1.74 billion, an additional $14 million will be paid over a two-year period upon vesting and settlement of restricted stock units and performance-based share units previously granted to the Company's employees. The special cash distribution was funded from the Climate Transaction proceeds.
Following the initial sale as part of the Climate Transaction, the Company repurchased an Electronics operation located in India on March 27, 2017 as further described in Note 4, "Discontinued Operations."
Other non-current liabilities are summarized as follows:
September 30 | December 31 | ||||||
2017 | 2016 | ||||||
(Dollars in Millions) | |||||||
Deferred income | $ | 16 | $ | 18 | |||
Product warranty and recall accruals | 12 | 12 | |||||
Income tax reserves | 11 | 14 | |||||
Non-income tax reserves | 8 | 10 | |||||
Other | 15 | 15 | |||||
$ | 62 | $ | 69 | ||||
14
NOTE 11. Debt
The Company’s short and long-term debt consists of the following:
September 30 | December 31 | ||||||
2017 | 2016 | ||||||
(Dollars in Millions) | |||||||
Short-Term Debt: | |||||||
Current portion of long-term debt | $ | 1 | $ | 3 | |||
Short-term borrowings | 43 | 33 | |||||
$ | 44 | $ | 36 | ||||
Long-Term Debt: | |||||||
Term debt facility | $ | 347 | $ | 346 | |||
Short-Term Debt
Short-term borrowings are primarily related to the Company's non-U.S. consolidated joint ventures and are payable primarily in U.S. Dollars, Chinese Renminbi and India Rupee, or Russian Ruble. The Company had short-term borrowings of $43 million and $33 million as of September 30, 2017 and December 31, 2016, respectively. Short-term borrowings increased in the third quarter of 2017 primarily due to changes in working capital needs.
Available borrowings on outstanding affiliate credit facilities as of September 30, 2017 are approximately $24 million and certain of these facilities have pledged assets as security.
Long-Term Debt
As of December 31, 2016, the Company had an amended credit agreement (the “Credit Agreement”) which included a $350 million Term Facility maturing April 9, 2021 and a Revolving Credit Facility with capacity of $200 million maturing April 9, 2019. Borrowings under the Term Facility accrued interest at the greater of LIBOR or 0.75%, plus 2.75%, with an option by the Company to specify the LIBOR tenor of either 1, 2, 3, or 6 months. Loans drawn under the Revolving Credit Facility had an interest rate equal to LIBOR plus a margin ranging from 2.00% to 2.75% as specified by a ratings grid contained in the Credit Agreement. As of December 31, 2016, borrowings under the Revolving Credit Facility would accrue interest at LIBOR plus 2.50%. There were no outstanding borrowings at year-end.
On March 24, 2017, the Company entered into a second amendment to the Credit Agreement to, among other things, extend the maturity dates of both facilities by three years and increase the Revolving Credit Facility capacity to $300 million. The amended Revolving Credit Facility will mature on March 24, 2022 and the amended Term Facility will mature on March 24, 2024. The amendment reduced the LIBOR spread applicable to each of the Revolving Credit Facility and the Term Facility by 0.50% and reduced the LIBOR floor related to the Term Facility from 0.75% to 0.00%. The $350 million of borrowings under the amended Term Facility accrue interest at a rate of LIBOR plus 2.25%. In conjunction with the refinancing the Company received a credit rating upgrade from Standard & Poor's to BB from BB-. Pursuant to the ratings grid contained within the amended Revolving Credit Facility agreement, any borrowing thereunder shall accrue interest at LIBOR plus 1.75%. As of September 30, 2017, there were no outstanding borrowings under the amended Revolving Credit Facility.
The Revolving Credit Facility also provides $75 million availability for the issuance of letters of credit and a maximum of $20 million for swing line borrowing. Any amount of the facility utilized for letters of credit or swing line loans outstanding will reduce the amount available under the amended Revolving Credit Facility. The Company may request increases in the limits under the amended Term Facility and the amended Revolving Credit Facility and may request the addition of one or more term loan facilities under the Credit Agreement. Outstanding borrowings may be prepaid without penalty (other than borrowings made for the purpose of reducing the effective interest rate margin or weighted average yield of the loans). There are mandatory prepayments of principal in connection with: (i) excess cash flow sweeps above certain leverage thresholds, (ii) certain asset sales or other dispositions, (iii) certain refinancing of indebtedness and (iv) over-advances under the Revolving Credit Facility. There are no excess cash flow sweeps required at the Company’s current leverage level.
The Credit Agreement requires the Company and its subsidiaries to comply with customary affirmative and negative covenants, and contains customary events of default. The Revolving Credit Facility also requires that the Company maintain a total net leverage ratio no greater than 3.00:1.00. During any period when the Company’s corporate and family ratings meet investment
15
grade ratings, certain of the negative covenants shall be suspended. As of September 30, 2017, the Company was in compliance with all its debt covenants.
All obligations under the Credit Agreement and obligations in respect of certain cash management services and swap agreements with the lenders and their affiliates are unconditionally guaranteed by certain of the Company’s subsidiaries. Under the terms of the Credit Agreement, all obligations under the Credit Agreement are secured by a first-priority perfected lien (subject to certain exceptions) on substantially all property of the Company and the subsidiaries party to the Security Agreement, subject to certain limitations.
In connection with amending both the Term Facility and Revolving Credit Facility, the Company recorded $1 million of interest expense and deferred $2 million of costs as a non-current asset. The deferred costs will be amortized over the term of the debt facilities. As of September 30, 2017, the amended Term Facility remains at $350 million of aggregate principal and there were no outstanding borrowings under the amended Revolving Credit Facility.
Other
On September 29, 2017 the Company amended certain terms of its letter of credit facility. The amended agreement reduced the facility amount from $15 million to $5 million and extended the expiration date by three years to September 30, 2020. Under the agreement the Company is required to maintain a collateral account equal to 103% of the aggregate stated amount of issued letters of credit (or 110% for non-U.S. currencies) and must reimburse any amounts drawn under issued letters of credit. The Company had $2 million of outstanding letters of credit issued under this facility secured by restricted cash, as of September 30, 2017.
Additionally, the Company had $18 million of locally issued letters of credit with $1 million of collateral as of September 30, 2017, to support various tax appeals, customs arrangements and other obligations at its local affiliates.
NOTE 12. Employee Benefit Plans
Defined Benefit Plans
The Company's net periodic benefit costs for all defined benefit plans for the three month periods ended September 30, 2017 and 2016 were as follows:
U.S. Plans | Non-U.S. Plans | ||||||||||||||
2017 | 2016 | 2017 | 2016 | ||||||||||||
(Dollars in Millions) | |||||||||||||||
Costs Recognized in Income: | |||||||||||||||
Service cost | $ | — | $ | — | $ | 1 | $ | 1 | |||||||
Interest cost | 7 | 7 | 2 | 3 | |||||||||||
Expected return on plan assets | (10 | ) | (10 | ) | (2 | ) | (3 | ) | |||||||
Net pension (income) expense | $ | (3 | ) | $ | (3 | ) | $ | 1 | $ | 1 | |||||
The Company's net periodic benefit costs for all defined benefit plans for the nine month periods ended September 30, 2017 and 2016 were as follows:
U.S. Plans | Non-U.S. Plans | ||||||||||||||
2017 | 2016 | 2017 | 2016 | ||||||||||||
(Dollars in Millions) | |||||||||||||||
Costs Recognized in Income: | |||||||||||||||
Service cost | $ | — | $ | — | $ | 2 | $ | 2 | |||||||
Interest cost | 21 | 21 | 7 | 9 | |||||||||||
Expected return on plan assets | (30 | ) | (31 | ) | (7 | ) | (9 | ) | |||||||
Settlements and curtailments | — | — | — | 1 | |||||||||||
Amortization of losses and other | — | — | 1 | — | |||||||||||
Net pension (income) expense | $ | (9 | ) | $ | (10 | ) | $ | 3 | $ | 3 | |||||
16
During the nine months ended September 30, 2017, cash contributions to the Company's defined benefit plans were less than a million for the U.S. plans and $5 million for the non-U.S. plans. The Company expects to make cash contributions to its defined benefit pension plans of $7 million in 2017.
On April 28, 2016, the Company purchased a non-participating annuity contract for all participants of the Canada non-represented plan. The annuity purchase covered 52 participants and resulted in the use of $5 million of plan assets for pension benefit obligation settlements of approximately $5 million. In connection with the annuity purchase, the Company recorded a settlement loss of approximately $1 million during the the three months ended September 30, 2016.
NOTE 13. Income Taxes
During the three and nine month periods ended September 30, 2017, the Company recorded a provision for income tax on continuing operations of $8 million and $34 million, respectively, which reflects income tax expense in countries where the Company is profitable; withholding taxes; changes in uncertain tax benefits; and the inability to record a tax benefit for pretax losses and/or recognize expense for pretax income in certain jurisdictions (including the U.S.) due to valuation allowances. Pretax losses from continuing operations in jurisdictions where valuation allowances are maintained and no income tax benefits are recognized totaled
$13 million and $38 million for the nine months ended September 30, 2017 and September 30, 2016, respectively, resulting in an increase in the Company's effective tax rate in those years.
The Company provides for U.S. and non-U.S. income taxes and non-U.S. withholding taxes on the projected future repatriations of the earnings from its non-U.S. operations that are not considered permanently reinvested at each tier of the legal entity structure.
During the nine month periods ended September 30, 2017 and 2016, the Company recognized expense primarily related to non-U.S. withholding taxes of $6 million and $3 million, respectively, reflecting the Company's forecasts which contemplate numerous financial and operational considerations that impact future repatriations.
The Company's provision for income taxes in interim periods is computed by applying an estimated annual effective tax rate against income before income taxes, excluding equity in net income of non-consolidated affiliates for the period. Effective tax rates vary from period to period as separate calculations are performed for those countries where the Company's operations are profitable and whose results continue to be tax-effected and for those countries where full deferred tax valuation allowances exist and are maintained. In determining the estimated annual effective tax rate, the Company analyzes various factors, including but not limited to, forecasts of projected annual earnings, taxing jurisdictions in which the pretax income and/or pretax losses will be generated and available tax planning strategies. The Company’s estimated annual effective tax rate is updated each quarter and may be significantly impacted by changes to the mix of forecasted earnings by tax jurisdiction. The tax impact of adjustments to the estimated annual effective tax rate are recorded in the period such estimates are revised. The Company is also required to record the tax impact of certain other non-recurring tax items, including changes in judgment about valuation allowances and uncertain tax positions, and changes in tax laws or rates, in the interim period in which they occur, rather than include them in the estimated annual effective tax rate.
The need to maintain valuation allowances against deferred tax assets in the U.S. and other affected countries will cause variability in the Company’s quarterly and annual effective tax rates. Full valuation allowances against deferred tax assets in the U.S. and applicable foreign countries will be maintained until sufficient positive evidence exists to reduce or eliminate them. The factors considered by management in its determination of the probability of the realization of the deferred tax assets include, but are not limited to, recent historical financial results, historical taxable income, projected future taxable income, the expected timing of the reversals of existing temporary differences and tax planning strategies. If, based upon the weight of available evidence, it is more likely than not the deferred tax assets will not be realized, a valuation allowance is recorded. The weight given to the positive and negative evidence is commensurate with the extent to which the evidence may be objectively verified. As such, it is generally difficult for positive evidence regarding projected future taxable income exclusive of reversing taxable temporary differences to outweigh objective negative evidence of recent financial reporting losses, in particular, when there is a cumulative loss incurred over a three-year period. In regards to the full valuation allowance recorded against the U.S. net deferred tax assets, the cumulative U.S. pretax book loss adjusted for significant permanent items incurred over the three-year period ended December 31, 2016 limits the ability to consider other subjective evidence such as the Company’s plans to improve U.S. profits, and as such, the Company continues to maintain a full valuation allowance against the U.S. net deferred tax assets. Based on the Company’s current assessment, it is possible that within the next 12 to 24 months, the existing valuation allowance against the U.S. net deferred tax assets could be partially released. Any such release is dependent upon the sustained improvement in U.S. operating results, and, if such a release of the valuation allowance were to occur, it could have a significant impact on net income in the quarter in which it is deemed appropriate to partially release the reserve.
17
Unrecognized Tax Benefits
Gross unrecognized tax benefits as of September 30, 2017 and December 31, 2016, including amounts attributable to discontinued operations, were $17 million and $35 million, respectively. Of these amounts approximately $8 million and $12 million as of September 30, 2017 and December 31, 2016, respectively, represent the amount of unrecognized benefits that, if recognized, would impact the effective tax rate. The gross unrecognized tax benefit differs from that which would impact the effective tax rate due to uncertain tax positions embedded in other deferred tax attributes carrying a full valuation allowance. If the uncertainty is resolved while a full valuation allowance is maintained, these uncertain tax positions should not impact the effective tax rate in current or future periods. The Company records interest and penalties related to uncertain tax positions as a component of income tax expense and related amounts accrued at September 30, 2017 and December 31, 2016 were $3 million and $4 million, respectively.
During the first quarter of 2017, the IRS completed the audit of the Company's U.S. tax returns for the 2012 and 2013 tax years. The closing of the audit did not have a material impact on the Company's effective tax rate due to the valuation allowances maintained against the Company's U.S. tax attributes resulting in a decrease in unrecognized tax benefits of $16 million. Also during the first quarter of 2017, the Company settled tax assessments from the Mexican tax authorities in the amount of $2 million related to certain transfer pricing-related issues. During the third quarter of 2017, the Company settled tax assessments in connection with the Company’s former operations in Spain and France in the amount of $1 million.
With few exceptions, the Company is no longer subject to U.S. federal tax examinations for years before 2014, or state, local or non-U.S. income tax examinations for years before 2003, although U.S. net operating losses carried forward into open tax years technically remain open to adjustment. During the second quarter of 2017, the IRS contacted the Company to begin the examination process of the Company’s U.S. tax returns for 2014 and 2015. Although it is not possible to predict the timing of the resolution of all ongoing tax audits with accuracy, it is reasonably possible that certain tax proceedings in Europe, Asia and Mexico could conclude within the next twelve months and result in a significant increase or decrease in the balance of gross unrecognized tax benefits. Given the number of years, jurisdictions and positions subject to examination, the Company is unable to estimate the full range of possible adjustments to the balance of unrecognized tax benefits. The long-term portion of uncertain income tax positions (including interest) in the amount of $11 million is included in Other non-current liabilities on the consolidated balance sheet.
A reconciliation of the beginning and ending amount of unrecognized tax benefits including amounts attributable to discontinued operations is as follows:
Nine Months Ended September 30, 2017 | |||
(Dollars in Millions) | |||
Beginning balance | $ | 35 | |
Tax positions related to current period: | |||
Additions | 2 | ||
Tax positions related to prior periods: | |||
Reductions | (21 | ) | |
Effect of exchange rate changes | 1 | ||
Ending balance | $ | 17 | |
During 2012, Brazil tax authorities issued tax assessment notices to Visteon Sistemas Automotivos (“Sistemas”) related to the sale of its chassis business to a third party, which required a deposit in the amount of $15 million during 2013 necessary to open a judicial proceeding against the government in order to suspend the debt and allow Sistemas to operate regularly before the tax authorities after attempts to reopen an appeal of the administrative decision failed. Adjusted for currency impacts and accrued interest, the deposit amount is approximately $16 million, as of September 30, 2017. The Company believes that the risk of a negative outcome is remote once the matter is fully litigated at the highest judicial level. These appeal payments, as well as income tax refund claims associated with other jurisdictions, total $19 million as of September 30, 2017, and are included in "Other non-current assets" on the consolidated balance sheet.
18
NOTE 14. Stockholders’ Equity and Non-controlling Interests
Changes in equity for the three and nine months ended September 30, 2017 and 2016 are as follows:
2017 | 2016 | ||||||||||||||||||||||
Visteon | NCI | Total | Visteon | NCI | Total | ||||||||||||||||||
(Dollars in Millions) | |||||||||||||||||||||||
Three Months Ended September 30 | |||||||||||||||||||||||
Beginning balance | $ | 569 | $ | 136 | $ | 705 | $ | 616 | $ | 148 | $ | 764 | |||||||||||
Net income from continuing operations | 43 | 4 | 47 | 21 | 4 | 25 | |||||||||||||||||
Net income from discontinued operations | — | — | — | 7 | — | 7 | |||||||||||||||||
Net income | 43 | 4 | 47 | 28 | 4 | 32 | |||||||||||||||||
Other comprehensive income (loss) | |||||||||||||||||||||||
Foreign currency translation adjustments | 17 | 2 | 19 | 7 | — | 7 | |||||||||||||||||
Net investment hedge | (7 | ) | — | (7 | ) | (4 | ) | — | (4 | ) | |||||||||||||
Benefit plans | (1 | ) | — | (1 | ) | — | — | — | |||||||||||||||
Unrealized hedging gain | 1 | — | 1 | — | — | — | |||||||||||||||||
Total other comprehensive income | 10 | 2 | 12 | 3 | — | 3 | |||||||||||||||||
Stock-based compensation, net | 3 | — | 3 | 1 | — | 1 | |||||||||||||||||
Share repurchase | (10 | ) | — | (10 | ) | — | — | — | |||||||||||||||
Dividends to non-controlling interests | — | (24 | ) | (24 | ) | — | (6 | ) | (6 | ) | |||||||||||||
Ending balance | $ | 615 | $ | 118 | $ | 733 | $ | 648 | $ | 146 | $ | 794 | |||||||||||
2017 | 2016 | ||||||||||||||||||||||
Visteon | NCI | Total | Visteon | NCI | Total | ||||||||||||||||||
(Dollars in Millions) | |||||||||||||||||||||||
Nine Months Ended September 30 | |||||||||||||||||||||||
Beginning balance | $ | 586 | $ | 138 | $ | 724 | $ | 1,057 | $ | 142 | $ | 1,199 | |||||||||||
Net income from continuing operations | 143 | 11 | 154 | 88 | 12 | 100 | |||||||||||||||||
Net income (loss) from discontinued operations | 8 | — | 8 | (15 | ) | — | (15 | ) | |||||||||||||||
Net income | 151 | 11 | 162 | 73 | 12 | 85 | |||||||||||||||||
Other comprehensive income (loss) | |||||||||||||||||||||||
Foreign currency translation adjustments | 57 | 4 | 61 | 32 | (2 | ) | 30 | ||||||||||||||||
Net investment hedge | (20 | ) | — | (20 | ) | (6 | ) | — | (6 | ) | |||||||||||||
Benefit plans | (2 | ) | — | (2 | ) | 1 | — | 1 | |||||||||||||||
Unrealized hedging gain (loss) | 4 | — | 4 | (4 | ) | — | (4 | ) | |||||||||||||||
Total other comprehensive income (loss) | 39 | 4 | 43 | 23 | (2 | ) | 21 | ||||||||||||||||
Stock-based compensation, net | 9 | — | 9 | (5 | ) | — | (5 | ) | |||||||||||||||
Share repurchase | (170 | ) | — | (170 | ) | (500 | ) | — | (500 | ) | |||||||||||||
Dividends to non-controlling interests | — | (35 | ) | (35 | ) | — | (6 | ) | (6 | ) | |||||||||||||
Ending balance | $ | 615 | $ | 118 | $ | 733 | $ | 648 | $ | 146 | $ | 794 | |||||||||||
Share Repurchase Program
During 2016, Visteon completed two stock buyback programs with a third-party financial institution to purchase shares of common stock for an aggregate purchase price of $500 million. Under these programs, Visteon purchased 7,190,506 shares at an average price of $69.48.
On January 10, 2017, the Company's board of directors authorized $400 million of share repurchase of its shares of common stock through. On February 27, 2017 the Company entered into an accelerated share buyback ("ASB") program with a third-party financial institution to purchase shares of Visteon common stock for an aggregate purchase price of $125 million. On March 2, 2017, the Company received an initial delivery of 1,062,022 shares of common stock using a reference price of $94.16. The
19
program was concluded in May 2017 and the Company received an additional 238,344 shares. In total, the Company purchased 1,300,366 shares at an average price of $96.13 under this ASB program.
During the second quarter of 2017, the Company entered into a brokerage agreement with a third party financial institution to execute open market share purchases of the Company's common stock. The Company paid approximately $35 million to repurchase 359,100 shares at an average price of $97.44.
During the third quarter of 2017, the Company paid approximately $10 million to repurchase 82,513 shares on the open market at an average price of $121.25.
The Company anticipates that additional repurchases of common stock, if any, would occur from time to time in open market transactions or in privately negotiated transactions depending on market and economic conditions, share price, trading volume, alternative uses of capital and other factors.
Non-Controlling Interests
Non-controlling interests in the Visteon Corporation economic entity are as follows:
September 30 | December 31 | ||||||
2017 | 2016 | ||||||
(Dollars in Millions) | |||||||
Yanfeng Visteon Automotive Electronics Co., Ltd. | $ | 73 | $ | 97 | |||
Shanghai Visteon Automotive Electronics, Co., Ltd. | 43 | 39 | |||||
Other | 2 | 2 | |||||
$ | 118 | $ | 138 | ||||
20
Accumulated Other Comprehensive (Loss) Income
Changes in Accumulated other comprehensive (loss) income (“AOCI”) and reclassifications out of AOCI by component include:
Three Months Ended September 30 | Nine Months Ended September 30 | ||||||||||||||
2017 | 2016 | 2017 | 2016 | ||||||||||||
(Dollars in Millions) | |||||||||||||||
Changes in AOCI: | |||||||||||||||
Beginning balance | $ | (204 | ) | $ | (170 | ) | $ | (233 | ) | $ | (190 | ) | |||
Other comprehensive income (loss) before reclassification, net of tax | 8 | 2 | 34 | 24 | |||||||||||
Amounts reclassified from AOCI | 2 | 1 | 5 | (1 | ) | ||||||||||
Ending balance | $ | (194 | ) | $ | (167 | ) | $ | (194 | ) | $ | (167 | ) | |||
Changes in AOCI by Component: | |||||||||||||||
Foreign currency translation adjustments | |||||||||||||||
Beginning balance | $ | (123 | ) | $ | (134 | ) | $ | (163 | ) | $ | (159 | ) | |||
Other comprehensive income before reclassification, net of tax (a) | 17 | 7 | 57 | 32 | |||||||||||
Ending balance | (106 | ) | (127 | ) | (106 | ) | (127 | ) | |||||||
Net investment hedge | |||||||||||||||
Beginning balance | (3 | ) | 2 | 10 | 4 | ||||||||||
Other comprehensive loss before reclassification, net of tax (a) | (7 | ) | (4 | ) | (20 | ) | (6 | ) | |||||||
Ending balance | (10 | ) | (2) | (10 | ) | (2) | |||||||||
Benefit plans | |||||||||||||||
Beginning balance | (76 | ) | (35) | (75 | ) | (36) | |||||||||
Other comprehensive income before reclassification, net of tax (a) | (1 | ) | — | (2 | ) | — | |||||||||
Amounts reclassified from AOCI | — | — | — | 1 | |||||||||||
Ending balance | (77 | ) | (35 | ) | (77 | ) | (35 | ) | |||||||
Unrealized hedging (loss) gain | |||||||||||||||
Beginning balance | (2 | ) | (3 | ) | (5 | ) | 1 | ||||||||
Other comprehensive income (loss) before reclassification, net of tax (b) | (1 | ) | (1 | ) | (1 | ) | (2 | ) | |||||||
Amounts reclassified from AOCI | 2 | 1 | 5 | (2 | ) | ||||||||||
Ending balance | (1 | ) | (3 | ) | (1 | ) | (3 | ) | |||||||
Total AOCI | $ | (194 | ) | $ | (167 | ) | $ | (194 | ) | $ | (167 | ) | |||
(a) Net tax expense was less than $1 million for the nine month period ending September 30, 2017. Income tax effects are zero for all other periods due to the recording of the valuation allowance.
(b) Net tax expense of less than $1 million and $1 million are related to unrealized hedging gain for the three and nine month periods ended September 30, 2017, respectively. Net tax benefits of $1 million and less than $1 million are related to unrealized hedging gain for the three and nine month periods ended September 30, 2016, respectively.
NOTE 15. Earnings Per Share
Basic earnings per share is calculated by dividing net income attributable to Visteon by the weighted average number of shares of common stock outstanding. Diluted earnings per share is computed by dividing net income by the weighted average number of common and potentially dilutive common shares outstanding. Performance based share units are considered contingently issuable shares, and are included in the computation of diluted earnings per share based on the number of shares that would be issuable if the reporting date were the end of the contingency period and if the result would be dilutive.
21
The table below provides details underlying the calculations of basic and diluted earnings (loss) per share:
Three Months Ended September 30 | Nine Months Ended September 30 | ||||||||||||||
2017 | 2016 | 2017 | 2016 | ||||||||||||
(In Millions, Except Per Share Amounts) | |||||||||||||||
Numerator: | |||||||||||||||
Net income from continuing operations attributable to Visteon | $ | 43 | $ | 21 | $ | 143 | $ | 88 | |||||||
Income (loss) from discontinued operations, net of tax | — | 7 | 8 | (15 | ) | ||||||||||
Net income attributable to Visteon | $ | 43 | $ | 28 | $ | 151 | $ | 73 | |||||||
Denominator: | |||||||||||||||
Average common stock outstanding - basic | 31.2 | 34.0 | 31.8 | 35.6 | |||||||||||
Dilutive effect of performance based share units and other | 0.6 | 0.4 | 0.5 | 0.4 | |||||||||||
Diluted shares | 31.8 | 34.4 | 32.3 | 36.0 | |||||||||||
Basic and Diluted Per Share Data: | |||||||||||||||
Basic earnings (loss) per share attributable to Visteon: | |||||||||||||||
Continuing operations | $ | 1.38 | $ | 0.62 | $ | 4.50 | $ | 2.47 | |||||||
Discontinued operations | — | 0.21 | 0.25 | (0.42 | ) | ||||||||||
$ | 1.38 | $ | 0.83 | $ | 4.75 | $ | 2.05 | ||||||||
Diluted earnings (loss) per share attributable to Visteon: | |||||||||||||||
Continuing operations | $ | 1.35 | $ | 0.61 | $ | 4.43 | $ | 2.44 | |||||||
Discontinued operations | — | 0.20 | 0.25 | (0.41 | ) | ||||||||||
$ | 1.35 | $ | 0.81 | $ | 4.68 | $ | 2.03 | ||||||||
NOTE 16. Fair Value Measurements and Financial Instruments
Fair Value Measurements
The Company uses a three-level fair value hierarchy that categorizes assets and liabilities measured at fair value based on the observability of the inputs utilized in the valuation. The fair value hierarchy gives the highest priority to the quoted prices in active markets for identical assets and liabilities and lowest priority to unobservable inputs.
• | Level 1 – Financial assets and liabilities whose values are based on unadjusted quoted market prices for identical assets and liabilities in an active market that the Company has the ability to access. |
• | Level 2 – Financial assets and liabilities whose values are based on quoted prices in markets that are not active or model inputs that are observable for substantially the full term of the asset or liability. |
• | Level 3 – Financial assets and liabilities whose values are based on prices or valuation techniques that require inputs that are both unobservable and significant to the overall fair value measurement. |
Items Measured at Fair Value on a Nonrecurring Basis
Certain assets and liabilities are measured at fair value on a nonrecurring basis. The fair value measurements are generally determined using unobservable inputs and are classified within Level 3 of the fair value hierarchy. These assets include long-lived assets, intangible assets and investments in affiliates, which may be written down to fair value as a result of impairment. During the third quarter there were no items measured at fair value on a nonrecurring basis.
Items Not Carried at Fair Value
The Company's fair value of debt was approximately $397 million and $389 million as of September 30, 2017 and December 31, 2016, respectively. Fair value estimates were based on the current rates offered to the Company for debt of the same remaining maturities. Accordingly, the Company's debt fair value disclosures are classified as Level 2, "Other Observable Inputs" in the fair value hierarchy.
22
The Company is exposed to various market risks including, but not limited to, changes in currency exchange rates and market interest rates. The Company manages these risks, in part, through the use of derivative financial instruments. The maximum length of time over which the Company hedges the variability in the future cash flows related to transactions, excluding those transactions as related to the payment of variable interest on existing debt, is eighteen months. The maximum length of time over which the Company hedges forecasted transactions related to variable interest payments is the term of the underlying debt. The use of financial derivative instruments may pose risk of loss in the event of nonperformance by the transaction counter-party.
The Company presents its derivative positions and any related material collateral under master netting arrangements that provide for the net settlement of contracts, by counterparty, in the event of default or termination. Derivative financial instruments designated and non-designated as hedging instruments are included in the Company’s consolidated balance sheets. There is no cash collateral on any of these derivatives.
Items Measured at Fair Value on a Recurring Basis
Foreign currency hedge instruments are measured at fair value on a recurring basis under an income approach using industry-standard models that consider various assumptions, including time value, volatility factors, current market and contractual prices for the underlying and non-performance risk. Substantially all of these assumptions are observable in the marketplace throughout the full term of the instrument, can be derived from observable data, or are supported by observable levels at which transactions are executed in the marketplace. Accordingly, the Company's foreign currency instruments are classified as Level 2, "Other Observable Inputs" in the fair value hierarchy.
Interest rate swaps are valued under an income approach using industry-standard models that consider various assumptions, including time value, volatility factors, current market and contractual prices for the underlying and non-performance risk. Substantially all of these assumptions are observable in the marketplace throughout the full term of the instrument, and can be derived from observable data or supported by observable levels at which transactions are executed in the marketplace. Accordingly, the Company's interest rate swaps are classified as Level 2, "Other Observable Inputs" in the fair value hierarchy.
Foreign Exchange Risk: The Company’s net cash inflows and outflows exposed to the risk of changes in foreign currency exchange rates arise from the sale of products in countries other than the manufacturing source, foreign currency denominated supplier payments, debt and other payables, subsidiary dividends and investments in subsidiaries. The Company primarily uses foreign currency derivative instruments, including forward and option contracts, to mitigate the variability of the value of cash flows denominated in currency other than the hedging entity's functional currency. Foreign currency exposures are reviewed periodically and any natural offsets are considered prior to entering into a derivative financial instrument. The Company’s current hedged foreign currency exposures include the Euro, Japanese Yen, Thailand Bhat and Mexican Peso.
As of September 30, 2017, and December 31, 2016, the Company had foreign currency derivative instruments with aggregate notional value of approximately $133 million and $169 million, respectively. At September 30, 2017, approximately $89 million of the hedge instruments have been designated as cash flow hedges. Accordingly, the effective portion of changes in the fair value of the transactions are initially recognized in other comprehensive income, a component of shareholders' equity. Upon settlement of the transactions, the accumulated gains and losses are reclassified to income in the same periods during which the hedged cash flows impact earnings. The ineffective portion of changes in the fair value of the transactions, if any, is recognized directly in income. There was no ineffectiveness associated with such derivatives as of September 30, 2017 and December 31, 2016 and the fair value of these derivatives was a liability of $3 million and a liability of $6 million, respectively. The difference between the gross and net value of these derivatives after offset by counter party is not material. The estimated AOCI that is expected to be reclassified into earnings within the next 12 months is an approximate loss of $1 million.
During 2015, the Company entered into cross currency swaps to mitigate the variability of the value of the Company's investment in certain non-U.S. entities. In April 2017, the Company terminated the cross currency swaps and received $5 million of proceeds upon settlement. There was no ineffectiveness associated with such derivatives at the time of the termination. The Company subsequently entered into new cross currency swap transactions with an aggregate notional amount of $150 million. The transactions are designated as net investment hedges of certain of the Company's European affiliates. Accordingly, the effective portion of periodic changes in the fair value of the transactions is recognized in other comprehensive income, a component of shareholders' equity. There was no ineffectiveness associated with such derivatives as of September 30, 2017 and December 31, 2016 and the fair value of these derivatives was a liability of $19 million and an asset of $6 million, respectively.
Interest Rate Risk: The Company is subject to interest rate risk principally in relation to variable-rate debt. The Company uses financial derivative instruments to manage exposure to fluctuations in interest rates in connection with its risk management policies.
23
During 2015, the Company entered into interest rate swaps to manage interest rate risk associated with the Term Facility. In April 2017 the Company terminated the interest rate swaps and paid $1 million to settle the contracts.
During the second quarter of 2017, the Company entered into interest rate swap contracts with an aggregate notional value of $150 million to effectively convert designated interest payments related to the amended Term Facility from variable to fixed cash flows. The maturities of these swaps do not exceed the underlying obligations under the amended Term Facility. The instruments have been designated as cash flow hedges and the effective portion of the changes in the fair value of the swap transactions is recognized in other comprehensive income, a component of shareholders' equity. Subsequently, the accumulated gains and losses recorded in equity are reclassified to income in the period during which the hedged cash transaction impacts earnings. The ineffective portion of changes in the fair value of the swap transactions, if any, is recognized directly in income. As of September 30, 2017 and December 31, 2016, the fair value was an asset of less than $1 million and a liability of $1 million, respectively and there has been no ineffectiveness associated with these derivatives. AOCI expected to be reclassified into earnings within the next 12 months is a loss of less than $1 million.
Financial Statement Presentation
Gains and losses on derivative financial instruments for the three and nine months ended September 30, 2017 and 2016 are as follows:
Recorded (Loss) Income into AOCI, net of tax | Reclassified from AOCI into (Income) Loss | Recorded in (Income) Loss | ||||||||||||||||||||||
2017 | 2016 | 2017 | 2016 | 2017 | 2016 | |||||||||||||||||||
(Dollars in Millions) | ||||||||||||||||||||||||
Three Months Ended September 30 | ||||||||||||||||||||||||
Foreign currency risk - Cost of sales: | ||||||||||||||||||||||||
Cash flow hedges | $ | (1 | ) | $ | (3 | ) | $ | 2 | $ | — | $ | — | $ | — | ||||||||||
Net investment hedges | (7 | ) | (1 | ) | — | — | — | — | ||||||||||||||||
Non-designated cash flow hedges | — | — | — | — | 1 | (2 | ) | |||||||||||||||||
Interest rate risk - Interest expense, net: | ||||||||||||||||||||||||
Interest rate swap | — | 2 | — | 1 | — | — | ||||||||||||||||||
$ | (8 | ) | $ | (2 | ) | $ | 2 | $ | 1 | $ | 1 | $ | (2 | ) | ||||||||||
Nine Months Ended September 30 | ||||||||||||||||||||||||
Foreign currency risk - Cost of sales: | ||||||||||||||||||||||||
Cash flow hedges | $ | (1 | ) | $ | — | $ | 5 | $ | (3 | ) | $ | — | $ | — | ||||||||||
Net investment hedges | (20 | ) | (3 | ) | — | — | — | — | ||||||||||||||||
Non-designated cash flow hedges | — | — | — | — | (2 | ) | (3 | ) | ||||||||||||||||
Interest rate risk - Interest expense, net: | ||||||||||||||||||||||||
Interest rate swap | — | (2 | ) | 1 | 1 | — | — | |||||||||||||||||
$ | (21 | ) | $ | (5 | ) | $ | 6 | $ | (2 | ) | $ | (2 | ) | $ | (3 | ) | ||||||||
Concentrations of Credit Risk
Financial instruments including cash equivalents, derivative contracts, and accounts receivable, expose the Company to counter-party credit risk for non-performance. The Company’s counterparties for cash equivalents and derivative contracts are banks and financial institutions that meet the Company’s credit rating requirements. The Company’s counterparties for derivative contracts are substantial investment and commercial banks with significant experience using such derivatives. The Company manages its credit risk through policies requiring minimum credit standing and limiting credit exposure to any one counter-party and through monitoring counter-party credit risks.
The Company's credit risk with any individual customer does not exceed ten percent of total accounts receivable except for Ford and its affiliates which represents 17% and 16% of the balance as of September 30, 2017 and December 31, 2016, respectively, Mazda which represents 11% and 10% of the balance as of September 30, 2017 and December 31, 2016, and Nissan/Renault which represents 11% and 10% of the balance as of September 30, 2017 and December 31, 2016, respectively.
24
NOTE 17. Commitments and Contingencies
Litigation and Claims
In 2003, the Local Development Finance Authority of the Charter Township of Van Buren, Michigan (the “Township”) issued, approximately $28 million in bonds finally maturing in 2032, the proceeds of which were used at least in part to assist in the development of the Company’s U.S. headquarters located in the Township. During January 2010, the Company and the Township entered into a settlement agreement (the “Settlement Agreement”) that, among other things, reduced the taxable value of the headquarters property to current market value and facilitated certain claims of the Township in the Company’s chapter 11 proceedings. The Settlement Agreement also provided that the Company would continue to negotiate in good faith with the Township in the event that property tax payments was inadequate to permit the Township to meet its payment obligations with respect to the bonds. In September 2013, the Township notified the Company in writing that it is estimating a shortfall in tax revenues of between $25 million and $36 million, which could render it unable to satisfy its payment obligations under the bonds. On May 12, 2015, the Township commenced a proceeding against the Company in the U. S. Bankruptcy Court for the District of Delaware in connection with the foregoing. Upon the Company’s motion to dismiss, the Township dismissed the proceeding before the Delaware Bankruptcy Court and re-commenced the proceeding against the Company in the Michigan Wayne County Circuit Court for the State of Michigan on July 2, 2015. The Township sought damages or, alternatively, declaratory judgment that, among other things, the Company is responsible under the Settlement Agreement for payment of any shortfall in the bond debt service payments. On February 2, 2016, the Wayne County Circuit Court dismissed the Township’s lawsuit without prejudice on the basis that the Township’s claims were not ripe for adjudication. The Township appealed the decision to the Michigan Court of Appeals, which affirmed the dismissal of the Township’s lawsuit. The Township has sought leave to appeal from the Michigan Supreme Court. The Company disputes the factual and legal assertions made by the Township and intends to vigorously defend the matter. The Company is not able to estimate the possible loss or range of loss in connection with this matter.
The Company is currently involved in disputes with its former President and Chief Executive Officer, Timothy D. Leuliette. Mr. Leuliette filed an arbitration demand against the Company with the American Arbitration Association, alleging claims relating to the cessation of his employment. The Company subsequently filed a complaint against Mr. Leuliette in the U.S. District Court for the Eastern District of Michigan, seeking to enjoin the arbitration and asserting additional claims. The federal litigation is currently stayed pending a ruling in the arbitration. The Company disputes the factual and legal assertions made by Mr. Leuliette, has asserted counterclaims against him in the arbitration, and, although there can be no assurances, the Company does not currently believe that the resolution of these disputes will have a material adverse impact on its results of operations or financial condition.
In November 2013, the Company and Halla Visteon Climate Control Corporation, a Korean corporation (“HVCC”), jointly filed an Initial Notice of Voluntary Self-Disclosure statement with the U.S. Treasury Department’s Office of Foreign Assets Control (“OFAC”) regarding certain sales of automotive HVAC components by a minority-owned, Chinese joint venture of HVCC into Iran. The Company updated that notice in December 2013, and subsequently filed a voluntary self-disclosure regarding these sales with OFAC in March 2014. In May 2014, the Company voluntarily filed a supplementary self-disclosure identifying additional sales of automotive HVAC components by the Chinese joint venture, as well as similar sales involving an HVCC subsidiary in China, totaling approximately $12 million, and filed a final voluntary-self disclosure with OFAC on October 17, 2014. OFAC is currently reviewing the results of the Company’s investigation. Following that review, OFAC may conclude that the disclosed sales resulted in violations of U.S. economic sanctions laws and warrant the imposition of civil penalties, such as fines, limitations on the Company's ability to export products from the United States, and/or referral for further investigation by the U.S. Department of Justice. Any such fines or restrictions may be material to the Company’s financial results in the period in which they are imposed, but at this time is not able to estimate the possible loss or range of loss in connection with this matter. Additionally, disclosure of this conduct and any fines or other action relating to this conduct could harm the Company’s reputation and have a material adverse effect on our business, operating results and financial condition. The Company cannot predict when OFAC will conclude its own review of our voluntary self-disclosures or whether it may impose any of the potential penalties described above.
The Company's operations in Brazil and Argentina are subject to highly complex labor, tax, customs and other laws. While the Company believes that it is in compliance with such laws, it is periodically engaged in litigation regarding the application of these laws. As of September 30, 2017, the Company maintained accruals of approximately $12 million and $4 million for claims aggregating approximately $57 million and $5 million in Brazil and Argentina, respectively. The amounts accrued represent claims that are deemed probable of loss and are reasonably estimable based on the Company's assessment of the claims and prior experience with similar matters.
While the Company believes its accruals for litigation and claims are adequate, the final amounts required to resolve such matters could differ materially from recorded estimates and the Company's results of operations and cash flows could be materially affected.
25
Guarantees and Commitments
The Company provided a $15 million loan guarantee to YFVIC. The guarantee contains standard non-payment provisions to cover the borrowers in event of non-payment of principal, accrued interest, and other fees, and the loan is expected to be fully paid by September 2019.
As part of the agreements of the Climate Transaction and Interiors Divestiture, the Company continues to provide lease guarantees to divested Climate and Interiors entities. At September 30, 2017 the Company has approximately $7 million of outstanding guarantees, related to each of the divested Climate and Interiors entities, respectively, totaling $14 million. These guarantees will generally cease upon expiration of current lease agreements.
Product Warranty and Recall
Amounts accrued for product warranty and recall claims are based on management’s best estimates of the amounts that will ultimately be required to settle such items. The Company’s estimates for product warranty and recall obligations are developed with support from its sales, engineering, quality and legal functions and include due consideration of contractual arrangements, past experience, current claims and related information, production changes, industry and regulatory developments and various other considerations. The following table provides a reconciliation of changes in the product warranty and recall claims liability:
Nine Months Ended September 30 | |||||||
2017 | 2016 | ||||||
(Dollars in Millions) | |||||||
Beginning balance | $ | 55 | $ | 38 | |||
Accruals for products shipped | 15 | 12 | |||||
Changes in estimates | 5 | 4 | |||||
Specific cause actions | 3 | 7 | |||||
Recoverable warranty/recalls | — | 6 | |||||
Foreign currency | 2 | 1 | |||||
Settlements | (29 | ) | (13 | ) | |||
Ending balance | $ | 51 | $ | 55 | |||
Other Contingent Matters
The Company is actively negotiating the possible exit of a European facility that would involve contributing cash, inventory, and fixed assets to a third party. The potential transaction is subject to governmental and legal approvals. While the terms have yet to be finalized, the potential contribution includes cash and working capital ranging from $15 million to $20 million and long term assets of approximately $10 million to $15 million. As of September 30, 2017, the Company did not meet the specific criteria necessary for the assets to be considered held for sale.
Various legal actions, governmental investigations and proceedings and claims are pending or may be instituted or asserted in the future against the Company, including those arising out of alleged defects in the Company’s products; governmental regulations relating to safety; employment-related matters; customer, supplier and other contractual relationships; intellectual property rights; product warranties; product recalls; and environmental matters. Some of the foregoing matters may involve compensatory, punitive or antitrust or other treble damage claims in very large amounts, or demands for recall campaigns, environmental remediation programs, sanctions, or other relief which, if granted, would require very large expenditures. The Company enters into agreements that contain indemnification provisions in the normal course of business for which the risks are considered nominal and impracticable to estimate.
Contingencies are subject to many uncertainties, and the outcome of individual litigated matters is not predictable with assurance. Reserves have been established by the Company for matters discussed in the immediately foregoing paragraph where losses are deemed probable and reasonably estimable. It is possible, however, that some of the matters discussed in the foregoing paragraph could be decided unfavorably to the Company and could require the Company to pay damages or make other expenditures in amounts, or a range of amounts, that cannot be estimated as of September 30, 2017 and that are in excess of established reserves. The Company does not reasonably expect, except as otherwise described herein, based on its analysis, that any adverse outcome
26
from such matters would have a material effect on the Company’s financial condition, results of operations or cash flows, although such an outcome is possible.
NOTE 18. Segment Information
Financial results for the Company's reportable segment have been prepared using a management approach, which is consistent with the basis and manner in which financial information is evaluated by the Company's chief operating decision maker in allocating resources and in assessing performance. The Company’s chief operating decision maker, the Chief Executive Officer, evaluates the performance of the Company’s segment primarily based on net sales, before elimination of inter-company shipments, Adjusted EBITDA (a non-GAAP financial measure, as defined below) and operating assets.
The Company’s current reportable segment is Electronics. The Company's Electronics segment provides vehicle cockpit electronics products to customers, including audio systems, information displays, instrument clusters, head up displays, infotainment systems, and telematics solutions. Prior to 2017, the Company also had Other operations consisting primarily of South Africa and South America climate operations substantially exited during the fourth quarter of 2016. As the Company ceased Other operations in 2016, future legacy impacts will be associated with the Company's continuing Electronics operations.
Segment Sales
Three Months Ended September 30 | Nine Months Ended September 30 | ||||||||||||||
2017 | 2016 | 2017 | 2016 | ||||||||||||
(Dollars in Millions) | |||||||||||||||
Electronics | $ | 765 | $ | 749 | $ | 2,349 | $ | 2,304 | |||||||
Other | — | 21 | — | 41 | |||||||||||
Total consolidated sales | $ | 765 | $ | 770 | $ | 2,349 | $ | 2,345 | |||||||
Segment Adjusted EBITDA
The Company defines Adjusted EBITDA as net income attributable to the Company adjusted to eliminate the impact of depreciation and amortization, restructuring expense, net interest expense, loss on debt extinguishment, equity in net income of non-consolidated affiliates, loss on divestiture, gain on non-consolidated affiliate transactions, other net expense, provision for income taxes, discontinued operations, net income attributable to non-controlling interests, non-cash stock-based compensation expense, pension settlement gains, and other gains and losses not reflective of the Company's ongoing operations.
Adjusted EBITDA is presented as a supplemental measure of the Company's financial performance that management believes is useful to investors because the excluded items may vary significantly in timing or amounts and/or may obscure trends useful in evaluating and comparing the Company's operating activities across reporting periods. Not all companies use identical calculations and, accordingly, the Company's presentation of Adjusted EBITDA may not be comparable to other similarly titled measures of other companies. Adjusted EBITDA is not a recognized term under GAAP and does not purport to be a substitute for net income as an indicator of operating performance or cash flows from operating activities as a measure of liquidity. Adjusted EBITDA has limitations as an analytical tool and is not intended to be a measure of cash flow available for management's discretionary use, as it does not consider certain cash requirements such as interest payments, tax payments and debt service requirements. In addition, the Company uses Adjusted EBITDA (i) as a factor in incentive compensation decisions, (ii) to evaluate the effectiveness of the Company's business strategies and (iii) the Company's credit agreements use measures similar to Adjusted EBITDA to measure compliance with certain covenants.
Segment Adjusted EBITDA is summarized below:
Three Months Ended September 30 | Nine Months Ended September 30 | ||||||||||||||
2017 | 2016 | 2017 | 2016 | ||||||||||||
(Dollars in Millions) | |||||||||||||||
Electronics | $ | 83 | $ | 75 | $ | 268 | $ | 248 | |||||||
Other | — | — | — | (7 | ) | ||||||||||
Adjusted EBITDA | $ | 83 | $ | 75 | $ | 268 | $ | 241 | |||||||
27
The reconciliation of Adjusted EBITDA to net income attributable to Visteon is as follows:
Three Months Ended September 30 | Nine Months Ended September 30 | ||||||||||||||
2017 | 2016 | 2017 | 2016 | ||||||||||||
(Dollars in Millions) | |||||||||||||||
Adjusted EBITDA | $ | 83 | $ | 75 | $ | 268 | $ | 241 | |||||||
Depreciation and amortization | 21 | 21 | 62 | 62 | |||||||||||
Restructuring expense | 6 | 5 | 10 | 22 | |||||||||||
Interest expense, net | 3 | 5 | 12 | 10 | |||||||||||
Equity in net income of non-consolidated affiliates | (1 | ) | — | (6 | ) | (3 | ) | ||||||||
Other (income) expense, net | (1 | ) | 12 | (3 | ) | 16 | |||||||||
Provision for income taxes | 8 | 5 | 34 | 27 | |||||||||||
(Income) loss from discontinued operations, net of tax | — | (7 | ) | (8 | ) | 15 | |||||||||
Net income attributable to non-controlling interests | 4 | 4 | 11 | 12 | |||||||||||
Non-cash, stock-based compensation expense | 3 | 2 | 9 | 6 | |||||||||||
Other | (3 | ) | — | (4 | ) | 1 | |||||||||
Net income attributable to Visteon Corporation | $ | 43 | $ | 28 | $ | 151 | $ | 73 | |||||||
28
Item 2. | Management's Discussion and Analysis of Financial Condition and Results of Operations |
Management’s Discussion and Analysis (“MD&A”) is intended to help the reader understand the results of operations, financial condition and cash flows of Visteon Corporation (“Visteon” or the “Company”). MD&A is provided as a supplement to, and should be read in conjunction with, the Company’s Annual Report on Form 10-K for the fiscal year ended December 31, 2016 filed with the Securities and Exchange Commission on February 23, 2017, and the financial statements and accompanying notes to the financial statements included elsewhere herein.
Description of Business
Visteon Corporation (the "Company" or "Visteon") is a global automotive supplier that designs, engineers and manufactures innovative electronics products for nearly every original equipment vehicle manufacturer ("OEM") worldwide including Ford, Mazda, Renault/Nissan, General Motors, Honda, BMW and Daimler. Visteon is headquartered in Van Buren Township, Michigan and has an international network of manufacturing operations, technical centers and joint venture operations, supported by approximately 10,000 employees, dedicated to the design, development, manufacture and support of its product offerings and its global customers. The Company's manufacturing and engineering footprint is principally located outside of the United States.
Visteon provides value for its customers and stockholders through its technology-focused vehicle cockpit electronics business, by delivering a rich, connected cockpit experience for every car from luxury to entry. The Company's cockpit electronics business is one of the broadest portfolios in the industry and includes instrument clusters, information displays, infotainment systems, audio systems, telematics solutions, and head up displays. The Company's vehicle cockpit electronics business comprises and is reported under the Electronics segment. In addition to the Electronics segment, the Company had residual operations in South America and South Africa previously associated with the Climate business, sold or exited by December 31, 2016, but not subject to discontinued operations classification that comprised Other.
Strategic Initiatives
Visteon is a technology-focused, pure-play supplier of automotive cockpit electronics and connected car solutions. The Company has laid out the following strategic initiatives for 2017 and beyond:
• | Strengthen the Core - Visteon offers technology and related manufacturing operations for audio, head-up displays, information displays, infotainment, instrument clusters and telematics products. During the first nine months of 2017, the Company won $4.6 billion in new business, $0.5 billion higher than the first nine months of 2016. The third quarter 2017 new business wins includes the first award of Phoenix™ infotainment technology, designed to unlock innovation by enabling third-party developers to create apps easily, while delivering built-in cybersecurity and over-the-air ("OTA") updates. Earlier in the year, awards included the third and fourth awards of SmartCore™ cockpit technology which represents the industry-first automotive grade cockpit domain controller, consolidating separate cockpit electronics products on a single, multi-core chip, accessible through integrated human machine interface ("HMI") technology. The Company's backlog, defined as cumulative remaining life of program booked sales, is approximately $18.0 billion as of September 30, 2017, or 5.7 times the last twelve months of sales, reflecting a strong booked sales base on which to launch future growth. |
Core business financial results continue to improve with Adjusted EBITDA margin for electronics of 10.8% in third quarter 2017 compared with 10.0% in the same period of 2016. The Company expects to deliver cost efficiencies by streamlining selling, general and administration costs and engineering costs, improving free cash flow, optimizing the capital structure and driving savings benefits as revenue grows.
During 2016, the Company initiated a restructuring of its engineering and administration organization to focus on technology and execution and also to align the engineering and administrative footprint with its core technologies and customers. The organization will be comprised of customer regional engineering, product management and advanced technologies, and global centers of competence.
• | Move Selectively to Adjacent Products - As consumer demand continues to evolve with an increase in electronics content per vehicle, the Company is advancing its expertise in the areas of cockpit domain controllers, next generation safety applications, and vehicle cybersecurity. Each of these areas require careful assessments of shifting consumer needs and how these new products complement Visteon's core products. |
• | Expand into Autonomous Driving - The Company's approach to autonomous driving is to feature fail-safe centralized domain hardware, designed for algorithmic developers, and applying artificial intelligence for object detection and other functions. |
29
The Company is developing a secure autonomous driving domain controller platform with an open framework based on neural networks. The Company projects a launch of the technology in 2018.
During the third quarter of 2017, the Company entered into a contribution agreement with a non-profit corporation who is building a state of the art research and development facility for testing and validating connected and automated vehicles, the acceleration of standards, and the education of the workforce and public. The Company will use the future facility for the Company's autonomous driving research and development activities.
• | Accelerate China Business - The Company plans to accelerate its China business as China’s economic environment offers significant growth opportunities in sales and new technology launches. Visteon will continue to leverage joint venture relationships to drive adoption of new offerings. Approximately 37% of the Company's $18 billion of backlog is expected to be manufactured in China and other countries in Asia. |
• | Enhance Shareholder Returns - On January 10, 2017, the Company's board of directors authorized management to purchase $400 million of Visteon common stock. On February 27, 2017, the Company entered into an accelerated share buyback ("ASB") program with a third-party financial institution to purchase shares of Visteon common stock for an aggregate purchase price of $125 million. Through conclusion of the program on May 8, 2017, the Company acquired 1,300,366 shares at an average price of $96.13 per share. In addition to the ASB program, the Company has purchased of 441,613 shares in the open market. Through the end of the third quarter, the Company has purchased 1,741,979 shares at an average price of $97.59 per share for a total of $170 million in share repurchases during 2017. |
The Company anticipates that additional share repurchases, if any, would occur from time to time in open market transactions or in privately negotiated transactions depending on market and economic conditions, share price, trading volume, alternative uses of capital and other factors.
Executive Summary
The Company's Electronics sales for the three months ended September 30, 2017 totaled $765 million, the pie charts below highlight the sales breakdown for the three and nine months ended September 30, 2017.
Three Months Ended September 30, 2017
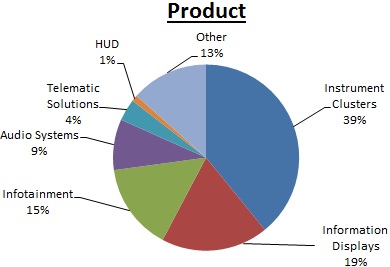
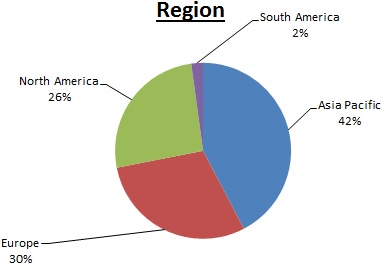
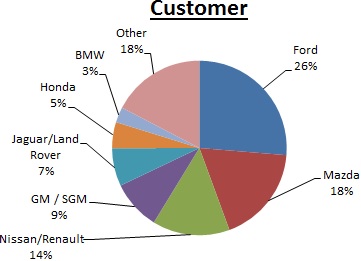
Nine Months Ended September 30, 2017
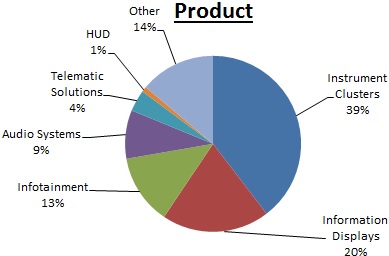
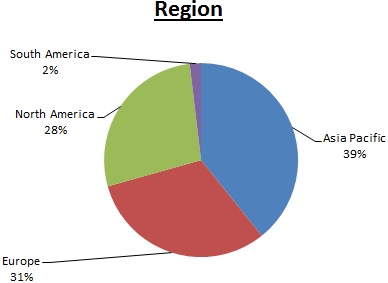
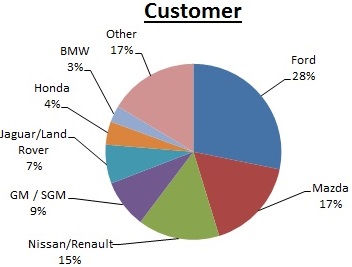
30
Third quarter 2017 global light vehicle production increased 2.1% over the same period last year. Production increased year over year in all regions during the third quarter except for North America which was down (9.7%) as manufacturers cut production to reduce higher than optimal levels of unsold inventory.
Light vehicle production levels for the three and nine months ended September 30, 2017 and 2016, by geographic region are provided below:
Three Months Ended September 30 | Nine Months Ended September 30 | ||||||||||||||||
2017 | 2016 | Change | 2017 | 2016 | Change | ||||||||||||
(Units in Millions) | |||||||||||||||||
Global | 22.4 | 22.0 | 2.1 | % | 69.8 | 68.0 | 2.6 | % | |||||||||
Asia Pacific | 11.9 | 11.5 | 3.5 | % | 36.0 | 34.7 | 3.6 | % | |||||||||
Europe | 5.0 | 4.8 | 5.2 | % | 16.5 | 16.1 | 2.4 | % | |||||||||
North America | 4.0 | 4.4 | (9.7 | )% | 13.0 | 13.5 | (3.7 | )% | |||||||||
South America | 0.9 | 0.7 | 26.1 | % | 2.4 | 2.0 | 20.9 | % | |||||||||
Other | 0.6 | 0.6 | 11.6 | % | 1.9 | 1.7 | 12.9 | % | |||||||||
Source: IHS Automotive | |||||||||||||||||
Significant aspects of the Company's financial results during the three and nine months periods ended September 30, 2017 include the following:
• | The Company recorded sales of $765 million for the three months ended September 30, 2017, representing a decrease of $5 million when compared with the same period of 2016. The decrease is attributable to the exit of other climate operations in 2016, representing a decrease of $21 million. Electronics sales increased by $16 million, primarily due to new business, favorable volumes, product mix, and currency, partially offset by customer pricing net of design changes. |
• | The Company recorded sales of $2,349 million for the nine months ended September 30, 2017, representing an increase of $4 million when compared with the same period of 2016. The increase was primarily due to new business, favorable volumes, and product mix, partially offset by customer pricing net of design changes, unfavorable currency, and the exit of other climate operations in 2016. |
• | Gross margin was $116 million or 15.2% of sales for the three months ended September 30, 2017, compared to $105 million or 13.6% of sales for the same period of 2016. The increase was primarily attributable to improved cost performance including higher engineering recoveries and favorable volumes and currency, partially offset by customer pricing and product mix. |
• | Gross margin was $359 million or 15.3% of sales for the nine months ended September 30, 2017, compared to $335 million or 14.3% of sales for the same period of 2016. The increase was primarily attributable to the exit of the Company's other climate operations in 2016, favorable volumes, net new business and improved cost performance including higher engineering recoveries, partially offset by customer pricing, currency impacts, and product mix. |
• | Net income attributable to Visteon was $43 million for the three months ended September 30, 2017, compared to net income of $28 million for the same period of 2016. The increase of $15 million includes improved gross margin of $11 million and the non-recurrence of charges associated with the 2016 South Africa climate disposition of $11 million. These increases were partially offset by an increase in the provision for income taxes of $3 million and the non-recurrence of 2016 discontinued operations net income of $7 million. |
• | Net income attributable to Visteon was $151 million for the nine months ended September 30, 2017, compared to net income of $73 million for the same period of 2016. The increase of $78 million includes higher net income due to the non-recurrence of 2016 losses from discontinued operations of $15 million, 2017 income from discontinued operations of $8 million, lower restructuring charges of $12 million, the non-recurrence of charges associated with the 2016 South Africa climate disposition of $11 million, lower selling, general and administrative expenses of $5 million, higher equity in net income of non-consolidated affiliates of $3 million and gains on the sale of non-consolidated affiliates of $3 million. Gross margin improved $24 million including $17 million for electronics operations and $7 million related to the 2016 exit of the climate operations. These improvements were partially offset by higher income taxes of $7 million. |
• | Including discontinued operations, the Company generated $131 million of cash in operating activities during the nine months ended September 30, 2017, compared to cash provided by operations of $38 million during the same period of 2016 representing a $93 million improvement. The increase in operating cash flows is attributable to higher net income of $77 million and lower cash tax payments, net of expense of $67 million primarily due to the non-recurrence of |
31
transaction related taxes incurred in 2016, partially offset by higher warranty payments net of expense of $21 million, higher working capital use of approximately $10 million and an increase in China bank notes of $11 million.
• | Total cash was $735 million, including $3 million of restricted cash as of September 30, 2017, $147 million lower than $882 million as of December 31, 2016, primarily attributable to share repurchases of $170 million, $69 million of capital expenditures, and the repurchase of the India electronics operations sold in connection with the Climate Transaction of $47 million, partially offset by the change in cash provided by operating activities of $93 million and $15 million proceeds from business divestiture. |
32
The Company's consolidated results of operations for the three months ended September 30, 2017 and 2016 were as follows:
Three Months Ended September 30 | |||||||||||
2017 | 2016 | Change | |||||||||
(Dollars in Millions) | |||||||||||
Sales | $ | 765 | $ | 770 | $ | (5 | ) | ||||
Cost of sales | 649 | 665 | (16 | ) | |||||||
Gross margin | 116 | 105 | 11 | ||||||||
Selling, general and administrative expenses | 54 | 53 | 1 | ||||||||
Restructuring expense | 6 | 5 | 1 | ||||||||
Interest expense, net | 3 | 5 | (2 | ) | |||||||
Equity in net income of non-consolidated affiliates | 1 | — | 1 | ||||||||
Other (income) expense, net | (1 | ) | 12 | (13 | ) | ||||||
Provision for income taxes | 8 | 5 | 3 | ||||||||
Net income from continuing operations | 47 | 25 | 22 | ||||||||
Income from discontinued operations | — | 7 | (7 | ) | |||||||
Net income | 47 | 32 | 15 | ||||||||
Net income attributable to non-controlling interests | 4 | 4 | — | ||||||||
Net income attributable to Visteon Corporation | $ | 43 | $ | 28 | $ | 15 | |||||
Adjusted EBITDA* | $ | 83 | $ | 75 | $ | 8 | |||||
* Adjusted EBITDA is a Non-GAAP financial measure, as further discussed below. | |||||||||||
Results of Operations - Three Months Ended September 30, 2017 and 2016
Prior to 2017, the Company also had Other operations consisting primarily of the South Africa and the South America climate operations exited during the fourth quarter of 2016.
Sales
Electronics | Other | Total | |||||||||
(Dollars in Millions) | |||||||||||
Three months ended September 30, 2016 | $ | 749 | $ | 21 | $ | 770 | |||||
Volume, mix, and net new business | 26 | — | 26 | ||||||||
Currency | 9 | — | 9 | ||||||||
Customer pricing and other | (19 | ) | — | (19 | ) | ||||||
Exit and wind-down | — | (21 | ) | (21 | ) | ||||||
Three months ended September 30, 2017 | $ | 765 | $ | — | $ | 765 | |||||
Sales for the three months ended September 30, 2017 totaled $765 million, which represents an decrease of $5 million compared with the same period of 2016. Favorable volumes, product mix, and net new business increased sales by $26 million. Product mix reflects the Company specific content across product lines. Favorable currency increased sales by $9 million, primarily attributable to the Euro and Indian Rupee. The exit of other climate operations in 2016 decreased sales by $21 million. Other reductions were associated with customer pricing, net of design savings.
33
Cost of Sales
Electronics | Other | Total | |||||||||
(Dollars in Millions) | |||||||||||
Three months ended September 30, 2016 | $ | 644 | $ | 21 | $ | 665 | |||||
Currency | 7 | — | 7 | ||||||||
Volume, mix, and net new business | 30 | — | 30 | ||||||||
Exit and wind-down | — | (21 | ) | (21 | ) | ||||||
Net cost performance | (32 | ) | — | (32 | ) | ||||||
Three months ended September 30, 2017 | $ | 649 | $ | — | $ | 649 | |||||
Cost of sales decreased $16 million for the three months ended September 30, 2017 when compared with the same period in 2016. Increased volumes, product mix, and net new business increased cost of sales by $30 million. Foreign currency increased cost of sales by $7 million primarily attributable to the Euro and Brazilian Real. The exit and wind down of other climate operations decreased costs by $21 million. Net efficiencies, including material, design and usage economics and higher engineering recoveries, partially offset by increased manufacturing expense, decreased cost of sales by $29 million. Cost of sales also included a $3 million benefit related to legacy South America climate operations for freight recoveries and a favorable ruling on a litigation matter.
Cost of sales includes net engineering costs comprised of gross engineering expenses related to forward model program development and advanced engineering activities, partially offset by engineering cost recoveries from customers. Electronics gross engineering expenses were $99 million for the three months ended September 30, 2017, consistent with the same period of 2016. Engineering recoveries were $33 million for the three months ended September 30, 2017, $9 million higher than the same period of 2016. Engineering cost recoveries can fluctuate period to period depending on underlying contractual terms and conditions and achievement of related development milestones.
Gross Margin
Gross margin was $116 million or 15.2% of sales for the three months ended September 30, 2017 compared to $105 million or 13.6% of sales for the same period of 2016. The increase in gross margin of $10 million included $9 million of favorable net cost performance reflecting material cost efficiencies and higher engineering recoveries which more than offset customer pricing and higher manufacturing costs. Favorable currency of $2 million reflected the impact of the Indian Rupee and Brazilian Real. Favorable volumes and net new business were offset by product mix reducing gross margin by $4 million. The year-over-year change in gross margin also included a $3 million benefit related to legacy South America climate operations for freight recoveries and a favorable ruling on a litigation matter.
Selling, General and Administrative Expenses
Selling, general, and administrative expenses were $54 million or 7.1% and $53 million or 6.9% during the three months ended September 30, 2017 and 2016, respectively. The increase is related to higher incentive compensation costs and economics partially offset by cost efficiencies.
Restructuring Expense
During the fourth quarter of 2016, the Company announced a restructuring program impacting the engineering and administrative functions to further align the Company's engineering and related administrative footprint with its core product technologies and customers. During the three months ended September 30, 2017, the Company recorded $6 million of restructuring expenses, net of reversals, under this program. Through September 30, 2017, the Company recorded approximately $37 million of restructuring expenses under this program, and expects to incur up to $45 million of restructuring costs associated with approximately 250 employees.
During the three months ended September 30, 2016, the Company recorded $4 million of restructuring expenses primarily related to severance and termination benefits, in connection with the wind-down of certain operations in South America.
34
Interest Expense, Net
Interest expense, net, was $3 million and $5 million for the three months ended September 30, 2017 and 2016, respectively. Interest expense for the three months ended September 30, 2017 includes termination impacts of the Company's interest rate swap as further described in Note 16, "Fair Value Measurements and Financial Instruments."
Equity in Net Income of Non-Consolidated Affiliates
Equity in net income of non-consolidated affiliates was $1 million for the three month period ending September 30, 2017.
Other (Income) Expense, Net
Other (income) expense, net consists of the following:
Three Months Ended September 30 | |||||||
2017 | 2016 | ||||||
(Dollars in Millions) | |||||||
Transformation initiatives | $ | 1 | $ | — | |||
Gain on non-consolidated affiliate transactions, net | (2 | ) | (1 | ) | |||
Foreign currency translation charge | — | 11 | |||||
Loss on asset contribution | — | 2 | |||||
$ | (1 | ) | $ | 12 | |||
Transformation initiative costs include information technology separation costs, integration of acquired business, and financial and advisory services incurred in connection with the Company's transformation into a pure play cockpit electronics business. The gain on non-consolidated affiliate transactions, net are described in Note 5, "Non-Consolidated Affiliates."
The Company recorded an impairment charge of $11 million during the three months ended September 30, 2016, related to foreign currency translation amounts recorded in accumulated other comprehensive loss associated with the agreement to sell the Company's South Africa climate operations. In connection with the closure of the Climate facility in Argentina, the Company entered an agreement to contribute land and building with a net book value of $2 million to the local municipality.
Income Taxes
The Company's provision for income taxes of $8 million for the three months ended September 30, 2017, represents an increase of $3 million when compared with $5 million in the same period of 2016. The increase in tax expense is primarily attributable to the year-over-year changes in the mix of earnings and differing tax rates between jurisdictions. In this regard, during the three months ended September 30, 2016, the Company reflected favorable adjustments due to incorporating certain transfer pricing adjustments between the U.S. and Japan consistent with the anticipated transfer pricing methodology expected to be agreed upon in connection with the pursuit of a bilateral advance pricing agreement (“APA”) with the U.S. and Japan tax authorities.
Discontinued Operations
The operations subject to the Interiors Divestiture and Climate Transaction met conditions required to qualify for discontinued operations reporting. Accordingly, the results of operations for the Interiors business have been reclassified to income (loss) from discontinued operations, net of tax in the consolidated statements of comprehensive income for the three month periods ended September 30, 2017 and 2016. See Note 4 “Discontinued Operations" for additional disclosures.
Net Income
Net income attributable to Visteon was $43 million for the three months ended September 30, 2017, compared to net income of $28 million for the same period of 2016. The increase of $15 million includes improved gross margin of $11 million and the non-recurrence of charges associated with the 2016 South Africa climate disposition of $11 million. These increases were partially offset by an increase in the provision for income taxes of $3 million and the non-recurrence of 2016 discontinued operations net income of $7 million.
35
Adjusted EBITDA
Adjusted EBITDA (a non-GAAP financial measure, as defined in Note 18) was $83 million for the three months ended September 30, 2017, representing an increase of $8 million when compared with Adjusted EBITDA of $75 million for the same period of 2016. The increase includes favorable net cost performance of $10 million reflecting material cost efficiencies and higher engineering recoveries which more than offset customer pricing and higher manufacturing costs. Foreign currency increased Adjusted EBITDA by $2 million attributable to the Brazilian Real and Indian Rupee. Favorable volumes and net new business were offset by product mix, reducing adjusted EBITDA by $4 million.
The reconciliation of Adjusted EBITDA to net income attributable to Visteon for the three months ended September 30, 2017 and 2016, is as follows:
Three Months Ended September 30 | |||||||||||
2017 | 2016 | Change | |||||||||
(Dollars in Millions) | |||||||||||
Adjusted EBITDA | $ | 83 | $ | 75 | $ | 8 | |||||
Depreciation and amortization | 21 | 21 | — | ||||||||
Restructuring expense | 6 | 5 | 1 | ||||||||
Interest expense, net | 3 | 5 | (2 | ) | |||||||
Equity income of non-consolidated affiliates | (1 | ) | — | (1 | ) | ||||||
Other (income) expense, net | (1 | ) | 12 | (13 | ) | ||||||
Provision for income taxes | 8 | 5 | 3 | ||||||||
Income from discontinued operations, net of tax | — | (7 | ) | 7 | |||||||
Net income attributable to non-controlling interests | 4 | 4 | — | ||||||||
Non-cash, stock-based compensation | 3 | 2 | 1 | ||||||||
Other | (3 | ) | — | (3 | ) | ||||||
Net income attributable to Visteon Corporation | $ | 43 | $ | 28 | $ | 15 | |||||
The Company's consolidated results of operations for the nine months ended September 30, 2017 and 2016 were as follows:
Nine Months Ended September 30 | |||||||||||
2017 | 2016 | Change | |||||||||
(Dollars in Millions) | |||||||||||
Sales | $ | 2,349 | $ | 2,345 | $ | 4 | |||||
Cost of sales | 1,990 | 2,010 | (20 | ) | |||||||
Gross margin | 359 | 335 | 24 | ||||||||
Selling, general and administrative expenses | 158 | 163 | (5 | ) | |||||||
Restructuring expense | 10 | 22 | (12 | ) | |||||||
Interest expense, net | 12 | 10 | 2 | ||||||||
Equity in net income of non-consolidated affiliates | 6 | 3 | 3 | ||||||||
Other (income) expense, net | (3 | ) | 16 | (19 | ) | ||||||
Provision for income taxes | 34 | 27 | 7 | ||||||||
Net income from continuing operations | 154 | 100 | 54 | ||||||||
Income (loss) from discontinued operations | 8 | (15 | ) | 23 | |||||||
Net income | 162 | 85 | 77 | ||||||||
Net income attributable to non-controlling interests | 11 | 12 | (1 | ) | |||||||
Net income attributable to Visteon Corporation | $ | 151 | $ | 73 | $ | 78 | |||||
Adjusted EBITDA* | $ | 268 | $ | 241 | $ | 27 | |||||
* Adjusted EBITDA is a Non-GAAP financial measure, as further discussed below. | |||||||||||
36
Results of Operations - Nine Months Ended September 30, 2017 and 2016
Prior to 2017, the Company also had Other operations consisting of the South Africa and the South America climate operations exited during the fourth quarter of 2016.
Sales
Electronics | Other | Total | |||||||||
(Dollars in Millions) | |||||||||||
Nine months ended September 30, 2016 | $ | 2,304 | $ | 41 | $ | 2,345 | |||||
Volume, mix, and net new business | 117 | — | 117 | ||||||||
Currency | (14 | ) | — | (14 | ) | ||||||
Customer pricing and other | (58 | ) | — | (58 | ) | ||||||
Exit and wind-down | — | (41 | ) | (41 | ) | ||||||
Nine months ended September 30, 2017 | $ | 2,349 | $ | — | $ | 2,349 | |||||
Sales for the nine months ended September 30, 2017 totaled $2,349 million, which represents an increase of $4 million compared with the same period of 2016. Favorable volumes, product mix, and net new business increased sales by $117 million. Product mix reflects the Company specific content across product lines. Unfavorable currency decreased sales by $14 million, primarily attributable to the Chinese Renminbi and Euro partially offset by the Brazilian Real and Indian Rupee. The exit of other climate operations in 2016 decreased sales by $41 million. Other reductions were associated with customer pricing, net of design savings.
Cost of Sales
Electronics | Other | Total | |||||||||
(Dollars in Millions) | |||||||||||
Nine months ended September 30, 2016 | $ | 1,962 | $ | 48 | $ | 2,010 | |||||
Currency | (12 | ) | — | (12 | ) | ||||||
Volume, mix, and net new business | 112 | — | 112 | ||||||||
Exit and wind-down | — | (48 | ) | (48 | ) | ||||||
Net cost performance | (72 | ) | — | (72 | ) | ||||||
Nine months ended September 30, 2017 | $ | 1,990 | $ | — | $ | 1,990 | |||||
Cost of sales decreased $20 million for the nine months ended September 30, 2017 when compared with the same period in 2016. Increased volumes, product mix, and net new business increased cost of sales by $112 million. Foreign currency decreased cost of sales by $12 million primarily attributable to the Chinese Renminbi, Japanese Yen, and Mexican Peso, partially offset by the Euro, Brazilian Real, and Thai Bhat. The exit and wind down of other climate operations decreased cost of sales by $48 million. Net efficiencies, including material, design and usage economics, and higher engineering recoveries, partially offset by higher manufacturing and warranty costs, decreased cost of sales by $68 million. Cost of sales during the nine months ended September 30, 2017 also includes a $4 million benefit related to legacy South America climate operations for freight recoveries and a favorable litigation matter ruling.
Cost of sales includes net engineering costs, comprised of gross engineering expenses related to forward model program development and advanced engineering activities, partially offset by engineering cost recoveries from customers. Electronics gross engineering expenses were $288 million for the nine months ended September 30, 2017, a decrease of $3 million compared to the same period of 2016. Engineering recoveries were $79 million for the nine months ended September 30, 2017, $19 million higher than the recoveries recorded in the same period of 2016. Engineering cost recoveries can fluctuate period to period depending on underlying contractual terms and conditions and achievement of related development milestones.
Gross Margin
Gross margin was $359 million or 15.3% of sales for the nine months ended September 30, 2017 compared to $335 million or 14.3% of sales for the same period of 2016. The $24 million increase in gross margin included $5 million from favorable volumes and net new business, partially offset by product mix and $7 million related to the exit of climate operations. Currency decreased gross margin by $2 million as the impact of the Chinese Renminbi and Euro more than offset the impact of the Japanese Yen, Mexican Peso, and Brazilian Real. Gross margin also included net cost efficiencies of $10 million, including favorable material
37
cost efficiencies and higher engineering recoveries partially offset by customer pricing reductions, and higher manufacturing costs. The year-over-year change in gross margin also included a $4 million benefit related to legacy South America climate operations.
Selling, General and Administrative Expenses
Selling, general, and administrative expenses were $158 million or 6.7% of sales and $163 million or 7.0% of sales during the nine months ended September 30, 2017 and 2016, respectively. The decrease is primarily related to net efficiencies including lower bad debt expense and impacts of restructuring actions.
Restructuring Expense
During the fourth quarter of 2016, the Company announced a restructuring program impacting engineering and administrative functions to further align the Company's engineering and related administrative footprint with its core product technologies and customers. Through September 30, 2017, the Company has recorded approximately $37 million of restructuring expenses, net of reversals, under this program, associated with approximately 250 employees, and expects to incur up to $45 million of restructuring costs for this program. During the nine months ended September 30, 2017, the Company has recorded approximately $10 million of restructuring expenses, net of reversals, under this program.
During the first quarter of 2016, the Company announced a restructuring program to transform the Company's engineering organization and supporting functional areas to focus on execution and technology. The organization will be comprised of regional engineering, product management and advanced technologies, and global centers of competence. Through the first nine months of 2016, the Company recorded approximately $13 million of restructuring expenses, net of reversals, under this program, associated with approximately 100 employees.
During the nine months ended September 30, 2016, the Company recorded $11 million of restructuring expenses, related to severance and termination benefits, in connection with the wind-down of certain operations in South America.
Interest Expense, Net
Interest expense, net was $12 million and $10 million for the nine months ended September 30, 2017 and 2016, respectively. The increase in net interest expense results from lower interest income due to lower cash balances, financing fees for the Amended Credit Facilities as further described in Note 11, "Debt" and termination impacts of the Company's interest rate swap as further described in Note 16, "Fair Value Measurements and Financial Instruments."
Equity in Net Income of Non-Consolidated Affiliates
Equity in net income of non-consolidated affiliates was $6 million and $3 million for the nine month periods ended September 30, 2017 and 2016 respectively. The income is primarily attributable to the Company's equity interest in Yanfeng Visteon Investment Company and increased primarily related to the timing of engineering recoveries.
Other (Income) Expense, Net
Other (income) expense, net consists of the following:
Nine Months Ended September 30 | |||||||
2017 | 2016 | ||||||
(Dollars in Millions) | |||||||
Transformation initiatives | $ | 1 | $ | 3 | |||
Gain on non-consolidated affiliate transactions, net | (4 | ) | (1 | ) | |||
Foreign currency translation charge | — | 11 | |||||
Loss on asset contribution | — | 2 | |||||
Transaction exchange losses | — | 1 | |||||
$ | (3 | ) | $ | 16 | |||
Transformation initiative costs include information technology separation costs, integration of acquired business, and financial and advisory services incurred in connection with the Company's transformation into a pure play cockpit electronics business. The gain on non-consolidated affiliate transactions, net are described in Note 5, "Non-Consolidated Affiliates."
38
During the nine months ended September 30, 2016, the Company recorded an impairment charge of $11 million related to foreign currency translation amounts recorded in accumulated other comprehensive loss associated with the agreement to sell the Company's South Africa climate operations. In connection with the closure of the Climate facility in Argentina, the Company entered an agreement to contribute land and building with a net book value of $2 million to the local municipality.
Income Taxes
The Company's provision for income taxes of $34 million for the nine months ended September 30, 2017 represents an increase of $7 million when compared with $27 million in the same period of 2016. The increase in tax expense is attributable to several items including the year-over-year increase in earnings, as well as changes in the mix of earnings and differing tax rates between jurisdictions, withholding taxes, the non-recurrence of a $3 million discrete income tax benefit in connection with certain income tax incentives formally approved by the Portuguese tax authorities during the first quarter of 2016, and $2 million resulting from changes in assessments regarding the potential realization of deferred tax assets. These increases were partially offset by the year-over-year decrease for uncertain tax positions, including interest, of approximately $3 million.
Discontinued Operations
The operations subject to the Interiors Divestiture and Climate Transaction met conditions required to qualify for discontinued operations reporting. Accordingly, the results of operations for the Interiors and Climate businesses have been reclassified to income (loss) from discontinued operations, net of tax in the consolidated statements of comprehensive income for the nine month periods ended September 30, 2017 and 2016. The nine months ending September 30, 2017 included a $7 million gain on the repurchase of the India electronics operations associated with the 2015 Climate Transaction. The nine months ending September 30, 2016 primarily included results of the South America interiors operations divested on December 1, 2016 and a tax benefit related to previously divested climate operations.
Net Income
Net income attributable to Visteon was $151 million for the nine months ended September 30, 2017, compared to net income of $73 million for the same period of 2016. The increase of $78 million includes discontinued operations impacts of $23 million, lower restructuring charges of $12 million, the non-recurrence of charges associated with the 2016 South Africa climate disposition of $11 million, lower selling, general and administrative expenses of $5 million, higher equity in net income of non-consolidated affiliates of $3 million and gains on the sale of non-consolidated affiliates of $3 million. Gross margin improved $24 million including $17 million for electronics operations and $7 million related to the 2016 exit of the climate operations. These improvements were partially offset by higher income taxes of $7 million.
Adjusted EBITDA
Adjusted EBITDA (a non-GAAP financial measure, as defined in Note 18) was $268 million for the nine months ended September 30, 2017, representing an increase of $27 million when compared with Adjusted EBITDA of $241 million for the same period of 2016. The increase includes $5 million from favorable volumes and net new business partially offset by product mix and $7 million related to other climate operations exited in 2016 . Foreign currency decreased Adjusted EBITDA by $1 million attributable to the Chinese Renminbi and Euro partially offset by the Japanese Yen, Mexican Peso, and Brazilian Real. Net cost performance of $16 million includes material cost efficiencies, higher engineering recoveries, and lower selling, general and administrative costs, offset by unfavorable customer pricing reductions, higher manufacturing costs, and increased warranty costs.
39
The reconciliation of Adjusted EBITDA to net income attributable to Visteon for the nine months ended September 30, 2017 and 2016, is as follows:
Nine Months Ended September 30 | |||||||||||
2017 | 2016 | Change | |||||||||
(Dollars in Millions) | |||||||||||
Adjusted EBITDA | $ | 268 | $ | 241 | $ | 27 | |||||
Depreciation and amortization | 62 | 62 | — | ||||||||
Restructuring expense | 10 | 22 | (12 | ) | |||||||
Interest expense, net | 12 | 10 | 2 | ||||||||
Equity in net income of non-consolidated affiliates | (6 | ) | (3 | ) | (3 | ) | |||||
Other (income) expense, net | (3 | ) | 16 | (19 | ) | ||||||
Provision for income taxes | 34 | 27 | 7 | ||||||||
(Income) loss from discontinued operations, net of tax | (8 | ) | 15 | (23 | ) | ||||||
Net income attributable to non-controlling interests | 11 | 12 | (1 | ) | |||||||
Non-cash, stock-based compensation expense | 9 | 6 | 3 | ||||||||
Other | (4 | ) | 1 | (5 | ) | ||||||
Net income attributable to Visteon Corporation | $ | 151 | $ | 73 | $ | 78 | |||||
40
Liquidity
The Company's primary sources of liquidity are cash flows from operations, existing cash balances, and borrowings under available credit facilities, if necessary. The Company believes that funds generated from these sources will be adequate to fund its liquidity for current business requirements.
A portion of the Company's cash flows from operations are generated outside of the U.S. Accordingly, the Company utilizes a combination of cash repatriation strategies, including dividends, royalties, intercompany loan arrangements and other distributions and advances to provide the funds necessary to meet obligations globally. The Company’s ability to access funds from its subsidiaries is subject to, among other things, customary regulatory and statutory requirements and contractual arrangements including joint venture agreements and local credit facilities. Moreover, repatriation efforts may be modified by the Company according to prevailing circumstances.
The Company's ability to generate operating cash flow is dependent on the level, variability and timing of its customers' worldwide vehicle production, which may be affected by many factors including, but not limited to, general economic conditions, specific industry conditions, financial markets, competitive factors and legislative and regulatory changes. The Company monitors the macroeconomic environment and its impact on vehicle production volumes in relation to the Company's specific cash needs. The Company's intra-year needs are impacted by seasonal effects in the industry, such as mid-year shutdowns, the subsequent ramp-up of new model production and year-end shutdowns at key customers.
In the event that the Company's funding requirements exceed cash provided by its operating activities, the Company will meet such requirements by reduction of existing cash balances, by drawing on its $300 million Revolving Credit Facility or other affiliate working capital lines, by seeking additional capital through debt or equity markets, or some combination thereof.
Access to additional capital through the debt or equity markets is influenced by the Company's credit ratings. On March 7, 2017, Standard & Poor's Ratings Services upgraded the Company to 'BB', from 'BB-', with stable outlook. Moody's has reaffirmed the Company's credit rating of Ba3. See Note 11 "Debt" to the accompanying consolidated financial statements for a more comprehensive discussion of the Company's debt facilities. Incremental funding requirements of the Company's consolidated foreign entities are primarily accommodated by intercompany cash pooling structures. Affiliate working capital lines are primarily used by the Company's consolidated joint ventures. As of September 30, 2017, these lines had availability of approximately $18 million.
Cash Balances
As of September 30, 2017, the Company had total cash of $735 million, including $3 million of restricted cash. Cash balances totaling $467 million were located in jurisdictions outside of the United States, of which approximately $195 million is considered permanently reinvested for funding ongoing operations outside of the U.S. If such permanently reinvested funds are repatriated to operations in the U.S., the Company would be required to accrue additional tax expense, primarily related to foreign withholding taxes.
Other Items Affecting Liquidity
During 2017, the Company expects to make remaining payments of approximately $35 million related to the Germany interiors divestiture that closed on December 1, 2015. Also, as announced during the fourth quarter of 2016, the Company expects to incur restructuring costs to further align the Company's engineering and related administrative footprint with its core product technologies and customers. The Company estimates that it may incur up to $45 million in cumulative expenses to complete these actions of which $37 million has been expensed and $14 million has been paid since inception to date through September 30, 2017.
The Company is actively negotiating the possible exit of a European facility that may involve contributing cash working capital to the purchaser. The estimated contribution includes cash and working capital ranging from $15 million to $20 million .
Management continually seeks to streamline the Company's operations and may incur additional restructuring charges in the future.
The Company is authorized to spend an additional $230 million to repurchase Visteon common stock pursuant to the $400 million share repurchase authorization, as discussed in Note 14, "Stockholders' Equity and Non-Controlling Interests" of the consolidated financial statements under Item 1.
During the nine months ended September 30, 2017, cash contributions to the Company's U.S. and non-U.S. defined benefit pension plan were $5 million. The Company expects to make cash contributions to its defined benefit pension plans of $7 million in 2017.
41
Estimated cash contributions for 2018 through 2020, under current regulations and market assumptions are approximately $29 million.
42
Cash Flows
Operating Activities
Including discontinued operations, the Company generated $131 million of cash in operating activities during the nine months ended September 30, 2017, compared to cash provided by operations of $38 million during the same period of 2016, representing a $93 million improvement. The increase in operating cash flows is attributable to higher net income of $77 million and lower cash tax payments, net of expense of $67 million primarily due to the non-recurrence of transaction related taxes incurred in 2016, partially offset by higher working capital use of approximately $10 million, higher warranty payments net of expense of $21 million and an increase in China bank notes of $11 million.
Investing Activities
Cash used from investing activities during the nine months ended September 30, 2017 totaled $97 million, compared to net cash provided by investing activities of $339 million for the same period in 2016, representing a decrease of $436 million. Net cash used by investing activities during the nine months ended September 30, 2017, includes the purchase of the India electronics operations associated with the Climate Transaction for $47 million and capital expenditures of $69 million. These outflows were partially offset by proceeds for divestitures of equity and cost based investments in China and Europe of $15 million and net investment hedge settlement proceeds of $5 million.
Net cash flow provided by investing activities for the nine months ended September 30, 2016 includes the Climate Transaction withholding tax refund of $356 million, liquidation of investments of short-term securities of $47 million and proceeds from asset sales of $15 million, partially offset by capital expenditures of $56 million, the acquisition of AllGo Embedded Systems Private Limited of $15 million and an $8 million shareholder loan to a non-consolidated affiliate.
Financing Activities
Cash used by financing activities during the nine months ended September 30, 2017, totaled $197 million, compared to $2,260 million used by financing activities for the same period in 2016, for a decrease in cash used by financing activities of $2,063 million. Cash used by financing activities during the nine months ended September 30, 2017 included share repurchases of $170 million and dividends paid to non-controlling interests of $29 million.
Cash used by financing activities during the nine months ended September 30, 2016 of $2,260 million included a distribution payment of $1,736 million, share repurchases of $500 million, stock based compensation tax withholding payments of $11 million and net payments on debt of $13 million.
Debt and Capital Structure
See Note 11, “Debt” to the consolidated financial statements included in Item 1.
Off-Balance Sheet Arrangements
The Company does not have any off-balance sheet financial arrangements that have or are reasonably likely to have a material current or future effect on financial condition, changes in financial condition, revenues or expenses, results of operations, liquidity, capital expenditures or capital resources.
Fair Value Measurement
See Note 16, “Fair Value Measurements and Financial Instruments” to the consolidated financial statements included in Item 1.
Recent Accounting Pronouncements
See Note 2 “Summary of Significant Accounting Policies” to the accompanying consolidated financial statements in Item 1.
43
Forward-Looking Statements
Certain statements contained or incorporated in this Quarterly Report on Form 10-Q which are not statements of historical fact constitute “Forward-Looking Statements” within the meaning of the Private Securities Litigation Reform Act of 1995 (the “Reform Act”). Forward-looking statements give current expectations or forecasts of future events. Words such as “anticipate”, “expect”, “intend”, “plan”, “believe”, “seek”, “estimate” and other words and terms of similar meaning in connection with discussions of future operating or financial performance signify forward-looking statements. These statements reflect the Company’s current views with respect to future events and are based on assumptions and estimates, which are subject to risks and uncertainties including those discussed in Item 1A under the heading “Risk Factors” and elsewhere in this report. Accordingly, undue reliance should not be placed on these forward-looking statements. Also, these forward-looking statements represent the Company’s estimates and assumptions only as of the date of this report. The Company does not intend to update any of these forward-looking statements to reflect circumstances or events that occur after the statement is made and qualifies all of its forward-looking statements by these cautionary statements.
You should understand that various factors, in addition to those discussed elsewhere in this document, could affect the Company’s future results and could cause results to differ materially from those expressed in such forward-looking statements, including:
• | Visteon’s ability to satisfy its future capital and liquidity requirements; Visteon’s ability to access the credit and capital markets at the times and in the amounts needed and on terms acceptable to Visteon; Visteon’s ability to comply with covenants applicable to it; and the continuation of acceptable supplier payment terms. |
• | Visteon’s ability to satisfy its pension and other postretirement employee benefit obligations, and to retire outstanding debt and satisfy other contractual commitments, all at the levels and times planned by management. |
• | Visteon’s ability to access funds generated by its foreign subsidiaries and joint ventures on a timely and cost effective basis. |
• | Changes in the operations (including products, product planning and part sourcing), financial condition, results of operations or market share of Visteon’s customers. |
• | Changes in vehicle production volume of Visteon’s customers in the markets where it operates, and in particular changes in Ford’s vehicle production volumes and platform mix. |
• | Increases in our vendor's commodity costs or disruptions in the supply of commodities, including aluminum, copper, fuel and natural gas. |
• | Visteon’s ability to generate cost savings to offset or exceed agreed upon price reductions or price reductions to win additional business and, in general, improve its operating performance; to achieve the benefits of its restructuring actions; and to recover engineering and tooling costs and capital investments. |
• | Visteon’s ability to compete favorably with automotive parts suppliers with lower cost structures and greater ability to rationalize operations; and to exit non-performing businesses on satisfactory terms, particularly due to limited flexibility under existing labor agreements. |
• | Restrictions in labor contracts with unions that restrict Visteon’s ability to close plants, divest unprofitable, noncompetitive businesses, change local work rules and practices at a number of facilities and implement cost-saving measures. |
• | The costs and timing of facility closures or dispositions, business or product realignments, or similar restructuring actions, including potential asset impairment or other charges related to the implementation of these actions or other adverse industry conditions and contingent liabilities. |
• | Significant changes in the competitive environment in the major markets where Visteon procures materials, components or supplies or where its products are manufactured, distributed or sold. |
• | Legal and administrative proceedings, investigations and claims, including shareholder class actions, inquiries by regulatory agencies, product liability, warranty, employee-related, environmental and safety claims and any recalls of products manufactured or sold by Visteon. |
• | Changes in economic conditions, currency exchange rates, changes in foreign laws, regulations or trade policies or political stability in foreign countries where Visteon procures materials, components or supplies or where its products are manufactured, distributed or sold. |
• | Shortages of materials or interruptions in transportation systems, labor strikes, work stoppages or other interruptions to or difficulties in the employment of labor in the major markets where Visteon purchases materials, components or supplies to manufacture its products or where its products are manufactured, distributed or sold. |
• | Changes in laws, regulations, policies or other activities of governments, agencies and similar organizations, domestic and foreign, that may tax or otherwise increase the cost of, or otherwise affect, the manufacture, licensing, distribution, sale, ownership or use of Visteon’s products or assets. |
44
• | Possible terrorist attacks or acts of war, which could exacerbate other risks such as slowed vehicle production, interruptions in the transportation system or fuel prices and supply. |
• | The cyclical and seasonal nature of the automotive industry. |
• | Visteon’s ability to comply with environmental, safety and other regulations applicable to it and any increase in the requirements, responsibilities and associated expenses and expenditures of these regulations. |
• | Visteon’s ability to protect its intellectual property rights, and to respond to changes in technology and technological risks and to claims by others that Visteon infringes their intellectual property rights. |
• | Visteon’s ability to quickly and adequately remediate control deficiencies in its internal control over financial reporting. |
• | Other factors, risks and uncertainties detailed from time to time in Visteon’s Securities and Exchange Commission filings. |
45
Item 3. | Quantitative and Qualitative Disclosures About Market Risk |
The primary market risks to which the Company is exposed includes changes in foreign currency exchange rates, interest rates and certain commodity prices. The Company manages these risks through derivative instruments and various operating actions including fixed price contracts with suppliers and cost sourcing arrangements with customers. The Company's use of derivative instruments is limited to mitigation of market risks, including hedging activities. However, derivative instruments are not used for speculative or trading purposes, as per clearly defined risk management policies. The Company's use of derivative instruments may entail risk of credit loss in the event of non-performance of a counter-party to a financial derivative contract. The Company limits its counterparty exposure by entering into agreements directly with a variety of major financial institutions with high credit profiles to support an expectation that the counterparty is capable of meeting the obligations under the contracts. In addition, the Company's ability to utilize derivatives to manage market risk is dependent on credit conditions and market conditions given the current economic environment.
Foreign Currency Risk
The Company's net cash inflows and outflows that are exposed to the risk of adverse changes in exchange rates as related to the sale of products in countries other than the manufacturing source, foreign currency denominated supplier payments, debt and other payables, subsidiary dividends, investments in subsidiaries and anticipated foreign currency denominated transaction proceeds. The Company utilizes derivative financial instruments to manage foreign currency exchange rate risks. Forward and option contracts may be utilized to reduce the impact to the Company's cash flows from adverse movements in exchange rates. Foreign currency exposures are reviewed periodically and any natural offsets are considered prior to entering into a financial derivative instrument. The Company’s primary hedged foreign currency exposures include Euro, Japanese Yen, Thailand Bhat and Mexican Peso. The Company's policy requires that hedge transactions relate to a specific portion of the exposure not to exceed the aggregate amount of the underlying transaction. As of September 30, 2017, and December 31, 2016, the net fair value of foreign currency forward and option contracts was a net liability of $4 million and less than $1 million, respectively. Maturities of these instruments generally do not exceed eighteen months.
In addition to the transactional exposure described above, the Company's operating results are impacted by the translation of its foreign operating income into U.S. dollars.
During 2015, the Company entered into cross currency swap transactions to mitigate the variability of the value of the Company's investment in certain non-U.S. entities. In April 2017, the Company terminated and received $5 million of proceeds upon settlement. There was no ineffectiveness associated with such derivatives at the time of the termination. The Company subsequently entered into new cross currency swap transactions with an aggregate notional amount of $150 million. The transactions are designated as net investment hedges of certain of the Company's European affiliates. Accordingly, the effective portion of changes in the fair value of the transactions are recognized in other comprehensive income, a component of shareholders' equity. There was no ineffectiveness associated with such derivatives as of September 30, 2017 and December 31, 2016 and the fair value of these derivatives was a liability of $19 million and an asset of $6 million, respectively.
The hypothetical pre-tax gain or loss in fair value from a 10% favorable or adverse change in quoted currency exchange rates would be approximately $30 million and $31 million for foreign currency derivative financial instruments as of September 30, 2017 and December 31, 2016, respectively. These estimated changes assume a parallel shift in all currency exchange rates and include the gain or loss on financial instruments used to hedge loans to subsidiaries. As exchange rates typically do not all move in the same direction, the estimate may overstate the impact of changing exchange rates on the net fair value of the Company's financial derivatives. It is also important to note that gains and losses indicated in the sensitivity analysis would generally be offset by gains and losses on the underlying exposures being hedged.
Interest Rate Risk
The Company is subject to interest rate risk principally in relation to variable-rate debt. The Company uses financial derivative instruments to manage exposure to fluctuations in interest rates in accordance with its risk management policies. During 2015, the Company entered into interest rate swaps to manage interest rate risk related to the variable rate interest payments of the Term Facility. In April 2017, the Company terminated these swaps and paid $1 million to settle the contracts.
During the second quarter of 2017, the Company entered into new interest rate swap contracts with an aggregate notional value of $150 million to effectively convert designated interest payments related to the amended Term Facility from variable to fixed cash flows. The maturities of these swaps do not exceed the underlying amended Term Facility. The instruments have been designated as cash flow hedges and accordingly, the effective portion of the changes in the fair value of the swap transactions are initially recognized in other comprehensive income. Subsequently, the accumulated gains and losses recorded in equity are
46
reclassified to income in the period during which the hedged transaction impacts earnings. The ineffective portion of changes in the fair value of the swap transactions, if any, are recognized directly in income. As of September 30, 2017 and December 31, 2016, the fair value of the Company's interest rate swaps was an asset of less than $1 million and a liability of $1 million, respectively. There has been no ineffectiveness associated with these derivatives.
The Company significantly reduced interest rate exposure after entering the swap transactions in 2015. The variable rate basis of debt is approximately 60% and 59% as of September 30, 2017 and December 31, 2016, respectively.
Commodity Risk
The Company's exposures to market risk arising from changes in the price of production material are managed primarily through negotiations with suppliers and customers, although there can be no assurance that the Company will recover all such costs. The Company continues to evaluate derivatives available in the marketplace and may determine to utilize derivatives in the future.
Item 4. | Controls and Procedures |
Disclosure Controls and Procedures
The Company maintains disclosure controls and procedures that are designed to ensure that information required to be disclosed in periodic reports filed with the SEC under the Securities Exchange Act of 1934 is recorded, processed, summarized, and reported within the time periods specified in the SEC’s rules and forms, and that such information is accumulated and communicated to the Company’s management, including its Chief Executive Officer and Executive Vice President and Chief Financial Officer, as appropriate, to allow timely decisions regarding required disclosure.
As of September 30, 2017, an evaluation was performed under the supervision and with the participation of the Company’s management, including its Chief Executive and Chief Financial Officer, of the effectiveness of the design and operation of disclosure controls and procedures. Based on that evaluation, the Chief Executive Officer and Executive Vice President and Chief Financial Officer concluded that the Company’s disclosure controls and procedures were effective as of September 30, 2017.
Internal Control over Financial Reporting
There were no changes in the Company's internal control over financial reporting during the three months ended September 30, 2017 that have materially affected, or are reasonably likely to materially affect, the Company's internal control over financial reporting.
47
Part II
Other Information
Item 1. | Legal Proceedings |
See the information above under Note 17, "Commitments and Contingencies," to the consolidated financial statements which is incorporated herein by reference.
Item 1A. | Risk Factors |
For information regarding factors that could affect the Company's results of operations, financial condition and liquidity, see the risk factors discussed in Part I, "Item 1A. Risk Factors" in the Company's Annual Report on Form 10-K for the year ended December 31, 2016. See also, "Forward-Looking Statements" included in Part I, Item 2 of this Quarterly Report on Form 10-Q.
Item 2. | Unregistered Sales of Equity Securities and Use of Proceeds |
Period
The following table summarizes information relating to purchases made by or on behalf of the Company, or an affiliated purchaser, of shares of the Company’s common stock during the third quarter of 2017.
Period | Total Number of Shares (or Units) Purchased (1) | Average Price Paid per Share (or Unit) | Total Number of Shares (or units) Purchased as Part of Publicly Announced Plans or Programs (2) | Approximate Dollar Value of Shares (or Units) that May Yet Be Purchased Under the Plans or Programs (3) (in millions) | |||||
Jul. 1, 2017 to Sep. 30, 2017 | 82,780 | $121.24 | 82,513 | $230 | |||||
Total | 82,780 | $121.24 | 82,513 | $230 | |||||
(1) | Includes 267 shares surrendered to the Company by employees to satisfy tax withholding obligations in connection with the vesting of restricted share and stock unit awards made pursuant to the Visteon Corporation 2010 Incentive Plan. |
(2) | During the third quarter 2017 the Company acquired 82,513 shares from the open market share repurchases. |
(3) | On January 10, 2017, the Company's board of directors authorized $400 million of share repurchase of its shares of common stock. As of September 30, 2017, there is $230 million remaining on the authorization. Additional repurchases of common stock, if any, may occur at the discretion of the Company. |
Item 6. | Exhibits |
The exhibits listed on the "Exhibit Index" on Page 49 hereof are filed with this report or incorporated by reference as set forth therein.
48
Exhibit Index
Exhibit No. | Description | |
101.INS | XBRL Instance Document.** | |
101.SCH | XBRL Taxonomy Extension Schema Document.** | |
101.CAL | XBRL Taxonomy Extension Calculation Linkbase Document.** | |
101.LAB | XBRL Taxonomy Extension Label Linkbase Document.** | |
101.PRE | XBRL Taxonomy Extension Presentation Linkbase Document.** | |
101.DEF | XBRL Taxonomy Extension Definition Linkbase Document.** | |
* | Indicates that exhibit is a management contract or compensatory plan or arrangement. |
** Pursuant to Rule 406T of Regulation S-T, the Interactive Data Files as Exhibit 101 hereto are deemed not filed or part of a registration
statement or prospectus for purposes of Sections 11 or 12 of the Securities Act of 1933, as amended, are deemed not filed for purposes
of Section 18 of the Securities and Exchange Act of 1934, as amended, and otherwise are not subject to liability under those sections.
In lieu of filing certain instruments with respect to long-term debt of the kind described in Item 601(b)(4) of Regulation S-K, Visteon agrees to furnish a copy of such instruments to the Securities and Exchange Commission upon request.
Signatures
Pursuant to the requirements of Section 13 of the Securities Exchange Act of 1934, Visteon Corporation has duly caused this Report to be signed on its behalf by the undersigned, thereunto duly authorized.
VISTEON CORPORATION | ||
By: | /s/ Stephanie S. Marianos | |
Stephanie S. Marianos | ||
Vice President and Chief Accounting Officer | ||
Date: October 26, 2017
49