Attached files
| file | filename |
|---|---|
| 8-K - BDCA VENTURE, INC. 8-K - CROSSROADS LIQUIDATING TRUST | a50912814.htm |
| EX-99.2 - EXHIBIT 99.2 - CROSSROADS LIQUIDATING TRUST | a50912814_ex992.htm |
Exhibit 99.1
Buy Privately, Sell Publicly, Capture the Difference™ Q2 2014 Investor Presentation Nasdaq: BDCV www.BDCV.com
Disclaimer Buy Privately, Sell Publicly, Capture the DifferenceTM BDCA Venture, Inc. (“BDCA Venture”), a Maryland corporation, is a closed-end fund that has elected to be regulated as a business development company under the Investment Company Act of 1940, as amended. BDCA Venture Adviser, LLC is an SEC registered investment adviser and acts as the investment adviser to, and receives base management and/or incentive fees from, BDCA Venture. This presentation is a general communication of BDCA Venture and is not intended to be a solicitation to purchase or sell any security. This presentation may contain certain forward-looking statements, including statements with regard to the future performance of BDCA Venture. These forward-looking statements are subject to the inherent uncertainties in predicting future results and conditions. Certain factors that could cause actual results to differ materially are included in BDCA Venture’s Form 10-K and Form 10-Q, and other SEC filings, and include uncertainties of economic, competitive, and market conditions, and future business decisions all of which are difficult or impossible to predict accurately, and many of which are beyond the control of BDCA Venture. Although BDCA Venture believes that the assumptions underlying the forward-looking statements included herein are reasonable, any of the assumptions could be inaccurate and therefore there can be no assurance that the forward-looking statements included herein will prove to be accurate. Except as required by the federal securities laws, BDCA Venture undertakes no obligation to revise or update this presentation (including the slides presented) or any forward-looking statements contained herein, whether as a result of new information, future events or otherwise. Important Information about Structural Protections: In each of our investments, we may seek to negotiate structural protections such as conversion rights which would result in our receiving shares of common stock at a discount to the IPO price upon conversion at the time of the IPO, or warrants that would result in our receiving additional shares for a nominal exercise price at the time of an IPO. The ability to realize the potential value associated with these structural protections at the time of the IPO will depend on a number of factors including each portfolio company’s completion of an IPO, any adjustment to the special IPO conversion price that may be negotiated prior to or during the IPO process, the possible subsequent issuance of more senior securities that may impact the relative value of the structural protection, and fluctuation in the market price of each portfolio company’s common shares until such time as the common shares received upon conversion can be disposed of following the expiration of the 180-day post-IPO lockup period. Even if an IPO is completed, the potential value associated with these structural protections would not be realized unless the market price of each portfolio company’s common shares equals or exceeds the IPO price at the time such shares are disposed of following the post-IPO lockup period. Please see our periodic reports on Form 10-K and Form 10-Q for additional information on, and risks related to, our structural protections. 2
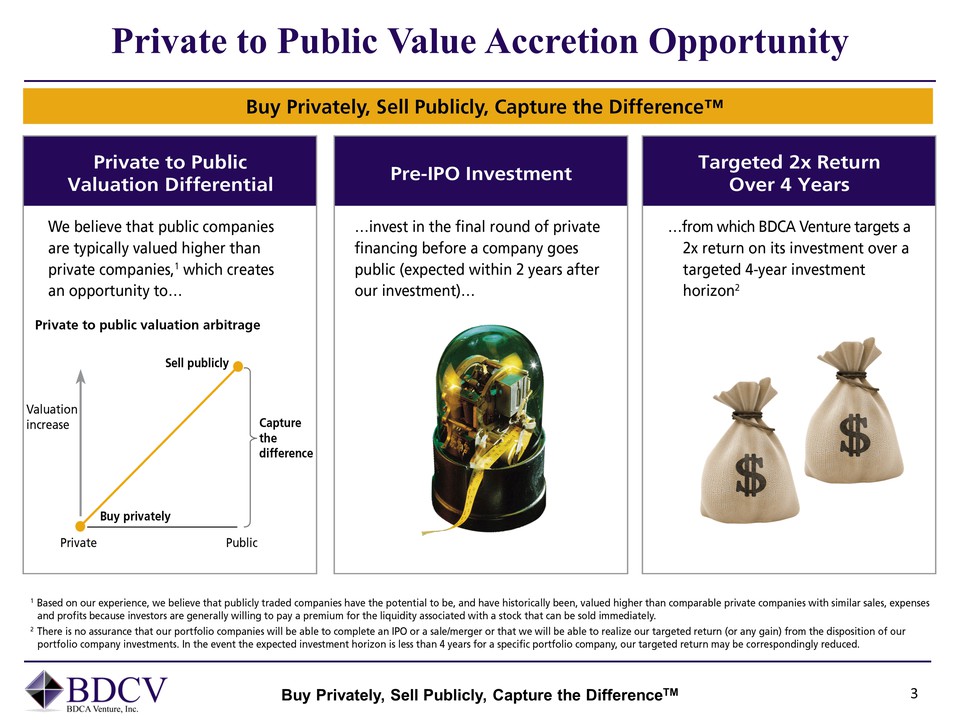
Private to Public Value Accretion Opportunity Buy Privately, Sell Publicly, Capture the DifferenceTM 3 Buy Privately, Sell Publicly, Capture the DifferenceTM Private to Public Valuation Differential Pre-IPO Investment Targeted 2x Return Over 4 Years We believe that public companies are typically valued higher than private companies,1 which creates an opportunity to Private to public valuation arbitrage Valuation increase Sell Publicly Buy privately Private Public Capture the difference invest in the final round of private financing before a company goes public (expected within 2 years after our investment) … from which BDCA Venture targets a 2x return on its investment over a targeted 4-year investment horizon2 1Based onour experience, we believe that publicly traded companies have the potential to be, and have historically been, valued higher than comparable private companies with similar sales, expenses and profits because investors are generally willing to pay a premium for the liquidity associated with a stock that can be sold immediately. 2There is no assurance that our portfolio companies will be able to complete an IPO or a sale/merger or that we will be able to realize our targerted return (or any gain) from the disposition of our portfolio company investments. In the event the expected investment horizon is less than 4 years for a specific portfolio company, our targeted return may be correspondingly reduced.
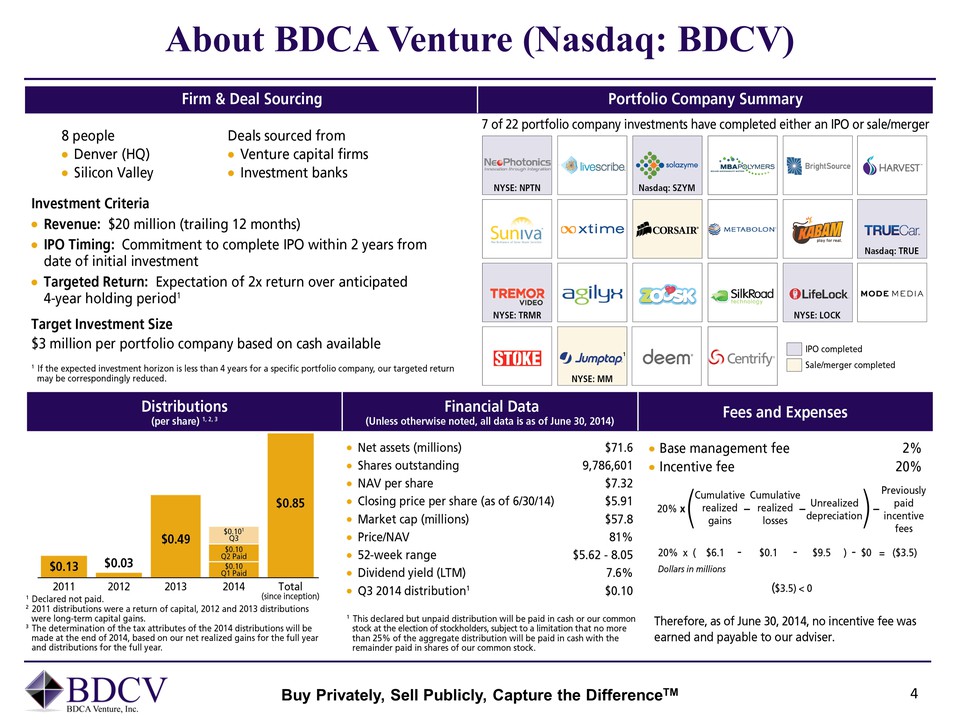
About BDCA Venture (Nasdaq: BDCV) Buy Privately, Sell Publicly, Capture the DifferenceTM 4 Firm & Deal Sourcing 8 people Denver (HQ) Silicon Valley Deals sourced from Venture capital firms Investment banks Investment Criteria Revenuye: $20 million (traiing 12 months) IPO Timing: Commitment to complete IPO within 2 years from date of initial investment Targeter Return: Expectation of 2x return over anticipated 40year holding period1 Target Investment Size $3 million per portfolio company based on cash available 1If the expected investment horizon is less than 4 years for a specific portfolio company, our targeted return may be correspondingly reduced. Portfolio Company Summary 7 of 22 portfolio company investments have completed either an IPO or sale/merger Distributions (per share)123 $0.13 $0.03 $0.49 $0.10Q3 Q2 Paid Q1 Paid $0.85 2011 2012 2013 2014 Total (since inception) 1 Declared not paid. 2 2011 distributions were a return of capital, 2012 and 2013 distributions were long-term capital gains. 3 The determination of the tax attributes of the 2013 distributions will be made at the end of 2014, based on our net realized gains for the full year and distributions for the full year. Financial Date (Unless otherwise noted, all data is as of June 30, 2014) Net asssets (millions) Shares outstanding NAV per share Closing price per share (as of 6/30/14) Market cap (millions) Price/NAV 52-week range Dividend yield (LTM) Q3 2014 distribution 1 This declared but unpaid distribution will be paid in cash or our common stock at the election of stockholders, subject to a limitation that no more than 25% of the aggregate distribution will be paid in cash with the remainder paid in shares of our common stock. $71.6 9,786,601 $7.32 $5.91 $57.8 81% $5.62 – 8.05 7.6% $0.10 Fees and Expenses Base management fee Incentive fee 2% 20% Cumulative realized gains Cumulative realized losses Unrealized depreciation Previously paid incentive fees $6.1 $0.1 $9.5 $0 ($3.5) Dollars in millions <0 Therefore, as of June 30, 2014, no incentive fee was earned and payable to our adviser.
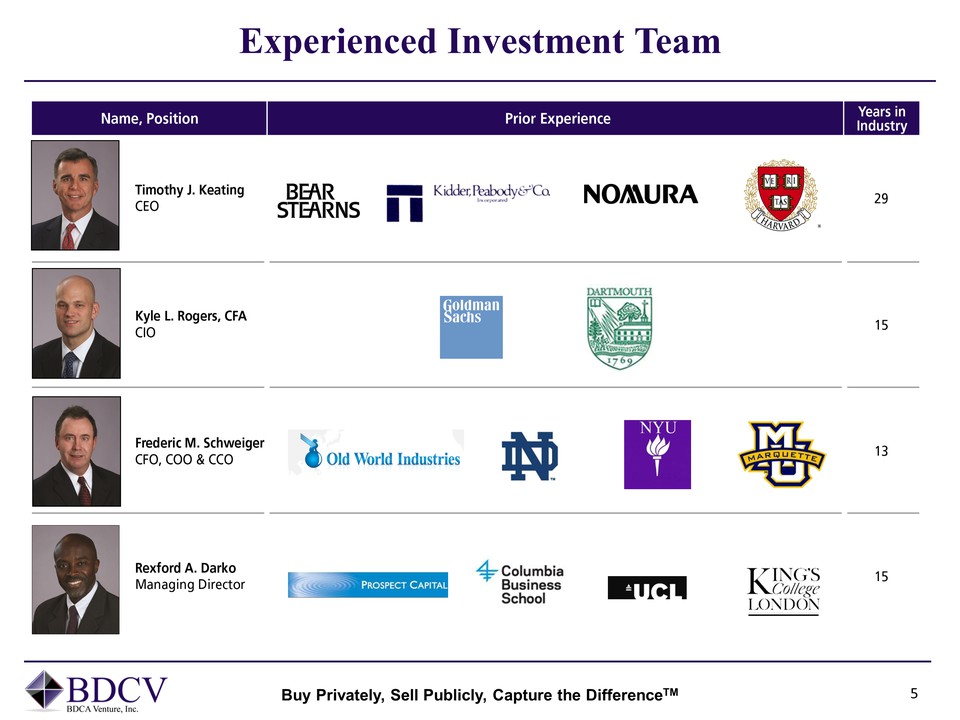
Experienced Investment Team Buy Privately, Sell Publicly, Capture the DifferenceTM 5 Name, Position Prior Experience Years in Industry Timothy J. Keating CEO 29 Kyle L Rogers, CFA CIO 15 Frederic M. Schweiger CFO, COO & CCO 13 Rexford A. Darko Managing Direction 15
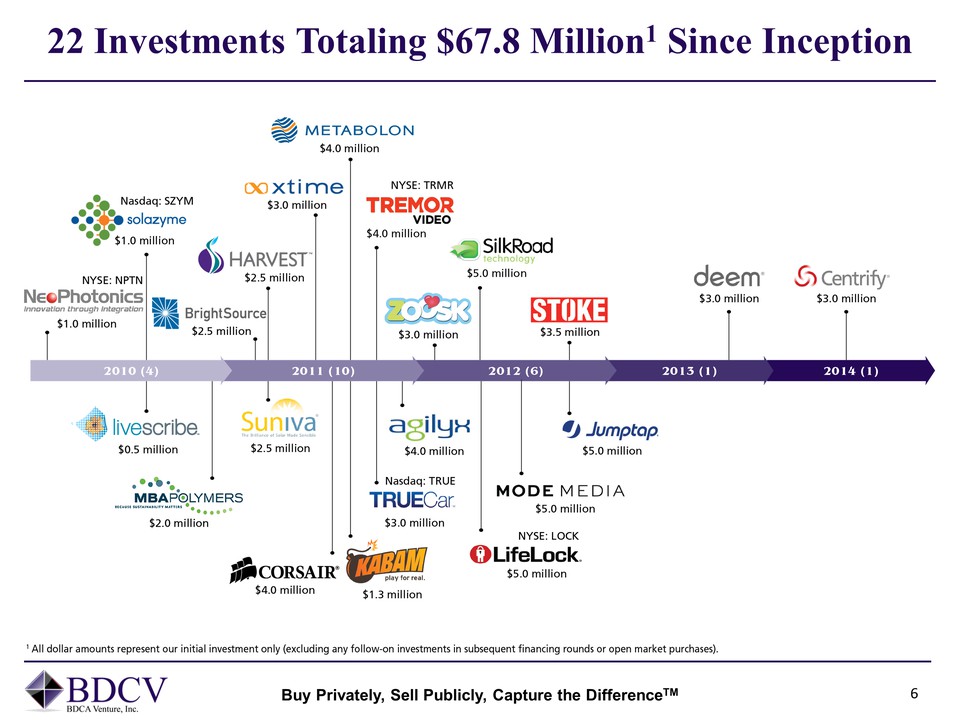
22 Investments Totaling $67.8 Million1 Since Inception Buy Privately, Sell Publicly, Capture the DifferenceTM 6 1 All dollar amounts represent our initial investment only (excluding any follow-on investments in subsequent financing rounds or open market purchases).
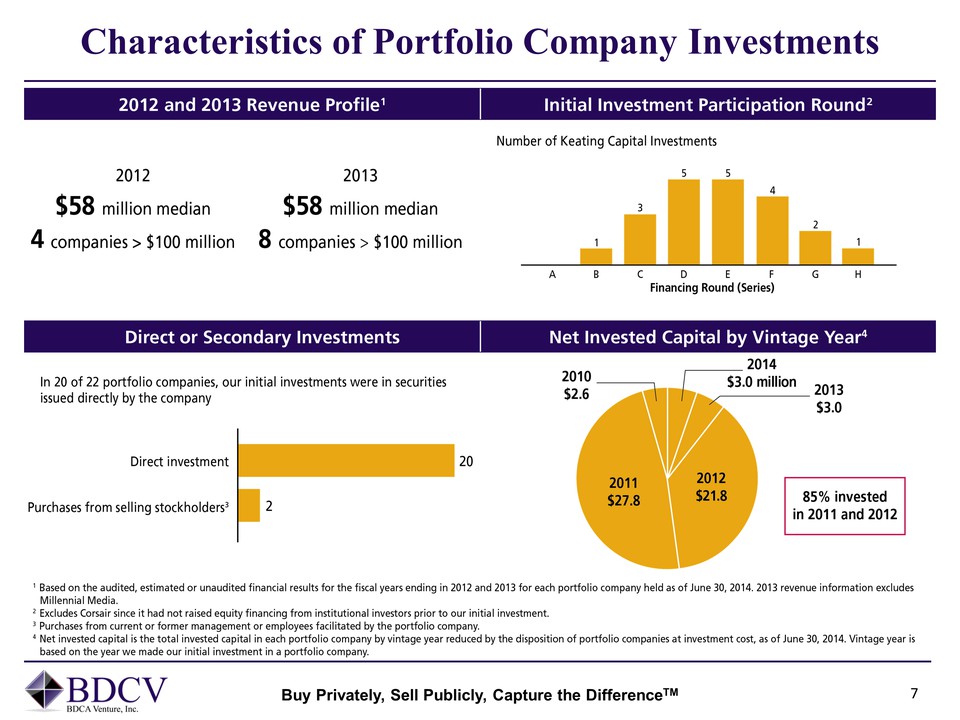
Characteristics of Portfolio Company Investments Buy Privately, Sell Publicly, Capture the DifferenceTM 7 2012 and 2013 Revenue Profile1 Initial Investment Participation Round2 2012 2013 $58 million median 4 companies > $100 million 8 companies > $100 million Number of Keating Capital Investments A B C D E F G H Financing Round (Series) 1 3 5 4 2 1 Direct or Secondary Investments Net Invested Capital by Vintage Year4 In 20 of 22 portfolio companies, our initial investments were in securities issued directly by the company Direct investment Purchases from selling stockholders3 2 20 2010 $2.6 2014 $3.0 million 2013 $3.0 2011 $27.8 2012 $21.8 85% invested in 2011 and 2012 1 Based on the audited, estimated or unaudited financial results for the fiscal years ending in 2012 and 2013 for each portfolio company held as of June 30. 2014. 2013 revenue information excludes Millennial Media. 2 Excludes Corsair since it had not raised equity financing from institutional investors prior to our initial investment. 3 Purchases from current or former management or employees facilitated by the portfolio company. 4 Net invested capital is the total invested capital in each portfolio company by vintage year reduced by the disposition of portfolio companies at investment cost, as of June 30, 2014. Vintage year is based on the year we made our initial investment in a portfolio company.
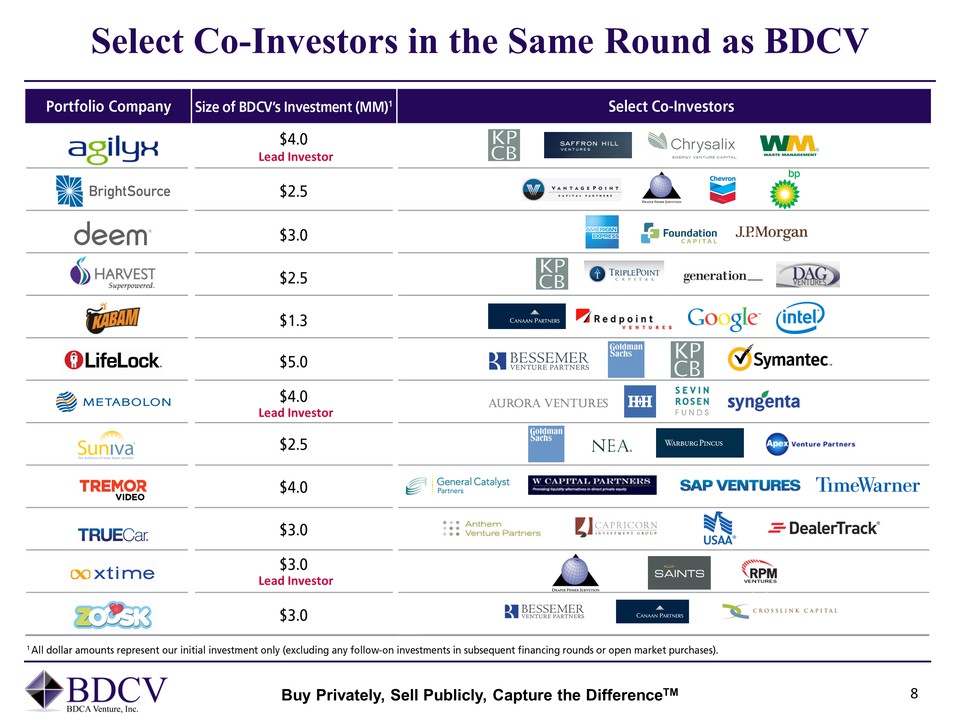
Select Co-Investors in the Same Round as BDCV Lead Investor Lead Investor Lead Investor Buy Privately, Sell Publicly, Capture the DifferenceTM 8 Portfolio Company Size of BDCV’s Investment (MM)1 Select Co-Investors $4.0 $2.5 $3.0 $1.3 $5.0 1 All dollar amounts represent our initial investment only (excluding any follow-on investments in subsequent financing rounds or open market purchases).
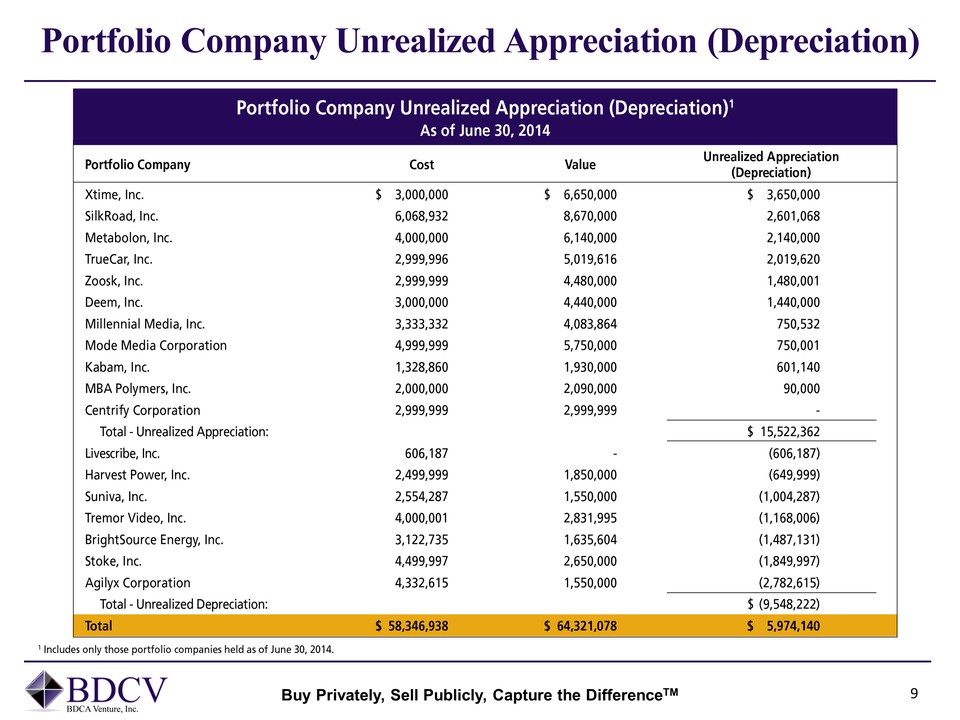
Portfolio Company Unrealized Appreciation (Depreciation) Buy Privately, Sell Publicly, Capture the DifferenceTM 9 Portfolio Company Unrealized Appreciation (Depreciation)1 As of June 30, 2014 Portfolio Company Cost Value Unrealized Appreciation (Depreciation) Xtime, Inc. SilkRoad, Inc. Metabolon, Inc. TrueCar, Inc. Zoosk, Inc. Deem, Inc. Millennial Media, Inc. Mode Media Corporation Kabam, Inc. MBA Polymers, Inc. Centrify Corporation Total – Unrealized Appreciation: Livescribe, Inc. Harvest Power, Inc. Suniva, Inc. Tremor Video, Inc. BrightSource Energy, Inc. Stoke, Inc. Agilyx Corporation Total – Unrealized Depreciation: Total $3,000,000 6,068,932 4,000,000 2,999,996 2,999,999 3,000,000 3,333,332 4,999,999 1,328,860 2,000,000 2,999,999 606,187 2,499,999 2,554,287 4,000,001 3,122,735 4,499,997 4,332,615 6,650,000 8,670,000 6,140,000 5,019,616 4,480,000 4,440,000 4,083,864 5,750,000 1,930,000 2,090,000 2,999,999 1,850,000 1,550,000 2,831,995 1,635,604 2,650,000 1,550,000 58,346,938 64,321,078 3,650,000 2,601,068 2,140,000 2,019,620 1,480,001 1,440,000 750,532 750,001 601,140 90,000 – 15,522,362 (606,187) (649,999) (1,004,287) (1,168,006) (1,487,131) (1,849,997) (2,782,615) (9,548,222) 5,974,140 1 Includes only those portfolio companies held as of June 30, 2014
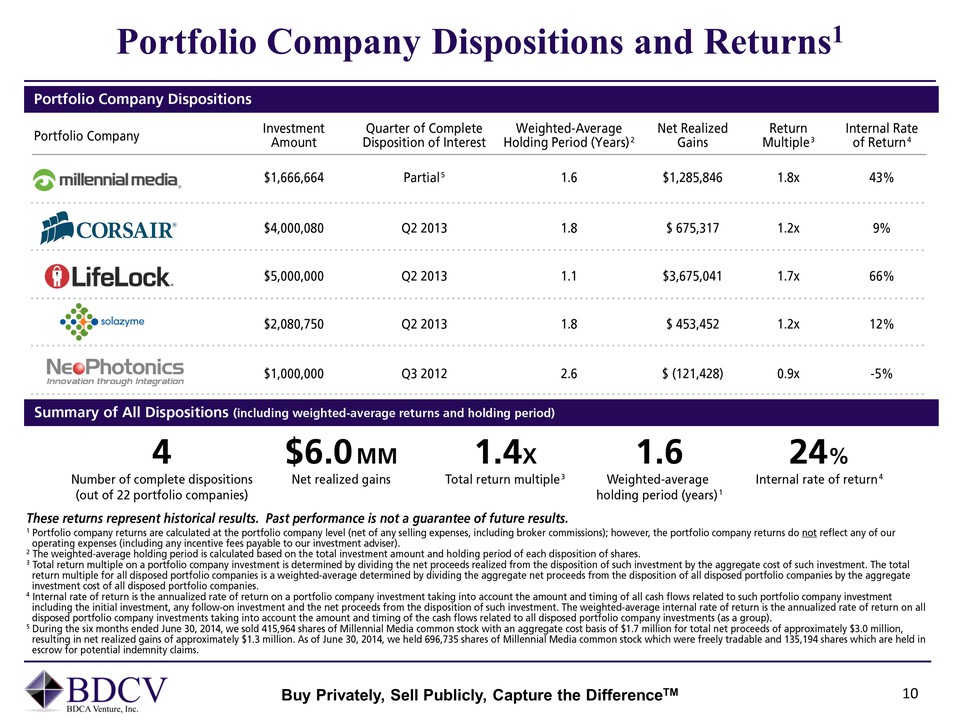
Portfolio Company Dispositions and Returns1 Buy Privately, Sell Publicly, Capture the DifferenceTM 10 Portfolio Company Dispositions Portfolio Company Investment Amount Quarter of Complete Disposition of Interest Weighted-Average Holding Period (Years)2 Net Realized Gains Return Multiple3 Internal Rate of Return4 $1.666.664 $4,000,080 $5,000,000 $2,080,750 $1,000,000 Partial5 Q2 2013 Q3 2012 1.6 1.8 1.1 1.8 2.6 $1,285,846 $675,317 $3,675,041 $453,452 $(121,428) 1.8x 1.2x 1.7x1.2x 0.9x 43% 9% 66% 12% -5% 4 $6.0 MM 1.4x 1.6 24% Number of complete dispositions (out 0f 22 portfolio companies) Net realized gains Total return multiple3 Weighted-average holding period (years) 1 These returns represent historical results. Past performance is not a guarantee of future results. 1 Portfolio company returns are calculated at the portfolio company level (net of any selling expenses, including broker commissions); however, the portfolio company returns do not reflect any of our operating expenses (including any incentive fees payable to our investment adviser). 2 The weighted-average holding period is calculated based on the total investment amount and holding period of each disposition of shares. 3 Total return multiple on a portfolio company investment is determind by dividing the net proceeds realized from the disposition of such investment by the aggregate cost of such investment. The total return multiple for all disposed portfolio companies is a weighted-average determinded by dividing the aggregate net proceeds from the disposition of all disposed portfolio companies by the aggregate investment cost of all disposed portfolio companies. 4 Internal rate of return is the annualized rate of return on a portfolio company investment taking into account the amount and timing of all cash flows related to such portfolio company investment including the intial investment, any follow-on investment and the net proceeds from the disposition of such investment. The weighted-average internal rate of return is the annualized rate of return on all disposed portfolio company investments taking into account the amount and timing of the ash flows related to all disposed portfolio company investments (as a group). 5 During the six months ended June 30, 2014, we sold 415,964 shares of Millennial Media common stock with an aggregate cost basis of $1.7 million for total net proceeds of approximately $3.0 million, resulting in net realized gains of approximately $1.3 million. As of June 30, 2014, we held 696,735 shares of Millennial Media common stock which were freely tradable and 135,194 shares which are held in escrow for potential indemnity claims.
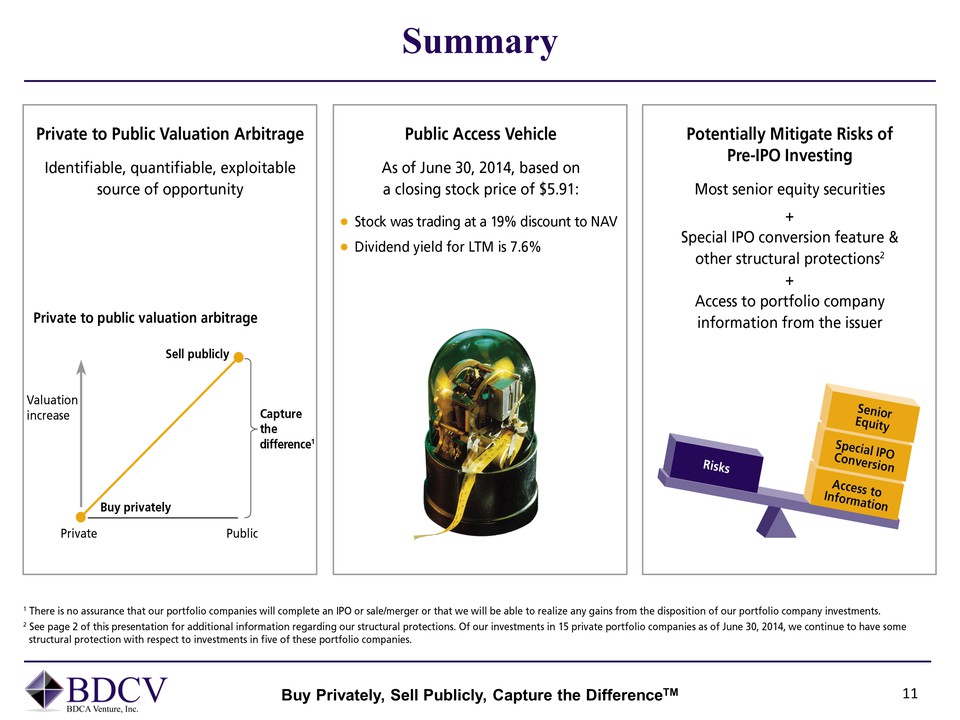
Summary Buy Privately, Sell Publicly, Capture the DifferenceTM 11 Private to Public Valuation Arbitrage Identifiable, quantifiable, exploitable source of opportunity Private to public valuation arbitrage Valuation increase Sell publicly Capture the difference 1 Buy privately Private Public Public Access Vehicle As of June 30, 2014, based on a closing stock price of $5.91; Stock was trading at a 19% discount to NAV Dividend yield for LTM is 7.6% Potentially Mitigate Risks of Pre-IPO Investing Most senior equity securities + Special IPO conversion feature & other structural protections 2 + Access to portfolio company information from the issuer Risks Senior Equity Special IPO Conversion Access to Information 1 There is no assurance that our portfolio companies will complete an IPO or sale/merger or that we will be able to realize any gains from the disposition of our portfolio company investments. 2 See page 2 of this presentation for additional information regarding our structural protections. Of our investments in 15 private portfolio companies as of June 30, 2014, we continue to have some structural protection with respect to investments in five of these portfolio companies.
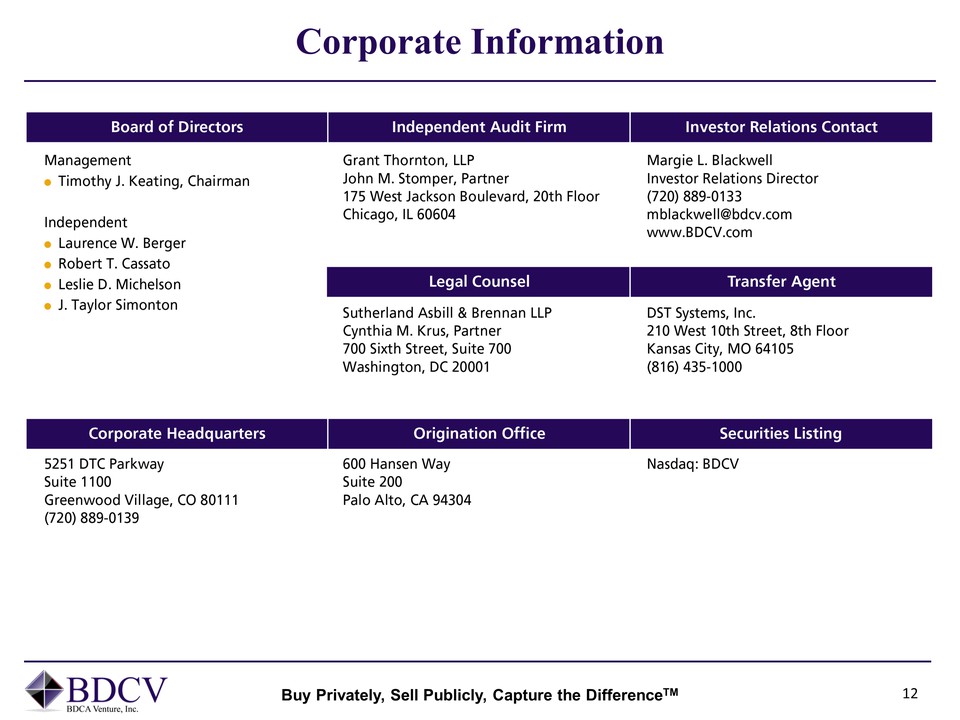
Corporate Information Buy Privately, Sell Publicly, Capture the DifferenceTM 12 Board of Directors Independent Audit Firm Investor Relations Contact Management Timothy J. Keating, Chairman Independent Laurence W. Berger Robert T. Cassato Leslie D. Michelson J. Taylor Simonton Grant Thornton, LLP John M. Stomper, Partner 175 West Jackson Boulevard, 20th Floor Chicago, IL 60604 Margie L. Blackwell Investor Relations Director (720) 889-0133 mblackwell@bdcv.com www.BDCV.com Legal Counsel Sutherland Asbill & Brennan LLP Cynthia M. Krus, Partner 700 Sixth Street, Suite 700 Washington, DC 20001 Transfer Agent DST Systems, Inc. 210 West 10th Street, 8th Floor Kansas City, MO 64105 (816) 435-1000 Corporate Headquarters 5251 DTC Parkway Suite 1100 Greenwood Village, CO 80111 (720) 889-0139 Origination Office 600 Hansen Way Suite 200 Palo Alto, CA 94304 Securities Listing Nasdaq: BDCV