Attached files
| file | filename |
|---|---|
| EX-3.7 - EX-3.7 - CROSSROADS LIQUIDATING TRUST | d482887dex37.htm |
| EX-31.2 - EX-31.2 - CROSSROADS LIQUIDATING TRUST | d482887dex312.htm |
| EX-31.1 - EX-31.1 - CROSSROADS LIQUIDATING TRUST | d482887dex311.htm |
| EX-32.2 - EX-32.2 - CROSSROADS LIQUIDATING TRUST | d482887dex322.htm |
| EX-32.1 - EX-32.1 - CROSSROADS LIQUIDATING TRUST | d482887dex321.htm |
| EX-10.5 - EX-10.5 - CROSSROADS LIQUIDATING TRUST | d482887dex105.htm |
Table of Contents
UNITED STATES
SECURITIES AND EXCHANGE COMMISSION
WASHINGTON, D.C. 20549
FORM 10-K
| x | ANNUAL REPORT PURSUANT TO SECTION 13 OR 15(d) OF THE SECURITIES EXCHANGE ACT OF 1934 |
FOR THE FISCAL YEAR ENDED DECEMBER 31, 2012
OR
| ¨ | TRANSITION REPORT PURSUANT TO SECTION 13 OR 15(d) OF THE SECURITIES EXCHANGE ACT OF 1934 |
FOR THE TRANSITION PERIOD FROM TO
COMMISSION FILE NUMBER: 0-53504
KEATING CAPITAL, INC.
(Exact name of registrant as specified in its charters)
| Maryland | 26-2582882 | |
| (State of Incorporation) | (I.R.S. Employer Identification Number) |
5251 DTC Parkway, Suite 1100
Greenwood Village, CO 80111
(Address of principal executive offices)
(720) 889-0139
(Registrant’s telephone number, including area code)
Securities registered pursuant to Section 12(b) of the Act:
| Title of Each Class Registered |
Name of Each Exchange on Which Registered | |
| Common stock, par value $0.001 per share | Nasdaq Capital Market |
Securities registered pursuant to Section 12(g) of the Act: None
Indicate by check mark if the registrant is a well-known seasoned issuer, as defined in Rule 405 of the Securities Act. Yes ¨ No x.
Indicate by check mark if the registrant is not required to file reports pursuant to Section 13 or Section 15(d) of the Act. Yes ¨ No x.
Indicate by check mark whether the registrant (1) has filed all reports required to be filed by Section 13 or 15(d) of the Securities Exchange Act of 1934 during the preceding 12 months (or for such shorter period that the Registrant was required to file such reports), and (2) has been subject to such filing requirements for the past 90 days. Yes x No ¨.
Indicate by check mark whether the registrant has submitted electronically and posted on its corporate Web site, if any, every Interactive Data File required to be submitted and posted pursuant to Rule 405 of Regulation S-T (§ 232.405 of this chapter) during the preceding 12 months (or for such shorter period that the registrant was required to submit and post such files). Yes ¨ No ¨.
Indicate by check mark if disclosure of delinquent filers pursuant to Item 405 of Regulation S-K is not contained herein, and will not be contained, to the best of registrant’s knowledge, in definitive proxy or information statements incorporated by reference in Part III of this Form 10-K or any amendment to this Form 10-K. x
Indicate by check mark whether the registrant is a large accelerated filer, an accelerated filer, a non-accelerated filer, or a smaller reporting company. See definition of “accelerated filer,” “large accelerated filer” and “smaller reporting company” in Rule 12b-2 of the Exchange Act. (Check one):
| Large accelerated filer |
¨ |
Accelerated filer |
¨ | |||
| Non-accelerated filer |
x |
Smaller reporting company |
¨ | |||
Indicate by check mark whether the registrant is a shell company (as defined in Rule 12b-2 of the Act). Yes ¨ No x.
The aggregate market value of the voting and non-voting common stock held by non-affiliates of the registrant as of the last business day of the registrant’s most recently completed second fiscal quarter was approximately $68.6 million based upon a closing price of $7.54 reported for such date on the Nasdaq Capital Market. Common shares held by each executive officer and director and by each person who owns 5% or more of the outstanding common shares have been excluded in that such persons may be deemed to be affiliates.
As of February 14, 2013, the number of outstanding shares of common stock of the registrant was 9,174,785.
DOCUMENTS INCORPORATED BY REFERENCE
Portions of the registrant’s definitive Proxy Statement relating to the 2013 Annual Meeting of Stockholders, to be filed within 120 days after the close of the registrant’s year end, are incorporated by reference into Part III of this Annual Report on Form 10-K.
Table of Contents
Keating Capital, Inc.
Annual Report on Form 10-K
For Fiscal Year Ended December 31, 2012
| Page | ||||||
| Item 1. |
1 | |||||
| Item 1A. |
29 | |||||
| Item 1B. |
50 | |||||
| Item 2. |
50 | |||||
| Item 3. |
50 | |||||
| Item 4. |
50 | |||||
| Item 5. |
51 | |||||
| Item 6. |
55 | |||||
| Item 7. |
Management’s Discussion and Analysis of Financial Condition and Results of Operations |
56 | ||||
| Item 7A. |
96 | |||||
| Item 8. |
97 | |||||
| Item 9. |
Changes in and Disagreements with Accountants on Accounting and Financial Disclosure |
128 | ||||
| Item 9A. |
128 | |||||
| Item 9B. |
128 | |||||
| Item 10. |
129 | |||||
| Item 11. |
129 | |||||
| Item 12. |
Security Ownership of Certain Beneficial Owners and Management and Related Stockholder Matters |
129 | ||||
| Item 13. |
Certain Relationships and Related Transactions, and Director Independence |
129 | ||||
| Item 14. |
129 | |||||
| Item 15. |
130 | |||||
| 132 | ||||||
Table of Contents
| Item 1. | Business |
General
Keating Capital, Inc. (the “Company”, “we”, “us” or “our”) was incorporated on May 9, 2008 under the laws of the State of Maryland and is an externally managed, non-diversified, closed-end management investment company that has elected to be regulated as a business development company under the Investment Company Act of 1940, as amended (the “1940 Act”), as of November 20, 2008. As a business development company, we are required to comply with certain regulatory requirements. For instance, we generally have to invest at least 70% of our total assets in “qualifying assets,” including securities of private U.S. companies, cash, cash equivalents, U.S. government securities and high-quality debt investments that mature in one year or less. See “Regulation as a Business Development Company” below. Effective January 1, 2010, we elected to be treated for tax purposes as a regulated investment company, or a RIC, under Subchapter M of the Code. We satisfied the RIC requirements during our 2010, 2011 and 2012 taxable years. See “Material U.S. Federal Income Tax Considerations” below.
We specialize in making pre-IPO investments in innovative, emerging growth companies that are committed to and capable of becoming public. We provide investors with the ability to participate in a unique fund that allows our stockholders to share in the potential value accretion, or private-to-public valuation arbitrage, that we believe typically occurs once a company transforms from private to public status. Our shares are listed on Nasdaq Capital Market under the ticker symbol “KIPO.”
We commenced our portfolio company investment activities in January 2010. Keating Investments, LLC (“Keating Investments”) serves as our investment adviser and also provides us with the administrative services necessary for us to operate. We expect that our investment portfolio will consist of securities that do not provide current income through interest or dividend income. Our investment objective is to maximize capital appreciation. We seek to accomplish our capital appreciation objective by making investments in the equity securities of later stage, typically venture capital-backed, pre-initial public offering (“pre-IPO”) companies. In accordance with our investment objective, we seek to invest in equity securities of principally U.S.-based, private companies with an equity value of between $100 million and $1 billion. We refer to companies with an equity value of between $100 million and less than $250 million as “micro-cap companies” and companies with an equity value of between $250 million and $1 billion as “small-cap companies.”
We generally acquire our equity securities through direct investments in prospective portfolio companies that meet our investment criteria. We use a disciplined approach to our initial investment assessment and continued portfolio monitoring which relies primarily on the detailed financial and business information we receive about the portfolio company and our access to and discussions with management, both prior to and after our investment. Our equity investments are typically acquired directly from the issuer in the form of convertible preferred stock and common stock. The equity securities that we acquire directly from an issuer are typically the issuer’s most senior preferred stock at the time of our investment or, in cases where we acquire common shares, the issuer typically has only common stock outstanding. The proceeds of our direct investments are used by these companies for growth or working capital purposes as well as in select cases for acquisitions. Many of our direct investments are sourced through top tier venture capital funds and other financial or strategic investors that are either existing investors or co-investors in the round in which we invest.
We may also purchase equity securities of companies that meet our investment criteria directly from current or former management or early stage investors in private secondary transactions, or from current or former non-management employees where the portfolio company or its management is coordinating the transaction process. The equity securities that we acquire directly from selling stockholders are more likely to be common stock and may not represent the most senior equity securities of the issuer. In these private secondary transactions, we typically require an opportunity to conduct due diligence discussions with the portfolio company’s management, as well as to have access to the company’s business and financial information in connection with our investment and on an ongoing basis. We may also seek to negotiate terms, such as warrants or other structural protections, that are intended to provide some additional value protection in the event of an initial public offering (“IPO”).
By design, our fund has been structured as a high risk/high return investment vehicle. While we have discretion in the investment of our capital, we seek long-term capital appreciation through investments principally in equity securities that we believe will maximize our total return. Although our preferred stock investments typically carry a dividend rate, in some cases with a payment preference over other classes of equity, we do not expect dividends (whether cumulative or non-cumulative) to be declared and paid on our preferred stock investments, or on our common stock investments, since our portfolio companies typically prefer to retain profits, if any, in their businesses. Accordingly, our equity investments are not expected to generate current income (i.e., dividends or interest income), which makes us different from other business development companies that primarily make debt investments from which they receive current yield in the form of interest income. Our primary source of investment return will be
1
Table of Contents
generated from net capital gains, if any, realized on the disposition of our portfolio company investments, which typically will occur after a portfolio company completes an IPO. Because the portfolio company securities that we acquire are typically illiquid until an IPO or sale of the company, we generally cannot predict the regularity and time periods between dispositions of our portfolio company investments and the realizations of capital gains, if any, from such dispositions. Dispositions of our portfolio company investments are discretionary and based on our business judgment.
Our goal is to be the leading pre-IPO financing provider for companies in a variety of growth industries that we believe are capable of being transformed by technological, economic and social forces. To the best of our knowledge, we are the only publicly listed fund in the United States dedicated to pre-IPO investing. Despite our limited track record, the transactions that we have executed to date have helped to establish our reputation with the types of innovative, emerging growth, pre-IPO companies and their financial sponsors that we target for investment. We have relationships with top tier venture capital firms and investment banks that we believe can be a source of pre-IPO companies that meet our investment criteria and, as a result, will give us the opportunity to evaluate a growing number of attractive pre-IPO investment opportunities.
We focus on companies in the technology, Internet and software, and cleantech industries, and investments in such companies represented 100% of our investment portfolio as of December 31, 2012. We expect that our portfolio will consist of a broad range of companies within these general industry designations.
Our strategy is to evaluate and invest in companies prior to the valuation accretion that we believe occurs once our portfolio companies complete an initial public offering, or what we refer to as private-to-public valuation arbitrage. Our investment strategy can be summarized as buy privately, sell publicly, capture the difference. We evaluate the detailed financial and business information we receive about a portfolio company and typically have access to and discussions with management before we make our investment. Subsequent to making our investment, we will continue to receive financial information and have ongoing discussions with management pursuant to our typical rights. We also use our initial and ongoing discussions with our portfolio company management teams to validate and monitor their commitment to completing an IPO and, when requested, to provide our insights on the current IPO market and what we believe are the key differentiators for successful IPOs.
We believe we provide five core benefits to our stockholders as follows:
| • | Publicly traded investment vehicle. We believe we are the first and only publicly listed investment fund dedicated to pre-IPO investing in the U.S. As compared to private venture capital funds, we believe that our fund provides greater transparency and liquidity to our stockholders, who may buy or sell our common stock on the Nasdaq Capital Market. |
| • | Access to qualified pre-IPO opportunities. We provide access to later stage, pre-IPO investments in innovative, emerging growth companies that would otherwise be inaccessible to most individual investors and to institutional investors that either do not, or are not permitted to, invest in private companies at any stage. In addition, we allow institutional investors to leverage our investment adviser’s highly developed network to access these private, pre-IPO investment opportunities and its experience in negotiating, structuring and closing these specialized transactions with issuers and selling stockholders. |
| • | Non-controlling structure drives deal flow. Because of our profile as a flexible, non-controlling investor, we believe we are well positioned to participate in the last round of private financing that high growth companies typically need before they complete an IPO. We believe we can be a provider of choice for pre-IPO financing, acting either as a participant or as a lead investor. We believe that our willingness to lead an investment round may be attractive to certain existing venture capital investors, who may wish to avoid conflicts of interest presented by their board seats or other control rights. |
| • | IPO market insights. We believe our investment adviser’s experience in taking companies public and its insights on the trends affecting the IPO market and the factors that contribute to a successful IPO positions us to evaluate prospective deals in a disciplined manner based on, among other things, current pricing trends, investor sentiments, favored or out-of-favored industries or sectors and marketing and distribution concerns. |
| • | Patient investor. Finally, we believe that the perpetual nature of our corporate structure enables us to be a patient investor in our portfolio companies, allowing them flexibility to access IPO windows when the timing and pricing may be best for the company and us. In the event of a prolonged closure of the IPO markets, we can be flexible as our portfolio companies wait for a market recovery or seek alternative exit strategies. We are not subject to requirements to return invested capital to investors nor do we have a finite investment horizon. Capital providers that are subject to such limitations are often required to seek a liquidity event more quickly than they otherwise might, which can result in a lower overall return on an investment. |
2
Table of Contents
As of December 31, 2012, we were fully invested based on our currently available funds and had approximately $8.9 million of cash and cash equivalents. It is our policy to retain approximately $10 million in cash and cash equivalents to fund our future operating expenses, although the amount we actually retain may vary depending on our operating expenses and the timing of our purchases and sales of portfolio company investments. We currently expect to have a portfolio of approximately 20 companies, taking into account our current portfolio composition and our current capital base. Since we typically do not expect to generate current income from our portfolio company investments, our operating expenses will be financed from our capital base during periods of time between realizations of capital gains on our investments, if any.
We intend to access the capital markets from time to time in the future to raise cash to fund additional investments. We also intend to file a registration statement with the SEC to offer for sale, from time to time, shares of our common stock, in one or more underwritten public offerings, at-the-market offerings, negotiated transactions, block trades, best efforts or a combination of these methods. We intend to use the proceeds from these offerings to fund additional investments in portfolio companies consistent with our investment objective. There can be no assurance that we will be able to raise additional capital for investment purposes or, if we are able to do so, on terms favorable to us. Without sufficient access to the capital markets, we may be forced to curtail our business operations or we may not be able to pursue new investment opportunities, which could decrease our investment income, if any, and cause our net asset value to deteriorate. As of December 31, 2012, we had no indebtedness for borrowed money, and we currently do not intend to borrow funds in the foreseeable future to finance the purchase of our investments in portfolio companies.
Since we typically do not expect to generate current income from our portfolio company investments, our operating expenses will be financed from our capital base during periods of time between realizations of capital gains on our investments. In addition, if we are successful in disposing of a portfolio company investment, we intend to reinvest the principal amount of our investment in new portfolio company opportunities, with any gain that we may realize being distributed to our stockholders after we pay any incentive fees earned by our investment adviser and our operating expenses.
Our Investment Adviser
We are externally managed by Keating Investments, an investment adviser that was founded in 1997 and is registered under the Investment Advisers Act of 1940, as amended (the “Advisers Act”). As our investment adviser, Keating Investments is responsible for managing our day-to-day operations including, without limitation, identifying, evaluating, negotiating, closing, monitoring and servicing our investments. Keating Investments also provides us with the administrative services necessary for us to operate. Our investment activities are managed by Keating Investments pursuant to an investment advisory and administrative services agreement (the “Investment Advisory and Administrative Services Agreement”). We pay Keating Investments a fee for its investment advisory services under the Investment Advisory and Administrative Services Agreement consisting of two components – a base management fee and an incentive fee. See “Investment Advisory and Administrative Services Agreement” below.
The managing member and principal owner of Keating Investments is Timothy J. Keating. Our investment adviser’s principals are Timothy J. Keating, our President, Chief Executive Officer and Chairman of our Board of Directors, Kyle L. Rogers, our Chief Investment Officer, and Frederic M. Schweiger, our Chief Operating Officer, Chief Compliance Officer, Secretary and a member of our Board of Directors. As a result of the resignation of Stephen M. Hills as our Chief Financial Officer and Treasurer effective February 20, 2013, Mr. Schweiger was appointed by our Board of Directors to serve as our Chief Financial Officer and Treasurer effective February 20, 2013. Mr. Schweiger will continue to serve as our Chief Operating Officer, Chief Compliance Officer, Secretary and a member of our Board of Directors. Mr. Schweiger also replaced Mr. Hills as the Chief Financial Officer of our investment adviser in February 2013. In addition, Keating Investments employs two other investment professionals dedicated to portfolio company origination, due diligence and financial analysis.
Keating Investments has established an investment committee (“Investment Committee”) that must unanimously approve each new portfolio company investment that we make. Messrs. Keating, Rogers and Schweiger are the current members of the Investment Committee. However, as the managing member of Keating Investments, Mr. Keating has sole control over the appointment and removal of the members of the Investment Committee.
Our investment adviser’s principals have extensive experience in taking companies public, advising micro- and small-cap companies on capital markets strategies, and developing investor relations programs. Our investment adviser has managed our portfolio company investment activity since we made our first investment in January 2010. Through our investment adviser’s experience in taking companies public, we believe the principals of our investment adviser possess valuable insights on the trends affecting the IPO market, the factors that contribute to the completion of a successful IPO in the current market, key IPO pricing drivers, investor sentiment, and industries or sectors in and out of favor. Our investment adviser is able to use this experience and insight as part of its disciplined approach to investment assessment and adjust valuation expectations and portfolio composition as IPO market trends are identified.
3
Table of Contents
Governance
Our Board of Directors monitors and performs an oversight role with respect to our business and affairs, including with respect to investment practices and performance, compliance with regulatory requirements and the services, expenses and performance of our service providers. Among other things, our Board of Directors approves the appointment of our investment adviser and officers, reviews and monitors the services and activities performed by our investment adviser and officers, approves the engagement, and reviews the performance of, our independent registered public accounting firm, and provides overall risk management oversight. Pursuant to the requirements under the 1940 Act and to satisfy the Nasdaq listing standards, our Board of Directors is composed of a majority of non-interested, independent, directors.
Our Board of Directors has established the Audit Committee, the Valuation Committee and the Nominating Committee to assist the Board of Directors in fulfilling its oversight responsibilities. Each of these committees is composed solely of non-interested, or independent, directors. The Audit Committee’s responsibilities include overseeing our accounting and financial reporting processes, our systems of internal controls over financial reporting, and audits of our financial statements. The Valuation Committee’s responsibilities include reviewing preliminary portfolio company investment valuations from our investment adviser and making recommendations to our Board of Directors regarding the valuation of each investment in our portfolio. The Nominating Committee’s responsibilities include identifying qualified individuals to serve on our Board of Directors, and to select, or recommend that the Board of Directors select, the Board nominees.
Our Market Opportunity
We believe that an attractive market opportunity exists for us as a provider of pre-IPO financing to innovative, emerging growth companies that meet our investment criteria for the following reasons:
| • | Companies staying private longer. The venture capital-backed companies that we typically target are staying private significantly longer than in the past. While there are many reasons for companies staying private longer, we believe that the volatile equity markets, a lack of investment research coverage for smaller companies, the increased public company compliance obligations, and certain structural changes and distribution inefficiencies have all contributed. As a result, we believe there is a growing pipeline of more mature private companies that are currently able to satisfy investor demands for growth and prospects for near-term profitability. |
| • | Need for pre-IPO financing. As a result of the changing IPO market conditions over the last several years, we believe micro- and small-cap companies generally must demonstrate an ability to raise private capital prior to an IPO to be successful in the IPO process. We believe such pre-IPO financing evidences existing investors’ continuing commitment to the company, validates increased valuations to the extent new investors price the pre-IPO financing, and strengthens the company’s balance sheet as it prepares for the IPO process. We also believe the increased cash position that such pre-IPO financing provides affords greater flexibility to access IPO windows when the timing and pricing may be best for the company. |
| • | Non-controlling investment structure. We believe we can be a provider of choice for pre-IPO financing. Since we do not require board seats, observation rights, or other control provisions, we allow the current management and board to remain focused on executing the company’s business strategy. As a non-controlling pre-IPO investor, we believe we are well positioned to participate in the final round of pre-IPO financing before these micro- and small-cap companies go public. Furthermore, we believe our ability to typically make investment decisions in a relatively short time frame is attractive to the company’s existing management and institutional investors and therefore makes us a desirable partner in a transaction with other institutional investors. In addition to participating in financings led by other investors, we are able to act as a lead investor, in which case we would establish the price and other terms on our own behalf and on behalf of other investors. We believe that our willingness to lead an investment round may be attractive to certain existing venture capital investors, who may wish to avoid conflicts of interest presented by their board seats or other control rights. As of December 31, 2012, we had been the lead investor in seven out of our 19 portfolio company investments. |
Capital markets volatility and the overall market environment may preclude our portfolio companies from completing an IPO and impede our exit from these investments. Since 1998, the number of venture capital-backed companies that have been able to complete IPOs has fallen, while the median time from initial funding to IPO completion has risen. While the U.S. IPO market had its fastest start in 2012 since 2000, the market declined after Facebook’s botched IPO in May 2012 and the continuing European debt
4
Table of Contents
crisis. The uncertainty surrounding the U.S. fiscal cliff resulted in sporadic IPO activity in the second half of 2012, with the slowest November and December since the technology bubble in 2000. Still, the overall results for 2012 showed an improvement over 2011, with 128 U.S. IPOs completed in 2012 – up from 125 IPOs in 2011.
Including Facebook’s $16 billion IPO, the largest venture-backed IPO in history, there were 46 venture-backed IPOs in 2012 raising total proceeds of about $20.7 billion, compared to 51 venture-backed IPOs in 2011 raising about $7.9 billion. However, excluding Facebook’s IPO, total 2012 proceeds declined by about $3.2 billion from 2011, an indication that recent ventured-backed IPO activity consisted of mainly smaller IPOs with average deal size falling from $155 million in 2011 to $104 million in 2012.
On April 5, 2012, the Jumpstart Our Business Start-ups Act (“JOBS Act”), which was designed to make it easier for small businesses and emerging growth companies to raise capital and complete the IPO process, was signed into law. The JOBS Act amends the Securities Act of 1933, as amended (“Securities Act”) and the Securities Exchange Act of 1934, as amended (“Exchange Act”) to add a new category of issuer, an “emerging growth company,” broadly defined as a company with less than $1 billion of annual gross revenue in the fiscal year prior to its IPO. For companies that qualify as “emerging growth companies,” the JOBS Act provides exemptions from certain disclosure requirements and auditing and accounting rules that we believe discouraged many smaller companies from going public. For example, the JOBS Act amends Section 404 of the Sarbanes-Oxley Act to exempt emerging growth companies from the requirement to include an auditor’s statement attesting to management’s internal controls over financial reporting for up to five years. Among the changes implemented by the JOBS Act, we perceive the following potentially will have the most impact on the IPO market:
| • | Reducing the number of years of audited financial statements that emerging growth companies are required to disclose in their registration statements from three years to two years; |
| • | Allowing emerging growth companies to submit a draft IPO registration statement for confidential review by the SEC prior to making a public filing; |
| • | Permitting emerging growth companies to communicate with Qualified Institutional Buyers (QIBs), institutions and accredited investors before or after the filing of a registration statement to determine whether these prospective investors might be interested in the offering; |
| • | Allowing investment banks to publish research reports on pending offerings, even while serving as an underwriter; and |
| • | Waiving conflict of interest and three-way communications rules involving research analysts, investment banks, and an emerging growth company’s management. |
We believe the reforms provided for in the JOBS Act have the potential to reduce many of the barriers to going public for emerging growth companies by making the process faster, easier and less costly. Many of the provisions of the JOBS Act affecting IPOs are subject to SEC rulemaking, and there are no assurances that the SEC will act in a timely fashion to implement such changes, or what additional requirements the rulemaking may impose on emerging growth companies. Also, the extent to which market practices regarding the conduct of IPOs will change as a result of the JOBS Act is unclear at this time.
While the market continues to be volatile, we believe there will be investor interest for IPOs in companies that demonstrate growth and prospects for near-term profitability. However, we believe the IPO “windows,” or the periods of days or weeks in which new IPOs will be completed, may be shorter and more unpredictable.
The market prices of companies that have recently completed an IPO typically experience high volatility and are driven by such factors as overall market conditions, the industry conditions for the particular sector in which the portfolio company operates, the portfolio company’s performance, the relative size of the public float, and the potential selling activities of other pre-IPO investors and possibly management. A stock market characterized by high volatility and declining prices/valuation multiples can be both positive and negative for our investment strategy. On the one hand, it adversely impacts the timing and value of our portfolio company exits, both in terms of companies completing IPOs and ultimately in the value we are able to realize from the disposition of our publicly traded portfolio companies after our lockup restrictions expire. On the other hand, declining valuations of comparable public companies or recently completed IPOs that we typically analyze in assessing new portfolio company investments may provide us with better pricing or terms, or both, for these new investments. Our overall goals remain unchanged. We intend to continue investing in the securities of later stage, pre-IPO companies that are positioned for growth and to potentially increase our net asset value.
5
Table of Contents
Our Investment Strategy
Our investment objective is to maximize capital appreciation. We seek to accomplish our capital appreciation objective through equity investments in later stage, typically venture capital-backed, pre-IPO companies that are committed to and capable of becoming public. Our primary source of investment return will be generated from net capital gains, if any, realized on the disposition of our portfolio company investments, which typically will occur after a portfolio company completes an IPO and after expiration of a customary 180-day post-IPO lockup restriction. While our preferred stock investments typically carry a dividend rate, in some cases with a payment preference over other classes of equity, we do not expect dividends (whether cumulative or non-cumulative) to be declared and paid on our preferred stock investments, or on our common stock investments, since our portfolio companies typically prefer to retain profits, if any, in their businesses. Accordingly, our equity investments are not expected to generate current income (i.e., dividends or interest income). Our investing strategy relies on the expertise of our investment adviser’s deal origination team to source opportunities that meet our investment criteria through our disciplined evaluation of company-provided business and financial information and access to management.
We generally acquire our equity securities through direct investments in prospective portfolio companies that meet our investment criteria and are seeking growth capital. However, we may also purchase equity securities of qualified companies from current or former management or early stage investors in private secondary transactions, or from current or former non-management employees where the company or its management is coordinating the transaction process. In each case, we use a disciplined approach to our initial investment assessment and continued portfolio monitoring which relies primarily on the detailed financial and business information we typically receive about the portfolio company and our access to and discussions with management, both prior to and after our investment.
We intend to maximize our potential for capital appreciation by taking advantage of the private-to-public valuation arbitrage, or the premium, we believe is generally associated with having a more liquid asset, such as a publicly traded security. Typically, we believe investors place a premium on liquidity, or having the ability to sell stock more quickly and efficiently through an established stock exchange than through private transactions. Specifically, we believe that an exchange listing, if obtained, should generally provide our portfolio companies with greater visibility, marketability and liquidity than they would otherwise be able to achieve without such a listing. As a result, we believe that public companies typically trade at higher valuations – generally 2x or more – than private companies with similar financial attributes. By going public and listing on an exchange, we believe that our portfolio companies have the potential to receive the benefit of this liquidity premium. There can be no assurance that our portfolio companies will trade at these higher valuations once they are public and listed on an exchange.
Because of the value differential which we believe exists between public and private companies as a result of the liquidity premium, as discussed above, we seek to make investments that create the potential for a 2x return on our investment once the company is publicly traded and assuming our expected investment horizon of 36 months. We may also pursue investments with a shorter expected investment horizon, where we believe the portfolio company may file for an IPO sooner than our targeted 12-month time frame or has a registration statement filed at the time of our investment, in which case our targeted return may be correspondingly reduced. In general, we seek to invest in later stage, private, pre-IPO companies that we believe will be able to file a registration statement with the SEC for an IPO within approximately 12 months after our initial investment, and complete an IPO and obtain an exchange listing within approximately 18 months after our initial investment. After the IPO is completed, we typically will be subject to a lockup restriction which prohibits us from selling our investment during the customary 180-day period following the IPO. Once this lockup restriction expires, we expect to sell our shares in the portfolio company in the public markets over the following 12 months. However, we have the discretion to hold our position to the extent we believe the portfolio company is not being appropriately valued in the public markets or is adversely affected by market or industry cyclicality. Accordingly, we anticipate our typical investment horizon for portfolio investments will be 36 months; however, we may pursue investments that have a shorter expected investment horizon. In each case, we have the discretion to hold securities for a longer period.
We are focused on the potential value transformation that we believe our portfolio companies will experience as they complete an IPO and become publicly traded and correspondingly achieve a market equity value comparable to their publicly traded peers. We target our investments in portfolio companies that we believe can complete this value transformation within our targeted 36-month holding period, compared to typical private equity and venture capital funds which take typically seven years or more. As a result, we may experience low or negative returns in our initial years with any potential valuation accretion expected to occur in later years as our portfolio companies complete their IPOs and become publicly traded. However, there can be no assurance that we will be able to achieve our targeted return on any individual portfolio company investment if and when it goes public or on our portfolio as a whole.
We have an IPO, event-driven strategy, and we attempt to generate returns by accepting the risks of owning illiquid securities of later stage private companies. The process of transforming from private to public ownership is subject to the uncertainties of the IPO process. If this process happened quickly and with certainty, we believe there would be less of an illiquidity discount available
6
Table of Contents
(and hence, less potential return) to us when we make our investments. Instead, the private-to-public transformation process takes time and is subject to market conditions, and we therefore incorporate an expected three-year average holding period for each portfolio company into our strategy.
We typically do not acquire shares from selling stockholders by placing bids for positions listed on the trading platforms of private secondary marketplaces since these platforms usually provide limited business and financial information on the company and, in most cases, little or no access to the company’s management or continuing financial information. Further, the imbalance of information and sophistication among the sellers and buyers on these trading platforms may result in trading prices which do not necessarily reflect our assessment of value. We also believe that the highly-publicized, private companies whose common shares are actively traded on the trading platforms of private secondary marketplaces, with equity values in some cases in excess of $1 billion, narrow the valuation differential which we believe exists between public and private companies as a result of the liquidity premium investors place on having the ability to sell stock quickly.
We believe that there are four critical factors that will drive the success of our pre-IPO investing strategy, differentiate us from other potential investors in later stage private companies, and potentially enable us to complete equity transactions in pre-IPO companies that we believe will meet our expected targeted return.
| • | Size. We focus on companies with an equity value of typically between $100 million and $1 billion – companies we believe are better positioned to achieve our targeted return on our investment once the company is publicly traded. We believe that larger, highly-publicized, private companies may create the risk to a prospective purchaser of being either fully or, in certain cases, over-valued relative to publicly traded peers. We believe this greatly diminishes the opportunity for the potential value accretion that we believe exists as issuers transform from private to public status. |
| • | Source. We focus on prospective portfolio companies where we can purchase securities directly from an issuer or from a selling stockholder in a negotiated transaction and can obtain business and financial information on the portfolio company. The disciplined approach we use to assess our initial investment and monitor our portfolio investments relies primarily on the detailed financial and business information we receive about the company and our access to and discussions with management, both prior to and after our investment. |
| • | Securities. We focus on acquiring equity securities that are typically the issuer’s most senior preferred stock at the time of our investment or, in cases where we acquire common shares, the issuer typically has only common stock outstanding. We believe that investing in an issuer’s most senior equity securities and/or negotiating certain structural protections are ways to potentially mitigate the otherwise high risks associated with pre-IPO investing. We may also seek to negotiate terms, such as warrants or other structural protections (for example, conversion rights which would result in our receiving shares of common stock at a discount to the IPO price upon conversion at the time of the IPO), that are intended to provide some additional value protection in the event of an IPO. We view the potential value associated with these structural protections as an important component of our investment strategy. As of December 31, 2012, we had some structural protection of this type with respect to eight of our portfolio company investments. |
| • | Valuation. We are focused on the acquisition of private securities at a valuation that creates the potential for our targeted return on our investment once the company is publicly traded. We believe that the existence of an active market in the common stock of a private company on the trading platforms of a private secondary marketplace, where there is active trading in meaningful volumes, may diminish the opportunity to participate in the potential value accretion that we believe is typically associated with a company’s transformation from private to public status. |
As of December 31, 2012, we held investments in 19 portfolio companies, which consisted of the most senior preferred equity in 10 of the companies (of which two of our investments have a pari passu preference with a subsequently issued series of preferred stock), common stock in two private companies whose capitalizations consisted of only common stock (Corsair Components, Inc. and TrueCar, Inc.), and common stock in two publicly traded companies (Solazyme, Inc. and LifeLock, Inc.). As of December 31, 2012: (i) our Series B preferred stock investment in Harvest Power, Inc. (“Harvest Power”) is no longer Harvest Power’s most senior preferred stock because Harvest Power issued more senior preferred stock in a Series C preferred stock round in March 2012 in which we did not participate, (ii) our common stock investment in Stoke, Inc. (“Stoke”) does not consist of Stoke’s most senior equity securities since Stoke had preferred stock outstanding at the time of our initial investment, (iii) our preferred stock investments in Livescribe, Inc. (“Livescribe”) were converted into common stock in November 2012 and, as such, our common stock is no longer Livescribe’s most senior equity securities since Livescribe continues to have more senior preferred stock outstanding, (iv) our Series C preferred stock investment in Agilyx Corporation (“Agilyx”) is no longer Agilyx’s most senior preferred stock because
7
Table of Contents
Agilyx issued more senior preferred stock in a Series D preferred stock round in October 2012 in which we did not participate, and (v) our initial Series E preferred stock investment in BrightSource Energy, Inc. (“BrightSource”) was converted into BrightSource’s common stock and Series 1A preferred stock and is no longer BrightSource’s most senior preferred stock because BrightSource issued more senior preferred stock in a Series 1 preferred stock round in October 2012 (although we did participate in the Series 1 preferred stock round and, as a result, we acquired Series 1 preferred stock which is BrightSource’s most senior preferred equity). Additionally, while Xtime and Suniva each issued new series of preferred stock subsequent to our initial investment, the newly issued series of preferred stock and our preferred stock investments in these portfolio companies have, on an equal priority, pari passu basis, a senior right and preference (before any other preferred or common stock) to any dividends declared or any distribution of assets in liquidation.
All of our portfolio company investments to date were acquired directly from the issuer, with the exception of our common stock investment in Corsair Components, Inc. (“Corsair”), which we acquired from current and former management, our investment in additional shares of Solazyme in the public market subsequent to its IPO, and our investment in Stoke which we acquired from employees.
As part of our initial investment in each portfolio company, we obtained contractual rights to receive certain financial information from each portfolio company, including those where we initially acquired common stock. However, our information rights have been subsequently terminated for: (i) Solazyme, Inc. (“Solazyme”) and LifeLock, Inc. (“LifeLock”) in connection with the completion of their IPOs, and (ii) Livescribe in connection with the conversion of our preferred stock investments into common stock. However, we continue to have access to financial information for Solazyme and LifeLock from their periodic reports filed with the SEC.
We do not intend to borrow funds or issue senior securities, including preferred stock, in the foreseeable future to finance the purchase of our investments in portfolio companies, but we have the discretion to do so. However, we will not borrow funds or issue senior securities, including preferred stock, to finance the purchase of our investment in portfolio companies for at least one year from the date of the completion of any equity offering. In the event we do borrow funds to make investments, we are exposed to the risks of leverage, which may be considered a speculative investment technique. Borrowings, also known as leverage, magnify the potential for gain and loss on amounts invested and therefore increase the risks associated with investing in our securities. In addition, the costs associated with our borrowings, including any increase in the management fee payable to our investment adviser, will be borne by our common stockholders. We also do not intend to lend the securities of our publicly traded portfolio companies to generate fee income.
Our Investment Criteria
We have identified three core criteria that we believe are important in meeting our investment objective. These core criteria provide the primary basis for making our investment decisions; however, we may not require each prospective portfolio company in which we choose to invest to meet all of these core criteria.
| • | High quality growth companies. We seek to invest primarily in micro-cap and small-cap companies that are already generating annual revenue in excess of $10 million on a trailing 12-month basis and which we believe have growth potential. However, in certain opportunistic situations, we may invest in development stage, pre-revenue stage and early revenue stage companies if there is a clear and verifiable path to generating meaningful revenue within the next 12 months. We examine the market segment in which each prospective portfolio company is operating, including its size, geographic focus and competition, to determine whether that company is likely to meet its projected growth rate prior to investing. In response to the recent IPO market volatility, we also assess with the company’s management team the prospects for future growth and attempt to validate the company’s prospects for profitability. Most of the companies that we have invested in, and intend to invest in the future, will have operating histories that are unprofitable or marginally profitable at the time of our investment. |
| • | Commitment to complete IPO. We seek to invest in micro-cap and small-cap companies whose management teams are committed to, and capable of, taking their companies public, whose businesses we believe will benefit from status as public companies, and that we believe are capable of completing IPOs and obtaining exchange listings typically within 18 months after we complete our investment. In order to determine a potential portfolio company’s commitment to going public, our investment adviser seeks to determine whether the issuer’s major stakeholders (i.e., management, independent directors, and major stockholders) have expressed a commitment to complete an IPO within our targeted 18-month time frame. We also assess whether the company is generally meeting performance milestones consistent with our investment adviser’s understanding of the market expectations for the types of companies that will likely be successful in completing IPOs. We generally also require that our portfolio companies have in place, or be committed to hiring, a qualified chief financial officer, have complete or near-complete audited financial statements for a minimum of two years, and satisfy or be committed to satisfying certain governance |
8
Table of Contents
| requirements for an exchange listing (including the appointment of an independent board and an audit committee). We also use our initial and ongoing discussions with our portfolio company management teams to validate and monitor their commitment to completing an IPO and, when requested, to provide our insights on the current IPO market and what we believe are the key differentiators for successful IPOs. |
| • | Potential for return on investment. Because of the value differential which we believe exists between public and private companies as a result of the liquidity premium, we seek to make investments that create the potential for a 2x return on our investment once the company is publicly traded and assuming our expected investment horizon of 36 months. We may also pursue investments with a shorter expected investment horizon, where we believe the portfolio company may file for an IPO sooner than 12 months or has a registration statement filed at the time of our investment, in which case our targeted return may be correspondingly reduced. However, there can be no assurance that we will be able to achieve our targeted return on each of our portfolio company investments. |
We may also consider making follow-on investments in an existing private portfolio company that is seeking to raise additional capital in subsequent private equity financing rounds. Existing portfolio companies may elect, or be required, to raise additional capital prior to pursuing an IPO for any number of reasons including: (i) to fund additional spending in marketing and/or research and development to develop their business, (ii) to fund working capital deficiencies due to weaker than expected revenue growth or higher than expected operating expenses, (iii) to fund business acquisitions or strategic joint ventures, and (iv) to increase cash reserves in advance of an anticipated IPO. In evaluating follow-on investment opportunities, we typically assess a number of additional factors beyond the three core investment criteria we use in making our initial investment decisions. These additional factors may include: (i) the portfolio company’s continued commitment to an IPO, (ii) the achievement of pre-IPO milestones since our initial investment, (iii) the size of our portfolio company investment relative to our overall portfolio, (iv) any industry trends affecting the portfolio company or other portfolio investments in similar industries, (v) the impact of a follow-on investment on our diversification requirements so we can continue to qualify as a RIC for tax purposes, and (vi) the possible adverse consequences to our existing investment if we elect not to make a follow-on investment, such as the forced conversion of our preferred stock into common stock at an unfavorable conversion rate and the corresponding loss of any liquidation preferences or other rights and privileges that may be applicable to the securities we currently hold.
In addition, our investment adviser considers a number of other factors outside of our core criteria in evaluating a portfolio company investment opportunity. Some of the factors we may consider include: (i) whether we believe there is a proven demand for the company’s products or services that address large market opportunities, (ii) whether the company has developed defendable market positions within its respective markets and is well positioned to capitalize on growth opportunities, (iii) whether the company has an experienced management team with public company experience, and (iv) whether the company is at or near profitability or has demonstrated prospects for profitability on an EBITDA or cash flow from operations basis.
Our Target Industries
We seek to invest in micro-cap and small-cap companies across a broad range of growth industries that we believe are being transformed by technological, economic and social forces. We intend to focus our investments in the following industries, or in companies that support companies in these industries:
| • | Technology. We classify “technology” companies as those that manufacture and/or market products or services that require advanced technologies, including, but not limited to, telecommunications infrastructure and equipment, networking systems, semiconductors, capital equipment, electronic equipment, instruments and components, commercial electronic data processing, business process outsourcing services, back-office automation, consumer electronics and other technology-based consumer products, and providers or developers of analytics, testing and diagnostics in the life sciences. |
| • | Internet and software. We classify “Internet and software” companies as those companies developing and marketing software and/or providing Internet services including mobile applications, cloud computing, data science and analytics, online databases and interactive services, digital and social media, database construction, Internet design services, retail goods or services, commercial and business-to-business services, and wholesale and distribution services, home entertainment software applications and systems, and specialized applications and software for the business or consumer markets. |
| • | Cleantech. We classify “cleantech” companies as those that seek to improve performance, productivity or efficiency, and to reduce environmental impact, waste, cost, energy consumption or raw materials, with particular focus on energy generation (solar, wind, advanced biofuels, hydro), energy storage (batteries, utility scale storage, fuel cells), energy efficiency (building materials, windows, lighting), energy management software and systems, energy infrastructure (grid hardware and smart metering), and waste recycling and repurposing. |
9
Table of Contents
We typically do not consider investments in real estate, construction, and mining and exploration companies because these industry segments require specialized knowledge. While we invest primarily in U.S. companies, we may invest on an opportunistic basis in certain non-U.S. companies that otherwise meet our investment criteria, subject to the requirements of the 1940 Act. We also typically avoid investments in companies whose principal place of business and executive management is located in China due to the unique due diligence risks currently associated with these types of companies.
Diversification
Beyond our guidelines for satisfying the regulated investment company, or RIC, diversification requirements (see “Taxation and Regulatory Requirements” below), we do not have fixed guidelines for portfolio diversification and, as a result, our investments could be concentrated in relatively few industry sectors, companies or geographic areas. Further, we also expect that all or a substantial portion of our portfolio may be invested in illiquid securities.
From January 11, 2010 through June 30, 2011, we raised $78.4 million, net of issuance costs, in a continuous public offering of 8,713,705 shares of our common stock, with the final closing of escrowed funds from subscribing investors occurring July 11, 2011. During this 18-month period, the size of each of our portfolio company investments was generally based on the then prevailing level of our gross assets.
Based on our current capital base, the targeted size of our individual portfolio company investments will be approximately $3 to $5 million, but we may invest more than this amount in certain opportunistic situations. We expect that most of our portfolio company investments will represent approximately 5% of our gross assets measured at the time of investment depending on the size of our asset base and our investable capital. However, based on our investment adviser’s assessment of each portfolio company’s relative quality, fundamentals and valuation, we may make opportunistic portfolio company investments that could represent up to 25% of our gross assets measured at the time of investment. An individual portfolio company investment may be smaller than our targeted size and weighting at the time of the initial investment due to factors such as the size of investment made available to us and our cash available for investment. We expect that the size of our individual portfolio company investments and their weighting in our overall portfolio will fluctuate over time based on a variety of factors including, but not limited to, additional follow-on investments in existing portfolio companies, dispositions, unrealized appreciation or depreciation, an increased asset base as a result of the issuance of additional equity, or a decreased asset base as a result of repurchases of our own equity.
We do not choose specific investments based on a strategy of industry diversification and do not intend to rebalance our portfolio if one of our portfolio company investments increases in value relative to the remaining portion of the portfolio. As a result, our portfolio may be more vulnerable to events affecting a single economic sector, industry or portfolio company and, therefore, subject to greater potential volatility than a company that follows a more diversified strategy.
As of December 31, 2012, our cash and cash equivalents and the value of our portfolio company investments, by specific investment and industry, were allocated as set forth in the table below.
10
Table of Contents
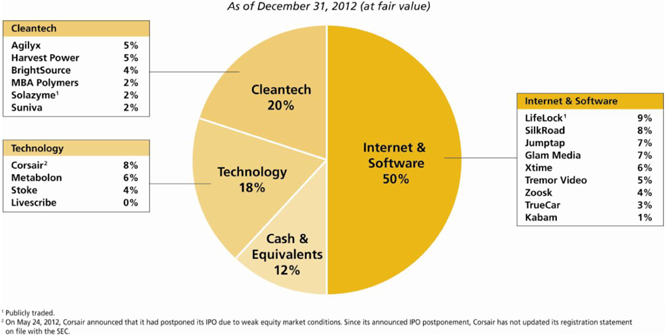
As of December 31, 2012, our portfolio consisted entirely of equity securities. Our two publicly traded portfolio companies, Solazyme and LifeLock, represented by value approximately 12.4% of our total portfolio company securities at December 31, 2012. One of our private portfolio companies, Corsair, had a registration statement publicly on file with the SEC and represented by value approximately 8.6% of our total portfolio securities at December 31, 2012; however, Corsair announced on May 24, 2012 that it had postponed its IPO due to weak equity market conditions. Since its announced IPO postponement, Corsair has not updated its registration statement on file with the SEC. BrightSource was previously in registration with the SEC, but withdrew its registration statement on April 12, 2012. BrightSource represented by value approximately 4.1% of our total portfolio company securities at December 31, 2012.
The remaining 79.0% of our portfolio company securities by value at December 31, 2012 (including BrightSource) consisted of securities in 16 private companies, which have not completed an IPO or do not have a publicly-filed registration statement for an IPO with the SEC as of December 31, 2012. As of December 31, 2012, the value of our investment in Livescribe was recorded at zero as a result of the conversion of our preferred stock investments in Livescribe into common stock and the cancellation of the preferred stock warrants we held in Livescribe due to our investment adviser’s decision not to invest in a new convertible debt financing completed by Livescribe in November 2012. Our investment adviser’s decision not to invest in Livescribe’s convertible debt financing was based on our investment adviser’s belief that an IPO by Livescribe was not likely in the foreseeable future. Following the foregoing conversion and cancellation, our investment in Livescribe’s common stock was subordinate in the capital structure to the preferred stock held by investors that participated in the convertible note financing and, accordingly, although Livescribe continues to operate its business as of December 31, 2012, we believe that the common stock has no fair value as of December 31, 2012 since any value will be attributed to preferred securities.
As a business development company, we may invest in certain non-U.S. companies that otherwise meet our investment criteria, subject to the requirements of the 1940 Act. As of December 31, 2012, we did not classify any portfolio company investments as non-U.S. investments.
Our Investment Process
Investment Sourcing
We believe our investment adviser has developed a disciplined approach to source qualified pre-IPO investing opportunities from a highly developed network of investors, advisers, and private companies that are deeply involved in later stage venture capital and IPO transactions. We believe a very distinct “IPO ecosystem” exists, which is composed primarily of top tier venture capital firms, select investment banking firms, and a select group of law firms and accounting firms. Our investment adviser has developed relationships with many of these leading venture capital, investment banking, legal and accounting firms that it believes are important participants in this ecosystem.
11
Table of Contents
Through these relationships, our investment adviser is able to gain valuable insights on the current IPO market and access to pre-IPO investment opportunities that currently, or may in the near-term, meet our investment criteria. We believe this approach will allow us to source the most attractive companies committed to going public. We typically do not pursue larger, well-publicized private company investments through anonymous bidding on the trading platforms of private secondary marketplaces. Instead, our investing strategy relies on the expertise of our investment adviser’s deal origination team to source opportunities that we can validate meet our investment criteria through our disciplined evaluation of company-provided business and financial information and access to management. Our investment adviser sources our investments through its principal office located in Greenwood Village, Colorado as well as through an additional office in Menlo Park, California.
Based on the reputation we believe we have developed and our current pipeline of investment opportunities, we expect that the primary source of our future portfolio company investment opportunities will be from our relationships with venture capital firms and investment banks.
| • | Venture capital firms. We believe that a majority of our investment opportunities will come from venture capital firms with existing portfolio companies seeking later stage, pre-IPO financing. In addition to participating in financings led by other investors, we are able to act as a lead investor, in which case we would establish the price and other terms on our own behalf and on behalf of other investors. We believe that our willingness to lead an investment round may be attractive to certain existing venture capital investors, who may wish to avoid conflicts of interest presented by their board seats or other control rights. We further believe that our targeted investment size is attractive to existing institutional investors who prefer a smaller and less dilutive final private round to strengthen the balance sheet. In addition, by not seeking out board seats, observation rights or other control features, we allow the private company’s existing management and board to focus on executing its business strategy. We will, however, make available managerial assistance to our portfolio companies upon request. |
| • | Investment banks. We also expect to source our investment opportunities from investment banks that are focused on innovative, emerging growth companies that meet our investment criteria. We have developed, and expect to continue building, relationships with the large, “bulge bracket,” investment banks and middle market firms that are recognized as leaders in these sectors. We also have relationships with the investment banking divisions of the recognized private secondary marketplaces to access negotiated transactions in which they are acting as the adviser to the issuer in a private offering or to the selling stockholders of qualified issuers. We expect that our investment banking relationships will be a source for both direct investments in prospective portfolio companies and for investments through private secondary transactions with selling stockholders in companies meeting our investment criteria. |
We also have in the past and may in the future source investment opportunities from our direct outreach to private companies. We have implemented a proactive marketing program to communicate with our investment adviser’s established referral network and with companies that meet our investment criteria. We also maintain and continually update a database of innovative, emerging growth companies, which are typically venture capital-backed, that we believe currently satisfy, or will satisfy within the next year, our investment criteria. Our database has been compiled from opportunities identified by our referral network, from publicly available information, and from acquired sources.
Because of our relationships with participants in the later stage venture capital and IPO ecosystems, we believe we have access to a significant number of venture capital-backed companies which are committed to and capable of completing an IPO in the near- or long-term. We regularly monitor the progress of these private company opportunities in order to position us to participate or lead in their future private financing round before an IPO.
As we continue to build our reputation as a leading source of pre-IPO financing, we also expect to leverage our experience in the capital markets in general, and the IPO market specifically, and our knowledge of the factors that contribute to a successful IPO, to further drive our origination marketing efforts with venture capital funds, investment banks, and qualified pre-IPO companies.
Portfolio Company Review and Approval
We use a disciplined approach to our initial investment assessment which relies primarily on the detailed financial and business information we receive about the company and our access to and discussions with management, both prior to and after our investment. Our investment adviser uses this company information to prepare our initial valuation analysis, leveraging its experience in taking companies public and its insights on current trends affecting the IPO market. We also use our initial discussions with our portfolio company management teams to discuss their commitment to completing an IPO and to determine which are best positioned to meet or exceed their performance targets following their IPOs and correspondingly achieve a market equity value comparable to their publicly traded peers.
12
Table of Contents
Once we identify those private companies that we believe meet our minimum revenue threshold and have indicated a commitment to go public within our targeted time frame, we utilize an investment review and approval process focused on the following factors:
| • | Qualification. We obtain information from the company’s management and/or placement agent and conduct a preliminary evaluation of the opportunity with primary focus on understanding the business, historical and projected financial information, industry, competition and valuation to ascertain whether we believe the prospective portfolio company will be able to satisfy our targeted return on investment if and when the company becomes public. The results of this preliminary evaluation are presented to our investment adviser’s Investment Committee, and typically a decision is made whether to pursue the opportunity further based on the relative attractiveness of the opportunity, the expected investment horizon and our assessment of the potential return on our investment, and our core investment criteria, compared to other opportunities currently in our deal pipeline. The Investment Committee typically selects those portfolio company investment opportunities that meet our investment criteria and present the greatest potential for achieving our target return on investment. |
| • | Analysis. Once the Investment Committee selects a portfolio company investment opportunity for further analysis, we will conduct research on the company’s prospects and industry, participate in additional discussions with the company’s management, placement agent and existing investors, and prepare an internal investment memorandum which discusses our evaluation findings and recommendations, together with an internal valuation analysis outlining our acceptable valuation ranges for an investment. As part of our analysis, we typically have discussions with the company’s management and advisers, and we usually request access to the company’s major stockholders. These discussions generally are centered on a review of the company’s financial history and projections to understand key supporting assumptions, verification of the company’s commitment to go public and the timing thereof, and the primary considerations, metrics and milestone achievements being used by the company to justify its valuation. At this stage, we prepare an in-depth valuation analysis focused primarily on comparable private transactions, market multiples of public companies that we believe are most comparable, and a discounted cash flow analysis. Based on our comprehensive valuation assessment, the Investment Committee typically makes a decision whether to proceed with an investment and, if we are the lead investor, the terms and conditions that we will propose for further negotiation. Each new portfolio company investment that we make requires the unanimous approval of our investment adviser’s three-person Investment Committee. |
| • | Terms. We believe that investing in an issuer’s most senior equity securities or negotiating investment terms that are expected to provide an enhanced return upon an IPO event is one important way to mitigate the otherwise high risks associated with pre-IPO investing. Examples of such structural protections include conversion rights which would result in our receiving shares of common stock at a discount to the IPO price upon conversion at the time of the IPO, or warrants that would result in our receiving additional shares for a nominal exercise price at the time of an IPO. In some circumstances, these structural protections will apply only if the IPO price is below stated levels. In some cases, our decision to pursue an investment opportunity will be dependent on obtaining some structural protections that are expected to enhance our ability to meet our targeted return on the investment. Of our investments in 17 private portfolio companies as of December 31, 2012, we have been provided some structural protection with respect to investments in eight of these portfolio companies. |
| • | Due Diligence and Closing. Prior to closing an investment, we conduct further due diligence with a focus on verifying or validating the primary considerations used by our investment adviser’s Investment Committee in approving the investment, contacting where possible key suppliers, customers or industry sources, and verifying the company’s capitalization table and equity structure. The consummation of each investment will be subject to the satisfactory completion of our due diligence investigation, our confirmation and acceptance of the investment pricing and structure, our review and acceptance of definitive agreements and, in the case of private secondary transactions, the exercise of any applicable veto rights or rights of first refusal. |
Our investment adviser’s principals have extensive experience negotiating, structuring and closing these specialized equity purchase transactions with issuers and selling stockholders. As part of its due diligence process, our investment adviser analyzes the complex capital structures which ventured capital-backed, pre-IPO companies typically possess including multiple classes of common and preferred equity securities with differing rights with respect to voting, dividends, redemptions, liquidation, and conversion rights. Our investment adviser’s principals also have experience in negotiating matters relating to registration rights, restrictions of transfer, and other stockholder rights and restrictions.
13
Table of Contents
Portfolio Company Investment Structure
Our portfolio company investments are currently composed of, and we anticipate that our portfolio will continue to be composed of, investments primarily in the form of preferred securities that are convertible into common stock, common stock, and warrants exercisable into common or preferred stock. At the time of our investment, the equity securities we acquire are generally illiquid due to restrictions on resale and to the lack of an established trading market. Our investments are typically non-controlling and we do not seek board seats, observation rights or other control features. We offer significant managerial assistance to our portfolio companies. While we expect most of our portfolio company investments to be in the form of equity securities, we may in some cases invest in debentures or loans that are convertible into or settled with common stock; however, as of December 31, 2012, none of our portfolio company investments were convertible debentures or loans.
The equity securities that we acquire directly from an issuer are typically the issuer’s most senior preferred stock at the time of our investment or, in cases where we acquire common shares, the issuer typically has only common stock outstanding. Although we seek to invest in the most senior class of securities, the seniority provided in these types of investments may be diminished if the portfolio company issues more senior securities in a subsequent financing round. The equity securities that we acquire directly from selling stockholders are typically common stock and may not represent the most senior equity securities of the issuer. However, in each case, we may seek to negotiate terms, such as warrants or other structural protections, that are intended to provide some additional value protection in the event of an IPO.
The proceeds of our direct investments are used by these companies for growth or working capital purposes as well as in select cases for acquisitions. In many of our portfolio companies, top tier venture capital funds or other financial or strategic investors are either existing investors or co-investors in the round in which we invest in.
We believe we can be a provider of choice for pre-IPO financing. In addition to participating in financings led by other investors, we are able to act as a lead investor, in which case we would establish the price and other terms on our own behalf and on behalf of other investors. We believe that our willingness to lead an investment round may be attractive to certain existing venture capital investors, who may wish to avoid conflicts of interest presented by their board seats or other control rights. Since we do not require board seats, observation rights, or other control provisions, we allow the current management and board to remain focused on executing the company’s business strategy. As of December 31, 2012, we were the lead investor in seven of our 19 portfolio company investments.
In those investment opportunities where we are the lead investor or are directly negotiating terms with the selling stockholders, we may attempt to negotiate structural protections such as conversion rights which would result in our receiving shares of common stock at a discount to the IPO price upon conversion at the time of the IPO, or warrants that would result in our receiving additional shares for a nominal exercise price at the time of an IPO. However, there is no assurance that we will be successful in negotiating these structural protections and, if we are able to obtain these structural protections, it is possible that these protections may be diminished if the portfolio company issues more senior securities in a subsequent financing round.
Where we are not the lead investor in a pre-IPO financing round or are unable to negotiate terms directly with selling stockholders in a private secondary transaction, the price and terms of the investment have generally already been established by the issuer and/or its placement agent or by the selling stockholder group and/or its adviser. In these deals, we typically we will not have structural protections, although some variation may be included in certain investments to the extent negotiated by the lead investor in such transactions.
Our convertible preferred stock investments typically carry fixed or adjustable rate dividends and will generally have a preference over common equity in the payment of dividends and the liquidation of a portfolio company’s assets. This preference means that a portfolio company must pay dividends on preferred stock before paying any dividends on its common equity and, in some cases, the holders of all outstanding series of preferred stock would receive any preferred dividends based on their respective preference amount on a pro rata basis. However, in order to be payable, dividends on such preferred stock must be declared by the portfolio company’s board of directors. In the event dividends on our preferred stock investments are non-cumulative, which is typically the case, if the board of directors of a portfolio company does not declare a preferred dividend for a specific period, then we will not be entitled to such a preferred dividend for such period. We do not expect the board of directors of our portfolio companies to declare preferred dividends since these companies typically prefer to retain profits, if any, in their businesses. Accordingly, we do not expect to receive dividend income on our preferred stock investments. Cumulative dividend payments on preferred equity means dividends will accumulate even if not declared by the board of directors or otherwise made payable. In such a case, all accumulated dividends must typically be paid before any dividend on the common equity can be paid. However, there is no assurance that any dividends will be paid by a portfolio company even in the case of cumulative preferred dividends and, in most cases, the payment of any accumulated preferred dividends is likely to be deferred until conversion and, if paid, may be paid in shares of the issuer’s preferred or common stock.
14
Table of Contents
As of December 31, 2012, we had made a total of 20 portfolio company investments since our inception, and 17 of our initial investments in these portfolio companies have been structured as convertible preferred stock with the remaining three initial investments structured as common stock. Our convertible preferred stock, common stock, warrants and equity interests are generally non-income producing. Except for the convertible preferred stock investments in SilkRoad and Jumptap, all convertible preferred stock investments carry a non-cumulative, preferred dividend payable when and if declared by the portfolio company’s board of directors. In the case of SilkRoad, the shares of convertible preferred stock carry a cumulative preferred dividend, which is payable only when and if declared by SilkRoad’s board of directors or upon a qualifying liquidation event. In the case of Jumptap, the shares of convertible preferred stock carry a cumulative preferred dividend, which is payable only when and if declared by Jumptap’s board of directors. During 2012, the preferred dividends on our Series B convertible preferred stock in Harvest Power were changed from a cumulative to a non-cumulative dividend in connection with Harvest Power’s Series C round. Since no dividends have been declared or paid, or are expected to be declared or paid, with respect to these convertible preferred stock investments, these investments are considered to be non-income producing.
Our Investment Horizon
In general, we seek to invest in micro-cap and small-cap companies that we believe will be able to file a registration statement with the SEC for an IPO within approximately 12 months after our initial investment, and complete an IPO and obtain an exchange listing within approximately 18 months after the closing of our initial investment. After the IPO is completed, we typically will be subject to a lockup restriction which prohibits us from selling our investment during the customary 180-day period following the IPO. Once this lockup restriction expires, we expect to sell our shares in the portfolio company in the public markets over the following 12 months. However, we have the discretion to hold our position to the extent we believe the portfolio company is not being appropriately valued in the public markets or is adversely affected by market or industry cyclicality. Accordingly, we anticipate our typical investment horizon for portfolio investments will be 36 months; however, we may also pursue investments with a shorter expected investment horizon, where we believe the portfolio company may file for an IPO sooner than 12 months or has a registration statement filed at the time of our investment. In each case, we have the discretion to hold securities for a longer period. There can be no assurance that we will be able to achieve our targeted return on our investments in portfolio companies once they go public. The table below illustrates our targeted portfolio company investment horizon.
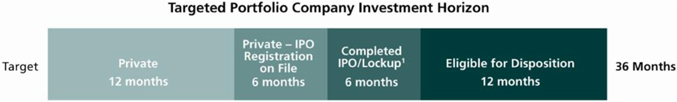
| 1 | Following an IPO, the shares we hold in our portfolio companies are generally subject to customary 180-day lockup restrictions. |
If the private companies in which we invest do not perform as planned, they may be unable to successfully complete an IPO within our typical targeted 18-month time frame, or at all, or may decide to abandon their plans for an IPO. In such cases, we will likely exceed our targeted 36-month holding period and the value of these investments may decline substantially if an IPO exit is no longer viable. We may also be forced to take other steps to exit these investments, including the use of the trading platforms of private secondary marketplaces that specialize in the trading of private company securities. Although we expect that some of our equity investments may trade on these trading platforms, the securities we hold will typically be subject to legal and other restrictions on resale that may prevent us from using these trading platforms or otherwise selling our securities, and will otherwise be less liquid than publicly traded securities. Furthermore, trading in private securities markets involves risks given the possible imbalance of information between such transaction participants. In addition, while some portfolio companies may trade on the trading platforms of private secondary marketplaces, we can provide no assurance that such a trading market will be available for particular companies, will continue or remain active, or that we will be able to sell our position in any portfolio company at the time we desire to do so and at the price we anticipate.
Since we do not seek to control any of our portfolio companies, or have a board seat, we generally do not expect to have input as to when, or if, our portfolio companies choose to pursue an IPO. In certain cases, our portfolio companies may choose to delay the pursuit of an IPO because of either adverse conditions in their particular industry or the IPO and equity markets generally. In other cases, our portfolio companies may be performing poorly or not achieving the milestones that an investment bank would require to underwrite an IPO. In such cases, our portfolio companies may need to raise additional capital, which may cause dilution to, or adversely affect, our ownership interests, or we may have to make additional follow-on investments pro rata with other investors in order to preserve our rights and preferences of our initial investment.
15
Table of Contents
In certain situations, our portfolio companies may abandon the pursuit of an IPO altogether, including because the completion of an IPO is no longer a realistic possibility or because another company seeks to acquire our portfolio company. If a portfolio company has abandoned plans to pursue an IPO, the portfolio company may consider a sale or merger with a strategic buyer as a possible alternative to an IPO or pursue a simultaneous “dual tracking” strategic sale and IPO exit strategy.
Portfolio Company Monitoring
As part of our portfolio company investment, we typically require information rights that give us access to the company’s quarterly and annual financial statements as well as the company’s annual budget. As part of our initial investment in each portfolio company, we obtained contractual rights to receive certain financial information from each portfolio company, including those where we initially acquired common stock. However, as of December 31, 2012, our information rights have been subsequently terminated for: (i) Solazyme and LifeLock in connection with the completion of their IPOs, and (ii) Livescribe in connection with the conversion of our preferred stock investments into common stock. However, we continue to have access to financial information for Solazyme and LifeLock from their periodic reports filed with the SEC. Although we do not have a control position through our ownership or board seats, we attempt to have dialogue, on at least a quarterly basis, with our private portfolio company management teams to review the company’s business prospects, financial results, and exit strategy plans. We monitor the financial trends of each portfolio company to assess the performance of individual companies as well as to evaluate overall portfolio quality and risk. We believe this is an important competitive advantage for us relative to those funds that do not have or require the same access to ongoing financial information that we insist upon. We also monitor our portfolio for compliance with the requirements for maintaining our status as a business development company under the 1940 Act and a RIC for tax purposes.
Since we will typically not be in a position to control the management, operation and strategic decision-making of the companies we invest in, a portfolio company may make business decisions with which we disagree, and the stockholders and management of such a portfolio company may take risks or otherwise act in ways that are adverse to our interests. In addition, other stockholders, such as venture capital and private equity sponsors that have substantial investments in our portfolio companies, may have interests that differ from that of the portfolio company or its minority stockholders, which may lead them to take actions that could materially and adversely affect the value of our investment in the portfolio company. Due to the lack of liquidity for the equity investments that we will typically hold in our portfolio companies, we may not be able to dispose of our investments in the event that we disagree with the actions of a portfolio company or its substantial stockholders, and may therefore suffer a decrease in the value of our investments.
We also use our ongoing discussions with our portfolio company management teams to monitor their continued commitment to completing an IPO and, when requested, to provide our insights on the current IPO market and what we believe are the key differentiators for successful IPOs.
We also offer significant managerial assistance to our portfolio companies. We expect that this managerial assistance will likely involve consulting and advice on the going public process and public capital markets. As a business development company, we are required to offer, and in some cases provide and be paid for, such managerial assistance.
Disposition of Investments in Publicly Traded Portfolio Companies
Our primary source of investment return will be generated from net capital gains realized on the disposition of our portfolio company investments, which typically will occur after a portfolio company completes an IPO. We are also typically prohibited from exiting investments in our publicly traded portfolio company until the expiration of the customary post-IPO lockup agreement. These agreements, which we are required to enter into as part of our initial investment, prohibit us and other significant existing investors from selling stock in the portfolio company or hedging such securities during the customary 180 days following an IPO. The market prices of our portfolio companies that have recently completed an IPO typically experience high volatility and are driven by such factors as overall market conditions, the industry conditions for the particular sector in which the portfolio company operates, the portfolio company’s performance, the relative size of the public float, and the potential selling activities of other pre-IPO investors and possibly management. Following the post-IPO lockup period, significant sales by other selling stockholders may result in a decrease in trading price, particularly if the stock has low trading volumes, which could result in significant market price volatility and a decline in the value of our investment. In such cases, the value of our investments may decline substantially or we may be forced to hold our positions for longer than we anticipated, or both.
For our portfolio company investments where the lockup period following the IPO has expired and the stock becomes freely tradable, we typically do not begin selling automatically upon expiration of the lockup period. We expect to sell our positions over a period of time, typically during the 12 months following the expiration of our lockup, although we may sell more rapidly or in one or more block transactions. Factors that we may consider include, but are not limited to, the following:
16
Table of Contents
| • | The target price determined by our investment adviser based on its business judgment and what it believes to be the portfolio company’s intrinsic value. |
| • | The application of public company multiples and our proprietary analysis to a variety of operating metrics for each portfolio company. The primary operating metrics that we typically consider are revenue, EBITDA and net income. |
| • | Other factors that may be adversely or favorably affecting a particular portfolio company’s stock price, including overall market conditions, industry cyclicality, or issues specific to the portfolio company. |
While we typically do not intend to purchase stock in a portfolio company’s IPO or in open market transactions thereafter, under certain circumstances, we may consider making additional investments in a publicly traded portfolio company in open market purchases, which will increase our position in the company. We typically will consider open market purchases of shares in our publicly traded portfolio companies as a means to bring our overall investment closer to our targeted 5% of our gross assets per portfolio company investment. In such cases, our initial private investments may have been limited due to the level of our gross assets at the time of the initial investment. However, we may be unable to make follow-on investments in our publicly traded portfolio companies as a result of certain regulatory restrictions on a business development company’s investments in publicly traded securities with market capitalizations in excess of $250 million. See “Regulation as a Business Development Company” below.
Because the portfolio company securities that we acquire are typically illiquid until an IPO or sale of the company, we generally cannot predict the regularity and time periods between dispositions of our portfolio company investments and the realizations of capital gains, if any, from such dispositions. Dispositions of our portfolio company investments are discretionary and based on our business judgment. Since we typically do not expect to generate current income from our portfolio company investments, our operating expenses will be financed from our capital base during periods of time between realizations of capital gains on our investments. In addition, if we are successful in disposing of a portfolio company investment, we intend to reinvest the principal amount of our investment in new portfolio company opportunities, with any gain that we may realize being distributed to our stockholders after we pay any incentive fees earned by our investment adviser and our operating expenses.
The trading platforms of private secondary marketplaces have also emerged as an alternative to traditional public equity exchanges to provide liquidity principally to the stockholders of venture capital-backed, private companies. While these trading platforms have more limited transaction volume than public exchanges, they may provide us with access to potential purchasers interested in privately acquiring our positions in our portfolio companies that are unable to complete an IPO within our targeted time frame.
Due to the perpetual nature of our corporate structure, we believe that we can be a patient investor in our portfolio companies allowing them flexibility to access IPO windows when the timing and pricing may be best for the company and us. In the event of a prolonged closure of the IPO markets, we can be flexible as our portfolio companies wait for a market recovery or seek alternative exist strategies. However, there may be situations where our portfolio companies will not perform as planned and thus may be unable to go public under any circumstances. There may also be situations where a specific industry or sector will no longer be attractive to IPO investors.
In such cases, we will consider whether the portfolio company has already passed, or is likely to exceed, our targeted 18-month IPO completion period. If we believe the portfolio company will not complete an IPO within this period, our investment adviser has the discretion to consider a number of alternative strategies including:
| • | Pursuing a negotiated sale of our interests to an existing investor; |
| • | Attempting to influence the portfolio company’s management to pursue a strategic merger or sale; |
| • | Leveraging our investment adviser’s experience in taking companies public and its insights on the trends affecting the IPO market to assist the portfolio company’s management in evaluating and executing an IPO led (or “bookrun”) by a middle-market underwriting firm; |
| • | Identifying potential third party investors interested in purchasing all or a portion of our interest; and |
| • | Accessing the trading platforms of private secondary marketplaces that have emerged as an alternative to traditional public equity exchanges to provide liquidity principally to the stockholders of venture capital-backed, private companies, to the extent that such a market may exist for the subject portfolio company. |
17
Table of Contents
Our ability to liquidate our investments under any of these strategies will be highly uncertain although we expect to have a greater chance of success if our investments contain structural protections. Nonetheless, depending on the circumstances, even if we are successful in liquidating an investment under these alternatives, we are not likely to achieve our targeted return and we may suffer a loss on our investment.
See “Risk Factors – The securities of our private portfolio companies are illiquid, and the inability of these portfolio companies to complete an IPO within our targeted time frame will extend the holding period of our investments, may adversely affect the value of these investments, and will delay the distribution of gains, if any.”
Competition
A large number of entities compete with us to make the types of equity investments that we target as part of our business strategy. We compete for such investments with a large number of venture capital funds, other equity and non-equity based investment funds, investment banks and other sources of financing, including traditional financial services companies such as commercial banks and specialty finance companies. Many of our competitors are substantially larger than us and have considerably greater financial, technical and marketing resources than we do. In addition, some of our competitors may require less information than we do and/or have higher risk tolerances or different risk assessments, which could allow them to consider a wider variety of investments and establish more relationships than we can. Furthermore, many of our competitors are not subject to the regulatory restrictions that the 1940 Act imposes on us as a business development company and, as a result, such companies may be more successful in completing their investments. There can be no assurance that the competitive pressures we face will not have a material adverse effect on our business, financial condition, and results of operations. Also, as a result of this competition, we may not be able to take advantage of attractive investment opportunities from time to time, and we can offer no assurance that we will be able to identify and make investments that are consistent with our investment objective.
Investment Advisory and Administrative Services Agreement
Organization of the Investment Adviser
Keating Investments is a Delaware limited liability company that is registered as an investment adviser under the Advisers Act and serves as our investment adviser. Timothy J. Keating is the principal owner and managing member of Keating Investments. Messrs. Keating, Rogers and Schweiger are Keating Investments’ principals and the members of its Investment Committee. Messrs. Keating, Rogers and Schweiger manage the day-to-day operations of our investment adviser and provide the services to us under the Investment Advisory and Administrative Services Agreement. Keating Investments may in the future provide similar investment advisory services to other entities in addition to us. In the event that Keating Investments provides investment advisory services to other entities, we expect that our management and our independent directors will attempt to resolve conflicts in a fair and equitable manner taking into account factors that would include the investment objective, amount of assets under management and available for investment in new portfolio companies, portfolio composition and return expectations of us and any other entity, and other factors deemed appropriate. However, in the event such conflicts do arise in the future, Keating Investments intends to allocate investment opportunities in a fair and equitable manner consistent with our investment objective and strategies and with the fiduciary duties owed to us so that we are not disadvantaged in relation to any other affiliate or client of Keating Investments. The principal address of Keating Investments is 5251 DTC Parkway, Suite 1100, Greenwood Village, Colorado 80111.
Management and Advisory Services
Subject to the overall supervision of our Board of Directors, Keating Investments manages our day-to-day operations and provides us with investment advisory services. Under the terms of the Investment Advisory and Administrative Services Agreement, as currently in effect, Keating Investments:
| • | Determines the composition of our portfolio, the nature and timing of the changes to our portfolio and the manner of implementing such changes; |
| • | Determines which securities we will purchase, retain or sell; |
| • | Identifies, evaluates and negotiates the structure of the investments we make; and |
| • | Closes, monitors and services the investments we make. |
Keating Investments’ services under the Investment Advisory and Administrative Services Agreement are not exclusive and it is free to furnish similar services to other entities so long as its services to us are not impaired. Although we are not aware of any current plans to do so, our investment adviser is not restricted from creating new investment vehicles subject to compliance with
18
Table of Contents
applicable law. Further, our investment adviser, its principals, investment professionals and the members of its Investment Committee may serve as investment advisers, officers, directors or principals of entities or investment funds that operate in the same or a related line of business as us and/or of investment funds managed by our affiliates.
We pay Keating Investments a fee for its investment advisory services under the Investment Advisory and Administrative Services Agreement consisting of two components – a base management fee and an incentive fee. The cost of both the base management fee payable to Keating Investments and any incentive fees earned by Keating Investments is ultimately borne by our common stockholders. Our officers do not receive any compensation directly from us. However, the principals and officers of the investment adviser who also serve as the Company’s officers receive compensation from, or may have financial interests in, the investment adviser, which may be funded by or economically related to the investment advisory fees paid by us to the investment adviser under to the Investment Advisory and Administrative Services Agreement.
The base management fee (the “Base Fee”) is calculated at an annual rate of 2% of our gross assets, where gross assets include any borrowings for investment purposes. We do not presently expect to use borrowed funds for the purpose of making portfolio investments. The Base Fee is payable monthly in arrears, and is calculated based on the value of our gross assets at the end of the most recently completed calendar quarter, and appropriately adjusted for any equity capital raises or repurchases during the current calendar quarter. The Base Fee for any partial month or quarter will be appropriately pro-rated.
The incentive fee is determined and payable in arrears as of the end of each calendar year and equals 20% of our realized capital gains, if any, on a cumulative basis from inception through the end of each calendar year, computed net of all realized capital losses and unrealized capital depreciation on a cumulative basis, less the aggregate amount of any previously paid incentive fees. For purposes of determining the incentive fee, realized capital gains, realized capital losses and unrealized capital depreciation are each determined without regard to the holding period for our investments and include both long-term (held more than 12 months) and short-term holdings.
We believe the investment advisory fees that we pay Keating Investments fairly compensate it for the specialized knowledge that its principals and investment professionals have in managing our specialized pool of private equity investments. Specifically, we believe our investment adviser has a superior origination platform and approach based on company-provided information and access to company management, a unique understanding of the IPO markets and the underwriting of risks associated with pre-IPO investing, and a disciplined portfolio monitoring process to evaluate our specific portfolio companies and ensure the integrity and reliability of our Board of Directors’ determination of the fair value of our portfolio company investments.
Administrative Services
Pursuant to the Investment Advisory and Administrative Services Agreement, Keating Investments also furnishes us with equipment and clerical, bookkeeping and record-keeping services, including responsibility for the financial records which we are required to maintain and preparing reports to our stockholders and reports filed with the SEC. In addition, Keating Investments assists us in monitoring our portfolio accounting and bookkeeping, managing portfolio collections and reporting, performing internal audit services, determining and publishing our net asset value, overseeing the preparation and filing of our tax returns and the printing and dissemination of reports to our stockholders, providing support for our risk management efforts and generally overseeing the payment of our expenses and the performance of administrative and professional services rendered to us by others.
We reimburse Keating Investments for our allocable portion of overhead and other expenses incurred by it in performing its administrative obligations under the Investment Advisory and Administrative Services Agreement, including our allocable portion of the compensation of our Chief Financial Officer and Chief Compliance Officer, and their respective staff. The allocation ratio with respect to compensation of our Chief Financial Officer and Chief Compliance Officer is dependent upon the amount of time each devotes to matters on behalf of us and Keating Investments, respectively. Allocated administrative expenses are payable to the investment adviser monthly in arrears. We also agreed to reimburse the investment adviser for separation payments due to our former Chief Financial Officer who resigned in November 2011. In consideration for certain separation services, the former Chief Financial Officer was paid a separation payment equal to $8,000 per month (prorated for any partial month) for the period November 16, 2011 through April 30, 2012.
Payment of our Expenses
Our primary operating expenses include the payment of: (i) investment advisory fees to our investment adviser, Keating Investments, (ii) our allocable portion of overhead and other expenses incurred by Keating Investments, as our administrator, in performing its administrative obligations under the Investment Advisory and Administrative Services Agreement, and (iii) other operating expenses which we have detailed below. Our investment advisory fee compensates our investment adviser for its work in identifying, evaluating, negotiating, closing, monitoring and servicing our investments. We bear all other expenses of our operations and transactions, including (without limitation):
19
Table of Contents
| • | costs of calculating our net asset value, including the cost of any third-party valuation services; |
| • | costs of effecting sales and repurchases of shares of our common stock and other securities; |
| • | fees payable to third parties relating to, or associated with, making investments, including fees and expenses associated with performing due diligence reviews of prospective investments; |
| • | costs related to organization and offerings; |
| • | transfer agent and custodial fees; |
| • | fees and expenses associated with marketing efforts; |
| • | federal and state registration fees; |
| • | any stock exchange listing fees; |
| • | applicable federal, state and local taxes; |
| • | independent directors’ fees and expenses; |
| • | brokerage commissions; |
| • | costs of proxy statements, stockholders’ reports and notices; |
| • | fidelity bond, directors and officers/errors and omissions liability insurance and other insurance premiums; |
| • | direct costs such as printing, mailing, and long distance telephone; |
| • | fees and expenses associated with independent audits and outside legal costs; |
| • | costs associated with our reporting and compliance obligations under the 1940 Act, Sarbanes-Oxley Act, and applicable federal and state securities laws; and |
| • | all other expenses incurred by either Keating Investments or us in connection with administering our business, including payments under the Investment Advisory and Administrative Services Agreement that will be based upon our allocable portion of overhead and other expenses incurred by Keating Investments in performing its obligations under the Investment Advisory and Administrative Services Agreement, including our allocable portion of the compensation of our Chief Financial Officer and Chief Compliance Officer, and their respective staff. |
All of these expenses are ultimately borne by our common stockholders.
Duration and Termination
Our amended and restated Investment Advisory and Administrative Services Agreement, which is presently in effect, was approved by our Board of Directors on April 17, 2009, and by our stockholders on May 14, 2009. On April 13, 2012, our Board of Directors (including the non-interested directors) renewed the current Investment Advisory and Administrative Services Agreement for an additional year. The current Investment Advisory and Administrative Services Agreement will remain in effect from year to year thereafter if approved annually by (i) the vote of our Board of Directors, or by the vote of a majority of our outstanding voting securities, and (ii) the vote of a majority of our directors who are not interested persons. An affirmative vote of the holders of a majority of our outstanding voting securities is also necessary in order to make material amendments to the current Investment Advisory and Administrative Services Agreement.
The Investment Advisory and Administrative Services Agreement will automatically terminate in the event of its assignment. As required by the 1940 Act, the Investment Advisory and Administrative Services Agreement provides that we may terminate the agreement without penalty upon 60 days written notice to Keating Investments. If Keating Investments wishes to voluntarily
20
Table of Contents
terminate the Investment Advisory and Administrative Services Agreement, it must give stockholders a minimum of 120 days notice prior to termination and must pay all expenses associated with its termination. The Investment Advisory and Administrative Services Agreement may also be terminated, without penalty, upon the vote of a majority of our outstanding voting securities. See “Risk Factors — Risks Relating to Our Business and Structure.”
In addition, should we or Keating Investments elect to terminate the Investment Advisory and Administrative Services Agreement, a new investment adviser may not be appointed without approval of a majority of our outstanding common stock, except in limited circumstances where a temporary adviser may be appointed without stockholder consent, consistent with the 1940 Act.
Board Approval of the Investment Advisory and Administrative Services Agreement
Our Board of Directors (including the independent directors) determined at a meeting held on April 13, 2012 to approve the renewal of the Investment Advisory and Administrative Services Agreement currently in effect. In its consideration of the renewal of the Investment Advisory and Administrative Services Agreement, our Board of Directors focused on information it had received relating to, among other things:
| • | The nature, quality and extent of the advisory and other services to be provided to us by Keating Investments; |
| • | Comparative data with respect to advisory fees or similar expenses paid by other business development companies with similar investment objective; |
| • | Our projected operating expenses and expense ratio compared to business development companies with similar investment objective; |
| • | Any existing and potential sources of indirect income to Keating Investments from their relationship with us and the profitability of those relationships, including through the Investment Advisory and Administrative Services Agreement; |
| • | Information about the services to be performed and the personnel performing such services under the Investment Advisory and Administrative Services Agreement; |
| • | The organizational capability and financial condition of Keating Investments and its affiliates; |
| • | Keating Investments’ practices regarding the selection and compensation of brokers that may execute our portfolio transactions and the brokers’ provision of brokerage and research services to Keating Investments; |
| • | The possibility of obtaining similar services from other third party service providers or through an internally managed structure; and |
| • | Any real or potential conflicts of interest. |
Based on the information reviewed and the discussions, our Board of Directors, including a majority of the non-interested directors, concluded that fees payable to the investment adviser pursuant to the Investment Advisory and Administrative Services Agreement were reasonable in relation to the services to be provided. Our Board of Directors did not assign relative weights to the above factors or the other factors considered by it. In addition, our Board of Directors did not reach any specific conclusion on each factor considered, but conducted an overall analysis of these factors. Individual members of our Board of Directors may have given different weights to different factors.
License Agreement
On July 28, 2008, we entered into a license agreement (“License Agreement”) with Keating Investments pursuant to which Keating Investments granted us a non-exclusive license to use the name “Keating.” Under the License Agreement, we have a right to use the Keating name and logo, for so long as Keating Investments or one of its affiliates remains our investment adviser. Other than with respect to this limited license, we have no legal right to the “Keating” name or logo. The License Agreement will remain in effect for so long as the Investment Advisory and Administrative Services Agreement with our investment adviser is in effect.
21
Table of Contents
Employees
Currently, we do not have any employees. The management of our investment portfolio will be the responsibility of our investment adviser, Keating Investments, and its Investment Committee, which currently consists of Messrs. Keating, Rogers and Schweiger. Keating Investments’ Investment Committee must unanimously approve each new investment that we make. The members of the Investment Committee will not be employed by us, and will receive no compensation from us in connection with their portfolio management activities. However, Messrs. Keating, Rogers and Schweiger, through their financial interests in, or management positions with, Keating Investments, will be entitled to a portion of any investment advisory fees paid by us to Keating Investments pursuant to the Investment Advisory and Administrative Services Agreement.
Material U.S. Federal Income Tax Considerations
From incorporation through December 31, 2009, we were treated as a corporation under the Code. Effective January 1, 2010, we elected to be treated for tax purposes as a regulated investment company, or RIC, under the Code. We intend to operate so as to qualify as a RIC and, as such, have made no provision for income taxes as of December 31, 2012 and 2011. However, our continued qualification as a RIC requires that we comply with certain requirements contained in Subchapter M of the Code that may affect our ability to pursue additional business opportunities or strategies that, if we were to determine we should pursue, could diminish the desirability of qualifying, or impede our ability to qualify, as a RIC. For example, a RIC must meet certain requirements, including source of income and asset diversification requirements (as described below) and distributing annually at least 90% of its investment company taxable income (the “Annual Distribution Requirement”).
As a RIC, we generally will not have to pay corporate-level federal income taxes on any investment company taxable income (which is generally our net ordinary income plus the excess, if any, of realized net short-term capital gains over realized net long-term capital losses) or any realized net capital gains (which is generally net realized long-term capital gains in excess of net realized short-term capital losses) that we distribute to our stockholders as dividends. We will be subject to United States federal income tax at the regular corporate rates on any investment company taxable income or capital gain not distributed (or deemed distributed) to our stockholders.
In order to qualify and continue to qualify as a RIC for federal income tax purposes and obtain the tax benefits accorded to a RIC, in addition to satisfying the Annual Distribution Requirement, we must, among other things:
| • | Have in effect at all times during each taxable year an election to be regulated as a business development company under the 1940 Act; |
| • | Derive in each taxable year at least 90% of our gross income from (i) dividends, interest, payments with respect to certain securities loans, gains from the sale of stock or other securities, or other income derived with respect to our business of investing in such stock or securities and (ii) net income derived from an interest in a “qualified publicly traded limited partnership” (the “90% Income Test”); and |
| • | Diversify our holdings so that at the end of each quarter of the taxable year: |
| • | at least 50% of the value of our assets consists of cash, cash equivalents, U.S. government securities, securities of other RICs, and other securities if such other securities of any one issuer do not represent more than 5% of the value of our assets or more than 10% of the outstanding voting securities of such issuer; and |
| • | no more than 25% of the value of our assets is invested in (i) securities (other than U.S. government securities or securities of other RICs) of one issuer, (ii) securities of two or more issuers that are controlled, as determined under applicable tax rules, by us and that are engaged in the same or similar or related trades or businesses, or (iii) securities of one or more “qualified publicly traded partnerships” (the “Diversification Tests”). |
Provided that we satisfy the Diversification Tests as of the close of any quarter, we will not fail the Diversification Tests as of the close of a subsequent quarter as a consequence of a discrepancy between the value of our assets and the requirements of the Diversification Tests that is attributable solely to fluctuations in the value of our assets. Rather, we will fail the Diversification Tests as of the end of a subsequent quarter only if such a discrepancy existed immediately after our acquisition of any asset and was wholly or partly the result of that acquisition. In addition, if we fail the Diversification Tests as of the end of any quarter, we will not lose our status as a RIC if we eliminate the discrepancy within thirty days of the end of such quarter and, if we eliminate the discrepancy within that thirty-day period, we will be treated as having satisfied the Diversification Tests as of the end of such quarter.
We satisfied the above RIC requirements during our 2010, 2011 and 2012 taxable years. Since we did not generate investment company taxable income in 2010, 2011 or 2012, we were not required to make any distributions to satisfy the Annual Distribution Requirement. We did not generate any realized net capital gains in 2010 or 2011 and, as a result, we were not required to make any distributions to satisfy the Excise Tax Avoidance Requirement, as described below. Because we distributed our net realized capital gains for the year ended December 31, 2012, no corporate-level federal income or excise taxes are due on such net realized capital gains and, as such, we have not made any provision for federal income or excise taxes as of December 31, 2012.
22
Table of Contents
Our Board of Directors currently maintains a distribution policy with the objective of distributing our net capital gains (which we define for this purpose as our realized capital gains in excess of realized capital losses during the year, without regard to the long-term or short-term character of such gains or losses), if any, after reduction for any incentive fees payable to our investment adviser, our operating expenses, and any other retained amounts. Since our portfolio company investments will typically not generate current income (i.e., dividends or interest income), we do not expect to receive net ordinary income from which we could make distributions to our stockholders. Our distributions will also depend on our financial condition, maintenance of our RIC status, income and excise tax planning, compliance with applicable business development company regulations and such other factors as our Board of Directors may deem relevant from time to time.
Assuming we continue to qualify as a RIC, our corporate-level federal income tax should be substantially reduced or eliminated to the extent that we distribute any investment company taxable income or realized net capital gains to our stockholders as dividends. However, we will pay corporate-level federal income tax on any amount of realized net capital gain that we elect to retain. In the event we retain some or all of our realized net capital gains, including amounts retained to pay incentive fees to our investment adviser or our operating expenses, we may designate the retained amount as a deemed distribution to stockholders. In such case, among other consequences, we will pay corporate-level tax on the retained amount, each U.S. stockholder will be required to include its share of the deemed distribution in income as if it had been actually distributed to the U.S. stockholder, and the U.S. stockholder will be entitled to claim a credit or refund equal to its allocable share of the corporate-level tax we pay on the retained realized net capital gain. The amount of the deemed distribution (net of such tax credit or refund) will be added to each U.S. stockholder’s cost basis for its common stock. In order to utilize the deemed distribution approach, we must provide written notice to our stockholders prior to the expiration of 60 days after the close of the relevant taxable year.
Distributions, or deemed distributions, of our net capital gains properly reported by us as “capital gain dividends” will be taxable to a U.S. stockholder as long-term capital gains, regardless of the U.S. stockholder’s holding period for his, her or its shares. In general, non-corporate U.S. stockholders are subject to a maximum federal income tax rate of 20% on their long-term capital gains. In addition, for taxable years beginning after December 31, 2012, individuals with income in excess of $200,000 ($250,000 in the case of married individuals filing jointly) are generally subject to an additional 3.8% tax on their net capital gains. Corporate U.S. stockholders currently are subject to federal income tax on net capital gain at the maximum 35% rate also applied to ordinary income.
As a RIC, we are also subject to a 4% nondeductible federal excise tax on certain undistributed income unless we distribute in a timely manner an amount at least equal to the sum of (i) 98% of our ordinary income for each calendar year, (ii) 98.2% of our capital gains in excess of capital losses for the one-year period ending December 31 in that calendar year, and (iii) any ordinary income and realized net capital gains for preceding years that were not distributed during such years (the “Excise Tax Avoidance Requirement”). We will not be subject to this excise tax on amounts on which we are required to pay corporate income tax (such as retained realized net capital gains which we designate as “undistributed capital gain” or a deemed distribution). We currently intend to make sufficient distributions (including deemed distributions of retained realized net capital gains) each taxable year to avoid the payment of this excise tax. We intend to elect to calculate excise taxes related to any net capital gains on a calendar year basis on our 2012 tax returns.
The following simplified examples illustrate the tax treatment under Subchapter M of the Code for us and our non-corporate U.S. stockholders with regard to three possible distribution alternatives, assuming we realize, in 2012, a net capital gain of $1.00 per share, consisting entirely of sales of non-real property assets held for more than 12 months.
Under Alternative A: 100% of net capital gain declared as a cash dividend and distributed to stockholders:
| 1. | No federal income taxation at the Company level. |
| 2. | Taxable stockholders receive a $1.00 per share dividend and pay federal income tax at a rate not in excess of 20% or $0.20 per share, retaining $0.80 per share. |
| 3. | Non-taxable stockholders that file a federal tax return receive a $1.00 per share dividend and pay no federal income tax, retaining $1.00 per share. |
23
Table of Contents
Under Alternative B: 100% of net capital gain retained by the Company and designated as “undistributed capital gain” or deemed dividend:
| 1. | The Company pays a corporate-level federal income tax of 35% on the undistributed gain or $0.35 per share and retains 65% of the gain or $0.65 per share. |
| 2. | Taxable stockholders increase their cost basis in their stock by $0.65 per share. They are liable for federal income tax at a rate not in excess of 20% on 100% of the undistributed gain of $1.00 per share or $0.20 per share in tax. Offsetting this tax, stockholders receive a tax credit equal to the $0.35 per share tax paid by us, which offsets the $0.20 per share tax liability, resulting in an excess tax credit of $0.15 per share for each such stockholder. |
| 3. | Non-taxable stockholders that file a federal income tax return receive a tax refund equal to $0.35 per share. |
Under Alternative C: 100% of net capital gain retained by the Company, with no designated undistributed capital gain or deemed dividend:
| 1. | The Company pays a corporate-level federal income tax of 35% on the retained gain or $0.35 per share. |
| 2. | There is no tax consequence at the stockholder level. |
We are authorized to borrow funds and to sell assets in order to satisfy the Annual Distribution Requirement and the Excise Tax Avoidance Requirement (collectively, the “Distribution Requirements”). Although we are permitted to borrow funds under the 1940 Act and could use these borrowed funds to make distributions to satisfy the Distribution Requirements, we currently do not intend to borrow money for this purpose. Further, under the 1940 Act, we are not permitted to make distributions to our stockholders while our debt obligations and other senior securities are outstanding unless certain “asset coverage” tests are met. Moreover, our ability to dispose of assets to meet the Distribution Requirements may be limited by: (i) the illiquid nature of our portfolio, or (ii) other requirements relating to our status as a RIC, including the Diversification Tests. If we dispose of assets in order to meet the Distribution Requirements, we may make such dispositions at times that, from an investment standpoint, are not advantageous.
A RIC is limited in its ability to deduct expenses in excess of its investment company taxable income. If our expenses in a given year exceed investment company taxable income (which is likely to occur since our operating expenses are expected to exceed the amount of interest or dividend income we receive on our portfolio investments), we would experience a net operating loss for that year. However, a RIC is not permitted to carry forward net operating losses to subsequent years. In addition, expenses including any incentive fees paid to our investment adviser can be used only to offset investment company taxable income, not net capital gain. Due to these limits on the deductibility of expenses, we may for tax purposes have aggregate taxable income for several years that we are required to distribute and that is taxable to our stockholders even if such income is greater than the aggregate net income we actually earned during those years. Such required distributions may be made from our cash assets or by liquidation of investments, if necessary. We may realize gains or losses from such liquidations. In the event we realize net capital gains from such transactions, our stockholders may receive a larger capital gain distribution than they would have received in the absence of such transactions.
If we are unable to continue to qualify for treatment as a RIC, we would be subject to tax on all of our taxable income at regular corporate rates. We would not be able to deduct distributions to stockholders, nor would distributions be required to be made. Such distributions would be taxable to our stockholders and, provided certain holding period and other requirements were met, could qualify for treatment as “qualified dividend income” eligible for the 20% maximum rate for non-corporate stockholders to the extent of our current or accumulated earnings and profits. Subject to certain limitations under the Code, corporate distributees would be eligible for the dividends received deduction. Distributions in excess of our current and accumulated earnings and profits would be treated first as a return of capital to the extent of the stockholder’s tax basis, and any remaining distributions would be treated as a capital gain.
If we fail to qualify as a RIC in any taxable year, we would be required to satisfy the RIC qualification requirements in order to requalify as a RIC and dispose of any earnings and profits from any year in which we failed to qualify as a RIC. Subject to a limited exception applicable to RICs that qualified as such under Subchapter M of the Code for at least one year prior to disqualification and that requalify as a RIC no later than the second year following the nonqualifying year, we could be subject to tax on any unrealized net built-in gains in the assets held by us during the period in which we failed to qualify as a RIC that were recognized within the subsequent 10 years, unless we made a special election to pay corporate-level tax on such built-in gain at the time of our requalification as a RIC. If we fail to satisfy the 90% Income Test or the Diversification Test described above, however, we may be able to avoid losing our status as a RIC by timely providing notice of such failure to the IRS, curing such failure and possibly paying an additional tax.
24
Table of Contents
Regulation as a Business Development Company
The following discussion is a general summary of the material prohibitions and descriptions governing business development companies. It does not purport to be a complete description of all of the laws and regulations affecting business development companies.
A business development company primarily focuses on investing in or lending to private companies and making significant managerial assistance available to them. A business development company provides stockholders with the ability to retain the liquidity of a publicly traded stock, while sharing in the possible benefits of investing in emerging growth, expansion stage or established stage companies. The 1940 Act contains prohibitions and restrictions relating to transactions between business development companies and their directors and officers and principal underwriters and certain other related persons and requires that a majority of the directors be persons other than “interested persons,” as that term is defined in the 1940 Act. In addition, the 1940 Act provides that we may not change the nature of our business so as to cease to be, or to withdraw our election as, a business development company unless approved by a majority of our outstanding voting securities. A majority of the outstanding voting securities of a company is defined under the 1940 Act as the lesser of: (i) 67% or more of such company’s shares present at a meeting if more than 50% of the outstanding shares of such company are present or represented by proxy, or (ii) more than 50% of the outstanding shares of such company.
Qualifying Assets
Under the 1940 Act, a business development company may not acquire any asset other than assets of the type listed in Section 55(a) of the 1940 Act, which are referred to here as “qualifying assets,” unless, at the time the acquisition is made, qualifying assets represent at least 70% of the company’s total assets (the “70% test”). The principal categories of qualifying assets relevant to our business are any of the following:
| (1) | Securities purchased in transactions not involving any public offering from the issuer of such securities, which issuer (subject to certain limited exceptions) is an eligible portfolio company, or from any person who is, or has been during the preceding 13 months, an affiliated person of an eligible portfolio company, or from any other person, subject to such rules as may be prescribed by the SEC. An eligible portfolio company is defined in the 1940 Act as any issuer which: |
| (a) | is organized under the laws of, and has its principal place of business in, the United States; |
| (b) | is not an investment company (other than a small business investment company wholly owned by the business development company) or a company that would be an investment company but for certain exclusions under the 1940 Act; and |
| (c) | Satisfies any of the following: |
| (i) | does not have any class of securities that is traded on a national securities exchange; |
| (ii) | has a class of securities listed on a national securities exchange, but has an aggregate market value of outstanding voting and non-voting common equity of less than $250 million; |
| (iii) | is controlled by a business development company or group of companies including a business development company and the business development company has an affiliated person who is a director of the eligible portfolio company; or |
| (iv) | is a small and solvent company having gross assets of not more than $4.0 million and capital and surplus of not less than $2.0 million. |
| (2) | Securities of any eligible portfolio company that we control. |
| (3) | Securities purchased in a private transaction from a U.S. issuer that is not an investment company or from an affiliated person of the issuer, or in transactions incident thereto, if the issuer is in bankruptcy and subject to reorganization or if the issuer, immediately prior to the purchase of its securities was unable to meet its obligations as they came due without material assistance other than conventional lending or financing arrangements. |
| (4) | Securities of an eligible portfolio company purchased from any person in a private transaction if there is no ready market for such securities and we already own 60% of the outstanding equity of the eligible portfolio company. |
| (5) | Securities received in exchange for or distributed on or with respect to securities described in (1) through (4) above, or pursuant to the exercise of warrants or rights relating to such securities. |
25
Table of Contents
| (6) | Cash, cash equivalents, certificates of deposit, U.S. Government securities or high-quality debt securities maturing in one year or less from the time of investment. |
Control, as defined by the 1940 Act, is presumed to exist where a business development company beneficially owns more than 25% of the outstanding voting securities of the portfolio company.
If less than 70% of our total assets are comprised of qualifying assets, we would generally not be permitted to acquire any additional non-qualifying assets, until such time as 70% of our then current total assets were comprised of qualifying assets. We would not be required, however, to dispose of any non-qualifying assets in such circumstances. As of December 31, 2012, we believe that all of our portfolio company investments constituted qualifying investments under Section 55(a) of the 1940 Act, with the exception of 100,000 shares of Solazyme, Inc. common stock acquired in open market transactions with a cost and value of $1,080,759 and $786,000, respectively, which represented approximately 1.5% and 1.1% of our total assets.
We do not intend to acquire securities issued by any investment company that exceed the limits imposed by the 1940 Act. Under these limits, we generally cannot acquire more than 3% of the voting stock of any investment company (as defined in the 1940 Act), invest more than 5% of the value of our gross assets in the securities of one such investment company or invest more than 10% of the value of our gross assets in the securities of such investment companies in the aggregate. With regard to that portion of our portfolio invested in securities issued by investment companies, it should be noted that such investments might subject our stockholders to additional expenses.
In addition, a business development company must have been organized and have its principal place of business in the United States and must be operated for the purpose of making investments in the types of securities described in (1), (2) or (3) above.
Significant Managerial Assistance
In general, in order to count portfolio securities as qualifying assets for the purpose of the 70% test, we must either control the issuer of the securities or must offer to make available to the issuer of the securities (other than small and solvent companies described above) significant managerial assistance; except that, where we purchase such securities in conjunction with one or more other persons acting together, one of the other persons in the group may make available such managerial assistance. Making available managerial assistance means, among other things, any arrangement whereby the business development company, through its directors, officers or employees, offers to provide, and, if requested to, provides significant guidance and counsel concerning the management, operations or business objectives and policies of a portfolio company. We expect that any managerial assistance we provide to our portfolio companies will likely involve consulting and advice on the going public process and public capital markets.
Senior Securities
We are permitted, under specified conditions, to issue multiple classes of debt and one class of stock senior to our common stock if our asset coverage, as defined in the 1940 Act, is at least equal to 200% immediately after each such issuance. In addition, while any senior securities remain outstanding, we must make provisions to prohibit any distribution to our stockholders or the repurchase of such securities or shares unless we meet the applicable asset coverage ratios at the time of the distribution or repurchase. We may also borrow amounts up to 5% of the value of our gross assets for temporary or emergency purposes without regard to asset coverage.
We do not intend to borrow funds or issue senior securities, including preferred stock, in the foreseeable future to finance the purchase of our investments in portfolio companies, but we have the discretion to do so. However, we will not borrow funds or issue senior securities, including preferred stock, to finance the purchase of our investment in portfolio companies for at least one year from the date of the completion of any equity offering. In the event we do borrow funds to make investments, we are exposed to the risks of leverage, which may be considered a speculative investment technique. Borrowings, also known as leverage, magnify the potential for gain and loss on amounts invested and therefore increase the risks associated with investing in our securities. In addition, the costs associated with our borrowings, including any increase in the management fee payable to our investment adviser will be borne by our common stockholders.
Proxy Voting Policies and Procedures
We vote proxies relating to our portfolio securities in the best interest of our stockholders. We review on a case-by-case basis each proposal submitted to a stockholder vote to determine its impact on the portfolio securities held by us. Although we generally vote against proposals that may have a negative impact on our portfolio securities, we may vote for such a proposal if there exists compelling long-term reasons to do so.
26
Table of Contents
Our proxy voting decisions are made by our investment adviser’s principals. To ensure that our vote is not the product of a conflict of interest, we require that: (i) anyone involved in the decision making process disclose to our Chief Compliance Officer any potential conflict that he is aware of and any contact that he has had with any interested party regarding a proxy vote; and (ii) employees involved in the decision making process or vote administration are prohibited from revealing how we intend to vote on a proposal in order to reduce any attempted influence from interested parties.
Stockholders may obtain information regarding how we voted proxies with respect to our portfolio securities by making a written request for proxy voting information to: Chief Compliance Officer, Keating Capital, Inc., 5251 DTC Parkway, Suite 1100, Greenwood Village, Colorado 80111.
Temporary Investments
Pending investment in other types of “qualifying assets,” as described above, our investments may consist of cash, cash equivalents, certificates of deposit, U.S. government securities or high-quality debt securities maturing in one year or less. The management fee payable to our investment adviser will not be reduced while our assets are invested in such temporary investments.
Code of Ethics
We and our investment adviser have each adopted a code of ethics pursuant to Rule 17j-1 under the 1940 Act and Rule 204A-1 under the Advisers Act, respectively, that establishes procedures for personal investments and restricts certain transactions by our personnel. Our codes of ethics generally do not permit investments by our employees in securities that may be purchased or held by us. You may read and copy these codes of ethics at the SEC’s Public Reference Room in Washington, DC. You may obtain information on the operation of the Public Reference Room by calling the SEC at (202) 551-8090. In addition, each code of ethics is available on the SEC’s website at www.sec.gov. You may also obtain copies of the codes of ethics, after paying a duplicating fee, by electronic request at the following Email address: publicinfo@sec.gov, or by writing the SEC’s Public Reference Section, 100 F Street, N.E., Washington, DC 20549. You may also obtain a copy of our code of ethics on our website at www.keatingcapital.com.
Capital Structure
We are not generally able to issue and sell our common stock at a price below net asset value per share. We may, however, sell our common stock, at a price below the current net asset value of the common stock, or sell warrants, options or rights to acquire such common stock, at a price below the current net asset value of the common stock if our Board of Directors determines that such sale is in the best interests of the Company and our stockholders have approved the practice of making such sales.
Compliance Policies and Procedures
We and our investment adviser have adopted and implemented written policies and procedures reasonably designed to detect and prevent violation of the federal securities laws and are required to review these compliance policies and procedures annually for their adequacy and the effectiveness of their implementation and designate a Chief Compliance Officer to be responsible for administering the policies and procedures. Frederic M. Schweiger serves as our Chief Compliance Officer.
Sarbanes-Oxley Act
The Sarbanes-Oxley Act imposes a wide variety of regulatory requirements on publicly-held companies and their insiders. Many of these requirements affect us. For example:
| • | Pursuant to Rule 13a-14 of the Exchange Act, our Chief Executive Officer and Chief Financial Officer must certify the accuracy of the financial statements contained in our periodic reports; |
| • | Pursuant to Item 307 of Regulation S-K, our periodic reports must disclose our conclusions about the effectiveness of our disclosure controls and procedures; |
| • | Pursuant to Rule 13a-15 of the Exchange Act, our management must prepare an annual report regarding its assessment of our internal controls over financial reporting and, once our public float exceeds $75 million, must obtain an audit of the effectiveness of internal controls over financial reporting performed by our independent registered public accounting firm; |
| • | Pursuant to Item 308 of Regulation S-K and Rule 13a-15 of the Exchange Act, our periodic reports must disclose whether there were significant changes in our internal controls over financial reporting or in other factors that could significantly affect these controls subsequent to the date of their evaluation, including any corrective actions with regard to significant deficiencies and material weaknesses; and |
27
Table of Contents
| • | Pursuant to Section 404 of the Sarbanes-Oxley Act and Rule 13a-15 of the Exchange Act, we are required to include in our annual report on Form 10-K a report from our management on internal controls over financial reporting, including a statement that our management is responsible for establishing and maintaining adequate internal control over financial reporting as well as our management’s assessment of the effectiveness of our internal control over financial reporting. |
A reporting company that is a non-accelerated filer (with a public float below $75 million as of June 30 of the previous year) is exempt from the requirement to obtain an audit of the effectiveness of internal controls over financial reporting performed by their auditors. Accordingly, until such time as we have a public float in excess of $75 million, our auditors will not need to report on our management’s assessment of our internal control over financial reporting. However, we will be required to assess the effectiveness of our internal controls over financial reporting each year.
The Sarbanes-Oxley Act requires us to review our current policies and procedures to determine whether we comply with the Sarbanes-Oxley Act and the regulations promulgated thereunder. We will continue to monitor our compliance with all regulations that are adopted under the Sarbanes-Oxley Act and will take actions necessary to ensure that we are in compliance therewith.
Privacy Principles
We are committed to maintaining the privacy of our stockholders and to safeguarding their non-public personal information. The following information is provided to help you understand what personal information we collect, how we protect that information and why, in certain cases, we may share information with select other parties.
Generally, we do not receive any non-public personal information relating to our stockholders, although certain non-public personal information of our stockholders may become available to us. We do not disclose any non-public personal information about our stockholders or former stockholders to anyone, except as permitted by law or as is necessary in order to service stockholder accounts (for example, to a transfer agent or third party administrator).
We restrict access to non-public personal information about our stockholders to employees of our investment adviser and its affiliates with a legitimate business need for the information. We will maintain physical, electronic and procedural safeguards designed to protect the non-public personal information of our stockholders.
Other
We may also be prohibited under the 1940 Act from knowingly participating in certain transactions with our affiliates without the prior approval of our Board of Directors who are not interested persons and, in some cases, prior approval by the SEC.
We maintain a directors and officers liability insurance policy covering our directors and officers of the Company, insuring us against loss that we may be required or permitted to pay as indemnities of our directors and officers, and insuring us for certain securities claims. We also maintain an additional policy providing for excess coverage in the case of non-indemnifiable claims, covering our directors and officers. The coverages under these polices in certain cases extend to the officers, managers and employees of the investment adviser, and to the investment adviser’s Investment Committee. On November 4, 2011, we and the investment adviser entered into a joint liability insurance agreement, which was approved by our non-interested directors, that allocates the premium cost of the directors and officers liability insurance policy and the excess coverage policy between us and the investment adviser and provides for the allocation of any deductibles and losses in excess of applicable insurance limits. For the directors and officers liability insurance policy covering the policy year ending August 28, 2013, the joint liability insurance agreement specifies that 10% of the total premium under this policy be allocated to the investment adviser. None of the premium under the excess coverage policy is allocated to the investment adviser.
We expect to be periodically examined by the SEC for compliance with the 1940 Act.
We are required to provide and maintain a bond issued by a reputable fidelity insurance company to protect us against larceny and embezzlement. Furthermore, as a business development company, we are prohibited from protecting any director or officer against any liability to us or our stockholders arising from willful misfeasance, bad faith, gross negligence or reckless disregard of the duties involved in the conduct of such person’s office.
28
Table of Contents
Brokerage Allocations and Other Practices
Since we will generally acquire our investments in privately negotiated transactions, we will infrequently use brokers in the normal course of our investing activities. However, we do intend to dispose of our publicly traded securities brokers. Subject to policies established by our Board of Directors, our investment adviser is primarily responsible for the execution and sale of the publicly traded securities portion of our portfolio transactions and the allocation of brokerage commissions. The investment adviser does not execute sales of our publicly held securities through any particular broker or dealer, but seeks to obtain the best net results for us, taking into account such factors as price (including the applicable brokerage commission or dealer spread), size of order, difficulty of execution, and operational facilities of the firm and the firm’s risk and skill in positioning blocks of securities. While our investment adviser will generally seek reasonably competitive trade execution costs, we will not necessarily pay the lowest spread or commission available. Subject to applicable legal requirements, our investment adviser may select a broker based partly upon brokerage or research services provided to our investment adviser and to us and any other clients. In return for such services, we may pay a higher commission than other brokers would charge if the investment adviser, in accordance with Section 28(e) under the Exchange Act, determines in good faith that such commission is reasonable in relation to the services provided.
Available Information
We are required to file with or submit to the SEC annual, quarterly and current reports, proxy statements and other information meeting the informational requirements of the Exchange Act. You may inspect and copy these reports, proxy statements and other information, as well as related exhibits and schedules, at the Public Reference Room of the SEC at 100 F Street, N.E., Washington, DC 20549. You may obtain information on the operation of the Public Reference Room by calling the SEC at 1-800-SEC-0330. The SEC maintains an Internet site that contains reports, proxy and information statements and other information filed electronically by us with the SEC, which are available on the SEC’s website at www.sec.gov. Copies of these reports, proxy and information statements and other information may be obtained, after paying a duplicating fee, by electronic request at the following e-mail address: publicinfo@sec.gov, or by writing the SEC’s Public Reference Section, 100 F Street, N.E., Washington, DC 20549.
You may also obtain a copy of these reports, proxy and information statements and other information on our website at www.keatingcapital.com. We make available free of charge on our website these reports, proxy and information statements and other information as soon as reasonably practicable after we electronically file such material with, or furnish it to, the SEC. Information contained on our website is not incorporated by reference into this annual report on Form 10-K and you should not consider information contained on our website to be part of this annual report on Form 10-K.
| Item 1A. | Risk Factors |
An investment in our securities involves a number of significant risks. In addition to the other information contained in this annual report on Form 10-K, you should consider carefully the following information before making an investment in our common stock. Although the risks described below represent our material risks, they are not the only risks we face. Additional risks and uncertainties not presently known to us might also impair our operations and performance. If any of the following events occur, our business, financial condition and results of operations could be materially and adversely affected. In such case, our net asset value and the trading price of our common stock could decline, and you may lose all or part of your investment in our common stock.
Risks Related to Our Portfolio Company Investments
Our investments in the later stage, private, pre-IPO companies that we target may be extremely risky, and you could lose all or part of your investment in our common stock.
Investments in the later stage, private, pre-IPO companies that we target involve a number of significant risks, including:
| • | They typically have limited operating histories, narrower, less established product lines and smaller market shares than larger businesses, which tend to render them more vulnerable to competitors’ actions, market conditions and consumer sentiment in respect of their products or services, as well as general economic downturns. Substantially all of our portfolio companies may experience operating losses, which may be substantial, and there can be no assurance when or if such companies will operate at a profit. |
| • | They may have limited financial resources and may be unable to meet their obligations under their existing credit facilities (to the extent that such facilities exist), which may lead to equity financings, possibly at discounted valuations, in which we could be substantially diluted if we do not or cannot participate, bankruptcy or liquidation and the reduction or loss of our equity investment. The companies in which we invest may have substantial debt loads and, in such cases, our equity investments would typically be last in line behind any creditors in a bankruptcy or liquidation. |
29
Table of Contents
| • | At the time of our investment, there is generally little publicly available information about these businesses since they are primarily privately owned; therefore, although our investment adviser’s representatives will perform due diligence investigations on these portfolio companies, their operations and their prospects, we may not learn all of the material information we need to know regarding these businesses. At the time of our investment, we may only have access to the portfolio company’s actual financial results as of and for the most recent quarter end or, in certain cases, the quarter end preceding the most recent quarter end. There can be no assurance that the information that we do obtain with respect to any investment is reliable. |
| • | They are more likely to depend on the management talents and efforts of a small group of persons; therefore, the death, disability, resignation or termination of one or more of these persons could have a material adverse impact on our portfolio company and, in turn, on us. |
| • | They generally have less predictable operating results, may from time to time be parties to litigation, may be engaged in rapidly changing businesses with products subject to a substantial risk of obsolescence, and may require substantial additional capital to support their operations, finance expansion or maintain their competitive position. |
| • | Continued global economic uncertainty could also result in investors becoming more risk-averse, which in turn could reduce the amount of growth capital available to our portfolio companies from both existing and new investors, could adversely affect their operating performance, and could delay liquidity paths (for example, IPO or strategic sale) for our portfolio companies. |
A portfolio company’s failure to satisfy financial or operating covenants imposed lenders could lead to defaults and, potentially, termination of its loans and foreclosure on its assets, which could trigger cross-defaults under other agreements and jeopardize our equity investment in such portfolio company. We may incur expenses to the extent necessary to seek recovery of our equity investment or to negotiate new terms with a financially distressed portfolio company.
The securities of our private portfolio companies are illiquid, and the inability of these portfolio companies to complete an IPO within our targeted time frame will extend the holding period of our investments, may adversely affect the value of these investments, and will delay the distribution of gains, if any.
The IPO market continues to be volatile with IPO “windows,” or the periods of days or weeks in which new IPOs will be launched, being short and unpredictable even for the most qualified companies. A lack of IPO opportunities for venture capital-backed companies could lead to companies staying longer in our portfolio as private entities still requiring funding. This situation may adversely affect the amount of available venture capital funding to late-stage companies that cannot complete an IPO. Such stagnation could dampen returns or could lead to unrealized depreciation and realized losses as some companies run short of cash and have to accept lower valuations in private fundings or are not able to access additional capital at all. A lack of IPO opportunities for venture capital-backed companies may also cause some venture capital firms to change their strategies, leading some of them to reduce funding of their portfolio companies and making it more difficult for such companies to access capital. This might result in unrealized depreciation and realized losses in such companies by other investment funds, like us, who are co-investors in such companies. There can be no assurance that we will be able to achieve our targeted return on our portfolio company investments if and when they go public.
The equity securities we acquire in a private company are generally subject to contractual transfer limitations imposed on the company’s stockholders as well as other contractual obligations, such as rights of first refusal and co-sale rights. These obligations generally expire only upon an IPO by the company. As a result, prior to an IPO, our ability to liquidate our private portfolio company positions may be constrained. Transfer restrictions could limit our ability to liquidate our positions in these securities if we are unable to find buyers acceptable to our portfolio companies, or where applicable, their stockholders. Such buyers may not be willing to purchase our investments at adequate prices or in volumes sufficient to liquidate our position, and even where they are willing, other stockholders could exercise their co-sale rights to participate in the sale, thereby reducing the number of shares available to sell by us. Furthermore, prospective buyers may be deterred from entering into purchase transactions with us due to the delay and uncertainty that these transfer and other limitations create.
If the private companies in which we invest do not perform as planned, they may be unable to successfully complete an IPO within our targeted 18-month time frame, or at all, or may decide to abandon their plans for an IPO. In such cases, we will likely exceed our targeted 36-month holding period and the value of these investments may decline substantially if an IPO exit is no longer viable. We may also be forced to take other steps to exit these investments, including the use of the trading platforms of private secondary marketplaces that specialize in the trading of private company securities. Although we expect that some of our equity investments will trade on these platforms, the securities we hold will typically be subject to legal and other restrictions on resale that may prevent us from using these platforms or otherwise selling our securities, and will otherwise be less liquid than publicly traded securities. Furthermore, trading in private securities markets involves risks given the possible imbalance of information between such
30
Table of Contents
transaction participants. In addition, while some portfolio companies may trade on the trading platforms of private secondary marketplaces, we can provide no assurance that such a trading market will be available for particular companies, will continue or remain active, or that we will be able to sell our position in any portfolio company at the time we desire to do so and at the price we anticipate. The prices of securities on private secondary marketplaces may be subject to irregular trading activity, wide bid/ask spreads and extended trade settlement periods, which may cause an inability for us to realize full value on our investment. In addition, wide swings in market prices, which are typical of irregularly traded securities, could cause significant and unexpected declines in the value of our portfolio investments. Further, prices in private secondary marketplaces, where limited information is available, may not accurately reflect the true value of a portfolio company, and may in certain cases understate a portfolio company’s actual value, which may cause us to realize future capital losses on our investment in that portfolio company.
The illiquidity of our private portfolio company investments, including those that are traded on the trading platforms of private secondary marketplaces, may make it difficult for us to sell such investments if the need arises. Also, if we are required to liquidate all or a portion of our portfolio quickly, we may realize significantly less than the value at which we have previously recorded our investments. We will have no limitation on the portion of our portfolio that may be invested in illiquid securities, and we anticipate that all or a substantial portion of our portfolio may be invested in such illiquid securities at all times. Due to the inherent uncertainty in determining the fair value of investments that do not have a readily available market value, the fair value of our investments determined in good faith by our Board may differ significantly from the value that would have been used had a ready market existed for such investments, and the differences could be material.
In addition, even if a portfolio company completes an IPO, we will typically not be able to sell our position until the post-IPO lockup expires, which generally means we will be required to hold our investments for at least 24 months before we are able to begin selling. As a result of lockup restrictions, the market price of securities that we hold may decline substantially before we are able to sell them following an IPO.
There are significant potential risks associated with investing in venture capital-backed, later stage, pre-IPO companies with complex capital structures.
We invest primarily in venture capital-backed, later stage, pre-IPO companies, primarily through direct investments in these companies and, to a lesser extent, through private secondary transactions which we negotiate with selling stockholders in these portfolio companies. Such private companies frequently have much more complex capital structures than traditional publicly-traded companies, and may have multiple classes of common and preferred equity securities with differing rights, including with respect to voting, dividends, redemptions, liquidation, and conversion rights. Although we seek to invest in the most senior class of securities or obtain other structural protections, the seniority and protections provided in these types of investments may be diminished if the portfolio company issues more senior securities in a subsequent financing round. Our investment adviser typically requires information on the private company’s capital structure as part of its due diligence process. Although we believe that our investment adviser’s principals have extensive experience evaluating and investing in private companies with such complex capital structures, there can be no assurance that we will be able to adequately evaluate the relative risks and benefits of investing in a particular class of a portfolio company’s equity securities. Any failure on our part to properly evaluate the relative rights and value of a class of securities in which we invest could cause us to lose part or all of our investment, which in turn could have a material and adverse effect on our net asset value and results of operations.
There are significant potential risks associated with investing in private secondary transactions which we negotiate with selling stockholders in portfolio companies that meet our investment criteria.
We may acquire equity investments in privately-held companies that meet our investment criteria directly from current or former management and early stage investors that are interested in selling privately. We may also acquire shares in these private secondary transactions from current or former non-management employees where the company or its management is coordinating the transaction process. We will typically source these negotiated transactions from investment banks or through our other relationships. We intend to focus on transactions where we will have access to management, as well as financial data and other information about the private company. This management access is important to assure the flow of the company’s financial and other information to us both before and after our investment. Although we do not intend to place bids for positions listed on the trading platforms of private secondary marketplaces, to the extent we did so, our access to information regarding the target company would be limited. In any case, there can be no assurance that our investment adviser will be able to acquire adequate information on which to make its investment decision with respect to any private secondary purchases, or that the information it is able to obtain is current, accurate or complete. Any failure to obtain full and complete information regarding the portfolio companies with respect to which we invest through private secondary transactions could cause us to lose part or all of our investment in such companies, which would have a material and adverse effect on our net asset value and results of operations.
31
Table of Contents
Investments in private companies through private secondary transactions also entail additional legal and regulatory risks which expose participants to the risk of liability due to the imbalance of information among participants and participant qualification and other transactional requirements applicable to private securities transactions, the non-compliance with which could result in rescission rights and monetary and other sanctions. In addition, private block sales of shares may be restricted by contractual transfer restrictions and company policies, which may impose strict limits on transfer, including veto rights or rights of first refusal in favor of the company and other stockholders. As a result, we may be unable to complete a purchase transaction if the subject company or its stockholders chooses to exercise a veto right or right of first refusal.
We may not realize gains from our equity investments.
Our investment objective is to maximize capital appreciation, which we seek to accomplish by making investments in the equity securities of later stage, typically venture capital-backed, pre-IPO companies. Unlike most business development companies that are focused on investing in debt securities that generate current yield for their stockholders, our portfolio companies typically do not pay dividends and, as a result, we are unable to pass this source of current income through to our stockholders. Any gains that we may realize, and the source of distributions to our stockholders, will come solely from the disposition of the equity interests we acquire in our portfolio companies. These equity interests may not appreciate in value and, in fact, may decline in value.
In addition, the private company securities we acquire are often subject to certain provisions, which could permit other stockholders, under certain circumstances, to force us to liquidate our position in a subject company at a specified price, which could be inadequate or undesirable or even below our cost basis. In this event, we could realize a loss or fail to realize a gain in an amount that we deem an appropriate return on our investment.
Further, capital markets volatility and the overall market environment may preclude our portfolio companies from completing an IPO and impede our exit from these investments. Accordingly, we may not be able to realize gains from our equity interests, and any gains that we do realize on the disposition of any equity interests may not be sufficient to offset any other losses we experience. We will generally have little, if any, control over the timing of any gains we may realize from our equity investments.
Even if our portfolio companies are successful in completing an IPO, there is no assurance that they will be able to achieve their projected revenue and earnings targets or effectively maintain their status as public reporting companies. In such case, there may be little or no demand for the securities of our portfolio companies in the public markets, we may have difficulty disposing of our investments, and the value of our investments may decline substantially.
We are also typically prohibited from exiting investments in our publicly traded portfolio company until the expiration of the customary post-IPO lockup agreement. These agreements, which we are required to enter into as part of our initial investment, prohibit us and other significant existing investors from selling stock in the portfolio company or hedging such securities during the customary 180 days following an IPO. The market prices of our portfolio companies that have recently completed an IPO typically experience high volatility driven by such factors as overall market conditions, the industry conditions for the particular sector in which the portfolio company operates, the portfolio company’s performance, the relative size of the public float, and the potential selling activities of other pre-IPO investors and possibly management. Following the post-IPO lockup period, significant sales by other selling stockholders may result in a decrease in trading price, particularly if the stock has low trading volumes, which could result in significant market price volatility and a decline in the value of our investment. In such cases, the value of our investments may decline substantially or we may be forced to hold our positions for longer than we anticipated, or both. As a result, there can be no assurance that we will be able to achieve our targeted return on our portfolio company investments if and when they go public.
We may not succeed in negotiating structural protections for our investments, and cannot assure you that we will realize gains from structural protections in our investments.
As part of our investment strategy, our investment adviser may attempt to negotiate structural protections that are expected to provide for an enhanced return upon an IPO event or otherwise enhance our ability to meet our targeted return on our portfolio company investments. Such structural protections may include conversion rights which would result in us receiving shares of common stock at a discount to the IPO price upon conversion at the time of the IPO, or warrants that would result in us receiving additional shares for a nominal exercise price at the time of an IPO. We have negotiated structural protections of this type in eight of our 17 private portfolio company investments as of December 31, 2012.
There can be no assurance that our investment adviser will succeed in negotiating structural protections for our future investments. Even if it succeeds in obtaining such protections, our ability to realize the value of these structural protections (which we sometimes refer to as “structurally protected appreciation”) will depend on a number of factors including the completion of the IPO, any adjustment to the terms of the structural protection that may be negotiated during the IPO process, and the possible subsequent issuance of more senior securities that may impact the relative value of our investment. Further, even if an IPO is
32
Table of Contents
completed, we would not realize any structurally protected appreciation unless the market price of the portfolio company’s common shares equaled or exceeded the IPO price at the time such shares were disposed of following the lockup period. Further, our ability to realize any structurally protected appreciation at the time of a sale or liquidation of a portfolio company will depend on a number of factors including the completion of a sale or liquidation, the realization of sales or liquidation proceeds (after payment of liabilities) sufficient to pay our senior preference amount, any adjustment to our preference amount that may be negotiated prior to any sale or liquidation, and the possible subsequent issuance of more senior securities that may make our preference rights subordinate to the preference rights of senior security holders. As a result, there can be no assurance that we will be able to realize the potential value of these structural protections even if we are able to obtain them.
Because our investments are generally not in publicly traded securities, there will be uncertainty regarding the value of our investments, which could adversely affect the determination of our net asset value.
Our portfolio investments will generally not be in publicly traded securities and, as a result, the fair value of our investments in portfolio companies will often not be readily determinable. At December 31, 2012, portfolio investments, which were valued at fair value by our Board of Directors, were approximately 85.9% of our gross assets. We expect our investments to continue to consist primarily of securities issued by privately-held companies, the fair value of which is not readily determinable, and the percentage of assets which will be valued at fair value by our Board of Directors is expected to increase as we continue to make additional investments in private portfolio companies. To the extent our Board of Directors has determined that an investment has increased in fair value, we record an increase in unrealized appreciation for that investment and, conversely, to the extent our Board of Directors has determined that an investment has decreased in fair value, we record a decrease in unrealized appreciation for that investment.
The 1940 Act requires us to value each portfolio investment on a quarterly basis to determine our net asset value. Under the 1940 Act, unrestricted securities with readily available market quotations in an active market are valued at the closing market price on the valuation date; all other assets are valued at fair value as determined in good faith by our Board of Directors based upon the recommendation of the Board of Director’s Valuation Committee in accordance with our written valuation policy. In connection with that determination, members of our investment adviser’s portfolio management team will prepare portfolio company valuations using the most recently available portfolio company financial statements and forecasts. The Valuation Committee intends to utilize the services of one or more independent valuation firms, which will conduct an initial valuation review of each new private portfolio company investment and, in accordance with our valuation policy, periodic updated valuation reviews for our portfolio investments that are not publicly traded. However, our Board of Directors will retain ultimate authority as to the appropriate valuation of each such investment.
We typically obtain financial and other information with respect to private companies directly from our prospective portfolio companies during our due diligence process or from available public sources. We also generally have agreements with our portfolio companies to receive financial and other information with respect to private companies on a quarterly basis. However, for our quarterly fair value determinations, we typically will only have access to a portfolio company’s actual financial results as of and for the quarter end which precedes the quarter end for which our fair value determination relates. In addition, we typically only receive updated financial projections for a portfolio company on an annual basis. Due to the inherent uncertainty in determining the fair value of investments that do not have a readily available market value, the fair value of our investments determined in good faith by our Board of Directors may differ significantly from the value that would have been used had a ready market existed for such investments, and the differences could be material. There can be no assurance that we will be able to realize the fair value that our Board has determined for our portfolio company investments upon our disposition of such investments. Our net asset value could be adversely affected if our determinations regarding the fair value of our investments were materially higher than the values that we ultimately realize upon the disposal of such securities.
Because there is generally no established market in which to value our investments, our Board of Directors’ value determinations may differ materially from the values that a ready market or third party would attribute to these investments.
There is generally no public market for the private equity securities in which we invest. Pursuant to the requirements of the 1940 Act, we value all of the privately held equity securities in our portfolio at fair value as determined in good faith by our Board of Directors.
The types of factors that the Valuation Committee may take into account in providing its fair value recommendation to our Board of Directors with respect to our private portfolio company investments may include, as relevant and, to the extent available, the portfolio company’s most recently available historical and projected financial results, industry valuation benchmarks and public market comparables, and other factors. The Valuation Committee may also consider other events, including the transaction in which we acquired our securities, subsequent equity sales by the portfolio company, mergers or acquisitions affecting the portfolio company, or the completion of an IPO by the portfolio company. The Valuation Committee may also consider the trends of the portfolio company’s basic financial metrics from the time of our original investment until the valuation date, with material improvement of
33
Table of Contents
these metrics indicating a possible increase in fair value, while material deterioration of these metrics may indicate a possible reduction in fair value. Determinations of fair value are highly fact-specific and involve subjective judgments and estimates. After review of available information, the Valuation Committee may determine that it is appropriate to increase fair value, decrease fair value or to make no change to fair value. The fair values of our portfolio company securities are generally discounted for lack of marketability or when the securities are illiquid, such as when there are restrictions on resale or the lack of an established trading market which will generally be the case for pre-IPO companies, as well as during any lockup period to which we are subject with respect to public companies in our portfolio. Due to the inherent uncertainty in determining the fair value of investments that do not have a readily available market value, the fair value of our investments determined in good faith by our Board of Directors may differ significantly from the value that would have been used had a ready market existed for such investments, and the differences could be material. Accordingly, there can be no assurance that we will be able to realize the fair value that our Board has determined for our portfolio company investments upon our disposition of such investments.
Our portfolio may be focused in a limited number of portfolio companies or industry sectors, which will subject us to a risk of significant loss if the business or market position of these companies deteriorates or industry sectors experience a downturn.
A consequence of our limited number of investments is that the aggregate returns we realize may be significantly adversely affected if a small number of investments perform poorly or if we need to write down the value of any one investment. Beyond our income tax asset diversification requirements, we do not have fixed guidelines for diversification, and our investments could be concentrated in relatively few issuers. In addition, our investments may be concentrated in a limited number of industry sectors. We make investments in later stage, typically venture capital-backed, private, pre-IPO companies in the technology, Internet and software, and cleantech industries. As a result, a market downturn affecting one of our portfolio companies or one of these industry sectors could materially adversely affect us.
We do not choose specific investments based on a strategy of industry diversification and do not intend to rebalance our portfolio if one of our portfolio company investments increases in value relative to the remaining portion of the portfolio. As a result, our portfolio may be more vulnerable to events affecting a single industry sector or portfolio company and, therefore, subject to greater potential volatility than a company that follows a more diversified strategy.
Our investments in the clean technology industry are subject to many risks, including volatility, intense competition, unproven technologies, periodic downturns, loss of government subsidies and incentives, and potential litigation.
Our investments in clean technology, or cleantech, companies are subject to substantial operational risks, such as underestimated cost projections, unanticipated operation and maintenance expenses, loss of government subsidies, and inability to deliver cost-effective alternative energy solutions compared to traditional energy products. In addition, energy companies employ a variety of means of increasing cash flow, including increasing utilization of existing facilities, expanding operations through new construction or acquisitions, or securing additional long-term contracts. Thus, some energy companies may be subject to construction risk, acquisition risk or other risks arising from their specific business strategies. Furthermore, production levels for solar, wind and other renewable energies may be dependent upon adequate sunlight, wind, or biogas production, which can vary from market to market and period to period, resulting in volatility in production levels and profitability. In addition, our cleantech companies may have narrow product lines and small market shares, which tend to render them more vulnerable to competitors’ actions and market conditions, as well as to general economic downturns. The revenues, income (or losses) and valuations of clean technology companies can and often do fluctuate suddenly and dramatically and the markets in which clean technology companies operate are generally characterized by abrupt business cycles and intense competition. Demand for clean technology and renewable energy is also influenced by the available supply and prices for other energy products, such as coal, oil and natural gases. A change in prices in these energy products could reduce demand for alternative energy. Our investments in cleantech companies also face potential litigation, including significant warranty and product liability claims, as well as class action and government claims arising from business failures of companies supported government subsidies. Such litigation could adversely affect the business and results of operations of our cleantech portfolio companies. There is also particular uncertainty about whether agreements providing government incentives and subsidies for reductions in greenhouse gas emissions, such as the Kyoto Protocol, will continue and whether countries around the world will enact or maintain legislation that provides such incentives and subsidies for reductions in greenhouse gas emissions, without which such investments in clean technology dependent portfolio companies may not be economical or financing for such projects may become unavailable. As a result, these portfolio company investments face considerable risk, including the risk that favorable regulatory regimes or government subsidies and incentives expire or are adversely modified. This could, in turn, materially adversely affect the value of the clean technology companies in our portfolio.
34
Table of Contents
Our investments in Internet and software companies are subject to many risks, including regulatory concerns, litigation risks and intense competition.
Our investments in Internet and software companies are subject to substantial risks. For example, our portfolio companies face intense competition since their businesses are rapidly evolving and intensely competitive, and are subject to changing technology, shifting user needs, and frequent introductions of new products and services. Internet and software companies have many competitors in different industries, including general purpose search engines, vertical search engines and e-commerce sites, social networking sites, traditional media companies, and providers of online products and services. Potential competitors to our portfolio companies in the Internet and software industries range from large and established companies to emerging start-ups. Further, such companies are subject to laws that were adopted prior to the advent of the Internet and related technologies and, as a result, do not contemplate or address the unique issues of the Internet and related technologies. The laws that do reference the Internet are being interpreted by the courts, but their applicability and scope remain uncertain. For example, the laws relating to the liability of providers of online services are currently unsettled both within the U.S. and abroad. Claims have been threatened and filed under both U.S. and foreign laws for defamation, invasion of privacy and other tort claims, unlawful activity, copyright and trademark infringement, or other theories based on the nature and content of the materials searched and the ads posted by a company’s users, a company’s products and services, or content generated by a company’s users. Further, the growth of Internet and software companies into a variety of new fields implicate a variety of new regulatory issues and may subject such companies to increased regulatory scrutiny, particularly in the U.S. and Europe. As a result, these portfolio company investments face considerable risk. This could, in turn, materially adversely affect the value of the Internet and software companies in our portfolio.
Our investments in technology companies are subject to many risks, including volatility, intense competition, shortened product life cycles, litigation risk and periodic downturn.
We have invested and will continue investing in technology companies, many of which may have narrow product lines and small market shares, which tend to render them more vulnerable to competitors’ actions and market conditions, as well as to general economic downturns. The revenues, income (or losses), and valuations of technology-related companies can and often do fluctuate suddenly and dramatically. In addition, technology-related markets are generally characterized by abrupt business cycles and intense competition, where the leading companies in any particular category may hold a highly concentrated percentage of the overall market share. Therefore, our portfolio companies may face considerably more risk of loss than do companies in other industry sectors.
Because of rapid technological change, the selling prices of products and services provided by technology-related companies have historically decreased over their productive lives. As a result, the selling prices of products and services offered by technology-related companies may decrease over time, which could adversely affect their operating results, their ability to meet obligations under their debt securities and the value of their equity securities. This could, in turn, materially adversely affect the value of the technology-related companies in our portfolio.
Some of our portfolio companies are subject to complex regulation, and any compliance failures or regulatory action could materially adversely affect their business and reduce the value of our investments.
The businesses of some our of portfolio companies are subject to extensive, complex and continually changing federal and state laws and regulations and the regulations of foreign agencies. If these companies fail to comply with any applicable law, rule or regulation, they could be subject to fines and penalties, indemnification claims by their customers, or become the subject of a regulatory agency enforcement action, each of which would materially adversely affect their business and reputation.
These companies may also become subject to additional regulatory and compliance requirements as a result of changes in laws or regulations, or as a result of any expansion or enhancement of existing products and services or any new products or services they may offer in the future. Compliance with any new regulatory requirements may divert internal resources and take significant time and effort. Their compliance processes may not be sufficient to prevent assertions that they failed to comply with any applicable law, rule or regulation.
Any claims of noncompliance brought against our portfolio companies, regardless of merit or ultimate outcome, could subject them to investigation by the Department of Labor, the Federal Trade Commission, Internal Revenue Service, the Treasury Department or other federal, state and foreign regulatory authorities, which could result in substantial costs to them and divert management’s attention and other resources away from their operations. In addition, investor perceptions of the subject company may suffer and could cause a decline in the market price of their securities, reducing the value of our investments in them.
35
Table of Contents
Our portfolio companies may issue additional securities or incur debt that ranks equal or senior to our investments in such companies and we may experience a complete loss on our equity investments in the event of a bankruptcy or liquidation of any of our portfolio companies.
We intend to invest primarily in equity securities issued by our portfolio companies. The equity securities that we acquire directly from an issuer are typically the issuer’s most senior preferred stock at the time of our investment or, in cases where we acquire common shares, the issuer typically has only common stock outstanding. The equity securities that we acquire directly from selling stockholders in private secondary transactions are typically common stock and may not represent the most senior equity securities of the issuer. The portfolio companies may be permitted to issue additional securities or incur other debt that ranks equally with, or senior to, the equity securities in which we invest. By their terms, such other securities (especially if they are debt securities) may provide that the holders are entitled to receive payment of interest or principal before we are entitled to receive any distribution from the portfolio companies. Also, in the event of insolvency, liquidation, dissolution, reorganization, or bankruptcy of a portfolio company, holders of debt instruments would typically be entitled to receive payment in full before equity investors like us may receive any distribution in respect of our investment, and holders of more senior classes of preferred stock (if any are issued) would typically be entitled to receive full or partial payment in preference to any distribution to us. After repaying such senior creditors or preferred stockholders, the portfolio company may not have any remaining assets to distribute to us, and we may experience a complete loss on our investment.
We may be limited in our ability to make follow-on investments, and our failure to make follow-on investments in our portfolio companies could impair the value of our portfolio.
Following an initial investment in a portfolio company, we may make additional investments in that portfolio company as “follow-on” investments, in order to: (i) increase or maintain in whole or in part our equity ownership percentage; (ii) exercise warrants, options or convertible securities that were acquired in the original or subsequent financing; or (iii) attempt to preserve or enhance the value of our investment.
We may elect not to make follow-on investments, or may otherwise lack sufficient funds to make those investments or lack access to desired follow-on investment opportunities. We have the discretion to make any follow-on investments, subject to the availability of capital resources and of the investment opportunity. Even if we have sufficient capital to make a desired follow-on investment, we may elect not to make a follow-on investment because we may not want to increase our concentration of risk, because we prefer other opportunities, or because we are inhibited by compliance with business development company requirements or the desire to maintain our tax status or lack access to the desired follow-on investment opportunity. Our failure to make follow-on investments may, in some circumstances, jeopardize the continued viability of a portfolio company and our initial investment, or may result in a missed opportunity for us to increase our participation in a successful operation.
We may be required to make additional investments in our portfolio companies, from time to time, to fund their operations. If we elect not to fund our pro rata share of these additional investments, there may be adverse consequences to our initial investment including the forced conversion of our preferred stock into common stock at an unfavorable conversion rate and the corresponding loss of any liquation preferences or other rights and privileges that may be applicable to the securities we currently hold.
While we typically do not intend to purchase stock in a portfolio company’s IPO or in open market transactions thereafter, under certain circumstances, we may consider making additional investments a publicly traded portfolio company in open market purchases, which will increase our position in the company. We typically will consider open market purchases of shares in our publicly traded portfolio companies as a means to bring our overall investment closer to our targeted percentage of our gross assets per portfolio company investment. In such cases, our initial private investments may have been limited due to the level of our gross assets at the time of the initial investment. However, we may be unable to make follow-on investments in our publicly traded portfolio companies as a result of certain regulatory restrictions on a business development company’s investments in publicly traded securities with market capitalizations in excess of $250 million.
Because we likely will not hold controlling equity interests in our portfolio companies, we may not be in a position to exercise control over such portfolio companies or to prevent decisions by management of such portfolio companies that could decrease the value of our investments.
We typically do not seek board seats, observation rights or other control features in our investments. As a result, our equity investments will typically be non-control investments, meaning we will not be in a position to control the management, operation and strategic decision-making of the companies we invest in. As a result, we will be subject to the risk that a portfolio company may make business decisions with which we disagree, and the stockholders and management of such a portfolio company may take risks or otherwise act in ways that are adverse to our interests. In addition, other stockholders, such as venture capital and private equity sponsors that have substantial investments in our portfolio companies, may have interests that differ from that of the portfolio company or its minority stockholders, which may lead them to take actions that could materially and adversely affect the value of our investment in the portfolio company. Due to the lack of liquidity for the equity and equity-related investments that we will typically hold in our portfolio companies, we may not be able to dispose of our investments in the event that we disagree with the actions of a portfolio company or its substantial stockholders, and may therefore suffer a decrease in the value of our investments.
36
Table of Contents
As a business development company, we may not acquire any asset other than qualifying assets, as defined under the 1940 Act, unless at the time the acquisition is made such qualifying assets represent at least 70% of the value of our total assets. If we do not invest a sufficient portion of our assets in qualifying assets, we could be precluded from investing in assets that we deem to be attractive.
As a business development company, we generally may not acquire any asset other than qualifying assets, as defined under the 1940 Act, unless at the time the acquisition is made qualifying assets represent at least 70% of the value of our total assets. Qualifying assets include investments in U.S. operating companies whose securities are not listed on a national securities exchange and companies listed on a national securities exchange subject to a market capitalization limit of $250 million. Qualifying assets also include cash, cash equivalents, U.S. government securities and high quality debt securities maturing in one year or less from the time of investment.
We believe that most of our portfolio company investments will constitute qualifying assets. However, we may be precluded from investing in what we believe are attractive investments if such investments are not qualifying assets for purposes of the 1940 Act. If we do not invest a sufficient portion of our assets in qualifying assets, we will be prohibited from making any additional investment that is not a qualifying asset and could be forced to forgo attractive investment opportunities. Similarly, these rules could prevent us from making follow-on investments in existing portfolio companies (which could result in the dilution of our position).
Investments in foreign companies may involve significant risks in addition to the risks inherent in U.S. investments.
While we invest primarily in U.S. companies, we may invest on an opportunistic basis in certain non-U.S. companies, including those located in emerging markets, that otherwise meet our investment criteria, subject to the requirements of the 1940 Act. Investing in foreign companies, and particularly those in emerging markets, may expose us to additional risks not typically associated with investing in U.S. issues. These risks include changes in exchange control regulations, political and social instability, expropriation, imposition of foreign taxes, less liquid markets and less available information than is generally the case in the United States, higher transaction costs, less government supervision of exchanges, brokers and issuers, less developed bankruptcy laws, difficulty in enforcing contractual obligations, lack of uniform accounting and auditing standards and greater price volatility. Further, we may have difficulty enforcing our rights as equity holders in foreign jurisdictions. In addition, to the extent we invest in non-U.S. companies, we may face greater exposure to foreign economic developments.
Although we expect that most of our investments will be U.S. dollar-denominated, any investments denominated in a foreign currency will be subject to the risk that the value of a particular currency will change in relation to one or more other currencies. Among the factors that may affect currency values are trade balances, the level of short-term interest rates, differences in relative values of similar assets in different currencies, long-term opportunities for investment and capital appreciation, and political developments.
We are a non-diversified investment company within the meaning of the 1940 Act, and therefore we generally are not limited with respect to the proportion of our assets that may be invested in securities of a single issuer.
We are classified as a non-diversified investment company within the meaning of the 1940 Act, which means that we are not limited by the 1940 Act with respect to the proportion of our assets that we may invest in securities of a single issuer, excluding limitations on investments in other investment companies. To the extent that we assume large positions in the securities of a small number of issuers, our net asset value may fluctuate to a greater extent than that of a diversified investment company as a result of changes in the financial condition or the market’s assessment of the issuer. We may also be more susceptible to any single economic or regulatory occurrence than a diversified investment company. Beyond our income tax diversification requirements, we do not have fixed guidelines for diversification, and our investments could be concentrated in relatively few portfolio companies.
Risks Relating to Our Business and Structure
We have a limited operating history, and there is no assurance that we will achieve our investment objective.
We were initially formed in May 2008 and made our first portfolio company investment in January 2010. We completed our continuous public offering on June 30, 2011 raising $78.4 million, net of issuance costs. As of December 31, 2012, we have made investments of $63.4 million in 20 portfolio companies. As of December 31, 2012, we were fully invested based on our currently available funds. It is our policy to retain approximately $10 million in cash and cash equivalents to fund our future operating expenses, although the amount we actually retain may vary depending on our operating expenses and the timing of our purchases and sales of portfolio company investments. As of December 31, 2012, we had only limited dispositions of our investments, relating to interests in two portfolio company investments. As a result, we have limited financial information on which you can evaluate an investment in our company or our prior performance. In addition, our investment adviser, Keating Investments, has only a limited history of investing experience, managing a pool of assets substantially smaller than the net proceeds that we raised in our continuous public offering. We are subject to all of the business risks and uncertainties associated with any new business, including the risk that we will not achieve our investment objective and that the value of your investment could decline substantially or become worthless.
37
Table of Contents
Any failure on our part to maintain our status as a business development company would reduce our operating flexibility.
We intend to continue to qualify as a business development company under the 1940 Act. The 1940 Act imposes numerous constraints on the operations of business development companies. For example, business development companies are required to invest at least 70% of their total assets primarily in securities of eligible portfolio companies, cash, cash equivalents, U.S. government securities and other high quality debt investments that mature in one year or less. Furthermore, any failure to comply with the requirements imposed on business development companies by the 1940 Act could cause the SEC to bring an enforcement action against us and/or expose us to claims of private litigants. Upon approval of a majority of our stockholders, we may elect to withdraw our status as a business development company. If we decide to withdraw our election, or if we otherwise fail to qualify, or maintain our qualification, as a business development company, we might be regulated as a closed-end investment company under the 1940 Act, which would subject us to substantially more regulatory restrictions under the 1940 Act and correspondingly decrease our operating flexibility and increase our costs of doing business.
We are dependent upon Keating Investments’ principals, Timothy J. Keating, Kyle L. Rogers and Frederic M. Schweiger, for our future success. If we lose any of our investment adviser’s principals, our ability to implement our business strategy could be significantly harmed.
We depend on the diligence, skill and network of business contacts of Keating Investments’ principals. The principals, together with other investment professionals employed by Keating Investments, identify, evaluate, negotiate, structure, close, monitor and service our investments. Our future success will depend to a significant extent on the continued service and coordination of Keating Investments’ principals, Timothy J. Keating, Kyle L. Rogers and Frederic M. Schweiger. Keating Investments has established an Investment Committee that must unanimously approve each new portfolio company investment that we make. Messrs. Keating, Rogers and Schweiger are the current members of the Investment Committee. However, as the managing member of Keating Investments, Mr. Keating has sole control over the appointment and removal of the members of the Investment Committee and neither we nor our Board of Directors has any direct participation on the selection of members to the Investment Committee. None of Messrs. Keating, Rogers and Schweiger is subject to an employment contract, and none receive any compensation directly from us. While Messrs. Keating, Rogers and Schweiger currently devote substantially all of their business time to our operations, we expect that one of more of them will have other demands on their time as a result of Keating Investments’ contemplated launch of other entities to which they intend to provide investment advisory services. We do not carry key-man life insurance on the lives of Messrs. Keating, Rogers or Schweiger. The departure of any of these principals could have a material adverse effect on our ability to achieve our investment objective.
None of Keating Investments’ principals or other investment professionals, including Timothy J. Keating, Kyle L. Rogers and Frederic M. Schweiger, are subject to employment agreements, and there can be no assurance that our investment adviser will be successful in retaining its principals or other investment professionals.
None of Keating Investments’ principals or other investment professionals, Timothy J. Keating, Kyle L. Rogers and Frederic M. Schweiger, are subject to employment agreements. As a result, although Messrs. Keating, Rogers and Schweiger comprise the principals of Keating Investments, they are free to terminate their employment with Keating Investments at any time. In addition, none of our investment adviser’s principals or other investment professionals, including Messrs. Keating, Rogers and Schweiger, are subject to any non-compete agreements that would restrict their ability to provide investment advisory services to an entity with an investment objective similar to our own in the event they were to terminate their employment with Keating Investments, or if Keating Investments were to no longer serve as our investment adviser. Currently, Messrs. Keating, Rogers and Schweiger devote substantially all of their business time to our operations. However, we expect that one or more of Keating Investments’ principals and investment professionals may in the future have other demands on their time as a result of Keating Investments providing investment advisory services to other entities. Further, our investment adviser, its principals, investment professionals and employees and the members of its Investment Committee may serve as investment advisers, officers, directors or principals of entities or investment funds that operate in the same or a related line of business as us and/or of investment funds managed by our affiliates. There can be no assurance that our investment adviser will be successful in retaining its principals and other investment professionals, including Messrs. Keating, Rogers and Schweiger. The departure of any of Messrs. Keating, Rogers and Schweiger could have a material adverse effect on our ability to achieve our investment objective.
Our growth will require that Keating Investments retain and attract new investment and administrative personnel in a competitive market. Its ability to attract and retain personnel with the requisite credentials, experience and skills will depend on several factors including, but not limited to, its ability to offer competitive wages, benefits and professional growth opportunities. Many of the entities with which Keating Investments will compete for experienced personnel, including investment funds (such as private equity funds and mezzanine funds) and traditional financial services companies, will have greater resources than it.
38
Table of Contents
Our financial condition and results of operations will depend on our ability to achieve our investment objective.
Although Keating Investments has been an investment adviser registered under the Investment Advisers Act of 1940, as amended, since 2001, it had no prior experience in managing a business development company or a pool of assets of the amount we raised in our continuous public offering. In addition, since we had only had limited dispositions of our investments, relating to interests in two portfolio company investments, as of December 31, 2012, we have limited financial information on which you can evaluate an investment in our company or the prior performance of us or our investment adviser. As such, we are subject to the business risks and uncertainties associated with any new business enterprise. Our ability to achieve our investment objective will depend on our investment adviser’s ability to identify, analyze and invest in companies that meet our investment criteria. Accomplishing this result on a cost-effective basis is largely a function of our investment adviser’s proper structuring of the investment process and its ability to provide competent, attentive and efficient services to us. We seek a specified number of investments in later stage, private pre-IPO companies, which may be extremely risky. There can be no assurance that Keating Investments will be successful in identifying and investing in companies that meet our investment criteria, or that we will achieve our investment objective or be able to achieve our targeted return on our portfolio company investments if and when they go public.
Because the portfolio company securities that we acquire are typically illiquid until an IPO or sale of the company, we generally cannot predict the regularity and time periods between dispositions of our portfolio company investments and the realizations of capital gains, if any, from such dispositions. Dispositions of our portfolio company investments are discretionary and based on our investment adviser’s business judgment. Since we do not expect to generate current income from our portfolio company investments, our annual operating expenses will be financed from our capital base during periods of time between realizations of capital gains on our investments. In addition, if we are successful in disposing of a portfolio company investment, we intend to reinvest the principal amount of our investment in new portfolio company opportunities, with any gain that we may realize being distributed to our stockholders after we pay any incentive fees earned by our investment adviser and our operating expenses.
Even if we are able to grow and build upon our investment operations, any failure to manage our growth effectively could have a material adverse effect on our business, financial condition, results of operations and prospects. The results of our operations will depend on many factors, including the availability of opportunities for investment, our ability to access the capital markets to raise cash to fund additional investments once we are fully invested, and economic conditions. Furthermore, if we cannot successfully operate our business or implement our investment policies and strategies as described herein, it could negatively impact our ability to pay distributions to our stockholders.
We may experience fluctuations in our periodic results, and if we fail to achieve our investment objective, the net asset value of our common stock may decline.
We could experience fluctuations in our periodic results due to a number of factors, some of which are beyond our control, including our ability to make investments in companies that meet our investment criteria, the level of our expenses (including the interest rates payable on our borrowings and the dividend rates on any preferred stock we may issue), variations in and the timing of the recognition of realized and gains or losses and unrealized appreciation and depreciation, the degree to which we encounter competition in our markets and general economic conditions. Our periodic results will also be affected by the ability of our private portfolio companies to complete their IPOs in our targeted 18-month time frame, the strength of the IPO market and the level of stock market volatility in general. As a result of these factors, results for any period should not be relied upon as being indicative of performance in future periods.
Our business model depends upon the development and maintenance of strong referral relationships with venture capital firms and investment banks, and our direct outreach to private companies.
We are substantially dependent on our relationships with venture capital firms and investment banks, which we use to help identify and gain access to investment opportunities, and our outreach to private companies that meet our investment criteria. If we fail to maintain our existing relationships, our relationships become strained as a result of enforcing our rights to protect our investments in certain portfolio companies, or we fail to develop new relationships with other firms or sources of investment opportunities, then we will not be able to grow our portfolio of equity investments and achieve our investment objective. In addition, persons with whom our investment adviser has relationships are not obligated to inform us of investment opportunities and therefore such relationships may not lead to the origination of equity investments. Any loss or diminishment of such relationships could effectively reduce our ability to identify attractive portfolio companies that meet our investment criteria, either for direct equity investments or for investments through private secondary transactions with selling stockholders in these portfolio companies.
39
Table of Contents
Our ability to grow will depend on our ability to raise capital, and a disruption in the capital markets or the credit markets could negatively affect our business.
As a business development company, we need the ability to raise additional capital for investment purposes. Without sufficient access to the capital markets, we may be forced to curtail our business operations or we may not be able to pursue new investment opportunities. Disruptive conditions in the financial industry and any new legislation in response to those conditions could restrict our business operations and could adversely impact our results of operations and financial condition.
Although we do not intend to borrow funds or issue senior securities, including preferred stock, in the foreseeable future to finance the purchase of our investments in portfolio companies, we have the discretion to do so. However, we will not borrow funds or issue senior securities, including preferred stock, to finance the purchase of our investment in portfolio companies for at least one year from the date of the completion of any equity offering. To the extent we do utilize leverage and the fair value of our assets declines substantially, we may fail to maintain the asset coverage ratios imposed upon us by the 1940 Act. Any such failure would affect our ability to issue senior securities, including borrowings, and pay dividends, which could materially impair our business operations. Our liquidity could be impaired further by an inability to access the capital markets. For example, we cannot be certain that we will be able to raise additional equity capital to provide funding for normal operations, including additional investments. Reflecting concern about the stability of the financial markets, many institutional investors have reduced or ceased providing funding to certain borrowers. This market turmoil has led to increased market volatility and widespread reduction of business activity generally.
While market conditions have stabilized and, in many cases, improved, there can be no assurance that significant disruption and volatility in the financial markets will not occur in the future. For example, recent concerns regarding U.S. debt and budget matters and the sovereign debt crisis in Europe have caused uncertainty in financial markets. Although the U.S. debt limit was increased, a failure to raise the U.S. debt limit and/or a downgrade of U.S. debt ratings in the future could, in addition to causing economic and financial market disruptions, materially adversely affect our ability to access capital markets on favorable terms and the market value of the U.S. government securities that we hold, as well as have other material adverse effects on the operation of our business and our financial results and condition.
We operate in a highly competitive market for investment opportunities.
A large number of entities compete with us to make the types of equity investments that we target as part of our business strategy. We compete for such investments with a large number of venture capital funds, other equity and non-equity based investment funds, investment banks and other sources of financing, including traditional financial services companies such as commercial banks and specialty finance companies. Many of our competitors are substantially larger than us and have considerably greater financial, technical and marketing resources than we do. In addition, some of our competitors may have higher risk tolerances or different risk assessments, which could allow them to consider a wider variety of investments and establish more relationships than we can. Furthermore, many of our competitors are not subject to the regulatory restrictions that the 1940 Act imposes on us as a business development company and, as a result, such companies may be more successful in completing their investments. There can be no assurance that the competitive pressures we face will not have a material adverse effect on our business, financial condition, and results of operations. Also, as a result of this competition, we may not be able to take advantage of attractive investment opportunities from time to time, and we can offer no assurance that we will be able to identify and make investments that are consistent with our investment objective.
The incentive fee may induce Keating Investments, our investment adviser, to make speculative investments or incur leverage.
The incentive fee payable by us to Keating Investments may create an incentive for Keating Investments to make investments on our behalf that are risky or more speculative than would be the case in the absence of such compensation arrangement. Although we do not intend to borrow funds or issue senior securities, including preferred stock, in the foreseeable future to finance the purchase of our investments in portfolio companies, we have the discretion to do so. However, we will not borrow funds or issue senior securities, including preferred stock, to finance the purchase of our investment in portfolio companies for at least one year from the date of the completion of any equity offering. Although the use of leverage is not currently contemplated, the way in which the incentive fee payable to Keating Investments is determined, which is calculated as a percentage of the return on invested capital, may encourage Keating Investments to use leverage to increase the return on our investments. In addition, while leverage for investment purposes is not currently used or contemplated, the fact that our base management fee is payable based upon our gross assets, which would include any borrowings for investment purposes, may encourage Keating Investments to seek to use leverage to make additional investments. We will be required, however, to obtain the approval of our Board of Directors before we incur any indebtedness. Under certain circumstances, the use of leverage may increase the likelihood of default, which would disfavor holders of our common stock. Such a practice could result in our investing in more speculative securities than would otherwise be the case, which could result in higher investment losses, particularly during cyclical economic downturns.
40
Table of Contents
In addition, our investment adviser has control over the timing of the acquisition and dispositions of our investments, and therefore over when we realize gains and losses on our investments. As a result, our investment adviser may face a conflict of interest in determining when it is appropriate to dispose of a specific investment to the extent doing so may serve to maximize its incentive fee at a point where disposing of such investment may not necessarily be in the best interests of our stockholders. Our Board of Directors monitors such conflicts of interest in connection with its review of the performance of our investment adviser under our Investment Advisory and Administrative Services Agreement, as well as during its quarterly review of our financial performance and results of operations.
We may borrow money, which would magnify the potential for gain or loss on amounts invested and may increase the risk of investing in us.
Borrowings, also known as leverage, magnify the potential for gain or loss on amounts invested and, therefore, increase the risks associated with investing in our securities. Although we do not intend to borrow funds or issue senior securities, including preferred stock, in the foreseeable future to finance the purchase of our investments in portfolio companies, we have the discretion to do so. However, we will not borrow funds or issue senior securities, including preferred stock, to finance the purchase of our investment in portfolio companies for at least one year from the date of the completion of any equity offering. Although we do not currently anticipate incurring leverage, if we do so we may borrow from and issue senior debt securities to banks, insurance companies and other lenders. Lenders of such senior securities would have fixed dollar claims on our assets that are superior to the claims of our common stockholders. If the value of our assets increases, then leveraging would cause the net asset value attributable to our common stock to increase more sharply than it would have had we not leveraged. Conversely, if the value of our assets decreases, leveraging would cause net asset value to decline more sharply than it otherwise would have had we not leveraged. Similarly, any increase in our income in excess of interest payable on the borrowed funds would cause our net income to increase more than it would without the leverage, while any decrease in our income would cause net income to decline more sharply than it would have had we not borrowed. Leverage is generally considered a speculative investment technique. Our ability to service any debt that we incur will depend largely on our financial performance and will be subject to prevailing economic conditions and competitive pressures. Moreover, as the management fee payable to Keating Investments will be payable on our gross assets, including those assets acquired through the use of leverage, Keating Investments may have a financial incentive to incur leverage which may not be consistent with our stockholders’ interests. In addition, our common stockholders will bear the burden of any increase in our expenses as a result of leverage, including any increase in the management fee payable to Keating Investments.
Our potential use of borrowed funds to make investments may expose us to risks typically associated with leverage.
Although we do not intend to borrow funds or issue senior securities, including preferred stock, in the foreseeable future to finance the purchase of our investments in portfolio companies, we have the discretion to do so. However, we will not borrow funds or issue senior securities, including preferred stock, to finance the purchase of our investment in portfolio companies for at least one year from the date of the completion of any equity offering. To the extent we do utilize leverage:
| • | a decrease in the value of our investments would have a greater negative impact on the value of our common shares than if we did not use leverage, therefore, shares of our common stock are exposed to incremental risk of loss; |
| • | adverse changes in interest rates could reduce or eliminate the incremental income we make with the proceeds of any leverage; |
| • | our ability to pay dividends on our common stock will be restricted if our asset coverage ratio is not at least 200% and any amounts used to service indebtedness or preferred stock may not be available for such dividends; |
| • | such indebtedness would be governed by an indenture or other instrument containing covenants restricting our operating flexibility; |
| • | we, and indirectly our stockholders, would bear the cost of issuing and paying interest or dividends on such securities; and |
| • | any convertible or exchangeable securities that we issue may have rights, preferences and privileges more favorable than those of our common stock. |
41
Table of Contents
Our base management fee may induce our investment advisor to incur leverage.
Our base management fee is calculated on the basis of our total assets, including assets acquired with the proceeds of leverage. Although we do not intend to borrow funds or issue senior securities, including preferred stock, in the foreseeable future to finance the purchase of our investments in portfolio companies, we have the discretion to do so. However, we will not borrow funds or issue senior securities, including preferred stock, to finance the purchase of our investment in portfolio companies for at least one year from the date of the completion of any equity offering. Although the use of leverage is not currently contemplated, our investment adviser may be encouraged to use leverage to increase the aggregate amount of and the return on our investments, even when it may not be appropriate to do so, and to refrain from delevering when it would otherwise be appropriate to do so. Under certain circumstances, the use of increased leverage may increase the likelihood of default, which would impair the value of our common stock. Given the subjective nature of the investment decisions made by our investment adviser on our behalf, we will not be able to monitor this conflict of interest.
There are significant potential conflicts of interest, which could impact our investment returns and limit the flexibility of our investment policies.
We have entered into an Investment Advisory and Administrative Services Agreement with Keating Investments. Keating Investments is controlled by Timothy J. Keating, who is Chairman of our Board of Directors and our Chief Executive Officer, Kyle L. Rogers, who is our Chief Investment Officer, and Frederic M. Schweiger, who is our Chief Operating Officer, Chief Compliance Officer and Secretary and a member of our Board of Directors. Messrs. Keating, Rogers and Schweiger, as principals of Keating Investments, collectively manage the business and internal affairs of Keating Investments. In addition, Keating Investments provides us with office facilities and administrative services pursuant to an Investment Advisory and Administrative Services Agreement, without any profit to Keating Investments. Mr. Keating is the Managing Member of and controls Keating Investments.
In addition, our executive officers and directors, and the principals of our investment adviser, may serve as officers, directors or principals of other entities or investment funds that operate in a line of business similar to our own. Accordingly, if this occurs, they have obligations to investors in those entities, the fulfillment of which might not be in the best interests of us or our stockholders.
While we expect that the investment focus of each of these other entities will tend to be different from our investment objective, it is possible that new investment opportunities that meet our investment objective may come to the attention of one of these entities in connection with another investment advisory client or program, and, if so, such opportunity might not be offered, or otherwise made available, to us. However, our executive officers, directors and investment adviser intend to treat us in a fair and equitable manner consistent with their applicable duties under law so that we will not be disadvantaged in relation to any other particular client. In addition, Keating Investments does not anticipate that it will ordinarily identify investment opportunities that are appropriate for both Keating Capital and the other funds that in the future may be managed by Keating Investments. However, to the extent it does identify such opportunities, Keating Investments will establish a procedure to ensure that such opportunities are allocated between Keating Capital and such other funds in a fair and equitable manner. Our Board of Directors will monitor on a quarterly basis any such allocation of investment opportunities between Keating Capital and any such other funds.
In the ordinary course of business, we may enter into transactions with portfolio companies that may be considered related party transactions. In order to ensure that we do not engage in any prohibited transactions with any persons affiliated with us, we have implemented certain written policies and procedures whereby our executive officers screen each of our transactions for any possible affiliations between the proposed portfolio investment, us, companies controlled by us and our executive officers and directors. We will not enter into any agreements unless and until we are satisfied that doing so will not raise concerns under the 1940 Act or, if such concerns exist, we have taken appropriate actions to seek board review and approval or exemptive relief for such transaction. Our Board of Directors will review these procedures on an annual basis.
We have also adopted a Code of Ethics which applies to, among others, our senior officers, including our Chief Executive Officer and Chief Financial Officer, as well as all of our officers, directors and employees. Our officers and directors also remain subject to the fiduciary obligations imposed by both the 1940 Act and applicable state corporate law. Our Code of Ethics requires that all employees and directors avoid any conflict, or the appearance of a conflict, between an individual’s personal interests and our interests. Pursuant to our Code of Ethics, each employee and director must disclose any conflicts of interest, or actions or relationships that might give rise to a conflict, to our chief compliance officer. Our Board of Directors is charged with approving any waivers under our Code of Ethics. As required by the Nasdaq corporate governance listing standards, the Audit Committee of our Board of Directors is also required to review and approve any transactions with related parties, as such term is defined in Item 404 of Regulation S-K. In accordance with Item 404, related parties generally include our directors and executive officers, any nominees for director, any immediate family member of a director or executive officer or nominee for director, and any other person sharing the household of such director, executive officer or nominee for director.
We pay Keating Investments our allocable portion of overhead and other expenses incurred by Keating Investments in performing its obligations under the Investment Advisory and Administrative Services Agreement, including a portion of the rent and the compensation of our Chief Financial Officer and Chief Compliance Officer, and their respective staff, which creates conflicts of interest that our Board of Directors must monitor.
42
Table of Contents
Finally, we also entered into a license agreement with our investment adviser, pursuant to which our investment adviser granted us a non-exclusive license to use the name “Keating.” Under the license agreement, we have the right to use the “Keating” name and logo for so long as Keating Investments or one of its affiliates remains our investment adviser.
Our investment adviser and its affiliates, officers and employees have certain conflicts of interest.
Our investment adviser, its principals, investment professionals and employees and the members of its Investment Committee serve or may serve as investment advisers, officers, directors or principals of entities or investment funds that operate in the same or a related line of business as us and/or of investment funds managed by our affiliates. Accordingly, these individuals may have obligations to investors in those entities or funds, the fulfillment of which might not be in our best interests or the best interests of our stockholders. In addition, we note that any affiliated investment vehicle currently formed or formed in the future and managed by the adviser or its affiliates may have overlapping investment objectives with our own and, accordingly, may invest in asset classes similar to those targeted by us. As a result, our investment adviser and/or its affiliates may face conflicts in allocating investment opportunities between us and such other entities. Although our investment adviser and its affiliates will endeavor to allocate investment opportunities in a fair and equitable manner and consistent with applicable allocation procedures, it is possible that, in the future, we may not be given the opportunity to participate in investments made by investment funds managed by our investment adviser or its affiliates. In any such case, if our investment adviser forms other affiliates in the future, we may co-invest on a concurrent basis with such other affiliates, subject to compliance with applicable regulations and regulatory guidance, as well as applicable allocation procedures. In certain circumstances, negotiated co-investments may be made only if we receive an order from the SEC permitting us to do so. There can be no assurance when any such order would be obtained or that one will be obtained at all.
Our investment adviser can resign on 120 days’ notice and we may be unable to find a suitable replacement within that time, resulting in a disruption in our operations that could adversely affect our financial condition, business and results of operations.
Our investment adviser has the right, under our current Investment Advisory and Administrative Services Agreement, to resign at any time upon not less than 120 days’ written notice, whether we have found a replacement or not. If our investment adviser resigns, we may not be able to find a new investment adviser or hire internal management with similar expertise and ability to provide the same or equivalent services on acceptable terms within 120 days, or at all. If we are unable to do so quickly, our operations are likely to experience a disruption, our financial condition, business and results of operations as well as our ability to pay distributions are likely to be adversely affected and the market price of our shares may decline. In addition, the coordination of our internal management and investment activities is likely to suffer if we are unable to identify and reach an agreement with a single institution or group of executives having the expertise possessed by our investment adviser and its affiliates. Even if we were able to retain comparable management, whether internal or external, the integration of such management and their lack of familiarity with our investment objective might result in additional costs and time delays that could adversely affect our financial condition, business and results of operations.
Operating under the constraints imposed on us as a business development company and a regulated investment company may hinder the achievement of our investment objectives.
The 1940 Act imposes numerous constraints on the operations of business development companies. For example, business development companies are required to invest at least 70% of their total assets primarily in securities of U.S.-based private companies or public companies with market capitalizations of less than $250 million, cash, cash equivalents, U.S. government securities and other high quality debt instruments that mature in one year or less. In addition, qualification for taxation as a regulated investment company, or RIC, requires satisfaction of source-of-income, diversification and distribution requirements. These constraints, among others, may hinder Keating Investments’ ability to take advantage of attractive investment opportunities and to achieve our investment objective.
Regulations governing our operation as a business development company affect our ability to and the way in which we raise additional capital, which may expose us to risks, including the typical risks associated with leverage.
Although we do not intend to borrow funds or issue senior securities, including preferred stock, in the foreseeable future to finance the purchase of our investments in portfolio companies, we have the discretion to do so. However, we will not borrow funds or issue senior securities, including preferred stock, to finance the purchase of our investment in portfolio companies for at least one year from the date of the completion of any equity offering. Although the use of leverage is not currently contemplated, we may issue debt securities or preferred stock and/or borrow money from banks or other financial institutions, which we refer to collectively as “senior securities,” up to the maximum amount permitted by the 1940 Act. Our Board of Directors is required under the 1940 Act to approve any issuance of senior securities. Under the provisions of the 1940 Act, we will be permitted, as a business development
43
Table of Contents
company, to issue senior securities in amounts such that our asset coverage ratio, as defined in the 1940 Act, equals at least 200% of gross assets less all liabilities and indebtedness not represented by senior securities, after each issuance of senior securities. If the value of our assets declines, we may be unable to satisfy this test. If that were to happen, we might be required to sell a portion of our investments and, depending on the nature of our leverage, repay a portion of our indebtedness at a time when such sales may be disadvantageous. Furthermore, any amounts that we use to service our indebtedness would not be available for distributions to our common stockholders.
If in the future we issue debt or preferred stock, all of the costs of offering and servicing such debt or preferred stock, including interest or preferential dividend payments thereon, will be borne by our common stockholders. The interests of the holders of any debt or preferred stock we may issue will not necessarily be aligned with the interests of our common stockholders. In particular, the rights of holders of our debt or preferred stock to receive interest, dividends or principal repayment will be senior to those of our common stockholders. Also, in the event we issue preferred stock, the holders of such preferred stock may have the ability to elect two members of our Board of Directors. In addition, we may grant a lender a security interest in a significant portion or all of our assets, even if the total amount we may borrow from such lender is less than the amount of such lender’s security interest in our assets. In no event, however, will any lender to us have any veto power over, or any vote with respect to, any change in our, or approval of any new, investment objective or investment policies or strategies.
If our common stock trades below its net asset value per share, our ability to raise additional equity capital will be adversely affected, and any offering of our common stock at a price below net asset value will result in immediate dilution to existing stockholders upon the closing of any such offering.
We are not generally able to issue and sell our common stock at a price below net asset value per share. We may, however, sell our common stock, or warrants, options or rights to acquire our common stock, at a price below the then-current net asset value of our common stock if our Board of Directors determines that such sale is in the best interests of Keating Capital and its stockholders, and our stockholders approve such sale. In this regard, at our 2012 Annual Meeting of Stockholders our stockholders approved a proposal to sell or otherwise issue up to 50% of our outstanding shares of common stock at a price below our net asset value per share at the time of such issuance. Our Board of Directors has also adopted a policy which prohibits us from selling or issuing shares of our common stock at an offering price per share which represents a discount to the then current net asset value per share of more than 15%.
If our common stock trades below net asset value, the higher dilution to our existing stockholders may result in it being unattractive to raise new equity, which may limit our ability to grow. The risk of trading below net asset value is separate and distinct from the risk that our net asset value per share may decline.
If we were to issue shares at a price below net asset value, such sales would result in an immediate dilution to existing common stockholders, which would include a reduction in the net asset value per share as a result of the issuance. This dilution would also include a proportionately greater decrease in a stockholder’s interest in our earnings and assets and voting interest in us than the increase in our assets resulting from such issuance.
In addition, if we determine to conduct additional offerings in the future there may be even greater discounts if we determine to conduct such offerings at prices below net asset value. As a result, existing stockholders would experience further dilution and additional discounts to the price of our common stock. Because the number of shares of common stock that could be so issued and the timing of any issuance is not currently known, the actual dilutive effect of an offering cannot be predicted.
We will be subject to corporate-level income tax if we are unable to qualify as a regulated investment company, or RIC.
Effective January 1, 2010, we elected to be treated for tax purposes as a regulated investment company, or RIC, under the Code. We intend to operate so as to qualify as a RIC in future taxable years, however, no assurance can be given that we will be able to continue to qualify for and maintain RIC status in future years. In order to qualify for the special treatment accorded to a RIC, we must meet certain income source, asset diversification and annual distribution requirements. In order to satisfy the income source requirement, we must derive in each taxable year at least 90% of our gross income from dividends, interest, payments with respect to certain securities loans, gains from the sale of stock or other securities or foreign currencies, income from “qualified publicly traded partnerships” or other income derived with respect to our business of investing in such stock or securities. To qualify as a RIC, we must also meet certain asset diversification requirements at the end of each quarter of our taxable year. Failure to meet these tests may result in our having to dispose of certain investments quickly in order to prevent the loss of RIC status. Because most of our investments will be in private companies, any such dispositions could be made at disadvantageous prices and may result in substantial losses. In order to satisfy the annual distribution requirement for a RIC, we must distribute at least 90% of our investment company taxable income (which is generally our net ordinary income plus the excess, if any, of realized net short-term capital gains over realized net long-term capital losses), if any, to our stockholders on an annual basis. Although we do not intend to borrow funds or
44
Table of Contents
issue senior securities, including preferred stock, in the foreseeable future to finance the purchase of our investments in portfolio companies, we have the discretion to do so. However, we will not borrow funds or issue senior securities, including preferred stock, to finance the purchase of our investment in portfolio companies for at least one year from the date of the completion of any equity offering. Although the use of leverage is not currently contemplated, because we may use debt financing, we may be subject to certain asset coverage ratio requirements under the 1940 Act and financial covenants under loan and credit agreements that could, under certain circumstances, restrict us from making distributions necessary to satisfy the annual distribution requirement. If we are unable to obtain cash from other sources, we may fail to qualify for special tax treatment as a RIC and, thus, may be subject to corporate-level income tax on all our income. If we fail to qualify as a RIC for any reason and remain or become subject to corporate income tax, the resulting corporate-level federal taxes could substantially reduce our net assets, the amount of income available for distribution, and the amount of our distributions. Such a failure would have a material adverse effect on us and our stockholders.
We may have difficulty paying our required distributions if we recognize income before or without receiving cash representing such income.
Although we focus on achieving capital gains from our equity investments, in certain limited cases we may receive current income, either through interest or dividend payments, on our investments. While our preferred stock investments typically carry a dividend rate, in some cases with a payment preference over other classes of equity, we do not expect dividends (whether cumulative or non-cumulative) to be declared and paid on our preferred stock investments, or on our common stock investments, since our portfolio companies typically prefer to retain profits, if any, in their businesses. In the event that dividends are declared and paid on our preferred stock investments, it is possible that such preferred dividends may be paid in the form of preferred or common shares of the portfolio company. Because in certain cases we may recognize such current income before or without receiving cash representing such income, we may have difficulty satisfying the annual distribution requirement applicable to RICs. Accordingly, we may have to sell some of our investments at times we would not consider advantageous, raise additional debt or equity capital or reduce new investments to meet these distribution requirements. If we are not able to obtain cash from other sources, we may fail to qualify for RIC tax treatment and thus be subject to corporate-level income tax.
Even in the event the value of your investment declines, the base management fee will still be payable.
The annual base management fee is calculated as 2% of the value of our gross assets, which we pay monthly in arrears. The base management fee is payable regardless of whether the value of our gross assets or your investment declines. As a result, we may owe Keating Investments a base management fee regardless of whether we incurred significant realized capital losses and unrealized capital depreciation (losses) during the period for which the base management fee is paid.
We incur significant costs as a result of being a public company.
As a public company, we incur legal, accounting and other expenses, including costs associated with the periodic reporting requirements applicable to a company whose securities are registered under the Exchange Act, as well as additional corporate governance requirements, including requirements under the Sarbanes-Oxley Act, and other rules implemented by the SEC.
Our Board of Directors is authorized to reclassify any unissued shares of our stock into one or more classes of preferred stock, which could convey special rights and privileges to its owners.
Our charter permits our Board of Directors to reclassify any authorized but unissued shares of stock into one or more classes of preferred stock. Our Board of Directors will generally have broad discretion over the size and timing of any such reclassification, subject to a finding that the reclassification and issuance of such preferred stock is in the best interests of Keating Capital and our existing common stockholders. Any issuance of preferred stock would be subject to certain limitations imposed under the 1940 Act, including the requirement that such preferred stock have equal voting rights with our outstanding common stock. We are authorized to issue up to 200,000,000 shares of common stock and, as of December 31, 2012, we had 9,174,785 shares of common stock issued and outstanding. In the event our Board of Directors opts to reclassify a portion of our unissued shares of common stock into a class of preferred stock, those preferred shares would have a preference over our common stock with respect to dividends and liquidation. The cost of any such reclassification would be borne by our existing common stockholders. In addition, the 1940 Act provides that holders of preferred stock are entitled to vote separately from holders of common stock to elect two directors. As a result, our preferred stockholders would have the ability to reject a director that would otherwise be elected by our common stockholders. In addition, while Maryland law generally requires directors to act in the best interests of all of a corporation’s stockholders, there can be no assurance that a director elected by our preferred stockholders would not chose to act in a manner that tends to favors our preferred stockholders, particularly where there was a conflict between the interests of our preferred stockholders and our common stockholders. The class voting rights of any preferred shares we may issue could make it more difficult for us to take some actions that may, in the future, be proposed by the Board of Directors and/or the holders of our common stock, such as a merger, exchange of securities, liquidation, or alteration of the rights of a class of our securities, if these actions were perceived by the holders of preferred
45
Table of Contents
shares as not in their best interests. The issuance of preferred shares convertible into shares of common stock might also reduce the net income and net asset value per share of our common stock upon conversion. These effects, among others, could have an adverse effect on your investment in our common stock.
Our Board of Directors may change our investment objective, operating policies and strategies without prior notice or stockholder approval, the effects of which may be adverse.
Our Board of Directors has the authority to modify or waive certain of our investment objective, current operating policies, investment criteria and strategies without prior notice and without stockholder approval (except as required by the 1940 Act). We cannot predict the effect any changes to our investment objective, current operating policies, investment criteria and strategies would have on our business, net asset value, operating results and value of our stock. However, the effects might be adverse, which could negatively impact our ability to pay you distributions and cause you to lose all or part of your investment.
Changes in laws or regulations governing our operations may adversely affect our business.
We and our portfolio companies are subject to regulation by laws at the local, state and federal levels. These laws and regulations, as well as their interpretation, may be changed from time to time. For example, although the Dodd-Frank Wall Street Reform and Protection Act, or the Dodd-Frank Act, became effective on July 21, 2010, many provisions of the Dodd-Frank Act have delayed effectiveness or will not become effective until the relevant federal agencies issue new rules to implement the Dodd-Frank Act. Any change in these laws or regulations, and the issuance of the implementing regulations under the Dodd-Frank Act, could have a material adverse effect on our business and the value of your investment.
Provisions of the Maryland General Corporation Law and of our charter and bylaws could deter takeover attempts and have an adverse impact on the price of our common stock.
Our charter and bylaws, as well as certain statutory and regulatory requirements, contain certain provisions that may have the effect of discouraging a third party from making an acquisition proposal for us. Our bylaws contain a provision exempting any and all acquisitions by any person of our shares of stock from the Control Share Act under the Maryland General Corporation Law. If our Board of Directors does not otherwise approve a business combination, the Control Share Act (if we amend our bylaws to be subject to that Act) may discourage others from trying to acquire control of us and increase the difficulty of consummating any offer. Additionally, under our charter, our Board of Directors may, without stockholder action, authorize the issuance of shares of stock in one or more classes or series, including preferred stock; and our Board of Directors may, without stockholder action, amend our charter to increase the number of shares of stock of any class or series that we have authority to issue. These antitakeover provisions may inhibit a change of control in circumstances that could give the holders of our common stock the opportunity to realize a premium over the market price for our common stock.
Continued global economic uncertainty could materially adversely impact our business and the value of your investment.
Beginning in the fall of 2008, the global economy entered a financial crisis and recession. Volatile capital and credit markets, declining business and consumer confidence and increased unemployment precipitated a continuing economic slowdown. While certain economic conditions in the United States have shown signs of improvement, economic growth has been slow and uneven as consumers continue to be affected by high unemployment rates and depressed housing values. In addition, recent concerns and events such as economic uncertainty surrounding financial regulatory reform and its effect on the revenues of financial services companies, U.S. debt and budget matters and the sovereign debt crisis in Europe, may continue to impact economic recovery and the financial services industry. There can be no assurance that governmental or other measures to aid economic recovery will be effective. During such economic uncertainty and market volatility, we may have difficulty raising equity capital to fund additional portfolio company investments once we become fully invested. Continued adverse economic conditions could also have a material adverse effect on our portfolio companies (including their ability to complete IPOs), our business and the value of your investment.
The downgrade in the U.S. credit rating could materially adversely impact our business, financial condition and results of operations.
On August 5, 2011, Standard & Poor’s Rating Services (“S&P”) downgraded the U.S. credit rating from its top rank of AAA to AA+. The downgrade of the U.S. credit rating could have a material adverse effect on the financial markets and economic conditions in the United States and throughout the world. Additionally, austerity measures necessary to reduce the deficit could result in a slowing economy in the near term. The impact of this or any further downgrades to the U.S. government’s sovereign credit rating, or its perceived creditworthiness, and the impact of the current crisis in Europe with respect to the ability of certain European Union countries to continue to service their sovereign debt obligations is inherently unpredictable and could adversely effect the U.S. and global financial markets and economic conditions.
46
Table of Contents
In addition, adverse market and economic conditions that could occur due to a downgrade of the U.S. credit rating on the United States’ debt could result in increasing borrowing costs, a falling dollar, less stable financial markets and slowing or negative economic growth in the near term. These events could adversely affect our business in a variety ways, including, but not limited to, adversely impacting our portfolio companies’ ability to obtain financing, or obtaining financing but at significantly higher costs or lower valuations than the preceding financing rounds. Market disruptions could also delay the timing of going public by our private portfolio companies and affect the value of our publicly traded portfolio companies, which as of December 31, 2012, accounted for 12.4% percent of our investment portfolio and 10.9% of our gross assets. If any of these events were to occur, it could materially adversely affect our business, financial condition and results of operations.
In addition to the downgrade of the U.S. credit rating, on August 8, 2011, S&P downgraded the credit ratings of Fannie Mae, Freddie Mac, and other entities linked to long-term U.S. debt. As of December 31, 2012, our portfolio included $8.7 million of money market funds that invest in U.S. Treasurys and other U.S. Government agency-backed securities. These money market funds could be adversely affected by future credit downgrades.
Risks Related to Our Common Stock
Investing in shares of our common stock is highly speculative and an investor could lose all or some of the amount invested.
We are focused on capital appreciation and growth, which we seek to achieve through investments in the equity securities of later stage, private, pre-IPO companies. By design, our fund has been structured as a high risk/high return investment vehicle. Our investment objective and strategies result in a high degree of risk in our investments and may result in losses in the value of our investment portfolio. Our investments in portfolio companies are highly speculative and, therefore, an investor in our common stock may lose his entire investment. Write-downs of securities of our privately held companies will always be a by-product and risk of our business, and there can be no assurance that we will be able to achieve our targeted return on our portfolio company investments if and when they go public. An investment in our common stock may not be suitable for investors with lower risk tolerance.
Our common stock price may be volatile and may decrease substantially.
Since shares of our common stock were listed on the Nasdaq Capital Market beginning December 12, 2011, the trading price of our common stock has fluctuated substantially. We expect that the trading price of our common stock will continue to fluctuate substantially. The price of our common stock in the market on any particular day depends on many factors, some of which are beyond our control and may not be directly related to our operating performance. These factors include, but are not limited to, the following:
| • | price and volume fluctuations in the overall stock market from time to time; |
| • | investor demand for our shares; |
| • | significant volatility in the market price and trading volume of securities of regulated investment companies, business development companies or other financial services companies; |
| • | changes in regulatory policies or tax guidelines with respect to regulated investment companies or business development companies; |
| • | failure to qualify as a RIC for a particular taxable year, or the loss of RIC status; |
| • | actual or anticipated changes in our earnings, fluctuations in our operating results and net asset value, or changes in the expectations of securities analysts; |
| • | general economic conditions and trends; |
| • | fluctuations in the valuation of our portfolio investments; |
| • | public perception of the value of our portfolio companies; |
| • | operating performance of companies comparable to us; |
47
Table of Contents
| • | market sentiment against the industry sectors in which invest in such as technology, Internet and software, and cleantech; or |
| • | departures of any of the principals or other investment professionals of Keating Investments. |
In the past, following periods of volatility in the market price of a company’s securities, securities class action litigation has often been brought against that company. Due to the potential volatility of our stock price, we may therefore be the target of securities litigation in the future. Securities litigation could result in substantial costs and divert management’s attention and resources from our business.
Our shares might trade at premiums that are unsustainable or at discounts from net asset value.
Shares of business development companies like us may, during some periods, trade at prices higher than their net asset value per share and, during other periods, as frequently occurs with closed-end investment companies, trade at prices lower than their net asset value per share. The perceived value of our investment portfolio may be affected by a number of factors including perceived prospects for individual companies we invest in, market conditions for common stock investments generally, for initial public offerings and other exit events for venture capital-backed companies, and the mix of companies in our investment portfolio over time. Because accurate financial and other data on our portfolio companies may be limited and not publicly disseminated, the public perception of their value may be unduly influenced by trading levels on secondary marketplaces, speculation about their prospects, market conditions, uninformed investor sentiment or other factors. Negative or unforeseen developments affecting the perceived value of companies in our investment portfolio could result in a decline in the trading price of our common stock relative to our net asset value per share. We cannot ever predict whether shares of our common stock will trade above, at or below our net asset value.
The possibility that our shares will trade at a discount from net asset value or at premiums that are unsustainable are risks separate and distinct from the risk that our net asset value per share will decrease. The risk of purchasing shares of a business development company that might trade at a discount or unsustainable premium is more pronounced for investors who wish to sell their shares in a relatively short period of time because, for those investors, realization of a gain or loss on their investments is likely to be more dependent upon changes in premium or discount levels than upon increases or decreases in net asset value per share.
Sales of substantial amounts of our common stock in the public market may have an adverse effect on the market price of our common stock.
If we conduct additional offerings to sell additional shares of our common stock, the prevailing market price for our common stock could be adversely affected. If this occurs and continues, it could impair our ability to raise additional capital through the sale of equity securities should we desire to do so.
There is a risk that you may not receive dividends or that our dividends may not grow over time, particularly since we invest primarily in securities that do not produce current income, and any dividends we do pay are expected to vary significantly from year to year.
We cannot assure you that we will achieve investment results or maintain a tax status that will allow or require any specified level of cash distributions or year-to-year increases in cash distributions. The amount and timing of any distributions to our stockholders will fluctuate substantially because the source of our distributions will be solely from net capital gains (which we define for this purpose as our realized capital gains in excess of realized capital losses during the year, without regard to the long-term or short-term character of such gains or losses), if any, that we realize from the dispositions of our portfolio company investments. Since our equity investments typically do not generate current income (i.e., dividends or interest income), we will not generate net ordinary income from which we could make distributions to our stockholders, which makes us different from other business development companies that primarily make debt investments and may pay dividends from their interest income to stockholders on a more regular basis. As we intend to focus on making primarily capital gains-based investments in equity securities, which will not be income producing, we do not anticipate that we will pay distributions regularly on a quarterly basis or become a predictable issuer of dividends, and we expect that our dividends, if any, will be less consistent than other business development companies that primarily make debt investments.
Our ability to pay distributions will be based on our ability to invest our capital in securities of suitable portfolio companies in a timely manner, our portfolio companies achieving a liquidity event, and our ability to dispose of our publicly traded portfolio positions at a gain. There is no assurance that our portfolio companies will complete an IPO or other liquidity event or that we will be able to realize any net capital gains from the sale of our publicly traded portfolio company investments. Accordingly, there can be no assurance that we will pay distributions to our stockholders in the future, and that any distributions we do pay to stockholders will be paid only from net capital gains, if any, realized from the disposition of our portfolio company investments, after reduction for any
48
Table of Contents
incentive fees payable to our investment adviser, our operating expenses, and any other retained amounts. Moreover, to the extent that we make such distributions in the future, the timing and amount of such distributions will be irregular and vary significantly from year to year.
In addition, any unrealized depreciation in our investment portfolio could be an indication that we will be unable to recover the cost of our investment when we dispose of it in the future. This could result in realized capital losses in the future and ultimately in reductions of our net capital gains available for distribution in future periods.
A portion of our distributions may constitute a return of capital and affect our stockholders’ tax basis in our shares.
We plan to make distributions from any assets legally available for distribution and will be required to determine the extent to which such distributions are paid out of current or accumulated earnings, realized capital gains or are returns of capital. To the extent there is a return of capital, investors will be required to reduce their cost basis in our stock for federal tax purposes, which will result in higher tax liability when the shares are sold, even if they have not increased in value or have lost value. In addition, any return of capital paid out of offering proceeds will be net of any sales load and offering expenses associated with sales of shares of our common stock.
We may retain some or all of our realized net capital gain to pay any incentive fees payable to our investment adviser and to pay our operating expenses, which may result in a deemed distribution to our stockholders.
Our Board of Directors currently maintains a distribution policy with the objective of distributing our net capital gains (which we define for this purpose as our realized capital gains in excess of realized capital losses during the year, without regard to the long-term or short-term character of such gains or losses), if any, after reduction for any incentive fees payable to our investment adviser, our operating expenses, and any other retained amounts. Our distributions will also depend on our financial condition, maintenance of our RIC status, corporate-level income and excise tax planning, compliance with applicable business development company regulations and such other factors as our Board of Directors may deem relevant from time to time. The amounts we retain from our distributions of realized net capital gains, including incentive fees and our operating expenses, may be designated as a deemed distribution to stockholders. In such case, among other consequences, we will pay corporate-level tax on the retained amount, each U.S. stockholder will be required to include its share of the deemed distribution in income as if it had been actually distributed to the U.S. stockholder, and the U.S. stockholder will be entitled to claim a credit or refund equal to its allocable share of the corporate-level tax we pay on the retained realized net capital gains.
The market price of our shares of common stock may be adversely affected by the sale of shares by our management or large stockholders.
Sales of our shares of common stock by our officers through 10b5-1 plans or by large shareholders could adversely and unpredictably affect the price of those securities. Additionally, the price of our shares of common stock could be affected even by the potential for sales by these persons. We cannot predict the effect that any future sales of our common stock, or the potential for those sales, will have on our share price. Furthermore, due to relatively low trading volume of our stock, should one or more large stockholders seek to sell a significant portion of its stock in a short period of time, the price of our stock may decline.
If we sell common stock at a discount to our net asset value per share, stockholders who do not participate in such sale will experience immediate dilution in an amount that may be material.
At our 2012 Annual Meeting of Stockholders, our stockholders approved a proposal to sell or otherwise issue up to 50% of our outstanding shares of common stock at a price below our net asset value per share at the time of such issuance. Our Board of Directors has also adopted a policy which prohibits us from selling or issuing shares of our common stock at an offering price per share which represents a discount to the then current net asset value per share of more than 15%. No change can be made to this policy without unanimous approval of our independent directors. We cannot issue shares of our common stock at a price below net asset value unless our Board of Directors determines that it would be in our and our stockholders’ best interests to do so. If our stockholders grant us such approval, the issuance or sale by us of shares of our common stock at a discount to net asset value poses a risk of dilution to our stockholders. In particular, stockholders who do not purchase additional shares of common stock at or below the discounted price in proportion to their current ownership will experience an immediate decrease in net asset value per share (as well as in the aggregate net asset value of their shares of common stock if they do not participate at all). These stockholders will also experience a disproportionately greater decrease in their participation in our earnings and assets and their voting power than the increase we experience in our assets, potential earning power and voting interests from such issuance or sale. In addition, such sales may adversely affect the price at which our common stock trades.
49
Table of Contents
| Item 1B. | Unresolved Staff Comments |
Not applicable.
| Item 2. | Properties |
We do not own any real estate or other physical properties materially important to our operation. Our headquarters are located at 5251 DTC Parkway, Suite 1100, Greenwood Village, Colorado, 80111, where we occupy our office space pursuant to our Investment Advisory and Administrative Services Agreement with Keating Investments. We believe that our office facilities are suitable and adequate for our business as it is presently conducted. Our investment adviser also maintains an office in Menlo Park, California for the origination of portfolio company investment opportunities.
| Item 3. | Legal Proceedings |
We are not currently subject to any material legal proceedings, nor, to our knowledge, is any material legal proceeding threatened against us. From time to time, we may be a party to certain legal proceedings in the ordinary course of business, including proceedings relating to the enforcement of our rights under contracts with our portfolio companies. While the outcome of these legal proceedings cannot be predicted with certainty, we do not expect that these proceedings will have a material effect upon our financial condition or results of operations.
| Item 4. | Mine Safety Disclosures |
Not applicable.
50
Table of Contents
| Item 5. | Market for Registrant’s Common Equity, Related Stockholder Matters and Issuer Purchases of Equity Securities |
Price Range of Common Stock
Our common stock was listed and began trading on the Nasdaq Capital Market on December 12, 2011. Our shares of common stock are traded under the symbol “KIPO.” The following table sets forth the range of high and low sales prices of our common stock as reported on the Nasdaq Capital Market for the period beginning December 12, 2011, our initial listing date, through December 31, 2012.
| Price Range | ||||||||
| Quarter Ended | High | Low | ||||||
| December 31, 2011 |
$ | 10.73 | $ | 8.00 | ||||
| March 31, 2012 |
$ | 9.69 | $ | 6.51 | ||||
| June 30, 2012 |
$ | 7.96 | $ | 5.72 | ||||
| September 30, 2012 |
$ | 7.80 | $ | 6.16 | ||||
| December 31, 2012 |
$ | 7.40 | $ | 6.08 | ||||
The last reported price for our common stock on February 14, 2013 was $6.46 per share.
As of February 14, 2013, we had approximately 1,100 stockholders of record. Approximately 73% of the outstanding shares of our common stock are held by brokers and other institutions on behalf of stockholders. We believe that there are currently approximately 2,800 additional beneficial holders of our common stock.
Shares of business development companies like us may, during some periods, trade at a market price higher than our net asset value per share and, during other periods, as frequently occurs with closed-end investment companies, trade at a market price lower than our net asset value per share. The possibility that our shares will trade at a discount from net asset value or at premiums that are unsustainable are risks separate and distinct from the risk that our net asset value per share will decrease. We cannot predict whether our common stock may trade at prices that are at, above, or below our net asset value.
Sales of Unregistered Securities
On May 14, 2008, our investment adviser, Keating Investments, purchased 100 shares of our common stock at a price of $10.00 per share as our initial capital. On November 12, 2008, we completed the final closing of our private placement offering. We sold a total of 569,800 shares of our common stock in our private placement offering at a price of $10.00 per share raising aggregate gross proceeds of $5,698,000. After the payment of commissions and other offering costs of approximately $454,566, we received aggregate net proceeds of approximately $5,243,434 in connection with our private placement offering. Our current officers and directors acquired 145,200 shares of our common stock in this private offering.
Issuer Purchases of Equity Securities
On May 9, 2012, our Board of Directors authorized a stock repurchase program of up to $5.0 million. Under the repurchase program, we are authorized to repurchase shares of our common stock in open market transactions, including through block purchases, depending on prevailing market conditions and other factors. Our stock repurchase program was originally set to expire on November 8, 2012; however, on October 26, 2012, our Board of Directors extended our stock repurchase program for an additional six months. The program will now expire on May 8, 2013, unless extended further by our Board of Directors. The repurchase program may be extended, modified or discontinued at any time for any reason. The repurchase program does not obligate us to acquire any specific number of shares, and all repurchases will be made in accordance with Rule 10b-18 under the Exchange Act, which sets certain restrictions on the method, timing, price and volume of stock repurchases. Since the inception of our stock repurchase program in May 2012 through December 31, 2012, we have repurchased 108,996 shares of our common stock at an average price of $7.01 per share, including commissions, for a total cost of $764,179. Details of the monthly share repurchases under our stock repurchase program during the year ended December 31, 2012 are set forth in the table below.
51
Table of Contents
| Period | Total Number of Shares Repurchased |
Total Cost of Shares Repurchased |
Average Price Paid per Share |
Total Number
of Shares Purchased as Part of the Publicly Announced Program (1) |
Total Cost of
Shares Purchased as Part of the Publicly Announced Program (1) |
Maximum Dollar Value of Shares that May Yet be Purchased Under the Program (1) |
||||||||||||||||||
| April 2012 |
— | $ | — | $ | — | — | $ | — | $ | — | ||||||||||||||
| May 2012 |
4,159 | 29,221 | 7.03 | 4,159 | 29,221 | 4,970,779 | ||||||||||||||||||
| June 2012 |
34,829 | 247,977 | 7.12 | 34,829 | 247,977 | 4,722,802 | ||||||||||||||||||
| July 2012 |
— | — | — | — | — | 4,722,802 | ||||||||||||||||||
| August 2012 |
5,469 | 38,648 | 7.07 | 5,469 | 38,648 | 4,684,154 | ||||||||||||||||||
| September 2012 |
26,013 | 193,097 | 7.42 | 26,013 | 193,097 | 4,491,057 | ||||||||||||||||||
| October 2012 |
— | — | — | — | — | 4,491,057 | ||||||||||||||||||
| November 2012 |
26,970 | 178,867 | 6.63 | 26,970 | 178,867 | 4,312,190 | ||||||||||||||||||
| December 2012 |
11,556 | 76,369 | 6.61 | 11,556 | 76,369 | 4,235,821 | ||||||||||||||||||
| Total - 2012 |
108,996 | $ | 764,179 | $ | 7.01 | 108,996 | $ | 764,179 | ||||||||||||||||
| (1) | On May 9, 2012, our Board of Directors authorized a stock repurchase program of up to $5.0 million. The stock repurchase program was originally set to expire on November 8, 2012; however, on October 26, 2012, our Board of Directors extended our stock repurchase program for an additional six months. The program will now expire on May 8, 2013, unless extended further by our Board of Directors. |
Issuance of Common Stock Below Net Asset Value
At our 2012 Annual Meeting of Stockholders, our stockholders approved a proposal to issue up to 50% of our outstanding shares of common stock at a price (after reduction for commissions and discounts) below our net asset value per share at the time of such issuance. Our Board of Directors has also adopted a policy which prohibits us from selling or issuing shares of our common stock at an offering price per share (offering price to public before commissions and discounts) which represents a discount to the then current net asset value per share of more than 15%. This authorization will expire on the earlier of June 1, 2013 or the date of our 2013 Annual Meeting of Stockholders. In order to sell shares pursuant to this authorization, we cannot sell or issue shares of our common stock at a price below our net asset value per share at the time unless our Board of Directors determines that such sale or issuance would be in our and our stockholders’ best interests. Sales of our common stock at a price below our net asset value per share will dilute the interests of existing stockholders, have the effect of reducing our net asset value per share, and may reduce our market price per share. In addition, continuous sales of common stock below net asset value may have a negative impact on total returns and could have a negative impact on the market price of our shares of common stock. As of December 31, 2012, we have not issued any of our shares of common stock below net asset value pursuant to this authorization.
Distribution Policy
Dividends and distributions to our common stockholders must be approved by our Board of Directors and any dividend payable is recorded on the ex-dividend date. On February 11, 2011, our Board of Directors declared a special cash distribution of $446,837, or $0.13 per share outstanding on the record date. The distribution was paid on February 17, 2011 to our stockholders of record as of February 15, 2011. This special cash distribution was based on the unrealized appreciation we had recorded on our NeoPhotonics investment at the time of the distribution, following NeoPhotonics’ completion of its IPO. In the future, we do not expect to pay distributions based on the unrealized appreciation of our private or public company investments.
On December 6, 2012, our Board of Directors declared a cash distribution of $282,203, or approximately $0.03 per share outstanding on the record date. The distribution was paid on December 26, 2012, to stockholders of record as of December 14, 2012. This distribution represented a distribution of our net realized capital gains for 2012.
The following table summarizes the cash dividends declared and paid or to be paid on the outstanding shares of common stock to date:
| Date Declared |
Record Date | Payment Date | Amount Per Share |
|||||||||
| February 11, 2011 |
February 15, 2011 | February 17, 2011 | $ | 0.13 | ||||||||
| December 6, 2012 |
December 14, 2012 | December 26, 2012 | $ | 0.03 | ||||||||
|
|
|
|||||||||||
| $ | 0.16 | |||||||||||
52
Table of Contents
For federal income tax purposes, distributions paid to our stockholders are characterized and reported as ordinary income, return of capital, long term capital gains or a combination thereof. Distributions in excess of our accumulated earnings and profits would generally be treated first as a return of capital to the extent of the stockholder’s tax basis, and any remaining distributions would be treated as a capital gain. The determination of the tax attributes of our distributions is made annually as of the end of our fiscal year based upon our taxable income for the full year and distributions paid for the full year. There can be no certainty to stockholders that this determination is representative of what the tax attributes of our future distributions to stockholders, if any, will actually be. Each year a statement on Form 1099-DIV identifying the source of the distribution (i.e., paid from ordinary income, paid from net capital gains on the sale of portfolio company investments, and/or a return of capital which is a nontaxable distribution) is mailed to our stockholders. Our distribution of $446,837 to stockholders in February 2011 was characterized as a return of capital for federal income tax purposes since we did not generate any investment company taxable income or realized net capital gains during the year ended December 31, 2011. Our distribution of $282,203 to stockholders in December 2012 was characterized as a long-term capital gain distribution for federal income tax purposes since it represented a distribution of our net realized capital gains for 2012.
Distributions to our stockholders will be payable only as and when declared by our Board of Directors and will be paid out of assets legally available for distribution. All distributions will be paid at the discretion of our Board of Directors. We plan to make distributions from any assets legally available for distribution and will be required to determine the extent to which such distributions are paid out of current or accumulated earnings, realized capital gains or are returns of capital. To the extent there is a return of capital, investors will be required to reduce their cost basis in our stock for federal tax purposes, which will result in higher tax liability when the shares are sold, even if they have not increased in value or have lost value. In addition, any return of capital paid out of offering proceeds will be net of any sales load and offering expenses associated with sales of shares of our common stock.
Our Board of Directors currently maintains a distribution policy with the objective of distributing our net capital gains (which we define for this purpose as our realized capital gains in excess of realized capital losses during the year, without regard to the long-term or short-term character of such gains or losses), if any, after reduction for any incentive fees payable to our investment adviser, our operating expenses, and any other retained amounts. Our Board of Directors currently intends to declare distributions (if any) at least annually, at the end of each year. Since our portfolio company investments will typically not generate current income (i.e., dividends or interest income), we do not expect to generate net ordinary income from which we could make distributions to our stockholders. Our distributions will also depend on our financial condition, maintenance of our RIC status, corporate-level income and excise tax planning, compliance with applicable business development company regulations and such other factors as our Board of Directors may deem relevant from time to time.
We will have substantial fluctuations in our distribution payments to stockholders, since we expect to have an average holding period for our portfolio company investments of up to 36 months. Our ability to pay distributions will be based on our ability to invest our capital in securities of suitable portfolio companies in a timely manner, our portfolio companies achieving a liquidity event through either an IPO or sale of the company, and our ability to dispose of our positions at a gain following the liquidity event. We can give no assurance that we will be able to realize any net capital gains from the sale of our portfolio company investments. Accordingly, there can be no assurance that we will pay distributions to our stockholders in the future, and any distributions we do pay to stockholders will typically be paid only from net capital gains, if any, from the disposition of our portfolio company investments, after reduction for any incentive fees, operating expenses or other retained amounts.
In the event we retain some or all of our realized net capital gains, including amounts retained to pay incentive fees to our investment adviser or our operating expenses, we may designate the retained amount as a deemed distribution to stockholders. In such case, among other consequences, we will pay corporate-level tax on the retained amount, each U.S. stockholder will be required to include its share of the deemed distribution in income as if it had been actually distributed to the U.S. stockholder, and the U.S. stockholder will be entitled to claim a credit or refund equal to its allocable share of the corporate-level tax that we pay on the retained realized net capital gain.
We have adopted an “opt out” dividend reinvestment plan that provides for reinvestment of dividends and distributions on behalf of our stockholders, unless a stockholder elects to receive cash. As a result, if our Board of Directors authorizes, and we declare a cash dividend or distribution, then our stockholders who have not “opted out” of the dividend reinvestment plan will have their cash dividend automatically reinvested in additional whole shares of our common stock (with any fractional share being paid in cash), rather than receiving the cash dividends or distributions. However, our distribution of $446,837 to stockholders in February 2011 was not eligible for reinvestment under the dividend reinvestment plan since our shares of common stock had not been listed on a stock exchange at the time of the distribution.
53
Table of Contents
Performance Graph
Our common stock was listed and began trading on the Nasdaq Capital Market on December 12, 2011. Due to our limited trading history, we do not have five years of performance history and will present annual comparative performance data for: (i) the period beginning December 12, 2011 and ending December 31, 2011, and (ii) the period beginning January 1, 2012 and ending December 31, 2012. The following stock performance graph assumes that the value of the investment in our common stock and in each of the indices was $100 on the beginning of each period, and tracks it through the end of each period (including reinvestment of dividends).
The following stock performance graph compares the cumulative total return of holders of our common stock with the cumulative total return of: (i) the Russell 2000 Index, a broad equity market index that includes companies whose equity securities are traded on the same exchange as us, and (ii) a peer issuer index consisting of four business development companies (with relatively comparable market capitalizations to us) whose investment objective is to maximize capital appreciation with a focus on making equity investments in private portfolio companies. The selected peer issuer index includes: Firsthand Technology Value Fund (Nasdaq:SVVC), GSV Capital Corp. (Nasdaq:GSVC), and Harris & Harris Group, Inc. (Nasdaq:TINY).
The Russell 2000 Index replaces the S&P 500 Index which was used as the broad equity market index in our 2011 annual report. We believe that the Russell 2000 Index, which measures the performance of the small-cap segment of the U.S. equities universe, is a more appropriate broad equity market index because it better reflects the higher price volatility, higher beta, and higher sensitivity of small companies to economic cycles that our portfolio of later stage, venture capital-backed, private companies are more likely to experience. In addition, as the number of equity-focused business development companies such as us has increased over the last two years, we believe the performance of this selected peer issuer index is more appropriate than the Nasdaq Financial 100 Index which was used in our 2011 annual report. However, the following stock performance graph compares our cumulative total return with that of both the newly selected indices and the indices used in our 2011 annual report.
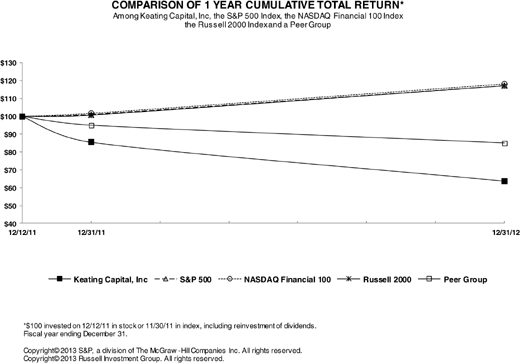
This graph and other information furnished under Part II. Item 5 of this Form 10-K shall not be deemed to be “soliciting material” or to be “filed” with the SEC or subject to Regulation 14A or 14C, or to the liabilities of Section 18 of the 1934 Act. The stock price performance included in the above graph is not necessarily indicative of future stock price performance.
54
Table of Contents
| Item 6. | Selected Financial Data |
The following selected financial data for the years ended December 31, 2012, 2011, 2010 and 2009 and for the period from May 9, 2008 (Inception) through December 31, 2008 is derived from our financial statements which have been audited by Grant Thornton LLP, our independent registered public accounting firm. The data should be read in conjunction with our financial statements and related notes thereto and “Management’s Discussion and Analysis of Financial Condition and Results of Operations” included elsewhere in this annual report.
| At and for the Years Ended | ||||||||||||||||||||
| December 31, 2012 |
December 31, 2011 |
December 31, 2010 |
December 31, 2009 |
At December 31, 2008 and for the Period from May 9, 2008 (Inception) to December 31, 2008 |
||||||||||||||||
| Statement of Operations Data: |
||||||||||||||||||||
| Total investment income |
$ | 3,870 | $ | 54,348 | $ | 54,009 | $ | 10,637 | $ | 14,005 | ||||||||||
| Base management fees |
1,533,808 | 1,153,058 | 218,876 | 90,904 | 11,990 | |||||||||||||||
| Incentive fees |
425,519 | 152,757 | 115,423 | — | — | |||||||||||||||
| Administrative expenses allocated from investment adviser |
633,997 | 450,019 | 404,633 | 269,384 | 28,041 | |||||||||||||||
| Total operating expenses |
4,056,856 | 3,764,370 | 2,031,002 | 1,006,615 | 542,965 | |||||||||||||||
| Net investment loss |
(4,052,986 | ) | (3,710,022 | ) | (1,976,993 | ) | (995,978 | ) | (528,960 | ) | ||||||||||
| Net change in unrealized appreciation on investments |
1,845,390 | 763,784 | 577,116 | — | — | |||||||||||||||
| Net realized gain on investments |
282,203 | — | — | — | — | |||||||||||||||
| Net decrease in net assets resulting from operations |
(1,925,393 | ) | (2,946,238 | ) | (1,399,877 | ) | (995,978 | ) | (528,960 | ) | ||||||||||
| Per Share Data: |
||||||||||||||||||||
| Net asset value per common share |
$ | 8.00 | $ | 8.23 | $ | 7.85 | $ | 6.53 | $ | 8.27 | ||||||||||
| Net investment loss (1) |
(0.44 | ) | (0.54 | ) | (1.43 | ) | (1.75 | ) | (1.79 | ) | ||||||||||
| Net decrease in net assets resulting from operations (1) |
(0.21 | ) | (0.43 | ) | (1.01 | ) | (1.75 | ) | (1.79 | ) | ||||||||||
| Distributions declared (1) |
0.03 | 0.06 | — | — | — | |||||||||||||||
| Balance Sheet Data at Period End: |
||||||||||||||||||||
| Investment in portfolio company securities at fair value |
$ | 65,023,706 | $ | 37,273,980 | $ | 4,177,607 | $ | — | $ | — | ||||||||||
| Short-term investments at fair value |
— | — | 13,500,000 | 3,000,000 | 4,411,127 | |||||||||||||||
| Cash and cash equivalents |
8,934,036 | 39,606,512 | 4,753,299 | 367,918 | 367,588 | |||||||||||||||
| Total assets |
74,385,077 | 76,943,238 | 22,856,713 | 3,903,387 | 4,810,163 | |||||||||||||||
| Total liabilities |
972,137 | 558,523 | 400,313 | 183,891 | 94,689 | |||||||||||||||
| Net assets |
73,412,940 | 76,384,715 | 22,456,400 | 3,719,496 | 4,715,474 | |||||||||||||||
| Common shares outstanding |
9,174,785 | 9,283,781 | 2,860,299 | 569,900 | 569,900 | |||||||||||||||
| (1) | Per share amounts are calculated using weighted average shares outstanding during the period. |
55
Table of Contents
| Item 7. | Management’s Discussion and Analysis of Financial Condition and Results of Operations |
FORWARD-LOOKING STATEMENTS AND PROJECTIONS
This annual report on Form 10-K contains forward-looking statements that involve substantial risks and uncertainties. These forward-looking statements are not historical facts, but are based on current management expectations that involve substantial risks, uncertainties, and other factors, some of which are beyond our control and difficult to predict and could cause actual results to differ materially from those expressed in, or implied by, these forward-looking statements. Forward-looking statements relate to future events or our future financial performance. We generally identify forward-looking statements by terminology such as “may,” “will,” “should,” “expects,” “plans,” “anticipates,” “could,” “intends,” “target,” “projects,” “contemplates,” “believes,” “estimates,” “predicts,” “potential” or “continue” or the negative of these terms or other similar words. Important assumptions include our ability to originate new portfolio company investment opportunities, the success of our portfolio companies in completing an initial public offering within our targeted timeframes, our ability to achieve certain returns on our investments, and our ability to access additional capital. The forward-looking statements contained in this annual report on Form 10-K include statements as to:
| • | our future operating results; |
| • | our business prospects and the prospects of our existing and prospective portfolio companies; |
| • | the impact of the investments we expect to make; |
| • | our ability to identify future portfolio companies that meet our investment criteria; |
| • | the impact of a protracted decline in the market for IPOs on our business; |
| • | our relationships with venture capital firms and investment banks that are the primary sources of our investment opportunities; |
| • | the expected market for venture capital investments in later stage, private, pre-IPO companies; |
| • | the dependence of our future success on the general economy and its impact on the industries in which we invest; |
| • | our ability to access the equity markets to raise capital to fund future portfolio company investments; |
| • | the ability of our portfolio companies to achieve their operating performance objectives and complete an IPO within our targeted timeframe; |
| • | our ability to invest at valuations which allow us to achieve our targeted returns within our expected holding periods; |
| • | our regulatory structure and tax status, including any changes in laws and regulations; |
| • | our ability to operate as a business development company and a regulated investment company; |
| • | the adequacy of our cash resources and working capital; |
| • | our ability to generate realized capital gains from the disposition of our portfolio company interests after they have completed an IPO; |
| • | the timing, form and amount of any dividend distributions; |
| • | the valuation of any investments in portfolio companies, particularly those having no liquid trading market; and |
| • | our ability to recover unrealized losses. |
Although we believe that the assumptions on which these forward-looking statements are based are reasonable, any of those assumptions could prove to be inaccurate, and as a result, the forward-looking statements based on those assumptions also could be inaccurate. In light of these and other uncertainties, the inclusion of a projection or forward-looking statement in this annual report on Form 10-K should not be regarded as a representation by us that our plans and objectives will be achieved. These risks and uncertainties include those described or identified in “Risk Factors” in this annual report on Form 10-K. You should not place undue reliance on these forward-looking statements, which apply only as of the date of this annual report on Form 10-K. Except as required by the federal securities laws, we undertake no obligation to revise or update any forward-looking statements, whether as a result of new information, future events or otherwise, to reflect events or circumstances occurring after the date of this annual report on Form 10-K. The forward-looking statements and projections contained in this annual report on Form 10-K are excluded from the safe harbor protection provided by Section 27A of the Securities Act.
56
Table of Contents
MANAGEMENT’S DISCUSSION AND ANALYSIS
OF FINANCIAL CONDITION AND RESULTS OF OPERATIONS
The following discussion should be read in conjunction with our financial statements and related notes and other financial information appearing elsewhere in this annual report on Form 10-K. In addition to historical information, the following discussion and other parts of this annual report on Form 10-K contain forward-looking information that involves risks and uncertainties. Our actual results could differ materially from those anticipated by such forward-looking information due to the factors discussed under “Risk Factors” and “Forward-Looking Statements and Projections” and the “Risk Factors” appearing elsewhere in this annual report on Form 10-K.
Overview
We are a closed-end, non-diversified investment company that has elected to be regulated as a business development company under the 1940 Act. As a business development company, we are required to comply with certain regulatory requirements. For instance, we generally have to invest at least 70% of our total assets in “qualifying assets,” including securities of private U.S. companies, cash, cash equivalents, U.S. government securities and high-quality debt investments that mature in one year or less. Effective January 1, 2010, we elected to be treated for tax purposes as a regulated investment company, or a RIC, under Subchapter M of the Code. We satisfied the RIC requirements during our 2010, 2011 and 2012 taxable years. See “Material U.S. Federal Income Tax Considerations” above.
We are externally managed by Keating Investments, an investment adviser that was founded in 1997 and is registered under the Advisers Act. As our investment adviser, Keating Investments is responsible for managing our day-to-day operations including, without limitation, identifying, evaluating, negotiating, closing, monitoring and servicing our investments. Keating Investments also provides us with the administrative services necessary for us to operate. Our investment activities are managed by Keating Investments pursuant to the Investment Advisory and Administrative Services Agreement. See “Investment Advisory and Administrative Services Agreement” below.
We specialize in making pre-IPO investments in innovative, emerging growth companies that are committed to and capable of becoming public. We provide investors with the ability to participate in a unique fund that allows our stockholders to share in the potential value accretion that we believe typically occurs once a company transforms from private to public status, or what we refer to as the private-to-public valuation arbitrage. Our shares are listed on Nasdaq under the ticker symbol “KIPO.”
By design, our fund has been structured as a high risk/high return investment vehicle. While we have discretion in the investment of our capital, we seek long-term capital appreciation through investments principally in equity securities that we believe will maximize our total return. Although our preferred stock investments typically carry a dividend rate, in some cases with a payment preference over other classes of equity, we do not expect dividends (whether cumulative or non-cumulative) to be declared and paid on our preferred stock investments, or on our common stock investments, since our portfolio companies typically prefer to retain profits, if any, in their businesses. Accordingly, our equity investments are not expected to generate current income (i.e., dividends or interest income), which makes us different from other business development companies that primarily make debt investments from which they receive current yield in the form of interest income. Our primary source of investment return will be generated from net capital gains, if any, realized on the disposition of our portfolio company investments, which typically will occur after a portfolio company completes an IPO and after expiration of a customary 180-day post-IPO lockup restriction.
Our investment objective is to maximize capital appreciation. We seek to accomplish our capital appreciation objective by making investments in the equity securities of later stage, typically venture capital-backed, pre-IPO companies that are committed to and capable of becoming public. In accordance with our investment objective, we seek to invest in equity securities of principally U.S.-based, private companies with an equity value of between $100 million and $1 billion. We refer to companies with an equity value of between $100 million and less than $250 million as “micro-cap companies” and companies with an equity value of between $250 million and $1 billion as “small-cap companies.”
We have identified three core investment criteria that we believe are important in meeting our investment objective. These core criteria provide the primary basis for making our investment decisions; however, we may not require each prospective portfolio company in which we choose to invest to meet all of these core criteria.
| • | High quality growth companies. We seek to invest primarily in micro-cap and small-cap companies that are already generating annual revenue in excess of $10 million on a trailing 12-month basis and which we believe have growth potential. |
57
Table of Contents
| • | Commitment to complete IPO. We seek to invest in public ready micro-cap and small-cap companies whose management teams are committed to, and capable of, becoming public companies, whose businesses we believe will benefit from status as public companies, and that we believe are capable of completing IPOs and obtaining exchange listings typically within 18 months after we complete our investments. |
| • | Potential for return on investment. Because of the value differential which we believe exists between public and private companies as a result of the liquidity premium, or what we refer to as the private-to-public valuation arbitrage, as discussed below, we seek to make investments that create the potential for a 2x return on our investment once the company is publicly traded and assuming our expected investment horizon of 36 months. We may also pursue investments with a shorter expected investment horizon, where we believe the portfolio company may file for an IPO sooner than 12 months or has a registration statement filed at the time of our investment, in which case our targeted 2x return on our investment may be correspondingly reduced. |
We generally acquire our equity securities principally through direct investments in prospective portfolio companies that meet our investment criteria. However, we may also purchase our equity securities directly from current or former management or early stage investors in private secondary transactions, or from current or former non-management employees where the company or its management is coordinating the transaction process. We use a disciplined approach to our initial investment assessment and continued portfolio monitoring which relies primarily on the detailed financial and business information we receive about the portfolio company and our access to and discussions with management, both prior to and after our investment. We expect that the primary sources of our investment opportunities will be from our relationships with venture capital firms and investment banks. Our investment adviser sources our investments through its principal office located in Greenwood Village, Colorado as well as through an additional office in Menlo Park, California.
Our portfolio company investments are currently composed of, and we anticipate that our portfolio will continue to be composed of, investments primarily in the form of preferred stock that is convertible into common stock, common stock, and warrants exercisable into common or preferred stock. While we expect most of our portfolio company investments to be in the form of equity securities, we may in some cases invest in debentures or loans that are convertible into or settled with common stock. At December 31, 2012, none of our portfolio company investments were convertible debentures or loans.
We believe that investing in an issuer’s most senior equity securities and/or negotiating certain structural protections are ways to potentially mitigate the otherwise high risks associated with pre-IPO investing. The equity securities that we acquire directly from an issuer are typically the issuer’s most senior preferred stock at the time of our investment or, in cases where we acquire common shares, the issuer typically has only common stock outstanding. However, the equity securities that we acquire directly from selling stockholders are typically common stock and may not represent the most senior equity securities of the issuer. Of the 20 portfolio company investments we have made, at the time of our initial investment in these companies, 17 of these initial investments represented the portfolio company’s most senior preferred stock, two of these initial investments represented common shares where the portfolio company had only common stock outstanding, and in one initial investment in the common shares of Stoke, which we acquired from Stoke employees, we did not acquire the portfolio company’s most senior equity securities since Stoke had preferred stock outstanding at the time of our initial investment. We invested in Stoke because we believed it represented an opportunity to invest in a company that met our investment criteria even though it was not looking to raise additional equity financing at the time.
During 2012, we disposed of our entire interest in NeoPhotonics. As a result, our portfolio as of December 31, 2012 consisted of 19 companies, two publicly traded companies, Solazyme and LifeLock, and 17 private companies.
As of December 31, 2012, we held investments in 19 portfolio companies, which consisted of the most senior preferred equity in 10 of the companies (of which two of our investments have a pari passu preference with a subsequently issued series of preferred stock), common stock in two private companies whose capitalizations consisted of only common stock (Corsair and TrueCar), and common stock in two publicly traded companies (Solazyme and LifeLock). As of December 31, 2012: (i) our Series B preferred stock investment in Harvest Power is no longer Harvest Power’s most senior preferred stock because Harvest Power issued more senior preferred stock in a Series C preferred stock round in March 2012 in which we did not participate, (ii) our common stock investment in Stoke does not consist of Stoke’s most senior equity securities since Stoke had preferred stock outstanding at the time of our initial investment, (iii) our preferred stock investments in Livescribe were converted into common stock in December 2012 and, as such, our common stock is no longer Livescribe’s most senior equity securities since Livescribe continues to have more senior preferred stock outstanding, (iv) our Series C preferred stock investment in Agilyx is no longer Agilyx’s most senior preferred stock because Agilyx issued more senior preferred stock in a Series D preferred stock round in October 2012 in which we did not participate, and (v) our initial Series E preferred stock investment in BrightSource was converted into BrightSource’s common stock and Series 1A preferred stock and is no longer BrightSource’s most senior preferred stock because BrightSource issued more senior preferred stock in a Series 1 preferred stock round in October 2012 (although we did participate in the Series 1 preferred stock round and, as a result, we acquired Series 1 preferred stock which is BrightSource’s most senior preferred equity). Additionally, while Xtime and Suniva each
58
Table of Contents
issued new series of preferred stock subsequent to our initial investment, the newly issued series of preferred stock and our preferred stock investments in these portfolio companies have, on an equal priority, pari passu basis, a senior right and preference (before any other preferred or common stock) to any dividends declared or any distribution of assets in liquidation.
All of our portfolio company investments to date were acquired directly from the issuer, with the exception of our common stock investment in Corsair, which we acquired from current and former management, our investment in additional shares of Solazyme in the public market subsequent to its IPO, and our investment in Stoke which we acquired from employees.
We target our pre-IPO investing activities on direct investments in the most senior equity securities of later-stage innovative, emerging growth companies that agree to provide us with financial information both at the time of our initial investment and on an ongoing basis thereafter. The average age of our current portfolio companies at the time of our initial investment was eight years. In addition, the financing round in which we made our initial investment represented, on average, the portfolio company’s fifth, or Series E, financing round. Of our initial investments in 19 portfolio companies as of December 31, 2012, 17 have been direct investments in a portfolio company and two have been acquired in secondary transactions from current or former management or employees facilitated by the portfolio company. We have been the lead investor in seven of our 19 portfolio company investments.
As part of our initial investment in each portfolio company, we obtained contractual rights to receive certain financial information from each portfolio company, including those where we initially acquired common stock. However, our information rights have been subsequently terminated for: (i) Solazyme and LifeLock in connection with the completion of their IPOs, and (ii) Livescribe in connection with the conversion of our preferred stock investments into common stock. However, we continue to have access to financial information for Solazyme and LifeLock from their periodic reports filed with the SEC.
The following table details certain information and other characteristics of our portfolio companies as of December 31, 2012.
59
Table of Contents
| Initial Keating Capital Investment Date |
Portfolio Company (1) |
Portfolio Company Founding Year |
Portfolio Company Status as of December 31, 2012 |
Portfolio |
Initial Investment / Purchase Transaction (3) |
Lead
or Participating Investor |
Initial
Keating Capital Participation Round |
Number of Portfolio Company Financing Rounds Prior to Keating Capital Initial Investment |
Portfolio Company’s Most Senior Equity Security (4) |
Access to Portfolio Company Financial Information | ||||||||||
| Jul-10 |
Livescribe, Inc. |
2007 | Private | 3 | Direct | Participating | Series C Preferred | 2 | No | No | ||||||||||
| Jul-10 |
Solazyme, Inc. |
2003 | Public | 7 | Direct | Participating | Series D Preferred | 3 | Yes | Yes - Publicly Reporting | ||||||||||
| Oct-10 |
MBA Polymers, Inc. |
1993 | Private | 17 | Direct | Participating | Series G Preferred | 6 | Yes | Yes - Contractual Rights | ||||||||||
| Feb-11 |
BrightSource Energy, Inc. |
2006 | Private | 5 | Direct | Participating | Series E Preferred | 4 | No | Yes - Contractual Rights | ||||||||||
| Mar-11 |
Harvest Power, Inc. |
2008 | Private | 3 | Direct | Participating | Series B Preferred | 1 | No | Yes - Contractual Rights | ||||||||||
| Mar-11 |
Suniva, Inc. | 2007 | Private | 4 | Direct | Participating | Series D Preferred | 3 | Yes | Yes - Contractual Rights | ||||||||||
| Jun-11 |
Xtime, Inc. | 1999 | Private | 12 | Direct | Lead | Series F Preferred | 5 | Yes | Yes - Contractual Rights | ||||||||||
| Jul-11 |
Corsair Components, Inc. |
1994 | Private - IPO Registration on File |
17 | Secondary | Lead | Common | None | Yes | Yes - Contractual Rights | ||||||||||
| Aug-11 |
Metabolon, Inc. |
2000 | Private | 11 | Direct | Lead | Series D Preferred | 3 | Yes | Yes - Contractual Rights | ||||||||||
| Aug-11 |
Kabam, Inc. | 2006 | Private | 5 | Direct | Participating | Series D Preferred | 3 | Yes | Yes - Contractual Rights | ||||||||||
| Sep-11 |
Tremor Video, Inc. |
2005 | Private | 6 | Direct | Participating | Series F Preferred | 5 | Yes | Yes - Contractual Rights | ||||||||||
| Sep-11 |
TrueCar, Inc. |
2005 | Private | 6 | Direct | Participating | Common | 4 | Yes | Yes - Contractual Rights | ||||||||||
| Dec-11 |
Agilyx Corporation |
2004 | Private | 7 | Direct | Lead | Series C Preferred | 2 | No | Yes - Contractual Rights | ||||||||||
| Jan-12 |
Zoosk, Inc. | 2007 | Private | 5 | Direct | Participating | Series E Preferred | 4 | Yes | Yes - Contractual Rights | ||||||||||
| Mar-12 |
LifeLock, Inc. |
2005 | Public | 7 | Direct | Participating | Series E Preferred | 4 | Yes | Yes - Publicly Reporting | ||||||||||
| Mar-12 |
SilkRoad, Inc. |
2003 | Private | 9 | Direct | Participating | Series C Preferred | 2 | Yes | Yes - Contractual Rights | ||||||||||
| May-12 |
Glam Media, Inc. |
2004 | Private | 8 | Direct | Lead | Series F Preferred | 5 | Yes | Yes - Contractual Rights | ||||||||||
| Jun-12 |
Stoke, Inc. | 2004 | Private | 8 | Secondary | Lead (5) | Common | 5 | No | Yes - Contractual Rights | ||||||||||
| Jun-12 |
Jumptap, Inc. |
2005 | Private | 7 | Direct | Lead | Series G Preferred | 6 | Yes | Yes - Contractual Rights | ||||||||||
| Average Age of Portfolio Company at Time of Keating Capital’s Initial Investment (in years) | 8 | Average Number of Portfolio Company Financing Rounds Prior to Keating Capital’s Initial Investment (6) | 4 | |||||||||||||||||
| (1) | During the year ended December 31, 2012, we disposed of our entire interest in NeoPhotonics and, as a result, NeoPhotonics has not been included in the above table. |
| (2) | Reflects the age of each portfolio company (in years) at the time of Keating Capital’s initial investment. |
| (3) | Reflects the type of transaction in which Keating Capital acquired its initial investment in each portfolio company. “Direct” means an investment in equity securities issued directly by the portfolio company. “Secondary” means an acquisition of equity securities from a portfolio company’s current or former management or early stage investors in private secondary transactions, or from current or former non-management employees where the portfolio company or its management is coordinating the transaction. |
| (4) | Keating Capital is considered to own a portfolio company’s most senior equity securities if: (i) the preferred equity securities which Keating Capital acquired in its initial investment represent the portfolio company’s most senior equity securities outstanding as of December 31, 2012, or (ii) the common equity securities owned by Keating Capital as of December 31, 2012 represent the portfolio company’s only class of equity securities outstanding. Accordingly, the determination of most senior equity securities of a portfolio company takes into account a portfolio company’s issuance of more senior equity securities following Keating Capital’s initial investment. |
| (5) | Keating Capital was the sole investor. |
| (6) | Average calculation excludes Corsair since it had not raised equity financing from institutional investors prior to Keating Capital’s initial investment. A new series of preferred stock issued upon conversion of an existing series of preferred stock and rounds issued in acquisitions are not considered new rounds. |
60
Table of Contents
In each of our investments, we may seek to negotiate structural protections such as conversion rights which would result in our receiving shares of common stock at a discount to the IPO price upon conversion at the time of the IPO, or warrants that would result in our receiving additional shares for a nominal exercise price at the time of an IPO. In some circumstances, these structural protections will apply only if the IPO price is below stated levels. In some cases, our decision to pursue an investment opportunity will be dependent on obtaining some structural protections that are expected to enhance our ability to meet our targeted return on the investment. Of our investments in 17 private portfolio companies as of December 31, 2012, we have been provided some structural protection with respect to investments in eight of these portfolio companies.
We typically do not seek to take a control position in our investments through ownership, board seats, observation rights or other control features. However, we offer significant managerial assistance to our portfolio companies.
We intend to maximize our potential for capital appreciation by taking advantage of the private-to-public valuation arbitrage, or the premium, that we believe is generally associated with having a more liquid asset, such as a publicly traded security. Typically, we believe investors place a premium on liquidity, or having the ability to sell stock more quickly and efficiently through an established stock exchange than through private transactions. Specifically, we believe that an exchange listing, if obtained, should generally provide our portfolio companies with greater visibility, marketability and liquidity than they would otherwise be able to achieve without such a listing. As a result, we believe that public companies typically trade at higher valuations – generally 2x or more – than private companies with similar financial attributes. By going public and listing on an exchange, we believe that our portfolio companies have the potential to receive the benefit of this liquidity premium. There can be no assurance that our portfolio companies will trade at these higher valuations once they are public and listed on an exchange.
In general, we seek to invest in later stage, private, pre-IPO companies that we believe will be able to file a registration statement with the SEC for an IPO within approximately 12 months after our initial investment, and complete an IPO and obtain an exchange listing within approximately 18 months after the closing of our initial investment. After the IPO is completed, we typically will be subject to a lockup restriction which prohibits us from selling our investment during a customary 180-day period following the IPO. Once this lockup restriction expires, we expect to sell our shares in the portfolio company in the public markets over the following 12 months. However, we have the discretion to hold our position to the extent we believe the portfolio company is not being appropriately valued in the public markets or is adversely affected by market or industry cyclicality. Accordingly, we anticipate our typical investment horizon for portfolio investments will be 36 months. However, we may pursue investments with a shorter expected investment horizon, where we believe the portfolio company may file for an IPO sooner than 12 months or has a registration statement filed at the time of our investment. In each case, we have the discretion to hold securities for a longer period. The table below illustrates our targeted portfolio company investment horizon.
| 1 | Following an IPO, the shares we hold in our portfolio companies are generally subject to customary 180 day lockup restrictions. |
We are focused on the potential value transformation that we believe our portfolio companies will experience as they complete an IPO and become publicly traded and correspondingly achieve a market equity value comparable to their publicly traded peers. We target our investments in portfolio companies that we believe can complete this value transformation within our targeted 36-month holding period, compared to typical private equity and venture capital funds which take typically seven years or more. As a result, we may have low or negative returns in our initial years with any potential valuation accretion typically occurring in later years as our portfolio companies complete their IPOs and become publicly traded. However, there can be no assurance that we will be able to achieve our targeted return on any individual portfolio company investment if and when it goes public, or on the portfolio as a whole.
We have an IPO, event-driven strategy, and we attempt to generate returns by accepting the risks of owning illiquid securities of later stage private companies. The process of transforming from private to public ownership is subject to the uncertainties of the IPO process. If this process happened quickly and with certainty, we believe there would be less of an illiquidity discount available (and hence, less potential return) to us when we make our investments. Instead, the private-to-public transformation process takes time and is subject to market conditions, and we therefore incorporate an expected three-year average holding period for each portfolio company into our strategy.
61
Table of Contents
As of December 31, 2012, the total value of our investments in our 19 portfolio companies was $65.0 million, and we had cash and cash equivalents of $8.9 million. Based on our current capital base, the targeted size of our individual portfolio company investments will be approximately $3 to $5 million, but we may invest more than this amount in certain opportunistic situations. We expect that most of our portfolio company investments will represent approximately 5% of our gross assets measured at the time of investment depending on the size of our asset base and our investable capital. However, based on our investment adviser’s assessment of each portfolio company’s relative quality, fundamentals and valuation, we may make opportunistic portfolio company investments that could represent up to 25% of our gross assets measured at the time of investment. An individual portfolio company investment may be smaller than our targeted size and weighting at the time of the initial investment due to factors such as the size of investment made available to us and our cash available for investment. We expect that the size of our individual portfolio company investments and their weighting in our overall portfolio will fluctuate over time based on a variety of factors including, but not limited to additional follow-on investments in existing portfolio companies, dispositions, unrealized appreciation or depreciation, an increased asset base as a result of the issuance of additional equity, or a decreased asset base as a result of repurchases of our own equity. We currently expect to have a portfolio of approximately 20 companies, taking into account our current portfolio composition and our current capital base.
We may also consider making follow-on investments in an existing private portfolio company that is seeking to raise additional capital in subsequent private equity financing rounds. Existing portfolio companies may elect, or be required, to raise additional capital prior to pursuing an IPO for any number of reasons including: (i) to fund additional spending in marketing and/or research and development to develop their business, (ii) to fund working capital deficiencies due to weaker than expected revenue growth or higher than expected operating expenses, (iii) to fund business acquisitions or strategic joint ventures, and (iv) to increase cash reserves in advance of an anticipated IPO. In evaluating follow-on investment opportunities, we typically assess a number of additional factors beyond the three core investment criteria we use in making our initial investment decisions. These additional factors may include: (i) the portfolio company’s continued commitment to an IPO, (ii) the achievement of pre-IPO milestones since our initial investment, (iii) the size of our portfolio company investment relative to our overall portfolio, (iv) any industry trends affecting the portfolio company or other portfolio investments in similar industries, (v) the impact of a follow-on investment on our diversification requirements so we can continue to qualify as a RIC for tax purposes, and (vi) the possible adverse consequences to our existing investment if we elect not to make a follow-on investment, such as the forced conversion of our preferred stock into common stock at an unfavorable conversion rate and the corresponding loss of any liquidation preferences or other rights and privileges that may be applicable to the securities we currently hold.
Our primary source of investment return will be generated from net capital gains, if any, realized on the disposition of our portfolio company investments, which typically will occur after a portfolio company completes an IPO. We are typically prohibited from exiting investments in our publicly traded portfolio companies until the expiration of the customary 180-day post-IPO lockup period. These agreements, which we are usually required to enter into as part of our investment, prohibit us and other significant existing investors from selling stock in the portfolio company or hedging such securities during the customary 180 days following an IPO. We may dispose of these securities at our discretion at any time following the lockup period based on our business judgment. However, we will have no ability to mitigate the high volatility that is a typical characteristic of IPO aftermarket trading and is driven by such factors as overall market conditions, the industry conditions for the particular sector in which the portfolio company operates, the portfolio company’s performance, the relative size of the public float, and the potential selling activities of other pre-IPO investors and possibly management.
For our portfolio company investments where the lockup period following the IPO has expired and the stock becomes freely tradable, we typically do not begin selling automatically upon expiration of the lockup period. We expect to sell our positions over a period of time, typically during the 12 months following the expiration of our lockup, although we may sell more rapidly or in one or more block transactions. Factors that we may consider include, but are not limited to, the following:
| • | The target price determined by our investment adviser based on its business judgment and what it believes to be the portfolio company’s intrinsic value. |
| • | The application of public company multiples and our proprietary analysis to a variety of operating metrics for each portfolio company. The primary operating metrics that we typically consider are revenue, earnings before interest, taxes, depreciation and amortization (“EBITDA”) and net income. |
| • | Other factors that may be adversely or favorably affecting a particular portfolio company’s stock price, including overall market conditions, industry cyclicality, or issues specific to the portfolio company. |
While we typically do not intend to purchase stock in a portfolio company’s IPO or in open market transactions thereafter, under certain circumstances, we may consider making additional investments in a publicly traded portfolio company in open market purchases, which will increase our position in the company. We typically will consider open market purchases of shares in our publicly traded portfolio companies as a means to bring our overall investment closer to our targeted percentage of our gross assets per
62
Table of Contents
portfolio company investment. In such cases, our initial private investments may have been limited due to the level of our gross assets at the time of the initial investment. However, we may be unable to make follow-on investments in our publicly traded portfolio companies as a result of certain regulatory restrictions on a business development company’s investments in publicly traded securities with market capitalizations in excess of $250 million. See “Material U.S. Federal Income Tax Considerations” above.
Current Economic and Market Environment
Beginning in the fall of 2008, the global economy entered a financial crisis and recession. Volatile capital and credit markets, declining business and consumer confidence, and increased unemployment precipitated a continuing economic slowdown. While certain economic conditions in the United States have shown signs of improvement, economic growth has been slow and uneven as consumers continue to be affected by high unemployment rates and depressed housing values. In addition, recent concerns and events such as economic uncertainty surrounding financial regulatory reform and its effect on the revenues of financial services companies, U.S. debt and budget matters and the sovereign debt crisis in Europe, may continue to impact economic recovery and the financial services industry. There can be no assurance that governmental or other measures to aid economic recovery will be effective. During such economic uncertainty and market volatility, we may have difficulty raising equity capital to fund additional portfolio company investments once we become fully invested. Continued adverse economic conditions could also have a material adverse effect on our portfolio companies (including their ability to complete IPOs), our business and the value of your investment.
On August 5, 2011, Standard & Poor’s Rating Services (“S&P”) downgraded the U.S. credit rating from its top rank of AAA to AA+. The downgrade of the U.S. credit rating could have a material adverse effect on the financial markets and economic conditions in the United States and throughout the world. Additionally, austerity measures necessary to reduce the deficit could result in a slowing economy in the near term. The impact of this or any further downgrades to the U.S. government’s sovereign credit rating, or its perceived creditworthiness, and the impact of the current crisis in Europe with respect to the ability of certain European Union countries to continue to service their sovereign debt obligations is inherently unpredictable and could adversely effect the U.S. and global financial markets and economic conditions.
In addition, adverse market and economic conditions that could occur due to a downgrade of the U.S. credit rating on the United States’ debt could result in increasing borrowing costs, a falling value of the dollar, less stable financial markets and slowing or negative economic growth in the near term. These events could adversely affect our business in a variety ways, including, but not limited to, adversely impacting our portfolio companies’ ability to obtain financing, or obtaining financing but at significantly higher costs or lower valuations than the preceding financing rounds. Market disruptions could also delay the timing of going public by our private portfolio companies and affect the value of our publicly traded portfolio companies, which as of December 31, 2012, accounted for 12.4% percent of our investment portfolio and 10.9% of our gross assets. If any of these events were to occur, it could materially adversely affect our business, financial condition and results of operations.
In addition to the downgrade of the U.S. credit rating, on August 8, 2011, S&P downgraded the credit ratings of Fannie Mae, Freddie Mac, and other entities linked to long-term U.S. debt. As of December 31, 2012, our portfolio included $8.7 million of money market funds that invest in U.S. Treasurys and other U.S. Government agency-backed securities. These money market funds could be adversely affected by future credit downgrades.
IPO Market Conditions and Developments
Capital markets volatility and the overall market environment may preclude our portfolio companies from completing an IPO and impede our exit from these investments. Since 1998, the number of venture capital-backed companies that have been able to complete IPOs has fallen, while the median time from initial funding to IPO completion has risen. While the U.S. IPO market had its fastest start in 2012 since 2000, the market declined after Facebook’s botched IPO in May 2012 and the continuing European debt crisis. The uncertainty surrounding the U.S. fiscal cliff resulted in sporadic IPO activity in the second half of 2012, with the slowest November and December since the technology bubble in 2000. Still, the overall results for 2012 showed an improvement over 2011, with 128 U.S. IPOs completed in 2012 – up from 125 IPOs in 2011.
Including Facebook’s $16 billion IPO, the largest venture-backed IPO in history, there were 46 venture-backed IPOs in 2012 raising total proceeds of about $20.7 billion, compared to 51 venture-backed IPOs in 2011 raising about $7.9 billion. However, excluding Facebook’s IPO, total 2012 proceeds declined by about $3.2 billion from 2011, an indication that recent ventured-backed IPO activity consisted of mainly smaller IPOs with average deal size falling from $155 million in 2011 to $104 million in 2012.
On April 5, 2012, the JOBS Act, which was designed to make it easier for small businesses and emerging growth companies to raise capital and complete the IPO process, was signed into law. The JOBS Act amends the Securities Act and the Securities Exchange Act to add a new category of issuer, an “emerging growth company,” broadly defined as a company with less than $1 billion of annual gross revenue in the fiscal year prior to its IPO. For companies that qualify as “emerging growth companies,” the
63
Table of Contents
JOBS Act provides exemptions from certain disclosure requirements and auditing and accounting rules that we believe discouraged many smaller companies from going public. For example, the JOBS Act amends Section 404 of the Sarbanes-Oxley Act to exempt emerging growth companies from the requirement to include an auditor’s statement attesting to management’s internal controls over financial reporting for up to five years. Among the changes implemented by the JOBS Act, we perceive the following potentially will have the most impact on the IPO market:
| • | Reducing the number of years of audited financial statements that emerging growth companies are required to disclose in their registration statements from three years to two years; |
| • | Allowing emerging growth companies to submit a draft IPO registration statement for confidential review by the SEC prior to making a public filing; |
| • | Permitting emerging growth companies to communicate with Qualified Institutional Buyers (QIBs), institutions and accredited investors before or after the filing of a registration statement to determine whether these prospective investors might be interested in the offering; |
| • | Allowing investment banks to publish research reports on pending offerings, even while serving as an underwriter; and |
| • | Waiving conflict of interest and three-way communications rules involving research analysts, investment banks, and an emerging growth company’s management. |
We believe the reforms provided for in the JOBS Act have the potential to reduce many of the barriers to going public for emerging growth companies by making the process faster, easier and less costly. Many of the provisions of the JOBS Act affecting IPOs are subject to SEC rulemaking, and there are no assurances that the SEC will act in a timely fashion to implement such changes, or what additional requirements the rulemaking may impose on emerging growth companies. Also, the extent to which market practices regarding the conduct of IPOs will change as a result of the JOBS Act is unclear at this time.
Portfolio and Investment Activity
The 1940 Act requires periodic valuation of each portfolio investment to determine our net asset value. Value, as defined in Section 2(a)(41) of the 1940 Act, is: (i) the market price for those securities for which a market quotation is readily available, and (ii) for all other securities and assets, fair value is as determined in good faith by our Board of Directors. Given the nature of investing in the securities of private companies, our investments generally will not have readily available market quotations. Generally, our equity investments in publicly traded companies in which the lockup restriction has expired are valued at the closing market price on the valuation date. However, equity investments in publicly traded portfolio companies which remain subject to lockup restrictions are valued in good faith by our Board of Directors based on a discount to the most recently available closing market prices. Our equity investments in private companies will not generally have readily available market quotations and, as such, are valued at fair value as determined in good faith by or under the direction of our Board of Directors. As of December 31, 2012 and December 31, 2011, 85.9% and 45.0%, respectively, of our gross assets represented investments in portfolio companies valued at fair value by our Board of Directors.
64
Table of Contents
Portfolio Composition
The following table details the composition of our portfolio company investments by security, at cost and value as of December 31, 2012.
| December 31, 2012 | ||||||||||||||||||||||
| Portfolio Company |
Investment Description |
Shares/ Warrants |
Cost (Per Share) |
Cost | Value | Unrealized Appreciation (Depreciation) |
||||||||||||||||
| Publicly Traded Portfolio Companies: |
||||||||||||||||||||||
| Solazyme, Inc. (1) |
Common Stock | 47,927 | $ | 8.86 | $ | 424,403 | $ | 376,706 | $ | (47,697 | ) | |||||||||||
| Common Stock—Open Market Purchases | 50,000 | 11.07 | 553,259 | 393,000 | (160,259 | ) | ||||||||||||||||
| Common Stock—Open Market Purchases | 50,000 | 10.55 | 527,500 | 393,000 | (134,500 | ) | ||||||||||||||||
| LifeLock, Inc. |
Common Stock | 944,513 | 5.29 | 5,000,000 | 6,911,002 | 1,911,002 | ||||||||||||||||
|
|
|
|
|
|
|
|||||||||||||||||
| Total - Publicly Traded Portfolio Companies |
|
$ | 6,505,162 | $ | 8,073,708 | $ | 1,568,546 | |||||||||||||||
|
|
|
|
|
|
|
|||||||||||||||||
| Private Portfolio Companies That Have an IPO Registration on File: |
|
|||||||||||||||||||||
| Corsair Components, |
Common Stock | 640,000 | $ | 5.33 | $ | 3,411,080 | $ | 5,530,000 | $ | 2,118,920 | ||||||||||||
| Common Stock Warrants | 160,000 | 3.68 | 589,000 | 70,000 | (519,000 | ) | ||||||||||||||||
|
|
|
|
|
|
|
|||||||||||||||||
| Total - Private Portfolio Companies That Have an IPO Registration on File |
|
$ | 4,000,080 | $ | 5,600,000 | $ | 1,599,920 | |||||||||||||||
|
|
|
|
|
|
|
|||||||||||||||||
| Private Portfolio Companies: |
||||||||||||||||||||||
| Livescribe, Inc. (3) |
Common Stock | 9,686 | $ | 62.58 | $ | 606,187 | $ | — | $ | (606,187 | ) | |||||||||||
| MBA Polymers, Inc. |
Series G Convertible Preferred Stock | 1,100,000 | 1.00 | 1,100,000 | 951,500 | (148,500 | ) | |||||||||||||||
| Series G Convertible Preferred Stock | 900,000 | 1.00 | 900,000 | 778,500 | (121,500 | ) | ||||||||||||||||
| BrightSource Energy, |
Common Stock | 132,972 | 13.21 | 1,756,203 | 1,630,000 | (126,203 | ) | |||||||||||||||
| Series 1A Preferred Stock | 2,500,005 | 0.30 | 743,803 | 630,000 | (113,803 | ) | ||||||||||||||||
| Series 1 Convertible Preferred Stock | 26,475 | 15.00 | 397,125 | 397,125 | — | |||||||||||||||||
| Harvest Power, Inc. |
Series B Convertible Preferred Stock | 580,496 | 4.31 | 2,499,999 | 3,540,000 | 1,040,001 | ||||||||||||||||
| Suniva, Inc. (5) |
Series D Convertible Preferred Stock | 198 | 12,630.00 | 2,500,007 | 1,280,000 | (1,220,007 | ) | |||||||||||||||
| Xtime, Inc. (6) |
Series 1A Convertible Preferred Stock | 1,573,234 | 1.52 | 2,389,140 | 3,530,000 | 1,140,860 | ||||||||||||||||
| Common Stock Warrants | n/a | n/a | 610,860 | 900,000 | 289,140 | |||||||||||||||||
| Common Stock Warrants | 22,581 | — | — | 12,878 | 12,878 | |||||||||||||||||
| Metabolon, Inc. |
Series D Convertible Preferred Stock | 2,229,021 | 1.79 | 4,000,000 | 4,530,000 | 530,000 | ||||||||||||||||
| Kabam, Inc. |
Series D Convertible Preferred Stock | 1,046,017 | 1.27 | 1,328,860 | 980,000 | (348,860 | ) | |||||||||||||||
| Tremor Video, Inc. |
Series F Convertible Preferred Stock | 642,994 | 6.22 | 4,000,001 | 3,850,000 | (150,001 | ) | |||||||||||||||
| TrueCar, Inc. |
Common Stock | 566,037 | 5.30 | 2,999,996 | 2,680,000 | (319,996 | ) | |||||||||||||||
| Agilyx Corporation |
Series C Convertible Preferred Stock | 1,092,956 | 3.66 | 4,000,000 | 3,650,000 | (350,000 | ) | |||||||||||||||
| Zoosk, Inc. |
Series E Convertible Preferred Stock | 715,171 | 4.19 | 2,999,999 | 3,080,000 | 80,001 | ||||||||||||||||
| SilkRoad, Inc. |
Series C Convertible Preferred Stock | 12,398,158 | 0.28 | 3,500,000 | 4,004,000 | 504,000 | ||||||||||||||||
| Series C Convertible Preferred Stock | 5,313,496 | 0.28 | 1,500,000 | 1,716,000 | 216,000 | |||||||||||||||||
| Glam Media, Inc. |
Series F Convertible Preferred Stock | 1,196,315 | 4.18 | 4,999,999 | 5,170,000 | 170,001 | ||||||||||||||||
| Stoke, Inc. |
Common Stock | 1,000,000 | 3.50 | 3,500,000 | 3,040,000 | (460,000 | ) | |||||||||||||||
| Jumptap, Inc. |
Series G Convertible Preferred Stock | 695,023 | 7.19 | 4,999,995 | 4,999,995 | — | ||||||||||||||||
|
|
|
|
|
|
|
|||||||||||||||||
| Total - Private Portfolio Companies |
|
$ | 51,332,174 | $ | 51,349,998 | $ | 17,824 | |||||||||||||||
|
|
|
|
|
|
|
|||||||||||||||||
| Total - All Portfolio Companies | $ | 61,837,416 | $ | 65,023,706 | $ | 3,186,290 | ||||||||||||||||
|
|
|
|
|
|
|
|||||||||||||||||
| (1) | We sold 65,000 shares of Solazyme common stock with an aggregate cost basis of $575,588 during the year ended December 31, 2012. |
| (2) | Corsair Components, Inc. completed a 1-for-5 reverse stock split effective April 24, 2012. As a result of the reverse stock split, we now own 640,000 shares of common stock and warrants to purchase 160,000 shares of common stock at an exercise price of $0.05 per share. Prior to the reverse stock split, we owned 3,200,000 shares of common stock and warrants to purchase 800,000 shares of common stock at an exercise price of $0.01 per share. |
| (3) | In November 2012, Livescribe closed on a convertible note financing. Because we did not participate in the convertible note financing: (i) the Series C, C-1 and C-2 preferred stock we held in Livescribe were automatically converted into common stock at an unfavorable rate (one share for each 2.5 conversion shares), and (ii) the Series C and C-1 preferred stock warrants we held in Livescribe were canceled. Concurrent with the convertible note financing, Livescribe completed a 1-for-100 reverse stock split. |
| (4) | In October 2012, BrightSource completed an initial closing of a Series 1 preferred stock financing (the “Series 1 Financing”), in which we invested $397,125 to acquire 26,475 shares of Series 1 preferred stock. Immediately prior to the Series 1 Financing, all outstanding shares of preferred stock were automatically converted into common stock on a 1-for-1 basis, after giving effect to a 1-for-3 reverse stock split, which was effected in March 2012. As such, our 288,531 shares of Series E Preferred Stock on a pre-split basis were converted into 96,177 shares of common stock. Because we made our full pro-rata investment in the Series 1 Financing, we also received: (i) 2,500,005 shares of Series 1A preferred stock, which have a liquidation preference of $1.00 per share subordinate to the Series 1 liquidation preference, and (ii) 36,795 shares of common stock to compensate existing preferred stock investors for the potential dilutive effect of BrightSource’s option pool increase. The Series 1A preferred shares are not convertible into common stock. |
| (5) | Suniva, Inc. completed a 1-for-1000 reverse stock split effective December 20, 2012. As a result of the reverse stock split, we now own 197.942 shares of Series D convertible preferred stock. Prior to the reverse stock split, we previously owned 197,942 shares of Series D convertible preferred stock. |
| (6) | In October 2012, Xtime completed a Series 2 convertible preferred stock financing (“Series 2 Financing”) in which we did not participate. Immediately prior to the closing of the Series 2 Financing, all of the existing holders of Xtime’s preferred stock (including the Series F preferred stockholders) converted their existing preferred stock into: (i) newly-created Series 1A and 1B convertible preferred stock, and (ii) warrants to acquire additional shares of Xtime’s common stock which grant the holder the right to acquire additional shares of common stock, calculated at the time of Xtime’ IPO based on the actual IPO price, at an exercise price of $0.01 per share (“IPO warrants”). As a holder of Series F preferred stock, we received one share of Series 1A preferred stock for each share of Series F preferred stock that the Company held, no shares of Series 1B preferred stock, and IPO Warrants that are exercisable upon Xtime’s IPO. We continue to hold warrants to acquire 22,581 shares of Xtime common stock which we received as part of the Series F preferred stock investment. |
65
Table of Contents
NeoPhotonics Corporation. On January 25, 2010, we completed a $1,000,000 investment in the Series X convertible preferred stock of NeoPhotonics Corporation (“NeoPhotonics”). Our investment in NeoPhotonics was part of a $46 million Series X preferred stock offering. NeoPhotonics, headquartered in San Jose, California, is a developer and manufacturer of photonic integrated circuit based components, modules and subsystems for use in telecommunications networks.
NeoPhotonics completed an IPO on February 2, 2011 at a price of $11.00 per share. NeoPhotonics is listed on the New York Stock Exchange under the ticker symbol NPTN. Immediately prior to the IPO, our NeoPhotonics Series X preferred stock converted into 160,000 shares of NeoPhotonics common stock. The shares of NeoPhotonics common stock we received upon conversion were subject to a 180-day lockup provision which expired in August 2011.
During the third quarter of 2012, we sold 160,000 shares of NeoPhotonics common stock for an aggregate sales price (net of commissions and selling expenses) of $878,572, or an average price per share of $5.49. As of December 31, 2012, we no longer hold any shares of NeoPhotonics.
Solazyme, Inc. On July 16, 2010, we completed a $999,991 investment in the Series D convertible preferred stock of Solazyme, Inc. (“Solazyme”). Our investment in Solazyme was part of a $60 million Series D preferred stock offering. Solazyme is a renewable oils and green bioproducts company based in South San Francisco, California. Founded in 2003, Solazyme develops and commercializes algal oil and bioproducts for the fuels and chemicals, nutrition, and skin and personal care markets.
Solazyme completed an IPO on May 27, 2011 at a price of $18.00 per share. Solazyme is listed on the Nasdaq Global Market under the ticker symbol SZYM. Immediately prior to the IPO, our Solazyme Series D preferred stock converted into 112,927 shares of Solazyme common stock. The shares of Solazyme common stock we received upon conversion were subject to a 180-day lockup provision which expired in November 2011.
We purchased 50,000 shares of Solazyme’s common stock in open market transactions for an aggregate purchase price of $553,259, or an average price per share of $11.07, including commissions, during the fourth quarter of 2011. We also purchased 50,000 shares of Solazyme’s common stock in open market transactions for an aggregate purchase price of $527,500, or an average price per share of $10.55, including commissions, during January 2012.
During the first and second quarter of 2012, we sold 65,000 shares of Solazyme’s common stock for an aggregate sales price (net of commissions and selling expenses) of $979,219, or an average price per share of $15.06. At December 31, 2012, we continued to own 147,927 shares of Solazyme’s common stock which were valued at $1,162,706 based on Solazyme’s closing market price of $7.86 per share on December 31, 2012.
BrightSource Energy, Inc. On February 28, 2011, we completed a $2,500,006 investment in the Series E convertible preferred stock of BrightSource Energy, Inc. (“BrightSource”), which BrightSource included as part of its February 28, 2011 closing. Our investment in BrightSource was part of a $200 million Series E preferred stock offering. BrightSource, headquartered in Oakland, California, is a developer of utility scale solar thermal plants which generate solar energy for utility and industrial companies using its proprietary solar thermal tower technology.
On April 22, 2011, BrightSource filed a registration statement on Form S-1 for a $250 million IPO of its common stock. After filing a number of amendments to its registration statement, the last of which was filed on March 30, 2012, BrightSource withdrew its registration statement on April 12, 2012. On October 24, 2012, BrightSource completed an initial closing of its Series 1 convertible preferred stock financing, in which we invested $397,125 to acquire 26,475 shares of Series 1 preferred stock. Immediately prior to the Series 1 financing, all outstanding shares of preferred stock were automatically converted into common stock on a 1-for-1 basis, after giving effect to a 1-for-3 reverse stock split, which was effected in March 2012. As such, our 288,531 shares of Series E Preferred Stock on a pre-split basis were converted into 96,177 shares of common stock. Because we made our full pro-rata investment in the Series 1 financing, we also received: (i) 2,500,005 shares of Series 1A preferred stock, which have a liquidation preference of $1.00 per share but are subordinate to the senior liquidation preference of the Series 1 preferred stock, and (ii) 36,795 shares of common stock to compensate existing preferred stock investors for the potential dilutive effect of BrightSource’s option pool increase. The Series 1A preferred shares are not convertible into common stock and would be canceled upon an IPO.
In connection with the Series 1 financing, the cost basis of our initial investment in BrightSource’s Series E preferred stock investment of $2,500,006 was assigned, based on the fair value of the securities we received in exchange for the Series E preferred stock, as follows: (i) $1,756,203 was assigned to our 132,972 shares of common stock of BrightSource, and (ii) $743,803 was assigned to our 2,500,005 shares of Series 1A preferred stock of BrightSource. Our investment in the 26,475 shares of Series 1 preferred stock we acquired in the Series 1 financing has a cost basis of $397,125, which represents the purchase price we paid for such Series 1 preferred stock.
66
Table of Contents
At December 31, 2012, based upon a fair value determination made in good faith by our Board of Directors, (i) our Series 1 convertible preferred stock investment in BrightSource was valued at $397,125, (ii) our Series 1A preferred stock investment in BrightSource was valued at $630,000, and (iii) our common stock investment in BrightSource was valued at $1,630,000. On a combined basis, our investments in BrightSource’s Series 1 and 1A preferred stock and common stock have an aggregate cost of $2,897,131 and an aggregate fair value, as of December 31, 2012, of $2,657,125.
Corsair Components, Inc. On July 6, 2011, we completed a $4,000,080 investment in the common stock and warrants of Corsair Components, Inc. (“Corsair”) as part of a private purchase transaction with certain founders and current and former management employees of Corsair (the “Sellers”). Corsair is a private company headquartered in Fremont, California and is a designer and supplier of high-performance components to the personal computer, or PC, gaming hardware market.
Corsair had previously filed a registration statement on Form S-1 on April 23, 2010 for an IPO of its common stock. According to amendment No. 10 to its registration statement, Corsair completed a 1-for-5 reverse stock split of its common stock effective April 24, 2012. On May 24, 2012, Corsair announced that it had postponed its IPO due to weak equity market conditions. Since its announced IPO postponement, Corsair has not updated its registration statement on file with the SEC. For purposes of this annual report on Form 10-K, with respect to our investment in the common stock and warrants of Corsair, the number of shares and warrants and exercise price of the warrants are reflected after giving effect to this reverse stock split unless otherwise indicated.
Shares of our Corsair common stock also have certain registration rights. In the event of an IPO, any shares of common stock held by us following the IPO (i.e., any shares which we were unable to include for resale in the IPO) would be subject to a 180-day lockup period following the completion of the IPO.
Pursuant to the common stock and warrant purchase agreement governing the private purchase transaction with the Sellers, we purchased 640,000 shares of Corsair common stock at price of $6.25 per share and warrants to purchase 160,000 shares of common stock at a price of $0.0005 per share. The warrants were negotiated as a structural protection and grant us the right to purchase from the Sellers up to 160,000 shares of Corsair common stock at an exercise price of $0.05 per share. The warrants expire on the earlier of: (i) the consummation of an IPO by Corsair at an offering price of at least $12.50 per share of common stock, (ii) upon a sale of Corsair which results in holders of Corsair common stock receiving net sales proceeds of at least $12.50 per share, or (iii) July 6, 2016. These warrants would entitle us to a structurally protected appreciation multiple of 2x our overall Corsair investment cost at the time of the IPO based on the IPO price, provided Corsair prices at its IPO at $10.00 per share or greater.
The warrants are exercisable only upon: (i) Corsair completing an IPO of its common stock at an offering price of less than $12.50 per share, (ii) a sale of Corsair which results in holders of Corsair common stock receiving net sales proceeds of less than $12.50 per share, and (iii) if Corsair does not complete an IPO or sale prior to July 6, 2016, the warrants will be deemed to have been automatically exercised on such date. If the warrants become exercisable as a result of an IPO or sale of Corsair, the number of warrants will be proportionately decreased from 160,000 to the extent that the IPO price or net sale proceeds, as the case may be, exceeds $10.00 per share but is less than $12.50 per share, and the number of warrants will be reduced to zero if the IPO price or net sale proceeds, as the case may be, equals or exceeds $12.50 per share. Accordingly, if the warrants become exercisable as a result of an IPO or sale, we will be entitled to receive the full 160,000 warrants only if the IPO price or net sale proceeds, as the case may be, is $10.00 per share or less.
To estimate the fair value of warrants as of the initial investment date, the common stock and warrants were considered components of a portfolio of securities purchased for $4,000,080. However, since the number of common shares underlying the warrants is variable based on whether an IPO or sale of Corsair is greater than $12.50 per share in which case, the number of warrants is zero, or is $10.00 per share or less in which case the number of warrants is 160,000, the fair value of the warrants was derived using an option pricing model within the framework of a Monte Carlo numerical-based analysis, which takes into consideration the variability in the number of common shares underlying the warrants based on a range of IPO or sale prices for Corsair.
Our investment in Corsair common stock was assigned a cost of $3,411,080 and the warrants were assigned a cost of $589,000 based on the fair value of the warrants as of the initial investment. At December 31, 2012, based on a fair value determination made in good faith by our Board of Directors, (i) our common stock investment in Corsair was valued at $5,530,000, and (ii) our common stock warrants in Corsair were valued at $70,000. On a combined basis, our investment in Corsair’s common stock and warrants has an aggregate cost of $4,000,080 and an aggregate fair value, as of December 31, 2012, of $5,600,000.
Livescribe, Inc. On July 1, 2010, we completed a $500,500 investment in the Series C convertible preferred stock and warrants of Livescribe, Inc. (“Livescribe”). Our investment in Livescribe was part of a $39 million Series C preferred stock offering. Livescribe, a private company headquartered in Oakland, California, is a developer and marketer of a mobile, paper-based computing platform consisting of smartpens, dot paper, smartpen applications, accessories, desktop software, an online community and development tools. Livescribe’s smartpens are currently available from consumer electronics retailers in the U.S. and in several international markets.
67
Table of Contents
Subsequent to our initial investment in the Series C convertible preferred stock and warrants of Livescribe, we participated in follow-on investments in Livescribe’s Series C-1 and C-2 preferred stock financings as set forth below:
| • | On July 8, 2011, we completed a $27,481 investment in the Series C-1 convertible preferred stock and warrants of Livescribe as part of the first tranche which raised a total of $4.5 million from certain of Livescribe’s existing preferred stock investors. On November 14, 2011, we completed a $22,900 investment in the Series C-1 convertible preferred stock and warrants of Livescribe as part of the second tranche which raised a total of $3.7 million from certain of Livescribe’s existing preferred stock investors. We made our decision to invest in the Series C-1 convertible preferred stock round principally on our assessment of Livescribe’s business opportunity and prospects at the time of the investment. |
| • | On January 12, 2012, we made an investment of $18,435 in the Series C-2 convertible preferred stock of Livescribe as part of the first tranche which raised approximately $3.3 million from certain of Livescribe’s existing preferred stock investors. On May 10, 2012, we made an investment of $18,436 in the Series C-2 convertible preferred stock of Livescribe as part of the second tranche which raised approximately $3.3 million from certain of Livescribe’s existing preferred stock investors. On July 24, 2012, we made an additional investment of $18,435 in the Series C-2 convertible preferred stock of Livescribe as part of a final closing of the Series C-2 round. If we had not funded, or failed to commit to fund, our pro rata share of the Series C-2 round, our Series C convertible preferred stock would have been converted into common stock at an unfavorable rate compared to the existing conversion rate, and we would have lost any liquation preference or other rights and privileges otherwise applicable to our Series C preferred stock. |
In November 2012, Livescribe closed on a convertible note financing. Because we did not participate in the convertible note financing: (i) the Series C, C-1 and C-2 preferred stock we held in Livescribe were automatically converted into common stock at an unfavorable rate (one share for each 2.5 conversion shares), and (ii) the Series C and C-1 preferred stock warrants we held in Livescribe were canceled. Concurrent with the convertible note financing, Livescribe completed a 1-for-100 reverse stock split. Our investment adviser’s decision not to invest in Livescribe’s convertible debt financing was based on our investment adviser’s belief that an IPO by Livescribe was not likely in the foreseeable future. Following the foregoing conversion and cancellation, our investment in Livescribe’s common stock does not represent an investment in Livescribe’s most senior equity securities since existing preferred stock investors that participated in the convertible note financing received a newly-issued series of preferred stock in exchange for the shares of preferred stock they previously held. Accordingly, although Livescribe continues to operate its business as of December 31, 2012, we believe that the common stock has no value as of December 31, 2012 since any value will be attributed to preferred securities.
In connection with the conversion of the Series C, C-1 and C-2 preferred stock we held in Livescribe and the cancellation of the Series C and C-1 preferred stock warrants we held in Livescribe, the aggregate cost basis of our preferred stock and preferred stock warrant investments of $606,187 was assigned to our 9,686 shares of common stock of Livescribe. At December 31, 2012, our common stock investment in Livescribe was valued at $0 based on a fair value determination made in good faith by our Board of Directors.
MBA Polymers, Inc. On October 15, 2010, we completed a $1,100,000 investment in the Series G convertible preferred stock of MBA Polymers, Inc. (“MBA Polymers”). Our investment in MBA Polymers was part of a $25 million Series G convertible preferred stock offering. On February 22, 2011, we made an additional investment of $900,000 in MBA Polymers’ Series G convertible preferred stock. Our additional investment was part of an aggregate additional Series G preferred stock offering of approximately $15 million. MBA Polymers, a private company headquartered in Richmond, California, is a global manufacturer of recycled plastics sourced from end of life durable goods, such as computers, electronics, appliances and automobiles. At December 31, 2012, our Series G convertible preferred stock investment in MBA Polymers was valued at $1,730,000 based upon a fair value determination made in good faith by our Board of Directors.
Harvest Power, Inc. On March 9, 2011, we completed a $2,499,999 investment in Series B convertible preferred stock of Harvest Power, Inc. (“Harvest Power”). Our investment in Harvest Power was part of a $66 million Series B preferred stock offering. Founded in 2008 and headquartered in Waltham, Massachusetts, Harvest Power acquires, owns and operates organic waste facilities that convert organic waste, such as food scraps and yard debris, into compost, mulch and renewable energy.
68
Table of Contents
On March 30, 2012, Harvest Power completed the $110 million initial closing of a Series C convertible preferred stock financing from new and existing investors. Harvest Power completed an additional tranche of the Series C round for $15 million in July 2012. As a result of the Series C round, our investment in Harvest Power’s Series B preferred stock does not represent an investment in Harvest Power’s most senior equity securities. Further, as part of the Series C convertible preferred stock financing, the preferred dividends on our Series B convertible preferred stock were changed from a cumulative to a non-cumulative dividend. At December 31, 2012, our Series B convertible preferred stock investment in Harvest Power was valued at $3,540,000 based upon a fair value determination made in good faith by our Board of Directors.
Suniva, Inc. On March 31, 2011, we completed a $2,500,007 investment in the Series D convertible preferred stock of Suniva, Inc. (“Suniva”). Our investment in Suniva was part of a $106 million Series D preferred stock offering. Founded in 2007 and headquartered in Norcross, Georgia, Suniva is a manufacturer of high-efficiency solar photovoltaic cells and modules focused on delivering high-power solar energy products.
On December 20, 2012, Suniva completed an initial closing of a Series E convertible preferred stock financing. We did not participate in the initial closing of the Series E preferred stock financing. As part of the Series E financing, Suniva completed a 1-for-1,000 reverse stock split. As a result of the reverse stock split, we now own 197.942 shares of Series D convertible preferred stock with a cost basis of $12,630 per share and a non-participating liquidation preference equal to 1x our cost basis. Following the Series E financing, the holders of Series D and Series E preferred stock have, on an equal priority, pari passu basis, a senior right and preference (before any other preferred or common stock) to any dividends declared or any distribution of assets in liquidation.
At December 31, 2012, our Series D convertible preferred stock investment in Suniva was valued at $1,280,000 based upon a fair value determination made in good faith by our Board of Directors.
Xtime, Inc. On June 14, 2011, we completed a $3,000,000 investment in an initial closing of the Series F convertible preferred stock of Xtime, Inc. (“Xtime”). Founded in 1999 and headquartered in Redwood Shores, California, Xtime is a software as a service provider of Web scheduling and CRM solutions for automotive service departments. Our investment in Xtime was part of a $5 million Series F preferred stock offering in which we were the lead investor. As part of the final closing in August 2011, Xtime’s existing investors who invested more than their pro rata share in the Series F convertible preferred round (based on amounts they had invested in Xtime’s prior preferred stock rounds), received warrants to acquire shares of Xtime’s common stock at an exercise price of $0.01 per share. In order to preserve our post-money, fully diluted ownership interest in Xtime, we also received warrants to acquire 22,581 shares of Xtime common stock on the same terms as the warrants issued to existing investors. In the event Xtime completes a qualifying IPO, the number of warrants will be reduced by 50%.
On October 5, 2012, Xtime completed a Series 2 convertible preferred stock financing in which we did not participate. Immediately prior to the closing of the Series 2 financing, all of the existing holders of Xtime’s preferred stock (including the Series F preferred stockholders) converted their existing preferred stock into: (i) newly-created Series 1A and 1B convertible preferred stock, and (ii) warrants to acquire additional shares of Xtime’s common stock which grant the holder the right to acquire additional shares of common stock, calculated at the time of Xtime’ IPO based on the actual IPO price, at an exercise price of $0.01 per share (“IPO warrants”). As a holder of Series F preferred stock, we received one share of Series 1A preferred stock for each share of Series F preferred stock that the Company held, no shares of Series 1B preferred stock, and IPO Warrants that are exercisable upon Xtime’s IPO. Following the Series 2 financing, the holders of Series 2 and Series 1A preferred stock have, on an equal priority, pari passu basis, a senior right and preference (before the Series 1B and common stock) to any dividends declared or any distribution of assets in liquidation. We continue to hold warrants to acquire 22,581 shares of Xtime common stock which we received as part of the Series F preferred stock investment.
In connection with the Series 2 financing, the aggregate cost basis of our initial investment in Xtime’s Series F preferred stock investment of $3,000,000 was assigned, based on the fair value of the securities we received in exchange for the Series F preferred stock, as follows: (i) $2,389,140 was assigned to our 1,573,234 shares of Series 1A preferred stock of Xtime, and (ii) $610,860 was assigned to our IPO Warrants in Xtime.
At December 31, 2012, based upon a fair value determination made in good faith by our Board of Directors, (i) our Series 1A convertible preferred stock investment in Xtime was valued at $3,530,000, (ii) our IPO warrants in Xtime were valued at $900,000, and (iii) our warrants to acquire 22,581 shares of Xtime common stock were valued at $12,878. On a combined basis, our investment in Xtime’s Series 1A preferred stock, common stock warrants and the IPO Warrants have an aggregate cost of $3,000,000 and an aggregate fair value, as of December 31, 2012, of $4,442,878.
Metabolon, Inc. On August 25, 2011, we completed a $4,000,000 investment in the Series D convertible preferred stock of Metabolon, Inc. (“Metabolon”). Our investment in Metabolon was part of a $13 million Series D preferred stock offering, in which we were the lead investor. Founded in 2000 and headquartered in Research Triangle Park, North Carolina, Metabolon is a molecular diagnostics and services company offering metabolic profiling technology that uses advanced bioinformatics and data analytics software to identify, quantify, and analyze biochemical processes occurring within cells. Metabolon is utilizing biomarkers identified
69
Table of Contents
by its technology in the development of molecular diagnostic tests intended to detect and measure the aggression and stage of diseases such as diabetes and cancer. At December 31, 2012, our Series D convertible preferred stock investment in Metabolon was valued at $4,530,000 based upon a fair value determination made in good faith by our Board of Directors.
Kabam, Inc. On August 29, 2011, we completed a $1,328,860 investment in the Series D convertible preferred stock of Kabam, Inc. (“Kabam”). Our investment in Kabam was part of an $86 million Series D preferred stock offering. Founded in 2006 and headquartered in Redwood City, California, Kabam is an Internet-based social gaming company that combines the immersion of massively multiplayer games with the connectivity and interaction of social games. At December 31, 2012, our Series D convertible preferred stock investment in Kabam was valued at $980,000 based upon a fair value determination made in good faith by our Board of Directors.
Tremor Video, Inc. On September 6, 2011, we completed a $4,000,001 investment in the Series F convertible preferred stock of Tremor Video, Inc. (“Tremor Video”). Our investment in Tremor Video was part of a $37 million Series F preferred stock offering. Founded in 2005 and headquartered in New York, New York, Tremor Video is an online video technology and advertising company that provides video advertising solutions to major brand advertisers and publishers of Web videos. At December 31, 2012, our Series F convertible preferred stock investment in Tremor Video was valued at $3,850,000 based upon a fair value determination made in good faith by our Board of Directors.
TrueCar, Inc. On September 26, 2011, we completed a $2,999,996 investment in the common stock of TrueCar, Inc. (“TrueCar”). Our investment in TrueCar was part of a $50 million common stock offering. Subsequent to the initial closing of the common stock offering, TrueCar raised an additional $14 million from other investors from the sale of its common stock on the same price and terms as our investment. Founded in 2005 and based in Santa Monica, California, TrueCar is an online research and pricing tool for consumers interested in buying a new or used vehicle. At December 31, 2012, our common stock investment in TrueCar was valued at $2,680,000 based upon a fair value determination made in good faith by our Board of Directors.
Agilyx Corporation. On December 16, 2011, we completed a $4,000,000 investment in the Series C convertible preferred stock of Agilyx Corporation (“Agilyx”). Our investment in Agilyx was part of a $25 million Series C convertible preferred stock offering, in which we were the lead investor. Founded in 2004 and based in Beaverton, Oregon, Agilyx is an alternative energy company that economically converts difficult-to-recycle waste plastics into high value synthetic oil.
On October 9, 2012, Agilyx raised additional funds as part of a Series D convertible preferred stock financing in which we did not participate. As a result of the Series D round, our investment in Agilyx’s Series C preferred stock no longer represents an investment in Agilyx’s most senior equity securities.
At December 31, 2012, our Series C convertible preferred stock investment in Agilyx was valued at $3,650,000 based upon a fair value determination made in good faith by our Board of Directors.
Zoosk, Inc. On January 27, 2012, we completed a $2,999,999 investment in the Series E convertible preferred stock of Zoosk, Inc. (“Zoosk”). Our investment in Zoosk was part of a $21 million Series E convertible preferred stock offering. Founded in 2007 and headquartered in San Francisco, California, Zoosk operates online dating communities. At December 31, 2012, our Series E convertible preferred stock investment in Zoosk was valued at $3,080,000 based upon a fair value determination made in good faith by our Board of Directors.
LifeLock, Inc. On March 14, 2012, we completed a $5,000,000 investment in the Series E convertible preferred stock and warrants of LifeLock, Inc (“LifeLock”). Our investment in LifeLock was part of a $108 million Series E convertible preferred stock offering. Founded in 2005 and based in Tempe, Arizona, LifeLock offers consumer identity theft protection services. As part of the Series E preferred stock offering, LifeLock acquired ID Analytics, Inc., an enterprise identity risk management company.
On October 2, 2012, LifeLock priced its IPO at $9.00 per share. The shares of LifeLock’s common stock began trading on the New York Stock Exchange on October 3, 2012. In connection with LifeLock’s IPO, the Series E preferred stock we held automatically converted into 944,513 shares of LifeLock’s common stock, based on an adjusted conversion price of $5.29 per share. The adjusted conversion price was calculated based on our structurally protected appreciation multiple of 1.7x our investment cost. The Series E preferred stock warrants were cancelled in connection with the IPO. The shares of LifeLock’s common stock we received upon conversion of the Series E preferred stock are subject to a 180-day lockup provision which will expire in April 2013.
As part of our initial investment in LifeLock, the Series E convertible preferred stock was assigned a cost of $4,875,000, and the warrants were assigned a cost of $125,000 based on the fair value of the warrants as of the initial investment date. In connection with LifeLock’s IPO and the related warrant cancellation, our aggregate cost basis in the shares of LifeLock’s Series E preferred stock and the Series E preferred stock warrants of $5,000,000 was assigned to the 944,513 shares of common stock we received upon
70
Table of Contents
conversion of the Series E preferred stock at the time of the IPO. Accordingly, immediately following LifeLock’s IPO, we held 944,513 shares of LifeLock’s common stock with an aggregate cost of $5,000,000, or $5.29 per share, which were valued at $8.5 million at the time of the IPO based on the IPO price of $9.00 per share. At December 31, 2012, our common stock investment in LifeLock was valued at $6,911,002, or $7.32 per share, based on a fair value determination made in good faith by our Board of Directors, which represented a 10% discount to LifeLock’s closing market price of $8.13 at December 31, 2012.
SilkRoad, Inc. On March 28, 2012, we made a $3,500,000 investment in the Series C convertible preferred stock of SilkRoad, Inc. f/k/a SilkRoad Technology Holdings, Inc. (“SilkRoad”). On May 9, 2012, we made an additional investment of $1,500,000 in a second tranche of SilkRoad’s Series C convertible preferred stock financing. SilkRoad raised a total of $35 million in the Series C convertible preferred stock financing from new and existing investors in the initial and second tranches. Effective July 17, 2012, SilkRoad changed its corporate name from SilkRoad Technology Holdings, Inc. to SilkRoad, Inc. and raised an additional $2.9 million in a third tranche of the Series C round at the same price and on the same terms as our investment. Founded in 2003 and headquartered in Chicago, Illinois, SilkRoad is a global provider of cloud-based social talent management software. At December 31, 2012, our Series C convertible preferred stock investment in SilkRoad was valued at $5,720,000 based upon a fair value determination made in good faith by our Board of Directors.
Glam Media, Inc. On May 25, 2012, we completed a $4,999,999 investment in the Series F convertible preferred stock of Glam Media, Inc. (“Glam Media”). Our investment in Glam Media was part of a $15 million Series F convertible preferred stock offering. Founded in 2004 and headquartered in Brisbane, California, Glam Media is an online media and social networking company focused on matching targeted audiences with targeted content through its properties in the lifestyle, entertainment, home, health and wellness, food and parenting categories. At December 31, 2012, our Series F convertible preferred stock investment in Glam Media was valued at $5,170,000 based upon a fair value determination made in good faith by our Board of Directors.
Stoke, Inc. On June 5, 2012, we completed a $3,500,000 investment in the common stock of Stoke, Inc. (“Stoke”). Our investment in Stoke was structured as a secondary purchase of shares of common stock from certain Stoke employees. Our secondary purchase was facilitated by Stoke. Since Stoke has shares of preferred stock outstanding, our common stock investment in Stoke does not represent an investment in Stoke’s most senior equity securities. Founded in 2004 and headquartered in Santa Clara, California, Stoke is a systems designer and equipment manufacturer for mobile communications infrastructure networks. At December 31, 2012, our common stock investment in Stoke was valued at $3,040,000 based upon a fair value determination made in good faith by our Board of Directors.
Jumptap, Inc. On June 29, 2012, we completed a $4,999,995 investment in the Series G convertible preferred stock of Jumptap, Inc. (“Jumptap”). Our investment in Jumptap was part of a $27.5 million Series G convertible preferred stock offering. Founded in 2005 and headquartered in Cambridge, Massachusetts, Jumptap is a mobile advertising network and data platform that helps global brands to target, place and track advertising on mobile phones and tablets. At December 31, 2012, our Series G convertible preferred stock investment in Jumptap was valued at $4,999,995 based upon a fair value determination made in good faith by our Board of Directors.
The following table summarizes the composition of our portfolio company investments by type of security at cost and value as of December 31, 2012 and December 31, 2011.
| December 31, 2012 | December 31, 2011 | |||||||||||||||||||||||
| Investment Type |
Cost | Fair Value | Percentage of Portfolio |
Cost | Fair Value | Percentage of Portfolio |
||||||||||||||||||
| Private Portfolio Companies: |
||||||||||||||||||||||||
| Preferred Stock |
$ | 41,858,928 | $ | 43,087,120 | 66.26 | % | $ | 26,347,696 | $ | 25,981,874 | 69.70 | % | ||||||||||||
| Preferred Stock Warrants |
— | — | 0.00 | % | 32,058 | 1,323 | 0.00 | % | ||||||||||||||||
| Common Stock |
12,273,466 | 12,880,000 | 19.81 | % | 6,411,076 | 8,399,996 | 22.54 | % | ||||||||||||||||
| Common Stock Warrants |
1,199,860 | 982,878 | 1.51 | % | 589,000 | 219,156 | 0.59 | % | ||||||||||||||||
| Publicly Traded Portfolio Companies: |
||||||||||||||||||||||||
| Common Stock |
6,505,162 | 8,073,708 | 12.42 | % | 2,553,250 | 2,671,631 | 7.17 | % | ||||||||||||||||
|
|
|
|
|
|
|
|
|
|
|
|
|
|||||||||||||
| Total |
$ | 61,837,416 | $ | 65,023,706 | 100.00 | % | $ | 35,933,080 | $ | 37,273,980 | 100.00 | % | ||||||||||||
|
|
|
|
|
|
|
|
|
|
|
|
|
|||||||||||||
The following table summarizes the composition of our portfolio company investments by industry classification at cost and value as of December 31, 2012 and December 31, 2011.
71
Table of Contents
| December 31, 2012 | December 31, 2011 | |||||||||||||||||||||||
| Industry Classification |
Cost | Fair Value | Percentage of Portfolio |
Cost | Fair Value | Percentage of Portfolio |
||||||||||||||||||
| Internet & Software |
$ | 34,328,850 | $ | 37,833,875 | 58.19 | % | $ | 11,328,857 | $ | 11,338,013 | 30.42 | % | ||||||||||||
| Cleantech |
15,402,299 | 14,019,831 | 21.56 | % | 15,053,262 | 15,438,843 | 41.42 | % | ||||||||||||||||
| Technology |
12,106,267 | 13,170,000 | 20.25 | % | 9,550,961 | 10,497,124 | 28.16 | % | ||||||||||||||||
|
|
|
|
|
|
|
|
|
|
|
|
|
|||||||||||||
| Total |
$ | 61,837,416 | $ | 65,023,706 | 100.00 | % | $ | 35,933,080 | $ | 37,273,980 | 100.00 | % | ||||||||||||
|
|
|
|
|
|
|
|
|
|
|
|
|
|||||||||||||
The following table summarizes the composition of our portfolio company investments by geographic region of the United States at cost and value as of December 31, 2012 and December 31, 2011. The geographic composition is determined by the location of the corporate headquarters of the portfolio company at the time of our investment.
| December 31, 2012 | December 31, 2011 | |||||||||||||||||||||||
| Geographic Location |
Cost | Fair Value | Percentage of Portfolio |
Cost | Fair Value | Percentage of Portfolio |
||||||||||||||||||
| West |
$ | 38,837,414 | $ | 41,103,711 | 63.21 | % | $ | 22,933,073 | $ | 24,273,973 | 65.12 | % | ||||||||||||
| Northeast |
11,499,995 | 12,389,995 | 19.05 | % | 6,500,000 | 6,500,000 | 17.44 | % | ||||||||||||||||
| Southeast |
6,500,007 | 5,810,000 | 8.94 | % | 6,500,007 | 6,500,007 | 17.44 | % | ||||||||||||||||
| Midwest |
5,000,000 | 5,720,000 | 8.80 | % | — | — | 0.00 | % | ||||||||||||||||
|
|
|
|
|
|
|
|
|
|
|
|
|
|||||||||||||
| Total |
$ | 61,837,416 | $ | 65,023,706 | 100.00 | % | $ | 35,933,080 | $ | 37,273,980 | 100.00 | % | ||||||||||||
|
|
|
|
|
|
|
|
|
|
|
|
|
|||||||||||||
Portfolio Activity
The total value of our investments in 19 portfolio companies was $65.0 million at December 31, 2012, as compared to $37.3 million in 14 portfolio companies at December 31, 2011. During 2012, we made investments totaling $26.5 million in six new private portfolio companies, approximately $0.5 million in two existing private portfolio companies (BrightSource and Livescribe), and approximately $0.5 million in Solazyme, an existing publicly traded portfolio company.
During the first and second quarter of 2012, we sold 65,000 shares of Solazyme’s common stock at an average price of $15.06 per share (net of commissions and selling expenses) resulting in a realized gain of $403,631, which represents an average 1.7x return on our investment over the 20 to 24 months we held these shares. However, the price of Solazyme’s shares has since decreased, with a closing price of $7.86 as of December 31, 2012, which, compared to the cost basis of $8.86 per share on our original investment and an average cost basis of $10.81 per share on our open market purchases, is below the targeted return we seek to achieve upon a sale of our investment.
During the third quarter of 2012, we sold 160,000 shares of NeoPhotonics’ common stock having an aggregate cost of $1,000,000, or $6.25 per share, for an aggregate sales price (net of commissions and selling expenses) of $878,572, or an average price per share of $5.49. The shares of NeoPhotonics’ common stock that we sold were acquired upon conversion of the NeoPhotonics Series X preferred stock we held at the time of its IPO. Accordingly, we realized a capital loss of $121,428 on our sale of these shares during the third quarter of 2012, which represents a 0.88x return on our investment (or a 12% loss) in these shares over our weighted-average holding period of 31 months. As of December 31, 2012, we no longer own any shares of NeoPhotonics.
For a discussion of the changes in the unrealized appreciation (depreciation) on our portfolio company investments during the year ended December 31, 2012, see “Results of Operations” below.
Portfolio Analysis
Our preferred and common stock, warrants, and equity interests are generally non-income producing. Except for the convertible preferred stock investments in SilkRoad and Jumptap, all convertible preferred stock investments carry a non-cumulative, preferred dividend payable when and if declared by the portfolio company’s board of directors. In the case of SilkRoad, the shares of convertible preferred stock carry a cumulative preferred dividend, which is payable only when and if declared by SilkRoad’s board of directors or upon a qualifying liquidation event. In the case of Jumptap, the shares of convertible preferred stock carry a cumulative preferred dividend, which is payable only when and if declared by Jumptap’s board of directors. During 2012, the preferred dividends on our Series B convertible preferred stock in Harvest Power were changed from a cumulative to a non-cumulative dividend in connection with Harvest Power’s Series C round. Since no dividends have been declared or paid, or are expected to be declared or paid, with respect to these convertible preferred stock investments, these investments are considered to be non-income producing.
72
Table of Contents
Our primary source of investment return will be generated from net capital gains, if any, realized on the disposition of our portfolio company investments, which typically will occur after a portfolio company completes an IPO. Accordingly, we assess our portfolio company investments against a number of our targeted performance metrics including, among others:
| • | whether the portfolio company has filed a registration within 12 months of our initial investment; |
| • | whether the portfolio company has completed an IPO within 18 months of our initial investment; |
| • | whether we were able to liquidate our portfolio company interests within 36 months of our initial investment; |
| • | whether we were able to achieve our targeted 2x unrealized appreciation on our portfolio company investment at the time of its IPO based on the IPO price; and |
| • | whether we were able to dispose of our portfolio company interests to achieve our targeted 2x realized return upon sale of our investment. |
In the event we acquire investments where we believe there may be a shorter expected investment horizon, such as when we believe the portfolio company may file for an IPO sooner than 12 months or has a registration statement filed at the time of our investment, we may correspondingly reduce our targeted return and adjust our targeted performance metrics accordingly.
In making our performance assessment, we have grouped our portfolio company investments into three categories. Our first category is our portfolio companies that have completed an IPO, or what we refer to as our publicly traded portfolio companies. Our publicly traded portfolio companies include those companies whose securities we hold may still be subject to a post-IPO lockup restriction. Our second category is our portfolio companies that have filed a registration statement but have not completed an IPO, or what we refer to as private portfolio companies that have filed for an IPO. The third category is our portfolio companies that have neither filed a registration statement nor completed an IPO, or what we refer as our private portfolio companies.
As of December 31, 2012, our portfolio consisted entirely of equity securities. Our two publicly traded portfolio companies, Solazyme and LifeLock, represented by value approximately 12.4% of our total portfolio company securities at December 31, 2012. One of our private portfolio companies, Corsair, had a registration statement publicly on file with the SEC and represented by value approximately 8.6% of our total portfolio securities at December 31, 2012. However, Corsair announced on May 24, 2012 that it had postponed its IPO due to weak equity market conditions and has not updated its registration statement on file with the SEC since it announced its IPO postponement. BrightSource was previously in registration with the SEC, but withdrew its registration statement on April 12, 2012. BrightSource represented by value approximately 4.1% of our total portfolio company securities at December 31, 2012.
The remaining 79.0% of our portfolio company securities by value at December 31, 2012 (including BrightSource) consisted of securities in 16 private companies which have not completed an IPO or do not have a registration statement for an IPO publicly on file with the SEC at December 31, 2012. Over time, if our initial investments make progress towards or complete an IPO, we expect our overall portfolio to be more evenly spread across different stages and our targeted timelines for each stage, such as readying for an IPO (first 12 months after our investment), completion of an IPO (at approximately after 18 months after our investment), and disposition of our investment following the post-IPO lockup period (typically, 36 months after our investment).
Publicly Traded Portfolio Companies. NeoPhotonics, Solazyme and LifeLock have completed their IPOs. The lockup restrictions on our NeoPhotonics and Solazyme securities expired in August 2011 and November 2011, respectively. The lockup restrictions on our LifeLock securities will expire in April 2013.
NeoPhotonics priced its IPO and listed on the New York Stock Exchange on February 2, 2011, after an initial registration statement filing on April 15, 2010. Based on our investment date of January 25, 2010, NeoPhotonics filed its registration statement and completed its IPO within three months and 12 months, respectively, of our investment, compared to our targeted time frames of 12 months and 18 months. During the third quarter of 2012, we sold 160,000 shares of NeoPhotonics common stock having an aggregate cost of $1,000,000, or $6.25 per share, for an aggregate sales price (net of commissions and selling expenses) of $878,572, or an average price per share of $5.49. The shares of NeoPhotonics common stock that we sold were acquired upon conversion of NeoPhotonics Series X preferred stock at the time of its IPO. Accordingly, we realized a capital loss of $121,428 on our sale of these shares, which represents a 0.88x return on our investment (or a 12% loss) in these shares over our weighted-average holding period of 31 months. As of December 31, 2012, we no longer held any shares of NeoPhotonics.
73
Table of Contents
Solazyme priced its IPO and listed on Nasdaq on May 27, 2011, after an initial registration statement filing on March 11, 2011. Based on our investment date of July 16, 2010, Solazyme filed its registration statement and completed its IPO within eight months and 11 months, respectively, of our investment, compared to our targeted time frames of 12 months and 18 months. The shares of Solazyme’s common stock that we received upon conversion of the Series D preferred stock at their IPO have a cost basis of $8.86 per share. Based on Solazyme’s IPO price of $18.00 per share, which represented a 2.0x unrealized appreciation multiple based on the IPO price, we were at our targeted 2x unrealized appreciation at the time of the IPO. Since Solazyme’s IPO, the price of Solazyme shares has been volatile.
During the fourth quarter of 2011 and the first quarter of 2012, we purchased an aggregate of 100,000 shares of Solazyme’s common stock in open market transactions for an aggregate purchase price of $1,080,759, or an average price per share of $10.81, including commissions. Our last purchase of Solazyme common stock in open market transactions occurred in January 2012. Although we typically do not intend to purchase stock in a portfolio company’s IPO or in open market transactions thereafter, we made additional investments in Solazyme through open market purchases to bring our overall investment in Solazyme closer to our targeted percentage of our gross assets per portfolio company investment. Our initial $1,000,000 private investment in Solazyme was limited due to the level of our gross assets at the time of the initial investment.
During the first and second quarter of 2012, we sold 65,000 shares of Solazyme’s common stock at an average price of $15.06 per share (net of commissions and selling expenses) resulting in a realized gain of $403,631, which represents an average 1.7x return on our investment over the 20 to 24 months we held these shares. However, the price of Solazyme’s shares has since decreased, with a closing price of $7.86 as of December 31, 2012, which, compared to the cost basis of $8.86 per share on our original investment and an average cost basis of $10.81 per share on our open market purchases, is below the targeted return we seek to achieve upon a sale of our investment. As of December 31, 2012, we owned 47,927 shares of Solazyme’s common stock at a cost basis of $8.86 per share and 100,000 shares at an average cost basis of $10.81 per share.
As of December 31, 2012, our original investment in Solazyme had been in our portfolio for 30 months, compared to our targeted 36-month overall holding period. Although we believe that Solazyme has been meeting most of its stated milestones, we believe the market price of this company reflects the inherent risks and uncertainties of the cleantech sector, and the inherent difficulties in evaluating early stage businesses where the achievement of significant revenue and earnings are usually many years in the future. Additionally, the cleantech industry as a whole has been adversely impacted by the recent bankruptcy filing by solar panel manufacturer Solyndra which had previously received a substantial U.S. government loan guarantee, the global uncertainty about continued government subsidies to support these emerging technologies, the continued challenges to find cost effective cleantech solutions, and what is perceived as a currently unfavorable market for cleantech IPOs. We continue to be a patient investor in Solazyme.
On August 28, 2012, LifeLock publicly filed a registration statement with the SEC in connection with its IPO, approximately six months following our investment in the company. On October 2, 2012, LifeLock priced its IPO at $9.00 per share. LifeLock’s shares began trading on the New York Stock Exchange under the ticker symbol “LOCK” on October 3, 2012, approximately seven months following our investment compared to our targeted time frame of 18 months. In connection with LifeLock’s IPO, the shares of LifeLock’s Series E preferred stock we held automatically converted into 944,513 shares of LifeLock’s common stock, based on an adjusted conversion price of $5.29 per share. The adjusted conversion price was calculated based on our structurally protected appreciation multiple of 1.7x our investment cost. Accordingly, immediately following LifeLock’s IPO, we held 944,513 shares of LifeLock’s common stock with an aggregate cost of $5,000,000, or $5.29 per share, which were valued at $8.5 million at the time of the IPO based on the IPO price of $9.00 per share.
The shares of LifeLock’s common stock we hold are subject to a 180-day lockup provision which will expire in April 2013. As of December 31, 2012, our original investment in LifeLock had been in our portfolio for approximately 10 months, compared to our targeted 36-month overall holding period. As of December 31, 2012, we owned 944,513 shares of LifeLock’s common stock at a cost basis of $5.29 per share and a fair value of $7.32 per share (which represents a 10% discount to LifeLock’s closing market price of $8.13 at December 31, 2012), resulting in unrealized appreciation of $1.9 million as of December 31, 2012.
There can be no assurances that we will be able to dispose of our interests in these publicly traded portfolio companies within our targeted holding period or at prices that would allow us to achieve our targeted return, or any return at all.
Private Portfolio Companies That Have an IPO Registration on File. Corsair is currently in registration with the SEC to complete its IPO. Corsair filed its initial registration statement with the SEC on April 23, 2010, prior to our investment on July 6, 2011. On May 24, 2012, Corsair announced that it had postponed its IPO due to weak equity market conditions. Since its announced IPO postponement, Corsair has not updated its registration statement on file with the SEC. We can give no assurances that Corsair will update its registration statement or complete an IPO, and even if an IPO is completed, when it may be completed, at what price and under what terms, and whether any of our shares will be included for resale in the IPO. As of December 31, 2012, Corsair has been in our portfolio for 18 months, compared to our targeted 18 months to complete an IPO and our targeted 36-month holding period.
74
Table of Contents
There can be no assurances that any of our private portfolio companies that have a registration statement publicly on file with the SEC as of December 31, 2012 will be able to complete their IPOs within our targeted time frame, or at all. Even if these portfolio companies are able to complete an IPO, we may not be able to dispose of our interests in these publicly traded portfolio companies within our targeted holding period or at prices that would allow us to achieve our targeted return, or any return at all.
Private Portfolio Companies. As of December 31, 2012, we had investments in 16 private portfolio companies that do not have a registration statement publicly on file with the SEC or have not publicly announced the submission of a registration for confidential review by the SEC. One of the provisions of the JOBS Act allows emerging growth companies to submit a draft IPO registration statement for confidential review by the SEC prior to making a public filing. Companies that submit a registration statement for confidential review by the SEC may elect to publicly announce that they have made such a confidential submission without disclosing the content of such submission. Our private portfolio company investments consist of convertible preferred stock, common stock, and warrants to purchase preferred stock and common stock. As of December 31, 2012, these private portfolio company investments had an aggregate cost of $51.3 million and an aggregate value of $51.3 million, resulting in net unrealized appreciation of $17,824.
As of December 31, 2012, our initial investments in six private portfolio companies – Livescribe, MBA Polymers, BrightSource, Harvest Power, Suniva and Xtime – have been in our portfolio for periods between 18 and 30 months, which is beyond our targeted 18-month time frame to complete an IPO following our initial investment. None of these companies had a registration statement publicly on file with the SEC for an IPO as of December 31, 2012, although BrightSource previously filed a registration statement which was withdrawn on April 12, 2012.
We also have investments in five private portfolio companies – Metabolon, Kabam, Tremor Video, TrueCar and Agilyx – which, as of December 31, 2012, had been in our portfolio for periods between 12 and 18 months, which is beyond our targeted 12-month period to file a registration statement. We do not expect these private portfolio companies to complete an IPO within our targeted 18-month time frame following our initial investment.
Holding Periods. As of December 31, 2012, the average holding period of our 19 portfolio companies was 16.5 months from our initial investment date, and the weighted-average holding period (based on the fair value and holding period of each of our portfolio company securities as of December 31, 2012) was 13.5 months. The table below categorizes each of our 19 portfolio companies as follows: (i) those portfolio companies that have completed an IPO or that have a registration statement publicly on file with the SEC, and (ii) those portfolio companies that have not completed an IPO or do not have a registration statement publicly on file with the SEC. Within this latter category, we have further segmented these portfolio companies into the following groups: (i) those portfolio companies in which we have held our initial investment less than 12 months, (ii) those portfolio companies in which we have held our initial investment for between 12 months and 18 months and are beyond our targeted 12-month time frame for filing a registration statement for an IPO, and (iii) those portfolio companies in which we have held our initial investment for more than 18 months and are beyond our targeted 18-month time frame for completing an IPO.
75
Table of Contents
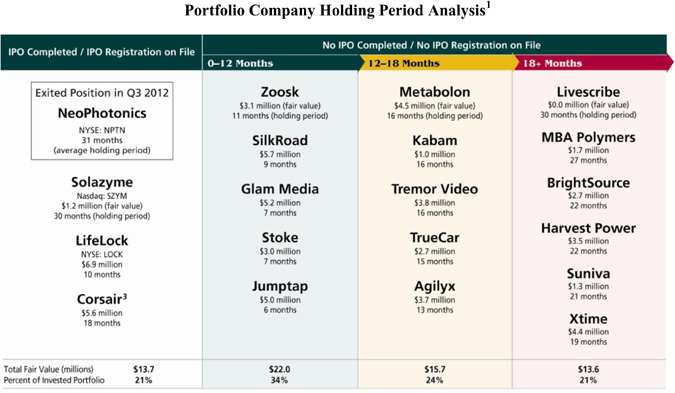
The weighted-average holding period for the overall portfolio is 13.5 months as of December 31, 2012.2
| 1 | As of December 31, 2012. Each of our portfolio companies are subject to many risks, including downturns. There is also no assurance that any of our portfolio companies will complete an IPO or other liquidity event. The holding period for each portfolio company is based on our initial investment date. The fair value of each portfolio company includes the fair value of our initial investment and any follow-on investments as of December 31, 2012. |
| 2 | Weighted-average holding period is calculated using the holding period of each of our portfolio company securities weighted using the fair value of each security as of December 31, 2012. Weighted-average holding period calculation excludes: (i) NeoPhotonics which we disposed of during the third quarter of 2012, and (ii) Livescribe which had a value of zero as of December 31, 2012. |
| 3 | On May 24, 2012, Corsair announced that it had postponed its IPO due to weak equity market conditions. Since its announced IPO postponement, Corsair has not updated its registration statement on file with the SEC. |
The weighted-average holding period for our first investment, NeoPhotonics, which we disposed of in its entirety during the third quarter of 2012, was 31 months and was within our targeted 36-month holding period. Excluding NeoPhotonics, three of our portfolio companies – Solazyme, LifeLock and Corsair – have completed an IPO or have a registration statement publicly on file with the SEC and have an aggregate fair value of $13.7 million as of December 31, 2012, or approximately 21% of our invested portfolio as measured by fair value. Six of our portfolio companies – Livescribe, MBA Polymers, BrightSource, Harvest Power, Suniva and Xtime – have not completed an IPO within our targeted 18-month time frame following our initial investment and have an aggregate fair value of $13.6 million as of December 31, 2012, or approximately 21% of our invested portfolio as measured by fair value.
As of December 31, 2012, we had five private portfolio companies which had been in our portfolio less than 12 months, representing $22.0 million in aggregate fair value, or approximately 34% of our invested portfolio as measured by fair value.
While the foregoing portfolio company holding period analysis is based on certain discrete events – a registration statement publicly on file with the SEC, the completion of an IPO, and the disposition of our investment – which we refer to as “lagging” indicators, we believe that a number of our portfolio companies continue to prepare for and make progress towards an IPO. Our assessment of a portfolio company’s IPO preparation and progress is based on information our investment adviser may obtain in its quarterly update calls with our portfolio company management teams with respect to certain pre-IPO indicators, or what we refer to as “leading” indicators. These leading indicators include: (i) adding new members of senior management (e.g., a CFO with public company experience), (ii) meeting with investment banking firms and conducting a “bakeoff” to select underwriters, (iii) testing the waters by meeting with prospective institutional IPO investors, (iv) determining (and then achieving) the key operating milestones that need to be met to increase the probability of a successful IPO, (v) holding an IPO “organizational meeting” to begin preparation for the IPO process, and (vi) drafting the IPO registration statement. Due to the confidential nature of our investment adviser’s discussions with management, we are precluded from discussing the presence or absence of these “leading” indicators with respect to specific portfolio companies.
76
Table of Contents
Based on our assessment of these “leading” indicators, we believe that several of our portfolio companies are making progress toward an IPO that is consistent with our targeted time frames and holding periods. However, there can be no assurances that any of our private portfolio companies will publicly file, or confidentially submit, a registration statement within our targeted 12-month time frame or be able to complete an IPO within our targeted 18-month time frame, or at all. Even if these portfolio companies are able to complete an IPO, we may not be able to dispose of our interests in these publicly traded portfolio companies within our targeted 36-month holding period or at prices that would allow us to our targeted 2x return on our investment, or any return at all. In cases where we have reduced our targeted return due to a shorter expected investment horizon, there can be no assurance that our portfolio company will be able to complete an IPO, or that we will be able to dispose of our investment, in this shorter time frame at our targeted return. There can be no assurance that we will be able to achieve our targeted return on our portfolio company investments if and when they go public.
In the event our portfolio companies fail to complete an IPO within our targeted 18-month time frame, we may need to make additional investments in these portfolio companies, along with other existing investors, to fund their operations. In some cases, if we elect not to fund our pro rata share of these additional investments, there may be adverse consequences including the forced conversion of our preferred stock into common stock at an unfavorable conversion rate and the corresponding loss of any liquidation preferences or other rights and privileges that may be applicable to the securities we currently hold.
Due to the perpetual nature of our corporate structure, we believe that we can be a patient investor in our portfolio companies, allowing them flexibility to access IPO windows when the timing and pricing may be best for the company and us. In the event of a prolonged closure of the IPO markets, we can be flexible as our portfolio companies wait for a market recovery or seek alternative exit strategies. However, there may be situations where our portfolio companies will not perform as planned and thus be unable to go public under any circumstances. There may also be situations where a specific industry or sector will no longer be attractive to IPO investors.
In such cases, we will consider whether the portfolio company has already passed, or is likely to exceed, our targeted 18-month IPO completion period. If we believe the portfolio company will not complete an IPO within this period, our investment adviser has the discretion to consider a number of alternative strategies including:
| • | Pursuing a negotiated sale of our interests to an existing investor; |
| • | Attempting to influence the portfolio company’s management to pursue a strategic merger or sale; |
| • | Leveraging our investment adviser’s experience in taking companies public and its insights on the trends affecting the IPO market to assist the portfolio company’s management in evaluating and executing an IPO led (or “bookrun”) by a middle-market underwriting firm; |
| • | Identifying potential third party investors interested in purchasing all or a portion of our interest; and |
| • | Accessing the trading platforms of private secondary marketplaces that have emerged as an alternative to traditional public equity exchanges to provide liquidity principally to the stockholders of venture capital-backed, private companies, to the extent that such a market may exist for the subject portfolio company. |
Our ability to liquidate our investments under any of these strategies will be highly uncertain although we expect to have a greater chance of success if our investments contain structural protections. Nonetheless, depending on the circumstances, even if we are successful in liquidating an investment under these alternatives, we are not likely to achieve our targeted return and we may suffer a loss on our investment.
See “Risk Factors – The securities of our private portfolio companies are illiquid, and the inability of these portfolio companies to complete an IPO within our targeted time frame will extend the holding period of our investments, may adversely affect the value of these investments, and will delay the distribution of gains, if any.”
Structural Protections. Of our investments in 17 private portfolio companies as of December 31, 2012, we have been provided some structural protection with respect to investments in eight of these portfolio companies. Our structural protections include six private portfolio company investments with conversion rights upon an IPO which would result in our receiving shares of common stock at a discount to the IPO price upon conversion at the time of the IPO, and two private portfolio company investments with warrants that would result in our receiving additional shares for a nominal exercise price at the time of an IPO. Our structural protection in eight private portfolio companies as of December 31, 2012 can be summarized as follows:
77
Table of Contents
| • | As of December 31, 2012, these eight private portfolio companies with structural protections had an aggregate cost basis of $32.0 million and a fair value of $36.0 million—representing 55% of our invested portfolio as measured by fair value. |
| • | These eight portfolio companies have structural protections that would, in the event of an IPO, entitle us to receive shares of common stock with a weighted-average aggregate value, at the time of issuance, of 1.79x our investment cost. We refer to this multiple as our structurally protected appreciation multiple. |
| • | As of December 31, 2012, our structurally protected appreciation on these investments would, if each of these eight portfolio companies completed an IPO, result in an increase in our unrealized appreciation of $21.2 million at the time of the IPO. |
The structurally protected appreciation is calculated assuming each portfolio company completes an IPO. Further, the structurally protected appreciation is not impacted by the IPO price, since the structural protections are designed to derive such appreciation at any IPO price at the time of the IPO. The only exceptions are: (i) the structural protection provided in the Corsair common stock investment where the structurally protected appreciation of 2.0x of our investment cost begins to decline as the Corsair IPO price falls below $10.00 per share, and (ii) the structural protection provided in one of our other private portfolio companies where the structurally protected appreciation of 2.0x of our investment cost begins to decline as the IPO price falls below our cost basis per share. In each of the eight portfolio company investments that have structural protections, it is possible for us to achieve an unrealized appreciation at IPO in excess of the structurally protected appreciation amount where the portfolio company’s IPO price exceeds a threshold amount.
Our ability to realize the structurally protected appreciation at the time of the IPO will depend on a number of factors including each portfolio company’s completion of an IPO, any adjustment to the special IPO conversion price that may be negotiated prior to or during the IPO process, the possible subsequent issuance of more senior securities that may impact the relative value of the structural protection, and fluctuations in the market price of each portfolio company’s common shares until such time as the common shares received upon conversion can be disposed of following the expiration of a customary 180-day post-IPO lockup period. Accordingly, the structurally protected appreciation would not be available unless each portfolio company completes an IPO. Further, even if an IPO is completed, the structurally protected appreciation would not be realized unless the market price of each portfolio company’s common shares equals or exceeds the IPO price at the time such shares are disposed of following the post-IPO lockup period.
Of the eight portfolio companies that have structurally protected appreciation at the time of an IPO, three of these portfolio companies, as of December 31, 2012, provide us with a senior right and preference upon the portfolio company’s sale or liquidation to receive a distribution of the portfolio company’s assets (after payment of liabilities) equal to 1.75x to 2.0x our investment cost. In addition, our preferred stock liquidation preference in two of the eight portfolio companies that we have structurally protected appreciation provide us with a senior liquidation preference equal to 1.0x our investment cost, with a right to participate in any remaining distributions (after the payment of all preferred stock liquidation preferences) with the holders of common stock on an as converted basis, with the participation right in one of these portfolio companies subject to a cap of 2x our investment cost. Our ability to realize the structurally protected appreciation at the time of a sale or liquidation of the portfolio company will depend on a number of factors including each portfolio company’s completion of a sale or liquidation, the realization of sales or liquidation proceeds (after payment of liabilities) sufficient to pay our senior preference amount, any adjustment to our preference amount that may be negotiated prior to any sale or liquidation, and the possible subsequent issuance of more senior securities that may make our preference rights subordinate to the preference rights of senior security holders. Upon a sale or liquidation of these portfolio companies, we also retain the right to convert our shares of preferred stock to common if, upon conversion, the amount we would receive on our common stock is greater than our preference amount. In addition, we also have structurally protected appreciation with respect to a sale of Corsair which would entitle us to receive 2.0x our investment cost in such sale; provided, however, that our 2.0x structural protection in a sale begins to decline if the Corsair sale price falls below $10.00 per share.
See “Risk Factors — We may not succeed in negotiating structural protections for our investments, and cannot assure you that we will realize gains from structural protections in our investments.”
Results of Operations
The principal measure of our financial performance is the net increase (decrease) in our net assets resulting from operations, which includes net investment income (loss), net realized gain (loss) on investments and net unrealized appreciation (depreciation) on investments. Net investment income (loss) is the difference between our income from interest, dividends, fees and other investment income and our operating expenses. Net realized gain (loss), if any, is the difference between the net proceeds of sales of portfolio company securities and their stated cost. Net unrealized appreciation (depreciation) from investments is the net change in the fair value of our investment portfolio.
78
Table of Contents
Set forth below are the results of operations for the years ended December 31, 2012, 2011 and 2010.
Comparison of Years ended December 31, 2012 and 2011
Investment Income. For the years ended December 31, 2012 and 2011, we earned interest and dividend income from money market investments of $3,870 and $54,348, respectively, a decrease of $50,478 compared to the prior year. This decrease is due to increased investment activity resulting in lower levels of cash and cash equivalents. No other investment income was recorded during the years ended December 31, 2012 and 2011.
Our preferred and common stock, warrants, and equity interests are generally non-income producing. Although our preferred stock investments typically carry a dividend rate, in some cases with a payment preference over other classes of equity, we do not expect dividends (whether cumulative or non-cumulative) to be declared and paid on our preferred stock investments, or on our common stock investments, since our portfolio companies typically prefer to retain profits, if any, in their businesses. Since no dividends have been declared or paid, or are expected to be declared or paid, with respect to these convertible preferred stock investments, these investments are considered to be non-income producing. Accordingly, we expect that our investments in portfolio companies will consist of securities that typically do not provide current income through interest or dividend income.
As of December 31, 2012, we had cash and cash equivalents of $8,934,036, compared to cash and cash equivalents of $39,606,512 as of December 31, 2011. We invest our cash on hand in money market funds that invest primarily in U.S. Treasury securities, U.S. Government agency securities, and repurchase agreements fully-collateralized by such securities. However, the investment income we generate from these money market funds is not expected to be significant. During the year ended December 31, 2011, as our investments in four-week certificates of deposit matured, we invested the proceeds into our money market funds. Accordingly, as of December 31, 2011, we no longer held any certificates of deposit classified as short-term investments. Cash needed to fund our near-term operating expenses is held in a bank depository account.
Our primary source of investment return will be generated from net capital gains, if any, realized on the disposition of our portfolio company investments, which typically will occur after the portfolio company completes an IPO and after the expiration of a customary 180-day post-IPO lockup agreement. Dispositions of our portfolio company investments are discretionary and based on our business judgment. Since we typically do not expect to generate current income from our portfolio company investments, our operating expenses will be financed from our capital base during periods of time between realizations of capital gains on our investments, if any.
Operating Expenses. Our primary operating expenses include the payment of: (i) investment advisory fees to our investment adviser, Keating Investments, (ii) our allocable portion of overhead and other expenses incurred by Keating Investments, as our administrator, in performing its administrative obligations under the Investment Advisory and Administrative Services Agreement, and (iii) other operating expenses as detailed below. Our investment advisory fee compensates our investment adviser for its work in identifying, evaluating, negotiating, closing, monitoring and servicing our investments. See “Investment Advisory and Administrative Services Agreement” below. We bear all other expenses of our operations and transactions, including, without limitation:
| • | costs of calculating our net asset value, including the cost of any third-party valuation services; |
| • | costs of effecting sales and repurchases of shares of our common stock and other securities; |
| • | fees payable to third parties relating to, or associated with, making investments, including fees and expenses associated with performing due diligence reviews of prospective investments; |
| • | costs related to organization and offerings; |
| • | transfer agent and custodial fees; |
| • | fees and expenses associated with marketing efforts; |
| • | federal and state registration fees; |
| • | any stock exchange listing fees; |
| • | applicable federal, state and local taxes; |
79
Table of Contents
| • | independent directors’ fees and expenses; |
| • | brokerage commissions; |
| • | costs of proxy statements, stockholders’ reports and notices; |
| • | fidelity bond, directors and officers/errors and omissions liability insurance and other insurance premiums; |
| • | direct costs such as printing, mailing, and long distance telephone; |
| • | fees and expenses associated with independent audits and outside legal costs; |
| • | costs associated with our reporting and compliance obligations under the 1940 Act, Sarbanes-Oxley Act, and applicable federal and state securities laws; and |
| • | all other expenses incurred by either Keating Investments or us in connection with administering our business, including payments under the Investment Advisory and Administrative Services Agreement that will be based upon our allocable portion of overhead and other expenses incurred by Keating Investments in performing its obligations under the Investment Advisory and Administrative Services Agreement, including our allocable portion of the compensation of our Chief Financial Officer and Chief Compliance Officer, and their respective staff. |
Operating expenses for the years ended December 31, 2012 and 2011 were $4,056,856 and $3,764,370, respectively, an increase of $292,486 compared to the prior year. A summary of the items comprising the increase in our operating expenses for the year ended December 31, 2012 compared to the year ended December 31, 2011 is set forth in the table below.
| Year Ended | ||||||||||||
| December 31, | December 31, | Increase / | ||||||||||
| 2012 | 2011 | (Decrease) | ||||||||||
| Operating Expenses |
||||||||||||
| Base management fees |
$ | 1,533,808 | $ | 1,153,058 | $ | 380,750 | ||||||
| Incentive fees |
425,519 | 152,757 | 272,762 | |||||||||
| Administrative expenses allocated from investment adviser |
633,997 | 450,019 | 183,978 | |||||||||
| Legal and professional fees |
670,839 | 579,751 | 91,088 | |||||||||
| Directors’ fees |
160,000 | 130,289 | 29,711 | |||||||||
| Stock transfer agent fees |
65,108 | 212,262 | (147,154 | ) | ||||||||
| Printing and fulfillment expenses |
112,491 | 185,536 | (73,045 | ) | ||||||||
| Postage and delivery expenses |
61,623 | 146,287 | (84,664 | ) | ||||||||
| Stock issuance expenses |
— | 114,388 | (114,388 | ) | ||||||||
| Travel and entertainment expenses |
81,904 | 345,461 | (263,557 | ) | ||||||||
| General and administrative expenses |
311,567 | 294,562 | 17,005 | |||||||||
|
|
|
|
|
|
|
|||||||
| Total Operating Expenses |
$ | 4,056,856 | $ | 3,764,370 | $ | 292,486 | ||||||
|
|
|
|
|
|
|
|||||||
The increase of $380,750 in base management fees for the year ended December 31, 2012 compared to the year ended December 31, 2011 was the result of an increase in our gross assets on which the base management fee is calculated. The increase in our gross assets was primarily the result of the net proceeds received during 2011 from the sale of common stock in our continuous public offering, which concluded on June 30, 2011.
The increase of $272,762 in incentive fees for the year ended December 31, 2012 compared to the year ended December 31, 2011 was the result of $1,845,390 in net unrealized appreciation and $282,203 of net realized capital gains on our portfolio company investments during the year ended December 31, 2012, compared to $763,784 of net unrealized appreciation on our portfolio company investments during the year ended December 31, 2011. See “Investment Advisory and Administrative Services Agreement” below.
The increase of $183,978 in administrative expenses allocated from our investment adviser for the year ended December 31, 2012 compared to the year ended December 31, 2011 was primarily the result of the allocation to us of additional salary and benefit expenses associated with our management and administration.
80
Table of Contents
The increase of $91,088 in legal and professional fees for the year ended December 31, 2012 compared to the year ended December 31, 2011 was primarily the result of: (i) an increase in audit and tax fees of $106,941 associated with the increase in our portfolio company investments since December 31, 2011, (ii) an increase of $58,764 in fees paid to public relations firms associated with our focus on building and enhancing our stockholder communications, investor relations and brand marketing programs, (iii) an increase in valuation services fees of $16,815 associated with the increase in our portfolio company investments since December 31, 2011, and (iv) an increase of $8,483 in fees associated with our SEC filings. The increase in legal and professional fees for the year ended December 31, 2012 was partially offset by: (i) a $43,246 decrease in legal fees, (ii) a decrease of $39,805 in recruiting fees due to a one-time fee of $40,000 paid to a recruiting firm in connection with the hiring of Stephen M. Hills as our Chief Financial Officer in November 2011, and (iii) a decrease in other consulting and professional fees of $16,864.
The increase of $29,711 in directors’ fees for the year ended December 31, 2012 compared to the year ended December 31, 2011 was the result of (i) an increase in the number of independent directors from three to four, and (ii) increases in annual fees paid to independent directors.
The decreases of: (i) $147,154 in stock transfer agent fees, (ii) $84,664 in postage and delivery expenses, and (iii) $73,045 in printing and fulfillment expenses during the year ended December 31, 2012 compared to the year ended December 31, 2011 were primarily the result of higher transfer agent fees prior to the listing of our common stock on Nasdaq in December 2011 and increased printing and production volume and related mailing of investor and marketing materials during the year ended December 31, 2011 associated with our continuous public offering, which concluded on June 30, 2011.
The decrease of $114,388 in stock issuance expenses during the year ended December 31, 2012 compared to the year ended December 31, 2011 was the result of the conclusion of our continuous public offering on June 30, 2011.
The decrease of $263,557 in travel and entertainment expenses during the year ended December 31, 2012 compared to the year ended December 31, 2011 was primarily the result of increased travel and travel-related expenses related to the investor conferences and meetings during the year ended December 31, 2011 associated with our continuous public offering, which concluded on June 30, 2011.
The increase of $17,005 in general and administrative expenses during the year ended December 31, 2012 compared to the year ended December 31, 2011 was primarily the result of increases in database and information services subscription expenses, regulatory fees, and insurance expenses, partially offset by decreases in marketing and advertising expenses and bank service charges.
We continue to focus on building and enhancing our stockholder communications, investor relations and brand marketing programs which we began in anticipation of the listing of our common stock on Nasdaq Capital Market in December 2011. We believe it is important to continue to develop these programs as they will be the foundation of our investor relations initiatives as we anticipate that we will need to access the capital markets from time to time to raise additional capital to fund new portfolio company investments. While some of these expenses may be one-time in nature, the majority of these expenses will continue, and may increase over time, as we attempt to develop interest in the Company and an active trading market for our shares.
Our operating expenses (excluding base management fees, incentive fees and stock issuance costs) for the year ended December 31, 2012 and 2011 were $2,097,529 and $2,344,167, respectively, a decrease of $246,638 compared to the prior period. This decrease was primarily related to decreases in stock transfer agent fees, postage and delivery expenses, printing and fulfillment expenses, stock issuance expenses, and travel and entertainment expenses, partially offset by increases in administrative expenses allocated from our investment adviser and legal and professional fees. For the three months ended December 31, 2012, our operating expenses (excluding base management fees, incentive fees and stock issuance costs) were $505,974. We expect our operating expenses (excluding base management fees, incentive fees and stock issuance costs) to range from $500,000 to $625,000 each quarter through the end of 2013; however, such expenses are expected to increase to about $750,000 each quarter if we are successful in completing an equity offering. We do not expect to incur significant incremental operating expenses (excluding base management fees, incentive fees and stock issuance costs) from any increase in our capital base from approximately $100 million to $250 million. Accordingly, based on our current level of assets and any proceeds we raise from future equity offerings, we would expect our annualized operating expense ratio to decline as we raise more capital since the rate of increase in total operating expenses (including base management fees) should be less than the rate of increase in our net assets as a result of an equity offering.
Net Investment Loss. Net investment losses for the years ended December 31, 2012 and 2011 were $4,052,986 and $3,710,022, respectively. The increase of $342,964 in net investment loss for the year ended December 31, 2012 compared to the year ended December 31, 2011 is attributable to an increase in our operating expenses of $292,486 and a decrease in our interest and dividend income of $50,478.
Basic and diluted net investment loss per common share was $0.44 for the year ended December 31, 2012 compared to basic and diluted net investment loss per common share of $0.54 for the year ended December 31, 2011.
81
Table of Contents
Realized Gains (Losses) on Investments. For the years ended December 31, 2012 and 2011, realized gains on investments totaled $282,203 and $0, respectively. During the year ended December 31, 2012, we sold 65,000 shares of Solazyme’s common stock having an aggregate cost of $575,588, or $8.86 per share, for an aggregate sales price (net of commissions and selling expenses) of $979,219, or an average price per share of $15.06. The shares of Solazyme’s common stock that we sold were specifically identified as the shares we acquired upon conversion of the Series D preferred stock at the time of the IPO. Accordingly, we realized a long— term capital gain of $403,631 on our sale of these Solazyme shares in the year ended December 31, 2012. During the year ended December 31, 2012, we also sold 160,000 shares of NeoPhotonics common stock having an aggregate cost of $1,000,000, or $6.25 per share, for an aggregate sales price (net of commissions and selling expenses) of $878,572, or an average price per share of $5.49. Accordingly, we realized a long— term capital loss of $121,428 on our sale of these shares during the year ended December 31, 2012. During the year ended December 31, 2011, we did not dispose of any of our investments in portfolio companies and, accordingly, we had no realized gains or losses during the year ended December 31, 2011.
Net Change in Unrealized Appreciation (Depreciation) on Investments. For the year ended December 31, 2012 and 2011, the net change in unrealized appreciation (depreciation) on investments totaled $1,845,390 and $763,784, respectively.
The following table summarizes the cost and value of our portfolio company investments as of December 31, 2012 and December 31, 2011, and the change in unrealized appreciation (depreciation) on each individual portfolio company investment comprising the net change in unrealized appreciation (depreciation) on investments of $1,845,390 for the year ended December 31, 2012.
| December 31, 2012 | December 31, 2011 | |||||||||||||||||||||||||||||||
| Portfolio Company |
Cost | Value | Unrealized Appreciation (Depreciation) |
Cost | Value | Unrealized Appreciation (Depreciation) |
Change
In Unrealized Appreciation (Depreciation) |
Change In Unrealized Appreciation (Depreciation) Per Share1 |
||||||||||||||||||||||||
| Private Portfolio Companies: |
||||||||||||||||||||||||||||||||
| Livescribe, Inc. |
$ | 606,187 | $ | — | $ | (606,187 | ) | $ | 550,881 | $ | 154,324 | $ | (396,557 | ) | $ | (209,630 | ) | (0.02 | ) | |||||||||||||
| MBA Polymers, Inc. |
2,000,000 | 1,730,000 | (270,000 | ) | 2,000,000 | 2,000,000 | — | (270,000 | ) | (0.03 | ) | |||||||||||||||||||||
| BrightSource Energy, Inc. |
2,897,131 | 2,657,125 | (240,006 | ) | 2,500,006 | 2,500,006 | — | (240,006 | ) | (0.03 | ) | |||||||||||||||||||||
| Harvest Power, Inc. |
2,499,999 | 3,540,000 | 1,040,001 | 2,499,999 | 2,499,999 | — | 1,040,001 | 0.11 | ||||||||||||||||||||||||
| Suniva, Inc. |
2,500,007 | 1,280,000 | (1,220,007 | ) | 2,500,007 | 2,500,007 | — | (1,220,007 | ) | (0.13 | ) | |||||||||||||||||||||
| Xtime, Inc. |
3,000,000 | 4,442,878 | 1,442,878 | 3,000,000 | 3,009,156 | 9,156 | 1,433,722 | 0.15 | ||||||||||||||||||||||||
| Corsair Components, Inc. |
4,000,080 | 5,600,000 | 1,599,920 | 4,000,080 | 5,610,000 | 1,609,920 | (10,000 | ) | * | |||||||||||||||||||||||
| Metabolon, Inc. |
4,000,000 | 4,530,000 | 530,000 | 4,000,000 | 4,000,000 | — | 530,000 | 0.06 | ||||||||||||||||||||||||
| Kabam, Inc. |
1,328,860 | 980,000 | (348,860 | ) | 1,328,860 | 1,328,860 | — | (348,860 | ) | (0.04 | ) | |||||||||||||||||||||
| Tremor Video, Inc. |
4,000,001 | 3,850,000 | (150,001 | ) | 4,000,001 | 4,000,001 | — | (150,001 | ) | (0.02 | ) | |||||||||||||||||||||
| TrueCar, Inc. |
2,999,996 | 2,680,000 | (319,996 | ) | 2,999,996 | 2,999,996 | — | (319,996 | ) | (0.03 | ) | |||||||||||||||||||||
| Agilyx Corporation |
4,000,000 | 3,650,000 | (350,000 | ) | 4,000,000 | 4,000,000 | — | (350,000 | ) | (0.04 | ) | |||||||||||||||||||||
| Zoosk, Inc. |
2,999,999 | 3,080,000 | 80,001 | — | — | — | 80,001 | 0.01 | ||||||||||||||||||||||||
| SilkRoad, Inc. |
5,000,000 | 5,720,000 | 720,000 | — | — | — | 720,000 | 0.08 | ||||||||||||||||||||||||
| Glam Media, Inc. |
4,999,999 | 5,170,000 | 170,001 | — | — | — | 170,001 | 0.02 | ||||||||||||||||||||||||
| Stoke, Inc. |
3,500,000 | 3,040,000 | (460,000 | ) | — | — | — | (460,000 | ) | (0.05 | ) | |||||||||||||||||||||
| Jumptap, Inc. |
4,999,995 | 4,999,995 | — | — | — | — | — | — | ||||||||||||||||||||||||
| Publicly Traded Portfolio Companies: |
||||||||||||||||||||||||||||||||
| NeoPhotonics Corporation |
— | — | — | 1,000,000 | 732,800 | (267,200 | ) | 267,200 | 0.03 | |||||||||||||||||||||||
| Solazyme, Inc. |
1,505,162 | 1,162,706 | (342,456 | ) | 1,553,250 | 1,938,831 | 385,581 | (728,037 | ) | (0.08 | ) | |||||||||||||||||||||
| LifeLock, Inc. |
5,000,000 | 6,911,002 | 1,911,002 | — | — | — | 1,911,002 | 0.21 | ||||||||||||||||||||||||
|
|
|
|
|
|
|
|
|
|
|
|
|
|
|
|
|
|||||||||||||||||
| Total |
$ | 61,837,416 | $ | 65,023,706 | $ | 3,186,290 | $ | 35,933,080 | $ | 37,273,980 | $ | 1,340,900 | $ | 1,845,390 | $ | 0.20 | ||||||||||||||||
|
|
|
|
|
|
|
|
|
|
|
|
|
|
|
|
|
|||||||||||||||||
| * | Per share amounts less than $0.01. |
| 1 | Per share amounts based on weighted-average shares outstanding during 2012. |
The net change in unrealized appreciation (depreciation) on our publicly traded portfolio company investments in NeoPhotonics and Solazyme during the year ended December 31, 2012 reflects the change in market prices for these portfolio companies, our disposition of NeoPhotonics, and a disposition of a portion of our position in Solazyme. The net change in unrealized appreciation on our publicly traded portfolio company investment in LifeLock during the year ended December 31, 2012 reflects our investment in LifeLock’s preferred stock that was converted into common stock upon LifeLock’s IPO in October 2012, whose fair value as of December 31, 2012 included a discount for lack of marketability, which discount will be eliminated upon expiry of the lockup restriction in April 2013. We will continue to be subject to market fluctuations in the prices LifeLock and our remaining investment in Solazyme.
82
Table of Contents
The change in unrealized appreciation (depreciation) on certain of our private portfolio company investments during the year ended December 31, 2012 is primarily attributable to one or more of the following reasons:
| • | A significant change in the portfolio company’s financial condition or operating performance compared to projections, and any significant changes to the portfolio company’s most recent projections relative to previous projections. |
| • | A reduction in our weighting of the precedent transaction value since such value may no longer represent the best indicator of fair value within a range of fair values developed from the various valuation approaches and methods used. Precedent transactions may include the transaction in which we acquired our portfolio company interests, as well as subsequent transactions in the equity of the portfolio company, in which we may or may not have participated. In assessing whether the precedent transaction continues to represent the best indicator, or an indicator, of fair value at valuation dates subsequent to the date of the precedent transaction, we typically will consider the recency of the precedent transaction, along with significant changes in the portfolio company’s business performance and financial condition and other significant events or conditions occurring subsequent to the date of the precedent transaction. |
| • | The establishment of a new precedent transaction value based on a more recent transaction involving the portfolio company’s equity securities, whether or not we participated in such transaction, taking into account the price, rights, preferences and limitations of the equity securities. |
| • | A change in the market multiples of the selected comparable public companies used to value a portfolio company. |
| • | An adjustment to the discount for lack of marketability due to a significant change in the time frame in which the portfolio company expects to pursue or complete an IPO or sale. |
A discussion of the net change in unrealized (depreciation) during the year ended December 31, 2012 for certain of our private portfolio company investments follows:
| • | The depreciation in the fair value of our investment in Livescribe during the year ended December 31, 2012 was the result of a number of factors including Livescribe’s ongoing needs to raise capital to support its product development and business operations and our investment adviser’s decision not to invest in Livescribe’s convertible debt financing which resulted in the conversion of the Series C, C-1 and C-2 preferred stock we held into common stock at an unfavorable rate and the cancellation of the Series C and C-1 preferred stock warrants we held. Following the foregoing conversion and cancellation, our investment in Livescribe’s common stock was subordinate in the capital structure to the preferred stock held by investors that participated in the convertible note financing and, accordingly, although Livescribe continues to operate its business as of December 31, 2012, we believe that the common stock has no value as of December 31, 2012 since any value will be attributed to preferred securities. |
| • | The depreciation in the fair value of our investment in BrightSource during the year ended December 31, 2012 was the result of the implied equity value of BrightSource derived from the initial closing of BrightSource’s Series 1 convertible preferred stock financing, the securities we received in connection with the conversion of the Series E preferred, our pro rata participation in the Series 1 convertible preferred stock financing, and other factors. |
| • | The appreciation in the fair value of our investment in Harvest Power during the year ended December 31, 2012 was primarily the result of Harvest Power’s equity value as implied by the Series C convertible preferred stock financing, which was initially closed in March 2012 with an additional closing in July 2012, and other factors. |
| • | The depreciation in the fair value of our investment in Suniva during the year ended December 31, 2012 was primarily the result of a deterioration in Suniva’s operating performance compared to projections, reductions in the most recent 2012 projections relative to previous projections, reductions in the relevant multiples of comparable companies since the date of our investment, and changes in Suniva’s financial condition during the year ended December 31, 2012. |
| • | The appreciation in the fair value of our investment in Xtime during the year ended December 31, 2012 was the result of a number of factors including Xtime’s equity value as implied by the terms of Xtime’s Series 2 convertible preferred stock financing (including the conversion the shares of Series F preferred stock we held for newly-created Series 1A convertible preferred stock and certain warrants to acquire additional shares of Xtime’s common stock for nominal consideration upon an IPO), which financing closed in October 2012. |
| • | The depreciation in the fair value of our investment in Stoke during the year ended December 31, 2012 was primarily the result of a delay in reaching critical sales milestones compared to projections and reductions in the most recent 2012 projections relative to previous projections. |
83
Table of Contents
| • | The changes in the fair value of our investments in Metabolon, Kabam, TrueCar, Agilyx, and SilkRoad during the year ended December 31, 2012 were the result of reductions in our weightings of the precedent transaction value based on the length of time which has transpired since the closing of our investments, our increased weightings on values derived under the comparable public company and discounted cash flow methods, and other factors. |
Upon sale of any of our portfolio company investments, the value that is ultimately realized could be different from the value currently reflected in our financial statements, and this difference could be material.
Net Increase (Decrease) in Net Assets Resulting From Operations and Per Share Information. The net decrease in our net assets resulting from operations for the year ended December 31, 2012 was $1,925,393, which included $282,203 in net realized gains and $1,845,390 in net unrealized appreciation on investments recorded during such period, compared to a net decrease in our net assets resulting from operations for the year ended December 31, 2011 of $2,946,238, which included $763,784 in net unrealized appreciation on investments recorded during such period.
Basic and diluted net decrease in net assets resulting from operations per common share was $0.21 for the year ended December 31, 2012, compared to basic and diluted net decrease in net assets resulting from operations per common share of $0.43 per common share for the year ended December 31, 2011.
Comparison of Years ended December 31, 2011 and 2010
Investment Income. For the years ended December 31, 2011 and 2010, we earned interest income from certificates of deposit and money market investments of $54,348 and $44,009, respectively. During 2010, we also recorded other income of $10,000 representing a non-refundable due diligence fee received from a prospective portfolio company in December 2009, which was initially recorded as deferred income and was subsequently recognized as income when the proposed investment transaction failed to close in February 2010. No other investment income was recorded during 2011 or 2010.
Operating Expenses. Operating expenses for the years ended December 31, 2011 and 2010 were $3,764,370 and $2,031,002, respectively, an increase of $1,733,368 compared to the prior period. A summary of the items comprising the increase in our operating expenses for 2011 compared to 2010 is set forth below:
| Year Ended | ||||||||||||
| December 31, | December 31, | Increase / | ||||||||||
| 2011 | 2010 | (Decrease) | ||||||||||
| Operating Expenses |
||||||||||||
| Base management fees |
$ | 1,153,058 | $ | 218,876 | $ | 934,182 | ||||||
| Incentive fees |
152,757 | 115,423 | 37,334 | |||||||||
| Administrative expenses allocated from investment adviser |
450,019 | 404,633 | 45,386 | |||||||||
| Legal and professional fees |
579,751 | 335,839 | 243,912 | |||||||||
| Directors’ fees |
130,289 | 108,000 | 22,289 | |||||||||
| Stock transfer agent fees |
212,262 | 192,306 | 19,956 | |||||||||
| Printing and fulfillment expenses |
185,536 | 108,192 | 77,344 | |||||||||
| Postage and delivery expenses |
146,287 | 98,907 | 47,380 | |||||||||
| Stock issuance expenses |
114,388 | 156,941 | (42,553 | ) | ||||||||
| Travel and entertainment expenses |
345,461 | 125,617 | 219,844 | |||||||||
| General and administrative expenses |
294,562 | 166,268 | 128,294 | |||||||||
|
|
|
|
|
|
|
|||||||
| Total Operating Expenses |
$ | 3,764,370 | $ | 2,031,002 | $ | 1,733,368 | ||||||
|
|
|
|
|
|
|
|||||||
The increase of $934,182 in base management fees for 2011 compared to 2010 was the result of an increase in our gross assets on which the base management fee is calculated. The increase in our gross assets in 2011 was primarily the result of the net proceeds received during 2011 from the sale of common stock in our continuous public offering, which concluded on June 30, 2011.
The increase of $37,334 in incentive fees for 2011 compared to 2010 was the result of the increase of $763,784 of net unrealized appreciation on our portfolio company investments that was recorded during 2011. See “Investment Advisory and Administrative Services Agreement” below.
84
Table of Contents
The increase of $45,386 in administrative expenses allocated from our investment adviser for 2011 compared to 2010 was primarily the result of the allocation to us of additional expenses associated with management, coordination and administration of the investor outreach during the final six months of our continuous public offering which concluded June 30, 2011.
The increase of $243,912 in legal and professional fees for 2011 compared to 2010 was primarily the result of: (i) an increase in audit and audit related expenses of $72,379 associated with the increase in our portfolio company investments in 2011 compared to 2010, (ii) an increase of $63,477 in fees paid to third-party valuation firms engaged to review preliminary portfolio company investment valuations prepared by the senior investment professionals of our investment adviser, based on our increased portfolio company investment activity in 2011 compared to 2010, (iii) an increase of $61,393 in fees paid to public relations firms associated with the listing of our common stock on Nasdaq, and (iv) a fee of $40,000 paid to a recruiting firm in connection with the hiring of Mr. Hills as Chief Financial Officer in November 2011.
The increases of: (i) $19,956 in stock transfer agent fees, (ii) $77,344 in printing and fulfillment expenses, and (iii) $47,380 in postage and delivery expenses during 2011 compared to 2010 were primarily the result of an increase in the printing and production volume and related mailing of investor and marketing materials associated with the final six months our continuous public offering which concluded on June 30, 2011.
The increase of $219,844 in travel and entertainment expenses for 2011 compared to 2010 was primarily the result of an increase in travel and travel-related expenses related to investor conferences and meetings during the final six months of our continuous public offering which concluded June 30, 2011.
The increase of $128,294 in general and administrative expenses for 2011 compared to 2010 was primarily the result of an increase in expenses associated with press releases, brand marketing, and web site improvements and online search optimization.
Net Investment Loss. Net investment loss for the years ended December 31, 2011 and 2010 were $3,710,022 and $1,976,993, respectively. The increase of $1,733,029 in net investment loss for 2011 compared to 2010 is primarily attributable to an increase in our operating expenses of $1,733,368, as discussed above.
Basic and diluted net investment loss per common share was $0.54 for the year ended December 31, 2011, compared to basic and diluted net investment loss per common share of $1.43 for the year ended December 31, 2010.
Net Change in Unrealized Appreciation (Depreciation) on Investments. For the years ended December 31, 2011 and 2010, the net change in unrealized appreciation (depreciation) on investments totaled $763,784 and $577,116, respectively. The following table summarizes the cost and value of our portfolio company investments as of December 31, 2011 and 2010, and the change in unrealized appreciation (depreciation) on each individual portfolio company investment comprising the net change in unrealized appreciation on investments of $763,784 for the year ended December 31, 2011.
85
Table of Contents
| December 31, 2011 | December 31, 2010 | |||||||||||||||||||||||||||
| Portfolio Company |
Cost | Value | Unrealized Appreciation (Depreciation) |
Cost | Value | Unrealized Appreciation (Depreciation) |
Change In Unrealized Appreciation (Depreciation) |
|||||||||||||||||||||
| Private Portfolio Companies: |
||||||||||||||||||||||||||||
| Livescribe, Inc. |
$ | 550,881 | $ | 154,324 | $ | (396,557 | ) | $ | 500,500 | $ | 527,616 | $ | 27,116 | $ | (423,673 | ) | ||||||||||||
| MBA Polymers, Inc. |
2,000,000 | 2,000,000 | — | 1,100,000 | 1,100,000 | — | — | |||||||||||||||||||||
| BrightSource Energy, Inc. |
2,500,006 | 2,500,006 | — | — | — | — | — | |||||||||||||||||||||
| Harvest Power, Inc. |
2,499,999 | 2,499,999 | — | — | — | — | — | |||||||||||||||||||||
| Suniva, Inc. |
2,500,007 | 2,500,007 | — | — | — | — | — | |||||||||||||||||||||
| Xtime, Inc. |
3,000,000 | 3,009,156 | 9,156 | — | — | — | 9,156 | |||||||||||||||||||||
| Corsair Components, Inc. |
4,000,080 | 5,610,000 | 1,609,920 | — | — | — | 1,609,920 | |||||||||||||||||||||
| Metabolon, Inc. |
4,000,000 | 4,000,000 | — | — | — | — | — | |||||||||||||||||||||
| Kabam, Inc. |
1,328,860 | 1,328,860 | — | — | — | — | — | |||||||||||||||||||||
| Tremor Video, Inc. |
4,000,001 | 4,000,001 | — | — | — | — | — | |||||||||||||||||||||
| TrueCar, Inc. |
2,999,996 | 2,999,996 | — | — | — | — | — | |||||||||||||||||||||
| Agylix Corporation |
4,000,000 | 4,000,000 | — | — | — | — | — | |||||||||||||||||||||
| Publicly Traded Portfolio Companies: |
— | |||||||||||||||||||||||||||
| NeoPhotonics Corporation (1) |
1,000,000 | 732,800 | (267,200 | ) | 1,000,000 | 1,550,000 | 550,000 | (817,200 | ) | |||||||||||||||||||
| Solazyme, Inc. (1) |
1,553,250 | 1,938,831 | 385,581 | 999,991 | 999,991 | — | 385,581 | |||||||||||||||||||||
|
|
|
|
|
|
|
|
|
|
|
|
|
|
|
|||||||||||||||
| Total |
$ | 35,933,080 | $ | 37,273,980 | $ | 1,340,900 | $ | 3,600,491 | $ | 4,177,607 | $ | 577,116 | $ | 763,784 | ||||||||||||||
|
|
|
|
|
|
|
|
|
|
|
|
|
|
|
|||||||||||||||
| (1) | NeoPhotonics and Solazyme were considered private portfolio companies as of December 31, 2010 as NeoPhotonics and Solazyme did not complete their initial public offerings until February 2, 2011 and May 27, 2011, respectively. |
The net change in unrealized appreciation (depreciation) on our publicly traded portfolio company investments in NeoPhotonics and Solazyme during 2011 reflects the change in market prices for these portfolio companies, and we will continue to be subject to market fluctuations in the prices of our publicly traded securities. The increase in the unrealized depreciation on our investment in Livescribe during 2011 was primarily the result of the deterioration in Livescribe’s operating performance compared to projections, its reduction in available cash and working capital resources, and its decline in net book value, supported by the then pending Series C-2 convertible preferred stock round being funded by existing investors at a lower valuation than the Series C and C-1 rounds. The increase in the unrealized appreciation on our investment in Corsair during 2011 was primarily the result of an increase in the relevant multiples for comparable public companies, Corsair’s operating performance compared to projections, recent prices for the redemption of common stock from certain current and former management, and other supporting factors.
During the years ended December 31, 2011 and 2010, we did not dispose of any of our investments in portfolio companies. As a result, we did not generate any net realized gains or losses from our portfolio company investment activity during 2011 or 2010. Upon sale of any of our portfolio company investments, the value that is ultimately realized could be different from the value currently reflected in our financial statements, and this difference could be material.
Net Decrease in Net Assets Resulting From Operations and Per Share Information. The net decrease in our net assets resulting from operations for the year ended December 31, 2011 was $2,946,238, which included $763,784 in net unrealized appreciation on investments recorded during such period, compared to a net decrease in our net assets resulting from operations for the year ended December 31, 2010 of $1,399,877, which included $577,116 in net unrealized appreciation on investments recorded during such period.
Basic and diluted net decrease in net assets per common share was $0.43 for the year ended December 31, 2011, compared to basic and diluted net decrease in net assets per common share of $1.01 per common share for the year ended December 31, 2010.
Financial Condition, Liquidity and Capital Resources
As of December 31, 2012, we had cash and cash equivalents of $8,934,036, compared to cash and cash equivalents of $39,606,512 as of December 31, 2011. We primarily invest our cash on hand in money market funds that invest primarily in U.S. Treasury securities, U.S. Government agency securities, and repurchase agreements fully-collateralized by such securities. The investment income we generate from these money market funds is not expected to be significant. During the year ended December 31, 2011, as our investments in four-week certificates of deposit matured, we invested the proceeds into our money market funds. Accordingly, as of December 31, 2011, we no longer held any certificates of deposit classified as short-term investments. Cash needed to fund our near-term operating expenses is held in a bank depository account.
86
Table of Contents
As of December 31, 2012, we were fully invested based on our currently available funds. It is our policy to retain approximately $10 million in cash and cash equivalents to fund our future operating expenses, although the amount we actually retain may vary depending on our operating expenses and the timing of our purchases and sales of portfolio company investments. We currently expect to have a portfolio of approximately 20 companies, taking into account our current portfolio composition and our current capital base. Since we typically do not expect to generate current income from our portfolio company investments, our operating expenses will be financed from our capital base during periods of time between realizations of capital gains on our investments, if any.
As of December 31, 2012, we had no indebtedness and total accounts payable and accrued expenses of $972,137, including amounts owed to our investment adviser. As of December 31, 2012, amounts owed to our investment adviser consist of $128,746 of base management fees, $51,396 of administrative expenses, and $693,699 of accrued incentive fees related to net unrealized appreciation and realized gain on our investments as of December 31, 2012.
As of December 31, 2011, we had no indebtedness and total accounts payable and accrued expenses of $558,523, including amounts owed to our investment adviser. As of December 31, 2011, amounts owed to our investment adviser consisted of $130,969 of base management fees, $47,285 of administrative expenses, and $268,180 of accrued incentive fees.
Since the incentive fee is only payable based on realized capital gains (after reduction for realized capital losses and unrealized depreciation), these accrued incentive fees may differ from the actual incentive fee that may be paid to our investment adviser depending on whether we are ultimately able to dispose of our portfolio company investments and generate a net realized capital gain at least commensurate with the unrealized appreciation recorded as of December 31, 2012 and December 31, 2011. See “Investment Advisory and Administrative Services Agreement” below.
We will not borrow funds or issue senior securities, including preferred stock, to finance the purchase of our investment in portfolio companies for at least one year from the date of the completion of any equity offering.
From January 11, 2010 through June 30, 2011, we raised $78,423,340, net of issuance costs, in a continuous public offering of 8,713,705 shares of our common stock, with the final closing of escrowed funds from subscribing investors occurring on July 11, 2011. The shares of common stock were offered at $10.00 per share, adjusted for volume discounts and commission waivers. All shares in the continuous public offering were sold at a price of either $9.30 or $10.00, depending on whether or not sales commissions were waived by the dealer manager. The continuous public offering resulted in gross proceeds of $86,800,000, or an average price of $9.96 per share. The investment adviser purchased 564 shares of common stock in the continuous public offering at a price of $10.00 per share.
Because the portfolio company securities that we acquire are typically illiquid until an IPO or sale of the company, we generally cannot predict the regularity and time periods between dispositions of our portfolio company investments and the realizations of capital gains, if any, from such dispositions. Dispositions of our portfolio company investments are discretionary and based on our business judgment. If we are successful in disposing of a portfolio company investment, we intend to reinvest the principal amount of our investment in new portfolio company opportunities, with any gain that we may realize being distributed to our stockholders after we pay any incentive fees earned by our investment adviser and our operating expenses.
We intend to access the capital markets from time to time in the future to raise cash to fund additional investments. We also intend to file a registration statement with the SEC to offer for sale, from time to time, shares of our common stock, in one or more underwritten public offerings, at-the-market offerings, negotiated transactions, block trades, best efforts or a combination of these methods. We intend to use the proceeds from these offerings to fund additional investments in portfolio companies consistent with our investment objective. If we are not able to access the capital markets to raise cash to fund additional investments, we may not be able to grow our business and fully execute our business strategy and could decrease our investment income, if any, and cause our net asset value to deteriorate.
On March 15, 2012, we filed a registration statement on Form N-2 for an equity offering of our common stock. On November 9, 2012 we filed our third, and most recent, amendment to the registration statement. During 2012, we incurred $322,906 in offering expenses associated with the equity offering, including the preparation of the registration statement filed in connection therewith. Such costs were capitalized and will be either charged to equity upon the conclusion of the equity offering, or expensed if we do not complete the equity offering. There can be no assurance that we will be able to raise additional capital for investment purposes or, if we are able to do so, on terms favorable to us.
87
Table of Contents
At our 2012 Annual Meeting of Stockholders, our stockholders approved a proposal to sell or otherwise issue up to 50% of our outstanding shares of common stock at a price (after reduction for commission and discounts) below our net asset value per share at the time of such issuance. Our Board of Directors has also adopted a policy which prohibits us from selling or issuing shares of our common stock at an offering price per share (offering price to public before commissions and discounts) which represents a discount to the then current net asset value per share of more than 15%. This authorization will expire on the earlier of June 1, 2013 or the date of our 2013 Annual Meeting of Stockholders. In order to sell shares pursuant to this authorization, we cannot sell or issue shares of our common stock at a price below our net asset value per share at the time unless our Board of Directors determines that such sale or issuance would be in our and our stockholders’ best interests. Sales of our common stock at a price below our net asset value per share will dilute the interests of existing stockholders, have the effect of reducing our net asset value per share, and may reduce our market price per share. In addition, continuous sales of common stock below net asset value may have a negative impact on total returns and could have a negative impact on the market price of our shares of common stock.
On May 9, 2012, our Board of Directors authorized a stock repurchase program of up to $5.0 million. Under the repurchase program, we are authorized to repurchase shares of our common stock in open market transactions, including through block purchases, depending on prevailing market conditions and other factors. Our stock repurchase program was originally set to expire on November 8, 2012; however, on October 26, 2012, our Board of Directors extended our stock repurchase program for an additional six months. The program will now expire on May 8, 2013, unless extended further by our Board of Directors. The repurchase program may be extended, modified or discontinued at any time for any reason. The repurchase program does not obligate us to acquire any specific number of shares, and all repurchases will be made in accordance with Rule 10b— 18 under the Exchange Act, which sets certain restrictions on the method, timing, price and volume of stock repurchases. Since the inception of our stock repurchase program through December 31, 2012, we have repurchased 108,996 shares of our common stock at an average price of $7.01 per share, including commissions, for a total cost of $764,179, and our net asset value per share has increased by $0.01 per share as a result of these share repurchases. The 108,996 shares of common stock repurchased under our stock repurchase program have not been retired or cancelled, and remain issued but not outstanding shares, and were held in treasury as of December 31, 2012. Details of the monthly share repurchases under our stock repurchase program during 2012 are set forth in the table below.
| Period |
Total Number of Shares Repurchased |
Total Cost of Shares Repurchased |
Average Price Paid per Share |
Total Number of Shares Purchased as Part of the Publicly Announced Program (1) |
Total Cost of Shares Purchased as Part of the Publicly Announced Program (1) |
Maximum Dollar Value of Shares that May Yet be Purchased Under the Program (1) |
||||||||||||||||||
| April 2012 |
— | $ | — | $ | — | — | $ | — | $ | — | ||||||||||||||
| May 2012 |
4,159 | 29,221 | 7.03 | 4,159 | 29,221 | 4,970,779 | ||||||||||||||||||
| June 2012 |
34,829 | 247,977 | 7.12 | 34,829 | 247,977 | 4,722,802 | ||||||||||||||||||
| July 2012 |
— | — | — | — | — | 4,722,802 | ||||||||||||||||||
| August 2012 |
5,469 | 38,648 | 7.07 | 5,469 | 38,648 | 4,684,154 | ||||||||||||||||||
| September 2012 |
26,013 | 193,097 | 7.42 | 26,013 | 193,097 | 4,491,057 | ||||||||||||||||||
| October 2012 |
— | — | — | — | — | 4,491,057 | ||||||||||||||||||
| November 2012 |
26,970 | 178,867 | 6.63 | 26,970 | 178,867 | 4,312,190 | ||||||||||||||||||
| December 2012 |
11,556 | 76,369 | 6.61 | 11,556 | 76,369 | 4,235,821 | ||||||||||||||||||
| Total - 2012 |
108,996 | $ | 764,179 | $ | 7.01 | 108,996 | $ | 764,179 | ||||||||||||||||
| (1) | On May 9, 2012, our Board of Directors authorized a stock repurchase program of up to $5.0 million. The stock repurchase program was originally set to expire on November 8, 2012; however, on October 26, 2012, our Board of Directors extended our stock repurchase program for an additional six months. The program will now expire on May 8, 2013, unless extended further by our Board of Directors. |
Dividends and Distributions
Dividends and distributions to our common stockholders must be approved by our Board of Directors and any dividend payable is recorded on the ex-dividend date. On February 11, 2011, our Board of Directors declared a special cash distribution of $446,837, or $0.13 per share outstanding on the record date. The distribution was paid on February 17, 2011 to our stockholders of record as of February 15, 2011. This special cash distribution was based on the unrealized appreciation we had recorded on our NeoPhotonics investment at the time of the distribution, following NeoPhotonics’ completion of its IPO. In the future, we do not expect to pay distributions based on the unrealized appreciation of our private or public company investments.
On December 6, 2012, our Board of Directors declared a cash distribution of $282,203, or approximately $0.03 per share outstanding on the record date. The distribution was paid on December 26, 2012, to stockholders of record as of December 14, 2012. This distribution represented a distribution of our net realized capital gains for 2012.
88
Table of Contents
The following table summarizes the cash dividends declared and paid or to be paid on the outstanding shares of common stock to date:
| Date Declared |
Record Date | Payment Date | Amount Per Share |
|||||
| February 11, 2011 |
February 15, 2011 | February 17, 2011 | $ | 0.13 | ||||
| December 6, 2012 |
December 14, 2012 | December 26, 2012 | $ | 0.03 | ||||
|
|
|
|||||||
| $ | 0.16 | |||||||
For federal income tax purposes, distributions paid to our stockholders are characterized and reported as ordinary income, return of capital, long-term capital gains or a combination thereof. Distributions in excess of our current and accumulated earnings and profits would generally be treated first as a return of capital to the extent of the stockholder’s tax cost basis, and any remaining distributions would be treated as a capital gain. The determination of the tax attributes of our distributions is made annually as of the end of our fiscal year based upon our taxable income for the full year and distributions paid for the full year. There can be no certainty to stockholders that this determination is representative of what the tax attributes of our future distributions to stockholders, if any, will actually be. Each year a statement on Form 1099-DIV identifying the source of the distribution (i.e., paid from ordinary income, paid from net capital gains on the sale of portfolio company investments, and/or a return of capital which is a nontaxable distribution) is mailed to our stockholders. Our distribution of $446,837 to stockholders in February 2011 was characterized as a return of capital for federal income tax purposes since we did not generate any investment company taxable income or realized net capital gains during the year ended December 31, 2011. Our distribution of $282,203 to stockholders in December 2012 was characterized as a long-term capital gain distribution for federal income tax purposes since it represented a distribution of our net realized capital gains for 2012.
Distributions to our stockholders will be payable only as and when declared by our Board of Directors and will be paid out of assets legally available for distribution. All distributions will be paid at the discretion of our Board of Directors. We plan to make distributions from any assets legally available for distribution and will be required to determine the extent to which such distributions are paid out of current or accumulated earnings, realized capital gains or are returns of capital. To the extent there is a return of capital, investors will be required to reduce their cost basis in our stock for federal tax purposes, which will result in higher tax liability when the shares are sold, even if they have not increased in value or have lost value. In addition, any return of capital paid out of offering proceeds will be net of any sales load and offering expenses associated with sales of shares of our common stock.
Our Board of Directors currently maintains a distribution policy with the objective of distributing our net capital gains (which we define for this purpose as our realized capital gains in excess of realized capital losses during the year, without regard to the long-term or short-term character of such gains or losses), if any, after reduction for any incentive fees payable to our investment adviser, our operating expenses, and any other retained amounts. Our Board of Directors currently intends to declare distributions (if any) at least annually, at the end of each year. Since our portfolio company investments will typically not generate current income (i.e., dividends or interest income), we do not expect to generate net ordinary income from which we could make distributions to our stockholders. Our distributions will also depend on our financial condition, maintenance of our RIC status, corporate-level income and excise tax planning, compliance with applicable business development company regulations and such other factors as our Board of Directors may deem relevant from time to time.
We will have substantial fluctuations in our distribution payments to stockholders, since we expect to have an average holding period for our portfolio company investments of up to 36 months. Our ability to pay distributions will be based on our ability to invest our capital in securities of suitable portfolio companies in a timely manner, our portfolio companies achieving a liquidity event through either an IPO or sale of the company, and our ability to dispose of our positions at a gain following the liquidity event. We can give no assurance that we will be able to realize any net capital gains from the sale of our portfolio company investments. Accordingly, there can be no assurance that we will pay distributions to our stockholders in the future, and any distributions we do pay to stockholders will typically be paid only from net capital gains, if any, from the disposition of our portfolio company investments, after reduction for any incentive fees, operating expenses or other retained amounts.
In the event we retain some or all of our realized net capital gains, including amounts retained to pay incentive fees to our investment adviser or our operating expenses, we may designate the retained amount as a deemed distribution to stockholders. In such case, among other consequences, we will pay corporate-level tax on the retained amount, each U.S. stockholder will be required to include its share of the deemed distribution in income as if it had been actually distributed to the U.S. stockholder, and the U.S. stockholder will be entitled to claim a credit or refund equal to its allocable share of the corporate-level tax that we pay on the retained realized net capital gain.
We have adopted an “opt out” dividend reinvestment plan that provides for reinvestment of dividends and distributions on behalf of our stockholders, unless a stockholder elects to receive cash. As a result, if our Board of Directors authorizes, and we declare a cash dividend or distribution, then our stockholders who have not “opted out” of the dividend reinvestment plan will have their cash dividend automatically reinvested in additional whole shares of our common stock (with any fractional share being paid in cash), rather than receiving the cash dividends or distributions. Our distribution of $446,837 to stockholders in February 2011 was not eligible for reinvestment under the dividend reinvestment plan since our shares of common stock had not been listed on a stock exchange at the time of the distribution.
89
Table of Contents
Investment Advisory and Administrative Services Agreement
We have entered into an Investment Advisory and Administrative Services Agreement, pursuant to which Keating Investments has agreed to serve as our investment adviser and to furnish us with certain administrative services necessary to conduct our day-to-day operations. This agreement is terminable by either party upon proper notice. We pay Keating Investments a fee for its investment advisory services under the Investment Advisory and Administrative Services Agreement consisting of two components; (i) a base management fee, and (ii) an incentive fee. We also reimburse Keating Investments for our allocable portion of overhead and other administrative expenses incurred by it in performing its administrative obligations under the Investment Advisory and Administrative Services Agreement, including an allocable portion of the compensation of our Chief Financial Officer and Chief Compliance Officer, and their respective staff.
Our officers do not receive any compensation directly from us. However, the principals and officers of the investment adviser who also serve as the Company’s officers receive compensation from, or may have financial interests in, the investment adviser, which may be funded by or economically related to the investment advisory fees paid by us to the investment adviser under to the Investment Advisory and Administrative Services Agreement.
The base management fee (the “Base Fee”) is calculated at an annual rate of 2% of our gross assets. The Base Fee is payable monthly in arrears, and is calculated based on the value of our gross assets at the end of the most recently completed calendar quarter, and adjusted for any equity capital raises or repurchases during the current calendar quarter. We recorded Base Fees of $1,533,808, $1,153,058 and $218,876 for the years ended December 31, 2012, 2011 and 2010, respectively. As of December 31, 2012 and 2011, Base Fees payable to the investment adviser were $128,746 and $130,969, respectively.
The incentive fee is payable in arrears as of the end of each calendar year and equals 20% of our realized capital gains, if any, on a cumulative basis from inception through the end of each calendar year, computed net of all realized capital losses and unrealized capital depreciation on a cumulative basis, less the aggregate amount of any previously paid incentive fees. For purposes of determining the incentive fee to be paid, realized capital gains, realized capital losses and unrealized capital depreciation are each determined without regard to the holding period for our investments and include both long-term (held more than 12 months) and short-term holdings.
During the year ended December 31, 2012, we recorded incentive fee expense of $425,519 resulting from: (i) an increase in net unrealized appreciation on our portfolio company investments of $1,845,390 during such period, and (ii) an increase in our cumulative net realized capital gains of $282,203 during such period. During the years ended December 31, 2011 and 2010, we recorded $152,757 and $115,423 in incentive fee expense, resulting from the increase in net unrealized appreciation on our portfolio company investments of $763,784 and $577,116, respectively, during the years ended December 31, 2011 and 2010.
The incentive fees are calculated and paid annually based on cumulative net realized capital gains (taking into account cumulative realized capital losses) reduced by unrealized depreciation on any investments that have a fair value below our investment cost and incentive fees previously paid. During the year ended December 31, 2012, no incentive fees were earned by or payable to the investment adviser in accordance with the contractual terms of the Investment Advisory and Administrative Services Agreement since we did not generate net realized capital gains in excess of gross unrealized depreciation during such period. However, as of December 31, 2012, we had accrued incentive fees payable to the investment adviser in the amount of $693,699. Accordingly, as of December 31, 2012, the accrued incentive fee related to net unrealized appreciation may differ from the actual incentive fee that may be paid to the investment adviser depending on whether we are ultimately able to dispose of our portfolio company investments and generate a net realized capital gain at least commensurate with the net unrealized appreciation recorded as of December 31, 2012. Further, as of December 31, 2012, no incentive fees related to our cumulative net realized capital gain would have been due and payable to the investment adviser since the aggregate unrealized depreciation on our investments that have a fair value below our investment cost exceeded the amount of the cumulative net realized capital gain.
During the years ended December 31, 2011 and 2010, no incentive fees were earned by or payable to the investment adviser in accordance with the contractual terms of the Investment Advisory and Administrative Services Agreement since we did not generate any realized capital gains during such periods. However, during the years ended December 31, 2011 and 2010, we recorded $152,757 and $115,423 in incentive fee expense, respectively, resulting from the increase in net unrealized appreciation on our portfolio company investments of $763,784 and $577,116 during the years ended December 31, 2011 and 2010, respectively. Additionally, as of December 31, 2011 and 2010, we had recorded accrued incentive fees payable to the investment adviser in the amounts of $268,180 and $115,423, respectively, with respect to $1,340,900 and $577,116 of net unrealized appreciation on its portfolio company investments as of December 31, 2011 and 2010, respectively.
90
Table of Contents
We reimburse the investment adviser for the allocable portion of overhead and other expenses incurred by the investment adviser in performing its administrative obligations under the Investment Advisory and Administrative Services Agreement, including the allocable portion of compensation of our Chief Financial Officer and Chief Compliance Officer, and their respective staff. Our expense allocation ratio is not fixed, and is therefore subject to fluctuation from period to period. In particular, the allocation ratio with respect to compensation of our Chief Financial Officer and Chief Compliance Officer is dependent upon the amount of time each devotes to matters on behalf of us and Keating Investments, respectively. Allocated administrative expenses are payable to the investment adviser monthly in arrears.
We recorded allocated administrative expenses of $633,997, $450,019 and $404,633 for the years ended December 31, 2012, 2011 and 2010, respectively. As of December 31, 2012 and 2011, allocated administrative expenses payable to the investment adviser were $51,396 and $47,285, respectively. We also agreed to reimburse the investment adviser for separation payments due to our former Chief Financial Officer who resigned in November 2011. In consideration for certain separation services, the former Chief Financial Officer was paid a separation payment equal to $8,000 per month (prorated for any partial month) for the period November 16, 2011 through April 30, 2012.
An amended and restated version of the Investment Advisory and Administrative Services Agreement, which is presently in effect, was approved by our Board of Directors on April 17, 2009, and by our stockholders on May 14, 2009. On April 13, 2012, our Board of Directors (including the non-interested directors) renewed the current Investment Advisory and Administrative Services Agreement for an additional year. The current Investment Advisory and Administrative Services Agreement will remain in effect from year to year thereafter if approved annually by (i) the vote of our Board of Directors, or by the vote of a majority of our outstanding voting securities, and (ii) the vote of a majority of our directors who are not interested persons. An affirmative vote of the holders of a majority of our outstanding voting securities is also necessary in order to make material amendments to the current Investment Advisory and Administrative Services Agreement.
Commitments and Contingencies
In the normal course of business, we may enter into investment agreements under which we commit to make an investment in a portfolio company at some future date or over a specified period of time.
We maintain a directors and officers insurance policy and an excess coverage policy for non-indemnifiable claims covering us and our officers and directors. We have also agreed to indemnify our directors and officers to the maximum extent permitted by Maryland law subject to the restrictions in the 1940 Act.
As of December 31, 2012, we and our officers and directors are not a party to any material legal proceedings. However, from time to time, we may be party to certain legal proceedings incidental to the normal course of our business including the enforcement of our rights under contracts with our portfolio companies.
Off-Balance Sheet Arrangements
As of December 31, 2012, we had no off-balance sheet arrangements.
Critical Accounting Policies
The preparation of financial statements and related disclosures in conformity with accounting principles generally accepted in the United States of America requires management to make estimates and assumptions that affect the reported amounts of assets and liabilities, disclosure of contingent assets and liabilities at the date of the financial statements, and revenues and expenses during the periods reported. Actual results could materially differ from those estimates. We have identified the following items as critical accounting policies.
Valuation of portfolio company investments. The most significant estimate inherent in the preparation of our financial statements is the valuation of our portfolio investments and the related amounts of unrealized appreciation and depreciation. Value, as defined in Section 2(a)(41) of the 1940 Act, is: (i) the market price for those securities for which a market quotation is readily available, and (ii) for all other securities and assets, fair value is as determined in good faith by our Board of Directors. As of December 31, 2012 and December 31, 2011, 85.9% and 45%, respectively, of our gross assets represented investments in portfolio companies valued at fair value by our Board of Directors.
91
Table of Contents
Accounting Standards Codification Topic 820, “Fair Value Measurement and Disclosures,” (“ASC 820”) defines fair value as the price that would be received to sell an asset or paid to transfer a liability in an orderly transaction between market participants at the measurement date (exit price). In accordance with ASC 820, the Company uses a three-tier fair value hierarchy, which prioritizes the inputs used in measuring fair value as follows:
| • | Level 1: Observable inputs such as unadjusted quoted prices in active markets; |
| • | Level 2: Includes inputs such as quoted prices for similar securities in active markets and quoted prices for identical securities where there is little or no activity in the market; and |
| • | Level 3: Unobservable inputs for which little or no market data exists, therefore requiring an entity to develop its own assumptions. |
We make investments in later stage, typically venture capital-backed, private, pre-IPO companies in technology, Internet and software, and cleantech. Given the nature of investing in the securities of private companies, our investments are generally considered Level 3 assets under ASC 820 until these portfolio companies become public and begin trading on a stock exchange and until such time as these securities are no longer subject to any post-IPO lockup restrictions. As such, we value all of our investments, other than unrestricted securities in publicly traded portfolio companies, at fair value as determined in good faith pursuant to a consistent valuation policy and our Board of Directors in accordance with the provisions of ASC 820 and the 1940 Act.
Determination of fair values involves subjective judgments and estimates. Accordingly, this critical accounting policy expresses the uncertainty with respect to the possible effect of such valuations, and any change in such valuations, on our financial statements. We generally have agreements with our portfolio companies to receive financial and other information with respect to our private portfolio companies on a quarterly basis. However, for our quarterly fair value determinations, we typically will only have access to a portfolio company’s actual financial results as of or for the quarter end which precedes the quarter end for which our fair value determination relates. In addition, we typically only receive updated financial projections for a portfolio company on an annual basis. Due to the inherent uncertainty in determining the fair value of investments that do not have a readily available market value, the fair value of our investments determined in good faith by our Board of Directors may differ significantly from the value that would have been used had a ready market existed for such investments, and the differences could be material. Changes in valuation of these equity securities are recorded in our Statement of Operations as “Net change in unrealized appreciation (depreciation) on investments.” In addition, the net changes in unrealized appreciation (depreciation) on investments that we record each period will affect the amount of any accrued incentive fees payable to the investment adviser. Changes in valuation of any of our investments in privately held companies from one period to another may be volatile.
As of December 31, 2012, all of our investments in portfolio companies were determined to be Level 3 assets, except for our investment in the common stock of Solazyme, which was determined to be a Level 1 asset following the expiration of a 180-day lockup provision in November 2011. Our common stock investment in LifeLock, a publicly traded company, is expected to change from a Level 3 asset to a Level 1 asset once the 180-day lockup on our common stock in LifeLock expires in April 2013.
Determining fair value requires that judgment be applied to the specific facts and circumstances of each portfolio investment while employing a consistently applied valuation process for the types of investments we make. We are required to specifically value each individual investment on a quarterly basis.
The 1940 Act requires periodic valuation of each portfolio investment to determine our net asset value. Under the 1940 Act, unrestricted securities with readily available market quotations in an active market are valued at the closing market price on the valuation date; all other assets must be valued at fair value as determined in good faith by or under the direction of our Board of Directors.
Our equity investments for which market quotations are readily available in an active market are generally valued at the most recently available closing market prices and are classified as Level 1 assets. However, equity investments for which market quotations are readily available, but which are subject to lockup provisions restricting the resale of such investments for a specified period of time, are valued at a discount to the most recently available closing market prices and, accordingly, are classified as Level 3 assets. We generally apply a 10% discount for lack of marketability to positions where a portfolio company has completed an IPO, but where we are still subject to a customary 180-day lockup provision.
With respect to investments for which market quotations are not readily available, our Board of Directors undertakes a multi-step valuation process each quarter, as described below:
| • | Our quarterly valuation process begins with each portfolio company investment being initially valued by the senior investment professionals of Keating Investments, our investment adviser, responsible for the portfolio investment. |
92
Table of Contents
| • | The Chairman of our Valuation Committee, in consultation with management, will determine each calendar quarter which investments in our portfolio for which market quotations are not readily available will be reviewed by a third-party valuation firm. However, a review will be conducted by a third-party valuation firm for each new portfolio company investment made during a calendar quarter and for any portfolio company for which market quotations are not readily available and whose valuation has not been reviewed in the prior twelve months. |
| • | Our Valuation Committee reviews the preliminary valuations, and our investment adviser and the third-party valuation firm respond and supplement the preliminary valuation to reflect any comments provided by our Valuation Committee. |
| • | Our Board of Directors discusses the valuations and determines, in good faith, the fair value of each investment in our portfolio for which market quotations are not readily available based on the input of our investment adviser, the third-party valuation firm, and our Valuation Committee. |
The fair values of our equity investments for which market quotations are not readily available (including investments in convertible preferred stock) are determined based on various factors and are classified as Level 3 assets. To determine the fair value of a portfolio company for which market quotations are not readily available, we may analyze the portfolio company’s most recently available historical and projected financial results, public market comparables, and other factors. We may also consider other events, including the transaction in which we acquired our securities, subsequent equity sales by the portfolio company, mergers or acquisitions affecting the portfolio company, or the completion of an IPO by the portfolio company. In addition, we may consider the trends of the portfolio company’s basic financial metrics from the time of our original investment until the measurement date, with material improvement of these metrics indicating a possible increase in fair value, while material deterioration of these metrics may indicate a possible reduction in fair value. The fair values of our portfolio company securities are generally discounted for lack of marketability or when the securities are illiquid, such as when there are restrictions on resale or the lack of an established trading market which will generally be the case for pre-IPO companies, as well as during any lockup period to which we are subject with respect to public companies in our portfolio.
The fair value of common and preferred stock warrants is generally determined by using option pricing models, such as the Black-Scholes model or, in cases of certain warrants where the Company’s ability to exercise may be contingent or be subject to certain metrics, a Monte Carlo simulation.
93
Table of Contents
The following provides quantitative information about our Level 3 fair value measurements as of December 31, 2012:
| December 31, 2012 | ||||||||||||||||||||||||
| Investment Type |
Fair Value | Valuation Technique(s) |
Unobservable Input |
Range | Weighted Average (1) |
|||||||||||||||||||
| Level 3 Portfolio Company Investments: Preferred Stock | $ | 43,087,120 | Precedent transactions | Precedent transactions | n/a | to | n/a | n/a | ||||||||||||||||
| Comparable transactions | Revenue multiple | 1.5 | 12.7 | 7.5 | ||||||||||||||||||||
| Comparable public companies | Revenue multiple | 0.4 | to | 6.1 | 2.8 | |||||||||||||||||||
| EBITDA multiple | 1.3 | to | 7.4 | 5.2 | ||||||||||||||||||||
| P/E multiple | 16.6 | to | 16.7 | 16.7 | ||||||||||||||||||||
| Discount for lack of marketability | 30 | % | to | 45 | % | 34 | % | |||||||||||||||||
| Discounted cash flow | Discount rate | 23 | % | to | 50 | % | 37 | % | ||||||||||||||||
| Terminal revenue multiple | 0.7 | to | 8.8 | 4.6 | ||||||||||||||||||||
| Terminal EBITDA multiple |
6.8 | to | 6.8 | 6.8 | ||||||||||||||||||||
| Terminal P/E multiple | 22.0 | to | 22.0 | 22.0 | ||||||||||||||||||||
| Discount for lack of marketability |
30 | % | to | 45 | % | 34 | % | |||||||||||||||||
| Level 3 Portfolio Company Investments: Preferred Stock Warrants | $ | — | Option pricing model | Comparable public company equity volatility |
n/a | to | n/a | n/a | ||||||||||||||||
| Level 3 Portfolio Company Investments: Common Stock | $ | 19,791,002 | Precedent transactions | Precedent transactions | n/a | to | n/a | n/a | ||||||||||||||||
| Comparable public companies | Revenue multiple | 0.7 | to | 3.6 | 2.8 | |||||||||||||||||||
| EBITDA multiple | 4.8 | to | 7.3 | 5.8 | ||||||||||||||||||||
| P/E multiple | 16.0 | to | 18.7 | 17.4 | ||||||||||||||||||||
| Discount for lack of marketability | 10 | % | to | 40 | % | 25 | % | |||||||||||||||||
| Discounted cash flow | Discount rate | 35 | % | to | 55 | % | 40 | % | ||||||||||||||||
| Terminal revenue multiple | 0.7 | to | 5.9 | 4.7 | ||||||||||||||||||||
| Terminal EBITDA multiple | 6.8 | to | 17.3 | 11.0 | ||||||||||||||||||||
| Terminal P/E multiple | 23.9 | to | 23.9 | 23.9 | ||||||||||||||||||||
| Discount for lack of marketability | 10 | % | to | 40 | % | 25 | % | |||||||||||||||||
| Level 3 Portfolio Company Investments: Common Stock Warrants | $ | 982,878 | Option pricing model | Comparable public company equity volatility | 48 | % | to | 48 | % | 48 | % | |||||||||||||
| (1) | Weighted average based on fair value of as of December 31, 2012. |
We currently have engaged third-party valuation firms to conduct an initial valuation review of each new private portfolio company investment and, in accordance with our valuation policy, periodic updated valuation reviews for our portfolio investments that are not publicly traded.
Federal Income Taxes. From incorporation through December 31, 2009, we were treated as a corporation under Subchapter C of the Internal Revenue Code of 1986, as amended (the “Code”). Effective January 1, 2010, we elected to be treated for tax purposes as a regulated investment company, or RIC, under the Code. We intend to operate so as to qualify as a RIC and, as such, have made no provision for income taxes as of December 31, 2012 and 2011.
As a RIC, we generally will not have to pay corporate-level federal income taxes on any investment company taxable income (which is generally our net ordinary income plus the excess, if any, of realized net short-term capital gains over realized net long-term capital losses) or any realized net capital gains (which is generally net realized long-term capital gains in excess of net realized short-term capital losses) that we distribute to our stockholders as dividends. Taxable income generally differs from net income for financial reporting purposes due to temporary and permanent differences in the recognition of income and expenses. In addition, taxable income generally excludes any unrealized appreciation or depreciation in our portfolio company investments, because gains and losses are not included in taxable income until they are realized and required to be recognized.
To maintain RIC tax treatment, we must meet specified source-of-income and asset diversification requirements (as described below) and distribute annually at least 90% of our investment company taxable income. Because federal income tax rules differ from accounting principles generally accepted in the United States, distributions in accordance with tax rules may differ from net investment income and realized gains recognized for financial reporting purposes. Differences may be permanent or temporary in nature.
94
Table of Contents
We are not required to distribute our realized net capital gains, if any, to stockholders to maintain RIC tax treatment. However, we generally will have to pay corporate-level federal income taxes on any realized net capital gains that we do not distribute to our stockholders. In the event we retain any of our realized net capital gains, including amounts retained to pay incentive fees to our investment adviser or to pay our operating expenses, we may designate the retained amount as a deemed distribution to our stockholders and will be required to pay corporate-level tax on the retained amount.
We would also be subject to an excise tax imposed on RICs if we fail to distribute during each calendar year an amount at least equal to the sum of: (i) 98% of our ordinary income for the calendar year, (ii) 98.2% of our capital gains in excess of capital losses for the one-year period ending on October 31 of the calendar year, and (iii) any ordinary income and net capital gains for preceding years that were not distributed during such years. We will not be subject to this excise tax on amounts on which we are required to pay corporate income tax (such as retained realized net capital gains).
Recent Developments
Resignation of Stephen M. Hills as Chief Financial Officer and Treasurer. On January 21, 2013, Stephen M. Hills submitted his resignation as our Chief Financial Officer and Treasurer effective February 20, 2013. His resignation was accepted by our Board of Directors on January 22, 2013. Mr. Hills’ resignation was a personal decision and was not the result of any disagreement with us on any matters relating to our operations, policies or practices. Mr. Hills also resigned as the Chief Financial Officer of our investment adviser in February 2013.
Appointment of Frederic M. Schweiger as Chief Financial Officer and Treasurer. Our Board of Directors appointed Frederic M. Schweiger to serve as our Chief Financial Officer and Treasurer, replacing Mr. Hills, effective February 20, 2013. Mr. Schweiger will continue to serve as our Chief Operating Officer, Chief Compliance Officer, Secretary and a member of our Board of Directors. Mr. Schweiger also is the Chief Operating Officer and Chief Compliance Officer of our investment adviser and serves as a member of our investment adviser’s investment committee. Mr. Schweiger also replaced Mr. Hills as the Chief Financial Officer of our investment adviser in February 2013. Accordingly, Mr. Schweiger is an “interested person” as such term is defined in Section 2(a)(19) under the 1940 Act.
Biographical and other information with respect to Mr. Schweiger is included in the Proxy Statement for our 2012 Annual Stockholders’ Meeting which was filed with the U.S. Securities and Exchange Commission on April 3, 2012.
95
Table of Contents
| Item 7A. | Quantitative and Qualitative Disclosures About Market Risk |
Our business activities contain elements of risk. We consider the primary type of market risk attributable to us to be valuation risk.
Valuation Risk. Value, as defined in Section 2(a)(41) of the 1940 Act, is (i) the market price for those securities for which market quotations are readily available and (ii) fair value as determined in good faith by, or under the direction of, our Board of Directors for all other assets. (See Note 2, Valuation of Investments, included in “Item 8. Financial Statements and Supplementary Data.”)
Because there is initially no public market for the equity securities of the private companies in which we invest, the valuation of these investments is estimated in good faith by our Board of Directors, in accordance with our valuation procedures. In the absence of a readily ascertainable market value, the estimated value of our portfolio of equity securities may differ significantly from the value that would be placed on the portfolio if a ready market for the equity securities existed. Changes in valuation of these equity securities are recorded in our Statement of Operations as “Net change in unrealized appreciation (depreciation) on investments.” Changes in valuation of any of our investments in privately held companies from one period to another may be volatile.
Interest Rate Risk. As of December 31, 2012, we had cash and cash equivalents of $8,934,036. We primarily invest our cash on hand in money market funds that invest primarily in U.S. Treasury securities, U.S. Government agency securities, and repurchase agreements fully-collateralized by such securities. Cash needed to fund our near-term operating expenses is held in a bank depository account. Based on the investment of cash on hand in these money market funds, pending subsequent investment in portfolio companies in accordance with our investment objective or payment of our operating expenses, we have market risk exposure relating to fluctuations in interest rates. During December 2012 our money market funds earned an effective annualized dividend of approximately 0.02%. Assuming no other changes to our holdings of money market funds as of December 31, 2012, a one percentage point change in the underlying dividend rate payable on our money market funds as of December 31, 2012 would not have a material effect on the amount of dividend income earned from our money market funds for the following 90-day period.
We have not engaged in any hedging activities since our inception and we do not expect to engage in any hedging activities with respect to the market risks to which we are exposed. We also do not intend to lend the securities of our publicly traded portfolio companies to generate fee income.
96
Table of Contents
| Item 8. | Financial Statements and Supplementary Data |
Keating Capital, Inc.
97
Table of Contents
Report of Independent Registered Public Accounting Firm
Board of Directors and Shareholders
Keating Capital, Inc.
We have audited the accompanying statements of assets and liabilities of Keating Capital, Inc. (the “Company,” a Maryland corporation), including the schedules of investments, as of December 31, 2012 and 2011, the related statements of operations, cash flows and changes in net assets for each of the three years in the period ended December 31, 2012, and the related financial highlights for each of the four years in the period ended December 31, 2012 and for the period from May 9, 2008 (Inception) to December 31, 2008. These financial statements and financial highlights are the responsibility of the Company’s management. Our responsibility is to express an opinion on these financial statements and financial highlights based on our audits.
We conducted our audits in accordance with the standards of the Public Company Accounting Oversight Board (United States). Those standards require that we plan and perform the audit to obtain reasonable assurance about whether the financial statements and financial highlights are free of material misstatement. The Company is not required to have, nor were we engaged to perform an audit of its internal control over financial reporting. Our audit included consideration of internal control over financial reporting as a basis for designing audit procedures that are appropriate in the circumstances, but not for the purpose of expressing an opinion on the effectiveness of the Company’s internal control over financial reporting. Accordingly, we express no such opinion. An audit also includes examining, on a test basis, evidence supporting the amounts and disclosures in the financial statements. Our procedures included confirmation of securities owned as of December 31, 2012 and 2011, by correspondence with the custodian. An audit also includes assessing the accounting principles used and significant estimates made by management, as well as evaluating the overall financial statement presentation. We believe that our audits provide a reasonable basis for our opinion.
In our opinion, the financial statements and financial highlights referred to above present fairly, in all material respects, the financial position of Keating Capital, Inc. as of December 31, 2012 and 2011, the results of its operations, its cash flows, the changes in its net assets for each of the three years in the period ended December 31, 2012, and the related financial highlights for each of the four years in the period ended December 31, 2012 and for the period from May 9, 2008 (Inception) to December 31, 2008 in conformity with accounting principles generally accepted in the United States of America.
/s/ GRANT THORNTON LLP
Chicago, Illinois
February 15, 2013
98
Table of Contents
Keating Capital, Inc.
Statements of Assets and Liabilities
| December 31, | December 31, | |||||||
| 2012 | 2011 | |||||||
| Assets |
||||||||
| Investments in portfolio company securities at fair value: |
||||||||
| Non-control/non-affiliate investments: |
||||||||
| Private portfolio companies (Cost: $47,332,174 and $25,379,750, respectively) |
$ | 46,819,998 | $ | 24,992,349 | ||||
| Publicly-traded portfolio companies (Cost: $6,505,162 and $2,553,250, respectively) |
8,073,708 | 2,671,631 | ||||||
| Affiliate investments: |
||||||||
| Private portfolio companies (Cost: $8,000,080 and $8,000,080, respectively) |
10,130,000 | 9,610,000 | ||||||
|
|
|
|
|
|||||
| Total, investments in portfolio company securities at fair value (Cost: $61,837,416 and $35,933,080, respectively) |
65,023,706 | 37,273,980 | ||||||
| Cash and cash equivalents |
8,934,036 | 39,606,512 | ||||||
| Prepaid expenses and other assets |
104,429 | 62,746 | ||||||
| Deferred offering costs |
322,906 | — | ||||||
|
|
|
|
|
|||||
| Total assets |
$ | 74,385,077 | $ | 76,943,238 | ||||
|
|
|
|
|
|||||
| Liabilities |
||||||||
| Base management fees payable to investment adviser |
$ | 128,746 | $ | 130,969 | ||||
| Accrued incentive fees payable to investment adviser |
693,699 | 268,180 | ||||||
| Administrative expenses payable to investment adviser |
51,396 | 47,285 | ||||||
| Accounts payable |
90,139 | 70,602 | ||||||
| Accrued expenses and other liabilities |
8,157 | 41,487 | ||||||
|
|
|
|
|
|||||
| Total liabilities |
972,137 | 558,523 | ||||||
|
|
|
|
|
|||||
| Net assets |
||||||||
| Common stock, $0.001 par value; 200,000,000 authorized; 9,283,781 and 9,283,781 shares issued, respectively |
$ | 9,284 | $ | 9,284 | ||||
| Additional paid-in capital |
71,675,244 | 75,302,711 | ||||||
| Treasury stock, at cost, 108,996 and 0 shares held, respectively |
(764,179 | ) | — | |||||
| Accumulated net investment loss |
(693,699 | ) | (268,180 | ) | ||||
| Accumulated undistributed net realized gain on investments |
— | — | ||||||
| Net unrealized appreciation on investments |
3,186,290 | 1,340,900 | ||||||
|
|
|
|
|
|||||
| Total net assets |
$ | 73,412,940 | $ | 76,384,715 | ||||
|
|
|
|
|
|||||
| Total liabilities and net assets |
$ | 74,385,077 | $ | 76,943,238 | ||||
|
|
|
|
|
|||||
| Net asset value per share (on 9,174,785 and 9,283,781 shares outstanding, respectively) |
$ | 8.00 | $ | 8.23 | ||||
|
|
|
|
|
|||||
The accompanying notes are an integral part of these financial statements.
99
Table of Contents
Keating Capital, Inc.
| Years Ended December 31, | ||||||||||||
| 2012 | 2011 | 2010 | ||||||||||
| Investment income |
||||||||||||
| Interest and dividend income: |
||||||||||||
| Certificate of deposit and money market investments |
$ | 3,870 | $ | 54,348 | $ | 44,009 | ||||||
| Other income |
— | — | 10,000 | |||||||||
|
|
|
|
|
|
|
|||||||
| Total investment income |
3,870 | 54,348 | 54,009 | |||||||||
|
|
|
|
|
|
|
|||||||
| Operating expenses |
||||||||||||
| Base management fees |
1,533,808 | 1,153,058 | 218,876 | |||||||||
| Incentive fees |
425,519 | 152,757 | 115,423 | |||||||||
| Administrative expenses allocated from investment adviser |
633,997 | 450,019 | 404,633 | |||||||||
| Legal and professional fees |
670,839 | 579,751 | 335,839 | |||||||||
| Directors fees |
160,000 | 130,289 | 108,000 | |||||||||
| Stock transfer agent fees |
65,108 | 212,262 | 192,306 | |||||||||
| Printing and fulfillment expenses |
112,491 | 185,536 | 108,192 | |||||||||
| Postage and delivery expenses |
61,623 | 146,287 | 98,907 | |||||||||
| Stock issuance expenses |
— | 114,388 | 156,941 | |||||||||
| Travel and entertainment expenses |
81,904 | 345,461 | 125,617 | |||||||||
| General and administrative expenses |
311,567 | 294,562 | 166,268 | |||||||||
|
|
|
|
|
|
|
|||||||
| Total operating expenses |
4,056,856 | 3,764,370 | 2,031,002 | |||||||||
|
|
|
|
|
|
|
|||||||
| Net investment loss |
(4,052,986 | ) | (3,710,022 | ) | (1,976,993 | ) | ||||||
|
|
|
|
|
|
|
|||||||
| Net realized gain on investments |
||||||||||||
| Non-control/non-affiliate investments |
282,203 | — | — | |||||||||
|
|
|
|
|
|
|
|||||||
| Total net realized gain on investments |
282,203 | — | — | |||||||||
|
|
|
|
|
|
|
|||||||
| Net change in unrealized appreciation (depreciation) on investments |
||||||||||||
| Non-control/non-affiliate investments |
1,325,390 | (846,136 | ) | 577,116 | ||||||||
| Affiliate investments |
520,000 | 1,609,920 | — | |||||||||
|
|
|
|
|
|
|
|||||||
| Total net change in unrealized appreciation (depreciation) on investments |
1,845,390 | 763,784 | 577,116 | |||||||||
|
|
|
|
|
|
|
|||||||
| Net decrease in net assets resulting from operations |
$ | (1,925,393 | ) | $ | (2,946,238 | ) | $ | (1,399,877 | ) | |||
|
|
|
|
|
|
|
|||||||
| Net investment loss per common share outstanding (basic and diluted) |
$ | (0.44 | ) | $ | (0.54 | ) | $ | (1.43 | ) | |||
|
|
|
|
|
|
|
|||||||
| Net decrease in net assets resulting from operations per common share outstanding (basic and diluted) |
$ | (0.21 | ) | $ | (0.43 | ) | $ | (1.01 | ) | |||
|
|
|
|
|
|
|
|||||||
| Weighted average common shares outstanding (basic and diluted) |
9,198,016 | 6,921,481 | 1,383,537 | |||||||||
|
|
|
|
|
|
|
|||||||
The accompanying notes are an integral part of these financial statements.
100
Table of Contents
Keating Capital, Inc.
Statements of Changes in Net Assets
| Treasury | Accumulated Net |
Accumulated Undistributed Net Realized |
Unrealized Appreciation (Depreciation) |
Distributions of Net |
||||||||||||||||||||||||||||||||
| Common Stock | Additional | Stock | Investment | Gain on | on | Investment | Net | |||||||||||||||||||||||||||||
| Shares (1) | Par Value | Paid-in Capital | At Cost | Income (Loss) | Investments | Investments | Income | Assets | ||||||||||||||||||||||||||||
| Balance at December 31, 2009 (3) |
569,900 | $ | 570 | $ | 3,718,926 | $ | — | $ | — | $ | — | $ | — | $ | — | $ | 3,719,496 | |||||||||||||||||||
| Net (decrease) increase in net assets from operations |
— | — | — | — | (1,976,993 | ) | — | 577,116 | — | (1,399,877 | ) | |||||||||||||||||||||||||
| Issuance of common stock, net of offering costs of $ 2,196,066(2) |
2,290,399 | 2,290 | 20,611,297 | — | — | — | — | — | 20,613,587 | |||||||||||||||||||||||||||
| Amortization of deferred offering costs |
— | — | (476,806 | ) | — | — | — | — | — | (476,806 | ) | |||||||||||||||||||||||||
| Reclassification of permanent book to tax differences (4) |
— | — | (1,861,570 | ) | — | 1,861,570 | — | — | — | — | ||||||||||||||||||||||||||
|
|
|
|
|
|
|
|
|
|
|
|
|
|
|
|
|
|
|
|||||||||||||||||||
| Balance at December 31, 2010 (3) |
2,860,299 | $ | 2,860 | $ | 21,991,847 | $ | — | $ | (115,423 | ) | $ | — | $ | 577,116 | $ | — | $ | 22,456,400 | ||||||||||||||||||
|
|
|
|
|
|
|
|
|
|
|
|
|
|
|
|
|
|
|
|||||||||||||||||||
| Net (decrease) increase in net assets from operations |
— | — | — | — | (3,710,022 | ) | — | 763,784 | — | (2,946,238 | ) | |||||||||||||||||||||||||
| Issuance of common stock, net of offering costs of $ 6,180,594(2) |
6,423,482 | 6,423 | 57,803,330 | — | — | — | — | — | 57,809,753 | |||||||||||||||||||||||||||
| Amortization of deferred offering costs |
— | — | (488,363 | ) | — | — | — | — | — | (488,363 | ) | |||||||||||||||||||||||||
| Distributions in excess of net investment income and net realized gains |
— | — | — | — | — | — | — | (446,837 | ) | (446,837 | ) | |||||||||||||||||||||||||
| Classification of distributions as a return of capital (5) |
— | — | (446,837 | ) | — | — | — | — | 446,837 | — | ||||||||||||||||||||||||||
| Reclassification of permanent book to tax differences (4) |
— | — | (3,557,265 | ) | — | 3,557,265 | — | — | — | — | ||||||||||||||||||||||||||
|
|
|
|
|
|
|
|
|
|
|
|
|
|
|
|
|
|
|
|||||||||||||||||||
| Balance at December 31, 2011 (3) |
9,283,781 | $ | 9,284 | $ | 75,302,711 | $ | — | $ | (268,180 | ) | $ | — | $ | 1,340,900 | $ | — | $ | 76,384,715 | ||||||||||||||||||
|
|
|
|
|
|
|
|
|
|
|
|
|
|
|
|
|
|
|
|||||||||||||||||||
| Net (decrease) increase in net assets from operations |
— | — | — | — | (4,052,986 | ) | 282,203 | 1,845,390 | — | (1,925,393 | ) | |||||||||||||||||||||||||
| Distributions to stockholders as long-term capital gains distribution (5) |
— | — | — | — | — | (282,203 | ) | — | — | (282,203 | ) | |||||||||||||||||||||||||
| Repurchase of common stock (108,996 shares) |
— | — | — | (764,179 | ) | — | — | — | — | (764,179 | ) | |||||||||||||||||||||||||
| Reclassification of permanent book to tax differences (4) |
— | — | (3,627,467 | ) | — | 3,627,467 | — | — | — | — | ||||||||||||||||||||||||||
|
|
|
|
|
|
|
|
|
|
|
|
|
|
|
|
|
|
|
|||||||||||||||||||
| Balance at December 31, 2012 (3) |
9,283,781 | $ | 9,284 | $ | 71,675,244 | $ | (764,179 | ) | $ | (693,699 | ) | $ | — | $ | 3,186,290 | $ | — | $ | 73,412,940 | |||||||||||||||||
|
|
|
|
|
|
|
|
|
|
|
|
|
|
|
|
|
|
|
|||||||||||||||||||
| (1) | Represents common shares issued. |
| (2) | All shares were sold at a price of either $9.30 or $10.00, depending on whether or not sales commissions were waived by the dealer manager. (3) Net assets at December 31, 2012, 2011, 2010 and 2009 include no accumulated undistributed net investment income. |
| (4) | See Note 2—Income Taxes. |
| (5) | See Note 2—Dividends and Distributions. |
The accompanying notes are an integral part of these financial statements.
101
Table of Contents
Keating Capital, Inc.
| Years Ended December 31, | ||||||||||||
| 2012 | 2011 | 2010 | ||||||||||
| Cash flows from operating activities |
||||||||||||
| Net decrease in net assets resulting from operations |
$ | (1,925,393 | ) | $ | (2,946,238 | ) | $ | (1,399,877 | ) | |||
| Adjustments to reconcile net decrease in net assets resulting from operations to net cash used in operating activities: |
||||||||||||
| Net realized gain on investments |
(282,203 | ) | — | — | ||||||||
| Net change in unrealized (appreciation) depreciation on investments |
(1,845,390 | ) | (763,784 | ) | (577,116 | ) | ||||||
| Changes in operating assets and liabilities: |
||||||||||||
| (Increase) decrease in prepaid expenses and other assets |
(41,683 | ) | 29,379 | (58,553 | ) | |||||||
| (Decrease) increase in base management fees payable to investment adviser |
(2,223 | ) | 40,338 | 61,163 | ||||||||
| Increase in accrued incentive fees payable to investment adviser |
425,519 | 152,757 | 115,423 | |||||||||
| Increase (decrease) in administrative expenses payable to investment adviser |
4,111 | 5,937 | (25,788 | ) | ||||||||
| Decrease in reimbursable expenses payable to investment adviser |
— | (3,068 | ) | (14,995 | ) | |||||||
| Increase (decrease) in accounts payable |
19,537 | (9,673 | ) | 48,162 | ||||||||
| (Decrease) increase in accrued expenses and other liabilities |
(33,330 | ) | (28,081 | ) | 32,457 | |||||||
|
|
|
|
|
|
|
|||||||
| Net cash used in operating activities |
(3,681,055 | ) | (3,522,433 | ) | (1,819,124 | ) | ||||||
| Cash flows from investing activities |
||||||||||||
| Investments in portfolio companies |
(27,479,924 | ) | (32,332,589 | ) | (3,600,491 | ) | ||||||
| Net proceeds from sales of portfolio company investments |
1,857,791 | — | — | |||||||||
| Purchases of short-term investments |
— | (89,000,000 | ) | (84,000,000 | ) | |||||||
| Proceeds from maturities of short-term investments |
— | 102,500,000 | 73,500,000 | |||||||||
|
|
|
|
|
|
|
|||||||
| Net cash used in investing activities |
(25,622,133 | ) | (18,832,589 | ) | (14,100,491 | ) | ||||||
| Cash flows from financing activities |
||||||||||||
| Gross proceeds from issuance of common stock |
— | 63,990,347 | 22,809,653 | |||||||||
| Offering costs from issuance of common stock |
— | (6,180,594 | ) | (2,196,066 | ) | |||||||
| Additions to deferred stock offering costs |
(322,906 | ) | (154,681 | ) | (308,591 | ) | ||||||
| Repurchase of common stock |
(764,179 | ) | — | — | ||||||||
| Stockholder distributions as long-term capital gains distribution |
(282,203 | ) | — | — | ||||||||
| Stockholder distributions as a return of capital |
— | (446,837 | ) | — | ||||||||
|
|
|
|
|
|
|
|||||||
| Net cash (used in) provided by financing activities |
(1,369,288 | ) | 57,208,235 | 20,304,996 | ||||||||
|
|
|
|
|
|
|
|||||||
| Net (decrease) increase in cash and cash equivalents |
(30,672,476 | ) | 34,853,213 | 4,385,381 | ||||||||
| Cash and cash equivalents, beginning of period |
39,606,512 | 4,753,299 | 367,918 | |||||||||
|
|
|
|
|
|
|
|||||||
| Cash and cash equivalents, end of period |
$ | 8,934,036 | $ | 39,606,512 | $ | 4,753,299 | ||||||
|
|
|
|
|
|
|
|||||||
| Supplemental disclosure of non-cash financing activities |
||||||||||||
| Amortization of deferred offering costs |
$ | — | $ | 488,363 | $ | 476,806 | ||||||
The accompanying notes are an integral part of these financial statements.
102
Table of Contents
Keating Capital, Inc.
December 31, 2012
| Portfolio Company |
Industry / Description (1) |
Type of Investment (2) |
Shares / Warrants |
Cost (3) | Value (4) | Value as % of Net Assets |
||||||||||||||
| Non-Control/Non-Affiliate Investments (5) |
||||||||||||||||||||
| Private Portfolio Companies: |
||||||||||||||||||||
| Livescribe, Inc. (6) |
Technology - Consumer Electronics | Common Stock |
9,686 | $ | 606,187 | $ | — | 0.00 | % | |||||||||||
| MBA Polymers, Inc. |
Cleantech - Plastics Recycling | Series G Convertible Preferred Stock |
2,000,000 | 2,000,000 | 1,730,000 | 2.36 | % | |||||||||||||
| BrightSource Energy, |
Cleantech - Solar Thermal Energy | Common Stock |
132,972 | 1,756,203 | 1,630,000 | 2.22 | % | |||||||||||||
| Series 1A Preferred Stock |
2,500,005 | 743,803 | 630,000 | 0.86 | % | |||||||||||||||
| Series 1 Convertible Preferred Stock |
26,475 | 397,125 | 397,125 | 0.54 | % | |||||||||||||||
| Harvest Power, Inc. |
Cleantech - Waste Management | Series B Convertible Preferred Stock |
580,496 | 2,499,999 | 3,540,000 | 4.82 | % | |||||||||||||
| Suniva, Inc. (8) |
Cleantech - Solar Photovoltaic Cells | Series D Convertible Preferred Stock |
198 | 2,500,007 | 1,280,000 | 1.74 | % | |||||||||||||
| Xtime, Inc. (9) |
Internet & Software - Software as a Service | Series 1A Convertible Preferred Stock | 1,573,234 | 2,389,140 | 3,530,000 | 4.81 | % | |||||||||||||
| Common Stock Warrants | n/a | 610,860 | 900,000 | 1.23 | % | |||||||||||||||
| Exercise price $0.01 per share; perpetual term |
||||||||||||||||||||
| Subject to restrictions on exercisability |
||||||||||||||||||||
| Common Stock Warrants |
22,581 | — | 12,878 | 0.02 | % | |||||||||||||||
| Exercise price $0.01 per share; expire 8/24/2018 |
||||||||||||||||||||
| Subject to restrictions on exercisability |
||||||||||||||||||||
| Kabam, Inc. |
Internet & Software - Online Multiplayer Games | Series D Convertible Preferred Stock | 1,046,017 | 1,328,860 | 980,000 | 1.33 | % | |||||||||||||
| Tremor Video, Inc. |
Internet & Software - Online Video Advertising | Series F Convertible Preferred Stock |
642,994 | 4,000,001 | 3,850,000 | 5.25 | % | |||||||||||||
| TrueCar, Inc. |
Internet & Software - Consumer Website | Common Stock |
566,037 | 2,999,996 | 2,680,000 | 3.65 | % | |||||||||||||
| Agilyx Corporation |
Cleantech - Renewable Oils | Series C Convertible Preferred Stock |
1,092,956 | 4,000,000 | 3,650,000 | 4.97 | % | |||||||||||||
| Zoosk, Inc. |
Internet & Software - Online Dating | Series E Convertible Preferred Stock |
715,171 | 2,999,999 | 3,080,000 | 4.20 | % | |||||||||||||
| SilkRoad, Inc. (10) |
Internet & Software - Software as a Service | Series C Convertible Preferred Stock |
17,711,654 | 5,000,000 | 5,720,000 | 7.79 | % | |||||||||||||
| Glam Media, Inc. |
Internet & Software - Social Media | Series F Convertible Preferred Stock |
1,196,315 | 4,999,999 | 5,170,000 | 7.04 | % | |||||||||||||
| Stoke, Inc. |
Technology - Communications Equipment | Common Stock |
1,000,000 | 3,500,000 | 3,040,000 | 4.14 | % | |||||||||||||
| Jumptap, Inc. |
Internet & Software - Mobile Advertising | Series G Convertible Preferred Stock |
695,023 | 4,999,995 | 4,999,995 | 6.81 | % | |||||||||||||
|
|
|
|
|
|
|
|||||||||||||||
| Subtotal - Non-Control/Non-Affiliate Investments, Private Portfolio Companies |
$ | 47,332,174 | $ | 46,819,998 | 63.78 | % | ||||||||||||||
|
|
|
|
|
|
|
|||||||||||||||
The accompanying notes are an integral part of these financial statements.
103
Table of Contents
Keating Capital, Inc.
Schedule of Investments
December 31, 2012
| Portfolio Company |
Industry / Description (1) |
Type of Investment (2) |
Shares / Warrants |
Cost (3) | Value (4) | Value as % of Net Assets |
||||||||||||||
| Publicly Traded Portfolio Companies: |
||||||||||||||||||||
| Solazyme, Inc. (11) |
Cleantech - Renewable Oils and Bioproducts |
Common Stock | 147,927 | 1,505,162 | 1,162,706 | 1.58 | % | |||||||||||||
| LifeLock, Inc. |
Internet & Software - Identity Theft Protection |
Common Stock | 944,513 | 5,000,000 | 6,911,002 | 9.41 | % | |||||||||||||
|
|
|
|
|
|
|
|||||||||||||||
| Subtotal - Non-Control/Non-Affiliate Investments, Publicly Traded Portfolio Companies |
$ | 6,505,162 | $ | 8,073,708 | 10.99 | % | ||||||||||||||
|
|
|
|
|
|
|
|||||||||||||||
| Affiliate Investments (5) |
||||||||||||||||||||
| Private Portfolio Companies: |
||||||||||||||||||||
| Corsair Components, |
Technology - PC Gaming Hardware |
Common Stock | 640,000 | 3,411,080 | 5,530,000 | 7.53 | % | |||||||||||||
| Common Stock Warrants | 160,000 | 589,000 | 70,000 | 0.10 | % | |||||||||||||||
| Exercise price $0.05 per share; expire 7/6/2016 |
||||||||||||||||||||
| Subject to restrictions on exercisability |
||||||||||||||||||||
| Metabolon, Inc. |
Technology - Molecular Diagnostics and Services |
Series D Convertible Preferred Stock | 2,229,021 | 4,000,000 | 4,530,000 | 6.17 | % | |||||||||||||
|
|
|
|
|
|
|
|||||||||||||||
| Subtotal - Affiliate Investments, Private Portfolio Companies |
$ | 8,000,080 | $ | 10,130,000 | 13.80 | % | ||||||||||||||
|
|
|
|
|
|
|
|||||||||||||||
| Total - Investments in Portfolio Company |
$ | 61,837,416 | $ | 65,023,706 | 88.57 | % | ||||||||||||||
|
|
|
|
|
|
|
|||||||||||||||
| Reconciliation to Net Assets |
Amount | % of Net Assets |
||||||
| Investments in portfolio company securities at fair value |
$ | 65,023,706 | 88.57 | % | ||||
| Cash and cash equivalents (includes investments in money market funds consisting of 8,675,149 Class A shares in the SEI Daily Income Trust Government Fund (SEOXX) with a value of $1 per share, or $8,675,149) |
8,934,036 | 12.17 | % | |||||
| Receivable for investments sold |
— | 0.00 | % | |||||
| Prepaid expenses and other assets |
104,429 | 0.14 | % | |||||
| Deferred offering costs |
322,906 | 0.44 | % | |||||
| Less: Total Liabilities |
(972,137 | ) | (1.32 | %) | ||||
|
|
|
|
|
|||||
| Net Assets |
$ | 73,412,940 | 100.00 | % | ||||
|
|
|
|
|
|||||
The accompanying notes are an integral part of these financial statements.
104
Table of Contents
Keating Capital, Inc.
Schedule of Investments
December 31, 2012
| (1) | The Company classifies its portfolio companies into three industries: (i) technology, (ii) Internet and software, and (iii) cleantech. The further description generally identifies the types of products or services provided by each portfolio company. |
| (2) | Convertible preferred, common stock, warrants and equity interests are generally non-income producing. Except for the convertible preferred stock in SilkRoad and Jumptap, all convertible preferred stock investments carry a non-cumulative, preferred dividend payable when and if declared by the portfolio company’s board of directors. In the case of SilkRoad, the shares of convertible preferred stock carry a cumulative preferred dividend, which is payable only when declared by SilkRoad’s board of directors or upon a qualifying liquidation event. In the case of Jumptap, the shares of convertible preferred stock carry a cumulative preferred dividend, which is payable only when declared by Jumptap’s board of directors. During the year ended December 31, 2012, the preferred dividends on our Series B convertible preferred stock in Harvest Power were changed from a cumulative to a non-cumulative dividend. Since no dividends have been declared or paid, or are expected to be declared or paid, with respect to these convertible preferred stock investments, these investments are considered to be non-income producing. |
| (3) | Gross unrealized appreciation, gross unrealized depreciation, and net unrealized appreciation for federal income tax purposes totaled $8,012,803, $4,826,513 and $3,186,290, respectively. The tax cost of investments is $61,837,416. |
| (4) | Except for common stock in one publicly traded portfolio company, Solazyme, all investments were valued at fair value as determined in good faith by the Board of Directors and are subject to legal restrictions on transfer (including lockup and other contractual restrictions) as of December 31, 2012. See Valuation of Investments under Note 2 of the Notes to Financial Statements. |
| (5) | Control Investments are defined by the Investment Company Act of 1940, as amended (the “1940 Act”), as investments in which the Company owns more than 25% of the voting securities or where the Company has the ability to nominate greater than 50% of the board representation. Affiliate Investments are defined by the 1940 Act as investments in which the Company owns between 5% and 25% of the voting securities. Non-Control/Non-Affiliate Investments are defined by the 1940 Act as investments that are neither Control Investments nor Affiliate Investments. |
| (6) | In November 2012, Livescribe closed on a convertible note financing. Because the Company did not participate in the convertible note financing: (i) the Series C, C-1 and C-2 preferred stock the Company held in Livescribe were automatically converted into common stock at an unfavorable rate (one share for each 2.5 conversion shares), and (ii) the Series C and C-1 preferred stock warrants the Company held in Livescribe were canceled. Concurrent with the convertible note financing, Livescribe completed a 1-for-100 reverse stock split. |
| (7) | In October 2012, BrightSource completed an initial closing of a Series 1 preferred stock financing (the “Series 1 Financing”), in which the Company invested $397,125 to acquire 26,475 shares of Series 1 preferred stock. Immediately prior to the Series 1 Financing, all outstanding shares of preferred stock were automatically converted into common stock on a 1-for-1 basis, after giving effect to a 1-for-3 reverse stock split, which was effected in March 2012. As such, the Company’s 288,531 shares of Series E Preferred Stock on a pre-split basis were converted into 96,177 shares of common stock. Because the Company made its full pro-rata investment in the Series 1 Financing, the Company also received: (i) 2,500,005 shares of Series 1A preferred stock, which have a liquidation preference of $1.00 per share subordinate to the Series 1 liquidation preference, and (ii) 36,795 shares of common stock to compensate existing preferred stock investors for the potential dilutive effect of BrightSource’s option pool increase. The Series 1A preferred shares are not convertible into common stock. |
| (8) | Suniva completed a 1-for-1000 reverse stock split effective December 20, 2012. As a result of the reverse stock split, the Company now owns 197.942 shares of Series D convertible preferred stock. Prior to the reverse stock split, the Company previously owned 197,942 shares of Series D convertible preferred stock. |
| (9) | In October 2012, Xtime completed a Series 2 convertible preferred stock financing (“Series 2 Financing”) in which the Company did not participate. Immediately prior to the closing of the Series 2 Financing, all of the existing holders of Xtime’s preferred stock (including the Series F preferred stockholders) converted their existing preferred stock into: (i) newly-created Series 1A and 1B convertible preferred stock, and (ii) warrants to acquire additional shares of Xtime’s common stock which grant the holder the right to acquire additional shares of common stock, calculated at the time of Xtime’ IPO based on the actual IPO price, at an exercise price of $0.01 per share (“IPO warrants”). As a holder of Series F preferred stock, the Company received one share of Series 1A preferred stock for each share of Series F preferred stock that the Company held, no shares of Series 1B preferred stock, and IPO Warrants that are exercisable upon Xtime’s IPO. The Company continues to hold warrants to acquire 22,581 shares of Xtime common stock which it received as part of the Series F preferred stock investment. |
| (10) | Effective July 17, 2012, SilkRoad Technology Holdings, Inc. changed its name to SilkRoad, Inc. |
| (11) | The Company sold 65,000 shares of Solazyme common stock with an aggregate cost basis of $575,588 during the year ended December 31, 2012. |
| (12) | Corsair Components completed a 1-for-5 reverse stock split effective April 24, 2012. As a result of the reverse stock split, the Company now owns 640,000 shares of common stock and warrants to purchase 160,000 shares of common stock at an exercise price of $0.05 per share. Prior to the reverse stock split, the Company previously owned 3,200,000 shares of common stock and warrants to purchase 800,000 shares of common stock at an exercise price of $0.01 per share. |
| (13) | All portfolio company investments constituted qualifying investments under Section 55(a) of the 1940 Act as of December 31, 2012, with the exception of 100,000 shares of Solazyme common stock acquired in open market transactions with a cost and value of $1,080,759 and $786,000, respectively, which represent approximately 1.5% and 1.1% of total assets. |
The accompanying notes are an integral part of these financial statements.
105
Table of Contents
Keating Capital, Inc.
Schedule of Investments
December 31, 2011
| Portfolio Company |
Industry / Description (1) |
Type of Investment (2) |
Shares / Warrants |
Cost (3) | Value (4) | Value as % of Net Assets |
||||||||||||||
| Non-Control/Non-Affiliate Investments (5) |
||||||||||||||||||||
| Private Portfolio Companies: |
||||||||||||||||||||
| Livescribe, Inc. |
Technology - Consumer Electronics |
Series C Convertible Preferred Stock |
1,000,000 | $ | 471,295 | $ | 139,000 | 0.18 | % | |||||||||||
| Series C Convertible Preferred Stock Warrants |
125,000 | 29,205 | 1,140 | 0.00 | % | |||||||||||||||
| Exercise price $0.50 per share; expire 6/30/2015 |
||||||||||||||||||||
| Series C-1 Convertible Preferred Stock |
100,660 | 47,528 | 14,001 | 0.02 | % | |||||||||||||||
| Series C-1 Convertible Preferred Stock Warrants |
12,582 | 2,853 | 183 | 0.00 | % | |||||||||||||||
| Exercise price $0.50 per share; expire 7/8/2016 |
||||||||||||||||||||
| MBA Polymers, Inc. |
Cleantech - Plastics Recycling |
Series G Convertible Preferred Stock |
2,000,000 | 2,000,000 | 2,000,000 | 2.62 | % | |||||||||||||
| BrightSource Energy, Inc. |
Cleantech - Solar Thermal Energy |
Series E Convertible Preferred Stock |
288,531 | 2,500,006 | 2,500,006 | 3.27 | % | |||||||||||||
| Harvest Power, Inc. |
Cleantech - Waste Management |
Series B Convertible Preferred Stock | 580,496 | 2,499,999 | 2,499,999 | 3.27 | % | |||||||||||||
| Suniva, Inc. |
Cleantech - Solar Photovoltaic Cells |
Series D Convertible Preferred Stock |
197,942 | 2,500,007 | 2,500,007 | 3.27 | % | |||||||||||||
| Xtime, Inc. |
Internet & Software - Software as a Service |
Series F Convertible Preferred Stock | 1,573,234 | 3,000,000 | 3,000,000 | 3.93 | % | |||||||||||||
| Common Stock Warrants | 22,581 | — | 9,156 | 0.01 | % | |||||||||||||||
| Exercise price $0.01 per share; expire 8/24/2018 |
||||||||||||||||||||
| Subject to restrictions on exercisability |
||||||||||||||||||||
| Kabam, Inc. |
Internet & Software - Online Multiplayer Games |
Series D Convertible Preferred Stock |
1,046,017 | 1,328,860 | 1,328,860 | 1.74 | % | |||||||||||||
| Tremor Video, Inc. |
Internet & Software - Online Video Advertising |
Series F Convertible Preferred Stock | 642,994 | 4,000,001 | 4,000,001 | 5.24 | % | |||||||||||||
| TrueCar, Inc. |
Internet & Software - Consumer Website |
Common Stock | 566,037 | 2,999,996 | 2,999,996 | 3.93 | % | |||||||||||||
| Agilyx Corporation |
Cleantech - Renewable Oils |
Series C Convertible Preferred Stock |
1,092,956 | 4,000,000 | 4,000,000 | 5.24 | % | |||||||||||||
|
|
|
|
|
|
|
|||||||||||||||
| Subtotal - Non-Control/Non-Affiliate Investments, Private Portfolio Companies |
$ | 25,379,750 | $ | 24,992,349 | 32.72 | % | ||||||||||||||
|
|
|
|
|
|
|
|||||||||||||||
| Publicly Traded Portfolio Companies: |
||||||||||||||||||||
| NeoPhotonics Corporation |
Technology - Communications Equipment |
Common Stock | 160,000 | 1,000,000 | 732,800 | 0.96 | % | |||||||||||||
| Solazyme, Inc. |
Cleantech - Renewable Oils and Bioproducts |
Common Stock | 162,927 | 1,553,250 | 1,938,831 | 2.54 | % | |||||||||||||
|
|
|
|
|
|
|
|||||||||||||||
| Subtotal - Non-Control/Non-Affiliate Investments, Publicly Traded Portfolio Companies |
$ | 2,553,250 | $ | 2,671,631 | 3.50 | % | ||||||||||||||
|
|
|
|
|
|
|
|||||||||||||||
The accompanying notes are an integral part of these financial statements
106
Table of Contents
Keating Capital, Inc.
December 31, 2011
| Portfolio Company |
Industry / Description (1) |
Type of Investment (2) |
Shares / Warrants |
Cost (3) | Value (4) | Value as % of Net Assets |
||||||||||||||
| Affiliate Investments (5) |
||||||||||||||||||||
| Private Portfolio Companies: |
||||||||||||||||||||
| Metabolon, Inc. |
Technology - Molecular Diagnostics and Services | Series D Convertible Preferred Stock |
2,229,021 | 4,000,000 | 4,000,000 | 5.24 | % | |||||||||||||
| Corsair Components, Inc. |
Technology - PC Gaming Hardware | Common Stock |
3,200,000 | 3,411,080 | 5,400,000 | 7.07 | % | |||||||||||||
| Common Stock Warrants |
800,000 | 589,000 | 210,000 | 0.27 | % | |||||||||||||||
| Exercise price $0.01 per share; expire 7/6/2016 |
||||||||||||||||||||
| Subject to restrictions on exercisability |
||||||||||||||||||||
|
|
|
|
|
|
|
|||||||||||||||
| Subtotal - Affiliate Investments, Private Portfolio Companies |
$ | 8,000,080 | $ | 9,610,000 | 12.58 | % | ||||||||||||||
|
|
|
|
|
|
|
|||||||||||||||
| Total - Investments in Portfolio Company |
$ | 35,933,080 | $ | 37,273,980 | 48.80 | % | ||||||||||||||
|
|
|
|
|
|
|
|||||||||||||||
| Reconciliation to Net Assets |
Amount | % of Net Assets |
||||||
| Investments in portfolio company securities at fair value |
$ | 37,273,980 | 48.80 | % | ||||
| Cash and cash equivalents (includes investments in money market funds consisting of 39,505,875 Class A shares in the SEI Daily Income Trust Government Fund (SEOXX) with a value of $1 per share, or $39,505,875) |
39,606,512 | 51.85 | % | |||||
| Prepaid expenses and other assets |
62,746 | 0.08 | % | |||||
| Less: Total Liabilities |
(558,523 | ) | (0.73 | %) | ||||
|
|
|
|
|
|||||
| Net Assets |
$ | 76,384,715 | 100.00 | % | ||||
|
|
|
|
|
|||||
| (1) | The Company classifies its portfolio companies into three industries: (i) technology, (ii) Internet and software, and (iii) cleantech. The further description generally identifies the types of products or services provided by each portfolio company. |
| (2) | Convertible preferred, common stock, warrants and equity interests are generally non-income producing. Except for the convertible preferred stock in Harvest Power, Inc., all convertible preferred stock investments carry a non-cumulative, preferred dividend payable when and if declared by the portfolio company’s board of directors. In the case of Harvest Power, Inc., the shares of convertible preferred stock carry a cumulative preferred dividend, which is payable only when declared by the portfolio company’s board of directors or upon a qualifying liquidation event. Since no dividends have been declared or paid, or are expected to be declared or paid, with respect to these convertible preferred stock investments, these investments are considered to be non-income producing. |
| (3) | Gross unrealized appreciation, gross unrealized depreciation, and net unrealized appreciation for federal income tax purposes totaled $2,383,657, $1,042,757 and $1,340,900, respectively. The tax cost of investments is $35,933,080. |
| (4) | Except for common stock in two publicly traded portfolio companies, all investments were valued at fair value as determined in good faith by the Board of Directors and are subject to legal restrictions on transfer (including lockup and other contractual restrictions) as of December 31, 2011. See Valuation of Investments under Note 2 of the Notes to Financial Statements. |
| (5) | Control Investments are defined by the Investment Company Act of 1940, as amended (the “1940 Act”), as investments in which the Company owns more than 25% of the voting securities or where the Company has the ability to nominate greater than 50% of the board representation. Affiliate Investments are defined by the 1940 Act as investments in which the Company owns between 5% and 25% of the voting securities. Non-Control/Non-Affiliate Investments are defined by the 1940 Act as investments that are neither Control Investments nor Affiliate Investments. |
| (6) | All portfolio company investments constituted qualifying investments under Section 55(a) of the 1940 Act as of December 31, 2011, with the exception of 50,000 shares of Solazyme, Inc. common stock with a cost and value of $553,259 and $595,000, respectively, purchased in open market transactions during the fourth quarter of 2011. |
The accompanying notes are an integral part of these financial statements
107
Table of Contents
Keating Capital, Inc.
| 1. | Description of Business |
Keating Capital, Inc. (“Keating Capital” or the “Company”) was incorporated on May 9, 2008 under the laws of the State of Maryland and is an externally managed, non-diversified, closed-end management investment company that has elected to be regulated as a business development company under the Investment Company Act of 1940, as amended (the “1940 Act”), as of November 20, 2008. The Company commenced its portfolio company investment activities in January 2010. The shares of the Company’s common stock have been listed on the Nasdaq Capital Market since December 12, 2011.
The Company’s investment objective is to maximize capital appreciation. The Company seeks to accomplish its capital appreciation objective by making investments in the equity securities of later stage, typically venture capital-backed, pre-initial public offering (“pre-IPO”) companies that are committed to and capable of becoming public. The Company generally acquires equity securities, including preferred stock that is convertible into common stock, common stock, and warrants exercisable into common or preferred stock. The Company may in some cases invest in debentures or loans that are convertible into or settled with common stock; however, as of December 31, 2012 and 2011, none of the Company’s investments were convertible debentures or loans. The Company’s investments are made principally through direct investments in prospective portfolio companies. However, the Company may also purchase equity securities in private secondary transactions from current or former management or early stage investors in private companies that meet its investment criteria.
Keating Investments, LLC (“Keating Investments”), or the “investment adviser,” serves as the Company’s external investment adviser and also provides the Company with administrative services necessary for it to operate. In this capacity, Keating Investments is primarily responsible for the selection, evaluation, structure, valuation and administration of the Company’s investment portfolio, subject to the supervision of the Company’s Board of Directors. Keating Investments is a registered investment adviser under the Investment Advisers Act of 1940, as amended.
| 2. | Basis of Presentation; Summary of Significant Accounting Policies |
Consolidation
Under the 1940 Act rules and the regulations pursuant to Article 6 of Regulation S-X, the Company is precluded from consolidating any entity other than another investment company or an operating company that provides substantially all of its services and benefits to the Company. The Company’s financial statements include only the accounts of Keating Capital as the Company has no subsidiaries.
Use of Estimates
The preparation of financial statements in conformity with accounting principles generally accepted in the United States of America (“GAAP”) requires the Company’s management to make estimates and assumptions that affect the reported amounts of assets and liabilities at the date of the financial statements and the reported amounts of income and expenses during the reported period. Such estimates and judgments could change in the future as more information becomes known, and actual results could differ from these estimates and the differences could be material. The Company considers its significant estimates to include the fair value of investments in portfolio company securities (see “Valuation of Investments”) and income taxes (see “Income Taxes”).
Valuation of Investments
Investments are stated at value as defined under the 1940 Act, in accordance with the applicable regulations of the SEC, and in accordance with Accounting Standards Codification Topic 820, “Fair Value Measurement and Disclosures,” (“ASC 820”). Value, as defined in Section 2(a)(41) of the 1940 Act, is: (i) the market price for those securities for which a market quotation is readily available, and (ii) the fair value as determined in good faith by, or under the direction of, the Board of Directors for all other assets (see Note 3).
At December 31, 2012 and 2011, approximately 85.9% and 45.0%, respectively, of the Company’s gross assets represented investments in portfolio companies that are valued at fair value by the Board of Directors. The Company makes investments in later stage, typically venture capital-backed, private, pre-IPO companies in technology, Internet and software, and cleantech. Given the nature of investing in the securities of private companies, the Company’s investments are generally considered Level 3 assets under ASC 820 until these portfolio companies become public and begin trading on a stock exchange and the securities are no longer subject to any post-IPO lockup restrictions. As such, the Company values all of its investments, other than unrestricted securities in publicly traded portfolio companies, at fair value as determined in good faith by the Company’s Board of Directors, pursuant to a consistent valuation policy in accordance with the provisions of ASC 820 and the 1940 Act.
108
Table of Contents
Notes to Financial Statements
Determination of fair values involves subjective judgments and estimates. Due to the inherent uncertainty in determining the fair value of investments that do not have a readily available market value, the fair value of the Company’s investments determined in good faith by its Board may differ significantly from the value that would have been used had a ready market existed for such investments, and the differences could be material. Changes in valuation of these equity securities are recorded in our Statement of Operations as “Net change in unrealized appreciation (depreciation) on investments.”
The 1940 Act requires periodic valuation of each investment in the Company’s portfolio to determine the Company’s net asset value. Under the 1940 Act, unrestricted securities with readily available market quotations are to be valued at the closing market price on the valuation date; all other assets must be valued at fair value as determined in good faith by or under the direction of the Board of Directors.
Equity investments for which market quotations are readily available are generally valued at the most recently available closing market prices. However, equity investments for which market quotations are readily available, but which are subject to lockup provisions restricting the resale of such investments for a specified period of time, are valued at a discount to the most recently available closing market prices.
With respect to investments for which market quotations are not readily available, the Company’s Board of Directors undertakes a multi-step valuation process each quarter, as described below:
| • | The Company’s quarterly valuation process begins with each portfolio company investment being initially valued by Keating Investments’ senior investment professionals responsible for the portfolio investment; |
| • | The Chairman of the Company’s Valuation Committee, in consultation with the Company’s management, will determine each calendar quarter which investments in the Company’s portfolio for which market quotations are not readily available will be reviewed by a third-party valuation firm, engaged by the Company’s Board, provided, however, that a review will be conducted by a third-party valuation firm for each new portfolio company investment made during a calendar quarter and for any portfolio company for which market quotations are not readily available and whose valuation has not been reviewed in the prior twelve months; |
| • | The Company’s Valuation Committee reviews the preliminary valuations, and the Company’s investment adviser and the third-party valuation firm respond and supplement the preliminary valuation to reflect any comments provided by the Valuation Committee; and |
| • | The Company’s Board discusses the valuations and determines, in good faith, the fair value of each investment in the Company’s portfolio for which market quotations are not readily available based on the input of the Company’s investment adviser, the third-party valuation firm, and the Company’s Valuation Committee. |
Investment Categories and Approaches to Determining Fair Value
ASC 820 defines fair value as the price that would be received to sell an asset or paid to transfer a liability in an orderly transaction between market participants at the measurement date (exit price). In accordance with ASC 820, the Company uses a three-tier fair value hierarchy, which prioritizes the inputs used in measuring fair value as follows:
| • | Level 1: Observable inputs such as unadjusted quoted prices in active markets; |
| • | Level 2: Includes inputs such as quoted prices for similar securities in active markets and quoted prices for identical securities where there is little or no activity in the market; and |
| • | Level 3: Unobservable inputs for which little or no market data exists, therefore requiring an entity to develop its own assumptions. |
The Company applies the framework for determining fair value as described above to the valuation of investments in each of the following categories:
109
Table of Contents
Notes to Financial Statements
Equity Investments
Equity investments for which market quotations are readily available in an active market are generally valued at the most recently available closing market prices and are classified as Level 1 assets. However, equity investments for which market quotations are readily available, but which are subject to lockup provisions restricting the resale of such investments for a specified period of time, are valued at a discount to the most recently available closing market prices and, accordingly, are classified as Level 3 assets.
The fair values of the Company’s equity investments for which market quotations are not readily available (including investments in convertible preferred stock) are determined based on various factors and are classified as Level 3 assets. To determine the fair value of a portfolio company for which market quotations are not readily available, the Company may analyze the portfolio company’s most recently available historical and projected financial results, public market comparables, and other factors. The Company may also consider other events, including the transaction in which the Company acquired its securities, subsequent equity sales by the portfolio company, mergers or acquisitions affecting the portfolio company, or the completion of an initial public offering (“IPO”) by the portfolio company. In addition, the Company may consider the trends of the portfolio company’s basic financial metrics from the time of its original investment until the measurement date, with material improvement of these metrics indicating a possible increase in fair value, while material deterioration of these metrics may indicate a possible reduction in fair value. The fair values of the Company’s portfolio company securities are generally discounted for lack of marketability or when the securities are illiquid, such as when there are restrictions on resale or the lack of an established trading market which will generally be the case for pre-IPO companies, as well as during any lockup period to which the Company is subject with respect to public companies in its portfolio. (See “Significant Unobservable Inputs for Level 3 Portfolio Company Securities”)
The fair value of common and preferred stock warrants is generally determined by using option pricing models, such as the Black-Scholes model or, in cases of certain warrants where the Company’s ability to exercise may be contingent or be subject to certain metrics, a Monte Carlo simulation.
Fair Value of Investments
The following table categorizes the Company’s cash equivalents, short-term investments, and portfolio company investments measured at fair value based upon the lowest level of significant input used in the valuation as of December 31, 2012 and 2011:
110
Table of Contents
Keating Capital, Inc.
Notes to Financial Statements
| Description |
Quoted Prices In Active Markets For Identical Assets (Level 1) |
Significant Other Observable Inputs (Level 2) |
Significant Unobservable Inputs (Level 3) |
Total Fair Value |
||||||||||||
| As of December 31, 2012 |
||||||||||||||||
| Private Portfolio Company Securities: |
||||||||||||||||
| Preferred Stock |
$ | — | $ | — | $ | 43,087,120 | $ | 43,087,120 | ||||||||
| Preferred Stock Warrants |
— | — | — | — | ||||||||||||
| Common Stock |
— | — | 12,880,000 | 12,880,000 | ||||||||||||
| Common Stock Warrants |
— | — | 982,878 | 982,878 | ||||||||||||
| Publicly Traded Portfolio Company Securities: |
||||||||||||||||
| Common Stock |
1,162,706 | — | 6,911,002 | 8,073,708 | ||||||||||||
| Cash Equivalents: |
||||||||||||||||
| Money Market Funds |
8,675,149 | — | — | 8,675,149 | ||||||||||||
|
|
|
|
|
|
|
|
|
|||||||||
| Total |
$ | 9,837,855 | $ | — | $ | 63,861,000 | $ | 73,698,855 | ||||||||
|
|
|
|
|
|
|
|
|
|||||||||
| As of December 31, 2011 |
||||||||||||||||
| Private Portfolio Company Securities: |
||||||||||||||||
| Preferred Stock |
$ | — | $ | — | $ | 25,981,874 | $ | 25,981,874 | ||||||||
| Preferred Stock Warrants |
— | — | 1,323 | 1,323 | ||||||||||||
| Common Stock |
— | — | 8,399,996 | 8,399,996 | ||||||||||||
| Common Stock Warrants |
— | — | 219,156 | 219,156 | ||||||||||||
| Publicly Traded Portfolio Company Securities |
||||||||||||||||
| Common Stock |
2,671,631 | — | — | 2,671,631 | ||||||||||||
| Cash Equivalents: |
||||||||||||||||
| Money Market Funds |
39,505,875 | — | — | 39,505,875 | ||||||||||||
|
|
|
|
|
|
|
|
|
|||||||||
| Total |
$ | 42,177,506 | $ | — | $ | 34,602,349 | $ | 76,779,855 | ||||||||
|
|
|
|
|
|
|
|
|
|||||||||
111
Table of Contents
Keating Capital, Inc.
Notes to Financial Statements
The following table provides a reconciliation of the changes in fair value for the Company’s portfolio company investments measured at fair value using significant unobservable inputs (Level 3) for the year ended December 31, 2012:
| Level 3 Portfolio Company Investments (Preferred Stock) |
Level 3 Portfolio Company Investments (Preferred Warrants) |
Level 3 Portfolio Company Investments (Common Stock) |
Level 3 Portfolio Company Investments (Common Warrants) |
Total | ||||||||||||||||
| Fair Value at December 31, 2011 |
$ | 25,981,874 | $ | 1,323 | $ | 8,399,996 | $ | 219,156 | $ | 34,602,349 | ||||||||||
| New investments in Level 3 portfolio company securities at cost |
23,327,424 | 125,000 | 3,500,000 | — | 26,952,424 | |||||||||||||||
| Exchange or conversion of Level 3 portfolio company securities |
(7,450,370 | ) | (126,323 | ) | 6,965,833 | 610,860 | — | |||||||||||||
| Gross transfers out of Level 3 to Level 1 |
— | — | — | — | — | |||||||||||||||
| Total unrealized (depreciation) appreciation on Level 3 portfolio company securities included in change in net assets |
1,228,192 | — | 925,173 | 152,862 | 2,306,227 | |||||||||||||||
|
|
|
|
|
|
|
|
|
|
|
|||||||||||
| Fair Value at December 31, 2012 |
$ | 43,087,120 | $ | — | $ | 19,791,002 | $ | 982,878 | $ | 63,861,000 | ||||||||||
|
|
|
|
|
|
|
|
|
|
|
|||||||||||
| Total unrealized (depreciation) appreciation on Level 3 portfolio company securities included in change in net assets that were still held by the Company at December 31, 2012 |
$ | 1,228,192 | $ | — | $ | 925,173 | $ | 152,862 | $ | 2,306,227 | ||||||||||
|
|
|
|
|
|
|
|
|
|
|
|||||||||||
The Company’s investments in securities of private companies are generally considered Level 3 assets under ASC 820 until these portfolio companies become public and begin trading on a stock exchange and until such time as these securities are no longer subject to any post-IPO lockup restrictions, at which time the Company transfers the value of these securities as of the prior year-end into Level 1 assets. For the year ended December 31, 2012, exchange or conversion of Level 3 portfolio company securities resulted from the transactions in three portfolio companies: (i) the conversion of the Company’s preferred stock and preferred warrant investments in Livescribe, Inc. (“Livescribe”) into common stock, (ii) the exchange of the Company’s preferred stock investment in BrightSource Energy, Inc. (“BrightSource”) for preferred and common stock, and (iii) the Company’s preferred stock investment in Xtime, Inc. (“Xtime”) for common stock and common warrants. The exchange or conversion of these Level 3 portfolio company securities are reflected at the fair value of the exchanged or converted securities as of December 31, 2011 or the cost of the exchanged or converted securities if acquired during the year ended December 31, 2012.
During the year ended December 31, 2012, the Company made a new investment in the preferred stock and preferred stock warrants of LifeLock, Inc. (“LifeLock”). As such, the Company’s investment in LifeLock is reflected in new investments in Level 3 portfolio companies – “Level 3 Portfolio Company Investments (Preferred Stock)” and “Level 3 Portfolio Company Investments (Preferred Warrants).” Subsequent to this investment, LifeLock completed its IPO in October 2012 resulting in the conversion of the Company’s preferred stock investment into common stock and the cancellation of its preferred stock warrants. The conversion and cancellation of these Level 3 portfolio company securities are reflected at the cost of the converted or canceled securities since they were acquired during the year ended December 31, 2012. Because the Company’s common stock in LifeLock is subject to a lockup restriction that had not lapsed as of December 31, 2012, it remains classified as a Level 3 asset as of December 31, 2012.
For the year ended December 31, 2012, no investments were transferred from Level 3 to Level 1 within the fair value hierarchy.
112
Table of Contents
Keating Capital, Inc.
Notes to Financial Statements
The following table provides a reconciliation of the changes in fair value for the Company’s portfolio company investments measured at fair value using significant unobservable inputs (Level 3) for the year ended December 31, 2011:
| Level 3 Portfolio Company Investments (Preferred Stock) |
Level 3 Portfolio Company Investments (Preferred Warrants) |
Level 3 Portfolio Company Investments (Common Stock) |
Level 3 Portfolio Company Investments (Common Warrants) |
Total | ||||||||||||||||
| Fair Value at December 31, 2010 |
$ | 4,149,991 | $ | 27,616 | $ | — | $ | — | $ | 4,177,607 | ||||||||||
| New investments in Level 3 portfolio company securities at cost |
24,776,401 | 2,853 | 6,411,076 | 589,000 | 31,779,330 | |||||||||||||||
| Gross transfers out of Level 3 to Level 1 |
(2,549,991 | ) | — | — | — | (2,549,991 | ) | |||||||||||||
| Total unrealized (depreciation) appreciation on Level 3 portfolio company securities included in change in net assets |
(394,527 | ) | (29,146 | ) | 1,988,920 | (369,844 | ) | 1,195,403 | ||||||||||||
|
|
|
|
|
|
|
|
|
|
|
|||||||||||
| Fair Value at December 31, 2011 |
$ | 25,981,874 | $ | 1,323 | $ | 8,399,996 | $ | 219,156 | $ | 34,602,349 | ||||||||||
|
|
|
|
|
|
|
|
|
|
|
|||||||||||
| Total unrealized (depreciation) appreciation on Level 3 portfolio company securities included in change in net assets that were still held by the Company at December 31, 2011. |
$ | (394,527 | ) | $ | (29,146 | ) | $ | 1,988,920 | $ | (369,844 | ) | $ | 1,195,403 | |||||||
|
|
|
|
|
|
|
|
|
|
|
|||||||||||
For the year ended December 31, 2011, gross transfers out of Level 3 to Level 1 – “Portfolio Company Investments (Preferred Stock)” resulted from two of the Company’s portfolio companies, NeoPhotonics Corporation (“NeoPhotonics”) and Solazyme, Inc. (“Solazyme”) completing an initial public offering, and the Company’s securities in these portfolio companies being converted into common stock, with the lockup restrictions on these common shares subsequently lapsing during 2011. As of December 31, 2010, the Company’s convertible preferred stock investments in NeoPhotonics and Solazyme had a fair value of $1,550,000 and $999,991, respectively, as determined in good faith by the Company’s Board of Directors and were included as a component of Level 3 – “Portfolio Company Investments (Preferred Stock).” These investments were transferred into Level 1 within the fair value hierarchy during 2011.
Significant Unobservable Inputs for Level 3 Portfolio Company Securities
The significant unobservable inputs that may be used in the fair value measurement of the Company’s investments in convertible preferred stock and common stock for which market quotations are not readily available include: prior or contemporaneous transactions in the equity of the portfolio company (“Precedent Transactions”); (i) revenue, (ii) earnings before interest, taxes, depreciation and amortization (“EBITDA”), and (iii) price to earnings (“P/E”) multiples (collectively, “Multiples”) for comparable public company and comparable transactions; discount rates applied in a discounted cash flow analysis of the portfolio company; and discounts for lack of marketability (“DLOM”). A change in the assumptions used for Precedent Transactions and Multiples may indicate a directionally similar change in the fair value of the Company’s investments in convertible preferred stock or common stock, while a change in the assumptions used for discount rate and DLOM may indicate a directionally opposite change in the fair value of the portfolio company investment.
The significant unobservable input used in the fair value measurement of the Company’s investments in convertible preferred stock warrants and common stock warrants for which market quotations are not readily available is the equity volatility of comparable public companies. A change in the assumption used for equity volatility may indicate a directionally similar change in the fair value of the convertible preferred stock warrant or common stock warrant investment.
113
Table of Contents
Keating Capital, Inc.
Notes to Financial Statements
The following provides quantitative information about the Company’s Level 3 fair value measurements as of December 31, 2012:
| December 31, 2012 | ||||||||||||||||
| Investment Type |
Fair Value | Valuation Technique(s) |
Unobservable Input |
Range | Weighted Average (1) | |||||||||||
| Level 3 Portfolio Company Investments: Preferred Stock |
$ | 43,087,120 | Precedent transactions | Precedent transactions | n/a | to | n/a | n/a | ||||||||
| Comparable transactions | Revenue multiple | 1.5 | 12.7 | 7.5 | ||||||||||||
| Comparable public companies | Revenue multiple | 0.4 | to | 6.1 | 2.8 | |||||||||||
| EBITDA multiple | 1.3 | to | 7.4 | 5.2 | ||||||||||||
| P/E multiple | 16.6 | to | 16.7 | 16.7 | ||||||||||||
| Discount for lack of marketability | 30% | to | 45% | 34% | ||||||||||||
| Discounted cash flow | Discount rate | 23% | to | 50% | 37% | |||||||||||
| Terminal revenue multiple | 0.7 | to | 8.8 | 4.6 | ||||||||||||
| Terminal EBITDA multiple | 6.8 | to | 6.8 | 6.8 | ||||||||||||
| Terminal P/E multiple | 22.0 | to | 22.0 | 22.0 | ||||||||||||
| Discount for lack of marketability | 30% | to | 45% | 34% | ||||||||||||
| Level 3 Portfolio Company Investments: Preferred Stock Warrants |
$ | — | Option pricing model | Comparable public company equity volatility | n/a | to | n/a | n/a | ||||||||
| Level 3 Portfolio Company Investments: Common Stock |
$ | 19,791,002 | Precedent transactions | Precedent transactions | n/a | to | n/a | n/a | ||||||||
| Comparable public companies | Revenue multiple | 0.7 | to | 3.6 | 2.8 | |||||||||||
| EBITDA multiple | 4.8 | to | 7.3 | 5.8 | ||||||||||||
| P/E multiple | 16.0 | to | 18.7 | 17.4 | ||||||||||||
| Discount for lack of marketability | 10% | to | 40% | 25% | ||||||||||||
| Discounted cash flow | Discount rate | 35% | to | 55% | 40% | |||||||||||
| Terminal revenue multiple | 0.7 | to | 5.9 | 4.7 | ||||||||||||
| Terminal EBITDA multiple | 6.8 | to | 17.3 | 11.0 | ||||||||||||
| Terminal P/E multiple | 23.9 | to | 23.9 | 23.9 | ||||||||||||
| Discount for lack of marketability | 10% | to | 40% | 25% | ||||||||||||
| Level 3 Portfolio Company Investments: Common Stock Warrants |
$ | 982,878 | Option pricing model | Comparable public company equity volatility | 48% | to | 48% | 48% | ||||||||
| (1) | Weighted average based on fair value of as of December 31, 2012. |
Valuation of Financial Instruments
The Company believes that the carrying amounts of its financial instruments, consisting of cash and cash equivalents (including money market funds), receivables, accounts payable and accrued liabilities approximate the fair values of such items due to the short maturity of such instruments.
Portfolio Company Investment Classification
The Company classifies its portfolio company investments in accordance with the requirements of the 1940 Act. Under the 1940 Act, “Control Investments” are defined as investments in which the Company owns more than 25% of the voting securities or has rights to nominate greater than 50% of the board representation. Under the 1940 Act, “Affiliate Investments” are defined as investments in which the Company owns between 5% and 25% of the voting securities. Under the 1940 Act, “Non-Control/Non-Affiliate Investments” are defined as investments that are neither Control Investments nor Affiliate Investments.
At December 31, 2012 and 2011, the Company had two portfolio company investments, Metabolon, Inc. and Corsair Components, Inc., which were Affiliate Investments, and no Control Investments. No income was derived from these Affiliate Investments as both are non-incoming producing equity investments (see Note 9).
Cash and Cash Equivalents
Cash and cash equivalents are composed of demand deposits with original maturities of 90 days or less and investments in money market funds. The Company primarily invests its cash on hand in money market funds that invest primarily in U.S. Treasury securities, U.S. Government agency securities, and repurchase agreements fully collateralized by such securities. Cash needed to fund the Company’s near-term operating expenses is held in a bank depository account.
114
Table of Contents
Keating Capital, Inc.
Notes to Financial Statements
Offering Costs
On March 15, 2012, the Company filed a registration statement on Form N-2 for an equity offering of its common stock, which was last amended by the Company on November 9, 2012. For the year ended December 31, 2012, the Company incurred $322,906 in offering expenses associated with the equity offering, including the preparation of the registration statement in connection therewith. Such costs were capitalized and will be either charged to equity upon the conclusion of the equity offering, or expensed if the Company does not complete the equity offering.
Offering expenses directly related to the Company’s continuous public offering, which concluded June 30, 2011, totaling $965,169 on a cumulative basis were initially deferred and subsequently amortized and charged against the gross proceeds of the continuous public offering, as a reduction to additional paid-in capital, on a straight-line basis beginning with the closing of the first common stock issuance on January 11, 2010 and continuing through the conclusion of the offering period on June 30, 2011. During the year ended December 31, 2011, deferred offering costs totaling $488,363 were amortized and charged as a reduction to additional paid-in capital.
Offering expenses incurred subsequent to January 11, 2010 associated with maintaining the registration of the continuous public offering (e.g., legal, accounting, printing and state “blue sky” registration) were expensed as incurred. During the year ended December 31, 2011, $114,388 in offering expenses associated with maintaining the registration of the continuous public offering were expensed as incurred and were classified as Stock Issuance Expenses in the accompanying Statement of Operations.
Concentration of Credit Risk
The Company may place its cash and cash equivalents with various financial institutions and, at times, cash held in depository accounts at such institutions may exceed the Federal Deposit Insurance Corporation insured limit. The Company has not experienced any losses in such accounts and believes it is not exposed to any significant credit risk.
Securities Transactions
Securities transactions are accounted for on the date the transaction for the purchase or sale of the securities is entered into by the Company (i.e., trade date). Securities transactions outside conventional channels, such as private transactions, are recorded as of the date the Company obtains the right to demand the securities purchased or to collect the proceeds from a sale, and incurs an obligation to pay for securities purchased or to deliver securities sold, respectively. Cash due from brokers related to sales of securities that had not settled as of the balance sheet date is classified as receivable for investments sold. Commissions and other costs associated with transactions involving securities, including legal expenses, are included in the cost basis of purchases and deducted from the proceeds of sales.
Interest and Dividend Income
Interest income from certificates of deposit and other short-term investments is recorded on an accrual basis to the extent such amounts are expected to be collected, and accrued interest income is evaluated periodically for collectability.
The Company’s preferred equity investments may pay fixed or adjustable rate, non-cumulative dividends and will generally have a “preference” over common equity in the payment of non-cumulative dividends and the liquidation of a portfolio company’s assets. In order to be payable, non-cumulative distributions on such preferred equity must be declared by the portfolio company’s board of directors. Non-cumulative dividend income from preferred equity investments in portfolio companies is recorded when such dividends are declared or at the point an obligation exists for a portfolio company to make a distribution.
In limited instances, the Company’s preferred equity investments may include cumulative dividend provisions, where such cumulative dividends, whether or not declared, accrue at a specified rate from the original investment date, have a “preference” over other classes of preferred equity and common equity with respect to payment, and are payable only when declared by a portfolio company’s board of directors or upon a qualifying liquidation event. Cumulative dividends are recorded when such dividends are declared by the portfolio company’s board of directors, or when a specified event occurs triggering an obligation to pay such dividends. When recorded, cumulative dividends are added to the balance of the preferred equity investment and are recorded as dividend income in the statement of operations.
The Company’s preferred and common stock, warrants, and equity interests are generally non-income producing. Except for the convertible preferred stock investment in SilkRoad, Inc., f/k/a SilkRoad Technology Holdings, Inc. (“SilkRoad”), and Jumptap, Inc. (“Jumptap”), all convertible preferred stock investments carry a non-cumulative, preferred dividend payable when and if declared by
115
Table of Contents
Keating Capital, Inc.
Notes to Financial Statements
the portfolio company’s board of directors. In the case of SilkRoad, the shares of convertible preferred stock carry a cumulative preferred dividend, which is payable only when and if declared by SilkRoad’s board of directors or upon a qualifying liquidation event. In the case of Jumptap, the shares of convertible preferred stock carry a cumulative preferred dividend, which is payable only when and if declared by Jumptap’s board of directors. As part of a new convertible preferred stock financing by Harvest Power, Inc. (“Harvest Power”), which had its initial closing during the year ended December 31, 2012, the preferred dividends on the Company’s convertible preferred stock were changed from a cumulative to a non-cumulative dividend. Although the Company’s preferred stock investments typically carry a dividend rate, in some cases with a payment preference over other classes of equity, the Company does not expect dividends (whether cumulative or non-cumulative) to be declared and paid on its preferred stock investments, or on its common stock investments, since its portfolio companies typically prefer to retain profits, if any, in their businesses. Accordingly, since no dividends have been declared or paid, or are expected to be declared or paid, with respect to these convertible preferred stock investments, these investments are considered to be non-income producing.
During the years ended December 31, 2012, 2011 and 2010, there were no non-cumulative or cumulative dividends recorded.
Other Income
Other income is composed of fees, if any, for due diligence and management assistance that may be rendered to portfolio companies and prospective portfolio companies. For services that are separately identifiable from the Company’s investment, income is recognized as earned, which is generally when the investment or other applicable transaction closes, or when the services are rendered if payment is not subject to the closing of an investment transaction.
During the year ended December 31, 2010, the Company recorded $10,000 in other income representing a non-refundable due diligence fee received from a prospective portfolio company in December of 2009, which was initially recorded as deferred income and was subsequently recognized as income when the proposed investment transaction failed to close in February 2010.
Realized Gain or Loss and Unrealized Appreciation or Depreciation of Portfolio Investments
Realized gain or loss is recognized when an investment is disposed of and is computed as the difference between the Company’s cost basis in the investment at the disposition date and the net proceeds received from such disposition (after reduction for commissions and other selling expenses). Realized gains and losses on investment transactions are determined by specific identification. Unrealized appreciation or depreciation is computed as the difference between the fair value of the investment and the cost basis of such investment.
Income Taxes
Effective January 1, 2010, the Company elected to be treated for tax purposes as a RIC under the Code. The Company intends to operate so as to qualify as a RIC. To maintain RIC tax treatment, the Company must meet specified source-of-income and asset diversification requirements and distribute annually at least 90% of its investment company taxable income.
As a RIC, the Company generally will not have to pay corporate-level federal income taxes on any investment company taxable income (which is generally the Company’s net ordinary income plus the excess, if any, of realized net short-term capital gains over realized net long-term capital losses) or any realized net capital gains (which is generally net realized long-term capital gains in excess of net realized short-term capital losses) that the Company distributes to its stockholders as dividends. Taxable income generally differs from net income for financial reporting purposes due to temporary and permanent differences in the recognition of income and expenses. In addition, taxable income generally excludes any unrealized appreciation or depreciation in the Company’s portfolio company investments, because gains and losses are not included in taxable income until they are realized and required to be recognized.
The Company is not required to distribute its realized net capital gains, if any, to stockholders to maintain RIC tax treatment. However, the Company generally will have to pay corporate-level federal income taxes on any realized net capital gains that the Company does not distribute to its stockholders. In the event the Company retains any of its realized net capital gains, including amounts retained to pay incentive fees to the investment adviser or to pay annual operating expenses, the Company may designate the retained amount as a deemed distribution to stockholders and will be required to pay corporate-level tax on the retained amount.
The Company would also be subject to certain excise taxes imposed on RICs if it fails to distribute during each calendar year an amount at least equal to the sum of: (i) 98% of its ordinary income for the calendar year, (ii) 98.2% of its capital gains in excess of capital losses for the one-year period ending on October 31 of the calendar year, and (iii) any ordinary income and net capital gains for preceding years that were not distributed during such years. The Company will not be subject to this excise tax on amounts on which the Company is required to pay corporate income tax (such as retained realized net capital gains).
116
Table of Contents
Keating Capital, Inc.
Notes to Financial Statements
Because federal income tax regulations differ from accounting principles generally accepted in the United States, distributions from net realized gains for financial reporting purposes may include short-term capital gains which are included in ordinary income for tax purposes. Accounting principles generally accepted in the United States require that certain components of net assets relating to permanent differences be reclassified between financial and tax reporting. These reclassifications have no effect on the net assets or net asset value per share and are intended to enable the Company’s stockholders to determine the amount of accumulated and undistributed earnings they potentially could receive in the future and on which they could be taxed.
Because the Company distributed its net realized capital gains for the year ended December 31, 2012, no corporate-level federal income or excise taxes are due on such net realized capital gains and, as such, the Company has not made any provision for federal income or excise taxes as of December 31, 2012. See “Dividends and Distributions” below.
As of December 31, 2012, 2011 and 2010, the Company’s net investment loss (before incentive fees) of $3,627,467, $3,557,265 and $1,861,570, respectively, representing the Company’s 2012, 2011 and 2010 ordinary loss for tax purposes which may not be carried forward to future years by a RIC, was charged to additional paid-in-capital. The portion of the Company’s net investment loss attributable to incentive fee expense has not been charged to additional paid-in-capital as of December 31, 2012, 2011 and 2010 since incentive fee expense represents a temporary, rather than permanent, book-to-tax difference. In addition, as of December 31, 2011, the Company’s distribution during 2011 of $446,837, which was treated as a tax return of capital to stockholders, was classified as a return of capital and thus charged to additional paid-in capital.
The aggregate gross unrealized appreciation and depreciation, the net unrealized appreciation, and the aggregate cost of the Company’s portfolio company securities for federal income tax purposes as of December 31, 2012 and 2011 were as follows:
| December 31, 2012 |
December 31, 2011 |
|||||||
| Aggregate cost of portfolio company securities for federal income tax purposes |
$ | 61,837,416 | $ | 35,933,080 | ||||
|
|
|
|
|
|||||
| Gross unrealized appreciation of portfolio company securities |
8,012,803 | 2,383,657 | ||||||
| Gross unrealized depreciation of portfolio company securities |
(4,826,513 | ) | (1,042,757 | ) | ||||
|
|
|
|
|
|||||
| Net unrealized appreciation of portfolio company securities |
$ | 3,186,290 | $ | 1,340,900 | ||||
|
|
|
|
|
|||||
As of December 31, 2012 and 2011, the Company had no undistributed ordinary income, undistributed long-term capital gains or capital loss carryforwards for federal income tax purposes.
The Company evaluates tax positions taken or expected to be taken in the course of preparing its tax returns to determine whether the tax positions are “more-likely-than-not” of being sustained by the applicable tax authority. Tax positions deemed to meet a “more-likely-than-not” threshold would be recorded as a tax benefit or expense in the applicable period. Although the Company files federal and state tax returns, its major tax jurisdiction is federal. The 2009, 2010 and 2011 federal tax years for the Company remain subject to examination by the Internal Revenue Service. The 2009, 2010 and 2011 state tax years for the Company remain subject to examination by the Colorado Department of Revenue.
As of December 31, 2012 and 2011, the Company had not recorded a liability for any unrecognized tax positions. Management’s evaluation of uncertain tax positions may be subject to review and adjustment at a later date based upon factors including, but not limited to, an on-going analysis of tax laws, regulations and interpretations thereof. The Company’s policy is to include interest and penalties related to income taxes, if applicable, in general and administrative expenses. There were no such expenses for the years ended December 31, 2012, 2011 and 2010.
The Regulated Investment Company Modernization Act of 2010 (the “RIC Act”) modernized several of the federal income and excise tax provisions related to RICs. Under the RIC Act, capital losses incurred during the Company’s 2011 taxable year and after may be carried forward indefinitely with the character of the original loss retained. Prior to the RIC Act, capital losses could be carried forward for eight years, and were carried forward as short-term capital losses regardless of the character of the original loss. The RIC Act also contains simplification provisions, which are aimed at preventing disqualification of a RIC for inadvertent failures to comply with asset diversification and/or qualifying income tests.
117
Table of Contents
Keating Capital, Inc.
Notes to Financial Statements
Dividends and Distributions
Dividends and distributions to common stockholders must be approved by the Company’s Board of Directors and any dividend payable is recorded on the ex-dividend date.
On December 6, 2012, the Company’s Board of Directors declared a cash distribution of $282,203, or $0.03 per share outstanding on the record date. The distribution was paid on December 26, 2012 to the Company’s stockholders of record as of December 14, 2012. This distribution represented a distribution of the Company’s net realized capital gains for the year ended December 31, 2012.
On February 11, 2011, the Company’s Board of Directors declared a special cash distribution of $446,837, or $0.13 per share outstanding on the record date. The distribution was paid on February 17, 2011 to the Company’s stockholders of record as of February 15, 2011. This special cash distribution was based on the unrealized appreciation the Company had recorded on its investment in NeoPhotonics Corporation (“NeoPhotonics”) at the time of the distribution, following NeoPhotonics’ completion of its IPO.
For income tax purposes, distributions paid to stockholders are reported as ordinary income, return of capital, long term capital gains or a combination thereof. The Company’s cash distribution of $282,203 to stockholders in December 2012 was characterized as a distribution of long-term capital gains for income tax purposes since it represented a distribution of the Company’s net realized capital gains for the year ended December 31, 2012, all of which were long-term in nature. The Company’s cash distribution of $446,837 to stockholders in February 2011 was characterized as a return of capital for income tax purposes since the Company did not generate any investment company taxable income or realized net capital gains during the year ended December 31, 2011.
The Company has adopted an “opt out” dividend reinvestment plan that provides for reinvestment of dividends and distributions on behalf of the Company’s stockholders, unless a stockholder elects to receive cash. As a result, if the Board of Directors authorizes, and the Company declares a cash dividend or distribution, then the Company’s stockholders who have not “opted out” of the dividend reinvestment plan will have their cash dividend automatically reinvested in additional shares of the Company’s common stock, rather than receiving the cash dividends or distributions. The Company’s distribution of $446,837 to stockholders in February 2011 was not eligible for reinvestment under the dividend reinvestment plan since the Company’s shares of common stock had not been listed on a stock exchange at the time of the distribution.
Distributions to the Company’s stockholders will be payable only when and as declared by the Company’s Board of Directors and will be paid out of assets legally available for distribution. All distributions will be paid at the discretion of the Board of Directors. The Board of Directors maintains a distribution policy with the objective of distributing the Company’s net capital gains (which are defined as the Company’s realized capital gains in excess of realized capital losses during the year, without regard to the long-term or short-term character of such gains or losses), if any, after reduction for any incentive fees payable to the Company’s investment adviser, the Company’s operating expenses, and any other retained amounts. Since the Company’s portfolio company investments will typically not generate current income (i.e., dividends or interest income), the Company does not typically expect to generate net ordinary income from which it could make distributions to its stockholders. Distributions will also depend on our financial condition, maintenance of our RIC status, corporate-level income and excise tax planning, compliance with applicable business development company regulations and such other factors as the Company’s Board of Directors may deem relevant from time to time.
In the event the Company retains some or all of its realized net capital gains, including amounts retained to pay incentive fees to the investment adviser or operating expenses, the Company may designate the retained amount as a deemed distribution to stockholders. In such case, among other consequences, the Company will pay corporate-level tax on the retained amount, each U.S. stockholder will be required to include its share of the deemed distribution in income as if it had been actually distributed to the U.S. stockholder, and the U.S. stockholder will be entitled to claim a credit or refund equal to its allocable share of the corporate-level tax the Company pays on the retained realized net capital gain.
Per Share Information
Net changes in net assets resulting from operations per common share, or basic earnings per share, are calculated using the weighted average number of common shares outstanding for the period presented. Diluted earnings per share are not presented as there are no potentially dilutive securities outstanding.
118
Table of Contents
Keating Capital, Inc.
Notes to Financial Statements
Recently Issued Accounting Pronouncements
From time to time, new accounting pronouncements are issued by the Financial Accounting Standards Board (“FASB”) or other standards setting bodies that are adopted by the Company as of the specified effective date. Unless otherwise discussed, the Company believes that the impact of recently issued standards that are not yet effective will not have a material impact on its financial statements upon adoption.
In May 2011, the FASB issued Accounting Standards Update No. 2011-04 Fair Value Measurement: Amendments to Achieve Common Fair Value Measurement and Disclosure Requirements in U.S. GAAP and IFRS, or ASU 2011-04. ASU 2011-04 clarifies the application of existing fair value measurement and disclosure requirements, changes the application of some requirements for measuring fair value and requires additional disclosure for fair value measurements. In addition, the disclosure requirements are expanded to include for fair value measurements categorized in Level 3 of the fair value hierarchy: (i) a quantitative disclosure of the unobservable inputs and assumptions used in the measurement, (ii) a description of the valuation processes in place, and (iii) a narrative description of the sensitivity of the fair value to changes in unobservable inputs and interrelationships between those inputs. ASU 2011-04 was effective for interim and annual periods beginning after December 15, 2011, for public entities. The Company has implemented ASU 2011-04, which implementation did not have an impact on the Company’s financial position or results of operations, but did result in the inclusion of the additional disclosures discussed above.
| 3. | Investments |
The Company’s investments in portfolio companies consist of securities issued by private and publicly traded companies consisting of convertible preferred stock, common stock, and warrants to purchase convertible preferred stock and common stock. During the year ended December 31, 2012, the Company made investments totaling $26.5 million in six new private portfolio companies, $0.5 million in two existing private portfolio companies, and $0.5 million in Solazyme, Inc., one of our existing publicly traded portfolio companies, in open market transactions.
See the accompanying schedule of investments for the fair value of the Company’s investments in portfolio companies. The methodology for the determination of the fair value of the Company’s investments in portfolio companies is discussed in Note 2.
The following table summarizes the composition of the Company’s investment portfolio by type of security at cost and fair value as of December 31, 2012 and 2011.
| December 31, 2012 | December 31, 2011 | |||||||||||||||||||||||
| Investment Type |
Cost | Fair Value | Percentage of Portfolio |
Cost | Fair Value | Percentage of Portfolio |
||||||||||||||||||
| Private Portfolio Companies: |
||||||||||||||||||||||||
| Preferred Stock |
$ | 41,858,928 | $ | 43,087,120 | 66.26 | % | $ | 26,347,696 | $ | 25,981,874 | 69.70 | % | ||||||||||||
| Preferred Stock Warrants |
— | — | 0.00 | % | 32,058 | 1,323 | 0.00 | % | ||||||||||||||||
| Common Stock |
12,273,466 | 12,880,000 | 19.81 | % | 6,411,076 | 8,399,996 | 22.54 | % | ||||||||||||||||
| Common Stock Warrants |
1,199,860 | 982,878 | 1.51 | % | 589,000 | 219,156 | 0.59 | % | ||||||||||||||||
| Publicly Traded Portfolio Companies: |
||||||||||||||||||||||||
| Common Stock |
6,505,162 | 8,073,708 | 12.42 | % | 2,553,250 | 2,671,631 | 7.17 | % | ||||||||||||||||
|
|
|
|
|
|
|
|
|
|
|
|
|
|||||||||||||
| Total |
$ | 61,837,416 | $ | 65,023,706 | 100.00 | % | $ | 35,933,080 | $ | 37,273,980 | 100.00 | % | ||||||||||||
119
Table of Contents
Keating Capital, Inc.
Notes to Financial Statements
The following table summarizes the composition of the Company’s investment portfolio by industry classification at cost and fair value as of December 31, 2012 and 2011.
| December 31, 2012 | December 31, 2011 | |||||||||||||||||||||||
| Industry Classification |
Cost | Fair Value | Percentage of Portfolio |
Cost | Fair Value | Percentage of Portfolio |
||||||||||||||||||
| Internet & Software |
$ | 34,328,850 | $ | 37,833,875 | 58.19 | % | $ | 11,328,857 | $ | 11,338,013 | 30.42 | % | ||||||||||||
| Cleantech |
15,402,299 | 14,019,831 | 21.56 | % | 15,053,262 | 15,438,843 | 41.42 | % | ||||||||||||||||
| Technology |
12,106,267 | 13,170,000 | 20.25 | % | 9,550,961 | 10,497,124 | 28.16 | % | ||||||||||||||||
|
|
|
|
|
|
|
|
|
|
|
|
|
|||||||||||||
| Total |
$ | 61,837,416 | $ | 65,023,706 | 100.00 | % | $ | 35,933,080 | $ | 37,273,980 | 100.00 | % | ||||||||||||
|
|
|
|
|
|
|
|
|
|
|
|
|
|||||||||||||
The following table summarizes the composition of the Company’s investment portfolio by geographic region of the United States at cost and fair value as of December 31, 2012 and 2011. The geographic composition is determined by the location of the corporate headquarters of the portfolio company at the time of the Company’s investment.
| December 31, 2012 | December 31, 2011 | |||||||||||||||||||||||
| Geographic Location |
Cost | Fair Value | Percentage of Portfolio |
Cost | Fair Value | Percentage of Portfolio |
||||||||||||||||||
| West |
$ | 38,837,414 | $ | 41,103,711 | 63.21 | % | $ | 22,933,073 | $ | 24,273,973 | 65.12 | % | ||||||||||||
| Northeast |
11,499,995 | 12,389,995 | 19.05 | % | 6,500,000 | 6,500,000 | 17.44 | % | ||||||||||||||||
| Southeast |
6,500,007 | 5,810,000 | 8.94 | % | 6,500,007 | 6,500,007 | 17.44 | % | ||||||||||||||||
| Midwest |
5,000,000 | 5,720,000 | 8.80 | % | — | — | 0.00 | % | ||||||||||||||||
|
|
|
|
|
|
|
|
|
|
|
|
|
|||||||||||||
| Total |
$ | 61,837,416 | $ | 65,023,706 | 100.00 | % | $ | 35,933,080 | $ | 37,273,980 | 100.00 | % | ||||||||||||
|
|
|
|
|
|
|
|
|
|
|
|
|
|||||||||||||
| 4. | Related Party Agreements and Transactions |
Investment Advisory and Administrative Services Agreement
Subject to the overall supervision of the Company’s Board of Directors, the investment adviser manages the Company’s day-to-day operations and provides the Company with investment advisory services. Under the terms of the Investment Advisory and Administrative Services Agreement, the investment adviser:
| • | Determines the composition of the Company’s investment portfolio, the nature and timing of the changes to the investment portfolio and the manner of implementing such changes; |
| • | Determines which securities the Company will purchase, retain or sell; |
| • | Identifies, evaluates and negotiates the structure of investments the Company makes, including performing due diligence on prospective portfolio companies; and |
| • | Closes, monitors and services the investments the Company makes. |
The investment adviser’s services under the Investment Advisory and Administrative Services Agreement are not exclusive, and it is free to furnish similar services to other entities so long as its services to the Company are not impaired.
The Company pays the investment adviser a fee for its investment advisory services under the Investment Advisory and Administrative Services Agreement consisting of two components: (i) a base management fee, and (ii) an incentive fee. The Company’s officers do not receive any compensation directly from the Company. However, the principals and officers of the investment adviser who also serve as the Company’s officers receive compensation from, or may have financial interests in, the investment adviser, which may be funded by or economically related to the investment advisory fees paid by the Company to the investment adviser under to the Investment Advisory and Administrative Services Agreement.
120
Table of Contents
Keating Capital, Inc.
Notes to Financial Statements
Base Management Fee
The base management fee (the “Base Fee”) is calculated at an annual rate of 2% of the Company’s gross assets, where gross assets include any borrowings for investment purposes. The Company did not have any borrowings for the years ended December 31, 2012, 2011 or 2010. The Base Fee is payable monthly in arrears, and is calculated based on the value of the Company’s gross assets at the end of the most recently completed calendar quarter, and adjusted for any equity capital raises or repurchases during the current calendar quarter.
The Company recorded Base Fees of $1,533,808, $1,153,058 and $218,876 for the years ended December 31, 2012, 2011 and 2010, respectively. As of December 31, 2012 and 2011, Base Fees payable to the investment adviser were $128,746 and $130,969, respectively.
Incentive Fee
The incentive fee is determined and payable in arrears as of the end of each calendar year (or upon termination of the Investment Advisory and Administrative Services Agreement, as of the termination date), and equals 20% of the Company’s realized capital gains, if any, on a cumulative basis from inception through the end of each calendar year, computed net of all realized capital losses and unrealized capital depreciation on a cumulative basis, less the aggregate amount of any previously paid incentive fees, with respect to each of the investments in the Company’s portfolio. For purposes of determining the incentive fee to be paid, realized capital gains, realized capital losses and unrealized capital depreciation are each determined without regard to the holding period for the Company’s investments and include both long-term (held more than 12 months) and short-term holdings. The investment adviser is not entitled to an incentive fee on investment income generated from interest or dividends on its portfolio company investments. For purposes of calculating the incentive fee, realized capital gains and losses include both short-term and long-term capital gains and losses.
During the years ended December 31, 2012, 2011 and 2010, no incentive fees were earned by or payable to the investment adviser in accordance with the contractual terms of the Investment Advisory and Administrative Services Agreement since the Company did not generate net realized capital gains in excess of gross unrealized depreciation during such periods. However, during the year ended December 31, 2012, the Company recorded incentive fee expense of $425,519 resulting from: (i) an increase in net unrealized appreciation on the Company’s portfolio company investments of $1,845,390 during such period, and (ii) an increase in the Company’s cumulative net realized capital gains of $282,203 during such period. During the years ended December 31, 2011 and 2010, the Company recorded $152,757 and $115,423 in incentive fee expense, resulting from the increase in net unrealized appreciation on its portfolio company investments of $763,784 and $577,116, respectively, during the years ended December 31, 2011 and 2010.
As of December 31, 2012 and 2011, the Company had recorded accrued incentive fees payable to the investment adviser in the amounts of $693,699 and $268,180, respectively.
The incentive fees are calculated and paid annually based on cumulative net realized capital gains (taking into account cumulative realized capital losses) reduced by unrealized depreciation on any investments that have a fair value below the Company’s investment cost and incentive fees previously paid. Accordingly, as of December 31, 2012, the accrued incentive fee related to net unrealized appreciation may differ from the actual incentive fee that may be paid to the investment adviser depending on whether the Company is ultimately able to dispose of its portfolio company investments and generate a net realized capital gain at least commensurate with the net unrealized appreciation recorded as of December 31, 2012. Further, as of December 31, 2012, no incentive fees related to the cumulative net realized capital gain were due and payable to the investment adviser since the aggregate unrealized depreciation on the Company’s investments that have a fair value below the Company’s investment cost exceeded the amount of the cumulative net realized capital gain.
Administrative Services
Pursuant to the Investment Advisory and Administrative Services Agreement, the investment adviser furnishes the Company with office facilities, equipment, and clerical, bookkeeping and record-keeping services. The investment adviser also performs, or facilitates the performance of, certain administrative services, which includes being responsible for the financial records which the Company is required to maintain, and preparing reports to the Company’s stockholders and reports filed with the SEC.
In addition, the investment adviser assists the Company with its portfolio accounting and bookkeeping, managing portfolio collections and reporting, performing stockholder and investor relations services, determining and publishing its net asset value, overseeing the preparation and filing of its tax returns, printing and disseminating reports to its stockholders, providing support for its risk management efforts and generally overseeing the payment of its expenses and performance of administrative and professional services rendered to the Company by others.
121
Table of Contents
Keating Capital, Inc.
Notes to Financial Statements
The Company reimburses the investment adviser for the allocable portion of overhead and other expenses incurred by the investment adviser in performing its administrative obligations under the Investment Advisory and Administrative Services Agreement, including the allocable portion of compensation of the Company’s Chief Financial Officer and Chief Compliance Officer, and their respective staff. The allocation ratio with respect to compensation of the Company’s Chief Financial Officer and Chief Compliance Officer is dependent upon the amount of time each devotes to matters on behalf of the Company and Keating Investments, respectively. Allocated administrative expenses are payable to the investment adviser monthly in arrears.
The Company recorded allocated administrative expenses of $633,997, $450,019 and $404,633 for the years ended December 31, 2012, 2011 and 2010, respectively. As of December 31, 2012 and 2011, allocated administrative expenses payable to the investment adviser were $51,396 and $47,285, respectively.
The Company also agreed to reimburse the investment adviser for separation payments due to the Company’s former Chief Financial Officer who resigned in November 2011. In consideration for certain separation services, the former Chief Financial Officer was paid a separation payment equal to $8,000 per month (prorated for any partial month) for the period commencing on November 16, 2011 and continuing through April 30, 2012.
Duration and Termination
An amended and restated version of the Investment Advisory and Administrative Services Agreement, which is presently in effect, was approved by the Company’s Board of Directors on April 17, 2009, and by the Company’s stockholders on May 14, 2009. On April 13, 2012, the Company’s Board of Directors (including the non-interested directors) renewed the current Investment Advisory and Administrative Services Agreement for an additional year. The current Investment Advisory and Administrative Services Agreement will remain in effect from year-to-year thereafter if approved annually by (i) the vote of the Board of Directors, or by the vote of a majority of the Company’s outstanding voting securities, and (ii) the vote of a majority of the directors who are not interested persons. An affirmative vote of the holders of a majority of the Company’s outstanding voting securities is also necessary in order to make material amendments to the current Investment Advisory and Administrative Services Agreement.
The Investment Advisory and Administrative Services Agreement automatically terminates in the event of its assignment. As required by the 1940 Act, the Investment Advisory and Administrative Services Agreement provides that the Company may terminate the agreement without penalty upon 60 days’ written notice to the investment adviser. If the investment adviser wishes to voluntarily terminate the Investment Advisory and Administrative Services Agreement, it must give stockholders a minimum of 120 days’ notice prior to termination and must pay all expenses associated with its termination. The Investment Advisory and Administrative Services Agreement may also be terminated, without penalty, upon the vote of a majority of the Company’s outstanding voting securities.
License Agreement
The Company entered into a license agreement with the investment adviser, pursuant to which the investment adviser granted the Company a non-exclusive license to use the name “Keating.” Under the license agreement, the Company has the right to use the “Keating” name and logo for so long as Keating Investments or one of its affiliates remains the Company’s investment adviser. Other than with respect to this limited license, the Company has no legal right to the “Keating” name or logo. The License Agreement will remain in effect for as long as the Investment Advisory and Administrative Services Agreement with the investment adviser is in effect.
Joint Liability Insurance Agreement
The Company maintains a directors and officers liability insurance policy covering the directors and officers of the Company, insuring the Company against loss that it may be required or permitted to pay as indemnities of the directors and officers of the Company, and insuring the Company for certain securities claims. The Company also maintains an additional policy providing for excess coverage in the case of non-indemnifiable claims, covering its directors and officers. The coverages under these polices in certain cases extend to the officers, managers and employees of the investment adviser, and to the investment adviser’s Investment Committee. On November 4, 2011, the Company and the investment adviser entered into a joint liability insurance agreement, which was approved by the Company’s non-interested directors, that allocates the premium cost of the directors and officers liability insurance policy and the excess coverage policy between the Company and the investment adviser and provides for the allocation of any deductibles and losses in excess of applicable insurance limits. For the directors and officers liability insurance policy covering the policy years ending August 28, 2012 and August 28, 2013, the joint liability insurance agreement specifies that 10% of the total premium under this policy be allocated to the investment adviser. None of the premium under the excess coverage policy is allocated to the investment adviser.
122
Table of Contents
Keating Capital, Inc.
Notes to Financial Statements
| 5. | Capital Stock |
The Company’s authorized capital stock consists of 200,000,000 shares of stock, par value $0.001 per share, all of which has initially been designated as common stock. Each share of common stock entitles the holder to one vote.
From January 11, 2010 through June 30, 2011, the Company raised $78,423,340, net of issuance costs, in a continuous public offering of 8,713,705 shares of its common stock, with the final closing of escrowed funds from subscribing investors occurring July 11, 2011. The shares of common stock were offered at $10.00 per share, adjusted for volume discounts and commission waivers. All shares in the continuous public offering were sold at a price of either $9.30 or $10.00, depending on whether or not sales commissions were waived by the dealer manager. The continuous public offering resulted in gross proceeds of $86,800,000, or an average price of $9.96 per share. The investment adviser purchased 564 shares of common stock in the continuous public offering at a price of $10.00 per share.
On May 9, 2012, the Company’s Board of Directors authorized a stock repurchase program of up to $5.0 million. Under the repurchase program, the Company is authorized to repurchase shares of the Company’s common stock in open market transactions, including through block purchases, depending on prevailing market conditions and other factors. The Company’s stock repurchase program was originally set to expire on November 8, 2012; however, on October 26, 2012, the Company’s Board of Directors extended our stock repurchase program for an additional six months. The program will now expire on May 8, 2013, unless extended further by the Company’s Board of Directors. The repurchase program may be extended, modified or discontinued at any time for any reason. The repurchase program does not obligate the Company to acquire any specific number of shares, and all repurchases will be made in accordance with SEC Rule 10b-18, which sets certain restrictions on the method, timing, price and volume of stock repurchases.
During the year ended December 31, 2012, the Company repurchased 108,996 shares and of its common stock at an average price of $7.01 per share, including commissions, with a total cost of $764,179. The Company’s net asset value per share increased by $0.01 per share as a result of the share repurchases during the year ended December 31, 2012. The weighted average discount to net asset value per share of the shares repurchased during the year ended December 31, 2012 was 14%. The 108,996 shares of common stock repurchased under the Company’s stock repurchase program have not been retired or cancelled, remain issued but not outstanding shares, and were held in treasury as of December 31, 2012. The Company has accounted for the repurchases of its common stock under the cost method, such that repurchased shares were recorded as treasury stock based on the actual cost of the repurchases.
| 6. | Commitments and Contingencies |
In the normal course of business, the Company may enter into investment agreements under which it commits to make an investment in a portfolio company at some future date or over a specified period of time. At December 31, 2012, the Company had not entered into any investment agreements which required it to make a future investment in a portfolio company.
The Company maintains a directors and officers insurance policy and an excess coverage policy for non-indemnifiable claims covering us and our officers and directors. The Company has also agreed to indemnify its directors and officers to the maximum extent permitted by Maryland law subject to the restrictions in the 1940 Act.
As of December 31, 2012, the Company was not a party to any material legal proceedings. However, from time to time, we may be party to certain legal proceedings incidental to the normal course of our business including the enforcement of our rights under contracts with our portfolio companies.
123
Table of Contents
Keating Capital, Inc.
Notes to Financial Statements
| 7. | Changes in Net Assets Per Share |
The following table sets forth the computation of the basic and diluted per share net decrease in net assets resulting from operations for the years ended December 31, 2012, 2011 and 2010:
| Years Ended December 31, | ||||||||||||
| 2012 | 2011 | 2010 | ||||||||||
| Net decrease in net assets resulting from operations |
$ | (1,925,393 | ) | $ | (2,946,238 | ) | $ | (1,399,877 | ) | |||
| Basic and diluted weighted average shares outstanding |
9,198,016 | 6,921,481 | 1,383,537 | |||||||||
| Basic and diluted net increase (decrease) in net assets per share resulting from operations |
$ | (0.21 | ) | $ | (0.43 | ) | $ | (1.01 | ) | |||
|
|
|
|
|
|
|
|||||||
During the years ended December 31, 2012, 2011 and 2010, the Company had no dilutive securities outstanding.
124
Table of Contents
Keating Capital, Inc.
Notes to Financial Statements
| 8. | Financial Highlights |
The following is a schedule of financial highlights for each of the four years in the period ended December 31, 2012 and for the period from May 9, 2008 (Inception) to December 31, 2008.
| May 9, 2008 | ||||||||||||||||||||
| Years Ended December 31, | (Inception) to | |||||||||||||||||||
| 2012 | 2011 | 2010 | 2009 | December 31, 2008 | ||||||||||||||||
| Per common share data |
||||||||||||||||||||
| Net asset value, beginning of period |
$ | 8.23 | $ | 7.85 | $ | 6.53 | $ | 8.27 | $ | — | ||||||||||
| Net investment loss* |
(0.44 | ) | (0.54 | ) | (1.43 | ) | (1.75 | ) | (0.93 | ) | ||||||||||
| Net realized gain on investments* |
0.03 | — | — | — | — | |||||||||||||||
| Net change in unrealized appreciation on investments* |
0.20 | 0.11 | 0.42 | — | — | |||||||||||||||
|
|
|
|
|
|
|
|
|
|
|
|||||||||||
| Net decrease in net assets resulting from operations |
(0.21 | ) | (0.43 | ) | (1.01 | ) | (1.75 | ) | (0.93 | ) | ||||||||||
|
|
|
|
|
|
|
|
|
|
|
|||||||||||
| Stockholder distributions: |
||||||||||||||||||||
| Stockholder distributions as long-term capital gains distribution |
(0.03 | ) | — | — | — | — | ||||||||||||||
| Distributions as a return of capital* |
— | (0.06 | ) | — | — | — | ||||||||||||||
|
|
|
|
|
|
|
|
|
|
|
|||||||||||
| Net decrease in net assets resulting for stockholder distributions |
(0.03 | ) | (0.06 | ) | — | — | — | |||||||||||||
|
|
|
|
|
|
|
|
|
|
|
|||||||||||
| Capital stock transactions: |
||||||||||||||||||||
| Issuance of common stock in continuous public offering (1) |
— | 1.83 | 4.26 | — | 10.00 | |||||||||||||||
| Offering costs from issuance of common stock* |
— | (0.89 | ) | (1.59 | ) | — | — | |||||||||||||
| Amortization of deferred offering costs* |
— | (0.07 | ) | (0.34 | ) | — | (0.80 | ) | ||||||||||||
| Repurchases of common stock (2) |
0.01 | — | — | — | — | |||||||||||||||
|
|
|
|
|
|
|
|
|
|
|
|||||||||||
| Net increase in net assets from capital stock transactions |
0.01 | 0.87 | 2.33 | — | 9.20 | |||||||||||||||
|
|
|
|
|
|
|
|
|
|
|
|||||||||||
| Net asset value, end of period |
$ | 8.00 | $ | 8.23 | $ | 7.85 | $ | 6.53 | $ | 8.27 | ||||||||||
|
|
|
|
|
|
|
|
|
|
|
|||||||||||
| Ratios and supplemental data: |
||||||||||||||||||||
| Per share market price, end of period (3) |
$ | 6.27 | 8.46 | — | — | — | ||||||||||||||
| Total return based on change in net asset value (4) |
(2.43 | %) | 5.61 | % | 20.21 | % | (21.04 | %) | (11.08 | %) | ||||||||||
| Total return based on stock price (5) |
(25.52 | %) | (14.46 | %) | — | — | — | |||||||||||||
| Common shares outstanding, end of period |
9,174,785 | 9,283,781 | 2,860,299 | 569,900 | 569,900 | |||||||||||||||
| Weighted average common shares outstanding during period |
9,198,016 | 6,921,481 | 1,383,537 | 569,900 | 294,824 | |||||||||||||||
| Net assets, end of period |
$ | 73,412,940 | $ | 76,384,715 | $ | 22,456,400 | $ | 3,719,496 | $ | 4,715,474 | ||||||||||
| Annualized ratio of operating expenses to average net assets (6) |
5.39 | % | 7.62 | % | 15.52 | % | 23.87 | % | 35.62 | % | ||||||||||
| Annualized ratio of net investment loss to average net assets (6) |
(5.39 | %) | (7.51 | %) | (15.11 | %) | (23.62 | %) | 34.70 | % | ||||||||||
| Weighted average debt per common share (7) |
$ | — | $ | — | $ | — | $ | — | $ | — | ||||||||||
| Portfolio turnover (8) |
2.47 | % | — | — | — | — | ||||||||||||||
| * | Based on weighted average shares outstanding during the period. |
| (1) | Represents the average increase in net asset value attributable to each share issued during the years ended December 31, 2011 and 2010. |
| (2) | For the year ended December 31, 2012, the increase in net asset value attributable to the shares repurchased was $0.01 per share. There were no shares repurchased during the years ended December 31, 2011, 2010, 2009 and the period ended December 31, 2008. |
| (3) | The shares of the Company’s common stock were listed on the Nasdaq Capital Market beginning December 12, 2011. Accordingly, there was no market price for the shares as of December 31, 2010, 2009 and 2008, and no total return based on stock price has been presented for the years ended December 31, 2010 and 2009 and the period ended December 31, 2008. |
| (4) | Total return based on change in net asset value equals the change in the end of the period net asset value over the beginning of the period net asset value plus distributions during the period, divided by the beginning of the period net asset value. For the period from May 9, 2008 (Inception) through December 31, 2008, the beginning of the period value was $9.30 per share (based on the offering price per share in the Company’s initial private placement net of placement agent commissions), and the total return has not been annualized. |
| (5) | For the year ended December 31, 2012, total return based on stock price is calculated based on the change in the market price of the Company’s shares taking into account distributions reinvested in accordance with the Company’s dividend reinvestment plan. For the year ended December 31, 2011, the total return based on stock price equals the change in the end of the period market price plus distributions over $9.96 per share (the average selling price in the Company’s continuous public offering which concluded on June 30, 2011), divided by $9.96 per share (which return has not been annualized and includes the February 2011 distribution). |
| (6) | Ratios for the period from May 9, 2008 (Inception) to December 31, 2008 have been annualized |
| (7) | During the years ended December 31, 2012, 2011, 2010 and 2009, and the period ended December 31, 2008, the Company did not have any debt. |
| (8) | For the year ended December 31, 2012, portfolio turnover is calculated as net proceeds from the sale of portfolio company investments during the period divided by average net assets during the period. Since there were no sales of portfolio company investments during the years ended December 31, 2011, 2010 and 2009, and the period ended December 31, 2008, there was no portfolio turnover. |
125
Table of Contents
Keating Capital, Inc.
Notes to Financial Statements
| 9. | Investments in and Advances to Affiliates |
During the year ended December 31, 2012, the Company had two portfolio company investments, Metabolon, Inc. and Corsair Components, Inc., which were Affiliate Investments, and the Company had no Control Investments. The following is a schedule of the Company’s investments in these two affiliates during the year ended December 31, 2012. For the year ended December 31, 2012, the Company made no advances to these two affiliates.
| Year Ended December 31, 2012 |
||||||||||||||||||||||||||
| Portfolio Company (1) |
Investment Description |
Number of Shares / Warrants |
Amount of Interest and Dividends Credited to Income (2) |
December 31, 2011 Fair Value |
Gross Additions (3) |
Gross Reductions (4) |
December 31, 2012 Fair Value |
|||||||||||||||||||
| Affiliate Investments |
||||||||||||||||||||||||||
| Corsair Components, Inc. |
Common Stock (5) |
640,000 | $ | — | $ | 5,400,000 | $ | 130,000 | $ | — | $ | 5,530,000 | ||||||||||||||
| Common Stock Warrants (5) |
160,000 | — | 210,000 | — | (140,000 | ) | 70,000 | |||||||||||||||||||
| Metabolon, Inc. |
Series D Convertible Preferred Stock |
2,229,021 | — | 4,000,000 | 530,000 | — | 4,530,000 | |||||||||||||||||||
|
|
|
|
|
|
|
|
|
|
|
|||||||||||||||||
| Total Affiliate Investments |
$ | — | $ | 9,610,000 | $ | 660,000 | $ | (140,000 | ) | $ | 10,130,000 | |||||||||||||||
|
|
|
|
|
|
|
|
|
|
|
|||||||||||||||||
| (1) | The Company had no control investments as defined by the 1940 Act during the year ended December 31, 2012. |
| (2) | Affiliate investments consist of convertible preferred stock, common stock and common stock warrants that are generally non-income producing and restricted. The convertible preferred stock investment carries a non-cumulative, preferred dividend payable when and if declared by the portfolio company’s board of directors. Since no dividends have been declared or paid, or are expected to be declared or paid, with respect to these convertible preferred stock investments, these investments are considered to be non-income producing. |
| (3) | Gross additions include increases in investments resulting from new portfolio company investments, paid-in-kind interest or dividends, and exchange of one or more existing securities for one or more new securities. Gross additions also include net decreases in unrealized depreciation or net increases in unrealized appreciation. |
| (4) | Gross reductions include decreases in investments resulting from sales and the exchange of one or more existing securities for one or more new securities. Gross reductions also include net increases in unrealized depreciation or net decreases in unrealized appreciation. |
| (5) | Corsair Components, Inc. completed a 1-for-5 reverse stock split effective April 24, 2012. As a result of the reverse stock split, the Company now owns 640,000 shares of common stock and warrants to purchase 160,000 shares of common stock at an exercise price of $0.05 per share. Prior to the reverse stock split, the Company previously owned 3,200,000 shares of common stock and warrants to purchase 800,000 shares of common stock at an exercise price of $0.01 per share. |
During the year ended December 31, 2011, the Company had two portfolio company investments, Metabolon, Inc. and Corsair Components, Inc., which were Affiliate Investments, and the Company had no Control Investments. The following is a schedule of the Company’s investments in these two affiliates during the year ended December 31, 2011. For the year ended December 31, 2011, the Company made no advances to these two affiliates.
126
Table of Contents
Keating Capital, Inc.
Notes to Financial Statements
| Year Ended December 31, 2011 |
||||||||||||||||||||||||||
| Portfolio Company (1) |
Investment Description |
Number of Shares / Warrants |
Amount of Interest and Dividends Credited to Income (2) |
December 31, 2010 Fair Value |
Gross Additions (3) |
Gross Reductions (4) |
December 31, 2011 Fair Value |
|||||||||||||||||||
| Affiliate Investments |
||||||||||||||||||||||||||
| Corsair Components, Inc. |
Common Stock | 3,200,000 | $ | — | $ | — | $ | 5,400,000 | $ | — | $ | 5,400,000 | ||||||||||||||
| Common Stock Warrants |
800,000 | — | — | 210,000 | — | 210,000 | ||||||||||||||||||||
| Metabolon, Inc. |
Series D Convertible Preferred Stock |
2,229,021 | — | — | 4,000,000 | — | 4,000,000 | |||||||||||||||||||
|
|
|
|
|
|
|
|
|
|
|
|||||||||||||||||
| Total Affiliate Investments |
$ | — | $ | — | $ | 9,610,000 | $ | — | $ | 9,610,000 | ||||||||||||||||
|
|
|
|
|
|
|
|
|
|
|
|||||||||||||||||
| (1) | The Company had no control investments as defined by the 1940 Act during the year ended December 31, 2011. |
| (2) | Affiliate investments consist of convertible preferred stock, common stock and common stock warrants that are generally non-income producing and restricted. The convertible preferred stock investment carries a non-cumulative, preferred dividend payable when and if declared by the portfolio company’s board of directors. Since no dividends have been declared or paid, or are expected to be declared or paid, with respect to these convertible preferred stock investments, these investments are considered to be non-income producing. |
| (3) | Gross additions include increases in investments resulting from new portfolio company investments, paid-in-kind interest or dividends, and exchange of one or more existing securities for one or more new securities. Gross additions also include net decreases in unrealized depreciation or net increases in unrealized appreciation. |
| (4) | Gross reductions include decreases in investments resulting from sales and the exchange of one or more existing securities for one or more new securities. Gross reductions also include net increases in unrealized depreciation or net decreases in unrealized appreciation. |
The above schedules should be read in conjunction with the Schedule of Investments set forth above and Notes 2 and 3 to these Financial Statements.
| 10. | Subsequent Events |
In preparing these financial statements, the Company has evaluated events after December 31, 2012. There were no subsequent events since December 31, 2012 that would require adjustment to or additional disclosure in these financial statements.
| 11. | Selected Quarterly Financial Data (Unaudited) |
The following tables set forth certain quarterly financial information for each of the last eight quarters ended December 31, 2012. This information was derived from our unaudited financial statements. Results for any quarter are not necessarily indicative of results for the full year or for any further quarter.
| Investment Income |
Net Investment Loss |
Net
Realized Gain (Loss) on Investments |
Net
Change in Unrealized Appreciation (Depreciation) on Investments |
Net (Decrease) in Net Assets from Operations |
||||||||||||||||||||||||||||||||||||
| Quarter Ended |
Total | Per Share (1) |
Total | Per Share (1) |
Total | Per Share (1) |
Total | Per Share (1) |
Total | Per Share (1) |
||||||||||||||||||||||||||||||
| March 31, 2011 |
24,091 | 0.01 | (859,278 | ) | (0.24 | ) | — | — | 77,915 | 0.02 | (781,363 | ) | (0.22 | ) | ||||||||||||||||||||||||||
| June 30, 2011 |
19,187 | * | (1,123,755 | ) | (0.20 | ) | — | — | 684,683 | 0.12 | (439,072 | ) | (0.08 | ) | ||||||||||||||||||||||||||
| September 30, 2011 |
6,382 | * | (583,214 | ) | (0.06 | ) | — | — | (776,954 | ) | (0.09 | ) | (1,360,168 | ) | (0.15 | ) | ||||||||||||||||||||||||
| December 31, 2011 |
4,688 | * | (1,143,775 | ) | (0.12 | ) | — | — | 778,140 | 0.08 | (365,635 | ) | (0.04 | ) | ||||||||||||||||||||||||||
| March 31, 2012 |
1,742 | * | (1,201,620 | ) | (0.13 | ) | 132,930 | 0.01 | 972,518 | 0.10 | (96,172 | ) | (0.01 | ) | ||||||||||||||||||||||||||
| June 30, 2012 |
1,098 | * | (908,668 | ) | (0.10 | ) | 270,701 | 0.03 | (319,247 | ) | (0.03 | ) | (957,214 | ) | (0.10 | ) | ||||||||||||||||||||||||
| September 30, 2012 |
537 | * | (1,082,515 | ) | (0.12 | ) | (121,428 | ) | (0.01 | ) | 1,332,013 | 0.14 | 128,070 | 0.01 | ||||||||||||||||||||||||||
| December 31, 2012 |
493 | * | (860,183 | ) | (0.09 | ) | — | — | (139,894 | ) | (0.02 | ) | (1,000,077 | ) | (0.11 | ) | ||||||||||||||||||||||||
| * | Per share amounts less than $0.01. |
| (1) | Per share amounts are calculated using weighted average shares outstanding during the quarterly period. |
127
Table of Contents
| Item 9. | Changes in and Disagreements with Accountants on Accounting and Financial Disclosure |
Not applicable.
| Item 9A. | Controls and Procedures |
Evaluation of Disclosure Controls and Procedures
As of December 31, 2012 (the end of the period covered by this annual report), we, including our Chief Executive Officer and Chief Financial Officer, evaluated the effectiveness of the design and operation of our disclosure controls and procedures (as defined in Rule 13a-15(e) of the 1934 Act). Based on that evaluation, our management, including our Chief Executive Officer and Chief Financial Officer, concluded that our disclosure controls and procedures were effective and provided reasonable assurance that information required to be disclosed in our periodic SEC filings is recorded, processed, summarized and reported within the time periods specified in the SEC’s rules and forms, and that such information is accumulated and communicated to our management, including our Chief Executive Officer and Chief Financial Officer, as appropriate, to allow timely decisions regarding required disclosure. However, in evaluating the disclosure controls and procedures, management recognized that any controls and procedures, no matter how well designed and operated can provide only reasonable assurance of achieving the desired control objectives, and management necessarily was required to apply its judgment in evaluating the cost-benefit relationship of possible controls and procedures.
Management’s Report on Internal Control over Financial Reporting
Management is responsible for establishing and maintaining adequate internal control over financial reporting, and for performing an assessment of the effectiveness of internal control over financial reporting as of December 31, 2012. Internal control over financial reporting is a process designed by, or under the supervision of, our principal executive and principal financial officers, or persons performing similar functions, and effected by our Board of Directors, management and other personnel, to provide reasonable assurance regarding the reliability of financial reporting and the preparation of financial statements for external purposes in accordance with generally accepted accounting principles. Our internal control over financial reporting includes those policies and procedures that (i) pertain to the maintenance of records that in reasonable detail accurately and fairly reflect the transactions and dispositions of assets of the company; (ii) provide reasonable assurance that transactions are recorded as necessary to permit preparation of financial statements in accordance with generally accepted accounting principles, and that receipts and expenditures are being made only in accordance with authorizations; and (iii) provide reasonable assurance regarding prevention or timely detection of unauthorized acquisition, use, or disposition of our assets that could have a material effect on the financial statements.
Because of its inherent limitations, internal control over financial reporting may not prevent or detect misstatements. Therefore, even those systems determined to be effective can provide only reasonable assurance with respect to financial statement preparation and presentation.
Management performed an assessment of the effectiveness of our internal control over financial reporting as of December 31, 2012 based upon the criteria set forth in Internal Control—Integrated Framework issued by the Committee of Sponsoring Organizations of the Treadway Commission (“COSO”). Based on our assessment, management determined that our internal control over financial reporting was effective as of December 31, 2012.
This annual report on Form 10-K does not include an attestation report of the Company’s independent registered public accounting firm regarding internal control over financial reporting. Management’s report was not subject to attestation by the Company’s independent registered public accounting firm pursuant to rules of the Securities and Exchange Commission that permit the Company to provide only management’s report in this annual report on Form 10-K.
Changes in Internal Control over Financial Reporting
Management has not identified any change in the Company’s internal control over financial reporting that occurred during the fourth quarter of 2012 that has materially affected, or is reasonably likely to materially affect, the Company’s internal control over financial reporting.
| Item 9B. | Other Information |
None.
128
Table of Contents
| Item 10. | Directors, Executive Officers and Corporate Governance |
Information in response to this Item is incorporated herein by reference to the information provided in our definitive Proxy Statement for our 2013 Annual Meeting of Shareholders (the “2013 Proxy Statement”) to be filed with the Securities and Exchange Commission pursuant to Regulation 14A under the Exchange Act.
We have adopted a code of business conduct and ethics that applies to our directors, officers and employees. The code of business conduct and ethics is available on our website at www.keatingcapital.com. We will report any amendments to or waivers of a required provision of the code of business conduct and ethics on our website or in a Form 8-K.
| Item 11. | Executive Compensation |
The information with respect to compensation of executives and directors will be contained in the 2013 Proxy Statement to be filed with the Securities and Exchange Commission and is incorporated in this Annual Report by reference in response to this item.
| Item 12. | Security Ownership of Certain Beneficial Owners and Management and Related Stockholder Matters |
The information with respect to security ownership of certain beneficial owners and management will be contained in the 2013 Proxy Statement to be filed with the Securities and Exchange Commission and is incorporated in this Annual Report by reference in response to this item.
| Item 13. | Certain Relationships and Related Transactions, and Director Independence |
The information with respect to certain relationships and related transactions will be contained in the 2013 Proxy Statement to be filed with the Securities and Exchange Commission and is incorporated in this Annual Report by reference in response to this item.
| Item 14. | Principal Accountant Fees and Services |
The information with respect to principal accountant fees and services will be contained in the 2013 Proxy Statement to be filed with the Securities and Exchange Commission and is incorporated in this Annual Report by reference in response to this item.
129
Table of Contents
| Item 15. | Exhibits and Financial Statement Schedules |
a. Documents Filed as Part of this Report
The following financial statements of Keating Capital, Inc. are filed herewith in Item 8:
| Financial Statements | Page(s) | |||
| Report of Independent Registered Public Accounting Firm |
98 | |||
| Statements of Assets and Liabilities as of December 31, 2012 and 2011 |
99 | |||
| Statements of Operations for the Years Ended December 31, 2012, 2011, and 2010 |
100 | |||
| Statements of Changes in Net Assets for the Years Ended December 31, 2012, 2011, and 2010 |
101 | |||
| Statements of Cash Flows for the Years Ended December 31, 2012, 2011, and 2010 |
102 | |||
| Schedule of Investments as of December 31, 2012 |
103 | |||
| Schedule of Investments as of December 31, 2011 |
106 | |||
| Notes to Financial Statements |
108 | |||
130
Table of Contents
b. Exhibits
The following exhibits are filed as part of this Annual Report or hereby incorporated by reference to exhibits previously filed with the SEC:
| 3.1 | Amended and Restated Articles of Incorporation (Incorporated by reference to Post-Effective Amendment No. 1 to the Registrant’s Registration Statement on Form N-2 (File No. 333-157217), filed on April 21, 2010) | |
| 3.2 | Articles of Amendment to Amended and Restated Articles of Incorporation (Incorporated by reference to Post-Effective Amendment No. 3 to the Registrant’s Registration Statement on Form N-2 (File No. 333-157217), filed on May 27, 2010) | |
| 3.3 | Amended and Restated Bylaws (Incorporated by reference to the Registrant’s Current Report on Form 8-K (File No. 0-53504), filed on April 23, 2009) | |
| 3.4 | Amendment to Bylaws dated August 5, 2010 (Incorporated by reference to the Registrant’s Current Report on Form 8-K (File No. 0-53504), filed on August 9, 2010) | |
| 3.5 | Amendment to Bylaws dated October 22, 2010 (Incorporated by reference to the Registrant’s Current Report on Form 8-K (File No. 0-53504), filed on October 26, 2010) | |
| 3.6 | Amended and Restated Dividend Reinvestment Plan dated April 12, 2011 (Incorporated by reference to the Registrant’s Quarterly Report on Form 10-Q (File No. 0-53504), filed on August 12, 2011) | |
| 3.7 | Amendment to Amended and Restated Dividend Reinvestment Plan dated November 5, 2012* | |
| 4.1 | Form of Share Certificate (Incorporated by reference to the Registrant’s Annual Report on Form 10-K (File No. 0-53504), filed on March 9, 2009) | |
| 10.1 | Form of Amended and Restated Investment Advisory and Administrative Services Agreement (Incorporated by reference to Amendment No. 1 to the Registrant’s Registration Statement on Form N-2 (File No. 333-157217), filed on May 1, 2009) | |
| 10.2 | License Agreement between the Company and Keating Investments, LLC (Incorporated by reference to the Registrant’s Registration Statement on Form 10 (File No. 0-53504), filed on November 20, 2008) | |
| 10.3 | Form of Indemnification Agreement for Directors (Incorporated by reference to Amendment No. 2 to the Registrant’s Registration Statement on Form N-2 (File No. 333-157217), filed on June 5, 2009) | |
| 10.4 | Custody Agreement between the Company and Steele Street Bank & Trust (Incorporated by reference to the Registrant’s Registration Statement on Form 10 (File No. 0-53504), filed on November 20, 2008) | |
| 10.5 | First Amendment to Custody Agreement between the Company and Steele Street Bank & Trust dated December 21, 2012* | |
| 11 | Computation of Per Share Earnings (included in the notes to the unaudited financial statements contained in this annual report) | |
| 31.1* | Certification of Chief Executive Officer pursuant to Rule 13a-14 of the Securities Exchange Act of 1934, as amended. | |
| 31.2* | Certification of Chief Financial Officer pursuant to Rule 13a-14 of the Securities Exchange Act of 1934, as amended. | |
| 32.1* | Certification of Chief Executive Officer pursuant to Section 906 of The Sarbanes-Oxley Act of 2002. | |
| 32.2* | Certification of Chief Financial Officer pursuant to Section 906 of The Sarbanes-Oxley Act of 2002. | |
| * | Filed herewith. | |
c. Financial statement schedules
No financial statement schedules are filed herewith because (i) such schedules are not required, or (ii) the information has been presented in the aforementioned financial statements.
131
Table of Contents
Pursuant to the requirements of Section 13 or 15(d) of the Securities Exchange Act of 1934, the registrant has duly caused this report to be signed on its behalf by the undersigned, thereunto duly authorized.
| Date: February 15, 2013 |
KEATING CAPITAL, INC. | |||
| /S/ TIMOTHY J. KEATING | ||||
| Timothy J. Keating President and Chief Executive Officer | ||||
Pursuant to the requirements of the Securities Exchange Act of 1934, this report has been signed below by the following persons on behalf of the registrant and in the capacity and on the dates indicated.
| /S/ TIMOTHY J. KEATING | ||||
| Date: February 15, 2013 |
Timothy J. Keating President, Chief Executive Officer and Chairman of the Board of Directors (Principal Executive Officer) | |||
| /S/ STEPHEN M. HILLS | ||||
| Date: February 15, 2013 |
Stephen M. Hills Chief Financial Officer and Treasurer (Principal Accounting and Financial Officer) | |||
| /S/ FREDERIC M. SCHWEIGER | ||||
| Date: February 15, 2013 |
Frederic M. Schweiger Director | |||
| /S/ J. TAYLOR SIMONTON | ||||
| Date: February 15, 2013 |
J. Taylor Simonton Director | |||
| /S/ ANDREW S. MILLER | ||||
| Date: February 15, 2013 |
Andrew S. Miller Director | |||
| /S/ LAURENCE W. BERGER | ||||
| Date: February 15, 2013 |
Laurence W. Berger Director | |||
| /S/ BRIAN P. ALLEMAN | ||||
| Date: February 15, 2013 |
Brian P. Alleman Director | |||
132