Attached files
| file | filename |
|---|---|
| EX-99.1 - EX-99.1 - ASSOCIATED BANC-CORP | d758346dex991.htm |
| 8-K - 8-K - ASSOCIATED BANC-CORP | d758346d8k.htm |
 ASSOCIATED BANC-CORP
2Q 2014 EARNINGS PRESENTATION
JULY 17, 2014
Exhibit 99.2 |
 FORWARD-LOOKING STATEMENTS
Important
note
regarding
forward-looking
statements:
Statements made in this presentation which are not purely historical are
forward-looking statements, as defined in the Private Securities
Litigation Reform Act of 1995. This includes any statements regarding
management’s plans, objectives, or goals for future operations, products or
services,
and
forecasts
of
its
revenues,
earnings,
or
other
measures
of
performance.
Such
forward-looking
statements
may
be
identified
by
the
use
of
words
such
as
“believe”,
“expect”,
“anticipate”,
“plan”,
“estimate”,
“should”,
“will”,
“intend”,
“outlook”,
or
similar
expressions.
Forward-
looking statements are based on current management expectations and, by their
nature, are subject to risks and uncertainties. Actual results may differ
materially from those contained in the forward-looking statements.
Factors which may cause actual results to differ materially from those
contained in such forward-looking statements include those identified in the
Company’s most recent Form 10-K and subsequent SEC filings.
Such factors are incorporated herein by reference.
1 |
 2014
SECOND QUARTER HIGHLIGHTS 2
Loan Growth drives Solid Earnings
•
Average loans of $16.6 billion were up $482 million, or 3% from the first
quarter Total average commercial loans grew $398 million from the first
quarter Credit card portfolio purchased on June 30, 2014 for $108
million •
Net interest income of $169 million was up $4 million, or 2% from the first
quarter Interest on Commercial loans was up $3 million, or 3% from the first
quarter •
Net interest margin of 3.08% compared to 3.12% in the first quarter
•
Quarterly dividend of $0.09 / common share, or 32% of second quarter
earnings •
Repurchased 1.7 million shares of common stock during the second
quarter
July 1st –
repurchased additional 1.6 million shares in accelerated program
•
Capital ratios remain strong and above Basel III targets
•
Noninterest income of $72 million was down $1 million compared to the first
quarter Core fee-based revenues grew $3 million from the first
quarter •
Noninterest expense of $168 million was flat compared to the first quarter
Efficiency ratio improved from the first quarter to 68%
•
Net income available to common shareholders of $45 million or $0.28 per
share •
Pretax income of $68 million was up $2 million, or 3% from the first quarter
•
Return on Tier 1 Common Equity of 9.6%
Net Interest Income
&
Net Interest Margin
Noninterest Income
&
Expenses
Capital
Balance Sheet
Net Income
&
ROT1CE |
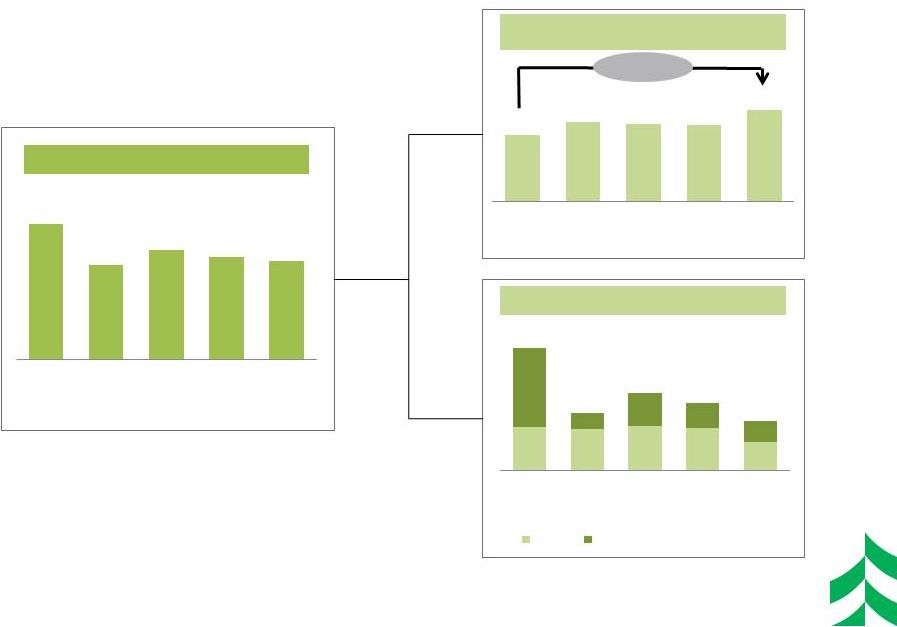
 LOAN
PORTFOLIO COMPOSITION 3
2Q 2014 Average Net Loan Change (+$482 mln)
Loan
Mix
–
2Q
2014
(Average)
($ in millions)
Home Equity & Installment
Commercial Real Estate
Residential Mortgage
Power & Utilities
Oil & Gas
Mortgage Warehouse
General Commercial Loans
Average Quarterly Loans ($ in billions)
$16.6
+4%
% Chg
+78%
+2%
+14%
(3%)
$15.7
+2%
$16.2
$14.6
$13.0
Total
Commercial &
Business
Lending
+6%
+8%
$4.2
$5.0
$5.9
$6.1
$6.5
$2.9
$3.3
$3.7
$3.9
$4.0
$2.7
$3.3
$3.7
$3.9
$4.1
$3.2
$3.0
$2.5
$2.2
$2.1
2Q 2011
2Q 2012
2Q 2013
1Q 2014
2Q 2014
Commercial & Business
Commercial Real Estate
Residential Mortgage
Home Equity & Installment
($67)
$48
$60
$74
$97
$119
$151
CRE Investor
18%
Construction
6%
Commercial
& Business
Lending
39%
Res Mtg
25%
Home Equity
10%
Installment
2% |
 COMMERCIAL LINE UTILIZATION TRENDS
4
Line utilization increased in Commercial & Business Lending
Change from 1Q 14
Commercial Real
Estate (including
construction)
-
260 bps
Commercial &
Business Lending
+ 290 bps
50.0%
51.1%
48.6%
46.9%
48.8%
51.7%
56.5%
60.4%
61.1%
63.1%
64.2%
61.6%
45.0%
50.0%
55.0%
60.0%
65.0%
1Q 2013
2Q 2013
3Q 2013
4Q 2013
1Q 2014
2Q 2014
Commercial & Business Lending
Commercial Real Estate |
 160,000 “Associated Bank”
branded card accounts
CREDIT CARD PORTFOLIO PURCHASE
5
Summary Details:
ASBC and US Bank will both participate on a pro-rata basis in all revenues,
credit losses, and growth going forward.
Elan will continue to administer, service, and manage the portfolio for a fixed,
per account fee. The purchase premium will be amortized over 5 years.
55%
participation
45%
participation
ASBC acquired a 45% participation interest ($99 million) in a credit card portfolio
of customers who currently hold “Associated Bank”
branded credit card accounts for $108 million.
ASBC will forego referral fees it has been receiving from Elan/US Bank for new
accounts but expects that the net yield on the portfolio (net of losses and
premium amortization) will offset this foregone fee revenue.
Transaction is expected to result in less card based fee income but more net
interest income. Bottom line impact should not be material in 2014,
but will build value over time and contribute to earnings growth as the
portfolio grows. |
 GROWING
NET INTEREST INCOME WHILE MARGIN COMPRESSES
6
Yield on Interest-earning Assets
Cost of Interest-bearing Liabilities
Net Interest Income & Net Interest Margin
($ in millions)
$160
$161
$167
$165
Net Interest Margin
$169
$1
<$1
<$1
0.41%
0.35%
0.31%
0.38%
0.29%
2Q 2013
3Q 2013
4Q 2013
1Q 2014
2Q 2014
$159
$159
$163
$164
$168
$1
$4
Net Interest Income Net of Interest Recoveries
Interest Recoveries
0.24%
0.23%
0.22%
0.19%
0.19%
2Q 2013
3Q 2013
4Q 2013
1Q 2014
2Q 2014
Interest Bearing Deposit Costs
Other Funding Costs
3.47%
3.42%
3.50%
3.36%
3.31%
3.16%
3.13%
3.23%
3.12%
3.08%
2Q 2013
3Q 2013
4Q 2013
1Q 2014
2Q 2014 |
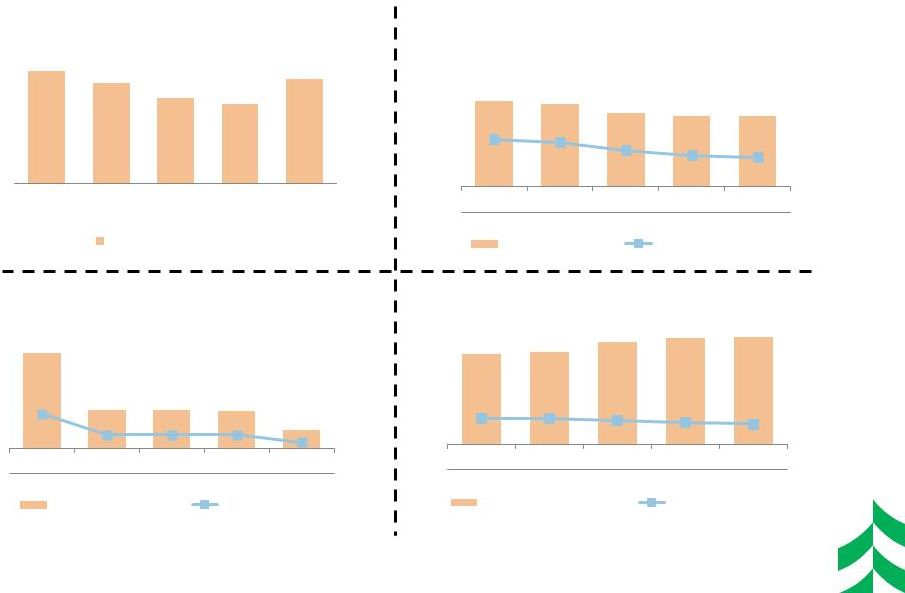
 NONINTEREST INCOME TRENDS
($ IN MILLIONS)
7
Core
Fee-based
Revenue
Other
Noninterest
Income
Total Noninterest Income
1
–
Core
Fee-based
Revenue
=
Trust
service
fees
plus
Service
charges
on
deposit
accounts
plus
Card-based
and
other
nondeposit
fees
plus
Insurance
commissions plus Brokerage and annuity commissions. This is a non-GAAP
measure. Please refer to press release tables for more information.
2
–
Other
Noninterest
Income
=
Total
Noninterest
Income
minus
Core
Fee-based
Revenue.
$29
$13
$19
$17
$12
$84
$71
$76
$74
$72
2Q
2013
3Q
2013
4Q
2013
1Q
2014
2Q
2014
$55
$58
$57
$57
$60
2Q
2013
3Q
2013
4Q
2013
1Q
2014
2Q
2014
+10%
$10
$10
$10
$10
$7
$19
$4
$8
$6
$5
2Q
2013
3Q
2013
4Q
2013
1Q
2014
2Q
2014
Other
Mortgage Banking Income (net)
1
2 |
 NONINTEREST EXPENSE TRENDS
($ IN MILLIONS)
8
Total Noninterest Expense
Personnel
Spend
/
FTE
Trend
Efficiency Ratio
67%
70%
73%
69%
68%
Other
Non-Personnel
Spend
Trend
1
–
Efficiency
ratio
=
Noninterest
expense,
excluding
amortization
of
intangibles,
divided
by
sum
of
taxable
equivalent
net
interest
income
plus
noninterest
income,
excluding investment securities gains, net, and asset gains, net. This is a
non-GAAP financial measure. Please refer to the appendix for a reconciliation of this.
2
–
FTE
= Average Full Time Equivalent Employees
3
–
Technology
Spend
=
Data
Processing
and
Equipment
expenses
4
–
Other
Non-Personnel
Spend
=
Total
Noninterest
Expense
less
Personnel
and
Technology
spend
3
4
$69
$67
$78
$70
$70
$169
$165
$179
$168
$168
2Q
2013
3Q
2013
4Q
2013
1Q
2014
2Q
2014
$100
$98
$101
$98
$98
4,790
4,699
4,584
4,517
4,431
2Q
2013
3Q
2013
4Q
2013
1Q
2014
2Q
2014
Personnel Spend
FTE
$19
$19
$19
$19
$21
$50
$49
$58
$51
$49
2Q
2013
3Q
2013
4Q
2013
1Q
2014
2Q
2014
Technology Spend
Other Non-Personnel
1
2 |
 CREDIT
QUALITY INDICATORS ($ IN MILLIONS)
9
$310
$277
$235
$220
$288
2Q 2013
3Q 2013
4Q 2013
1Q 2014
2Q 2014
Potential Problem Loans
$217
$208
$185
$178
$179
1.38%
1.33%
1.17%
1.08%
1.05%
2Q 2013
3Q 2013
4Q 2013
1Q 2014
2Q 2014
Nonaccruals
Nonaccruals / Loans
$14
$5
$5
$5
$3
0.35%
0.14%
0.14%
0.14%
0.06%
2Q 2013
3Q 2013
4Q 2013
1Q 2014
2Q 2014
Net Charge Offs
NCOs / Avg Loans
127%
131%
145%
151%
152%
1.76%
1.74%
1.69%
1.63%
1.59%
2Q 2013
3Q 2013
4Q 2013
1Q 2014
2Q 2014
ALLL/ Nonaccruals
ALLL/ Total Loans |
 EPS,
DIVIDENDS, AND CAPITAL DEPLOYMENT •
Current capital levels are in excess of
“well-capitalized”
regulatory benchmarks
Existing capital levels are already
above Basel III capital levels
$115 mm of remaining share
repurchase authorization
10
Tier 1 Common Equity Ratio
EPS and Dividends Paid & ROT1CE
Earnings & Dividends
per Common Share
Return on Tier 1
Common Equity
Definition of Tier 1 Common Equity:
Tier
1
Common
Equity
(T1CE),
a
non-GAAP
financial
measure,
is
used
by
banking
regulators,
investors
and
analysts
to
assess
and
compare
the
quality
and
composition of our capital with the capital of other financial services companies.
Management uses Tier 1 common equity, along with other capital measures, to assess
and
monitor
our
capital
position.
Tier
1
Common
Equity
is
Tier
1
capital
excluding
qualifying
perpetual
preferred
stock
and
qualifying
trust
preferred
securities.
$0.15
$0.24
$0.28
$0.28
12.61%
12.04%
11.49%
10.72%
2Q 2011
2Q 2012
2Q 2013
2Q 2014
$0.01
$0.05
$0.08
$0.09
2Q 2011
2Q 2012
2Q 2013
2Q 2014
6.1%
9.3%
9.9%
9.6% |
 2014
SECOND HALF OUTLOOK 11
Asset Growth
Deposits / Funding
Mix
Margin
Noninterest
Income
Noninterest
Expense
Capital
Provision
•
Full year 2014 annual
average loan growth of approximately 8%
•
Mid single digit average deposit and slightly higher other
funding growth
•
NIM compression of a few basis points per quarter
•
Net interest income growth
•
Second half 2014 noninterest income in line with first half 2014
•
Total 2014 expenses expected to be flat compared to
2013 with a continued focus on efficiency initiatives
•
Continue to follow stated corporate priorities for capital
deployment
•
Provision based on expected loan growth and other factors
|
 APPENDIX
12 |
 RECONCILIATION AND DEFINITIONS OF
NON-GAAP ITEMS
13
2Q 2013
3Q 2013
4Q 2013
1Q 2014
2Q 2014
Efficiency Ratio Reconciliation:
Efficiency ratio (1)
69.01%
71.45%
73.70%
70.41%
69.70%
Taxable equivalent adjustment
(1.38)
(1.50)
(1.49)
(1.35)
(1.32)
Asset gains (losses), net
(0.01)
0.59
0.80
0.22
0.26
Other intangible amortization
(0.41)
(0.44)
(0.42)
(0.42)
(0.41)
Efficiency ratio, fully taxable equivalent (1)
67.21%
70.10%
72.59%
68.86%
68.23%
(1) Efficiency
ratio
is
defined
by
the
Federal
Reserve
guidance
as
noninterest
expense
divided
by
the
sum
of
net
interest
income
plus
noninterest
income, excluding investment securities gains / losses, net. Efficiency
ratio, fully taxable equivalent, is noninterest expense, excluding other
intangible amortization, divided by the sum of taxable equivalent net interest
income plus noninterest income, excluding investment securities gains /
losses, net and asset gains / losses, net. This efficiency ratio is presented on a taxable equivalent basis, which adjusts net interest
income for the tax-favored status of certain loans and investment
securities. Management believes this measure to be the preferred industry
measurement of net interest income as it enhances the comparability of net interest
income arising from taxable and tax-exempt sources and it excludes
certain specific revenue items (such as investment securities gains / losses, net and asset gains / losses, net). |