Attached files
| file | filename |
|---|---|
| 8-K - 8-K - TIDEWATER INC | d750427d8k.htm |
| EX-99.2 - EX-99.2 - TIDEWATER INC | d750427dex992.htm |
 GHS 100 Energy
Conference June 25, 2014
Quinn P. Fanning
EVP & CFO
Joseph M. Bennett
EVP & Chief IRO
Exhibit 99.1 |
 FORWARD-LOOKING STATEMENTS
In
accordance
with
the
safe
harbor
provisions
of
the
Private
Securities
Litigation
Reform
Act
of
1995,
the
Company
notes
that
certain
statements
set
forth
in
this
presentation
provide
other
than
historical
information
and
are
forward
looking.
The
actual
achievement
of
any
forecasted
results,
or
the
unfolding
of
future
economic
or
business
developments
in
a
way
anticipated
or
projected
by
the
Company,
involve
numerous
risks
and
uncertainties
that
may
cause
the
Company’s
actual
performance
to
be
materially
different
from
that
stated
or
implied
in
the
forward-looking
statement.
Among
those
risks
and
uncertainties,
many
of
which
are
beyond
the
control
of
the
Company,
include,
without
limitation,
fluctuations
in
worldwide
energy
demand
and
oil
and
gas
prices;
fleet
additions
by
competitors
and
industry
overcapacity;
changes
in
capital
spending
by
customers
in
the
energy
industry
for
offshore
exploration,
development
and
production;
changing
customer
demands
for
different
vessel
specifications,
which
may
make
some
of
our
older
vessels
technologically
obsolete
for
certain
customer
projects
or
in
certain
markets;
uncertainty
of
global
financial
market
conditions
and
difficulty
accessing
credit
or
capital;
acts
of
terrorism
and
piracy;
significant
weather
conditions;
unsettled
political
conditions,
war,
civil
unrest
and
governmental
actions,
such
as
expropriation
or
enforcement
of
customs
or
other
laws
that
are
not
well-developed
or
consistently
enforced,
especially
in
higher
political
risk
countries
where
we
operate;
foreign
currency
fluctuations;
labor
changes
proposed
by
international
conventions;
increased
regulatory
burdens
and
oversight;
and
enforcement
of
laws
related
to
the
environment,
labor
and
foreign
corrupt
practices.
Readers
should
consider
all
of
these
risks
factors,
as
well
as
other
information
contained
in
the
Company’s
form
10-K’s
and
10-Q’s.
Phone:
504.568.1010 | Fax:
504.566.4580
Web site address:
www.tdw.com
Email:
connect@tdw.com
GHS 100 Energy Conference
TIDEWATER
601 Poydras Street, Suite 1500, New Orleans, LA 70130
2 |
 •
Consistent goal of “Best in Class”
safety and compliance culture
•
History of earnings growth and solid returns
•
Largest “NEW”
OSV fleet in the industry, operating in over
50 countries with ~9,000 employees worldwide
•
Solid balance sheet and ready liquidity allows us to continue
to act upon available opportunities, such as recent Troms
acquisition and new Subsea business
•
Constructive fundamental backdrop for the OSV industry
Key Tidewater Takeaways
GHS 100 Energy Conference
3 |
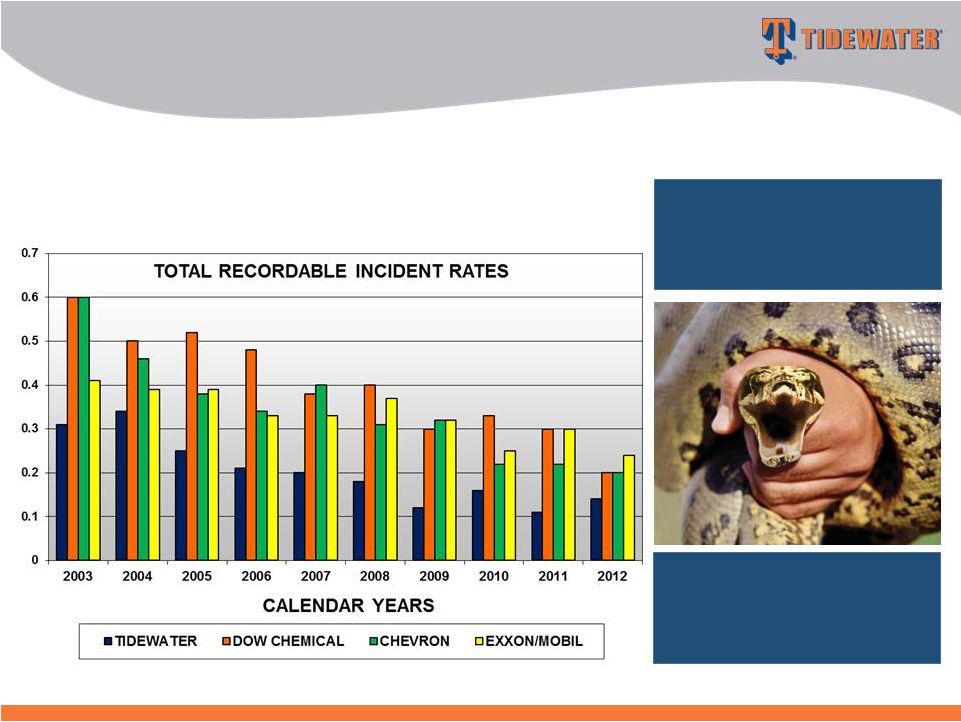 Safety Record
Rivals Leading Companies GHS 100 Energy Conference
•
Safe Operations is Priority #1
•
Stop Work Obligation
•
Safety performance is 25% of mgt. incentive comp
4
It’s a task that can’t be turned
loose not for a microsecond or an
accident will strike without pity.
Operating safely offshore is like
holding a snake by its head. |
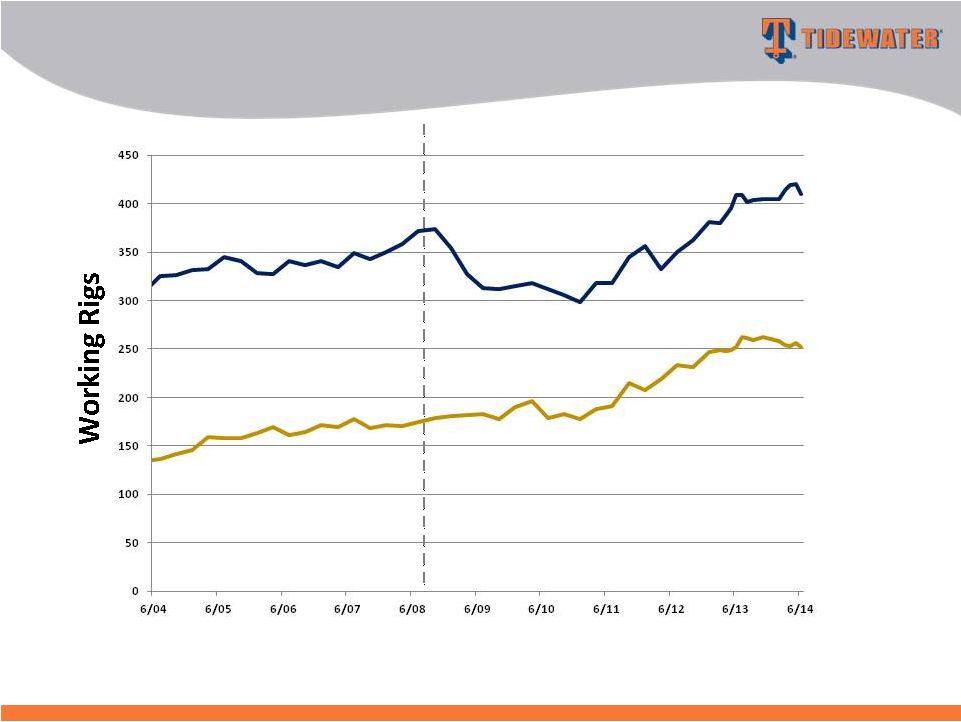 Source: ODS-Petrodata
Note: 43 “Other”
rigs, along with the Jackups and Floaters, provide a total working rig count of 705
in June 2014. 410
252
Prior peak (summer 2008)
Jackups
Floaters
Working Offshore Rig Trends
GHS 100 Energy Conference
5 |
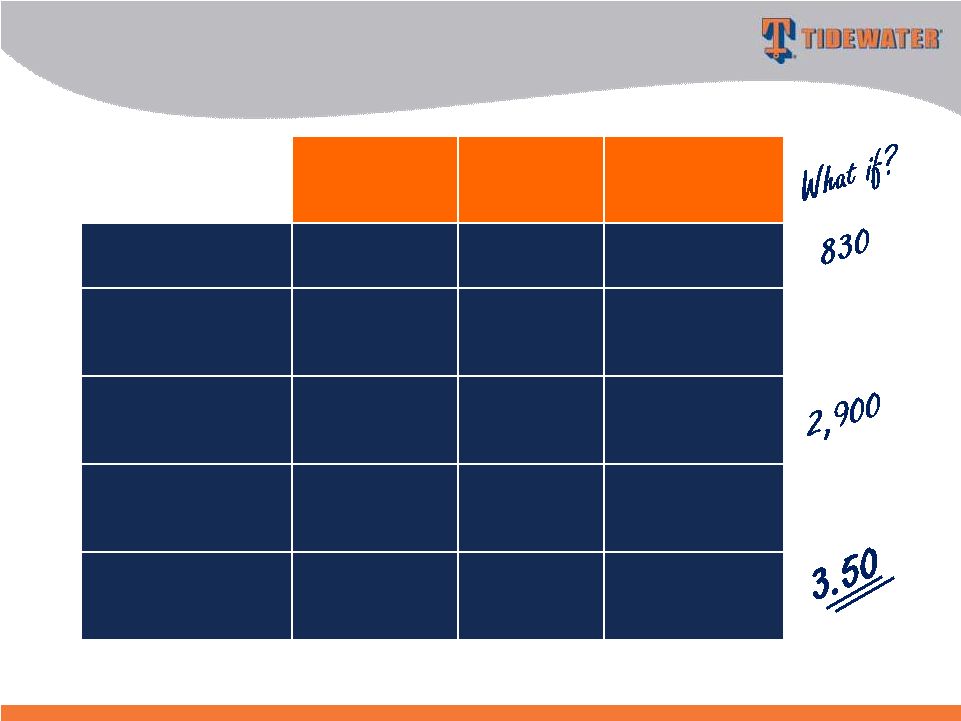 Source: ODS-Petrodata and Tidewater
July 2008
(Peak)
Jan. 2011
(Trough)
June
2014
Working Rigs
603
538
705
Rigs Under
Construction
186
118
245
OSV Global
Population
2,033
2,599
3,126
OSV’s Under
Construction
736
367
469
OSV/Rig Ratio
3.37
4.83
4.43
Drivers of our Business “Peak to Present”
GHS 100 Energy Conference
6 |
 Source: ODS-Petrodata and Tidewater
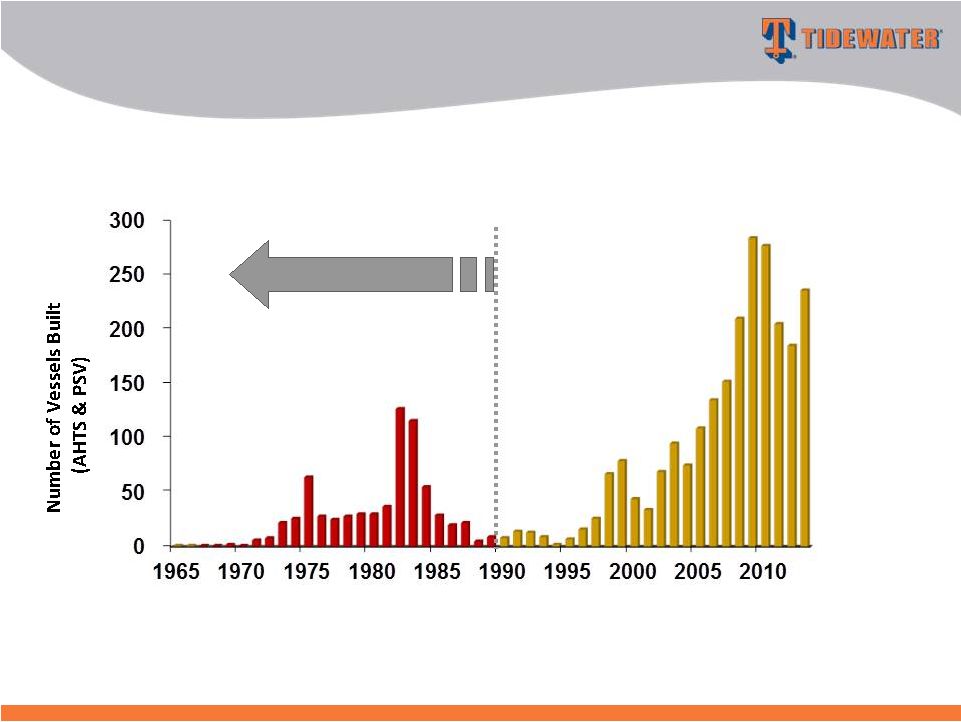
As of June 2014, there are approximately 469 additional AHTS
and PSV’s (~15% of the global fleet) under construction.
Global fleet is estimated at 3,126 vessels, including ~700
vessels that are 25+ yrs old (25%). Vessels > 25 years old
today The Worldwide OSV Fleet
(Includes AHTs and PSVs only) Estimated as of June 2014
GHS 100 Energy Conference
7 |
 Year
Built Deepwater vessels
Towing Supply/Supply
Other vessels
245 “New”
vessels –
6.9 avg yrs
23 “Traditional”
vessels –
26.6 avg yrs
Tidewater’s Active Fleet
As of March 31, 2014
GHS 100 Energy Conference
8 |
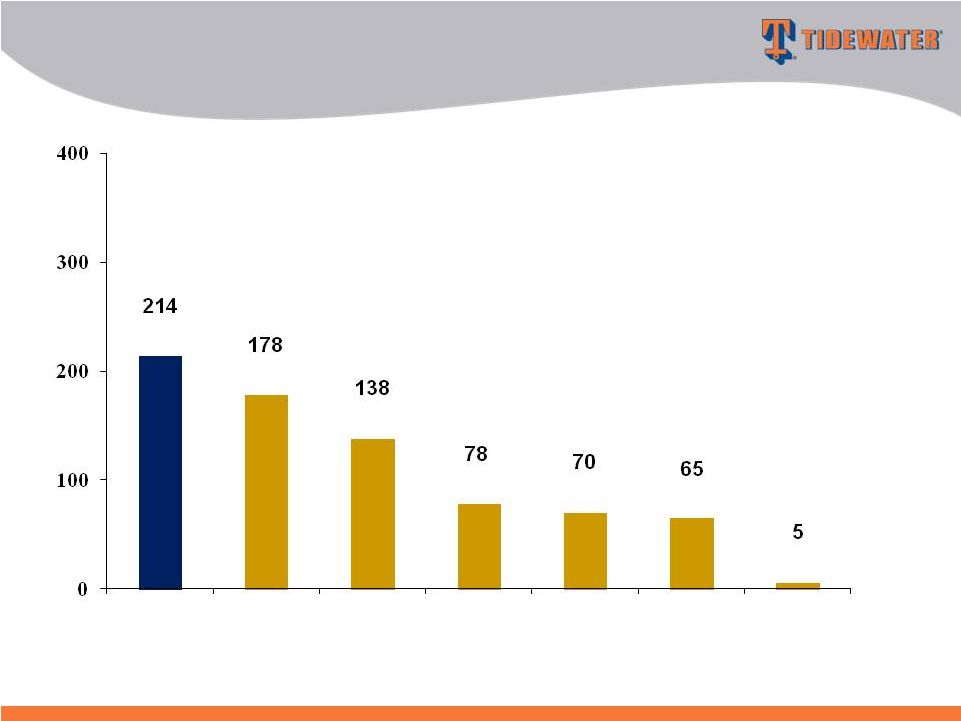 Source: ODS-Petrodata and Tidewater
Tidewater
Competitor #2
Competitor #3
Competitor #4
Competitor # 5
Competitor #1
Avg.
All Others (2,383 total
vessels for
400+ owners)
Vessel Population by Owner
(AHTS and PSVs only) Estimated as of June 2014
GHS 100 Energy Conference
9 |
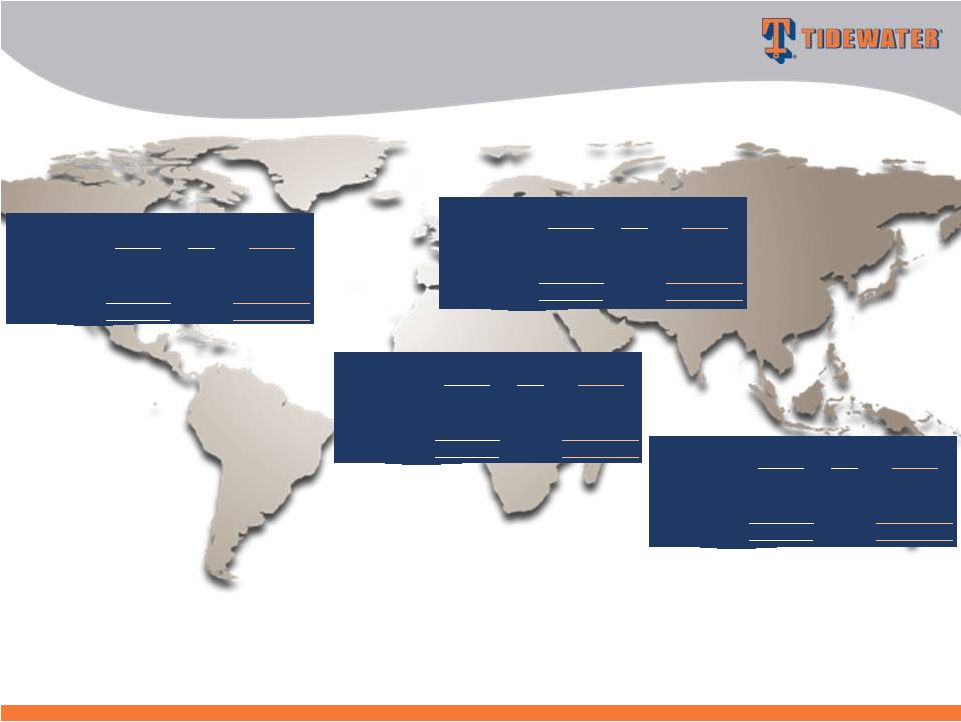
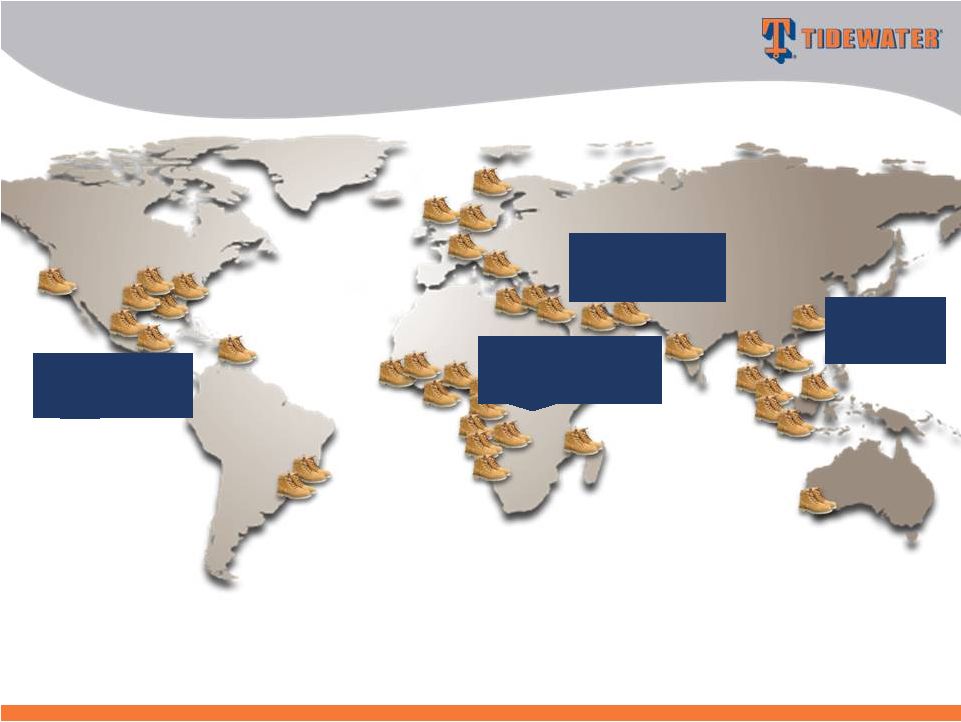 Americas
66(25%)
SS Africa/Europe
135(50%)
MENA
44(16%)
Asia/Pac
23(9%)
In 4Q FY 2014, ~12% of vessel revenue was generated in the U.S. by ~ 17 vessels;
however, <15 other U.S.-flagged vessels are currently operating in
International regions that could be re-deployed to the U.S. GOM. In addition, Tidewater has
currently under construction five additional U.S.-flagged deepwater PSVs.
Our Global Footprint –
Vessel Count by Region
(Excludes stacked vessels –
as of 3/31/14)
GHS 100 Energy Conference
10 |
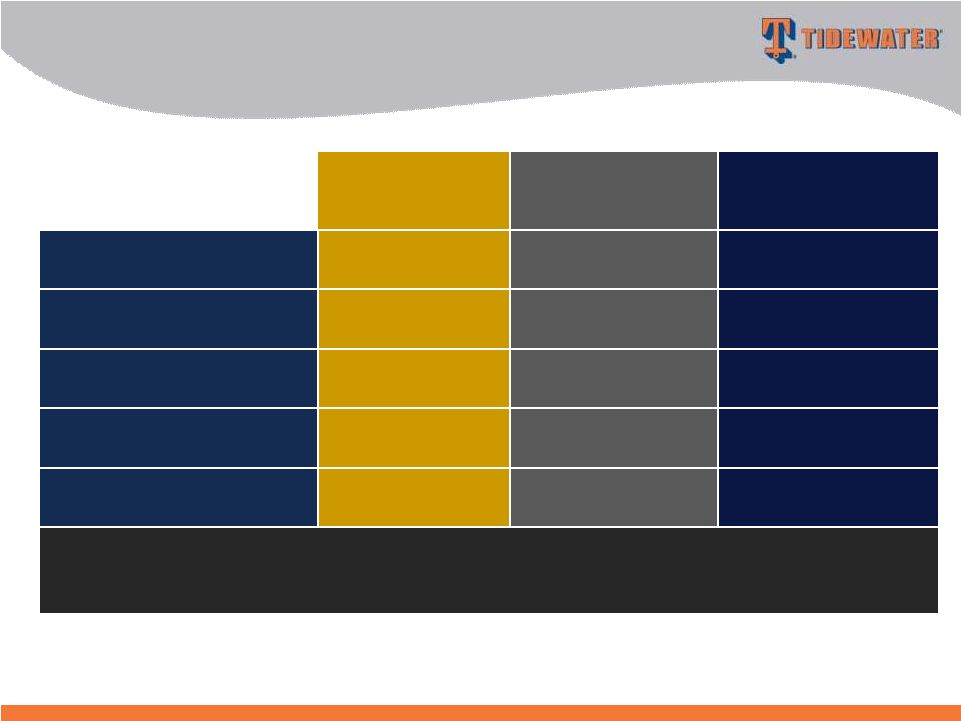
 Our Global
Footprint – Vessel Class by Region
(Excludes stacked vessels –
as of 3/31/14)
GHS 100 Energy Conference
New
Avg.
Traditional
Vessels
NBV
Vessels
Deepwater
31
$19.3M
0
Towing Supply
14
$10.7M
8
Other
9
$3.5M
4
54
12
New
Avg.
Traditional
Vessels
NBV
Vessels
Deepwater
10
$17.0M
1
Towing Supply
31
$12.2M
0
Other
0
0
2
41
3
New
Avg.
Traditional
Vessels
NBV
Vessels
Deepwater
39
$28.3M
0
Towing Supply
46
$12.3M
2
Other
42
$1.9M
6
127
8
New
Avg.
Traditional
Vessels
NBV
Vessels
Deepwater
8
$25.0M
0
Towing Supply
14
$11.8M
0
Other
1
$6.8M
0
23
0
Americas
SSAE
MENA
Asia/Pac
Vessel
count
info
is
as
of
3/31/14,
and
includes
leased
vessels.
Avg
NBV
excludes
the
impact
of
leased
vessels
which
have
no
NBV.
Average
NBV
of
the
total
23
Traditional
vessels
is
$0.96M
at
3/31/14.
11 |
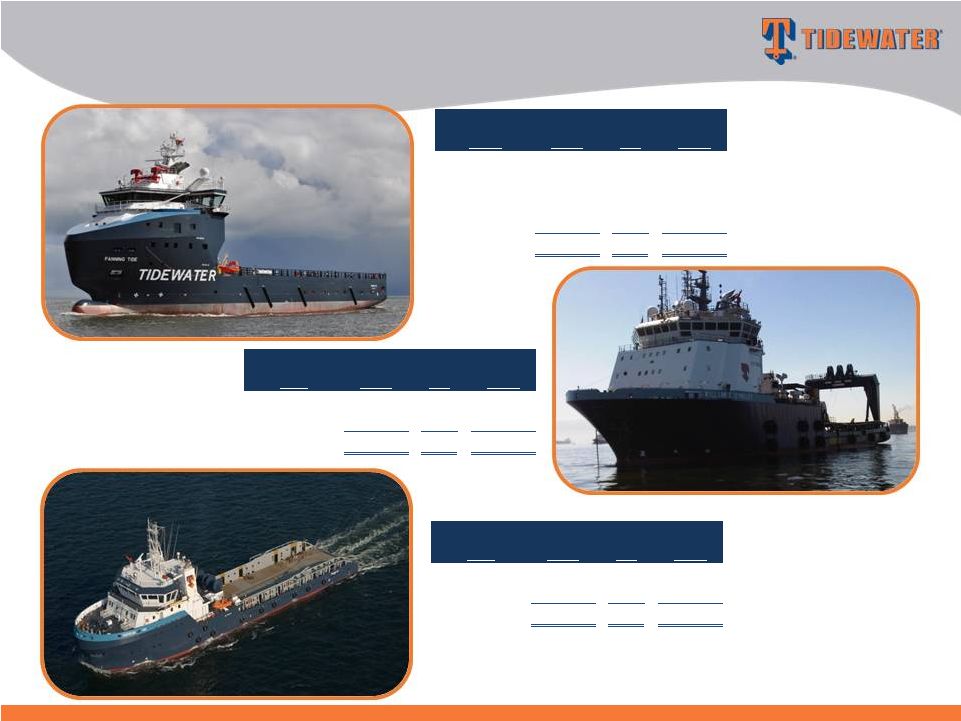 A Broad
Portfolio of New High Spec OSVs GHS 100 Energy Conference
Deepwater PSV
Deepwater PSV
Deepwater AHTS
Deepwater AHTS
Towing Supply
Vessel information is as of 3/31/14. CIP=Construction in Process.
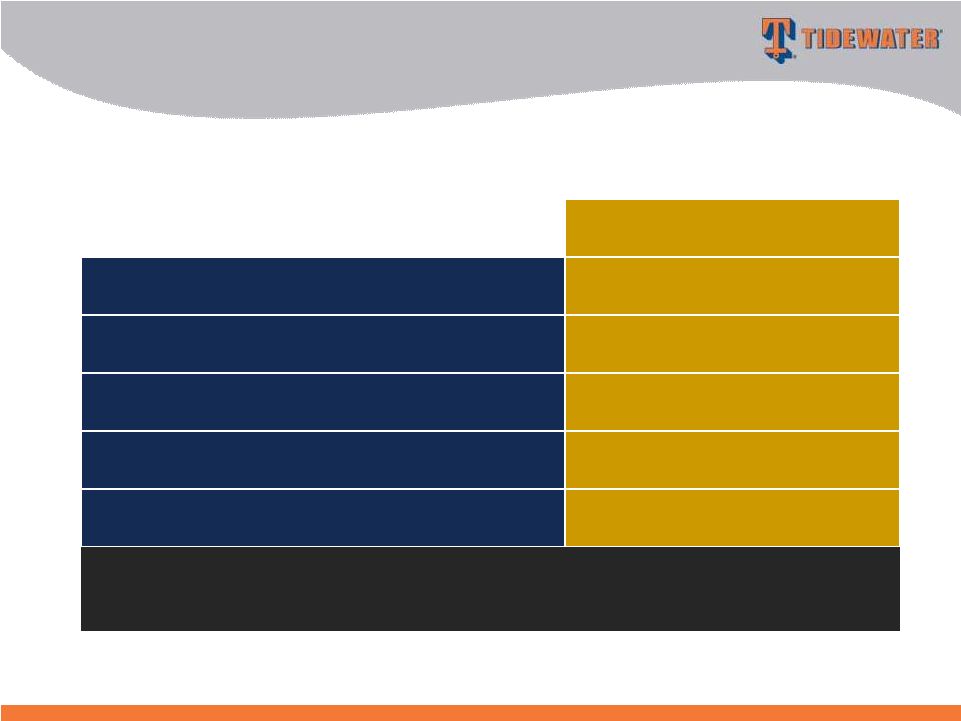
Current
Future
DWT
Fleet
CIP
Fleet
5,000-6,000
16
4
20
4,000-4,999
11
13
24
3,000-3,999
43
6
49
<3,000
6
0
6
76
23
99
Current
Future
BHP
Fleet
CIP
Fleet
25,000+
5
0
5
13,500-16,500
7
0
7
12
0
12
Current
Future
BHP
Fleet
CIP
Fleet
7,000-10,000
36
6
42
3,000-6,999
69
0
69
105
6
111
12 |
 Vessel Count (2) Total Cost (2)
Average Cost
per Vessel
Deepwater PSVs
99
$2,771m
$28.0m
Deepwater AHTSs
12
$387m
$32.3m
Towing Supply/Supply
111
$1,670m
$15.0m
Other
53
$227m
$4.3m
TOTALS:
275
$5,055m
(1)
$18.4m
.
At 3/31/14, 245 new vessels were in our fleet with ~6.9 year average age
Vessel Commitments
Jan. ’00 –
March ‘14
(1)
~$4.5b (89%) funded through 3/31/14
(2)
Vessel count and total cost is net of 26 vessel dispositions ($243M of original
cost) (2)
Vessel count and total cost is net of 25 vessel dispositions ($227m of original
cost) The Largest Modern OSV Fleet in the Industry
GHS 100 Energy Conference
13 |
 Count
Deepwater PSVs
23
Deepwater AHTSs
-
Towing Supply/Supply
6
Other
1
Total
30
Vessels Under Construction*
As of March 31, 2014
Estimated
delivery
schedule
–
12
in
FY
’15,
16
in
FY
‘16
and
2
thereafter.
CAPX of $368m in FY ’15, $193m in FY ‘16 and $12m thereafter.
…and More to Come
GHS 100 Energy Conference
14 |
 As of March
31, 2014 Cash & Cash Equivalents
$60 million
Total Debt
$1,515 million
Shareholders Equity
$2,679 million
Net Debt / Net Capitalization
35%
Total Debt / Capitalization
36%
~$660 million of available liquidity as of 3/31/14, including $600 million of
unused capacity under the company’s revolving credit facility.
Strong Financial Position Provides
Strategic Optionality
GHS 100 Energy Conference
15 |
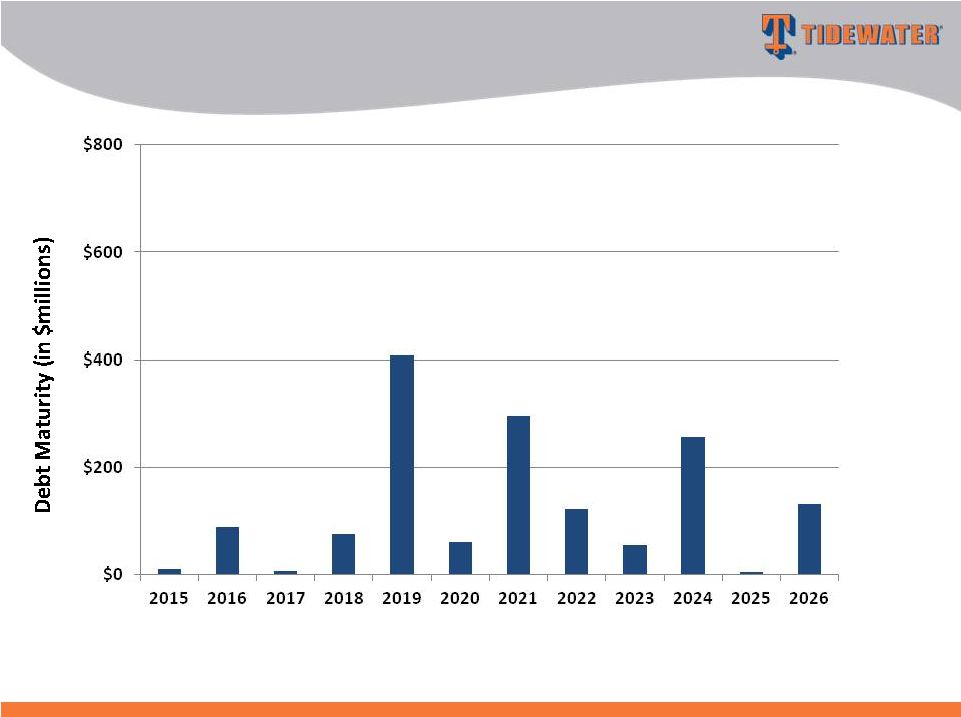 Debt Maturities
as of 3/31/14 Limited for Several Years
GHS 100 Energy Conference
Fiscal Year
16 |
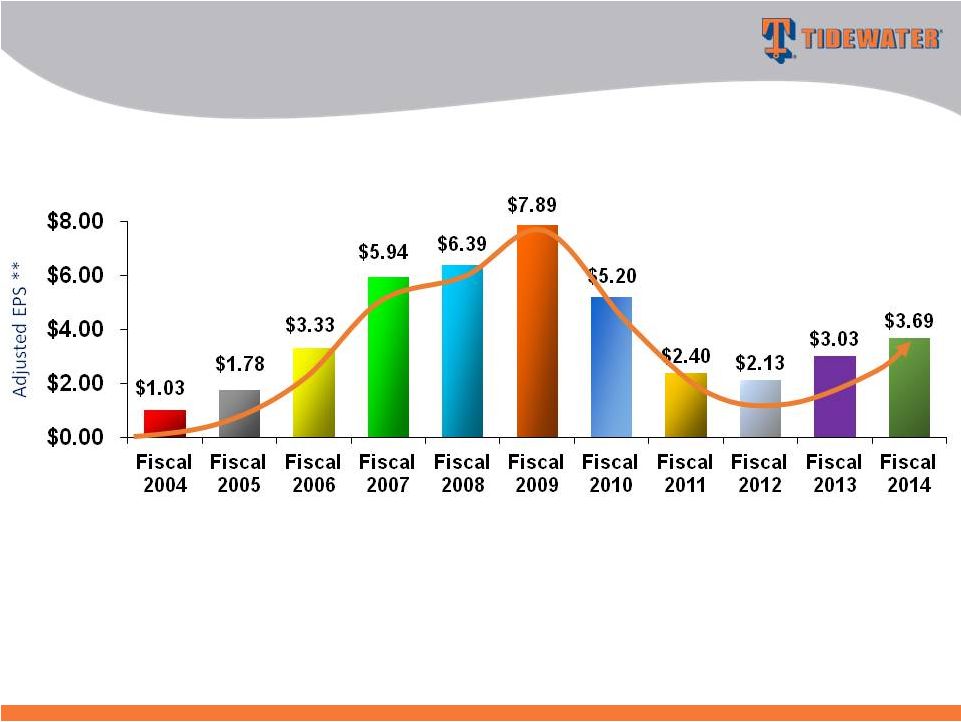 **
EPS in Fiscal 2004 is exclusive of the $.30 per share after tax impairment
charge. EPS in Fiscal 2006 is exclusive of the $.74 per share after tax gain from the
sale of six KMAR vessels. EPS in Fiscal 2007 is exclusive of $.37 per share of after
tax gains from the sale of 14 offshore tugs. EPS in Fiscal 2010 is
exclusive of $.66 per share Venezuelan provision, a $.70 per share tax benefit
related to favorable resolution of tax litigation and a $0.22 per share charge for
the proposed settlement with the SEC of the company’s FCPA matter. EPS in Fiscal
2011 is exclusive of total $0.21 per share charges for settlements with DOJ
and Government of Nigeria for FCPA matters, a $0.08 per share charge related to participation in a multi-company U.K.-based pension plan and a $0.06
per share impairment charge related to certain vessels. EPS in Fiscal 2012 is
exclusive of $0.43 per share goodwill impairment charge. EPS in Fiscal 2014 is
exclusive of $0.87 per share goodwill impairment charge.
Adjusted Return
On Avg. Equity 4.3% 7.2%
12.4%
18.9% 18.3%
19.5% 11.4% 5.0%
4.3% 5.9% 7.0%
Adjusted EPS**
History of Earnings Growth & Solid
Through-Cycle Return
GHS 100 Energy Conference
17 |
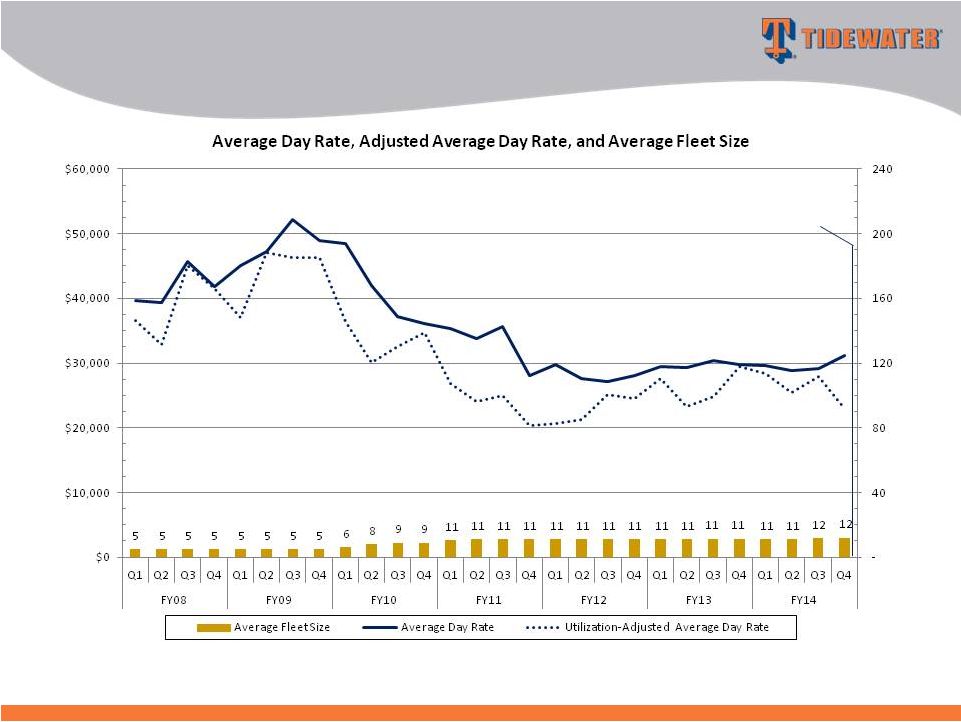
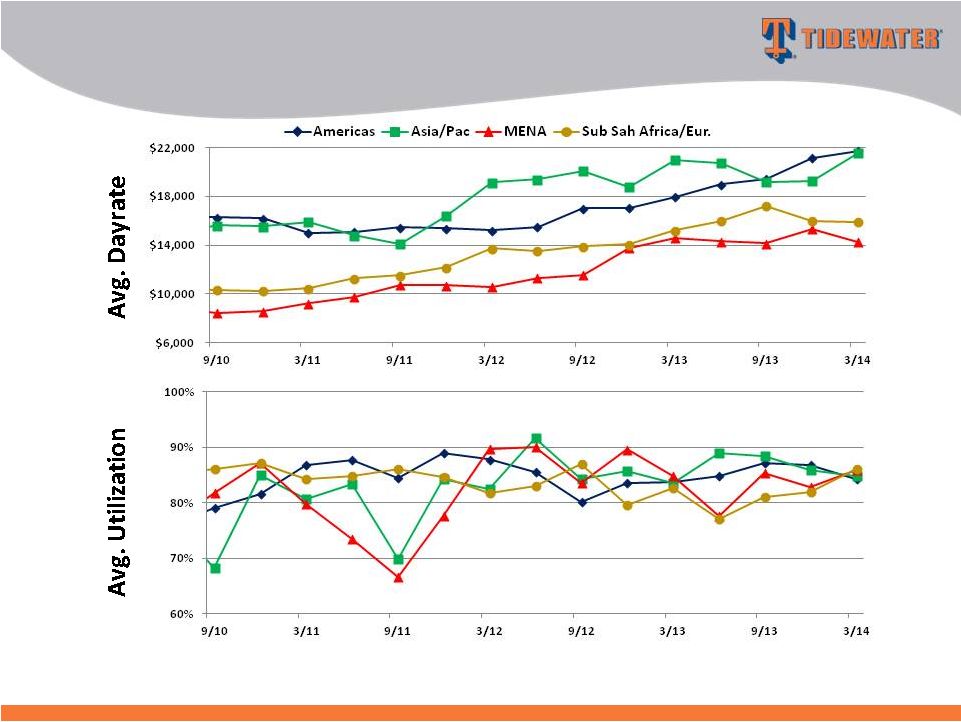 Impact of $7.4
million of retroactive revenue recorded in September 2012 quarter is excluded from 9/12 average dayrates and
included in the respective March 2012 and June 2012 quarterly average dayrates. Utilization
stats exclude stacked vessels. Active Vessel Dayrates & Utilization by Segment
GHS 100 Energy Conference
18 |
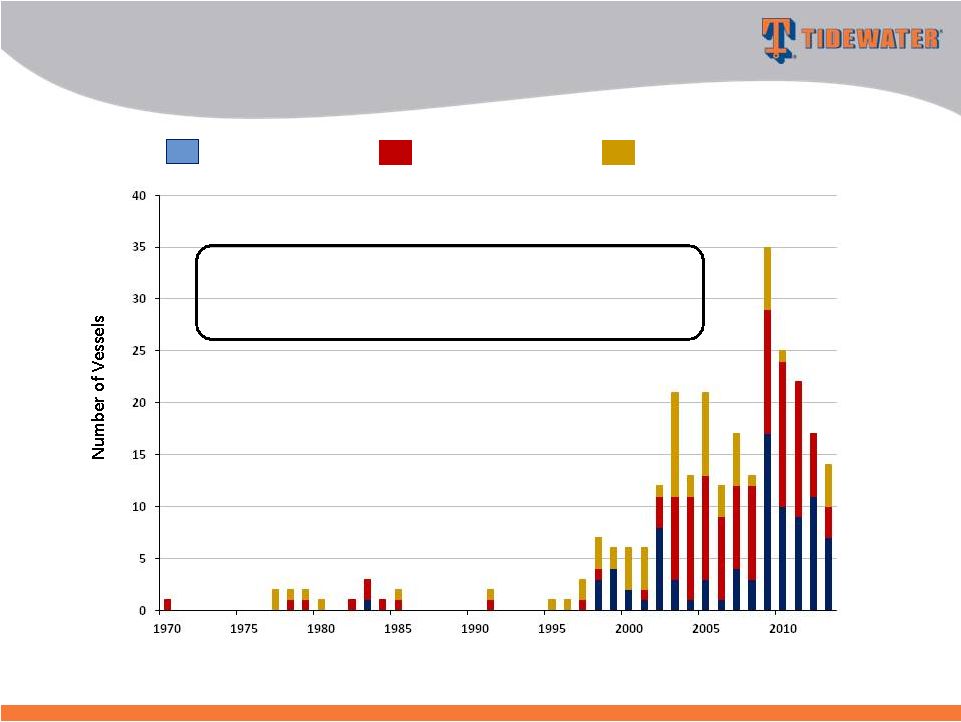
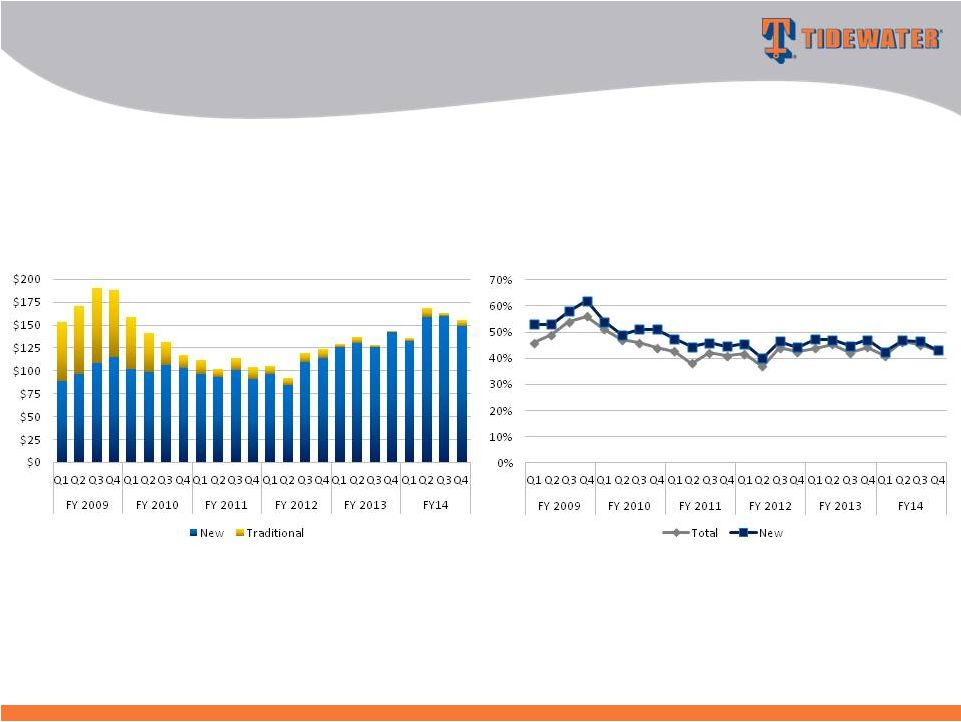
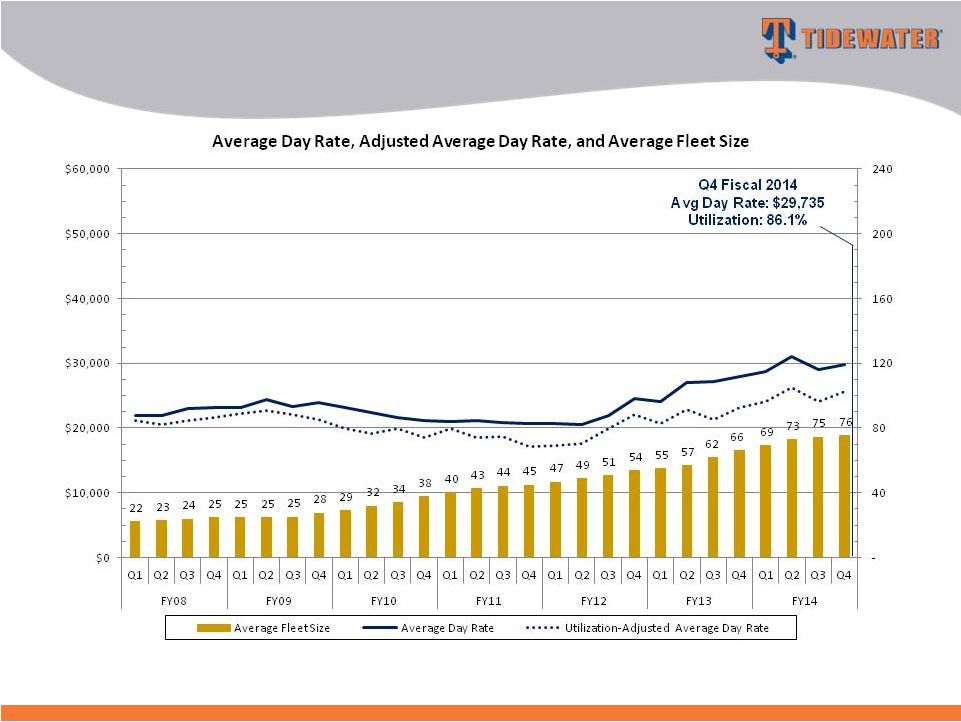 $174 million, or 48%, of Vessel Revenue in Q4 Fiscal 2014
New Vessel Trends by Vessel Type
Deepwater PSVs
GHS 100 Energy Conference
19 |
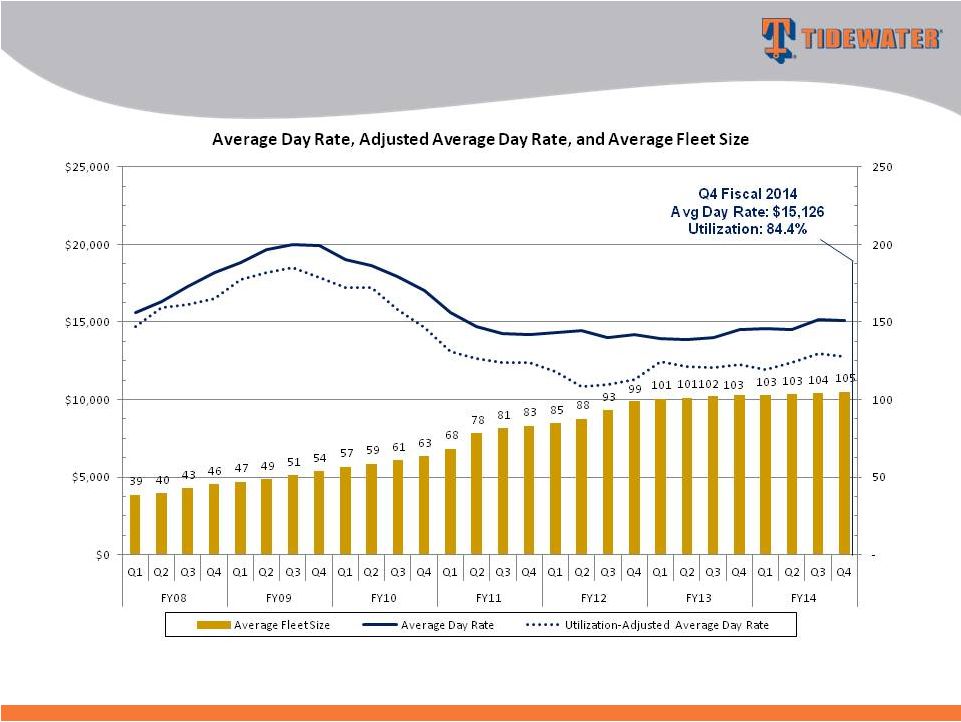 $121 million, or 33%, of Vessel Revenue in Q4 Fiscal 2014
New Vessel Trends by Vessel Type
Towing Supply/Supply Vessels
GHS 100 Energy Conference
20 |
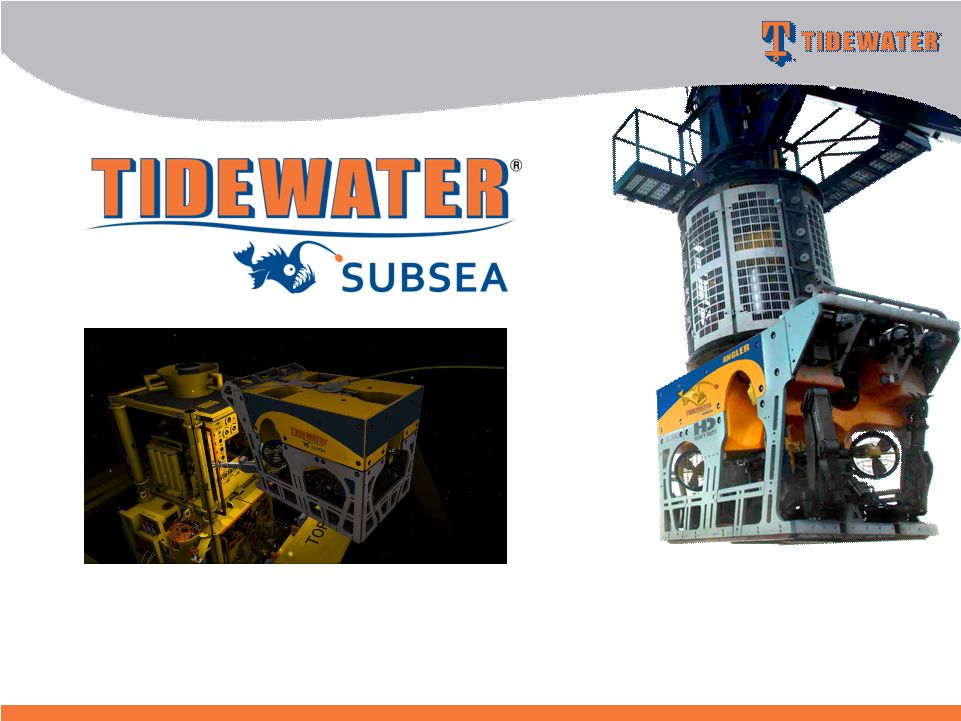 Recent delivery
of six work-class remotely operated vehicles (ROV)
Tidewater’s New Subsea Business
GHS 100 Energy Conference
21 |
 •
Continue to improve upon stellar safety and compliance programs
•
Maintain solid balance sheet and financial flexibility to deal with
industry uncertainties and seize opportunities when presented
•
Disciplined deployment of cash to expand vessel and ROV
fleet capabilities
•
Return capital to shareholders through dividends and
opportunistic share repurchases
Tidewater’s Future
GHS 100 Energy Conference
22 |
 GHS 100 Energy
Conference June 25, 2014
Quinn P. Fanning
EVP & CFO
Joseph M. Bennett
EVP & Chief IRO |
 Appendix
GHS 100 Energy Conference
24 |
 Maintain
Financial Strength
Financial Strength
EVA-Based Investments
EVA-Based Investments
On Through-cycle Basis
On Through-cycle Basis
Deliver Results
Deliver Results
Financial Strategy Focused on Creating
Long-Term Shareholder Value
GHS 100 Energy Conference
25 |
 $25
million, or 7%, of Vessel Revenue in Q4 Fiscal 2014 New Vessel Trends by Vessel Type
Deepwater AHTS
GHS 100 Energy Conference
26
Q4 Fiscal 2014
Avg Day Rate: $31,158
Utilization: 73.9% |
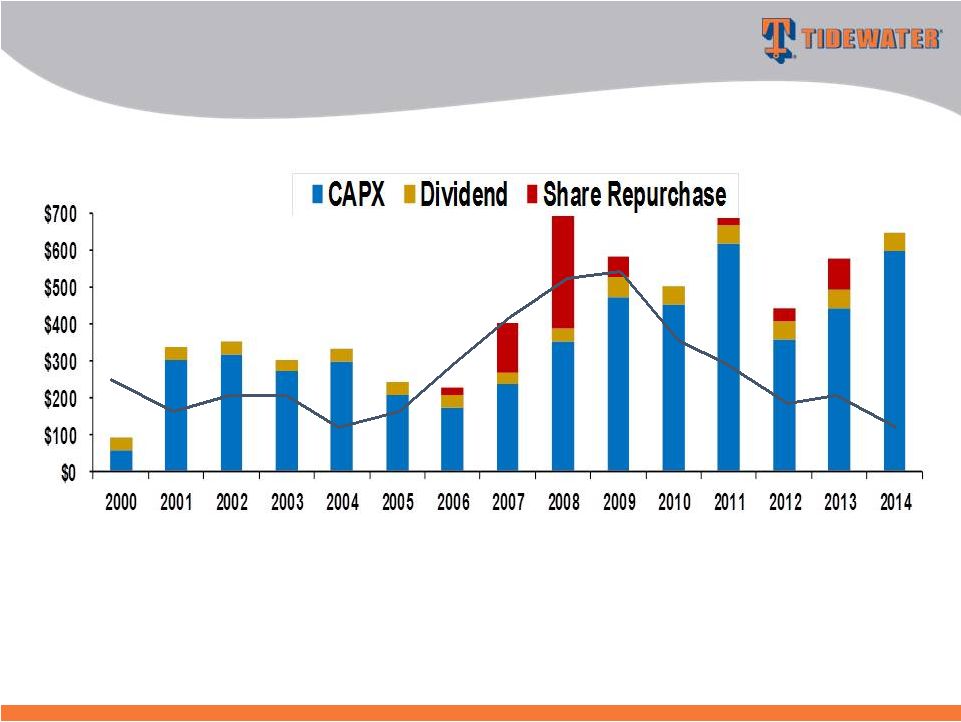 Over
a 15-year period, Tidewater has invested ~$5.2 billion in CapEx, and paid out ~$1.3 billion through
dividends and share repurchases. Over the same period, CFFO and
proceeds from dispositions were ~$3.9
billion and ~$800 million, respectively.
$ in millions
CFFO
Fiscal Year
Fleet Renewal & Expansion Largely
Funded by CFFO
GHS 100 Energy Conference
27 |
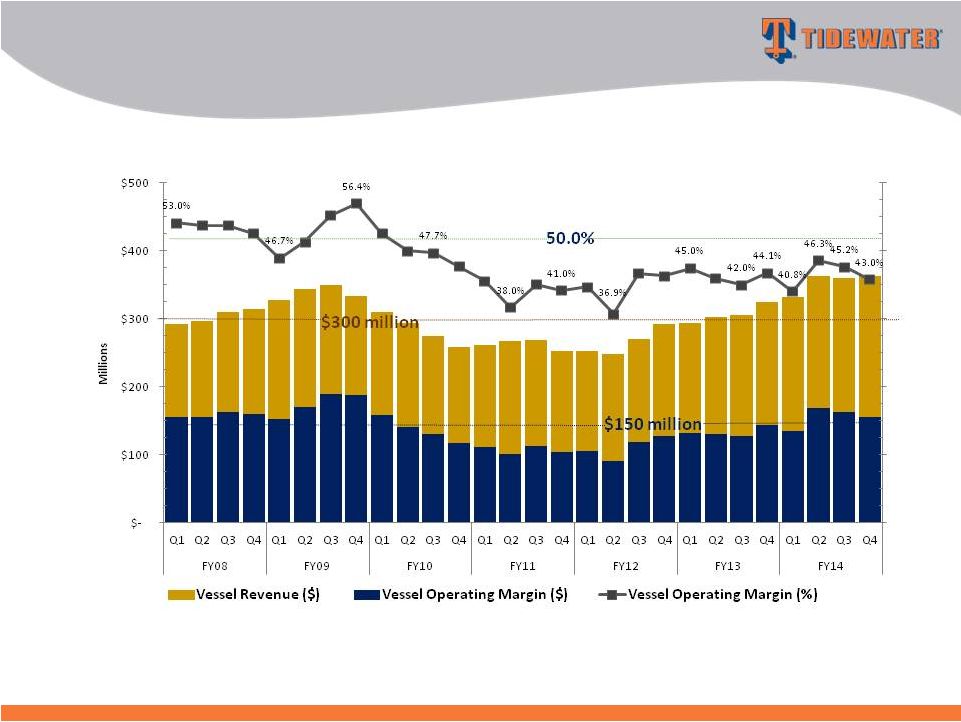 Note: Vessel operating margin is defined as vessel revenue less
vessel operating expenses
Prior peak period (FY2009)
averaged quarterly revenue of
$339M, quarter operating
margin of $175.6M at 51.8%
Total Revenue and Margin
Fiscal 2008-2014
GHS 100 Energy Conference
28 |
 Vessel Cash Operating Margin ($)
Vessel Cash Operating Margin (%)
$156 million Vessel Margin in Q4
FY2014 (96% from New Vessels)
Q4 FY2014 Vessel Margin: 43%
Cyclical Upturn should Drive Margin Expansion
GHS 100 Energy Conference
29 |
 Super Majors
37%
NOC's
22%
Others
41%
Our top 10 customers in Fiscal 2014 (4 Super Majors, 4 NOC’s,
1 IOC’s and 1 independent) accounted for 62% of our revenue
Current Revenue Mix
Quality of Customer Base
GHS 100 Energy Conference
30 |