Attached files
| file | filename |
|---|---|
| 8-K - 8-K - StoneX Group Inc. | a8-kinvestorpresentationdoc.htm |
INVESTOR PRESENTATION June 2014
Disclaimer 2 The following presentation should be taken in conjunction with the most recent financial statements and notes thereto as well as the most recent Form 10-Q or 10-K filed with the SEC. This presentation may contain "forward-looking statements" within the meaning of Section 27A of the Securities Act of 1933 and Section 21E of the Securities Exchange Act of 1934. These forward-looking statements involve known and unknown risks and uncertainties, many of which are beyond the Company's control, including adverse changes in economic, political and market conditions, losses from the Company's market-making and trading activities arising from counter-party failures and changes in market conditions, the possible loss of key personnel, the impact of increasing competition, the impact of changes in government regulation, the possibility of liabilities arising from violations of federal and state securities laws and the impact of changes in technology in the securities, foreign exchange and commodities dealing and trading industries. Although the Company believes that its forward-looking statements are based upon reasonable assumptions regarding its business, future market conditions, there can be no assurances that the Company's actual results will not differ materially from any results expressed or implied by the Company's forward-looking statements. The Company undertakes no obligation to publicly update or revise any forward-looking statements, whether as a result of new information, future events or otherwise. Readers are cautioned that any forward-looking statements are not guarantees of future performance. Adjusted operating revenues, adjusted net income, adjusted EBITDA and adjusted stockholders’ equity are financial measures that are not recognized by U.S. GAAP, and should not be considered as alternatives to operating revenues, net income or stockholders’ equity calculated under U.S. GAAP or as an alternative to any other measures of performance derived in accordance with U.S. GAAP. The Company has included these non-GAAP financial measures because it believes that they permit investors to make more meaningful comparisons of performance between the periods presented. In addition, these non-GAAP measures are used by management in evaluating the Company’s performance. The appendix to this presentation reflects all reconciling items between the GAAP and non-GAAP measures presented. For a full discussion of management’s reasons for disclosing these adjustments, see ‘Item 7. Management’s Discussion and Analysis of Financial Condition and Results of Operations’ in the Form 10-K for the fiscal year ended September 30, 2013.
INTL FCStone Inc. is a pioneer in specialized financial services that opens markets for underserved mid-market clients with insight, guidance and access. 3
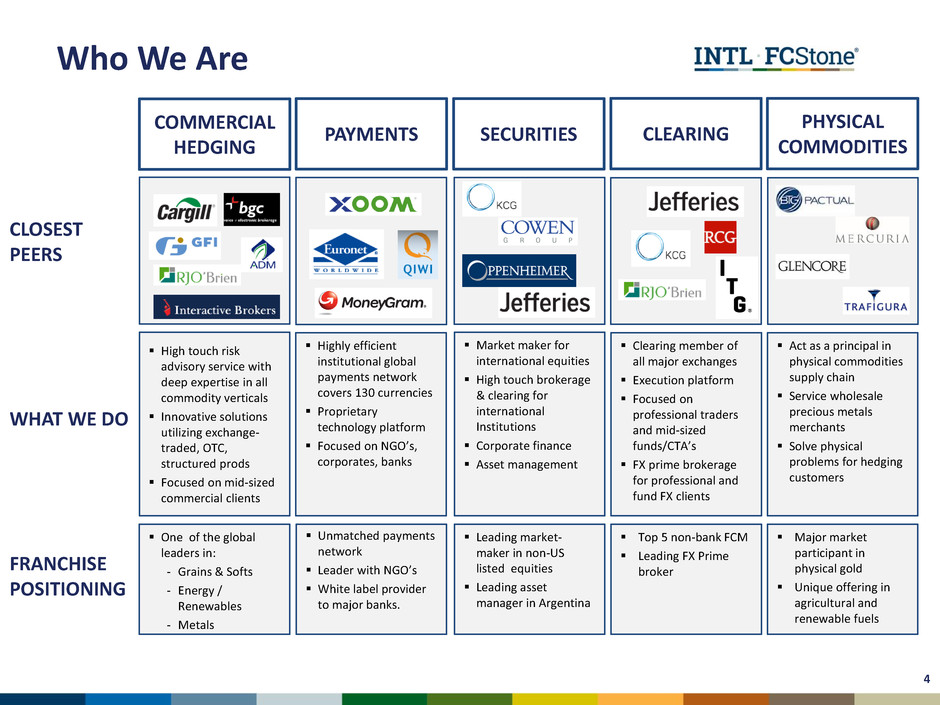
Who We Are CLOSEST PEERS WHAT WE DO FRANCHISE POSITIONING One of the global leaders in: - Grains & Softs - Energy / Renewables - Metals COMMERCIAL HEDGING High touch risk advisory service with deep expertise in all commodity verticals Innovative solutions utilizing exchange- traded, OTC, structured prods Focused on mid-sized commercial clients Unmatched payments network Leader with NGO’s White label provider to major banks. PAYMENTS Highly efficient institutional global payments network covers 130 currencies Proprietary technology platform Focused on NGO’s, corporates, banks Leading market- maker in non-US listed equities Leading asset manager in Argentina SECURITIES Market maker for international equities High touch brokerage & clearing for international Institutions Corporate finance Asset management Top 5 non-bank FCM Leading FX Prime broker Clearing member of all major exchanges Execution platform Focused on professional traders and mid-sized funds/CTA’s FX prime brokerage for professional and fund FX clients CLEARING Major market participant in physical gold Unique offering in agricultural and renewable fuels PHYSICAL COMMODITIES Act as a principal in physical commodities supply chain Service wholesale precious metals merchants Solve physical problems for hedging customers 4
We Open Markets For Our Clients 1. CLIENTS FIRST – ALWAYS We know that every dollar of revenue starts with a client and will protect that relationship at all costs. We do not trade against or in front of our clients or use client information in an inappropriate manner. 2. INTEGRITY AND HONESTY IN ALL WE DO Reputation and trust is our most valuable and treasured asset. 3. SPECIALTY EXPERTISE DELIVERS VALUE We justify our role every day by adding value to our clients through our high touch service, our expertise and advice and providing our clients with transparent and efficient access to liquidity in the global markets. 4. LASTING CUSTOMER RELATIONSHIPS We seek to develop deep and lasting partnerships with our clients. 5. GLOBAL PERSPECTIVE For us there are no foreign markets – we offer a global perspective to our clients. 6. LONG TERM FOCUS We believe in the creation of long term shareholder value over short term results. Our Values 5
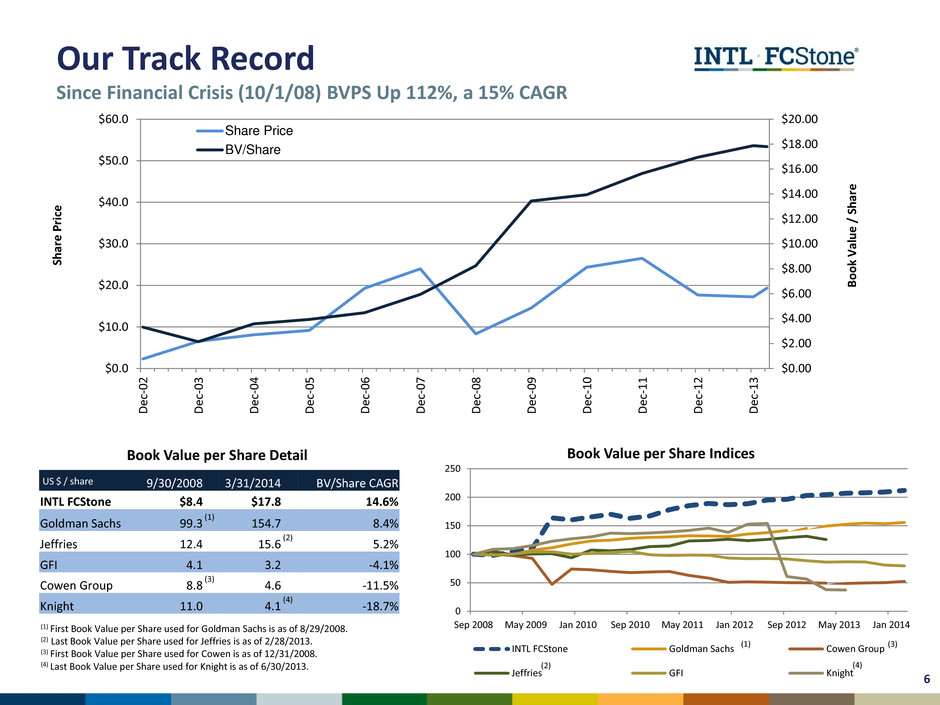
0 50 100 150 200 250 Sep 2008 May 2009 Jan 2010 Sep 2010 May 2011 Jan 2012 Sep 2012 May 2013 Jan 2014 Book Value per Share Indices INTL FCStone Goldman Sachs Cowen Group Jeffries GFI Knight Our Track Record Since Financial Crisis (10/1/08) BVPS Up 112%, a 15% CAGR US $ / share 9/30/2008 3/31/2014 BV/Share CAGR INTL FCStone $8.4 $17.8 14.6% Goldman Sachs 99.3 (1) 154.7 8.4% Jeffries 12.4 15.6 (2) 5.2% GFI 4.1 3.2 -4.1% Cowen Group 8.8 (3) 4.6 -11.5% Knight 11.0 4.1 (4) -18.7% (1) First Book Value per Share used for Goldman Sachs is as of 8/29/2008. (2) Last Book Value per Share used for Jeffries is as of 2/28/2013. (3) First Book Value per Share used for Cowen is as of 12/31/2008. (4) Last Book Value per Share used for Knight is as of 6/30/2013. Book Value per Share Detail (1) (2) (3) (4) $0.00 $2.00 $4.00 $6.00 $8.00 $10.00 $12.00 $14.00 $16.00 $18.00 $20.00 $0.0 $10.0 $20.0 $30.0 $40.0 $50.0 $60.0 D e c- 0 2 D e c- 0 3 D e c- 0 4 D e c- 0 5 D e c- 0 6 D e c- 0 7 D e c- 0 8 D e c- 0 9 D e c- 1 0 D e c- 1 1 D e c- 1 2 D e c- 1 3 B o o k Va lu e / S h ar e Sh ar e P ri ce Share Price BV/Share 6
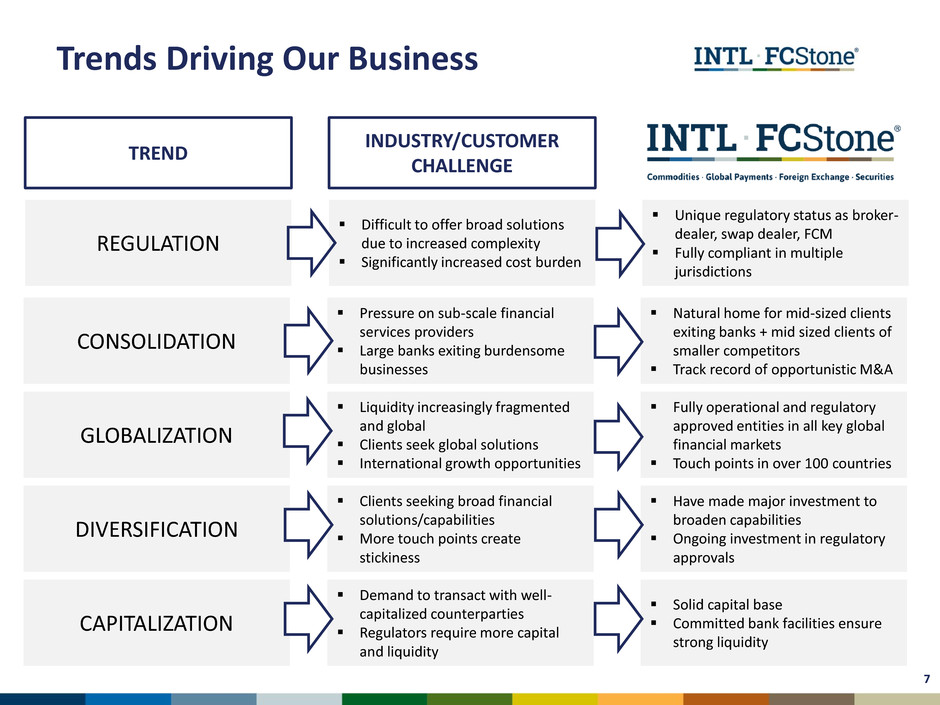
Trends Driving Our Business Difficult to offer broad solutions due to increased complexity Significantly increased cost burden INDUSTRY/CUSTOMER CHALLENGE Unique regulatory status as broker- dealer, swap dealer, FCM Fully compliant in multiple jurisdictions REGULATION Pressure on sub-scale financial services providers Large banks exiting burdensome businesses Natural home for mid-sized clients exiting banks + mid sized clients of smaller competitors Track record of opportunistic M&A CONSOLIDATION Liquidity increasingly fragmented and global Clients seek global solutions International growth opportunities Fully operational and regulatory approved entities in all key global financial markets Touch points in over 100 countries GLOBALIZATION Demand to transact with well- capitalized counterparties Regulators require more capital and liquidity Solid capital base Committed bank facilities ensure strong liquidity CAPITALIZATION TREND Clients seeking broad financial solutions/capabilities More touch points create stickiness Have made major investment to broaden capabilities Ongoing investment in regulatory approvals DIVERSIFICATION 7
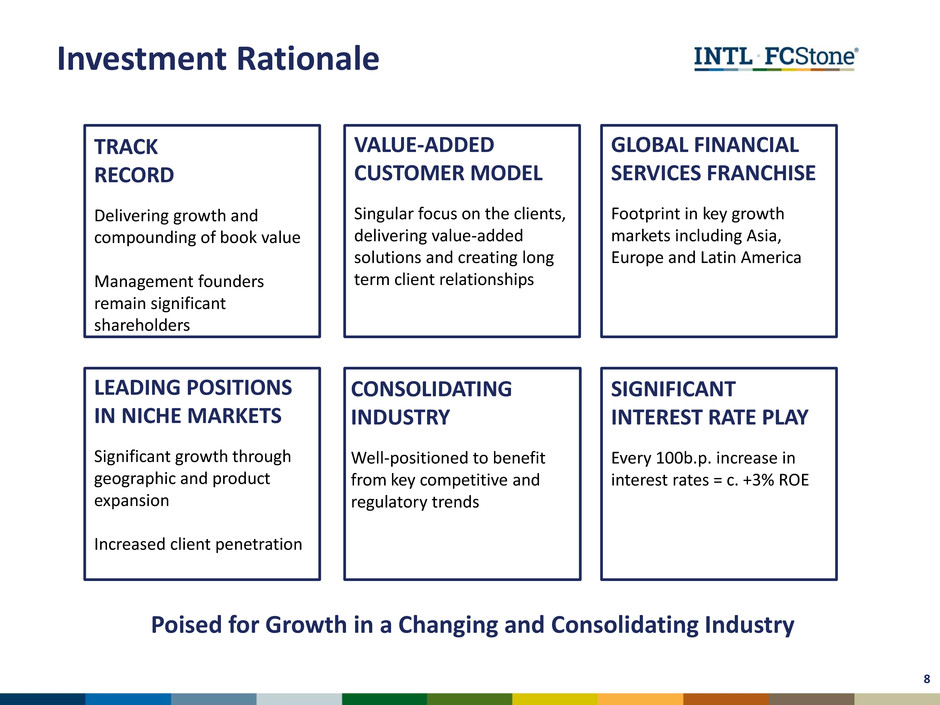
LEADING POSITIONS IN NICHE MARKETS Significant growth through geographic and product expansion Increased client penetration SIGNIFICANT INTEREST RATE PLAY Every 100b.p. increase in interest rates = c. +3% ROE Investment Rationale Poised for Growth in a Changing and Consolidating Industry TRACK RECORD Delivering growth and compounding of book value Management founders remain significant shareholders VALUE-ADDED CUSTOMER MODEL Singular focus on the clients, delivering value-added solutions and creating long term client relationships GLOBAL FINANCIAL SERVICES FRANCHISE Footprint in key growth markets including Asia, Europe and Latin America CONSOLIDATING INDUSTRY Well-positioned to benefit from key competitive and regulatory trends 8
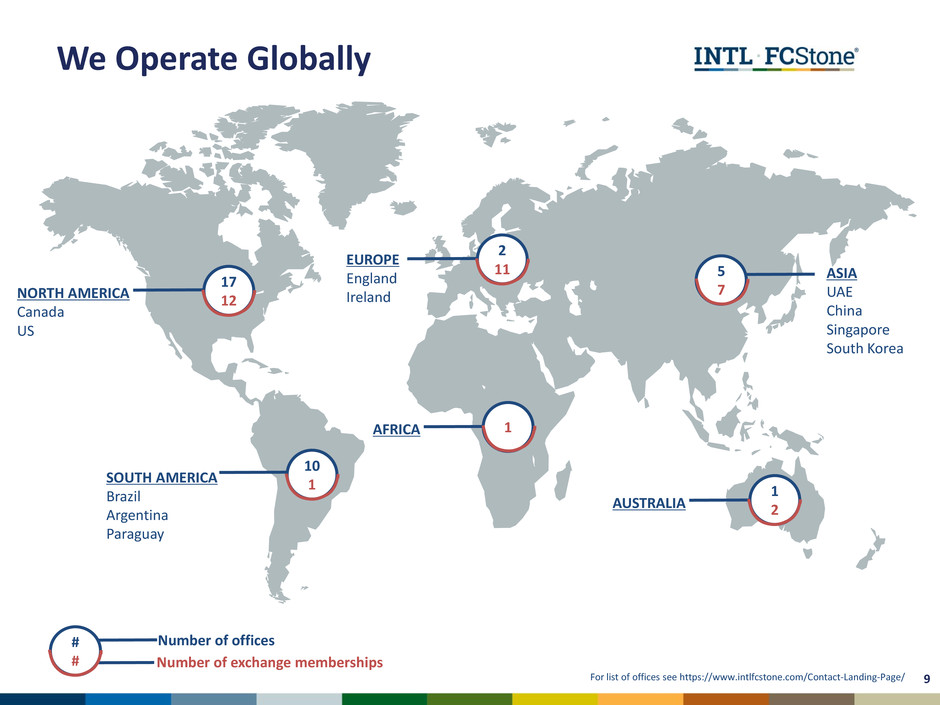
We Operate Globally NORTH AMERICA Canada US SOUTH AMERICA Brazil Argentina Paraguay EUROPE England Ireland ASIA UAE China Singapore South Korea AUSTRALIA 17 12 10 1 2 11 5 7 1 2 Number of offices # # Number of exchange memberships For list of offices see https://www.intlfcstone.com/Contact-Landing-Page/ AFRICA 1 9
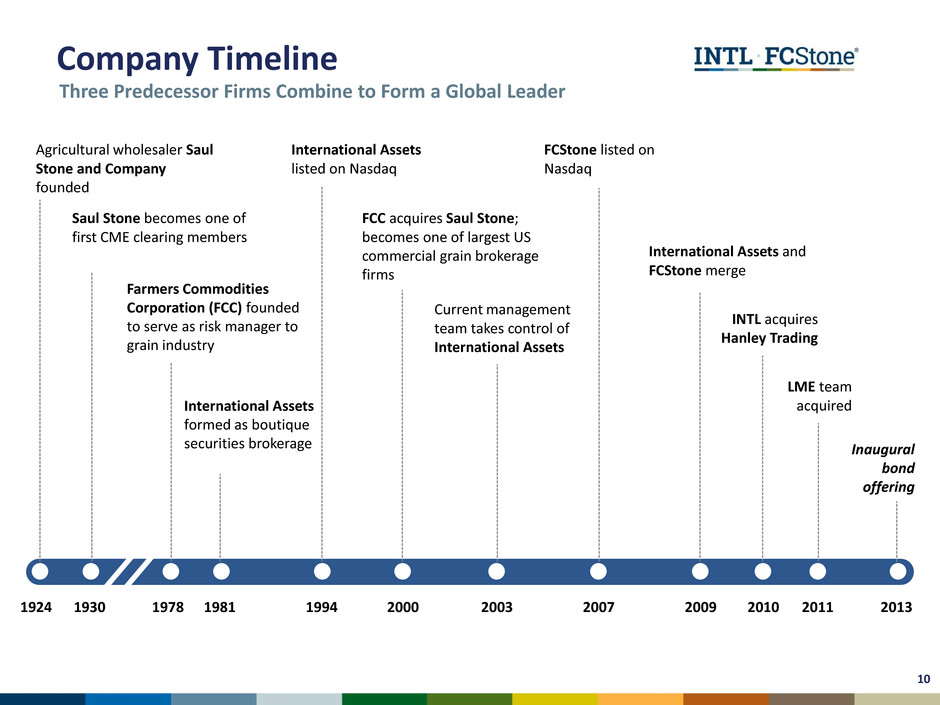
Three Predecessor Firms Combine to Form a Global Leader 1924 2013 1930 1978 1981 1994 2000 2003 2007 2011 2010 2009 Agricultural wholesaler Saul Stone and Company founded Saul Stone becomes one of first CME clearing members Farmers Commodities Corporation (FCC) founded to serve as risk manager to grain industry International Assets formed as boutique securities brokerage International Assets listed on Nasdaq FCC acquires Saul Stone; becomes one of largest US commercial grain brokerage firms Current management team takes control of International Assets FCStone listed on Nasdaq International Assets and FCStone merge INTL acquires Hanley Trading LME team acquired Inaugural bond offering Company Timeline 10
Our Business Segments
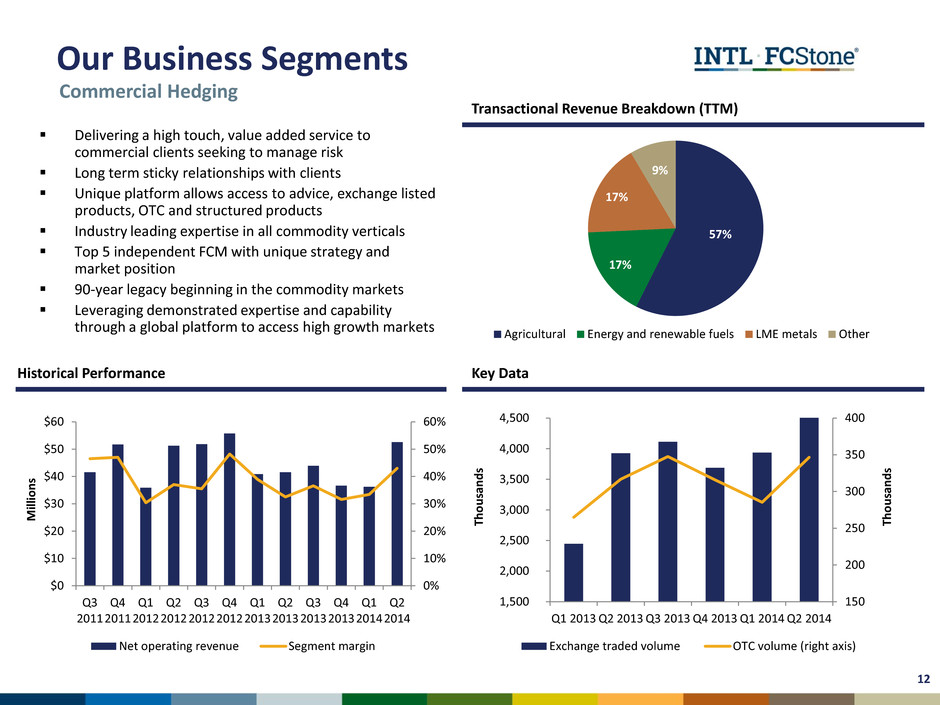
150 200 250 300 350 400 1,500 2,000 2,500 3,000 3,500 4,000 4,500 Q1 2013 Q2 2013 Q3 2013 Q4 2013 Q1 2014 Q2 2014 Th o u sa n d s Th o u sa n d s Exchange traded volume OTC volume (right axis) 0% 10% 20% 30% 40% 50% 60% Q3 2011 Q4 2011 Q1 2012 Q2 2012 Q3 2012 Q4 2012 Q1 2013 Q2 2013 Q3 2013 Q4 2013 Q1 2014 Q2 2014 $0 $10 $20 $30 $40 $50 $60 M ill io n s Net operating revenue Segment margin Historical Performance Key Data Delivering a high touch, value added service to commercial clients seeking to manage risk Long term sticky relationships with clients Unique platform allows access to advice, exchange listed products, OTC and structured products Industry leading expertise in all commodity verticals Top 5 independent FCM with unique strategy and market position 90-year legacy beginning in the commodity markets Leveraging demonstrated expertise and capability through a global platform to access high growth markets Transactional Revenue Breakdown (TTM) 57% 17% 17% 9% Agricultural Energy and renewable fuels LME metals Other Our Business Segments Commercial Hedging 12
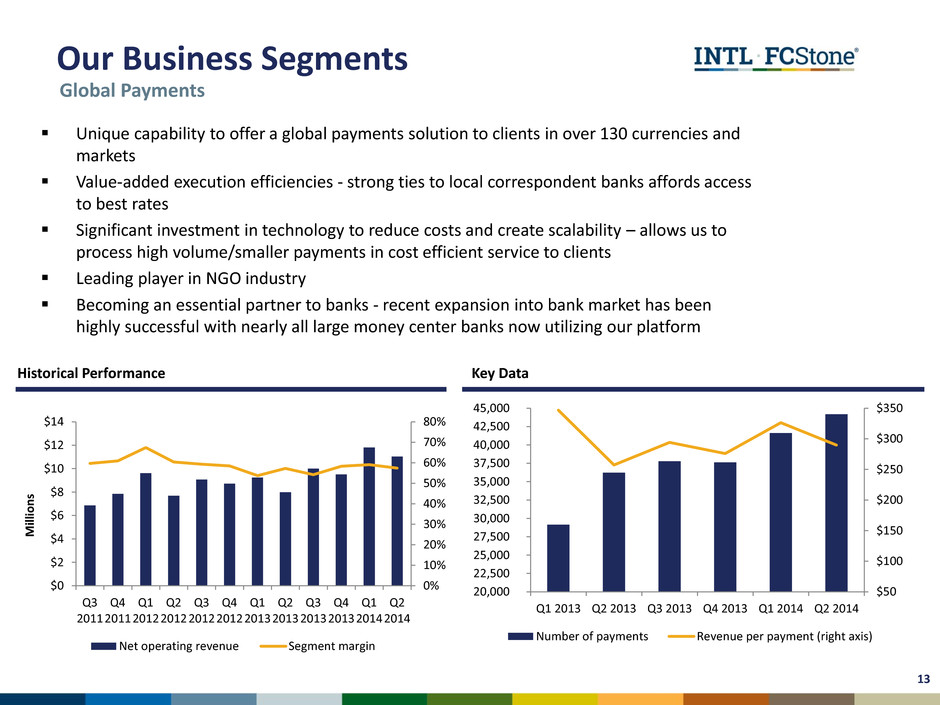
Unique capability to offer a global payments solution to clients in over 130 currencies and markets Value-added execution efficiencies - strong ties to local correspondent banks affords access to best rates Significant investment in technology to reduce costs and create scalability – allows us to process high volume/smaller payments in cost efficient service to clients Leading player in NGO industry Becoming an essential partner to banks - recent expansion into bank market has been highly successful with nearly all large money center banks now utilizing our platform Global Payments $50 $100 $150 $200 $250 $300 $350 20,000 22,500 25,000 27,500 30,000 32,500 35,000 37,500 40,000 42,500 45,000 Q1 2013 Q2 2013 Q3 2013 Q4 2013 Q1 2014 Q2 2014 Number of payments Revenue per payment (right axis) Historical Performance Key Data $0 $2 $4 $6 $8 $10 $12 $14 Q3 2011 Q4 2011 Q1 2012 Q2 2012 Q3 2012 Q4 2012 Q1 2013 Q2 2013 Q3 2013 Q4 2013 Q1 2014 Q2 2014 0% 10% 20% 30% 40% 50% 60% 70% 80% M ill io n s Net operating revenue Segment margin Our Business Segments 13
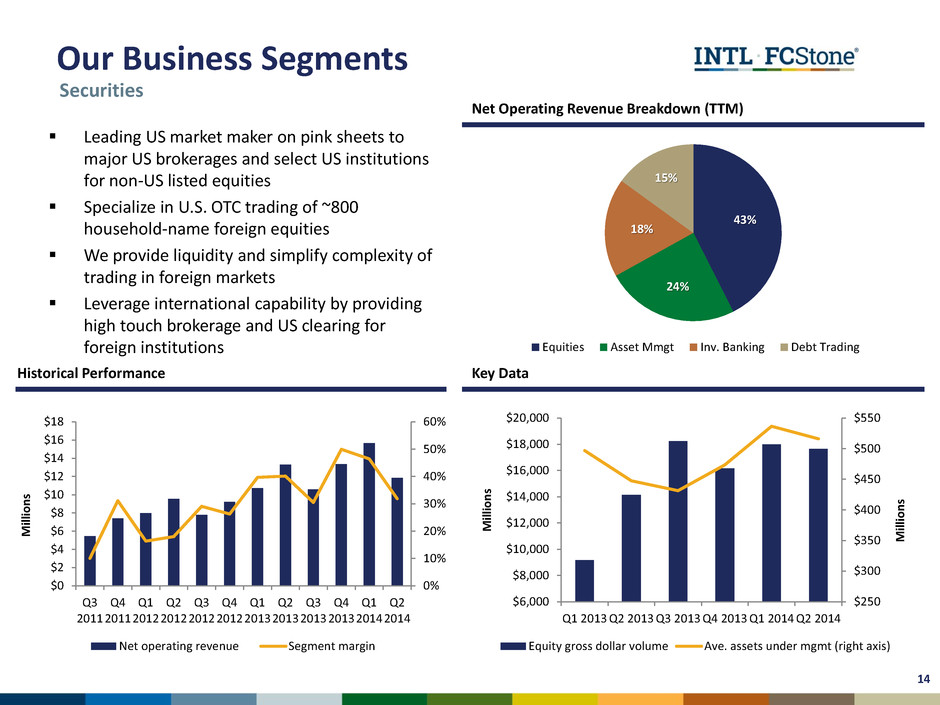
Leading US market maker on pink sheets to major US brokerages and select US institutions for non-US listed equities Specialize in U.S. OTC trading of ~800 household-name foreign equities We provide liquidity and simplify complexity of trading in foreign markets Leverage international capability by providing high touch brokerage and US clearing for foreign institutions Historical Performance Key Data $250 $300 $350 $400 $450 $500 $550 $6,000 $8,000 $10,000 $12,000 $14,000 $16,000 $18,000 $20,000 Q1 2013 Q2 2013 Q3 2013 Q4 2013 Q1 2014 Q2 2014 M ill io n s M ill io n s Equity gross dollar volume Ave. assets under mgmt (right axis) $0 $2 $4 $6 $8 $10 $12 $14 $16 $18 Q3 2011 Q4 2011 Q1 2012 Q2 2012 Q3 2012 Q4 2012 Q1 2013 Q2 2013 Q3 2013 Q4 2013 Q1 2014 Q2 2014 0% 10% 20% 30% 40% 50% 60% M ill io n s Net operating revenue Segment margin Net Operating Revenue Breakdown (TTM) Securities Our Business Segments 14 43% 24% 18% 15% Equities Asset Mmgt Inv. Banking Debt Trading
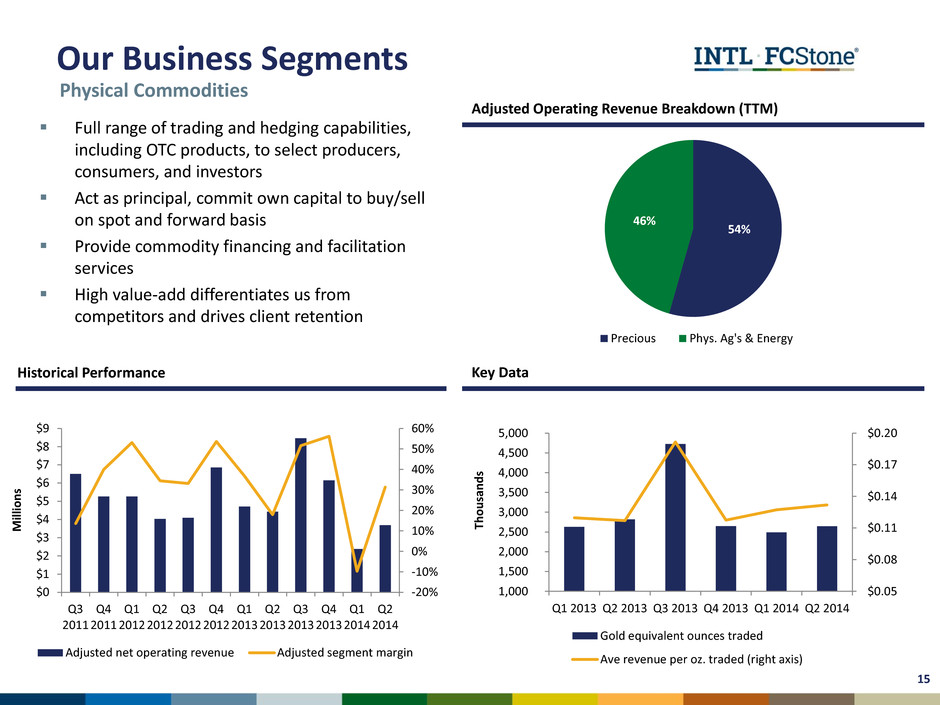
Full range of trading and hedging capabilities, including OTC products, to select producers, consumers, and investors Act as principal, commit own capital to buy/sell on spot and forward basis Provide commodity financing and facilitation services High value-add differentiates us from competitors and drives client retention Historical Performance Key Data $0.05 $0.08 $0.11 $0.14 $0.17 $0.20 Q1 2013 Q2 2013 Q3 2013 Q4 2013 Q1 2014 Q2 2014 1,000 1,500 2,000 2,500 3,000 3,500 4,000 4,500 5,000 Th o u sa n d s Gold equivalent ounces traded Ave revenue per oz. traded (right axis) Adjusted Operating Revenue Breakdown (TTM) 54% 46% Precious Phys. Ag's & Energy $0 $1 $2 $3 $4 $5 $6 $7 $8 $9 Q3 2011 Q4 2011 Q1 2012 Q2 2012 Q3 2012 Q4 2012 Q1 2013 Q2 2013 Q3 2013 Q4 2013 Q1 2014 Q2 2014 -20% -10% 0% 10% 20% 30% 40% 50% 60% M ill io n s Adjusted net operating revenue Adjusted segment margin Physical Commodities Our Business Segments 15
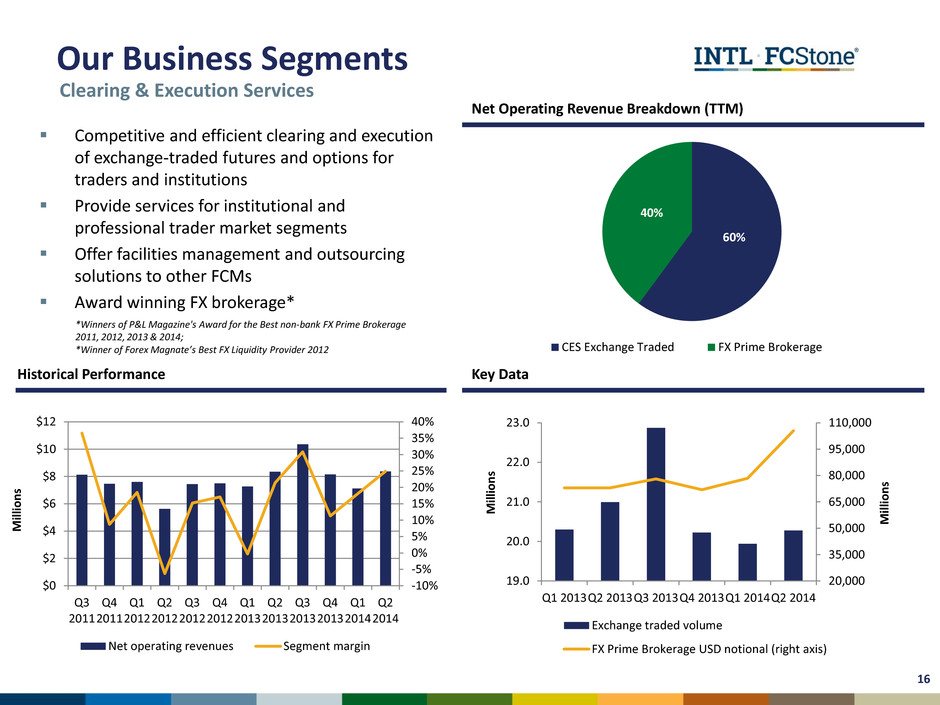
Competitive and efficient clearing and execution of exchange-traded futures and options for traders and institutions Provide services for institutional and professional trader market segments Offer facilities management and outsourcing solutions to other FCMs Award winning FX brokerage* Historical Performance Key Data -10% -5% 0% 5% 10% 15% 20% 25% 30% 35% 40% $0 $2 $4 $6 $8 $10 $12 Q3 2011 Q4 2011 Q1 2012 Q2 2012 Q3 2012 Q4 2012 Q1 2013 Q2 2013 Q3 2013 Q4 2013 Q1 2014 Q2 2014 M ill io n s Net operating revenues Segment margin 20,000 35,000 50,000 65,000 80,000 95,000 110,000 19.0 20.0 21.0 22.0 23.0 Q1 2013Q2 2013Q3 2013Q4 2013Q1 2014Q2 2014 M ill io n s M ill io n s Exchange traded volume FX Prime Brokerage USD notional (right axis) Net Operating Revenue Breakdown (TTM) 60% 40% CES Exchange Traded FX Prime Brokerage *Winners of P&L Magazine's Award for the Best non-bank FX Prime Brokerage 2011, 2012, 2013 & 2014; *Winner of Forex Magnate’s Best FX Liquidity Provider 2012 Clearing & Execution Services Our Business Segments 16
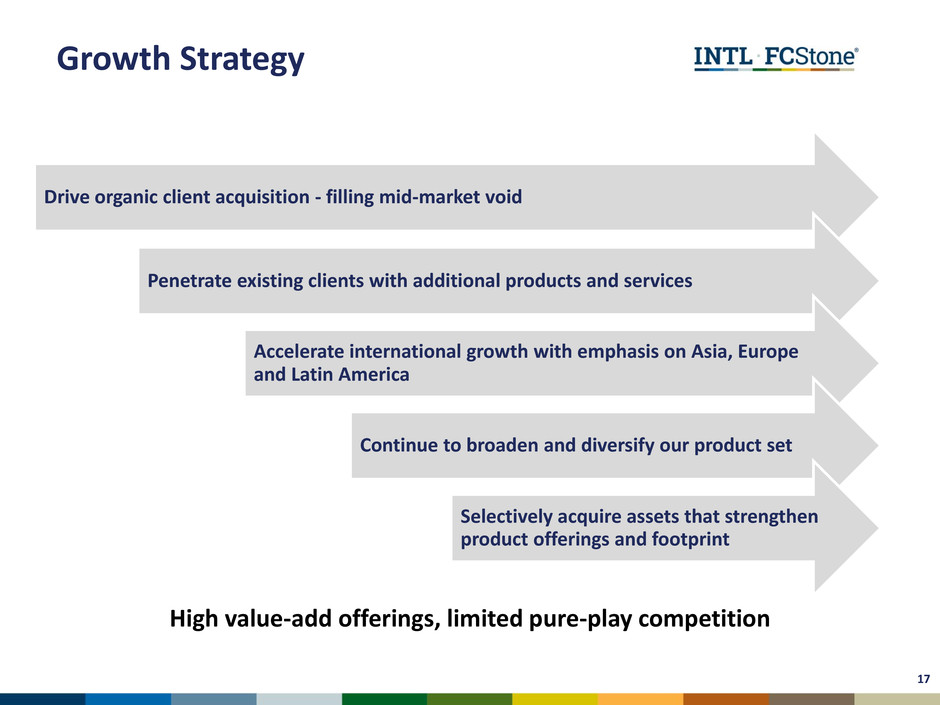
Growth Strategy Drive organic client acquisition - filling mid-market void Penetrate existing clients with additional products and services Accelerate international growth with emphasis on Asia, Europe and Latin America Continue to broaden and diversify our product set Selectively acquire assets that strengthen product offerings and footprint 17 High value-add offerings, limited pure-play competition
Financials
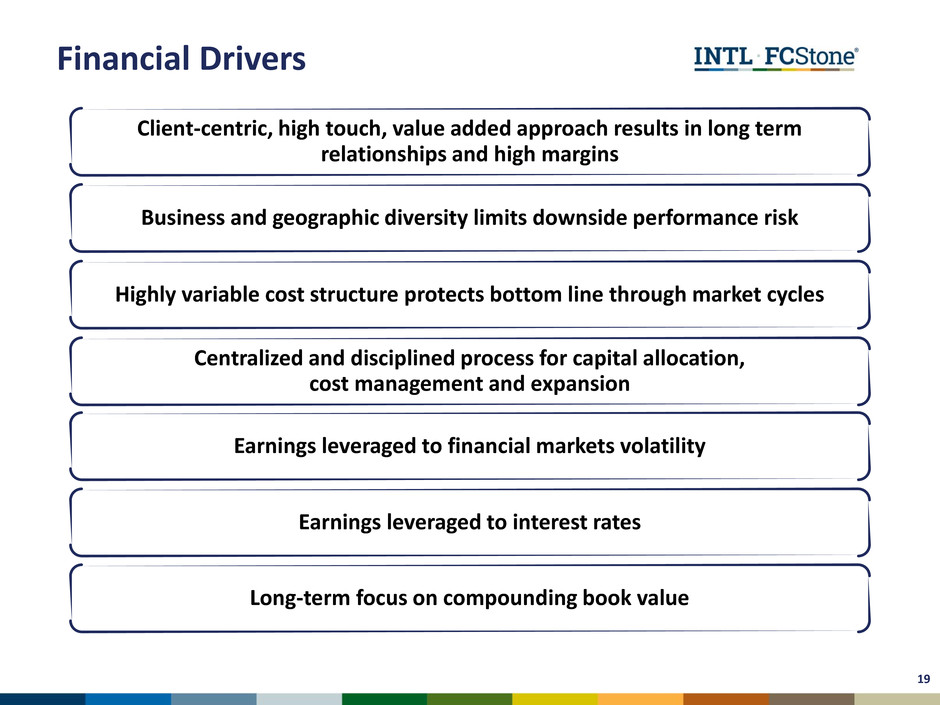
Client-centric, high touch, value added approach results in long term relationships and high margins Business and geographic diversity limits downside performance risk Highly variable cost structure protects bottom line through market cycles Centralized and disciplined process for capital allocation, cost management and expansion Earnings leveraged to financial markets volatility Earnings leveraged to interest rates Long-term focus on compounding book value Financial Drivers 19
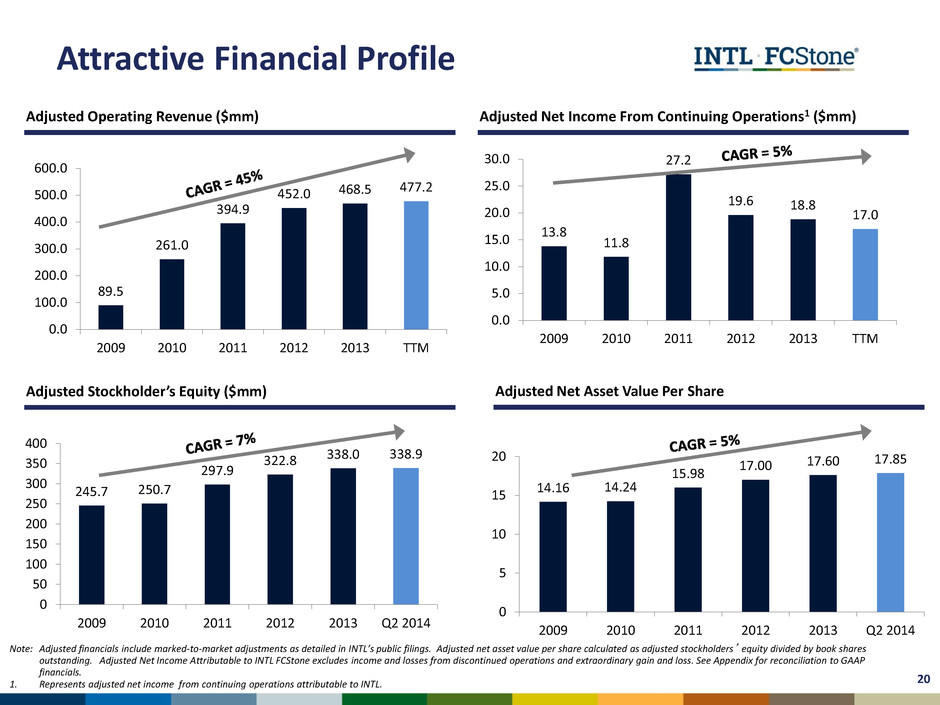
245.7 250.7 297.9 322.8 338.0 338.9 0 50 100 150 200 250 300 350 400 2009 2010 2011 2012 2013 Q2 2014 89.5 261.0 394.9 452.0 468.5 477.2 0.0 100.0 200.0 300.0 400.0 500.0 600.0 2009 2010 2011 2012 2013 TTM 13.8 11.8 27.2 19.6 18.8 17.0 0.0 5.0 10.0 15.0 20.0 25.0 30.0 2009 2010 2011 2012 2013 TTM 14.16 14.24 15.98 17.00 17.60 17.85 0 5 10 15 20 2009 2010 2011 2012 2013 Q2 2014 Note: Adjusted financials include marked-to-market adjustments as detailed in INTL’s public filings. Adjusted net asset value per share calculated as adjusted stockholders’ equity divided by book shares outstanding. Adjusted Net Income Attributable to INTL FCStone excludes income and losses from discontinued operations and extraordinary gain and loss. See Appendix for reconciliation to GAAP financials. 1. Represents adjusted net income from continuing operations attributable to INTL. Adjusted Operating Revenue ($mm) Adjusted Net Income From Continuing Operations1 ($mm) Adjusted Stockholder’s Equity ($mm) Adjusted Net Asset Value Per Share Attractive Financial Profile 20
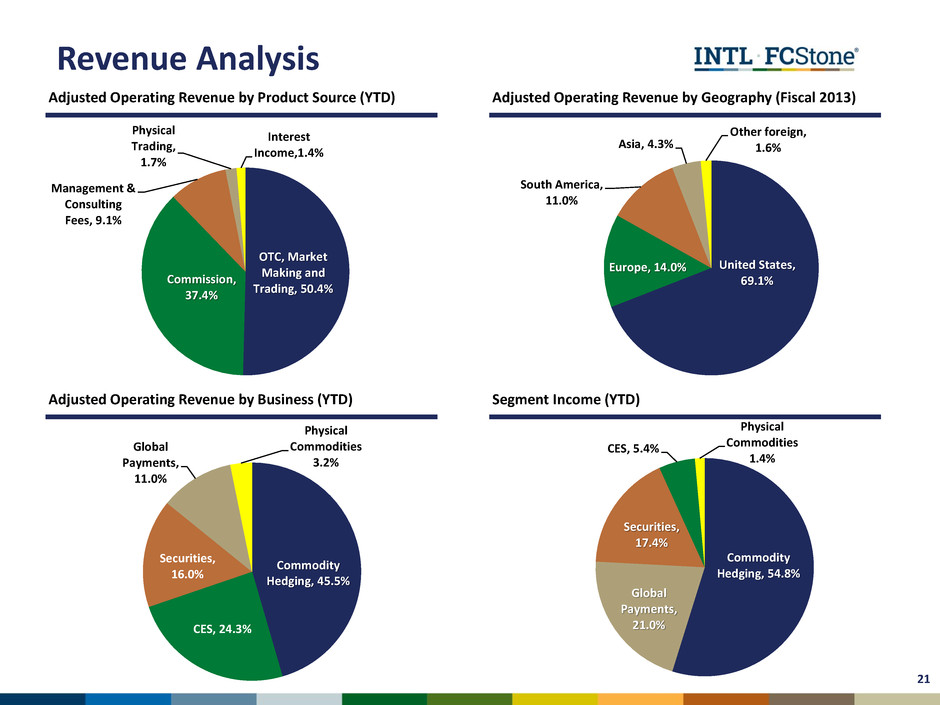
United States, 69.1% Europe, 14.0% South America, 11.0% Asia, 4.3% Other foreign, 1.6% OTC, Market Making and Trading, 50.4% Commission, 37.4% Management & Consulting Fees, 9.1% Physical Trading, 1.7% Interest Income,1.4% Commodity Hedging, 45.5% CES, 24.3% Securities, 16.0% Global Payments, 11.0% Physical Commodities 3.2% Commodity Hedging, 54.8% Global Payments, 21.0% Securities, 17.4% CES, 5.4% Physical Commodities 1.4% Adjusted Operating Revenue by Product Source (YTD) Segment Income Revenue Analysis Adjusted Operating Revenue by Business (YTD) Adjusted Operating Revenue by Geography (Fiscal 2013) Segment Income (YTD) 21
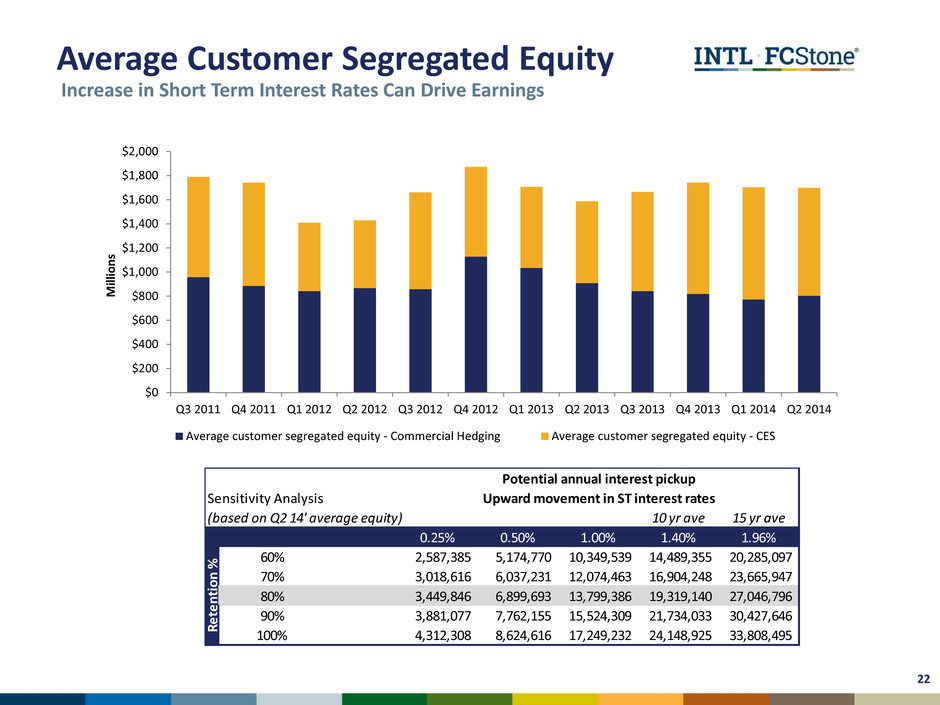
Average Customer Segregated Equity $0 $200 $400 $600 $800 $1,000 $1,200 $1,400 $1,600 $1,800 $2,000 Q3 2011 Q4 2011 Q1 2012 Q2 2012 Q3 2012 Q4 2012 Q1 2013 Q2 2013 Q3 2013 Q4 2013 Q1 2014 Q2 2014 M ill io n s Average customer segregated equity - Commercial Hedging Average customer segregated equity - CES Increase in Short Term Interest Rates Can Drive Earnings 22 Sensitivity Analysis (based on Q 14' average equity) 10 yr ave 15 yr ave 0.25% 0.50% 1.00% 1.40% 1.96% 60% 2,587,385 5,174,770 10,349,539 14,489,355 20,285,097 70% 3,018,616 6,037,231 12,074,463 16,904,248 23,665,947 80% 3,449,846 6,899,693 13,799,386 19,319,140 27,046,796 90% 3,881,077 7,762,155 15,524,309 21,734,033 30,427,646 100% 4,312,308 8,624,616 17,249,232 24,148,925 33,808,495 Rete ntion % Upward movement in ST interest rates Potential annual interest pickup
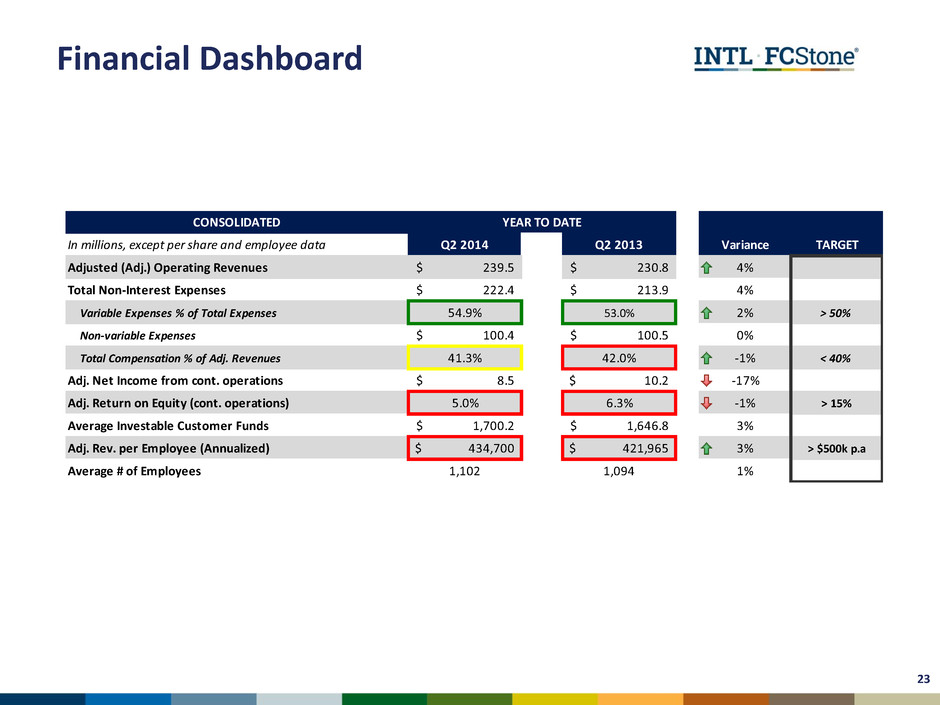
Financial Dashboard 23 CONSOLIDATED In millions, except per share and employee data Q2 2014 Q2 2013 Variance TARGET Adjusted (Adj.) Operating Revenues 239.5$ 230.8$ 4% Total Non-Interest Expenses 222.4$ 213.9$ 4% Variable Expenses % of Total Expenses 54.9% 53.0% 2% > 50% Non-variable Expenses 100.4$ 100.5$ 0% Total Compensation % of Adj. Revenues 41.3% 42.0% -1% < 40% Adj. Net Income from cont. operations 8.5$ 10.2$ -17% Adj. Return on Equity (cont. operations) 5.0% 6.3% -1% > 15% Average Investable Customer Funds 1,700.2$ 1,646.8$ 3% Adj. Rev. per Employee (Annualized) 434,700$ 421,965$ 3% > $500k p.a Average # of Employees 1,102 1,094 1% YEAR TO DATE
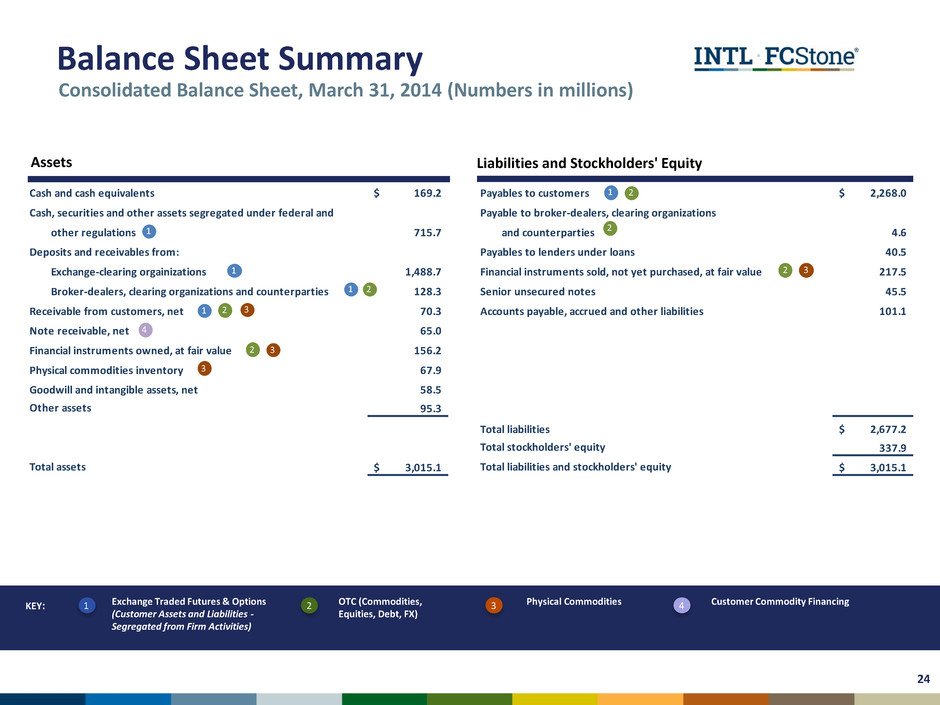
Customer Commodity Financing Exchange Traded Futures & Options (Customer Assets and Liabilities - Segregated from Firm Activities) OTC (Commodities, Equities, Debt, FX) Physical Commodities KEY: 1 2 3 4 Balance Sheet Summary Consolidated Balance Sheet, March 31, 2014 (Numbers in millions) 24 Cash and cash equivalents 169.2$ Payables to customers 2,268.0$ Cash, securities and other assets segregated under federal and Payable to broker-dealers, clearing organizations other regulations 715.7 and counterparties 4.6 Deposits and receivables from: Payables to lenders under loans 40.5 Exchange-clearing orgainizations 1,488.7 Financial instruments sold, not yet purchased, at fair value 217.5 Broker-dealers, clearing organizations and counterparties 128.3 Senior unsecured notes 45.5 Receivable from customers, net 70.3 Accounts payable, accrued and other liabilities 101.1 Note receivable, net 65.0 Fi ancial instruments owned, at fair value 156.2 Physical commodities inventory 67.9 Goodwill and intangible assets, net 58.5 Other assets 95.3 Total liabilities 2,677.2$ Total stockholders' equity 337.9 Total assets 3,015.1$ Total liabilities and stockholders' equity 3,015.1$ 1 1 1 1 3 4 2 21 2 3 3 1 2 2 2 3 Assets Liabilities and Stockholders' Equity
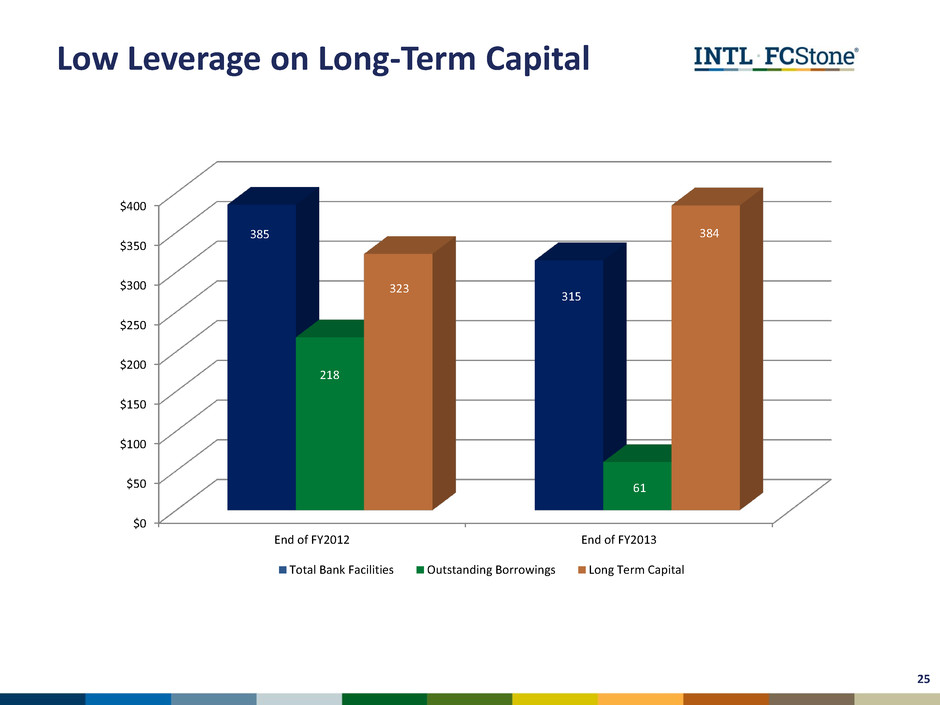
Low Leverage on Long-Term Capital 25 $0 $50 $100 $150 $200 $250 $300 $350 $400 End of FY2012 End of FY2013 385 315 218 61 323 384 Total Bank Facilities Outstanding Borrowings Long Term Capital
Appendix
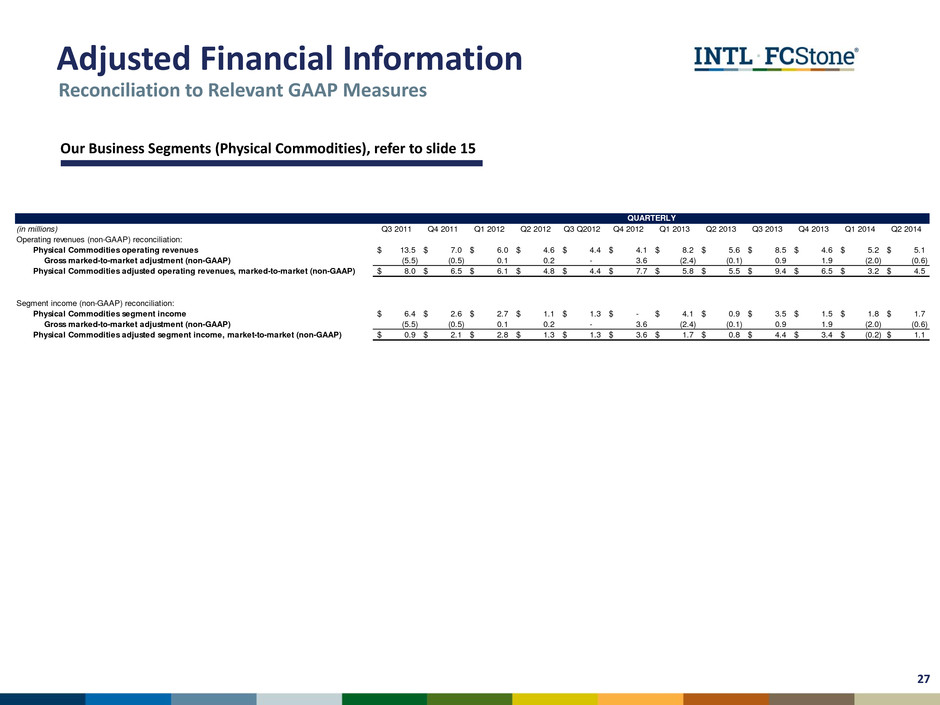
Adjusted Financial Information Reconciliation to Relevant GAAP Measures Our Business Segments (Physical Commodities), refer to slide 15 27 (i millions) Q3 2011 Q4 2011 Q1 2012 Q2 2012 Q3 Q2012 Q4 2012 Q1 2013 Q2 2013 Q3 2013 Q4 2013 Q1 2014 Q2 2014 perating revenues (non-GAAP) reconciliation: Physical Commodities operating revenues 13.5$ 7.0$ 6.0$ 4.6$ 4.4$ 4.1$ 8.2$ 5.6$ 8.5$ 4.6$ 5.2$ 5.1$ Gross marked-to-market djustment (non-GAAP) (5. ) (0.5) 0.1 0.2 - 3.6 (2.4) (0.1) 0.9 1.9 (2.0) (0.6) Physical Commodities adjusted operating revenues, marked-to-market (non-GAAP) 8.0$ 6.$ 6.$ 4.8$ 4.4$ 7.7$ 5.8$ 5.5$ 9.4$ 6.5$ 3.2$ 4.5$ Segment income (non-GAAP) reconciliation: Physical Commodities segment income 6.4$ 2.6$ 2.7$ 1.1$ 1.3$ -$ 4.1$ 0.9$ 3.5$ 1.5$ 1.8$ 1.7$ Gross marked-to-market adjustment (non-GAAP) (5.5) (0.5) 0.1 0.2 - 3.6 (2.4) ( .1) 0.9 .9 (2.0) (0.6) Physical Commodities adjusted egment income, market-to-market (non-GAAP) 0.9$ 2.1$ 2.8$ 1.3$ 1.3$ .$ 1.7$ 0.8$ 4.4$ 3.4$ (0.2)$ 1.1$ QUARTERLY
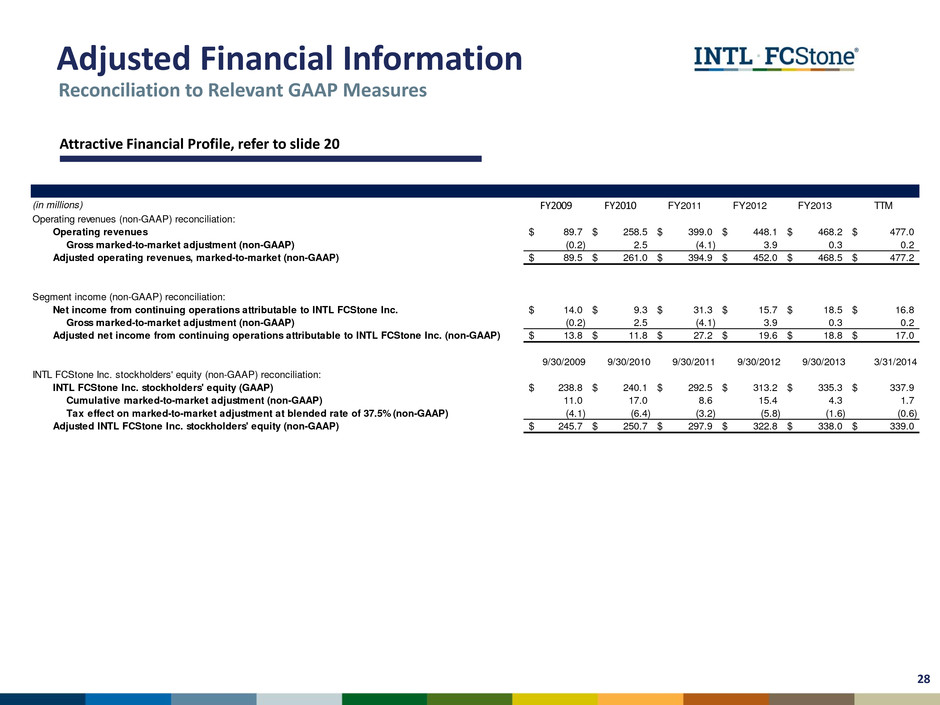
Adjusted Financial Information 28 Reconciliation to Relevant GAAP Measures Attractive Financial Profile, refer to slide 20 (in millions) FY2009 FY2010 FY2011 FY2012 FY2013 TTM Operating revenues (non-GAAP) reconciliation: Operating revenues 89.7$ 258.5$ 399.0$ 448.1$ 468.2$ 477.0$ Gross marked-to-market adjustment (non-GAAP) (0.2) 2.5 (4.1) 3.9 0.3 0.2 Adjusted operating revenues, marked-to-market (non-GAAP) 89.5$ 261.0$ 394.9$ 452.0$ 468.5$ 477.2$ Segment income (non-GAAP) reconciliation: Net income from continuing operations attributable to INTL FCStone Inc. 14.0$ 9.3$ 31.3$ 15.7$ 18.5$ 16.8$ Gross marked-to-market adjustment (non-GAAP) (0.2) 2.5 (4.1) 3.9 0.3 0.2 djusted net income from continuing operations attributable to INTL FCStone Inc. (non-GAAP) 13.8$ 11.8$ 27.2$ 19.6$ 18.8$ 17.0$ 9/30/2009 9/30/2010 9/30/2011 9/30/2012 9/30/2013 3/31/2014 INTL FCStone Inc. stockholders' equity (non-GAAP) reconciliation: INTL FCStone Inc. stockholders' equity (GAAP) 238.8$ 240.1$ 292.5$ 313.2$ 335.3$ 337.9$ Cumulative marked-to-market adjustment (non-GAAP) 11.0 17.0 8.6 15.4 4.3 1.7 Tax effect on marked-to-market adjustment at blended rate of 37.5% (non-GAAP) (4.1) (6.4) (3.2) (5.8) (1.6) (0.6) Adjusted INTL FCStone Inc. stockholders' equity (non-GAAP) 245.7$ 250.7$ 297.9$ 322.8$ 338.0$ 339.0$
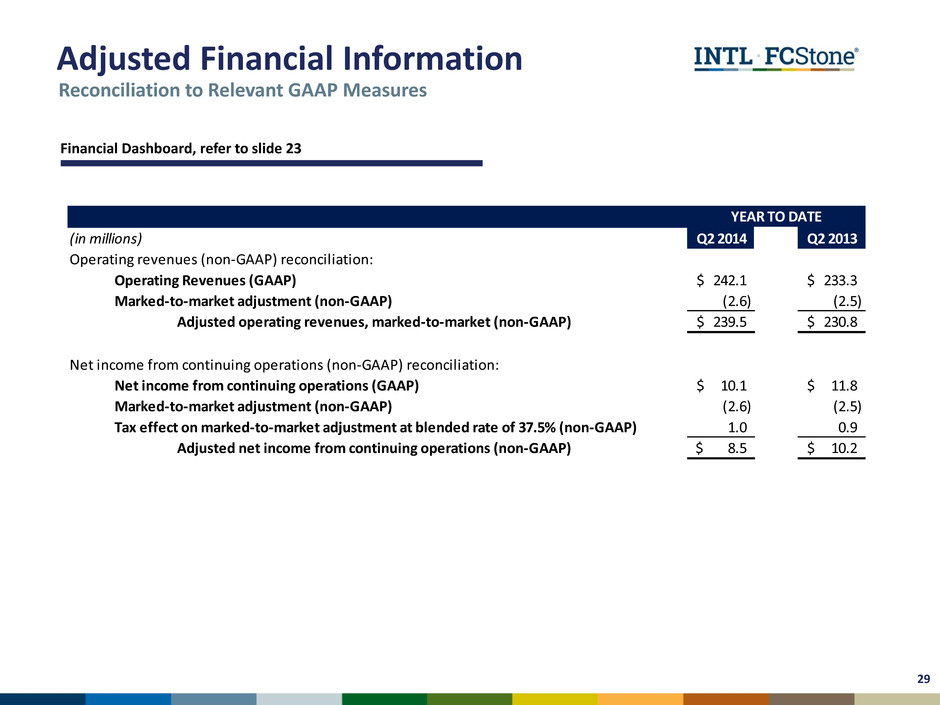
Adjusted Financial Information (in millions) Q2 2014 Q2 2013 Operating revenues (non-GAAP) reconciliation: Operating Revenues (GAAP) 242.1$ 233.3$ Marked-to-market adjustment (non-GAAP) (2.6) (2.5) Adjusted operating revenues, marked-to-market (non-GAAP) 239.5$ 230.8$ Net income from continuing operations (non-GAAP) reconciliation: Net income from continuing operations (GAAP) 10.1$ 11.8$ Marked-to-market adjustment (non-GAAP) (2.6) (2.5) Tax effect on marked-to-market adjustment at blended rate of 37.5% (non-GAAP) 1.0 0.9 Adjusted net income from continuing operations (non-GAAP) 8.5$ 10.2$ YEAR TO DATE Reconciliation to Relevant GAAP Measures Financial Dashboard, refer to slide 23 29
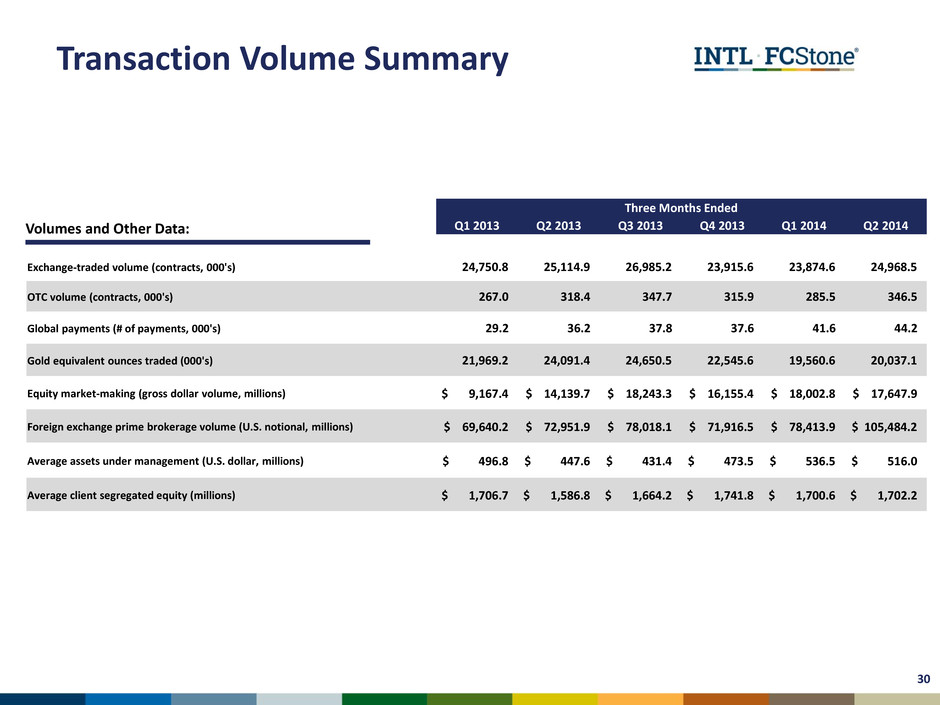
Transaction Volume Summary 30 Three Months Ended Q1 2013 Q2 2013 Q3 2013 Q4 2013 Q1 2014 Q2 2014 Exchange-traded volume (contracts, 000's) 24,750.8 25,114.9 26,985.2 23,915.6 23,874.6 24,968.5 OTC volume (contracts, 000's) 267.0 318.4 347.7 315.9 285.5 346.5 Global payments (# of payments, 000's) 29.2 36.2 37.8 37.6 41.6 44.2 Gold equivalent ounces traded (000's) 21,969.2 24,091.4 24,650.5 22,545.6 19,560.6 20,037.1 Equity market-making (gross dollar volume, millions) $ 9,167.4 $ 14,139.7 $ 18,243.3 $ 16,155.4 $ 18,002.8 $ 17,647.9 Foreign exchange prime brokerage volume (U.S. notional, millions) $ 69,640.2 $ 72,951.9 $ 78,018.1 $ 71,916.5 $ 78,413.9 $ 105,484.2 Average assets under management (U.S. dollar, millions) $ 496.8 $ 447.6 $ 431.4 $ 473.5 $ 536.5 $ 516.0 Average client segregated equity (millions) $ 1,706.7 $ 1,586.8 $ 1,664.2 $ 1,741.8 $ 1,700.6 $ 1,702.2 Volumes and Other Data:
INVESTOR PRESENTATION June 2014
