Attached files
| file | filename |
|---|---|
| EX-21 - LIST OF THE COMPANY'S SUBSIDIARIES - StoneX Group Inc. | dex21.htm |
| EX-32.2 - CERTIFICATION - StoneX Group Inc. | dex322.htm |
| EX-31.2 - CERTIFICATION - StoneX Group Inc. | dex312.htm |
| EX-32.1 - CERTIFICATION - StoneX Group Inc. | dex321.htm |
| EX-31.1 - CERTIFICATION - StoneX Group Inc. | dex311.htm |
| EX-23.1 - CONSENT OF KPMG LLP - StoneX Group Inc. | dex231.htm |
| EX-23.2 - CONSENT OF ROTHSTEIN, KASS & COMPANY, P.C. - StoneX Group Inc. | dex232.htm |
UNITED STATES
SECURITIES AND EXCHANGE COMMISSION
Washington, D.C. 20549
FORM 10-K
ANNUAL REPORT PURSUANT TO SECTION 13 OR 15(d) OF
THE SECURITIES EXCHANGE ACT OF 1934
For the fiscal year ended September 30, 2010
Commission File Number 000-23554
INTERNATIONAL ASSETS HOLDING CORPORATION
(Exact name of registrant as specified in its charter)
| Delaware | 59-2921318 | |
| (State or other jurisdiction of incorporation or organization) |
(I.R.S. Employer Identification No.) |
708 Third Avenue, Suite 1500
New York, NY 10017
(Address of principal executive offices) (Zip Code)
(212) 485-3500
(Registrant’s telephone number, including area code)
Securities registered under Section 12(b) of the Exchange Act:
| Title of each class |
Name of each exchange on which registered | |
| Common Stock, $.01 par value | NASDAQ Global Market |
Securities registered under Section 12(g) of the Exchange Act:
None
Indicate by check mark if the registrant is a well-known seasoned issuer, as defined in Rule 405 of the Securities Act. Yes ¨ No x
Indicate by check mark if the registrant is not required to file reports pursuant to Section 13 or Section 15(d) of the Act. Yes ¨ No x
Indicate by check mark whether the registrant (1) has filed all reports required to be filed by Section 13 or 15(d) of the Securities Exchange Act of 1934 during the preceding 12 months (or for such shorter period that the registrant was required to file such reports), and (2) has been subject to such filing requirements for the past 90 days. Yes x No ¨
Indicate by check mark whether the registrant has submitted electronically and posted on its corporate Web site, if any, every Interactive Data File required to be submitted and posted pursuant to Rule 405 of Regulation S-T (§ 232.405 of this chapter) during the preceding 12 months (or for such shorter period that the registrant was required to submit and post such files). Yes ¨ No ¨
Indicate by check mark if disclosure of delinquent filers pursuant to Item 405 of Regulation S-K is not contained herein, and will not be contained, to the best of registrant’s knowledge, in definitive proxy or information statements incorporated by reference in Part III of this Form 10-K or any amendment to this Form 10-K. ¨
Indicate by check mark whether the registrant is a large accelerated filer, an accelerated filer, a non-accelerated filer, or a smaller reporting company. See definitions of “accelerated filer”, “large accelerated filer” and “smaller reporting company” in Rule 12b-2 of the Exchange Act.
| Large accelerated filer | ¨ | Accelerated filer | x | |||
| Non-accelerated filer | ¨ | Smaller reporting company | ¨ | |||
Indicate by check mark whether the registrant is a shell company (as defined in Rule 12b-2 of the Exchange Act). Yes ¨ No x
As of March 31, 2010, the aggregate market value of the common stock held by non-affiliates of the registrant was approximately $168.6 million.
As of December 10, 2010, there were 10,612,522 shares of the registrant’s common stock outstanding.
INTERNATIONAL ASSETS HOLDING CORPORATION
ANNUAL REPORT ON FORM 10-K FOR THE FISCAL YEAR ENDED SEPTEMBER 30, 2010
DOCUMENTS INCORPORATED BY REFERENCE
Portions of the definitive Proxy Statement for the Registrant’s Annual Meeting of Stockholders to be held on February 24, 2011 are incorporated by reference into Part III of this Annual Report on Form 10-K.
INTERNATIONAL ASSETS HOLDING CORPORATION
ANNUAL REPORT ON FORM 10-K FOR THE FISCAL YEAR ENDED SEPTEMBER 30, 2010
INTERNATIONAL ASSETS HOLDING CORPORATION
ANNUAL REPORT ON FORM 10-K FOR THE FISCAL YEAR ENDED SEPTEMBER 30, 2010
Cautionary Statement about Forward-Looking Statements
Certain statements in this report, other than purely historical information, including estimates, projections, statements relating to our business plans, objectives and expected operating results, and the assumptions upon which those statements are based, are “forward-looking statements” within the meaning of the Private Securities Litigation Reform Act of 1995, Section 27A of the Securities Act of 1933 and Section 21E of the Securities Exchange Act of 1934. Forward-looking statements are based on current expectations and assumptions that are subject to risks and uncertainties which may cause actual results to differ materially from the forward-looking statements. A detailed discussion of these and other risks and uncertainties that could cause actual results and events to differ materially from such forward-looking statements is included in the section entitled “Risk Factors” (refer to Part I, Item 1A). The Company undertakes no obligation to update or revise publicly any forward-looking statements, whether as a result of new information, future events or otherwise.
PART I
| Item 1. | Business |
Overview of Business and Strategy
International Assets Holding Corporation, a Delaware corporation, together with its consolidated subsidiaries (collectively the “Company”) forms a financial services group employing 729 people in offices in eleven countries. We provide comprehensive risk management consulting services to mid-sized commercial customers, as well as utilize our expertise and capital to provide foreign exchange and treasury services, securities execution, physical commodities trading services and execution in both listed futures and option contracts as well as structured over-the counter (“OTC”) products in a wide range of commodities.
We are a customer centric organization which focuses on acquiring and building long-term relationships with our customers by providing consistent, quality execution and value added financial solutions, with the goal of earning the premium spreads that allow us to achieve our financial objectives.
We provide these services to a diverse group of more than 10,000 customers located in more than 100 countries, including producers, processors and end-users of nearly all widely-traded physical commodities to manage their risks and enhance margins; to commercial counterparties who are end-users of the firm’s products and services; to governmental and non-governmental organizations; and to commercial banks, brokers, institutional investors and major investment banks.
The Company engages in direct sales efforts to seek new customers, with a strategy of extending our services to potential customers who are similar in size and operations to our existing customer base, as well as different kinds of customers that have risk management needs that could be effectively met by our services. We plan to expand our services into new business product lines and new geographic regions, particularly in Asia, Europe, Australia, Latin America and Canada.
Our strategy is to utilize a centralized and disciplined process for capital allocation, risk management and cost control, while delegating the execution of strategic objectives and day-to-day management to experienced individuals. This requires high quality managers, a clear communication of performance objectives and strong financial and compliance controls. The Company believes this strategy will enable the Company to build a scalable and significantly larger organization that embraces an entrepreneurial approach to business, supported and underpinned by strong central controls.
Each of the Company’s businesses is volatile and their financial performance can change due to a variety of factors which are both outside of management’s control and not readily predictable. To address this volatility, the Company has sought to diversify into a number of uncorrelated businesses.
The Company’s internet address is www.intlassets.com. The Company’s annual reports on Form 10-K, quarterly reports on Form 10-Q, current reports on Form 8-K, statements of changes in beneficial ownership and press releases are available in the Investor Relations section of this web site. The Company’s website also includes information regarding the Company’s corporate governance, including the Company’s Code of Ethics, which governs the Company’s directors, officers and employees.
3
INTERNATIONAL ASSETS HOLDING CORPORATION
ANNUAL REPORT ON FORM 10-K FOR THE FISCAL YEAR ENDED SEPTEMBER 30, 2010
Capabilities
Clearing and Execution
The Company provides execution services on a wide variety of technology platforms in a number of markets. We provide clearing and execution of listed futures and options on futures contracts on all major commodity exchanges throughout the world and is a member of all major US commodity exchanges. The Company provides global payments and treasury services in more than 130 countries to a broad array of commercial customers, including financial institutions, multi-national corporations, and governmental and charitable organizations.
Advisory Services
We provide value added advisory services in a variety of financial markets and works with commercial clients to systematically identify and quantify exposures to commodity price risks and then develops strategic plans to effectively manage these risks with a view to protecting margins and mitigating exposures through its proprietary Integrated Risk Management Program (“IRMP”).
We provide commercial customers with a full range of investment banking services from optimizing the customer’s capital structure through the issue of loans, debt or equity securities and advisory services including mergers, acquisitions and restructurings.
Through its asset management activities, we leverage our specialist expertise in niche markets to provide institutional investors with tailored investment products.
Physical Trading
The Company trades in a variety of physical commodities, primarily precious and base metals as well as select soft commodities. The services offer customers efficient off-take or supply, as well as logistics management. Through these trading activities, the Company has the ability to offer complex hedging structures as part of each physical contract to provide customers with enhanced price risk mitigation.
Over-The-Counter (“OTC”) / Market Making
The Company offers customized and complex solutions in the OTC markets that are designed to help customers mitigate their specific market risks. These solutions are offered on a global basis across many markets, including virtually all traded commodities, foreign currencies and interest rates. This process is integrated from product design through execution of the underlying components of the structured risk product.
The Company also provides market making in a variety of financial products including commodity options, unlisted American Depository Receipts (“ADRs”), foreign common shares and foreign currencies.
Trading Revenues
In the Company’s business, purchases of individual securities, currencies, commodities or derivative instruments may be from single or multiple customers or counterparties. These purchases may be covered by a matching sale to a customer or counterparty or may be aggregated with other purchases to provide liquidity intraday, for a number of days or, in some cases, particularly the base metals business, even longer periods (during which fair values may fluctuate). Sales of individual securities, currencies, commodities or derivative instruments may also be to single or multiple customers or counterparties. They may be made from inventory, they may be covered by a simultaneous and matching purchase in the market or they may represent a short sale and be covered by a later purchase in the market.
Operating Segments
The Company’s activities are divided into five functional areas consisting of Commodity and Risk Management Services, Foreign Exchange, Securities, Clearing and Execution Services, and Other.
Commodity and Risk Management Services (“C&RM”)
We serve our commercial customers through a force of 119 risk management consultants who seek to provide high value added service that differentiates the Company from our competitors and maximizes the opportunity to retain customers. The
4
INTERNATIONAL ASSETS HOLDING CORPORATION
ANNUAL REPORT ON FORM 10-K FOR THE FISCAL YEAR ENDED SEPTEMBER 30, 2010
IRMP provides customers with commodity risk management consulting services with the goal of developing a customized long term hedging programs that assist customers to mitigate their exposure to commodity price risk and to maximize the amount and certainty of their operating profits. Customers are assisted in the execution of their hedging strategies through the Company’s exchange-traded futures and options on futures clearing and execution operations and through access to more customized alternatives provided by our OTC trading desk. Generally, customers direct their own trading activities and risk management consultants do not have discretionary authority to transact trades on behalf of customers. When transacting OTC contracts with a customer, the Company may offset the customer’s transaction simultaneously with one of its trading counterparties. Alternatively, the OTC trade desk will accept a customer transaction and offset that transaction with a similar but not identical position on the exchange.
We also provide a full range of trading and hedging capabilities to select producers, consumers, recylers and investors in precious metals and certain base metals and select other commodities. Acting as a principal, we commit our own capital to buy and sell these commodities on a spot and forward basis.
The risk management consultants organize their marketing efforts within this segment into customer industry product lines, and currently serve customers in the following areas:
| • | Commercial Grain—Customers in this product line include grain elevator operators, traders, processors, manufacturers and end-users. |
| • | Energy—The energy customer product line targets companies where energy represents a significant input cost into the production of their product or service. Customers in this product line include producers, refiners, wholesalers, transportation companies, convenience store chains, automobile and truck fleet operators, industrial companies, railroads and municipalities. |
| • | Renewable Fuels—The renewable fuels customer product line targets producers of ethanol and biodiesel products. |
| • | Latin America/Brazil—The customers within this product line are located predominantly in Mexico and Brazil. Customers are involved in all sectors of agribusiness, including livestock production and feeding, flour milling and baking, oilseed crushing and refining, grain merchandising, meat processing and sugar/ethanol production. |
| • | China—The China customer product line represents both Chinese future commission merchants (“FCM’s”) as well as commercial companies seeking to hedge their commodity risk exposures. The Chinese FCM’s are similar to introducing brokers, facilitating the transactions of their clients in the U.S. commodities markets. The commercial accounts generally represent significant processors of grain or other commodities. |
| • | Dairy/Food Service—The dairy and food service product line targets the dairy industry and users of agricultural commodities in the food industry. |
| • | Cotton/Textiles—The cotton product line targets both the domestic and international markets with a focus on providing trading, consulting and information services to the global fiber, textile and apparel industry. |
| • | Precious Metals—This product line targets mining producers and scrap merchants as well as wholesale jewelry manufactures and commercial concerns globally. |
| • | Base Metals—This product line has relationships with a number of small and medium-sized metals producers, refiners, recyclers, traders and manufacturing entities. We are also active in the acquisition of scrap metals which are refined under contract and sold to our customers. |
5
INTERNATIONAL ASSETS HOLDING CORPORATION
ANNUAL REPORT ON FORM 10-K FOR THE FISCAL YEAR ENDED SEPTEMBER 30, 2010
| • | Natural Gas—This product line focuses consumers of natural gas and has relationships with some of the largest natural gas consumers in North America, including municipalities and large manufacturing firms, as well as major utilities. |
| • | Introducing Brokers—Introducing brokers within this product line include individuals or organizations that maintain relationships with customers and intermediate transactions between the customer and FCStone. The customers within this product line are primarily agricultural producers. |
The Company records all of its physical commodities revenues on a gross basis. Operating revenues and losses from the Company’s commodities derivatives activities are recorded in ‘Trading gains’. Inventory for the commodities business is valued at the lower of cost or fair value, under the provisions of the Inventory Topic of the Accounting Standards Codification (“ASC”). The Company generally mitigates the price risk associated with commodities held in inventory through the use of derivatives. The Company does not elect hedge accounting under accounting principles generally accepted in the U.S. (“U.S. GAAP”) in accounting for this price risk mitigation. In such situations, unrealized gains in inventory are not recognized under U.S. GAAP, but unrealized gains and losses in related derivative positions are recognized under U.S. GAAP. As a result, the Company’s reported earnings from commodities trading may be subject to significant volatility.
Foreign Exchange
The Company provides treasury, global payment and foreign exchange services to financial institutions, multi-national corporations, government organizations and charitable organizations. We also assist commercial customers with the execution of foreign exchange hedging strategies. The Company transacts in over 130 currencies and specializes in smaller, more difficult emerging markets where there is limited liquidity. In addition, the Company executes trades based on the foreign currency flows inherent in the Company’s existing business activities. The Company primarily acts as a principal in buying and selling foreign currencies on a spot basis. The Company derives revenue from the difference between the purchase and sale prices.
The Company also provides spot foreign currency trading for eligible contract participants and high net worth retail customers and operates a proprietary foreign exchange desk which arbitrages the futures and cash markets.
Securities
Through INTL Trading, Inc. (“INTL Trading”), the Company acts as a wholesale market maker in select foreign securities including unlisted ADRs and foreign ordinary shares and provides execution in select debt instruments and exchange traded funds (“ETF’s”). INTL Trading provides execution and liquidity to national broker-dealers, regional broker-dealers and institutional investors.
The Company makes markets in approximately 800 ADRs and foreign ordinary shares traded in the OTC market. In addition, the Company will, on request, make prices in more than 8,000 other ADRs and foreign common shares. As a market-maker, the Company provides trade execution services by offering to buy shares from, or sell shares to, broker-dealers and institutions. The Company displays the prices at which it is willing to buy and sell these securities and adjusts its prices in response to market conditions. When acting as principal, the Company commits its own capital and derives revenue from the difference between the prices at which the Company buys and sells shares. The Company also earns commissions by executing trades on an agency basis.
While the Company’s customers are other broker-dealers and institutions, the business tends to be driven by the needs of the private clients of those broker-dealers and institutions. The size of private client trades may be uneconomical for the in-house international equities trading desks of our customers to execute. The Company is able to provide execution of smaller trades at profitable margins.
6
INTERNATIONAL ASSETS HOLDING CORPORATION
ANNUAL REPORT ON FORM 10-K FOR THE FISCAL YEAR ENDED SEPTEMBER 30, 2010
The Company provides a full range of investment banking advisory services to commercial customers including the issue of loans or equity. On occasion we may invest our own capital in debt instruments before selling them into the market.
Clearing and Execution Services (“CES”)
We provide competitive and efficient clearing and execution of exchange-traded futures and options on futures for the institutional and professional traders through our subsidiary FCStone, LLC. Through its platform, customer orders are accepted and directed to the appropriate exchange for execution. The Company then facilitates the clearing of customers’ transactions. Clearing involves the matching of customers’ trades with the exchange, the collection and management of margin deposits to support the transactions, and the accounting and reporting of the transactions to customers. The Company seeks to leverage its capabilities and capacity by offering facilities management or outsourcing solutions to other FCM’s.
FCStone, LLC is a registered FCM and a clearing member of all major U.S. commodity futures exchanges including the Chicago Mercantile Exchange and its divisions: the Chicago Board of Trade, the New York Mercantile Exchange and the COMEX; ICE Futures US formerly known as the New York Board of Trade, Kansas City Board of Trade and the Minneapolis Grain Exchange (“MGEX”). As of September 30, 2010, FCStone, LLC was the fourth largest independent FCM in the United States, as measured by required customer segregated assets. As of September 30, 2010, FCStone, LLC had $1.2 billion in required customer segregated assets.
Other
This segment consists of the Company’s asset management and grain financing and facilitation business. The asset management revenues include fees, commissions and other revenues received by the Company for management of third party assets and investment gains or losses on the Company’s investments in funds and proprietary accounts managed either by the Company’s investment managers or by independent investment managers.
We operate a grain financing and facilitation business that makes loans to commercial grain-related companies against physical grain inventories. Sale and repurchase agreements are used to purchase grain evidenced by warehouse receipts at local grain elevators subject to a simultaneous agreements to sell such grain back to the original seller at a later date. These transactions are accounted for as product financing arrangements, and accordingly no grain inventory, grain purchases or grain sales are recorded. The Company also serves as a lender for a number of different commodities, including grain, lumber, energy products and renewable fuels.
Acquisition of FCStone Group, Inc.
On September 30, 2009, International Assets Holding Corporation completed its acquisition of FCStone Group, Inc. (“FCStone”) pursuant to the merger of FCStone and a wholly owned subsidiary of the Company (the “FCStone transaction”). As a result of this transaction, the Company issued approximately 8.2 million shares of its common stock to the former shareholders of FCStone, and FCStone became a wholly owned subsidiary of International Assets Holding Corporation.
At the time of the acquisition, FCStone and its subsidiaries provided risk management consulting and transaction execution services to commercial commodity intermediaries, users and producers. FCStone primarily assisted middle-market customers in optimizing their profit margins and mitigating commodity price risk. In addition to its risk management consulting services, FCStone operated an independent clearing and execution platform for exchange-traded futures and options contracts. All of the capabilities of FCStone have been retained and integrated into our operations.
Effect of FCStone transaction on disclosures in this Form 10-K
The FCStone transaction was consummated on September 30, 2009, the last day of the 2009 fiscal year for the Company. As a result, the consolidated income statement of the Company for the fiscal year ended September 30, 2010 includes the results of FCStone, while the consolidated income statements of the Company for the fiscal years ended September 30, 2009 and
7
INTERNATIONAL ASSETS HOLDING CORPORATION
ANNUAL REPORT ON FORM 10-K FOR THE FISCAL YEAR ENDED SEPTEMBER 30, 2010
2008 included in this Form 10-K do not include the results of FCStone. The consolidated balance sheets for the Company as of September 30, 2010 and 2009 included in this Form 10-K reflect the acquisition of FCStone utilizing the purchase method of accounting.
Acquisitions made in the 2010 Fiscal Year
During fiscal year 2010, the Company acquired three businesses, Risk Management Incorporated and RMI Consulting, Inc., Hanley Trading, LLC and related companies and Provident Group, none of which were significant on an individual or aggregate basis. The Company’s consolidated financial statements include the operating results of each business from the dates of acquisition.
Risk Management Incorporated and RMI Consulting, Inc.
On April 1, 2010, we acquired Risk Management Incorporated and RMI Consulting, Inc. (the “RMI Companies”). The purchase price consisted of an initial payment of $6.0 million, and three contingent payments. The estimated total purchase price, including contingent consideration, is approximately $16.7 million.
RMI provides execution and consulting services to some of the largest natural gas consumers in North America, including municipalities and large manufacturing firms, as well as major utilities. In addition to its risk-management and brokerage services, RMI also offers a wide range of other programs, including a proprietary online energy procurement platform. The acquisition adds extensive and proven expertise in the natural gas, electricity and related energy markets where RMI has a leading presence, as well as a broad range of long-term relationships with some major organizations.
Hanley Companies
On July 2, 2010, we acquired HGC Trading, LLC; HGC Asset Management, LLC; HGC Advisory Services, LLC; Hanley Alternative Trade Group, LLC and HGC Office Services, LLC; (the “Hanley Companies”). The purchase price consisted of an initial payment of $31.8 million, and three contingent payments. The estimated total purchase price, including contingent consideration, is approximately $47.4 million.
The Hanley Companies are engaged in the business of acting as market makers and dealers in exchange traded options and futures on soft commodities; executing and trading derivatives on soft commodities in the OTC market; and providing related advisory services.
Provident Group
On September 20, 2010, the Company acquired certain assets of Provident Group (“Provident”), a New York-based investment banking and advisory firm. Under terms of the acquisition agreement, the Company acquired assets and secured the services of the individual sellers as set forth in the agreement. The estimated purchase price for the assets and services of the sellers was $5.0 million.
Provident is engaged in the business of providing investment banking and advisory services. Provident is expected to play a critical role in building out a comprehensive investment banking and advisory platform delivering financing solutions to the middle market.
Subsequent acquisition
Hencorp Futures
Subsequent to the fiscal year ended September 30, 2010, the Company acquired all of the membership interests in Hencorp Becstone Futures, L.C. (“Hencorp Futures”), the futures operation of Miami-based Hencorp Group. Hencorp Futures specializes in the development and execution of risk-management programs designed to hedge price volatility in a number of widely traded commodities, including coffee, sugar, cocoa, grains and energy products. The purchase price consists of an initial payment of $2.3 million, four contingent payments which will be based on Hencorp Futures’ net income for each of the four years after the closing and a final contingent payment based on the average net income of the second, third and fourth years.
Competition
The international commodities and financial markets are highly competitive and rapidly evolving. In addition, these markets are dominated by firms with significant capital and personnel resources that are not matched by the Company’s resources. The Company expects these competitive conditions to continue in the future, although the nature of the competition may change as a result of the current global financial crisis. The crisis has produced opportunities for the Company to expand its activities and may produce further opportunities. The Company believes that it can compete successfully with other commodities and financial intermediaries in the markets it seeks to serve, based on the Company’s expertise, products and quality of consulting and execution services.
8
INTERNATIONAL ASSETS HOLDING CORPORATION
ANNUAL REPORT ON FORM 10-K FOR THE FISCAL YEAR ENDED SEPTEMBER 30, 2010
We compete with a large number of firms in the exchange-traded futures and options execution sector and in the OTC derivatives sector. We compete primarily on the basis of price and value of service. Our competitors in the exchange-traded futures and options sector include international brokerage firms, national brokerage firms, regional brokerage firms (both cooperatives and non-cooperatives) as well as local introducing brokers, with competition driven by price level and quality of service. Many of these competitors also offer OTC trading programs. In addition, there are a number of financial firms and physical commodities firms that participate in the OTC markets, both directly in competition with us and indirectly through firms like us. We compete in the OTC market by making specialized OTC transactions available to our customers in contract sizes that are smaller than those usually available from major counter-parties.
The Company’s activities are impacted, and will continue to be impacted, by investor interest in the markets served by the Company. The instruments traded in these markets compete with a wide range of alternative investment instruments. The Company seeks to counterbalance changes in demand in specified markets by undertaking activities in multiple uncorrelated markets.
Technology has increased competitive pressures on commodities and financial intermediaries by improving dissemination of information, making markets more transparent and facilitating the development of alternative execution mechanisms. The Company competes, in certain instances, by providing technology-based solutions to facilitate customer transactions and solidify customer relationships.
Administration and Operations
The Company employs operations personnel to supervise and, for certain products, complete the clearing and settlement of transactions.
INTL Trading’s securities transactions are cleared through Broadcourt, a division of Merrill Lynch, Pierce, Fenner & Smith, Inc. INTL Trading does not hold customer funds or directly clear or settle securities transactions.
We utilize front-end electronic trading, back office and accounting systems to process transactions on a daily basis. In some cases these systems are integrated. They provide recordkeeping, trade reporting to exchange clearing, internal risk controls, and reporting to government entities, corporate managers, risk managers and customers. Our futures and options back office system is maintained by a third-party service bureau which is located in Chicago with a disaster recovery site in New York.
The Company holds customer funds in relation to certain of its activities. In regulated entities, these are segregated but in unregulated entities they are not.
The Company’s administrative staff manages the Company’s internal financial controls, accounting functions, office services and compliance with regulatory requirements.
Governmental Regulation and Exchange Membership
The Company’s activities are subject to significant governmental regulation, both in the United States and overseas. Failure to comply with regulatory requirements could result in administrative or court proceedings, censure, fines, issuance of cease-and-desist orders, suspension or disqualification of the regulated entity, its officers, supervisors or representatives. The regulatory environment in which the Company operates is subject to frequent change and these changes directly impact the Company’s business and operating results.
The securities industry in the United States is subject to extensive regulation under federal and state securities laws. The Company is required to comply with a wide range of requirements imposed by the SEC, state securities commissions and Financial Industry Regulatory Authority (“FINRA”). These regulatory bodies are charged with safeguarding the integrity of the financial markets and with protecting the interests of investors in these markets. They also impose minimum capital requirements on regulated entities.
On July 21, 2010, the President signed into law the Dodd-Frank Wall Street Reform and Consumer Protection Act (the “Dodd-Frank Act”). The Dodd-Frank Act contains a variety of provisions designed to regulate financial markets, including credit and derivatives transactions. Many aspects of the Dodd-Frank Act are subject to rulemaking that will take effect over several years, thus making it difficult to assess the impact of the statute on the financial industry, including the Company, at this time. The Company will continue to monitor all applicable developments in the implementation of the Dodd-Frank Act and expects to adapt successfully to any new applicable legislative and regulatory requirements.
The activities of our broker-dealer subsidiaries in the United States, INTL Trading and FCC Investments, Inc. (“FCC Investments”), are primarily regulated by FINRA and the SEC.
9
INTERNATIONAL ASSETS HOLDING CORPORATION
ANNUAL REPORT ON FORM 10-K FOR THE FISCAL YEAR ENDED SEPTEMBER 30, 2010
The commodities industry in the United States is also subject to extensive regulation under federal law. The Company is required to comply with a wide range of requirements imposed by the Commodity Futures Trading Commission, the National Futures Association and the Chicago Mercantile Exchange, which is our designated self-regulatory organization. It is also a member of Chicago Mercantile Exchange/Chicago Board of Trade, New York Mercantile Exchange, ICE Futures US, Minneapolis Grain Exchange and the Kansas City Board of Trade. These regulatory bodies are charged with protecting customers by imposing requirements relating to capital adequacy, licensing of personnel, conduct of business, protection of customer assets, record-keeping, trade-reporting and other matters.
The USA PATRIOT Act contains anti-money laundering and financial transparency laws and mandates the implementation of various regulations applicable to broker-dealers and other financial services companies. The USA PATRIOT Act seeks to promote cooperation among financial institutions, regulators and law enforcement entities in identifying parties that may be involved in terrorism or money laundering. Anti-money laundering laws outside of the United States contain similar provisions. We believe that we have implemented, and that we maintain, appropriate internal practices, procedures and controls to enable us to comply with the provisions of the USA PATRIOT Act and other anti-money laundering laws.
The United States maintains various economic sanctions programs administered by the U.S. Treasury Department’s Office of Foreign Assets Control (“OFAC”). The OFAC-administered sanctions take many forms, but generally prohibit or restrict trade and investment in and with sanctions targets; and in some cases require blocking of the target’s assets. Violations of any of the OFAC-administered sanctions are punishable by civil fines, as well as criminal fines and imprisonment. We have established policies and procedures designed to comply with applicable OFAC requirements. Although we believe that our policies and procedures are effective, there can be no assurance that our policies and procedures will effectively prevent us from violating the OFAC-administered sanctions in every transaction in which we may engage.
Net Capital Requirements
INTL Trading is subject to the net capital requirements imposed by SEC Rule 15c3-1 under the Securities Exchange Act of 1934. These requirements are intended to ensure the financial integrity and liquidity of broker-dealers. They establish both minimum levels of capital and liquid assets. The net capital requirements prohibit the payments of dividends, redemption of stock, the prepayment of subordinated indebtedness and the making of any unsecured advances or loans to any stockholder, employee or affiliate, if such payment would reduce the broker-dealer’s net capital below required levels.
The net capital requirements restrict the ability of INTL Trading to make distributions to the Company. They also restrict the ability of INTL Trading to expand its business beyond a certain point without the introduction of additional capital.
As of September 30, 2010, INTL Trading’s net capital and excess net capital were $1.5 million and $0.5 million, respectively. See Note 16 to the consolidated financial statements.
FCStone, LLC is subject to minimum capital requirements in the United States, under Section 4(f)(b) of the Commodity Exchange Act and Part 1.17 of the rules and regulations of the Commodity Futures Trading Commission. These rules specify the minimum amount of capital that must be available to support our clients’ open trading positions, including the amount of assets that FCStone, LLC must maintain in relatively liquid form, and are designed to measure general financial integrity and liquidity. Net capital and the related net capital requirement may fluctuate on a daily basis. FCStone, LLC currently maintains regulatory capital in excess of all applicable requirements. See Note 16 to the Consolidated Financial Statements.
Compliance with minimum capital requirements may limit our operations if we cannot maintain the required levels of capital. Moreover, any change in these rules or the imposition of new rules affecting the scope, coverage, calculation or amount of capital we are required to maintain could restrict our ability to operate our business and adversely affect our operations.
FCStone Commodities Services (Europe), Ltd. is regulated by the Financial Regulator of Ireland and is subject to a minimum capital requirement which at September 30, 2010 was 370,000 euros.
Risk Management Incorporated is regulated by the CFTC and the National Futures Association (“NFA”) and is subject to a minimum capital requirement which at September 30, 2010 was $45,000.
Foreign Operations
The Company operates in a number of foreign jurisdictions, including Canada, Ireland, the United Kingdom, Argentina, Brazil, Uruguay, Mexico, Nigeria, Dubai, China, Australia and Singapore. INTL has established wholly-owned subsidiaries in Mexico and Nigeria but does not have offices or employees in those countries.
FCStone Commodity Services (Europe) Ltd. is domiciled in Ireland and subject to regulation by the Financial Regulator of Ireland.
INTL Trading and INTL Commodities each have branch offices in the United Kingdom. As a result, their activities are also subject to regulation by the United Kingdom Financial Services Authority.
In Argentina, the activities of INTL Gainvest and Compania Inversora Bursatil S.A. Sociedad de Bolsa (“CIBSA”) are subject to regulation by the Comision de Valores and Merval.
In Brazil, the activities of FCStone do Brasil are subject to regulation by BM&FBovespa.
10
INTERNATIONAL ASSETS HOLDING CORPORATION
ANNUAL REPORT ON FORM 10-K FOR THE FISCAL YEAR ENDED SEPTEMBER 30, 2010
The activities of INTL Capital Limited and INTL Commodities DMCC are subject to regulation by the Dubai Financial Services Authority and the Dubai Multi Commodities Centre, respectively.
FCStone Australia Pty. Ltd. is subject to regulation by the Australian Securities and Investments Commission.
Business Risks
The Company seeks to mitigate the market and credit risks arising from its financial trading activities through an active risk management program. The principal objective of this program is to limit trading risk to an acceptable level while maximizing the return generated on the risk assumed.
The Company has a defined risk policy which is administered by the Company’s risk committee, which reports to the Company’s audit committee. The Company has established specific exposure limits for inventory positions in every business, as well as specific issuer limits and counterparty limits. These limits are designed to ensure that in a situation of unexpectedly large or rapid movements or disruptions in one or more markets, systemic financial distress, the failure of a counterparty or the default of an issuer, the potential estimated loss will remain within acceptable levels. The audit committee reviews the performance of the risk committee on a quarterly basis to monitor compliance with the established risk policy.
Employees
As of September 30, 2010, we employed 729 people globally: 547 in the United States, 3 in Canada, 59 in Argentina, 36 in Brazil, 8 in Uruguay, 25 in the United Kingdom, 5 in Ireland, 16 in Dubai, 19 in Singapore, 1 in China and 10 in Australia. None of our employees operate under a collective bargaining agreement, and we have not suffered any work stoppages or labor disputes. Many of our employees are subject to employment agreements, certain of which contain non-competition provisions.
| Item 1A. | Risk Factors |
The Company faces a variety of risks that could adversely impact its financial condition and results of operations.
The risks faced by the Company include the following:
We do not have a consistent history of profitability and our ability to achieve consistent profitability in the future in subject to uncertainty. During the fiscal year ended September 30, 2010 we recorded a net income of $5.4 million, which includes a $7.0 million extraordinary loss related to purchase price adjustments and the correction of immaterial errors on the FCStone transaction, compared with net income of $27.6 million in 2009, which includes an $18.5 million extraordinary gain related to the FCStone transaction in 2009, and $27.8 million in 2008.
Our ability to achieve consistent profitability is subject to uncertainty due to the nature of our businesses and the markets in which we operate. In particular, our revenues and operating results may fluctuate significantly in the future because of the following factors:
| • | Market conditions, such as price levels and volatility in the securities, commodities and foreign exchange markets in which we operate |
| • | Changes in the volume of our market making and trading activities |
| • | Changes in the value of our financial instruments, currency and commodities positions and our ability to manage related risks |
| • | The level and volatility of interest rates |
| • | The availability and cost of funding and capital |
| • | Our ability to manage personnel, overhead and other expenses |
| • | Changes in execution and clearing fees |
| • | The addition or loss of sales or trading professionals |
| • | Changes in legal and regulatory requirements |
| • | General economic and political conditions |
Although we are continuing our efforts to diversify the sources of our revenues, it is likely that our revenues and operating results will continue to fluctuate substantially in the future and such fluctuations could result in losses. These losses could have a material adverse affect on our business, financial condition and operating results.
The manner in which we account for our commodities inventory and forward commitments may increase the volatility of our reported earning. Our net income is subject to volatility due to the manner in which we report our commodities inventory. This inventory is stated at the lower of cost or fair value. The Company generally mitigates the price risk associated with its commodities inventory through the use of derivatives. This price risk mitigation does not generally qualify for hedge
11
INTERNATIONAL ASSETS HOLDING CORPORATION
ANNUAL REPORT ON FORM 10-K FOR THE FISCAL YEAR ENDED SEPTEMBER 30, 2010
accounting under GAAP. In such situations, any unrealized gains in inventory are not recognized under GAAP, but unrealized gains and losses in related derivative positions are recognized under GAAP. Additionally, GAAP does not require us to reflect changes in estimated values of forward commitments to purchase and sell commodities. As a result, the Company’s reported earnings from this business segment are subject to greater volatility than the earnings from our other business segments.
Our substantial indebtedness could adversely affect our financial conditions. As of September 30, 2010, our total consolidated indebtedness to lenders and noteholders was approximately $132.1 million, and we expect to increase our indebtedness in the future as we continue to expand our business. Our indebtedness could have important consequences, including:
| • | increasing our vulnerability to general adverse economic and industry conditions |
| • | requiring that a portion of our cash flow from operations be used for the payment of interest on our debt, thereby reducing our ability to use our cash flow to fund working capital, capital expenditures, acquisitions and general corporate requirements |
| • | limiting our ability to obtain additional financing to fund future working capital, capital expenditures, acquisitions and general corporate requirements |
| • | limiting our flexibility in planning for, or reacting to, changes in our business and the securities industry |
| • | restricting our ability to pay dividends or make other payments |
| • | placing us at a competitive disadvantage to our competitors that have less indebtedness |
We may be able to incur additional indebtedness in the future, including secured indebtedness. If new indebtedness is added to our current indebtedness levels, the related risks that we now face could intensify.
Committed credit facilities currently available to the Company might not be renewed. As of December 15, 2010, we have three committed credit facilities under which we may borrow up to $290 million, consisting of:
| • | a $140 million facility available to our wholly-owned subsidiary, INTL Commodities, for its commodities trading activities, is committed until September 21, 2011 |
| • | a $75 million available to our wholly-owned subsidiary, FCStone, LLC, for short-term funding of margin to commodity exchanges, is committed until June 22, 2011 |
| • | a $75 million facility available to the Company and INTL Global Currencies, for general working capital requirements, is committed until October 1, 2013. This facility was established on October 1, 2010 and replaced two existing facilities for $60 million that were in place on September 30, 2010. |
We also have a $50 million uncommitted facility available to our wholly-owned subsidiary, FCStone Financial, for financing commodity repurchase agreements, terminating December 1, 2011. This facility was established on December 2, 2010.
It is possible that these facilities might not be renewed at the end of their commitment periods and that we will be unable to replace them with other facilities. If our credit facilities are unavailable or insufficient to support future levels of business activities, we may need to raise additional funds externally, either in the form of debt or equity. If we cannot raise additional funds on acceptable terms, we may not be able to develop or enhance our business, take advantage of future opportunities or respond to competitive pressure or unanticipated requirements, leading to reduced profitability.
The failure of the Company to successfully integrate the operations of businesses acquired by the Company in the last 15 months could have a material adverse effect on the Company’s business, financial condition and operating results. Since September 30, 2009, the Company has acquired several businesses, including FCStone, Risk Management Incorporated and RMI Consulting, Inc., Hanley Group, Provident Group and Hencorp Futures. We will need to meet significant challenges to realize the expected benefits and synergies of these acquisitions. These challenges include:
| • | integrating the management teams, strategies, cultures, technologies and operations of the acquired companies; |
| • | retaining and assimilating the key personnel of acquired companies; |
| • | retaining existing clients of the acquired companies; |
| • | creating uniform standards, controls, procedures, policies and information systems; and |
| • | achieving revenue growth because of risks involving (1) the ability to retain clients, (2) the ability to sell the services and products of the acquired companies to the existing clients of our other business segments, and (3) the ability to sell the services and products of our other business segments to the existing clients of the acquired companies. |
The accomplishment of these objectives will involve considerable risk, including:
| • | the potential disruption of each company’s ongoing business and distraction of their respective management teams; |
| • | unanticipated expenses related to technology integration; and |
| • | potential unknown liabilities associated with the acquisition. |
12
INTERNATIONAL ASSETS HOLDING CORPORATION
ANNUAL REPORT ON FORM 10-K FOR THE FISCAL YEAR ENDED SEPTEMBER 30, 2010
It is possible that the integration process could result in the loss of the technical skills and management expertise of key employees, the disruption of the ongoing businesses or inconsistencies in standards, controls, procedures and policies due to possible cultural conflicts or differences of opinions on technical decisions and product road maps that adversely affect the Company’s ability to maintain relationships with clients, software developers, customers and employees or to achieve the anticipated benefits of the acquisition.
We face risks associated with our market making and trading activities. We conduct our market-making and trading activities predominantly as a principal, which subjects our capital to significant risks. These activities involve the purchase, sale or short sale for customers and for our own account of financial instruments, including equity and debt securities, commodities and foreign exchange. These activities are subject to a number of risks, including risks of price fluctuations, rapid changes in the liquidity of markets and counterparty creditworthiness.
These risks may limit our ability to either resell financial instruments we purchased or to repurchase securities we sold in these transactions. In addition, we may experience difficulty borrowing financial instruments to make delivery to purchasers to whom we sold short, or lenders from whom we have borrowed. From time to time, we have large position concentrations in securities of a single issuer or issuers in specific countries and markets. This concentration could result in higher trading losses than would occur if our positions and activities were less concentrated.
The success of our market-making activities depends on:
| • | the price volatility of specific financial instruments, currencies and commodities |
| • | our ability to attract order flow |
| • | the skill of our personnel |
| • | the availability of capital |
| • | general market conditions |
To attract market-trading, market-making and trading business, we must be competitive in:
| • | providing enhanced liquidity to our customers |
| • | the efficiency of our order execution |
| • | the sophistication of our trading technology |
| • | the quality of our customer service |
In our role as a market maker and trader, we attempt to derive a profit from the difference between the prices at which we buy and sell financial instruments, currencies and commodities. However, competitive forces often require us to:
| • | match the quotes other market makers display; and |
| • | hold varying amounts of financial instruments, currencies and commodities in inventory. |
By having to maintain inventory positions, we are subject to a high degree of risk. We cannot ensure that we will be able to manage our inventory risk successfully or that we will not experience significant losses, either of which could materially adversely affect our business, financial condition and operating results.
We operate as a principal in the OTC derivatives markets which involves the risks associated with commodity derivative instruments. We offer OTC derivatives to our customers in which we act as a principal counterparty. We endeavor to simultaneously offset the commodity price risk of the instruments by establishing corresponding offsetting positions with commodity counterparties, or alternatively we may offset those transactions with similar but not identical positions on an exchange. To the extent that we are unable to simultaneously offset an open position or the offsetting transaction is not fully effective to eliminate the commodity derivative risk, we have market risk exposure on these unmatched transactions. Our exposure varies based on the size of the overall positions, the terms and liquidity of the instruments brokered, and the amount of time the positions remain open.
To the extent an unhedged position is not disposed of intra-day, adverse movements in the commodities underlying these positions or a downturn or disruption in the markets for these positions could result in a substantial loss. In addition, any principal gains and losses resulting from these positions could on occasion have a disproportionate effect, positive or negative, on our financial condition and results of operations for any particular reporting period.
Transactions involving OTC derivative contracts may be adversely affected by fluctuations in the level, volatility, correlation or relationship between market prices, rates, indices and/or other factors. These types of instruments may also suffer from illiquidity in the market or in a related market.
OTC derivative transactions are subject to unique risks. OTC derivative transactions are subject to the risk that, as a result of mismatches or delays in the timing of cash flows due from or to counterparties in OTC derivative transactions or related hedging, trading, collateral or other transactions, we or our counterparty may not have adequate cash available to fund its current obligations.
13
INTERNATIONAL ASSETS HOLDING CORPORATION
ANNUAL REPORT ON FORM 10-K FOR THE FISCAL YEAR ENDED SEPTEMBER 30, 2010
We could incur material losses pursuant to OTC derivative transactions because of inadequacies in or failures of our internal systems and controls for monitoring and quantifying the risk and contractual obligations associated with OTC derivative transactions and related transactions or for detecting human error, systems failure or management failure.
OTC derivative transactions may be modified or terminated only by mutual consent of the original parties and subject to agreement on individually negotiated terms. Accordingly it may not be possible to modify, terminate or offset obligations or exposure to the risk associated with a transaction prior to its scheduled termination date.
The current global financial crisis has heightened many of the risks to which the Company is exposed. The current financial crisis has increased many of the risks that accompany the Company’s business, including the risk of counterparty failure, the inability to obtain necessary financing and the absence of liquid markets. The continuation of the crisis may affect other aspects of the Company’s businesses for a variety of reasons. A general decrease in worldwide economic activity could reduce demand for Company’s equity market making and foreign exchange business, as well as volumes in FCStone’s commodity & risk management services and clearing and execution services segments. The substantial decline in commodities prices may affect the levels of business in the commodities trading segment. The ultimate effect of the crisis on the Company’s liquidity, financial condition and capital resources is unpredictable.
We may have difficulty managing our growth. Since October 1, 2005, we have experienced significant growth in our business. Our operating revenues grew from $35.1 million in the 2006 fiscal year to $269.0 million in 2010. The acquisition of additional businesses since September 30, 2009 is expected to increase operating revenues in 2011.
This growth has required and will continue to require us to increase our investment in management personnel, financial and management systems and controls, and facilities. In the absence of continued revenue growth, the costs associated with our expected growth would cause our operating margins to decline from current levels. In addition, as is common in the financial industry, we are and will continue to be highly dependent on the effective and reliable operation of our communications and information systems.
The scope of procedures for assuring compliance with applicable rules and regulations has changed as the size and complexity of our business has increased. In response, we have implemented and continue to revise formal compliance procedures.
It is possible that we will not be able to manage our growth successfully. Our inability to do so could have a material adverse effect on our business, financial condition and operating results.
We are exposed to the credit risk of our customers and counterparties and their failure to meet their financial obligations could adversely affect our business. We have substantial credit risk in both our securities and commodities businesses. As a market-maker of OTC and listed securities, the majority of our securities transactions are conducted as principal with broker-dealer counterparties located in the United States. We clear our securities transactions through an unaffiliated clearing broker. Substantially all of our equity and debt securities are held by this clearing broker. Our clearing broker has the right to charge us for losses that result from a counterparty’s failure to fulfill its contractual obligations.
As a clearing broker in futures and option transactions, we act on behalf of our customers for all trades consummated on exchanges. We must pay initial and variation margin to the exchanges before we receive the required payments from our customers. Accordingly, we are responsible for our customers’ obligations with respect to these transactions, including margin payments, which exposes us to significant credit risk. Customer positions which represent a significant percentage of open positions in a given market or concentrations in illiquid markets may expose us to the risk that we are not able to liquidate a customer’s position in a manner which does not result in a deficit in that customers account. A substantial part of our working capital is at risk if customers default on their obligations to us and their account balances and security deposits are insufficient to meet all of their obligations.
With over-the-counter derivative transactions we act as a principal, which exposes us to both the credit risk of our customers and the counterparties with which we offset the customer’s position. As with exchange traded transactions, our over-the-counter transactions require that we meet initial and variation margin payments on behalf of our customers before we receive the required payment from our customers. In addition, with over-the-counter transactions, there is a risk that a counterparty will fail to meet its obligations when due. We would then be exposed to the risk that a settlement of a transaction which is due a customer will not be collected from the respective counterparty with which the transaction was offset. Customers and counterparties that owe us money, securities or other assets may default on their obligations to us due to bankruptcy, lack of liquidity, operational failure or other reasons.
In this regard, during its fiscal year ended August 31, 2009, FCStone Group, Inc. recognized approximately $119.8 million in bad debt expense as a result of defaults by customer counterparties. Although the Company has adopted additional procedures that are designed to reduce the likelihood and magnitude of such credit losses, they are an inherent component of the business conducted by the Company, and the Company will continue to be subject to the risk of such losses.
14
INTERNATIONAL ASSETS HOLDING CORPORATION
ANNUAL REPORT ON FORM 10-K FOR THE FISCAL YEAR ENDED SEPTEMBER 30, 2010
We are responsible for self-clearing our foreign exchange and precious and base metals commodities trading activities and, in addition, take principal risk to counterparties and customers in these activities. Any metals or other physical commodities positions are held by third party custodians.
Although we have procedures for reviewing credit exposures to specific customers and counterparties to address present credit concerns, default risk may arise from events or circumstances that are difficult to detect or foresee including rapid changes in securities, commodity and foreign exchange price levels. Some of our risk management methods depend upon the evaluation of information regarding markets, clients or other matters that are publicly available or otherwise accessible by us. That information may not, in all cases, be accurate, complete, up-to-date or properly evaluated. In addition, concerns about, or a default by, one institution could lead to significant liquidity problems, losses or defaults by other institutions, which in turn could adversely affect us. We may be materially and adversely affected in the event of a significant default by our customers and counterparties.
In our securities and commodities trading businesses we rely on the ability of our clearing brokers to adequately discharge their obligations on a timely basis. We also depend on the solvency of our clearing brokers and custodians. Any failure by a clearing broker to adequately discharge its obligations on a timely basis, or insolvency of a clearing broker or custodian, or any event adversely affecting our clearing brokers or custodians, could have a material adverse effect on our business, financial condition and operating results.
Our revenues may decrease due to changes in market volume, prices or liquidity. Our revenues may decrease due to changes in market volume, prices, or liquidity. Declines in the volume of securities, commodities and foreign exchange transactions and in market liquidity generally may result in lower revenues from market-making and trading activities. Changes in price levels of securities and commodities and foreign exchange rates also may result in reduced trading activity and reduce our revenues from market-making transactions. Changed price levels also can result in losses from changes in the fair value of securities and commodities held in inventory. Sudden sharp changes in fair values of securities and commodities can result in:
| • | illiquid markets |
| • | fair value losses arising from positions held by the Company |
| • | the failure of buyers and sellers of securities and commodities to fulfill their settlement obligations |
| • | redemptions from funds managed in our asset management business segment and consequent reductions in management fees |
| • | reductions in accrued performance fees in our asset management business segment |
| • | increases in claims and litigation |
Any change in market volume, price or liquidity or any other of these factors could have a material adverse effect on our business, financial condition and operating results.
Our revenues may decrease due to changes in customer trading volumes which are dependent in large part on commodity prices and commodity price volatility, Customer trading volumes are largely driven by the degree of volatility—the magnitude and frequency of fluctuations—in prices of commodities. Higher volatility increases the need to hedge contractual price risk and creates opportunities for arbitrage trading. Energy and agricultural commodities markets have periodically experienced significant price volatility. In addition to price volatility, increases in commodity prices lead to increased trading volume. As prices of commodities have risen, especially energy prices, new participants have entered the markets to address their growing risk-management needs or to take advantage of greater trading opportunities. Sustained periods of stability in the prices of commodities or generally lower prices could result in lower trading volumes and, potentially, lower revenues. Lower volatility and lower volumes could lead to lower customer balances held on deposit, which in turn may reduce the amount of interest revenue based on these deposits.
Factors that are particularly likely to affect price volatility and price levels of commodities include:
| • | supply and demand of commodities, |
| • | weather conditions affecting certain commodities, |
| • | national and international economic and political conditions, |
| • | perceived stability of commodities and financial markets, |
| • | the level and volatility of interest rates and inflation, and |
| • | financial strength of market participants. |
Any one or more of these factors may reduce price volatility or price levels in the markets for commodities trading, which in turn could reduce trading activity in those markets. Moreover, any reduction in trading activity could reduce liquidity which in turn could further discourage existing and potential market participants and thus accelerate any decline in the level of trading activity in these markets.
15
INTERNATIONAL ASSETS HOLDING CORPORATION
ANNUAL REPORT ON FORM 10-K FOR THE FISCAL YEAR ENDED SEPTEMBER 30, 2010
Our revenues may be impacted by diminished market activity due to adverse economic, political and market conditions. The amount of our revenues depends in part on the level of activity in the securities, foreign exchange and commodities markets in which we conduct business. The level of activity in these markets is directly affected by numerous national and international factors that are beyond our control, including:
| • | economic, political and market conditions |
| • | the availability of short-term and long-term funding and capital |
| • | the level and volatility of interest rates |
| • | legislative and regulatory changes |
| • | currency values and inflation |
Any one or more of these factors may reduce the level of activity in these markets, which could result in lower revenues from our market-making and trading activities. Any reduction in revenues or any loss resulting from these factors could have a material adverse effect on our business, financial condition and operating results.
Multiple product lines of our business depend significantly on a limited group of customers. Based on management’s assessment of our business, we believe that a small number of our customers account for a significant portion of our revenues in multiple product lines of our businesses. These product lines include our equities market-making, metals trading and foreign exchange trading product lines. We are unable to measure the level of this concentration because our dealing activities do not permit us to quantify revenues generated by each customer. We expect a significant portion of the future demand for each of our market-making and trading services to remain concentrated within a limited number of customers. None of these customers is obligated contractually to use our market-making or trading services. Accordingly, these customers may direct their trading activities to other market-makers or traders at any time. The loss of or a significant reduction in demand for our services from any of these customers could have a material adverse effect on our business, financial condition and operating results.
We are dependent on our management team. Our future success depends, in large part, upon our management team who possess extensive knowledge and management skills with respect to securities, commodities and foreign exchange businesses operated by the Company. The unexpected loss of services of any of our executive officers could adversely affect our ability to manage our business effectively or execute our business strategy. Although these officers have employment contracts with us, they are generally not required to remain with us for a specified period of time. In addition, we maintain key-man life insurance policies on only two of our executive officers.
We depend on our ability to attract and retain key personnel. Competition for key personnel and other highly qualified management, sales, trading, compliance and technical personnel is significant. It is possible that we will be unable to retain our key personnel and to attract, assimilate or retain other highly qualified personnel in the future. The loss of the services of any of our key personnel or the inability to identify, hire, train and retain other qualified personnel in the future could have a material adverse effect on our business, financial condition and operating results.
From time to time, other companies in the financial sector have experienced losses of sales and trading professionals. The level of competition to attract these professionals is intense. It is possible that we will lose professionals due to increased competition or other factors in the future. The loss of a sales and trading professional, particularly a senior professional with broad industry expertise, could have a material adverse affect on our business, financial condition and operating results.
Computer systems failures, capacity constraints and breaches of security could increase our operating costs and cause us to lose clients. We are heavily dependent on the capacity and reliability of the computer and communications systems supporting our operations, whether owned and operated internally or by third parties. We receive and process a large portion of our trade orders through electronic means, such as through public and private communications networks. These computer and communications systems and networks are subject to performance degradation or failure from any number of reasons, including loss of power, acts of war or terrorism, human error, natural disasters, fire, sabotage, hardware or software malfunctions or defects, computer viruses, intentional acts of vandalism, customer error or misuse, lack of proper maintenance or monitoring and similar events. Our systems, or those of our third party providers, may fail or operate slowly, causing one or more of the following:
| • | unanticipated disruptions in service to our clients, |
| • | slower response times, |
| • | delays in our clients’ trade execution, |
| • | failed settlement of trades, |
| • | decreased client satisfaction with our services, |
| • | incomplete, untimely or inaccurate accounting, recording, reporting or processing of trades, |
| • | financial losses, |
16
INTERNATIONAL ASSETS HOLDING CORPORATION
ANNUAL REPORT ON FORM 10-K FOR THE FISCAL YEAR ENDED SEPTEMBER 30, 2010
| • | litigation or other client claims, and |
| • | regulatory sanctions. |
The occurrence of degradation or failure of the communications and computer systems on which we rely may lead to financial losses, litigation or arbitration claims filed by or on behalf of our customers and regulatory investigations and sanctions, including by the CFTC, which require that our trade execution and communications systems be able to handle anticipated present and future peak trading volumes. Any such degradation or failure could also have a negative effect on our reputation, which in turn could cause us to lose existing customers to our competitors or make it more difficult for us to attract new customers in the future. Further, any financial loss that we suffer as a result of such degradations or failures could be magnified by price movements of contracts involved in transactions impacted by the degradation or failure, and we may be unable to take corrective action to mitigate any losses we suffer.
We are subject to extensive government regulation. The securities and commodities futures industries are subject to extensive regulation under federal, state and foreign laws. In addition, the Securities and Exchange Commission, the Commodities Futures Trading Commission, FINRA, the NFA the CME and other self-regulatory organizations, commonly referred to as SROs, state securities commissions, and foreign securities regulators require strict compliance with their respective rules and regulations. These regulatory bodies are responsible for safeguarding the integrity of the financial markets and protecting the interests of participants in those markets.
As participants in various financial markets, we may be subject to regulation concerning certain aspects of our business, including:
| • | trade practices |
| • | the way we deal with and solicit clients |
| • | financial and reporting practices |
| • | client identification and anti-money laundering requirements |
| • | capital structure |
| • | record retention |
| • | the conduct of our directors, officers and employees |
Failure to comply with any of these laws, rules or regulations could result in adverse consequences. We and certain of our officers and employees have, in the past, been subject to claims arising from acts in contravention of these laws, rules and regulations. These claims have resulted in the payment of fines and settlements. It is possible that we and our officers and other employees will, in the future, be subject to similar claims. An adverse ruling against us or our officers and other employees could result in our or our officers and other employees being required to pay a substantial fine or settlement and could result in suspension or expulsion. This could have a material adverse effect on our business, financial condition and operating results.
The regulatory environment in which we operate is subject to change. New or revised legislation or regulations imposed by the SEC, the CFTC, other United States or foreign governmental regulatory authorities, SROs or FINRA could have a material adverse effect on our business, financial condition and operating results. Changes in the interpretation or enforcement of existing laws and rules by these governmental authorities, SROs and FINRA could also have a material adverse effect on our business, financial condition and operating results.
Additional regulation, changes in existing laws and rules, or changes in interpretations or enforcement of existing laws and rules often directly affect securities firms. We cannot predict what effect any such changes might have. Our business, financial condition and operating results may be materially affected by both regulations that are directly applicable to us and regulations of general application. Our level of trading and market-making activities can be affected not only by such legislation or regulations of general applicability, but also by industry-specific legislation or regulations.
Passage of the Dodd-Frank Wall Street Reform and Consumer Protection Act will increase our operational and compliance costs. The Dodd-Frank Act contains a variety of provisions designed to regulate financial markets, including credit and derivatives transactions. The Dodd-Frank Act requires various federal agencies to adopt a broad range of new rules and regulations, and to prepare numerous studies and reports for Congress. The federal agencies are given significant discretion in drafting the rules and regulations, and consequently, many of the details and much of the impact of the Dodd-Frank Act may not be known for many months or years.
The Dodd-Frank Act will require publicly traded companies to give stockholders a non-binding vote on executive compensation and so-called “golden parachute” payments, and authorizes the SEC to promulgate rules that would allow stockholders to nominate their own candidates using a company’s proxy materials.
17
INTERNATIONAL ASSETS HOLDING CORPORATION
ANNUAL REPORT ON FORM 10-K FOR THE FISCAL YEAR ENDED SEPTEMBER 30, 2010
It is difficult to predict at this time what specific impact the Dodd-Frank Act and the yet to be written implementing rules and regulations will have. However, it is expected that at a minimum they will increase our operating and compliance costs.
We are subject to net capital requirements. The SEC, FINRA and various other regulatory agencies require our broker-dealer subsidiaries, INTL Trading and FCC Investments, Inc. to maintain specific levels of net capital. Failure to maintain the required net capital may subject these subsidiaries to suspension or revocation of registration by the SEC and suspension or expulsion by FINRA and other regulatory bodies.
The CFTC and various other self-regulatory organizations require our futures commission merchant subsidiary, FCStone, LLC, to maintain specific levels of net capital. Failure to maintain the required net capital may subject this subsidiary to limitations on its activities, including suspension or revocation of its registration by the CFTC and suspension or expulsion by the NFA and various exchanges of which it is a member.
Ultimately, any failure to meet capital requirements by our securities broker-dealer subsidiaries or our FCM subsidiary could result in liquidation of the subsidiary. Failure to comply with the net capital rules could have material and adverse consequences such as limiting their operations, or restricting the Company from withdrawing capital from these subsidiaries.
In addition, a change in the net capital rules, the imposition of new rules or any unusually large charge against net capital could limit our operations that require the intensive use of capital. They could also restrict our ability to withdraw capital from these subsidiaries. Any limitation on our ability to withdraw capital could limit our ability to pay cash dividends, repay debt and repurchase shares of our outstanding stock. A significant operating loss or any unusually large charge against net capital could adversely affect our ability to expand or even maintain our present levels of business, which could have a material adverse effect on our business, financial condition and operating results.
We are subject to margin funding requirements on short notice. Our business involves establishment and carrying of substantial open positions for customers on futures exchanges and in the OTC derivatives markets. We are required to post and maintain margin or credit support for these positions. Although we collect margin or other deposits from our customers for these positions, significant adverse price movements can occur which will require us to post margin or other deposits on short notice, whether or not we are able to collect additional margin or credit support from our customers. We maintain borrowing facilities for the purpose of funding margin and credit support and have systems to endeavor to collect margin and other deposits from customers on a same-day basis, there can be no assurance that these facilities and systems will be adequate to eliminate the risk of margin calls in the event of severe adverse price movements affecting open positions of our customers. Generally, if a customer is unable to meet its margin call, we promptly liquidate the customer’s account. However, there can be no assurance that in each case the liquidation of the account will not result in a loss to us or that a liquidation will be feasible, given market conditions, size of the account and tenor of the positions.
Low short-term interest rates negatively impact our profitability. The level of prevailing short-term interest rates affects our profitability because a portion of our revenue is derived from interest earned from the investment of funds deposited with us by our customers. At September 30, 2010, we had $1.2 billion in customer segregated assets, which are generally invested in short-term treasury securities and money market funds. Our financial performance generally benefits from rising interest rates. Higher interest rates increase the amount of interest income earned from these customer deposits. If short-term interest rates remain low or continue to fall, our revenues derived from interest will decline which would negatively impact our profitability.
Short-term interest rates are highly sensitive to factors that are beyond our control, including general economic conditions and the policies of various governmental and regulatory authorities. In particular, decreases in the federal funds rate by the Board of Governors of the Federal Reserve System usually lead to decreasing interest rates in the U.S., which generally lead to a decrease in short-term interest rates.
We may issue additional equity securities. The issuance of additional common stock or securities convertible into our common stock could result in dilution of the ownership interest in us held by existing stockholders. We are authorized to issue, without stockholder approval, a significant number of additional shares of our common stock and securities convertible into either common stock or preferred stock.
We are subject to risks relating to litigation and potential securities laws liability. We face significant legal risks in our businesses, including risks related to currently pending litigation involving both the Company and FCStone. Many aspects of our business involve substantial risks of liability, including liability under federal and state securities and commodities laws, other federal, state and foreign laws and court decisions, as well as rules and regulations promulgated by the SEC, the CFTC, FINRA and other regulatory bodies. Substantial legal liability or significant regulatory action against us and our subsidiaries could have material adverse financial effects or cause significant reputational harm to us, which in turn could seriously harm our business prospects. In addition, we face increased litigation risk as a result of the FCStone acquisition. Any such litigation could lead to more volatility of our stock price.
18
INTERNATIONAL ASSETS HOLDING CORPORATION
ANNUAL REPORT ON FORM 10-K FOR THE FISCAL YEAR ENDED SEPTEMBER 30, 2010
For a further discussion of litigation risks, see Item 3—Legal Proceedings below and “Note 15—Commitments and Contingencies” in the Consolidated Financial Statements.
We may be subject to potentially large claims for violations of environmental laws. Our base metals trading business may be subject to potential claims under certain federal, state and foreign environmental laws. This business involves the purchase and sale of base metals such as lead and other potentially hazardous materials. As part of this business, we engage third parties located both in the United States and in other countries to acquire, store, transport and recycle used automotive and industrial batteries on our behalf. In the event that these third parties fail to comply with federal, state or foreign environmental laws in handling or disposing of these batteries and other hazardous substances used in or arising from the recycling of these batteries, we may be exposed to claims for the cost of remediating sites impacted by such improper handling and disposal, as well as other related costs. We seek to mitigate this risk by dealing with third parties who we believe are in compliance with applicable laws and who have established reputations in the industry.
We are subject to intense competition. We derive a significant portion of our revenues from market-making and trading activities involving securities and commodities. The market for these services, particularly market-making services through electronic communications gateways, is rapidly evolving and intensely competitive. We expect competition to continue and intensify in the future. We compete primarily with wholesale, national, and regional broker-dealers and FCM’s, as well as electronic communications networks. We compete primarily on the basis of our expertise and quality of service.
We also derive a significant portion of our revenues from commodities risk management services. The commodity risk management industry is very competitive and we expect competition to continue to intensify in the future. Our primary competitors in this industry include both large, diversified financial institutions and commodity-oriented businesses, smaller firms that focus on specific products or regional markets and independent FCM’s.
A number of our competitors have significantly greater financial, technical, marketing and other resources than we have. Some of them may:
| • | offer alternative forms of financial intermediation as a result of superior technology and greater availability of information |
| • | offer a wider range of services and products than we offer |
| • | be larger and better capitalized |
| • | have greater name recognition |
| • | have more extensive customer bases |
These competitors may be able to respond more quickly to new or evolving opportunities and customer requirements. They may also be able to undertake more extensive promotional activities and offer more attractive terms to customers. Recent advances in computing and communications technology are substantially changing the means by which market-making services are delivered, including more direct access on-line to a wide variety of services and information. This has created demand for more sophisticated levels of customer service. Providing these services may entail considerable cost without an offsetting increase in revenues. In addition, current and potential competitors have established or may establish cooperative relationships or may consolidate to enhance their services and products. New competitors or alliances among competitors may emerge and they may acquire significant market share.
We cannot assure you that we will be able to compete effectively with current or future competitors or that the competitive pressures we face will not have a material adverse effect on our business, financial condition and operating results.
Our business could be adversely affected if we are unable to retain our existing customers or attract new customers. The success of our business depends, in part, on our ability to maintain and increase our customer base. Customers in our market are sensitive to, among other things, the costs of using our services, the quality of the services we offer, the speed and reliability of order execution and the breadth of our service offerings and the products and markets to which we offer access. We may not be able to continue to offer the pricing, service, speed and reliability of order execution or the service, product and market breadth that customers desire. In addition, once our risk management consulting customers have become better educated with regard to sources of risk and the tools available to facilitate the management of this risk and we have provided them with recommended hedging strategies, they may no longer continue paying monthly fees for these services. Furthermore, our existing customers, including IRMP customers, are not generally obligated to use our services and can switch providers of clearing and execution services or decrease their trading activity conducted through us at any time. As a result, we may fail to retain existing customers or be unable to attract new customers. Our failure to maintain or attract customers could have a material adverse effect on our business, financial condition and operating results.
We rely on relationships with introducing brokers for obtaining some of our customers. The failure to maintain these relationships could adversely affect our business. We have relationships with introducing brokers who assist us in establishing new customer relationships and provide marketing and customer service functions for some of our customers. These
19
INTERNATIONAL ASSETS HOLDING CORPORATION
ANNUAL REPORT ON FORM 10-K FOR THE FISCAL YEAR ENDED SEPTEMBER 30, 2010
introducing brokers receive compensation for introducing customers to us. Many of our relationships with introducing brokers are non-exclusive or may be cancelled on relatively short notice. In addition, our introducing brokers have no obligation to provide new customer relationships or minimum levels of transaction volume. Our failure to maintain these relationships with these introducing brokers or the failure of these introducing brokers to establish and maintain customer relationships would result in a loss of revenues, which could adversely affect our business.
Certain provisions of Delaware law and our charter may adversely affect the rights of holders of our common stock and make a takeover of us more difficult. We are organized under the laws of the State of Delaware. Certain provisions of Delaware law may have the effect of delaying or preventing a change in control. In addition, certain provisions of our certificate of incorporation may have anti-takeover effects and may delay, defer or prevent a takeover attempt that a stockholder might consider in its best interest. Our certificate provides for a staggered board, so that it would take three successive annual meting to replace the entire board of directors. Our certificate of incorporation authorizes the board to determine the terms of our unissued series of preferred stock and to fix the number of shares of any series of preferred stock without any vote or action by our stockholders. As a result, the board can authorize and issue shares of preferred stock with voting or conversion rights that could adversely affect the voting or other rights of holders of our common stock. In addition, the issuance of preferred stock may have the effect of delaying or preventing a change of control, because the rights given to the holders of a series of preferred stock may prohibit a merger, reorganization, sale, liquidation or other extraordinary corporate transaction.
Our stock price is subject to volatility. The market price of our common stock has been and can be expected to be subject to fluctuation as a result of a variety of factors, many of which are beyond our control, including:
| • | actual or anticipated variations in our results of operations |
| • | announcements of new products by us or our competitors |
| • | technological innovations by us or our competitors |
| • | changes in earnings estimates or buy/sell recommendations by financial analysts |
| • | the operating and stock price performance of other companies |
| • | general market conditions or conditions specific in specific markets |
| • | conditions or trends affecting our industry or the economy generally |
| • | announcements relating to strategic relationships or acquisitions |
| • | risk factors and uncertainties set forth elsewhere in this Form 10-K |
Because of this volatility, we may fail to meet the expectations of our stockholders or of securities analysts, and the trading prices of our common stock could decline as a result. In addition, any negative change in the public’s perception of the securities industry could depress our stock price regardless of our operating results.
Future sales by existing stockholders could depress the market price of our common stock. If our stockholders sell substantial amounts of our common stock in the public market, the market price of our common stock could fall. Such sales also might make it more difficult for us to sell equity securities in the future at a time and price that we deem appropriate.
Our international operations involve special challenges that we may not be able to meet, which could adversely affect our financial results. Our international operations involve special challenges that we may not be able to meet, which could adversely affect our financial results. We engage in a significant amount of business with customers in the international markets. Certain additional risks are inherent in doing business in international markets, particularly in a regulated industry. These risks include:
| • | the inability to manage and coordinate the various regulatory requirements of multiple jurisdictions that are constantly evolving and subject to unexpected change, |
| • | tariffs and other trade barriers, |
| • | difficulties in recruiting and retaining personnel, and managing international operations, |
| • | difficulties of debt collection in foreign jurisdictions, |
| • | potentially adverse tax consequences, and |
| • | reduced protection for intellectual property rights. |
Our operations are also subject to the political, legal and economic risks associated with politically unstable and less developed regions of the world, including the risk of war and other international conflicts and actions by governmental authorities, insurgent groups, terrorists and others. Specifically, we conduct business in countries whose currencies may be unstable. Future instability in such currencies or the imposition of governmental or regulatory restrictions on such currencies could impede our foreign exchange business and our ability to collect on collateral held in such currencies.
In addition, we are required to comply with the laws and regulations of foreign governmental and regulatory authorities of each country in which we conduct business. These may include laws, rules and regulations, including registration
20
INTERNATIONAL ASSETS HOLDING CORPORATION
ANNUAL REPORT ON FORM 10-K FOR THE FISCAL YEAR ENDED SEPTEMBER 30, 2010
requirements. Our compliance with these laws and regulations may be difficult and time consuming and may require significant expenditures and personnel requirements, and our failure to be in compliance would subject us to legal and regulatory liabilities. We have customers in numerous countries around the world in which we are not registered. As a result, we may become subject to the regulatory requirements of those countries. We may also experience difficulty in managing our international operations because of, among other things, competitive conditions overseas, established domestic markets, language and cultural differences and economic or political instability. Any of these factors could have a material adverse effect on the success of our international operations or limit our ability to grow our international operations and, consequently, on our business, financial condition and operating results.
If we are unable to manage any of these risks effectively, our business could be adversely affected.
| Item 1B. | Unresolved Staff Comments |
We have received no written comments regarding our periodic or current reports from the staff of the SEC that were issued 180 days or more preceding the end of our fiscal year 2010 that remain unresolved.
| Item 2. | Properties |
The Company maintains offices in New York, New York; Winter Park, Florida; West Des Moines, Iowa; Chicago, Illinois; Kansas City, Missouri; St. Louis, Missouri; Omaha, Nebraska; Minneapolis, Minnesota; Bloomington, Illinois; Miami, Florida; New Smyrna Beach, Florida; Indianapolis, Indiana; Spirit Lake, Iowa; Bowling Green, Ohio; Nashville, Tennessee; Castle Rock, Colorado; Topeka, Kansas; Winnipeg, Canada; Calgary, Canada; Buenos Aires, Argentina; Campinas, Brazil; Sao Paulo, Brazil; Montevideo, Uruguay; London, United Kingdom; Dublin, Ireland; Dubai, United Arab Emirates; Singapore, Singapore; Beijing and Shanghai, China; and Sydney, Australia.
All of our offices and other principal business properties are leased, except for the space in Buenos Aires, which we own. We believe that our leased facilities are adequate to meet anticipated requirements for our current lines of business.
| Item 3. | Legal Proceedings |
Securities Litigation
FCStone and certain officers of FCStone were named as defendants in an action filed in the United States District Court for the Western District of Missouri on July 15, 2008. A consolidated amended complaint was subsequently filed on September 25, 2009. The action, which purports to be brought as a class action on behalf of purchasers of FCStone common stock between November 15, 2007 and February 24, 2009, seeks to hold defendants liable under Section 10(b) and Section 20(a) of the Securities Exchange Act of 1934 for allegedly false statements and failure to disclose adverse facts relating to an interest rate hedge, the bad debt reserve of FCStone and losses sustained by FCStone in connection with a customer’s energy trades. FCStone filed a motion to dismiss this amended complaint, along with supporting documents, on November 24, 2009. On November 16, 2010, the Court denied FCStone’s motion to dismiss and granted the plaintiffs leave to amend the complaint on or before December 15, 2010.
A purported shareholder derivative action was filed against FCStone (solely as a nominal defendant) and certain officers and directors of FCStone in August 2008 in the Circuit Court of Platte County, Missouri, alleging breaches of fiduciary duties, waste of corporate assets and unjust enrichment. An amended complaint was subsequently filed in May 2009 to add claims based upon the losses sustained by FCStone arising out of a customer’s energy trading account. On July 2, 2009 FCStone filed a motion to dismiss and supporting documents. On July 7, 2009, the same plaintiff filed a motion for leave to amend the existing case to add a purported class action claim on behalf of the holders of FCStone common stock.
On July 8, 2009, a purported class action complaint was filed against FCStone and its directors, as well as International Assets Holding Corporation and International Assets Acquisition Corporation in the Circuit Court of Clay County, Missouri by two individuals who purported to be stockholders of FCStone. The plaintiffs purported to bring this action on behalf of all stockholders of FCStone. The complaint alleged that FCStone and its directors breached their fiduciary duties by failing to maximize stockholder value in connection with the contemplated acquisition of FCStone by International Assets Holding Corporation. The complaint also alleged that FCStone, International Assets Holding Corporation and International Assets Acquisition Corporation aided and abetted the directors’ alleged breach of fiduciary duties. The plaintiffs sought to permanently enjoin the transaction between FCStone and International Assets Holding Corporation, monetary damages in an unspecified amount attributable to the alleged breach of duties, and legal fees and expenses. The plaintiffs did not succeed in enjoining the transaction. This complaint was subsequently consolidated with the complaint filed in the Circuit Court of Platte County, Missouri, and will fall under the jurisdiction of that court. A combined, amended complaint was served on the
21
INTERNATIONAL ASSETS HOLDING CORPORATION
ANNUAL REPORT ON FORM 10-K FOR THE FISCAL YEAR ENDED SEPTEMBER 30, 2010
defendants in January 2010. All of the defendants intend to defend against the complaint vigorously. The defendants filed a notice to dismiss in February, 2010, the plaintiffs filed their opposition to this in April, 2010 and supplemental filings were made in September and October, 2010.
Sentinel Litigation
In August 2008, the bankruptcy trustee of Sentinel Management Group, Inc. (“Sentinel”) filed adversary proceedings against one of the Company’s subsidiaries, FCStone, LLC, and a number of other FCM’s in the Bankruptcy Court, subsequently reassigned within the United States District Court, for the Northern District of Illinois seeking avoidance of alleged transfers or withdrawals of funds received by the Company and other FCM’s within 90 days prior to the filing of the Sentinel bankruptcy petition, as well as avoidance of post-petition distributions and disallowance of the proof of claim filed by FCStone, LLC. The trustee seeks recovery of pre- and post-petition transfers totaling approximately $15.5 million and, in April, 2009, filed an amended complaint adding a claim for unjust enrichment. FCStone, LLC has answered the complaints and all parties have entered into the discovery phase of the litigation. Trial in this matter is expected to be during 2011. FCStone, LLC intends to defend the matter vigorously, and to coordinate its defense with the other FCM’s.
Convertible Noteholder Litigation
In November, 2009, an investor in a principal amount of $3.7 million of the Company’s senior subordinated convertible notes due 2011 (the “Notes”), Portside Growth and Opportunity Fund (“Portside”), managed by Ramius LLC, served a notice of motion for summary judgment on the Company, claiming that the FCStone transaction resulted in a change of control as defined in the Notes; and that, as a result, the Company should have afforded Portside the opportunity to have the Notes redeemed at a 15% premium. Portside is also claiming default interest at the rate of 15% per annum established in the Notes. Portside’s motion was denied in March, 2010. Portside filed an amended complaint in April, 2010. The remaining three holders of the notes, Highbridge International LLC, LBI Group Inc. and Iroquois Master Fund Ltd., holding Notes in an aggregate amount of $13.0 million, filed a similar lawsuit on the Company on October 20, 2010.
On December 14, 2010 Portside delivered a Conversion Notice to the Company in compliance with the terms of the relevant agreement. The principal amount and accrued interest will convert into 173,966 shares of common stock of the Company. This conversion supersedes Portside’s claim for redemption at a premium.
The Company is of the view that the FCStone transaction did not result in a change of control as defined in the Notes and intends to vigorously defend the lawsuit brought by the remaining three holders of the Notes. In the event that the Company does not prevail in this litigation, then the Company would be obligated to pay to the Noteholders the principal amount of the Notes, the premium of 15%, accrued interest and attorneys’ fees.
We are currently unable to predict the outcome of these claims and believe their current status does not warrant accrual under the guidance of the Contingencies Topic of the Accounting Standards Codification, since the amount of any liability is neither probable nor reasonably estimable. As such, no amounts have been accrued in the financial statements. We intend to vigorously defend the claims against us and will continue to monitor the litigation and assess the need for future accruals. In light of the nature of the Company’s activities, it is possible that the Company may be involved in litigation in the future, which could have a material adverse impact on the Company and its financial condition and results of operations.
From time to time and in the ordinary course of our business, we are a plaintiff or are a defendant in other legal proceedings related to various issues, including worker’s compensation claims, tort claims, contractual disputes and collections. We carry insurance that provides protection against certain types of claims, up to the policy limits of our insurance. It is the opinion of management that none of the other known legal actions will have a material adverse impact on our financial position, results of operations or liquidity.
22
INTERNATIONAL ASSETS HOLDING CORPORATION
ANNUAL REPORT ON FORM 10-K FOR THE FISCAL YEAR ENDED SEPTEMBER 30, 2010
PART II
| Item 5. | Market for Registrant’s Common Equity, Related Stockholder Matters and Issuer Purchases of Equity Securities |
The Company’s common stock is listed on The NASDAQ Stock Market LLC (“NASDAQ”) under the symbol ‘IAAC’. The Company’s stock trades on the NASDAQ Global Market. As of September 30, 2010, there were 272 registered holders of record of the Company’s common stock. The high and low sales prices per share of the Company’s common stock for each full quarterly period during fiscal 2010 and 2009 were as follows:
| Price Range | ||||||||
| High | Low | |||||||
| 2010: |
||||||||
| Fourth Quarter |
$ | 18.91 | $ | 15.54 | ||||
| Third Quarter |
$ | 16.96 | $ | 14.90 | ||||
| Second Quarter |
$ | 17.25 | $ | 14.20 | ||||
| First Quarter |
$ | 19.97 | $ | 14.03 | ||||
| 2009: |
||||||||
| Fourth Quarter |
$ | 18.90 | $ | 12.50 | ||||
| Third Quarter |
$ | 16.95 | $ | 9.35 | ||||
| Second Quarter |
$ | 11.82 | $ | 6.25 | ||||
| First Quarter |
$ | 27.75 | $ | 5.29 | ||||
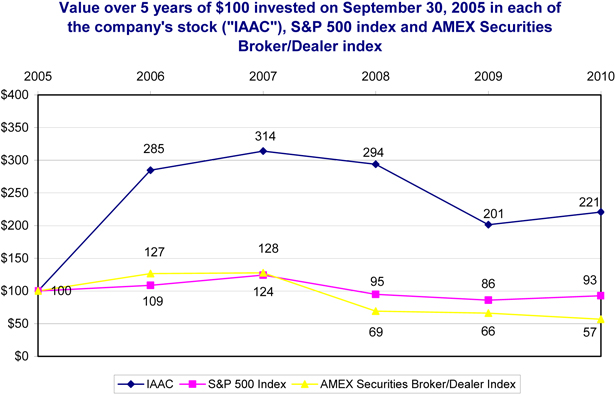
The Company has never declared any cash dividends on its common stock, and does not currently have any plans to pay dividends on its common stock. The payment of cash dividends in the future is subject to the discretion of the Board of Directors and will depend on the Company’s earnings, financial condition, capital requirements, contractual restrictions and other relevant factors. The Company’s credit agreements currently prohibit the payment of cash dividends by the Company.
On November 20, 2008, the Company’s Board of Directors renewed the Company’s share repurchase authorization for $5.0 million in shares of the Company’s common stock. There were no repurchases during the fiscal year ended September 30, 2009 or first quarter ended December 30, 2009, and the share repurchase authorization expired November 20, 2009.
23
INTERNATIONAL ASSETS HOLDING CORPORATION
ANNUAL REPORT ON FORM 10-K FOR THE FISCAL YEAR ENDED SEPTEMBER 30, 2010
Information relating to compensation plans under which our equity securities are authorized for issuance is set forth in Part III, Item 12 of our Annual Report on Form 10-K.
24
INTERNATIONAL ASSETS HOLDING CORPORATION
ANNUAL REPORT ON FORM 10-K FOR THE FISCAL YEAR ENDED SEPTEMBER 30, 2010
| Item 6. | Selected Financial Data |
The following selected financial and operating data are derived from our consolidated financial statements and should be read in conjunction with Management’s Discussion and Analysis of Financial Condition and Results of Operations, included in Item 7 and our consolidated financial statements included in Item 8. The income statement data for 2010 reflects the results of FCStone, which was acquired on September 30, 2009. The income statement data for 2006 through 2009 does not include the results of FCStone.
| Selected Summary Financial Information (GAAP) | ||||||||||||||||||||
| Year Ended September 30, | ||||||||||||||||||||
| (in millions, except share and per share numbers) |
2010 | 2009 | 2008 | 2007 | 2006 | |||||||||||||||
| Operating revenues |
$ | 269.0 | $ | 90.6 | $ | 114.9 | $ | 45.7 | $ | 35.1 | ||||||||||
| Interest expense |
9.9 | 8.0 | 11.2 | 9.3 | 2.1 | |||||||||||||||
| Non-interest expenses: |
||||||||||||||||||||
| —Compensation |
104.2 | 40.2 | 35.6 | 28.5 | 16.4 | |||||||||||||||
| —Clearing |
68.2 | 16.0 | 13.1 | 11.2 | 7.6 | |||||||||||||||
| —Other |
68.8 | 13.1 | 12.7 | 6.9 | 3.9 | |||||||||||||||
| Income (loss) from operations, before tax and discontinued operations |
17.9 | 13.3 | 42.3 | (10.2 | ) | 5.1 | ||||||||||||||
| Income tax expense |
6.4 | 2.6 | 16.2 | (3.4 | ) | 1.6 | ||||||||||||||
| Loss (income) from discontinued operations, net of tax |
(0.6 | ) | 1.1 | (1.0 | ) | (1.7 | ) | — | ||||||||||||
| Net income (loss) before extraordinary loss (income) |
12.1 | 9.6 | 27.1 | (5.1 | ) | 3.5 | ||||||||||||||
| Extraordinary loss (income) |
7.0 | (18.5 | ) | — | — | — | ||||||||||||||
| Net income (loss) |
5.1 | 28.1 | 27.1 | (5.1 | ) | 3.5 | ||||||||||||||
| Less: Net (loss) income attributable to noncontrolling interests |
(0.3 | ) | 0.5 | (0.7 | ) | (0.6 | ) | — | ||||||||||||
| Net income (loss) attributable to International Assets Holding Corporation common shareholders |
$ | 5.4 | $ | 27.6 | $ | 27.8 | $ | (4.5 | ) | $ | 3.5 | |||||||||
| Earnings (loss) per share: |
||||||||||||||||||||
| —Basic |
$ | 0.31 | $ | 3.11 | $ | 3.30 | $ | (0.56 | ) | $ | 0.45 | |||||||||
| —Diluted |
$ | 0.30 | $ | 2.80 | $ | 2.95 | $ | (0.56 | ) | $ | 0.41 | |||||||||
| Number of shares: |
||||||||||||||||||||
| —Basic |
17,306,019 | 8,895,697 | 8,434,976 | 8,086,837 | 7,636,808 | |||||||||||||||
| —Diluted |
17,883,233 | 10,182,586 | 9,901,706 | 8,086,837 | 8,387,761 | |||||||||||||||
| Selected Balance Sheet Information: |
||||||||||||||||||||
| Total assets |
$ | 2,021.7 | $ | 1,555.7 | $ | 438.0 | $ | 361.2 | $ | 199.9 | ||||||||||
| Convertible notes |
$ | 16.7 | $ | 16.7 | $ | 16.8 | $ | 24.9 | $ | 26.9 | ||||||||||
| Shareholders’ equity |
$ | 241.3 | $ | 238.8 | $ | 74.8 | $ | 35.6 | $ | 33.9 | ||||||||||
| Leverage ratio: Total assets : Equity |
8.4 | 6.5 | 5.9 | 10.1 | 5.9 | |||||||||||||||
25
INTERNATIONAL ASSETS HOLDING CORPORATION
ANNUAL REPORT ON FORM 10-K FOR THE FISCAL YEAR ENDED SEPTEMBER 30, 2010
Adjusted Non-GAAP Financial Information (Unaudited)
| Year Ended September 30, | ||||||||||||||||||||
| (in millions, except ratio) |
2010 | 2009 | 2008 | 2007 | 2006 | |||||||||||||||
| U.S. GAAP Data: |
||||||||||||||||||||
| Operating revenues |
$ | 269.0 | $ | 90.6 | $ | 114.9 | $ | 45.7 | $ | 35.1 | ||||||||||
| Income (loss) from operations, before tax and discontinued operations |
$ | 17.9 | $ | 13.3 | $ | 42.3 | $ | (10.2 | ) | $ | 5.1 | |||||||||
| Net income attributable to International Assets Holding Corporation common shareholders (a) |
$ | 5.4 | $ | 27.6 | $ | 27.8 | $ | (4.5 | ) | $ | 3.5 | |||||||||
| Shareholders’ equity (a) |
$ | 241.3 | $ | 238.8 | $ | 74.8 | $ | 35.6 | $ | 33.9 | ||||||||||
| Adjusted Non-GAAP Data (Unaudited): |
||||||||||||||||||||
| Data adjusted (on a marked to market basis): |
||||||||||||||||||||
| Operating revenues as stated above |
$ | 269.0 | $ | 90.6 | $ | 114.9 | $ | 45.7 | $ | 35.1 | ||||||||||
| Marked-to-market adjustment |
6.0 | 6.9 | (26.9 | ) | 23.4 | 7.6 | ||||||||||||||
| Adjusted operating revenues, marked to market |
$ | 275.0 | $ | 97.5 | $ | 88.0 | $ | 69.1 | $ | 42.7 | ||||||||||
| Income (loss) from operations, before tax and discontinued operations, as stated above |
$ | 17.9 | $ | 13.3 | $ | 42.3 | $ | (10.2 | ) | $ | 5.1 | |||||||||
| Marked-to-market adjustment |
6.0 | 6.9 | (26.9 | ) | 23.4 | 7.6 | ||||||||||||||
| Adjusted income from operations, before tax |
$ | 23.9 | $ | 20.2 | $ | 15.4 | $ | 13.2 | $ | 12.7 | ||||||||||
| Net income attributable to International Assets Holding Corporation common shareholders, as stated above |
$ | 5.4 | $ | 27.6 | $ | 27.8 | $ | (4.5 | ) | $ | 3.5 | |||||||||
| Marked-to-market adjustment |
6.0 | 6.9 | (26.9 | ) | 23.4 | 7.6 | ||||||||||||||
| Tax effect at blended rate of 37.5% |
(2.3 | ) | (2.5 | ) | 10.1 | (8.8 | ) | (2.9 | ) | |||||||||||
| Adjusted net income attributable to International Assets Holding Corporation common shareholders |
$ | 9.1 | $ | 32.0 | $ | 11.0 | $ | 10.1 | $ | 8.2 | ||||||||||
| Shareholders’ equity, as stated above |
$ | 241.3 | $ | 238.8 | $ | 74.8 | $ | 35.6 | $ | 33.9 | ||||||||||
| Cumulative marked-to-market adjustment |
17.0 | 11.0 | 4.1 | 31.0 | 7.6 | |||||||||||||||
| Tax effect at blended rate of 37.5% |
(6.4 | ) | (4.1 | ) | (1.6 | ) | (11.7 | ) | (2.9 | ) | ||||||||||
| Adjusted shareholders’ equity (non-GAAP) |
$ | 251.9 | $ | 245.7 | $ | 77.3 | $ | 54.9 | $ | 38.6 | ||||||||||
| Return on average adjusted stockholders’ equity (b) |
4.9 | % | 16.0 | % | 16.6 | % | 21.6 | % | 24.6 | % | ||||||||||
| Other Data: |
||||||||||||||||||||
| Employees (c) |
729 | 625 | 195 | 170 | 89 | |||||||||||||||
| Compensation and benefits / adjusted operating revenues |
37.9 | % | 41.2 | % | 40.5 | % | 41.2 | % | 38.4 | % | ||||||||||
| Leverage ratio: (total assets to adjusted shareholders’ equity) |
8.0 | 6.3 | 5.7 | 6.6 | 5.2 | |||||||||||||||
| (a) | Net income and stockholders’ equity for 2010 includes a $7.0 million extraordinary loss resulting from purchase price adjustments and the correction of immaterial errors related to the FCStone transaction. Net income and stockholders’ equity for 2009 includes an $18.5 million extraordinary gain related to the FCStone transaction. |
| (b) | Return on average adjusted stockholders’ equity for 2010 excludes the effect of the $7.0 million extraordinary loss resulting from purchase price adjustments and the correction of immaterial errors related to the FCStone transaction. Return on average adjusted stockholders’ equity for 2009 excludes the effect of an $18.5 million extraordinary gain related to the FCStone transaction. |
| (c) | The number of employees listed in 2009 includes the number of employees of FCStone as of September 30, 2009. |
As discussed in previous filings and elsewhere in this Form 10-K, U.S. GAAP requires the Company to carry derivatives at fair market value but physical commodities inventory at the lower of cost or fair value. These requirements may have a significant temporary impact on our reported earnings. Under U.S. GAAP, gains and losses on commodities inventory and derivatives which the Company intends to be offsetting are often recognized in different periods. Additionally, U.S. GAAP does not require us to reflect changes in estimated values of forward commitments to purchase and sell commodities.
For these reasons, management primarily assesses the Company’s operating results on a marked-to-market basis. Management relies on these adjusted operating results to evaluate the performance of the Company’s commodities business segment and its personnel.
The Unaudited Adjusted Data in the table above reflect the Company’s adjusted operating revenues, adjusted net income and adjusted stockholders’ equity, which have been adjusted to reflect the marked-to-market differences in the Company’s commodities business during each period (in the case of operating revenues and net income) and the cumulative differences (in the case of stockholders’ equity). The Company has also included the estimated tax liability which would have been incurred as a result of these adjustments, utilizing a blended tax rate of 37.5%.
Adjusted operating revenues, adjusted net income, and adjusted stockholders’ equity are financial measures that are not recognized by U.S. GAAP, and should not be considered as alternatives to operating revenues, net income or stockholders’ equity calculated under U.S. GAAP or as an alternative to any other measures of performance derived in accordance with
26
INTERNATIONAL ASSETS HOLDING CORPORATION
ANNUAL REPORT ON FORM 10-K FOR THE FISCAL YEAR ENDED SEPTEMBER 30, 2010
U.S. GAAP. The Company has included these non-GAAP financial measures because it believes that they permit investors to make more meaningful comparisons of performance between the periods presented. In addition, these non-GAAP measures are used by management in evaluating the Company’s performance.
The Company determines the fair value of physical commodities inventory on a marked-to-market basis by applying quoted market prices to the inventory owned by the Company on the balance sheet date. In the Company’s precious metals business, the Company obtains the closing COMEX nearby futures price for the last business day of the month and then adjusts that price to reflect an exchange for physical transaction, utilizing bids obtained from one or more market participants. In the Company’s base metals business, for copper inventory, the Company obtains the closing COMEX or LME nearby futures price and then adjusts that price to reflect any freight charges to the relevant delivery point. For the Company’s lead inventory, the Company obtains the closing LME nearby futures month price and then adjusts that price to reflect any tolling and freight charges to the relevant delivery point. If inventories were required to be valued using fair value instead of under U.S. GAAP at the lower of cost or market, our physical commodities inventory would be classified as Level 2 assets using the Fair Value Measurements and Disclosures Topic of the ASC.
| Item 7. | Management’s Discussion and Analysis of Financial Condition and Results of Operations |
The following discussion should be read together with the Consolidated Financial Statements and Notes thereto appearing elsewhere in this annual report on Form 10-K. Certain statements in “Management’s Discussion and Analysis of Financial Condition and Results of Operations” are forward-looking statements that involve risks and uncertainties. Words such as may, will, should, would, anticipates, expects, intends, plans, believes, seeks, estimates and similar expressions identify such forward-looking statements. The forward-looking statements contained herein are based on current expectations and entail various risks and uncertainties that could cause actual results to differ materially from those expressed in such forward-looking statements. Factors that might cause such a difference include, among other things, those set forth under “Risk Factors” and those appearing elsewhere in this Form 10-K. Readers are cautioned not to place undue reliance on these forward-looking statements, which reflect management’s analysis only as of the date hereof. We assume no obligations to update these forward-looking statements to reflect actual results or changes in factors or assumptions affecting forward-looking statements.
Overview
International Assets Holding Corporation and its subsidiaries (“we” or the “Company”) form a financial services group employing 729 people in offices in eleven countries. The Company’s services include comprehensive risk management advisory services for commercial customers; execution of listed futures and option contracts on all major exchanges; the sale of structured over-the-counter (“OTC”) products in a wide range of commodities; physical trading and hedging of precious and base metals and select other commodities; trading of more than 130 foreign currencies; market-making in international equities; and debt origination and asset management.
The Company provides these services to a diverse group of more than 10,000 customers located in more than 100 countries, including producers, processors and end-users of nearly all widely-traded physical commodities; commercial counterparties who are end-users of the firm’s products and services; governmental and non-governmental organizations; and commercial banks, brokers, institutional investors and major investment banks.
Recent Legislation Affecting the Financial Services Industry
On July 21, 2010, the President signed into law the Dodd-Frank Wall Street Reform and Consumer Protection Act (the “Dodd-Frank Act”). The Dodd-Frank Act contains a variety of provisions designed to regulate financial markets, including credit and derivatives transactions. Many aspects of the Dodd-Frank Act are subject to rulemaking that will take effect over several years, thus making it difficult to assess the impact of the statute on the financial industry, including the Company, at this time. The Company will continue to monitor all applicable developments in the implementation of the Dodd-Frank Act and expects to adapt successfully to any new applicable legislative and regulatory requirements.
FCStone Transaction
On September 30, 2009, the Company acquired FCStone Group, Inc. through its merger with a subsidiary of the Company in exchange for 8,239,319 shares of the Company’s common stock.
Under the terms of the merger agreement, the shareholders of FCStone received 0.2950 of a share of the Company’s common stock in exchange for each share of FCStone’s common stock. Additionally, as a result of the merger, each outstanding FCStone stock option was converted into an option to purchase shares of the Company’s common stock, with adjustments to the number of shares and the exercise price to reflect the exchange ratio. The shares of the Company’s common stock issued to FCStone stockholders in connection with the transaction represented approximately 47.5% of the outstanding shares of the Company’s common stock.
27
INTERNATIONAL ASSETS HOLDING CORPORATION
ANNUAL REPORT ON FORM 10-K FOR THE FISCAL YEAR ENDED SEPTEMBER 30, 2010
The purchase price for the transaction was approximately $137.6 million, consisting of the fair value of common stock issued in the merger of $135.5 million and estimated acquisition costs of $2.1 million.
At September 30, 2009, the acquisition of FCStone increased the Company’s total assets by $1,173.7 million, total liabilities by $1,016.0 million, minority interest by $1.6 million and stockholders’ equity by $156.1 million.
The Company recognized $7.0 million of extraordinary loss, related to purchase accounting adjustments and the correction of immaterial errors, and $18.5 million of extraordinary income for 2010 and 2009, respectively, related to the FCStone acquisition. The extraordinary income, also defined as negative goodwill, was the result of the sum of the fair values of the assets acquired less the liabilities assumed exceeding the acquisition cost. The extraordinary loss relates to adjustments to the purchase price allocation. Typically, changes within the measurement period are recognized through a corresponding adjustment to goodwill. However, in the absence of goodwill, recorded in connection with this transaction, the $7.0 million has been reported as an extraordinary loss in the consolidated financial statements. For the year ended September 30, 2010. See Note 17 to the Consolidated Financial Statements for additional information on the acquisition.
Results of Operations
Set forth below is the Company’s discussion of the results of its operations, as viewed by management, for the fiscal years 2010, 2009, and 2008, respectively. This discussion refers to both U.S. GAAP results and adjusted non-GAAP marked-to-market information, in accordance with the information presented in Item 6, ‘Selected Financial Data’. For the Foreign Exchange, Securities, Clearing and Execution Services and Other segments, there are no differences between the U.S GAAP results and the adjusted non-GAAP marked-to-market results. Only the Commodity and Risk Management Services segment has differences between the U.S GAAP results and the adjusted non-GAAP marked-to-market results. However, this means that there are differences between the U.S GAAP basis and marked-to-market basis total operating revenues, total contribution and net income. Please note that any term below that contains the word ‘adjusted’ refers to non-GAAP, marked-to-market information.
The discussion below relates only to continuing operations. All revenues and expenses relating to discontinued operations have been removed from disclosures of total revenues and expenses in all periods and are reflected in a net discontinued operations number.
Financial Overview
The following table shows an overview of our financial results.
Financial Overview (Unaudited)
| Year Ended September 30, | ||||||||||||||||||||
| (in millions) |
2010 | % Change |
2009 | % Change |
2008 | |||||||||||||||
| Operating revenues |
$ | 269.0 | 197 | % | $ | 90.6 | (21 | )% | $ | 114.9 | ||||||||||
| Marked-to-market adjustment (Non-GAAP) |
6.0 | (13 | )% | 6.9 | n/m | (26.9 | ) | |||||||||||||
| Adjusted operating revenues (non-GAAP) |
275.0 | 182 | % | 97.5 | 11 | % | 88.0 | |||||||||||||
| Interest expense |
9.9 | 24 | % | 8.0 | (29 | )% | 11.2 | |||||||||||||
| Adjusted net revenues (non-GAAP) |
265.1 | 196 | % | 89.5 | 17 | % | 76.8 | |||||||||||||
| Non-interest expenses |
241.2 | 248 | % | 69.3 | 13 | % | 61.4 | |||||||||||||
| Adjusted income from operations, before tax (non-GAAP) |
$ | 23.9 | 18 | % | $ | 20.2 | 31 | % | $ | 15.4 | ||||||||||
| Reconciliation of net revenues from GAAP to adjusted, non-GAAP numbers: |
||||||||||||||||||||
| Net revenues |
$ | 259.1 | $ | 82.6 | $ | 103.7 | ||||||||||||||
| Marked-to-market adjustment (Non-GAAP) |
6.0 | 6.9 | (26.9 | ) | ||||||||||||||||
| Adjusted net revenues (non-GAAP) |
$ | 265.1 | $ | 89.5 | $ | 76.8 | ||||||||||||||
| Reconciliation of income from operations, before tax from GAAP to adjusted, non-GAAP numbers: |
||||||||||||||||||||
| Income before income tax and minority interest |
$ | 17.9 | $ | 13.3 | $ | 42.3 | ||||||||||||||
| Marked-to-market adjustment (Non-GAAP) |
6.0 | 6.9 | (26.9 | ) | ||||||||||||||||
| Adjusted income from operations, before tax (non-GAAP) |
$ | 23.9 | $ | 20.2 | $ | 15.4 | ||||||||||||||
28
INTERNATIONAL ASSETS HOLDING CORPORATION
ANNUAL REPORT ON FORM 10-K FOR THE FISCAL YEAR ENDED SEPTEMBER 30, 2010
2010 Operating Revenues vs. 2009 Operating Revenues
The acquisition of FCStone was completed on September 30, 2009, therefore the results of FCStone are reflected in the results of operations for the Company for the year ended September 30, 2010, but are not reflected in the year ended September 30, 2009.
The Company’s operating revenues under U.S GAAP for 2010 and 2009 were $269.0 million and $90.6 million, respectively. This 197% increase in operating revenue is primarily a result of the FCStone acquisition. The operations of FCStone contributed $187.6 million in operating revenues for 2010. For the year ended August 31, 2009, FCStone reported total revenues of $248.9 million. There were increases in operating revenues of 576% in the C&RM segment and 57% in the Foreign Exchange segment, partially offset by a decrease of 47% in the Securities segment. The CES segment, which consists primarily of revenues from FCStone, contributed $61.8 million in operating revenues in 2010, while the Other segment contributed $8.9 in operating revenues compared to $3.4 in 2009.
Operating revenues increased in C&RM in 2010 with both exchange traded and OTC contract volumes increasing in the soft commodities business. Additionally, our precious metals business was affected by elevated prices, which constrained volumes and customer activity, and our base metals business was positively affected by increased customer demand and wider spreads which augmented trading profits. Operating revenues in the Foreign Exchange segment in 2010 were affected by narrower spreads, despite an increase in customer trade volumes, primarily with financial institutions. Operating revenues in the Securities segment in 2010 were affected by low levels of volume and volatility in the international equities markets, which had reached unprecedented levels in 2009. Operating revenues in the CES segment in 2010 were constrained by continued low short term interest rates, despite an increase in customer deposits, and adversely affected by a trading loss on positions acquired from an under-margined clearing customer. While the lack of demand and risk intolerance caused by the global financial crisis continues to adversely affect our debt arrangement and placement business, the acquisition of CIBSA in Argentina in April 2009 has increased our debt trading revenues. See the segmental analysis below for additional information on activity in each of the segments.
Operating revenues for 2010 include a mark-to-market gain of $2.5 million on interest rate swaps entered into during the year to manage a portion of our aggregate interest rate position.
The Company’s adjusted operating revenues were $275.0 million in 2010, compared with $97.5 million in 2009, an increase of $177.5 million. The only difference between operating revenues and adjusted operating revenues, a non-GAAP measure, is the gross mark-to-market adjustment of $6.0 million and $6.9 million for 2010 and 2009, respectively. The gross marked-to-market adjustment only affects the adjusted operating revenues in the C&RM segment. Adjusted operating revenues are identical to operating revenues in all other segments.
2009 Operating Revenues vs. 2008 Operating Revenues
The Company’s operating revenues under U.S. GAAP for 2009 and 2008 were $90.6 million and $114.9 million, respectively. The Company’s decrease in operating revenues was primarily due to a decrease in reported operating revenues in the C&RM segment (before marked to market adjustments). This decrease was due primarily to declining base metal prices, partially offset by increases in operating revenues from precious metals, foreign exchange trading, and asset management.
The decrease in operating revenues from base metals was attributable to the decline in lead prices. Precious metals operating revenues increased as a result of increased customer business in our Dubai and Singapore subsidiaries, and operating revenues from foreign exchange trading increased 28%. Wider spreads produced by the global financial crisis were part of the reason for the increased foreign exchange trading revenues. Operating revenues in the Securities segment increased 2%, mostly driven by our debt placement business as our equities market-making business enjoyed a record first half-year in 2009, partly because of near-panic conditions in the equities markets in the quarter ended December 31, 2008, however there was a steep decline during the second half-year, caused by a lack of activity and volatility, with the result that operating revenues for this business segment for the year were flat with 2008 levels. See the segmental analysis below for additional information on activity in each of the segments.
Adjusted operating revenues increased by 11% from $88.0 million in 2008 to $97.5 million in 2009. The only difference between operating revenues and adjusted operating revenues, a non-GAAP measure, is the gross marked-to-market adjustment of $6.9 million and ($26.9) million for the fiscal year ended 2009 and 2008, respectively. The gross marked-to-market adjustment only affects the adjusted operating revenues in the commodities trading segment. Adjusted operating revenues are identical to operating revenues in all other segments.
2010 Interest Expense vs. 2009 Interest Expense
Interest expense: Interest expense increased from $8.0 million in 2009 to $9.9 million in 2010. Excluding interest expense in the operations of FCStone of $3.2 million, interest expense decreased by $1.3 million, or 16%, as a result of both a
29
INTERNATIONAL ASSETS HOLDING CORPORATION
ANNUAL REPORT ON FORM 10-K FOR THE FISCAL YEAR ENDED SEPTEMBER 30, 2010
decrease in average borrowings and lower interest rates. In mid-2008, the Company entered into two three-year interest rate swaps for a total of $100 million. These were designated as cash flow hedges. The Company discontinued hedge accounting for one of the swaps during the year, which resulted in reclassifying a portion of the deferred loss to earnings during the period. See Note 7 to the Consolidated Financial Statements for further information. The Company pays a fixed 3.66% (on average), and receives a variable rate equal to one-month LIBOR. One-month LIBOR was lower than the fixed rate of 3.66% paid by the Company for much of 2010, resulting in a net interest expense on the swaps. The effective portion of the change in cash flows from the hedge of the remaining forecasted payments during 2010 had the effect of increasing the Company’s reported interest expense by $1.9 million.
2009 Interest Expense vs. 2008 Interest Expense
Interest expense: Interest expense decreased by 29% from $11.2 million in 2008 to $8.0 million in 2009 as a result of decreased average borrowings during the year, at lower absolute interest rates. Effective Q4 2008, the Company entered into two three-year interest rate swaps for a total of $100 million. These were designated as cash flow hedges. See Note 7 to the Consolidated Financial Statements for further information. The Company pays a fixed 3.66% (on average), and receives a variable rate equal to one-month LIBOR. One-month LIBOR was lower than the fixed rate of 3.66% paid by the Company during fiscal 2009, resulting in a net interest expense on the swaps. The effective portion of the interest expense on the swaps during fiscal 2009 had the effect of increasing the Company’s reported interest expense by $2.0 million.
Non-interest expenses: The following table sets forth information concerning non-interest expenses.
| Year Ended September 30, | ||||||||||||||||||||
| (in millions) |
2010 | % Change |
2009 | % Change |
2008 | |||||||||||||||
| NON-INTEREST EXPENSES |
||||||||||||||||||||
| Compensation and benefits |
$ | 104.2 | 159 | % | $ | 40.2 | 13 | % | $ | 35.6 | ||||||||||
| Clearing and related expenses |
68.2 | 326 | % | 16.0 | 22 | % | 13.1 | |||||||||||||
| Other non-interest expenses |
||||||||||||||||||||
| —Communication and data services |
11.1 | 429 | % | 2.1 | 0 | % | 2.1 | |||||||||||||
| —Introducing broker commissions |
18.9 | n/m | — | n/m | — | |||||||||||||||
| —Occupancy and equipment rental |
6.2 | 464 | % | 1.1 | 0 | % | 1.1 | |||||||||||||
| —Professional fees |
8.1 | 268 | % | 2.2 | 10 | % | 2.0 | |||||||||||||
| —Depreciation and amortization |
1.6 | 100 | % | 0.8 | 0 | % | 0.8 | |||||||||||||
| —Bad debts and impairments |
5.8 | 93 | % | 3.0 | 25 | % | 2.4 | |||||||||||||
| —Other expense |
17.1 | 338 | % | 3.9 | (9 | )% | 4.3 | |||||||||||||
| 68.8 | 425 | % | 13.1 | 3 | % | 12.7 | ||||||||||||||
| Total non-interest expenses |
$ | 241.2 | 248 | % | $ | 69.3 | 13 | % | $ | 61.4 | ||||||||||
2010 Non-Interest Expenses vs. 2009 Non-Interest Expenses
Total Non-interest expenses: Non-interest expenses increased by 248% from $69.3 million in 2009 to $241.2 million in 2010. Excluding expenses in the FCStone operations of $171.1 million, non-interest expenses increased $0.8 million.
Compensation and Benefits: Compensation and benefits expense increased by 159% from $40.2 million to $104.2 million, and represented 43% and 58% of total non-interest expenses in 2010 and 2009, respectively. Total compensation and benefits were 39% of operating revenues in 2010 compared to 44% in 2009. The variable portion of compensation and benefits increased by 158% from $17.8 million in 2009 to $45.9 million in 2010, primarily as a result of the 197% increase in operating revenues compared to the prior year. The fixed portion of compensation and benefits increased 160% from $22.4 million to $58.3 million, primarily as a result of the FCStone transaction. Administrative and executive bonuses, including deferred compensation expenses (a proportion of current year bonuses allocated to restricted stock awards is deferred and expensed as vesting occurs), were $6.1 million, compared with $6.4 million in 2009. Stock option expense in 2010 was $0.5 million, compared with $1.0 million in 2009. The number of employees in the Company grew 17% from 625 at the end of 2009 to 729 at the end of 2010, primarily as a result of several acquisitions during 2010.
Clearing and Related Expenses: Clearing and related expenses increased 326% from $16.0 million in 2009 to $68.2 million in 2010. The increase was primarily driven by the Company’s addition of the CES segment, as a result of the FCStone acquisition, and increased clearing costs in CIBSA, acquired in April 2009. This increase was partially offset by a significant decline in clearing costs in the Securities segment related to lower volumes in the international equities business.
Other Non-Interest Expenses: Other non-interest expenses increased by 425% from $13.1 million in 2009 to $68.8 million in 2010. The operations of FCStone contributed $48.2 million in other non-interest expenses in 2010. Other non-interest
30
INTERNATIONAL ASSETS HOLDING CORPORATION
ANNUAL REPORT ON FORM 10-K FOR THE FISCAL YEAR ENDED SEPTEMBER 30, 2010
expenses include bad debt expense, net, of $5.8 million. During 2010, FCStone recorded a charge to bad debt expense of approximately $2.3 million related to a disputed trade that was “given-up” to FCStone by another FCM for a customer that held an account with us. Despite expressly informing the FCM that the Company would not accept the “give-up” trade, the “give-up” trade was submitted through the electronic clearing process and erroneously cleared by FCStone, generating a deficit in the customer’s trading account. The customer lacked the financial capacity to cover the account deficit, and FCStone has filed a complaint and is seeking legal relief through arbitration against the FCM to have the “give-up” transaction rescinded, with an award of appropriate damages. In addition in the fourth quarter of fiscal 2010, the Company recorded a $2.5 million provision against a receivable from a Dubai customer to whom INTL Commodities DMCC had consigned gold to. While the Company has a security interest in property to secure the amount of the receivable, it is uncertain as to whether the entire amount of the receivable will be collected. In addition, during 2010 the Company recorded an impairment charge of $1.2 million related to it’s investment in INTL Sieramet.
Provision for Taxes: The effective income tax rate on a U.S. GAAP basis was 35.6% in 2010, compared with 19.9% in 2009. This change was primarily due to changes in the geographic mix of profits or losses. Our effective income tax rate can vary from period to period depending on, among other factors, the geographic and business mix of our earnings, the level of our pre-tax earnings and the level of our tax credits.
Non-Controlling Interest: This represents the non-controlling interests in INTL Gainvest Capital Uruguay S.A., INTL Sieramet, LLC, and the Blackthorn Multi-Advisor Fund, LP (“Blackthorn Fund”), a majority interest acquired with the Hanley Companies, as discussed in Note 17—Acquisitions.
Loss or Gain from Discontinued Operations: In May 2010, the Company sold its interest in INTL Capital Limited (“INTL Capital”) to an independent third party for a purchase price equal to book value. The subsidiary operated an asset management business in Dubai. Additionally, during 2010 the Company discontinued the operations of Agora-X, LLC (“Agora-X”), as it was determined that its carrying value would no longer be recoverable and was in fact impaired. During 2009, the Company sold its interest in INTL Consilium, LLC (“INTL Consilium”). The results of operations for INTL Capital, Agora-X and INTL Consilium were previously included within the Other segment, and are presented within discontinued operations on the consolidated income statements. The company recognized an aggregate gain from discontinued operations, net of taxes of $0.6 million in 2010 and an aggregate loss on discontinued operations, net of taxes of $1.1 million in 2009.
2009 Non-Interest Expenses vs. 2008 Non-Interest Expenses
Non-interest expenses: Non-interest expenses increased by 13% from $61.4 million in 2008 to $69.3 million in 2009.
Compensation and Benefits: Compensation and benefits expense grew by 13% from $35.6 million to $40.2 million. These represented 58% of total non-interest expenses in both 2009 and 2008. The variable portion of compensation and benefits increased 5% from $17.0 million in 2008 to $17.8 million in 2009. Administrative and executive bonuses, including deferred compensation expenses (a proportion of current year bonuses allocated to restricted stock awards is deferred and expensed as vesting occurs), were $6.4 million, compared with $1.9 million in 2008. Stock option expense in 2009 was $1.0 million, compared with $0.8 million in 2008. Salaries and benefits were unchanged from $16.0 million in 2008 to $16.0 million in 2009. The number of employees in the Company grew 221% from 195 at the end of 2008 to 625 at the end of 2009, primarily as a result of the FCStone acquisition. Excluding the FCStone transaction, the number of employees in the Company declined to 193 from 195 at the end of 2008.
Clearing and Related Expenses: Clearing and related expenses increased by 22% from $13.1 million in 2008 to $16.0 million in 2009. The increase was mainly a result of increased equities volumes and commissions paid in the foreign exchange trading business. Clearing and related expenses include bank charges, which increased from $1.2 million in 2008 to $1.7 million in 2009. Bank charges include commitment and arrangement fees paid to banks.
Other Non-Interest Expenses: Other non-interest expenses increased by 3% from $12.7 million in 2008 to $13.1 million in 2009. Business development costs decreased 14% from $2.2 million in 2008 to $1.9 million in 2009. $2.4 million of the other non-interest expenses in 2008 relates to the write-off of a receivable from one of the Company’s customers, compared with $3.0 million in 2009 which included an impairment charge of $1.1 million relating to the Company’s INTL Sieramet, LLC partnership.
Provision for Taxes: The effective income tax rate on a U.S. GAAP basis was 19.5% in 2009, compared with 39% in 2008. This change was primarily due to changes in the geographic mix of profits or losses. Our effective income tax rate can vary from period to period depending on, among other factors, the geographic and business mix of our earnings, the level of our pre-tax earnings and the level of our tax credits.
31
INTERNATIONAL ASSETS HOLDING CORPORATION
ANNUAL REPORT ON FORM 10-K FOR THE FISCAL YEAR ENDED SEPTEMBER 30, 2010
Non-controlling Interest: This represents the non-controlling interests in INTL Gainvest Capital Uruguay S.A. and INTL Commodities DMCC. During February 2009, the Company acquired the 50% interest held by our joint venture partner in INTL Commodities DMCC, making this company a wholly-owned subsidiary for part of the year.
Loss or Gain from Discontinued Operations: In May 2010, the Company sold its interest in INTL Capital to an independent third party for a purchase price equal to book value. The subsidiary operated an asset management business in Dubai. During 2009, the Company sold its interest in INTL Consilium. The results of operations for INTL Capital and INTL Consilium were previously included within the Other segment, and are presented within discontinued operations on the consolidated income statements. During 2008, the Company discontinued operations related to the Company’s margin foreign exchange trading operations in Hong Kong. The Company recognized an aggregate loss on discontinued operations, net of taxes of $1.1 million in 2009 and an aggregate gain from discontinued operations, net of taxes of $1.3 million in 2008.
Effective May 1, 2010, the Company sold its interest in INTL Capital Limited (“INTL Capital”) to an independent third party for a purchase price equal to book value. The subsidiary operated an asset management business in Dubai. The results of operations for INTL Capital, which were previously included within the Other segment, are included within discontinued operations on the consolidated income statements.
Variable vs. Fixed Expenses
| Year Ended September 30, | ||||||||||||||||||||||||
| (in millions) |
2010 | % of Total |
2009 | % of Total |
2008 | % of Total |
||||||||||||||||||
| VARIABLE vs. FIXED EXPENSES |
||||||||||||||||||||||||
| Variable clearing and related expenses |
$ | 66.4 | 28 | % | $ | 15.9 | 23 | % | $ | 12.9 | 21 | % | ||||||||||||
| Variable compensation |
45.9 | 19 | % | 17.8 | 26 | % | 17.0 | 28 | % | |||||||||||||||
| Introducing broker commissions |
18.8 | 8 | % | — | 0 | % | — | 0 | % | |||||||||||||||
| Total variable expenses |
131.1 | 54 | % | 33.7 | 49 | % | 29.9 | 49 | % | |||||||||||||||
| Fixed expenses |
104.7 | 43 | % | 32.6 | 47 | % | 31.5 | 51 | % | |||||||||||||||
| Bad debts and impairments |
5.4 | 2 | % | 3.0 | 4 | % | — | 0 | % | |||||||||||||||
| Total non-variable expenses |
110.1 | 46 | % | 35.6 | 51 | % | 31.5 | 51 | % | |||||||||||||||
| Total non-interest expenses |
$ | 241.2 | 100 | % | $ | 69.3 | 100 | % | $ | 61.4 | 100 | % | ||||||||||||
The Company aims to make its non-interest expenses variable to the greatest extent possible, and to keep its fixed costs as low as possible. The table above shows an analysis of the Company’s total non-interest expenses for 2010, 2009, and 2008. Variable expenses consist of clearing and clearing related expenses, variable compensation paid to traders and risk management consultants, bonuses paid to operational employees, introducing broker commissions and bad debt and impairment expenses. As a percentage of total non-interest expenses, variable expenses increased from 49% in 2008 and 2009 to 54% in 2010.
32
INTERNATIONAL ASSETS HOLDING CORPORATION
ANNUAL REPORT ON FORM 10-K FOR THE FISCAL YEAR ENDED SEPTEMBER 30, 2010
Segment Information: The following table sets forth information concerning the Company’s principal business segments.
| Year Ended September 30, | ||||||||||||||||||||
| (in millions) |
2010 | % Change |
2009 | % Change |
2008 | |||||||||||||||
| SEGMENTAL RESULTS |
||||||||||||||||||||
| Commodity & Risk Management Services (C&RM) | ||||||||||||||||||||
| Operating revenues |
$ | 129.8 | 576 | % | $ | 19.2 | (63 | )% | $ | 51.2 | ||||||||||
| Gross marked-to-market adjustment (non-GAAP) |
6.0 | (13 | )% | 6.9 | n/m | (26.9 | ) | |||||||||||||
| Adjusted operating revenues (non-GAAP) |
135.8 | 420 | % | 26.1 | 7 | % | 24.3 | |||||||||||||
| —Interest expense |
6.2 | 170 | % | 2.3 | (60 | )% | 5.7 | |||||||||||||
| —Variable direct expenses |
52.7 | 675 | % | 6.8 | 48 | % | 4.6 | |||||||||||||
| Adjusted net contribution (non-GAAP) |
76.9 | 352 | % | 17.0 | 21 | % | 14.0 | |||||||||||||
| —Non-variable direct expenses |
36.5 | 356 | % | 8.0 | 54 | % | 5.2 | |||||||||||||
| Adjusted segment income (non-GAAP) |
40.4 | 349 | % | 9.0 | 2 | % | 8.8 | |||||||||||||
| Foreign Exchange | ||||||||||||||||||||
| Operating revenues |
$ | 47.5 | 57 | % | $ | 30.3 | 25 | % | $ | 24.2 | ||||||||||
| —Interest expense |
0.7 | 75 | % | 0.4 | (56 | )% | 0.9 | |||||||||||||
| —Variable direct expenses |
18.8 | 96 | % | 9.6 | 41 | % | 6.8 | |||||||||||||
| Net contribution |
28.0 | 38 | % | 20.3 | 23 | % | 16.5 | |||||||||||||
| —Non-variable direct expenses |
6.0 | 28 | % | 4.7 | (2 | )% | 4.8 | |||||||||||||
| Segment income |
22.0 | 41 | % | 15.6 | 33 | % | 11.7 | |||||||||||||
| Securities | ||||||||||||||||||||
| Operating revenues |
$ | 20.8 | (47 | )% | $ | 39.1 | 2 | % | $ | 38.2 | ||||||||||
| —Interest expense |
0.5 | n/m | — | n/m | (0.1 | ) | ||||||||||||||
| —Variable direct expenses |
8.9 | (45 | )% | 16.2 | (4 | )% | 16.8 | |||||||||||||
| Net contribution |
11.4 | (50 | )% | 22.9 | 7 | % | 21.5 | |||||||||||||
| —Non-variable direct expenses |
6.1 | 56 | % | 3.9 | 22 | % | 3.2 | |||||||||||||
| Segment income |
5.3 | (72 | )% | 19.0 | 4 | % | 18.3 | |||||||||||||
| Clearing & Execution Services (CES) | ||||||||||||||||||||
| Operating revenues |
$ | 61.8 | n/m | $ | — | n/m | $ | — | ||||||||||||
| —Interest expense |
1.8 | n/m | — | n/m | — | |||||||||||||||
| —Variable direct expenses |
49.3 | n/m | — | n/m | — | |||||||||||||||
| Net contribution |
10.7 | n/m | — | n/m | — | |||||||||||||||
| —Non-variable direct expenses |
9.3 | n/m | — | n/m | — | |||||||||||||||
| Segment income |
1.4 | n/m | — | n/m | — | |||||||||||||||
| Other | ||||||||||||||||||||
| Operating revenues |
$ | 8.9 | 162 | % | $ | 3.4 | 467 | % | $ | 0.6 | ||||||||||
| —Interest expense |
0.2 | (83 | )% | 1.2 | 33 | % | 0.9 | |||||||||||||
| —Variable direct expenses |
1.6 | 60 | % | 1.0 | (44 | )% | 1.8 | |||||||||||||
| Net contribution |
7.1 | 492 | % | 1.2 | n/m | (2.1 | ) | |||||||||||||
| —Non-variable direct expenses |
3.0 | 58 | % | 1.9 | 27 | % | 1.5 | |||||||||||||
| Segment income |
4.1 | n/m | (0.7 | ) | (81 | )% | (3.6 | ) | ||||||||||||
| Total Segmental Results | ||||||||||||||||||||
| Operating revenues |
$ | 268.8 | 192 | % | $ | 92.0 | (19 | )% | $ | 114.2 | ||||||||||
| Gross marked-to-market adjustment (non-GAAP) |
6.0 | (13 | )% | 6.9 | n/m | (26.9 | ) | |||||||||||||
| Adjusted operating revenues (non-GAAP) |
274.8 | 178 | % | 98.9 | 13 | % | 87.3 | |||||||||||||
| —Interest expense |
9.4 | 141 | % | 3.9 | (47 | )% | 7.4 | |||||||||||||
| —Variable direct expenses |
131.3 | 291 | % | 33.6 | 12 | % | 30.0 | |||||||||||||
| Adjusted net contribution (non-GAAP) |
134.1 | 118 | % | 61.4 | 23 | % | 49.9 | |||||||||||||
| —Non-variable direct expenses |
60.9 | 229 | % | 18.5 | 26 | % | 14.7 | |||||||||||||
| Adjusted net segment income (non-GAAP) |
$ | 73.2 | 71 | % | $ | 42.9 | 22 | % | $ | 35.2 | ||||||||||
| Reconciliation of C&RM net contribution from GAAP to adjusted, non-GAAP numbers: |
||||||||||||||||||||
| Total C&RM net contribution |
$ | 70.9 | $ | 10.1 | $ | 40.9 | ||||||||||||||
| Gross marked-to-market adjustment (non-GAAP) |
6.0 | 6.9 | (26.9 | ) | ||||||||||||||||
| C&RM adjusted net contribution (non-GAAP) |
$ | 76.9 | $ | 17.0 | $ | 14.0 | ||||||||||||||
| Reconciliation of C&RM segment income from GAAP to adjusted, non-GAAP numbers: |
||||||||||||||||||||
| Total C&RM segment income |
$ | 34.4 | $ | 2.1 | $ | 35.7 | ||||||||||||||
| Gross marked-to-market adjustment (non-GAAP) |
6.0 | 6.9 | (26.9 | ) | ||||||||||||||||
| C&RM adjusted segment income (non-GAAP) |
$ | 40.4 | $ | 9.0 | $ | 8.8 | ||||||||||||||
| Reconciliation of total operating revenues from GAAP to adjusted, non-GAAP numbers: |
||||||||||||||||||||
| Total operating revenues |
$ | 269.0 | $ | 90.6 | $ | 114.9 | ||||||||||||||
| Gross marked-to-market adjustment (non-GAAP) |
6.0 | 6.9 | (26.9 | ) | ||||||||||||||||
| Operating revenue not assigned to a segment |
(0.2 | ) | 1.4 | (0.7 | ) | |||||||||||||||
| Adjusted segment operating revenues (non-GAAP) |
$ | 274.8 | $ | 98.9 | $ | 87.3 | ||||||||||||||
| Reconciliation of net contribution from GAAP to adjusted, non-GAAP numbers: |
||||||||||||||||||||
| Total net contribution |
$ | 128.1 | $ | 54.5 | $ | 76.8 | ||||||||||||||
| Gross marked-to-market adjustment (non-GAAP) |
6.0 | 6.9 | (26.9 | ) | ||||||||||||||||
| Adjusted net contribution (non-GAAP) |
$ | 134.1 | $ | 61.4 | $ | 49.9 | ||||||||||||||
| Reconciliation of segment income from GAAP to adjusted, non-GAAP numbers: |
||||||||||||||||||||
| Total net segment income |
$ | 67.2 | $ | 36.0 | $ | 62.1 | ||||||||||||||
| Gross marked-to-market adjustment (non-GAAP) |
6.0 | 6.9 | (26.9 | ) | ||||||||||||||||
| Adjusted net segment income (non-GAAP) |
$ | 73.2 | $ | 42.9 | $ | 35.2 | ||||||||||||||
33
INTERNATIONAL ASSETS HOLDING CORPORATION
ANNUAL REPORT ON FORM 10-K FOR THE FISCAL YEAR ENDED SEPTEMBER 30, 2010
2010 vs. 2009 Segmental Analysis
The net contribution of all the Company’s business segments was $128.1 million in 2010, compared with $54.5 million in 2009. The adjusted net contribution of all the Company’s business segments was $134.1 million in 2010, compared with $61.4 million in 2009. The operations of FCStone contributed $74.5 million to both net contribution and adjusted net contribution in 2010.
Net contribution is one of the key measures used by management to assess the performance of each segment and for decisions regarding the allocation of the Company’s resources. Net contribution is calculated as revenue less direct cost of sales, interest expense, clearing and related expenses, introducing broker commissions and variable compensation. Variable compensation paid to traders represents a fixed percentage of an amount equal to revenues produced less clearing and related charges, base salaries and an overhead allocation.
Total segment income was $67.2 million in 2010, compared with $35.0 million in 2009. Total adjusted segment income was $73.2 million in 2010, compared with $41.9 million in 2009. The operations of FCStone contributed $38.7 million to both total segment income and adjusted segment income for 2010.
Segment income is calculated as net contribution less certain non-variable direct expenses of the segment. These non-variable direct expenses include trader base compensation and benefits, operational employee compensation and benefits, communication and data services, travel, professional fees and bad debt expense.
Commodity and Risk Management Services—Operating revenues under U.S. GAAP increased from $19.2 million in 2009 to $129.8 million in 2010. Adjusted operating revenues increased by 420% from $26.1 million in 2009 to $135.8 million in 2010. The operations of FCStone contributed $99.0 million to both operating revenues and adjusted operating revenues in 2010.
During 2010, the soft commodity business, which includes primarily agricultural and energy commodities, has been constrained by global economic conditions, however an increase in underlying volatility, particularly in agricultural commodities, as well as the effect of rising prices has resulted in year over year increases in exchange traded volumes. OTC volumes are slightly higher than the prior year driven primarily by increases in OTC transactions in the energy markets early in the fiscal year and the international markets in the second half of the fiscal year primarily in Brazil. Increases in customer assets on deposit have been more than offset by continued historically low short term interest rates, which continued to negatively affect the level of interest income earned on customer deposits during 2010.
Precious metals operating revenues decreased from $18.3 million in 2009 to $14.0 million in 2010. Precious metals adjusted operating revenues decreased from $18.1 million in 2009 to $16.5 million in 2010. These declines were primarily a result of reduced business activity caused by higher prices.
Base metals operating revenues increased from $0.9 million in 2009 to $8.6 million in 2010. Base metals adjusted operating revenues increased from $8.0 million in 2009 to $12.1 million in 2010. Base metals operating revenues increased primarily due to increased demand from the Far East and wider spreads augmenting trading profits while rising lead prices contributed to greater arbitrage opportunities.
Segment income increased from $1.1 million in 2009 to $34.4 million in 2010. Adjusted segment income increased from $8.0 million in 2009 to $40.4 million in 2010. Segment income in 2010 was effected by a $2.5 million bad debt provision related to a receivable from a Dubai customer to whom the Company had consigned gold. The operations of FCStone contributed $29.5 million to both segment income and adjusted segment income for 2010.
Foreign Exchange Trading—Operating revenues increased by 57% from $30.3 million in 2009 to $47.5 million in 2010. The operations of FCStone contributed $21.7 million to operating revenues in this segment in 2010. The volume of trades in the Company’s global payments business increased from the prior year period, however a narrowing of spreads in the currencies in which we deal which were affected by the global economic crisis in the prior year period, offset the increase in volumes. The volumes in the global payments business continued to benefit from an increase in customers consisting primarily of financial institutions and our ability to offer an electronic transaction order system to our customers.
In 2010, the customer speculative foreign exchange business experienced low volumes which were offset by activity on the proprietary foreign exchange arbitrage desk which capitalized on arbitrage opportunities in the cash versus futures markets.
34
INTERNATIONAL ASSETS HOLDING CORPORATION
ANNUAL REPORT ON FORM 10-K FOR THE FISCAL YEAR ENDED SEPTEMBER 30, 2010
Segment income increased 41% from $15.6 million to $22.0 million, with FCStone operations contributing $7.3 million in 2010. Variable expenses expressed as a percentage of operating revenues increased from 32% to 40%, primarily as a result of the FCStone acquisition.
Securities—Operating revenues decreased by 47% from $39.1 million in 2009 to $20.8 million in 2010. Operating revenues in the equities market-making business decreased 49% from the prior year, or $16.7 million. Operating revenues in the debt capital markets business decreased by 32% from the prior year, or $1.7 million.
Operating revenues in the equities market-making business are largely dependent on overall volume and volatility, which reached unprecedented levels during the beginning of 2009 in response to the global financial crisis. Volume and volatility declined considerably by mid-2009 and remained in abatement through 2010. Equity market-making operating revenues include the trading profits earned by the Company before the related expense deduction for ADR conversion fees. These ADR fees are included in the consolidated income statements as clearing and related expenses.
Operating revenues in the debt capital markets business declined as a result of reduced business activity which continues as a result of negative sentiment stemming from the financial crisis as well as trading losses in the third quarter on Argentinean fixed income securities, partially offset by the acquisition of CIBSA. The business focuses on the arranging and placing of debt issues and asset backed securitization, and debt trading in the newly-acquired CIBSA and in Singapore.
Segment income decreased 72% from $19.0 million to $5.3 million. Variable expenses expressed as a percentage of operating revenues increased from 41% to 43%.
Clearing and Execution Services—Operating revenues in the CES segment, resulting from the acquisition of FCStone were $61.8 million for 2010 and are primarily generated from two sources: commission and clearing fee revenues from the execution and clearing of exchange-traded futures and options contracts, and interest income derived from cash balances in our customers’ accounts.
Operating revenues were affected by low volatility in the exchange-traded markets as a result of the macro-economic conditions, as well as historically low short term interest rates. In addition, volumes in this segment were significantly lower than the prior as a result of the Company’s intentional reduction in the number of high volume professional trading customers which it provided clearing services to in the prior year. Operating revenues for 2010 include a trading loss of $2.7 million related to open commodity positions acquired from an under-margined customer.
Segment income was $1.4 million for 2010, which included a $2.3 million bad debt expense provision recorded in the third quarter of 2010, related to a disputed trade that was “given-up” to FCStone by another FCM for a customer that held an account with us as well as the trading loss noted above. Variable expenses, which are primarily clearing and related expenses, represented 80% of operating revenues.
Other—The Company’s asset management segment revenues include management and performance fees, commissions and other revenues received by the Company for management of third party assets and investment gains or losses on the Company’s investments in funds or proprietary accounts managed either by the Company’s investment managers or by independent investment managers. With the acquisition of FCStone, the Other segment’s revenues now include interest income and fees earned in relation to commodity financing transactions as well as a limited amount of principal physical commodity sales transactions related to inputs to the renewable fuels industry.
Operating revenues were $8.9 million in 2010 compared to $3.4 million in 2009. The operations of FCStone contributed $1.5 million to operating revenues in 2010. Assets under management at September 30, 2010 were approximately $349.3 million compared with approximately $353.4 million at September 30, 2009. Management fees decreased by 9% from $3.8 million in 2009 to $3.5 million in 2010, primarily as a decrease in rates on assets managed. Fees and commissions increased by 149% from $1.3 million in 2009 to $3.2 million in 2010 as the environment in Argentina for asset-backed securitizations improved.
Segment income was $4.1 million in 2010 compared to a segment loss of $0.7 million in 2009. During 2009, the Company sold its partnership interest in INTL Consilium, LLC (“INTL Consilium”), and the results of INTL Consilium, previously consolidated, have been reclassified as discontinued operations in the consolidated financial statements.
35
INTERNATIONAL ASSETS HOLDING CORPORATION
ANNUAL REPORT ON FORM 10-K FOR THE FISCAL YEAR ENDED SEPTEMBER 30, 2010
2009 vs. 2008 Segmental Analysis
The net contribution of all the Company’s business segments decreased 29% from $76.8 million in 2008, to $54.5 million in 2009. The adjusted net contribution of all the Company’s business segments increased 23% from $49.9 million in 2008 to $61.4 million in 2009. Net contribution consists of operating revenues less direct clearing and clearing related charges and variable compensation paid to traders. Variable compensation is paid to traders on the basis of a fixed percentage of the aggregate of revenues less clearing and related charges, base salaries and a fixed overhead allocation. Net contribution is one of the key measures used by management to assess the performance of each segment.
Total segment income was $35.0 million in 2009, compared with $62.1 million in 2008. Total adjusted segment income was $41.9 million in 2009, compared with $35.2 million in 2008. Segment income is calculated as net contribution less certain non-variable direct expenses of the segment. These non-variable direct expenses include trader base compensation and benefits, operational employee compensation and benefits, communication and data services, travel, professional fees and bad debt expense.
Commodity and Risk Management Services—Operating revenues under U.S. GAAP decreased from $51.2 million in 2008 to $19.2 million in 2009. Adjusted operating revenues increased by 7% from $24.3 million in 2008 to $26.1 million in 2009. The only difference between operating revenues and adjusted operating revenues, a non-GAAP measure, is the gross marked-to-market adjustment of $6.9 million and ($26.9) million for the fiscal year ended 2009 and 2008, respectively.
Precious metals operating revenues increased from $10.7 million in 2008 to $18.3 million in 2009. Precious metals adjusted operating revenues increased 70% from $10.6 million in 2008 to $18.1 million in 2009, as a result of increased customer business in our Dubai and Singapore subsidiaries.
Base metals operating revenues decreased 98% from $40.5 million in 2008 to $0.9 million in 2009. Base metals adjusted operating revenues decreased 34% from $12.2 million in 2008 to $8.0 million in 2009. The decrease in base metals operating revenues was primarily due to the decline in lead prices within our base metals division. Base metals operating revenues benefited during the first half of 2008 from a disparity between the price of auto batteries, which the Company recycles for their lead content, and the price at which it was able to sell lead to customers. With the rapid decline in lead prices during calendar 2008 and persistently low prices during much of 2009, this disparity also declined to the extent that recycling became less attractive in the second half of fiscal 2008 and most of fiscal 2009. Within base metals, increased copper revenues to some extent compensated for the decline in lead revenues.
Segment income decreased from $35.7 million in 2008 to $2.1 million in 2009. Adjusted segment income decreased from $8.8 million in 2008 to $9.0 million in 2009. Variable expenses expressed as a percentage of adjusted operating revenues increased from 19% to 26%.
Foreign Exchange Trading—Operating revenues increased by 25% from $24.2 million in 2008 to $30.3 million in 2009 due to a larger customer base and wider spreads in developing market currency exchange rates.
Segment income increased 33% from $11.7 million in 2008 to $15.6 million in 2009. Variable expenses expressed as a percentage of operating revenues increased from 28% to 32%, mainly as a result of commissions paid to third-party introducers
Securities—Operating revenues increased by 2% from $38.2 million in 2008 to $39.1 million in 2009. Operating revenues in the equities market-making business decreased marginally from $33.9 million in 2008 to $33.8 million in 2009. Operating revenues in the debt capital markets business increased by 26% from $4.2 million in 2008 to $5.3 million in 2009.
Operating revenues in the equities market-making business are largely dependent on overall volume and volatility. Volume and volatility declined considerably by mid-2009 and remained in abatement through 2010. More than half of the revenues, $18.5 million, were produced during the first fiscal quarter ended December 31, 2008, demonstrating the extreme volatility in the equity markets during fiscal 2009. The volume of trades was 4% higher in 2009 than in 2008. Equity market-making operating revenues include the trading profits earned by the Company before the related expense deduction for ADR conversion fees. These ADR fees are included in the consolidated income statements as clearing and related expenses.
Operating revenues in the debt capital markets business include the arranging and placing of debt issues, asset backed securitization and debt trading, which grew off an insignificant base with effect from the third fiscal quarter of 2009, with the acquisition of CIBSA in April 2009 and the hiring of a debt trading team in Singapore. Fee revenues have been adversely affected by the lack of market demand and intolerance for risk caused by the global financial crisis but segmental revenues have been augmented by the new trading activities. Fee revenues were $2.2 million and trading revenues $2.7 million in 2009, compared with $3.9 million and $0.3 million, respectively, in 2008.
36
INTERNATIONAL ASSETS HOLDING CORPORATION
ANNUAL REPORT ON FORM 10-K FOR THE FISCAL YEAR ENDED SEPTEMBER 30, 2010
Segment income increased 4% from $18.3 million to $19.0 million. Variable expenses expressed as a percentage of operating revenues decreased from 44% to 41%.
Other—The Company’s asset management segment revenues include management and performance fees, commissions and other revenues received by the Company for management of third party assets and investment gains or losses on the Company’s investments in funds or proprietary accounts managed either by the Company’s investment managers or by independent investment managers. Operating revenues increased by 467% from $0.6 million in 2008 to $3.4 million in 2009.
The segment loss was $0.7 million in 2009 as compared to a segment loss of $3.6 million in 2008. During 2009, the Company sold its partnership interest in INTL Consilium, LLC (“INTL Consilium”), and the results of INTL Consilium, previously consolidated, have been reclassified as discontinued operations in the consolidated financial statements.
Liquidity, Financial Condition and Capital Resources
Overview
Liquidity is of critical importance to us and imperative to maintain our operations on a daily basis. In FCStone, LLC, the Company’s FCM subsidiary, we have responsibilities to meet margin calls at all exchanges on a daily basis and intra-day basis, if necessary. Our customers are required to make any required margin deposits the next business day, and we require our largest customers to make intra-day margin payments during periods of significant price movement. Margin required to be posted to the exchanges is a function of the net open positions of our customers and the required margin per contract.
In addition, in our commodities trading, C&RM over-the-counter, securities and foreign exchange trading activities, we may be called upon to meet margin calls with our various trading counterparties based upon the underlying open transactions we have in place with those counterparties.
The Company continuously reviews its overall credit and capital needs to ensure that its capital base, both stockholders’ equity and debt, as well as available credit facilities can appropriately support the anticipated financing needs of its operating subsidiaries.
At September 30, 2010, the Company had total equity capital of $241.3 million, bank loans of $114.9 million, subordinated debt of $0.5 million and convertible subordinated notes of $16.7 million.
A substantial portion of the Company’s assets are liquid. At September 30, 2010, approximately 92% of the Company’s assets consisted of cash; deposits and receivables from exchange-clearing organizations, broker-dealers, clearing organizations, FCM’s, and counterparties; customer receivables; marketable financial instruments and investments; and physical commodities inventory, at cost. All assets that are not customer and counterparty deposits, are financed by the Company’s equity capital, convertible subordinated notes, subordinated debt, bank loans, short-term borrowings from financial instruments sold, not yet purchased, and other payables.
Customer and Counterparty Credit and Liquidity Risk
Our operations expose us to credit risk of default of our customers and counterparties. The risk includes liquidity risk to the extent our customers or counterparties are unable to make timely payment of margin or other credit support. These risks expose us indirectly to the financing and liquidity risks of our customers and counterparties, including the risks that our customers and counterparties may not be able to finance their operations. Throughout the commodities and securities industries, continued volatility in commodity prices has required increased lines of credit, and placed a strain on working capital debt facilities. In many cases, our customers have been forced to increase leverage to unprecedented levels in order for them to continue to carry inventory and properly execute hedging strategies. Continuing volatility in the financial markets has tightened credit further.
As a clearing broker, we act on behalf of our customers for all trades consummated on exchanges. We must pay initial and variation margin to the exchanges before we receive the required payments from our customers. Accordingly, we are responsible for our customers’ obligations with respect to these transactions, which exposes us to significant credit risk. Our customers are required to make any required margin deposits the next business day, and we require our largest customers to make intra-day margin payments during periods of significant price movement. Our clients are required to maintain initial margin requirements at the level set by the respective exchanges, but we have the ability to increase the margin requirements for customers based on their open positions, trading activity, or market conditions.
37
INTERNATIONAL ASSETS HOLDING CORPORATION
ANNUAL REPORT ON FORM 10-K FOR THE FISCAL YEAR ENDED SEPTEMBER 30, 2010
With over-the-counter derivative transactions, we act as a principal, which exposes us to the credit risk of both our customers and the counterparties with whom we offset our customer positions. As with exchange-traded transactions, our over-the-counter transactions require that we meet initial and variation margin payments on behalf of our customers before we receive the required payment from our customers. Over-the-counter customers are required to post sufficient collateral to meet margin requirements based on Value at Risk models as well as variation margin requirement based on the price movement of the commodity or security in which they transact. Our customers are required to make any required margin deposits the next business day, and we may require our largest clients to make intra-day margin payments during periods of significant price movement. We have the ability to increase the margin requirements for customers based on their open positions, trading activity, or market conditions.
In addition, with over-the-counter transactions, we are at the risk that a counterparty will fail to meet its obligations when due. We would then be exposed to the risk that the settlement of a transaction which is due a customer will not be collected from the respective counterparty with whom the transaction was offset. We continuously monitor the credit quality of our respective counterparties and mark our positions held with each counterparty to market on a daily basis. FCStone has primarily carried trade credit insurance in amounts in excess of its exposure to each of its counterparty and will adjust levels of insurance or positions with a given counterparty based on the exposure to that counterparty.
As a result of the acquistion of FCStone, the Company acquired notes receivable from certain customers and an introducing broker which arose from previous customer account deficits. At September 30, 2010, notes receivable related to these customer account deficits were $125.1 million. The Company is uncertain as to the full collectability of the contractual amounts, and no assurances can be given as to the amount and timing of recovery that may be obtained under the promissory notes. The Company estimates the collectability on these notes to be $13.6 million at September 30, 2010.
During 2010, the Company recorded a charge to bad debt expense of approximately $2.3 million related to a disputed trade that was “given-up” to FCStone by another FCM for a customer that held an account with FCStone. Despite expressly informing the FCM that the Company would not accept the “give-up” trade, the “give-up” trade was submitted through the electronic clearing process and erroneously cleared by FCStone, generating a deficit in the customer’s trading account. The customer lacked the financial capacity to cover the account deficit, and FCStone has filed a complaint and is seeking legal relief through arbitration against the FCM to have the “give-up” transaction rescinded, with an award of appropriate damages.
Primary Sources and Uses of Cash
The Company’s assets and liabilities may vary significantly from period to period due to changing customer requirements, economic and market conditions and the growth of the Company. The Company’s total assets at September 30, 2010 and September 30, 2009, were $2,021.7 million and $1,555.7 million, respectively. The Company’s operating activities generate or utilize cash as a result of net income or loss earned or incurred during each period and fluctuations in its assets and liabilities. The most significant fluctuations arise from changes in the level of customer activity, commodities prices and changes in the balances of financial instruments and commodities inventory. FCStone, LLC, our FCM subsidiary, occasionally uses its margin line credit facilities, on a short-term basis, to meet intraday settlements with the commodity exchanges prior to collecting margin funds from our customers. FCStone, LLC has historically utilized subordinated debt to increase its excess regulatory capital, however that practice ceased during 2010, as discussed further below.
We have liquidity and funding policies and processes in place that are intended to maintain significant flexibility to address both company-specific and industry liquidity needs. The majority of our excess funds are held with high quality institutions, under highly-liquid reverse repurchase agreements, with a maturity of typically three days or less, U.S. Government Treasury and Agency securities and AA-rated money market investments.
At September 30, 2010, approximately $6.6 million of the Company’s financial instruments owned and $7.5 million of financial instruments sold, not yet purchased, are exchangeable foreign equities and American Depository Receipts.
On June 21, 2010, the Company’s subsidiary, FCStone, LLC amended and restated its $75.0 million syndicated margin line credit facility available for funding daily and intraday margin calls at exchanges, committed through June 22, 2011. During September 2010, the Company’s subsidiary, INTL Commodities, amended its revolving syndicated loan facility, increasing the amount available under the facility to $140.0 million, and the facility is committed until September 21, 2011.
At September 30, 2010, the Company’s subsidiary, INTL Global Currencies Limited, had a $25.0 million facility, committed until December 17, 2010 and the Company had its own $35.0 million facility, committed until December 17, 2010. As of September 30, 2010, the Company had bank facilities of $275.0 million, of which $114.9 million was outstanding. Subsequent to September 30, 2010, and effective October 29, 2010, the Company amended these two bilateral facilities into a single three year senior secured revolving credit facility in the amount of $75 million, committed until October 1, 2013.
38
INTERNATIONAL ASSETS HOLDING CORPORATION
ANNUAL REPORT ON FORM 10-K FOR THE FISCAL YEAR ENDED SEPTEMBER 30, 2010
On December 2, 2010, the Company entered into a Credit Agreement with Bank of Montreal, as Agent, and BMO Capital Markets Financing, Inc., as lender, which provides a $50 million uncommitted borrowing facility. Borrowings under the facility will be used to finance traditional commodity financing arrangements, and the credit agreement expires on December 1, 2011.
Prior to April 1, 2010, the Company had a subordinated debt facility with a syndicate of lenders that was being utilized as capital for regulatory purposes. On April 1, 2010, the Company repaid in full the outstanding subordinated debt, and the commitment was terminated as the ability of the Company to draw on this subordinated debt facility expired on July 22, 2009. The Company does not expect to replace this facility, and management believes the termination of this subordinated debt facility will not significantly impact our overall business operations. We expect to increase excess regulatory capital, if needed, through income from operations and available internal cash reserves.
The Company’s facility agreements contain covenants relating to financial measures such as minimum net worth, minimum working capital, minimum regulatory capital and minimum interest coverage ratios. Failure to comply with any such covenants could result in the debt becoming payable on demand. The Company and its subsidiaries are in compliance with all of its covenants under these facilities.
The Company collected $37.1 million during 2010, relating to the net operating loss of FCStone Group, Inc. for its fiscal year ended August 31, 2009. The Company elected to carry back the net operating loss to recapture taxes paid in the prior two fiscal years.
In September 2006, the Company completed a private placement of $27 million of 7.625% subordinated convertible notes (the “Notes”). The Notes mature in September 2011. They are convertible at any time at the option of the noteholder at a current conversion price of $21.79 per share. The Notes contain customary anti-dilutive provisions. During the 2006 fiscal year, $2.0 million in principal amount of the Notes, together with accrued interest, were converted into a total of 79,562 shares of common stock of the Company. During the 2008 fiscal year, approximately $8.2 million in principal amount of the Notes, together with accrued interest, were converted into a total of 325,755 shares of common stock of the Company. During the 2009 fiscal year, approximately $0.1 million in principal amount of the Notes, together with accrued interest, were converted into a total of 4,359 shares of common stock of the Company, leaving $16.7 million in principal amount of Notes outstanding. At the current conversion price, conversion would result in the issue of 767,886 new shares of common stock. The Company may require conversion at any time if the dollar volume-weighted average share price exceeds $38.25 for 20 out of any 30 consecutive trading days. Noteholders could redeem their Notes at par if the interest coverage ratio set forth in the Notes was less than 2.75 for the twelve-month period ending December 31, 2009. The consolidated net interest coverage ratio for the twelve-month period ended December 31, 2009 exceeded 2.75, so the holders were not entitled to early redemption of their Notes.
Set forth below is the calculation of consolidated EBITDA and consolidated cash interest expense, as defined in the Notes, for the trailing twelve month period ended September 30, 2010:
| (in millions) |
For the Trailing Twelve Months Ended September 30, 2010 (non-GAAP) |
|||
| Income from continuing operations |
$ | 12.0 | ||
| Noncontrolling interests |
(0.3 | ) | ||
| Income tax |
5.9 | |||
| Depreciation and amortization |
1.6 | |||
| Stock compensation amortization |
1.8 | |||
| Interest expense |
9.9 | |||
| Change in unrealized fair market value gain in physical commodities inventory |
4.7 | |||
| Other marked-to-market adjustments |
1.3 | |||
| Consolidated EBITDA (non-GAAP) |
$ | 36.9 | ||
| Interest expense |
$ | 9.9 | ||
| Less: amortization of deferred financing costs |
(0.2 | ) | ||
| Consolidated cash interest expense (non-GAAP) |
$ | 9.7 | ||
39
INTERNATIONAL ASSETS HOLDING CORPORATION
ANNUAL REPORT ON FORM 10-K FOR THE FISCAL YEAR ENDED SEPTEMBER 30, 2010
Adjusted consolidated EBITDA is a financial measure that is not recognized by U.S. GAAP, and should not be considered as an alternative to any other measures of performance derived in accordance with U.S. GAAP. The Company has included this non-GAAP financial measure because it required under the terms of the Notes.
During fiscal 2010, one of the noteholders commenced litigation against the Company, alleging that the transaction with FCStone constituted a change of control under the Notes and that, as a result, the Company should have afforded the noteholder the opportunity to redeem the Notes at a 15% premium. The remaining three holders of the notes holding Notes in an aggregate amount of $13.0 million, filed a similar lawsuit on the Company on October 20, 2010. The Company is of the view that the FCStone transaction did not result in a change of control as defined in the Notes and intends to continue to defend the matter vigorously. Refer to Item 3—Legal Proceedings, for additional information.
Effective May 2007, the Company acquired a group of companies (together ‘INTL Gainvest’) that conduct a specialist local markets securitization and asset management business in South America. In addition to the initial purchase price, the Company agreed to make a further payment to the sellers of INTL Gainvest on June 1, 2008 equal to 25% of the aggregate revenues of INTL Gainvest earned in the year to April 30, 2008; and a further payment on June 1, 2009 equal to 25% of the aggregate revenues of INTL Gainvest earned in the year to April 30, 2009. Accordingly, the Company paid $1.4 million to the sellers of INTL Gainvest on June 1, 2008 and a further $1.4 million on June 1, 2009. No further payments are required to be made by the Company to the sellers of INTL Gainvest.
On December 31, 2007, FCStone LLC acquired Downes-O’Neill, LLC, a registered brokerage group and risk management consulting firm specializing in serving the dairy industry. Under the terms of the purchase agreement, FCStone LLC is obligated to pay additional consideration if specific conditions and earnings targets are met annually, based on a calendar year period, through December 31, 2010. If the earnings targets are met, additional consideration of $1.0 million is triggered, plus an additional twenty percent of the excess over the earnings target. For the calendar year period ended December 31, 2009, the specific conditions and earnings targets were reached and additional consideration of $1.2 million was distributed during the quarter ended March 31, 2010. The additional consideration was a pre-acquisition contingency, and reported as an extraordinary loss in the consolidated income statement.
On April 7, 2009, the Company acquired CIBSA, a leading securities broker-dealer based in Argentina. The Company paid approximately $1.7 million on the date of purchase and is obligated to make additional payments over the next two years, depending on the level of revenues achieved. Under the purchase agreement, the Company was obligated to pay an amount equal to 25% of the net revenues if such revenues are in excess of $2.5 million and up to $3.0 million, 35% of the net revenues in excess of $3.0 million up to $4.0 million, and 40% of the net revenues in excess of $4.0 million for each of the two twelve-month periods ending March 31, 2010 and 2011 to the sellers as additional consideration. For the twelve-month period ended March 31, 2010, the specific net revenue target was reached and additional consideration of $0.8 million was distributed in May of 2010. Any amounts paid under this agreement are recorded as goodwill.
On April 1, 2010, the Company acquired Risk Management Incorporated and RMI Consulting, Inc. (the “RMI Companies”). The purchase price consisted of an initial payment of $6.0 million, and three contingent payments which will be based on the combined net income of the RMI Companies for each of the three years after the closing. The estimated total purchase price, including contingent consideration is approximately $16.7 million. The fair value of the additional consideration is recognized as a contingent liability as of the acquisition date. The acquisition date fair value of additional consideration is estimated to be approximately $10.7 million. The contingent liability represents the fair value of the expected consideration to be paid based on the forecasted sales during the three year period and a discount rate being applied to those future payments.
On July 2, 2010, the Company, acquired HGC Trading, LLC; HGC Asset Management, LLC; HGC Advisory Services, LLC; Hanley Alternative Trade Group, LLC and HGC Office Services, LLC (the “Hanley Companies”). The purchase price consisted of cash payments totaling $31.8 million and three additional contingent payments equal to 15% of the adjusted earnings before interest and taxes of the soft commodities derivatives business of the Hanley Companies and FCStone Trading LLC, subsequently renamed INTL Hanley, LLC, (the “Derivatives Division”) for each twelve month period during the three year period commencing on July 1, 2010. The estimated total purchase price, including contingent consideration is approximately $47.4 million. The fair value of the additional consideration is recognized as a contingent liability as of the acquisition date. The acquisition date fair value of additional consideration is estimated to be approximately $15.6 million. The contingent liability represents the fair value of the expected consideration to be paid based on the forecasted sales during the three year period and a discount rate being applied to those future payments.
On September 20, 2010, the Company acquired certain assets of Provident Group (“Provident”), a New York-based investment banking and advisory firm. Under terms of the acquisition agreement, the Company acquired assets and secured the services of the individual sellers as set forth in the agreement. The purchase price for the assets and services of the sellers was $5.0 million.
40
INTERNATIONAL ASSETS HOLDING CORPORATION
ANNUAL REPORT ON FORM 10-K FOR THE FISCAL YEAR ENDED SEPTEMBER 30, 2010
Subsequent to the fiscal year ended September 30, 2010, the Company acquired all of the membership interests in Hencorp Becstone Futures, L.C. (“Hencorp Futures”), the futures operation of Miami-based Hencorp Group. Hencorp Futures specializes in the development and execution of risk-management programs designed to hedge price volatility in a number of widely traded commodities, including coffee, sugar, cocoa, grains and energy products. The purchase price consists of an initial payment of $2.3 million, four contingent payments which will be based on Hencorp Futures’ net income for each of the four years after the closing and a final contingent payment based on the average net income of the second, third and fourth years.
Other Capital Considerations
Our FCM subsidiary, FCStone LLC is subject to various regulations and capital adequacy requirements. Pursuant to the rules, regulations, and requirements of the CFTC and other self-regulatory organizations, FCStone LLC is required to maintain certain minimum net capital as defined in such rules, regulations, and requirements. Net capital will fluctuate on a daily basis. FCStone LLC had adjusted net capital at September 30, 2010 of $77.8 million, which was $25.0 million in excess of its minimum net capital requirement of $52.8 million. Subsequent to September 30, 2010, the business activities of FCStone Forex, LLC have been transferred to FCStone, LLC. The transfer has not had a material impact on the net capital of FCStone, LLC.
INTL Trading, the Company’s broker-dealer subsidiary, is subject to the net capital requirements of the SEC relating to liquidity and net capital levels. At September 30, 2010, INTL Trading had regulatory net capital of $1.5 million, which was $0.5 million in excess of its minimum net capital requirement of $1.0 million. The Company’s ability to receive distributions from INTL Trading is restricted by regulations of the SEC. The Company’s right to receive distributions from its subsidiaries is also subject to the rights of the subsidiaries’ creditors, including customers of INTL Trading. During 2010 INTL Trading paid dividends of $3.9 million to the Company.
FCStone Australia Pty Ltd is regulated by the Australian Securities and Investment Commission and is subject to a minimum capital requirement which at September 30, 2010 was $50,000.
FCC Investments, Inc., a broker-dealer subsidiary of FCStone, is subject to the net capital requirements of the SEC relating to liquidity and net capital levels. At September 30, 2010, FCC Investments, Inc. had regulatory net capital of $0.4 million, and its minimum net capital requirement was $0.3 million.
FCStone Commodities Services (Europe), Ltd. is regulated by the Financial Regulator of Ireland and is subject to a minimum capital requirement which at September 30, 2010 was 370,000 euros.
Risk Management Incorporated is regulated by the CFTC and the National Futures Association (“NFA”) and is subject to a minimum capital requirement which at September 30, 2010 was $45,000.
The Company expects to contribute $0.8 million to its defined benefit pension plans during fiscal 2011, which represents the minimum funding requirement.
Cash Flows
The Company’s cash and cash equivalents increased from approximately $60.5 million at September 30, 2009 to approximately $81.9 million at September 30, 2010, a net increase of approximately $21.4 million. Net cash of $111.8 million was provided by operating activities, $41.0 million was used in investing activities and net cash of $49.2 million was used in financing activities, of which approximately $6.1 million was from a reduction in amounts payable to lenders under loans and overdrafts and $56.0 million was used in repayment of subordinated debt. Fluctuations in exchange rates had a negative effect of $0.2 million on the Company’s cash and cash equivalents.
The Company is continuously evaluating opportunities to expand its business. Expansion of the Company’s activities will require funding and will have an effect on liquidity.
Apart from what has been disclosed above, there are no known trends, events or uncertainties that have had or are likely to have a material impact on the liquidity, financial condition and capital resources of the Company.
Commitments
Information about the Company’s commitments and contingent liabilities is contained in Note 15 of the Consolidated Financial Statements.
The Company’s senior subordinated convertible notes, as described in note 14 of the Notes to the Consolidated Financial Statements, are due in September 2011 if they are not converted or redeemed prior to their due date. Refer to Item 3- Legal Proceedings, for information on litigation commenced in November 2009 against the Company by a noteholder.
Off Balance Sheet Arrangements
The Company is party to certain financial instruments with off-balance sheet risk in the normal course of business as a registered securities broker-dealer and futures commission merchant and from its market making and proprietary trading in the foreign exchange and commodities trading business. As part of these activities, the Company carries short positions. For example, it sells financial instruments that it does not own, borrows the financial instruments to make good delivery, and
41
INTERNATIONAL ASSETS HOLDING CORPORATION
ANNUAL REPORT ON FORM 10-K FOR THE FISCAL YEAR ENDED SEPTEMBER 30, 2010
therefore is obliged to purchase such financial instruments at a future date in order to return the borrowed financial instruments. The Company has recorded these obligations in the consolidated financial statements at September 30, 2010 and 2009 at the fair value of the related financial instruments, totaling $189.6 million and $127.5 million, respectively. These positions are held to offset the risks related to financial assets owned and reported on the Company’s consolidated balance sheets under ‘Financial instruments owned, at fair value’, and ‘Physical commodities inventory, at cost’. The Company will incur losses if the fair value of the financial instruments sold, not yet purchased, increases subsequent to September 30, 2010, which might be partially or wholly offset by gains in the value of assets held at September 30, 2010. The total of $189.6 million and $127.5 million includes a net liability of $87.6 million and $30.8 million for derivatives, based on their fair value as of September 30, 2010 and 2009, respectively.
In the Company’s foreign exchange and commodities trading business segments, the Company holds options and futures contracts resulting from market-making and proprietary trading activities in the Company’s foreign exchange/commodities trading business segment. The Company assists its customers in its commodities trading business to protect the value of their future production (precious or base metals) by selling them put options on an OTC basis. The Company also provides its commodities trading business customers with sophisticated option products, including combinations of buying and selling puts and calls. The Company mitigates its risk by effecting offsetting options with market counterparties or through the purchase or sale of exchange traded commodities futures. The risk mitigation of offsetting options is not within the documented hedging designation requirements of the Derivatives and Hedging Topic of the ASC.
In the Company’s C&RM segment, the Company will generally offset the customer’s transaction simultaneously with one of our trading counterparties when transacting OTC and foreign exchange contracts with our customers. On a limited basis, our OTC and foreign exchange trade desks will accept a customer transaction and will offset that transaction with a similar but not identical position on the exchange. These unmatched transactions are intended to be short-term in nature and are conducted to facilitate the most effective transaction for our customer.
Derivative contracts are traded along with cash transactions because of the integrated nature of the markets for such products. The Company manages the risks associated with derivatives on an aggregate basis along with the risks associated with its proprietary trading and market-making activities in cash instruments as part of its firm-wide risk management policies.
The Company is a member of various commodity exchanges and clearing organizations. Under the standard membership agreement, all members are required to guarantee the performance of other members and, accordingly, in the event another member is unable to satisfy its obligations to the exchange, may be required to fund a portion of the shortfall. Our liability under these arrangements is not quantifiable and could exceed the cash and securities we have posted as collateral at the exchanges. However, management believes that the potential for us to be required to make payments under these arrangements is remote. Accordingly, no contingent liability for these arrangements has been recorded in the consolidated balance sheets as of September 30, 2010.
Effects of Inflation
The Company’s assets are not significantly affected by inflation because they are, to a large extent, liquid in nature. Increases in the Company’s expenses, such as compensation and benefits, clearing and related expenses, occupancy and equipment rental, due to inflation, may not be readily recoverable from increasing the prices of services offered by the Company. In addition, to the extent that inflation results in rising interest rates or has other adverse effects on the financial markets and on the value of financial instruments, currency and commodities positions, it may adversely affect the Company’s financial position and results of operations.
Critical Accounting Policies
The preparation of consolidated financial statements in conformity with accounting principles generally accepted in the United States of America (“U.S. GAAP”) requires management to make estimates and assumptions that affect the reported amounts of assets, liabilities, revenue, and expenses. The most significant of these estimates and assumptions relate to fair value measurements for financial instruments and investments and the provision for potential losses from bad debts. Provisions for estimated bad debts are recorded on a specific identification basis. Although these and other estimates and assumptions are based on the best available information, actual results could be materially different from these estimates.
The Company believes that, of its significant accounting policies, those described below may, in certain instances, involve a high degree of judgment and complexity. Therefore, understanding these policies is important in understanding the reported results of operations and the financial position of the Company.
Valuation of Financial Instruments and Foreign Currencies. Substantially all financial instruments are reflected in the consolidated financial statements at fair value or amounts that approximate fair value. These financial instruments include: cash, cash equivalents, and financial instruments purchased under agreements to resell; deposits with clearing organizations; financial instruments owned; and financial instruments sold but not yet purchased. Unrealized gains and losses related to these financial instruments, which are not customer owned positions, are reflected in earnings. Where available, the Company uses
42
INTERNATIONAL ASSETS HOLDING CORPORATION
ANNUAL REPORT ON FORM 10-K FOR THE FISCAL YEAR ENDED SEPTEMBER 30, 2010
prices from independent sources such as listed market prices, or broker or dealer price quotations. Fair values for certain derivative contracts are derived from pricing models that consider current market and contractual prices for the underlying financial instruments or commodities, as well as time value and yield curve or volatility factors underlying the positions. In some cases, even though the value of a security is derived from an independent market price or broker or dealer quote, certain assumptions may be required to determine the fair value. However, these assumptions may be incorrect and the actual value realized upon disposition could be different from the current carrying value. The value of foreign currencies, including foreign currencies sold, not yet purchased, are converted into its U.S. dollar equivalents at the foreign exchange rates in effect at the close of business at the end of the accounting period. For foreign currency transactions completed during each reporting period, the foreign exchange rate in effect at the time of the transaction is used.
The application of the valuation process for financial instruments and foreign currencies is critical because these items represent a significant portion of the Company’s total assets. Valuations for substantially all of the financial instruments held by the Company are available from independent publishers of market information. The valuation process may involve estimates and judgments in the case of certain financial instruments with limited liquidity and OTC derivatives. Given the wide availability of pricing information, the high degree of liquidity of the majority of the Company’s assets, and the relatively short periods for which they are typically held in inventory, these factors mitigate the risk of changes in estimates having a material effect on the Company. The basis for estimating the valuation of any financial instruments has not undergone any change.
Revenue Recognition. The revenues of the Company are derived principally from realized and unrealized trading income in securities, derivative instruments, commodities and foreign currencies purchased or sold for the Company’s account. Realized and unrealized trading income is recorded on a trade date basis. Securities owned and securities sold, not yet purchased and foreign currencies sold, not yet purchased, are stated at fair value with related changes in unrealized appreciation or depreciation reflected in ‘Trading gains’. Fee and interest income are recorded on the accrual basis and dividend income is recognized on the ex-dividend date.
Revenue on commodities that are purchased for physical delivery to customers and that are not readily convertible into cash is recognized at the point in time when the commodity has been shipped, title and risk of loss has been transferred to the customer, and the following conditions have been met: persuasive evidence of an arrangement exists, the price is fixed and determinable, and collectability of the resulting receivable is reasonably assured.
The critical aspect of revenue recognition for the Company is recording all known transactions as of the trade date of each transaction for the financial period. The Company has developed systems for each of its businesses to capture all known transactions. Recording all known transactions involves reviewing trades that occur after the financial period that relate to the financial period. The accuracy of capturing this information is dependent upon the completeness and accuracy of data capture of the operations systems and the Company’s clearing firm.
Physical Commodities Inventory. Physical commodities inventory is stated at the lower of cost or fair value, determined using the weighted-average price method. The Company generally mitigates the price risk associated with physical commodities held in inventory through the use of derivatives. The Company does not elect hedge accounting under U.S. GAAP in accounting for this price risk mitigation. Any unrealized gains in physical commodities inventory are not recognized under U.S. GAAP, but unrealized gains and losses in related derivative positions are recognized under U.S. GAAP. As a result, the Company’s reported commodities trading earnings are subject to volatility.
Recently Issued Accounting Standards
The details for recently issued accounting standards can be found under Note 2 of the Consolidated Financial Statements.
| Item 7A. | Quantitative and Qualitative Disclosures about Market Risk |
Market Risk
The Company conducts its market-making and trading activities predominantly as a principal, which subjects its capital to significant risks. These risks include, but are not limited to, absolute and relative price movements, price volatility and changes in liquidity, over which the Company has virtually no control. The Company’s exposure to market risk varies in accordance with the volume of customer-driven market-making transactions, the size of the proprietary positions and the volatility of the financial instruments traded.
We seek to mitigate exposure to market risk by utilizing a variety of qualitative and quantitative techniques:
| • | diversification of business activities and instruments |
| • | limitations on positions |
43
INTERNATIONAL ASSETS HOLDING CORPORATION
ANNUAL REPORT ON FORM 10-K FOR THE FISCAL YEAR ENDED SEPTEMBER 30, 2010
| • | allocation of capital and limits based on estimated weighted risks |
| • | daily monitoring of positions and mark-to-market profitability |
The Company utilizes derivative products in a trading capacity as a dealer, to satisfy customer needs and mitigate risk. The Company manages risks from both derivatives and non-derivative cash instruments on a consolidated basis. The risks of derivatives should not be viewed in isolation, but in aggregate with the Company’s other trading activities.
Management believes that the volatility of revenues is a key indicator of the effectiveness of its risk management techniques. The graph below summarizes volatility of the Company’s daily revenue, determined on a marked-to-market basis, during fiscal year 2010.
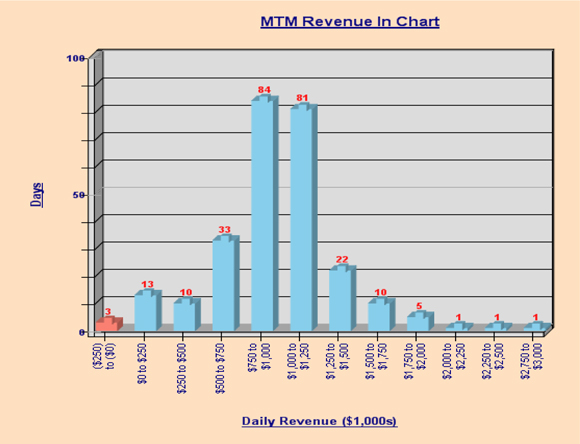
In the Company’s securities market-making and trading activities, the Company maintains inventories of equity and debt securities. In the Company’s commodities market-making and trading activities, the Company’s positions include physical inventories, forwards, futures and options. The Company’s commodity trading activities are managed as one consolidated book for each commodity encompassing both cash positions and derivative instruments. The Company monitors the aggregate position for each commodity in equivalent physical ounces or metric tons.
Margin Risk
Our customers with exchange-traded positions, including OTC trades submitted for clearing, are required to maintain margin sufficient to support their open trading positions. While we initially establish each client’s margin requirement at the level set by the respective exchanges, we have the ability to increase the requirements to levels we believe are sufficient to cover their open positions. A client’s subsequent trading activity or adverse market changes may cause that client’s previous margin payments to be inadequate to support their trading obligations, which, in instances where we serve as the exchange clearing member for the trade, would require us to cover any shortfall and thereby expose us to potential losses. When we act as a principal in the OTC markets, we are responsible for the performance of both our customers as well the counterparty with which we have offset the customer’s transactions.
44
INTERNATIONAL ASSETS HOLDING CORPORATION
ANNUAL REPORT ON FORM 10-K FOR THE FISCAL YEAR ENDED SEPTEMBER 30, 2010
Interest Rate Risk
In the ordinary course of our operations, we have interest rate risk from the possibility that changes in interest rates will affect the values of financial instruments and impact interest income earned. We generate interest income from the positive spread earned on customer deposits. We typically invest in U.S. Treasury and Agency securities, reverse repurchase agreements involving U.S. Treasury and Agency securities or AA rate money market funds. We have an investment policy which establishes acceptable standards of credit quality and limits the amount of funds that can be invested within a particular fund and institution.
In April 2010, we implemented an interest rate risk management strategy using derivative financial instruments in the form of interest rate swaps to manage a portion of our aggregate interest rate position. Our objective is to invest the majority of customer segregated deposits in high quality, short-term investments and swap the resulting variable interest earnings into the medium-term interest stream, by using a strip of interest rate swaps that mature every quarter, and enable us to achieve the two year moving average of the two year swap rate. These interest rate swaps are not designated for hedge accounting treatment, and changes in the marked-to-market valuations of the financial instruments are recorded in earnings on a quarterly basis.
We manage interest expense using floating rate debt and through interest rate swap transactions. Refer to Note 7 to the Consolidated Financial Statements for information on the interest rate swap transactions. The debt instruments are carried at their unpaid principal balance which approximates fair value. All of the debt outstanding at September 30, 2010, has a variable interest rate.
| Item 8. | Financial Statements and Supplementary Data |
The financial statements of International Assets Holding Corporation are as follows:
Management’s Report on the Consolidated Financial Statements
Our management is responsible for the preparation of the consolidated financial statements and related information that are presented in this report. The consolidated financial statements, which include amounts based on management’s estimates and judgments, have been prepared in conformity with accounting principles generally accepted in the United States of America. The Company designs and maintains accounting and internal control systems to provide reasonable assurance at reasonable cost that assets are safeguarded against loss from unauthorized use or disposition, and that the financial records are reliable for preparing financial statements and maintaining accountability for assets. These systems are augmented by written policies, an organizational structure providing division of responsibilities and careful selection and training of qualified personnel.
The consolidated financial statements have been audited by KPMG, LLP, an independent registered public accounting firm, who conducted their audit in accordance with the standards of the Public Company Accounting Oversight Board (United States). The independent registered public accounting firm’s responsibility is to express an opinion as to whether such financial statements fairly present, in all material respects, our financial position, results of operations and cash flows in accordance with U.S. generally accepted accounting principles.
| Item 9. | Changes in and Disagreements with Accountants on Accounting and Financial Disclosure |
None.
45
INTERNATIONAL ASSETS HOLDING CORPORATION
ANNUAL REPORT ON FORM 10-K FOR THE FISCAL YEAR ENDED SEPTEMBER 30, 2010
| Item 9A. | Controls and Procedures |
In connection with the filing of this Form 10-K, the Company’s management, including the Chief Executive Officer and Chief Financial Officer, evaluated the effectiveness of the Company’s disclosure controls and procedures as of September 30, 2010. The Company’s Chief Executive Officer and Chief Financial Officer have concluded that the Company’s disclosure controls and procedures were effective as of September 30, 2010.
There were no changes in the Company’s internal controls over financial reporting during 2010 that materially affected, or are reasonably likely to materially affect, the Company’s internal control over financial reporting.
It should be noted that a control system, no matter how well designed and operated, can provide only reasonable, not absolute, assurance that the objectives of the control system are met. As a result, there can be no assurance that a control system will succeed in preventing all possible instances of error and fraud. The Company’s disclosure controls and procedures are designed to provide reasonable assurance of achieving their objectives, and the conclusions of our Chief Executive Officer and Chief Financial Officer are made at the “reasonable assurance” level.
Management’s report on internal control over financial reporting and the report of KPMG, LLP are contained in Part II, Item 8 of this report.
The Company’s Chief Executive Officer and Chief Financial Officer filed with the SEC as exhibits to the Form 10-K for the year ended September 30, 2010 and are filing as exhibits to this report, the certifications required by Section 302 of the Sarbanes-Oxley Act of 2002 and Rule 13a-14(a) and Rule 15d-14(a) of the Securities Exchange Act of 1934.
| Item 9B. | Other Information |
None.
PART III
| Item 10. | Directors, Executive Officers and Corporate Governance |
A list of our executive officers and biographical information about them and our directors will be included in the definitive Proxy Statement for our 2011 Annual Meeting of Shareholders to be held on February 24, 2011, which will be filed within 120 days of the end of our fiscal year ended September 30, 2010 (the “2011 Proxy Statement”) and is incorporated herein by reference. Information about our Audit Committee may be found in the Proxy Statement. That information is incorporated herein by reference.
We have adopted a code of ethics that applies to the directors, officers and employees of the Company and each of its subsidiaries. The code of ethics is publicly available on our Website at www.intlassets.com/ethics.aspx. If we make any substantive amendments to the code of ethics or grant any waiver, including any implicit waiver, from a provision of the code to our Chief Executive Officer, Chief Financial Officer, or Chief Accounting Officer, we will disclose the nature of the amendment or waiver on that website or in a report on Form 8-K.
| Item 11. | Executive Compensation |
Information relating to our executive officer and director compensation and the compensation committee of our board of directors will be included in the 2011 Proxy Statement and is incorporated herein by reference.
| Item 12. | Security Ownership of Certain Beneficial Owners and Management and Related Stockholder Matters |
Information relating to security ownership of certain beneficial owners of our common stock and information relating to the security ownership of our management will be included in the 2011 Proxy Statement and is incorporated herein by reference.
The following table provides information generally as of September 30, 2010, the last day of fiscal 2010, regarding securities to be issued on exercise of stock options, and securities remaining available for issuance under our equity compensation plans that were in effect during fiscal 2010.
46
INTERNATIONAL ASSETS HOLDING CORPORATION
ANNUAL REPORT ON FORM 10-K FOR THE FISCAL YEAR ENDED SEPTEMBER 30, 2010
| Plan Category |
Number of securities to be issued upon exercise of outstanding options, warrants and rights |
Weighted average exercise price of outstanding options, warrants and rights |
Number of securities remaining available for future issuance under equity compensation plans |
|||||||||
| Equity compensation plans approved by shareholders |
1,476,500 | $ | 20.42 | 744,871 | ||||||||
| Equity compensation plans not approved by shareholders |
— | — | — | |||||||||
| Total |
1,476,500 | $ | 20.42 | 744,871 | ||||||||
| Item 13. | Certain Relationships and Related Transactions, and Director Independence |
Information regarding certain relationships and related transactions and director independence will be included in the 2011 Proxy Statement and is incorporated herein by reference.
| Item 14. | Principal Accountant Fees and Services |
Information regarding principal accountant fees and services will be included in the 2011 Proxy Statement and is incorporated herein by reference.
PART IV
| Item 15. | Exhibits and Financial Statement Schedules |
| (a) | Consolidated Financial Statements and Financial Statement Schedules. See “Part II—Item 8. Financial Statements and Supplementary Data. |
(c) Exhibit No.
3.1 Amended and Restated Certificate of Incorporation (incorporated by reference from the Company’s Form 8-K filed with the SEC on October 9, 2009).
3.2 Amended and Restated By-laws (incorporated by reference from the Company’s Quarterly Report on Form 10-Q filed with the SEC on August 14, 2007).
4.1 International Assets Holding Corporation 1993 Stock Option Plan (incorporated by reference from the Company’s Registration Statement on Form SB-2 (No. 33-70334-A) filed with the SEC on February 2, 1994).
4.2 Amendment dated December 28, 1995 to the International Assets Holding Corporation 1993 Stock Option Plan (incorporated by reference from the Registration Statement on Form S-8 (No. 333-10727) filed with the SEC on August 23, 1996).
4.3 Amendment dated October 28, 1998 to the International Assets Holding Corporation 1993 Stock Option Plan (incorporated by reference from Company’s Proxy Statement on Form 14A filed with the SEC on January 15, 1999).
4.4 Amendment dated June 9, 2000 to the International Assets Holding Corporation 1993 Stock Option Plan (incorporated by reference from the Company’s Proxy Statement on Form 14A filed with the SEC on January 12, 2001).
4.5 International Assets Holding Corporation 2003 Stock Option Plan (incorporated by reference from the Company’s Proxy Statement on Schedule 14A filed on January 14, 2003).
4.6 Amendment to International Assets Holding Corporation 2003 Stock Option Plan (incorporated by reference from the Company’s Proxy Statement on Form 14A filed with the SEC on February 11, 2004).
4.7 Amendment to International Assets Holding Corporation 2003 Stock Option Plan (incorporated by reference from the Company’s Proxy Statement on Form 14A filed with the SEC on January 23, 2006).
4.8 FCStone Group, Inc. 2006 Equity Incentive Plan (incorporated by reference from the Registration Statement on Form S-8 filed by FCStone Group, Inc. with the SEC on June 12, 2006).
10.1 Employment Agreement, dated October 22, 2002, by and between the Company and Sean O’Connor (incorporated by reference from the Company’s Form 8-K filed with the SEC on October 24, 2002).
10.2 Employment Agreement, dated October 22, 2002, by and between the Company and Scott Branch (incorporated by reference from the Company’s Form 8-K filed with the SEC on October 24, 2002).
47
INTERNATIONAL ASSETS HOLDING CORPORATION
ANNUAL REPORT ON FORM 10-K FOR THE FISCAL YEAR ENDED SEPTEMBER 30, 2010
10.3 Registration Rights Agreement, dated October 22, 2002, by and between the Company, and Sean O’Connor (incorporated by reference from the Company’s Form 8-K filed with the SEC on October 24, 2002).
10.4 First Amendment to Registration Rights Agreement, dated December 6, 2002, by and between the Company and Sean O’Connor (incorporated by reference from the Company’s Form 8-K filed with the SEC on December 10, 2002).
10.5 Registration Rights Agreement, dated October 22, 2002, by and between the Company and Scott Branch (incorporated by reference from the Company’s Form 8-K filed with the SEC on October 24, 2002).
10.6 First Amendment to Registration Rights Agreement, dated December 6, 2002, by and between the Company and Scott Branch (incorporated by reference from the Company’s Form 8-K filed with the SEC on December 10, 2002).
10.7 Registration Rights Agreement, dated October 22, 2002, by and between the Company and John Radziwill (incorporated by reference from the Company’s Form 8-K filed with the SEC on October 24, 2002).
10.8 First Amendment to Registration Rights Agreement, dated December 6, 2002, by and between the Company and John Radziwill (incorporated by reference from the Company’s Form 8-K filed with the SEC on December 10, 2002).
10.9 Clearing Agreement, effective November 23, 2005, by and between the Company and Broadcort, a division of Merrill Lynch, Pierce, Fenner & Smith, Inc. (incorporated by reference from the Company’s Form 8-K filed with the SEC on December 6, 2005).
10.10 Employment Agreement, effective December 1, 2004, by and between the Company and Brian T. Sephton (incorporated by reference from the Company’s Form 8-K, as filed with the SEC on November 24, 2004).
10.11 International Assets Holding Corporation form of Senior Subordinated Convertible Note (incorporated by reference from the Company’s Form 8-K filed with the SEC on September 15, 2006).
10.12 International Assets Holding Corporation form of Securities Purchase Agreement (incorporated by reference from the Company’s Form 8-K filed with the SEC on September 15, 2006).
10.13 International Assets Holding Corporation form of Lock Up Agreement (incorporated by reference from the Company’s
Form 8-K filed with the
SEC on September 15, 2006).
10.14 International Assets Holding Corporation form of Registration Rights Agreement (incorporated by reference from the Company’s Form 8-K filed with the SEC on September 15, 2006).
10.15 2007 Restricted Stock Plan (incorporated by reference from the Company’s Proxy Statement on Form 14A filed with the SEC on January 18, 2007).
10.16 2007 Executive Compensation Plan (incorporated by reference from the Company’s Proxy Statement on Form 14A filed with the SEC on January 18, 2007).
10.17 Chief Executive Officer Employment Agreement, effective September 1, 2007, between FCStone Group, Inc. and Paul G. Anderson (incorporated by reference from the Current Report on Form 8-K filed by FCStone Group, Inc. with the SEC on July 15, 2008)
10.18 Executive Employment Agreement, effective September 1, 2008, between FCStone Group, Inc. and William J. Dunaway (incorporated by reference from the Current Report on Form 8-K filed by FCStone Group, Inc. with the SEC on November 12, 2008)
10.19 CEO Deferred Compensation Plan for Paul G. Anderson dated February 22, 2002 (incorporated by reference from the Registration Statement on Form S-4 filed by FCStone Group, Inc. with the SEC on August 18, 2004)
10.20 Farmers Commodities Corporation Supplemental Nonqualified Pension Plan (incorporated by reference from Amendment No. 2 to the Registration Statement on Form S-4 filed by FCStone Group, Inc. with the SEC on December 9, 2004)
10.21 Executive Short-Term Incentive Plan (incorporated by reference from Amendment No. 2 to the Registration Statement on Form S-1, filed by FCStone Group, Inc. with the SEC on February 27, 2007)
10.22 FCStone Group, Inc. Executive Long Term Incentive Plan Effective Fiscal Year 2008 (incorporated by reference from the Current Report on Form 8-K filed by FCStone Group, Inc. with the SEC on July 15, 2008)
10.23 FCStone Group Inc. Change In Control Severance Plan (incorporated by reference from Amendment No. 2 to the Registration Statement on Form S-1, filed by FCStone Group, Inc. with the SEC on February 27, 2007)
48
INTERNATIONAL ASSETS HOLDING CORPORATION
ANNUAL REPORT ON FORM 10-K FOR THE FISCAL YEAR ENDED SEPTEMBER 30, 2010
10.24 FCStone Group, Inc. Staff Incentive Plan (incorporated by reference from Amendment No. 2 to the Registration Statement on Form S-1, filed by FCStone Group, Inc. with the SEC on February 27, 2007 )
10.25 FCStone Group, Inc. Amended and Restated Mutual Commitment Compensation Plan (incorporated by reference from Amendment No. 2 to the Registration Statement on Form S-4 filed by FCStone Group, Inc. with the SEC on December 9, 2004)
10.26 Form of Director Indemnification Agreement (incorporated by reference from Amendment No. 3 to the Registration Statement on Form S-4 filed by FCStone Group, Inc. with the SEC on December 30, 2004)
10.27 Agreement and Plan of Merger dated as of July 1, 2009, by and among International Assets Holding Corporation, International Assets Acquisition Corp. and FCStone Group, Inc. (incorporated by reference from the Company’s Current Report on Form 8-K filed with the SEC on July 2, 2009).
10.28 Support Agreement dated as of July 1, 2009, by and among International Assets Holding Corporation, International Assets Acquisition Corp. and FCStone Group, Inc. (incorporated by reference from the Company’s Current Report on Form 8-K filed with the SEC on July 2, 2009).
10.29 Option Agreement dated as of July 1, 2009, by and among International Assets Holding Corporation and FCStone Group, Inc. (incorporated by reference from the Company’s Current Report on Form 8-K filed with the SEC on July 2, 2009).
10.30 Stock Purchase Agreement dated as of April 1, 2010, by and among FCStone Group, Inc.; Risk Management Incorporated; RMI Consulting, Inc.; John Snell; Daniel Conrath and Shane Mathis (incorporated by reference from the Company’s Current Report on Form 8-K filed with the SEC on April 5, 2010).
10.31 Amended and Restated Credit Agreement, made as of June 21, 2010, by and between FCStone, LLC, as borrower, FCStone Group, Inc., as a guarantor, International Assets Holding Corporation, as a guarantor, Bank of Montreal, as administrative agent, BMO Capital Markets, as Sole Lead Arranger, and the lenders party thereto (incorporated by reference from the Company’s Current Report on Form 8-K filed with the SEC on June 24, 2010).
10.32 Purchase Agreement dated as of July 2, 2010, by and among FCStone Group, Inc.; Hanley Group Holdings, LLC; HGC Trading, LLC; HGC Asset Management, LLC; HGC Advisory Services, LLC; Hanley Alternative Trade Group, LLC; HGC Office Services, LLC; George P. Hanley; George P. Hanley Trust and George P. Hanley GRAT (incorporated by reference from the Company’s Current Report on Form 8-K filed with the SEC on July 7, 2010).
10.33 Option Agreement by and among International Assets Holding Corporation and Hanley Group Holdings, LLC (incorporated by reference from the Company’s Current Report on Form 8-K filed with the SEC on July 7, 2010).
10.34 Amended and Restated Credit Agreement, made as of September 22, 2010, by and between INTL Commodities, Inc. as borrower, International Assets Holding Corporation, as a guarantor, BNP Paribas as Administrative Agent, Collateral Agent, an Issuing Bank and the Swing Line Lender, ABN AMRO Bank N.V. and Rabobank Nederland, New York Branch, as additional Issuing Banks, and the lenders party thereto (incorporated by reference from the Company’s Current Report on Form 8-K filed with the SEC on September 28, 2010).
10.35 Credit Agreement, effective on October 29, 2010, by and between International Assets Holding Corporation and INTL Global Currencies Limited as borrowers, the subsidiaries identified therein as guarantors, Bank of America, N.A. and additional lenders (incorporated by reference from the Company’s Current Report on Form 8-K filed with the SEC on November 4, 2010).
10.36 Credit Agreement, made as of December 2, 2010, by and between FCStone Financial, Inc. as borrower, International Assets Holding Corporation, as guarantor, Bank of Montreal, as Administrative Agent and a Lender, and the lenders party thereto (incorporated by reference from the Company’s Current Report on Form 8-K filed with the SEC on Decemebr 7, 2010).
14 International Assets Holding Corporation Code of Ethics (incorporated by reference from the Company’s Form 10-KSB filed with the SEC on December 29, 2003).
| 21 | List of the Company’s subsidiaries. * |
| 23.1 | Consent of KPMG LLP* |
| 23.2 | Consent of Rothstein, Kass & Company, P.C. * |
| 31.1 | Certification of Chief Executive Officer, pursuant to Rule 13a—14(a). * |
| 31.2 | Certification of Chief Financial Officer, pursuant to Rule 13a—14(a). * |
49
INTERNATIONAL ASSETS HOLDING CORPORATION
ANNUAL REPORT ON FORM 10-K FOR THE FISCAL YEAR ENDED SEPTEMBER 30, 2010
32.1 Certification of Chief Executive Officer, pursuant to 18 U.S.C. Section 1350, as adopted pursuant to Section 906 of the Sarbanes-Oxley Act of 2002. *
32.2 Certification of Chief Financial Officer, pursuant to 18 U.S.C. Section 1350, as adopted pursuant to Section 906 of the Sarbanes-Oxley Act of 2002. *
| * | Filed as part of this report. |
Schedules and Exhibits Excluded
All schedules and exhibits not included are not applicable, not required or would contain information which is included in Consolidated Financial Statements, Summary of Significant Accounting Policies, or the Notes to the Consolidated Financial Statements.
50
INTERNATIONAL ASSETS HOLDING CORPORATION
ANNUAL REPORT ON FORM 10-K FOR THE FISCAL YEAR ENDED SEPTEMBER 30, 2010
In accordance with Section 13 or 15(d) of the Securities and Exchange Act of 1934, the registrant caused this report to be signed on its behalf by the undersigned, thereunto duly authorized.
| INTERNATIONAL ASSETS HOLDING CORPORATION | ||
| By: | /S/ SEAN M. O’CONNOR | |
| Sean M. O’Connor, | ||
| Chief Executive Officer | ||
| Dated: December 15, 2010 | ||
Pursuant to the requirements of the Securities and Exchange Act of 1934, this report has been signed below by the following persons in the capacities and on the dates indicated.
| Signature |
Title |
Date | ||
| /S/ DIEGO J. VEITIA |
Director and Chairman of the Board | December 15, 2010 | ||
| Diego J. Veitia | ||||
| /S/ SEAN M. O’CONNOR |
Director and Chief Executive Officer | December 15, 2010 | ||
| Sean M. O’Connor | (Principal Executive Officer) | |||
| /S/ SCOTT J. BRANCH |
Director and Chief Operating Officer | December 15, 2010 | ||
| Scott J. Branch | ||||
| /S/ PAUL G. ANDERSON |
Director and President | December 15, 2010 | ||
| Paul G. Anderson | ||||
|
|
Director | |||
| Robert A. Miller | ||||
|
|
Director | |||
| John Radziwill | ||||
| /S/ JUSTIN R. WHEELER |
Director | December 15, 2010 | ||
| Justin R. Wheeler | ||||
| /S/ JOHN M. FOWLER |
Director | December 15, 2010 | ||
| John M. Fowler | ||||
| /S/ BRENT BUNTE |
Director | December 15, 2010 | ||
| Brent Bunte | ||||
|
|
Director | |||
| Bruce Krehbiel | ||||
| /S/ DARYL HENZE |
Director | December 15, 2010 | ||
| Daryl Henze | ||||
| /S/ ERIC PARTHEMORE |
Director | December 15, 2010 | ||
| Eric Parthemore | ||||
| /S/ JACK FRIEDMAN |
Director | December 15, 2010 | ||
| Jack Friedman | ||||
| /S/ WILLIAM J. DUNAWAY |
Chief Financial Officer | December 15, 2010 | ||
| William J. Dunaway | (Principal Financial Officer and Chief Accounting Officer) | |||
51
Report of Independent Registered Public Accounting Firm
The Board of Directors and Stockholders
International Assets Holding Corporation:
We have audited International Assets Holding Corporation’s (the Company) internal control over financial reporting as of September 30, 2010, based on criteria established in Internal Control – Integrated Framework issued by the Committee of Sponsoring Organizations of the Treadway Commission. The Company’s management is responsible for maintaining effective internal control over financial reporting and for its assessment of the effectiveness of internal control over financial reporting, included in the accompanying Management’s Annual Report on Internal Control over Financial Reporting. Our responsibility is to express an opinion on the Company’s internal control over financial reporting based on our audit.
We conducted our audit in accordance with the standards of the Public Company Accounting Oversight Board (United States). Those standards require that we plan and perform the audit to obtain reasonable assurance about whether effective internal control over financial reporting was maintained in all material respects. Our audit included obtaining an understanding of internal control over financial reporting, assessing the risk that a material weakness exists, and testing and evaluating the design and operating effectiveness of internal control based on the assessed risk. Our audit also included performing such other procedures as we considered necessary in the circumstances. We believe that our audit provides a reasonable basis for our opinion.
A company’s internal control over financial reporting is a process designed to provide reasonable assurance regarding the reliability of financial reporting and the preparation of financial statements for external purposes in accordance with generally accepted accounting principles. A company’s internal control over financial reporting includes those policies and procedures that (1) pertain to the maintenance of records that, in reasonable detail, accurately and fairly reflect the transactions and dispositions of the assets of the company; (2) provide reasonable assurance that transactions are recorded as necessary to permit preparation of financial statements in accordance with generally accepted accounting principles, and that receipts and expenditures of the company are being made only in accordance with authorizations of management and directors of the company; and (3) provide reasonable assurance regarding prevention or timely detection of unauthorized acquisition, use, or disposition of the company’s assets that could have a material effect on the financial statements.
Because of its inherent limitations, internal control over financial reporting may not prevent or detect misstatements. Also, projections of any evaluation of effectiveness to future periods are subject to the risk that controls may become inadequate because of changes in conditions, or that the degree of compliance with the policies or procedures may deteriorate.
In our opinion, the Company maintained, in all material respects, effective internal control over financial reporting as of September 30, 2010, based on criteria established in Internal Control — Integrated Framework issued by the Committee of Sponsoring Organizations of the Treadway Commission.
We also have audited, in accordance with the standards of the Public Company Accounting Oversight Board (United States), the consolidated balance sheet of the Company and subsidiaries as of September 30, 2010, and the related consolidated statements of income, stockholders’ equity, and cash flows for the year then ended, and our report dated December 15, 2010 expressed an unqualified opinion on those consolidated financial statements.
/s/ KPMG LLP
Kansas City, Missouri
December 15, 2010
F - 1
Report of Independent Registered Public Accounting Firm
The Board of Directors and Stockholders
International Assets Holding Corporation:
We have audited the accompanying consolidated balance sheet of International Assets Holding Corporation and subsidiaries (the Company) as of September 30, 2010, and the related consolidated statements of income, stockholders’ equity, and cash flows for the year then ended. These consolidated financial statements are the responsibility of the Company’s management. Our responsibility is to express an opinion on these consolidated financial statements based on our audit.
We conducted our audit in accordance with the standards of the Public Company Accounting Oversight Board (United States). Those standards require that we plan and perform the audit to obtain reasonable assurance about whether the financial statements are free of material misstatement. An audit includes examining, on a test basis, evidence supporting the amounts and disclosures in the financial statements. An audit also includes assessing the accounting principles used and significant estimates made by management, as well as evaluating the overall financial statement presentation. We believe that our audit provides a reasonable basis for our opinion.
In our opinion, the consolidated financial statements referred to above present fairly, in all material respects, the financial position of the Company as of September 30, 2010, and the results of its operations and its cash flows for the year then ended, in conformity with U.S. generally accepted accounting principles.
We also have audited, in accordance with the standards of the Public Company Accounting Oversight Board (United States), the Company’s internal control over financial reporting as of September 30, 2010, based on criteria established in Internal Control — Integrated Framework issued by the Committee of Sponsoring Organizations of the Treadway Commission, and our report dated December 15, 2010 expressed an unqualified opinion on the effectiveness of the Company’s internal control over financial reporting.
/s/ KPMG LLP
Kansas City, Missouri
December 15, 2010
F - 2
REPORT OF INDEPENDENT REGISTERED PUBLIC ACCOUNTING FIRM
To the Board of Directors and Stockholders of
International Assets Holding Corporation
We have audited the accompanying consolidated balance sheet of International Assets Holding Corporation and Subsidiaries (collectively, the “Company”) as of September 30, 2009, and the related consolidated income statements, statements of stockholders’ equity, and cash flows for each of the years in the two-year period ended September 30, 2009. These consolidated financial statements are the responsibility of the Company’s management. Our responsibility is to express an opinion on these consolidated financial statements based on our audits.
We conducted our audits in accordance with the standards of the Public Company Accounting Oversight Board (United States). Those standards require that we plan and perform the audits to obtain reasonable assurance about whether the financial statements are free of material misstatement. Our audit of the consolidated financial statements included examining, on a test basis, evidence supporting the amounts and disclosures in the consolidated financial statements, assessing the accounting principles used and significant estimates made by management, as well as evaluating the overall financial statement presentation. We believe that our audits provide a reasonable basis for our opinion.
In our opinion, the consolidated financial statements referred to above present fairly, in all material respects, the financial position of the Company as of September 30, 2009, and the results of its operations and its cash flows for each of the years in the two-year period ended September 30, 2009 in conformity with accounting principles generally accepted in the United States of America.
Our audits were conducted for the purpose of expressing an opinion on the basic consolidated financial statements taken as a whole. The accompanying financial statement schedule is presented for the purpose of additional analysis. The financial statement schedule has be subjected to the auditing procedures applied in the audit of the basic financial statement and, in our opinion, is fairly stated in all material respects, in relation to the basic consolidated financial statements taken as a whole.
/s/ Rothstein, Kass & Company, P.C.
Roseland, New Jersey
December 14, 2009
F - 3
INTERNATIONAL ASSETS HOLDING CORPORATION
Consolidated Balance Sheets
(In millions, except par value and share amounts)
| September 30, 2010 |
September 30, 2009 |
|||||||
| ASSETS | ||||||||
| Cash and cash equivalents |
$ | 81.9 | $ | 60.5 | ||||
| Cash and securities segregated under federal and other regulations (including $0.8 and $2.0 at fair value at September 30, 2010 and 2009, respectively) |
15.3 | 14.9 | ||||||
| Securities purchased under agreements to resell |
342.0 | — | ||||||
| Deposits and receivables from: |
||||||||
| Exchange-clearing organizations (including $906.4 and $727.9 at fair value at September 30, 2010 and 2009, respectively) |
903.4 | 899.0 | ||||||
| Broker-dealers, clearing organizations and counterparties (including $56.1 and $20.4 at fair value at September 30, 2010 and 2009, respectively) |
173.9 | 69.6 | ||||||
| Receivable from customers, net |
78.0 | 56.3 | ||||||
| Notes receivable, net |
29.2 | 22.2 | ||||||
| Income taxes receivable |
9.4 | 44.9 | ||||||
| Financial instruments owned, at fair value |
159.8 | 209.8 | ||||||
| Physical commodities inventory, at cost |
125.0 | 106.9 | ||||||
| Deferred income taxes |
21.0 | 29.6 | ||||||
| Property and equipment, net |
7.3 | 4.7 | ||||||
| Goodwill and intangible assets, net |
53.4 | 13.7 | ||||||
| Other assets |
22.1 | 23.6 | ||||||
| Total assets |
$ | 2,021.7 | $ | 1,555.7 | ||||
| LIABILITIES AND EQUITY | ||||||||
| Liabilities: |
||||||||
| Accounts payable and other accrued liabilities |
$ | 99.4 | $ | 63.7 | ||||
| Payables to: |
||||||||
| Customers |
1,351.0 | 935.8 | ||||||
| Broker-dealers, clearing organizations and counterparties |
3.9 | 4.0 | ||||||
| Lenders under loans and overdrafts |
114.9 | 108.7 | ||||||
| Income taxes payable |
2.8 | 2.3 | ||||||
| Financial instruments sold, not yet purchased, at fair value |
189.6 | 127.5 | ||||||
| 1,761.6 | 1,242.0 | |||||||
| Subordinated debt |
0.5 | 56.5 | ||||||
| Convertible subordinated notes payable |
16.7 | 16.7 | ||||||
| Total liabilities |
1,778.8 | 1,315.2 | ||||||
| Commitments and contingencies (see Note 12) |
||||||||
| Equity: |
||||||||
| International Assets Holding Corporation stockholders’ equity: |
||||||||
| Preferred stock, $.01 par value. Authorized 1,000,000 shares; no shares issued or outstanding |
— | — | ||||||
| Common stock, $.01 par value. Authorized 30,000,000 shares; 17,612,792 issued and 17,601,535 outstanding at September 30, 2010 and 17,361,884 issued and 17,350,627 outstanding at September 30, 2009 |
0.2 | 0.2 | ||||||
| Common stock in treasury, at cost - 11,257 shares at September 30, 2010 and September 30, 2009 |
(0.1 | ) | (0.1 | ) | ||||
| Additional paid-in capital |
184.6 | 187.0 | ||||||
| Retained earnings |
59.7 | 54.3 | ||||||
| Accumulated other comprehensive loss |
(3.1 | ) | (2.6 | ) | ||||
| Total International Assets Holding Corporation stockholders’ equity |
241.3 | 238.8 | ||||||
| Noncontrolling interests |
1.6 | 1.7 | ||||||
| Total equity |
242.9 | 240.5 | ||||||
| Total liabilities and equity |
$ | 2,021.7 | $ | 1,555.7 | ||||
The accompanying notes are an integral part of the consolidated financial statements.
F - 4
INTERNATIONAL ASSETS HOLDING CORPORATION
Consolidated Income Statements
(In millions, except share and per share amounts)
| Year Ended September 30, | ||||||||||||
| 2010 | 2009 | 2008 | ||||||||||
| Revenues: |
||||||||||||
| Sales of physical commodities |
$ | 46,709.2 | $ | 43,554.0 | $ | 18,255.2 | ||||||
| Trading gains |
86.5 | 39.1 | 79.7 | |||||||||
| Commission and clearing fees |
118.0 | 6.5 | 5.3 | |||||||||
| Consulting and management fees |
19.1 | 1.9 | 2.4 | |||||||||
| Interest income |
7.0 | 1.8 | 3.2 | |||||||||
| Other income |
0.5 | 0.4 | 0.6 | |||||||||
| Total revenues |
46,940.3 | 43,603.7 | 18,346.4 | |||||||||
| Cost of sales of physical commodities |
46,671.3 | 43,513.1 | 18,231.5 | |||||||||
| Operating revenues |
269.0 | 90.6 | 114.9 | |||||||||
| Interest expense |
9.9 | 8.0 | 11.2 | |||||||||
| Net revenues |
259.1 | 82.6 | 103.7 | |||||||||
| Non-interest expenses: |
||||||||||||
| Compensation and benefits |
104.2 | 40.2 | 35.6 | |||||||||
| Clearing and related expenses |
68.2 | 16.0 | 13.1 | |||||||||
| Communication and data services |
11.1 | 2.1 | 2.1 | |||||||||
| Introducing broker commissions |
18.9 | — | — | |||||||||
| Occupancy and equipment rental |
6.2 | 1.1 | 1.1 | |||||||||
| Professional fees |
8.1 | 2.2 | 2.0 | |||||||||
| Depreciation and amortization |
1.6 | 0.8 | 0.8 | |||||||||
| Bad debts and impairments |
5.8 | 3.0 | 2.4 | |||||||||
| Other |
17.1 | 3.9 | 4.3 | |||||||||
| Total non-interest expenses |
241.2 | 69.3 | 61.4 | |||||||||
| Income from operations, before tax |
17.9 | 13.3 | 42.3 | |||||||||
| Income tax expense |
6.4 | 2.6 | 16.2 | |||||||||
| Net income before discontinued operations |
11.5 | 10.7 | 26.1 | |||||||||
| (Income) loss from discontinued operations, net of tax |
(0.6 | ) | 1.1 | (1.0 | ) | |||||||
| Income before extraordinary loss |
12.1 | 9.6 | 27.1 | |||||||||
| Extraordinary (gain) loss |
7.0 | (18.5 | ) | — | ||||||||
| Net income |
5.1 | 28.1 | 27.1 | |||||||||
| Less: Net income (loss) attributable to noncontrolling interests |
(0.3 | ) | 0.5 | (0.7 | ) | |||||||
| Net income attributable to International Assets Holding Corporation common shareholders |
$ | 5.4 | $ | 27.6 | $ | 27.8 | ||||||
| Basic earnings (loss) per share: |
||||||||||||
| Income from continuing operations attributable to International Assets Holding Corporation common shareholders |
$ | 0.68 | $ | 1.16 | $ | 3.14 | ||||||
| (Loss) income from discontinued operations attributable to International Assets Holding Corporation common shareholders |
0.03 | (0.13 | ) | 0.16 | ||||||||
| Extraordinary (loss) income attributable to International Assets Holding Corporation common shareholders |
(0.40 | ) | 2.08 | — | ||||||||
| Net income attributable to International Assets Holding Corporation common shareholders |
$ | 0.31 | $ | 3.11 | $ | 3.30 | ||||||
| Diluted earnings (loss) per share: |
||||||||||||
| Income from continuing operations attributable to International Assets Holding Corporation common shareholders |
$ | 0.66 | $ | 1.10 | $ | 2.81 | ||||||
| (Loss) income from discontinued operations attributable to International Assets Holding Corporation common shareholders |
0.03 | (0.12 | ) | 0.14 | ||||||||
| Extraordinary (loss) income attributable to International Assets Holding Corporation common shareholders |
(0.39 | ) | 1.82 | — | ||||||||
| Net income attributable to International Assets Holding Corporation common shareholders |
$ | 0.30 | $ | 2.80 | $ | 2.95 | ||||||
| Weighted-average number of common shares outstanding: |
||||||||||||
| Basic |
17,306,019 | 8,895,697 | 8,434,976 | |||||||||
| Diluted |
17,883,233 | 10,182,586 | 9,901,706 | |||||||||
| Amounts attributable to International Assets Holding Corporation common shareholders: |
||||||||||||
| Income from continuing operations, net of tax |
$ | 11.8 | $ | 10.2 | $ | 26.5 | ||||||
| Loss from discontinued operations, net of tax |
(0.6 | ) | 1.1 | (1.3 | ) | |||||||
| Extraordinary loss |
7.0 | (18.5 | ) | — | ||||||||
| Net income |
$ | 5.4 | $ | 27.6 | $ | 27.8 | ||||||
The accompanying notes are an integral part of the consolidated financial statements.
F - 5
INTERNATIONAL ASSETS HOLDING CORPORATION
Consolidated Cash Flow Statements
(In millions)
| Year Ended September 30, | ||||||||||||
| 2010 | 2009 | 2008 | ||||||||||
| Cash flows from operating activities: |
||||||||||||
| Net income |
$ | 5.1 | $ | 28.1 | $ | 27.1 | ||||||
| Adjustments to reconcile net income to net cash provided by operating activities: |
||||||||||||
| Depreciation and amortization |
1.7 | $ | 0.7 | $ | 1.2 | |||||||
| Provision for bad debts |
3.5 | — | — | |||||||||
| Deferred income taxes |
3.7 | (3.7 | ) | 7.8 | ||||||||
| Amortization of debt issuance costs and debt discount |
0.2 | 0.2 | 0.3 | |||||||||
| Convertible debt interest settled in company stock upon partial conversion |
— | — | 0.1 | |||||||||
| Noncontrolling interest |
— | 0.7 | 1.1 | |||||||||
| Amortization of stock-based compensation expense |
1.9 | 1.9 | 1.5 | |||||||||
| Unrealized investment gains from INTL Consilium managed funds |
— | (2.0 | ) | 3.5 | ||||||||
| Loss on disposition of INTL Consilium, LLC |
— | 0.4 | — | |||||||||
| Extraordinary loss (gain) on acquisition of FCStone |
7.0 | (18.5 | ) | — | ||||||||
| Impairment of INTL Sieramet |
1.1 | 1.1 | — | |||||||||
| Deconsolidation and impairment of Agora-x subsidiary |
(2.9 | ) | — | — | ||||||||
| Changes in operating assets and liabilities: |
||||||||||||
| Cash and securities segregated under federal and other regulations |
(0.3 | ) | — | — | ||||||||
| Deposits and receivables from exchange-clearing organizations |
(4.2 | ) | — | — | ||||||||
| Deposits and receivables from broker-dealers, clearing organizations and counterparties |
(57.6 | ) | 11.2 | 11.2 | ||||||||
| Receivable from customers, net |
(18.2 | ) | 1.9 | (19.5 | ) | |||||||
| Notes receivable from customers, net |
(7.0 | ) | — | — | ||||||||
| Income taxes receivable |
35.4 | (4.6 | ) | 1.1 | ||||||||
| Financial instruments owned and securities purchased under agreements to resell, at fair value |
(212.7 | ) | 44.9 | (26.2 | ) | |||||||
| Physical commodities inventory, at cost |
(18.1 | ) | (49.6 | ) | (17.8 | ) | ||||||
| Other assets |
3.9 | (2.2 | ) | (2.3 | ) | |||||||
| Accounts payable and other accrued liabilities |
1.9 | (6.0 | ) | (1.3 | ) | |||||||
| Payable to customers |
415.3 | 26.1 | 8.0 | |||||||||
| Payable to broker-dealers, clearing organization and counterparties |
(0.4 | ) | (22.5 | ) | 10.5 | |||||||
| Income taxes payable |
0.4 | 0.6 | (2.0 | ) | ||||||||
| Financial instruments sold, not yet purchased, at fair value |
(46.7 | ) | (26.1 | ) | (32.9 | ) | ||||||
| Net cash provided by (used in) operating activities |
$ | 113.0 | $ | (17.4 | ) | $ | (28.6 | ) | ||||
| Cash flows from investing activities: |
||||||||||||
| Capital contribution of consolidated joint venture partner |
— | 0.2 | — | |||||||||
| Capital distribution to consolidated joint venture partner |
— | (2.8 | ) | (2.8 | ) | |||||||
| (De-consolidation) / consolidation of affiliates |
(0.3 | ) | (8.2 | ) | 16.4 | |||||||
| Disposition of affiliates |
0.2 | 0.4 | — | |||||||||
| Investment withdrawals from (in) managed funds |
— | 17.9 | (10.0 | ) | ||||||||
| Cash acquired with acquisition of FCStone |
— | 24.2 | — | |||||||||
| Cash paid for other acquisitions, net |
(37.6 | ) | (1.1 | ) | (1.4 | ) | ||||||
| Purchase of property and equipment |
(4.7 | ) | (2.8 | ) | (1.1 | ) | ||||||
| Net cash (used in) provided by investing activities |
(42.4 | ) | 27.8 | 1.1 | ||||||||
| Cash flows from financing activities: |
||||||||||||
| Net change in payable to lenders under loans and overdrafts |
6.1 | (13.8 | ) | 34.7 | ||||||||
| Repayment of subordinated debt |
(56.0 | ) | — | — | ||||||||
| Share repurchase |
— | (0.1 | ) | — | ||||||||
| Exercise of stock options |
0.7 | 0.4 | 1.4 | |||||||||
| Income tax benefit on stock awards exercised |
— | 0.3 | 1.3 | |||||||||
| Net cash used in financing activities |
(49.2 | ) | (13.2 | ) | 37.4 | |||||||
| Effect of exchange rates on cash and cash equivalents |
— | 0.5 | (0.8 | ) | ||||||||
| Net increase (decrease) in cash and cash equivalents |
21.4 | (2.3 | ) | 9.1 | ||||||||
| Cash and cash equivalents at beginning of period |
60.5 | 62.8 | 53.7 | |||||||||
| Cash and cash equivalents at end of period |
$ | 81.9 | $ | 60.5 | $ | 62.8 | ||||||
| Supplemental disclosure of cash flow information: |
||||||||||||
| Cash paid for interest |
$ | 7.4 | $ | 8.8 | $ | 10.2 | ||||||
| Income taxes paid, net of refunds |
$ | (33.3 | ) | $ | 8.3 | $ | 9.4 | |||||
| Supplemental disclosure of non-cash investing and financing activities: |
||||||||||||
| Conversion of subordinated notes to common stock, net |
$ | — | $ | 0.1 | $ | 8.1 | ||||||
| Release of trust certificates |
$ | — | $ | — | $ | 11.2 | ||||||
| Estimated beginning fair value of assets and (liabilities) received on consolidation: |
||||||||||||
| Assets acquired |
— | $ | 1,178.9 | $ | 50.9 | |||||||
| Liabilities assumed |
— | (1,020.5 | ) | (43.7 | ) | |||||||
| Noncontrolling interests |
— | 1.6 | (7.2 | ) | ||||||||
| Total net assets acquired |
$ | — | $ | 160.0 | $ | — | ||||||
| Identified intangible assets on acquisitions |
$ | — | $ | 0.7 | $ | — | ||||||
| Additional consideration payable related to acquisitions |
$ | 26.3 | $ | — | $ | — | ||||||
| Issuance of common stock related to acquisitions |
$ | — | $ | 135.6 | $ | — | ||||||
The accompanying notes are an integral part of the consolidated financial statements.
F - 6
INTERNATIONAL ASSETS HOLDING CORPORATION
Consolidated Statements of Stockholders’ Equity
(In millions)
| Common Stock |
Treasury Stock |
Additional Paid-in Capital |
Retained Earnings |
Accumulated Other Comprehensive Loss |
Noncontrolling Interests |
Total | ||||||||||||||||||||||
| Balances as of September 30, 2007 |
$ | 0.1 | $ | — | $ | 36.6 | $ | (1.1 | ) | $ | — | $ | 3.1 | $ | 38.7 | |||||||||||||
| Components of comprehensive income: |
||||||||||||||||||||||||||||
| Net income |
27.8 | (0.7 | ) | 27.1 | ||||||||||||||||||||||||
| Change in unrealized loss on derivative instruments |
(0.8 | ) | (0.8 | ) | ||||||||||||||||||||||||
| Change in foreign currency translation |
(0.1 | ) | (0.1 | ) | ||||||||||||||||||||||||
| Total comprehensive income |
(0.9 | ) | (0.7 | ) | 26.2 | |||||||||||||||||||||||
| Exercise of stock options |
— | 1.4 | 1.4 | |||||||||||||||||||||||||
| Stock-based compensation |
2.8 | 2.8 | ||||||||||||||||||||||||||
| Debt conversion |
— | 8.1 | 8.1 | |||||||||||||||||||||||||
| Acquisition or consolidation |
7.1 | 7.1 | ||||||||||||||||||||||||||
| Disposition or de-consolidation |
(1.4 | ) | (1.4 | ) | ||||||||||||||||||||||||
| Balances as of September 30, 2008 |
$ | 0.1 | $ | — | $ | 48.9 | $ | 26.7 | $ | (0.9 | ) | $ | 8.1 | $ | 82.9 | |||||||||||||
| Components of comprehensive income: |
||||||||||||||||||||||||||||
| Net income |
27.6 | 0.5 | 28.1 | |||||||||||||||||||||||||
| Change in unrealized loss on derivative instruments |
(1.5 | ) | (1.5 | ) | ||||||||||||||||||||||||
| Change in foreign currency translation |
(0.2 | ) | (0.2 | ) | ||||||||||||||||||||||||
| Total comprehensive income |
(1.7 | ) | 0.5 | 26.4 | ||||||||||||||||||||||||
| Exercise of stock options |
— | 0.4 | 0.4 | |||||||||||||||||||||||||
| Stock-based compensation |
2.2 | 2.2 | ||||||||||||||||||||||||||
| Debt conversion |
— | 0.1 | 0.1 | |||||||||||||||||||||||||
| Acquisition or consolidation |
1.0 | 1.0 | ||||||||||||||||||||||||||
| Disposition or de-consolidation |
(7.9 | ) | (7.9 | ) | ||||||||||||||||||||||||
| Purchase of treasury shares |
(0.1 | ) | (0.1 | ) | ||||||||||||||||||||||||
| Issuance of shares for acquisition |
0.1 | 135.4 | 135.5 | |||||||||||||||||||||||||
| Balances as of September 30, 2009 |
$ | 0.2 | $ | (0.1 | ) | $ | 187.0 | $ | 54.3 | $ | (2.6 | ) | $ | 1.7 | $ | 240.5 | ||||||||||||
| Components of comprehensive income: |
||||||||||||||||||||||||||||
| Net income |
5.4 | (0.3 | ) | 5.1 | ||||||||||||||||||||||||
| Change in unrealized loss on derivative instruments |
1.1 | 1.1 | ||||||||||||||||||||||||||
| Change in pension liabilities |
(1.7 | ) | (1.7 | ) | ||||||||||||||||||||||||
| Unrealized gain/loss on available-for-sale securities |
0.2 | 0.2 | ||||||||||||||||||||||||||
| Change in foreign currency translation |
(0.1 | ) | (0.1 | ) | ||||||||||||||||||||||||
| Total comprehensive income |
(0.5 | ) | (0.3 | ) | 4.6 | |||||||||||||||||||||||
| Exercise of stock options |
— | 0.7 | 0.7 | |||||||||||||||||||||||||
| Stock-based compensation |
1.9 | 1.9 | ||||||||||||||||||||||||||
| Acquisition or consolidation |
1.6 | 1.6 | ||||||||||||||||||||||||||
| Disposition or de-consolidation |
(1.4 | ) | (1.4 | ) | ||||||||||||||||||||||||
| Stock held in escrow for business combination |
(5.0 | ) | (5.0 | ) | ||||||||||||||||||||||||
| Balances as of September 30, 2010 |
$ | 0.2 | $ | (0.1 | ) | $ | 184.6 | $ | 59.7 | $ | (3.1 | ) | $ | 1.6 | $ | 242.9 | ||||||||||||
The accompanying notes are an integral part of the consolidated financial statements.
F - 7
INTERNATIONAL ASSETS HOLDING CORPORATION
Notes to Consolidated Financial Statements
Note 1 – Description of Business
International Assets Holding Corporation, a Delaware corporation, together with its consolidated subsidiaries (collectively “INTL” or “the Company”), form a financial services group focused on domestic and select international markets. The Company’s services include comprehensive risk management advisory services for commercial customers; execution of listed futures and options on futures contracts on all major commodity exchanges; structured over-the-counter (“OTC”) products in a wide range of commodities; physical trading and hedging of precious and base metals and select other commodities; trading of more than 130 foreign currencies; market-making in international equities; debt origination and asset management.
The Company provides these services to a diverse group of approximately 10,000 customers located throughout the world, including producers, processors and end-users of nearly all widely-traded physical commodities to manage their risks and enhance margins; to commercial counterparties who are end-users of the firm’s products and services; to governmental and non-governmental organizations; and to commercial banks, brokers, institutional investors and major investment banks.
The Company entered into an Agreement and Plan of Merger dated July 1, 2009, with FCStone Group, Inc. (“FCStone”) that was approved by the stockholders of the Company on September 25, 2009 and was effective on September 30, 2009 (the FCStone transaction). The conclusion of the transaction on September 30, 2009, the last day of the previous fiscal year, means that the consolidated income statement of the Company for the year ended September 30, 2010 includes the results of FCStone, and the consolidated income statements for the years ended September 30, 2009 and 2008, respectively, reflect the results of INTL as it existed before the transaction except for extraordinary loss. The consolidated balance sheets at September 30, 2010 and 2009 reflect the financial condition of INTL after the FCStone transaction. See additional discussion of the transaction in Note 17.
Prior to the acquisition of FCStone in September 2009, the Company’s activities were divided into five reportable segments: International Equities Market-making, Foreign Exchange Trading, Commodities Trading, International Debt Capital Markets and Asset Management. The Company revised its segment reporting as a result of the FCStone transaction, and the Company’s activities are now divided into the following five reportable segments:
| • | Commodity and Risk Management Services |
| • | Foreign Exchange |
| • | Securities |
| • | Clearing and Execution Services |
| • | Other |
To conform to the current segment presentation, the Company has restated certain segment information for prior periods.
Note 2 – Significant Accounting Policies
Basis of Presentation
The accompanying consolidated financial statements include the accounts of International Assets Holding Corporation and all other entities in which the Company has a controlling financial interest. All material intercompany transactions and balances have been eliminated in consolidation. All adjustments that, in the opinion of management and consisting only of a normal and recurring nature, are necessary for a fair presentation for the periods presented have been reflected.
In accordance with the Consolidation Topic of the Accounting Standards Codification (“ASC”) the Company consolidates any variable interest entities for which it is the primary beneficiary, as defined. The Company applies the equity method of accounting when the Company does not have a controlling interest in an entity, but exerts significant influence over the entity.
Unless otherwise stated herein, all references to 2010, 2009, and 2008 refer to the Company’s fiscal years ended September 30.
Use of Estimates
The preparation of consolidated financial statements in conformity with accounting principles generally accepted in the United States of America (“U.S. GAAP”) requires management to make estimates and assumptions that affect the reported amounts of assets, liabilities, revenue, and expenses. The most significant of these estimates and assumptions relate to fair value measurements for financial instruments and investments and the provision for potential losses from bad debts. Provisions for estimated bad debts are recorded on a specific identification basis. Although these and other estimates and assumptions are based on the best available information, actual results could be materially different from these estimates.
F - 8
INTERNATIONAL ASSETS HOLDING CORPORATION
Notes to Consolidated Financial Statements—(Continued)
Foreign Currency Translation
Assets and liabilities recorded in foreign currencies are translated at the exchange rates prevailing on the balance sheet date. Revenue and expenses are translated at average rates of exchange prevailing during the period. Gains or losses on translation of the financial statements of a non-U.S. operation, when the functional currency is other than the U.S. dollar, are recorded in other comprehensive income (loss) (“OCI”) and flow directly through the consolidated statements of stockholders’ equity. Foreign currency remeasurement gains or losses on transactions in nonfunctional currencies are included in the consolidated income statements.
Cash and Cash Equivalents
Cash and cash equivalents consist of cash, foreign currency and money market funds not deposited with or pledged to an exchange-clearing organization and are stated at cost plus accrued interest, which approximates fair value. All cash and cash equivalents deposited with brokers, dealers and clearing organizations support the Company’s trading activities, and are subject to contractual restrictions.
Cash and Securities Segregated under Federal and other Regulations
Pursuant to requirements of the Commodity Exchange Act, funds deposited by customers relating to futures and options on futures contracts in regulated commodities must be carried in separate accounts which are designated as segregated customers’ accounts. The deposits in segregated customer accounts are not commingled with the funds of the company. At September 30, 2010 and 2009, cash and securities segregated under federal and other regulations consisted of cash held at banks, money market funds of approximately $14.5 million and $12.9 million, respectively and U.S. government securities and federal agency obligations of approximately $0.8 million and $2.0 million, respectively (see fair value measurements discussion in Note 6).
Securities purchased under agreements to resell
The Company has an overnight sweep reverse repurchase agreement program to allow the Company to enter into secured overnight investments (reverse repurchase agreements or reverse repos), which generally provides a higher investment yield than a regular operating account. The reverse repurchase agreements are recorded at amounts at which the securities were initially acquired. It is the policy of the Company to take possession of the securities purchased under agreements to resell. The Company receives U.S. treasury securities as collateral for the overnight agreements. The securities received are recorded at no more than the lesser of the current fair value of the securities or the net amount to be realized by the Company upon resale of the securities. The maturity of the reverse repurchase agreements is typically one day, at which point the securities are sold and the proceeds are returned to the Company, plus any accrued interest. Agreements to resell securities in the amount of $342.0 million and $0 were outstanding at September 30, 2010 and 2009, respectively.
Deposits and Receivables from Exchange-Clearing Organizations, Broker-dealers, Clearing Organizations and Futures Commission Merchants and Counterparties, and Payables to Broker-dealers, Clearing Organizations and Counterparties
As required by the regulations of the U.S. Commodity Futures Trading Commission (“CFTC”), customer funds received to margin, guarantee, and/or secure commodity futures transactions are segregated and accounted for separately from the general assets of the Company. Deposits with exchange-clearing organizations and broker-dealers and FCM’s pertain primarily to deposits made to satisfy margin requirements on customer and proprietary open futures and options on futures positions and to satisfy the requirements set by clearing exchanges for clearing membership. At September 30, 2010 and 2009, the Company had cash and cash equivalents on deposit with or pledged to exchange-clearing organizations, broker-dealers and FCM’s of $532.1 million and $951.7 million, respectively.
These balances also include securities pledged by the Company on behalf of customers and customer-owned securities that are pledged. It is the Company’s practice to include customer owned securities on its consolidated balance sheet, as the rights to those securities have been transferred to the Company under the terms of the futures trading agreement. Securities pledged include U.S. Treasury bills and instruments backed by U.S. government sponsored entities. The securities that are not customer-owned are adjusted to fair value with associated changes in unrealized gains or losses are recorded as a component of other comprehensive income until realized, in the Company’s consolidated balance sheet. For customer owned securities, the change in fair value is offset against the customer accounts payable with no impact recognized on the consolidated income statements.
F - 9
INTERNATIONAL ASSETS HOLDING CORPORATION
Notes to Consolidated Financial Statements—(Continued)
The securities, primarily U.S. Government obligations, held by FCStone as collateral or as margin have been deposited with exchange-clearing organizations, broker-dealers or other FCM’s. The fair value of these securities was approximately $998.1 million and $320.2 million at September 30, 2010 and 2009, respectively.
Management has considered guidance required by the Transfers and Servicing Topic of the Financial Accounting Standards Board (“FASB”) ASC as it relates to securities pledged by customers to margin their accounts. Based on a review of the agreements with the customer, management believes a legal basis exists to support that the transferor surrenders control over those assets if all of the following three conditions are met: (a) the transferred assets have been isolated from the transferor—put presumptively beyond the reach of the transferor and its creditors, even in bankruptcy or other receivership, (b) each transferee has the right to pledge or exchange the assets (or beneficial interests) it received, and no condition both constrains the transferee (or holder) from taking advantage of its right to pledge or exchange and provides more than a trivial benefit to the transferor and (c) the transferor does not maintain effective control over the transferred assets through either (1) an agreement that both entitles and obligates the transferor to repurchase or redeem them before their maturity or (2) the ability to unilaterally cause the holder to return specific assets, other than through a cleanup call. Under this guidance, the Company reflects the customer collateral assets and corresponding liabilities in the Company’s consolidated balance sheets as of September 30, 2010 and 2009.
In addition to margin, deposits with exchange-clearing organizations include guaranty deposits. The guaranty deposits are held by the clearing organization for use in potential default situations by one or more members of the clearing organization. The guaranty deposits may be applied to the Company’s obligations to the clearing organization, or to the clearing organization’s obligations to other clearing members or third parties. Deposits with and receivables from exchange-clearing organizations and broker-dealers and FCM’s are reported gross, except where a right of offset exists.
The Company maintains customer omnibus and proprietary accounts with other FCM’s, and the equity balances in those accounts along with any margin cash or securities deposited with the carrying broker are included in deposits and receivables from broker-dealers and FCM’s.
The Company pledges margin deposit with various counterparties for over-the-counter derivative contracts, and the deposits are included in deposits and receivables from counterparties.
Receivables from and payable to exchange-clearing organizations are primarily comprised of amounts due from or due to exchange-clearing organizations for daily variation settlements on open futures and options on futures positions. The variation settlements due from or due to exchange-clearing organizations are paid in cash on the following business day.
Receivables from and Payables to Customers
Receivables from customers, net of the allowance for doubtful accounts, include the secured and unsecured deficit balances due from customers related to margin requirements as of the balance sheet date. The secured amounts due are backed by U.S. Treasury bills and notes with a fair value of $0.2 million and $1.3 million at September 30, 2010 and 2009, respectively. Receivables from customers arise from realized and unrealized trading losses on futures and options on futures positions and amounts due on cash and margin transactions. Customer deficit accounts are reported gross of customer accounts that contain net credit or positive balances, except where a right of offset exists.
Payables to customers represent the total of customer accounts with credit or positive balances. Customer accounts are used primarily in connection with commodity transactions and include gains and losses on open commodity trades as well as securities and other deposits made as required by the Company or the exchange-clearing organizations. Customer accounts with credit or positive balances are reported gross of customer deficit accounts, except where a right of offset exists. Payables to customers for regulated accounts are for transactions facilitated by FCStone, an FCM, with exchange-clearing organizations. Payables to customers for unregulated accounts are for transactions occurring in the over-the-counter market.
For regulatory purposes, certain customers, which would include persons who are affiliated with the Company or is a principal, such as an officer or director, and any person who is materially involved in the management of the Company, are identified as noncustomers. A noncustomer account may not be carried as a customer account due to an affiliation with the Company. In a liquidation event, amounts owed to noncustomers are paid in the same priority as amounts owed to general creditors of the Company. These accounts are also referred to as proprietary accounts. The amounts related to noncustomer accounts are included in payables to customers on the consolidated balance sheets.
The future collectability of the receivables from customers can be impacted by the Company’s collection efforts, the financial stability of its customers, and the general economic climate in which it operates. The Company evaluates accounts that it believes may become uncollectible on a specific identification basis, through reviewing daily margin deficit reports, the historical daily aging of the receivables, and by monitoring the financial strength of its customers. The Company may unilaterally close customer trading positions in certain circumstances. In addition, to evaluate customer margining and collateral requirements, customer positions are stress tested regularly and monitored for excessive concentration levels relative to the overall market size.
F - 10
INTERNATIONAL ASSETS HOLDING CORPORATION
Notes to Consolidated Financial Statements—(Continued)
Notes Receivable from Customers
The Company accepts notes receivable under sale/repurchase agreements with customers whereby the customers sell certain commodity inventory to the Company and agree to repurchase the commodity inventory at a future date at either a fixed or floating rate. In accordance with the guidance contained in the Revenue Recognition Topic of the ASC, these transactions are treated as secured borrowings rather than commodity inventory in the Company’s consolidated financial statements.
Accrual of commodity financing income on any note is discontinued when, in the opinion of management, there is reasonable doubt as to the timely collectability of interest or principal. Nonaccrual notes are returned to an accrual status when, in the opinion of management, the financial position of the borrower indicates there is no longer any reasonable doubt as to the timely payment of principal and interest. The Company records a charge against operations for notes receivable losses when management believes that collectability of the principal is unlikely.
Physical Commodities Inventory
Physical commodities inventories are stated at the lower of cost or market, using the weighted-average price method. Cost includes finished commodity or raw material and processing costs related to the purchase and processing of inventories.
Property and Equipment
Property and equipment is stated at cost, net of accumulated depreciation and amortization and depreciated using the straight-line method over the estimated useful lives of the assets. Leasehold improvements are amortized on a straight-line basis over the estimated useful life of the improvement or the term of the lease, whichever is shorter. Certain costs of software developed or obtained for internal use are capitalized and amortized over the estimated useful life of the software.
Goodwill and Identifiable Intangible Assets
Goodwill is the cost of acquired companies in excess of the fair value of identifiable net assets at acquisition date. In accordance with the Intangibles – Goodwill and Other Topic of the ASC, goodwill is tested for impairment on an annual basis at the fiscal year-end, and between annual tests if indicators of potential impairment exist, using a fair-value-based approach. No impairment of goodwill has been identified during any of the periods presented.
Identifiable intangible assets subject to amortization are amortized using the straight-line method over their estimated period of benefit, ranging from three to twenty years. Identifiable intangible assets are tested for impairment whenever events or changes in circumstances suggest that an asset’s or asset group’s carrying value may not be fully recoverable in accordance with the Intangibles – Goodwill and Other Topic of the ASC. Residual value is presumed to be zero. Identifiable intangible assets not subject to amortization are reviewed at each reporting period to reevaluate if the intangible asset’s useful life remains indefinite. Additionally, intangible assets not subject to amortization are tested annually for impairment at the fiscal year-end, and between annual tests if indicators of potential impairment exist, using a fair-value-based approach. No material impairments of identifiable intangible assets have been identified during any of the periods presented.
Financial Instruments
Financial instruments owned, at fair value and financial instruments sold, not yet purchased, at fair value consist of financial instruments carried at fair value or amounts that approximate fair value, with related unrealized changes in gains or losses recognized in the Company’s results of operations, except for securities classified as available for sale. The fair value of a financial instrument is the amount at which the instrument could be exchanged in a current transaction between willing parties, other than in a forced or liquidation sale.
The Company accounts for its securities pledged on behalf of customers and proprietary securities in accordance with the Investments - Debt and Equity Securities Topic in the ASC. In accordance with this guidance, the Company determines the appropriate classification of its investments as trading, available-for-sale, or held-to-maturity at the time of purchase and reevaluates the designation as of each reporting period.
The Company has classified the U.S. government obligations, mortgage-backed securities and corporate debt securities as available-for-sale, which are carried at fair value based on observable or quoted market prices and associated unrealized gains or losses are recorded as a component of other comprehensive income until realized, unless an unrealized loss is determined to be other than temporary, in which case such loss is charged to earnings. The Company classifies those securities as available-for-sale because it would consider selling them prior to maturity to meet liquidity needs or as part of the Company’s risk management program.
F - 11
INTERNATIONAL ASSETS HOLDING CORPORATION
Notes to Consolidated Financial Statements—(Continued)
The Company computes the cost of its securities on a specific identification basis. Such cost includes the direct costs to acquire securities, adjusted for the amortization of any discount or premium. The amortized cost of securities is computed under the effective interest method and is included in interest income. Realized gains and losses, declines in value judged to be other than temporary and interest on available-for-sale securities are included in earnings.
Investment in managed funds, at fair value represents investments in funds managed by the Company’s fund managers. The investments are valued at period-end at the net asset value provided by the fund’s administrator.
We utilize derivative instruments to manage exposures to foreign currency, commodity price and interest rate risks for the Company and its customers. The Company’s objectives for holding derivatives include reducing, eliminating, and efficiently managing the economic impact of these exposures as effectively as possible. Derivative instruments are recognized as either assets or liabilities and are measured at fair value. The accounting for changes in the fair value of a derivative depends on the intended use of the derivative and the resulting designation. For a derivative instrument designated as a cash-flow hedge, the effective portion of the derivative’s gain or loss is initially reported as a component of OCI and is subsequently recognized in earnings when the hedged exposure affects earnings. The ineffective portion of the gain or loss is recognized in earnings. Gains and losses from changes in fair values of derivatives that are not designated as hedges for accounting purposes are recognized in earnings.
The Company’s derivative contracts consist of exchange-traded and over-the-counter (“OTC”) derivatives. Fair values of exchange-traded derivatives are generally determined from quoted market prices. OTC derivatives are valued using valuation models. The valuation models used to derive the fair values of OTC derivatives require inputs including contractual terms, market prices, yield curves and measurements of volatility. The Company uses similar models to value similar instruments. Where possible, the Company verifies the values produced by pricing models by comparing them to market transactions. Inputs may involve judgment where market prices are not readily available. The Company does not elect hedge accounting under the Derivatives and Hedging Topic of the ASC in accounting for derivatives used as economic hedges in our commodities.
The Company may lease commodities to or from customers or counterparties, or advance commodities to customers on an unpriced basis, receiving payment as and when they become priced. These are valued at fair value and classified under financial instruments as hybrid contracts with embedded derivative features that cannot be reliably measured and separated from the host contract. As permitted by the Derivatives and Hedging Topic of the ASC, the entire instrument is recorded at fair value, with the corresponding change in fair value recognized in revenue within net dealer and investment gains.
Exchange Memberships and Stock
The Company holds exchange membership seats and exchange firm common stock, which are pledged for clearing purposes, providing the Company the right to process trades directly with the various exchanges. Exchange memberships include seats on the Chicago Board of Trade (CBOT), the Board of Trade of Kansas City, Missouri, Inc., the Minnesota Grain Exchange, the New York Mercantile Exchange (NYMEX), the COMEX Division of the New York Mercantile Exchange, Mercado de Valores de Buenos Aires S.A. (MERVAL), the Chicago Mercantile Exchange (CME) Growth and Emerging Markets seat and InterContinental Exchange, Inc. (ICE) Futures. U.S. Exchange stocks include shares of CME Group, Inc. common stock and ICE common stock.
Exchange memberships and stocks pledged for clearing purposes are recorded at cost, in accordance with GAAP and CFTC regulations. The cost basis for FCStone’s exchange memberships and stock was established using fair value on September 30, 2009 as a result of applying purchase accounting to FCStone’s assets. The cost basis for Hanley’s exchange memberships was established using fair value on July 1, 2010, as a result of applying purchase accounting to Hanley’s assets. The cost basis for exchange memberships and stock pledged for clearing purposes was approximately $11.9 million and $7.6 million at September 30, 2010 and 2009, respectively, and is included within the other assets caption on the consolidated balance sheets. The fair market value for exchange memberships and stock pledged for clearing purposes was approximately $9.9 million and $7.6 million at September 30, 2010 and 2009, respectively. The fair value of exchange stock is determined by quoted market prices, and the fair value of exchange memberships is determined by recent sale transactions. At September 30, 2010, all exchange common stock held by the Company was pledged for clearing purposes. The Company monitors the fair value of exchange membership seats and common stock on a quarterly basis, and does not consider the current unrealized loss to be anything other than temporary impairment.
Business Combinations
Acquisitions during fiscal 2010 are accounted for as business combinations in accordance with the provisions of the Business Combinations Topic of the ASC. Under the new accounting guidance the method of accounting for a number of aspects of business combinations was revised, such that more assets and liabilities acquired will be measured at fair value as of the acquisition date. Certain contingent liabilities acquired will require remeasurement at fair value in each subsequent reporting
F - 12
INTERNATIONAL ASSETS HOLDING CORPORATION
Notes to Consolidated Financial Statements—(Continued)
period. Noncontrolling interests will initially be measured at fair value and classified as a separate component of equity. Acquisition related costs, such as fees for attorneys, accountants, and investment bankers, will be expensed as incurred and no longer capitalized as part of the purchase price. For all acquisitions, regardless of the consummation date, deferred tax assets, valuation allowances, and uncertain tax position adjustments occurring after the measurement period will be recorded as a component of income, rather than adjusted through goodwill.
Acquisitions during fiscal 2009 are accounted for as purchase business combinations in accordance with the provisions of Statement of Financial Accounting Standards (“SFAS”) No. 141, Business Combinations. Under the purchase method of accounting, the costs, including transaction costs, are allocated to the underlying net assets acquired, based on their respective estimated fair values. Any excess of the purchase price over the estimated fair values of the net assets acquired is recorded as goodwill which is not amortized to expense. Any excess of the estimated fair values of the net assets acquired over the purchase price results in negative goodwill. Negative goodwill is allocated as a pro rata reduction of the amounts assigned to the assets acquired excluding financial assets, deferred taxes and other current assets. If negative goodwill exceeds the amount of those assets, the remaining excess is recognized as an extraordinary gain in the income statement. Direct out-of-pocket or incremental costs that are directly related to a business combination are included in the cost of the acquired enterprise. Costs included in the cost of the acquired enterprise include finder’s fees or other fees paid to outside consultants for accounting, legal or appraisal services.
Determining the fair value of certain assets and liabilities acquired is subjective in nature and often involves the use of significant estimates and assumptions. Estimating the fair value of the assets and liabilities acquired requires significant judgment.
Revenue Recognition
Sales of physical commodities revenue are recognized when persuasive evidence of an arrangement exists, delivery has occurred, the fee is fixed or determinable, and collectability is probable. The Company reports its physical commodities revenues on a gross basis, with the corresponding cost of sales shown separately, in accordance with the guidelines provided in the Revenue Recognition Topic of the ASC.
Trading gains include brokerage fees and margins generated from OTC derivative trades executed with customers and other counterparties and are recognized when trades are executed. Trading gains, net also includes income from limited forms of proprietary trading. This trading involves taking short-term proprietary positions in derivatives and foreign currencies. These strategies involve relatively short-term exposure to the markets and are usually undertaken in conjunction with the use of derivative contracts, designed to mitigate the risk of customers through hedging strategies. Net dealer inventory and investment gains are recognized on a trade-date basis and include realized gains or losses and changes in unrealized gains or losses on investments at fair value.
Commissions on futures contracts are recognized on a half-turn basis in two equal parts. The first half is recognized when the contract is purchased (opened) and the second half is recognized when the transaction is closed. Commissions on option contracts are recognized upon the purchase or sale of the option, as the Company has no further obligations to provide service. If the Company is required to perform additional services when an option is exercised or closed, a separate commission can be charged and recognized at that date at the discretion of the Company. Commissions and fees are charged at various rates based on the type of account, the products traded, and the method of trade. Clearing and transaction fees are charged to customers on a per exchange contract basis based on the trade date. Such fees are for clearing customers’ exchange trades and include fees charged to the Company by the various futures exchanges.
Consulting and management fees include risk management consulting fees which are billed and recognized as revenue on a monthly basis when risk management services are provided. Such agreements are generally for one year periods, but are cancelable by either party upon providing thirty days written notice to the other party and the amounts are not variable based on customer trading activities. Asset management fees are recognized as they are earned based on estimates of fees due at each period-end date. These include estimated performance fees based on the amount that would be due under the formula for exceeding performance targets as of the period-end date. Estimated performance fees may be at risk due to future performance contingencies until such time as they are fixed.
Interest income, generated primarily from investments and customer inventory financing, is recognized on an accrual basis. Interest from investments is generated from securities purchased using customer funds deposited with the Company to satisfy margin requirements, net of interest returned to customers, and from securities acquired through internally-generated company funds. Interest also includes unrealized gains and losses on securities owned and those deposited with other parties.
Revenue generally is recognized net of any taxes collected from customers and subsequently remitted to governmental authorities.
F - 13
INTERNATIONAL ASSETS HOLDING CORPORATION
Notes to Consolidated Financial Statements—(Continued)
Cost of Revenue
Cost of sales of physical commodities include finished commodity or raw material and processing costs along with operating costs relating to the receipt, storage and delivery of the physical commodities.
Compensation and Benefits
Compensation and benefits consists primarily of salaries, incentive compensation, commissions, related payroll taxes and employee benefits. The Company classifies employees as either traders / risk management consultants, operational or administrative personnel, which includes our executive officers. The most significant component of the Company’s compensation expense is the employment of the traders / risk management consultants, who are paid commissions based on the revenues that their customer portfolios generate. The Company accrues commission expense on a trade date basis.
Share-Based Compensation
The Company accounts for share-based compensation in accordance with the guidance of the Compensation-Stock Compensation Topic of the ASC. The cost of employee services received in exchange for a share-based award is generally measured based on the grant-date fair value of the award. Share-based employee awards that require future service are amortized over the relevant service period. Expected forfeitures are included in determining share-based employee compensation expense. In the first quarter of 2006 the Company adopted the guidance under the Compensation-Stock Compensation Topic of the ASC using the modified prospective method. For option awards granted subsequent to the adoption, compensation cost is recognized on a straight-line basis over the vesting period for the entire award. The expense of unvested option awards granted prior to the adoption are recognized on a straight-line basis, over the balance of the vesting period.
Clearing and Related Expenses
Clearing fees and related expenses include expenses for exchange-traded futures and options clearing and settlement services, including fees the Company pays to the exchanges and the floor pit brokers. These fees are based on transaction volume, and recorded as expense on the trade date. Clearing fees are passed on to our customers and presented gross in the consolidated statements of operations under the Revenue Recognition Topic of the ASC, as the Company acts as a principal for these transactions.
Introducing Broker Commissions
Introducing broker commissions include commissions paid to non-employee third parties that have introduced customers to the Company. Introducing brokers are individuals or organizations that maintain relationships with customers and accept futures and options orders from those customers. We directly provide all account, transaction and margining services to introducing brokers, including accepting money, securities and property from the customers. The commissions are determined monthly.
Income Taxes
Income tax expense includes U.S. federal and state and foreign income taxes. Certain items of income and expense are not reported in tax returns and financial statements in the same year. The tax effect of such temporary differences is reported as deferred income taxes. Tax provisions are computed in accordance with the Income Taxes Topic of the ASC.
Comprehensive Income (Loss)
Comprehensive income (loss) consists of net earnings (loss) and other gains and losses affecting stockholders’ equity that, under U.S. GAAP, are excluded from net income (loss). Other comprehensive income (loss) includes changes in prior service cost and net actuarial losses from pension and postretirement benefit plans, unrealized gains and losses on available-for-sale securities, and changes in the fair value of interest rate swap agreements, to the extent they are effective as cash flow hedges, net of taxes of $1.5 million as of September 30, 2010.
Recent Accounting Pronouncements
In June 2009, the Financial Accounting Standards Board (FASB) established the FASB ASC as the single source of authoritative U.S. GAAP. Subsequent revisions to U.S. GAAP will be incorporated into the ASC through Accounting Standards Updates (ASU). The following are recently issued accounting standards which may have a significant impact on the Company.
In September 2006, new accounting guidance was issued which refined the definition of fair value, established a framework for measuring fair value, and expanded disclosures about fair value measurements. We adopted this guidance for financial
F - 14
INTERNATIONAL ASSETS HOLDING CORPORATION
Notes to Consolidated Financial Statements—(Continued)
assets and liabilities effective October 1, 2008. Effective October 1, 2009, we adopted this guidance for non-financial assets and liabilities recognized or disclosed at fair value on a nonrecurring basis. The nonfinancial assets and liabilities, such as goodwill and long lived assets, are recognized at fair value subsequent to initial recognition when they are deemed to be impaired. Also included in nonfinancial assets and liabilities measured on a nonrecurring basis are those initially measured at fair value in a business combination or other new basis event, but not measured at fair value in subsequent periods. The adoption of this standard did not have a material impact on the Company’s consolidated financial statements.
In December 2007, new accounting guidance was issued revising the method of accounting for a number of aspects of business combinations, such that more assets and liabilities acquired will be measured at fair value as of the acquisition date. Certain contingent liabilities acquired will require remeasurement at fair value in each subsequent reporting period. Noncontrolling interests will initially be measured at fair value and classified as a separate component of equity. Acquisition related costs, such as fees for attorneys, accountants, and investment bankers, will be expensed as incurred and no longer capitalized as part of the purchase price. For all acquisitions, regardless of the consummation date, deferred tax assets, valuation allowances, and uncertain tax position adjustments occurring after the measurement period will be recorded as a component of income, rather than adjusted through goodwill. Effective October 1, 2009, the Company adopted this guidance for business combinations. The acquisition of FCStone during fiscal year 2009 was accounted for under the previous accounting guidance.
On October 1, 2009, the Company adopted recently issued accounting guidance contained within the Consolidations Topic of the ASC, which changed the accounting and reporting for minority interests, which are now characterized as noncontrolling interests and classified as a component of equity. This recently issued guidance requires retroactive adoption of the presentation and disclosure requirements for existing noncontrolling interests. All other requirements under the new guidance have been applied prospectively.
In June 2008, new guidance was issued for determining whether instruments granted in share-based payment transactions are participating securities, mandating that unvested share-based payment awards containing nonforfeitable rights to dividends or dividend equivalents are participating securities and should be included in the computation of basic EPS using the two-class method. The guidance requires retrospective application for all periods presented. The Company has determined that adoption of this guidance effective October 1, 2009 did not have a material effect on the consolidated financial statements if the required disclosures were omitted. Had the required disclosures been made for the year ended September 30, 2010 and 2009, the Company’s basic earnings (loss) per share would have been reduced by less than $.01 per share.
In December 2008, the FASB issued authoritative guidance to require employers to provide additional disclosures about plan assets of a defined benefit pension or other post-retirement plan. These disclosures should principally include information detailing investment policies and strategies, the major categories of plan assets, the inputs and valuation techniques used to measure the fair value of plan assets and an understanding of significant concentrations of risk within plan assets. The required disclosures shall be provided for fiscal years ending after December 15, 2009. Upon initial application, this guidance is not required to be applied to earlier periods that are presented for comparative purposes. The adoption of this guidance did not have a material impact on the Company’s consolidated financial statements.
In June 2009, new guidance was issued on transfers and servicing of financial assets to eliminate the concept of a qualifying special-purpose entity, change the requirements for off balance sheet accounting for financial assets including limiting the circumstances where off balance sheet treatment for a portion of a financial asset is allowable, and require additional disclosures. The guidance is effective for the Company’s 2011 fiscal year. The Company does not expect that the adoption of this guidance will have a material impact on its consolidated financial statements.
In June 2009, new guidance was issued to revise the approach to determine when a variable interest entity (“VIE”) should be consolidated. The new consolidation model for VIEs considers whether the Company has the power to direct the activities that most significantly impact the VIEs economic performance and shares in the significant risks and rewards of the entity. The guidance on VIEs requires companies to continually reassess VIEs to determine if consolidation is appropriate and provide additional disclosures. The guidance is effective for the Company’s 2011 fiscal year. The Company is assessing the potential effect this guidance will have on its consolidated financial statements.
In January 2010, new guidance was issued to require new disclosures and clarify existing disclosure requirements about fair value measurements as set forth in the Fair Value Measurements and Disclosures Topic in the ASC. The guidance requires that a reporting entity should disclose separately the amounts of significant transfers in and out of Level 1 and Level 2 fair value measurements and describe the reasons for the transfers; and in the reconciliation for fair value measurements using significant unobservable inputs, a reporting entity should present separately information about purchases, sales, issuances, and settlements. In addition, the guidance clarifies that for purposes of reporting fair value measurement for each class of assets and liabilities, a reporting entity needs to use judgment in determining the appropriate classes of assets and liabilities; and a
F - 15
INTERNATIONAL ASSETS HOLDING CORPORATION
Notes to Consolidated Financial Statements—(Continued)
reporting entity should provide disclosures about the valuation techniques and inputs used to measure fair value for both recurring and nonrecurring fair value measurements. This guidance is effective for the Company for the year ended September 30, 2010 except for the detailed Level 3 rollforward disclosure, which is effective for fiscal years beginning after December 15, 2010. The adoption of this guidance will not have a material impact on the Company’s disclosures in its consolidated financial statements.
In February 2010, new guidance was issued to no longer require disclosure of the date through which subsequent events have been evaluated in originally issued and revised financial statements as set forth in the Subsequent Events Topic in the ASC. SEC filers that are traded in a public market must evaluate subsequent events through the date the financial statements are issued, rather than the date the financial statements are available to be issued. This guidance is effective for the Company for the year ended September 30, 2010 and the adoption of this guidance did not have a material impact on the Company’s disclosures in its consolidated financial statements.
Note 3 – Earnings (Loss) per Share
Basic earnings per share has been computed by dividing net income by the weighted average number of common shares outstanding. The following is a reconciliation of the numerator and denominator of the diluted net income per share computations for the periods presented below.
| Year Ended September 30, | ||||||||||||
| (in millions, except share amounts) |
2010 | 2009 | 2008 | |||||||||
| Numerator: |
||||||||||||
| Income from continuing operations, net of tax |
$ | 11.8 | $ | 10.2 | $ | 26.5 | ||||||
| Add: Interest on convertible debt, net of tax |
— | 0.9 | 1.4 | |||||||||
| Diluted income from continuing operations |
11.8 | 11.1 | 27.9 | |||||||||
| Less: Loss (gain) from discontinued operations |
(0.6 | ) | 1.1 | (1.3 | ) | |||||||
| Less: Extraordinary loss (gain) |
7.0 | (18.5 | ) | — | ||||||||
| Diluted net income |
$ | 5.4 | $ | 28.5 | $ | 29.2 | ||||||
| Denominator: |
||||||||||||
| Weighted average number of: |
||||||||||||
| Common shares outstanding |
17,306,019 | 8,895,697 | 8,434,976 | |||||||||
| Dilutive potential common shares outstanding: |
||||||||||||
| Share-based awards |
577,214 | 514,680 | 492,663 | |||||||||
| Convertible debt |
— | 772,209 | 974,067 | |||||||||
| Diluted weighted-average shares |
17,883,233 | 10,182,586 | 9,901,706 | |||||||||
The dilutive effect of share-based awards is reflected in diluted net income per share by application of the treasury stock method, which includes consideration of unamortized share-based compensation expense required under the Compensation – Stock Compensation Topic of the ASC. The dilutive effect of convertible debt has been reflected in diluted net income per share by application of the if-converted method. See Note 14 for additional discussion on convertible debt.
For fiscal years 2010, 2009, and 2008, options to purchase 815,066 shares, 825,302 shares, and 121,341 shares of common stock, respectively, were excluded from the calculation of diluted earnings per share because they would have been antidilutive.
F - 16
INTERNATIONAL ASSETS HOLDING CORPORATION
Notes to Consolidated Financial Statements—(Continued)
Note 4 – Segregated Requirements
Pursuant to the requirements of the Commodity Exchange Act, funds deposited by customers of FCStone relating to futures and options on futures positions in regulated commodities must be carried in separate accounts which are designated as segregated customers’ accounts. Certain amounts in the accompanying table reflect reclassifications and eliminations required for regulatory filing and as a result, may differ from those presented in the accompanying consolidated statements of financial position. Funds deposited by customers and other assets, which have been aggregated as belonging to the commodity customers at September 30, 2010 and 2009, are as follows:
| September 30, (in millions) |
2010 | 2009 | ||||||
| Cash, at banks - segregated |
$ | 3.6 | $ | 5.8 | ||||
| Securities - customer segregated |
352.1 | 15.2 | ||||||
| Securities held for customers in lieu of cash, at banks |
0.8 | 2.0 | ||||||
| Deposits with and receivables from: |
||||||||
| Exchange-clearing organizations, including securities, net of omnibus elimnations |
808.8 | 810.3 | ||||||
| Other futures commission merchants |
0.6 | 1.1 | ||||||
| Securities held for customers in lieu of cash |
18.4 | 4.9 | ||||||
| Total customer-segregated funds |
1,184.3 | 839.3 | ||||||
| Amount required to be segregated |
1,162.4 | 799.1 | ||||||
| Excess funds in segregation |
$ | 21.9 | $ | 40.2 | ||||
Funds deposited by customers and other assets, which are held in separate accounts for customers trading foreign futures and foreign options customers, at September 30, 2010 and 2009 are as follows:
| September 30, (in millions) |
2010 | 2009 | ||||||
| Cash - secured |
$ | 3.9 | $ | 3.7 | ||||
| Equities with registered futures commissions merchants |
9.8 | 8.9 | ||||||
| Amounts held by members of foreign boards of trade |
2.2 | 2.7 | ||||||
| Total customer-secured funds |
15.9 | 15.3 | ||||||
| Amount required to be secured |
12.3 | 6.6 | ||||||
| Excess secured funds |
$ | 3.6 | $ | 8.7 | ||||
Note 5 – Receivables from Customers and Notes Receivable, net
Receivable from customers, net includes a provision for bad debts, which reflects our best estimate of probable losses inherent in the receivable from customers and notes receivable. The Company provides for an allowance for doubtful accounts on a specific-identification basis. The allowance for doubtful accounts related to receivables from customers is $5.0 million and $5.7 million at September 30, 2010 and 2009, respectively. The Company continually reviews its provision for bad debts. If circumstances change, and the financial condition of our customers were adversely affected resulting in their inability to meet their financial obligations to us, we may need to record additional allowances.
During the quarter ended June 30, 2010, the Company recorded a charge to bad debt expense of approximately $2.3 million related to a disputed trade that was “given-up” to FCStone by another futures commission merchant (the “FCM”) for a customer that held an account with us. Despite expressly informing the FCM that the Company would not accept the “give-up” trade, the “give-up” trade was submitted through the electronic clearing process and erroneously cleared by FCStone, generating a deficit in the customer’s trading account. The customer lacked the financial capacity to cover the account deficit, and FCStone has filed a complaint and is seeking legal relief through arbitration against the FCM to have the “give-up” transaction rescinded, with an award of appropriate damages.
As a result of the merger with FCStone, the Company acquired notes receivable of $139.9 million at September 30, 2009, including promissory notes from certain customers and an introducing broker which arose from previous customer account deficits. At September 30, 2010 and 2009, notes receivable specifically related to these certain customer account deficits and introducing broker were $125.1 million and $133.7 million, respectively. The Company is uncertain as to the full collectability of the contractual amounts, and no assurances can be given as to the amount and timing of recovery that may be obtained under the promissory notes.
Prior to the Merger, a significant deficit account was introduced to FCStone through an introducing broker relationship, with that broker contractually responsible for fifty percent of account deficits as determined in accordance with the terms of the introducing broker agreement. The Company has an executed promissory note for fifty percent of the energy trading customer account deficit from the introducing broker. The Company estimates the collectability on this note to be $4.4 million at September 30, 2010, and the note is secured by the introducing brokers’ future revenue stream, which comprises commissions collected by the Company, and for which the Company controls disbursement. The Company also has an executed promissory note for the total amount of the energy trading account deficit from the customer. The Company estimates the collectability on this note to be $9.2 million, with proceeds expected from the customer’s refund of income taxes paid in prior years.
F - 17
INTERNATIONAL ASSETS HOLDING CORPORATION
Notes to Consolidated Financial Statements—(Continued)
Activity in the allowance for doubtful accounts and notes for the year ended September 30, 2010 was as follows:
| (in millions) |
||||
| Balance, September 30, 2009 |
$ | 123.4 | ||
| Provision for bad debts |
2.3 | |||
| Deductions: |
||||
| Charge-offs |
(5.8 | ) | ||
| Recoveries |
(0.7 | ) | ||
| Balance, September 30, 2010 |
$ | 119.2 | ||
Additionally, in the normal course of operations the Company accepts notes receivable under sale/repurchase agreements with customers whereby the customers sell certain commodity inventory and agree to repurchase the commodity inventory at a future date at either a fixed or floating rate. These transactions are treated as secured borrowings rather than commodity inventory in the Company’s consolidated financial statements. At September 30, 2010 and 2009, the Company had outstanding notes receivable of $13.6 and $4.0 million, respectively, related to this program.
Sale/repurchase transactions involving fixed rates accrue commodity financing fees on the outstanding notes’ balance on a daily basis using an applicable interest rate stipulated under the agreement. The customers bear the risk of changes in market price while under contract. The Company maintains a futures account to hedge its price risk on these agreements by using futures contracts. The fixed price notes are carried at their principal balance, which approximates fair value.
Accrual of commodity financing income on any note is discontinued when, in the opinion of management, there is reasonable doubt as to the timely collectability of interest or principal. Nonaccrual notes are returned to an accrual status when, in the opinion of management, the financial position of the borrower indicates there is no longer any reasonable doubt as to the timely payment of principal and interest. The Company records a charge against operations for notes receivable losses when management believes that collectability of the principal is unlikely.
Note 6 – Financial Assets and Liabilities Reported at Fair Value
The Fair Value Measurements and Disclosures Topic of the ASC provides guidance for all financial and nonfinancial assets and liabilities that are required to be reported at fair value. The guidance defines fair value, establishes a framework for measuring fair value in accordance with US GAAP, and expands disclosures about fair value measurements. The Company utilizes valuation techniques that maximize the use of observable inputs and minimize the use of unobservable inputs. The Company adopted the new accounting guidance for all non-financial assets and liabilities accounted for at fair value on a non-recurring basis effective October 1, 2009. The Company’s financial assets and liabilities that are reported at fair value, on a recurring basis, are included within the following captions on the consolidated balance sheets:
Cash and cash equivalents
Securities segregated under federal and other regulations
Securities purchased under agreements to resell
Deposits and receivables from exchange-clearing organizations
Deposits and receivables from broker-dealers, clearing organizations and counterparties
Financial instruments owned
Payables to lenders under loans and overdrafts
Financial instruments sold, not yet purchased
The table below sets forth an analysis of the carrying value of financial instruments owned and financial instruments sold, not yet purchased. This is followed by tables that provide the information required by the Fair Value Measurements and Disclosures Topic of the ASC for all financial assets and liabilities that are carried at fair value.
F - 18
INTERNATIONAL ASSETS HOLDING CORPORATION
Notes to Consolidated Financial Statements—(Continued)
| September 30, 2010 | September 30, 2009 | |||||||||||||||
| (in millions) |
Owned | Sold, not yet purchased |
Owned | Sold, not yet purchased |
||||||||||||
| Certificates of deposits |
$ | — | $ | — | $ | 10.0 | $ | — | ||||||||
| Common stock and ADR’s |
17.4 | 8.5 | 7.9 | 2.5 | ||||||||||||
| Exchangeable foreign ordinary equities and ADR’s |
6.6 | 7.5 | 10.5 | 10.5 | ||||||||||||
| Corporate and municipal bonds |
13.1 | — | 20.0 | — | ||||||||||||
| U.S. and foreign government obligations |
8.7 | 0.2 | 6.4 | — | ||||||||||||
| Derivatives |
40.2 | 87.6 | 42.1 | 30.8 | ||||||||||||
| Commodities leases and unpriced positions |
69.2 | 85.8 | 105.4 | 83.7 | ||||||||||||
| Mutual funds and other |
2.1 | — | 4.8 | — | ||||||||||||
| Investment in managed funds |
2.5 | — | 2.7 | — | ||||||||||||
| $ | 159.8 | $ | 189.6 | $ | 209.8 | $ | 127.5 | |||||||||
Fair Value Hierarchy
As required by the Fair Value Measurements and Disclosures Topic of the ASC, financial and nonfinancial assets and liabilities are classified in their entirety based on the lowest level of input that is significant to the fair value measurement. The hierarchy gives the highest priority to unadjusted quoted prices in active markets for identical assets or liabilities (Level 1 measurements) and the lowest priority to unobservable inputs (Level 3 measurements). A market is active if there are sufficient transactions on an ongoing basis to provide current pricing information for the asset or liability, pricing information is released publicly, and price quotations do not vary substantially either over time or among market makers. Observable inputs reflect the assumptions market participants would use in pricing the asset or liability developed based on market data obtained from sources independent of the reporting entity. The guidance requires the Company to consider counterparty credit risk of all parties to outstanding derivative instruments that would be considered by a market participant in the transfer or settlement of such contracts (exit price). The Company’s exposure to credit risk on derivative financial instruments relates to the portfolio of OTC derivative contracts as all exchange-traded contracts held can be settled on an active market with the credit guarantee by the respective exchange. The Company requires each counterparty to deposit margin collateral for all OTC instruments and is also required to deposit margin collateral with counterparties. The Company has assessed the nature of these deposits and used its discretion to adjust each based on the underlying credit considerations for the counterparty and determined that the collateral deposits minimize the exposure to counterparty credit risk in the evaluation of the fair value of OTC instruments as determined by a market participant.
The majority of financial assets and liabilities on the consolidated balance sheets are reported at fair value. Cash and cash equivalents are reported at the balance held at financial institutions. Deposits with and receivables from exchange-clearing organizations and broker-dealers and FCMs and payables to customers and exchange-clearing organizations include the value of cash collateral as well as the value of money market funds and other pledged investments, primarily U.S. Treasury bills and securities issued by government sponsored entities. These balances also include the fair value of futures and options on futures determined by prices on the applicable exchange. Financial instruments owned and sold, not yet purchased include the value of reverse repurchase agreements, U.S. and foreign government obligations, corporate debt securities, derivative financial instruments, commodities, mutual funds and investments in managed funds. The fair value of exchange common stock is determined by quoted market prices, and the fair value of exchange memberships is determined by recent sale transactions. Notes payable and subordinated debt carry variable rates of interest and thus approximate fair value.
The fair value estimates presented herein are based on pertinent information available to management as of September 30, 2010. Although management is not aware of any factors that would significantly affect the estimated fair value amounts, such amounts have not been comprehensively revalued for purposes of these financial statements since that date and current estimates of fair value may differ significantly from the amounts presented herein.
Cash equivalents, securities and derivative financial instruments are carried at fair value, on a recurring basis, and are classified and disclosed into three levels within the fair value hierarchy. The Company did not have any fair value adjustments for assets or liabilities measured at fair value on a non-recurring basis during the years ended September 30, 2010 and 2009, except as disclosed in Note 17. The three levels of the fair value hierarchy under the Fair Value Measurements and Disclosures Topic of the ASC are:
Level 1 – Unadjusted quoted prices in active markets that are accessible at the measurement date for identical, unrestricted assets or liabilities. Level 1 consists of financial assets and liabilities whose fair values are estimated using quoted market prices. Included in Level 1 are money market funds, some corporate bonds, as well as futures and options on futures contracts traded on national exchanges and OTC swaps and options contracts using quoted prices from national exchanges in which the Company executes transactions for customer and proprietary accounts.;
F - 19
INTERNATIONAL ASSETS HOLDING CORPORATION
Notes to Consolidated Financial Statements—(Continued)
Level 2 – Quoted prices for identical or similar assets or liabilities in markets that are less active, that is, markets in which there are few transactions for the asset or liability that are observable for substantially the full term. Included in Level 2 are those financial assets and liabilities for which fair values are estimated using models or other valuation methodologies. These models are primarily industry-standard models that consider various observable inputs, including time value, yield curve, volatility factors, observable current market and contractual prices for the underlying financial instruments, as well as other relevant economic measures. Financial assets and liabilities in this category include U.S. government securities and federal agency obligations and OTC forwards, swaps, and options; and
Level 3 – Prices or valuation techniques that require inputs that are both significant to the fair value measurement and unobservable (i.e., supported by little or no market activity). Level 3 comprises financial assets and liabilities whose fair value is estimated based on internally developed models or methodologies utilizing significant inputs that are not readily observable from objective sources.
The following tables set forth the Company’s financial and nonfinancial assets and liabilities that were accounted for at fair value as of September 30, 2010 and 2009 by level within the fair value hierarchy:
| September 30, 2010 | ||||||||||||||||||||
| (in millions) |
Level 1 | Level 2 | Level 3 | Netting and Collateral (1) |
Total | |||||||||||||||
| Assets: |
||||||||||||||||||||
| Unrestricted cash equivalents - money market funds |
$ | 0.3 | $ | — | $ | — | $ | — | $ | 0.3 | ||||||||||
| U.S. and foreign government obligations |
— | 0.8 | — | — | 0.8 | |||||||||||||||
| Securities segregated under federal and other regulations |
— | 0.8 | — | — | 0.8 | |||||||||||||||
| Securities purchased under agreements to resell |
342.0 | — | — | — | 342.0 | |||||||||||||||
| Money market funds |
428.2 | — | — | — | 428.2 | |||||||||||||||
| U.S. and foreign government obligations |
— | 988.1 | — | — | 988.1 | |||||||||||||||
| Mortgage-backed securities |
— | 10.0 | — | — | 10.0 | |||||||||||||||
| Derivatives |
4,228.1 | — | — | (4,748.0 | ) | (519.9 | ) | |||||||||||||
| Deposits and receivables from exchange-clearing organizations |
4,656.3 | 998.1 | — | (4,748.0 | ) | 906.4 | ||||||||||||||
| Common stock and ADR’s |
22.1 | 0.7 | 1.2 | — | 24.0 | |||||||||||||||
| Corporate and municipal bonds |
— | 5.1 | 8.0 | — | 13.1 | |||||||||||||||
| U.S. and foreign government obligations |
2.8 | 5.9 | — | — | 8.7 | |||||||||||||||
| Derivatives (2) |
186.0 | 897.9 | — | (1,043.7 | ) | 40.2 | ||||||||||||||
| Commodities leases and unpriced positions |
— | 201.9 | — | (132.7 | ) | 69.2 | ||||||||||||||
| Mutual funds and other |
1.7 | — | 0.4 | — | 2.1 | |||||||||||||||
| Investment in managed funds |
— | 1.9 | 0.6 | — | 2.5 | |||||||||||||||
| Financial instruments owned |
212.6 | 1,113.4 | 10.2 | (1,176.4 | ) | 159.8 | ||||||||||||||
| Total assets at fair value |
$ | 5,211.2 | $ | 2,112.3 | $ | 10.2 | $ | (5,924.4 | ) | $ | 1,409.3 | |||||||||
| Liabilities: |
||||||||||||||||||||
| Payables to customers - derivatives |
$ | 5,451.0 | $ | — | $ | — | $ | (5,451.0 | ) | $ | — | |||||||||
| Common stock and ADR’s |
15.5 | 0.5 | — | — | 16.0 | |||||||||||||||
| U.S. and foreign government obligations |
— | 0.2 | — | — | 0.2 | |||||||||||||||
| Derivatives (2) |
189.3 | 859.5 | — | (961.2 | ) | 87.6 | ||||||||||||||
| Commodities leases and unpriced positions |
— | 127.2 | — | (41.4 | ) | 85.8 | ||||||||||||||
| Financial instruments sold, not yet purchased |
204.8 | 987.4 | — | (1,002.6 | ) | 189.6 | ||||||||||||||
| Total liabilities at fair value |
$ | 5,655.8 | $ | 987.4 | $ | — | $ | (6,453.6 | ) | $ | 189.6 | |||||||||
| (1) | Represents cash collateral and the impact of netting across the levels of the fair value hierarchy. Netting among positions classified within the same level are included in that level. |
| (2) | The derivatives include net unrealized gains (losses) that are reclassified to deposits and receivables from broker-dealers, clearing organizations and counterparties and receivables from customers of $56.1 million as of September 30, 2010, as a result of netting and collateral. |
F - 20
INTERNATIONAL ASSETS HOLDING CORPORATION
Notes to Consolidated Financial Statements—(Continued)
| September 30, 2009 | ||||||||||||||||||||
| (in millions) |
Level 1 | Level 2 | Level 3 | Netting and Collateral (1) |
Total | |||||||||||||||
| Assets: |
||||||||||||||||||||
| Unrestricted cash equivalents - money market funds |
$ | 15.6 | $ | — | $ | — | $ | — | $ | 15.6 | ||||||||||
| U.S. and foreign government obligations |
— | 2.0 | — | — | 2.0 | |||||||||||||||
| Securities segregated under federal and other regulations (2) |
— | 2.0 | — | — | 2.0 | |||||||||||||||
| Money market funds |
710.1 | — | — | — | 710.1 | |||||||||||||||
| U.S. and foreign government obligations |
— | 320.2 | — | — | 320.2 | |||||||||||||||
| Derivatives |
4,043.9 | — | — | (4,346.3 | ) | (302.4 | ) | |||||||||||||
| Deposits and receivables from exchange-clearing |
4,754.0 | 320.2 | — | (4,346.3 | ) | 727.9 | ||||||||||||||
| Certificates of deposits |
— | 10.0 | — | — | 10.0 | |||||||||||||||
| Common stock and ADR’s |
15.9 | 1.3 | 1.2 | — | 18.4 | |||||||||||||||
| Corporate and municipal bonds |
14.5 | 1.2 | 4.3 | — | 20.0 | |||||||||||||||
| U.S. and foreign government obligations |
0.5 | 5.2 | 0.7 | — | 6.4 | |||||||||||||||
| Derivatives (4) |
108.8 | 733.8 | — | (800.5 | ) | 42.1 | ||||||||||||||
| Commodities leases and unpriced positions |
— | 137.3 | — | (31.9 | ) | 105.4 | ||||||||||||||
| Mutual funds and other |
1.4 | 3.0 | 0.4 | — | 4.8 | |||||||||||||||
| Investment in managed funds |
— | — | 2.7 | — | 2.7 | |||||||||||||||
| Financial instruments owned |
141.1 | 891.8 | 9.3 | (832.4 | ) | 209.8 | ||||||||||||||
| Total assets at fair value |
$ | 4,910.7 | $ | 1,214.0 | $ | 9.3 | $ | (5,178.7 | ) | $ | 955.3 | |||||||||
| Liabilities: |
||||||||||||||||||||
| Payable to customers - derivatives |
$ | 4,012.5 | $ | — | $ | — | $ | (4,012.5 | ) | $ | — | |||||||||
| Common stock and ADR’s |
11.2 | 1.8 | — | — | 13.0 | |||||||||||||||
| Derivatives (4) |
115.0 | 683.3 | — | (767.5 | ) | 30.8 | ||||||||||||||
| Commodities leases and unpriced positions |
— | 109.7 | — | (26.0 | ) | 83.7 | ||||||||||||||
| Financial instruments sold, not yet purchased |
126.2 | 794.8 | — | (793.5 | ) | 127.5 | ||||||||||||||
| Total liabilities at fair value |
$ | 4,138.7 | $ | 794.8 | $ | — | $ | (4,806.0 | ) | $ | 127.5 | |||||||||
| (1) | Represents cash collateral and the impact of netting across the levels of the fair value hierarchy. Netting among positions classified within the same level are included in that level. |
| (2) | Excludes $12.9 million within cash and securities segregated under federal and other regulations which are accounted for at other than fair value. |
| (3) | Excludes $171.1 million within deposits and receivables from exchange clearing organizations which are accounted for at other than fair value. |
| (4) | The gross derivative assets and liabilities include net unrealized gains that are reclassified to deposits and receivables from broker-dealers, clearing organizations and counterparties of $20.4 million as of September 30, 2009, as a result of netting and collateral. |
The Company reports transfers in and out of Levels 1, 2 and 3, as applicable, using the fair value of the securities as of the beginning of the reporting period in which the transfer occurred. The Company did not have any transfers between Level 1 and Level 2 fair value measurements for the fiscal year ended September 30, 2010. The Company transferred $0.7 million of U.S. and foreign obligations from Level 3 to Level 2 during the fiscal year ended September 30, 2010. During the current year, the Company re-evaluated the observability of the inputs for the fair value of the securities that were transferred into Level 2 from Level 3 and determined that there was improvement in the market for these securities and that resulted in the Company being able to utilize inputs that were observable and as such, they have moved the classification of the securities at September 30, 2010.
Realized and unrealized gains and losses are included within ‘Trading gains’ in the income statement.
F - 21
INTERNATIONAL ASSETS HOLDING CORPORATION
Notes to Consolidated Financial Statements—(Continued)
Information on Level 3 Financial Assets and Liabilities
The Company’s financial assets at fair value classified within Level 3 of the fair value hierarchy are summarized below:
| (in millions) |
As of September 30, 2010 |
As of September 30, 2009 |
||||||
| Total Level 3 assets |
$ | 10.2 | $ | 9.3 | ||||
| Level 3 assets for which the Company bears economic exposure |
$ | 10.2 | $ | 9.3 | ||||
| Total assets |
$ | 2,021.7 | $ | 1,555.7 | ||||
| Total financial assets at fair value |
$ | 1,409.3 | $ | 955.3 | ||||
| Total Level 3 assets as a percentage of total assets |
0.5 | % | 0.6 | % | ||||
| Level 3 assets for which the the Company bears economic exposure as a percentage of total assets |
0.5 | % | 0.6 | % | ||||
| Total level 3 assets as a percentage of total financial assets at fair value |
0.7 | % | 1.0 | % | ||||
The following table sets forth a summary of changes in the fair value of the Company’s Level 3 financial assets and liabilities during the years ended September 30, 2010 and 2009, including a summary of unrealized gains (losses) during the 2010 and 2009 years on the Company’s Level 3 financial assets and liabilities still held at September 30, 2010.
| Level 3 Financial Assets and Financial Liabilities For the Year Ended September 30, 2010 |
||||||||||||||||||||||||
| (in millions) |
Balances at beginning of period |
Realized gains (losses) during period |
Unrealized gains (losses) during period |
Purchases, issuances, settlements |
Transfers in or (out) of Level 3 |
Balances at end of period |
||||||||||||||||||
| Assets: |
||||||||||||||||||||||||
| Common stock and ADR’s |
$ | 1.2 | $ | — | $ | — | $ | — | $ | — | $ | 1.2 | ||||||||||||
| Corporate and municipal bonds |
4.3 | — | 0.5 | 3.2 | — | 8.0 | ||||||||||||||||||
| U.S. and foreign government obligations |
0.7 | — | — | — | (0.7 | ) | — | |||||||||||||||||
| Mutual funds and other |
0.4 | — | — | — | — | 0.4 | ||||||||||||||||||
| Investment in managed funds |
2.7 | — | (0.3 | ) | (1.8 | ) | — | 0.6 | ||||||||||||||||
| $ | 9.3 | $ | — | $ | 0.2 | $ | 1.4 | $ | (0.7 | ) | $ | 10.2 | ||||||||||||
| Level 3 Financial Assets and Financial Liabilities For the Year Ended September 30, 2009 |
||||||||||||||||||||||||
| (In millions) |
Balances at prior reporting date |
Realized gains (losses) during period |
Unrealized gains (losses) at reporting date |
Purchases, issuances, settlements |
Transfers in or (out) of Level 3 |
Balances at current reporting date |
||||||||||||||||||
| Assets: |
||||||||||||||||||||||||
| Common stock and ADR’s |
$ | 2.9 | $ | (0.2 | ) | $ | (0.4 | ) | $ | (1.1 | ) | $ | — | $ | 1.2 | |||||||||
| Corporate and municipal bonds |
3.6 | — | 0.1 | 0.6 | — | 4.3 | ||||||||||||||||||
| U.S. and foreign government obligations |
— | — | (0.7 | ) | — | 1.4 | 0.7 | |||||||||||||||||
| Mutual funds and other |
— | — | — | — | 0.4 | 0.4 | ||||||||||||||||||
| Investment in managed funds |
11.9 | 1.0 | (0.7 | ) | (9.5 | ) | — | 2.7 | ||||||||||||||||
| $ | 18.4 | $ | 0.8 | $ | (1.7 | ) | $ | (10.0 | ) | $ | 1.8 | $ | 9.3 | |||||||||||
As a result of its acquisition of FCStone, the Company acquired securities classified as available-for-sale at September 30, 2009. In accordance with the Business Combinations Topic of the ASC, available-for-sale securities are valued at fair value as of the acquisition date. As a result, the investment securities classified as available-for-sale did not have any unrealized gains or losses as of September 30, 2009.
F - 22
INTERNATIONAL ASSETS HOLDING CORPORATION
Notes to Consolidated Financial Statements—(Continued)
The following tables summarize the amortized cost basis, the aggregate fair value and gross unrealized holding gains and losses of the Company’s investment securities classified as available-for-sale at September 30, 2010:
Amounts included in financial instruments owned:
| Amortized | Unrealized Holding (1) | Estimated | ||||||||||||||
| (in millions) |
Cost | Gains | (Losses) | Fair Value | ||||||||||||
| U.S. government securities and federal agency obligations |
$ | 5.0 | $ | — | $ | — | $ | 5.0 | ||||||||
| Corporate bonds |
5.1 | — | — | 5.1 | ||||||||||||
| $ | 10.1 | $ | — | $ | — | $ | 10.1 | |||||||||
| (1) | Unrealized gains/losses on financial instruments as of September 30, 2010, is less than $10 thousand. |
Amounts included in deposits with and receivables from exchange-clearing organizations:
| Amortized | Unrealized Holding | Estimated | ||||||||||||||
| (in millions) |
Cost | Gains | (Losses) | Fair Value | ||||||||||||
| U.S. government securities and federal agency obligations |
$ | 936.0 | $ | 0.4 | $ | — | $ | 936.4 | ||||||||
| Mortgage-backed securities |
10.1 | — | (0.1 | ) | 10.0 | |||||||||||
| $ | 946.1 | $ | 0.4 | $ | (0.1 | ) | $ | 946.4 | ||||||||
At September 30, 2010, investments in debt securities classified as available-for-sale mature as follows:
| Due in | Estimated | |||||||||||
| (in millions) |
Less than 1 year | 1 year or more | Fair Value | |||||||||
| U.S. government securities and federal agency obligations |
$ | 876.0 | $ | 65.4 | $ | 941.4 | ||||||
| Corporate bonds |
— | 5.1 | 5.1 | |||||||||
| Mortgage-backed securities |
— | 10.0 | 10.0 | |||||||||
| $ | 876.0 | $ | 80.5 | $ | 956.5 | |||||||
There were no sales of AFS securities during the year and as a result, no realized gains or losses were recorded for the year ended September 30, 2010.
For the purposes of the maturity schedule, mortgage-backed securities, which are not due at a single maturity date, have been allocated over maturity groupings using the contractual maturity of the underlying collateral as a basis. Mortgage-backed securities may mature earlier than their stated contractual maturities because of accelerated principal repayments of the underlying loans.
Note 7 – Financial Instruments with Off-Balance Sheet Risk and Concentrations of Credit Risk
The Company accounts for derivative instruments in accordance with the provisions of the Derivatives and Hedging Topic of the ASC. The Company recognizes derivative instruments as either assets or liabilities and measures those instruments at fair value. The accounting for changes in the fair value of a derivative depends on the intended use of the derivative and the resulting designation. The Company has derivatives that are designated as cash flow hedges and derivatives that are not designated for hedging purposes. For a derivative instrument designated as a cash flow hedge, the effective portion of the derivative’s gain or loss is initially reported as a component of accumulated other comprehensive income and subsequently reclassified into earnings when the hedged exposure affects earnings. The ineffective portion of the gain (loss) is reported immediately in earnings. For a derivative instrument that is not designated as a hedge, the changes in fair value are reported immediately in earnings.
The Company is party to certain financial instruments with off-balance sheet risk in the normal course of its business. The Company has sold financial instruments that it does not currently own and will therefore be obliged to purchase such financial instruments at a future date. The Company has recorded these obligations in the consolidated financial statements at September 30, 2010 at the fair values of the related financial instruments. The Company will incur losses if the fair value of the underlying financial instruments increases subsequent to September 30, 2010. The total of $189.6 million and $127.5 million at September 30, 2010 and 2009, respectively, includes $87.6 million and $30.8 million for derivative contracts, which represent a liability to the Company based on their fair values as of September 30, 2010 and 2009, respectively.
F - 23
Derivatives
The Company utilizes derivative products in its trading capacity as a dealer in order to satisfy client needs and mitigate risk. The Company manages risks from both derivatives and non-derivative cash instruments on a consolidated basis. The risks of derivatives should not be viewed in isolation, but in aggregate with the Company’s other trading activities. The Company’s derivative positions are included within the balance sheets under the caption ‘financial instruments owned, at fair value’, ‘deposits and receivables from exchange-clearing organizations’ and ‘financial instruments sold, not yet purchased, at fair value’.
In April 2010, the Company implemented an interest rate risk management strategy using derivative financial instruments in the form of interest rate swaps to manage a portion of our aggregate interest rate position. The Company’s objective is to invest the majority of customer segregated deposits in high quality, short-term investments and swap the resulting variable interest earnings into the medium-term interest stream, by using a strip of interest rate swaps that mature every quarter, and enable us to achieve the two year moving average of the two year swap rate. These interest rate swaps, which are recorded at fair value, are not designated for hedge accounting treatment, and changes in the marked-to-market valuations of the financial instruments will be recorded in earnings on a quarterly basis.
Listed below are the fair values of derivatives as of September 30, 2010 and 2009. Assets represent net unrealized gains and liabilities represent net unrealized losses.
| (In millions) |
September 30, 2010 | September 30, 2009 | ||||||||||||||
| Assets (1) | Liabilities (1) | Assets (1) | Liabilities (1) | |||||||||||||
| Derivative contracts not accounted for as hedges: |
||||||||||||||||
| Exchange-traded commodity derivatives |
$ | 4,126.2 | $ | 5,332.6 | $ | 4,008.0 | $ | 3,974.6 | ||||||||
| OTC commodity derivatives |
563.3 | 562.9 | 303.5 | 302.9 | ||||||||||||
| Exchange-traded foreign exchange derivatives |
84.6 | 98.7 | 25.8 | 44.2 | ||||||||||||
| OTC Foreign exchange derivatives (2) |
512.6 | 478.3 | 526.3 | 474.2 | ||||||||||||
| Interest rate derivatives |
22.5 | 18.6 | 11.3 | 6.8 | ||||||||||||
| Equity index derivatives |
2.8 | 7.6 | 11.6 | 3.4 | ||||||||||||
| Derivative contracts accounted for as hedges: |
||||||||||||||||
| Interest rate derivatives |
— | 1.1 | — | 4.7 | ||||||||||||
| Gross fair value of derivative contracts |
5,312.0 | 6,499.8 | 4,886.5 | 4,810.8 | ||||||||||||
| Impact of netting and collateral |
(5,791.7 | ) | (6,412.2 | ) | (5,146.8 | ) | (4,780.0 | ) | ||||||||
| Total fair value included in ‘Deposits and receivables from exhange-clearing organizations’ |
$ | (519.9 | ) | $ | (302.4 | ) | ||||||||||
| Total fair value included in ‘Deposits and receivables from broker-dealers, clearing organizations and counterparties’ |
$ | — | $ | — | ||||||||||||
| Total fair value included in ‘Financial instruments owned, at fair value’ |
$ | 40.2 | $ | 42.1 | ||||||||||||
| Fair value included in ‘Financial instruments sold, not yet purchased, at fair value’ |
$ | 87.6 | $ | 30.8 | ||||||||||||
| (1) | As of September 30, 2010 and 2009, the Company’s derivative contract volume for open positions was approximately 3.5 million and 3.1 million contracts, respectively. |
| (2) | In accordance with agreements with counterparties, the Company is allowed to periodically take advances against its open trade fair value. Amount excludes advances against open trade fair value of $27.0 and $31.9 million outstanding at September 30, 2010 and 2009, respectively. |
The Company’s derivative contracts are principally held in its Commodity and Risk Management Services segment. The Company assists its commodities and relationship management customers in protecting the value of their future production by entering into option or forward agreements with them on an OTC basis. The Company also provides its commodities and relationship management customers with sophisticated option products, including combinations of buying and selling puts and calls. The Company mitigates its risk by effecting offsetting trades with market counterparties. The risk mitigation of these offsetting trades is not within the documented hedging designation requirements of the Derivatives and Hedging Topic of the ASC. These derivative contracts are traded along with cash transactions because of the integrated nature of the markets for these products. The Company manages the risks associated with derivatives on an aggregate basis along with the risks associated with its proprietary trading and market-making activities in cash instruments as part of its firm-wide risk management policies. In particular, the risks related to derivative positions may be partially offset by inventory, unrealized gains in inventory or cash collateral paid or received.
F - 24
INTERNATIONAL ASSETS HOLDING CORPORATION
Notes to Consolidated Financial Statements—(Continued)
The following table sets forth by major risk type the firm’s gains/(losses) related to derivative financial instruments for the years ended September 30, 2010 and 2009, in accordance with the Derivatives and Hedging Topic of the ASC. The gains/(losses) set forth below are included in ‘Trading gains’ in the consolidated income statements.
| (In millions) |
Year Ended September 30, 2010 |
Year Ended September 30, 2009 |
||||||
| Gains (losses) from derivative contracts |
$ | (3.3 | ) | $ | (26.1 | ) | ||
| Total |
$ | (3.3 | ) | $ | (26.1 | ) | ||
Periodically, the Company uses interest rate swap contracts to hedge certain forecasted transactions. The Company’s primary objective in holding these types of derivatives is to reduce the volatility of earnings and cash flows associated with changes in interest rates. The Company has two interest rate swap contracts at September 30, 2010, each with a notional amount of $50 million, which were entered into in order to hedge potential changes in cash flows resulting from the Company’s variable rate LIBOR based borrowings. The interest rate swaps are classified under the Derivatives and Hedging Topic of the ASC as cash flow hedges. These derivatives will mature in less than one year.
As a result of a decrease in borrowings by the Company in 2010, it was determined that one of the interest rate swaps no longer met the criteria, specified under the Derivatives and Hedging Topic, to allow for the deferral of the effective portion of unrecognized hedging gains or losses in other comprehensive income or loss since all of the forecasted variable interest payments are not expected to occur. However, the Company expects that a portion of those forecasted transactions are still going to occur. The Company discontinued hedge accounting for that swap during the fiscal year ended September 30, 2010, which resulted in the immediate reclassification into earnings during the fiscal year of a portion of the unrecognized loss remaining in accumulated other comprehensive income or loss and the deferred loss relating to those forecasted transactions that are no longer expected to occur. The amount the Company reclassified as a result of the discontinuation of hedge accounting was a loss of $0.4 million from accumulated other comprehensive income or loss into ‘Trading gains’ on the consolidated income statement for the fiscal year ended September 30, 2010. The amount remaining in accumulated other comprehensive income or loss relating to transactions that are still expected to occur for the discontinued hedge is a loss of $0.5 million as of September 30, 2010.
The effective portion of the swaps’ gain or loss, including gains associated with the discontinued hedge prior to it being de-designated during fiscal year 2010, was a gain of $1.3 million and a loss of $2.4 million for the fiscal year ended September 30, 2010 and 2009, respectively, which has been reported in the balance sheets as a component of accumulated other comprehensive income (loss). The remaining unrecognized loss, net of tax, relating to both interest rate swaps of $1.0 million and $2.1 million included in accumulated other comprehensive income (loss) at September 30, 2010 and 2009, respectively will be recognized as the forecasted payments affect interest expense. The ineffective portion of the swap gain or loss was a gain of $0.2 million and a loss of $1.8 for the fiscal year ended September 30, 2010 and 2009, respectively, and is included in ‘Trading gains’ on the consolidated income statements.
Credit Risk
In the normal course of business, the Company purchases and sells financial instruments, commodities and foreign currencies as either principal or agent on behalf of its customers. If either the customer or counterparty fails to perform, the Company may be required to discharge the obligations of the nonperforming party. In such circumstances, the Company may sustain a loss if the fair value of the financial instrument or foreign currency is different from the contract value of the transaction.
The majority of the Company’s transactions and, consequently, the concentration of its credit exposure is with commodity exchanges, customers, broker-dealers and other financial institutions. These activities primarily involve collateralized and uncollateralized arrangements and may result in credit exposure in the event that a customer or counterparty fails to meet its contractual obligations. The Company’s exposure to credit risk can be directly impacted by volatile financial markets, which may impair the ability of customers or counterparties to satisfy their contractual obligations. The Company seeks to control its credit risk through a variety of reporting and control procedures, including establishing credit limits based upon a review of the counterparties’ financial condition and credit ratings. The Company monitors collateral levels on a daily basis for compliance with regulatory and internal guidelines and requests changes in collateral levels as appropriate.
The Company is a party to financial instruments in the normal course of its business through customer and proprietary trading accounts in exchange-traded and OTC derivative instruments. These instruments are primarily the execution of orders for
F - 25
INTERNATIONAL ASSETS HOLDING CORPORATION
Notes to Consolidated Financial Statements—(Continued)
commodity futures, options on futures and forward foreign currency contracts on behalf of its customers, substantially all of which are transacted on a margin basis. Such transactions may expose the Company to significant credit risk in the event margin requirements are not sufficient to fully cover losses which customers may incur. The Company controls the risks associated with these transactions by requiring customers to maintain margin deposits in compliance with individual exchange regulations and internal guidelines. The Company monitors required margin levels daily and, therefore, may require customers to deposit additional collateral or reduce positions when necessary. The Company also establishes credit limits for customers, which are monitored daily. The Company evaluates each customer’s creditworthiness on a case by case basis. Clearing, financing, and settlement activities may require the Company to maintain funds with or pledge securities as collateral with other financial institutions. Generally, these exposures to both customers and exchanges are subject to netting, or customer agreements, which reduce the exposure to the Company by permitting receivables and payables with such customers to be offset in the event of a customer default. Management believes that the margin deposits held at September 30, 2010 and 2009 were adequate to minimize the risk of material loss that could be created by positions held at that time. The Company periodically purchases credit insurance and credit-default swaps that provides some coverage against counterparty risk. The Company records the insurance premiums as a prepaid asset and amortizes that over the term of the policy or contract. The Company records credit-default swaps at fair value, as a financial instrument owned. Additionally, the Company monitors collateral fair value on a daily basis and adjusts collateral levels in the event of excess market exposure. Generally, these exposures to both customers and counterparties are subject to netting, or customer agreements which reduces the exposure to the Company.
The Company is also a party to a guarantee of payment and performance by a third party of an ethanol marketing agreement with a risk management customer which would require the Company to purchase the output of the customer if the third party could not perform under the marketing agreement. The guarantee does not have a set term, and the underlying agreement cannot be terminated by the third party unless the customer breaches the agreement. The maximum potential amount of future payments required under the guarantee cannot be estimated because the underlying marketing agreement does not specify the amount or the price of the ethanol to be purchased during the term of the agreement. The price of the ethanol to be purchased is at the discretion of the Company.
Derivative financial instruments involve varying degrees of off-balance sheet market risk whereby changes in the fair values of underlying financial instruments may result in changes in the fair value of the financial instruments in excess of the amounts reflected in the consolidated balance sheets. Exposure to market risk is influenced by a number of factors, including the relationships between the financial instruments and the Company’s positions, as well as the volatility and liquidity in the markets in which the financial instruments are traded. The principal risk components of financial instruments include, among other things, interest rate volatility, the duration of the underlying instruments and changes in foreign exchange rates. The Company attempts to manage its exposure to market risk through various techniques. Aggregate market limits have been established and market risk measures are routinely monitored against these limits.
Note 8 – Physical Commodities Inventory
Physical commodities inventory is valued at the lower of cost or fair value, determined using the weighted-average cost method. Commodities in process include commodities in the process of being recycled. At September 30, 2010 and 2009, $124.8 and $105.3 million, respectively, of physical commodities inventory served as collateral under one of the Company’s credit facilities, as detailed further in Note 13. The carrying values of the Company’s inventory at September 30, 2010 and 2009 are as follows:
| (in millions) |
September 30, 2010 |
September 30, 2009 |
||||||
| Commodities in process |
$ | 3.6 | $ | 8.7 | ||||
| Finished commodities |
121.4 | 98.2 | ||||||
| $ | 125.0 | $ | 106.9 | |||||
F - 26
INTERNATIONAL ASSETS HOLDING CORPORATION
Notes to Consolidated Financial Statements—(Continued)
Note 9 – Property and Equipment, net
Property and equipment are stated at cost, and reported net of accumulated depreciation on the balance sheets. Depreciation on plant and equipment is calculated on the straight-line method over the estimated useful lives of the assets. The estimated useful lives of property and equipment range from 3 to 10 years. During fiscal years 2010, 2009, and 2008, depreciation expense was $1.0 million, $0.7 million and $0.6 million, respectively. A summary of property and equipment, at cost less accumulated depreciation at September 30, 2010 and 2009 is as follows:
| (In millions) |
September 30, 2010 |
September 30, 2009 |
||||||
| Property and equipment |
||||||||
| Furniture, fixtures and equipment |
$ | 6.4 | $ | 6.2 | ||||
| Building |
0.6 | 0.6 | ||||||
| Leasehold improvements |
3.2 | 1.0 | ||||||
| Total property and equipment |
10.2 | 7.8 | ||||||
| Less: Accumulated depreciation and amortization |
(2.9 | ) | (3.1 | ) | ||||
| Property and equipment, net |
$ | 7.3 | $ | 4.7 | ||||
Note 10 – Goodwill
The Company acquired the Gainvest group of companies (“INTL Gainvest”), specialists in local markets securitization and asset management in Argentina, Brazil and Uruguay, in May 2007. Pursuant to the terms of this acquisition, the Company made a final payment in June of 2009 of $1.4 million which was recorded as goodwill during the quarter ended June 30, 2009.
The Company acquired the 50% interest held by Nilesh Ved in INTL Commodities DMCC, the Company’s Dubai commodities joint venture, in February of 2009. The completion of the purchase accounting for this transaction resulted in goodwill of $2.3 million being recorded during the quarter ended March 31, 2009.
On April 7, 2009, the Company acquired Compania Inversora Bursatil S.A. Sociedad de Bolsa (“CIBSA”, now renamed INTL CIBSA Sociedad de Bolsa S.A.), a leading securities broker-dealer based in Argentina. The Company paid approximately $1.7 million on the date of purchase and is obligated to make additional payments over the next two years, depending on the level of revenues achieved. The Company recorded goodwill of $0.7 million during the quarter ended June 30, 2009 as a result of completing its purchase accounting for this transaction. Under the purchase agreement, the Company is obligated to pay an amount equal to 25% of the net revenues if such revenues are in excess of $2.5 million and up to $3 million, 35% of the net revenues in excess of $3 million up to $4 million, and 40% of the net revenues in excess of $4 million for each of the two twelve-month periods ending March 31, 2010 and 2011 to the sellers as additional consideration. For the twelve-month period ended March 31, 2010, the specific net revenue target was reached and additional consideration of $0.8 million was distributed in May of 2010. Any amounts paid as additional consideration under this agreement are recorded as goodwill.
During the fiscal year ended September 30, 2010, the company recognized $21.6 million in additional goodwill related to current year acquisitions. See discussion in Note 17 related to the additional goodwill recorded in fiscal year 2010 associated with these current year acquisitions.
Goodwill allocated to the Company’s operating segments is as follows:
| (In millions) |
September 30, 2010 |
September 30, 2009 |
||||||
| Commodity and Risk Management Services |
$ | 28.7 | $ | 2.4 | ||||
| Foreign Exchange |
6.3 | 6.3 | ||||||
| Securities and Other |
5.3 | 4.6 | ||||||
| Goodwill |
$ | 40.3 | $ | 13.3 | ||||
F - 27
INTERNATIONAL ASSETS HOLDING CORPORATION
Notes to Consolidated Financial Statements—(Continued)
Note 11 – Intangible Assets
| September 30, 2010 | September 30, 2009 | |||||||||||||||||||||||
| Gross Amount |
Accumulated Amortization |
Net Amount | Gross Amount |
Accumulated Amortization |
Net Amount | |||||||||||||||||||
| Intangible assets subject to amortization |
||||||||||||||||||||||||
| Noncompete agreement |
$ | 3.3 | $ | (0.5 | ) | $ | 2.8 | $ | 0.4 | $ | (0.3 | ) | $ | 0.1 | ||||||||||
| Trade name |
0.8 | (0.4 | ) | 0.4 | 0.6 | (0.3 | ) | 0.3 | ||||||||||||||||
| Software programs/platforms |
2.1 | (0.2 | ) | 1.9 | — | — | — | |||||||||||||||||
| Customer base |
7.4 | (0.4 | ) | 7.0 | 0.2 | (0.2 | ) | — | ||||||||||||||||
| 13.6 | (1.5 | ) | 12.1 | 1.2 | (0.8 | ) | 0.4 | |||||||||||||||||
| Intangible assets not subject to amortization |
||||||||||||||||||||||||
| Trade name |
1.0 | — | 1.0 | — | — | — | ||||||||||||||||||
| Total intangible assets |
$ | 14.6 | $ | (1.5 | ) | $ | 13.1 | $ | 1.2 | $ | (0.8 | ) | $ | 0.4 | ||||||||||
Amortization expense amounted to $0.7 million, $0.2 million and $0.3 million for the years ended September 30, 2010, 2009 and 2008, respectively. Estimated future amortization expense based on existing intangible assets for the five succeeding years is as follows: 2011: $2.0 million, 2012: $2.0 million, 2013: $1.5 million 2014: $0.8 million and 2015: $0.7 million.
Note 12 – Related Party Transactions
As of September 30, 2009, the Company had an investment valued at $2.7 million, in the INTL Trade Finance Fund Limited, a fund managed by the Company’s former subsidiary, INTL Capital Limited. This fund invested primarily in global trade finance-related assets and was included in ‘Financial instruments owned’ on the consolidated balance sheets. The Company liquidated its position in this fund in 2010 after the sale of its subsidiary.
During the quarter ended June 30, 2009, the Company redeemed its interest in the INTL Consilium Convertible Arbitrage Fund (“the ICCAF fund”). Under the provisions of the Consolidation Topic of the ASC, the Company was previously required to consolidate the ICCAF fund as a variable interest entity with effect from the quarter ended June 30, 2008. Accordingly, these consolidated financial statements include the effect of deconsolidation of the ICCAF fund during the quarter ended June 30, 2009.
Note 13 – Payable to Lenders under Loans and Overdrafts
As of September 30, 2010 the Company had four credit facilities under which the Company may borrow up to $275.0 million, subject to certain conditions. Additionally, the Company has a subordinated note, as defined by CFTC regulations, outstanding of $0.5 million with an individual at September 30, 2010.
The Company’s credit facilities at September 30, 2010 consisted of the following:
A one-year, renewable, revolving syndicated committed loan facility established on September 22, 2010 under which the Company’s subsidiary, INTL Commodities, Inc. (‘INTL Commodities’) is entitled to borrow up to $140 million, subject to certain conditions. The loan proceeds are used to finance the activities of INTL Commodities and are secured by its assets. Unused portions of the margin line require a commitment fee of 0.75% on the unused commitment. The borrowings outstanding under the facility bear interest at the Eurodollar Rate, as defined and 0.375% at September 30, 2010, plus 2.875% for the applicable term, at INTL Commodities’ election. The agreement contains financial covenants related to INTL Commodities’ working capital, equity and leverage ratio, as defined. The Company was in compliance with these covenants as of September 30, 2010. The Company paid debt issuance costs of $0.7 million in connection with the credit facility, which are being amortized over a twelve month period (the term of the facility). The facility is guaranteed by the Company.
Two additional lines of credit with a commercial bank under which the Company may borrow up to $60 million, subject to certain conditions. One of these lines of credit is secured by certain of the Company’s assets. The other is secured by a pledge of shares held in certain of the Company’s foreign subsidiaries. The interest rate on these facilities was 2.40% over one-month LIBOR (approximately 0.26% at September 30, 2010). The loan proceeds are used to finance working capital needs of the Company and certain subsidiaries. Subsequent to September 30, 2010, the two lines of credit were rolled into a three year senior secured revolving credit facility in the amount of $75 million, as discussed below.
An unsecured line of credit with a syndicate of lenders, administered by Bank of Montreal was amended and restated on June 21, 2010, under which FCStone may borrow up to $75.0 million. This line is intended to provide short term funding of margin
F - 28
INTERNATIONAL ASSETS HOLDING CORPORATION
Notes to Consolidated Financial Statements—(Continued)
to commodity exchanges as necessary and is subject to annual review. The continued availability of this line of credit is subject to FCStone’s financial condition and operating results continuing to be satisfactory as set forth in the agreement. Borrowings under the margin line are on a demand basis and bear interest at the Base Rate, as defined and 3.25% at September 30, 2010, plus 2.0%. The agreement contains financial covenants related to FCStone’s tangible net worth, leverage ratio, and net capital, as defined. The Company was in compliance with these covenants as of September 30, 2010. Unused portions of the margin line require a commitment fee of 0.50% on the unused commitment. There were no borrowings outstanding under these lines of credit at September 30, 2010 and 2009. FCStone paid fees and other debt issuance costs of $0.4 million in connection with the credit facility, which are being amortized over a twelve month period (the term of the facility).
FCStone has a subordinated note with an individual, in the amount of $0.5 million at September 30, 2010. The note matures on December 31, 2010, and bears interest at a rate equal to the prime rate as published in The Wall Street Journal, which was 3.25% at September 30, 2010.
Credit facilities and outstanding borrowings as of September 30, 2010 and 2009 were as follows:
| Amounts Outstanding | ||||||||||||||
| (in millions) Security |
Renewal / Expiration Date |
Total Commitment |
September 30, 2010 |
September 30, 2009 |
||||||||||
| Certain foreign exchange assets |
December 17, 2010 |
$ | 25.0 | $ | 12.5 | $ | 11.1 | |||||||
| Certain pledged shares |
December 17, 2010 |
35.0 | 11.9 | 34.9 | ||||||||||
| Certain commodities assets |
September 21, 2011 |
140.0 | 90.5 | 60.0 | ||||||||||
| None |
June 22, 2011 |
75.0 | — | — | ||||||||||
| Certain commodities assets |
Terminated March, 2010 |
— | — | 2.7 | ||||||||||
| None |
Terminated April, 2010 |
— | — | 55.0 | ||||||||||
| None |
December 31, 2010 |
0.5 | 0.5 | 1.5 | ||||||||||
| $ | 275.5 | $ | 115.4 | $ | 165.2 | |||||||||
Effective October 29, 2010, the Company established a credit agreement with a syndicate of lenders, administered by Bank of America, N.A., in the amount of $75 million, replacing the two previous lines of credit that had an aggregated commitment level of $60 million. The term of the credit agreement is three years, expiring October 1, 2013. The loan proceeds will be used to finance working capital needs of the Company and certain subsidiaries.
On December 2, 2010, the Company entered into a Credit Agreement with Bank of Montreal, as Agent, and BMO Capital Markets Financing, Inc., as lender, which provides a $50 million uncommitted borrowing facility. Borrowings under the facility will be used to finance traditional commodity financing arrangements, and the credit agreement expires on December 1, 2011.
Note 14 – Convertible Subordinated Notes and Debt Issuance Costs
The Company had $16.7 million in aggregate principal amount of the Company’s senior subordinated convertible notes due 2011 (‘Notes’) outstanding as of September 30, 2010 and 2009. The Notes are general unsecured obligations of the Company and bear interest at the rate of 7.625% per annum, payable quarterly in arrears. The Company’s Notes currently prohibit the payment of cash dividends by the Company.
During October 2008, Notes with a principal balance of $0.1 million were converted into 4,359 common shares at the election of the holders of those Notes. During September 2009, the Company issued an additional 8,239,319 shares in conjunction with its acquisition of FCStone. As a result of this transaction, the conversion price was reduced to $21.79 per share. As of September 30, 2010, the remaining Notes are convertible by the holders into 767,886 shares of common stock of the Company.
If the dollar-volume weighted average price of the common stock exceeds $38.25, subject to certain adjustments, for any twenty out of thirty consecutive trading days, the Company will have the right to require the holders of the Notes to convert all or any portion of the Notes into shares of common stock at the then-applicable conversion price.
In the event that the consolidated net interest coverage ratio, as set forth in the Notes, for the 12 months preceding the end of any fiscal quarter is less than 2.0, the interest rate on the Notes will be increased by 2.0% to 9.625% per annum, effective as of the first day of the following fiscal quarter. Through the quarter ended September 30, 2010, no such increase has been necessary. Holders had the option to redeem their Notes at par if the consolidated net interest coverage ratio was less than 2.75 for the twelve-month period ending December 31, 2009. The consolidated net interest coverage ratio for the twelve-month period ended December 31, 2009 exceeded 2.75, so the holders were not entitled to early redemption of their Notes.
F - 29
INTERNATIONAL ASSETS HOLDING CORPORATION
Notes to Consolidated Financial Statements—(Continued)
The Company entered into a separate Registration Rights Agreement with the holders of the Notes, under which the Company was required to file with the U.S. Securities and Exchange Commission (‘the SEC’) a Registration Statement on Form S-3 within a specified period of time. The Registration Statement was declared effective by the SEC on October 24, 2006. The Company is required, under the Registration Rights Agreement, to maintain the effectiveness of the Registration Statement, failing which it could become liable to pay holders of the Notes liquidated damages of 1% of the value of the Notes, plus a further 1% for every 30 days that it remains ineffective thereafter, up to an aggregate maximum of 10% of the value of the Notes. At September 30, 2010 the Company was in compliance with its requirements under the Registration Rights Agreement.
On December 14, 2010 the holder of $3.7 million in principal amount of the Notes delivered to the Company a Conversion Notice, as a result of which this principal amount and accrued interest will be converted into 173,966 shares of common stock of the Company and the principal balance of the Notes will be reduced from $16.7 million to $13 million.
Note 15 – Commitments and Contingencies
As discussed in Note 10 – Goodwill, the Company has a contingent liability relating to the acquisition of CIBSA which may result in the payment of additional consideration in May of 2011. In addition, the Company has a contingent liability relating to the acquisition of Downes O’Neill, LLC which may result in the payment of additional consideration calculated at December 31, 2010.
As discussed in Note 17 – Acquisitions, the Company has a contingent liability relating to the acquisition of the RMI Companies, which may result in the payment of additional consideration. The acquisition date fair value of additional consideration is estimated to be approximately $10.7 million and will be remeasured to its fair value each quarter, with changes in fair value recorded in earnings.
As discussed in Note 17 – Acquisitions, the Company has a contingent liability relating to the acquisition of the Hanley Group, which may result in the payment of additional consideration. The acquisition date fair value of additional consideration is estimated to be approximately $15.6 million and will be remeasured to its fair value each quarter, with changes in fair value recorded in earnings.
As discussed in Note 14 – Convertible Subordinated Notes and Debt Issuance Costs, the Notes may be converted into shares of common stock of the Company at any time by the holders. The Notes also contain a provision to increase the interest rate by 2%, subject to certain conditions measured on a quarterly basis.
Operating Leases
The Company is obligated under various noncancelable operating leases for the rental of office facilities, aircraft, automobiles, service obligations and certain office equipment, and accounts for these lease obligations on a straight line basis. The expense associated with operating leases amounted to $5.5 million, $1.9 million and $2.4 million, for fiscal years 2010, 2009 and 2008, respectively. The expenses associated with the operating leases and service obligations are reported in the consolidated income statements within occupancy and equipment rental, clearing and related and other expenses.
Future aggregate minimum lease payments under noncancelable operating leases as of September 30, 2010 are as follows:
| Year ending September 30, (In millions) |
||||
| 2011 |
$ | 4.0 | ||
| 2012 |
3.9 | |||
| 2013 |
3.2 | |||
| 2014 |
2.9 | |||
| 2015 |
2.3 | |||
| Thereafter |
4.8 | |||
| $ | 21.1 | |||
Exchange Member Guarantees
The Company is a member of various exchanges that trade and clear futures and option contracts. Associated with its membership, the Company may be required to pay a proportionate share of the financial obligations of another member who may default on its obligations to the exchange. While the rules governing different exchange memberships vary, in general the Company’s guarantee obligations would arise only if the exchange had previously exhausted its resources. In addition, any
F - 30
INTERNATIONAL ASSETS HOLDING CORPORATION
Notes to Consolidated Financial Statements—(Continued)
such guarantee obligation would be apportioned among the other non-defaulting members of the exchange. Any potential contingent liability under these membership agreements cannot be estimated. The Company has not recorded any contingent liability in the consolidated financial statements for these agreements and believes that any potential requirement to make payments under these agreements is remote.
Impairment
The Company recorded an impairment charge of $1.1 million in each of the years ended September 30, 2010 and 2009 in connection with INTL Sieramet LLC, a corporation in which it holds a 55% equity interest. This amount is recorded in ‘Other’ under the ‘Non-interest expenses’ section of the Consolidated Income Statements. The impairment charge is to recognize the uncertain future of INTL Sieramet’s operations and the possibility that there may be incomplete recovery of the full value of its assets.
Securities Litigation
FCStone and certain officers of FCStone were named as defendants in an action filed in the United States District Court for the Western District of Missouri on July 15, 2008. A consolidated amended complaint was subsequently filed on September 25, 2009. The action, which purports to be brought as a class action on behalf of purchasers of FCStone common stock between November 15, 2007 and February 24, 2009, seeks to hold defendants liable under Section 10(b) and Section 20(a) of the Securities Exchange Act of 1934 for allegedly false statements and failure to disclose adverse facts relating to an interest rate hedge, the bad debt reserve of FCStone and losses sustained by FCStone in connection with a customer’s energy trades. FCStone filed a motion to dismiss this amended complaint, along with supporting documents, on November 24, 2009. On November 16, 2010, the Court denied FCStone’s motion to dismiss and granted the plaintiffs leave to amend the complaint on or before December 15, 2010.
A purported shareholder derivative action was filed against FCStone (solely as a nominal defendant) and certain officers and directors of FCStone in August, 2008 in the Circuit Court of Platte County, Missouri, alleging breaches of fiduciary duties, waste of corporate assets and unjust enrichment. An amended complaint was subsequently filed in May, 2009 to add claims based upon the losses sustained by FCStone arising out of a customer’s energy trading. On July 2, 2009 FCStone filed a motion to dismiss and supporting documents. On July 7, 2009, the same plaintiff filed a motion for leave to amend the existing case to add a purported class action claim on behalf of the holders of FCStone common stock. On July 8, 2009, a purported class action complaint was filed against FCStone and its directors, as well as International Assets Holding Corporation and International Assets Acquisition Corp. in the Circuit Court of Clay County, Missouri by two individuals who purported to be stockholders of FCStone. The plaintiffs purported to bring this action on behalf of all stockholders of FCStone. The complaint alleged that FCStone and its directors breached their fiduciary duties by failing to maximize stockholder value in connection with the contemplated acquisition of FCStone by International Assets Holding Corporation. The complaint also alleged that FCStone, International Assets Holding Corporation and International Assets Acquisition Corp. aided and abetted the directors’ alleged breach of fiduciary duties. The plaintiffs sought to permanently enjoin the transaction between FCStone and International Assets Holding Corporation, monetary damages in an unspecified amount attributable to the alleged breach of duties, and legal fees and expenses. The plaintiffs did not succeed in enjoining the transaction. This complaint was subsequently consolidated with the complaint filed in the Circuit Court of Platte County, Missouri, and will fall under the jurisdiction of that court. A combined, amended complaint was served on the defendants in January 2010. All of the defendants intend to defend against the complaint vigorously. The defendants filed a notice to dismiss in February, 2010, the plaintiffs filed their opposition to this in April, 2010 and supplemental filings were made in September and October, 2010.
Sentinel Litigation
In August, 2008, the bankruptcy trustee of Sentinel filed adversary proceedings against one of the Company’s subsidiaries, FCStone, LLC, and a number of other futures commission merchants in the Bankruptcy Court, subsequently reassigned within the United States District Court, for the Northern District of Illinois seeking avoidance of alleged transfers or withdrawals of funds received by the futures commission merchants within 90 days prior to the filing of the Sentinel bankruptcy petition, as well as avoidance of post-petition distributions and disallowance of the proof of claim filed by FCStone, LLC. The trustee seeks recovery of pre- and post-petition transfers totaling approximately $15.5 million and, in April, 2009, filed an amended complaint adding a claim for unjust enrichment. FCStone, LLC has answered the complaints and all parties have entered into the discovery phase of the litigation. Trial in this matter is expected to be during 2011. FCStone, LLC intends to defend the matter vigorously, and to coordinate its defense with the other futures commission merchants.
F - 31
INTERNATIONAL ASSETS HOLDING CORPORATION
Notes to Consolidated Financial Statements—(Continued)
Convertible Noteholder Litigation
In November, 2009, an investor in a principal amount of $3.7 million of the Company’s senior subordinated convertible notes due 2011 (“the Notes”), Portside Growth and Opportunity Fund (“Portside”), managed by Ramius LLC, served a notice of motion for summary judgment on the Company, claiming that the FCStone transaction resulted in a change of control as defined in the Notes; and that, as a result, the Company should have afforded Portside the opportunity to have the Notes redeemed at a 15% premium. Portside is also claiming default interest at the rate of 15% per annum established in the Notes. Portside’s motion was denied in March, 2010. Portside filed an amended complaint in April, 2010. The remaining three holders of the notes, Highbridge International LLC, LBI Group Inc. and Iroquois Master Fund Ltd., holding Notes in an aggregate amount of $13.0 million, filed a similar lawsuit on the Company on October 20, 2010.
On December 14, 2010 Portside delivered a Conversion Notice to the Company in compliance with the terms of the relevant agreement. The principal amount and accrued interest will convert into 173,966 shares of common stock of the Company. This conversion supersedes Portside’s claim for redemption at a premium.
The Company is of the view that the FCStone transaction did not result in a change of control as defined in the Notes and intends vigorously to defend the lawsuit brought by the remaining three holders of the Notes. In the event that the Company does not prevail in this litigation, then the Company would be obligated to pay to the Note-holders the principal amount of the Notes, the premium of 15%, accrued interest and attorneys’ fees.
The Company is currently unable to predict the outcome of these claims and believe their current status does not warrant accrual under the guidance of the Contingencies Topic of the ASC, since the amount of any liability is neither probable nor reasonably estimable. As such, no amounts have been accrued in the consolidated financial statements. The Company intends to vigorously defend the claims against us and will continue to monitor the litigation and assess the need for future accruals. In light of the nature of the Company’s activities, it is possible that the Company may be involved in litigation in the future, which could have a material adverse impact on the Company and its financial condition and results of operations.
From time to time and in the ordinary course of our business, the Company is a plaintiff or a defendant in other legal proceedings related to various issues, including worker’s compensation claims, tort claims, contractual disputes and collections. The Company carries insurance that provides protection against certain types of claims, up to the policy limits of our insurance. It is the opinion of management that none of the other known legal actions will have a material adverse impact on the Company’s financial position, results of operations or liquidity.
Change in Control Contingency
In connection with the FCStone Transaction, certain of FCStone’s management and executive officers are participants in FCStone’s Change in Control Severance Plan (“the Severance Plan”). The Severance Plan provides that if during the two-year period following the completion of the merger agreement, a participant terminates their employment for “good reason” or the Company terminates the participant’s employment other than for “cause” or on account of death or disability, the Company will be committed to pay certain compensation amounts to the participant in a lump sum amount. The maximum potential commitment for all participants is $4.5 million. At September 30, 2010, no actions have occurred or are anticipated which would trigger payments under the Severance Plan.
Note 16 – Capital and Other Regulatory Requirements
Our FCM subsidiary, FCStone LLC is subject to various regulations and capital adequacy requirements. Pursuant to the rules, regulations, and requirements of the CFTC and other self-regulatory organizations, FCStone LLC is required to maintain certain minimum net capital as defined in such rules, regulations, and requirements. Net capital will fluctuate on a daily basis. FCStone LLC had adjusted net capital at September 30, 2010 of $77.8 million, which was $25.0 million in excess of its minimum net capital requirement of $52.8 million. Subsequent to September 30, 2010, the business activities of FCStone Forex, LLC have been moved into FCStone, LLC, and impacts to net capital have been minimal.
INTL Trading, Inc. (“INTL Trading”) is a registered broker dealer and member of the Financial Industry Regulatory Authority (“FINRA”) and is subject to the SEC Uniform Net Capital Rule 15c3-1. This rule requires the maintenance of minimum net capital, and requires that the ratio of aggregate indebtedness to net capital not exceed 15 to 1. Equity capital may not be withdrawn if the resulting net capital ratio would exceed 10 to 1. At September 30, 2010, INTL Trading had regulatory net capital of $1.5 million, which was $0.5 million in excess of its minimum net capital requirement of $1.0 million. The Company’s ability to receive distributions from INTL Trading is restricted by regulations of the SEC. The Company’s right to receive distributions from its subsidiaries is also subject to the rights of the subsidiaries’ creditors, including customers of INTL Trading. During 2010 INTL Trading paid dividends of $3.9 million to the Company.
FCStone Australia Pty Ltd is regulated by the Australian Securities and Investment Commission and is subject to a minimum capital requirement which at September 30, 2010 was $50,000.
FCC Investments, Inc., a broker-dealer subsidiary of FCStone, is subject to the net capital requirements of the SEC relating to liquidity and net capital levels. At September 30, 2010, FCC Investments, Inc. had regulatory net capital of $0.4 million, and its minimum net capital requirement was $0.3 million.
FCStone Commodities Services (Europe), Ltd. is regulated by the Financial Regulator of Ireland and is subject to a minimum capital requirement which at September 30, 2010 was 370,000 euros.
Risk Management Incorporated is regulated by the CFTC and the National Futures Association (“NFA”) and is subject to a minimum capital requirement which at September 30, 2010 was $45,000.
F - 32
INTERNATIONAL ASSETS HOLDING CORPORATION
Notes to Consolidated Financial Statements—(Continued)
Note 17 – Acquisitions
Acquisitions in 2010
During fiscal year 2010, the Company acquired three businesses, Risk Management Incorporated and RMI Consulting, Inc, Hanley Group and Provident Group, none of which were significant on an individual or aggregate basis. The Company’s consolidated financial statements include the operating results of each business from the dates of acquisition.
The total amount of goodwill that is expected to be deductible for tax purposes is $40.9 million at September 30, 2010.
Risk Management Incorporated and RMI Consulting, Inc
On April 1, 2010, the Company acquired Risk Management Incorporated and RMI Consulting, Inc. (the “RMI Companies”). The transaction is not considered significant. Under terms of the Purchase Agreement, the Company acquired all the outstanding capital stock of the RMI Companies. The purchase price for the shares consisted of an initial payment of $6.0 million, and three contingent payments which will be based on the combined net income of the RMI Companies for each of the three years after the closing. The estimated total purchase price, including contingent consideration, is approximately $16.7 million.
RMI provides execution and consulting services to some of the largest natural gas consumers in North America, including municipalities and large manufacturing firms, as well as major utilities. In addition to its risk-management and brokerage services, RMI also offers a wide range of other programs, including a proprietary online energy procurement platform. The acquisition adds extensive and proven expertise in the natural gas, electricity and related energy markets where RMI has a leading presence, as well as a broad range of long-term relationships with some major organizations.
The Company has made a preliminary allocation of the purchase costs among identified intangible assets, with determinable useful lives, intangible assets with indefinite lives and goodwill. The Company is in the process of finalizing third-party valuations of the intangible assets and contingent liabilities. Purchase costs allocated to intangible assets with determinable useful lives are amortized over the remaining useful lives of the assets. The preliminary intangible assets and goodwill recognized in this transaction were assigned to the Consulting and Risk Management (“C&RM”) segment. The intangible assets recognized include customer relationships of $7.0 million (20 year useful life); software programs and platforms of $0.8 million (5 year useful life) and trade name of $1.2 million (indefinite useful life). Amortization related to the intangible assets was $0.3 million for the year ended September 30, 2010. The goodwill is calculated as the excess of the fair value of the consideration transferred over the fair value of the identified net assets acquired and liabilities assumed. Purchase costs were allocated to goodwill of approximately $7.7 million.
Under the terms of the purchase agreements, the Company has obligations to pay additional consideration if specific conditions and earnings targets are met, as described above. In accordance with the Business Combinations Topic of the ASC, the fair value of the additional consideration is recognized as a contingent liability as of the acquisition date. The acquisition date fair value of additional consideration is estimated to be approximately $10.7 million. The contingent liability for the estimated additional consideration is included in the accounts payable and other accrued liabilities caption of the consolidated balance sheet at September 30, 2010. The amount recorded represents the fair value of expected consideration to be paid based on the forecasted sales during the three year period and a discount rate being applied to those future payments. At the end of each reporting period after the acquisition date, the contingent payment will be remeasured to its fair value, with changes in fair value recorded in earnings. The Company’s consolidated financial statements include the operating results of the RMI Companies from the date of acquisition.
Hanley Group
On July 2, 2010, FCStone, a wholly owned subsidiary of the Company, entered into a Purchase Agreement to acquire HGC Trading, LLC; HGC Asset Management, LLC; HGC Advisory Services, LLC; Hanley Alternative Trade Group, LLC and HGC Office Services, LLC (the Hanley Companies). The Hanley Companies are engaged in the business of acting as market makers and dealers in exchange traded options and futures on soft commodities; executing and trading derivatives on soft commodities in the over the counter market; and providing related advisory services. The transaction is not considered significant.
Under the terms of the Purchase Agreement, FCStone acquired all of the outstanding membership interests in the Hanley Companies. The purchase price for the interests is an amount equal to the sum of the following: (1) an initial payment to be made at the closing of $7.5 million; (2) two payments equaling $24.3 million for the adjusted net asset value of the Hanley Companies as of June 30, 2010; (3) three additional payments equal to 15% of the adjusted earnings before interest and taxes of the soft commodities derivatives business of the Hanley Companies and FCStone Trading LLC (the “Derivatives Division”) for each twelve month period during the three year period commencing on July 1, 2010; and (4) a final payment based on the cumulative Adjusted EBIT of the Derivatives Division for the three year period commencing on July 1, 2010. The estimated total purchase price, including contingent consideration is approximately $47.4 million.
F - 33
INTERNATIONAL ASSETS HOLDING CORPORATION
Notes to Consolidated Financial Statements—(Continued)
At the closing under the Purchase Agreement, the Company and the sellers of the Hanley Companies entered into an option agreement (the Option Agreement), pursuant to which the sellers of the Hanley Companies have the right to elect, in their discretion, to receive up to thirty percent (30%) of the final EBIT Payment in the form of restricted shares of the common stock of the Company. The Option may be exercised by the sellers of the Hanley Companies at any time during the twenty day period commencing on June 30, 2013. The option price will be equal to the greater of: (i) $16.00 per share, or (ii) seventy five percent (75%) of the fair market value of the common stock of the Company as of June 30, 2013. The maximum number of restricted shares issuable upon the exercise of the Option is 187,500 shares. The restricted shares will be subject to restrictions on transfer which will lapse at the rate of one-third per year over the three year period commencing on June 30, 2013. The Option Agreement was included in determining the fair value of the contingent consideration.
The Company has made a preliminary allocation of the purchase costs among tangible assets, identified intangible assets, with determinable useful lives, intangible assets with indefinite lives and goodwill. The Company is in the process of finalizing third-party valuations of the intangible assets and contingent liabilities. Purchase costs allocated to intangible assets with determinable useful lives are amortized over the remaining useful lives of the assets. The preliminary intangible assets and goodwill recognized in this transaction were assigned to the C&RM segment. The intangible assets recognized include customer relationships of $0.2 million (5 year useful life); software programs and platforms of $1.2 million (5 year useful life), non-compete agreements of $2.9 million (3 year useful life) and trade name of $0.1 million (indefinite useful life). Amortization related to the intangible assets was $0.3 million for the period from July 2, 2010 to September 30, 2010. The goodwill is calculated as the excess of the fair value of the consideration transferred over the fair value of the identified net assets acquired and liabilities assumed. Purchase costs were allocated to goodwill of approximately $18.7 million.
Under the terms of the purchase agreements, the Company has obligations to pay additional consideration if specific conditions and earnings targets are met, as described above. In accordance with the Business Combinations Topic of the ASC, the fair value of the additional consideration will be recognized as a contingent liability as of the acquisition date. The acquisition date fair value of additional consideration is estimated to be approximately $15.6 million. The contingent liability for the estimated additional consideration is included in the accounts payable and other accrued liabilities caption of the consolidated balance sheet at September 30, 2010. The amount recorded represents the fair value of expected consideration to be paid based on the forecasted sales during the three year period and a discount rate being applied to those future payments. At the end of each reporting period after the acquisition date, the contingent payment will be remeasured to its fair value, with changes in fair value recorded in earnings. The Company’s consolidated financial statements include the operating results of the Hanley Companies from the date of acquisition.
As part of the acquisition of the Hanley Companies, the Company acquired a majority interest in the Blackthorn Multi-Advisor Fund, LP (“Blackthorn Fund”). The Blackthorn Fund is a commodity investment pool, which allocates most of its assets to third-party commodity trading advisors and other investment managers. The Blackthorn Fund engages in the speculative trading of a wide variety of commodity futures and option contracts, securities and other financial instruments. In addition to the majority interest that was acquired, a subsidiary of the Company is also the general partner of the Blackthorn Fund. Under the provisions of the Consolidations Topic of the ASC, the Company is required to consolidate the Blackthorn Fund as a variable interest entity since it is the general partner and owns a majority interest. The creditors of the Blackthorn Fund have no recourse to the general assets of the Company.
The Blackthorn Fund has net assets of $5.2 million as of September 30, 2010. The net assets of the Blackthorn fund consisted of cash and cash equivalents of $0.6 million, deposits and receivables from broker-dealers, clearing organizations and counterparties of $2.8 million, investments in managed funds of $1.8 million and less than $50 thousand in accounts payable and other accrued liabilities at September 30, 2010. Accordingly, the noncontrolling interest shown in the balance sheet includes the noncontrolling interest of the Blackthorn Fund of $1.6 million as of September 30, 2010. See Note 6 for discussion of fair value of the financial assets and liabilities.
Provident Group
On September 20, 2010, the Company acquired certain assets of Provident Group (“Provident”), a New York-based investment banking and advisory firm. Under terms of the acquisition agreement, the Company acquired assets secured the services of the individual sellers, as set forth in the agreement. The purchase price for the assets and services of the sellers was $5.0 million.
Subsequent to closing, the individual sellers placed the $5.0 million purchase price into an escrow account. The $5.0 million held in escrow was recorded as a reduction in additional paid in capital as shares held in escrow for business
F - 34
INTERNATIONAL ASSETS HOLDING CORPORATION
Notes to Consolidated Financial Statements—(Continued)
combinations. The shares held in escrow for business combinations will be released to the individual sellers, over a five year period from the date of closing based on net profits, in accordance with the provisions of the acquisition agreement. Upon the release of the shares, they will be owned by the individual sellers free and clear of any further encumbrance under the acquisition agreement or the custody agreement and the Company will reduce the shares held in escrow for business combinations amounts. However, if the terms of the agreement are not met, the remaining shares will be forfeited and the remaining shares and balance in the shares held in escrow for business combinations balance will be recorded as treasury stock. The Company is in the process of making a preliminary allocation of purchase costs
Provident is engaged in the business of providing investment banking services. Provident will play a critical role in building out a comprehensive investment banking and advisory platform delivering financing solutions to the middle market.
Provident’s investment banking and advisory business focuses mainly on middle-market companies seeking capital throughout key growth markets spanning North America, Latin America, northern Asia and Australia. The firm effectively leverages its expertise across market segments typically under the radar of the larger global investment banks, delivering relevant solutions in the natural resources, real estate, financial institutions, power generation and transportation sectors. The Provident team seamlessly integrates structuring, execution and distribution in managing local and cross-border mandates, which complements the needs of the Company’s global client base and the broader marketplace.
Acquisitions in 2009
On September 30, 2009, the Company acquired FCStone Group, Inc. (“FCStone”) through the issuance of 8,239,319 shares of the Company’s common stock. As a result of the acquisition, FCStone became a wholly-owned subsidiary of the Company.
FCStone is an integrated risk management company that provides risk management consulting and transaction execution services to commercial commodity intermediaries, end-users and producers. The Company believes that the acquisition will create a leading global provider of consulting and trade execution services. Management believes the combined entity will be better positioned to take advantage of market opportunities and enjoy better access to capital sources. In addition to those factors, other primary factors for the acquisition includes revenue diversification, additional product offerings, creation of critical mass, enhanced geographic footprint, expanded shareholder base and liquidity in the stock and an experienced management team.
Since the acquisition was completed on September 30, 2009, which is the last day of the Company’s fiscal year end, no results of operations from FCStone have been included in the Company’s consolidated income statement for the year ended September 30, 2009.
The purchase price of approximately $137.6 million includes the fair value of common stock issued and estimated acquisition costs. The components of the purchase price are as follows:
| (in millions, except share and per share amounts) |
September 30, 2009 | |||
| Number of shares of International Assets common stock issued |
8,239,319 | |||
| Weighted average price per share of International Assets common stock, for the period covering two days immediately before and after September 30, 2009 |
$ | 16.45 | ||
| Consideration attributable to issuance of International Assets common stock |
$ | 135.5 | ||
| International Assets acquisition costs |
2.1 | |||
| Total purchase price |
$ | 137.6 | ||
In connection with the merger, the holders of FCStone common stock and stock options became holders of the Company’s common stock and stock options, respectively. As a result of the acquisition, all unvested FCStone stock options became fully vested as of the effective date of the acquisition. Each outstanding share of common stock of FCStone was converted into .295 shares (the exchange ratio) of the Company’s common stock. In addition, each outstanding vested FCStone stock option granted under FCStone’s stock option plan was converted into a vested option to purchase shares of the Company’s common stock, with adjustments to the number of shares and the strike price to reflect the exchange ratio.
F - 35
INTERNATIONAL ASSETS HOLDING CORPORATION
Notes to Consolidated Financial Statements—(Continued)
The fair value of the common stock issued was determined using a value of $16.45 per share, which represents the average closing price of the Company’s common stock for the five-day period comprised of the two days prior to, and the two days subsequent to the date of the acquisition on September 30, 2009.
The total purchase price of the assets acquired and liabilities assumed for the acquisition of FCStone is allocated to the net tangible and intangible assets based on their estimated fair value as of the date of the acquisition. Management’s estimates of fair value are based upon assumptions believed to be reasonable, but which are inherently uncertain and unpredictable. Applying purchase accounting resulted in the mark-up of FCStone’s exchange memberships and stock to fair market value, resulting in an increase of $2.6 million to exchange memberships and stock, net of estimated deferred income taxes of $1.8 million, the recording of an actuarial loss of $0.5 million on the FCStone defined-benefit pension plan and a decrease to the recorded Agora-X minority interest balance of $4.4 million.
The allocation of the purchase price to assets acquired and liabilities assumed as of the date of acquisition resulted in negative goodwill. In accordance with SFAS 141, the negative goodwill was allocated as a pro rata deduction of the amounts assigned to the assets acquired excluding financial assets, deferred taxes and other current assets. This resulted in the allocation of negative goodwill to the writing down of $4.2 million in non-current assets, net of estimated deferred taxes of $2.9 million. The remaining negative goodwill of $18.5 million has been recognized as an extraordinary item in the consolidated income statement for the year ended September 30, 2009.
| (in millions) |
September 30, 2010 | September 30, 2009 | ||||||
| Book value of net assets acquired |
$ | 146.8 | $ | 153.8 | ||||
| Adjusted for: |
||||||||
| FCStone mark-up of exchange memberships and stock, net of deferred income taxes |
2.6 | 2.6 | ||||||
| FCStone write-down of non-current assets, net of deferred income taxes |
(4.2 | ) | (4.2 | ) | ||||
| FCStone pension actuarial loss |
(0.5 | ) | (0.5 | ) | ||||
| FCStone adjustment to Agora-X minority interest |
4.4 | 4.4 | ||||||
| Adjusted book value of net assets acquired |
149.1 | 156.1 | ||||||
| Adjusted for: |
||||||||
| Excess net assets over purchase price (negative goodwill) |
(11.5 | ) | (18.5 | ) | ||||
| Total purchase price |
$ | 137.6 | $ | 137.6 | ||||
During fiscal 2010, the Company revised the estimate of state tax allocations resulting in a reduction in the consolidated effective state tax rate. As a result, the net deferred tax assets decreased by $2.2 million, including a change in estimate related to the valuation of state net operating loss carryforwards. The Company’s change in estimate was the result of revised revenue apportionment factors in certain jurisdictions due to analysis and activities completed subsequent to the filing of the fiscal year ended September 30, 2009 financial statements. Typically, changes within the measurement period that result from new information about facts and circumstances that existed at the acquisition date are recognized through a corresponding adjustment to goodwill. However, in the absence of goodwill recorded in connection with this transaction, the $2.2 million decrease in net deferred tax assets has been reported as an extraordinary loss in the consolidated income statement for fiscal 2010. Additionally, during January 2010, the Company paid $1.2 million in additional consideration related to a pre-acquisition contingency that has been reported as a $0.8 million extraordinary loss, net of taxes, in the consolidated income statement for fiscal 2010.
During the three months ended September 30, 2010, the Company identified accounting errors related to the recording of deferred tax assets by FCStone in the amount of $4.0 million that occurred prior to the acquisition. The Company has evaluated materiality under the guidance of SEC Staff Accounting Bulletin No. 99, Materiality, and considered relevant qualitative and quantitative factors. Based on this analysis and the belief that these errors would not have changed the purchase price at acquisition, the Company has corrected the errors through the recognition of a purchase price adjustments in the amount of $4.0 million reported as an extraordinary loss in the consolidated income statement for fiscal 2010, and a corresponding $4.0 million decrease in deferred tax assets reported on the consolidated balance sheet at September 30, 2010. The Company’s analysis supports the conclusion that these errors are not material to the fourth quarter or any prior periods impacted by the errors.
F - 36
INTERNATIONAL ASSETS HOLDING CORPORATION
Notes to Consolidated Financial Statements—(Continued)
The following presents a condensed balance sheet of FCStone as of the September 30, 2009 acquisition date, after applying purchase accounting to the balances as per the reconciliation above:
| September 30, |
2009 | |||
| ASSETS | ||||
| Cash and cash equivalents |
$ | 24.2 | ||
| Cash and securities segregated under federal and other regulations |
14.9 | |||
| Deposits and receivables from: |
||||
| Exchange-clearing organizations |
899.0 | |||
| Broker-dealers and futures commission merchants |
45.9 | |||
| Counterparties |
14.7 | |||
| Receivable from customers, net |
8.4 | |||
| Notes receivable from customers, net |
22.2 | |||
| Income taxes receivable |
40.2 | |||
| Financial instruments owned, at fair value |
59.5 | |||
| Deferred income taxes |
27.7 | |||
| Other assets |
17.0 | |||
| Total assets |
$ | 1,173.7 | ||
| LIABILITIES AND STOCKHOLDERS’ EQUITY | ||||
| Liabilities: |
||||
| Accounts payable and other accrued liabilities |
$ | 49.8 | ||
| Payables to: |
||||
| Customers - regulated |
811.6 | |||
| Customers - unregulated |
71.7 | |||
| Lenders under loans and overdrafts |
2.7 | |||
| Financial instruments sold, not yet purchased, at fair value |
23.7 | |||
| 959.5 | ||||
| Subordinated debt |
56.5 | |||
| Total liabilities |
1,016.0 | |||
| Minority owners’ interest in consolidated entities |
1.6 | |||
| Stockholders’ equity |
156.1 | |||
| Total liabilities and stockholders’ equity |
$ | 1,173.7 | ||
F - 37
INTERNATIONAL ASSETS HOLDING CORPORATION
Notes to Consolidated Financial Statements—(Continued)
The following table presents the unaudited pro forma condensed consolidated results of continuing operations of the Company as if the acquisition were completed as of the beginning of each of the fiscal years presented below.
| UNAUDITED, PRO FORMA (In millions, except share and per share numbers) |
For the Fiscal
Year Ended September 30, 2009 |
|||
| Income Statement |
||||
| Operating revenues |
$ | 320.6 | ||
| Interest expense |
12.5 | |||
| Non-interest expenses |
391.6 | |||
| (Loss) income before income tax and minority interest |
(83.5 | ) | ||
| Income tax |
(37.1 | ) | ||
| Minority interest |
(0.4 | ) | ||
| (Loss) income from continuing operations |
$ | (46.0 | ) | |
| (Loss) earnings from continuing operations per share: |
||||
| - Basic |
$ | (2.69 | ) | |
| - Diluted |
$ | (2.69 | ) | |
| Weighted-average number of common shares outstanding: |
||||
| - Basic |
17,116,639 | |||
| - Diluted |
17,116,639 | |||
The unaudited pro forma amounts are presented for illustrative purposes only and are not necessarily indicative of expected future consolidated results of continuing operations. FCStone’s results have been included using the results from their August 31 fiscal years. Pro forma adjustments were made to exclude $9.9 million and $1.3 million from FCStone’s expenses for the fiscal year ended August 31, 2009 and 2008, respectively, net of taxes of $6.0 million and $0.8 million at August 31, 2009 and 2008, respectively. The pro forma adjustments consist of the elimination of depreciation and amortization expense, impairment on goodwill and merger costs and amortization of equipment related to research and development activities for FCStone. Average basic and diluted shares outstanding were adjusted to reflect the exchange ratio of 0.295 shares of the Company for each FCStone common share.
Note 18 – Share-Based Compensation
Share-based compensation expense is included within Compensation and benefits in the consolidated income statements and totaled $1.9 million, $1.9 million and $1.5 million for 2010, 2009 and 2008, respectively.
Stock Option Plans
The Company sponsors a stock option plan for its directors, officers, employees and consultants. At September 30, 2010, 744,871 shares were authorized for future grant under our stock plan. Awards that expire or are canceled generally become available for issuance again under the plan. We settle stock option exercises with newly issued shares of common stock.
Fair value is estimated at the grant date based on a Black-Scholes-Merton option-pricing model using the following weighted average assumptions:
| Year Ended September 30, |
2010 | 2009 | 2008 | |||||||||
| Expected stock price volatility |
85 | % | 114 | % | 61 | % | ||||||
| Expected dividend yield |
0 | % | 0 | % | 0 | % | ||||||
| Risk free interest rate |
1.45 | % | 2.23 | % | 3.17 | % | ||||||
| Average expected life (in years) |
2.80 | 4.70 | 2.96 | |||||||||
Expected stock price volatility rates are based on the historical volatility of the Company’s common stock. We have not paid dividends in the past and do not currently expect to do so in the future. Risk free interest rates are based on the U.S. Treasury yield curve in effect at the time of grant for periods corresponding with the expected life of the option or award. The average expected life represents the estimated period of time that options or awards granted are expected to be outstanding, based on the Company’s historical share option exercise experience for similar option grants. The weighted average fair value of options issued during fiscal years 2010, 2009 and 2008 was $8.12, $10.21 and $11.73.
F - 38
INTERNATIONAL ASSETS HOLDING CORPORATION
Notes to Consolidated Financial Statements—(Continued)
The following is a summary of stock option activity through September 30, 2010:
| Shares Available for Grant |
Number of Options Outstanding |
Weighted Average Price |
Weighted Average Remaining Term (in years) |
Aggregate Intrinsic Value ($ millions) |
||||||||||||||||
| Balances at September 30, 2009 |
782,504 | 1,616,654 | $ | 19.91 | 4.58 | $ | 8.6 | |||||||||||||
| Granted |
(55,633 | ) | 55,633 | $ | 15.30 | |||||||||||||||
| Exercised |
(136,046 | ) | $ | 6.14 | ||||||||||||||||
| Forfeited |
8,000 | (47,086 | ) | $ | 37.71 | |||||||||||||||
| Expired |
10,000 | (12,655 | ) | $ | 22.54 | |||||||||||||||
| Balances at 2010 |
744,871 | 1,476,500 | $ | 20.42 | 3.68 | $ | 8.4 | |||||||||||||
| Exercisable at 2010 |
979,002 | $ | 26.33 | 3.56 | $ | 3.6 | ||||||||||||||
Total compensation cost not yet recognized for non-vested stock option awards is $1.2 million at September 30, 2010 and has a weighted average period of 2.89 years over which the compensation expense is expected to be recognized. The total intrinsic value of options exercised during fiscal years 2010, 2009 and 2008 was $1.4 million, $0.6 million and $5.3 million, respectively.
The options outstanding as of September 30, 2010 are as follows:
| Exercise Price |
Number of Options Outstanding |
Weighted Average Exercise Price |
Weighted Average Remaining Term (in years) |
|||||||||||||||
| $ | — | - | $ 5.00 | 225,974 | $ | 2.50 | 2.31 | |||||||||||
| 5.00 | - | 10.00 | 425,332 | $ | 7.04 | 4.09 | ||||||||||||
| 10.00 | - | 15.00 | 9,240 | $ | 14.49 | 2.65 | ||||||||||||
| 15.00 | - | 20.00 | 405,371 | $ | 18.20 | 3.87 | ||||||||||||
| 20.00 | - | 25.00 | 23,223 | $ | 23.11 | 0.76 | ||||||||||||
| 25.00 | - | 30.00 | 93,981 | $ | 28.27 | 0.66 | ||||||||||||
| 30.00 | - | 35.00 | 1,476 | $ | 34.25 | 1.84 | ||||||||||||
| 35.00 | - | 40.00 | — | n/a | n/a | |||||||||||||
| 40.00 | - | 45.00 | — | n/a | n/a | |||||||||||||
| 45.00 | - | 50.00 | — | n/a | n/a | |||||||||||||
| 50.00 | - | 55.00 | 291,903 | $ | 54.23 | 5.10 | ||||||||||||
|
|
Outstanding, September 30, 2010 |
1,476,500 | ||||||||||||||||
Restricted Stock Plan
The Company sponsors a restricted stock plan for its directors, officers and employees. At September 30, 2010, 430,882 shares were authorized for future grant under our restricted stock plan. Awards that expire or are canceled generally become available for issuance again under the plan. We settle restricted stock with newly issued shares of common stock.
The following is a summary of all restricted stock activity through September 30, 2010:
| Shares Available for Grant |
Number of Shares Outstanding |
Weighted Average Grant Date Fair Value |
Weighted Average Remaining Term (in years) |
Aggregate Intrinsic Value ($ millions) |
||||||||||||||||
| Balances at September 30, 2009 |
552,449 | 163,528 | $ | 12.99 | 2.68 | $ | 2.7 | |||||||||||||
| Granted |
(121,567 | ) | 121,567 | $ | 16.12 | |||||||||||||||
| Vested |
(44,727 | ) | $ | 17.89 | ||||||||||||||||
| Balances at September 30, 2010 |
430,882 | 240,368 | $ | 13.66 | 2.13 | $ | 4.4 | |||||||||||||
Total compensation cost not yet recognized for non-vested stock awards is $2.1 million at September 30, 2010 and has a weighted average period of 2.13 years over which the compensation expense is expected to be recognized. Compensation expense is amortized on a straight-line basis over the vesting period. Restricted stock grants are included in the Company’s total issued and outstanding common shares.
F - 39
INTERNATIONAL ASSETS HOLDING CORPORATION
Notes to Consolidated Financial Statements—(Continued)
Note 19 – Retirement Plans
Defined Benefit Retirement Plans
As a result of its acquisition of FCStone, the Company has a qualified and a nonqualified noncontributory retirement plan, which are defined benefit plans that covers certain employees, and which were frozen to new employees prior to the acquisition. Additionally, prior to acquisition, the plan was amended to freeze all future benefit accruals, and accordingly no additional benefits accrue for active participants under the plan. The Company’s funding policy as it relates to this plan is to fund amounts that are intended to provide for benefits attributed to service to date.
The following table presents changes in, and components of, the Company’s net liability for retirement costs as of and for the year ended September 30, 2010, based on measurement dates of September 30, 2010 and 2009:
| (in millions) |
||||
| Changes in benefit obligation: |
||||
| Benefit obligation, beginning of year |
$ | 35.6 | ||
| Service cost |
— | |||
| Interest cost |
2.0 | |||
| Actuarial (gain) loss |
2.8 | |||
| Benefits paid |
(2.8 | ) | ||
| Benefit obligation, end of year |
37.6 | |||
| Changes in plan assets: |
||||
| Fair value, beginning of year |
18.9 | |||
| Actual return |
1.7 | |||
| Employer contribution |
6.4 | |||
| Benefits paid |
(2.8 | ) | ||
| Fair value, end of year |
24.2 | |||
| Funded status |
$ | 13.4 | ||
The Company is required to recognize the funded status of its defined benefit pension plans measured as the difference between plan assets at fair value and the projected benefit obligation on the consolidated balance sheet at September 30, 2010 and 2009, and to recognize changes in the funded status, that arise during the period but are not recognized as components of net periodic pension cost, within accumulated other comprehensive income, net of taxes. Amounts recognized in the consolidated balance sheet consist of $0.3 million and $0.2 million included within ‘Other assets’ at September 30, 2010 and 2009, respectively, and $13.7 million and $16.9 million included within ‘Accounts payable and other accrued liabilities’ at September 30, 2010 and 2009, respectively.
Accumulated other comprehensive loss, net of tax, includes an amount for actuarial loss in the amount of $1.7 million at September 30, 2010. The Company does not expect to recognize any amount currently in accumulated other comprehensive income (loss) as a component of net periodic pension cost over the next fiscal year.
The following table displays the Company’s defined benefit plans that have accumulated benefit obligations and projected benefit obligations in excess of the fair value of plans assets (underfunded ABO) at September 30, 2010 and 2009:
| (in millions) |
2010 | 2009 | ||||||
| Accumulated benefit obligation |
$ | 37.6 | $ | 35.6 | ||||
| Projected benefit obligation |
$ | 37.6 | $ | 35.6 | ||||
| Plan assets |
$ | 24.2 | $ | 18.9 | ||||
F - 40
INTERNATIONAL ASSETS HOLDING CORPORATION
Notes to Consolidated Financial Statements—(Continued)
The defined benefit obligations were based upon an annual measurement date of September 30, 2010 and 2009. The following weighted-average assumptions were used to determine benefit obligations in the accompanying balance sheets as of September 30, 2010 and 2009:
| 2010 | 2009 | |||||||
| Weighted average assumptions: |
||||||||
| Discount rate |
5.30 | % | 5.90 | % | ||||
| Expected return on assets |
7.30 | 8.25 | ||||||
| Rate of compensation increase – based on age-graded scale (1) |
N/A | N/A | ||||||
| (1) | The plans are frozen for all benefit accruals, no assumption is necessary for rate of compensation increase at the measurement dates. |
The weighted-average assumptions used to determine net periodic pension cost for the period ended September 30, 2010 included a discount rate of 5.30% and an expected rate of return on assets of 7.30%. To account for the defined benefit pension plans in accordance with the guidance in the Compensation – Retirement Benefits Topic of the ASC the Company makes two main determinations at the end of each fiscal year. These determinations are reviewed annually and updated as necessary, but nevertheless, are subjective and may vary from actual results.
First, the Company must determine the actuarial assumptions for the discount rate used to reflect the time value of money in the calculation of the projected benefit obligations for the end of the current fiscal year and to determine the net periodic pension cost for the subsequent fiscal year. The objective of the discount rate assumption is to reflect the interest rate at which pension benefits could be effectively settled. In making this determination, the Company considers the timing and amount of benefits that would be available under the plans. The discount rate at September 30, 2010 is based on a model portfolio of high-quality fixed-income debt instruments with durations that are consistent with the expected cash flows of the benefit obligations.
Second, the Company must determine the expected long-term rate of return on assets assumption that is used to determine the expected return on plan assets component of the net periodic pension cost for the subsequent period. The expected long-term rate of return on asset assumption was determined, with the assistance of the Company’s investment consultants, based on a variety of factors. These factors include, but are not limited to, the plan’s asset allocations, a review of historical capital market performance, historical plan performance, current market factors such as inflation and interest rates, and a forecast of expected future asset returns. The Company reviews this long-term assumption on an annual basis.
As a result of the defined benefit plans having a frozen status, no additional benefits will be accrued for active participants under the plan, and accordingly no assumption will be made for the rate of increase in compensation levels in the future.
The Components of net periodic pension cost recognized in the consolidated statements of operations for the year ended September 30, 2010 were as follows:
| (in millions) |
2010 | |||
| Interest cost |
2.0 | |||
| Less expected return on plan assets |
(1.7 | ) | ||
| Net periodic pension cost |
$ | 0.3 | ||
Plan Assets
The following table sets forth the actual asset allocation as of September 30, 2010 and 2009, and the target asset allocation for the Company’s plan assets:
| September 30, | ||||||||||||
| 2010 | 2009 | Target Asset Allocation | ||||||||||
| Equity securities |
70 | % | 66 | % | 65% to 75% | |||||||
| Debt Securities |
30 | % | 34 | % | 25% to 35% | |||||||
| Total |
100 | % | 100 | % | ||||||||
The long-term goal for equity exposure and for fixed income exposure is presented above. The exact allocation at any point in time is at the discretion of the investment manager, but should recognize the need to satisfy both the volatility and the rate of return objectives for equity exposure and satisfy the objective of preserving capital for the fixed income exposure.
F - 41
INTERNATIONAL ASSETS HOLDING CORPORATION
Notes to Consolidated Financial Statements—(Continued)
The investment philosophy of the Company’s pension plans reflect that over the long-term, the risk of owning equities has been and should continue to be rewarded with a greater return than that available from fixed income investments. The primary objective is for the plan to achieve a minimum average total rate of return of four percentage points above the rate of inflation.
Investments in the Company’s pension plans include debt and equity securities. The fair value of plan assets is based upon the fair value of the underlying investments, which include cash equivalents, common stocks, U.S. government securities and federal agency obligations, municipal and corporate bonds, and equity funds. Cash equivalents consist of short-term money market funds that are stated at cost, which approximates fair value. The shares of common stock, U.S. government securities and federal agency obligations, municipal and corporate bonds are stated at estimated fair value based upon quoted market prices, if available, or dealer quotes. The equity funds are investment vehicles valued using the net asset value (“NAV”) provided by the administrator of the fund. The NAV is based on the underlying assets owned by the fund, minus its liabilities, and then divided by the number of shares outstanding.
The methods described above may produce a fair value calculation that may not be indicative of net realizable value or reflective of future fair values. Furthermore, while the Company believes the valuation methods are appropriate and consistent with other market participants, the use of different methodologies or assumptions to determine the fair value of certain financial instruments could result in a different fair value measurement at the reporting date.
Equity securities did not include any International Assets Holding Corporation common stock at September 30, 2010. The following table summarizes the Company’s pension assets by major category of plan assets measured at fair value on a recurring basis (at least annually) as of September 30, 2010. For additional information and a detailed description of each level within the fair value hierarchy, see Note 6.
| September 30, 2010 | ||||||||||||||||
| (in millions) |
Level 1 | Level 2 | Level 3 | Total | ||||||||||||
| Assets: |
||||||||||||||||
| Cash and cash equivalents |
$ | 0.1 | 0.5 | $ | 0.6 | |||||||||||
| Fixed Income |
— | |||||||||||||||
| Government & Agencies |
3.3 | 3.3 | ||||||||||||||
| Municipal Bonds |
0.6 | 0.6 | ||||||||||||||
| Corporate Bonds & Notes |
2.7 | 2.7 | ||||||||||||||
| Mutual Funds |
0.2 | 0.2 | ||||||||||||||
| Equity Collective Funds |
— | |||||||||||||||
| Large Cap |
12.3 | 12.3 | ||||||||||||||
| International |
3.2 | 3.2 | ||||||||||||||
| Real Estate Collective Fund |
— | |||||||||||||||
| Real Estate |
1.3 | 1.3 | ||||||||||||||
| Total |
$ | 0.3 | 22.6 | 1.3 | $ | 24.2 | ||||||||||
Cash and cash equivalents are mostly comprised of short-term money market instruments and the valuation is based on inputs derived from observable market data of related assets.
Fixed Income: These securities primarily include debt issued by the U.S. Department of Treasury and securities issued or backed by U.S. government sponsored entities and municipal bonds. These investments are valued utilizing a market approach that includes various valuation techniques and sources such as, broker quotes in active and non-active markets, benchmark yields and securities, reported trades, issuer spreads, and/or other applicable reference data and are generally classified within Level 2.
Corporate Bonds & Notes: Securities in this category primarily include fixed income securities issued by domestic and foreign corporations. These investments are valued utilizing a market approach that includes various valuation techniques and sources such as value generation models, broker quotes in active and non-active markets, benchmark yields and securities, reported trades, issuer spreads, and/or other applicable reference data, and are generally classified as Level 2.
Mutual Funds—Mutual funds held by the Company’s plans are primarily invested in mutual funds with underlying common stock investments. The fair value of these investments is based on the net asset value of the units held in the respective fund which are determined by obtaining quoted prices on nationally recognized securities exchanges.
Equity Collective Funds: These collective investment funds are unregistered investment vehicles that invest in portfolios of stocks, bonds, or other securities. The value of equity collective funds is based upon review of the audited statement of the funds. Substantially all of the underlying investments in the funds were either Level 1 or Level 2 investments. As such, the plan has classified the investment in the funds (which is not exchange traded) as Level 2 investments.
F - 42
INTERNATIONAL ASSETS HOLDING CORPORATION
Notes to Consolidated Financial Statements—(Continued)
Real Estate Collective Fund: This collective investment fund is unregistered investment vehicles that invest in portfolios of real estate investment trusts. The value of the real estate fund is based upon review of the audited statement of the fund, substantially all of the underlying investments in the fund are Level 3 investments. As such, plans have classified the investment in the funds (which is not exchange traded) as Level 3 investments.
The following table summarizes the changes in the Company’s Level 3 pension assets for the twelve months ended September 30, 2010:
| (in millions) |
Real Estate | |||
| Balance as of September 30, 2009 |
$ | 1.3 | ||
| Purchases, sales, issuances and settlements, net |
— | |||
| Unrealized gains/(losses), net, relating to instruments still held at year end |
— | |||
| Balance as of September 30, 2010 |
$ | 1.3 | ||
The Company expects to contribute approximately $0.8 million to the pension plans during fiscal 2010, which represents the minimum funding requirement. However, the Company is currently determining what voluntary pension plan contributions, if any, will be made in fiscal 2011.
The following benefit payments, which reflect expected future service, are expected to be paid:
| Year ending September 30, (In millions) |
||||
| 2011 |
$ | 3.0 | ||
| 2012 |
3.2 | |||
| 2013 |
3.1 | |||
| 2014 |
2.4 | |||
| 2015 - 2020 |
12.9 | |||
| $ | 24.6 | |||
Defined Contribution Retirement Plans
Effective December 31, 2009, the Company discontinued its Savings Incentive Match Plan for Employees IRA (“SIMPLE IRA”), which allowed participating U.S. employees of International Assets Holding Corporation to contribute up to 100% of their salary, but not more than statutory limits. The Company contributed a dollar for each dollar of a participant’s contribution to this plan, up to a maximum contribution of 3% of a participant’s earnings. Under the SIMPLE IRA, employees are 100% vested in both the employee and employer contributions at all times.
U.K. based employees of International Assets Holding Corporation are eligible to participate in a defined contribution pension plan. The Company contributes double the employee’s contribution up to 10% of total base salary for this plan. For this plan, employees are 100% vested in both the employee and employer contributions at all times.
The Company offers participation in the International Assets Holding Corporation 401(k) Plan (“401(k) Plan”), a defined contribution plan providing retirement benefits, to all domestic employees who have reached 21 years of age, and provided four months of service to the Company. Employees may contribute from 1% to 80% of their annual compensation to the 401(k) Plan, limited to a maximum annual amount as set periodically by the Internal Revenue Service. The Company makes matching contributions to the 401(k) Plan in an amount equal to 62.5% of each participant’s eligible elective deferral contribution to the 401(k) Plan, up to 8%. Matching contributions vest, by participant, based on the following years of service schedule: less than two years – none, two to three years – 20%, three to four years – 40%, four to five years – 60%, and greater than five years – 100%.
For fiscal years 2010, 2009 and 2008, the Company’s contribution to these defined contribution plans were $2.1 million, $0.5 million, and $0.5 million, respectively.
F - 43
INTERNATIONAL ASSETS HOLDING CORPORATION
Notes to Consolidated Financial Statements—(Continued)
Note 20 – Preferred Stock
The Company is authorized to issue one million shares of its preferred stock at a par value of $.01 per share. As of September 30, 2010 and 2009, no preferred shares were outstanding and the Board of Directors had not yet determined the specific rights and privileges of these shares.
Note 21 – Taxes
Income tax expense for the years ended September 30, 2010, 2009 and 2008 as follows:
| (In millions) Year Ended September 30, |
2010 | 2009 | 2008 | |||||||||
| Income tax expense (benefit) attributable to income (loss) from continuing operations |
$ | 6.4 | $ | 2.6 | $ | 16.2 | ||||||
| Income tax expense (benefit) attributable to loss from discontinued operations |
0.6 | 0.1 | 0.6 | |||||||||
| Income tax expense (benefit) attributable to income (loss) from extraordinary gain (loss) |
5.8 | — | — | |||||||||
| Taxes allocated to stockholders’ equity, related to unrealized gains on available-for-sale securities |
0.1 | — | — | |||||||||
| Taxes allocated to stockholders’ equity, related to pension liabilities |
(1.1 | ) | — | — | ||||||||
| Taxes allocated to stockholders’ equity, related to unrealized loss on derivatives |
0.7 | (1.2 | ) | — | ||||||||
| Income tax expense |
$ | 12.5 | $ | 1.5 | $ | 16.8 | ||||||
The components of the provision for income taxes were as follows:
| (In millions) Year Ended September 30, |
2010 | 2009 | 2008 | |||||||||
| Current Taxes: |
||||||||||||
| U.S. Federal |
$ | — | $ | 1.7 | $ | 5.7 | ||||||
| U.S. State and Local |
0.4 | 0.2 | 0.6 | |||||||||
| International |
4.8 | 4.4 | 2.1 | |||||||||
| Current taxes |
5.2 | 6.3 | 8.4 | |||||||||
| Deferred taxes |
1.2 | (3.7 | ) | 7.8 | ||||||||
| Income tax expense |
$ | 6.4 | $ | 2.6 | $ | 16.2 | ||||||
U.S. and international components of income before income taxes was as follows:
| (In millions) Year Ended September 30, |
2010 | 2009 | 2008 | |||||||||
| U.S. |
$ | 4.4 | $ | (4.8 | ) | $ | 37.0 | |||||
| International |
13.5 | 18.1 | 5.3 | |||||||||
| Income from operations, before tax |
$ | 17.9 | $ | 13.3 | $ | 42.3 | ||||||
F - 44
INTERNATIONAL ASSETS HOLDING CORPORATION
Notes to Consolidated Financial Statements—(Continued)
Items accounting for the difference between income taxes computed at the federal statutory rate and the provision for income taxes were as follows:
| Year Ended September 30, |
2010 | 2009 | 2008 | |||||||||
| Federal statutory rate Effect of: |
35.0 | % | 34.0 | % | 34.0 | % | ||||||
| U.S. State income taxes |
2.9 | % | (1.4 | )% | 3.1 | % | ||||||
| Foreign earnings taxed at (lower) higher rates |
(7.0 | )% | (13.7 | )% | 0.7 | % | ||||||
| Change in valuation allowance |
5.0 | % | 0.0 | % | 0.0 | % | ||||||
| Stock-based compensation expense |
0.0 | % | 3.4 | % | 0.3 | % | ||||||
| Non-deductible meals and entertainment |
(0.8 | )% | 0.4 | % | 0.1 | % | ||||||
| Other reconciling items |
0.5 | % | (2.8 | )% | (0.4 | )% | ||||||
| Effective rate |
35.6 | % | 19.9 | % | 37.8 | % | ||||||
F - 45
INTERNATIONAL ASSETS HOLDING CORPORATION
Notes to Consolidated Financial Statements—(Continued)
The components of deferred income tax assets and liabilities were as follows:
| (In millions) September 30, |
2010 | 2009 | ||||||
| Deferred tax assets: |
||||||||
| Stock-based compensation expense |
$ | 1.7 | $ | 1.7 | ||||
| Pension liability |
5.2 | 7.2 | ||||||
| Deferred compensation |
4.4 | 5.3 | ||||||
| State net operating loss carryforwards |
5.4 | 7.3 | ||||||
| Intangible assets |
3.1 | 3.5 | ||||||
| Partnership tax basis timing difference |
1.2 | 1.1 | ||||||
| Unrealized loss on derivatives |
0.6 | 1.4 | ||||||
| Fixed assets |
— | 0.7 | ||||||
| Bad debt reserve |
2.4 | 2.3 | ||||||
| Foreign tax credit |
1.3 | 0.5 | ||||||
| Other |
1.8 | 1.4 | ||||||
| Total gross deferred tax assets |
27.1 | 32.4 | ||||||
| Less valuation allowance |
(2.6 | ) | — | |||||
| Deferred tax assets |
$ | 24.5 | $ | 32.4 | ||||
| Deferred income tax liabilities: |
||||||||
| Unrealized gain on securities |
$ | 1.6 | $ | 1.6 | ||||
| Prepaid expenses |
1.4 | 1.2 | ||||||
| Fixed assets |
0.5 | — | ||||||
| Deferred income tax liabilities |
$ | 3.5 | $ | 2.8 | ||||
| Net deferred tax assets |
$ | 21.0 | $ | 29.6 | ||||
Deferred income tax balances reflect the effects of temporary differences between the carrying amounts of assets and liabilities and their tax bases and are stated at enacted tax rates expected to be in effect when taxes are actually paid or recovered.
The Company collected $37.1 million during 2010, relating to the net operating loss of FCStone Group, Inc. for its fiscal year ended August 31, 2009. The Company elected to carry back the net operating loss to recapture taxes paid in the prior two fiscal years.
At September 30, 2010 and 2009, respectively, the Company has net operating loss carryforwards for state income tax purposes of $2.8 million and $4.4 million, net of valuation allowances, which are available to offset future state taxable income. The net operating loss carryforwards expire in tax years ending in 2020 through 2030.
The valuation allowance for deferred tax assets as of September 30, 2010 was $2.6 million. The net change in the total valuation allowance for the year ended September 30, 2010 was an increase of $2.6 million. No valuation allowance existed in 2009 and 2008. The valuation allowance at September 30, 2010 was primarily related to state and foreign net operating loss carryforwards that, in the judgment of management, are not more likely than not to be realized. In assessing the realizability of deferred tax assets, management considers whether it is more likely than not that some or all of the deferred tax assets will not be realized.
The total amount of undistributed earnings in the Company’s foreign subsidiaries, for income tax purposes, was approximately $45.9 million at September 30, 2010. It is the Company’s current intention to reinvest undistributed earnings of its foreign subsidiaries in the foreign jurisdictions, resulting in the indefinite postponement of the remittance of those earnings. Accordingly, no provision has been made for foreign withholding taxes or United States income taxes which may become payable if undistributed earnings of foreign subsidiaries were paid as dividends to the Company. For the same reason, it is not practicable to calculate the unrecognized deferred tax liability on those earnings.
In June 2006, the FASB issued guidance under the Income Taxes Topic of the ASC clarifying the accounting for uncertainty in income taxes recognized in an enterprise’s financial statements. This guidance prescribes a recognition threshold and measurement attribute for the financial statement recognition and measurement of a tax position taken or expected to be taken in a tax return. This guidance also provides guidance on derecognition, classification, interest and penalties, accounting in interim periods, disclosure, and transition. The Company adopted the guidance on October 1, 2007 and was not required to record any cumulative effect adjustment to retained earnings as a result of this adoption. The Company recognizes potential interest and penalties as a component of income tax expense. The Company did not have any uncertain tax positions at September 30, 2010 and 2009.
The Company and its subsidiaries file income tax returns with the U.S. federal jurisdiction, various states, and various foreign jurisdictions. The Internal Revenue Service has commenced an examination of FCStone’s U.S. income tax return for its fiscal year ended August 31, 2009, and additionally FCStone is under examination with several states for various periods, ranging from its fiscal year ended August 31, 2006 through September 30, 2009.
F - 46
INTERNATIONAL ASSETS HOLDING CORPORATION
Notes to Consolidated Financial Statements—(Continued)
Note 22 – Discontinued Operations
Effective May 1, 2010, the Company sold its interest in INTL Capital Limited (“INTL Capital”) to an independent third party for a purchase price equal to book value. The subsidiary operated an asset management business in Dubai. The results of operations for INTL Capital, which were previously included within the other segment, are included within discontinued operations on the consolidated income statements for all periods presented. For 2010, the Company recorded a loss, net of tax, related to INTL Capital of $0.7 million within discontinued operations.
At December 31, 2009, the Company owned 80% of the shares outstanding of Agora-X, LLC (“Agora”) and the Company’s consolidated balance sheet and income statement at December 31, 2009, reflected the Company’s consolidation of Agora. On February 12, 2010 the Company and NASDAQ OMX (“NASDAQ”), the noncontrolling interest holder prior to this purchase transaction, signed a restructuring agreement, effective January 1, 2010, whereby NASDAQ acquired an additional 65% interest in Agora in exchange for an investment of $6.6 million. In accordance with the Consolidation Topic of the ASC, since the Company no longer had a controlling financial interest, it deconsolidated the subsidiary from the date of the agreement. The Company had retained a 15% noncontrolling ownership interest in Agora. The Company recorded its retained 15% noncontrolling interest under the equity method, in accordance with the guidance in the Investments – Equity Method and Joint Ventures Topic of the ASC. On June 10, 2010, the board of directors of Agora agreed to discontinue the operations of the entity. In evaluating the fair value of the Company’s investment in Agora, during the third quarter of fiscal year 2010, it was determined that its carrying value would no longer be recoverable and was in fact impaired. The Company wrote down its investment in Agora to zero, which resulted in a $0.5 million impairment charge. Since the discontinuation of operations of Agora occurred within the one year assessment period, beginning with the Company’s loss of controlling interest, the Company determined that Agora had met the criteria established with the guidance in the Presentation of Financial Statements – Discontinued Operations Topic of the ASC for reporting discontinued operations. In accordance with the guidance, the results of Agora, including the Company’s 15% share of the losses and impairment charge for the remaining investment in Agora from January 1, 2010 through September 30, 2010, are included within discontinued operations, net of tax, on the consolidated income statements for 2010. For fiscal 2010, the Company recorded a pre-tax gain of $1.9 million and a gain, net of tax, related to Agora of $1.3 million, respectively, within discontinued operations.
On May 8, 2009, the Company agreed to redeem its partnership interest in INTL Consilium, LLC (“INTL Consilium”), effective April 30, 2009. The results of INTL Consilium, which were previously included within the asset management and other segment, are included within discontinued operations on the consolidated income statements for all periods presented.
On August 1, 2008, the Company notified the employees of its Hong Kong subsidiary, INTL Global Currencies (Asia) Ltd., of its intention to discontinue its foreign exchange margin trading operations. The Company incurred losses before taxes of $2.4 million and $0.2 million in this subsidiary during fiscal years 2008 and 2007, respectively. The Company realized a tax benefit of $1.0 million for the 2008 fiscal year. The results of operations for INTL Global Currencies (Asia) Ltd. which were previously included in the foreign exchange trading segment, are included within discontinued operations on the consolidated income statement for all periods presented.
Note 23 – Subsequent Events
On October 1, 2010, the Company acquired 100 percent of the ownership interests in Hencorp Becstone Futures, L.C. (“Hencorp Futures”), the futures operation of Miami-based Hencorp Group. Hencorp Futures specializes in the development and execution of risk-management programs designed to hedge price volatility in a number of widely traded commodities, including coffee, sugar, cocoa, grains and energy products. The transaction will enable the Company to round out its portfolio of commodity risk management services to include a more robust capability in soft commodities, especially coffee, where Hencorp Futures has established a substantial presence and reputation globally, and especially in Central and South America. The purchase price consisted of an initial payment of $2.3 million, four contingent payments which will be based on Hencorp Futures’ net income for each of the four years after the closing and a final contingent payment based on the average net income of the second, third and fourth years.
On December 14, 2010, the Company received a conversion notice from the holder of $3.7 million in principal amount of the Company’s Notes. The holder intends to convert the principal balance of $3.7 million and accrued interest of $0.1 million at the current conversion price of $21.79 into 173,966 shares of common stock of the Company. The remaining balance of the Notes is $13 million.
F - 47
INTERNATIONAL ASSETS HOLDING CORPORATION
Notes to Consolidated Financial Statements—(Continued)
Note 24 – Quarterly Financial Information (Unaudited)
The Company has set forth certain quarterly unaudited financial data for the past two years in the table below:
| (In millions, except per share amounts) Quarter Ended |
December 31 | March 31 | June 30 | September 30 | ||||||||||||
| Fiscal Year 2010 |
||||||||||||||||
| Operating revenues |
$ | 59.6 | $ | 65.4 | $ | 78.1 | $ | 65.9 | ||||||||
| Interest expense |
2.5 | 2.3 | 2.7 | 2.4 | ||||||||||||
| Net revenues |
57.1 | 63.1 | 75.4 | 63.5 | ||||||||||||
| Total non-interest expenses |
57.6 | 53.4 | 62.0 | 68.2 | ||||||||||||
| (Loss) income from operations, before tax |
(0.5 | ) | 9.7 | 13.4 | (4.7 | ) | ||||||||||
| Income tax (benefit) expense |
(0.2 | ) | 3.5 | 4.8 | (1.7 | ) | ||||||||||
| Net (loss) income before discontinued operations |
(0.3 | ) | 6.2 | 8.6 | (3.0 | ) | ||||||||||
| Loss (income) from discontinued operations |
0.8 | (1.2 | ) | 1.1 | (1.3 | ) | ||||||||||
| Net (loss) income before extraordinary items |
(1.1 | ) | 7.4 | 7.5 | (1.7 | ) | ||||||||||
| Extraordinary loss (gain) |
3.4 | — | 0.8 | 2.8 | ||||||||||||
| Net (loss) income |
(4.5 | ) | 7.4 | 6.7 | (4.5 | ) | ||||||||||
| Less: Net income attributable to the noncontrolling interest |
(0.3 | ) | — | — | — | |||||||||||
| Net (loss) income attributable to International Assets Holding Corporation common shareholders |
$ | (4.2 | ) | $ | 7.4 | $ | 6.7 | $ | (4.5 | ) | ||||||
| Net basic earnings (loss) per share |
$ | (0.25 | ) | $ | 0.43 | $ | 0.39 | $ | (0.26 | ) | ||||||
| Net diluted earnings (loss) per share |
$ | (0.25 | ) | $ | 0.41 | $ | 0.38 | $ | (0.26 | ) | ||||||
| Fiscal Year 2009 |
||||||||||||||||
| Operating revenues |
$ | 28.3 | $ | 26.0 | $ | 22.9 | $ | 13.4 | ||||||||
| Interest expense |
2.4 | 2.3 | 1.6 | 1.7 | ||||||||||||
| Net revenues |
25.9 | 23.7 | 21.3 | 11.7 | ||||||||||||
| Total non-interest expenses |
19.8 | 17.9 | 16.1 | 15.5 | ||||||||||||
| (Loss) income from operations, before tax |
6.1 | 5.8 | 5.2 | (3.8 | ) | |||||||||||
| Income tax expense |
2.5 | 0.9 | 1.4 | (2.2 | ) | |||||||||||
| Net (loss) income before discontinued operations |
3.6 | 4.9 | 3.8 | (1.6 | ) | |||||||||||
| Loss from discontinued operations |
0.2 | 0.5 | 0.2 | 0.2 | ||||||||||||
| Net (loss) income before extraordinary items |
3.4 | 4.4 | 3.6 | (1.8 | ) | |||||||||||
| Extraordinary (gain) loss |
— | — | — | (18.5 | ) | |||||||||||
| Net income |
3.4 | 4.4 | 3.6 | 16.7 | ||||||||||||
| Less: Net loss attributable to the noncontrolling interest |
0.1 | 0.4 | — | — | ||||||||||||
| Net income attributable to International Assets Holding Corporation common shareholders |
$ | 3.3 | $ | 4.0 | $ | 3.6 | $ | 16.7 | ||||||||
| Net basic earnings per share |
$ | 0.37 | $ | 0.46 | $ | 0.41 | $ | 1.87 | ||||||||
| Net diluted earnings per share |
$ | 0.35 | $ | 0.44 | $ | 0.38 | $ | 1.62 | ||||||||
During the fourth quarter of fiscal year 2010, the Company made an adjustment between loss (income) from discontinued operations and extraordinary loss (gain). Additionally, see discussion in Note 17 of purchase accounting adjustments and corrections of immaterial errors that impacted extraordinary loss (gain) for the respective quarters during fiscal year 2010.
Note 25 – Segment Information
Prior to the acquisition of FCStone in September 2009, the Company’s activities were divided into five reportable segments: International Equities Market-making, Foreign Exchange Trading, Commodities Trading, International Debt Capital Markets and Asset Management. FCStone divided its activities into four reportable segments, which consisted of Commodity and Risk Management Services, Clearing and Execution Services, Financial Services, and a Corporate and Other segment. The Company revised its segment reporting as a result of the FCStone acquisition, and the Company’s activities are now divided into the following five functional areas:
| • | Commodity and Risk Management Services |
| • | Foreign Exchange |
| • | Securities |
| • | Clearing and Execution Services |
| • | Other |
F - 48
INTERNATIONAL ASSETS HOLDING CORPORATION
Notes to Consolidated Financial Statements—(Continued)
To conform to the current segment presentation, the Company has reclassified certain prior period amounts. The consolidated income statements of the Company for fiscal 2009 and 2008 reflect the results of the Company prior to the FCStone transaction, as reclassified to conform to the current presentation.
Segment results include allocated intersegment interest charges.
Commodity and Risk Management Services (“C&RM”)
The Company serves its commercial customers through its force of 119 risk management consultants with a high value added service that differentiates us from other competitors and maximizes the opportunity to retain customers. The Integrated Risk Management Program (“IRMP”) involves providing customers with commodity risk management consulting services that are designed to develop a customized long term hedging program to help them mitigate their exposure to commodity price risk and maximize the amount and certainty of their operating profits. Customers are assisted in the execution of their hedging strategies through the Company’s exchange-traded futures and options clearing and execution operations and through access to more customized alternatives provided by the OTC trading desk. Generally, customers direct their own trading activity and risk management consultants do not have discretionary authority to transact trades on behalf of customers. When transacting OTC contracts with customers, the Company may offset the customer’s transaction simultaneously with one of its trading counterparties. Alternatively, the OTC trade desk will accept a customer transaction and offset that transaction with a similar but not identical position on the exchange. These unmatched transactions are intended to be short-term in nature and are conducted to facilitate the most effective transaction for customers.
In addition, the Company provides a full range of trading and hedging capabilities to select producers, consumers, recyclers and investors in precious metals and certain base metals. Acting as a principal, the Company commits its own capital to buy and sell the metals on a spot and forward basis.
The Company records its physical commodities revenues on a gross basis. Operating revenues and losses from the Company’s commodities derivatives activities are recorded in ‘Trading gains’. Inventory for the commodities business is valued at the lower of cost or fair value under the provisions of the Inventory Topic of the ASC. The Company generally mitigates the price risk associated with commodities held in inventory through the use of derivatives. The Company does not elect hedge accounting under U.S. GAAP in accounting for this price risk mitigation. In such situations, unrealized gains in inventory are not recognized under U.S. GAAP, but unrealized gains and losses in related derivative positions are recognized under U.S. GAAP. As a result, the Company’s reported earnings from commodities trading may be subject to significant volatility when calculated under U.S. GAAP.
The C&RM segment combines FCStone’s Commodity and Risk Management Services segment with the activities previously reported in the Company’s Commodities Trading segment.
Foreign Exchange
The Company provides treasury, global payment and foreign exchange services to financial institutions, multi-national corporations, government organizations and charitable organizations as well as assisting commercial customers with the execution of foreign exchange hedging strategies. The Company transacts in over 130 currencies and specializes in smaller, more difficult emerging markets where there is limited liquidity. In addition, the Company executes trades based on the foreign currency flows inherent in the Company’s existing business activities. The Company primarily acts as a principal in buying and selling foreign currencies on a spot basis. The Company derives revenue from the difference between the purchase and sale prices.
The Company also provides spot foreign currency trading for a customer base of eligible contract participants and high net worth retail customers as well as operating a proprietary foreign exchange desk which arbitrages the futures and cash markets.
The foreign exchange segment combines the activities previously reported in the Company’s Foreign Exchange trading segment and FCStone’s foreign exchange activity which had been reported in its Commodity and Risk Management Services segment.
Securities
Through INTL Trading, the Company acts as a wholesale market maker in select foreign securities including unlisted ADRs and foreign ordinary shares. INTL Trading provides execution and liquidity to national broker-dealers, regional broker-dealers and institutional investors.
The Company provides a full range of investment banking advisory services to commercial customers including the issue of loans or equity. On occasions, the Company may invest its own capital in debt instruments before selling them into the market.
F - 49
INTERNATIONAL ASSETS HOLDING CORPORATION
Notes to Consolidated Financial Statements—(Continued)
The Securities segment combines the activities previously reported in the Company’s International Equities Market-Making and International Debt Capital Markets segments.
Clearing and Execution Services (“CES”)
The Company seeks to provide competitive and efficient clearing and execution of exchange-traded futures and options for the institutional and professional trader market segments. Through its platform, customer orders are accepted and directed to the appropriate exchange for execution. The Company then facilitates the clearing of customers’ transactions. Clearing involves the matching of customers’ trades with the exchange, the collection and management of margin deposits to support the transactions, and the accounting and reporting of the transactions to customers. The Company seeks to leverage its capabilities and capacity by offering facilities management or outsourcing solutions to other Futures Commission Merchants (“FCM”).
Other
This segment combines activities previously reported in the Company’s Asset Management segment and in FCStone’s Financial Services and Corporate and Other segments.
The asset management revenues include fees, commissions and other revenues received by the Company for management of third party assets and investment gains or losses on the Company’s investments in funds and proprietary accounts managed either by the Company’s investment managers or by independent investment managers.
The Company serves as a grain financing and facilitation business lending to commercial grain-related companies against physical grain inventories. Sale and repurchase agreements are used to purchase grain evidenced by warehouse receipts at local grain elevators subject to a simultaneous agreement to sell such grain back to the original seller at a later date. These transactions are accounted for as product financing arrangements, and accordingly no grain inventory, grain purchases or grain sales are recorded. The Company also serves as a financing vehicle for a number of different commodities, including grain, energy products and renewable fuels.
The total revenues reported combine gross revenues for the physical commodities business and net revenues for all other businesses. In order to reflect the way that the Company’s management views the results, the tables below also reflect the segmental contribution to ‘Operating revenues’, which is shown on the face of the consolidated income statements and which is calculated by deducting physical commodities cost of sales from total revenues.
Segment data includes the profitability measure of net contribution by segment. Net contribution is one of the key measures used by management to assess the performance of each segment and for decisions regarding the allocation of the Company’s resources. Net contribution is calculated as revenue less direct cost of sales, clearing and related expenses, and variable compensation. Variable compensation paid to traders generally represents a fixed percentage of an amount equal to revenues produced less clearing and related charges, base salaries and an overhead allocation.
The segment data also includes segment income which is calculated as net contribution less certain non-variable direct expenses of the segment. These non-variable direct expenses include trader base compensation and benefits, operational employee compensation and benefits, communication and data services, travel, professional fees, bad debt expense and other direct expenses.
Inter-segment revenues, charges, receivables and payables are eliminated upon consolidation, except revenues and costs related to foreign currency transactions undertaken on an arm’s length basis by the foreign exchange trading business for the securities business. The foreign exchange trading business competes for this business as it does for any other business. If its rates are not competitive, the securities businesses buy or sell their foreign currency through other market counter-parties.
The total revenues reported combine gross revenues for the commodities business and net revenues for all other businesses. In order to reflect the way that the Company’s management views the results, the tables below also reflect the segmental contribution to ‘Operating revenues’, which is shown on the face of the consolidated income statements and which is calculated by deducting physical commodities cost of sales from total revenues.
Segment data includes the profitability measure of net contribution by segment. Net contribution is one of the key measures used by management to assess the performance of each segment and for decisions regarding the allocation of the Company’s resources. Net contribution is calculated as revenue less direct cost of sales, clearing and clearing related charges and variable trader bonus compensation. Variable trader bonus compensation represents a fixed percentage of an amount equal to revenues produced less clearing and related charges, base salaries and an overhead allocation.
F - 50
INTERNATIONAL ASSETS HOLDING CORPORATION
Notes to Consolidated Financial Statements—(Continued)
Inter-segment revenues, charges, receivables and payables are eliminated between segments, except revenues and costs related to foreign currency transactions undertaken on an arm’s length basis by the foreign exchange trading business for the equity, commodities trading and debt trading businesses. The foreign exchange trading business competes for this business as it does for any other business. If its rates are not competitive the equity, commodities trading and debt trading businesses buy or sell their foreign currency through other market counter-parties. The profit or loss made by the foreign exchange trading business on these transactions is not quantifiable.
Information concerning operations in these segments of business is shown in accordance with the Segment Reporting Topic of the ASC as follows:
| Year Ended September 30, | ||||||||||||
| (in millions) |
2010 | 2009 | 2008 | |||||||||
| Total revenues: |
||||||||||||
| Commodity and risk management services |
$ | 46,785.2 | $ | 43,532.3 | $ | 18,282.7 | ||||||
| Foreign exchange |
47.5 | 30.3 | 24.2 | |||||||||
| Securities |
20.8 | 39.1 | 38.2 | |||||||||
| Clearing and execution services |
61.8 | — | — | |||||||||
| Other |
24.8 | 3.4 | 0.6 | |||||||||
| Corporate unallocated |
0.2 | (1.4 | ) | 0.7 | ||||||||
| Total |
$ | 46,940.3 | $ | 43,603.7 | $ | 18,346.4 | ||||||
| Operating revenues: |
||||||||||||
| Commodity and risk management services |
$ | 129.8 | $ | 19.2 | $ | 51.2 | ||||||
| Foreign exchange |
47.5 | 30.3 | 24.2 | |||||||||
| Securities |
20.8 | 39.1 | 38.2 | |||||||||
| Clearing and execution services |
61.8 | — | — | |||||||||
| Other |
8.9 | 3.4 | 0.6 | |||||||||
| Corporate unallocated |
0.2 | (1.4 | ) | 0.7 | ||||||||
| Total |
$ | 269.0 | $ | 90.6 | $ | 114.9 | ||||||
| Net contribution (loss): |
||||||||||||
| (Revenues less cost of sales, clearing and related expenses, variable bonus compensation, introducing broker commissions and interest expense): |
||||||||||||
| Commodity and risk management services |
$ | 70.9 | $ | 10.1 | $ | 40.9 | ||||||
| Foreign exchange |
28.0 | 20.3 | 16.5 | |||||||||
| Securities |
11.4 | 22.9 | 21.5 | |||||||||
| Clearing and execution services |
10.7 | — | — | |||||||||
| Other |
7.1 | 1.2 | (2.1 | ) | ||||||||
| Total |
$ | 128.1 | $ | 54.5 | $ | 76.8 | ||||||
| Net segment income (loss): |
||||||||||||
| (Operating revenues less interest expense and direct costs allocated to segments): |
||||||||||||
| Commodity and risk management services |
$ | 34.4 | $ | 2.1 | $ | 35.7 | ||||||
| Foreign exchange |
22.0 | 15.6 | 11.7 | |||||||||
| Securities |
5.3 | 19.0 | 18.3 | |||||||||
| Clearing and execution services |
1.4 | — | — | |||||||||
| Other |
4.1 | (0.7 | ) | (3.6 | ) | |||||||
| Total |
$ | 67.2 | $ | 36.0 | $ | 62.1 | ||||||
| Reconciliation of segment income (loss) to income (loss) from operations before tax: |
||||||||||||
| Net contribution allocated to segments |
$ | 67.2 | $ | 36.0 | $ | 62.1 | ||||||
| Costs not allocated to operating segments |
49.3 | 22.7 | 19.8 | |||||||||
| Income (loss) from operations, before tax |
$ | 17.9 | $ | 13.3 | $ | 42.3 | ||||||
| As of September 30, 2010 |
As of September 30, 2009 |
|||||||
| Total assets: |
||||||||
| Commodity and risk management services |
$ | 1,182.8 | $ | 699.4 | ||||
| Foreign exchange |
64.8 | 38.4 | ||||||
| Securities |
49.5 | 50.3 | ||||||
| Clearing and execution services |
647.7 | 708.7 | ||||||
| Other |
30.8 | 23.3 | ||||||
| Corporate unallocated |
46.1 | 35.6 | ||||||
| Total |
$ | 2,021.7 | $ | 1,555.7 | ||||
F - 51
INTERNATIONAL ASSETS HOLDING CORPORATION
CONDENSED BALANCE SHEETS
Parent Company Only
(in millions)
| September 30, |
2010 | 2009 | ||||||
| ASSETS | ||||||||
| Cash and cash equivalents |
$ | 0.4 | $ | — | ||||
| Receivables from subsidiaries |
81.2 | 74.6 | ||||||
| Income taxes receivable |
7.9 | 7.4 | ||||||
| Financial instruments owned, at fair value |
2.8 | — | ||||||
| Investments in subsidiaries |
206.9 | 206.2 | ||||||
| Deferred income taxes |
2.5 | 0.9 | ||||||
| Goodwill and intangible assets, net |
— | — | ||||||
| Other assets |
1.6 | 1.5 | ||||||
| Total assets |
$ | 303.3 | $ | 290.6 | ||||
| LIABILITIES AND EQUITY | ||||||||
| Liabilities: |
||||||||
| Accounts payable and other accrued liabilities |
$ | 4.8 | $ | 7.1 | ||||
| Payables to lenders under loans and overdrafts |
11.9 | 34.9 | ||||||
| Financial instruments sold, not yet purchased, at fair value |
60.8 | 24.8 | ||||||
| 77.5 | 66.8 | |||||||
| Convertible subordinated notes payable |
16.7 | 16.7 | ||||||
| Total liabilities |
94.2 | 83.5 | ||||||
| Equity: |
||||||||
| International Assets Holding Corporation shareholders’ equity: |
||||||||
| Preferred stock, $.01 par value. Authorized 1,000,000 shares; no shares issued or outstanding |
— | — | ||||||
| Common stock, $.01 par value. Authorized 30,000,000 shares; 17,612,792 issued and 17,601,535 outstanding at September 30, 2010 and 17,361,884 issued and 17,350,627 outstanding at September 30, 2009 |
0.2 | 0.2 | ||||||
| Common stock in treasury, at cost—11,257 shares at September 30, 2010 and September 30, 2009 |
(0.1 | ) | (0.1 | ) | ||||
| Additional paid-in capital |
184.6 | 187.0 | ||||||
| Retained earnings |
25.4 | 22.1 | ||||||
| Accumulated other comprehensive loss |
(1.0 | ) | (2.1 | ) | ||||
| Total equity |
209.1 | 207.1 | ||||||
| Total liabilities and equity |
$ | 303.3 | $ | 290.6 | ||||
S - 1
INTERNATIONAL ASSETS HOLDING CORPORATION
CONDENSED INCOME STATEMENTS
Parent Company Only
(in millions)
| Year Ended September 30, |
2010 | 2009 | 2008 | |||||||||
| Revenues: |
||||||||||||
| Trading gains |
$ | 2.5 | $ | (2.5 | ) | $ | 0.4 | |||||
| Commission and clearing fees |
0.9 | 0.3 | 0.1 | |||||||||
| Interest income |
1.7 | 0.3 | 0.7 | |||||||||
| Other income |
13.9 | 15.1 | 17.4 | |||||||||
| Total revenues |
19.0 | 13.2 | 18.6 | |||||||||
| Cost of sales of physical commodities |
— | — | — | |||||||||
| Operating revenues |
19.0 | 13.2 | 18.6 | |||||||||
| Interest expense |
6.3 | 3.9 | 3.1 | |||||||||
| Net revenues |
12.7 | 9.3 | 15.5 | |||||||||
| Non-interest expenses: |
||||||||||||
| Compensation and benefits |
10.2 | 10.7 | 5.7 | |||||||||
| Clearing and related expenses |
0.1 | 0.1 | — | |||||||||
| Communication and data services |
0.5 | 0.3 | 0.1 | |||||||||
| Introducing broker commissions |
0.2 | — | — | |||||||||
| Occupancy and equipment rental |
0.8 | 0.2 | 0.2 | |||||||||
| Professional fees |
1.3 | 0.9 | 0.8 | |||||||||
| Bad debts and impairments |
(1.1 | ) | 2.7 | 2.4 | ||||||||
| Other |
3.1 | 0.7 | 1.0 | |||||||||
| Total non-interest expenses |
15.1 | 15.6 | 10.2 | |||||||||
| Income (loss) from operations, before tax |
(2.4 | ) | (6.3 | ) | 5.3 | |||||||
| Income tax benefit |
(5.7 | ) | (5.1 | ) | (2.5 | ) | ||||||
| Income (loss) before extraordinary gain |
3.3 | (1.2 | ) | 7.8 | ||||||||
| Extraordinary gain |
— | (18.5 | ) | — | ||||||||
| Net income |
$ | 3.3 | $ | 17.3 | $ | 7.8 | ||||||
S - 2
INTERNATIONAL ASSETS HOLDING CORPORATION
CONDENSED STATEMENTS OF CASH FLOWS
Parent Company Only
(in millions)
| Year Ended September 30, |
2010 | 2009 | 2008 | |||||||||
| Cash flows from operating activities: |
||||||||||||
| Net income |
$ | 3.3 | $ | 17.3 | $ | 7.8 | ||||||
| Adjustments to reconcile net income to net cash used in operating activities: |
||||||||||||
| Deferred income taxes |
(1.6 | ) | 0.3 | 5.0 | ||||||||
| Amortization of debt issuance costs and debt discount |
0.2 | 0.2 | 0.3 | |||||||||
| Convertible debt interest settled in Company stock upon partial conversion |
— | — | 0.1 | |||||||||
| Amortization of stock-based compensation expense |
1.9 | 1.9 | 1.5 | |||||||||
| Extraordinary gain on acquisition of FCStone |
— | (18.5 | ) | — | ||||||||
| Impairment of INTL Sieramet, LLC |
(1.1 | ) | 1.1 | — | ||||||||
| Changes in operating assets and liabilities: |
||||||||||||
| Receivable from customers |
— | 3.8 | (3.7 | ) | ||||||||
| Receivables from subsidiaries |
(6.5 | ) | 12.5 | (50.2 | ) | |||||||
| Subordinated loan due from affiliate |
— | 1.0 | 0.1 | |||||||||
| Income taxes receivable |
(0.5 | ) | (7.4 | ) | (9.0 | ) | ||||||
| Financial instruments owned, at fair value |
(2.8 | ) | 0.3 | — | ||||||||
| Other assets |
(0.3 | ) | (2.5 | ) | — | |||||||
| Accounts payable and other accrued liabilities |
(1.3 | ) | 2.0 | 0.4 | ||||||||
| Income taxes payable |
— | (1.0 | ) | 3.0 | ||||||||
| Financial instruments sold, not yet purchased, at fair value |
37.1 | (18.3 | ) | 41.0 | ||||||||
| Net cash provided by (used in) operating activities |
28.4 | (7.3 | ) | (3.7 | ) | |||||||
| Cash flows from investing activities: |
||||||||||||
| Payments related to acquisition of Gainvest |
— | (1.4 | ) | (1.4 | ) | |||||||
| Payments related to acquisition of Provident |
(5.0 | ) | — | — | ||||||||
| Payments related to investments in subsidiaries |
(0.7 | ) | — | — | ||||||||
| Net cash used in investing activities |
(5.7 | ) | (1.4 | ) | (1.4 | ) | ||||||
| Cash flows from financing activities: |
||||||||||||
| Payable to lenders under loans and overdrafts |
(23.0 | ) | 3.8 | 6.5 | ||||||||
| Share repurchase |
— | (0.1 | ) | — | ||||||||
| Exercise of stock options |
0.7 | 0.4 | 1.4 | |||||||||
| Income tax benefit on stock awards exercised |
— | 0.3 | 1.3 | |||||||||
| Net cash (used in) provided by financing activities |
(22.3 | ) | 4.4 | 9.2 | ||||||||
| Net increase (decrease) in cash and cash equivalents |
0.4 | (4.3 | ) | 4.1 | ||||||||
| Cash and cash equivalents at beginning of period |
— | 4.3 | 0.2 | |||||||||
| Cash and cash equivalents at end of period |
$ | 0.4 | $ | — | $ | 4.3 | ||||||
| Supplemental disclosure of cash flow information: |
||||||||||||
| Cash paid for interest |
$ | 3.8 | $ | 3.9 | $ | 3.4 | ||||||
| Income taxes paid, net of refunds |
(1.7 | ) | $ | 6.4 | $ | 3.5 | ||||||
| Supplemental disclosure of non-cash investing and financing activities: |
||||||||||||
| Conversion of subordinated notes to common stock, net |
$ | — | $ | 0.1 | $ | 8.1 | ||||||
| Release of trust certificates |
$ | — | $ | — | $ | 11.2 | ||||||
| Issuance of common stock related to acquisitions |
$ | — | $ | 135.5 | $ | — | ||||||
S - 3