Attached files
| file | filename |
|---|---|
| EX-32.2 - SECTION 906 CFO CERTIFICATION - StoneX Group Inc. | intlexhibit3226302018.htm |
| EX-32.1 - SECTION 302 CFO CERTIFICATION - StoneX Group Inc. | intlexhibit3216302018.htm |
| EX-31.2 - SECTION 906 CEO CERTIFICATION - StoneX Group Inc. | intlexhibit3126302018.htm |
| EX-31.1 - SECTION 302 CEO CERTIFICATION - StoneX Group Inc. | intlexhibit3116302018.htm |
UNITED STATES
SECURITIES AND EXCHANGE COMMISSION
Washington, D.C. 20549
____________________
FORM 10-Q
____________________
(Mark One)
x | QUARTERLY REPORT PURSUANT TO SECTION 13 OR 15(d) OF THE SECURITIES EXCHANGE ACT OF 1934 |
OR
o | TRANSITION REPORT PURSUANT TO SECTION 13 OR 15(d) OF THE SECURITIES EXCHANGE ACT OF 1934 |
For the Transition Period From to
Commission File Number 000-23554
____________________
INTL FCStone Inc.
(Exact name of registrant as specified in its charter)
____________________
Delaware | 59-2921318 | |
(State or other jurisdiction of incorporation or organization) | (I.R.S. Employer Identification No.) | |
New York, NY 10017
(Address of principal executive offices) (Zip Code)
(212) 485-3500
(Registrant’s telephone number, including area code)
____________________
Indicate by check mark whether the registrant (1) has filed all reports required to be filed by Section 13 or 15(d) of the Securities Exchange Act of 1934 during the preceding 12 months (or for such shorter period that the registrant was required to file such reports), and (2) has been subject to such filing requirements for the past 90 days. Yes x No o
Indicate by check mark whether the registrant has submitted electronically and posted on its corporate Web site, if any, every Interactive Data File required to be submitted and posted pursuant to Rule 405 of Regulation S-T (§232.405 of this chapter) during the preceding 12 months (or for such shorter period that the registrant was required to submit and post such files). Yes x No o
Indicate by check mark whether the registrant is a large accelerated filer, an accelerated filer, a non-accelerated filer, or smaller reporting company. See the definitions of “large accelerated filer,” “accelerated filer” and “smaller reporting company” in Rule 12b-2 of the Exchange Act.
Large accelerated filer | o | Accelerated filer | x | |
Non-accelerated filer | o | (Do not check if a smaller reporting company) | Smaller reporting company | o |
Emerging growth company | o | |||
If an emerging growth company, indicate by check mark if the registrant has elected not to use the extended transition period for complying with any new or revised financial accounting standards provided pursuant to Section 13(a) of the Exchange Act. o
Indicate by check mark whether the registrant is a shell company (as defined in Rule 12b-2 of the Exchange Act). Yes o No x
As of August 2, 2018, there were 18,906,669 shares of the registrant’s common stock outstanding.
INTL FCStone Inc.
Quarterly Report on Form 10-Q for the Quarterly Period Ended June 30, 2018
Table of Contents
Page | ||
Part I. FINANCIAL INFORMATION | ||
Item 1. | ||
Item 2. | ||
Item 3. | ||
Item 4. | ||
Part II. OTHER INFORMATION | ||
Item 1. | ||
Item 1A. | ||
Item 2. | ||
Item 6. | ||
PART I. FINANCIAL INFORMATION
Item 1. Financial Statements
INTL FCStone Inc.
Condensed Consolidated Balance Sheets
(Unaudited)
(in millions, except par value and share amounts) | June 30, 2018 | September 30, 2017 | |||||
ASSETS | |||||||
Cash and cash equivalents | $ | 347.8 | $ | 314.9 | |||
Cash, securities and other assets segregated under federal and other regulations (including $675.4 and $54.5 at fair value at June 30, 2018 and September 30, 2017, respectively) | 1,212.6 | 518.8 | |||||
Collateralized transactions: | |||||||
Securities purchased under agreements to resell | 769.6 | 406.6 | |||||
Securities borrowed | 176.3 | 86.6 | |||||
Deposits with and receivables from broker-dealers, clearing organizations and counterparties (including $716.4 and $204.7 at fair value at June 30, 2018 and September 30, 2017, respectively) | 2,165.2 | 2,625.1 | |||||
Receivables from customers, net | 218.5 | 232.7 | |||||
Notes receivable | 11.0 | 10.6 | |||||
Income taxes receivable | 0.2 | 0.4 | |||||
Financial instruments owned, at fair value (includes securities pledged as collateral that can be sold or repledged of $17.3 and $19.4 at June 30, 2018 and September 30, 2017, respectively) | 2,003.4 | 1,731.8 | |||||
Physical commodities inventory, net (including $111.1 and $73.2 at fair value at June 30, 2018 and September 30, 2017, respectively) | 212.8 | 124.8 | |||||
Deferred income taxes, net | 22.7 | 42.6 | |||||
Property and equipment, net | 41.0 | 38.7 | |||||
Goodwill and intangible assets, net | 56.4 | 59.4 | |||||
Other assets | 47.4 | 50.4 | |||||
Total assets | $ | 7,284.9 | $ | 6,243.4 | |||
LIABILITIES AND STOCKHOLDERS' EQUITY | |||||||
Liabilities: | |||||||
Accounts payable and other accrued liabilities (including $1.0 at fair value at September 30, 2017) | $ | 128.1 | $ | 135.6 | |||
Payables to: | |||||||
Customers | 3,354.7 | 3,072.9 | |||||
Broker-dealers, clearing organizations and counterparties (including $7.1 and $4.8 at fair value at June 30, 2018 and September 30, 2017, respectively) | 130.8 | 125.7 | |||||
Lenders under loans | 360.6 | 230.2 | |||||
Income taxes payable | 12.5 | 7.3 | |||||
Collateralized transactions: | |||||||
Securities sold under agreements to repurchase | 1,599.0 | 1,393.1 | |||||
Securities loaned | 204.3 | 111.1 | |||||
Financial instruments sold, not yet purchased, at fair value | 1,007.2 | 717.6 | |||||
Total liabilities | 6,797.2 | 5,793.5 | |||||
Commitments and contingencies (Note 11) | |||||||
Stockholders' Equity: | |||||||
Preferred stock, $0.01 par value. Authorized 1,000,000 shares; no shares issued or outstanding | — | — | |||||
Common stock, $0.01 par value. Authorized 30,000,000 shares; 21,012,531 issued and 18,890,574 outstanding at June 30, 2018 and 20,855,243 issued and 18,733,286 outstanding at September 30, 2017 | 0.2 | 0.2 | |||||
Common stock in treasury, at cost - 2,121,957 shares at June 30, 2018 and September 30, 2017 | (46.3 | ) | (46.3 | ) | |||
Additional paid-in capital | 265.7 | 259.0 | |||||
Retained earnings | 301.3 | 261.5 | |||||
Accumulated other comprehensive loss, net | (33.2 | ) | (24.5 | ) | |||
Total stockholders' equity | 487.7 | 449.9 | |||||
Total liabilities and stockholders' equity | $ | 7,284.9 | $ | 6,243.4 | |||
See accompanying notes to condensed consolidated financial statements.
1
INTL FCStone Inc.
Condensed Consolidated Income Statements
(Unaudited)
Three Months Ended June 30, | Nine Months Ended June 30, | ||||||||||||||
(in millions, except share and per share amounts) | 2018 | 2017 | 2018 | 2017 | |||||||||||
Revenues: | |||||||||||||||
Sales of physical commodities | $ | 6,866.2 | $ | 5,317.0 | $ | 20,836.4 | $ | 16,486.3 | |||||||
Trading gains, net | 103.4 | 79.9 | 296.9 | 246.9 | |||||||||||
Commission and clearing fees | 96.6 | 73.0 | 271.6 | 212.5 | |||||||||||
Consulting, management, and account fees | 18.3 | 16.3 | 53.2 | 47.5 | |||||||||||
Interest income | 33.7 | 19.6 | 85.6 | 47.7 | |||||||||||
Other income | 0.1 | 0.1 | 0.2 | 0.2 | |||||||||||
Total revenues | 7,118.3 | 5,505.9 | 21,543.9 | 17,041.1 | |||||||||||
Cost of sales of physical commodities | 6,858.5 | 5,308.3 | 20,811.3 | 16,462.2 | |||||||||||
Operating revenues | 259.8 | 197.6 | 732.6 | 578.9 | |||||||||||
Transaction-based clearing expenses | 49.0 | 33.9 | 136.6 | 101.2 | |||||||||||
Introducing broker commissions | 34.1 | 29.2 | 101.4 | 86.1 | |||||||||||
Interest expense | 22.1 | 11.2 | 55.4 | 30.1 | |||||||||||
Net operating revenues | 154.6 | 123.3 | 439.2 | 361.5 | |||||||||||
Compensation and other expenses: | |||||||||||||||
Compensation and benefits | 86.9 | 75.5 | 252.3 | 222.7 | |||||||||||
Trading systems and market information | 8.6 | 8.3 | 25.7 | 25.7 | |||||||||||
Occupancy and equipment rental | 4.2 | 3.9 | 12.5 | 11.1 | |||||||||||
Professional fees | 4.8 | 3.7 | 13.4 | 11.9 | |||||||||||
Travel and business development | 3.7 | 3.0 | 10.2 | 9.6 | |||||||||||
Non-trading technology and support | 3.8 | 3.2 | 10.3 | 8.9 | |||||||||||
Depreciation and amortization | 2.8 | 2.4 | 8.4 | 7.2 | |||||||||||
Communications | 1.3 | 1.5 | 4.1 | 3.9 | |||||||||||
Bad debts | 1.6 | 0.1 | 2.9 | 3.9 | |||||||||||
Other | 6.0 | 6.7 | 20.4 | 18.9 | |||||||||||
Total compensation and other expenses | 123.7 | 108.3 | 360.2 | 323.8 | |||||||||||
Other gain | 2.0 | — | 2.0 | — | |||||||||||
Income before tax | 32.9 | 15.0 | 81.0 | 37.7 | |||||||||||
Income tax expense | 8.9 | 2.3 | 41.2 | 7.7 | |||||||||||
Net income | $ | 24.0 | $ | 12.7 | $ | 39.8 | $ | 30.0 | |||||||
Earnings per share: | |||||||||||||||
Basic | $ | 1.27 | $ | 0.67 | $ | 2.10 | $ | 1.59 | |||||||
Diluted | $ | 1.25 | $ | 0.66 | $ | 2.06 | $ | 1.58 | |||||||
Weighted-average number of common shares outstanding: | |||||||||||||||
Basic | 18,597,165 | 18,447,053 | 18,524,846 | 18,365,939 | |||||||||||
Diluted | 18,976,898 | 18,702,128 | 18,876,259 | 18,659,138 | |||||||||||
See accompanying notes to condensed consolidated financial statements.
2
INTL FCStone Inc.
Condensed Consolidated Statements of Comprehensive Income
(Unaudited)
Three Months Ended June 30, | Nine Months Ended June 30, | ||||||||||||||
(in millions) | 2018 | 2017 | 2018 | 2017 | |||||||||||
Net income | $ | 24.0 | $ | 12.7 | $ | 39.8 | $ | 30.0 | |||||||
Other comprehensive loss, net of tax: | |||||||||||||||
Foreign currency translation adjustment | (4.9 | ) | (1.9 | ) | (8.7 | ) | (2.1 | ) | |||||||
Other comprehensive loss | (4.9 | ) | (1.9 | ) | (8.7 | ) | (2.1 | ) | |||||||
Comprehensive income | $ | 19.1 | $ | 10.8 | $ | 31.1 | $ | 27.9 | |||||||
See accompanying notes to condensed consolidated financial statements.
3
INTL FCStone Inc.
Condensed Consolidated Statements of Cash Flows
(Unaudited)
Nine Months Ended June 30, | |||||||
(in millions) | 2018 | 2017 | |||||
Cash flows from operating activities: | |||||||
Net income | $ | 39.8 | $ | 30.0 | |||
Adjustments to reconcile net income to net cash used in operating activities: | |||||||
Depreciation and amortization | 8.4 | 7.2 | |||||
Bad debts | 2.9 | 3.9 | |||||
Deferred income taxes | 19.7 | (5.8 | ) | ||||
Amortization of debt issuance costs | 0.8 | 1.7 | |||||
Amortization of share-based compensation | 4.9 | 4.6 | |||||
Gain on sale of property and equipment | — | (0.3 | ) | ||||
Changes in operating assets and liabilities, net: | |||||||
Cash, securities and other assets segregated under federal and other regulations | (731.0 | ) | 458.8 | ||||
Securities purchased under agreements to resell | (363.4 | ) | 87.9 | ||||
Securities borrowed | (89.7 | ) | (112.7 | ) | |||
Deposits with and receivables from broker-dealers, clearing organizations, and counterparties | 409.7 | (432.1 | ) | ||||
Receivables from customers, net | 22.5 | (87.2 | ) | ||||
Notes receivable | (0.4 | ) | 9.8 | ||||
Income taxes receivable | (0.8 | ) | (0.4 | ) | |||
Financial instruments owned, at fair value | (254.0 | ) | (174.6 | ) | |||
Physical commodities inventory, net | (89.0 | ) | (48.9 | ) | |||
Other assets | 1.5 | 0.5 | |||||
Accounts payable and other accrued liabilities | 1.5 | (13.3 | ) | ||||
Payables to customers | 319.7 | (4.8 | ) | ||||
Payables to broker-dealers, clearing organizations and counterparties | 10.0 | (65.4 | ) | ||||
Income taxes payable | 6.4 | 1.7 | |||||
Securities sold under agreements to repurchase | 206.0 | 291.2 | |||||
Securities loaned | 93.2 | 130.5 | |||||
Financial instruments sold, not yet purchased, at fair value | 294.2 | (97.2 | ) | ||||
Net cash used in operating activities | (87.1 | ) | (14.9 | ) | |||
Cash flows from investing activities: | |||||||
Cash paid for acquisitions, net | — | (6.0 | ) | ||||
Purchase of property and equipment | (9.3 | ) | (8.6 | ) | |||
Net cash used in investing activities | (9.3 | ) | (14.6 | ) | |||
Cash flows from financing activities: | |||||||
Net change in payable to lenders under loans | 131.0 | 62.5 | |||||
Repayment of senior unsecured notes | — | (45.5 | ) | ||||
Payments of note payable | (0.6 | ) | (0.6 | ) | |||
Deferred payments on acquisitions | (5.5 | ) | — | ||||
Debt issuance costs | (0.4 | ) | (0.3 | ) | |||
Exercise of stock options | 2.6 | 3.1 | |||||
Withholding taxes on stock option exercises | (0.8 | ) | |||||
Income tax benefit on stock options and awards | — | (0.2 | ) | ||||
Net cash provided by financing activities | 126.3 | 19.0 | |||||
Effect of exchange rates on cash and cash equivalents | 3.0 | 0.4 | |||||
Net increase (decrease) in cash and cash equivalents | 32.9 | (10.1 | ) | ||||
Cash and cash equivalents at beginning of period | 314.9 | 316.2 | |||||
Cash and cash equivalents at end of period | $ | 347.8 | $ | 306.1 | |||
Supplemental disclosure of cash flow information: | |||||||
Cash paid for interest | $ | 54.2 | $ | 27.2 | |||
Income taxes paid, net of cash refunds | $ | 15.8 | $ | 12.4 | |||
Supplemental disclosure of non-cash investing and financing activities: | |||||||
Identified intangible assets from asset acquisition | $ | — | $ | 6.0 | |||
See accompanying notes to condensed consolidated financial statements.
4
INTL FCStone Inc.
Condensed Consolidated Statement of Stockholders’ Equity
(Unaudited)
(in millions) | Common Stock | Treasury Stock | Additional Paid-in Capital | Retained Earnings | Accumulated Other Comprehensive Loss, net | Total | |||||||||||||||||
Balances as of September 30, 2017 | $ | 0.2 | $ | (46.3 | ) | $ | 259.0 | $ | 261.5 | $ | (24.5 | ) | $ | 449.9 | |||||||||
Net income | 39.8 | 39.8 | |||||||||||||||||||||
Other comprehensive loss | (8.7 | ) | (8.7 | ) | |||||||||||||||||||
Exercise of stock options | 1.8 | 1.8 | |||||||||||||||||||||
Share-based compensation | 4.9 | 4.9 | |||||||||||||||||||||
Balances as of June 30, 2018 | $ | 0.2 | $ | (46.3 | ) | $ | 265.7 | $ | 301.3 | $ | (33.2 | ) | $ | 487.7 | |||||||||
See accompanying notes to condensed consolidated financial statements.
5
INTL FCStone Inc.
Notes to Condensed Consolidated Financial Statements
(Unaudited)
Note 1 – Basis of Presentation and Consolidation and Accounting Standards Adopted
INTL FCStone Inc., a Delaware corporation, and its consolidated subsidiaries (collectively “INTL” or “the Company”), is a diversified global financial services organization providing execution, risk management and advisory services, market intelligence, and clearing services across asset classes and markets around the world. The Company’s services include comprehensive risk management advisory services for commercial customers; execution of listed futures and options on futures contracts on all major commodity exchanges; structured over-the-counter (“OTC”) products in a wide range of commodities; physical trading and hedging of precious metals and select other commodities; trading of more than 140 foreign currencies; market-making in international equities; fixed income; debt origination and asset management.
The Company provides these services to a diverse group of more than 20,000 predominantly wholesale organizations located throughout the world, including producers, processors and end-users of nearly all widely-traded physical commodities to manage their risks and enhance margins; to commercial counterparties who are end-users of the Company’s products and services; to governmental and non-governmental organizations; and to commercial banks, brokers, institutional investors and major investment banks.
Basis of Presentation and Consolidation
The accompanying unaudited condensed consolidated balance sheet as of September 30, 2017, which has been derived from audited consolidated financial statements, and the unaudited interim condensed consolidated financial statements have been prepared pursuant to the rules and regulations of the Securities and Exchange Commission (“SEC”). Certain information and disclosures normally included in annual consolidated financial statements prepared in accordance with accounting principles generally accepted in the United States of America (“U.S. GAAP”) have been condensed or omitted pursuant to those rules and regulations. The Company believes that the disclosures made are adequate to make the information presented not misleading. In the opinion of management, all adjustments (consisting of normal recurring accruals) considered necessary for a fair presentation of the condensed consolidated financial statements for the interim periods presented have been reflected as required by Rule 10-01 of Regulation S-X.
Operating results for interim periods are not necessarily indicative of the results that may be expected for the full year. These interim condensed consolidated financial statements should be read in conjunction with the Company’s audited consolidated financial statements and related notes contained in the Company’s Form 10-K for the fiscal year ended September 30, 2017 filed with the SEC.
These condensed consolidated financial statements include the accounts of INTL FCStone Inc. and all other entities in which the Company has a controlling financial interest. All material intercompany transactions and balances have been eliminated in consolidation.
The Company’s fiscal year end is September 30, and the fiscal quarters end on December 31, March 31, June 30 and September 30. Unless otherwise stated, all dates refer to fiscal years and fiscal interim periods.
The preparation of condensed consolidated financial statements in conformity with U.S. GAAP requires management to make estimates and assumptions that affect the reported amounts of assets and liabilities, disclosure of contingent liabilities as of the date of the condensed consolidated financial statements and the reported amounts of revenue and expenses during the reporting period. The most significant of these estimates and assumptions relate to fair value measurement for financial instruments and investments, revenue recognition, the provision for bad debts, valuation of inventories, valuation of goodwill and intangible assets, incomes taxes, and contingencies. Although these and other estimates and assumptions are based on the best available information, actual results could be materially different from these estimates.
In the condensed consolidated income statements, the total revenues reported combine gross revenues for the physical commodities business and net revenues for all other businesses. The subtotal ‘operating revenues’ in the condensed consolidated income statements is calculated by deducting physical commodities cost of sales from total revenues. The subtotal ‘net operating revenues’ in the condensed consolidated income statements is calculated as operating revenues less transaction-based clearing expenses, introducing broker commissions and interest expense. Transaction-based clearing expenses represent variable expenses paid to executing brokers, exchanges, clearing organizations and banks in relation to transactional volumes. Introducing broker commissions include commission paid to non-employee third parties that have introduced customers to the Company. Net operating revenues represent revenues available to pay variable compensation to risk management consultants and traders and direct non-variable expenses, as well as variable and non-variable expenses of operational and administrative employees.
6
Foreign Currency Translation
The Company’s condensed consolidated financial statements are reported in U.S. dollars. The Company’s foreign subsidiaries maintain their records either in U.S. dollars or in certain instances the currency of the country in which they operate. The method of translating local currency financial information into U.S. dollars depends on whether the economy in which the foreign subsidiary operates has been designated as highly inflationary or not. Economies with a three-year cumulative inflation rate of more than 100% are considered highly inflationary.
Assets and liabilities of foreign subsidiaries in non-highly inflationary economies are translated into U.S. dollars using rates of exchange at the balance sheet date. Translation adjustments are recorded in other comprehensive income (loss). Revenues and expense are translated at rates of exchange in effect during the year. Transaction gains and losses are recorded in earnings.
Foreign subsidiaries that operate in highly inflationary countries use the U.S. dollar as their functional currency. Local currency monetary assets and liabilities are remeasured into U.S. dollars using rates of exchange as of each balance sheet date, with remeasurement adjustments and other transaction gains and losses recognized in earnings. Nonmonetary assets and liabilities do not fluctuate with changes in the local currency exchange rates to the dollar as the translated amounts for nonmonetary assets and liabilities at the end of the accounting period in which the economy becomes highly inflationary becomes the accounting basis for those assets and liabilities in the period of change and subsequent periods. Revenues and expenses are translated at rates of exchange in effect during the year.
The Company operates asset management and debt trading businesses in Argentina through various wholly owned subsidiaries. Net operating revenues from the Argentinean subsidiaries represented approximately 4% of the consolidated net operating revenues for the nine months ended June 30, 2018. The operating environment in Argentina continues to present business challenges, including ongoing devaluation of the Argentine peso and significant inflation. For the nine months ended June 30, 2018, the Argentine peso declined approximately 67% (from 17.3 to 28.9 pesos to the U.S. dollar). Based upon inflationary data published by the International Practices Task Force (IPTF) of the Center for Audit Quality (CAQ), the economy of Argentina became highly inflationary during the three months ended June 30, 2018.
Beginning July 1, 2018, the Company has designated Argentina’s economy as highly inflationary for accounting purposes. As a result, the Company will account for the Argentinean entities using the U.S. dollar as their functional currency beginning in the quarter ending September 30, 2018. Argentine peso-denominated monetary assets and liabilities will be remeasured at each balance sheet date to the currency exchange rate then in effect, with currency remeasurement gains and loses recognized in earnings. The translated balances for nonmonetary assets and liabilities as of June 30, 2018, will become the accounting basis for those assets in the period of change and subsequent periods.
At June 30, 2018, the Company had net monetary assets denominated in Argentine pesos of $11.2 million, including cash of $2.6 million. At June 30, 2018, the Company had net nonmonetary assets denominated in Argentine pesos of $1.1 million, including $0.1 million of goodwill.
Reclassifications
During the three and nine months ended June 30, 2018, the Company separately classified non-trading technology and support costs that were previously included within ‘Other’ on the condensed consolidated income statements. Additionally, during the three and nine months ended June 30, 2018, the Company separately classified communications related expenses separately from trading systems and market information related costs. In performing these reclassifications, the Company has made immaterial, retrospective adjustments to conform to the current period presentation. For the three and nine months ended June 30, 2017, ‘Other’ expenses included $3.2 million and $8.9 million, respectively, of expenses that are now included within ‘Non-trading technology and support’ on the condensed consolidated income statements. For the three and nine months ended June 30, 2017, ‘Trading systems and market information’ included $1.5 million and $3.9 million, respectively, of expenses that are now included within ‘Communications’ on the condensed consolidated income statements.
Accounting Standards Adopted
In March 2016, the Financial Accounting Standards Board (“FASB”) issued Accounting Standards Update No. 2016-09, “Compensation - Stock Compensation (Topic 718): Improvements to Employee Share-Based Payment Accounting” (“ASU 2016-09”), which simplifies several aspects of the accounting for share-based payment transactions. Under ASU 2016-09, excess tax benefits and tax deficiencies are recognized as income tax expense or benefit in the income statement instead of additional paid in capital. ASU 2016-09 also provides entities with the option to elect an accounting policy to estimate forfeitures of share-based awards over the service period or account for forfeitures when they occur. Under ASU 2016-09, previously unrecognized excess tax benefits should be recognized using a modified retrospective transition. In addition, amendments requiring recognition of excess tax benefits and tax deficiencies in the income statement, as well as changes in the computation of weighted-average diluted shares outstanding, should be applied prospectively. ASU 2016-09 is effective for and was adopted by the Company in the first quarter of 2018 and the impact of the adoption resulted in the following:
7
• | During the nine months ended June 30, 2018, the Company recognized excess tax benefits from share-based compensation of $0.4 million within income tax expense on the condensed consolidated income statement and within net income on the condensed consolidated cash flow statement. Prior to adoption, the tax effect of share-based awards would have been recognized in additional paid-in-capital on the condensed consolidated balance sheets and separately stated in the financing activities in the condensed consolidated cash flow statements. The Company has elected to adopt this guidance prospectively. |
• | The Company has elected to account for forfeitures of share-based awards as they occur. The Company elected to account for forfeitures as they occur using a modified retrospective transition method. The adoption of this guidance did not have a material impact on the condensed consolidated financial statements. |
• | The excess tax benefits from the assumed proceeds available to repurchase shares were excluded in the computation of diluted earnings per share for the three and nine months ended June 30, 2018. The Company has elected to adopt this guidance prospectively. |
• | For the nine months ended June 30, 2018, the Company has classified as a financing activity in the condensed consolidated cash flow statement $0.8 million of cash paid to taxing authorities for restricted stock shares withheld to satisfy statutory income tax withholding obligations. The retrospective application of this guidance had no impact on the condensed consolidated cash flow statement for the nine months ended June 30, 2017. |
In July 2015, the FASB issued ASU No. 2015-11, “Simplifying the Measurement of Inventory (Topic 330).” Under ASU 2015-11, inventory that is measured using the first-in, first-out (FIFO), specific identification, or average cost methods should be measured at the lower of cost or net realizable value. This ASU does not impact inventory measurement under the last-in, first-out (LIFO) or retail inventory methods. The Company adopted this ASU prospectively in the first quarter of 2018. The adoption of this ASU did not have a material impact on the condensed consolidated financial statements.
Note 2 – Earnings per Share
The Company presents basic and diluted earnings per share (“EPS”) using the two-class method which requires all outstanding unvested share-based payment awards that contain rights to non-forfeitable dividends and therefore participate in undistributed earnings with common stockholders be included in computing earnings per share. Under the two-class method, net income is reduced by the amount of dividends declared in the period for each class of common stock and participating security. The remaining undistributed earnings are then allocated to common stock and participating securities, based on their respective rights to receive dividends. Restricted stock awards granted to certain employees and directors contain non-forfeitable rights to dividends at the same rate as common stock, and are considered participating securities. Basic EPS has been computed by dividing net income by the weighted-average number of common shares outstanding.
The following is a reconciliation of the numerator and denominator of the diluted earnings per share computations for the periods presented below.
Three Months Ended June 30, | Nine Months Ended June 30, | ||||||||||||||
(in millions, except share amounts) | 2018 | 2017 | 2018 | 2017 | |||||||||||
Numerator: | |||||||||||||||
Net income | $ | 24.0 | $ | 12.7 | $ | 39.8 | $ | 30.0 | |||||||
Less: Allocation to participating securities | (0.3 | ) | (0.3 | ) | (0.6 | ) | (0.6 | ) | |||||||
Net income allocated to common stockholders | $ | 23.7 | $ | 12.4 | $ | 39.2 | $ | 29.4 | |||||||
Denominator: | |||||||||||||||
Weighted average number of: | |||||||||||||||
Common shares outstanding | 18,597,165 | 18,447,053 | 18,524,846 | 18,365,939 | |||||||||||
Dilutive potential common shares outstanding: | |||||||||||||||
Share-based awards | 379,733 | 255,075 | 351,413 | 293,199 | |||||||||||
Diluted weighted-average common shares | 18,976,898 | 18,702,128 | 18,876,259 | 18,659,138 | |||||||||||
The dilutive effect of share-based awards is reflected in diluted earnings per share by application of the treasury stock method, which includes consideration of unamortized share-based compensation expense required under the Compensation – Stock Compensation Topic of the ASC.
Options to purchase 76,587 and 210,543 shares of common stock for the three months ended June 30, 2018 and 2017, respectively, and options to purchase 147,640 and 242,778 shares of common stock for the nine months ended June 30, 2018 and 2017, respectively, were excluded from the calculation of diluted earnings per share as they would have been anti-dilutive.
8
Note 3 – Assets and Liabilities, at Fair Value
Fair value is defined by U.S. GAAP as the price that would be received for an asset or paid to transfer a liability (an exit price) in the principal or most advantageous market for the asset or liability in an orderly transaction between willing market participants on the measurement date.
Fair value is a market-based measure considered from the perspective of a market participant rather than an entity-specific measure. Therefore, even when market assumptions are not readily available, the Company is required to develop a set of assumptions that reflect those that market participants would use in pricing the asset or liability at the measurement date. The Company uses prices and inputs that are current as of the measurement date, including periods of market dislocation. In periods of market dislocation, the observability of prices and inputs may be reduced for many assets and liabilities. This condition could cause a security to be reclassified to a lower level within the fair value hierarchy.
The Company has designed independent price verification controls and periodically performs such controls to ensure the reasonableness of such values.
In accordance with FASB ASC 820, Fair Value Measurement, the Company groups its assets and liabilities measured at fair value in three levels based on the markets in which the assets and liabilities are traded and the reliability of the assumptions used to determine fair value. These levels are:
Level 1 - Valuation is based upon unadjusted quoted prices in active markets that are accessible at the measurement date for identical, unrestricted assets or liabilities. Level 1 consists of financial assets and liabilities whose fair values are estimated using quoted market prices.
Level 2 - Valuation is based upon quoted prices for identical or similar assets or liabilities in markets that are less active, that is, markets in which there are few transactions for the asset or liability that are observable for substantially the full term. Included in Level 2 are those financial assets and liabilities for which fair values are estimated using models or other valuation methodologies. These models are primarily industry-standard models that consider various observable inputs, including time value, yield curve, volatility factors, observable current market and contractual prices for the underlying financial instruments, as well as other relevant economic measures.
Level 3 - Valuation is based on prices or valuation techniques that require an input that is both significant to the fair value measurement and unobservable (i.e., supported by little or no market activity). Level 3 comprises financial assets and liabilities whose fair value is estimated based on internally developed models or methodologies utilizing significant inputs that are not readily observable from objective sources.
Financial and nonfinancial assets and liabilities are classified in their entirety based on the lowest level of input that is significant to the fair value measurement. The hierarchy gives the highest priority to unadjusted quoted prices in active markets for identical assets or liabilities (Level 1 measurements) and the lowest priority to unobservable inputs (Level 3 measurements). A market is active if there are sufficient transactions on an ongoing basis to provide current pricing information for the asset or liability, pricing information is released publicly, and price quotations do not vary substantially either over time or among market participants. Observable inputs reflect the assumptions market participants would use in pricing the asset or liability developed based on market data obtained from sources independent of the reporting entity.
The guidance requires the Company to consider counterparty credit risk of all parties of outstanding derivative instruments that would be considered by a market participant in the transfer or settlement of such contracts (exit price). The Company’s exposure to credit risk on derivative financial instruments relates to the portfolio of OTC derivative contracts as all exchange-traded contracts held can be settled on an active market with a credit guarantee from the respective exchange. The Company requires most counterparties to deposit margin collateral for all OTC instruments and is also required to deposit margin collateral with counterparties, which mitigates the impact of counterparty credit risk in the evaluation of the fair value of OTC derivative contracts.
Fair value of financial and nonfinancial assets and liabilities that are carried on the Condensed Consolidated Balance Sheets at fair value on a recurring basis
Cash and cash equivalents reported at fair value on a recurring basis includes certificates of deposit, which are stated at cost plus accrued interest, which approximates fair value.
Cash, securities and other assets segregated under federal and other regulations reported at fair value on a recurring basis include the value of pledged investments, primarily U.S. Treasury obligations and commodities warehouse receipts.
Deposits with and receivables from broker-dealers, clearing organizations and counterparties and payable to customers and broker-dealers, clearing organizations and counterparties include the value of pledged investments, primarily U.S. Treasury obligations and foreign government obligations. These balances also include the fair value of exchange-traded options on futures and exchange-cleared OTC swaps and options determined by quoted prices on the applicable exchange.
9
Financial instruments owned and sold, not yet purchased reported at fair value on a recurring basis include the value of common and preferred stock, American Depository Receipts (“ADRs”), and Global Depository Receipts (“GDRs”), exchangeable foreign ordinary equities, ADRs, and GDRs, corporate and municipal bonds, U.S. Treasury obligations, U.S. government agency obligations, foreign government obligations, agency mortgage-backed obligations, asset-backed obligations, derivative financial instruments, commodities leases, commodities warehouse receipts, exchange firm common stock, and mutual funds and investments in managed funds.
Physical commodities inventory recorded at fair value on a recurring basis includes precious metals that are a part of the trading activities of a regulated broker-dealer subsidiary and is recorded at fair value using spot prices. Physical commodities inventory also includes agricultural commodities that are a part of the trading activities of a non-broker dealer subsidiary and are also recorded at net realizable value using spot prices. Precious metals inventory held by subsidiaries that are not broker-dealers are valued at fair value on a non-recurring basis. Except as disclosed in Note 6, the Company did not have any fair value adjustments for assets or liabilities measured at fair value on a non-recurring basis as of June 30, 2018 and September 30, 2017.
The following section describes the valuation methodologies used by the Company to measure classes of financial instruments at fair value and specifies the level within the fair value hierarchy where various financial instruments are classified.
The Company uses quoted prices in active markets, where available, and classifies such instruments within Level 1 of the fair value hierarchy. Examples include U.S. Treasury obligations, commodities warehouse receipts, some common and preferred stock, ADRs, and GDRs, some exchangeable foreign ordinary equities, ADRs, and GDRs, some corporate and municipal obligations, physical precious metals held by a regulated broker-dealer subsidiary, exchange firm common stock, mutual funds, as well as exchange traded options on futures contracts.
When instruments are traded in secondary markets and observable prices are not available for substantially the full term, the Company generally relies on internal valuation techniques that use observable inputs or prices obtained from third-party pricing services or brokers or a combination thereof, and accordingly, classified these instruments as Level 2. Examples include U.S. government agency obligations, agency-mortgage backed obligations, asset-backed obligations, foreign government obligations, some common and preferred stock, ADRs, and GDRs, certain exchangeable foreign ordinary equities, ADRs, and GDRs, OTC commodity and foreign exchange forwards, swaps, and options, physical agricultural commodity inventory, and OTC firm purchase and sale commitments related to the Company’s agricultural and energy commodities.
With the exception of certain derivative instruments, financial instruments owned and sold are primarily valued using third party pricing sources. Third party vendors compile prices from various sources and often apply matrix pricing for similar securities when no prices are observable. The Company reviews the pricing methodologies provided by the various vendors in order to determine if observable market information is being used, versus unobservable inputs. When evaluating the propriety of an internal trader price compared with vendor prices, considerations include the range and quality of vendor prices. Trader or broker prices are used to ensure the reasonableness of a vendor price; however valuing financial instruments involves judgments acquired from knowledge of a particular market. If a trader asserts that a vendor or market price is not reflective of market value, justification for using the trader price, including recent sales activity where possible, must be provided to and approved by the appropriate levels of management. Financial instruments owned and sold are included within either Level 1 or Level 2 of the fair value hierarchy based upon the observability of the inputs used and the level of activity in the market.
Level 3 comprises financial assets and liabilities whose fair value is estimated based on internally developed models or methodologies utilizing significant inputs that are not readily observable from objective sources. Included in Level 3 are some common stock and ADRs, some corporate and municipal obligations, and contingent liabilities. Level 3 assets and liabilities are valued using an income approach based upon management developed discounted cash flow projections, which are an unobservable input.
The fair value estimates presented herein are based on pertinent information available to management as of June 30, 2018 and September 30, 2017. Although management is not aware of any factors that would significantly affect the estimated fair value amounts, such amounts have not been comprehensively revalued for purposes of these condensed consolidated financial statements since those respective dates and current estimates of fair value may differ significantly from the amounts presented herein.
10
The following tables set forth the Company’s financial and nonfinancial assets and liabilities accounted for at fair value, on a recurring basis, as of June 30, 2018 by level in the fair value hierarchy.
June 30, 2018 | |||||||||||||||||||
(in millions) | Level 1 | Level 2 | Level 3 | Netting and Collateral (1) | Total | ||||||||||||||
Assets: | |||||||||||||||||||
Unrestricted cash equivalents - certificate of deposits | $ | 3.8 | $ | — | $ | — | $ | — | $ | 3.8 | |||||||||
Commodities warehouse receipts | 74.9 | — | — | — | 74.9 | ||||||||||||||
U.S. Treasury obligations | 600.5 | — | — | — | 600.5 | ||||||||||||||
Cash, securities and other assets segregated under federal and other regulations | 675.4 | — | — | — | 675.4 | ||||||||||||||
U.S. Treasury obligations | 666.7 | — | — | — | 666.7 | ||||||||||||||
"To be announced" (TBA) and forward settling securities | — | 4.4 | — | (0.1 | ) | 4.3 | |||||||||||||
Foreign government obligations | — | 5.5 | — | — | 5.5 | ||||||||||||||
Derivatives | 6,131.7 | 24.2 | — | (6,116.0 | ) | 39.9 | |||||||||||||
Deposits with and receivables from broker-dealers, clearing organization and counterparties | 6,798.4 | 34.1 | — | (6,116.1 | ) | 716.4 | |||||||||||||
Common and preferred stock, ADRs, and GDRs | 33.2 | 2.9 | — | — | 36.1 | ||||||||||||||
Exchangeable foreign ordinary equities, ADRs, and GDRs | 29.7 | 1.4 | — | — | 31.1 | ||||||||||||||
Corporate and municipal bonds | 64.1 | 0.2 | — | — | 64.3 | ||||||||||||||
U.S. Treasury obligations | 99.7 | — | — | — | 99.7 | ||||||||||||||
U.S. government agency obligations | — | 352.8 | — | — | 352.8 | ||||||||||||||
Foreign government obligations | — | 8.5 | — | — | 8.5 | ||||||||||||||
Agency mortgage-backed obligations | — | 1,036.2 | — | — | 1,036.2 | ||||||||||||||
Asset-backed obligations | — | 47.4 | — | — | 47.4 | ||||||||||||||
Derivatives | 0.7 | 1,473.7 | — | (1,169.4 | ) | 305.0 | |||||||||||||
Commodities leases | — | 77.9 | — | (70.6 | ) | 7.3 | |||||||||||||
Commodities warehouse receipts | 0.1 | — | — | — | 0.1 | ||||||||||||||
Exchange firm common stock | 10.0 | — | — | — | 10.0 | ||||||||||||||
Mutual funds and other | 4.9 | — | — | — | 4.9 | ||||||||||||||
Financial instruments owned | 242.4 | 3,001.0 | — | (1,240.0 | ) | 2,003.4 | |||||||||||||
Physical commodities inventory, net | 8.9 | 102.2 | — | — | 111.1 | ||||||||||||||
Total assets at fair value | $ | 7,728.9 | $ | 3,137.3 | $ | — | $ | (7,356.1 | ) | $ | 3,510.1 | ||||||||
Liabilities: | |||||||||||||||||||
TBA and forward settling securities | — | 7.2 | — | (0.1 | ) | 7.1 | |||||||||||||
Derivatives | 6,175.9 | 3.4 | — | (6,179.3 | ) | — | |||||||||||||
Payable to broker-dealers, clearing organizations and counterparties | 6,175.9 | 10.6 | — | (6,179.4 | ) | 7.1 | |||||||||||||
Common and preferred stock, ADRs, and GDRs | 39.3 | 8.8 | — | — | 48.1 | ||||||||||||||
Exchangeable foreign ordinary equities, ADRs, and GDRs | 31.2 | — | — | — | 31.2 | ||||||||||||||
Corporate and municipal bonds | 1.5 | — | — | — | 1.5 | ||||||||||||||
U.S. Treasury obligations | 511.4 | — | — | — | 511.4 | ||||||||||||||
U.S. government agency obligations | — | 38.1 | — | — | 38.1 | ||||||||||||||
Agency mortgage-backed obligations | — | 0.1 | — | — | 0.1 | ||||||||||||||
Derivatives | — | 1,490.6 | — | (1,184.8 | ) | 305.8 | |||||||||||||
Commodities leases | — | 69.9 | — | 1.1 | 71.0 | ||||||||||||||
Financial instruments sold, not yet purchased | 583.4 | 1,607.5 | — | (1,183.7 | ) | 1,007.2 | |||||||||||||
Total liabilities at fair value | $ | 6,759.3 | $ | 1,618.1 | $ | — | $ | (7,363.1 | ) | $ | 1,014.3 | ||||||||
(1) | Represents cash collateral and the impact of netting across the levels of the fair value hierarchy. Netting among positions classified within the same level is included in that level. |
11
The following table sets forth the Company’s financial and nonfinancial assets and liabilities accounted for at fair value, on a recurring basis, as of September 30, 2017 by level in the fair value hierarchy.
September 30, 2017 | |||||||||||||||||||
(in millions) | Level 1 | Level 2 | Level 3 | Netting and Collateral (1) | Total | ||||||||||||||
Assets: | |||||||||||||||||||
Unrestricted cash equivalents - certificates of deposits | $ | 3.8 | $ | — | $ | — | $ | — | $ | 3.8 | |||||||||
Commodities warehouse receipts | 21.0 | — | — | — | 21.0 | ||||||||||||||
U.S. Treasury obligations | 33.5 | — | — | — | 33.5 | ||||||||||||||
Cash, securities and other assets segregated under federal and other regulations | 54.5 | — | — | — | 54.5 | ||||||||||||||
U.S. Treasury obligations | 244.7 | — | — | — | 244.7 | ||||||||||||||
"To be announced" (TBA) and forward settling securities | — | 8.8 | — | — | 8.8 | ||||||||||||||
Foreign government obligations | — | 6.4 | — | — | 6.4 | ||||||||||||||
Derivatives | 2,608.6 | 289.1 | — | (2,952.9 | ) | (55.2 | ) | ||||||||||||
Deposits with and receivables from broker-dealers, clearing organizations, and counterparties | 2,853.3 | 304.3 | — | (2,952.9 | ) | 204.7 | |||||||||||||
Common and preferred stock, ADRs, and GDRs | 31.2 | 3.4 | 0.1 | — | 34.7 | ||||||||||||||
Exchangeable foreign ordinary equities, ADRs, and GDRs | 9.2 | 1.2 | — | — | 10.4 | ||||||||||||||
Corporate and municipal bonds | 28.2 | 0.9 | — | — | 29.1 | ||||||||||||||
U.S. Treasury obligations | 60.0 | — | — | — | 60.0 | ||||||||||||||
U.S. government agency obligations | — | 368.9 | — | — | 368.9 | ||||||||||||||
Foreign government obligations | — | 10.2 | — | — | 10.2 | ||||||||||||||
Agency mortgage-backed obligations | — | 920.9 | — | — | 920.9 | ||||||||||||||
Asset-backed obligations | — | 47.3 | — | — | 47.3 | ||||||||||||||
Derivatives | 1.3 | 1,413.4 | — | (1,252.6 | ) | 162.1 | |||||||||||||
Commodities leases | — | 174.1 | — | (138.7 | ) | 35.4 | |||||||||||||
Commodities warehouse receipts | 38.5 | — | — | — | 38.5 | ||||||||||||||
Exchange firm common stock | 8.3 | — | — | — | 8.3 | ||||||||||||||
Mutual funds and other | 6.0 | — | — | — | 6.0 | ||||||||||||||
Financial instruments owned | 182.7 | 2,940.3 | 0.1 | (1,391.3 | ) | 1,731.8 | |||||||||||||
Physical commodities inventory, net | 73.2 | — | — | — | 73.2 | ||||||||||||||
Total assets at fair value | $ | 3,167.5 | $ | 3,244.6 | $ | 0.1 | $ | (4,344.2 | ) | $ | 2,068.0 | ||||||||
Liabilities: | |||||||||||||||||||
Accounts payable and other accrued liabilities - contingent liabilities | $ | — | $ | — | $ | 1.0 | $ | — | $ | 1.0 | |||||||||
TBA and forward settling securities | — | 4.9 | — | (0.1 | ) | 4.8 | |||||||||||||
Derivatives | 2,476.2 | 292.8 | — | (2,769.0 | ) | — | |||||||||||||
Payable to broker-dealers, clearing organizations and counterparties | 2,476.2 | 297.7 | — | (2,769.1 | ) | 4.8 | |||||||||||||
Common and preferred stock, ADRs, and GDRs | 33.7 | 0.7 | — | — | 34.4 | ||||||||||||||
Exchangeable foreign ordinary equities, ADRs, and GDRs | 10.3 | 0.2 | — | — | 10.5 | ||||||||||||||
Corporate and municipal bonds | 0.3 | — | — | — | 0.3 | ||||||||||||||
U.S. Treasury obligations | 285.9 | — | — | — | 285.9 | ||||||||||||||
U.S. government agency obligations | — | 27.9 | — | — | 27.9 | ||||||||||||||
Agency mortgage-backed obligations | — | 0.1 | — | — | 0.1 | ||||||||||||||
Derivatives | — | 1,427.2 | — | (1,110.2 | ) | 317.0 | |||||||||||||
Commodities leases | — | 191.1 | — | (149.6 | ) | 41.5 | |||||||||||||
Financial instruments sold, not yet purchased | 330.2 | 1,647.2 | — | (1,259.8 | ) | 717.6 | |||||||||||||
Total liabilities at fair value | $ | 2,806.4 | $ | 1,944.9 | $ | 1.0 | $ | (4,028.9 | ) | $ | 723.4 | ||||||||
(1) | Represents cash collateral and the impact of netting across the levels of the fair value hierarchy. Netting among positions classified within the same level is included in that level. |
Realized and unrealized gains and losses are included in ‘trading gains, net’, ‘interest income’, and ‘cost of sales of physical commodities’ in the condensed consolidated income statements.
12
Information on Level 3 Financial Assets and Liabilities
The following tables set forth a summary of changes in the fair value of the Company’s Level 3 financial assets and liabilities during the three and nine months ended June 30, 2018 and 2017, including a summary of unrealized gains (losses) during the respective periods on the Company’s Level 3 financial assets and liabilities held during the periods.
Level 3 Financial Assets For the Three and Nine Months Ended June 30, 2018 | |||||||||||||||||||||||||||
(in millions) | Balances at beginning of period | Realized gains (losses) during period | Unrealized gains (losses) during period | Purchases/issuances | Settlements | Transfers in or (out) of Level 3 | Balances at end of period | ||||||||||||||||||||
Assets: | |||||||||||||||||||||||||||
Common and preferred stock, ADRs, and GDRs | $ | 0.1 | $ | — | $ | (0.1 | ) | $ | — | $ | — | $ | — | $ | — | ||||||||||||
$ | 0.1 | $ | — | $ | (0.1 | ) | $ | — | $ | — | $ | — | $ | — | |||||||||||||
Level 3 Financial Assets and Financial Liabilities For the Three Months Ended June 30, 2017 | |||||||||||||||||||||||||||
(in millions) | Balances at beginning of period | Realized gains (losses) during period | Unrealized gains (losses) during period | Purchases/issuances | Settlements | Transfers in or (out) of Level 3 | Balances at end of period | ||||||||||||||||||||
Assets: | |||||||||||||||||||||||||||
Common and preferred stock, ADRs, and GDRs | $ | 0.2 | $ | — | $ | — | $ | — | $ | — | $ | — | $ | 0.2 | |||||||||||||
Corporate and municipal bonds | — | — | — | — | — | — | — | ||||||||||||||||||||
$ | 0.2 | $ | — | $ | — | $ | — | $ | — | $ | — | $ | 0.2 | ||||||||||||||
(in millions) | Balances at beginning of period | Realized (gains) losses during period | Unrealized (gains) losses during period | Purchases/issuances | Settlements | Transfers in or (out) of Level 3 | Balances at end of period | ||||||||||||||||||||
Liabilities: | |||||||||||||||||||||||||||
Contingent liabilities | $ | 0.9 | $ | — | $ | — | $ | — | $ | — | $ | — | $ | 0.9 | |||||||||||||
Level 3 Financial Assets and Financial Liabilities For the Nine Months Ended June 30, 2017 | |||||||||||||||||||||||||||
(in millions) | Balances at beginning of period | Realized gains (losses) during period | Unrealized gains (losses) during period | Purchases/issuances | Settlements | Transfers in or (out) of Level 3 | Balances at end of period | ||||||||||||||||||||
Assets: | |||||||||||||||||||||||||||
Common and preferred stock, ADRs, and GDRs | $ | 0.2 | $ | — | $ | — | $ | — | $ | — | $ | — | $ | 0.2 | |||||||||||||
Corporate and municipal bonds | 3.0 | — | — | — | (3.0 | ) | — | — | |||||||||||||||||||
$ | 3.2 | $ | — | $ | — | $ | — | $ | (3.0 | ) | $ | — | $ | 0.2 | |||||||||||||
(in millions) | Balances at beginning of period | Realized (gains) losses during period | Unrealized (gains) losses during period | Purchases/issuances | Settlements | Transfers in or (out) of Level 3 | Balances at end of period | ||||||||||||||||||||
Liabilities: | |||||||||||||||||||||||||||
Contingent liabilities | $ | 0.8 | $ | — | $ | 0.1 | $ | — | $ | — | $ | — | $ | 0.9 | |||||||||||||
The Company was required to make additional future cash payments based on certain financial performance measures of an acquired business. The Company was required to remeasure the fair value of contingent consideration arrangements on a recurring basis. As of September 30, 2017, the Company had classified its liability for the contingent consideration within Level 3 of the fair value hierarchy because the fair value was determined using significant unobservable inputs, which included projected cash flows. The estimated fair value of the contingent consideration arrangements was based upon management-developed earnings forecasts for the remaining contingency period, which was a Level 3 input in the fair value hierarchy. The fair value of the contingent consideration increased by $0.1 million during the nine months ended June 30, 2017, with the corresponding amount classified as ‘other’ in the condensed consolidated income statements. The contingency period for the
13
contingent consideration arrangements ended as of December 31, 2017 and the accrued balance of $1.0 million was paid during the nine months ended June 30, 2018.
The Company reports transfers in and out of Levels 1, 2 and 3, as applicable, using the fair value of the securities as of the beginning of the reporting period in which the transfer occurred. The Company did not have any transfers in and out of Levels 1, 2, and 3 during the three and nine months ended June 30, 2018 and 2017.
Additional disclosures about the fair value of financial instruments that are not carried on the Condensed Consolidated Balance Sheets at fair value
Many, but not all, of the financial instruments that the Company holds are recorded at fair value in the Condensed Consolidated Balance Sheets. The following represents financial instruments in which the ending balance at June 30, 2018 and September 30, 2017 was not carried at fair value in accordance with U.S. GAAP on the Condensed Consolidated Balance Sheets:
Short-term financial instruments: The carrying value of short-term financial instruments, including cash and cash equivalents, cash segregated under federal and other regulations, securities purchased under agreements to re-sell and securities sold under agreements to re-purchase, and securities borrowed and loaned are recorded at amounts that approximate the fair value of these instruments due to their short-term nature and level of collateralization. These financial instruments generally expose the Company to limited credit risk and have no stated maturities or have short-term maturities and carry interest rates that approximate market rates. Under the fair value hierarchy, cash and cash equivalents and cash segregated under federal and other regulations are classified as Level 1. Securities purchased under agreements to re-sell and securities sold under agreements to re-purchase, and securities borrowed and loaned are classified as Level 2 under the fair value hierarchy as they are generally short-term in nature and are collateralized by common stock, U.S. Treasury obligations, U.S. government agency obligations, agency mortgage-backed obligations, and asset-backed obligations.
Receivables and other assets: Receivables from broker-dealers, clearing organizations, and counterparties, receivables from customers, net, notes receivables, and certain other assets are recorded at amounts that approximate fair value due to their short-term nature and are classified as Level 2 under the fair value hierarchy.
Payables: Payables to customers and payables to brokers-dealers, clearing organizations, and counterparties are recorded at amounts that approximate fair value due to their short-term nature and are classified as Level 2 under the fair value hierarchy.
Lenders under loans: Payables to lenders under loans carry variable rates of interest and thus approximate fair value and are classified as Level 2 under the fair value hierarchy.
Note 4 – Financial Instruments with Off-Balance Sheet Risk and Concentrations of Credit Risk
The Company is party to certain financial instruments with off-balance sheet risk in the normal course of its business. The Company has sold financial instruments that it does not currently own and will therefore be obliged to purchase such financial instruments at a future date. The Company has recorded these obligations in the condensed consolidated financial statements as of June 30, 2018 and September 30, 2017 at the fair values of the related financial instruments. The Company will incur losses if the fair value of the underlying financial instruments increases subsequent to June 30, 2018. The total financial instruments sold, not yet purchased of $1,007.2 million and $717.6 million as of June 30, 2018 and September 30, 2017, respectively, includes $305.8 million and $317.0 million for derivative contracts, respectively, which represented a liability to the Company based on their fair values as of June 30, 2018 and September 30, 2017.
Derivatives
The Company utilizes derivative products in its trading capacity as a dealer in order to satisfy customer needs and mitigate risk. The Company manages risks from both derivatives and non-derivative cash instruments on a consolidated basis. The risks of derivatives should not be viewed in isolation, but in aggregate with the Company’s other trading activities. The majority of the Company’s derivative positions are included in the condensed consolidated balance sheets in ‘Deposits with and receivables from broker-dealers, clearing organizations and counterparties’, ‘Financial instruments owned, at fair value’, ‘Financial instruments sold, not yet purchased, at fair value’ and ‘Payables to broker-dealers, clearing organizations and counterparties’.
14
Listed below are the fair values of the Company’s derivative assets and liabilities as of June 30, 2018 and September 30, 2017. Assets represent net unrealized gains and liabilities represent net unrealized losses.
June 30, 2018 | September 30, 2017 | ||||||||||||||
(in millions) | Assets (1) | Liabilities (1) | Assets (1) | Liabilities (1) | |||||||||||
Derivative contracts not accounted for as hedges: | |||||||||||||||
Exchange-traded commodity derivatives | $ | 4,789.5 | $ | 4,771.0 | $ | 2,094.2 | $ | 1,975.0 | |||||||
OTC commodity derivatives | 839.3 | 850.3 | 1,084.0 | 1,110.3 | |||||||||||
Exchange-traded foreign exchange derivatives | 74.6 | 57.2 | 66.0 | 52.0 | |||||||||||
OTC foreign exchange derivatives | 618.3 | 603.5 | 618.5 | 609.8 | |||||||||||
Exchange-traded interest rate derivatives | 577.8 | 529.3 | 228.4 | 203.6 | |||||||||||
OTC interest rate derivatives | 40.3 | 40.2 | — | — | |||||||||||
Exchange-traded equity index derivatives | 690.5 | 818.4 | 221.3 | 245.4 | |||||||||||
TBA and forward settling securities | 4.4 | 7.2 | 8.8 | 4.9 | |||||||||||
Gross fair value of derivative contracts | 7,634.7 | 7,677.1 | 4,321.2 | 4,201.0 | |||||||||||
Impact of netting and collateral | (7,285.5 | ) | (7,364.2 | ) | (4,205.5 | ) | (3,879.2 | ) | |||||||
Total fair value included in ‘Deposits with and receivables from broker-dealers, clearing organizations, and counterparties’ | $ | 44.2 | $ | (46.4 | ) | ||||||||||
Total fair value included in ‘Financial instruments owned, at fair value’ | $ | 305.0 | $ | 162.1 | |||||||||||
Total fair value included in ‘Payables to broker-dealers, clearing organizations and counterparties | $ | 7.1 | $ | 4.8 | |||||||||||
Fair value included in ‘Financial instruments sold, not yet purchased, at fair value’ | $ | 305.8 | $ | 317.0 | |||||||||||
(1) | As of June 30, 2018 and September 30, 2017, the Company’s derivative contract volume for open positions were approximately 9.7 million and 6.1 million contracts, respectively. |
The Company’s derivative contracts are principally held in its Commercial Hedging and Clearing and Execution Services segments. The Company assists its Commercial Hedging segment customers in protecting the value of their future production by entering into option or forward agreements with them on an OTC basis. The Company also provides its Commercial Hedging segment customers with option products, including combinations of buying and selling puts and calls. The Company mitigates its risk by offsetting the customer’s transaction simultaneously with one of the Company’s trading counterparties or with a similar but not identical exchange-traded position. The risk mitigation of these offsetting trades is not within the documented hedging designation requirements of the Derivatives and Hedging Topic of the ASC. These derivative contracts are traded along with cash transactions because of the integrated nature of the markets for these products. The Company manages the risks associated with derivatives on an aggregate basis along with the risks associated with its proprietary trading and market-making activities in cash instruments as part of its firm-wide risk management policies. In particular, the risks related to derivative positions may be partially offset by inventory, unrealized gains in inventory or cash collateral paid or received.
The Company has derivative instruments, which consist of mortgage-backed TBA securities and forward settling transactions that are used to manage risk exposures in the trading inventory of the Company’s domestic institutional fixed income business. The fair value on these transactions are recorded in deposits with and receivables from or payables to broker-dealers, clearing organizations and counterparties. Realized and unrealized gains and losses on securities and derivative transactions are reflected in ‘trading gains, net’.
15
As of June 30, 2018 and September 30, 2017, these transactions are summarized as follows:
June 30, 2018 | September 30, 2017 | ||||||||||||||
(in millions) | Gain / (Loss) | Notional Amounts | Gain / (Loss) | Notional Amounts | |||||||||||
Unrealized gain on TBA securities purchased within deposits with and receivables from broker-dealers, clearing organizations and counterparties and payables to broker-dealers, clearing organizations and counterparties, respectively, and related notional amounts (1) | $ | 2.9 | $ | 829.5 | $ | — | $ | 51.3 | |||||||
Unrealized loss on TBA securities purchased within deposits with and receivables from broker-dealers, clearing organizations and counterparties and payables to broker-dealers, clearing organizations and counterparties, respectively, and related notional amounts (1) | $ | — | $ | 38.7 | $ | (2.9 | ) | $ | 1,236.8 | ||||||
Unrealized gain on TBA securities sold within payables to broker-dealers, clearing organizations and counterparties and deposits with and receivables from broker-dealers, clearing organizations and counterparties, respectively, and related notional amounts (1) | $ | 0.1 | $ | (90.7 | ) | $ | 5.8 | $ | (1,881.9 | ) | |||||
Unrealized loss on TBA securities sold within payables to broker-dealers, clearing organizations and counterparties and deposits with and receivables from broker-dealers, clearing organizations and counterparties, respectively, and related notional amounts (1) | $ | (6.9 | ) | $ | (1,838.2 | ) | $ | (0.1 | ) | $ | (404.1 | ) | |||
Unrealized gain (loss) on forward settling securities purchased within deposits with and receivables from broker-dealers, clearing organizations and counterparties and payables to broker-dealers, clearing organizations and counterparties, respectively, and related notional amounts (1) | $ | 1.4 | $ | 563.8 | $ | (2.0 | ) | $ | 882.9 | ||||||
Unrealized (loss) gain on forward settling securities sold within payables to broker-dealers, clearing organizations, and counterparties and deposits with and receivables from broker-dealers, clearing organizations and counterparties, respectively, and related notional amounts (1) | $ | (0.3 | ) | $ | (245.5 | ) | $ | 3.0 | $ | (590.2 | ) | ||||
(1) The notional amounts of these instruments reflect the extent of the Company's involvement in TBA and forward settling securities and do not represent risk of loss due to counterparty non-performance. | |||||||||||||||
The following table sets forth the Company’s gains (losses) related to derivative financial instruments for the three and nine months ended June 30, 2018 and 2017 in accordance with the Derivatives and Hedging Topic of the ASC. The net gains set forth below are included in ‘Cost of sales of physical commodities’ and ‘Trading gains, net’ in the condensed consolidated income statements.
Three Months Ended June 30, | Nine Months Ended June 30, | ||||||||||||||
(in millions) | 2018 | 2017 | 2018 | 2017 | |||||||||||
Commodities | $ | 38.1 | $ | 22.0 | $ | 71.9 | $ | 40.8 | |||||||
Foreign exchange | 2.9 | 1.7 | 7.7 | 3.7 | |||||||||||
Interest rate | 0.5 | — | 1.1 | (1.0 | ) | ||||||||||
TBA and forward settling securities | — | (5.4 | ) | 10.3 | 3.1 | ||||||||||
Net gains from derivative contracts | $ | 41.5 | $ | 18.3 | $ | 91.0 | $ | 46.6 | |||||||
Credit Risk
In the normal course of business, the Company purchases and sells financial instruments, commodities and foreign currencies as either a principal or agent on behalf of its customers. If either the customer or counterparty fails to perform, the Company may be required to discharge the obligations of the nonperforming party. In such circumstances, the Company may sustain a loss if the fair value of the financial instrument or foreign currency is different from the contract value of the transaction.
The majority of the Company’s transactions and, consequently, the concentration of its credit exposure are with commodity exchanges, customers, broker-dealers and other financial institutions. These activities primarily involve collateralized and uncollateralized arrangements and may result in credit exposure in the event that a counterparty fails to meet its contractual obligations. The Company’s exposure to credit risk can be directly impacted by volatile financial markets, which may impair the ability of counterparties to satisfy their contractual obligations. The Company seeks to control its credit risk through a variety of reporting and control procedures, including establishing credit and/or position limits based upon a review of the counterparties’ financial condition and credit ratings. The Company monitors collateral levels on a daily basis for compliance with regulatory and internal guidelines and requests changes in collateral levels as appropriate.
The Company is a party to financial instruments in the normal course of its business through customer and proprietary trading accounts in exchange-traded and OTC derivative instruments. These instruments are primarily the result of the execution of orders for commodity futures, options on futures, OTC swaps and options and spot and forward foreign currency contracts on behalf of its customers, substantially all of which are transacted on a margin basis. Such transactions may expose the Company to significant credit risk in the event margin requirements are not sufficient to fully cover losses which customers may incur.
16
The Company controls the risks associated with these transactions by requiring customers to maintain margin deposits in compliance with individual exchange regulations and internal guidelines. The Company monitors required margin levels daily, and therefore may require customers to deposit additional collateral or reduce positions when necessary. The Company also establishes credit limits for customers, which are monitored daily. The Company evaluates each customer’s creditworthiness on a case by case basis. Clearing, financing, and settlement activities may require the Company to maintain funds with or pledge securities as collateral with other financial institutions. Generally, these exposures to both customers and exchanges are subject to master netting, or customer agreements, which reduce the exposure to the Company by permitting receivables and payables with such customers to be offset in the event of a customer default. Management believes that the margin deposits held as of June 30, 2018 and September 30, 2017 were adequate to minimize the risk of material loss that could be created by positions held at that time. Additionally, the Company monitors collateral fair value on a daily basis and adjusts collateral levels in the event of excess market exposure. Generally, these exposures to both customers and counterparties are subject to master netting or customer agreements which reduce the exposure to the Company.
Derivative financial instruments involve varying degrees of off-balance sheet market risk whereby changes in the fair values of underlying financial instruments may result in changes in the fair value of the financial instruments in excess of the amounts reflected in the condensed consolidated balance sheets. Exposure to market risk is influenced by a number of factors, including the relationships between the financial instruments and the Company’s positions, as well as the volatility and liquidity in the markets in which the financial instruments are traded. The principal risk components of financial instruments include, among other things, interest rate volatility, the duration of the underlying instruments and changes in foreign exchange rates. The Company attempts to manage its exposure to market risk through various techniques. Aggregate market limits have been established and market risk measures are routinely monitored against these limits.
Note 5 – Allowance for Doubtful Accounts
The allowance for doubtful accounts related to receivables from customers was $9.9 million and $7.6 million as of June 30, 2018 and September 30, 2017, respectively. The allowance for doubtful accounts related to deposits with and receivables from broker-dealers, clearing organizations, and counterparties was $48.1 million and $47.0 million as of June 30, 2018 and September 30, 2017, respectively.
During the three months ended June 30, 2018, the Company recorded bad debt expense of $1.6 million. The bad debt expense was primarily related to agricultural OTC customer account deficits in the Company’s Commercial Hedging segment partially offset by the recovery of a precious metals customer trading account deficit in the Company’s Physical Commodities segment. During the three months ended June 30, 2017, the Company recorded bad debt expense of $0.1 million.
During the nine months ended June 30, 2018, the Company recorded bad debt expense of $2.9 million. The provision for bad debts was primarily related an additional provision of $1.0 million related to a bad debt in the physical coal business for amounts due to the Company from a coal supplier for demurrage and other charges related to contracts with delivery dates subsequent to September 30, 2017 and agricultural OTC customer account deficits in the Company’s Commercial Hedging segment. During the nine months ended June 30, 2017, the Company recorded bad debt expense of $3.9 million, primarily related to $3.8 million of LME Metals customer deficits in the Company’s Commercial Hedging Segment.
Note 6 – Physical Commodities Inventory
The Company’s inventories consist of finished physical commodities. Inventories by component of the Company’s Physical Commodities segment are shown below.
(in millions) | June 30, 2018 | September 30, 2017 | |||||
Physical Ag & Energy(1) | $ | 103.5 | $ | 65.1 | |||
Precious metals - held by broker-dealer subsidiary(2) | 8.9 | 13.3 | |||||
Precious metals - held by non-broker-dealer subsidiaries(3) | 100.4 | 46.4 | |||||
Physical commodities inventory | $ | 212.8 | $ | 124.8 | |||
(1) Physical Ag & Energy maintains agricultural commodity inventories, including corn, soybeans, wheat, dried distillers grain, canola, sorghum, coffee, cocoa, cotton, and others. The agricultural commodity inventories are carried at net realizable value, which approximates fair value less disposal costs, with changes in net realizable value included as a component of ‘cost of sales of physical commodities’ on the condensed consolidated income statements. The agricultural inventories have reliable, readily determinable and realizable market prices, have relatively insignificant costs of disposal and are available for immediate delivery. Physical Ag & Energy also maintains energy related inventory, primarily kerosene, which is valued at the lower of cost or net realizable value.
17
(2) Precious metals held by the Company’s subsidiary, INTL FCStone Ltd, a United Kingdom based broker-dealer subsidiary, is measured at fair value, with changes in fair value included as a component of ‘trading gains, net’ on the condensed consolidated income statements, in accordance with U.S. GAAP accounting requirements for broker-dealers.
(3) Precious metals inventory held by subsidiaries that are not broker-dealers are valued at the lower of cost or net realizable value.
The Company has recorded lower of cost or net realizable adjustments for certain precious metals inventory of $0.0 million and $0.7 million as of June 30, 2018 and September 30, 2017, respectively. The adjustments are included in ‘cost of sales of physical commodities’ in the condensed consolidated income statements.
Note 7 – Goodwill
The carrying value of goodwill is allocated to the Company’s operating segments as follows:
(in millions) | June 30, 2018 | September 30, 2017 | |||||
Commercial Hedging | $ | 30.3 | $ | 30.7 | |||
Global Payments | 6.3 | 6.3 | |||||
Physical Commodities | 2.4 | 2.4 | |||||
Securities | 6.8 | 7.7 | |||||
Goodwill | $ | 45.8 | $ | 47.1 | |||
The Company recorded $1.3 million in foreign exchange revaluation adjustments on goodwill for the nine months ended June 30, 2018.
Note 8 – Intangible Assets
The gross and net carrying values of intangible assets as of the balance sheet dates, by major intangible asset class are as follows (in millions):
June 30, 2018 | September 30, 2017 | ||||||||||||||||||||||
Gross Amount | Accumulated Amortization | Net Amount | Gross Amount | Accumulated Amortization | Net Amount | ||||||||||||||||||
Intangible assets subject to amortization: | |||||||||||||||||||||||
Software programs/platforms | $ | 2.7 | $ | (2.5 | ) | $ | 0.2 | $ | 2.7 | $ | (2.5 | ) | $ | 0.2 | |||||||||
Customer base | 20.0 | (9.6 | ) | 10.4 | 20.0 | (7.9 | ) | 12.1 | |||||||||||||||
Total intangible assets | $ | 22.7 | $ | (12.1 | ) | $ | 10.6 | $ | 22.7 | $ | (10.4 | ) | $ | 12.3 | |||||||||
Amortization expense related to intangible assets was $1.7 million and $2.1 million for the nine months ended June 30, 2018 and 2017, respectively. Amortization expense related to intangible assets was $0.6 million and $0.7 million for the three months ended June 30, 2018 and 2017, respectively.
As of June 30, 2018, the estimated future amortization expense was as follows:
(in millions) | |||
Fiscal 2018 (remaining three months) | $ | 0.6 | |
Fiscal 2019 | 2.2 | ||
Fiscal 2020 | 2.0 | ||
Fiscal 2021 | 1.9 | ||
Fiscal 2022 and thereafter | 3.9 | ||
$ | 10.6 | ||
18
Note 9 – Credit Facilities
Variable-Rate Credit Facilities
The Company has four committed credit facilities under which the Company and its subsidiaries may borrow up to $594.5 million, subject to the terms and conditions for these facilities. The amounts outstanding under these credit facilities are short term borrowings and carry variable rates of interest, thus approximating fair value. The Company’s committed credit facilities consist of the following:
• | $262.0 million facility available to INTL FCStone Inc. for general working capital requirements. |
• | $75.0 million facility available to the Company’s wholly owned subsidiary, INTL FCStone Financial Inc., for short-term funding of margin to commodity exchanges. The facility is subject to annual review and guaranteed by INTL FCStone Inc. |
• | $232.5 million facility available to the Company’s wholly owned subsidiary, FCStone Merchant Services, LLC, for financing traditional commodity financing arrangements and commodity repurchase agreements. The facility is guaranteed by INTL FCStone Inc. |
• | $25.0 million facility available to the Company’s wholly owned subsidiary, INTL FCStone Ltd, for short-term funding of margin to commodity exchanges. The facility is subject to annual review and is guaranteed by INTL FCStone Inc. |
The Company also has a secured, uncommitted loan facility, under which the Company’s wholly owned subsidiary, INTL FCStone Ltd, may borrow up to approximately $25.0 million, collateralized by commodities warehouse receipts, to facilitate financing of commodities under repurchase agreement services to its customers, subject to certain terms and conditions of the credit agreement. There were no borrowings outstanding under this credit facility as of June 30, 2018 and September 30, 2017.
The Company also has a secured, uncommitted loan facility, under which the Company’s wholly owned subsidiary, INTL FCStone Financial Inc., may borrow up to $75.0 million, collateralized by commodities warehouse receipts, to facilitate U.S. commodity exchange deliveries of its customers, subject to certain terms and conditions of the credit agreement. There were zero and $23.0 million in borrowings outstanding under this credit facility as of June 30, 2018, and September 30, 2017, respectively.
The Company also has a secured, uncommitted loan facility, under which the Company’s wholly owned subsidiary, INTL FCStone Financial Inc., may borrow for short term funding of firm and customer securities margin requirements, subject to certain terms and conditions of the agreement. The uncommitted amount available to be borrowed is not specified, and all requests for borrowing are subject to the sole discretion of the lender. The borrowings are secured by first liens on firm owned marketable securities or customer owned securities which have been pledged under a clearing arrangement. The amounts borrowed under the facilities are payable on demand. As of June 30, 2018, there were $48.0 million in borrowings outstanding under this credit facility and no borrowings outstanding as of September 30, 2017.
The Company also has a secured, uncommitted loan facility, under which the Company’s wholly owned subsidiary, INTL FCStone Financial Inc., may borrow up to $100.0 million for short term funding of firm and customer securities margin requirements, subject to certain terms and conditions of the agreement. The borrowings are secured by first liens on firm owned marketable securities or customer owned securities which have been pledged under a clearing arrangement. The amounts borrowed under the facilities are payable on demand. There were zero and $11.0 million in borrowings outstanding under this credit facility as of June 30, 2018, and September 30, 2017, respectively.
Note Payable to Bank
The Company has a loan from a commercial bank, secured by equipment purchased with the proceeds. The note is payable in monthly installments, ending in March 2020. The note bears interest at a rate per annum equal to LIBOR plus 2.00%.
19
The following table sets forth a listing of credit facilities, the current committed amounts as of the report date on the facilities, outstanding borrowings on the facilities, as well as indebtedness on a promissory note as of June 30, 2018 and September 30, 2017:
(in millions) | |||||||||||||||
Credit Facilities | Amounts Outstanding | ||||||||||||||
Borrower | Security | Renewal / Expiration Date | Total Commitment | June 30, 2018 | September 30, 2017 | ||||||||||
Committed Credit Facilities | |||||||||||||||
INTL FCStone Inc. | Pledged shares of certain subsidiaries | March 18, 2019 | $ | 262.0 | $ | 208.7 | $ | 150.0 | |||||||
INTL FCStone Financial, Inc. | None | April 4, 2019 | 75.0 | — | — | ||||||||||
FCStone Merchants Services, LLC | Certain commodities assets | November 1, 2019 | 232.5 | 102.5 | 44.2 | ||||||||||
INTL FCStone Ltd. | None | November 7, 2018 | 25.0 | — | — | ||||||||||
$ | 594.5 | 311.2 | 194.2 | ||||||||||||
Uncommitted Credit Facilities | |||||||||||||||
INTL FCStone Financial, Inc. | Commodities warehouse receipts and certain pledged securities | n/a | $ | — | 48.0 | 34.0 | |||||||||
INTL FCStone Ltd. | Commodities warehouse receipts | n/a | $ | — | — | — | |||||||||
Note Payable to Bank | |||||||||||||||
Monthly installments, due March 2020 and secured by certain equipment | 1.4 | 2.0 | |||||||||||||
Total Payables to lenders under loans | $ | 360.6 | $ | 230.2 | |||||||||||
As reflected above, $362.0 million of the Company’s committed credit facilities are scheduled to expire within twelve months of this filing. The Company intends to renew or replace the facilities when they expire, and based on the Company’s liquidity position and capital structure, the Company believes it will be able to do so.
The Company’s credit facility agreements contain financial covenants relating to financial measures on a consolidated basis, as well as on a certain stand-alone subsidiary basis, including minimum tangible net worth, minimum regulatory capital, minimum net unencumbered liquid assets, maximum net loss, minimum fixed charge coverage ratio and maximum funded debt to net worth ratio. Failure to comply with these covenants could result in the debt becoming payable on demand. As of June 30, 2018, the Company was in compliance with all of its financial covenants under its credit facilities.
Note 10 – Securities and Commodity Financing Transactions
The Company’s outstanding notes receivable in connection with repurchase agreements for agricultural and energy commodities, whereby the customers sell to the Company certain commodity inventory and agree to repurchase the commodity inventory at a future date at a fixed price were $1.0 million and $0.8 million as of June 30, 2018 and September 30 2017, respectively.
The Company enters into securities purchased under agreements to resell, securities sold under agreements to repurchase, securities borrowed and securities loaned transactions to, among other things, finance financial instruments, acquire securities to cover short positions, acquire securities for settlement, and to accommodate counterparties’ needs. These agreements are recorded as collateralized financings at their contractual amounts plus accrued interest. The related interest is recorded in the condensed consolidated income statements as interest income or interest expense, as applicable. In connection with these agreements and transactions, it is the policy of the Company to receive or pledge cash or securities to adequately collateralize such agreements and transactions in accordance with general industry guidelines and practices. The value of the collateral is valued daily and the Company may require counterparties to deposit additional collateral or return collateral pledged, when appropriate. The carrying amounts of these agreements and transactions approximate fair value due to their short-term nature and the level of collateralization.
The Company pledges financial instruments owned to collateralize repurchase agreements. At June 30, 2018 and September 30, 2017, financial instruments owned, at fair value of $17.3 million and $19.4 million, respectively, were pledged as collateral under repurchase agreements. The counterparty has the right to repledge the collateral in connection with these transactions. These financial instruments owned have been pledged as collateral and have been parenthetically disclosed on the condensed consolidated balance sheet.
20
The Company also has repledged securities borrowed and customer securities held under custodial clearing arrangements to collateralize securities loaned agreements with a fair value of $193.9 million and $108.4 million as of June 30, 2018, and September 30, 2017, respectively. Additionally, the Company has also pledged customer securities held under custodial clearing arrangements with a fair value of $58.8 million and $12.7 million as of June 30, 2018, and September 30, 2017, respectively, to collateralize uncommitted loan facilities with certain banks as discussed further in Note 9.
In addition, as of June 30, 2018 and September 30, 2017, the Company pledged financial instruments owned, at fair value of $1,364.5 million and $1,306.4 million, respectively, and securities received under reverse repurchase agreements of $252.1 million and $100.2 million, respectively, to cover collateral requirements for tri-party repurchase agreements. For these securities, the counterparties do not have the right to sell or repledge the collateral and, therefore, they have not been parenthetically disclosed on the condensed consolidated balance sheet.
At June 30, 2018, the Company has accepted collateral that it is permitted by contract to sell or repledge. This collateral consists primarily of securities received in reverse repurchase agreements, securities borrowed agreements, and margin securities held on behalf of correspondent brokers under custodial clearing agreements. The fair value of such collateral at June 30, 2018 and September 30, 2017, was $1,091.3 million and $631.7 million, respectively, of which $515.6 million and $306.9 million, respectively, was used to cover securities sold short which are recorded in financial instruments sold, not yet purchased on the condensed consolidated balance sheet. In the normal course of business, this collateral is used by the Company to cover financial instruments sold, not yet purchased, to obtain financing in the form of repurchase agreements or bank loans, and to meet counterparties’ needs under lending arrangements.
The following tables provide the contractual maturities of gross obligations under repurchase and securities lending agreements as of June 30, 2018 and September 30, 2017 (in millions):
June 30, 2018 | |||||||||||||||
Overnight and Open | Less than 30 Days | 30-90 Days | Over 90 Days | Total | |||||||||||
Securities sold under agreements to repurchase | $ | 699.1 | $ | 584.9 | $ | 305.0 | $ | 10.0 | $ | 1,599.0 | |||||
Securities loaned | 204.3 | — | — | — | 204.3 | ||||||||||
Gross amount of secured financing | $ | 903.4 | $ | 584.9 | $ | 305.0 | $ | 10.0 | $ | 1,803.3 | |||||
September 30, 2017 | |||||||||||||||
Overnight and Open | Less than 30 Days | 30-90 Days | Over 90 Days | Total | |||||||||||
Securities sold under agreements to repurchase | $ | 640.2 | $ | 432.9 | $ | 320.0 | $ | — | $ | 1,393.1 | |||||
Securities loaned | 111.1 | — | — | — | 111.1 | ||||||||||
Gross amount of secured financing | $ | 751.3 | $ | 432.9 | $ | 320.0 | $ | — | $ | 1,504.2 | |||||
The following table provides the underlying collateral types of the gross obligations under repurchase and securities lending agreements as of June 30, 2018 and September 30, 2017 (in millions):
Securities sold under agreements to repurchase: | June 30, 2018 | September 30, 2017 | |||||
U.S. Treasury obligations | $ | 3.0 | $ | 7.0 | |||
U.S. government agency obligations | 342.6 | 332.6 | |||||
Asset-backed obligations | 77.6 | 36.4 | |||||
Agency mortgage-backed obligations | 1,175.8 | 1,017.1 | |||||
Total securities sold under agreements to repurchase | 1,599.0 | 1,393.1 | |||||
Securities loaned: | |||||||
Common stock | 204.3 | 111.1 | |||||
Total securities loaned | 204.3 | 111.1 | |||||
Gross amount of secured financing | $ | 1,803.3 | $ | 1,504.2 | |||
21
Note 11 – Commitments and Contingencies
Legal Proceedings
From time to time and in the ordinary course of business, the Company is involved in various legal actions and proceedings, including tort claims, contractual disputes, employment matters, workers’ compensation claims and collections. The Company carries insurance that provides protection against certain types of claims, up to the policy limits of the insurance.
As of June 30, 2018 and September 30, 2017, the condensed consolidated balance sheets include loss contingency accruals which are not material, individually or in the aggregate, to the Company’s financial position or liquidity. In the opinion of management, possible exposure from loss contingencies in excess of the amounts accrued, is not likely to be material to the Company’s earnings, financial position or liquidity.
The following is a summary of a significant legal matter involving the Company:
Sentinel Litigation
Prior to the July 1, 2015 merger into INTL FCStone Financial, our subsidiary, FCStone, LLC, had a portion of its excess segregated funds invested with Sentinel Management Group Inc. (“Sentinel”), a registered futures commission merchant (“FCM”) and an Illinois-based money manager that provided cash management services to other FCMs. In August 2007, Sentinel halted redemptions to customers and sold certain of the assets it managed to an unaffiliated third party at a significant discount. On August 17, 2007, subsequent to Sentinel’s sale of certain assets, Sentinel filed for bankruptcy protection. In aggregate, $15.5 million of FCStone, LLC’s $21.9 million in invested funds were returned to it before and after Sentinel’s bankruptcy petition. A further amount of $2.0 million was held by the bankruptcy trustee in reserve in the name of FCStone, LLC.
In August 2008, the bankruptcy trustee of Sentinel filed adversary legal proceedings against FCStone, LLC and a number of other FCMs, seeking recovery of pre- and post-petition transfers totaling $15.5 million.
On April 23, 2018, following ten years of legal proceedings and a final ruling by the United States Court of Appeals for the Seventh Circuit against the trustee and in favor of INTL FCStone Financial, the United States Supreme Court denied the trustee’s petition for writ of certiorari. Following this, on May 1, 2018, INTL FCStone Financial received funds from the reserve account in the amount of $2.0 million. This amount is presented in ‘other gain’ in the condensed consolidated income statement.
The Company’s assessments are based on estimates and assumptions that have been deemed reasonable by management, but that may later prove to be incomplete or inaccurate, and unanticipated events and circumstances may occur that might cause it to change those estimates and assumptions.
Contractual Commitments
Self-Insurance
The Company self-insures its costs related to medical and dental claims. The Company is self-insured, up to a stop loss amount, for eligible participating employees and retirees, and for qualified dependent medical and dental claims, subject to deductibles and limitations. As of June 30, 2018, the Company had $0.8 million accrued for self-insured medical and dental claims included in ‘accounts payable and other liabilities’ in the condensed consolidated balance sheet.
22
Note 12 – Capital and Other Regulatory Requirements
The Company’s activities are subject to significant governmental regulation, both in the United States and in the international jurisdictions in which it operates. The subsidiaries of the Company were in compliance with all of their regulatory requirements as of June 30, 2018, as follows:
(in millions) | As of June 30, 2018 | |||||||||||
Subsidiary | Regulatory Authority | Jurisdiction | Requirement Type | Actual | Minimum Requirement | |||||||
INTL FCStone Financial Inc. | SEC and Commodity Futures Trading Commission ("CFTC") | United States | Net capital | $ | 157.0 | $ | 93.3 | |||||
INTL FCStone Financial Inc. | CFTC | United States | Segregated funds | $ | 2,452.9 | $ | 2,397.0 | |||||
INTL FCStone Financial Inc. | CFTC | United States | Secured funds | $ | 162.6 | $ | 144.8 | |||||
INTL FCStone Financial Inc. | SEC | United States | Customer reserve | $ | — | $ | — | |||||
INTL FCStone Financial Inc. | SEC | United States | PAB reserve | $ | — | $ | — | |||||
INTL Custody & Clearing Solutions Inc. | SEC | United States | Net capital | $ | 2.0 | $ | 0.1 | |||||
SA Stone Wealth Management Inc. | SEC | United States | Net capital | $ | 3.7 | $ | 0.5 | |||||
INTL FCStone Ltd(1) | Financial Conduct Authority ("FCA") | United Kingdom | Net capital | $ | 193.2 | $ | 91.7 | |||||
INTL FCStone Ltd | FCA | United Kingdom | Segregated funds | $ | 167.4 | $ | 163.4 | |||||
INTL Netherlands BV(1) | FCA | United Kingdom | Net capital | $ | 192.4 | $ | 91.7 | |||||
INTL FCStone DTVM Ltda. | Brazilian Central Bank and Securities and Exchange Commission of Brazil | Brazil | Capital adequacy | $ | 11.6 | $ | 2.2 | |||||
INTL Gainvest S.A. | National Securities Commission ("CNV") | Argentina | Capital adequacy | $ | 4.7 | $ | 0.1 | |||||
INTL Gainvest S.A. | CNV | Argentina | Net capital | $ | 1.4 | $ | 0.1 | |||||
INTL CIBSA S.A. | CNV | Argentina | Capital adequacy | $ | 4.8 | $ | 0.6 | |||||
INTL CIBSA S.A. | CNV | Argentina | Net capital | $ | 0.9 | $ | 0.4 | |||||
(1) INTL Netherlands BV is a holding company that includes the ownership equity of INTL FCStone Ltd. The associated net capital amounts and minimum requirements should not be considered in aggregate.
Certain other non-U.S. subsidiaries of the Company are also subject to capital adequacy requirements promulgated by authorities of the countries in which they operate. As of June 30, 2018, these subsidiaries were in compliance with their local capital adequacy requirements.
Note 13 – Other Expenses
Other expenses for the three and nine months ended June 30, 2018 and 2017 consisted of the following:
Three Months Ended June 30, | Nine Months Ended June 30, | ||||||||||||||
(in millions) | 2018 | 2017 | 2018 | 2017 | |||||||||||
Contingent consideration, net | $ | — | $ | — | $ | — | $ | 0.1 | |||||||
Insurance | 0.7 | 0.7 | 1.9 | 2.0 | |||||||||||
Advertising, meetings and conferences | 1.0 | 1.0 | 5.3 | 3.1 | |||||||||||
Office supplies and printing | 0.5 | 0.6 | 1.3 | 1.7 | |||||||||||
Other clearing related expenses | 0.8 | 0.9 | 1.8 | 1.6 | |||||||||||
Other non-income taxes | 1.3 | 1.2 | 3.8 | 3.5 | |||||||||||
Other | 1.7 | 2.3 | 6.3 | 6.9 | |||||||||||
Total other expenses | $ | 6.0 | $ | 6.7 | $ | 20.4 | $ | 18.9 | |||||||
23
Note 14 – Accumulated Other Comprehensive Loss, Net
Comprehensive income consists of net income and other gains and losses affecting stockholders’ equity that, under U.S. GAAP, are excluded from net income. Other comprehensive loss includes net actuarial losses from defined benefit pension plans and foreign currency translation adjustments.
The following table summarizes the changes in accumulated other comprehensive loss, net for the nine months ended June 30, 2018.
(in millions) | Foreign Currency Translation Adjustment | Pension Benefits Adjustment | Accumulated Other Comprehensive Loss | |||||||||
Balances as of September 30, 2017 | $ | (21.5 | ) | $ | (3.0 | ) | $ | (24.5 | ) | |||
Other comprehensive loss, net of tax | (8.7 | ) | — | (8.7 | ) | |||||||
Balances as of June 30, 2018 | $ | (30.2 | ) | $ | (3.0 | ) | $ | (33.2 | ) | |||
Note 15 – Income Taxes
The income tax provision for interim periods is comprised of tax on ordinary income (loss) provided at the most recent estimated annual effective tax rate, adjusted for the tax effect of discrete items. Management uses an estimated annual effective tax rate based on the forecasted pretax income (loss) and statutory tax rates in the various jurisdictions in which it operates. The Company’s effective tax rate differs from the U.S. statutory rate primarily due to state and local taxes, and differing statutory tax rates applied to the income of non-U.S. subsidiaries. The Company records the tax effect of certain discrete items, including the effects of changes in tax laws, tax rates and adjustments with respect to valuation allowances or other unusual or nonrecurring tax adjustments, in the interim period in which they occur, as an addition to, or reduction from, the income tax provision, rather than being included in the estimated effective annual income tax rate. In addition, jurisdictions with a projected loss for the year or a year-to-date loss where no tax benefit can be recognized are excluded from the estimated annual effective income tax rate.
The Company is required to assess its deferred tax assets and the need for a valuation allowance at each reporting period. This assessment requires judgment on the part of management with respect to benefits that may be realized. The Company will record a valuation allowance against deferred tax assets when it is considered more likely than not that all or a portion of the deferred tax assets will not be realized.
Effects of the Tax Cuts and Jobs Act
On December 22, 2017, the President of the United States signed and enacted into law H.R. 1, the Tax Cuts and Jobs Act (“the Tax Reform”). Among the significant changes to the U.S. Internal Revenue Code, the Tax Reform lowers the U.S. federal corporate income tax rate from 35% to 21%, effective January 1, 2018. The Company will compute its income tax expense (benefit) for the September 30, 2018 tax year using a U.S. statutory tax rate of 24.5%. The 21% U.S. statutory tax rate will apply to fiscal years ending September 30, 2019 and thereafter. For the nine months ended June 30, 2018, the Company recorded tax expense of $8.8 million related to the remeasurement of deferred tax assets and liabilities. For the three months ended December 31, 2017, the Company recorded tax expense of $8.9 million related to the remeasurement of deferred tax assets and liabilities. Due to additional information becoming available in the three months ended March 31, 2018, the Company recorded a benefit of $0.1 million related to the remeasurement of deferred tax assets and liabilities. There were no adjustments recorded in the three months ended June 30, 2018. This amount remains provisional. The Tax Reform also includes a one-time mandatory repatriation transition tax on previously untaxed accumulated and current earnings and profits (E&P) of certain of the Company’s foreign subsidiaries. To determine the amount of the transition tax, the Company must determine, in addition to other factors, the amount of post 1986 E&P of the relevant subsidiaries, as well as the amount of non-US income taxes paid on such earnings. The Company made a reasonable estimate of the transition tax and recorded a provisional transition tax obligation of $12.0 million in the three months ended December 31, 2017. In the three months ended March 31, 2018, the Company recorded a benefit of $0.7 million due to revised E&P computations, net operating loss carryforward available, and revised non-US income taxes paid. There were no adjustments recorded in the three months ended June 30, 2018. The total provisional transition tax obligation to date is $11.3 million. The Company continues to gather additional information to more precisely compute the amount of the transition tax.
The SEC staff issued Staff Accounting Bulletin No. 118 (SAB 118), which provides guidance on accounting for the tax effects of the Tax Reform. SAB 118 provides a measurement period that should not extend beyond one year from the Tax Reform enactment date for companies to complete the accounting under ASC 740. In accordance with SAB 118, a company must reflect the income tax effects of those aspects of the Tax Reform for which the accounting under ASC 740 is complete. To the extent that a company’s accounting for certain income tax effects of the Tax Reform is incomplete but it can determine a reasonable estimate, it must record a provisional estimate in the financial statements. If a company cannot determine a
24
provisional estimate to be included in the financial statements, it should continue to apply ASC 740 based on the tax laws that were in effect immediately before the enactment of the Tax Reform.
While the Company can make reasonable estimates of the impact of the reduction in corporate rate and the deemed repatriation transition tax, the final impact of the Tax Reform may differ from these estimates, due to, among other things, changes in interpretations and assumptions, additional guidance that may be issued by taxing authorities, and actions the Company may take.
The Tax Reform also establishes new tax laws that will affect the fiscal year ending September 30, 2019, including, but not limited to, (1) elimination of the corporate alternative minimum tax, (2) a new provision designed to tax global intangible low-taxed income (GILTI), (3) limitations on the utilization of net operating losses generated after December 31, 2017 to 80 percent of taxable income per tax year, (4) the creation of the base erosion anti-abuse tax (BEAT), (5) a general elimination of U.S. federal income taxes on dividends from foreign subsidiaries, and (6) limitations on the deductibility of certain executive compensation.
Effects of tax law changes where a reasonable estimate of the accounting effects has not yet been made include additional limitations on certain meals and entertainment expenses and the unlimited carryforward of net operating losses. The Company has also not yet determined the potential tax impact of provisions that are not yet effective, such as GILTI, BEAT, elimination of U.S. tax on dividends of future foreign earnings, and a limitation of the utilization of net operating losses generated after fiscal 2018 to 80 percent of taxable income per tax year. The Company expects to make the policy election to treat GILTI as a period expense in the fiscal year ending September 30, 2019.
Current and Prior Period Tax Expense
Income tax expense of $8.9 million and $2.3 million for the three months ended June 30, 2018 and 2017, respectively, and income tax expense of $41.2 million and $7.7 million for the nine months ended June 30, 2018 and 2017, respectively, reflect estimated federal, foreign, state and local taxes. Due to Tax Reform, the Company recorded discrete expense of $20.1 million. This consists of expense of $20.9 million in the three months ended December 31, 2017, and benefit of $0.8 million in the three months ended March 31, 2018. There were no adjustments recoded in the three months ended June 30, 2018. Tax expense, excluding the discrete expense related to the Tax Reform, was $8.8 million for the three months ended June 30, 2018, and $21.0 million for the nine months ended June 30, 2018.
For the three months ended June 30, 2018 and 2017, the Company’s effective tax rate was 27% and 15%, respectively. For the nine months ended June 30, 2018 and 2017, the Company’s effective tax rate was 51% and 20%, respectively. For the nine months ended June 30, 2018, the discrete expense of $20.1 million related to Tax Reform, increased the effective tax rate by 25%. The effective rate for the nine months ended June 31, 2018 was 26%, excluding the impacts of Tax Reform. The Company’s effective tax rate decreased 0.4% due to excess tax benefits on share-based compensation recognized through the first nine months of 2018 related to the adoption of ASU 2016-09. See Note 1 for more information regarding the adoption of ASU 2016-09. The effective rate, excluding the impacts of Tax Reform, was higher than the U.S. federal statutory rate due to U.S. state and local taxes and foreign permanent differences.
The valuation allowance for deferred tax assets as of June 30, 2018 and September 30, 2017 was $4.5 million and $4.0 million, respectively. The valuation allowances as of June 30, 2018 and September 30, 2017 were primarily related to U.S., state and local and foreign net operating loss carryforwards that, in the judgment of management, are not more likely than not to be realized. In assessing the realizability of deferred tax assets, management considers whether it is more likely than not that some or all of the deferred tax assets will not be realized.
The Company incurred U.S. federal, state, and local taxable (losses) income for the fiscal years ended September 30, 2017, 2016, and 2015 of $(20.5) million, $(9.7) million and $16.5 million, respectively. The differences between actual levels of past taxable (losses) income and pre-tax book (losses) income are primarily attributable to temporary differences in these jurisdictions. When evaluating if U.S. federal, state, and local deferred tax assets are realizable, the Company considered deferred tax liabilities of $3.3 million that are scheduled to reverse from 2018 to 2020 and $2.2 million of deferred tax liabilities associated with unrealized gains in securities which the Company could sell, if necessary. Furthermore, the Company considered its ability to implement business and tax planning strategies that would allow the remaining U.S. federal, state, and local deferred tax assets, net of valuation allowances, to be realized within approximately 5 years. Based on the tax planning strategies that are prudent and feasible, management believes that it is more likely than not that the Company will realize the tax benefit of the deferred tax assets, net of the existing valuation allowance, in the future. However, the realization of deferred income taxes is dependent on future events, and changes in estimates in future periods could result in adjustments to the valuation allowance.
The Company and its subsidiaries file income tax returns with the U.S. federal jurisdiction and various state, local and foreign jurisdictions. The Company has open tax years ranging from September 30, 2010 through September 30, 2017 with U.S. federal and state and local taxing authorities. In the U.K., the Company has open tax years ranging from September 30, 2016 to
25
September 30, 2017. In Brazil, the Company has open tax years ranging from December 31, 2012 through December 31, 2017. In Argentina, the Company has open tax years ranging from September 30, 2010 to September 30, 2017. In Singapore, the Company has open tax years ranging from September 30, 2012 to September 30, 2017.
Note 16 – Segment Analysis
The Company reports its operating segments based on services provided to customers. The Company’s business activities are managed as operating segments and organized into reportable segments as follows:
• | Commercial Hedging (includes components Financial Agricultural (Ag) & Energy and LME Metals) |
• | Global Payments |
• | Securities (includes components Equity Market-Making, Debt Trading, Investment Banking, and Asset Management) |
• | Physical Commodities (includes components Precious Metals and Physical Ag & Energy) |
• | Clearing and Execution Services (includes components Exchange-traded Futures & Options, FX Prime Brokerage, Correspondent Clearing, Independent Wealth Management, and Derivative Voice Brokerage) |
The total revenues reported combine gross revenues for the physical commodities business for subsidiaries that are not broker-dealers and net revenues for all other businesses. In order to reflect the way that the Company’s management views the results, the table below also reflects the segment contribution to ‘operating revenues’, which is shown on the face of the condensed consolidated income statements and which is calculated by deducting physical commodities cost of sales from total revenues.
Segment data includes the profitability measure of net contribution by segment. Net contribution is one of the key measures used by management to assess the performance of each segment and for decisions regarding the allocation of the Company’s resources. Net contribution is calculated as revenue less direct cost of sales, transaction-based clearing expenses, variable compensation, introducing broker commissions, and interest expense. Variable compensation paid to risk management consultants/traders generally represents a fixed percentage of revenues generated, and in some cases, revenues generated less transaction-based clearing charges, base salaries and an overhead allocation.
Segment data also includes segment income which is calculated as net contribution less non-variable direct expenses of the segment. These non-variable direct expenses include trader base compensation and benefits, operational employee compensation and benefits, communication and data services, business development, professional fees, bad debt expense and other direct expenses.
Inter-segment revenues, charges, receivables and payables are eliminated upon consolidation, except revenues and costs related to foreign currency transactions undertaken on an arm’s length basis by the foreign exchange trading business for the securities business. The foreign exchange trading business competes for this business as it does any other business. If its rates are not competitive, the securities businesses buy or sell their foreign currency through other market counterparties.
On a recurring basis, the Company sweeps excess cash from certain U.S. operating segments to a centralized corporate treasury function in exchange for an intercompany receivable asset. The intercompany receivable asset is eliminated during consolidation, and therefore this practice may impact reported total assets between segments.
26
Information for the reportable segments is shown in accordance with the Segment Reporting Topic of the ASC as follows
Three Months Ended June 30, | Nine Months Ended June 30, | ||||||||||||||
(in millions) | 2018 | 2017 | 2018 | 2017 | |||||||||||
Total revenues: | |||||||||||||||
Commercial Hedging | $ | 77.9 | $ | 57.1 | $ | 217.7 | $ | 177.3 | |||||||
Global Payments | 26.0 | 22.5 | 74.0 | 67.1 | |||||||||||
Securities | 49.9 | 40.0 | 148.4 | 115.3 | |||||||||||
Physical Commodities | 6,873.4 | 5,320.3 | 20,852.3 | 16,495.2 | |||||||||||
Clearing and Execution Services | 88.9 | 65.4 | 249.1 | 193.2 | |||||||||||
Corporate unallocated | 2.2 | 0.6 | 2.4 | (7.0 | ) | ||||||||||
Total | $ | 7,118.3 | $ | 5,505.9 | $ | 21,543.9 | $ | 17,041.1 | |||||||
Operating revenues (loss): | |||||||||||||||
Commercial Hedging | $ | 77.9 | $ | 57.1 | $ | 217.7 | $ | 177.3 | |||||||
Global Payments | 26.0 | 22.5 | 74.0 | 67.1 | |||||||||||
Securities | 49.9 | 40.0 | 148.4 | 115.3 | |||||||||||
Physical Commodities | 14.9 | 12.0 | 41.0 | 33.0 | |||||||||||
Clearing and Execution Services | 88.9 | 65.4 | 249.1 | 193.2 | |||||||||||
Corporate unallocated | 2.2 | 0.6 | 2.4 | (7.0 | ) | ||||||||||
Total | $ | 259.8 | $ | 197.6 | $ | 732.6 | $ | 578.9 | |||||||
Net operating revenues (loss): | |||||||||||||||
Commercial Hedging | $ | 61.0 | $ | 44.2 | $ | 172.0 | $ | 140.3 | |||||||
Global Payments | 24.7 | 20.3 | 69.6 | 60.0 | |||||||||||
Securities | 23.6 | 24.6 | 74.7 | 73.8 | |||||||||||
Physical Commodities | 11.4 | 10.2 | 32.3 | 27.3 | |||||||||||
Clearing and Execution Services | 32.7 | 25.6 | 91.9 | 75.1 | |||||||||||
Corporate unallocated | 1.2 | (1.6 | ) | (1.3 | ) | (15.0 | ) | ||||||||
Total | $ | 154.6 | $ | 123.3 | $ | 439.2 | $ | 361.5 | |||||||
Net contribution: | |||||||||||||||
(Revenues less cost of sales of physical commodities, transaction-based clearing expenses, variable compensation, introducing broker commissions and interest expense) | |||||||||||||||
Commercial Hedging | $ | 44.3 | $ | 32.6 | $ | 125.5 | $ | 102.9 | |||||||
Global Payments | 19.9 | 16.2 | 55.9 | 47.9 | |||||||||||
Securities | 17.5 | 20.2 | 55.6 | 58.9 | |||||||||||
Physical Commodities | 8.1 | 7.6 | 23.1 | 19.9 | |||||||||||
Clearing and Execution Services | 24.4 | 19.1 | 68.8 | 56.7 | |||||||||||
Total | $ | 114.2 | $ | 95.7 | $ | 328.9 | $ | 286.3 | |||||||
Segment income: | |||||||||||||||
(Net contribution less non-variable direct segment costs) | |||||||||||||||
Commercial Hedging | $ | 25.3 | $ | 16.3 | $ | 74.0 | $ | 50.4 | |||||||
Global Payments | 16.0 | 12.9 | 44.1 | 37.8 | |||||||||||
Securities | 10.3 | 12.9 | 34.1 | 37.5 | |||||||||||
Physical Commodities | 5.1 | 4.3 | 11.8 | 11.2 | |||||||||||
Clearing and Execution Services | 13.7 | 6.5 | 36.9 | 20.1 | |||||||||||
Total | $ | 70.4 | $ | 52.9 | $ | 200.9 | $ | 157.0 | |||||||
Reconciliation of segment income to income before tax: | |||||||||||||||
Segment income | $ | 70.4 | $ | 52.9 | $ | 200.9 | $ | 157.0 | |||||||
Net costs not allocated to operating segments | 39.5 | 37.9 | 121.9 | 119.3 | |||||||||||
Other gain | 2.0 | — | 2.0 | — | |||||||||||
Income before tax | $ | 32.9 | $ | 15.0 | $ | 81.0 | $ | 37.7 | |||||||
(in millions) | As of June 30, 2018 | As of September 30, 2017 | |||||||||||||
Total assets: | |||||||||||||||
Commercial Hedging | $ | 1,848.5 | $ | 1,650.3 | |||||||||||
Global Payments | 284.3 | 199.5 | |||||||||||||
Securities | 2,712.7 | 2,101.7 | |||||||||||||
Physical Commodities | 307.4 | 339.5 | |||||||||||||
Clearing and Execution Services | 2,026.3 | 1,818.9 | |||||||||||||
Corporate unallocated | 105.7 | 133.5 | |||||||||||||
Total | $ | 7,284.9 | $ | 6,243.4 | |||||||||||
27
Note 17 - Acquisitions
On June 12, 2018, the Company executed a sale and purchase agreement to acquire Carl Kliem S.A. Carl Kliem S.A. is an independent interdealer broker based in Luxembourg, a leading European financial hub, which provides foreign exchange, interest rate and fixed income products to a diverse, institutional client base across the European Union. Carl Kliem S.A. employs approximately 40 people and has over 400 active institutional clients. The closing of the agreement is conditional upon approval of the Luxembourg financial sector supervisory authority, the Commission de Surveillance du Secteur Financier. The purchase price is equal to the net tangible book value on the completion date minus restructuring costs and is not expected to be material to the Company.
Item 2. Management’s Discussion and Analysis of Financial Condition and Results of Operations
Throughout this document, unless the context otherwise requires, the terms “Company”, “we”, “us” and “our” refer to INTL FCStone Inc. and its consolidated subsidiaries. INTL FCStone Inc. is a Delaware corporation.
The following discussion and analysis should be read in conjunction with the financial statements and notes thereto appearing elsewhere in this report. This Quarterly Report on Form 10-Q contains “forward-looking statements” within the meaning of Section 27A of the Securities Act of 1933 and Section 21E of the Securities Exchange Act of 1934. These forward-looking statements involve known and unknown risks and uncertainties, many of which are beyond the control of INTL FCStone Inc. and its subsidiaries, including adverse changes in economic, political and market conditions, losses from our market-making and trading activities arising from counter-party failures and changes in market conditions, the possible loss of key personnel, the impact of increasing competition, the impact of changes in government regulation, the possibility of liabilities arising from violations of foreign, federal and state securities laws and the impact of changes in technology in the securities and commodities trading industries. Although we believe that our forward-looking statements are based upon reasonable assumptions regarding our business and future market conditions, there can be no assurances that our actual results will not differ materially from any results expressed or implied by our forward-looking statements. We undertake no obligation to publicly update or revise any forward-looking statements, whether as a result of new information, future events or otherwise. We caution readers that any forward-looking statements are not guarantees of future performance.
Overview
INTL FCStone Inc. is a diversified global financial services organization providing execution, risk management and advisory services, market intelligence, and clearing services across asset classes and markets around the world. We help our customers access market liquidity, maximize profits and manage risk.
We are a leader in the development of specialized financial services in commodities, securities, global payments, foreign exchange and other markets. Our revenues are derived primarily from financial products and advisory services intended to fulfill our customers’ real needs and provide bottom-line benefits to their businesses. We work to create added value for our customers by providing access to global financial markets using our industry and financial expertise, deep partner and network relationships, insight and guidance, and integrity and transparency. We believe our customer-first approach differentiates us from large banking institutions, engenders trust, and has enabled us to establish leadership positions in a number of complex fields in financial markets around the world.
Our leadership positions span markets such as commodity risk management advisory services; global payments; market-making in international equities and other securities; fixed income; correspondent securities clearing and independent wealth management; physical trading and hedging of precious metals and select other commodities; execution of listed futures and options on futures contracts on all major commodity exchanges and foreign currency trading, among others. These businesses are supported by our global infrastructure of regulated operating subsidiaries, advanced technology platform and team of more than 1,600 employees. We currently serve more than 20,000 predominantly wholesale organizations, located in more than 130 countries. Our correspondent clearing and independent wealth management businesses include approximately 50 correspondent clearing relationships with more than 120,000 underlying individual securities accounts, of which 65,000 are related to the independent wealth management business.
Our customers include producers, processors and end-users of nearly all widely traded physical commodities; commercial counterparties who are end-users of our products and services; governmental and non-governmental organizations; and commercial banks, asset managers, introducing broker-dealers, insurance companies, brokers, institutional investors and major investment banks. We believe our customers value us for our focus on their needs, our expertise and flexibility, our global reach, our ability to provide access to hard-to-reach markets and opportunities, and our status as a well-capitalized and regulatory-compliant organization.
We believe we are well positioned to capitalize on key trends impacting the financial services sector. Among others, these trends include the impact of increased regulation on banking institutions and other financial services providers; increased
28
consolidation, especially of smaller sub-scale financial services providers and independent securities clearing firms; the growing importance and complexity of conducting secure cross-border transactions; and the demand among financial institutions to transact with well-capitalized counterparties.
We focus on mitigating exposure to market risk, ensuring adequate liquidity to maintain daily operations and making non-interest expenses variable, to the greatest extent possible.
Effects of the Tax Cuts and Jobs Act
On December 22, 2017, the President of the United States signed and enacted into law H.R. 1, the Tax Cuts and Jobs Act (“the Tax Reform”). Among the significant changes to the U.S. Internal Revenue Code, the Tax Reform lowers the U.S. federal corporate income tax rate from 35% to 21%, effective January 1, 2018. We will compute our income tax expense (benefit) for the September 30, 2018 tax year using a U.S. statutory tax rate of 24.5%. The 21% U.S. statutory tax rate will apply to fiscal years ending September 30, 2019 and thereafter. The Tax Reform also imposes a one-time mandatory repatriation transition tax on previously untaxed accumulated and current earnings and profits (“E&P”) of certain of the Company’s foreign subsidiaries.
Our accounting for certain elements of the Tax Reform is incomplete. However, as of June 30, 2018, we can determine a reasonable estimate for certain effects of the Tax Reform and have recorded an estimate as a provisional amount. The provisional remeasurement of the deferred tax assets and liabilities resulted in $8.8 million of discrete tax expense, which increased the effective tax rate by 11% during the nine months ended June 30, 2018. The provisional remeasurement amount is expected to change as data becomes available allowing more accurate scheduling of the deferred tax assets and liabilities.
To determine the amount of the transition tax, we must determine, in addition to other factors, the amount of post 1986 E&P of the relevant subsidiaries, as well as the amount of non-US income taxes paid on such earnings. We can make a reasonable estimate of the transition tax and recorded a provisional transition tax obligation of $11.3 million, which increased the effective tax rate by 14% during the nine months ended June 30, 2018. We continue to gather additional information to more precisely compute the amount of the transition tax.
While we can make reasonable estimates of the impact of the reduction in corporate rate and the deemed repatriation transition tax, the final impact of the Tax Reform may differ from these estimates, due to, among other things, changes in our interpretations and assumptions, additional guidance that may be issued by taxing authorities, and actions we may take.
The Tax Reform also establishes new tax laws that will affect the fiscal year ending September 30, 2019, including, but not limited to, (1) elimination of the corporate alternative minimum tax, (2) a new provision designed to tax global intangible low-taxed income (GILTI), (3) limitations on the utilization of net operating losses generated after December 31, 2017 to 80 percent of taxable income per tax year, (4) the creation of the base erosion anti-abuse tax (BEAT), (5) a general elimination of U.S. federal income taxes on dividends from foreign subsidiaries, and (6) limitations on the deductibility of certain executive compensation.
Executive Summary
We achieved another strong performance in the third quarter of fiscal 2018, with operating revenues of $259.8 million, representing 31% growth over the prior year. Continued market volatility in our key markets resulted in increased customer activity and a widening of spreads, which combined with increases in short term interest rates and average customer balances resulted in growth in operating revenues across all of our operating segments, including record quarterly operating revenues in both our Global Payments and Clearing and Execution Services segments (“CES”).
The growth in operating revenues was led by our CES segment, which increased $23.5 million versus the prior year, while our largest segment, Commercial Hedging added $20.8 million in operating revenues versus the prior year. The Securities segment added $9.9 million while the Global Payments and Physical Commodities segments increased operating revenues by $3.5 million and $2.9 million, respectively.
Overall, segment income increased 33%, or $17.5 million with the Commercial Hedging and CES segments adding $9.0 million and $7.2 million respectively. In addition, Global Payments segment income increased $3.1 million versus the prior year period. Our Physical Commodities increased segment income by $0.8 million versus the prior year. These gains were partially offset by a $2.6 million decline in segment income in our Securities segment versus the prior year.
Commercial Hedging segment income increased 55%, primarily as a result of strong growth in both exchange-traded and OTC revenues as well as a $3.4 million increase in interest income. Non-variable direct expenses increased $2.7 million, primarily impacted by a $2.5 million increase in bad debt expense related to two customers in our agricultural commodities OTC business.
CES segment income increased 111%, primarily as a result of the increase in operating revenues, most notably a 77% increase in our Exchange-traded Futures & Options business, driven by a 55% increase in exchange-traded volumes as well as a $4.9 million increase in interest income. In addition, cost savings initiatives in our FX Prime Brokerage and Correspondent Clearing businesses resulted in a $1.9 million decline in non-variable direct expenses.
29
Global Payments segment income increased 24%, primarily as a result of the increase in operating revenues, driven by a 18% increase in the average revenue per trade versus the prior year period. In addition, introducing broker commissions declined $0.8 million, which was partially offset by a $0.6 million increase in non-variable direct expenses.
Segment income in our Physical Commodities segment increased 19%, driven by the increase in operating revenues as well as a $0.3 million decline in non-variable direct expenses. While operating revenues in our Securities segment increased 25%, segment income declined $2.6 million. This decline was the result of a $4.3 million increase in transaction-based clearing expenses and a $7.8 million increase in interest expense due to the effect of an increase in short term interest rates on our institutional fixed income business and an increase in our securities lending activities. In addition, the prior year period includes a $2.5 million realized gain on the sale of exchange shares in Argentina.
On the expense side, we continue to focus on maintaining our variable cost model and limiting the growth of our non-variable expenses. To that end, variable expenses were 63% of total expenses in the current period compared to 57% in the prior year period. Non-variable expenses increased 4%, or $2.9 million year-over-year, primarily as a result of a $1.5 million increase in bad debt expense as well as a $1.1 million increase in professional fees.
The third quarter results include $2.6 million in operating revenues, presented in ‘trading gains, net’, related to economic hedges in place against the effect of the devaluation of the Argentina peso on our Argentine operations. The Argentine peso has historically served as our functional currency in the Argentine operations, and as such the revaluation of the net assets of our Argentine subsidiaries is recorded as a component of accumulated other comprehensive loss, net in the condensed consolidated balance sheets. Recently, the Argentinian economy was determined to be highly inflationary and as such, beginning July 1, 2018, the functional currency for our Argentine subsidiaries will change to the U.S. dollar and prospectively the corresponding revaluations of the net assets of these subsidiaries will be recorded in earnings each quarter in the condensed consolidated income statements while the highly inflationary designation continues.
Finally, the third quarter results include a gain of $2.0 million related to a judgment received in final settlement of our claim in the Sentinel Management Group Inc. bankruptcy proceeding. Please see Note 11 - Commitments and Contingencies for additional information on the Sentinel litigation.
Net income nearly doubled, to a record $24.0 million in the third quarter, compared to $12.7 million in the prior year.
30
Selected Summary Financial Information
Results of Operations
Total revenues reported combine gross revenues for the physical commodities business and net revenues for all other businesses. In order to reflect the way that we view the results, the table below reflects the calculation of the subtotal ‘operating revenues’, which is calculated by deducting physical commodities cost of sales from total revenues. Below is a discussion of the results of our operations, as viewed by management, for the three and nine month periods ended June 30, 2018 and 2017.
Financial Information (Unaudited)
Three Months Ended June 30, | Nine Months Ended June 30, | ||||||||||||||||||||
(in millions) | 2018 | % Change | 2017 | 2018 | % Change | 2017 | |||||||||||||||
Revenues: | |||||||||||||||||||||
Sales of physical commodities | $ | 6,866.2 | 29 | % | $ | 5,317.0 | $ | 20,836.4 | 26 | % | $ | 16,486.3 | |||||||||
Trading gains, net | 103.4 | 29 | % | 79.9 | 296.9 | 20 | % | 246.9 | |||||||||||||
Commission and clearing fees | 96.6 | 32 | % | 73.0 | 271.6 | 28 | % | 212.5 | |||||||||||||
Consulting, management, and account fees | 18.3 | 12 | % | 16.3 | 53.2 | 12 | % | 47.5 | |||||||||||||
Interest income | 33.7 | 72 | % | 19.6 | 85.6 | 79 | % | 47.7 | |||||||||||||
Other income | 0.1 | — | 0.1 | 0.2 | — | % | 0.2 | ||||||||||||||
Total revenues | 7,118.3 | 29 | % | 5,505.9 | 21,543.9 | 26 | % | 17,041.1 | |||||||||||||
Cost of sales of physical commodities | 6,858.5 | 29 | % | 5,308.3 | 20,811.3 | 26 | % | 16,462.2 | |||||||||||||
Operating revenues | 259.8 | 31 | % | 197.6 | 732.6 | 27 | % | 578.9 | |||||||||||||
Transaction-based clearing expenses | 49.0 | 45 | % | 33.9 | 136.6 | 35 | % | 101.2 | |||||||||||||
Introducing broker commissions | 34.1 | 17 | % | 29.2 | 101.4 | 18 | % | 86.1 | |||||||||||||
Interest expense | 22.1 | 97 | % | 11.2 | 55.4 | 84 | % | 30.1 | |||||||||||||
Net operating revenues | 154.6 | 25 | % | 123.3 | 439.2 | 21 | % | 361.5 | |||||||||||||
Compensation and benefits | 86.9 | 15 | % | 75.5 | 252.3 | 13 | % | 222.7 | |||||||||||||
Bad debts | 1.6 | 1,500 | % | 0.1 | 2.9 | (26 | )% | 3.9 | |||||||||||||
Other expenses | 35.2 | 8 | % | 32.7 | 105.0 | 8 | % | 97.2 | |||||||||||||
Total compensation and other expenses | 123.7 | 14 | % | 108.3 | 360.2 | 11 | % | 323.8 | |||||||||||||
Other gain | 2.0 | nm | — | 2.0 | nm | — | |||||||||||||||
Income before tax | 32.9 | 119 | % | 15.0 | 81.0 | 115 | % | 37.7 | |||||||||||||
Income tax expense | 8.9 | 287 | % | 2.3 | 41.2 | 435 | % | 7.7 | |||||||||||||
Net income | $ | 24.0 | 89 | % | $ | 12.7 | $ | 39.8 | 33 | % | $ | 30.0 | |||||||||
Balance Sheet information: | June 30, 2018 | % Change | June 30, 2017 | ||||||||||||||||||
Total assets | $ | 7,284.9 | 18 | % | $ | 6,195.9 | |||||||||||||||
Payables to lenders under loans | $ | 360.6 | 47 | % | $ | 244.7 | |||||||||||||||
Stockholders’ equity | $ | 487.7 | 4 | % | $ | 469.1 | |||||||||||||||
31
The selected data table below reflects key operating metrics used by management in evaluating our product lines, for the periods indicated:
Three Months Ended June 30, | Nine Months Ended June 30, | ||||||||||||||||||||
2018 | % Change | 2017 | 2018 | % Change | 2017 | ||||||||||||||||
Volumes and Other Data: | |||||||||||||||||||||
Exchange-traded - futures and options (contracts, 000’s) | 35,632.6 | 47 | % | 24,190.3 | 98,190.8 | 33 | % | 73,763.0 | |||||||||||||
OTC (contracts, 000’s) | 427.4 | 12 | % | 382.8 | 1,165.7 | 13 | % | 1,035.5 | |||||||||||||
Global Payments (# of payments, 000’s) | 171.9 | (2 | )% | 175.8 | 481.1 | 1 | % | 476.1 | |||||||||||||
Gold equivalent ounces traded (000’s) | 72,300.6 | 98 | % | 36,553.6 | 160,802.8 | 82 | % | 88,122.2 | |||||||||||||
Equity Market-Making (gross dollar volume, millions) | $ | 30,344.1 | 42 | % | $ | 21,298.1 | $ | 87,088.6 | 29 | % | $ | 67,284.8 | |||||||||
Debt Trading (gross dollar volume, millions) | $ | 29,922.2 | (7 | )% | $ | 32,176.4 | $ | 91,615.0 | (11 | )% | $ | 102,651.2 | |||||||||
FX Prime Brokerage volume (U.S. notional, millions) | $ | 93,007.8 | (36 | )% | $ | 145,679.8 | $ | 330,178.9 | (32 | )% | $ | 487,145.5 | |||||||||
Average assets under management in Argentina (U.S. dollar, millions) | $ | 458.4 | (30 | )% | $ | 653.4 | $ | 467.3 | (18 | )% | $ | 570.7 | |||||||||
Average customer equity - futures and options (millions) | $ | 2,244.0 | 16 | % | $ | 1,938.7 | $ | 2,146.9 | 7 | % | $ | 2,010.8 | |||||||||
Operating Revenues
Three Months Ended June 30, 2018 Compared to Three Months Ended June 30, 2017
Operating revenues increased 31% to $259.8 million in the third quarter compared to $197.6 million in the prior year. All operating segments recorded growth in operating revenues, led by our Clearing and Execution Services and Commercial Hedging segments, which increased $23.5 million and $20.8 million, respectively. In addition, the Securities segment added$9.9 million versus the prior year, while Global Payments and Physical Commodities added $3.5 million and $2.9 million, respectively.
Operating revenues in our CES segment increased 36% to a record $88.9 million in the third quarter, primarily as a result of 77% growth in Exchange-traded Futures & Options revenues, to $50.8 million, driven by increases in contract volumes, the average rate per contract earned and a $4.9 million increase in interest income. Our Correspondent Clearing business added $1.7 million versus the prior year, while the FX Prime Brokerage added $0.6 million. These gains were modestly offset by $0.6 million and $0.3 million declines in our Independent Wealth Management and Derivative Voice Brokerage businesses, respectively.
Operating revenues in Commercial Hedging increased 36%, compared to the prior year to $77.9 million as a result of a $9.3 million increase in OTC revenues, a $7.8 million increase in exchange-traded revenues and a $3.4 million increase in interest income. OTC revenues increased as a result of a 12% increase in customer OTC volumes as well as a 39% increase in the average rate per contract, primarily driven by increased customer activity in Brazil and overall market volatility. Exchange-traded revenues increased primarily as a result of a 23% increase in exchange-traded contract volume, most notably in the domestic grain markets.
Operating revenues in our Securities segment increased 25% to $49.9 million in the third quarter compared to the prior year. The Equity Market-Making business increased 92%, to $24.8 million, as the gross dollar volume traded increased 42% as a result of increased market volatility, the on-boarding of new customers and increased market share. Operating revenues in our Debt Trading business declined 4%, to $22.1 million versus the prior year as higher domestic revenues were more than offset by weaker revenues in our Argentina business driven by local economic conditions. In addition, the prior year period includes a $2.5 million realized gain on the sale of exchange shares in Argentina. These same conditions drove a $0.6 million decline in Asset Management operating revenues to $2.7 million as average assets under management declined 30% driven by the decline in the Argentine Peso. Overall, the Securities segment operating revenues benefited from a $6.6 million increase in interest income, primarily in our domestic institutional fixed income and securities lending activities.
Operating revenues in our Global Payments segment increased 16% in the third quarter to a record $26.0 million, as the average revenue per trade increased 18% to $151.25 while the number of global payments declined modestly versus the prior year.
Our Physical Commodity segment operating revenues increased 24% to $14.9 million, as a result of a $1.1 million increase in Precious Metals operating revenues combined with a $1.8 million increase in our Physical Ag & Energy business.
32
Interest income increased $14.1 million to $33.7 million in the third quarter compared to prior year, driven by an increase in short term rates as well as a 16% increase in average customer equity in the Exchange-traded Futures & Options components of our Commercial Hedging and CES segments to $2.2 billion in the third quarter compared to the prior year, which resulted in an aggregate $7.0 million increase in interest income in these businesses. In addition, our Securities segment added $6.6 million in interest income as a result of increases in our domestic fixed income and securities lending businesses and our correspondent clearing business added $2.2 million in interest income versus the prior year.
Finally, operating revenues for the third quarter include gains of $2.6 million related to economic hedges in place against the effect of the devaluation of the Argentina Peso on our Argentine operations.
See Segment Information below for additional information on activity in each of the segments.
Nine Months Ended June 30, 2018 Compared to Nine Months Ended June 30, 2017
Operating revenues increased 27% to $732.6 million in the current nine months ended compared to $578.9 million in the prior year. All segments of our business achieved growth in operating revenues versus the prior year, with the largest growth coming in our CES segment which added $55.9 million in operating revenues. In addition, Commercial Hedging segment operating revenues increased $40.4 million, while operating revenues in our Securities segment added $33.1 million versus the prior year. Our Physical Commodities and Global Payment segments, grew $8.0 million and $6.9 million respectively.
Operating revenues for the prior year include a $5.8 million pre-tax unrealized loss on interest rate swaps and U.S. Treasury notes held as part of our interest rate management strategy, while the current nine months ended include no unrealized gain/losses on this program as all interest rate swaps and U.S. Treasury notes had been liquidated during fiscal 2017. On a segment basis, these unrealized losses are reported in the Corporate unallocated segment, while the amortized earnings on these investments are included in the Commercial Hedging and CES segments.
Operating revenues in our CES segment increased 29% to $249.1 million in the current nine months ended, primarily as a result of 61% growth in Exchange-traded Futures & Options revenues, to $136.3 million, driven by increases in contract volumes, the average rate per contract earned and a $7.6 million, or 135% increase in interest income. Our Derivative Voice Brokerage business added $1.6 million versus the prior year, while the Correspondent Clearing and Independent Wealth Management businesses added $1.2 million and $0.9 million in operating revenues, respectively compared to the prior year. In addition the FX Prime Brokerage business, added $0.5 million in operating revenues versus the prior year.
Operating revenues in Commercial Hedging increased 23% in the current nine months ended to $217.7 million, as exchange-traded revenues increased $11.7 million and OTC revenues increased $21.0 million. Customer exchange-traded volumes increased 18%, driven by increased activity from customers in the domestic grain and energy and renewable fuels markets as well as an increase in exchange-traded revenues from omnibus relationships introduced by our commercial hedging employees. OTC revenues increased as a result of both a 13% increase in OTC volumes and a 25% increase in the average rate per contract compared to the prior year. These increases were driven by increased activity from Brazil agricultural customers as well as increased activity in food service, dairy and cotton markets.
Operating revenues in our Securities segment increased 29% to $148.4 million in the current nine months ended compared to the prior year. The Equity Market-Making business increased 61%, to $70.8 million, as the gross dollar volume traded increased 29% as a result of increased market volatility, the on-boarding of new customers and increased market share. Operating revenues in our Debt Trading business increased 13%, to $68.4 million versus the prior year, with increases in activity in our municipal securities business as well as an increase in interest income in our domestic institutional fixed income business, partially offset by lower operating revenues in Argentina. The prior year period includes a $2.5 million realized gain on the sale of exchange shares in Argentina. Asset Management operating revenues declined 16%, to $7.5 million in the current nine months ended, as the average assets under management declined 18%. Overall, the Securities segment operating revenues benefited from a $17.8 million increase in interest income, primarily in our domestic institutional fixed income and securities lending activities.
Our Physical Commodity segment operating revenues increased 24% to $41.0 million in the current nine months ended, primarily as a result of a $4.1 million increase in Precious Metals operating revenues as well as a $3.9 million increase in Physical Ag & Energy operating revenues driven by increased customer activity.
Operating revenues in our Global Payments segment increased 10% in the current nine months ended to $74.0 million, as a result of a 1% increase in the number of global payments made as well as a 9% increase in the average revenue per trade.
Interest income increased $37.9 million to $85.6 million in the current nine months ended compared to prior year as a result of the effect of increases in short term interest rates and average customer equity as well as the $17.8 million increase in interest income in the Securities segment discussed above. Included in interest income, the prior year period includes a $4.8 million unrealized loss on U.S. Treasury notes held as part of our interest rate management strategy. Average customer equity in the Exchange-traded Futures & Options components of our Commercial Hedging and CES segments increased 7% to $2.1 billion
33
in the current nine months ended, which combined with the increases in short-term interest rates resulted in an aggregate $14.0 million increase in interest income in these businesses.
Finally, operating revenues for the current nine months ended include gains of $3.1 million related to economic hedges in place against the effect of the devaluation of the Argentina Peso on our Argentine operations.
See Segment Information below for additional information on activity in each of the segments.
Interest and Transactional Expenses
Three Months Ended June 30, 2018 Compared to Three Months Ended June 30, 2017
Transaction-based clearing expenses: Transaction-based clearing expenses increased 45% to $49.0 million in the third quarter compared to $33.9 million in the prior year, and were 19% of operating revenues in the third quarter compared to 17% in the prior year. The increase in expense is related to higher volumes in our Financial Ag & Energy, Exchange-traded Futures & Options and Equity Market-Making components.
Introducing broker commissions: Introducing broker commissions increased 17% to $34.1 million in the third quarter compared to $29.2 million in the prior year, and were 13% of operating revenues in the third quarter compared to 15% in the prior year. The percentage of operating revenue is inversely impacted by the growth in interest income. The increase in expense is primarily due to increased business activity and improved performance in our Exchange-traded Futures & Options and Financial Ag & Energy components, partially offset by lower costs in Debt Trading and Global Payments.
Interest expense: Interest expense increased 97% to $22.1 million in the third quarter compared to $11.2 million in the prior year. The increase in expense is primarily related to the trading activities of our institutional dealer in fixed income securities, which resulted in higher interest expense of $3.8 million, and the increased activity of our securities lending business, started up during fiscal 2017 in our Equity Market-Making component, which resulted in higher interest expense of $3.5 million. Also, an increase in short-term rates resulted in higher costs in our Exchange-traded Futures & Options component. Additionally, higher short-term rates along with higher average borrowings outstanding on our physical commodity financing facility resulted in increased expense.
Nine Months Ended June 30, 2018 Compared to Nine Months Ended June 30, 2017
Transaction-based clearing expenses: Transaction-based clearing expenses increased 35% to $136.6 million in the current nine months ended compared to $101.2 million in the prior year, and were 19% of operating revenues in the current nine months ended compared to 17% in the prior year. The increase in expense is primarily related to higher volumes in our Financial Ag & Energy, Exchange-Traded Futures & Options and Equity Market-Making components, partially offset by lower costs in our LME Metals, FX Prime Brokerage and Correspondent Clearing components.
Introducing broker commissions: Introducing broker commissions increased 18% to $101.4 million in the current nine months ended compared to $86.1 million in the prior year, and were 14% of operating revenues in the current nine months ended compared to 15% in the prior year. The increase in expense is primarily due to increased business activity and improved performance in our Exchange-traded Futures & Options and Financial Ag & Energy components, partially offset by lower costs in Global Payments and Equity Market-Making.
Interest expense: Interest expense increased 84% to $55.4 million in the current nine months ended compared to $30.1 million in the prior year. The increase in expense is primarily related to the trading activities of our institutional dealer in fixed income securities, which resulted in higher interest expense of $11.5 million, and the increased activity of our securities lending business, started up during fiscal 2017 in our Equity Market-Making component, which resulted in higher interest expense of $8.4 million. Also, an increase in short-term rates resulted in higher costs in our Exchange-traded Futures & Options and Financial Ag & Energy components. Additionally, higher short-term rates along with higher average borrowings outstanding on our physical commodity financing facility resulted in increased expense.
Net Operating Revenues
Net operating revenues is one of the key measures used by management to assess the performance of our operating segments. Net operating revenue is calculated as operating revenue less transaction-based clearing expenses, introducing broker commissions and interest expense. Transaction-based clearing expenses represent variable expenses paid to executing brokers, exchanges, clearing organizations and banks in relation to our transactional volumes. Introducing broker commissions include commission paid to non-employee third parties that have introduced customers to us. Net operating revenues represent revenues available to pay variable compensation to risk management consultants and traders and direct non-variable expenses, as well as variable and non-variable expenses of operational and administrative employees, including our executive management team.
Three Months Ended June 30, 2018 Compared to Three Months Ended June 30, 2017
34
Net operating revenues increased $31.3 million, or 25%, to $154.6 million in the third quarter compared to $123.3 million in the prior year.
Nine Months Ended June 30, 2018 Compared to Nine Months Ended June 30, 2017
Net operating revenues increased $77.7 million, or 21%, to $439.2 million in the current nine months ended compared to $361.5 million in the prior year.
Compensation and Other Expenses
The following table shows a summary of expenses, other than interest and transactional expenses.
Three Months Ended June 30, | Nine Months Ended June 30, | ||||||||||||||||||||
(in millions) | 2018 | % Change | 2017 | 2018 | % Change | 2017 | |||||||||||||||
Compensation and benefits: | |||||||||||||||||||||
Fixed compensation and benefits | $ | 40.4 | (3 | )% | $ | 41.5 | $ | 122.7 | 4 | % | $ | 118.0 | |||||||||
Variable compensation and benefits | 46.5 | 37 | % | 34.0 | 129.6 | 24 | % | 104.7 | |||||||||||||
86.9 | 15 | % | 75.5 | 252.3 | 13 | % | 222.7 | ||||||||||||||
Other non-compensation expenses: | |||||||||||||||||||||
Trading systems and market information | 8.6 | 4 | % | 8.3 | 25.7 | — | % | 25.7 | |||||||||||||
Occupancy and equipment rental | 4.2 | 8 | % | 3.9 | 12.5 | 13 | % | 11.1 | |||||||||||||
Professional fees | 4.8 | 30 | % | 3.7 | 13.4 | 13 | % | 11.9 | |||||||||||||
Travel and business development | 3.7 | 23 | % | 3.0 | 10.2 | 6 | % | 9.6 | |||||||||||||
Non-trading technology and support | 3.8 | 19 | % | 3.2 | 10.3 | 16 | % | 8.9 | |||||||||||||
Depreciation and amortization | 2.8 | 17 | % | 2.4 | 8.4 | 17 | % | 7.2 | |||||||||||||
Communications | 1.3 | (13 | )% | 1.5 | 4.1 | 5 | % | 3.9 | |||||||||||||
Bad debts | 1.6 | n/m | 0.1 | 2.9 | (26 | )% | 3.9 | ||||||||||||||
Other expense | 6.0 | (10 | )% | 6.7 | 20.4 | 8 | % | 18.9 | |||||||||||||
36.8 | 12 | % | 32.8 | 107.9 | 7 | % | 101.1 | ||||||||||||||
Total compensation and other expenses | $ | 123.7 | 14 | % | $ | 108.3 | $ | 360.2 | 11 | % | $ | 323.8 | |||||||||
Three Months Ended June 30, 2018 Compared to Three Months Ended June 30, 2017
Compensation and Other Expenses: Compensation and other expenses increased $15.4 million, or 14%, to $123.7 million in the third quarter compared to $108.3 million in the prior year.
Compensation and Benefits: Total compensation and benefits expense increased 15% to $86.9 million in the third quarter compared to $75.5 million in the prior year. Total compensation and benefits were 33% of operating revenues in the third quarter compared to 38% in the prior year. The variable portion of compensation and benefits increased by 37% to $46.5 million in the third quarter compared to $34.0 million in the prior year. Variable compensation and benefits were 30% of net operating revenues in the third quarter compared to 28% in the prior year. Administrative, centralized operations and executive incentive compensation was $7.3 million in the third quarter compared to $4.8 million in the prior year, primarily due to increased incentive accruals based on higher current year performance.
The fixed portion of compensation and benefits decreased 3% to $40.4 million in the third quarter compared to $41.5 million in the prior year. Non-variable salaries increased $0.3 million, or 1%, primarily across operations and administrative areas. Employee benefits, excluding share-based compensation, increased $0.4 million in the third quarter, primarily related to higher accruals for executive management related to a cash based-long-term incentive plan. Share-based compensation is a component of the fixed portion, and includes stock option and restricted stock expense. Share-based compensation was $1.7 million in the third quarter compared to $2.0 million in the prior year. The number of employees increased 3% to 1,646 at the end of the third quarter compared to 1,599 at the beginning of the third quarter. The number of employees at the end of the prior year period was 1,609.
Other Non-Compensation Expenses: Other non-compensation expenses increased 12% to $36.8 million in the third quarter compared to $32.8 million in the prior year. Professional fees increased 30% related to higher legal fees, and higher consulting fees primarily related to administrative system evaluations. Depreciation and amortization increased primarily due to depreciation of the new trading system for certain over-the-counter commodities business activities placed in service during the fourth quarter of 2017.
Bad debts increased $1.5 million over the prior year. During the third quarter, bad debt expense, net was $1.6 million, primarily related to $2.3 million of OTC customer deficits partially offset by the recovery of a precious metals customer account deficit. During the prior year, bad debt expense was $0.1 million.
35
Provision for Taxes: The effective income tax rate was 27% in the third quarter compared to 15% in the prior year. There were no discrete adjustments related to the Tax Act recorded in the three months ended June 30, 2018. The effective tax rate decreased 0.2% due to excess tax benefits of share-based compensation recognized during the period related to the adoption of ASU 2016-09. The effective income tax rate during the prior year was lower than the U.S. federal statutory rate primarily due to a higher mix of earnings taxed at lower rates in foreign jurisdictions. The effective tax rate during the third quarter of fiscal year 2018 was higher than the U.S. federal statutory rate primarily due to U.S. state and local taxes and foreign permanent differences.
Nine Months Ended June 30, 2018 Compared to Nine Months Ended June 30, 2017
Compensation and Other Expenses: Compensation and other expenses increased $36.4 million, or 11%, to $360.2 million in the current nine months ended compared to $323.8 million in the prior year.
Compensation and Benefits: Total compensation and benefits expense increased 13% to $252.3 million in the current nine months ended compared to $222.7 million in the prior year. Total compensation and benefits were 34% of operating revenues in the current nine months ended compared to 38% in the prior year. The variable portion of compensation and benefits increased 24% to $129.6 million in the current nine months ended compared to $104.7 million in the prior year. Variable compensation and benefits were 30% of net operating revenues in the current nine months ended compared to 29% in the prior year. Administrative, centralized operations and executive incentive compensation was $18.0 million in the current nine months ended compared to $14.5 million in the prior year, primarily due to increased incentive accruals based on higher current year performance.
The fixed portion of compensation and benefits increased 4% to $122.7 million in the current nine months ended compared to $118.0 million in the prior year. Non-variable salaries increased $2.3 million, or 3%, primarily across operations and administrative areas. Contract labor costs increased $1.0 million. Employee benefits, excluding share-based compensation, increased $2.2 million in the current nine months ended, primarily related to higher accruals for executive management related to a cash based-long-term incentive plan. Share-based compensation is a component of the fixed portion, and includes stock option and restricted stock expense. Share-based compensation was $4.9 million in the current nine months ended compared to $4.6 million in the prior year. The number of employees was 1,646 at the end of the second quarter compared to 1,607 at the beginning of the current fiscal year. The number of employees at the end of the prior year period was 1,609.
Other Non-Compensation Expenses: Other non-compensation expenses increased 7% to $107.9 million in the current nine months ended compared to $101.1 million in the prior year. Bad debts decreased $1.0 million over the prior year. During the current nine months ended, bad debt expense, net was $2.9 million, primarily related to $2.3 million of OTC customer deficits and additional bad debt expense of $1.0 million related to reimbursement due the Company from a coal supplier following our recorded charge of $47.0 million during the fourth quarter of fiscal 2017. During the prior year, bad debt expense was $3.9 million, primarily related to LME Metals customer deficits in our Commercial Hedging segment.
Provision for Taxes: The effective income tax rate was 51% in the current nine months ended compared to 20% in the prior year. The discrete expense of $20.1 million related to the Tax Reform, increased the effective tax rate by 25%. The effective rate for the current nine months ended was 26%, excluding the impacts of the Tax Reform. The effective tax rate decreased 0.4% due to excess tax benefits on share-based compensation recognized during the period related to the adoption of ASU 2016-09. Our effective income tax rate during the prior year was lower than the U.S. federal statutory rate primarily due to a higher mix of earnings taxed at lower rates in foreign jurisdictions. The effective income tax rate in the current nine months is higher than the U.S. federal statutory rate because of the impacts of the Tax Reform.
36
Unallocated Costs and Expenses
The following table is a breakout of our unallocated costs and expenses from the total costs and expenses shown above. The unallocated costs and expenses include certain shared services such as information technology, accounting and treasury, credit and risk, legal and compliance, and human resources and other activities.
Three Months Ended June 30, | Nine Months Ended June 30, | ||||||||||||||||||||
(in millions) | 2018 | % Change | 2017 | 2018 | % Change | 2017 | |||||||||||||||
Compensation and benefits: | |||||||||||||||||||||
Fixed compensation and benefits | $ | 15.6 | (5 | )% | $ | 16.4 | $ | 47.8 | 8 | % | $ | 44.4 | |||||||||
Variable compensation and benefits | 6.6 | 57 | % | 4.2 | 16.3 | 25 | % | 13.0 | |||||||||||||
22.2 | 8 | % | 20.6 | 64.1 | 12 | % | 57.4 | ||||||||||||||
Other non-compensation expenses: | |||||||||||||||||||||
Trading systems and market information | 0.8 | 33 | % | 0.6 | 2.1 | 11 | % | 1.9 | |||||||||||||
Occupancy and equipment rental | 4.2 | 8 | % | 3.9 | 12.4 | 13 | % | 11.0 | |||||||||||||
Professional fees | 2.9 | 38 | % | 2.1 | 8.0 | 13 | % | 7.1 | |||||||||||||
Travel and business development | 0.9 | 29 | % | 0.7 | 2.4 | — | % | 2.4 | |||||||||||||
Non-trading technology and support | 3.0 | 20 | % | 2.5 | 8.2 | 24 | % | 6.6 | |||||||||||||
Depreciation and amortization | 2.3 | 15 | % | 2.0 | 6.7 | 12 | % | 6.0 | |||||||||||||
Communications | 1.1 | (15 | )% | 1.3 | 3.7 | 6 | % | 3.5 | |||||||||||||
Other expense | 3.3 | 27 | % | 2.6 | 13.0 | 55 | % | 8.4 | |||||||||||||
18.5 | 18 | % | 15.7 | 56.5 | 20 | % | 46.9 | ||||||||||||||
Total compensation and other expenses | $ | 40.7 | 12 | % | $ | 36.3 | $ | 120.6 | 16 | % | $ | 104.3 | |||||||||
Total unallocated costs and other expenses increased $4.4 million to $40.7 million in the third quarter compared to $36.3 million in the prior year. Compensation and benefits increased $1.6 million, or 8% to $22.2 million in the third quarter compared to $20.6 million in the prior year.
Total unallocated costs and other expenses increased $16.3 million to $120.6 million in the current nine months ended compared to $104.3 million in the prior year. Compensation and benefits increased $6.7 million, or 12% to $64.1 million in the current nine months ended compared to $57.4 million in the prior year.
During the current three and nine months ended, the increase in compensation and benefits is primarily related to accruals for executive management for incentives based on current year performance, as well as a cash based-long-term incentive plan. The increase in other expense is primarily related to our internal bi-annual global sales meeting held during January 2018.
Variable vs. Fixed Expenses
Three Months Ended June 30, | Nine Months Ended June 30, | ||||||||||||||||||||||||||
(in millions) | 2018 | % of Total | 2017 | % of Total | 2018 | % of Total | 2017 | % of Total | |||||||||||||||||||
Variable compensation and benefits | $ | 46.5 | 22 | % | $ | 34.0 | 20 | % | $ | 129.6 | 22 | % | $ | 104.7 | 20 | % | |||||||||||
Transaction-based clearing expenses | 49.0 | 24 | % | 33.9 | 20 | % | 136.6 | 23 | % | 101.2 | 20 | % | |||||||||||||||
Introducing broker commissions | 34.1 | 17 | % | 29.2 | 17 | % | 101.4 | 16 | % | 86.1 | 17 | % | |||||||||||||||
Total variable expenses | 129.6 | 63 | % | 97.1 | 57 | % | 367.6 | 61 | % | 292.0 | 57 | % | |||||||||||||||
Fixed compensation and benefits | 40.4 | 20 | % | 41.5 | 24 | % | 122.7 | 21 | % | 118.0 | 23 | % | |||||||||||||||
Other fixed expenses | 35.2 | 17 | % | 32.7 | 19 | % | 105.0 | 18 | % | 97.2 | 19 | % | |||||||||||||||
Bad debts | 1.6 | — | % | 0.1 | — | % | 2.9 | — | % | 3.9 | 1 | % | |||||||||||||||
Total non-variable expenses | 77.2 | 37 | % | 74.3 | 43 | % | 230.6 | 39 | % | 219.1 | 43 | % | |||||||||||||||
Total non-interest expenses | $ | 206.8 | 100 | % | $ | 171.4 | 100 | % | $ | 598.2 | 100 | % | $ | 511.1 | 100 | % | |||||||||||
We seek to make our non-interest expenses variable to the greatest extent possible, and to keep our fixed costs as low as possible. The table above shows an analysis of our variable expenses and non-variable expenses as a percentage of total non-interest expenses for the three and nine months ended June 30, 2018 and 2017, respectively.
Our variable expenses include variable compensation paid to traders and risk management consultants, bonuses paid to operational, administrative, and executive employees, transaction-based clearing expenses and introducing broker commissions. As a percentage of total non-interest expenses, variable expenses were 63% in the third quarter compared to 57%
37
in the prior year. As a percentage of total non-interest expenses, variable expenses were 61% in the current nine months ended compared to 57% in the prior year.
Segment Information
Our business activities are managed as operating segments and organized into reportable segments as follows:
INTL FCStone Inc. | |||||||||||||
Commercial Hedging | Global Payments | Securities | Physical Commodities | Clearing and Execution Services (“CES”) | |||||||||
Components: | Component: | Components: | Components: | Components: | |||||||||
- Financial Ag & Energy | - Global Payments | - Equity Market- Making | - Precious Metals | - Exchange-traded Futures & Options | |||||||||
- LME Metals | - Debt Trading | - Physical Ag & Energy | - FX Prime Brokerage | ||||||||||
- Investment Banking | - Correspondent Clearing | ||||||||||||
- Asset Management | - Independent Wealth Management | ||||||||||||
- Derivative Voice Brokerage | |||||||||||||
We report our operating segments based on services provided to customers. Net contribution is one of the key measures used by management to assess the performance of each segment and for decisions regarding the allocation of our resources. Net contribution is calculated as revenue less direct cost of sales, transaction-based clearing expenses, introducing broker commissions, interest expense and variable compensation. Variable compensation paid to risk management consultants and traders generally represents a fixed percentage of an amount equal to revenues generated, and in some cases, revenues generated less transaction-based clearing expenses and related charges, base salaries and an overhead allocation.
Segment income is calculated as net contribution less non-variable direct expenses of the segment. These non-variable direct expenses include trader base compensation and benefits, operational charges, communication and data services, business development, professional fees, bad debt expense, trade errors and direct marketing expenses.
38
Total Segment Results
The following table shows summary information concerning all of our business segments combined.
Three Months Ended June 30, | Nine Months Ended June 30, | ||||||||||||||||||||||
(in millions) | 2018 | % of Operating Revenues | 2017 | % of Operating Revenues | 2018 | % of Operating Revenues | 2017 | % of Operating Revenues | |||||||||||||||
Sales of physical commodities | $ | 6,866.2 | $ | 5,317.0 | $ | 20,836.4 | $ | 16,486.3 | |||||||||||||||
Trading gains, net | 99.5 | 79.1 | 289.8 | 246.1 | |||||||||||||||||||
Commission and clearing fees | 96.9 | 73.0 | 271.7 | 212.2 | |||||||||||||||||||
Consulting, management, and account fees | 17.8 | 15.9 | 51.7 | 46.6 | |||||||||||||||||||
Interest income | 35.6 | 20.3 | 91.8 | 56.9 | |||||||||||||||||||
Other | 0.1 | — | 0.1 | — | |||||||||||||||||||
Total revenues | 7,116.1 | 5,505.3 | 21,541.5 | 17,048.1 | |||||||||||||||||||
Cost of sales of physical commodities | 6,858.5 | 5,308.3 | 20,811.3 | 16,462.2 | |||||||||||||||||||
Operating revenues | 257.6 | 100% | 197.0 | 100% | 730.2 | 100% | 585.9 | 100% | |||||||||||||||
Transaction-based clearing expenses | 49.2 | 19% | 33.5 | 17% | 135.7 | 19% | 99.6 | 17% | |||||||||||||||
Introducing broker commissions | 34.0 | 13% | 29.1 | 15% | 101.3 | 14% | 86.0 | 15% | |||||||||||||||
Interest expense | 21.0 | 8% | 9.5 | 5% | 52.7 | 7% | 23.8 | 4% | |||||||||||||||
Net operating revenues | 153.4 | 124.9 | 440.5 | 376.5 | |||||||||||||||||||
Variable direct compensation and benefits | 39.2 | 15% | 29.2 | 15% | 111.6 | 15% | 90.2 | 15% | |||||||||||||||
Net contribution | 114.2 | 95.7 | 328.9 | 286.3 | |||||||||||||||||||
Non-variable direct expenses | 43.8 | 17% | 42.8 | 22% | 128.0 | 18% | 129.3 | 22% | |||||||||||||||
Segment income | $ | 70.4 | $ | 52.9 | $ | 200.9 | $ | 157.0 | |||||||||||||||
Three Months Ended June 30, 2018 Compared to Three Months Ended June 30, 2017
Net contribution for all of our business segments increased 19% to $114.2 million in the third quarter compared to $95.7 million in the prior year. Segment income increased 33% to $70.4 million in the third quarter compared to $52.9 million in the prior year.
Nine Months Ended June 30, 2018 Compared to Nine Months Ended June 30, 2017
Net contribution for all of our business segments increased 15% to $328.9 million in the current nine months ended compared to $286.3 million in the prior year. Segment income increased 28% to $200.9 million in the current nine months ended compared to $157.0 million in the prior year.
Commercial Hedging
We serve our commercial customers through our team of risk management consultants, providing a high-value-added service that we believe differentiates us from our competitors and maximizes the opportunity to retain our customers. Our risk management consulting services are designed to quantify and monitor commercial entities’ exposure to commodity and financial risk. Upon assessing this exposure, we develop a plan to control and hedge these risks with post-trade reporting against specific customer objectives. Our customers are assisted in the execution of their hedging strategies through a wide range of products from listed exchange-traded futures and options, to basic OTC instruments that offer greater flexibility, to structured OTC products designed for customized solutions.
Our services span virtually all traded commodity markets, with the largest concentrations in agricultural and energy commodities (consisting primarily of grains, energy and renewable fuels, coffee, sugar, cotton, and food service) and base metals products listed on the LME. Our base metals business includes a position as a Category One ring dealing member of the LME, providing execution, clearing and advisory services in exchange-traded futures and OTC products. We also provide execution of foreign currency forwards and options and interest rate swaps as well as a wide range of structured product solutions to our commercial customers who are seeking cost-effective hedging strategies. Generally, our customers direct their own trading activity, and our risk management consultants do not have discretionary authority to transact trades on behalf of our customers.
39
The following table provides the financial performance for Commercial Hedging for the periods indicated.
Three Months Ended June 30, | Nine Months Ended June 30, | ||||||||||||||||||
(in millions) | 2018 | % Change | 2017 | 2018 | % Change | 2017 | |||||||||||||
Revenues: | |||||||||||||||||||
Sales of physical commodities | $ | — | — | $ | — | $ | — | — | $ | — | |||||||||
Trading gains, net | 34.9 | 45% | 24.0 | 101.5 | 25% | 81.1 | |||||||||||||
Commission and clearing fees | 32.5 | 24% | 26.3 | 88.6 | 16% | 76.3 | |||||||||||||
Consulting, management, and account fees | 3.7 | 6% | 3.5 | 11.5 | 6% | 10.9 | |||||||||||||
Interest income | 6.7 | 103% | 3.3 | 16.0 | 78% | 9.0 | |||||||||||||
Other | 0.1 | —% | — | 0.1 | — | — | |||||||||||||
Total revenues | 77.9 | 36% | 57.1 | 217.7 | 23% | 177.3 | |||||||||||||
Cost of sales of physical commodities | — | — | — | — | — | — | |||||||||||||
Operating revenues | 77.9 | 36% | 57.1 | 217.7 | 23% | 177.3 | |||||||||||||
Transaction-based clearing expenses | 10.1 | 31% | 7.7 | 27.8 | 27% | 21.9 | |||||||||||||
Introducing broker commissions | 6.3 | 26% | 5.0 | 16.5 | 12% | 14.7 | |||||||||||||
Interest expense | 0.5 | 150% | 0.2 | 1.4 | 250% | 0.4 | |||||||||||||
Net operating revenues | 61.0 | 38% | 44.2 | 172.0 | 23% | 140.3 | |||||||||||||
Variable direct compensation and benefits | 16.7 | 44% | 11.6 | 46.5 | 24% | 37.4 | |||||||||||||
Net contribution | 44.3 | 36% | 32.6 | 125.5 | 22% | 102.9 | |||||||||||||
Non-variable direct expenses | 19.0 | 17% | 16.3 | 51.5 | (2)% | 52.5 | |||||||||||||
Segment income | $ | 25.3 | 55% | $ | 16.3 | $ | 74.0 | 47% | $ | 50.4 | |||||||||
The following tables set forth transactional revenues and selected data for Commercial Hedging for the periods indicated.
Exchange-traded | |||||||||||||||||||
Three Months Ended June 30, | Nine Months Ended June 30, | ||||||||||||||||||
2018 | % Change | 2017 | 2018 | % Change | 2017 | ||||||||||||||
Transactional revenues (in millions): | |||||||||||||||||||
Agricultural | $ | 22.1 | 18% | $ | 18.7 | $ | 59.7 | 11% | $ | 53.7 | |||||||||
Energy and renewable fuels | 2.2 | 16% | 1.9 | 6.5 | 35% | 4.8 | |||||||||||||
LME metals | 12.1 | 22% | 9.9 | 37.7 | (3)% | 39.0 | |||||||||||||
Other | 4.1 | 86% | 2.2 | 11.2 | 90% | 5.9 | |||||||||||||
$ | 40.5 | 24% | $ | 32.7 | $ | 115.1 | 11% | $ | 103.4 | ||||||||||
Selected data: | |||||||||||||||||||
Futures and options (contracts, 000’s) | 7,399.2 | 23% | 6,013.8 | 20,956.5 | 18% | 17,806.6 | |||||||||||||
Average rate per contract | $ | 5.38 | 1% | $ | 5.33 | $ | 5.41 | (5)% | $ | 5.71 | |||||||||
Average customer equity - futures and options (millions) | $ | 973.0 | 5% | $ | 922.5 | $ | 914.5 | (2)% | $ | 937.4 | |||||||||
OTC | |||||||||||||||||||
Three Months Ended June 30, | Nine Months Ended June 30, | ||||||||||||||||||
2018 | % Change | 2017 | 2018 | % Change | 2017 | ||||||||||||||
Transactional revenues (in millions): | |||||||||||||||||||
Agricultural | $ | 21.0 | 75% | $ | 12.0 | $ | 58.2 | 62% | $ | 36.0 | |||||||||
Energy and renewable fuels | 4.2 | 11% | 3.8 | 11.1 | (10)% | 12.3 | |||||||||||||
Other | 1.7 | (6)% | 1.8 | 5.7 | —% | 5.7 | |||||||||||||
$ | 26.9 | 53% | $ | 17.6 | $ | 75.0 | 39% | $ | 54.0 | ||||||||||
Selected data: | |||||||||||||||||||
Volume (contracts, 000’s) | 427.4 | 12% | 382.8 | 1,165.7 | 13% | 1,035.5 | |||||||||||||
Average rate per contract | $ | 61.07 | 39% | $ | 43.89 | $ | 62.28 | 25% | $ | 49.64 | |||||||||
Three Months Ended June 30, 2018 Compared to Three Months Ended June 30, 2017
Operating revenues increased 36% to $77.9 million in the third quarter compared to $57.1 million in the prior year. Exchange-traded revenues increased 24%, to $40.5 million in the third quarter, resulting primarily from an increase in agricultural market revenues driven by an increase in volatility in the domestic grain markets. In addition, agricultural exchange-traded revenues benefited from increased activity from customers in both food service and dairy markets as well as in soft commodities, including coffee, cotton and sugar driven by increased market volatility. Uncertainty surrounding the effect of potential U.S. tariffs on global metals markets drove volatility and activity in our LME metals business in the third quarter. Finally, reflected
40
in the ‘Other” category above we saw an increase in exchange-traded revenues from omnibus relationships introduced by our commercial hedging employees in the third quarter. Overall exchange-traded contract volumes increased 23%, while the average rate per contract increased 1% versus the prior year to $5.38.
OTC revenues increased 53%, to $26.9 million in the third quarter, driven by both a 12% increase in OTC volumes and a 39% increase in the average rate per contract compared to the prior year. These increases were driven by growth in OTC contract volumes in agricultural commodities, primarily with Brazilian grain customers as well as increased activity in the food service, dairy markets and energy markets.
Consulting, management, and account fees increased 6% compared to the prior year, while interest income, increased 103%, to $6.7 million compared to the prior year. The increase in interest income was primarily driven by an increase in short-term rates as well as a result of a 5% increase versus the prior year in average customer equity to $973.0 million in the third quarter.
Segment income increased to $25.3 million in the third quarter compared to $16.3 million in the prior year, primarily as a result of the increase in operating revenues. These increases were partially offset by a $2.7 million increase in non-variable direct expenses, primarily related to a $2.2 million increase in bad debt expense versus the prior year related to two customers in our agricultural commodities OTC business. Variable expenses, excluding interest, expressed as a percentage of operating revenues were 42% in the third quarter compared to 43% in the prior year.
Nine Months Ended June 30, 2018 Compared to Nine Months Ended June 30, 2017
Operating revenues increased 23% to $217.7 million in the current nine months ended compared to $177.3 million in the prior year. Exchange-traded revenues increased 11%, to $115.1 million in the current nine months ended, driven by increased activity from customers in the domestic grain and energy and renewable fuels markets as well as an increase in exchange-traded revenues from omnibus relationships introduced by our commercial hedging employees, which are reflected in the ‘Other’ category above. These increases were partially offset by lower LME metals revenues compared to strong performance in the prior year. Overall exchange-traded contract volume increased 18% while the average rate per contract declined 5% to $5.41.
OTC revenues increased 39%, to $75.0 million in the current nine months ended, driven by both a 13% increase in OTC volumes and a 25% increase in the average rate per contract compared to the prior year. These increases were driven by growth in OTC contract volumes in agricultural commodities, primarily with Brazilian grain customers as well as increased activity in food service and dairy markets and soft commodities. These increases were offset by lower interest rate swap, coffee and energy and renewable fuels revenues.
Consulting and management fees increased $0.6 million versus the prior year, while interest income, increased 78%, to $16.0 million compared to the prior year. The increase in interest income was primarily driven by an increase in short-term rates, as average customer equity declined 2% versus the prior year to $914.5 million in the current nine months ended.
Segment income increased to $74.0 million in the current nine months ended compared to $50.4 million in the prior year, primarily as a result of the increase in operating revenues as well as a $1.0 million decline in non-variable direct expenses. The decline in non-variable direct expenses was primarily related to a $1.8 million decline in bad debt expense, partially offset by an increase in non-variable compensation and benefits. Variable expenses, excluding interest, expressed as a percentage of operating revenues were flat with the prior year period at 42%.
Global Payments
We provide global payment solutions to banks and commercial businesses as well as charities, non-governmental organizations and government organizations. We offer payments services in more than 175 countries and 140 currencies, which we believe is more than any other payments solution provider, and provide competitive and transparent pricing.
Our proprietary FXecute global payments platform is integrated with a financial information exchange (“FIX”) protocol. This FIX protocol is an electronic communication method for the real-time exchange of information, and we believe it represents one of the first FIX offerings for cross-border payments in exotic currencies. FIX functionality allows customers to view real time market rates for various currencies, execute and manage orders in real-time, and view the status of their payments through the easy-to-use portal.
Additionally, as a member of SWIFT (Society for Worldwide Interbank Financial Telecommunication), we are able to offer our services to large money center and global banks seeking more competitive international payment services.
Through this single comprehensive platform and our commitment to customer service, we believe we are able to provide simple and fast execution, ensuring delivery of funds in any of these countries quickly through our global network of approximately 300 correspondent banks. In this business, we primarily act as a principal in buying and selling foreign currencies on a spot basis. We derive revenue from the difference between the purchase and sale prices.
41
We believe our customers value our ability to provide exchange rates that are significantly more competitive than those offered by large international banks, a competitive advantage that stems from our years of foreign exchange expertise focused on smaller, less liquid currencies.
The following table provides the financial performance and selected data for Global Payments for the periods indicated.
Three Months Ended June 30, | Nine Months Ended June 30, | ||||||||||||||||||
(in millions) | 2018 | % Change | 2017 | 2018 | % Change | 2017 | |||||||||||||
Revenues: | |||||||||||||||||||
Sales of physical commodities | $ | — | — | $ | — | $ | — | — | $ | — | |||||||||
Trading gains, net | 24.9 | 14% | 21.9 | 71.0 | 9% | 65.3 | |||||||||||||
Commission and clearing fees | 1.1 | 83% | 0.6 | 3.0 | 67% | 1.8 | |||||||||||||
Consulting, management, account fees | — | — | — | — | — | — | |||||||||||||
Interest income | — | — | — | — | — | — | |||||||||||||
Other income | — | — | — | — | — | — | |||||||||||||
Total revenues | 26.0 | 16% | 22.5 | 74.0 | 10% | 67.1 | |||||||||||||
Cost of sales of physical commodities | — | — | — | — | — | — | |||||||||||||
Operating revenues | 26.0 | 16% | 22.5 | 74.0 | 10% | 67.1 | |||||||||||||
Transaction-based clearing expenses | 1.0 | (17)% | 1.2 | 3.3 | (6)% | 3.5 | |||||||||||||
Introducing broker commissions | 0.2 | (80)% | 1.0 | 1.0 | (71)% | 3.4 | |||||||||||||
Interest expense | 0.1 | — | — | 0.1 | — | 0.2 | |||||||||||||
Net operating revenues | 24.7 | 22% | 20.3 | 69.6 | 16% | 60.0 | |||||||||||||
Variable direct compensation and benefits | 4.8 | 17% | 4.1 | 13.7 | 13% | 12.1 | |||||||||||||
Net contribution | 19.9 | 23% | 16.2 | 55.9 | 17% | 47.9 | |||||||||||||
Non-variable direct expenses | 3.9 | 18% | 3.3 | 11.8 | 17% | 10.1 | |||||||||||||
Segment income | $ | 16.0 | 24% | $ | 12.9 | $ | 44.1 | 17% | $ | 37.8 | |||||||||
Selected data: | |||||||||||||||||||
Global Payments (# of payments, 000’s) | 171.9 | (2)% | 175.8 | 481.1 | 1% | 476.1 | |||||||||||||
Average revenue per trade | $ | 151.25 | 18% | $ | 127.99 | $ | 153.81 | 9% | $ | 140.94 | |||||||||
Three Months Ended June 30, 2018 Compared to Three Months Ended June 30, 2017
Operating revenues increased 16% to a record $26.0 million in the third quarter compared to $22.5 million in the prior year. The volume of payments made declined 2% versus the prior year period while the average revenue per trade increased by 18% compared to the prior year period. Similar to the prior quarters of fiscal 2018, the volume of payments has declined while the average revenue per trade has increased compared to comparable periods of fiscal 2017, as certain commercial customers who had previously transacted their individual high volume but low value payments through our platform, opened their own bank accounts in certain countries to which we had made payments into on their behalf. Although this process change may lower our number of payments, we still provide the foreign currency funding payments into these customers’ accounts on an aggregated basis in these countries. Overall, operating revenues increased in the third quarter compared to the prior year period as a result of an increase in both the number of active clients and the dollar value of the payments made versus the prior year.
Segment income increased 24% to $16.0 million in the third quarter compared to $12.9 million in the prior year. This increase primarily resulted from the increase in operating revenues and a decline in variable introducing broker commissions, partially offset by a $0.6 million increase in non-variable direct expenses versus the prior year period, driven in large part by higher non-variable compensation and trade system costs. Variable expenses, excluding interest, expressed as a percentage of operating revenues decreased to 23% in the third quarter compared to 28% in the prior year, mainly as a result of a decrease in introducing broker commissions.
Nine Months Ended June 30, 2018 Compared to Nine Months Ended June 30, 2017
Operating revenues increased 10% to $74.0 million in the current nine months ended compared to $67.1 million in the prior year. The volume of payments made increased 1% and the average revenue per trade increased 9% versus the prior year to $153.81
Segment income increased 17% to $44.1 million in the current nine months ended compared to $37.8 million in the prior year. This increase primarily resulted from the increase in operating revenues, partially offset by a $1.7 million increase in non-variable direct expenses, primarily in compensation and benefits and trade system costs. Variable expenses, excluding interest, expressed as a percentage of operating revenues decreased to 24% compared to 28% in the prior year, primarily as a result of a decline in introducing broker commissions.
42
Securities
We provide value-added solutions that facilitate cross-border trading and believe our customers value our ability to manage complex transactions, including foreign exchange, utilizing our understanding of local market convention, liquidity and settlement protocols around the world. Our customers include U.S.-based regional and national broker-dealers and institutions investing or executing customer transactions in international markets and foreign institutions seeking access to the U.S. securities markets. We are one of the leading market makers in foreign securities, including unlisted ADRs, Global Depository Receipts (“GDRs”) and foreign ordinary shares. We make markets in over 3,600 ADRs, GDRs and foreign ordinary shares, of which over 2,000 trade in the OTC market. In addition, we will, on request, make prices in more than 10,000 unlisted foreign securities. We are also a broker-dealer in Argentina, where we are active in providing institutional executions in the local capital markets.
We act as an institutional dealer in fixed income securities, including U.S. Treasury, U.S. government agency, agency mortgage-backed and asset-backed securities to a customer base including asset managers, commercial bank trust and investment departments, broker-dealers, and insurance companies.
We originate, structure and place debt instruments in the international and domestic capital markets. These instruments include complex asset-backed securities (primarily in Argentina) and domestic municipal securities. On occasion, we may invest our own capital in debt instruments before selling them. We also actively trade in a variety of international debt instruments as well as operate an asset management business in which we earn fees, commissions and other revenues for management of third party assets and investment gains or losses on our investments in funds and proprietary accounts managed either by our investment managers or by independent investment managers.
The following table provides the financial performance for Securities for the periods indicated.
Three Months Ended June 30, | Nine Months Ended June 30, | ||||||||||||||||||
(in millions) | 2018 | % Change | 2017 | 2018 | % Change | 2017 | |||||||||||||
Revenues: | |||||||||||||||||||
Sales of physical commodities | $ | — | — | $ | — | $ | — | — | $ | — | |||||||||
Trading gains, net | 23.7 | 13% | 20.9 | 74.0 | 16% | 63.9 | |||||||||||||
Commission and clearing fees | 4.9 | 48% | 3.3 | 15.4 | 97% | 7.8 | |||||||||||||
Consulting, management, and account fees | 2.4 | (31)% | 3.5 | 8.0 | (23)% | 10.4 | |||||||||||||
Interest income | 18.9 | 54% | 12.3 | 51.0 | 54% | 33.2 | |||||||||||||
Other income | — | — | — | — | — | — | |||||||||||||
Total revenues | 49.9 | 25% | 40.0 | 148.4 | 29% | 115.3 | |||||||||||||
Cost of sales of physical commodities | — | — | — | — | — | — | |||||||||||||
Operating revenues | 49.9 | 25% | 40.0 | 148.4 | 29% | 115.3 | |||||||||||||
Transaction-based clearing expenses | 10.7 | 67% | 6.4 | 30.9 | 65% | 18.7 | |||||||||||||
Introducing broker commissions | 0.8 | (60)% | 2.0 | 4.9 | (22)% | 6.3 | |||||||||||||
Interest expense | 14.8 | 111% | 7.0 | 37.9 | 130% | 16.5 | |||||||||||||
Net operating revenues | 23.6 | (4)% | 24.6 | 74.7 | 1% | 73.8 | |||||||||||||
Variable direct compensation and benefits | 6.1 | 39% | 4.4 | 19.1 | 28% | 14.9 | |||||||||||||
Net contribution | 17.5 | (13)% | 20.2 | 55.6 | (6)% | 58.9 | |||||||||||||
Non-variable direct expenses | 7.2 | (1)% | 7.3 | 21.5 | —% | 21.4 | |||||||||||||
Segment income | $ | 10.3 | (20)% | $ | 12.9 | $ | 34.1 | (9)% | $ | 37.5 | |||||||||
43
The following table sets forth operating revenues by product line and selected data for Securities for the periods indicated.
Three Months Ended June 30, | Nine Months Ended June 30, | ||||||||||||||||||
2018 | % Change | 2017 | 2018 | % Change | 2017 | ||||||||||||||
Operating revenues by product line (in millions): | |||||||||||||||||||
Equity Market-Making | $ | 24.8 | 92% | $ | 12.9 | $ | 70.8 | 61% | $ | 43.9 | |||||||||
Debt Trading | 22.1 | (4)% | 23.1 | 68.4 | 13% | 60.7 | |||||||||||||
Investment Banking | 0.3 | (57)% | 0.7 | 1.7 | (6)% | 1.8 | |||||||||||||
Asset Management | 2.7 | (18)% | 3.3 | 7.5 | (16)% | 8.9 | |||||||||||||
$ | 49.9 | 25% | $ | 40.0 | $ | 148.4 | 29% | $ | 115.3 | ||||||||||
Selected data: | |||||||||||||||||||
Equity Market-Making (gross dollar volume, millions) | $ | 30,344.1 | 42% | $ | 21,298.1 | $ | 87,088.6 | 29% | $ | 67,284.8 | |||||||||
Equity Market-Making revenue per $1,000 traded | $ | 0.68 | 17% | $ | 0.58 | $ | 0.70 | 9% | $ | 0.64 | |||||||||
Debt Trading (principal dollar volume, millions) | $ | 29,922.2 | (7)% | $ | 32,176.4 | $ | 91,615.0 | (11)% | $ | 102,651.2 | |||||||||
Debt Trading revenue per $1,000 traded | $ | 0.74 | 3% | $ | 0.72 | $ | 0.75 | 27% | $ | 0.59 | |||||||||
Average assets under management in Argentina (millions) | $ | 458.4 | (30)% | $ | 653.4 | $ | 467.3 | (18)% | $ | 570.7 | |||||||||
Three Months Ended June 30, 2018 Compared to Three Months Ended June 30, 2017
Operating revenues increased 25% to $49.9 million in the third quarter compared to $40.0 million in the prior year.
Operating revenues in our Securities segment are comprised of activities in four product lines, Equity Market-Making, Debt Trading, Investment Banking and Asset Management. Operating revenues in Equity Market-Making increased 92% in the third quarter compared to the prior year period. Gross dollar volume traded increased 42%, driven by increased market volatility, the on-boarding of new customers and an increase in market share, while the average revenue per $1,000 traded increased 17% versus the prior year. Equity Market-Making operating revenues include the trading profits we earn before the related expense deduction for ADR conversion fees. These ADR fees are included in the condensed consolidated income statements as ‘transaction-based clearing expenses’.
Operating revenues in Debt Trading declined $1.0 million or 4% in the third quarter compared to the prior year as higher operating revenues in our domestic institutional fixed income business were offset by lower operating revenues in our Argentina operations due to difficult local economic conditions including spikes in both local interest rates and deteriorating value of the local currency. Operating revenues in the prior year included a $2.5 million gain on the sale of exchange shares held in Argentina. Asset Management operating revenues declined 18% in the third quarter compared to the prior year as this business faced the same headwinds as our Argentina debt trading business, resulting in the average assets under management declining 30% to $458.4 million in the third quarter compared to $653.4 million in the prior year.
Segment income decreased 20% to $10.3 million in the third quarter compared to $12.9 million in the prior year. The increase in operating revenues was more than offset by an increase in interest expense in our domestic institutional fixed income and securities lending businesses as well as the prior year period inclusion of the $2.5 million gain on the sale of exchange shares in Argentina. Variable expenses, excluding interest, expressed as a percentage of operating revenues increased to 35% in the third quarter compared to 32% in the prior year, primarily as the result of an increase in transaction-based clearing expenses.
Nine Months Ended June 30, 2018 Compared to Nine Months Ended June 30, 2017
Operating revenues increased 29% to $148.4 million in the current nine months ended compared to $115.3 million in the prior year.
Operating revenues in Equity Market-Making increased 61% in the current nine months ended compared to the prior year, primarily as a result of a 29% increase in the gross dollar volume traded and a 9% increase in the average revenue per $1,000 traded. Equity Market-Making operating revenues include the trading profits we earn before the related expense deduction for ADR conversion fees.
Operating revenues in Debt Trading increased 13% in the current nine months ended compared to the prior year, primarily as a result of an increase in interest income in our domestic institutional fixed income business as well as increased activity in our municipal securities businesses. In addition, operating revenues in the prior year period included a $2.5 million gain on the sale of exchange shares held in Argentina. Asset Management operating revenues decreased 16% in the current nine months ended compared to the prior year as the average assets under management declined 18% to $467.3 million in the current nine months ended compared to $570.7 million in the prior year.
Segment income declined 9% to $34.1 million in the current nine months ended compared to $37.5 million in the prior year, as the increase in operating revenues were more than offset by an increase in interest expense, primarily in our Debt Trading
44
business as well as in securities lending combined with an increase in transaction-based clearing expenses in Equity Market-Making. Variable expenses, excluding interest, expressed as a percentage of operating revenues increased to 37% in the current nine months ended compared to 35% in the prior year, primarily as a result of an increase in transaction-based clearing expenses.
Physical Commodities
This segment consists of our physical Precious Metals trading and Physical Ag & Energy commodity businesses. In Precious Metals, we provide a full range of trading and hedging capabilities, including OTC products, to select producers, consumers, and investors. In our trading activities, we act as a principal, committing our own capital to buy and sell precious metals on a spot and forward basis.
In our Physical Ag & Energy commodity business, we act as a principal to facilitate financing, structured pricing and logistics services to clients across the commodity complex, including energy commodities, grains, oil seeds, cotton, coffee, cocoa, edible oils and feed products. We provide financing to commercial commodity-related companies against physical inventories. We use sale and repurchase agreements to purchase commodities evidenced by warehouse receipts, subject to a simultaneous agreement to sell such commodities back to the original seller at a later date.
Transactions where the sale and repurchase price are fixed upon execution, and meet additional required conditions, are accounted for as product financing arrangements, and accordingly no commodity inventory, purchases or sales are recorded. Transactions where the repurchase price is not fixed at execution do not meet all the criteria to be accounted for as product financing arrangements, and therefore are recorded as commodity inventory, purchases and sales.
Precious metals inventory held by INTL FCStone Ltd, a United Kingdom based broker-dealer subsidiary, is measured at fair value, with changes in fair value included as a component of ‘trading gains, net’ in the condensed consolidated income statements. INTL FCStone Ltd precious metals sales and cost of sales are presented on a net basis and included as a component of ‘trading gains, net’ in the condensed consolidated income statements. Precious metals inventory held by our subsidiaries that are not broker-dealers are valued at the lower of cost or net realizable value. Precious metals sales and cost of sales for subsidiaries that are not broker-dealers are recorded on a gross basis.
In our Physical Ag and Energy commodity business, we value our agricultural inventory at net realizable value, which approximates fair value less disposal costs. The agricultural inventories have reliable, readily determinable and realizable market prices, have relatively insignificant costs of disposal and are available for immediate delivery. Revenues generated from our Physical Ag and Energy commodity business are recorded on a gross basis.
Operating gains and losses from our Precious Metals commodities derivatives activities are included in ‘trading gains, net’ in the condensed consolidated income statements. Operating gains and losses from our Physical Ag and Energy commodities derivatives activities are included in ‘cost of sales of physical commodities’ in the condensed consolidated income statements. We generally mitigate the price risk associated with commodities held in inventory through the use of derivatives. We do not elect hedge accounting under U.S. GAAP in accounting for this price risk mitigation. Management continues to evaluate performance and allocate resources on an operating revenue basis.
45
The following table provides the financial performance for Physical Commodities for the periods indicated.
Three Months Ended June 30, | Nine Months Ended June 30, | ||||||||||||||||||
(in millions) | 2018 | % Change | 2017 | 2018 | % Change | 2017 | |||||||||||||
Revenues: | |||||||||||||||||||
Sales of physical commodities | $ | 6,866.2 | 29% | $ | 5,317.0 | $ | 20,836.4 | 26% | $ | 16,486.3 | |||||||||
Trading gains (losses), net | 4.6 | n/m | 1.4 | 8.2 | n/m | 2.4 | |||||||||||||
Commission and clearing fees | 0.4 | 33% | 0.3 | 1.5 | 114% | 0.7 | |||||||||||||
Consulting, management, and account fees | 0.4 | 100% | 0.2 | 0.8 | (20)% | 1.0 | |||||||||||||
Interest income | 1.8 | 29% | 1.4 | 5.4 | 13% | 4.8 | |||||||||||||
Other income | — | — | — | — | — | — | |||||||||||||
Total revenues | 6,873.4 | 29% | 5,320.3 | 20,852.3 | 26% | 16,495.2 | |||||||||||||
Cost of sales of physical commodities | 6,858.5 | 29% | 5,308.3 | 20,811.3 | 26% | 16,462.2 | |||||||||||||
Operating revenues | 14.9 | 24% | 12.0 | 41.0 | 24% | 33.0 | |||||||||||||
Transaction-based clearing expenses | 0.2 | —% | 0.2 | 0.7 | 17% | 0.6 | |||||||||||||
Introducing broker commissions | 0.1 | n/m | — | 0.2 | —% | 0.2 | |||||||||||||
Interest expense | 3.2 | 100% | 1.6 | 7.8 | 59% | 4.9 | |||||||||||||
Net operating revenues | 11.4 | 12% | 10.2 | 32.3 | 18% | 27.3 | |||||||||||||
Variable direct compensation and benefits | 3.3 | 27% | 2.6 | 9.2 | 24% | 7.4 | |||||||||||||
Net contribution | 8.1 | 7% | 7.6 | 23.1 | 16% | 19.9 | |||||||||||||
Non-variable direct expenses | 3.0 | (9)% | 3.3 | 10.3 | 18% | 8.7 | |||||||||||||
Bad debt on physical coal | — | n/m | — | 1.0 | n/m | — | |||||||||||||
Segment income | $ | 5.1 | 19% | $ | 4.3 | $ | 11.8 | 5% | $ | 11.2 | |||||||||
The following tables set forth operating revenue by product line and selected data for Physical Commodities for the periods indicated.
Precious Metals | |||||||||||||||||||
Three Months Ended June 30, | Nine Months Ended June 30, | ||||||||||||||||||
2018 | % Change | 2017 | 2018 | % Change | 2017 | ||||||||||||||
Total revenues | $ | 6,620.1 | 29% | $ | 5,146.4 | $ | 20,187.9 | 27% | $ | 15,938.6 | |||||||||
Cost of sales of physical commodities | 6,611.8 | 29% | 5,139.2 | 20,165.4 | 27% | 15,920.2 | |||||||||||||
Operating revenues | $ | 8.3 | 15% | $ | 7.2 | $ | 22.5 | 22% | $ | 18.4 | |||||||||
Selected data: | |||||||||||||||||||
Gold equivalent ounces traded (000’s) | 72,300.6 | 98% | 36,553.6 | 160,802.8 | 82% | 88,122.2 | |||||||||||||
Average revenue per ounce traded | $ | 0.11 | (45)% | $ | 0.20 | $ | 0.14 | (33)% | $ | 0.21 | |||||||||
Physical Ag & Energy | |||||||||||||||||||
Three Months Ended June 30, | Nine Months Ended June 30, | ||||||||||||||||||
2018 | % Change | 2017 | 2018 | % Change | 2017 | ||||||||||||||
Total revenues | $ | 253.3 | 46% | $ | 173.9 | $ | 664.4 | 19% | $ | 556.6 | |||||||||
Cost of sales of physical commodities | 246.7 | 46% | 169.1 | 645.9 | 19% | 542.0 | |||||||||||||
Operating revenues | $ | 6.6 | 38% | $ | 4.8 | $ | 18.5 | 27% | $ | 14.6 | |||||||||
Three Months Ended June 30, 2018 Compared to Three Months Ended June 30, 2017
Operating revenues for Physical Commodities increased 24% to $14.9 million in the third quarter compared to $12.0 million in the prior year.
Precious Metals operating revenues increased 15% to $8.3 million in the third quarter compared to $7.2 million in the prior year as a result of a 98% increase in the number of ounces traded, which was partially offset by a 45% decline in the average revenue per ounce traded compared to the prior year.
Operating revenues in Physical Ag & Energy increased 38% to $6.6 million in the third quarter compared to the prior year. The increase in operating revenues is largely due to increased trading activity in our U.S. subsidiary, FCStone Merchant Services, LLC, across multiple commodities including cotton, cocoa, edible oils and energy along with an increase in its commodity financing programs with customers.
Segment income increased 19% to $5.1 million in the third quarter compared to $4.3 million in the prior year, primarily as a result of the increase in operating revenues as well as a $0.3 million decline in non-variable direct expenses. Non-variable expenses declined $0.3 million as a result of a $0.7 million recovery of a bad debt expense in our Precious Metals business
46
originally recorded in the second quarter of fiscal 2018, which was partially offset by a $0.4 million increase in professional fees incurred related to our exit of our physical coal business.
Nine Months Ended June 30, 2018 Compared to Nine Months Ended June 30, 2017
Operating revenues for Physical Commodities increased 24% to $41.0 million in the current nine months ended compared to $33.0 million in the prior year.
Precious Metals operating revenues increased 22% to $22.5 million in the current nine months ended compared to $18.4 million in the prior year. Operating revenues increased from the prior year period as a result of a 82% increase in the number of ounces traded, which was partially offset by a 33% decline in the average revenue per ounce traded.
Operating revenues in Physical Ag & Energy increased 27% to $18.5 million in the current nine months ended compared to $14.6 million in the prior year. The increase in operating revenues is primarily due to business expansion in our U.S. subsidiary FCStone Merchant Services, LLC, resulting in increased transactions in cotton, cocoa and edible oils along with an increase in its commodity financing programs with customers from both existing and new customer relationships.
Segment income increased 5% to $11.8 million in the current nine months ended compared to $11.2 million in the prior year driven by the increase in operating revenues. The increase in operating revenues was partially offset by a $2.9 million increase in interest expense as well as a $1.6 million increase in non-variable direct expenses. Non-variable direct expenses increased primarily due to a $0.5 million increase in compensation and benefits, a $1.1 million increase in professional fees related to our exit of the physical coal business.
Clearing and Execution Services
We provide competitive and efficient clearing and execution in all major futures and securities exchanges globally as well as prime brokerage in all major foreign currency pairs and swap transactions.
As of June 30, 2018, we held $2.4 billion in required customer segregated assets, which we believe makes us the third largest independent futures commission merchant (“FCM”) in the United States not affiliated with a major financial institution or commodity intermediary, end-user or producer, as measured by required customer segregated assets. We seek to leverage our capabilities and capacity by offering facilities management or outsourcing solutions to other FCM’s. Through our platform, customer orders are accepted and directed to the appropriate exchange for execution. We then facilitate the clearing of customer transactions. Clearing involves the matching of customer trades with the exchange, the collection and management of customer margin deposits to support the transactions, and the accounting and reporting of the transactions to customers.
We believe we are one of the largest non-bank prime brokers and swap dealers in the world. Through this offering, we provide prime brokerage foreign exchange (“FX”) services to financial institutions and professional traders. We provide our customers with the full range of OTC products, including 24-hour a day execution of spot, forwards and options as well as non-deliverable forwards in both liquid and exotic currencies. We also operate a proprietary foreign exchange desk that arbitrages the exchange-traded foreign exchange markets with the cash markets.
With our correspondent securities clearing business, we are an independent full-service provider to introducing broker-dealers (“IBD’s”) of clearing, custody, research, syndicated and security-based lending products and services, including a proprietary technology platform which offers seamless connectivity to ensure a positive customer experience through the clearing and settlement process.
We have an independent wealth management business which offers a comprehensive product suite to retail customers nationwide. As a result we are one of the leading mid-market clearers in the securities industry, with approximately 60 correspondent clearing relationships with over $15 billion in assets under management or administration as of June 30, 2018.
Our London-based EMEA oil voice brokerage business provides brokerage services across the fuel, crude, and middle distillates markets with over 200 well known commercial and institutional customers throughout Europe, the Middle East and Africa.
47
The following table provides the financial performance and selected data for Clearing and Execution Services for the periods indicated.
Three Months Ended June 30, | Nine Months Ended June 30, | ||||||||||||||||||
(in millions) | 2018 | % Change | 2017 | 2018 | % Change | 2017 | |||||||||||||
Sales of physical commodities | $ | — | — | $ | — | $ | — | — | $ | — | |||||||||
Trading gains, net | 11.4 | 5% | 10.9 | 35.1 | 5% | 33.4 | |||||||||||||
Commission and clearing fees | 58.0 | 36% | 42.5 | 163.2 | 30% | 125.6 | |||||||||||||
Consulting, management, and account fees | 11.3 | 30% | 8.7 | 31.4 | 29% | 24.3 | |||||||||||||
Interest income | 8.2 | 148% | 3.3 | 19.4 | 96% | 9.9 | |||||||||||||
Other | — | — | — | — | — | — | |||||||||||||
Total revenues | 88.9 | 36% | 65.4 | 249.1 | 29% | 193.2 | |||||||||||||
Cost of physical commodities sold | — | — | — | — | — | — | |||||||||||||
Operating revenues | 88.9 | 36% | 65.4 | 249.1 | 29% | 193.2 | |||||||||||||
Transaction-based clearing expenses | 27.2 | 51% | 18.0 | 73.0 | 33% | 54.9 | |||||||||||||
Introducing broker commissions | 26.6 | 26% | 21.1 | 78.7 | 28% | 61.4 | |||||||||||||
Interest expense | 2.4 | 243% | 0.7 | 5.5 | 206% | 1.8 | |||||||||||||
Net operating revenues | 32.7 | 28% | 25.6 | 91.9 | 22% | 75.1 | |||||||||||||
Variable direct compensation and benefits | 8.3 | 28% | 6.5 | 23.1 | 26% | 18.4 | |||||||||||||
Net contribution | 24.4 | 28% | 19.1 | 68.8 | 21% | 56.7 | |||||||||||||
Non-variable direct expenses | 10.7 | (15)% | 12.6 | 31.9 | (13)% | 36.6 | |||||||||||||
Segment income | $ | 13.7 | 111% | $ | 6.5 | $ | 36.9 | 84% | $ | 20.1 | |||||||||
The following table sets forth operating revenues by product line and selected data for Clearing and Execution Services for the periods indicated.
Three Months Ended June 30, | Nine Months Ended June 30, | ||||||||||||||||||
(in millions) | 2018 | % Change | 2017 | 2018 | % Change | 2017 | |||||||||||||
Operating revenues by product line (in millions): | |||||||||||||||||||
Exchange-traded Futures & Options | $ | 50.8 | 77% | $ | 28.7 | $ | 136.3 | 61% | $ | 84.6 | |||||||||
FX Prime Brokerage | 5.1 | 13% | 4.5 | 14.8 | 3% | 14.3 | |||||||||||||
Correspondent Clearing | 8.1 | 27% | 6.4 | 20.9 | 6% | 19.7 | |||||||||||||
Independent Wealth Management | 18.3 | (3)% | 18.9 | 55.6 | 2% | 54.7 | |||||||||||||
Derivative Voice Brokerage | 6.6 | (4)% | 6.9 | 21.5 | 8% | 19.9 | |||||||||||||
Operating revenues | $ | 88.9 | 36% | $ | 65.4 | $ | 249.1 | 29% | $ | 193.2 | |||||||||
Selected data: | |||||||||||||||||||
Exchange-traded - futures and options (contracts, 000’s) | 28,233.5 | 55% | 18,176.5 | 77,234.3 | 38% | 55,956.4 | |||||||||||||
Exchange-traded - futures and options average rate per contract | $ | 1.51 | 12% | $ | 1.35 | $ | 1.51 | 16% | $ | 1.30 | |||||||||
Average customer equity - futures and options (millions) | $ | 1,271.0 | 25% | $ | 1,016.2 | $ | 1,232.4 | 15% | $ | 1,073.4 | |||||||||
FX Prime Brokerage volume (U.S. notional, millions) | $ | 93,007.8 | (36)% | $ | 145,679.8 | $ | 330,178.9 | (32)% | $ | 487,145.5 | |||||||||
Three Months Ended June 30, 2018 Compared to Three Months Ended June 30, 2017
Operating revenues increased 36% to $88.9 million in the third quarter compared to $65.4 million in the prior year.
Operating revenues in our Exchange-traded Futures & Options business increased 77% to $50.8 million in the third quarter compared to $28.7 million in the prior year as a result of a 55% increase in exchange-traded volumes and a 12% increase in the average rate per contract compared to the prior year period. In addition, interest income in the Exchange-traded Futures & Options business increased $3.9 million to $5.9 million in the third quarter due to an increase in short-term rates and a 25% increase in average customer equity to $1.3 billion.
Operating revenues in our FX Prime Brokerage increased 13% compared to the prior year to $5.1 million in the third quarter, despite a 36% decline in foreign exchange volumes, as market volatility drove a widening of spreads in this business.
48
Correspondent Clearing operating revenues increased 27% compared to the prior year to $8.1 million in the third quarter, while operating revenues in Independent Wealth Management declined 3% versus the prior year to $18.3 million. Included within these operating revenues, Correspondent Clearing and Independent Wealth Management businesses had interest income of $2.2 million and $0.1 million, respectively. Operating revenues in Derivative Voice Brokerage declined 4% to $6.6 million in the third quarter compared to the prior year.
Segment income increased to $13.7 million in the third quarter compared to $6.5 million in the prior year, primarily as a result of the increase in operating revenues as well as a $1.9 million decline in non-variable direct expenses, including a $1.2 million reduction in compensation and benefits, resulting from a cost savings initiative in the FX Prime Brokerage and Correspondent Clearing businesses. Segment income in the third quarter includes a $0.9 million quarterly charge to compensation and benefits per the terms of the acquisition of the Derivative Voice Brokerage business which will continue to be expensed through the end of fiscal 2018 based upon the employees’ continued employment. Variable expenses, excluding interest, as a percentage of operating revenues were 70% in both the third quarter and the prior year.
Nine Months Ended June 30, 2018 Compared to Nine Months Ended June 30, 2017
Operating revenues increased 29% to $249.1 million in the current nine months ended compared to $193.2 million in the prior year.
Operating revenues in our Exchange-traded Futures & Options business increased 61% to $136.3 million in the current nine months ended compared to $84.6 million in the prior year as a result of a 38% increase in exchange-traded volumes and a 16% increase in the average rate per contract compared to the prior year period. Interest income in the Exchange-traded Futures & Options business increased $7.6 million to $13.3 million in the current nine months ended primarily as a result of an increase in short-term rates and a 15% increase in average customer equity to $1.2 billion.
Operating revenues in our FX Prime Brokerage increased 3% to $14.8 million in the current nine months ended compared to $14.3 million in the prior year despite a 32% decrease in foreign exchange volumes as market volatility drove a widening of spreads in this business.
Operating revenues in the Correspondent Clearing increased 6% to $20.9 million in the current nine months ended, while Independent Wealth Management operating revenues increased 2% versus the prior year period to $55.6 million. Included within these operating revenues, Correspondent Clearing and Independent Wealth Management businesses had interest income of $5.5 million and $0.3 million, respectively. Operating revenues in the Derivative Voice Brokerage business increased 8% versus the prior year to $21.5 million in the current nine months ended.
Segment income increased to $36.9 million in the current nine months ended compared to $20.1 million in the prior year, primarily as a result of the increase in operating revenues as well as a $4.7 million decline in non-variable direct expenses compared to the prior year period. This decline in non-variable direct expenses, was primarily a result of cost savings initiatives in the FX prime brokerage and Correspondent Clearing businesses. Segment income in the current nine months ended includes a quarterly charge, aggregating to $2.7 million, to compensation and benefits per the terms of the acquisition of the oil voice brokerage business which will continue to be expensed through the end of fiscal 2018 based upon the employees continued employment. Variable expenses, excluding interest, as a percentage of operating revenues were 70% in both the current nine months ended and the prior year.
Liquidity, Financial Condition and Capital Resources
Overview
Liquidity is defined as our ability to generate sufficient amounts of cash to meet all of our cash needs. Liquidity is of critical importance to us and imperative to maintain our operations on a daily basis. Our senior management establishes liquidity and capital policies, and monitors liquidity on a daily basis. Senior management reviews business performance relative to these policies and monitors the availability of our internal and external sources of financing. Liquidity and capital matters are reported regularly to our board of directors.
INTL FCStone Financial is registered as a broker-dealer with the Securities and Exchange Commission (“SEC”) and is a member of the Financial Industry Regulatory Authority (“FINRA”) and the Municipal Securities Rulemaking Board (“MSRB”). In addition, INTL FCStone Financial is registered as a futures commission merchant with the CFTC and NFA, and a member of various commodities and futures exchanges in the U.S. and abroad. INTL FCStone Financial has a responsibility to meet margin calls at all exchanges on a daily basis and intra-day basis, if necessary. We require our customers to make any required margin deposits the next business day, and we require our largest customers to make intra-day margin payments during periods of significant price movement. Margin required to be posted to the exchanges is a function of the net open positions of our customers and the required margin per contract. INTL FCStone Financial is subject to minimum capital requirements under Section 4(f)(b) of the Commodity Exchange Act, Part 1.17 of the rules and regulations of the CFTC and the SEC Uniform Net Capital Rule 15c3-1 under the Securities Exchange Act of 1934. These rules specify the minimum amount of capital that must
49
be available to support our customers’ open trading positions, including the amount of assets that INTL FCStone Financial must maintain in relatively liquid form, and are designed to measure general financial integrity and liquidity. INTL FCStone Financial is also subject to the Rule 15c3-3 of the Securities Exchange Act of 1934, as amended (“Customer Protection Rule”).
INTL FCStone Ltd, our U.K. regulated subsidiary, is required to be compliant with the U.K.’s Individual Liquidity Adequacy Standards (“ILAS”). To comply with these standards, we have implemented daily liquidity procedures, conduct periodic reviews of liquidity by stressed scenarios, and have created liquidity buffers.
Our wholly owned subsidiaries, INTL Custody & Clearing Solutions Inc. (formerly Sterne Agee Clearing, Inc.) and SA Stone Wealth Management Inc. (formerly Sterne Agee Financial Services, Inc.) are subject to the SEC Uniform Net Capital Rule 15c3-1 under the Securities Exchange Act of 1934.
In addition, in our physical commodities trading, commercial hedging OTC, securities and foreign exchange trading activities, we may be called upon to meet margin calls with our various trading counterparties based upon the underlying open transactions we have in place with those counterparties.
We continuously review our overall credit and capital needs to ensure that our capital needs to ensure that our capital base, both stockholders’ equity and debt, as well as available credit facilities can appropriately support the anticipated financing needs of our operating subsidiaries.
As of June 30, 2018, we had total equity capital of $487.7 million and outstanding bank loans of $360.6 million.
A substantial portion of our assets are liquid. As of June 30, 2018, approximately 98% of our assets consisted of cash; securities purchased under agreements to resell; securities borrowed; deposits with and receivables from exchange-clearing organizations, broker-dealers, clearing organizations and counterparties; customer receivables, marketable financial instruments and investments, and physical commodities inventory. All assets that are not customer and counterparty deposits are financed by our equity capital, bank loans, short-term borrowings from financial instruments sold, not yet purchased and under repurchase agreements, securities loaned, and other payables.
Customer and Counterparty Credit and Liquidity Risk
Our operations expose us to credit risk of default of our customers and counterparties. The risk includes liquidity risk to the extent our customers or counterparties are unable to make timely payment of margin or other credit support. These risks expose us indirectly to the financing and liquidity risks of our customers and counterparties, including the risks that our customers and counterparties may not be able to finance their operations.
As a clearing broker, we act on behalf of our customers for all trades consummated on exchanges. We must pay initial and variation margin to the exchanges, on a net basis, before we receive the required payments from our customers. Accordingly, we are responsible for our customers’ obligations with respect to these transactions, which exposes us to significant credit risk. Our customers are required to make any required margin deposits the next business day, and we require our largest customers to make intra-day margin payments during periods of significant price movement. Our customers are required to maintain initial margin requirements at the level set by the respective exchanges, but we have the ability to increase the margin requirements for customers based on their open positions, trading activity, or market conditions.
With OTC derivative transactions, we act as a principal, which exposes us to the credit risk of both our customers and the counterparties with which we offset our customer positions. As with exchange-traded transactions, our OTC transactions require that we meet initial and variation margin payments on behalf of our customers before we receive the required payment from our customers. OTC customers are required to post sufficient collateral to meet margin requirements based on Value-at-Risk models as well as variation margin requirement based on the price movement of the commodity or security in which they transact. Our customers are required to make any required margin deposits the next business day, and we may require our largest customers to make intra-day margin payments during periods of significant price movement. We have the ability to increase the margin requirements for customers based on their open positions, trading activity, or market conditions. On a limited basis, we provide credit thresholds to certain customers, based on internal evaluations and monitoring of customer creditworthiness.
In addition, with OTC transactions, we are at risk that a counterparty will fail to meet its obligations when due. We would then be exposed to the risk that the settlement of a transaction which is due a customer will not be collected from the respective counterparty with which the transaction was offset. We continuously monitor the credit quality of our respective counterparties and mark our positions held with each counterparty to market on a daily basis.
We enter into securities purchased under agreements to resell, securities sold under agreements to repurchase, securities borrowed and securities loaned transactions to, among other things, finance financial instruments, acquire securities to cover short positions, acquire securities for settlement, and to accommodate counterparties’ needs. In connection with these agreements and transactions, it is our policy to receive or pledge cash or securities to adequately collateralize such agreements
50
and transactions in accordance with general industry guidelines and practices. The value of the collateral is valued daily and we may require counterparties to deposit additional collateral or return collateral pledged, when appropriate.
In our Physical Commodities business we act as a principal, which exposes us to the credit risk of both our customers and our suppliers with which we offset our customer positions as well as provide financing to commercial commodity-related companies against physical inventories. We mitigate this risk by securing warehouse receipts and or insurance against potential default by either party.
Information related to bad debt expense for the three and nine months ended June 30, 2018 and 2017 can be found in Note 5 of the Condensed Consolidated Financial Statements.
Primary Sources and Uses of Cash
Our assets and liabilities may vary significantly from period to period due to changing customer requirements, economic and market conditions and our growth. Our total assets as of June 30, 2018 and September 30, 2017, were $7.3 billion and $6.2 billion, respectively. Our operating activities generate or utilize cash as a result of net income or loss earned or incurred during each period and fluctuations in our assets and liabilities. The most significant fluctuations arise from changes in the level of customer activity, commodities prices and changes in the balances of financial instruments and commodities inventory. INTL FCStone Financial and INTL FCStone Ltd occasionally utilize their margin line credit facilities, on a short-term basis, to meet intraday settlements with the commodity exchanges prior to collecting margin funds from their customers.
The majority of the assets of INTL FCStone Financial and INTL FCStone Ltd are restricted from being transferred to its parent or other affiliates due to specific regulatory requirements. This restriction has no impact on our ability to meet our cash obligations, and no impact is expected in the future.
We have liquidity and funding policies and processes in place that are intended to maintain significant flexibility to address both company-specific and industry liquidity needs. The majority of our excess funds are held with high quality institutions, under highly-liquid reverse repurchase agreements, U.S. government obligations, interest earning cash deposits and AA-rated money market investments. We do not hold any direct investments in the general obligations of any sovereign nations.
As of June 30, 2018, we had $277.2 million in undistributed foreign earnings. As a result of the Tax Reform, the Company now has the ability to repatriate these funds tax free. While the majority of these undistributed earnings have been reinvested in our foreign regulated subsidiaries, in particular our London-based subsidiary INTL FCStone Ltd, we intend to repatriate available funds to our U.S. operations which will be placed into our central treasury, and available for funding.
As of June 30, 2018, $31.1 million of financial instruments owned and $31.2 million of financial instruments sold, not yet purchased, are exchangeable foreign equities, ADRs and GDRs.
As of June 30, 2018, we had four committed bank credit facilities, totaling $594.5 million, of which $311.2 million was outstanding. Additional information regarding our bank credit facilities can be found in Note 9 of the Condensed Consolidated Financial Statements. The credit facilities include:
• | A three-year syndicated loan facility, committed until March 18, 2019, under which INTL FCStone Inc. is entitled to borrow up to $262.0 million, subject to certain terms and conditions of the credit agreement. The loan proceeds are used to finance our working capital needs of us and certain subsidiaries. |
• | An unsecured syndicated loan facility, committed until April 4, 2019, under which our subsidiary, INTL FCStone Financial is entitled to borrow up to $75.0 million, subject to certain terms and conditions of the credit agreement. This facility is intended to provide short-term funding of margin to commodity exchanges as necessary. |
• | A syndicated loan facility, committed until November 1, 2019, under which our subsidiary, FCStone Merchant Services, LLC is entitled to borrow up to $232.5 million, subject to certain terms and conditions of the credit agreement. The loan proceeds are used to finance traditional commodity financing arrangements and commodity repurchase agreements. |
• | An unsecured syndicated loan facility, committed until November 7, 2018, under which our subsidiary, INTL FCStone Ltd is entitled to borrow up to $25.0 million, subject to certain terms and conditions of the credit agreement. This facility is intended to provide short-term funding of margin to commodity exchanges as necessary. |
As reflected above, $362.0 million of our committed credit facilities are scheduled to expire within twelve months of this filing. We intend to renew or replace these facilities as they expire, and based on our liquidity position and capital structure, we believe we will be able to do so.
Additionally, we have a secured, uncommitted loan facility, under which our subsidiary, INTL FCStone Financial may borrow up to $75.0 million, collateralized by commodities warehouse receipts, to facilitate U.S. commodity exchange deliveries of its customers, subject to certain terms and conditions of the credit agreement.
51
We also have a secured uncommitted loan facility, under which our subsidiary, INTL FCStone Ltd may borrow up to approximately $25.0 million, collateralized by commodities warehouse receipts, to facilitate financing of commodities under repurchases agreement services to its customers, subject to certain terms and conditions of the credit agreement.
We also have a secured uncommitted loan facility, under which our subsidiary, INTL FCStone Financial may borrow requested amounts for short term funding of firm and customer margin requirements. The uncommitted maximum amount available to be borrowed is not specified, and all requests for borrowing are subject to the sole discretion of the lender. The borrowings are secured by first liens on firm owned marketable securities or customer owned securities which have been pledged to us under a clearing arrangement.
In addition, we have a secured uncommitted loan facility under which our subsidiary INTL FCStone Financial may borrow up to $100.0 million for short term funding of firm and customer margin requirements. The borrowings are secured by first liens on firm owned marketable securities or customer owned securities which have been pledged to us under a clearing arrangement.
Our facility agreements contain certain financial covenants relating to financial measures on a consolidated basis, as well as on a certain stand-alone subsidiary basis, including minimum tangible net worth, minimum regulatory capital, minimum net unencumbered liquid assets, maximum net loss, minimum fixed charge coverage ratio and maximum funded debt to net worth ratio. Failure to comply with any such covenants could result in the debt becoming payable on demand. As of June 30, 2018, we and our subsidiaries are in compliance with all of our financial covenants under the outstanding facilities.
Other Capital Considerations
Our activities are subject to various significant governmental regulations and capital adequacy requirements, both in the U.S. and in the international jurisdictions in which we operate. Certain of our other non-U.S. subsidiaries are also subject to capital adequacy requirements promulgated by authorities of the countries in which they operate.
Our subsidiaries are in compliance with all of their capital regulatory requirements as of June 30, 2018. Additional information on these net capital and minimum net capital requirements can be found in Note 12 of the Condensed Consolidated Financial Statements.
The Dodd-Frank Act created a comprehensive new regulatory regime governing the OTC and listed derivatives markets and their participants by requiring, among other things: centralized clearing of standardized derivatives (with certain stated exceptions); the trading of clearable derivatives on swap execution facilities or exchanges; and registration and comprehensive regulation of new categories of market participants as “swap dealers” and swap “introducing brokers.” Our subsidiary, INTL FCStone Markets, LLC, is a provisionally registered swap dealer. Some important rules, such as those setting capital and margin requirements, have not been finalized or fully implemented, and it is too early to predict with any degree of certainty how we will be affected.
Cash Flows
Our cash and cash equivalents increased from $314.9 million as of September 30, 2017 to $347.8 million as of June 30, 2018, a net increase of $32.9 million. Net cash of $87.1 million was used in operating activities, $9.3 million was used in investing activities and net cash of $126.3 million was provided by financing activities, of which $131.0 million was borrowed from lines of credit and increased the amounts payable to lenders under loans. Fluctuations in exchange rates increased our cash and cash equivalents by $3.0 million.
In the commodities industry, companies report trading activities in the operating section of the statement of cash flows. Due to the daily price volatility in the commodities market, as well as changes in margin requirements, fluctuations in the balances of deposits held at various exchanges, marketable securities and customer commodity accounts may occur from day-to-day. A use of cash, as calculated on the consolidated statement of cash flows, includes unrestricted cash transferred and pledged to the exchanges or guarantee funds. These funds are held in interest-bearing deposit accounts at the exchanges, and based on daily exchange requirements, may be withdrawn and returned to unrestricted cash. Additionally, in our unregulated OTC and foreign exchange operations, cash deposits received from customers are reflected as cash provided from operations. Subsequent transfer of these cash deposits to counterparties or exchanges to margin their open positions will be reflected as an operating use of cash to the extent the transfer occurs in a different period than the cash deposit was received.
We continuously evaluate opportunities to expand our business. Investing activities include $9.3 million in capital expenditures for property, plant and equipment in the current nine months ended compared to $8.6 million in the prior year. Fluctuations in capital expenditures are primarily due to the timing of purchases of IT equipment and trade system software as well as the timing on leasehold improvement projects.
Apart from what has been disclosed above, there are no known trends, events or uncertainties that have had or are likely to have a material impact on our liquidity, financial condition and capital resources. Based upon our current operations, we
52
believe that cash flows from operations, available cash and available borrowings under our credit facilities will be adequate to meet our future liquidity needs.
Commitments
Information about our commitments and contingent liabilities is contained in Note 11 of the Condensed Consolidated Financial Statements.
Off Balance Sheet Arrangements
We are party to certain financial instruments with off-balance sheet risk in the normal course of business as a registered securities broker-dealer, futures commission merchant, U.K. based Financial Services Firm, provisionally registered swap dealer and from our market-making and proprietary trading in the foreign exchange and commodities trading activities. These financial instruments include futures, forward and foreign exchange contracts, exchange-traded and OTC options, mortgage-backed TBAs, and interest rate swaps. Derivative financial instruments involve varying degrees of off-statement of financial condition market risk whereby changes in the fair values of underlying financial instruments may result in changes in the fair value of the financial instruments in excess of the amounts reflected in the statement of financial condition. Exposure to market risk is influenced by a number of factors, including the relationships between the financial instruments and our positions, as well as the volatility and liquidity in the markets in which the financial instruments are traded. The principal risk components of financial instruments include, among other things, interest rate volatility, the duration of the underlying instruments and changes in commodity pricing and foreign exchange rates. We attempt to manage our exposure to market risk through various techniques. Aggregate market limits have been established and market risk measures are routinely monitored against these limits. Derivative contracts are traded along with cash transactions because of the integrated nature of the markets for such products. We manage the risks associated with derivatives on an aggregate basis along with the risks associated with our proprietary trading and market-making activities in cash instruments as part of our firm-wide risk management policies.
As part of the activities discussed above, we carry short positions. We sell financial instruments that we do not own, borrow the financial instruments to make good delivery, and therefore are obliged to purchase such financial instruments at a future date in order to return the borrowed financial instruments. We recorded these obligations in the condensed consolidated financial statements as of June 30, 2018 and September 30, 2017, at fair value of the related financial instruments, totaling $1,007.2 million and $717.6 million, respectively. These positions are held to offset the risks related to financial assets owned, and reported in our condensed consolidated balance sheets in ‘financial instruments owned, at fair value’, and ‘physical commodities inventory, net’. We will incur losses if the fair value of the financial instruments sold, not yet purchased, increases subsequent to June 30, 2018, which might be partially or wholly offset by gains in the value of assets held as of June 30, 2018. The totals of $1,007.2 million and $717.6 million include a net liability of $305.8 million and $317.0 million for derivatives, based on their fair value as of June 30, 2018 and September 30, 2017, respectively.
Except as discussed above, there have been no material changes to the off balance sheet arrangements discussed in the Management’s Discussion and Analysis of our Annual Report on Form 10-K for the fiscal year ended September 30, 2017.
Effects of Inflation
Because our assets are, to a large extent, liquid in nature, they are not significantly affected by inflation. Increases in our expenses, such as compensation and benefits, transaction-based clearing expenses, occupancy and equipment rental, due to inflation, may not be readily recoverable from increasing the prices of our services. While rising interest rates are generally favorable for us, to the extent that inflation has other adverse effects on the financial markets and on the value of the financial instruments held in inventory, it may adversely affect our financial position and results of operations.
Critical Accounting Policies
See our critical accounting policies discussed in the Management’s Discussion and Analysis of the most recent annual report filed on Form 10-K. There have been no material changes to these policies.
Accounting Development Updates
In May 2014, the Financial Accounting Standards Board (“FASB”) issued Accounting Standards Update (“ASU”) 2014-09, Revenue from Contracts with Customers (Topic 606). ASU 2014-09 completes the joint effort by the FASB and International Accounting Standards Board (IASB) to improve financial reporting by creating common revenue recognition guidance for GAAP and International Financial Reporting Standards (IFRS). In March 2016, the FASB issued ASU 2016-08, “Revenue from Contracts with Customers (Topic 606): Principal versus Agent Considerations (Reporting Revenue Gross versus Net).” ASU 2016-08 clarifies the implementation guidance on principal versus agent considerations. In April 2016, the FASB issued ASU 2016-10, “Revenue from Contracts with Customers (Topic 606): Identifying Performance Obligations and Licensing.” ASU 2016-10 clarifies the implementation guidance on identifying performance obligations. These ASUs apply to all companies that
53
enter into contracts with customers to transfer goods or services. These ASUs are effective for public entities for interim and annual reporting periods beginning after December 15, 2017. Early adoption is permitted only as of annual reporting periods beginning after December 15, 2016, including interim periods within that reporting period. The Company expects to adopt this guidance starting with the first quarter of fiscal year 2019. Entities have the choice to apply these ASUs either retrospectively to each reporting period presented or by recognizing the cumulative effect of applying these standards at the date of initial application and not adjusting comparative information. The Company plans to adopt the new standard using the modified retrospective method which will result in a cumulative effect adjustment as of the date of adoption. By selecting this adoption method, the Company will disclose the amount, if any, by which each financial statement line item is affected by the standard in the current reporting period compared with the guidance that was in effect before adoption. Our implementation efforts include identifying revenues and costs within the scope of the ASU, reviewing contracts, and analyzing any changes to its existing revenue recognition policies. As a result of the initial evaluation performed, the Company does not expect that there will be material changes to the timing of revenue, but do anticipate certain changes to the classification of revenue in the consolidated income statements. The Company also expects additional disclosures to be provided in our consolidated financial statements after adoption of the new standard. The Company is continuing to assess the impact of the new standard as we progress through the implementation process and as industry interpretations are resolved.
In February 2016, the FASB issued ASU No. 2016-02, Leases (Topic 842), which supersedes ASC 840, Leases. The Company will adopt this guidance starting with the first quarter of fiscal year 2020 using a modified retrospective transition approach. This accounting update will require the Company as a lessee to recognize on the consolidated balance sheet all leases with terms exceeding one year, which results in the recognition of a right of use asset and corresponding lease liability, including for those leases that we currently classify as operating leases. The right of use asset and lease liability will initially be measured using the present value of the remaining rental payments.
In February 2018, the FASB issued ASU No. 2018-02, Income Statement - Reporting Comprehensive Income (Topic 220): Reclassification of Certain Tax Effects from Accumulated Other Comprehensive Income. The ASU provides that the stranded tax effects from the Tax Reform on the balance of other comprehensive earnings may be reclassified to retained earnings. The ASU is effective for periods beginning after December 15, 2018, with an election to adopt early. The Company expects to adopt this guidance starting with the first quarter of fiscal year 2020. The Company does not expect the adoption of this ASU to have a material impact on our consolidated financial statements.
Item 3. Quantitative and Qualitative Disclosures about Market Risk
Credit Risk
See Note 4 to the Condensed Consolidated Financial Statements, ‘Financial Instruments with Off-Balance Sheet Risk and Concentrations of Credit Risk’.
Market Risk
We conduct our market-making and trading activities predominantly as a principal, which subjects our capital to significant risks. These risks include, but are not limited to, absolute and relative price movements, price volatility and changes in liquidity, over which we have virtually no control. Our exposure to market risk varies in accordance with the volume of customer-driven market-making transactions, the size of the proprietary positions and the volatility of the financial instruments traded.
We seek to mitigate exposure to market risk by utilizing a variety of qualitative and quantitative techniques:
• | Diversification of business activities and instruments; |
• | Limitations on positions; |
• | Allocation of capital and limits based on estimated weighted risks; and |
• | Daily monitoring of positions and mark-to-market profitability. |
We utilize derivative products in a trading capacity as a dealer to satisfy customer needs and mitigate risk. We manage risks from both derivatives and non-derivative cash instruments on a consolidated basis. The risks of derivatives should not be viewed in isolation, but in aggregate with our other trading activities.
54
Management believes that the volatility of revenues is a key indicator of the effectiveness of our risk management techniques. The graph below summarizes volatility of our daily revenue, determined on a marked-to-market basis, during the nine months ended June 30, 2018.
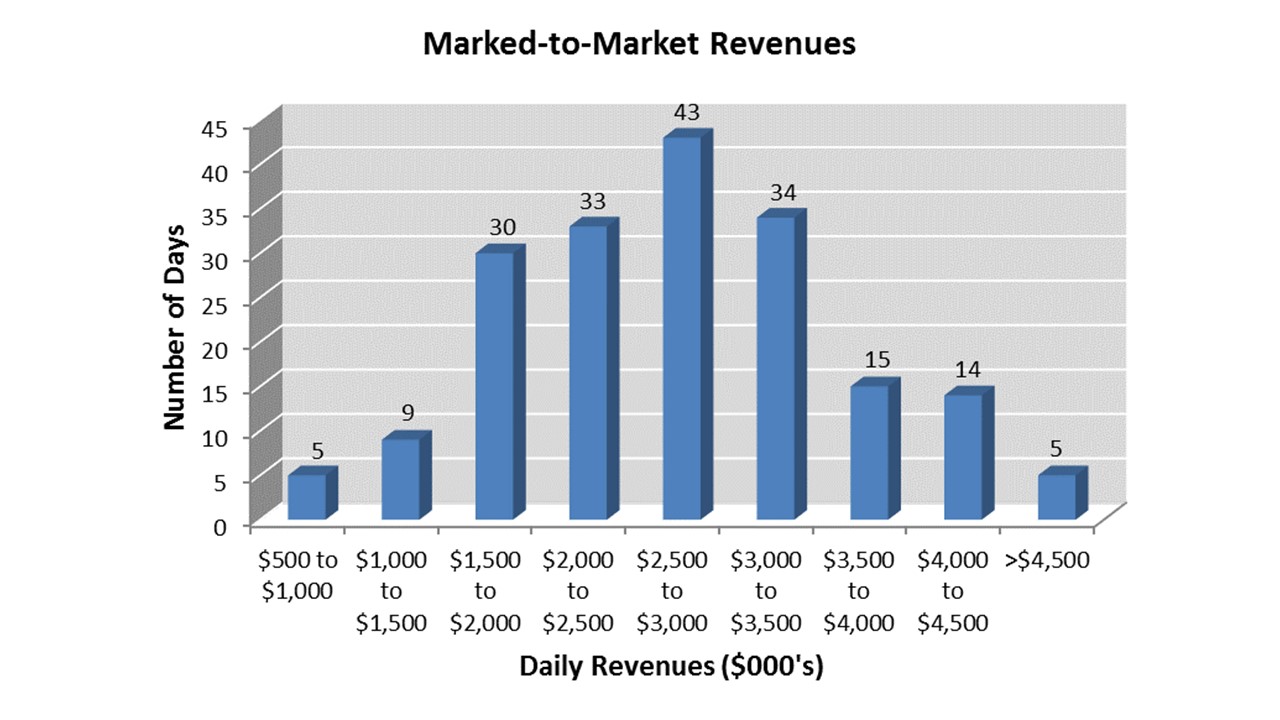
In our Securities market-making and trading activities, we maintain inventories of equity and debt securities. In our Physical Commodities segment, our positions include physical inventories, forwards, futures and options on futures, and OTC derivatives. Our commodity trading activities are managed as one consolidated book for each commodity encompassing both cash positions and derivative instruments. We monitor the aggregate position for each commodity in equivalent physical ounces, metric tons or other relevant unit.
Interest Rate Risk
In the ordinary course of our operations, we have interest rate risk from the possibility that changes in interest rates will affect the values of financial instruments and impact interest income earned. Within our domestic institutional fixed income business, we maintain a significant amount of trading assets and liabilities which are sensitive to changes in interest rates. These trading activities consists primarily of securities trading in connection with U.S. Treasury, U.S. government agency, agency mortgage-backed and agency asset-backed obligations. Derivative instruments, which consist of futures, mortgage-backed “to be announced” (TBA) securities and forward settling transactions, are used to manage risk exposures in the trading inventory. We enter into TBA securities transactions for the sole purpose of managing risk associated with the purchase of mortgage pass-through securities.
In addition, we generate interest income from the positive spread earned on customer deposits. We typically invest in U.S. Treasury bills, notes, and obligations issued by government sponsored entities, reverse repurchase agreements involving U.S. Treasury bills and government obligations or AA-rated money market funds. In some instances, we maintain interest earning cash deposits with banks, clearing organizations and counterparties. We have an investment policy which establishes acceptable standards of credit quality and limits the amount of funds that can be invested within a particular fund, institution, clearing organization and counterparty.
We employ an interest rate management strategy, where we use derivative financial instruments in the form of interest rate swaps and/or outright purchases of medium-term U.S. Treasury notes to manage a portion of our aggregate interest rate position. On a quarterly basis, we evaluate our overall level of short term investable balances, net of our of variable rate debt, and either invest a portion of these investable balances in medium-term U.S. Treasury notes or enter into interest rate swaps, when a sufficient interest rate spread between short-term and medium-term rates exists. Under this strategy, we do not actively trade in such instruments and generally intend to hold these investment to their maturity date. Under this strategy, excluding cash deposits and our investments in AA-rated money market funds, the weighted average time to maturity of our portfolio is not to exceed 24 months in duration.
55
Currently we hold no U.S. Treasury notes or interest rate swap derivative contracts as part of this strategy. For the three and nine months ended June 30, 2018, operating revenues include no unrealized gains or losses on the fair value of U.S. Treasury notes and interest rate swaps while the three and nine months ended June 30, 2017, include unrealized losses of $0.0 million and $5.8 million, respectively, related to the change in fair value of these U.S. Treasury notes and interest rate swaps. The U.S. Treasury notes and interest rate swaps were not designated for hedge accounting treatment, and changes in their fair values, which are volatile and can fluctuate from period to period, were included in operating revenues in the current periods.
Currently our short term investment balances are held in short term U.S. Treasury bills, interest earning cash deposits and AA-rated money market fund investments. The weighted-average time to maturity of the portfolio, excluding cash deposits and our investments in AA-rated money market funds, is less than three months.
We manage interest expense using a combination of variable and fixed rate debt as well as including the average outstanding borrowings in our calculations of the notional value of interest rate swaps to be entered into as part of our interest rate management strategy discussed above. The debt instruments are carried at their unpaid principal balance which approximates fair value. At June 30, 2018, $359.2 million of our debt was variable-rate debt. We are subject to earnings and liquidity risks for changes in the interest rate on this debt. As of June 30, 2018, we had $1.4 million outstanding in fixed-rate long-term debt. There are no earnings or liquidity risks associated with our fixed-rate debt.
Highly Inflationary Economy
At June 30, 2018, we have wholly owned subsidiaries in Argentina which employ approximately 80 people, and primarily conduct debt trading and asset management business activities for customers. The Argentinian economy was recently determined to be highly inflationary. A highly inflationary economy is one where the cumulative inflation rate for the three years preceding the beginning of the reporting period, including interim reporting periods, is in excess of 100 percent. Argentina’s inflation rate reached this threshold with the quarterly period ended June 30, 2018. For the interim periods ended June 30, 2018, the functional currency for certain of our subsidiaries is the Argentinian peso, the local currency of these subsidiaries. In accordance with this designation, we will report the financial results of the subsidiaries in Argentina at the functional currency of its parent, which is the U.S. dollar, effective July 1, 2018.
Item 4. Controls and Procedures
In connection with the filing of this Form 10-Q, our management, including the Chief Executive Officer and Chief Financial Officer, evaluated the effectiveness of the design and operation of our disclosure controls and procedures (as such term is defined in Rules 13a-15(e) and 15d-15(e) under the Securities Exchange Act of 1934, as amended (the “Exchange Act”)) as of June 30, 2018. Our Chief Executive Officer and Chief Financial Officer have concluded that our disclosure controls and procedures were effective as of June 30, 2018.
There are limitations inherent in any internal control, such as the possibility of human error and the circumvention or overriding of controls. A control system, no matter how well conceived and operated, can provide only reasonable, not absolute, assurance that the objectives of the control system are met, and may not prevent or detect misstatements. As conditions change over time, so too may the effectiveness of internal controls. As a result, there can be no assurance that a control system will succeed in preventing all possible instances of error and fraud. Our disclosure controls and procedures are designed to provide reasonable assurance of achieving their objectives, and the conclusions our Chief Executive Officer and Chief Financial Officer are made at the “reasonable assurance” level.
There were no changes in our internal controls over financial reporting during the quarter ended June 30, 2018 that materially affected, or are reasonably likely to materially affect, our internal control over financial reporting.
PART II
Item 1. Legal Proceedings
From time to time and in the ordinary course of business, we are involved in various legal and regulatory actions and proceedings, including tort claims, contractual disputes, employment matters, workers’ compensation claims and collections. We carry insurance that provides protection against certain types of claims, up to the policy limits of our insurance.
The following is a summary of a significant legal matter.
Sentinel Litigation
Prior to the July 1, 2015 merger into INTL FCStone Financial, our subsidiary, FCStone, LLC, had a portion of its excess segregated funds invested with Sentinel Management Group Inc. (“Sentinel”), a registered futures commission merchant (“FCM”) and an Illinois-based money manager that provided cash management services to other FCMs. In August 2007,
56
Sentinel halted redemptions to customers and sold certain of the assets it managed to an unaffiliated third party at a significant discount. On August 17, 2007, subsequent to Sentinel’s sale of certain assets, Sentinel filed for bankruptcy protection. In aggregate, $15.5 million of FCStone, LLC’s $21.9 million in invested funds were returned to it before and after Sentinel’s bankruptcy petition. A further amount of $2.0 million was held by the bankruptcy trustee in reserve in the name of FCStone, LLC.
In August 2008, the bankruptcy trustee of Sentinel filed adversary legal proceedings against FCStone, LLC and a number of other FCMs, seeking recovery of pre- and post-petition transfers totaling $15.5 million.
On April 23, 2018, following ten years of legal proceedings and a final ruling by the United States Court of Appeals for the Seventh Circuit against the trustee and in favor of INTL FCStone Financial, the United States Supreme Court denied the trustee’s petition for writ of certiorari. Following this, on May 1, 2018, INTL FCStone Financial received funds from the reserve account in the amount of $2.0 million. This amount is presented in ‘other gain’ in the condensed consolidated income statement.
Our assessments are based on estimates and assumptions that have been deemed reasonable by management, but that may later prove to be incomplete or inaccurate, and unanticipated events and circumstances may occur that might cause us to change those estimates and assumptions.
Item 1A. Risk Factors
In addition to the other information set forth in this report, information regarding risks affecting us appears in Part I, Item 1A of our Annual Report on Form 10-K for the fiscal year ended September 30, 2017. These are not the only risks we face. Additional risks and uncertainties not currently known to us or that management currently considers to be non-material may in the future adversely affect our business, financial condition and operating results. There have been no material changes to our risk factors since the filing of our Form 10-K.
Item 2. Unregistered Sales of Equity Securities and Use of Proceeds
On August 17, 2017, our Board of Directors authorized for fiscal year 2018, the repurchase of up to 1.0 million shares of our outstanding common stock from time to time in open market purchase and private transactions, commencing on October 1, 2017 and ending on September 30, 2018, subject to the discretion of the senior management team to implement our stock repurchase plan, and subject to market conditions and as permitted by securities laws and other legal, regulatory and contractual requirements and covenants.
Our common stock repurchase program activity for the three months ended June 30, 2018 was as follows.
Period | Total Number of Shares Purchased | Average Price Paid per Share | Total Number of Shares Purchased as Part of Publicly Announced Program | Maximum Number of Shares Remaining to be Purchased Under the Program | ||||||||
April 1, 2018 to April 30, 2018 | — | $ | — | — | 1,000,000 | |||||||
May 1, 2018 to May 31, 2018 | — | — | — | 1,000,000 | ||||||||
June 1, 2018 to June 30, 2018 | — | — | — | 1,000,000 | ||||||||
Total | — | $ | — | — | ||||||||
Item 6. Exhibits
31.1 | ||
31.2 | ||
32.1 | ||
32.2 | ||
57
Signatures
Pursuant to the requirements of the Securities Exchange Act of 1934, the registrant has duly caused this report to be signed on its behalf by the undersigned thereunto duly authorized.
INTL FCStone Inc.
Date: | August 6, 2018 | /s/ Sean M. O’Connor | ||
Sean M. O’Connor | ||||
Chief Executive Officer | ||||
Date: | August 6, 2018 | /s/ William J. Dunaway | ||
William J. Dunaway | ||||
Chief Financial Officer | ||||
58