Attached files
| file | filename |
|---|---|
| 8-K - 8-K - FASTENAL CO | fast331148kearningsrelease.htm |
EXHIBIT 99.1
Fastenal Company Reports 2014 First Quarter Earnings
WINONA, Minn., April 11, 2014 (GLOBE NEWSWIRE) -- Fastenal Company of Winona, MN (Nasdaq:FAST) reported the results of the quarter ended March 31, 2014. Except for per share information, or as otherwise noted below, dollar amounts are stated in thousands.
Net sales (and the related daily sales), pre-tax earnings, net earnings, and net earnings per share were as follows for the periods ended March 31:
Three-month period | |||||||||
2014 | 2013 | Change | |||||||
Net sales | $ | 876,501 | 806,326 | 8.7 | % | ||||
Business days | 63 | 63 | |||||||
Daily sales | $ | 13,913 | 12,799 | 8.7 | % | ||||
Pre-tax earnings | $ | 178,845 | 175,172 | 2.1 | % | ||||
% of sales | 20.4 | % | 21.7 | % | |||||
Net earnings | $ | 111,931 | 109,048 | 2.6 | % | ||||
Net earnings per share (basic) | $ | 0.38 | 0.37 | 2.7 | % | ||||
Set forth below is certain information as of the end of the periods indicated: | |||||||||||||
Mar. 2014 | Dec. 2013 | YTD Change | Mar. 2013 | Year Over Year Change | |||||||||
Number of stores | 2,683 | 2,687 | -0.1% | 2,660 | 0.9 | % | |||||||
FAST Solutions® (industrial vending) machines (device count) | 42,153 | 40,775 | 3.4% | 32,007 | 31.7 | % | |||||||
Employee count | 17,788 | 17,277 | 3.0% | 15,339 | 16.0 | % | |||||||
FIRST QUARTER
In July 2013, we disclosed our intention to increase the investment in people at the store level and in additional leadership personnel at the district and regional levels. We felt this expanded investment was necessary to add 'selling energy' to the organization. With expanded investment, comes expanded expectations - in July 2013 we grew average daily sales over the same month in the preceding year in the low single digits, in March 2014 we grew average daily sales over the same month in the preceding year by11.6%. Double digit growth is an old friend to Fastenal, a friend we hadn’t seen since September 2012.
Our plans for this expanded growth were challenged in the fourth quarter by continued weakness in the manufacturing and construction end markets, particularly in the heavy equipment manufacturing arena (this represents about 20% of our business); our plans were challenged in January and February 2014 by a harsh winter; and in March 2014 we were modestly helped by the timing of Easter. This is just noise to the numbers - bottom line we are proud of the Blue Team at Fastenal. Enough editorial, the rest of this release is ‘typical Fastenal’, a dive into the numbers, hopefully not too deep.
BUSINESS DISCUSSION
Similar to previous quarters, we have included comments regarding several aspects of our business:
1. | Monthly sales changes, sequential trends, and end market performance – a recap of our recent sales trends and some insight into the activities with different end markets. |
2. | Growth drivers of our business – a recap of how we grow our business. |
3. | Profit drivers of our business – a recap of how we increase our profits. |
4. | Statement of earnings information – a recap of the components of our income statement. |
5. | Operational working capital, balance sheet, and cash flow – a recap of the operational working capital utilized in our business, and the related cash flow. |
1
While reading these items, it is helpful to appreciate several aspects of our marketplace: (1) it's big, the North American marketplace for industrial supplies is estimated to be in excess of $160 billion per year (and we have expanded beyond North America), (2) no company has a significant portion of this market, (3) many of the products we sell are individually inexpensive, (4) when our customer needs something quickly or unexpectedly our local store is a quick source, (5) the cost and time to manage and procure these products is meaningful, (6) the cost to move these products, many of which are bulky, can be significant, (7) many customers would prefer to reduce their number of suppliers to simplify their business, and (8) many customers would prefer to utilize various technologies to improve availability and reduce waste.
Our motto is Growth through Customer Service®. This is important given the points noted above. We believe in efficient markets – to us, this means we can grow our market share if we provide the greatest value to the customer. We believe our ability to grow is amplified if we can service our customer at the closest economic point of contact. For us, this 'closest economic point of contact' is the local store; therefore, our focus centers on understanding our customers' day, their opportunities, and their obstacles.
The concept of growth is simple, find more customers every day and increase your activity with them. However, execution is hard work. First, we recruit service minded individuals to support our customers and their business. Second, we operate in a decentralized fashion to help identify the greatest value for our customers. Third, we build a great machine behind the store to operate efficiently and to help identify new business solutions. Fourth, we do these things every day. Finally, we strive to generate strong profits; these profits produce the cash flow necessary to fund the growth and to support the needs of our customers.
SALES GROWTH
Net sales and growth rates in net sales were as follows:
Three-month period | ||||||
2014 | 2013 | |||||
Net sales | $ | 876,501 | 806,326 | |||
Percentage change | 8.7 | % | 4.9 | % | ||
The increase in net sales in the first three months of 2014 and 2013 came primarily from higher unit sales. Our growth in net sales was impacted by slight inflationary price changes in our non-fastener products and some price deflation in our fastener products, but the net impact was a drag on growth. Our growth in net sales was not meaningfully impacted by the introduction of new products or services, with one exception. Over the last several years, our FAST Solutions® (industrial vending) initiative has stimulated faster growth with a subset of our customers (discussed later in this document). The higher unit sales resulted primarily from increases in sales at older store locations (discussed below and again later in this document) and to a lesser degree the opening of new store locations in the last several years. The growth in net sales at the older store locations was due to the growth drivers of our business (discussed later in this document), and, in the case of 2012, the moderating impacts of the recessionary environment. The change in currencies in foreign countries (primarily Canada) relative to the United States dollar lowered our daily sales growth rate by 0.6% and 0.1% in the first three months of 2014 and 2013, respectively.
MONTHLY SALES CHANGES, SEQUENTIAL TRENDS, AND END MARKET PERFORMANCE
Note – Daily sales are defined as the total net sales for the period divided by the number of business days (in the United States) in the period.
This section focuses on three distinct views of our business – monthly sales changes, sequential trends, and end market performance. The first discussion regarding monthly sales changes provides a good mechanical view of our business based on the age of our stores. The second discussion provides a framework for understanding the sequential trends (that is, comparing a month to the immediately preceding month) in our business. Finally, we believe the third discussion regarding end market performance provides insight into activities with our various types of customers.
Monthly Sales Changes:
All company sales – During the months in 2014, 2013, and 2012, all of our selling locations, when combined, had daily sales growth rates of (compared to the same month in the preceding year):
Jan. | Feb. | Mar. | Apr. | May | June | July | Aug. | Sept. | Oct. | Nov. | Dec. | ||||||||||||||||||||||||
2014 | 6.7 | % | 7.7 | % | 11.6 | % | |||||||||||||||||||||||||||||
2013 | 6.7 | % | 8.2 | % | 5.1 | % | 4.8 | % | 5.3 | % | 6.0 | % | 2.9 | % | 7.2 | % | 5.7 | % | 7.7 | % | 8.2 | % | 6.7 | % | |||||||||||
2012 | 21.3 | % | 20.0 | % | 19.3 | % | 17.3 | % | 13.1 | % | 14.0 | % | 12.1 | % | 12.0 | % | 12.9 | % | 6.8 | % | 8.2 | % | 9.7 | % | |||||||||||
2
Stores opened greater than two years – Our stores opened greater than two years (store sites opened as follows: 2014 group – opened 2012 and earlier, 2013 group – opened 2011 and earlier, and 2012 group – opened 2010 and earlier) represent a consistent 'same-store' view of our business. During the months in 2014, 2013, and 2012, the stores opened greater than two years had daily sales growth rates of (compared to the same month in the preceding year):
Jan. | Feb. | Mar. | Apr. | May | June | July | Aug. | Sept. | Oct. | Nov. | Dec. | ||||||||||||||||||||||||
2014 | 5.5 | % | 6.5 | % | 10.2 | % | |||||||||||||||||||||||||||||
2013 | 5.0 | % | 6.5 | % | 3.4 | % | 3.1 | % | 3.5 | % | 4.3 | % | 1.4 | % | 5.5 | % | 4.2 | % | 6.1 | % | 6.2 | % | 4.9 | % | |||||||||||
2012 | 18.8 | % | 17.1 | % | 16.8 | % | 14.5 | % | 10.1 | % | 11.1 | % | 9.1 | % | 8.6 | % | 9.8 | % | 3.8 | % | 5.1 | % | 6.6 | % | |||||||||||
Stores opened greater than five years – The impact of the economy, over time, is best reflected in the growth performance of our stores opened greater than five years (store sites opened as follows: 2014 group – opened 2009 and earlier, 2013 group – opened 2008 and earlier, and 2012 group – opened 2007 and earlier). This group, which represented about 90% of our total sales in the first three months of 2014, is more cyclical due to the increased market share they enjoy in their local markets. During the months in 2014, 2013, and 2012, the stores opened greater than five years had daily sales growth rates of (compared to the same month in the preceding year):
Jan. | Feb. | Mar. | Apr. | May | June | July | Aug. | Sept. | Oct. | Nov. | Dec. | ||||||||||||||||||||||||
2014 | 4.6 | % | 5.4 | % | 9.5 | % | |||||||||||||||||||||||||||||
2013 | 3.2 | % | 5.6 | % | 2.3 | % | 2.0 | % | 2.7 | % | 3.4 | % | 0.6 | % | 4.7 | % | 3.2 | % | 5.3 | % | 6.1 | % | 4.8 | % | |||||||||||
2012 | 17.4 | % | 15.8 | % | 15.7 | % | 13.7 | % | 9.0 | % | 10.2 | % | 8.3 | % | 7.9 | % | 8.5 | % | 2.6 | % | 4.6 | % | 5.6 | % | |||||||||||
Summarizing comments – There are three distinct influences to our growth: (1) execution, (2) currency fluctuations, and (3) economic fluctuations. This discussion centers on (2) and (3).
The change in currencies in foreign countries (primarily Canada) relative to the United States dollar impacted our growth over the last several years. During 2012 it lowered our growth by 0.1%, in 2013 it lowered our growth by 0.2%, and in the first quarter of 2014 it lowered our growth by 0.6%.
Regarding economic fluctuations, in 2011 we enjoyed strong growth. This reflected the strengthening economic environment being experienced by our customers. While the strength did not apply to all customers and to all geographies we serve, it was strong enough to produce acceptable results. During 2012, the growth in the first three and a half months generally continued the relative strength we saw in 2011. Then we began to experience several distinct economic slowdowns. The first occurred in the late April/May time frame, and then moderated until September 2012. The second occurred in the October/November time frame. This was exaggerated by the impact of Hurricane Sandy and an unusual business day comparison in October (23 days in 2012 versus 21 days in 2011 - the maintenance portion of our business is often linked to monthly spend patterns of our customers, which are not as business day dependent, this can dilute the daily growth picture given the change in business day divisor). The third occurred in the spring of 2013. This involved our fastener product line and our construction business (primarily non-residential construction). This third slowdown, similar to the first two listed, mirrored or slightly led some softening in the PMI index (discussed later in this document). The fastener piece was heavily impacted by our industrial production business. These customers utilize our fasteners in the manufacture/assembly of their finished products. The end markets with the most pronounced weakening included heavy machinery manufacturers with exposure to: mining, military, agriculture, and construction. The construction piece in 2013 was also hampered by poor weather during the winter and spring time frame throughout many areas in North America. The fourth and fifth occurred in July 2013 and December 2013. The daily sales growth in July 2013 and December 2013 were negatively impacted by the timing of the July 4th holiday (Thursday in 2013, Wednesday in 2012, Monday in 2011) and the Christmas/New Year holiday (Wednesday in 2013, Tuesday in 2012, and Sunday in 2011). This resulted in a 'lone' business day on Friday, July 5, 2013, in which many of our customers were closed, and three distinct one to two day work periods in the last two weeks of December 2013. The December impact was amplified due to poor weather conditions.
Our daily sales growth trends have improved since September 2013. This was largely related to changing comparisons to 2012. Our sales to customers engaged in light and medium duty manufacturing (largely related to consumer products) are improving; this makes sense given the trends in the PMI index. However, our sales to customers engaged in heavy machinery manufacturing (primarily serving the mining, military, agricultural, and construction end markets), which represents approximately one fifth of our business, continued to experience weak performance in the fourth quarter of 2013 and the first quarter of 2014.
In 2014, our sales growth was hampered in January and February due to a weak economy and foreign exchange rate fluctuations (primarily related to the Canadian dollar); however, the biggest impact was a severe winter in North America and its negative impact on our customers and our trucking network. In March 2014, the weak economy and negative foreign
3
exchange rate fluctuations continued; however, the weather normalized and our daily sales growth expanded to 11.6%. This double digit growth was helped by the Easter timing (April in 2014), but the real story is good people, good execution, and minimal negative weather impacts.
Sequential Trends:
We find it helpful to think about the monthly sequential changes in our business using the analogy of climbing a stairway – This stairway has several predictable landings where there is a pause in the sequential gain (i.e. April, July, and October to December), but generally speaking, climbs from January to October. The October landing then establishes the benchmark for the start of the next year.
History has identified these landings in our business cycle. They generally relate to months with impaired business days (certain holidays). The first landing centers on Easter, which alternates between March and April (Easter occurs in April in 2014, occurred in March in 2013, and occurred in April in 2012), the second landing centers on July 4th, and the third landing centers on the approach of winter with its seasonal impact on primarily our construction business and with the Christmas/New Year holiday. The holidays we noted impact the trends because they either move from month-to-month or because they move around during the week (the July 4th and Christmas/New Year holiday impacts noted earlier in this document are examples).
The table below shows the pattern to the sequential change in our daily sales. The line labeled 'Benchmark' is an historical average of our sequential daily sales change for the period 1998 to 2013, excluding 2008 and 2009. We believe this time frame will serve to show the historical pattern and could serve as a benchmark for current performance. We excluded the 2008 to 2009 time frame because it contains an extreme economic event and we don't believe it is comparable. The '2014', '2013', and '2012' lines represent our actual sequential daily sales changes. The '14Delta', '13Delta', and '12Delta' lines indicate the difference between the 'Benchmark' and the actual results in the respective year.
Cumulative | |||||||||||||||||||||||||||||||||||
Change from | |||||||||||||||||||||||||||||||||||
Jan. to | |||||||||||||||||||||||||||||||||||
Jan. 1 | Feb. | Mar. | Apr. | May | June | July | Aug. | Sept. | Oct. | Mar. | Oct. | ||||||||||||||||||||||||
Benchmark | 0.8 | % | 2.2 | % | 3.8 | % | 0.4 | % | 3.1 | % | 2.7 | % | -2.1 | % | 2.5 | % | 3.7 | % | -1.2 | % | 6.0 | % | 15.9 | % | |||||||||||
2014 | -1.4 | % | 3.0 | % | 7.1 | % | 10.3 | % | |||||||||||||||||||||||||||
14Delta | -2.2 | % | 0.8 | % | 3.3 | % | 4.3 | % | |||||||||||||||||||||||||||
2013 | -0.4 | % | 2.0 | % | 3.4 | % | -1.1 | % | 1.0 | % | 3.2 | % | -5.5 | % | 5.5 | % | 2.9 | % | -2.9 | % | 5.4 | % | 8.2 | % | |||||||||||
13Delta | -1.2 | % | -0.2 | % | -0.4 | % | -1.5 | % | -2.1 | % | 0.5 | % | -3.4 | % | 3.0 | % | -0.8 | % | -1.7 | % | -0.6 | % | -7.7 | % | |||||||||||
2012 | -0.3 | % | 0.5 | % | 6.4 | % | -0.8 | % | 0.5 | % | 2.5 | % | -2.7 | % | 1.3 | % | 4.3 | % | -4.8 | % | 7.0 | % | 7.1 | % | |||||||||||
12Delta | -1.1 | % | -1.7 | % | 2.6 | % | -1.2 | % | -2.6 | % | -0.2 | % | -0.6 | % | -1.2 | % | 0.6 | % | -3.6 | % | 1.0 | % | -8.8 | % | |||||||||||
(1) | The January figures represent the percentage change from the previous October, whereas the remaining figures represent the percentage change from the previous month. |
A graph of the sequential daily sales change pattern discussed above, starting with a base of '100' in the previous October and ending with the next October, would be as follows: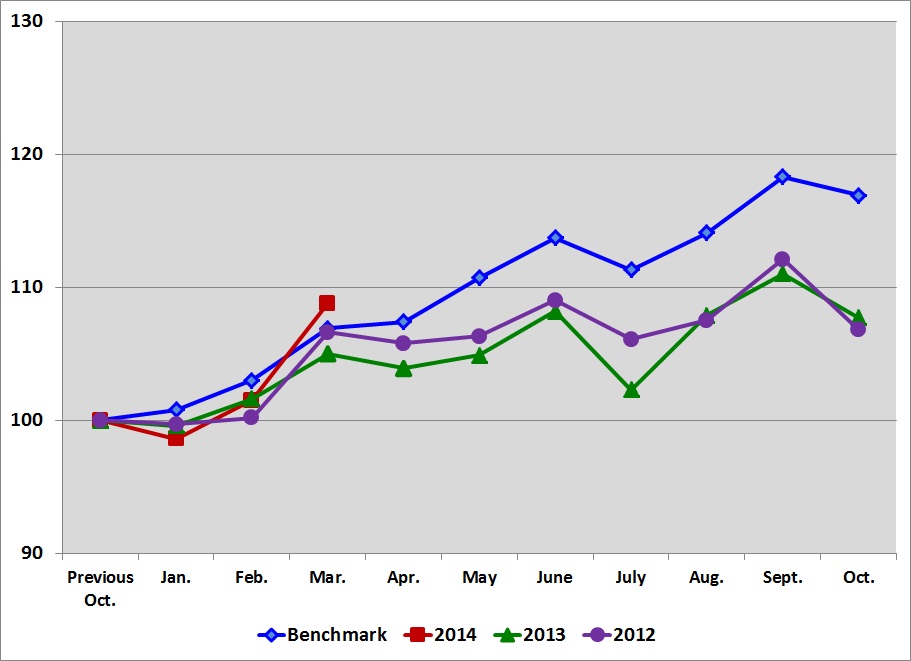
4
End Market Performance:
We ended the first quarter of 2014 with a strong March. To highlight this strength, we included the March 2014 daily sales growth rate in the tables below.
Fluctuations in end market business – The sequential trends noted above were directly linked to fluctuations in our end markets. To place this in perspective – approximately 50% of our business has historically been with customers engaged in some type of manufacturing. The daily sales to these customers grew, when compared to the same period in the prior year, as follows:
Q1 | Q2 | Q3 | Q4 | Annual | ||||||||||||
2014 | (March = 11.4%) | 9.0 | % | |||||||||||||
2013 | 7.0 | % | 5.9 | % | 4.7 | % | 7.2 | % | 6.3 | % | ||||||
2012 | 20.3 | % | 15.8 | % | 14.0 | % | 9.7 | % | 14.9 | % | ||||||
Our manufacturing business consists of two subsets: the industrial production business (this is business where we supply products that become part of the finished goods produced by our customers and is sometimes referred to as OEM - original equipment manufacturing) and the maintenance portion (this is business where we supply products that maintain the facility or the equipment of our customers engaged in manufacturing). The industrial business is more fastener centered, while the maintenance portion is represented by all product categories.
The best way to understand the change in our industrial production business is to examine the results in our fastener product line. From a company perspective, sales of fasteners grew, when compared to the same period in the prior year, as follows (note: this information includes all end markets):
Q1 | Q2 | Q3 | Q4 | Annual | ||||||||||||
2014 | (March = 5.3%) | 1.6 | % | |||||||||||||
2013 | 1.7 | % | 1.9 | % | 1.0 | % | 1.9 | % | 1.6 | % | ||||||
2012 | 15.4 | % | 8.0 | % | 6.0 | % | 2.6 | % | 7.8 | % | ||||||
By contrast, the best way to understand the change in the maintenance portion of the manufacturing business is to examine the results in our non-fastener product lines. From a company perspective, sales of non-fasteners grew, when compared to the same period in the prior year, as follows (note: this information includes all end markets):
Q1 | Q2 | Q3 | Q4 | Annual | ||||||||||||
2014 | (March = 16.5%) | 14.2 | % | |||||||||||||
2013 | 10.8 | % | 8.5 | % | 8.9 | % | 12.0 | % | 10.1 | % | ||||||
2012 | 25.1 | % | 21.1 | % | 18.0 | % | 13.6 | % | 19.2 | % | ||||||
The non-fastener business demonstrated greater relative resilience when compared to our fastener business and to the distribution industry in general, due to our strong FAST Solutions® (industrial vending) program; this is discussed in greater detail later in this document. However, this business has not been immune to the impact of a weak industrial environment.
The patterns related to the industrial production business, as noted above, are influenced by the movements noted in the Purchasing Manufacturers Index ('PMI') published by the Institute for Supply Management (http://www.ism.ws/), which is a composite index of economic activity in the United States manufacturing sector. The PMI in 2014, 2013, and 2012 was as follows:
Jan. | Feb. | Mar. | Apr. | May | June | July | Aug. | Sept. | Oct. | Nov. | Dec. | ||||||||||||||||||||||||
2014 | 51.3 | 53.2 | 53.7 | ||||||||||||||||||||||||||||||||
2013 | 52.3 | 53.1 | 51.5 | 50.0 | 50.0 | 52.5 | 54.9 | 56.3 | 56.0 | 56.6 | 57.0 | 56.5 | |||||||||||||||||||||||
2012 | 52.8 | 52.4 | 53.0 | 53.7 | 53.2 | 51.0 | 50.6 | 51.1 | 52.2 | 51.2 | 49.5 | 50.4 | |||||||||||||||||||||||
For background to readers not familiar with the PMI index, it is a monthly indicator of the economic health of the manufacturing sector in the United States. Five major indicators that influence the PMI index are new orders, inventory levels, productions, supplier deliveries, and the employment environment. When a PMI of 50 or higher is reported, this indicates expansion in the manufacturing industry compared to the previous month. If the PMI is below 50, this represents a contraction in the manufacturing sector. The PMI is not perfectly correlated with our business, as it reflects the activity of certain
5
categories of manufacturers (such as those engaged in light and medium manufacturing) who historically have not accounted for a significant portion of our sales. (Note – the Institute for Supply Management made annual adjustments to reflect seasonal factors for the PMI index effective for the January 2014 report. This table represents the updated PMI index.)
Our non-residential construction customers have historically represented 20% to 25% of our business. The daily sales to these customers grew when compared to the same period in the prior year, as follows:
Q1 | Q2 | Q3 | Q4 | Annual | ||||||||||||
2014 | (March = 7.6%) | 2.9 | % | |||||||||||||
2013 | 2.9 | % | 0.7 | % | 3.9 | % | 2.8 | % | 2.5 | % | ||||||
2012 | 17.1 | % | 12.7 | % | 8.2 | % | 4.2 | % | 10.3 | % | ||||||
We believe the weakness in the economy in the fourth quarter of 2012, throughout 2013, and during early 2014, particularly in the non-residential construction market, was amplified by the global economic uncertainty combined with the economic policy uncertainty in the United States. This weakness was amplified by severe winter weather conditions in January and February 2014.
A graph of the sequential daily sales trends to these two end markets in 2014, 2013, and 2012, starting with a base of '100' in the previous October and ending with the next October, would be as follows:
Manufacturing
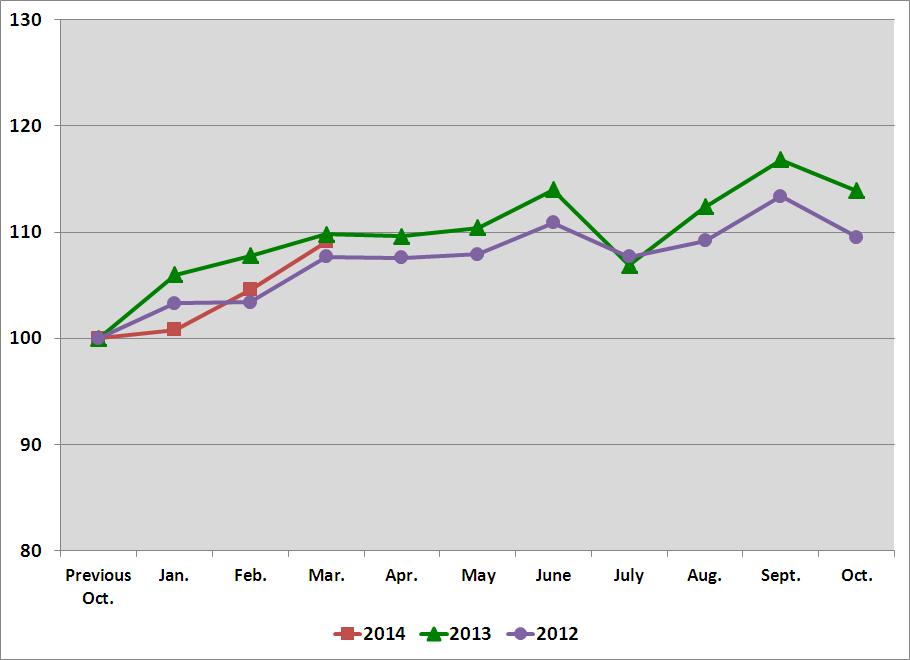
Non-Residential Construction
6

GROWTH DRIVERS OF OUR BUSINESS
We grow by continuously adding customers and by increasing the activity with each customer. We believe this growth is enhanced by our close proximity to our customers, which allows us to provide a range of services and product availability that our competitors can't easily match. Historically, we expanded our reach by opening stores at a very fast pace. These openings were initially in the United States, but expanded beyond the United States beginning in the mid 1990's.
For a little perspective, we began our business in 1967 with an idea to sell nuts and bolts (fasteners) through vending machines. We soon learned the technology of the 1960's wasn't ready, and also learned a lot of products didn't fit, so we went to 'Plan B'; sell to business users with a direct sales force. It took us a number of years to 'work out the bugs', but ten years later we began to pick up the pace of store openings. After another ten years of expansion we had approximately 50 stores and sales of about $20 million. Our need for cash was growing, as was our desire to allow employee ownership. This led us to a public offering in 1987.
In our first ten years of being public (1987 to 1997), we opened stores at an annual rate approaching 30%. In the next ten years (1997 to 2007), we opened stores at an annual rate of approximately 10% to 15% and, since 2007, at an annual rate of approximately 2% to 8% (we opened 9 stores in the first three months of 2014, or approximately 0.3%, and currently expect to open approximately 50 to 70 stores, or an annual rate of approximately 1.9% to 2.6%, in 2014).
As we gained proximity to more customers, we continued to diversify our growth drivers. This was done to provide existing store personnel with more tools to grow their business organically, and the results of this are reflected in our earlier discussion on sales growth at stores opened greater than five years. In the early 1990's, we began to expand our product lines, and we added new product knowledge to our bench (the non-fastener products now represent over 50% of our sales). This was our first big effort to diversify our growth drivers. The next step began in the mid to late 1990's when we began to add sales personnel with certain specialties or focus. This began with our National Accounts group in 1995, and, over time, has expanded to include individuals dedicated to: (1) sales related to our internal manufacturing division, (2) government sales, (3) internet sales, (4) specific products (most recently metalworking), and (5) FAST Solutions® (industrial vending). Another step occurred at our sales locations (this includes Fastenal stores as well as strategic account stores and in-plant locations) and at our distribution centers, and began with a targeted merchandising and inventory placement strategy that included our 'Customer Service Project' approximately ten years ago and our 'Master Stocking Hub' initiative approximately five years ago. These strategies allowed us to better target where to stock certain products (local store, regional distribution center, master stocking hub, or supplier) and allowed us to improve our fulfillment, lower our freight costs, and improve our ability to serve a broader range of customers. During 2013 and 2014, we expanded our store based inventory offering around select industries (with an emphasis on fasteners, construction products, and safety products) and beginning in the latter half of 2013 we expanded two key employee groups: (1) the number of employees working in our stores and (2) the number of district and regional leaders supporting our stores. The theme that shines through in all these changes, particularly the last several, is a simple one – invest into and support our sales machine – the local store.
Over the last several years our FAST Solutions® (industrial vending) operation has been a rapidly expanding component of our business. We believe industrial vending will be an important chapter in the Fastenal story; we also believe it has the potential to
7
be transformative to industrial distribution, and that we have a 'first mover' advantage. Given this, we have been investing aggressively to maximize the advantage.
At the beginning, our industrial vending business had a limited fleet of vending devices. This fleet primarily consisted of the following: (1) the FAST5000 (a helix/coil device with target monthly revenue of $2,000), (2) a 12-door locker device, and (3) a 3-door locker device. Given the infancy of the business, and our desire for simplicity in reporting, we have communicated our ‘machine equivalent’ numbers over the last several years using the FAST5000, with its $2,000 monthly revenue target, as the benchmark for ‘one machine’. However, given our expectation for lower potential revenue in the 12-door and 3-door lockers, we have historically counted them as a ‘half machine’.
Under this method of disclosure, the reported number of vending machines in contracts signed during the period and the number of machines installed at quarter end were as follows:
Q1 | Q2 | Q3 | Q4 | Annual | ||||||||||||
'Machine equivalent' count signed during the period | 2014 | 3,602 | ||||||||||||||
(locker equals half a machine) | 2013 | 5,728 | 5,357 | 4,372 | 3,848 | 19,305 | ||||||||||
2012 | 4,568 | 4,669 | 5,334 | 5,591 | 20,162 | |||||||||||
2011 | 1,405 | 2,107 | 2,246 | 2,084 | 7,842 | |||||||||||
Q1 | Q2 | Q3 | Q4 | ||||||||||||
'Machine equivalent' installed at the end of the period | 2014 | 35,310 | |||||||||||||
(locker equals half a machine) | 2013 | 25,447 | 29,549 | 32,248 | 33,920 | ||||||||||
2012 | 9,798 | 13,036 | 17,013 | 21,095 | |||||||||||
2011 | 2,659 | 3,867 | 5,642 | 7,453 | |||||||||||
Today, our expanded fleet consists of thirteen different vending devices. We have learned much about these devices over the last several years and currently have target monthly revenue ranging from under $1,000 to in excess of $3,000 per device. During the final two quarters of 2013 we indicated our intention to refine the reporting of machine equivalencies in 2014 to better reflect the equivalencies based on the ‘target revenue potential’ of each device. The following two tables, new this quarter, are an attempt to provide this disclosure. They include two views of our data: (1) actual device count regardless of the type of machine and (2) ‘equivalent machine count’ based on the weighted target monthly revenue of each device (compared to the FAST 5000 device). For example, the 12-door locker, with target monthly revenue of $750, would be counted as ‘0.375 machine equivalent’ (0.375 = $750/$2,000).
Using this method, the industrial vending information related to contracts signed during each period was as follows:
Q1 | Q2 | Q3 | Q4 | Annual | ||||||||||||
Device count signed during the period | 2014 | 4,025 | ||||||||||||||
2013 | 6,568 | 6,084 | 4,836 | 4,226 | 21,714 | |||||||||||
2012 | 6,646 | 6,818 | 7,871 | 6,715 | 28,050 | |||||||||||
2011 | 1,812 | 2,710 | 2,930 | 2,753 | 10,205 | |||||||||||
'Machine equivalent' count signed during the period | 2014 | 2,974 | ||||||||||||||
2013 | 4,825 | 4,505 | 3,656 | 3,244 | 16,230 | |||||||||||
2012 | 3,827 | 3,926 | 4,581 | 4,739 | 17,073 | |||||||||||
2011 | 1,264 | 1,915 | 2,035 | 1,880 | 7,094 | |||||||||||
Using this method, the industrial vending information related to installed machines at the end of each period was as follows:
8
Q1 | Q2 | Q3 | Q4 | ||||||||||||
Device count installed at the end of the period | 2014 | 42,153 | |||||||||||||
2013 | 32,007 | 36,452 | 39,180 | 40,775 | |||||||||||
2012 | 12,600 | 16,964 | 21,998 | 26,975 | |||||||||||
2011 | 3,227 | 4,793 | 7,062 | 9,462 | |||||||||||
'Machine equivalent' count installed at the end of the | 2014 | 30,326 | |||||||||||||
period | 2013 | 22,020 | 25,512 | 27,818 | 29,262 | ||||||||||
2012 | 8,842 | 11,604 | 14,880 | 18,395 | |||||||||||
2011 | 2,462 | 3,548 | 5,154 | 6,771 | |||||||||||
The following table includes some additional statistics regarding our sales and sales growth:
Q1 | Q2 | Q3 | Q4 | ||||||||||||
Percent of total net sales to customers with | 2014 | 37.8 | % | ||||||||||||
industrial vending1 | 2013 | 27.5 | % | 30.0 | % | 33.3 | % | 36.6 | % | ||||||
2012 | 17.8 | % | 20.8 | % | 23.2 | % | 25.8 | % | |||||||
2011 | 8.9 | % | 10.5 | % | 13.1 | % | 15.7 | % | |||||||
Q1 | Q2 | Q3 | Q4 | ||||||||||||
Daily sales growth to customers with | 2014 | 19.7 | % | ||||||||||||
industrial vending2 | 2013 | 23.9 | % | 18.9 | % | 15.2 | % | 18.7 | % | ||||||
2012 | 33.9 | % | 34.3 | % | 32.9 | % | 28.6 | % | |||||||
2011 | 50.6 | % | 43.9 | % | 42.5 | % | 40.7 | % | |||||||
1 The percentage of total sales (vended and traditional) to customers currently using a vending solution.
2 The growth in total sales (vended and traditional) to customers currently using a vending solution compared to the same period in the preceding year.
In addition to the industrial vending operation noted above, which primarily relates to our non-fastener business, we also provide bin stock programs (also known as ‘keep fill’ programs in the industry) to numerous customers. This business, which relates to both our maintenance customers (MRO fasteners and non-fasteners) and original equipment manufacturers (OEM fasteners), has many similar attributes to our industrial vending relationships. These attributes include a strong relationship, where we are often their preferred supplier, and also includes a frequent level of business transactions. This business is performed without the aid of a vending machine, but does make use of the latest scanning technologies, scales systems, and our fully integrated distribution network to manage the supply chain for all sizes of customers. In recent years, we have begun to refer to this business using terms such as FMI (Fastenal Managed Inventory).
9
PROFIT DRIVERS OF OUR BUSINESS
As we state several times in this document, profit is important to us. For a distribution business it is linked to cash flow, and cash flow funds our growth and creates value for our customers, our employees, our suppliers, and our shareholders. We grow our profits by continuously working to grow sales and to improve our relative profitability. We also grow our profits by allowing our inherent profitability to shine through – we refer to this as the 'pathway to profit'. The distinction is important.
We achieve improvements in our relative profitability by increasing our gross margin, by structurally lowering our operating expenses, or both. We advance on the 'pathway to profit' by increasing the average store size (measured in terms of monthly sales), and by allowing the changing store mix to improve our profits. This is best explained by comparing the varying profitability of our 'traditional' stores in the table below. The average store size for the group, and the average age, number of stores, and pre-tax earnings data by store size for the first quarter of 2014, 2013, and 2012, respectively, were as follows:
Sales per Month | Average Age (Years) | Number of Stores | Percentage of Stores | Pre-Tax Earnings Percentage | |||||||
Three months ended March 31, 2014 | Average store sales = $94,627 | ||||||||||
$0 to $30,000 | 6.1 | 176 | 6.6 | % | -13.2 | % | |||||
$30,001 to $60,000 | 8.6 | 726 | 27.1 | % | 10.8 | % | |||||
$60,001 to $100,000 | 11.5 | 825 | 30.7 | % | 19.4 | % | |||||
$100,001 to $150,000 | 13.8 | 473 | 17.6 | % | 23.9 | % | |||||
Over $150,000 | 16.3 | 347 | 12.9 | % | 26.3 | % | |||||
Strategic Account/Overseas Store | 136 | 5.1 | % | ||||||||
Company Total | 2,683 | 100.0 | % | 20.4 | % | ||||||
Three months ended March 31, 2013 | Average store sales = $88,267 | ||||||||||
$0 to $30,000 | 5.4 | 261 | 9.8 | % | -11.6 | % | |||||
$30,001 to $60,000 | 8.2 | 771 | 29.0 | % | 13.9 | % | |||||
$60,001 to $100,000 | 10.9 | 765 | 28.8 | % | 22.5 | % | |||||
$100,001 to $150,000 | 12.8 | 437 | 16.4 | % | 25.5 | % | |||||
Over $150,000 | 16.0 | 305 | 11.5 | % | 29.0 | % | |||||
Strategic Account/Overseas Store | 121 | 4.5 | % | ||||||||
Company Total | 2,660 | 100.0 | % | 21.7 | % | ||||||
Three months ended March 31, 2012 | Average store sales = $86,449 | ||||||||||
$0 to $30,000 | 4.4 | 289 | 11.1 | % | -17.4 | % | |||||
$30,001 to $60,000 | 7.6 | 795 | 30.4 | % | 11.9 | % | |||||
$60,001 to $100,000 | 9.9 | 719 | 27.5 | % | 21.5 | % | |||||
$100,001 to $150,000 | 12.5 | 419 | 16.0 | % | 24.9 | % | |||||
Over $150,000 | 15.6 | 287 | 11.0 | % | 28.4 | % | |||||
Strategic Account/Overseas Store | 102 | 3.9 | % | ||||||||
Company Total | 2,611 | 100.0 | % | 21.0 | % | ||||||
Note – Amounts may not foot due to rounding difference.
When we originally announced the 'pathway to profit' strategy in 2007, our goal was to increase our pre-tax earnings, as a percentage of sales, from 18% to 23%. This goal was to be accomplished by slowly moving the mix from the first three categories ($0 to $30,000, $30,001 to $60,000, and $60,001 to $100,000, these groups represented 76.5% of our store base in the first three months of 2007, the last quarter before we announced the 'pathway to profit') to the last three categories ($60,001 to $100,000, $100,001 to $150,000, and over $150,000, these groups represented 61.3% of our store base in the first quarter of 2014) and by increasing the average store sales from $71,600 (in the first three months of 2007) to approximately $125,000 per month. The weak economic environment in 2009 caused our average store size to decrease, and consequently lowered our level of profitability; however, we never lost sight of the simple 'economic math' of our business, and our ability to grow the level of profitability long-term. In the aftermath of 2009, we grew the average store size, we improved our gross margin, and we structurally lowered our operating expenses. The improvement in the latter two allowed us to amplify the 'pathway to profit' and effectively lowered the average store size required to hit our 23% goal. Today we believe we can accomplish our 'pathway to profit' goal with average store sales of approximately $100,000 to $110,000 per month.
Note – Dollar amounts in this section are presented in whole dollars, not thousands.
10
Store Count and Full-Time Equivalent (FTE) Headcount – The table below highlights certain impacts on our business of the 'pathway to profit' since its introduction in 2007. Under the 'pathway to profit' we increased both our store count and our store FTE headcount during 2007 and 2008. However, the rate of increase in store locations slowed and our FTE headcount for all types of personnel was reduced when the economy weakened late in 2008. In the table that follows, we refer to our 'store' net sales, locations, and personnel. When we discuss 'store' net sales, locations, and personnel, we are referring to (1) 'Fastenal' stores and (2) strategic account stores. 'Fastenal' stores are either a 'traditional' store, the typical format in the United States or Canada, or an 'overseas' store, which is the typical format outside the United States and Canada. This is discussed in greater detail in our 2013 annual report on Form 10-K. Strategic account stores are stores that are focused on selling to a group of large customers in a limited geographic market. The sales outside of our 'store' group, relate to either (1) our in-plant locations, (2) the portion of our internally manufactured product that is sold directly to a customer and not through a store (including our Holo-Krome® business acquired in December 2009), or (3) our direct import business.
The breakdown of our sales, the average monthly sales per store, the number of stores at quarter end, the average headcount at our stores during a quarter, the average FTE headcount during a quarter, and the percentage change were as follows for the first quarter of 2007 (the last completed quarter before we began the 'pathway to profit') and for each of the last five quarters:
Q1 2007 | Q1 2013 | Q2 2013 | Q3 2013 | Q4 2013 | Q1 2014 | ||||||||||||
Total net sales reported | $489,157 | $806,326 | $847,596 | $858,424 | $813,760 | $876,501 | |||||||||||
Less: Non-store sales (approximate) | 40,891 | 101,624 | 109,300 | 108,427 | 105,499 | 113,945 | |||||||||||
Store net sales (approximate) | $448,266 | $704,702 | $738,296 | $749,997 | $708,261 | $762,556 | |||||||||||
% change since Q1 2007 | 57.2 | % | 64.7 | % | 67.3 | % | 58.0 | % | 70.1 | % | |||||||
% change (twelve months) | 4.2 | % | 4.6 | % | 6.8 | % | 7.1 | % | 8.2 | % | |||||||
Percentage of sales through a store | 92 | % | 87 | % | 87 | % | 87 | % | 87 | % | 87 | % | |||||
Average monthly sales per store | $72 | $88 | $92 | $93 | $88 | $95 | |||||||||||
(using ending store count) | |||||||||||||||||
% change since Q1 2007 | 22.2 | % | 27.8 | % | 29.2 | % | 22.2 | % | 31.9 | % | |||||||
% change (twelve months) | 2.3 | % | 3.4 | % | 5.7 | % | 6.0 | % | 8.0 | % | |||||||
Company pre-tax earnings | 18.1 | % | 21.7 | % | 22.7 | % | 22.0 | % | 19.3 | % | 20.4 | % | |||||
11
Q1 2007 | Q1 2013 | Q2 2013 | Q3 2013 | Q4 2013 | Q1 2014 | ||||||||||||
Store locations - quarter end count | 2,073 | 2,660 | 2,677 | 2,686 | 2,687 | 2,683 | |||||||||||
% change since Q1 2007 | 28.3 | % | 29.1 | % | 29.6 | % | 29.6 | % | 29.4 | % | |||||||
% change (twelve months) | 1.9 | % | 1.6 | % | 1.4 | % | 1.3 | % | 0.9 | % | |||||||
Store personnel - absolute headcount | 6,849 | 10,108 | 10,160 | 10,607 | 11,261 | 11,775 | |||||||||||
% change since Q1 2007 | 47.6 | % | 48.3 | % | 54.9 | % | 64.4 | % | 71.9 | % | |||||||
% change (twelve months) | -3.6 | % | -4.5 | % | 0.0 | % | 8.8 | % | 16.5 | % | |||||||
Store personnel - FTE | 6,383 | 8,875 | 8,943 | 9,350 | 9,771 | 10,206 | |||||||||||
Non-store selling personnel - FTE | 616 | 1,121 | 1,174 | 1,190 | 1,214 | 1,236 | |||||||||||
Subtotal of all sales personnel - FTE | 6,999 | 9,996 | 10,117 | 10,540 | 10,985 | 11,442 | |||||||||||
Distribution personnel - FTE | 1,646 | 1,819 | 1,867 | 1,986 | 2,040 | 2,076 | |||||||||||
Manufacturing personnel - FTE1 | 316 | 565 | 572 | 570 | 581 | 617 | |||||||||||
Administrative personnel - FTE | 767 | 832 | 857 | 867 | 876 | 905 | |||||||||||
Subtotal of non-sales personnel - FTE | 2,729 | 3,216 | 3,296 | 3,423 | 3,497 | 3,598 | |||||||||||
Total - average FTE headcount | 9,728 | 13,212 | 13,413 | 13,963 | 14,482 | 15,040 | |||||||||||
% change since Q1 2007 | |||||||||||||||||
Store personnel - FTE | 39.0 | % | 40.1 | % | 46.5 | % | 53.1 | % | 59.9 | % | |||||||
Non-store selling personnel - FTE | 82.0 | % | 90.6 | % | 93.2 | % | 97.1 | % | 100.6 | % | |||||||
Subtotal of all sales personnel - FTE | 42.8 | % | 44.5 | % | 50.6 | % | 57.0 | % | 63.5 | % | |||||||
Distribution personnel - FTE | 10.5 | % | 13.4 | % | 20.7 | % | 23.9 | % | 26.1 | % | |||||||
Manufacturing personnel - FTE1 | 78.8 | % | 81.0 | % | 80.4 | % | 83.9 | % | 95.3 | % | |||||||
Administrative personnel - FTE | 8.5 | % | 11.7 | % | 13.0 | % | 14.2 | % | 18.0 | % | |||||||
Subtotal of non-sales personnel - FTE | 17.8 | % | 20.8 | % | 25.4 | % | 28.1 | % | 31.8 | % | |||||||
Total - average FTE headcount | 35.8 | % | 37.9 | % | 43.5 | % | 48.9 | % | 54.6 | % | |||||||
% change (twelve months) | |||||||||||||||||
Store personnel - FTE | -0.3 | % | -0.2 | % | 1.1 | % | 8.1 | % | 15.0 | % | |||||||
Non-store selling personnel - FTE | 12.3 | % | 11.4 | % | 11.6 | % | 13.5 | % | 10.3 | % | |||||||
Subtotal of all sales personnel - FTE | 1.0 | % | -0.6 | % | 2.2 | % | 8.7 | % | 14.5 | % | |||||||
Distribution personnel - FTE | 0.2 | % | -0.7 | % | 5.2 | % | 9.0 | % | 14.1 | % | |||||||
Manufacturing personnel - FTE1 | 7.2 | % | 5.0 | % | 4.8 | % | 6.8 | % | 9.2 | % | |||||||
Administrative personnel - FTE | 4.5 | % | 7.9 | % | 7.3 | % | 8.0 | % | 8.8 | % | |||||||
Subtotal of non-sales personnel - FTE | 2.5 | % | 2.4 | % | 5.7 | % | 8.4 | % | 11.9 | % | |||||||
Total - average FTE headcount | 1.4 | % | 0.1 | % | 3.1 | % | 8.6 | % | 13.8 | % | |||||||
1 | The manufacturing headcount was impacted by the addition of 92 employees with the acquisition of Holo-Krome® in December 2009. |
12
STATEMENT OF EARNINGS INFORMATION (percentage of net sales) for the periods ended March 31: | |||||
Three-month period | |||||
2014 | 2013 | ||||
Net sales | 100.0 | % | 100.0 | % | |
Gross profit | 51.2 | % | 52.3 | % | |
Operating and administrative expenses | 30.8 | % | 30.7 | % | |
Gain on sale of property and equipment | 0.0 | % | 0.0 | % | |
Operating income | 20.4 | % | 21.7 | % | |
Net interest income (expense) | 0.0 | % | 0.0 | % | |
Earnings before income taxes | 20.4 | % | 21.7 | % | |
Note – Amounts may not foot due to rounding difference. | |||||
Gross profit – percentage for the first quarter of 2014 decreased from the same period in 2013, but increased from the fourth quarter of 2013.
The gross profit percentage in the first, second, third, and fourth quarters was as follows:
Q1 | Q2 | Q3 | Q4 | ||||||||
2014 | 51.2 | % | |||||||||
2013 | 52.3 | % | 52.2 | % | 51.7 | % | 50.6 | % | |||
2012 | 51.3 | % | 51.6 | % | 51.6 | % | 51.6 | % | |||
The fluctuations in our gross profit percentages are typically driven by changes in: (1) transactional gross profit, (2) organizational gross profit, and (3) supplier incentive gross profit. The transactional gross profit represents the gross profit realized from the day-to-day fluctuations in customer pricing relative to product and freight costs. The organizational gross profit represents the component of gross profit we attribute to buying scale and efficiency gains. The third component relates to supplier volume allowances. In the short-term, periods of inflation or deflation can influence the first two categories, while sudden changes in business volume can influence the third.
We believe a normal gross profit percentage range for our business is 51% to 53%. This is based on our current mix of products, geographies, end markets, and end market uses (such as industrial production business versus maintenance business). The following narrative may be more detail than you want; however, we believe it is an important recap to understanding the dynamics surrounding our gross profit patterns. Our business operated below our expected gross profit range at the end of 2009, and expanded into the low end of this range during 2010. In the second quarter of 2010, we moved into the middle of the range as the three components of gross profit improved, the contribution being split fairly evenly between the three components. We remained in the middle of the range until the fourth quarter of 2011. In the fourth quarter of 2011, our gross profit felt pressure and dropped to the lower end of the range. This drop was primarily due to changes in our transactional profit (primarily due to changes in product and customer mix), lower supplier incentive gross profit, and lower freight utilization. The latter two items created half of the gross profit drop and are more of a seasonal issue. In the first quarter of 2012, our gross profit improved nominally over the previous quarter. This was primarily caused by the seasonal improvement of supplier volume allowances as rising fuel prices offset our improvements in freight utilization. In the second, third, and fourth quarters of 2012, our gross profit improved when compared to the first quarter. Most of this improvement related to improvements in our transactional gross profit. The improvement was partially offset by the weakening of our selling prices in certain foreign markets due to changes in the exchange rate. One item of note, in the fourth quarter of 2012 we experienced a drop off in the freight component of our gross profit due to lower freight utilization, a typical pattern due to the seasonal drop off in business; this gross profit decline was offset by an improvement in the remaining portion of our transactional gross profit that centers on product transactional cost and customer pricing.
The first two quarters of 2013 experienced a strong improvement in gross profit. A piece of this related to the seasonal impact of improving freight utilization, but this improvement was constrained due to the weak sales growth. The real driver of improvement related to our store personnel, armed with our newly implemented price guidance system, exercising great judgment about pricing their product. During the third quarter of 2013, we experienced a sequential (second to third quarter) decline in our gross profit. Most of this decline was in the transaction profit (about 85% of the change); with the balance in the supplier incentive gross profit. The decline in our supplier incentive gross profit was due to our continued pattern of weak sales growth. Within the transaction component, product mix stood out as the most identifiable portion (this was about 40% of the total drop, and reflects the continued weakness in our fastener growth and the strength in the growth in safety products - fasteners carry a higher gross profit, safety products don't). The remaining portion of the transactional decline was split across a
13
number of causes, the result of a very competitive landscape and our competitive nature. Beginning in the third quarter, we had placed a greater emphasis on expanding the headcount at our store locations, putting more emphasis on shorter cycle sales efforts, and moving the needle on top line growth. This impacted our gross profit in the short term; however, we think this approach is the correct long-term move as it reinforces our trust in our store personnel and our desire to grow our business long-term, but it does make for a bumpier ride. In the fourth quarter of 2013, we experienced another sequential (third to fourth quarter) decline in gross profit. Similar to prior years, we lost some gross profit due to a seasonal drop in freight utilization and in supplier incentive gross profit. This represented about 30% of the drop and was expected to recover in the new year as volume increases (seasonality) and supplier incentive programs reset (typically calendar based). The remaining drop relates to factors noted in the third quarter. We believe our expected gross profit range (51% to 53%) is still reasonable for 2014. In the first quarter of 2014, we moved back into our expected range. This improvement was evenly split between an improvement in freight utilization and in supplier incentive gross profit.
Operating and administrative expenses - were essentially unchanged as a percentage of sales in the first quarter of 2014 versus the first quarter of 2013.
Historically, our two largest components of operating and administrative expenses have consisted of employee related expenses (approximately 65% to 70%) and occupancy related expenses (approximately 15% to 20%). The remaining expenses cover a variety of items with selling transportation typically being the largest.
The three largest components of operating and administrative expenses grew as follows for the periods ended March 31 (compared to the same period in the preceding year):
Three-month period | |||||
2014 | 2013 | ||||
Employee related expenses | 6.4 | % | 5.5 | % | |
Occupancy related expenses | 8.6 | % | 13.6 | % | |
Selling transportation costs | 17.5 | % | 0.9 | % | |
Employee related expenses include: (1) payroll (which includes cash compensation, stock option expense, and profit sharing), (2) health care, (3) personnel development, and (4) social taxes. For the first three months of 2014, (1) our performance bonuses were lower due to modest earnings growth from the past year, (2) our industrial vending bonuses declined, (3) our profit sharing contribution contracted, and (4) our health care costs were flat. Nonetheless, total employee related expenses for the quarter grew due to (1) a 13.8% increase in our average employee headcount, measured on a full-time equivalent basis and (2) nominal growth in our sales commissions. The increase in employee related expenses in the first three months of 2013 was driven by the following factors: (1) average employee headcount, measured on a full-time equivalent basis, grew 1.4%, (2) sales commissions grew due to gross profit improvement, (3) bonus amounts related to our growth drivers grew (this includes items such as industrial vending bonuses which grew due to the strength in the vending rollout), (4) our profit sharing contribution grew, and (5) our health care costs grew.
Occupancy related expenses include: (1) building rent and depreciation, (2) building utility costs, (3) equipment related to our stores and distribution locations, and (4) FAST Solutions® (industrial vending) equipment (we consider the vending equipment to be a logical extension of our store operation and classify the expense as occupancy). The increase in the first three months of 2014 was driven by (1) an increase in the amount of FAST Solutions® (industrial vending) equipment as discussed earlier in this document, (2) an increase in building utility cost due to a severe winter in January and February 2014, (3) a nominal increase in the number of store locations, and (4) an increased investment in our distribution infrastructure over the last several years, primarily related to automation. Two noteworthy components were industrial vending and utilities. The vending component represented 37% of the increase, while utilities represented 22% of the increase. The increase in the first quarter of 2013 was driven by (1) an increase in the amount of FAST Solutions® (industrial vending) equipment as discussed earlier in this document, (2) an increase in the number of locations, and (3) an increased investment in our distribution infrastructure of the last several years. Two noteworthy components were industrial vending and utilities. The vending component represented 62% of the increase, while utilities represented 18% of the increase. The latter, related to utilities, was due to a more severe winter and increases in natural gas prices.
Our selling transportation costs consist primarily of our store fleet as most of the distribution fleet costs are included in the cost of sales. Selling transportation costs included in operating and administrative expenses grew dramatically in the first three months of 2014, when compared to 2013. This was driven by the increase in store headcount and the reduction in mileage per gallon associated with winter driving conditions. The decrease in the first three months of 2013, when compared to 2012, was primarily driven by stronger sales patterns related to our used store truck fleet, which lowered our vehicle ownership costs.
14
The last several years have seen some variation in the cost of diesel fuel and gasoline – During the first quarter of 2014, our total vehicle fuel costs were approximately $11.9 million. During the first, second, third, and fourth quarters of 2013, our total vehicle fuel costs were approximately $10.6, $10.6, $11.2, and $9.6 million, respectively. The changes resulted from variations in fuel costs, variations in the service levels provided to our stores from our distribution centers, changes in the number of vehicles at our store locations, changes in the number of other sales centered vehicles as a result of store openings and the expansion of our non-store sales force, and changes in driving conditions. These fuel costs include the fuel utilized in our distribution vehicles (semi-tractors, straight trucks, and sprinter trucks) which is recorded in cost of sales and the fuel utilized in our store delivery and other sales centered vehicles which is included in operating and administrative expenses (the split in the last several years has been approximately 50:50 between distribution and store and other sales centered use).
The average per gallon fuel costs (in actual dollars) and the percentage change (on a year-over-year basis) for the last three years was as follows:
Per gallon average price | Q1 | Q2 | Q3 | Q4 | Annual Average1 | |||||||||||
2014 price | ||||||||||||||||
Diesel fuel | $ | 3.98 | ||||||||||||||
Gasoline | $ | 3.33 | ||||||||||||||
2013 price | ||||||||||||||||
Diesel fuel | $ | 4.02 | 3.90 | 3.90 | 3.88 | 3.93 | ||||||||||
Gasoline | $ | 3.51 | 3.60 | 3.56 | 3.30 | 3.49 | ||||||||||
2012 price | ||||||||||||||||
Diesel fuel | $ | 3.92 | 3.98 | 3.88 | 4.05 | 3.96 | ||||||||||
Gasoline | $ | 3.53 | 3.73 | 3.61 | 3.53 | 3.60 | ||||||||||
Per gallon price change | Q1 | Q2 | Q3 | Q4 | Annual1 | |||||||||||
2014 change | ||||||||||||||||
Diesel fuel | -1.0 | % | ||||||||||||||
Gasoline | -5.1 | % | ||||||||||||||
2013 change | ||||||||||||||||
Diesel fuel | 2.6 | % | -2.0 | % | 0.5 | % | -4.2 | % | -0.8 | % | ||||||
Gasoline | -0.6 | % | -3.5 | % | -1.4 | % | -6.5 | % | -3.1 | % | ||||||
1 | Average of the four quarterly figures contained in the table. |
Income taxes – Income taxes, as a percentage of earnings before income taxes, were approximately 37.4% and 37.8% for the first three months of 2014 and 2013, respectively. As our international business and profits grow over time, the lower income tax rates in those jurisdictions, relative to the United States, have begun to lower our effective tax rate.
15
OPERATIONAL WORKING CAPITAL
The year-over-year comparison and the related dollar and percentage changes related to accounts receivable and inventories were as follows:
Balance at March 31: | Twelve Month Dollar Change | Twelve Month Percentage Change | ||||||||||||||||||||
2014 | 2013 | 2012 | 2014 | 2013 | 2014 | 2013 | ||||||||||||||||
Accounts receivable, net | $ | 473,181 | 418,733 | 386,882 | 54,448 | 31,851 | 13.0 | % | 8.2 | % | ||||||||||||
Inventories | 793,987 | 700,484 | 647,886 | 93,503 | 52,598 | 13.3 | % | 8.1 | % | |||||||||||||
Operational working capital1 | $ | 1,267,168 | 1,119,217 | 1,034,768 | 147,951 | 84,449 | 13.2 | % | 8.2 | % | ||||||||||||
Sales in last two months | $ | 583,324 | 531,460 | 522,905 | 51,864 | 8,555 | 9.8 | % | 1.6 | % | ||||||||||||
1 For purposes of this discussion, we are defining operational working capital as accounts receivable, net and inventories.
The growth in accounts receivable noted above was driven by our sales growth in the final two months of the period. The strong growth in recent years of our international business and of our large customer accounts has created meaningful difficulty with managing the growth of accounts receivable relative to the growth in sales.
Our growth in inventory balances over time does not have as direct a relationship to our monthly sales patterns as does our growth in accounts receivable. This is impacted by other aspects of our business. For example, the dramatic economic slowdown in late 2008 and early 2009 caused our inventory to spike. This occurred because the lead time for inventory procurement is typically longer than the visibility we have into future monthly sales patterns. Over the last decade, we increased our relative inventory levels due to the following: (1) new store openings, (2) expanded stocking breadth at distribution centers (for example, our master stocking hub in Indianapolis expanded its product breadth over six fold from 2005 to 2011), (3) expanded direct sourcing, (4) expanded exclusive brands (private label), (5) expanded industrial vending solutions, (6) national accounts growth, (7) international growth, and (8) expanded stocking breadth at individual stores. While all of these items impacted both 2014 and 2013, items (3) through (8) had the greatest impact.
BALANCE SHEET AND CASH FLOW
Our balance sheet continues to be very strong and our operations have good cash generating characteristics. During the first quarter of 2014, we generated $143,298 (or 128.0% of net earnings) of operating cash flow. Our first quarter typically has stronger cash flow characteristics due to the timing of tax payments; this benefit reverses itself in the second, third, and fourth quarters as income tax payments go out in April, June, September, and December. The remaining amounts of cash flow from operating activities are largely linked to the pure dynamics of a distribution business and its strong correlation to working capital as discussed above. During 2013, and the first quarter of 2014, we incurred some short-term debt to fund capital expenditures and dividends. This was expected and is expected to continue throughout the remainder of 2014 and possibly 2015.
Our dividends (per share basis) were as follows in 2014 and 2013:
2014 | 2013 | ||||||
First quarter | $ | 0.25 | $ | 0.10 | |||
Second quarter* | 0.25 | 0.20 | |||||
Third quarter | 0.25 | ||||||
Fourth quarter | 0.25 | ||||||
Total | $ | 0.50 | $ | 0.80 | |||
*The second quarter dividend was declared on April 10, 2014, and is payable on May 23, 2014 to shareholders of record at the close of business on April 25, 2014.
16
STOCK PURCHASES
During the first quarter of 2014, we purchased 200,000 shares of our common stock at an average price of approximately $44.24 per share. We currently have authority to purchase up to an additional 1,400,000 shares of our common stock.
CONFERENCE CALL TO DISCUSS QUARTERLY EARNINGS
As we previously disclosed, we will host a conference call today to review the quarterly results, as well as current operations. This conference call will be broadcast live over the Internet at 9:00 a.m., central time. To access the webcast, please go to the Fastenal Company Investor Relations Website at http://investor.fastenal.com/events.cfm.
ANNUAL MEETING OF SHAREHOLDERS PRESENTATION
On Tuesday, April 22, 2014, we will be holding our annual meeting of shareholders at our offices at 2001 Theurer Boulevard, Winona, MN. The meeting will be webcast from 10:00 a.m. central time, until the conclusion of the meeting. To access the webcast, please go to the Fastenal Company Investor Relations Website at http://investor.fastenal.com/events.cfm.
We publish on the 'Investor Relations' page of our website at www.fastenal.com, both our monthly consolidated net sales figures and certain quarterly supplemental sales information. We expect to publish the consolidated net sales figures for each month, other than the third month of a quarter, at 6:00 a.m. (central time) on the third business day of the following month. We expect to publish the consolidated net sales figures for the third month of each quarter and the supplemental sales information for each quarter at 6:00 a.m. (central time) on the date our earnings announcement for such quarter is publicly released.
We anticipate our quarterly reports on Form 10-Q will be filed with the Securities and Exchange Commission within 30 days after the end of the quarter.
We anticipate our 2014 annual report on Form 10-K will be filed with the Securities and Exchange Commission in February 2015.
Our logo is available at http://www.globenewswire.com/newsroom/prs/?pkgid=6432.
ADDITIONAL INFORMATION
Certain statements contained in this document do not relate strictly to historical or current facts. As such, they are considered 'forward-looking statements' that provide current expectations or forecasts of future events. These forward-looking statements are made pursuant to the safe harbor provisions of the Private Securities Litigation Reform Act of 1995. Such statements can be identified by the use of terminology such as anticipate, believe, should, estimate, expect, intend, may, plan, goal, project, will, and similar words or expressions. Any statement that is not a historical fact, including estimates, projections, future trends, and the outcome of events that have not yet occurred, is a forward-looking statement. Our forward-looking statements generally relate to our expectations regarding the business environment in which we operate, our projections of future performance, our perceived marketplace opportunities, and our strategies, goals, mission, and vision. You should understand that forward-looking statements involve a variety of risks and uncertainties, known and unknown, and may be affected by inaccurate assumptions. Consequently, no forward-looking statement can be guaranteed and actual results may vary materially. Factors that could cause our actual results to differ from those discussed in the forward-looking statements include, but are not limited to, economic downturns, weakness in the manufacturing or commercial construction industries, competitive pressure on selling prices, changes in our current mix of products, customers or geographic locations, changes in our purchasing patterns, changes in customer needs, changes in fuel or commodity prices, inclement weather, changes in foreign currency exchange rates, difficulty in adapting our business model to different foreign business environments, weak acceptance or adoption of vending technology or increased competition in industrial vending, difficulty in maintaining installation quality as our industrial vending business expands, difficulty in hiring, relocating, training or retaining qualified personnel, failure to accurately predict the number of North American markets able to support stores or to meet store opening goals, difficulty in controlling operating expenses, difficulty in collecting receivables or accurately predicting future inventory needs, dramatic changes in sales trends, changes in supplier production lead times, changes in our cash position, changes in tax law, changes in the availability or price of commercial real estate, changes in the nature or price of distribution and other technology, cyber-security incidents, potential liability and reputational damage that can arise if our products are defective, and other risks and uncertainties detailed in our filings with the Securities and Exchange Commission, including our most recent annual and quarterly reports. Each forward-looking statement speaks only as of the date on which such statement is made, and we undertake no obligation to update any such statement to reflect events or circumstances arising after such date. FAST-E
17
FASTENAL COMPANY AND SUBSIDIARIES | |||||||
Consolidated Balance Sheets | |||||||
(Amounts in thousands except share information) | |||||||
(Unaudited) | |||||||
Assets | March 31, 2014 | December 31, 2013 | |||||
Current assets: | |||||||
Cash and cash equivalents | $ | 89,021 | 58,506 | ||||
Marketable securities | 453 | 451 | |||||
Trade accounts receivable, net of allowance for doubtful accounts of $9,949 and $9,248, respectively | 473,181 | 414,331 | |||||
Inventories | 793,987 | 784,068 | |||||
Deferred income tax assets | 17,893 | 18,248 | |||||
Prepaid income taxes | — | 24,869 | |||||
Other current assets | 100,957 | 107,988 | |||||
Total current assets | 1,475,492 | 1,408,461 | |||||
Property and equipment, less accumulated depreciation | 677,295 | 654,850 | |||||
Other assets, net | 12,319 | 12,473 | |||||
Total assets | $ | 2,165,106 | 2,075,784 | ||||
Liabilities and Stockholders’ Equity | |||||||
Current liabilities: | |||||||
Accounts payable | $ | 105,697 | 91,253 | ||||
Accrued expenses | 148,569 | 148,579 | |||||
Income taxes payable | 47,260 | — | |||||
Total current liabilities | 301,526 | 239,832 | |||||
Deferred income tax liabilities | 63,256 | 63,255 | |||||
Stockholders' equity: | |||||||
Preferred stock, 5,000,000 shares authorized | — | — | |||||
Common stock, 400,000,000 shares authorized, 296,624,319 and 296,753,544 shares issued and outstanding, respectively | 2,966 | 2,968 | |||||
Additional paid-in capital | 64,573 | 69,847 | |||||
Retained earnings | 1,726,519 | 1,688,781 | |||||
Accumulated other comprehensive income | 6,266 | 11,101 | |||||
Total stockholders' equity | 1,800,324 | 1,772,697 | |||||
Total liabilities and stockholders' equity | $ | 2,165,106 | 2,075,784 | ||||
18
FASTENAL COMPANY AND SUBSIDIARIES | ||||||
Consolidated Statements of Earnings | ||||||
(Amounts in thousands except earnings per share) | ||||||
(Unaudited) | ||||||
Three Months Ended March 31, | ||||||
2014 | 2013 | |||||
Net sales | $ | 876,501 | 806,326 | |||
Cost of sales | 428,023 | 384,446 | ||||
Gross profit | 448,478 | 421,880 | ||||
Operating and administrative expenses | 269,843 | 247,334 | ||||
Gain on sale of property and equipment | (216 | ) | (213 | ) | ||
Operating income | 178,851 | 174,759 | ||||
Interest income | 120 | 447 | ||||
Interest expense | (126 | ) | (34 | ) | ||
Earnings before income taxes | 178,845 | 175,172 | ||||
Income tax expense | 66,914 | 66,124 | ||||
Net earnings | $ | 111,931 | 109,048 | |||
Basic net earnings per share | $ | 0.38 | 0.37 | |||
Diluted net earnings per share | $ | 0.38 | 0.37 | |||
Basic weighted average shares outstanding | 296,642 | 296,643 | ||||
Diluted weighted average shares outstanding | 297,495 | 297,652 | ||||
19
FASTENAL COMPANY AND SUBSIDIARIES | |||||||
Consolidated Statements of Cash Flows | |||||||
(Amounts in thousands) | |||||||
(Unaudited) | |||||||
Three Months Ended March 31, | |||||||
2014 | 2013 | ||||||
Cash flows from operating activities: | |||||||
Net earnings | $ | 111,931 | 109,048 | ||||
Adjustments to reconcile net earnings to net cash provided by operating activities: | |||||||
Depreciation of property and equipment | 17,281 | 15,152 | |||||
Gain on sale of property and equipment | (216 | ) | (213 | ) | |||
Bad debt expense | 2,796 | 2,045 | |||||
Deferred income taxes | 356 | 379 | |||||
Stock-based compensation | 1,380 | 1,350 | |||||
Excess tax benefits from stock-based compensation | (550 | ) | (954 | ) | |||
Amortization of non-compete agreements | 132 | 26 | |||||
Changes in operating assets and liabilities: | |||||||
Trade accounts receivable | (61,646 | ) | (48,619 | ) | |||
Inventories | (9,919 | ) | 14,899 | ||||
Other current assets | 7,031 | 13,478 | |||||
Accounts payable | 6,444 | (2,692 | ) | ||||
Accrued expenses | (10 | ) | (64 | ) | |||
Income taxes | 72,679 | 60,001 | |||||
Other | (4,391 | ) | (3,592 | ) | |||
Net cash provided by operating activities | 143,298 | 160,244 | |||||
Cash flows from investing activities: | |||||||
Purchases of property and equipment | (32,564 | ) | (55,513 | ) | |||
Proceeds from sale of property and equipment | 1,054 | 1,267 | |||||
Increase in marketable securities | (2 | ) | (63 | ) | |||
Net decrease (increase) in other assets | 22 | (3 | ) | ||||
Net cash used in investing activities | (31,490 | ) | (54,312 | ) | |||
Cash flows from financing activities: | |||||||
Borrowings under line of credit | 140,000 | 20,000 | |||||
Payments against line of credit | (140,000 | ) | (20,000 | ) | |||
Proceeds from exercise of stock options | 1,641 | 2,821 | |||||
Excess tax benefits from stock-based compensation | 550 | 954 | |||||
Purchases of common stock | (8,847 | ) | — | ||||
Payment of dividends | (74,193 | ) | (29,662 | ) | |||
Net cash used in financing activities | (80,849 | ) | (25,887 | ) | |||
Effect of exchange rate changes on cash | (444 | ) | (416 | ) | |||
Net increase in cash and cash equivalents | 30,515 | 79,629 | |||||
Cash and cash equivalents at beginning of period | 58,506 | 79,611 | |||||
Cash and cash equivalents at end of period | $ | 89,021 | 159,240 | ||||
Supplemental disclosure of cash flow information: | |||||||
Cash paid during each period for interest | $ | 70 | 34 | ||||
Net cash (received) paid during each period for income taxes | $ | (6,216 | ) | 6,502 | |||
20
CONTACT: | Ellen Trester |
Financial Reporting & Regulatory Compliance Manager | |
507-313-7282 | |
21