Attached files
| file | filename |
|---|---|
| EX-32 - SECTION 906 CEO AND CFO CERTIFICATION - FASTENAL CO | d224578dex32.htm |
| EX-31 - SECTION 302 CEO AND CFO CERTIFICATION - FASTENAL CO | d224578dex31.htm |
| EXCEL - IDEA: XBRL DOCUMENT - FASTENAL CO | Financial_Report.xls |
Table of Contents
SECURITIES AND EXCHANGE COMMISSION
WASHINGTON, D.C. 20549
FORM 10-Q
(Mark One)
| x | Quarterly report pursuant to Section 13 or 15(d) of the Securities Exchange Act of 1934 |
For the quarterly period ended September 30, 2011, or
| ¨ | Transition report pursuant to Section 13 or 15(d) of the Securities Exchange Act of 1934 |
For the transition period from to
Commission file number 0-16125
FASTENAL COMPANY
(Exact name of registrant as specified in its charter)
| Minnesota | 41-0948415 | |
| (State or other jurisdiction of incorporation or organization) |
(I.R.S. Employer Identification No.) | |
| 2001 Theurer Boulevard Winona, Minnesota |
55987-1500 | |
| (Address of principal executive offices) | (Zip Code) | |
(507) 454-5374
(Registrant’s telephone number, including area code)
Not Applicable
(Former name, former address and former fiscal year,
if changed since last report)
Indicate by check mark whether the registrant: (1) has filed all reports required to be filed by Section 13 or 15(d) of the Securities Exchange Act of 1934 during the preceding 12 months (or for such shorter period that the registrant was required to file such reports), and (2) has been subject to such filing requirements for the past 90 days. Yes x No ¨
Indicate by check mark whether the registrant has submitted electronically and posted on its corporate Web site, if any, every Interactive Data File required to be submitted and posted pursuant to Rule 405 of Regulation S-T (§ 232.405 of this chapter) during the preceding 12 months (or for such shorter period that the registrant was required to submit and post such files.) Yes x No ¨
Indicate by check mark whether the registrant is a large accelerated filer, an accelerated filer, a non-accelerated filer, or a smaller reporting company. See definition of “large accelerated filer”, “accelerated filer”, and “smaller reporting company” in Rule 12b-2 of the Exchange Act.
| Large Accelerated Filer | x | Accelerated Filer | ¨ | |||
| Non-accelerated Filer | ¨ (Do not check if a smaller reporting company) | Smaller Reporting Company | ¨ | |||
Indicate by check mark whether the registrant is a shell company (as defined in Rule 12b-2 of the Exchange Act). Yes ¨ No x
Indicate the number of shares outstanding of each of the issuer’s classes of common stock, as of the last practicable date.
| Class |
Outstanding at October 11, 2011 | |
| Common Stock, $.01 par value | 295,203,874 |
Table of Contents
INDEX
Table of Contents
PART I - FINANCIAL INFORMATION
ITEM 1. FINANCIAL STATEMENTS
FASTENAL COMPANY AND SUBSIDIARIES
Consolidated Balance Sheets
(Amounts in thousands except share information)
| (Unaudited) September 30, 2011 |
December 31, 2010 |
|||||||
| Assets |
||||||||
| Current assets: |
||||||||
| Cash and cash equivalents |
$ | 111,048 | 143,693 | |||||
| Marketable securities |
26,203 | 26,067 | ||||||
| Trade accounts receivable, net of allowance for doubtful accounts of $5,147 and $4,761, respectively |
361,075 | 270,133 | ||||||
| Inventories |
618,149 | 557,369 | ||||||
| Deferred income tax assets |
16,502 | 17,897 | ||||||
| Other current assets |
84,387 | 70,539 | ||||||
|
|
|
|
|
|||||
| Total current assets |
1,217,364 | 1,085,698 | ||||||
| Marketable securities |
0 | 5,152 | ||||||
| Property and equipment, less accumulated depreciation |
420,388 | 363,419 | ||||||
| Other assets, net |
13,268 | 14,014 | ||||||
|
|
|
|
|
|||||
| Total assets |
$ | 1,651,020 | 1,468,283 | |||||
|
|
|
|
|
|||||
| Liabilities and Stockholders’ Equity |
||||||||
| Current liabilities: |
||||||||
| Accounts payable |
$ | 86,839 | 60,474 | |||||
| Accrued expenses |
108,568 | 96,412 | ||||||
| Income taxes payable |
23,462 | 5,299 | ||||||
|
|
|
|
|
|||||
| Total current liabilities |
218,869 | 162,185 | ||||||
|
|
|
|
|
|||||
| Deferred income tax liabilities |
23,325 | 23,586 | ||||||
|
|
|
|
|
|||||
| Stockholders’ equity: |
||||||||
| Preferred stock, 5,000,000 shares authorized |
0 | 0 | ||||||
| Common stock, 400,000,000 shares authorized, 295,203,874 and 294,861,424 shares issued and outstanding, respectively |
2,952 | 2,948 | ||||||
| Additional paid-in capital |
14,317 | 2,889 | ||||||
| Retained earnings |
1,378,227 | 1,258,183 | ||||||
| Accumulated other comprehensive income |
13,330 | 18,492 | ||||||
|
|
|
|
|
|||||
| Total stockholders’ equity |
1,408,826 | 1,282,512 | ||||||
|
|
|
|
|
|||||
| Total liabilities and stockholders’ equity |
$ | 1,651,020 | 1,468,283 | |||||
|
|
|
|
|
|||||
The accompanying notes are an integral part of the consolidated financial statements.
- 1 -
Table of Contents
FASTENAL COMPANY AND SUBSIDIARIES
Consolidated Statements of Earnings
(Amounts in thousands except earnings per share)
| (Unaudited) Nine months ended September 30, |
(Unaudited) Three months ended September 30, |
|||||||||||||||
| 2011 | 2010 | 2011 | 2010 | |||||||||||||
| Net sales |
$ | 2,069,055 | 1,695,705 | 726,742 | 603,750 | |||||||||||
| Cost of sales |
992,061 | 819,486 | 349,361 | 291,102 | ||||||||||||
|
|
|
|
|
|
|
|
|
|||||||||
| Gross profit |
1,076,994 | 876,219 | 377,381 | 312,648 | ||||||||||||
| Operating and administrative expenses |
642,817 | 553,333 | 222,257 | 192,140 | ||||||||||||
| Loss (gain) on sale of property and equipment |
183 | 103 | (101 | ) | (2 | ) | ||||||||||
|
|
|
|
|
|
|
|
|
|||||||||
| Operating income |
433,994 | 322,783 | 155,225 | 120,510 | ||||||||||||
| Interest income |
318 | 713 | 94 | 192 | ||||||||||||
|
|
|
|
|
|
|
|
|
|||||||||
| Earnings before income taxes |
434,312 | 323,496 | 155,319 | 120,702 | ||||||||||||
| Income tax expense |
163,854 | 123,301 | 58,521 | 45,708 | ||||||||||||
|
|
|
|
|
|
|
|
|
|||||||||
| Net earnings |
$ | 270,458 | 200,195 | 96,798 | 74,994 | |||||||||||
|
|
|
|
|
|
|
|
|
|||||||||
| Basic net earnings per share |
$ | 0.92 | 0.68 | 0.33 | 0.25 | |||||||||||
|
|
|
|
|
|
|
|
|
|||||||||
| Diluted net earnings per share |
$ | 0.91 | 0.68 | 0.33 | 0.25 | |||||||||||
|
|
|
|
|
|
|
|
|
|||||||||
| Basic weighted average shares outstanding |
294,994 | 294,861 | 295,144 | 294,861 | ||||||||||||
|
|
|
|
|
|
|
|
|
|||||||||
| Diluted weighted average shares outstanding |
295,763 | 294,861 | 295,895 | 294,861 | ||||||||||||
|
|
|
|
|
|
|
|
|
|||||||||
The accompanying notes are an integral part of the consolidated financial statements.
- 2 -
Table of Contents
FASTENAL COMPANY AND SUBSIDIARIES
Consolidated Statements of Cash Flows
(Amounts in thousands)
| (Unaudited) Nine months ended September 30, |
||||||||
| 2011 | 2010 | |||||||
| Cash flows from operating activities: |
||||||||
| Net earnings |
$ | 270,458 | 200,195 | |||||
| Adjustments to reconcile net earnings to net cash provided by operating activities: |
||||||||
| Depreciation of property and equipment |
32,441 | 30,432 | ||||||
| Loss on sale of property and equipment |
183 | 103 | ||||||
| Bad debt expense |
6,591 | 6,004 | ||||||
| Deferred income taxes |
1,134 | (1,978 | ) | |||||
| Stock based compensation |
2,925 | 3,015 | ||||||
| Amortization of non-compete agreements |
445 | 50 | ||||||
| Changes in operating assets and liabilities: |
||||||||
| Trade accounts receivable |
(97,533 | ) | (93,556 | ) | ||||
| Inventories |
(60,780 | ) | (37,658 | ) | ||||
| Other current assets |
(13,848 | ) | (11,141 | ) | ||||
| Accounts payable |
26,365 | 20,115 | ||||||
| Accrued expenses |
12,156 | 29,206 | ||||||
| Income taxes |
18,163 | 19,970 | ||||||
| Other |
(4,519 | ) | 1,536 | |||||
|
|
|
|
|
|||||
| Net cash provided by operating activities |
194,181 | 166,293 | ||||||
|
|
|
|
|
|||||
| Cash flows from investing activities: |
||||||||
| Purchase of property and equipment |
(92,479 | ) | (42,643 | ) | ||||
| Proceeds from sale of property and equipment |
2,886 | 3,264 | ||||||
| Net decrease in marketable securities |
5,016 | 831 | ||||||
| Net decrease in other assets |
301 | 182 | ||||||
|
|
|
|
|
|||||
| Net cash used in investing activities |
(84,276 | ) | (38,366 | ) | ||||
|
|
|
|
|
|||||
| Cash flows from financing activities: |
||||||||
| Proceeds from exercise of stock options |
7,706 | 0 | ||||||
| Tax benefits from exercise of stock options |
801 | 0 | ||||||
| Payment of dividends |
(150,414 | ) | (120,893 | ) | ||||
|
|
|
|
|
|||||
| Net cash used in financing activities |
(141,907 | ) | (120,893 | ) | ||||
|
|
|
|
|
|||||
| Effect of exchange rate changes on cash |
(643 | ) | 679 | |||||
|
|
|
|
|
|||||
| Net (decrease) increase in cash and cash equivalents |
(32,645 | ) | 7,713 | |||||
| Cash and cash equivalents at beginning of period |
143,693 | 164,852 | ||||||
|
|
|
|
|
|||||
| Cash and cash equivalents at end of period |
$ | 111,048 | 172,565 | |||||
|
|
|
|
|
|||||
| Supplemental disclosure of cash flow information: |
||||||||
| Cash paid during each period for income taxes |
$ | 145,358 | 105,309 | |||||
|
|
|
|
|
|||||
The accompanying notes are an integral part of the consolidated financial statements.
- 3 -
Table of Contents
FASTENAL COMPANY AND SUBSIDIARIES
NOTES TO CONSOLIDATED FINANCIAL STATEMENTS
(Amounts in thousands except share and per share information and where otherwise noted)
September 30, 2011 and 2010
(Unaudited)
| (1) | Basis of Presentation |
The accompanying unaudited consolidated financial statements of Fastenal Company and subsidiaries (collectively referred to as the Company, Fastenal, or by terms such as we, our, or us) have been prepared in accordance with United States generally accepted accounting principles for interim financial information. They do not include all information and footnotes required by United States generally accepted accounting principles for complete financial statements. However, except as described herein, there has been no material change in the information disclosed in the notes to consolidated financial statements included in our consolidated financial statements as of and for the year ended December 31, 2010. In the opinion of management, all adjustments (consisting of normal recurring accruals) considered necessary for a fair presentation have been included.
Stock split – On April 19, 2011, our board of directors declared a two-for-one stock split with respect to our common stock. This stock split became effective at the close of business on May 20, 2011. All historical share and per share amounts in this report have been adjusted to reflect the impact of this stock split.
| (2) | Marketable Securities |
Fair value accounting standards define fair value as the price that would be received to sell an asset or paid to transfer a liability in an orderly transaction between market participants at the measurement date. The following fair value hierarchy prioritizes the inputs used to measure fair value into three levels, with Level 1 being of the highest priority. The three levels of inputs used to measure fair value are as follows:
| Level 1 – | Observable inputs that reflect quoted prices (unadjusted) for identical assets or liabilities in active markets. | |
| Level 2 – | Include other inputs that are directly or indirectly observable in the marketplace. | |
| Level 3 – | Unobservable inputs which are supported by little or no market activity. | |
The level in the fair value hierarchy within which a fair value measurement falls is based on the lowest level input that is significant to the fair value measurement in its entirety.
(Continued)
-4-
Table of Contents
FASTENAL COMPANY AND SUBSIDIARIES
NOTES TO CONSOLIDATED FINANCIAL STATEMENTS
(Amounts in thousands except share and per share information and where otherwise noted)
September 30, 2011 and 2010
(Unaudited)
The following table presents the placement in the fair value hierarchy of assets that are measured at fair value on a recurring basis at period end:
| Level 1 | Level 2 | Level 3 | ||||||||||||||
| Assets at September 30, 2011: |
Total | Quoted prices in active markets for identical assets |
Significant other observable inputs |
Significant unobservable inputs |
||||||||||||
| Common stock |
$ | 295 | 295 | 0 | 0 | |||||||||||
| Government and agency securities |
25,908 | 25,908 | 0 | 0 | ||||||||||||
|
|
|
|
|
|
|
|
|
|||||||||
| Total available-for-sale securities |
$ | 26,203 | 26,203 | 0 | 0 | |||||||||||
|
|
|
|
|
|
|
|
|
|||||||||
| Level 1 | Level 2 | Level 3 | ||||||||||||||
| Assets at September 30, 2010: |
Total | Quoted prices in active markets for identical assets |
Significant other observable inputs |
Significant unobservable inputs |
||||||||||||
| Common stock |
$ | 160 | 160 | 0 | 0 | |||||||||||
| State and municipal bonds |
5,166 | 0 | 5,166 | 0 | ||||||||||||
| Government and agency securities |
24,481 | 24,481 | 0 | 0 | ||||||||||||
|
|
|
|
|
|
|
|
|
|||||||||
| Total available-for-sale securities |
$ | 29,807 | 24,641 | 5,166 | 0 | |||||||||||
|
|
|
|
|
|
|
|
|
|||||||||
There were no transfers between levels during the nine months ended September 30, 2011 and 2010.
As of September 30, 2011 and September 30, 2010 our financial assets that are measured at fair value on a recurring basis consisted of common stock and debt securities. The government and agency securities have a maturity of twelve months. The debt securities are classified as marketable securities.
Marketable securities, all treated as available-for-sale securities at period end, consist of the following:
| September 30, 2011: |
Amortized cost |
Gross unrealized gains |
Gross unrealized losses |
Fair value | ||||||||||||
| Common stock |
$ | 198 | 97 | 0 | 295 | |||||||||||
| Government and agency securities |
25,850 | 58 | 0 | 25,908 | ||||||||||||
|
|
|
|
|
|
|
|
|
|||||||||
| Total available-for-sale securities |
$ | 26,048 | 155 | 0 | 26,203 | |||||||||||
|
|
|
|
|
|
|
|
|
|||||||||
(Continued)
-5-
Table of Contents
FASTENAL COMPANY AND SUBSIDIARIES
NOTES TO CONSOLIDATED FINANCIAL STATEMENTS
(Amounts in thousands except share and per share information and where otherwise noted)
September 30, 2011 and 2010
(Unaudited)
| September 30, 2010: |
Amortized cost |
Gross unrealized gains |
Gross unrealized losses |
Fair value | ||||||||||||
| Common stock |
$ | 183 | 0 | (23 | ) | 160 | ||||||||||
| State and municipal bonds |
5,179 | 0 | (13 | ) | 5,166 | |||||||||||
| Government and agency securities |
24,400 | 81 | 0 | 24,481 | ||||||||||||
|
|
|
|
|
|
|
|
|
|||||||||
| Total available-for-sale securities |
$ | 29,762 | 81 | (36 | ) | 29,807 | ||||||||||
|
|
|
|
|
|
|
|
|
|||||||||
The unrealized gains and losses recorded in accumulated other comprehensive income and the realized gains and losses recorded in earnings were immaterial during the periods reported in these consolidated financial statements.
Future maturities of our available-for-sale securities consist of the following:
| Less than 12 months | Greater than 12 months | |||||||||||||||
| September 30, 2011: |
Amortized cost |
Fair value |
Amortized cost |
Fair value |
||||||||||||
| Common stock |
$ | 198 | 295 | 0 | 0 | |||||||||||
| Government and agency securities |
25,850 | 25,908 | 0 | 0 | ||||||||||||
|
|
|
|
|
|
|
|
|
|||||||||
| Total available-for-sale securities |
$ | 26,048 | 26,203 | 0 | 0 | |||||||||||
|
|
|
|
|
|
|
|
|
|||||||||
| (3) | Stockholders’ Equity – See note (1) regarding our stock split. |
Our authorized and issued shares (share amounts stated in whole numbers) consist of the following:
| Par Value | September 30, 2011 |
December 31, 2010 |
||||||||||
| Preferred Stock |
$ | .01/share | ||||||||||
| Authorized |
5,000,000 | 5,000,000 | ||||||||||
| Shares issued |
0 | 0 | ||||||||||
| Common Stock |
$ | .01/share | ||||||||||
| Authorized |
400,000,000 | 400,000,000 | ||||||||||
| Shares issued |
295,203,874 | 294,861,424 | ||||||||||
Dividends
On October 12, 2011, our board of directors declared a dividend of $0.14 per share of common stock. This dividend is to be paid in cash on November 22, 2011 to shareholders of record at the close of business on October 26, 2011. Historically, we have paid semi-annual dividends, which were typically paid in the first and third quarters. In 2010 and 2008, we paid a supplemental dividend in the fourth quarter. In 2011, our board of directors declared a semi-annual dividend in January, and then switched to a quarterly dividend in April, July, and October. Our board of directors expect to continue paying quarterly dividends, provided the future determination as to payment of dividends will depend on the financial needs of the Company and such other factors as deemed relevant by the board of directors.
(Continued)
-6-
Table of Contents
FASTENAL COMPANY AND SUBSIDIARIES
NOTES TO CONSOLIDATED FINANCIAL STATEMENTS
(Amounts in thousands except share and per share information and where otherwise noted)
September 30, 2011 and 2010
(Unaudited)
The following table presents the dividends paid previously and declared by our board of directors for future payment by quarter (amounts are stated in per share value):
| 2011 | 2010 | |||||||
| First quarter |
$ | 0.25 | 0.20 | |||||
| Second quarter |
0.13 | 0.00 | ||||||
| Third quarter |
0.13 | 0.21 | ||||||
| Fourth quarter |
0.14 | 0.21 | ||||||
|
|
|
|
|
|||||
| Total |
$ | 0.65 | 0.62 | |||||
|
|
|
|
|
|||||
Stock Options
On April 19, 2011, the compensation committee of our board of directors approved the grant under our employee stock option plan, effective at the close of business that day, of options to purchase approximately 410 thousand shares of our common stock at a strike price of $35.00 per share. The closing stock price on the date of grant was $31.78 per share.
The following tables summarize the details of previous grants made under our stock option plan and the assumptions used to value the grants. The grants listed below exclude grants that have expired due to the lapse of time. All options granted were effective at the close of business on the date of grant.
| Options granted |
Option exercise (strike) price |
Closing stock price on date of grant |
||||||||||||||||||
| September 30, 2011 | ||||||||||||||||||||
| Options | Options | |||||||||||||||||||
| Date of grant |
outstanding | vested | ||||||||||||||||||
| April 19, 2011 |
410,000 | $ | 35.00 | $ | 31.78 | 410,000 | 0 | |||||||||||||
| April 20, 2010 |
530,000 | $ | 30.00 | $ | 27.13 | 400,000 | 0 | |||||||||||||
| April 21, 2009 |
790,000 | $ | 27.00 | $ | 17.61 | 600,000 | 0 | |||||||||||||
| April 15, 2008 |
550,000 | $ | 27.00 | $ | 24.35 | 360,000 | 0 | |||||||||||||
| April 17, 2007 |
4,380,000 | $ | 22.50 | $ | 20.15 | 3,432,550 | 1,725,550 | |||||||||||||
| Date of grant |
Risk-free interest rate |
Expected life of option in years |
Expected dividend yield |
Expected stock volatility |
Estimated fair value of stock option |
|||||||||||||||
| April 19, 2011 |
2.1 | % | 5.00 | 1.6 | % | 39.33 | % | $ | 11.20 | |||||||||||
| April 20, 2010 |
2.6 | % | 5.00 | 1.5 | % | 39.10 | % | $ | 8.14 | |||||||||||
| April 21, 2009 |
1.9 | % | 5.00 | 1.0 | % | 38.80 | % | $ | 3.64 | |||||||||||
| April 15, 2008 |
2.7 | % | 5.00 | 1.0 | % | 30.93 | % | $ | 7.75 | |||||||||||
| April 17, 2007 |
4.6 | % | 4.85 | 1.0 | % | 31.59 | % | $ | 5.63 | |||||||||||
All of the options in the tables above vest and become exercisable over a period of up to eight years. Each option will terminate, to the extent not previously exercised, 13 months after the end of the relevant vesting period.
(Continued)
-7-
Table of Contents
FASTENAL COMPANY AND SUBSIDIARIES
NOTES TO CONSOLIDATED FINANCIAL STATEMENTS
(Amounts in thousands except share and per share information and where otherwise noted)
September 30, 2011 and 2010
(Unaudited)
The fair value of each share-based option is estimated on the date of grant using a Black-Scholes valuation method that uses the assumptions listed above. The expected life is the average length of time over which we expect the employee groups will exercise their options, which is based on historical experience with similar grants. Expected volatilities are based on the movement of our stock over the most recent historical period equivalent to the expected life of the option. The risk-free interest rate is based on the U.S. Treasury rate over the expected life at the time of grant. The dividend yield is estimated over the expected life based on our current dividend payout, historical dividends paid, and expected future cash dividends.
Compensation expense equal to the grant date fair value is recognized for all of these awards over the vesting period. The stock-based compensation expense for the nine month periods ended September 30, 2011 and 2010 was $2,925 and $3,015, respectively. Unrecognized compensation expense related to outstanding stock options as of September 30, 2011 was $16,214 and is expected to be recognized over a weighted average period of 4.86 years. Any future changes in estimated forfeitures will impact this amount.
Earnings Per Share
The following tables present a reconciliation of the denominators used in the computation of basic and diluted earnings per share related to our stock option plan and a summary of the options to purchase shares of common stock which were excluded from the diluted earnings calculation because they were anti-dilutive (share amounts stated in whole numbers):
| Nine-month period | Three-month period | |||||||||||||||
| Reconciliation |
2011 | 2010 | 2011 | 2010 | ||||||||||||
| Basic-weighted average shares outstanding |
294,994,553 | 294,861,424 | 295,144,175 | 294,861,424 | ||||||||||||
| Weighted shares assumed upon exercise of stock options |
768,209 | 0 | 750,788 | 0 | ||||||||||||
|
|
|
|
|
|
|
|
|
|||||||||
| Diluted-weighted average shares outstanding |
295,762,762 | 294,861,424 | 295,894,963 | 294,861,424 | ||||||||||||
|
|
|
|
|
|
|
|
|
|||||||||
| Nine-month period | Three-month period | |||||||||||||||
| Summary of anti-dilutive options excluded |
2011 | 2010 | 2011 | 2010 | ||||||||||||
| Options to purchase shares of common stock |
668,791 | 5,319,890 | 818,261 | 5,466,413 | ||||||||||||
| Weighted-average exercise prices of anti-dilutive options |
$ | 31.85 | $ | 23.90 | $ | 32.51 | $ | 24.12 | ||||||||
Any dilutive impact summarized above would relate to periods when the average market price of our stock exceeded the exercise price of the potentially dilutive option securities then outstanding.
(Continued)
-8-
Table of Contents
FASTENAL COMPANY AND SUBSIDIARIES
NOTES TO CONSOLIDATED FINANCIAL STATEMENTS
(Amounts in thousands except share and per share information and where otherwise noted)
September 30, 2011 and 2010
(Unaudited)
| (4) | Comprehensive Income |
Comprehensive income and the components of other comprehensive income were as follows:
| Nine-month period | Three-month period | |||||||||||||||
| 2011 | 2010 | 2011 | 2010 | |||||||||||||
| Net earnings |
$ | 270,458 | 200,195 | 96,798 | 74,994 | |||||||||||
| Translation adjustment |
(5,295 | ) | 2,156 | (8,016 | ) | 2,423 | ||||||||||
| Change in marketable securities |
134 | 59 | (40 | ) | (6 | ) | ||||||||||
|
|
|
|
|
|
|
|
|
|||||||||
| Total comprehensive income |
$ | 265,297 | 202,410 | 88,742 | 77,411 | |||||||||||
|
|
|
|
|
|
|
|
|
|||||||||
| (5) | Income Taxes |
Fastenal, or one of its subsidiaries, files income tax returns in the United States Federal jurisdiction, numerous states, and various local and foreign jurisdictions. With limited exceptions, we are no longer subject to income tax examinations by taxing authorities for taxable years before 2008 in the case of United States Federal and non-United States examinations and 2007 in the case of state and local examinations.
As of September 30, 2011 and 2010, the Company had $4,399 and $1,728, respectively, of liabilities recorded related to unrecognized tax benefits. Included in this liability for unrecognized tax benefits is an immaterial amount for interest and penalties, both of which we classify as a component of income tax expense. The Company does not anticipate that total unrecognized tax benefits will change significantly during the next 12 months.
| (6) | Operating Leases |
We lease certain pick-up trucks under operating leases. These leases have a non-cancellable lease term of one year, with renewal options for up to 72 months. The pick-up truck leases include an early buy out clause we generally exercise, thereby giving the leases an effective term of 28-36 months. We provided an $841 loss on disposal reserve at September 30, 2011.
| (7) | Subsequent Events |
On October 12, 2011, our board of directors declared a dividend of $0.14 per share. This dividend is discussed in footnote (3) ‘Stockholders’ Equity’.
(Continued)
-9-
Table of Contents
FASTENAL COMPANY AND SUBSIDIARIES
NOTES TO CONSOLIDATED FINANCIAL STATEMENTS
(Amounts in thousands except share and per share information and where otherwise noted)
September 30, 2011 and 2010
(Unaudited)
| (8) | Contingencies |
In early February 2010, we received a letter from a California fastener supplier dated January 26, 2010. This letter threatened to sue us for an alleged violation of an exclusive distribution arrangement this supplier believes exists between our organizations. In addition to the letter, this supplier provided a press release and a video regarding the claim that they threatened to make public unless we agreed to mediation of the claim. Shortly after receipt of this letter, we performed a preliminary internal review to understand (1) who this supplier was and (2) the nature of our relationship with this supplier. Based on that review, we determined that this supplier manufactures a niche type of fastener and that the total volume of purchases by us, from all suppliers, over the purported term of the alleged exclusivity arrangement of this niche type of fastener did not exceed $1 million. Following completion of our preliminary internal review, we requested additional information and documentation from the supplier. The supplier’s response failed to provide the requested information and documentation. By letter dated February 26, 2010, we quantified for the supplier our total volume of purchases as discussed above and informed the supplier that we believed their claim was grossly exaggerated and completely unsupported. We have not received any direct response to our February 26, 2010 letter. On May 3, 2010, this supplier filed suit in Arkansas federal court alleging damages. In response, we filed a motion to dismiss. This motion to dismiss was denied on August 16, 2010. We subsequently filed two motions for summary judgment. The first summary judgment motion was partially denied.
On August 24, 2011, the court issued an order granting Fastenal’s second motion for summary judgment in its entirety. On September 8, 2011, this supplier filed an appeal in connection with the order granting Fastenal’s second motion for summary judgment. Based on current information, we believe the prospect that we will incur a material liability as a result of this claim is remote. While we are not required to disclose this matter under the rules of the Securities and Exchange Commission (‘SEC’), we initially disclosed the existence of this threat in February 2010 (in our 2009 annual report on Form 10-K) as we believed that disclosure was prudent due to the alleged amount ($180 million) of the claim and the threat to make these allegations public.
-10-
Table of Contents
| ITEM 2 – | MANAGEMENT’S DISCUSSION AND ANALYSIS OF FINANCIAL CONDITION AND RESULTS OF OPERATIONS |
The following is management’s discussion and analysis of certain significant factors that have affected our financial position and operating results during the periods included in the accompanying consolidated financial statements. (Dollar amounts are in thousands except for per share amounts and where otherwise noted.)
BUSINESS AND OPERATIONAL OVERVIEW:
Fastenal is a North American leader in the wholesale distribution of industrial and construction supplies. We distribute these supplies through a network of over 2,500 company owned stores. Most of our customers are in the manufacturing and non-residential construction markets. The manufacturing market includes both original equipment manufacturers (OEM) and maintenance and repair operations (MRO). The non-residential construction market includes general, electrical, plumbing, sheet metal, and road contractors. Other users of our product include farmers, truckers, railroads, mining companies, federal, state, and local governmental entities, schools, and certain retail trades. Geographically, our stores and customers are primarily located in North America.
Like most industrial and construction centric organizations, we have endured a roller coaster ride over the last several years. The third quarter of 2008 included the final months of an inflationary period related to both steel prices (approximately 50% of our sales consist of some type of fastener – nuts, bolts, screws, etc. – most of which are made of steel) and energy prices (a meaningful item for us given the amount of energy that is necessary in the production of our products and in the transportation of our products across North America in one of our over 5,000 vehicles on the road).
In the fourth quarter of 2008, and throughout much of 2009, this inflation turned to deflation. When the swings are dramatic, this can hurt our gross margins because we are selling expensive inventory on the shelf at declining prices. This hurt our gross margins in 2009. The drop in energy costs over the same period provided some relief, but it was small in comparison to the impact of deflation. The deflation of 2009 ended and these conditions normalized and allowed our gross margins to recover in 2010 and in the first nine months of 2011. (See later discussion on gross margins.) In recent months, we have seen evidence of nominal inflation creeping into our supply chain, both in the form of steel price inflation and energy inflation. The impact of this is discussed later in this report.
The discussion that follows includes information regarding our sales growth and our sales by product line. This information provides a summary view to understand the dynamics of the quarter. However, we feel the real story is told in the monthly sales changes, sequential trends, and end market information that follow – they explain the impact of the market dynamics affecting us over this period of uncertainty.
Over the last several years, we have continued to make significant investments in (1) store locations, (2) national accounts, (3) government sales, (4) internal manufacturing support, (5) international operations (now over 10% of our sales), and (6) industrial vending. We are excited about the prospects of each and will continue to shed light on these areas as we move through 2011 and into 2012.
As always, the ‘pathway to profit’ is the cornerstone of our business evolution, and it influences everything we do. Remember, our business centers on our 2,500 plus stores – their individual success leads to the success of the entire organization over time. As always, we will continue to work to be the best supplier in every market we serve as we maintain our goal of Growth through Customer Service.
-11-
Table of Contents
SALES GROWTH:
Net sales and growth rates in net sales were as follows:
| Nine-month period | Three-month period | |||||||||||||||
| 2011 | 2010 | 2011 | 2010 | |||||||||||||
| Net sales |
$ | 2,069,055 | 1,695,705 | 726,742 | 603,750 | |||||||||||
| Percentage change |
22.0 | % | 16.7 | % | 20.4 | % | 23.4 | % | ||||||||
The increase in net sales in the first nine months of 2011 came primarily from higher unit sales. Our growth in net sales was impacted by inflationary price changes in our products, but the impact was limited. Our growth in net sales was not meaningfully impacted by the introduction of new products or services. The higher unit sales resulted primarily from increases in sales at older store locations (discussed below and again later in this document) and to a lesser degree the opening of new store locations in the last several years. The growth in net sales at the older store locations was due to the moderating impacts of the current recessionary environment, an environment which dramatically worsened late in 2008. The change in currencies in foreign countries (primarily Canada) relative to the United States dollar improved our daily sales growth rate by 0.9% during the first nine months of 2011. This added approximately 0.7% and 0.3% to our annual growth in net sales in the quarters ended September 30, 2011 and 2010, respectively.
The stores opened greater than two years ago represent a consistent ‘same store’ view of our business (store sites opened as follows: 2011 group – opened 2009 and earlier, and 2010 group – opened 2008 and earlier). However, the impact of the economy is best reflected in the growth performance of our stores opened greater than five years ago (store sites opened as follows: 2011 group – opened 2006 and earlier, and 2010 group – opened 2005 and earlier) and opened greater than ten years ago (store sites opened as follows: 2011 group – opened 2001 and earlier, and 2010 group – opened 2000 and earlier). These two groups of stores are more cyclical due to the increased market share they enjoy in their local markets. The daily sales change for each of these groups was as follows:
| Nine-month period | Three-month period | |||||||||||||||
| 2011 | 2010 | 2011 | 2010 | |||||||||||||
| Store Age |
||||||||||||||||
| Opened greater than 2 years ago |
18.0 | % | 13.9 | % | 16.8 | % | 20.2 | % | ||||||||
| Opened greater than 5 years ago |
17.2 | % | 12.1 | % | 15.6 | % | 19.0 | % | ||||||||
| Opened greater than 10 years ago |
14.9 | % | 12.4 | % | 13.2 | % | 19.1 | % | ||||||||
Note: The age groups above are measured as of the last day of each respective calendar year.
SALES BY PRODUCT LINE:
The mix of sales from the original fastener product line and from the other product lines was as follows:
| Nine-month period | Three-month period | |||||||||||||||
| 2011 | 2010 | 2011 | 2010 | |||||||||||||
| Fastener product line |
47.3 | % | 49.6 | % | 46.5 | % | 49.2 | % | ||||||||
| Other product lines |
52.7 | % | 50.4 | % | 53.5 | % | 50.8 | % | ||||||||
|
|
|
|
|
|
|
|
|
|||||||||
| 100.0 | % | 100.0 | % | 100.0 | % | 100.0 | % | |||||||||
|
|
|
|
|
|
|
|
|
|||||||||
-12-
Table of Contents
COMMENTS REGARDING MONTHLY SALES CHANGES, SEQUENTIAL TRENDS, AND END MARKET PERFORMANCE
Note – Daily sales are defined as the sales for the period divided by the number of business days in the period.
This section focuses on three distinct views of our business – monthly sales changes, sequential trends, and end market performance. The first discussion regarding monthly sales changes provides a good mechanical view of our business based on the age of our stores. The second discussion provides a framework for understanding the sequential trends (that is, comparing a period to the immediately preceding period) in our business. Finally, we believe the third discussion regarding end market performance provides insight into activities with our various types of customers.
MONTHLY SALES CHANGES:
All company sales – During each of the first nine months in 2011 and each of the months in 2010 and 2009, all of our selling locations, when combined, had daily sales growth rates of (compared to the comparable month in the preceding year):
| Jan. | Feb. | Mar. | Apr. | May | June | July | Aug. | Sept. | Oct. | Nov. | Dec. | |||||||||||||||||||||||||||||||||||||
| 2011 |
18.8 | % | 21.5 | % | 22.8 | % | 23.2 | % | 22.6 | % | 22.5 | % | 22.4 | % | 20.0 | % | 18.8 | % | ||||||||||||||||||||||||||||||
| 2010 |
2.4 | % | 4.4 | % | 12.1 | % | 18.6 | % | 21.1 | % | 21.1 | % | 24.4 | % | 22.1 | % | 23.5 | % | 22.4 | % | 17.9 | % | 20.9 | % | ||||||||||||||||||||||||
| 2009 |
-8.5 | % | -10.5 | % | -17.4 | % | -21.0 | % | -20.7 | % | -22.5 | % | -22.9 | % | -21.4 | % | -20.8 | % | -18.7 | % | -12.0 | % | -8.6 | % | ||||||||||||||||||||||||
The growth in 2010, and into 2011, generally continues the improving trend we saw in the latter half of 2009. The negative growth in 2009 relates to the general economic weakness in the global marketplace. The change in currencies in foreign countries (primarily Canada) relative to the United States dollar improved our daily sales growth rate by 0.9% during the first nine months of 2011.
Stores opened greater than two years – Our stores opened greater than two years (store sites opened as follows: 2011 group – opened 2009 and earlier, 2010 group – opened 2008 and earlier, and 2009 group – opened 2007 and earlier) represent a consistent ‘same-store’ view of our business. During each of the first nine months in 2011 and each of the months in 2010 and 2009, the stores opened greater than two years had daily sales growth rates of (compared to the comparable month in the preceding year):
| Jan. | Feb. | Mar. | Apr. | May | June | July | Aug. | Sept. | Oct. | Nov. | Dec. | |||||||||||||||||||||||||||||||||||||
| 2011 |
16.0 | % | 18.4 | % | 19.4 | % | 19.6 | % | 19.2 | % | 19.1 | % | 18.7 | % | 16.5 | % | 15.2 | % | ||||||||||||||||||||||||||||||
| 2010 |
0.6 | % | 2.3 | % | 9.6 | % | 16.3 | % | 18.5 | % | 18.3 | % | 21.3 | % | 19.2 | % | 19.8 | % | 18.8 | % | 14.1 | % | 16.8 | % | ||||||||||||||||||||||||
| 2009 |
-11.2 | % | -13.8 | % | -20.1 | % | -24.0 | % | -23.7 | % | -25.1 | % | -25.4 | % | -24.0 | % | -23.1 | % | -20.9 | % | -13.7 | % | -10.6 | % | ||||||||||||||||||||||||
Stores opened greater than five years – The impact of the economy, over time, is best reflected in the growth performance of our stores opened greater than five years (store sites opened as follows: 2011 group – opened 2006 and earlier, 2010 group – opened 2005 and earlier, and 2009 group – opened 2004 and earlier). This group is more cyclical due to the increased market share these stores enjoy in their local markets. During each of the first nine months in 2011 and each of the months in 2010 and 2009, the stores opened greater than five years had daily sales growth rates of (compared to the comparable month in the preceding year):
| Jan. | Feb. | Mar. | Apr. | May | June | July | Aug. | Sept. | Oct. | Nov. | Dec. | |||||||||||||||||||||||||||||||||||||
| 2011 |
15.3 | % | 17.9 | % | 19.2 | % | 19.1 | % | 17.9 | % | 18.2 | % | 17.3 | % | 15.2 | % | 14.5 | % | ||||||||||||||||||||||||||||||
| 2010 |
-2.1 | % | -0.5 | % | 7.4 | % | 14.9 | % | 17.3 | % | 16.2 | % | 19.8 | % | 18.2 | % | 18.9 | % | 17.9 | % | 13.2 | % | 16.0 | % | ||||||||||||||||||||||||
| 2009 |
-12.4 | % | -14.3 | % | -21.5 | % | -25.2 | % | -25.2 | % | -26.3 | % | -26.6 | % | -24.7 | % | -24.2 | % | -21.7 | % | -15.0 | % | -12.1 | % | ||||||||||||||||||||||||
-13-
Table of Contents
SEQUENTIAL TRENDS:
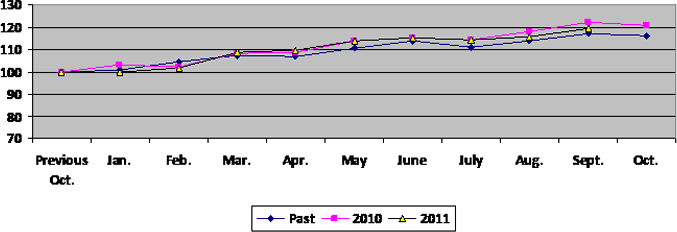
We find it helpful to think about the monthly sequential changes in our business using the analogy of climbing a stairway – This stairway has several predictable landings where there is a pause in the sequential gain (i.e. April, July, and October to December), but generally speaking, climbs from January to October. The October landing then establishes the benchmark for the start of the next year.
History has identified these landings in our business cycle. They generally relate to months with impaired business days (certain holidays). The first landing centers on Easter, which alternates between March and April (Easter occurred in April in both 2011 and 2010), the second landing centers on July 4th, and the third landing centers on the approach of winter with its seasonal impact on primarily our construction business and with the Christmas / New Year holidays. The holidays we noted impact the trends because they either move from month-to-month or because they move around during the week.
The table below shows the pattern to our sequential change in our daily sales. The line labeled ‘Past’ is an historical average of our sequential daily sales change for the period 1998 to 2003. We chose this time frame because it had similar characteristics, a weaker industrial economy in North America, and could serve as a benchmark for a possible trend line. The ‘2010’ and ‘2011’ lines represent our actual sequential daily sales changes. The ‘10Delta’ line is the difference between the ‘Past’ and ‘2010’; similarly, the ‘11Delta’ is the difference between the ‘Past’ and ‘2011’.
| Jan.(1) | Feb. | Mar. | Apr. | May | June | July | Aug. | Sept. | Oct. | |||||||||||||||||||||||||||||||
| Past |
0.9 | % | 3.3 | % | 2.9 | % | -0.3 | % | 3.4 | % | 2.8 | % | -2.3 | % | 2.6 | % | 2.6 | % | -0.7 | % | ||||||||||||||||||||
| 2010 |
2.9 | % | -0.7 | % | 5.9 | % | 0.6 | % | 4.8 | % | 1.7 | % | -1.0 | % | 3.5 | % | 4.5 | % | -1.5 | % | ||||||||||||||||||||
| 10Delta |
2.0 | % | -4.0 | % | 3.0 | % | 0.9 | % | 1.4 | % | -1.1 | % | 1.3 | % | 0.9 | % | 1.9 | % | -0.8 | % | ||||||||||||||||||||
| 2011 |
-0.2 | % | 1.6 | % | 7.0 | % | 0.9 | % | 4.3 | % | 1.7 | % | -1.0 | % | 1.4 | % | 3.4 | % | ||||||||||||||||||||||
| 11Delta |
-1.1 | % | -1.7 | % | 4.1 | % | 1.2 | % | 0.9 | % | -1.1 | % | 1.3 | % | -1.2 | % | 0.8 | % | ||||||||||||||||||||||
| (1) | The January figures represent the percentage change from the previous October, whereas the remaining figures represent the percentage change from the previous month. |
During 2010, and year-to-date in 2011, sales were strong - our business has closely followed the trend line since the fall of 2009. The months of February 2011 and 2010 were both negatively impacted by weather.
A graph of the sequential daily sales change pattern discussed above, starting with a base of ‘100’ in the previous October and ending with the next October, would be as follows:
-14-
Table of Contents
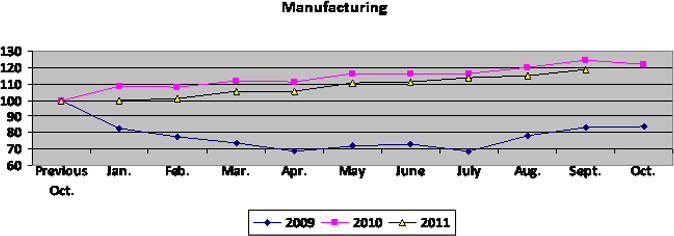
END MARKET PERFORMANCE:
Fluctuations in end market business – The sequential trends noted above were directly linked to fluctuations in our end markets. To place this in perspective – approximately 50% of our business has historically been with customers engaged in some type of manufacturing. The daily sales to these customers grew or contracted in the first, second, third, and fourth quarters (when compared to the same quarter in the previous year), and for the year, as follows:
| Q1 | Q2 | Q3 | Q4 | Annual | ||||||||||||||||
| 2011 |
15.5 | % | 18.5 | % | 18.3 | % | ||||||||||||||
| 2010 |
15.7 | % | 29.8 | % | 30.6 | % | 17.7 | % | 22.4 | % | ||||||||||
| 2009 |
-16.0 | % | -25.2 | % | -22.8 | % | -10.1 | % | -18.8 | % | ||||||||||
The 2011 and 2010 growth was more pronounced in our industrial production business (this is business where we supply products that become part of the finished goods produced by our customers) and less pronounced in the maintenance portion of our manufacturing business (this is business where we supply products that maintain the facility or the equipment of our customers engaged in manufacturing). The 2009 contraction was more severe in our industrial production business and less severe in the maintenance portion of our manufacturing business. These patterns are influenced by the movements noted in the Purchasing Manufacturers Index (‘PMI’) published by the Institute for Supply Management (http://www.ism.ws/), which is a composite index of economic activity in the manufacturing sector. The PMI in 2011, 2010, and 2009 was as follows:
| Jan. | Feb. | Mar. | Apr. | May | June | July | Aug. | Sept. | Oct. | Nov. | Dec. | |||||||||||||||||||||||||||||||||||||
| 2011 |
60.8 | 61.4 | 61.2 | 60.4 | 53.5 | 55.3 | 50.9 | 50.6 | 51.6 | |||||||||||||||||||||||||||||||||||||||
| 2010 |
58.3 | 57.1 | 60.4 | 59.6 | 57.8 | 55.3 | 55.1 | 55.2 | 55.3 | 56.9 | 58.2 | 58.5 | ||||||||||||||||||||||||||||||||||||
| 2009 |
35.7 | 36.0 | 36.6 | 39.9 | 41.9 | 44.7 | 49.0 | 51.4 | 53.2 | 55.8 | 54.7 | 56.4 | ||||||||||||||||||||||||||||||||||||
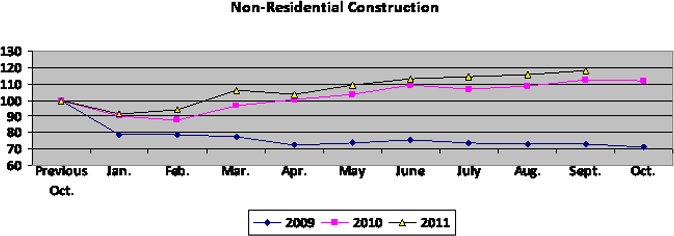
Our non-residential construction customers have historically represented 20% to 25% of our business. The daily sales to these customers grew or contracted in the first, second, third, and fourth quarters (when compared to the same quarter in the previous year), and for the year, as follows:
| Q1 | Q2 | Q3 | Q4 | Annual | ||||||||||||||||
| 2011 |
17.7 | % | 15.8 | % | 15.8 | % | ||||||||||||||
| 2010 |
-14.7 | % | 0.5 | % | 6.3 | % | 10.3 | % | -0.3 | % | ||||||||||
| 2009 |
-6.4 | % | -19.6 | % | -25.3 | % | -24.8 | % | -19.4 | % | ||||||||||
On a sequential basis, the sales to our manufacturing customers stabilized in May 2009 and then started to demonstrate patterns that resemble historical norms. This reversed the negative trend which began in October 2008. This stabilization and improvement was partially offset by continued deteriorization in our non-residential construction business which weakened dramatically in the first eight months of 2009, and then began to also demonstrate patterns that resemble historical norms.
-15-
Table of Contents
A graph of the sequential daily sales trends to these two end markets in 2009, 2010, and 2011, starting with a base of ‘100’ in the previous October and ending with the next October, would be as follows:
-16-
Table of Contents
PATHWAY TO PROFIT AND ITS IMPACT ON OUR BUSINESS:
In April 2007 we disclosed our intention to alter the growth drivers of our business – For most of the preceding ten years, we used store openings as the primary growth driver of our business (our historical rate was approximately 14% new stores each year). As announced in April 2007, we began to add outside sales personnel into existing stores at a faster rate than historical patterns. We funded this sales force expansion with the occupancy savings generated by opening stores at the rate of 7% to 10% per year (see our disclosure below regarding the temporary slowing of our store growth in recent periods). Our goal was four-fold: (1) to continue growing our business at a similar rate with the new outside sales investment model, (2) to grow the sales of our average store to $125 thousand per month in the five year period from 2007 to 2012, (3) to enhance the profitability of the overall business by capturing the natural expense leverage that has historically occurred in our existing stores as their sales grow, resulting in a growth of our pre-tax earnings to 23% of net sales by 2012, and (4) to improve the performance of our business due to the more efficient use of working capital (primarily inventory) as our average sales volume per store increases. The economic weakness that dramatically worsened in the fall of 2008 and continued into 2009 caused us to alter the ‘pathway to profit’ in 2009. These changes centered on two aspects (1) temporarily slowing new store openings to a range of 2% to 5% per year, and (2) temporarily stopping headcount additions except for new store openings and for stores that are growing. (See later discussion on future store openings.)
One side benefit of the ‘pathway to profit’ initiative, described above, is a slow altering of our cost structure to increase the portion of our operating costs that are variable versus fixed. This dramatically improved our ability to manage through the economic environment of the last several years. As discussed in our third quarter 2009 earnings release, we began to stabilize our store headcount in October 2009. (See ‘Store Size, Store Count and Full-Time Equivalent (FTE) Headcount’ table later in this document.)
The ‘pathway to profit’ initiative allows us to focus on the three drivers of our business: (1) sales force headcount, (2) store (or unit) growth, and (3) average sales volume per store, which ultimately drive our level of profitability. Our original goal was to hit the $125 thousand per month store average, and grow our pre-tax earnings to 23% of net sales, by 2012. We previously disclosed that we believed the duration of the economic weakness could delay the timing of when we achieve these goals by 24-30 months. However, as described below, we have modified our thinking regarding our pre-tax earnings goals.
During 2010, we modified our thought process around the ‘pathway to profit’ in two regards: (1) with a structurally lowered cost structure and improved gross margins, we concluded we could hit our profitability target in the ‘pathway to profit’ initiative with average store sales of $100 - $110 thousand per month by 2013 (see evidence of this in our ‘Store Size and Profitability’ table later in this document) and (2) we decided to hire fewer store-based employees and instead added resources focused on specific sales opportunities, such as national accounts personnel and dedicated sales specialists (manufacturing, government, industry focused, and industrial vending solutions). The decision to accelerate the addition of non-store selling resources into the areas of national accounts and dedicated sales specialists reinforces our belief that these areas represent an efficient manner to accelerate sales at existing stores.
Future store openings and increases in automated solutions (industrial vending) – In July 2010, we indicated our intentions to open 80 to 95 new stores during the second half of 2010 (or an annualized rate of 6.8% to 8.0%). During the second half of 2010 we opened 82 stores. For 2011, we previously disclosed our intention to open 150 to 200 new stores, or an annualized rate of 6.0% to 8.0%. In the first nine months of 2011, we opened 94 new stores. As the PMI began to moderate in May 2011 (see table earlier in this document), our field personnel began to slow their store openings. We have opened 94 new stores in the first nine months of 2011; based on this, we now estimate we will open 115 to 125 stores in 2011, or approximately 4.6% to 5.0%. In 2012, we expect to open approximately 4.0% to 6.0% new stores. We believe this is a rational reaction to the ‘moderating’ PMI and due to the good results we are experiencing with our automated solutions (industrial vending) rollout (discussed below). During the first nine months of 2011 and 2010, we closed 18 and seven stores, respectively. We have closed 52 stores in our 40+ year history.
-17-
Table of Contents
As was discussed at our investor day in May 2011, we have made significant progress in the development of automated solutions (industrial vending) for our customers. We believe these solutions have the potential to be transformative to industrial distribution. Some key statistics regarding this business include the following:
| Q1 | Q2 | Q3 | Q4 | |||||||||||||||||
| Number of vending machines in contracts signed during the period1 |
2011 | 1,391 | 2,103 | 2,260 | ||||||||||||||||
| 2010 | 246 | 409 | 419 | 776 | ||||||||||||||||
| 2009 | 106 | 214 | 194 | 327 | ||||||||||||||||
| Cumulative machines installed |
2011 | 2,905 | 4,009 | 5,732 | ||||||||||||||||
| 2010 | 1,144 | 1,452 | 1,803 | 2,195 | ||||||||||||||||
| 2009 | 148 | 312 | 558 | 787 | ||||||||||||||||
| Percent of total net sales to customers with vending machines2 |
2011 | 9.2 | % | 10.8 | % | 13.3 | % | |||||||||||||
| 2010 | 3.8 | % | 5.2 | % | 6.4 | % | 7.7 | % | ||||||||||||
| 2009 | 0.7 | % | 1.2 | % | 1.8 | % | 2.5 | % | ||||||||||||
| Daily sales growth to customers with vending machines3 |
2011 | 49.5 | % | 49.8 | % | 49.4 | % | |||||||||||||
| 2010 | 29.4 | % | 53.5 | % | 54.9 | % | 59.6 | % | ||||||||||||
| 2009 | Not meaningful, due to start-up phase | |||||||||||||||||||
| 1 | This represents the number of machines, not the number of contracts. |
| 2 | The percentage of total sales (vended and traditional) to customers currently using a vending solution. |
| 3 | The growth in total sales (vended and traditional) to customers currently using a vending solution compared to the comparable period in the preceding year. |
In addition to the increases in the number of vending machine contracts signed and the sales results noted, we are pleased with the ramp-up in our ability to install machines. In the third quarter of 2011, we installed 1,723 machines (5,732–4,009), a five-fold increase over the 351 (1,803–1,452) installed in the third quarter of 2010.
Store Count and Full-Time Equivalent (FTE) Headcount – The table that follows highlights certain impacts of the ‘pathway to profit’. Under the ‘pathway to profit’ we increased both our store count and our store FTE headcount during 2007 and 2008. However, as indicated earlier, the rate of increase in store locations slowed and our FTE headcount for all types of personnel was reduced when the economy weakened late in 2008. In the two tables that follow, we refer to our ‘store’ sales, ‘store’ locations, ‘store’ personnel and ‘store’ profitability. When we discuss ‘stores’ in the first table, we are referring to (1) ‘Fastenal’ stores and (2) strategic account stores. ‘Fastenal’ stores are either a ‘traditional’ store, a format utilized typically in North America, or an ‘overseas’ store, which is the typical format outside the United States and Canada. This is discussed in greater detail in our 2010 annual report on Form 10-K. Strategic account stores are stores that are focused on selling to a group of strategic account customers in a limited geographic market. When we discuss in the second table our profitability as the average monthly ‘store’ sales grow, we are referring to ‘traditional’ stores. The sales, outside of our ‘store’ group, relate to either (1) our in-plant locations, (2) our manufacturing business that is sold directly to a customer and not through a store (including our Holo-Krome business acquired in December 2009), or (3) our direct import business.
The breakdown of our sales, the average monthly sales per store, the number of stores at quarter end, the average headcount at our stores during a quarter, the average FTE headcount during a quarter, and the percentage change were as follows for the first quarter of 2007 (the last completed quarter before we began the ‘pathway to profit’), for the third quarter of 2008 (our peak quarter before the economy weakened), and for each of the last five quarters:
-18-
Table of Contents
| Q1 2007 |
Q3 2008 |
Q3 2010 |
Q4 2010 |
Q1 2011 |
Q2 2011 |
Q3 2011 |
||||||||||||||||||||||
| Total net sales reported |
$ | 489,157 | $ | 625,037 | $ | 603,750 | $ | 573,766 | $ | 640,583 | $ | 701,730 | $ | 726,742 | ||||||||||||||
| Less: Non-store sales (approximate) |
40,891 | 57,267 | 76,826 | 68,911 | 78,021 | 85,535 | 88,500 | |||||||||||||||||||||
|
|
|
|
|
|
|
|
|
|
|
|
|
|
|
|||||||||||||||
| Store net sales (approximate) |
$ | 448,266 | $ | 567,770 | $ | 526,924 | $ | 504,855 | $ | 562,562 | $ | 616,195 | $ | 638,242 | ||||||||||||||
|
|
|
|
|
|
|
|
|
|
|
|
|
|
|
|||||||||||||||
| % change since Q1 2007 |
26.7 | % | 17.5 | % | 12.6 | % | 25.5 | % | 37.5 | % | 42.4 | % | ||||||||||||||||
| % change (twelve months) |
17.5 | % | 21.4 | % | 22.3 | % | 25.2 | % | 23.6 | % | 21.1 | % | ||||||||||||||||
| Percentage of sales through a store |
92 | % | 91 | % | 87 | % | 88 | % | 88 | % | 88 | % | 88 | % | ||||||||||||||
| Average monthly sales per store (using ending store count) |
$ | 72 | $ | 82 | $ | 72 | $ | 68 | $ | 74 | $ | 80 | $ | 83 | ||||||||||||||
| % change since Q1 2007 |
13.9 | % | 0.0 | % | -5.6 | % | 2.8 | % | 11.1 | % | 15.3 | % | ||||||||||||||||
| % change (twelve months) |
9.3 | % | 16.1 | % | 17.2 | % | 17.5 | % | 15.9 | % | 15.3 | % | ||||||||||||||||
|
|
|
|
|
|
|
|
|
|
|
|
|
|
|
|||||||||||||||
| Store locations - quarter end count |
2,073 | 2,300 | 2,453 | 2,490 | 2,522 | 2,558 | 2,566 | |||||||||||||||||||||
| % change since Q1 2007 |
11.0 | % | 18.3 | % | 20.1 | % | 21.7 | % | 23.4 | % | 23.8 | % | ||||||||||||||||
| % change (twelve months) |
7.2 | % | 4.3 | % | 5.1 | % | 5.4 | % | 6.3 | % | 4.6 | % | ||||||||||||||||
| Store personnel - absolute headcount |
6,849 | 9,123 | 8,643 | 9,048 | 9,344 | 9,734 | 10,057 | |||||||||||||||||||||
| % change since Q1 2007 |
33.2 | % | 26.2 | % | 32.1 | % | 36.4 | % | 42.1 | % | 46.8 | % | ||||||||||||||||
| % change (twelve months) |
17.9 | % | 0.4 | % | 6.2 | % | 11.2 | % | 15.9 | % | 16.4 | % | ||||||||||||||||
| Store personnel - FTE |
6,383 | 8,280 | 7,450 | 7,611 | 7,825 | 8,254 | 8,629 | |||||||||||||||||||||
| Non-store selling personnel - FTE |
616 | 599 | 639 | 712 | 779 | 850 | 920 | |||||||||||||||||||||
|
|
|
|
|
|
|
|
|
|
|
|
|
|
|
|||||||||||||||
| Sub-total of all sales personnel - FTE |
6,999 | 8,879 | 8,089 | 8,323 | 8,604 | 9,104 | 9,549 | |||||||||||||||||||||
|
|
|
|
|
|
|
|
|
|
|
|
|
|
|
|||||||||||||||
| Distribution and manufacturing personnel-FTE 1 |
1,962 | 2,244 | 2,007 | 2,040 | 2,069 | 2,249 | 2,343 | |||||||||||||||||||||
| Administrative personnel-FTE |
767 | 805 | 726 | 744 | 760 | 783 | 811 | |||||||||||||||||||||
|
|
|
|
|
|
|
|
|
|
|
|
|
|
|
|||||||||||||||
| Sub-total of non-sales personnel - FTE |
2,729 | 3,049 | 2,733 | 2,784 | 2,829 | 3,032 | 3,154 | |||||||||||||||||||||
|
|
|
|
|
|
|
|
|
|
|
|
|
|
|
|||||||||||||||
| Total - average FTE headcount |
9,728 | 11,928 | 10,822 | 11,107 | 11,433 | 12,136 | 12,703 | |||||||||||||||||||||
|
|
|
|
|
|
|
|
|
|
|
|
|
|
|
|||||||||||||||
| % change since Q1 2007 |
||||||||||||||||||||||||||||
| Store personnel - FTE |
29.7 | % | 16.7 | % | 19.2 | % | 22.6 | % | 29.3 | % | 35.2 | % | ||||||||||||||||
| Non-store selling personnel - FTE |
-2.8 | % | 3.7 | % | 15.6 | % | 26.5 | % | 38.0 | % | 49.4 | % | ||||||||||||||||
|
|
|
|
|
|
|
|
|
|
|
|
|
|||||||||||||||||
| Sub-total of all sales personnel - FTE |
26.9 | % | 15.6 | % | 18.9 | % | 22.9 | % | 30.1 | % | 36.4 | % | ||||||||||||||||
|
|
|
|
|
|
|
|
|
|
|
|
|
|||||||||||||||||
| Distribution and manufacturing personnel-FTE 1 |
14.4 | % | 2.3 | % | 4.0 | % | 5.5 | % | 14.6 | % | 19.4 | % | ||||||||||||||||
| Administrative personnel-FTE |
5.0 | % | -5.3 | % | -3.0 | % | -0.9 | % | 2.1 | % | 5.7 | % | ||||||||||||||||
|
|
|
|
|
|
|
|
|
|
|
|
|
|||||||||||||||||
| Sub-total of non-sales personnel - FTE |
11.7 | % | 0.1 | % | 2.0 | % | 3.7 | % | 11.1 | % | 15.6 | % | ||||||||||||||||
|
|
|
|
|
|
|
|
|
|
|
|
|
|||||||||||||||||
| Total - average FTE headcount |
22.6 | % | 11.2 | % | 14.2 | % | 17.5 | % | 24.8 | % | 30.6 | % | ||||||||||||||||
|
|
|
|
|
|
|
|
|
|
|
|
|
|||||||||||||||||
| % change (twelve months) |
||||||||||||||||||||||||||||
| Store personnel - FTE |
15.2 | % | 5.1 | % | 8.6 | % | 11.7 | % | 16.0 | % | 15.8 | % | ||||||||||||||||
| Non-store selling personnel - FTE |
-2.4 | % | 9.0 | % | 19.3 | % | 31.1 | % | 43.8 | % | 44.0 | % | ||||||||||||||||
|
|
|
|
|
|
|
|
|
|
|
|
|
|||||||||||||||||
| Sub-total of all sales personnel - FTE |
13.8 | % | 5.4 | % | 9.5 | % | 13.2 | % | 18.1 | % | 18.0 | % | ||||||||||||||||
|
|
|
|
|
|
|
|
|
|
|
|
|
|||||||||||||||||
| Distribution and manufacturing personnel-FTE 1 |
5.4 | % | 13.8 | % | 15.4 | % | 14.9 | % | 19.4 | % | 16.7 | % | ||||||||||||||||
| Administrative personnel - FTE |
7.9 | % | -1.4 | % | 6.1 | % | 7.6 | % | 10.7 | % | 11.7 | % | ||||||||||||||||
|
|
|
|
|
|
|
|
|
|
|
|
|
|||||||||||||||||
| Sub-total of non-sales personnel - FTE |
6.0 | % | 9.4 | % | 12.8 | % | 12.9 | % | 17.0 | % | 15.4 | % | ||||||||||||||||
|
|
|
|
|
|
|
|
|
|
|
|
|
|||||||||||||||||
| Total - average FTE headcount |
11.7 | % | 6.4 | % | 10.3 | % | 13.2 | % | 17.8 | % | 17.4 | % | ||||||||||||||||
|
|
|
|
|
|
|
|
|
|
|
|
|
|||||||||||||||||
| 1 | The distribution and manufacturing headcount was impacted by the addition of 92 employees with the acquisition of Holo-Krome in December 2009. |
-19-
Table of Contents
Store Size and Profitability – The average age, number of stores, and pre-tax earnings data by store size for the third quarter of 2011, 2010, and 2009, respectively, were as follows:
| Sales per Month |
Average Age (Years) |
Number of Stores |
Percentage of Stores |
Pre-Tax Earnings Percentage |
||||||||||||
| Three months ended September 30, 2011 |
||||||||||||||||
| $0 to $30,000 |
3.5 | 319 | 12.4 | % | -12.6 | % | ||||||||||
| $30,001 to $60,000 |
7.0 | 816 | 31.8 | % | 13.3 | % | ||||||||||
| $60,001 to $100,000 |
9.4 | 712 | 27.7 | % | 22.4 | % | ||||||||||
| $100,001 to $150,000 |
11.7 | 375 | 14.6 | % | 26.5 | % | ||||||||||
| Over $150,000 |
14.9 | 257 | 10.0 | % | 28.5 | % | ||||||||||
| Strategic Account/Overseas Store |
87 | 3.4 | % | |||||||||||||
|
|
|
|
|
|
|
|||||||||||
| Company Total |
2,566 | 100.0 | % | 21.4 | % | |||||||||||
|
|
|
|
|
|
|
|||||||||||
| Three months ended September 30, 2010 |
||||||||||||||||
| $0 to $30,000 |
3.8 | 414 | 16.9 | % | -11.0 | % | ||||||||||
| $30,001 to $60,000 |
6.8 | 893 | 36.4 | % | 13.2 | % | ||||||||||
| $60,001 to $100,000 |
9.4 | 590 | 24.1 | % | 22.7 | % | ||||||||||
| $100,001 to $150,000 |
11.8 | 322 | 13.1 | % | 26.0 | % | ||||||||||
| Over $150,000 |
15.6 | 163 | 6.6 | % | 27.7 | % | ||||||||||
| Strategic Account/Overseas Store |
71 | 2.9 | % | |||||||||||||
|
|
|
|
|
|
|
|||||||||||
| Company Total |
2,453 | 100.0 | % | 20.0 | % | |||||||||||
|
|
|
|
|
|
|
|||||||||||
| Three months ended September 30, 2009 |
||||||||||||||||
| $0 to $30,000 |
3.9 | 529 | 22.5 | % | -17.7 | % | ||||||||||
| $30,001 to $60,000 |
6.5 | 912 | 38.8 | % | 9.9 | % | ||||||||||
| $60,001 to $100,000 |
9.5 | 518 | 22.0 | % | 20.0 | % | ||||||||||
| $100,001 to $150,000 |
11.9 | 229 | 9.7 | % | 24.5 | % | ||||||||||
| Over $150,000 |
16.1 | 103 | 4.4 | % | 26.5 | % | ||||||||||
| Strategic Account/Overseas Store |
61 | 2.6 | % | |||||||||||||
|
|
|
|
|
|
|
|||||||||||
| Company Total |
2,352 | 100.0 | % | 15.7 | % | |||||||||||
|
|
|
|
|
|
|
|||||||||||
Note – Amounts may not foot due to rounding difference.
Our original intent under the ‘pathway to profit’ was to increase the sales of our average store to approximately $125,000 per month (see earlier discussion) in order to meet our pre-tax earnings profitability goal of 23%. This would have shifted the store mix emphasis from the first three categories ($0 to $30,000, $30,001 to $60,000, and $60,001 to $100,000) to the last three categories ($60,001 to $100,000, $100,001 to $150,000, and over $150,000), and we believe would have allowed us to leverage our fixed cost and increase our overall productivity. Our goal today is to continue (1) to grow the business and (2) to grow our pre-tax earnings as a percent of net sales. As stated earlier, we now believe, based on the profitability improvements noted in the table above, we can hit our pre-tax earnings percent goal of 23% with average store sales of approximately $100,000 - $110,000 per month.
Note – Dollar amounts in this section are presented in whole dollars, not thousands.
-20-
Table of Contents
STATEMENT OF EARNINGS INFORMATION (percentage of net sales) for the periods ended September 30:
| Nine-month period | Three-month period | |||||||||||||||
| 2011 | 2010 | 2011 | 2010 | |||||||||||||
| Net sales |
100.0 | % | 100.0 | % | 100.0 | % | 100.0 | % | ||||||||
| Gross profit |
52.1 | % | 51.7 | % | 51.9 | % | 51.8 | % | ||||||||
| Operating and administrative expenses |
31.1 | % | 32.6 | % | 30.6 | % | 31.8 | % | ||||||||
| Loss (gain) on sale of property and equipment |
0.0 | % | 0.0 | % | 0.0 | % | 0.0 | % | ||||||||
|
|
|
|
|
|
|
|
|
|||||||||
| Operating income |
21.0 | % | 19.1 | % | 21.4 | % | 20.0 | % | ||||||||
|
|
|
|
|
|
|
|
|
|||||||||
| Interest income |
0.0 | % | 0.0 | % | 0.0 | % | 0.0 | % | ||||||||
|
|
|
|
|
|
|
|
|
|||||||||
| Earnings before income taxes |
21.0 | % | 19.1 | % | 21.4 | % | 20.0 | % | ||||||||
|
|
|
|
|
|
|
|
|
|||||||||
Note – Amounts may not foot due to rounding difference.
Gross profit percentage for the first nine months of 2011 increased from the same period in 2010. Sequentially, the gross profit for the third quarter of 2011 declined from the second quarter of 2011.
The gross profit percentage in the first, second, third and fourth quarters was as follows:
| Q1 | Q2 | Q3 | Q4 | |||||||||||||
| 2011 |
52.0 | % | 52.2 | % | 51.9 | % | ||||||||||
| 2010 |
51.1 | % | 52.1 | % | 51.8 | % | 52.0 | % | ||||||||
| 2009 |
52.9 | % | 51.1 | % | 50.0 | % | 49.9 | % | ||||||||
The fluctuations in our gross profit percentages are typically driven by: (1) transactional gross profit, (2) organizational gross profit, and (3) vendor incentive gross profit. The transactional gross profit represents the gross profit realized due to the day-to-day fluctuations in customer pricing relative to product and freight costs. This component was negatively influenced by the competitive landscape in 2009 which depressed the prices we could charge for our products. This component has generally improved since August 2009, except for customer mix which is discussed later. The organizational gross profit represents the component of gross profit we attribute to buying scale and efficiency gains. This component was negatively influenced by deflationary impacts in 2009 as we were selling inventory sourced at peak costs late in 2008. This component was magnified in 2009 due to the nature of our inventory turns and the dramatic decrease in sales activity during much of the year. However, this component improved in 2010, and in the first nine months of 2011, when compared to the fourth quarter of 2009. The third component relates to vendor volume allowances. The gross profit dollars associated with this component dropped dramatically in the second half of 2009. However, this component improved in 2010, and in the first nine months of 2011, when compared to the fourth quarter of 2009.
The slight decrease in the gross profit percentage, from the second quarter of 2010 to the third and fourth quarters of 2010 and the first and third quarters of 2011, was primarily caused by the strong growth of our industrial production business, which resulted in a change in our overall business mix. The industrial production business has a lower gross margin; therefore, the change in mix pulled our gross margin percentage down. However, since the operating expenses of our industrial production business are lower, operating income produced by that business is similar to our overall business. The increase from the first quarter of 2011 to the second quarter was primarily due to improvements in organizational gross profit and in vendor volume allowances. A portion of the transactional and organizational gross profit dropped from the second to the third quarter of 2011 due to the earlier mentioned strength in the industrial production business. As we indicated in our second quarter 2010 earnings release, vendor volume allowances largely recovered during the second quarter of 2010 to the levels in place in 2008 and in early 2009 due to the reset of vendor allowance programs which tend to be calendar based. Generally speaking, the decline in the gross margin percentage from 2008 to 2009 was evenly split between a deterioration in the three components
-21-
Table of Contents
discussed earlier. The improvement from 2009 to 2010 was primarily related to improvements in vendor incentive gross profit (about half of the improvement), with the balance evenly split between improvements in organizational gross profit and transactional gross profit. This improvement split is also true in the first nine months of 2011 when compared to the same period in 2010.
Operating and administrative expenses improved relative to sales in the third quarter of 2011 versus the third quarter of 2010.
Historically, 65% to 70% of our operating and administrative expenses consist of employee related costs. The components are: (1) payroll (which includes cash compensation, stock option expense, and profit sharing), (2) health care, (3) personnel development, and (4) social taxes. During 2009, these components had reduced to a range between 60% and 65% due to the factors noted below. During the first nine months of 2011 and during all of 2010, this range moved back to the historical level.
The two largest components of employee related costs grew/contracted as follows for the periods ended September 30:
| Nine-month period | Three-month period | |||||||||||||||
| 2011 | 2010 | 2011 | 2010 | |||||||||||||
| Payroll cost |
22.4 | % | 12.9 | % | 17.4 | % | 29.2 | % | ||||||||
| Health care cost |
3.9 | % | 2.5 | % | 3.0 | % | -7.4 | % | ||||||||
The two largest components of operating and administrative expenses, outside of the employee related costs, grew/contracted as follows for the periods ended September 30:
| Nine-month period | Three-month period | |||||||||||||||
| 2011 | 2010 | 2011 | 2010 | |||||||||||||
| Occupancy |
8.1 | % | 4.2 | % | 8.5 | % | 9.4 | % | ||||||||
| Selling transportation |
23.7 | % | -2.1 | % | 32.4 | % | -7.0 | % | ||||||||
The increase in payroll costs during the first nine months of 2011 and 2010 noted above was greater than the change in full-time equivalent headcount noted earlier in this document. This was driven by the following factors: (1) sales commissions earned grew (this increase is amplified by sales growth and gross margin fluctuations, both of which have a meaningful impact on the commissions earned), (2) total bonuses earned increased due to our profit growth, (3) hours worked per employee grew, and (4) our profit sharing contribution grew.
Our health care costs in the first nine months of 2011 increased from the same period in 2010. Our health care costs in the third quarter of 2010 decreased from the unusual peak in the same period of 2009. Health care costs in 2009, and the first quarter of 2010, increased dramatically due to the increase in the percentage of employees opting for expanded coverage as their spouses lost their insurance coverage at other employers, increases in COBRA costs due to changes in federal funding within COBRA, and an increase in health care utilization when compared to previous years.
The two largest components of the remaining costs within our operating and administrative expenses include occupancy and selling transportation. Occupancy expenses for the third quarter of 2011 increased from the third quarter of 2010 and increased from the second quarter of 2011. The increase from 2010 was driven by (1) a meaningful increase in utilities and (2) a dramatic increase in the amount of automated solutions (industrial vending) equipment as discussed earlier in this release. (We consider the vending equipment to be a logical extension of our store operation and classify the expense as occupancy.) The selling transportation costs consist primarily of our store fleet as most of the distribution fleet costs are included in cost of sales. Selling transportation costs included in operating and administrative expenses for the third quarter of 2011 increased from the third quarter of 2010, a sharp contrast to the prior year’s trend. Most of the components of selling transportation costs increased at a rate less than sales growth, with one exception, the fuel component increased more than sales growth in 2011. This was driven by the increase in per gallon fuel costs discussed below.
-22-
Table of Contents
The last several years have seen meaningful swings in the cost of diesel fuel and gasoline – During the first, second, and third quarters of 2011, our total vehicle fuel costs were approximately $8.6, $10.5, and $9.8 million, respectively. During the first, second, third, and fourth quarters of 2010, our total vehicle fuel costs were approximately $6.4 million, $6.8 million, $6.6 million, and $7.1 million, respectively. The changes resulted from variations in fuel costs, variations in the service levels provided to our stores from our distribution centers, and changes in the number of vehicles at our store locations. These fuel costs include the fuel utilized in our distribution vehicles (semi-tractors, straight trucks, and sprinter trucks) which is recorded in cost of goods and the fuel utilized in our store delivery vehicles which is included in operating and administrative expenses (the split in the last several years has been approximately 50:50 between distribution and store use).
The average per gallon fuel costs (in actual dollars) and the percentage change (on a year-over-year basis) for the last three years was as follows:
| Per gallon average price |
Q1 | Q2 | Q3 | Q4 | ||||||||||||
| 2011 price |
||||||||||||||||
| Diesel fuel |
$ | 3.60 | 4.04 | 3.90 | ||||||||||||
| Gasoline |
$ | 3.22 | 3.78 | 3.62 | ||||||||||||
| 2010 price |
||||||||||||||||
| Diesel fuel |
$ | 2.89 | 3.06 | 2.96 | 3.14 | |||||||||||
| Gasoline |
$ | 2.68 | 2.80 | 2.71 | 2.84 | |||||||||||
| 2009 price |
||||||||||||||||
| Diesel fuel |
$ | 2.19 | 2.29 | 2.61 | 2.70 | |||||||||||
| Gasoline |
$ | 1.86 | 2.25 | 2.55 | 2.54 | |||||||||||
| Per gallon price change |
Q1 | Q2 | Q3 | Q4 | ||||||||||||
| 2011 change |
||||||||||||||||
| Diesel fuel |
24.6 | % | 32.0 | % | 31.8 | % | ||||||||||
| Gasoline |
20.1 | % | 35.0 | % | 33.6 | % | ||||||||||
| 2010 change |
||||||||||||||||
| Diesel fuel |
32.0 | % | 33.6 | % | 13.4 | % | 16.3 | % | ||||||||
| Gasoline |
44.1 | % | 24.4 | % | 6.3 | % | 11.8 | % | ||||||||
Income taxes – Incomes taxes, as a percentage of earnings before income taxes, were approximately 37.7% and 38.1% for the third quarter of 2011 and 2010, respectively. As our international business and profits grow over time, the lower income tax rates in those jurisdictions have begun to lower our effective tax rate. Absent any discrete events, we currently estimate an effective income tax rate of approximately 37.9% for 2011.
-23-
Table of Contents
WORKING CAPITAL:
The year-over-year comparison and the related dollar and percentage changes related to accounts receivable and inventories were as follows:
| Balance at September 30: | Twelve Month Dollar Change |
Twelve Month Percentage Change |
||||||||||||||||||||||||||
| 2011 | 2010 | 2009 | 2011 | 2010 | 2011 | 2010 | ||||||||||||||||||||||
| Accounts receivable, net |
$ | 361,075 | 301,721 | 239,323 | 59,354 | 62,398 | 19.7 | % | 26.1 | % | ||||||||||||||||||
| Inventories |
$ | 618,149 | 546,063 | 498,106 | 72,086 | 47,957 | 13.2 | % | 9.6 | % | ||||||||||||||||||
| Sales in last two months |
$ | 504,398 | 413,053 | 328,804 | 91,345 | 84,249 | 22.1 | % | 25.6 | % | ||||||||||||||||||
The growth in accounts receivable noted above is driven by our sales growth in the final two months of the period. The strong growth in recent years with our international business and with large customer accounts has created some difficulty with managing the growth of accounts receivable relative to the growth in sales.
Our growth in inventory balances over time does not have as direct a relationship to our monthly sales patterns as does our growth in accounts receivable. This is impacted by other aspects of our business. For example, the dramatic economic slowdown in late 2008 and early 2009 caused our inventory to spike. This occurred because the lead time for inventory procurement is typically longer than the visibility we have into future monthly sales patterns. Over the last decade, we increased our relative inventory levels due to the following: (1) new store openings, (2) expanded stocking breadth at individual stores, (3) expanded stocking breadth at our distributions centers (for example, our master stocking hub in Indianapolis expanded its product breadth over six fold from 2006 to 2011), (4) expanded direct sourcing, (5) expanded private label brands, and, more recently, (6) expanded vending solutions. We believe these were excellent investments for our business. These investments have, and we believe will continue to, leverage our sales growth.
The discussion above covers inventory from a longer perspective; in more recent quarters, our expanding inventories are also related to (1) our expanding sales growth trends (with emphasis on our large account business – both OEM and MRO), (2) our confidence in their sustainability, (3) international expansion, and in recent months, (4) some inflation. However, this expansion has been at a rate less than sales growth which has allowed us to improve our inventory utilization.
BALANCE SHEET AND CASH FLOW:
Our balance sheet continues to be very strong and our operations have good cash generating characteristics. During the third quarter of 2011, we generated $92,904 (or 96.0% of net earnings) of operating cash flow; year-to-date, we generated $194,181 (or 71.8% of net earnings) of operating cash flow. Our first quarter typically has stronger cash flow characteristics due to the timing of tax payments; this benefit reverses itself in the second, third, and fourth quarters as income tax payments go out in April, June, September, and December. The remaining amounts of cash flow from operating activities are largely linked to the pure dynamics of a distribution business and its strong correlation to working capital as discussed above.
The strong free cash flow (operating cash flow less net capital expenditures) during 2010 and 2011 allowed us to increase our aggregate dividends in 2011. We paid our regular semi-annual dividend in the first quarter; subsequent to this, we declared and paid our ‘first’ second quarter dividend. With this payment, our board of directors indicated their desire to begin paying quarterly dividends. Our dividends (per share basis) were as follows in 2011:
| 2011 | ||||
| First quarter |
$ | 0.25 | ||
| Second quarter |
$ | 0.13 | ||
| Third quarter |
$ | 0.13 | ||
| Fourth quarter* |
$ | 0.14 | ||
|
|
|
|||
| Total |
$ | 0.65 | ||
|
|
|
|||
| * | The fourth quarter dividend was declared on October 12, 2011, with a payment date of November 22, 2011. |
-24-
Table of Contents
STOCK REPURCHASE:
We did not purchase any stock in 2010 or in the first nine months of 2011. We currently have authority to purchase up to 1,800,000 shares.
CRITICAL ACCOUNTING POLICIES:
A discussion of the critical accounting policies related to accounting estimates is contained in our 2010 annual report on Form 10-K.
LIQUIDITY AND CAPITAL RESOURCES:
Cash flow activity in dollars and as a percentage of net earnings was as follows:
| Nine-month period | ||||||||
| 2011 | 2010 | |||||||
| Net cash provided by operating activities |
$ | 194,181 | 166,293 | |||||
| Net cash used in investing activities |
$ | 84,276 | 38,366 | |||||
| Net cash used in financing activities |
$ | 141,907 | 120,893 | |||||
| Net cash provided by operating activities |
71.8 | % | 83.1 | % | ||||
| Net cash used in investing activities |
31.2 | % | 19.2 | % | ||||
| Net cash used in financing activities |
52.5 | % | 60.4 | % | ||||
Net cash provided by operating activities increased from the prior year. This increase was driven by the expansion of both our absolute and relative profitability from 2010 to 2011 and the expected impact of that expansion on the working capital of a distribution business. These would include: accounts receivable changes, inventory and related accounts payable changes, and finally accrued expense and income tax payable changes.
Net cash used in investing activities changed primarily due to changes in capital expenditures and short-term investments. Property and equipment expenditures in the first nine months of 2011 consisted of: (1) the purchase of software and hardware for Fastenal’s information processing systems, (2) the addition of certain pickup trucks, (3) the purchase of signage, shelving, and other fixed assets related to store openings, (4) the addition of manufacturing and warehouse equipment, (5) the expansion or improvement of certain owned or leased store properties, (6) the expansion of Fastenal’s distribution/trucking fleet, (7) the capital improvements to our new manufacturing property in Connecticut to support our new Holo-Krome business into the future, (8) the expansion of our Indianapolis, Indiana master distribution center, (9) the expansion of our Winona, Minnesota distribution center, and (10) purchases related to our automated solutions (industrial vending). Of these factors, the industrial vending increases created the greatest impact to our capital expenditures in the first nine months of 2011. Property and equipment expenditures in the same period of 2010 consisted of these same types of items (excluding item (9)). Disposals of property and equipment in both periods consisted of the planned disposition of certain pickup trucks, semi-tractors, and trailers in the normal course of business and the disposition of real estate relating to several store locations.
Cash requirements for property and equipment expenditures were satisfied from net earnings, cash on hand, and the proceeds of disposals. We anticipate funding our current expansion plans with cash generated from operations, from available cash and cash equivalents, and, to a lesser degree, from our borrowing capacity.
Net cash used in financing activities consisted of the payment of dividends.
A discussion of the nature and amount of future cash commitments is contained in our 2010 annual report on Form 10-K.
-25-
Table of Contents
ITEM 2 – (Continued)
Certain Risks and Uncertainties— This report contains statements that are not historical in nature and that are intended to be, and are hereby identified as, “forward-looking statements” under the Private Securities Litigation Reform Act of 1995, including statements regarding (1) the goals of our long-term growth strategy, ‘pathway to profit’, including anticipated decreases in the rate of new store openings from our historic rate prior to implementation of the strategy, planned additions to our sales personnel, the expected funding of such additions out of cost savings resulting from the slowing of the rate of new store openings, the growth in average store sales expected to result from that strategy and from our recent decision to add resources focused on specific sales opportunities and the expected timeline for achieving that growth, the leverage, working capital and productivity improvements expected to result from the strategy, and the growth in profitability expected to result from the strategy and the expected timeline for achieving that growth (including our belief that we can achieve targeted profitability due to a structural lowering of our costs even if our average store sales do not grow as expected), (2) the expected rate of new store openings, (3) our belief in the transformative nature of automated solutions (industrial vending), (4) our estimated effective tax rate for 2011, (5) the sales growth leverage expected to result from our inventory investments, (6) our expectations regarding sales growth and our confidence in the sustainability of that growth, (7) our board’s intent to pay quarterly dividends in the future, (8) the funding of our expansion plans, (9) our expectation that total unrecognized tax benefits will not change significantly during the next twelve months, (10) the expected unrecognized compensation expense related to stock options, and (11) our expectations regarding the litigation disclosed in this report. The following factors are among those that could cause the Company’s actual results to differ materially from those predicted in such forward-looking statements: (1) a downturn or continued weakness in the economy or in the manufacturing or commercial construction industries, changes in the expected rate of new store openings, difficulties in successfully attracting and retaining additional qualified sales personnel, an inability to realize anticipated savings from lowering our cost structure, and difficulties in changing our sales process could adversely impact our ability to achieve the goals of our ‘pathway to profit’ initiative and the expected time frame for achieving those goals, (2) a downturn or continued weakness in the economy or in the manufacturing or commercial construction industries, a change from that projected in the number of North American markets able to support stores, or an inability to recruit and retain qualified employees could cause the rate of new store openings to change from that expected, (3) a weaker level of industry acceptance or adoption of the vending technology from what we are currently experiencing could cause the automated solutions to be less transformative than expected, (4) a change in the geographic source of our income or a change in tax legislation could cause our effective tax rate for 2011 to differ from current expectations, (5) a decision to stock a greater amount of safety stock (extra units of inventory carried as protection against possible stock outs) or to expand product offerings in the various geographic areas in which we operate could cause sales growth leverage expected to result from our inventory investments not to occur, (6) a downturn or continued weakness in the economy or in the manufacturing or commercial construction industries could affect our ability to sustain our sales growth, (7) changes in our financial condition or results of operations could cause our board to modify our expected future dividend practices, (8) a change in our ability to generate free cash flow resulting from a slowdown in our sales or our inability to manage expenses could negatively impact the funding of our expansion plans, (9) changes in tax law or changes in the interpretation of tax law at the federal, state or local level could impact our expectation about total unrecognized tax benefits during the next twelve months, (10) an unexpected change in forfeiture rates due to demotion or turnover could impact the unrecognized compensation expense related to stock options, and (11) our expectations about the litigation disclosed in this report may be impacted by the disclosure of currently unknown facts and other uncertainties in the litigation including the possible expansion of claims brought by the claimants beyond those currently raised. A discussion of other risks and uncertainties which could cause our operating results to vary from anticipated results or which could materially adversely effect our business, financial condition, or operating results is included in our 2010 annual report on Form 10-K under the sections captioned Certain Risks and Uncertainties and Item 1A – Risk Factors. We assume no obligation to update any forward-looking statements or any discussions of risks and uncertainties.
-26-
Table of Contents
ITEM 3 – QUANTITATIVE AND QUALITATIVE DISCLOSURES ABOUT MARKET RISK
We are exposed to certain market risks from changes in interest rates, foreign currency exchange rates, commodity steel pricing, and commodity fuel prices. Changes in these factors cause fluctuations in our earnings and cash flows. We evaluate and manage exposure to these market risks as follows:
Interest Rates— We have a line of credit totaling $8 million which expires on August 4, 2012. The line bears interest at 0.9% over the LIBOR rate. During the quarter ended September 30, 2011, there was $0 outstanding on the line. We pay no fee for the unused portion of the line of credit.
Foreign Currency Exchange Rates— Foreign currency fluctuations can affect our net investments and earnings denominated in foreign currencies. Our primary exchange rate exposure is with the Canadian dollar against the United States dollar. There was a meaningful drop in the value of the Canadian dollar relative to the United States dollar in September 2011. Our estimated net earnings exposure for foreign currency exchange rates was not material at September 30, 2011.
Commodity Steel Pricing— We buy and sell various types of steel products; these products consist primarily of different types of threaded fasteners. During the last decade, there has been nominal movement in overall steel pricing, with some deflation occurring in the wake of the economic crisis of the Far East markets that occurred in the late 1990’s. This trend reversed to inflation in the period from late 2003 to the early part of 2005 and again from mid 2007 to the fall of 2008. This flipped to deflation in the fall of 2008 and during most of 2009 and became largely neutral to minimal inflation as we moved through 2010 and into the first nine months of 2011. We are exposed to the impacts of commodity steel pricing and our related ability to pass through the impacts to our end customers.
Commodity Fuel Prices— We have market risk for changes in gasoline and diesel fuel costs. Historically this risk has been mitigated over time by our ability to pass freight costs to our customers and the efficiency of our trucking distribution network.
ITEM 4 – CONTROLS AND PROCEDURES
Evaluation of Disclosure Controls and Procedures— As of the end of the period covered by this report, we conducted an evaluation, under the supervision and with the participation of the principal executive officer and principal financial officer of Fastenal, of our disclosure controls and procedures (as defined in Rules 13a-15(e) and 15d-15(e) under the Securities Exchange Act of 1934 (the “Exchange Act”)). Based on this evaluation, the principal executive officer and principal financial officer concluded that our disclosure controls and procedures are effective to ensure that information required to be disclosed by us in reports that we file or submit under the Exchange Act is recorded, processed, summarized and reported within the time periods specified in SEC rules and forms and is accumulated and communicated to our management, including the principal executive officer and principal financial officer, to allow for timely decisions regarding disclosure. There was no change in our internal control over financial reporting during our most recently completed fiscal quarter that has materially affected, or is reasonably likely to materially affect, our internal control over financial reporting.
-27-
Table of Contents
In early February 2010, we received a letter from a California fastener supplier dated January 26, 2010. This letter threatened to sue us for an alleged violation of an exclusive distribution arrangement this supplier believes exists between our organizations. In addition to the letter, this supplier provided a press release and a video regarding the claim that they threatened to make public unless we agreed to mediation of the claim. Shortly after receipt of this letter, we performed a preliminary internal review to understand (1) who this supplier was and (2) the nature of our relationship with this supplier. Based on that review, we determined that this supplier manufactures a niche type of fastener and that the total volume of purchases by us, from all suppliers, over the purported term of the alleged exclusivity arrangement of this niche type of fastener did not exceed $1 million. Following completion of our preliminary internal review, we requested additional information and documentation from the supplier. The supplier’s response failed to provide the requested information and documentation. By letter dated February 26, 2010, we quantified for the supplier our total volume of purchases as discussed above and informed the supplier that we believed their claim was grossly exaggerated and completely unsupported. We have not received any direct response to our February 26, 2010 letter. On May 3, 2010, this supplier filed suit in Arkansas federal court alleging damages. In response, we filed a motion to dismiss. This motion to dismiss was denied on August 16, 2010. We subsequently filed two motions for summary judgment. The first summary judgment motion was partially denied.
On August 24, 2011, the court issued an order granting Fastenal’s second motion for summary judgment in its entirety. On September 8, 2011, this supplier filed an appeal in connection with the order granting Fastenal’s second motion for summary judgment. Based on current information, we believe the prospect that we will incur a material liability as a result of this claim is remote. While we are not required to disclose this matter under the rules of the Securities and Exchange Commission, we initially disclosed the existence of this threat in February 2010 (in our 2009 annual report on Form 10-K) as we believed that disclosure was prudent due to the alleged amount ($180 million) of the claim and the threat to make these allegations public.
We are affected by risks specific to us as well as factors that affect all businesses operating in a global market. The significant factors known to us that could materially adversely affect our business, financial condition, or operating results are described in Item 2 of Part I above and in our most recently filed annual report on Form 10-K under Certain Risks and Uncertainties and Item 1A – Risk Factors. There has been no material change in those risk factors.
-28-
Table of Contents
| 3.1 | Restated Articles of Incorporation of Fastenal Company, as amended effective as of May 20, 2011 (incorporated by reference to Exhibit 3.1 to Fastenal Company’s Form 10-Q for the quarter ended March 31, 2011) | |
| 3.2 | Restated By-Laws of Fastenal Company (incorporated by reference to Exhibit 3.2 to Fastenal Company’s Form 8-K dated as of October 15, 2010) | |
| 31 | Certifications under Section 302 of the Sarbanes-Oxley Act of 2002 | |
| 32 | Certification under Section 906 of the Sarbanes-Oxley Act of 2002 | |
| 101 | The following financial statements from Fastenal Company’s Quarterly Report on Form 10-Q for the quarter ended September 30, 2011, filed on October 26, 2011, formatted in Extensible Business Reporting Language (XBRL): (i) Consolidated Statements of Earnings, (ii) Consolidated Balance Sheets, (iii) Consolidated Statements of Cash Flows, and (iv) the Notes to Consolidated Financial Statements. | |
-29-
Table of Contents
SIGNATURES
Pursuant to the requirements of the Securities Exchange Act of 1934, the registrant has duly caused this report to be signed on its behalf by the undersigned thereunto duly authorized.
| FASTENAL COMPANY | ||||||
| /s/ Willard D. Oberton | ||||||
| (Willard D. Oberton, Chief Executive Officer) | ||||||
| (Duly Authorized Officer) | ||||||
| Date October 26, 2011 | /s/ Daniel L. Florness | |||||
| (Daniel L. Florness, Chief Financial Officer) | ||||||
| (Principal Financial Officer) | ||||||
-30-
Table of Contents
INDEX TO EXHIBITS
| 3.1 | Restated Articles of Incorporation of Fastenal Company, as amended effective as of May 20, 2011 | (Incorporated by reference to Exhibit 3.1 to Fastenal Company’s Form 10-Q for the quarter ended March 31, 2011) | ||
| 3.2 | Restated By-Laws of Fastenal Company | (Incorporated by reference to Exhibit 3.2 to Fastenal Company’s Form 8-K dated as of October 15, 2010) | ||
| 31 | Certifications under Section 302 of the Sarbanes-Oxley Act of 2002 | Electronically Filed | ||
| 32 | Certification under Section 906 of the Sarbanes-Oxley Act of 2002 | Electronically Filed | ||
| 101.INS | XBRL Instance Document | Electronically Filed | ||
| 101.SCH | XBRL Taxonomy Extension Schema Document | Electronically Filed | ||
| 101.CAL | XBRL Taxonomy Extension Calculation Linkbase Document | Electronically Filed | ||
| 101.DEF | XBRL Taxonomy Extension Definition Linkbase Document | Electronically Filed | ||
| 101.LAB | XBRL Taxonomy Extension Label Linkbase Document | Electronically Filed | ||
| 101.PRE | XBRL Taxonomy Extension Presentation Linkbase Document | Electronically Filed | ||