Attached files
| file | filename |
|---|---|
| EX-32 - SECTION 906 CEO AND CFO CERTIFCATION - FASTENAL CO | fast63015ex_32.htm |
| EX-31 - SECTION 302 CEO AND CFO CERTIFICATION - FASTENAL CO | fast63015ex_31.htm |
UNITED STATES
SECURITIES AND EXCHANGE COMMISSION
WASHINGTON, D.C. 20549
FORM 10-Q
(Mark One)
ý | Quarterly report pursuant to Section 13 or 15(d) of the Securities Exchange Act of 1934 |
For the quarterly period ended June 30, 2015, or
¨ | Transition report pursuant to Section 13 or 15(d) of the Securities Exchange Act of 1934 |
For the transition period from to
Commission file number 0-16125
FASTENAL COMPANY
(Exact name of registrant as specified in its charter)
Minnesota | 41-0948415 | |
(State or other jurisdiction of incorporation or organization) | (I.R.S. Employer Identification No.) | |
2001 Theurer Boulevard Winona, Minnesota | 55987-1500 | |
(Address of principal executive offices) | (Zip Code) | |
(507) 454-5374
(Registrant’s telephone number, including area code)
Not Applicable
(Former name, former address and former fiscal year, if changed since last report)
Indicate by check mark whether the registrant: (1) has filed all reports required to be filed by Section 13 or 15(d) of the Securities Exchange Act of 1934 during the preceding 12 months (or for such shorter period that the registrant was required to file such reports), and (2) has been subject to such filing requirements for the past 90 days. Yes ý No ¨
Indicate by check mark whether the registrant has submitted electronically and posted on its corporate Web site, if any, every Interactive Data File required to be submitted and posted pursuant to Rule 405 of Regulation S-T (§ 232.405 of this chapter) during the preceding 12 months (or for such shorter period that the registrant was required to submit and post such files.) Yes ý No ¨
Indicate by check mark whether the registrant is a large accelerated filer, an accelerated filer, a non-accelerated filer, or a smaller reporting company. See definition of “large accelerated filer”, “accelerated filer”, and “smaller reporting company" in Rule 12b-2 of the Exchange Act.
Large Accelerated Filer | ý | Accelerated Filer | ¨ | |||
Non-accelerated Filer | ¨ (Do not check if a smaller reporting company) | Smaller Reporting Company | ¨ | |||
Indicate by check mark whether the registrant is a shell company (as defined in Rule 12b-2 of the Exchange Act). Yes ¨ No ý
Indicate the number of shares outstanding of each of the issuer’s classes of common stock, as of the last practicable date.
Class | Outstanding at July 13, 2015 | |
Common Stock, par value $.01 per share | 290,165,109 | |
FASTENAL COMPANY
INDEX
Page No. | |
PART I — FINANCIAL INFORMATION
ITEM 1 — FINANCIAL STATEMENTS
FASTENAL COMPANY AND SUBSIDIARIES
Condensed Consolidated Balance Sheets
(Amounts in thousands except share information)
(Unaudited) | ||||||
Assets | June 30, 2015 | December 31, 2014 | ||||
Current assets: | ||||||
Cash and cash equivalents | $ | 121,166 | 114,496 | |||
Trade accounts receivable, net of allowance for doubtful accounts of $12,178 and $12,619, respectively | 537,650 | 462,077 | ||||
Inventories | 876,697 | 869,224 | ||||
Deferred income tax assets | 20,653 | 21,765 | ||||
Other current assets | 107,207 | 115,703 | ||||
Total current assets | 1,663,373 | 1,583,265 | ||||
Property and equipment, less accumulated depreciation | 805,854 | 763,889 | ||||
Other assets, net | 11,705 | 11,948 | ||||
Total assets | $ | 2,480,932 | 2,359,102 | |||
Liabilities and Stockholders’ Equity | ||||||
Current liabilities: | ||||||
Line of credit, current | $ | 79,575 | 90,000 | |||
Accounts payable | 133,472 | 103,909 | ||||
Accrued expenses | 182,397 | 174,002 | ||||
Income taxes payable | 1,132 | 7,442 | ||||
Total current liabilities | 396,576 | 375,353 | ||||
Line of credit, noncurrent | 250,425 | — | ||||
Deferred income tax liabilities | 69,947 | 68,532 | ||||
Stockholders' equity: | ||||||
Preferred stock, 5,000,000 shares authorized | — | — | ||||
Common stock, 400,000,000 shares authorized, 290,149,384 and 295,867,844 shares issued and outstanding, respectively | 2,902 | 2,959 | ||||
Additional paid-in capital | 2,934 | 33,744 | ||||
Retained earnings | 1,781,645 | 1,886,350 | ||||
Accumulated other comprehensive loss | (23,497 | ) | (7,836 | ) | ||
Total stockholders' equity | 1,763,984 | 1,915,217 | ||||
Total liabilities and stockholders' equity | $ | 2,480,932 | 2,359,102 | |||
See accompanying notes to condensed consolidated financial statements.
1
FASTENAL COMPANY AND SUBSIDIARIES
Condensed Consolidated Statements of Earnings
(Amounts in thousands except earnings per share)
(Unaudited) | (Unaudited) | ||||||||||||
Six Months Ended June 30, | Three Months Ended June 30, | ||||||||||||
2015 | 2014 | 2015 | 2014 | ||||||||||
Net sales | $ | 1,951,144 | 1,826,439 | $ | 997,827 | 949,938 | |||||||
Cost of sales | 965,007 | 895,294 | 495,740 | 467,271 | |||||||||
Gross profit | 986,137 | 931,145 | 502,087 | 482,667 | |||||||||
Operating and administrative expenses | 557,031 | 545,859 | 276,644 | 276,016 | |||||||||
Gain on sale of property and equipment | (498 | ) | (412 | ) | (390 | ) | (196 | ) | |||||
Operating income | 429,604 | 385,698 | 225,833 | 206,847 | |||||||||
Interest income | 162 | 249 | 63 | 129 | |||||||||
Interest expense | (1,155 | ) | (320 | ) | (797 | ) | (194 | ) | |||||
Earnings before income taxes | 428,611 | 385,627 | 225,099 | 206,782 | |||||||||
Income tax expense | 160,648 | 143,182 | 84,742 | 76,268 | |||||||||
Net earnings | $ | 267,963 | 242,445 | $ | 140,357 | 130,514 | |||||||
Basic net earnings per share | $ | 0.91 | 0.82 | $ | 0.48 | 0.44 | |||||||
Diluted net earnings per share | $ | 0.91 | 0.82 | $ | 0.48 | 0.44 | |||||||
Basic weighted average shares outstanding | 293,192 | 296,667 | 291,177 | 296,691 | |||||||||
Diluted weighted average shares outstanding | 293,870 | 297,534 | 291,830 | 297,578 | |||||||||
See accompanying notes to condensed consolidated financial statements.
2
FASTENAL COMPANY AND SUBSIDIARIES
Condensed Consolidated Statements of Comprehensive Income
(Amounts in thousands)
(Unaudited) | (Unaudited) | ||||||||||||
Six Months Ended June 30, | Three Months Ended June 30, | ||||||||||||
2015 | 2014 | 2015 | 2014 | ||||||||||
Net earnings | $ | 267,963 | 242,445 | $ | 140,357 | 130,514 | |||||||
Other comprehensive income (loss), net of tax: | |||||||||||||
Foreign currency translation adjustments (net of tax of $0 in 2015 and 2014) | (15,661 | ) | 549 | 3,789 | 5,386 | ||||||||
Change in marketable securities (net of tax of $0 in 2015 and 2014) | — | 2 | — | — | |||||||||
Comprehensive income | $ | 252,302 | 242,996 | $ | 144,146 | 135,900 | |||||||
See accompanying notes to condensed consolidated financial statements.
3
FASTENAL COMPANY AND SUBSIDIARIES
Condensed Consolidated Statements of Cash Flows
(Amounts in thousands)
(Unaudited) | ||||||
Six Months Ended June 30, | ||||||
2015 | 2014 | |||||
Cash flows from operating activities: | ||||||
Net earnings | $ | 267,963 | 242,445 | |||
Adjustments to reconcile net earnings to net cash provided by operating activities: | ||||||
Depreciation of property and equipment | 39,295 | 35,190 | ||||
Gain on sale of property and equipment | (498 | ) | (412 | ) | ||
Bad debt expense | 4,806 | 5,421 | ||||
Deferred income taxes | 2,527 | 1,100 | ||||
Stock-based compensation | 3,441 | 3,000 | ||||
Excess tax benefits from stock-based compensation | (1,274 | ) | (1,488 | ) | ||
Amortization of non-compete agreements | 263 | 263 | ||||
Changes in operating assets and liabilities: | ||||||
Trade accounts receivable | (83,552 | ) | (93,420 | ) | ||
Inventories | (12,615 | ) | (34,703 | ) | ||
Other current assets | 8,496 | (3,021 | ) | |||
Accounts payable | 29,563 | 18,235 | ||||
Accrued expenses | 8,395 | 18,046 | ||||
Income taxes | (5,036 | ) | 31,707 | |||
Other | (620 | ) | 566 | |||
Net cash provided by operating activities | 261,154 | 222,929 | ||||
Cash flows from investing activities: | ||||||
Purchases of property and equipment | (88,020 | ) | (97,560 | ) | ||
Proceeds from sale of property and equipment | 4,112 | 2,720 | ||||
Net increase in marketable securities | — | (2 | ) | |||
Net increase in other assets | (20 | ) | (69 | ) | ||
Net cash used in investing activities | (83,928 | ) | (94,911 | ) | ||
Cash flows from financing activities: | ||||||
Borrowings under line of credit | 790,000 | 380,000 | ||||
Payments against line of credit | (550,000 | ) | (310,000 | ) | ||
Proceeds from exercise of stock options | 6,911 | 5,143 | ||||
Excess tax benefits from stock-based compensation | 1,274 | 1,488 | ||||
Purchases of common stock | (250,425 | ) | (8,847 | ) | ||
Payments of dividends | (164,736 | ) | (148,353 | ) | ||
Net cash used in financing activities | (166,976 | ) | (80,569 | ) | ||
Effect of exchange rate changes on cash and cash equivalents | (3,580 | ) | (15 | ) | ||
Net increase in cash and cash equivalents | 6,670 | 47,434 | ||||
Cash and cash equivalents at beginning of period | 114,496 | 58,506 | ||||
Cash and cash equivalents at end of period | $ | 121,166 | 105,940 | |||
Supplemental disclosure of cash flow information: | ||||||
Cash paid during each period for interest | $ | 1,155 | 320 | |||
Net cash paid during each period for income taxes | $ | 162,891 | 99,348 | |||
See accompanying notes to condensed consolidated financial statements.
4
FASTENAL COMPANY AND SUBSIDIARIES
Notes to Condensed Consolidated Financial Statements
(Amounts in thousands except share and per share information and where otherwise noted)
June 30, 2015 and 2014
(Unaudited)
(1) Basis of Presentation
The accompanying unaudited condensed consolidated financial statements of Fastenal Company and subsidiaries (collectively referred to as the Company, Fastenal, or by terms such as we, our, or us) have been prepared in accordance with U.S. generally accepted accounting principles (GAAP) for interim financial information. They do not include all information and footnotes required by U.S. GAAP for complete financial statements. However, except as described herein, there has been no material change in the information disclosed in the notes to consolidated financial statements included in our consolidated financial statements as of and for the year ended December 31, 2014. In the opinion of management, all adjustments (consisting of normal recurring accruals) considered necessary for a fair presentation have been included.
(2) Financial Instruments and Marketable Securities
Due to the varying short-term cash needs of our business, we periodically have marketable securities. We value these assets utilizing a fair value hierarchy that prioritizes the inputs to valuation techniques used to measure fair value. The hierarchy gives the highest priority to unadjusted quoted prices in active markets for identical assets and liabilities (Level 1) and the lowest priority to measurements involving unobservable inputs (Level 3). The three levels of the fair value hierarchy and how they are determined are defined in our 2014 annual report on Form 10-K in Note 1 of the Notes to Consolidated Financial Statements.
(3) Stockholders’ Equity
Our authorized, issued, and outstanding shares (stated in whole numbers) consist of the following:
Par Value | June 30, 2015 | December 31, 2014 | June 30, 2014 | ||||||||
Preferred stock | $.01 | /share | |||||||||
Shares authorized | 5,000,000 | 5,000,000 | 5,000,000 | ||||||||
Shares issued and outstanding | — | — | — | ||||||||
Common stock | $.01 | /share | |||||||||
Shares authorized | 400,000,000 | 400,000,000 | 400,000,000 | ||||||||
Shares issued and outstanding | 290,149,384 | 295,867,844 | 296,764,444 | ||||||||
Dividends
On July 13, 2015, our board of directors declared a dividend of $0.28 per share of common stock. This dividend is to be paid in cash on August 25, 2015 to shareholders of record at the close of business on July 28, 2015. Since 2011, we have paid quarterly dividends. Our board of directors expects to continue paying quarterly dividends, provided the future determination as to payment of dividends will depend on the financial needs of the Company and such other factors as deemed relevant by the board of directors.
The following table presents the dividends either paid previously or declared by our board of directors for future payment on a per share basis:
2015 | 2014 | |||||
First quarter | $ | 0.28 | 0.25 | |||
Second quarter | 0.28 | 0.25 | ||||
Third quarter | 0.28 | 0.25 | ||||
Fourth quarter | 0.25 | |||||
Total | $ | 0.84 | 1.00 | |||
5
FASTENAL COMPANY AND SUBSIDIARIES
Notes to Condensed Consolidated Financial Statements
(Amounts in thousands except share and per share information and where otherwise noted)
June 30, 2015 and 2014
(Unaudited)
Stock Options
The following tables summarize the details of grants made under our stock option plan that are still outstanding, and the assumptions used to value these grants. All options granted were effective at the close of business on the date of grant.
Options Granted | Option Exercise (Strike) Price | Closing Stock Price on Date of Grant | June 30, 2015 | |||||||||||||
Date of Grant | Options Outstanding | Options Exercisable | ||||||||||||||
April 21, 2015 | 893,220 | $ | 42.00 | $ | 41.26 | 880,842 | — | |||||||||
April 22, 2014 | 955,000 | $ | 56.00 | $ | 50.53 | 807,500 | 5,000 | |||||||||
April 16, 2013 | 205,000 | $ | 54.00 | $ | 49.25 | 137,500 | — | |||||||||
April 17, 2012 | 1,235,000 | $ | 54.00 | $ | 49.01 | 1,060,000 | 243,750 | |||||||||
April 19, 2011 | 410,000 | $ | 35.00 | $ | 31.78 | 268,800 | 143,800 | |||||||||
April 20, 2010 | 530,000 | $ | 30.00 | $ | 27.13 | 226,500 | 129,000 | |||||||||
April 21, 2009 | 790,000 | $ | 27.00 | $ | 17.61 | 303,900 | 211,400 | |||||||||
April 15, 2008 | 550,000 | $ | 27.00 | $ | 24.35 | 161,000 | 134,750 | |||||||||
April 17, 2007 | 4,380,000 | $ | 22.50 | $ | 20.15 | 1,346,840 | 1,346,840 | |||||||||
Total | 9,948,220 | 5,192,882 | 2,214,540 | |||||||||||||
Date of Grant | Risk-free Interest Rate | Expected Life of Option in Years | Expected Dividend Yield | Expected Stock Volatility | Estimated Fair Value of Stock Option | |||||||||
April 21, 2015 | 1.3 | % | 5.00 | 2.7 | % | 26.84 | % | $ | 7.35 | |||||
April 22, 2014 | 1.8 | % | 5.00 | 2.0 | % | 28.55 | % | $ | 9.57 | |||||
April 16, 2013 | 0.7 | % | 5.00 | 1.6 | % | 37.42 | % | $ | 12.66 | |||||
April 17, 2012 | 0.9 | % | 5.00 | 1.4 | % | 39.25 | % | $ | 13.69 | |||||
April 19, 2011 | 2.1 | % | 5.00 | 1.6 | % | 39.33 | % | $ | 11.20 | |||||
April 20, 2010 | 2.6 | % | 5.00 | 1.5 | % | 39.10 | % | $ | 8.14 | |||||
April 21, 2009 | 1.9 | % | 5.00 | 1.0 | % | 38.80 | % | $ | 3.64 | |||||
April 15, 2008 | 2.7 | % | 5.00 | 1.0 | % | 30.93 | % | $ | 7.75 | |||||
April 17, 2007 | 4.6 | % | 4.85 | 1.0 | % | 31.59 | % | $ | 5.63 | |||||
All of the options in the tables above vest and become exercisable over a period of up to eight years. Each option will terminate approximately nine years after the date of grant.
The fair value of each share-based option is estimated on the date of grant using a Black-Scholes valuation method that uses the assumptions listed above. The risk-free interest rate is based on the U.S. Treasury rate over the expected life of the option at the time of grant. The expected life is the average length of time over which we expect the employee groups will exercise their options, which is based on historical experience with similar grants. The dividend yield is estimated over the expected life of the option based on our current dividend payout, historical dividends paid, and expected future cash dividends. Expected volatilities are based on the movement of our stock over the most recent historical period equivalent to the expected life of the option.
Compensation expense equal to the grant date fair value is recognized for all of these awards over the vesting period. The stock-based compensation expense for the six-month periods ended June 30, 2015 and 2014 was $3,441 and $3,000, respectively. Unrecognized compensation expense related to outstanding unvested stock options as of June 30, 2015 was $17,707 and is expected to be recognized over a weighted average period of 5.04 years. Any future changes in estimated forfeitures will impact this amount.
6
FASTENAL COMPANY AND SUBSIDIARIES
Notes to Condensed Consolidated Financial Statements
(Amounts in thousands except share and per share information and where otherwise noted)
June 30, 2015 and 2014
(Unaudited)
Earnings Per Share
The following tables present a reconciliation of the denominators used in the computation of basic and diluted earnings per share and a summary of the options to purchase shares of common stock which were excluded from the diluted earnings calculation because they were anti-dilutive:
Six-month Period | Three-month Period | ||||||||||
Reconciliation | 2015 | 2014 | 2015 | 2014 | |||||||
Basic weighted average shares outstanding | 293,191,566 | 296,666,992 | 291,176,985 | 296,691,232 | |||||||
Weighted shares assumed upon exercise of stock options | 678,586 | 867,481 | 653,152 | 887,187 | |||||||
Diluted weighted average shares outstanding | 293,870,152 | 297,534,473 | 291,830,137 | 297,578,419 | |||||||
Six-month Period | Three-month Period | ||||||||||||||
Summary of Anti-dilutive Options Excluded | 2015 | 2014 | 2015 | 2014 | |||||||||||
Options to purchase shares of common stock | 2,395,247 | 1,646,892 | 2,724,639 | 1,997,363 | |||||||||||
Weighted average exercise prices of options | $ | 52.97 | $ | 54.44 | $ | 51.56 | $ | 54.72 | |||||||
Any dilutive impact summarized above relates to periods when the average market price of our stock exceeded the exercise price of the potentially dilutive option securities then outstanding.
(4) Income Taxes
Fastenal files income tax returns in the United States federal jurisdiction, all states, and various local and foreign jurisdictions. With limited exceptions, we are no longer subject to income tax examinations by taxing authorities for taxable years before 2012 in the case of United States federal and foreign examinations and 2011 in the case of state and local examinations.
As of June 30, 2015 and 2014, the Company had $4,299 and $3,916, respectively, of liabilities recorded related to gross unrecognized tax benefits. Included in this liability for unrecognized tax benefits is an immaterial amount for interest and penalties, both of which we classify as a component of income tax expense. The Company does not anticipate its total unrecognized tax benefits will change significantly during the next twelve months.
(5) Operating Leases
We lease certain pick-up trucks under operating leases. These leases have a non-cancellable lease term of one year, with renewal options for up to 72 months. The pick-up truck leases include an early buy out clause we generally exercise, thereby giving the leases an effective term of 28-36 months. Certain operating leases for pick-up trucks contain residual value guarantee provisions which would generally become due at the expiration of the operating lease agreement if the fair value of the leased vehicles is less than the guaranteed residual value. The aggregate residual value guarantee related to these leases is approximately $65,279. We believe the likelihood of funding the guarantee obligation under any provision of the operating lease agreements is remote other than where we have established an accrual for estimated losses, which is immaterial at June 30, 2015. To the extent our fleet contains vehicles we estimate will settle at a gain, such gains on these vehicles will be recognized when we sell the vehicle.
7
FASTENAL COMPANY AND SUBSIDIARIES
Notes to Condensed Consolidated Financial Statements
(Amounts in thousands except share and per share information and where otherwise noted)
June 30, 2015 and 2014
(Unaudited)
(6) Commitments and Contingencies
Credit Facilities and Commitments
On May 1, 2015, we entered into a new credit facility agreement and terminated our existing credit facility agreement. The new credit facility agreement provides us with a committed $500,000 unsecured revolving credit facility (the 'Credit Facility'). The Credit Facility includes a committed letter of credit subfacility of $55,000. The commitments under the Credit Facility will expire (and any borrowings outstanding under the Credit Facility will become due and payable) on March 1, 2018. In the next twelve months, we have the ability and intent to repay a portion of the outstanding line of credit obligations using cash; therefore, we have classified this portion of the line of credit as a current liability. Commitments under the Credit Facility are subject to certain financial and negative covenants, and we are currently in compliance with these covenants.
Line of credit obligations and undrawn letters of credit outstanding under the Credit Facility were as follows:
June 30, 2015 | December 31, 2014 | June 30, 2014 | |||||||
Line of credit, obligations outstanding | $ | 330,000 | 90,000 | 70,000 | |||||
Less: Line of credit, current | (79,575 | ) | (90,000 | ) | (70,000 | ) | |||
Line of credit, noncurrent | $ | 250,425 | — | — | |||||
Undrawn letters of credit - face amount | $ | 37,256 | 37,315 | 34,411 | |||||
Borrowings under the Credit Facility generally bear interest at a rate per annum equal to the London Interbank Offered Rate ('LIBOR') for interest periods of various lengths selected by us, plus 0.95%. Based on the interest periods we have chosen, our effective per annum interest rate at June 30, 2015 was approximately 1.1%. We pay a commitment fee for the unused portion of the Credit Facility. This fee is either 0.10% or 0.125% per annum based on our usage of the Credit Facility.
Legal Contingencies
The nature of our potential exposure to legal contingencies is described in our 2014 annual report on Form 10-K in Note 10 of the Notes to Consolidated Financial Statements. As of June 30, 2015, there were no litigation matters that we consider to be probable or reasonably possible to have a material adverse outcome.
(7) Subsequent Events
We evaluated all subsequent event activity and concluded that no subsequent events have occurred that would require recognition in the condensed consolidated financial statements or disclosure in the notes to the condensed consolidated financial statements, with the exception of the dividend disclosed in Note (3) 'Stockholders' Equity'.
(8) New Accounting Pronouncements
There has been no material change in the information regarding new accounting pronouncements disclosed in our 2014 annual report on Form 10-K in Note 13 of the Notes to Consolidated Financial Statements, with the exception of Accounting Standards Update (ASU) 2014-09, Revenue from Contracts with Customers, issued by the Financial Accounting Standards Board (FASB) in May 2014, which requires an entity to recognize the amount of revenue to which it expects to be entitled for the transfer of promised goods or services to customers. This ASU will replace most existing revenue recognition guidance in U.S. GAAP when it becomes effective. In April 2015, FASB deferred the effective date of the new standard. With this deferral, the new standard is effective for us on January 1, 2018. The standard permits the use of either the retrospective or cumulative effect transition method. We are evaluating the effect this ASU will have on our consolidated financial statements and related disclosures. We have not yet selected a transition method nor have we determined the effect of the standard on our ongoing financial reporting.
8
ITEM 2 — MANAGEMENT'S DISCUSSION AND ANALYSIS OF FINANCIAL CONDITION AND RESULTS OF OPERATIONS
The following is management’s discussion and analysis of certain significant factors which have affected our financial position and operating results during the periods included in the accompanying condensed consolidated financial statements. (Dollar amounts are stated in thousands except for per share amounts and where otherwise noted.)
BUSINESS DISCUSSION
Fastenal is a North American leader in the wholesale distribution of industrial and construction supplies. We distribute these supplies through a network of approximately 2,700 company owned stores. Most of our customers are in the manufacturing and non-residential construction markets. The manufacturing market includes both original equipment manufacturers (OEM) and maintenance and repair operations (MRO). The non-residential construction market includes general, electrical, plumbing, sheet metal, and road contractors. Other users of our product include farmers, ranchers, truckers, railroads, mining companies, federal, state, and local governmental entities, schools, and certain retail trades. Geographically, our stores and customers are primarily located in North America.
We are a growth centered organization and we constantly strive to make investments into growth drivers of our business. These investments typically center on people. By adding more people we add to our ability to interact with and ‘to serve’ our customers from our local store and to ‘back them up’ in some type of support role. Our goal is to aggressively add the former and to allow efficiency gains to limit the additions of the latter. In recent years this investment has also centered on more FAST Solutions® (industrial vending) devices ‘to serve’ our customers’ needs on a 24 hour / 7 day basis.
The table below summarizes our store employee count and our total employee count at the end of the periods presented. This is intended to demonstrate the energy (or capacity) added. Later in this document we discuss the average full-time equivalent employee count to help explain the expense trends in more detail. The final two items below summarize our investments in FAST Solutions® (industrial vending) devices and in store locations.
Change Since: | ||||||||||||||
Q2 2014 | Q4 2014 | Q2 2015 | Q2 2014 | Q4 2014 | ||||||||||
End of period total store employee count | 12,074 | 12,293 | 13,203 | 9.4 | % | 7.4 | % | |||||||
Change in total store employee count | 1,129 | 910 | ||||||||||||
End of period total employee count | 18,135 | 18,417 | 19,527 | 7.7 | % | 6.0 | % | |||||||
Change in total employee count | 1,392 | 1,110 | ||||||||||||
FAST Solutions® (industrial vending) machines (installed device count) | 43,761 | 46,855 | 50,620 | 15.7 | % | 8.0 | % | |||||||
Number of store locations | 2,684 | 2,637 | 2,616 | -2.5 | % | -0.8 | % | |||||||
Several items worth noting with respect to our results:
(1) | During the last twelve months, we have added 1,129 people into our stores with over 80% (or 910 people) of the additions in the first six months of 2015. We stated in January 2015 we would add people in an aggressive fashion during 2015. This is the result. |
(2) | The first six months of 2015 were hit hard by a slowdown in our business with customers connected to the oil and gas industry. This connection includes direct industry participants as well as those with a geographic connection. That's the bad news, the good news is that we believe there are signs of stabilization in the last few months. |
(3) | Gross profit, during the quarter, was impacted by the added pressure of a continuing change in the mix of customers and products. This was expected and we continued to manage our operating and administrative expenses during this change. A portion of our operating and administrative expense management is structural as an increase in average net sales per store/selling location leverages our fixed costs (a concept we have historically described as the 'Pathway to Profit'). The other portion is great people rising to the challenge by reducing other expenses! Simply put, in the last twelve months we funded all of our headcount expansion by spending less everywhere else. A simple concept, but it takes a focused effort to pull it off. |
(4) | This brings us to incremental operating income. Our operating income grew $19.0 million from the second quarter of 2014 to the second quarter of 2015 (increasing from $206.8 million to $225.8 million), and our net sales grew $47.9 |
9
million (increasing from $949.9 million to $997.8 million). This results in incremental operating income of 40% ($19.0 million / $47.9 million). Since the first quarter of 2014, excluding this quarter, our quarterly incremental operating income has been in the range of 6% to 32%.
The following sections contain an overview of Sales and Sales Trends and Cash Flow Impact Items which contain a more in-depth discussion of the following:
1. | Sales and sales trends – a recap of our recent sales trends and some insight into the activities with different end markets. |
2. | Growth drivers of our business – a recap of how we grow our business. |
3. | Profit drivers of our business – a recap of how we increase our profits. |
4. | Statement of earnings information – a recap of the components of our income statement. |
5. | Cash flow impact items – a recap of the operational working capital utilized in our business, and the related cash flow. |
The following is our explanation of our sales growth. The most important thing to note before you read it is to remember Fastenal is several businesses within itself.
First and foremost, we are a fastener distributor. We have been in this business for almost 50 years. We are good at it. We have strong capabilities at sourcing and procurement, at quality control, at logistics, and at local customer service. Each of these capabilities is focused on the customer at the end of the supply chain. Our fastener business represents about 40% of our net sales base. This business is split about 50% production/construction needs and about 50% maintenance needs. The former is a great business, but it can be cyclical because about 75% of our manufacturing customer base is engaged in some type of heavy manufacturing. This population needs the capabilities we bring to the table, but in the last six months this customer base has been contracting its production and therefore its need for fasteners. During this time frame, our fastener product line has seen its daily growth decrease from about 10% in the last six months of 2014 to flat in the second quarter of 2015. Our market share gains continue to be strong, but the contraction from our existing customers has eliminated our growth. It is also worthwhile to note, production fasteners is a sticky business in the short-term as it is expensive and time consuming for our customers to change their supplier relationships.
Secondly, we also have a non-fastener maintenance and supply business. We have actively pursued this business in the last 20 to 25 years, and this non-fastener business currently represents approximately 60% of our net sales base. The capabilities we developed as a fastener distributor, described above, provide a backbone to growing this ‘newer’ business. This backbone was enhanced in the last five years with our added capabilities in industrial vending. Given our local customer service, we have a structural advantage in the industrial vending business. There is more to industrial vending than the device or the financial resources to deploy; we believe the ability to replenish with a local team from an integrated supply chain network (i.e., the 'Team behind the Machine') is critical to the long-term success of this channel. Because of these capabilities, the non-fastener business remains more resilient. Similar to our fastener business, our non-fastener business has weakened in the last six months. During this time frame, our non-fastener product line has seen its daily sales growth decrease from about 18% in the last six months of 2014 to about 9% in the second quarter of 2015. The weak environment has hurt our business, but the 9% growth compared to our end markets continues to demonstrate strong market share gains.
Please read through the detailed Sales and Sales Trends section later in this document for additional insight.
Our gross profit decreased from 50.8% in the second quarter of 2014, to 50.3% in the second quarter of 2015. In other words, for every dollar increase in net sales from the second quarter of 2014 to the second quarter of 2015, we picked up about 41 cents of gross profit. The relationship between sales and gross profit depends on our success within our large account business (an area that is still under-represented in our customer mix). The large account end market produces a below ‘company average’ gross profit; however, as demonstrated this quarter, it leverages our existing network of capabilities and allows us to enjoy strong incremental operating income growth. Our gross profit is also impacted by supplier incentives. With weaker net sales growth and our tight management of inventory levels, the growth of spending with our suppliers is lower; hence, our supplier incentives are reduced. In addition to the year-over-year gross profit change noted earlier, on a sequential basis our gross profit dropped from 50.8% in the first quarter of 2015 to 50.3% in the second quarter of 2015. Supplier incentives represented about half of our gross profit drop since the first quarter of 2015. We view this sequential impact as transitory.
In regards to operating expenses, we added 1,392 people to the Fastenal organization in the last twelve months (about 81% of these people were added to a store or some other type of selling location), and about 80% of these additions came in the last six months. This provided a meaningful increase in our capacity. However, we needed to fund this increased capacity. We did this by (1) reducing our total operating and administrative expenses outside of payroll related costs, and (2) managing our hours worked in a very focused site by site fashion (our headcount grew by 7.7% in the last twelve months, but our average full-time equivalent headcount only grew by 4.4%). These two items allowed us to invest in store personnel and fund that investment in
10
a weak economic environment. Below is a quick recap of our full-time equivalent headcount to supplement the information on page nine of this document:
Change Since: | ||||||||||||||
Q2 2014 | Q4 2014 | Q2 2015 | Q2 2014 | Q4 2014 | ||||||||||
Average full-time equivalent store employee count | 10,446 | 10,376 | 10,887 | 4.2 | % | 4.9 | % | |||||||
Average full-time equivalent employee count | 15,427 | 15,512 | 16,107 | 4.4 | % | 3.8 | % | |||||||
Note – Full-time equivalent is based on 40 hours per week. | ||||||||||||||
We touched on our industrial vending earlier, but here is a quick recap: During the second quarter of 2015, we signed 5,144 devices (we signed 3,962 devices in the first quarter of 2015), our installed device count on June 30, 2015 was 50,620 (an increase of 15.7% over June 30, 2014), the percent of total net sales to customers with industrial vending was 40.9%, and our daily sales to customers with industrial vending grew 8.6% over the second quarter of 2014.
Finally, some thoughts on capital allocation: During the latter half of 2014 and the first six months of 2015, we have been modifying our capital allocation by buying back some stock. This is in response to several factors. The first centers on our external valuation. Our relative stock valuation has weakened over the last several years, which prompted us to reassess our cash deployment. To this end, we have spent approximately $295 million buying back stock in the last twelve months and have repurchased approximately 2.4% of our outstanding shares from the start of this time frame. We are mindful of our shareholders’ expectations relative to our dividend paying history and have primarily funded this buyback with debt. Over the last three to four years, we had dramatically increased our capital expenditures, relative to our net earnings, for the rapid deployment of distribution automation and industrial vending. These investments will continue in the future; however, we expect capital expenditures, relative to our net earnings, will moderate and will allow us to continue to fund our cash needs. Please read through the detailed Cash Flow Impact Items section, and the Condensed Consolidated Statements of Cash Flows later in this document for additional insight.
Historically, we have always been quick to point out the positives and negatives of our business. We believe the operating income growth we achieved, despite the weak business environment, was meaningful. We were also pleased to hit the milestone of 50,000 installed industrial vending devices. Congratulations to the Fastenal Team.
SALES AND SALES TRENDS
While reading these items, it is helpful to appreciate several aspects of our marketplace: (1) it's big, the North American marketplace for industrial supplies is estimated to be in excess of $160 billion per year (and we have expanded beyond North America), (2) no company has a significant portion of this market, (3) many of the products we sell are individually inexpensive, (4) when our customer needs something quickly or unexpectedly our local store is a quick source, (5) the cost and time to manage and procure these products is meaningful, (6) the cost to move these products, many of which are bulky, can be significant, (7) many customers would prefer to reduce their number of suppliers to simplify their business, and (8) many customers would prefer to utilize various technologies to improve availability and reduce waste.
Our motto is Growth through Customer Service®. This is important given the points noted above. We believe in efficient markets – to us, this means we can grow our market share if we provide the greatest value to our customers. We believe our ability to grow is amplified if we can service our customers at the closest economic point of contact. For us, this 'closest economic point of contact' is the local store; therefore, our focus centers on understanding our customers' day, their opportunities, and their obstacles.
The concept of growth is simple, find more customers every day and increase our activity with them. However, execution is hard work. First, we recruit service minded individuals to support our customers and their business. Second, we operate in a decentralized fashion to help identify the greatest value for our customers. Third, we have a great team behind the store to operate efficiently and to help identify new business solutions. Fourth, we do these things every day. Finally, we strive to generate strong profits; these profits produce the cash flow necessary to fund the growth and to support the needs of our customers.
11
SALES GROWTH
Note – Daily sales are defined as the total net sales for the period divided by the number of business days (in the United States) in the period.
Net sales and growth rates in net sales were as follows:
Six-month Period | Three-month Period | |||||||||||
2015 | 2014 | 2015 | 2014 | |||||||||
Net sales | $ | 1,951,144 | 1,826,439 | 997,827 | 949,938 | |||||||
Percentage change | 6.8 | % | 10.4 | % | 5.0 | % | 12.1 | % | ||||
Business days | 127 | 127 | 64 | 64 | ||||||||
Daily sales | $ | 15,363 | 14,381 | 15,591 | 14,843 | |||||||
Daily sales growth rate | 6.8 | % | 10.4 | % | 5.0 | % | 12.1 | % | ||||
Impact of currency fluctuations (primarily Canada) | -1.0 | % | -0.5 | % | -1.0 | % | -0.4 | % | ||||
The increase in net sales in the periods noted for 2015 and 2014 came primarily from higher unit sales. Net sales were impacted by minimal price changes in our non-fastener products and some price deflation in our fastener products, but the net impact was a drag on growth. Our growth in net sales was not meaningfully impacted by the introduction of new products or services, with one exception. Over the last several years, our FAST Solutions® (industrial vending) initiative has stimulated faster growth with a subset of our customers. The higher unit sales resulted primarily from increases in sales at older store locations (discussed below) and to a lesser degree the opening of new store locations in the last several years. The impact of change in currencies in foreign countries (primarily Canada) relative to the United States dollar is noted in the table above.
The stores opened greater than two years represent a consistent ‘same store’ view of our business (store sites opened as follows: 2015 group – opened 2013 and earlier, and 2014 group – opened 2012 and earlier). However, the impact of the economy is best reflected in the growth performance of our stores opened greater than five years (store sites opened as follows: 2015 group – opened 2010 and earlier, and 2014 group – opened 2009 and earlier) and opened greater than ten years (store sites opened as follows: 2015 group – opened 2005 and earlier, and 2014 group – opened 2004 and earlier). These two groups of stores are more cyclical due to the increased market share they enjoy in their local markets. The daily sales change for each of these groups was as follows:
Six-month Period | Three-month Period | ||||||||||
2015 | 2014 | 2015 | 2014 | ||||||||
Store Age | |||||||||||
Opened greater than 2 years | 6.1 | % | 9.1 | % | 4.4 | % | 10.7 | % | |||
Opened greater than 5 years | 6.0 | % | 8.3 | % | 4.5 | % | 10.0 | % | |||
Opened greater than 10 years | 6.0 | % | 7.6 | % | 4.6 | % | 9.4 | % | |||
Note: The age groups above are measured as of the last day of each respective calendar year.
SALES BY PRODUCT LINE:
The mix of sales from the original fastener product line and from the other product lines was as follows:
Six-month Period | Three-month Period | ||||||||||
2015 | 2014 | 2015 | 2014 | ||||||||
Fastener product line | 38.8 | % | 40.4 | % | 38.7 | % | 40.6 | % | |||
Other product lines | 61.2 | % | 59.6 | % | 61.3 | % | 59.4 | % | |||
100.0 | % | 100.0 | % | 100.0 | % | 100.0 | % | ||||
12
MONTHLY SALES CHANGES, SEQUENTIAL TRENDS, AND END MARKET PERFORMANCE
This section focuses on three distinct views of our business – monthly sales changes, sequential trends, and end market performance. The first discussion regarding monthly sales changes provides a good mechanical view of our business based on the age of our stores. The second discussion provides a framework for understanding the sequential trends (that is, comparing a month to the immediately preceding month, and also looking at the cumulative change from an earlier benchmark month) in our business. Finally, we believe the third discussion regarding end market performance provides insight into activities with our various types of customers.
Monthly Sales Changes:
All company sales – During the months noted below, all of our selling locations, when combined, had daily sales growth rates of (compared to the same month in the preceding year):
Jan. | Feb. | Mar. | Apr. | May | June | July | Aug. | Sept. | Oct. | Nov. | Dec. | ||||||||||||||||||||||||
2015 | 12.0 | % | 8.6 | % | 5.6 | % | 6.1 | % | 5.3 | % | 3.7 | % | |||||||||||||||||||||||
2014 | 6.7 | % | 7.7 | % | 11.6 | % | 10.0 | % | 13.5 | % | 12.7 | % | 14.7 | % | 15.0 | % | 12.9 | % | 14.6 | % | 15.3 | % | 17.4 | % | |||||||||||
2013 | 6.7 | % | 8.2 | % | 5.1 | % | 4.8 | % | 5.3 | % | 6.0 | % | 2.9 | % | 7.2 | % | 5.7 | % | 7.7 | % | 8.2 | % | 6.7 | % | |||||||||||
Stores opened greater than two years – Our stores opened greater than two years (store sites opened as follows: 2015 group – opened 2013 and earlier, 2014 group – opened 2012 and earlier, and 2013 group – opened 2011 and earlier) represent a consistent 'same-store' view of our business. During the months noted below, the stores opened greater than two years had daily sales growth rates of (compared to the same month in the preceding year):
Jan. | Feb. | Mar. | Apr. | May | June | July | Aug. | Sept. | Oct. | Nov. | Dec. | ||||||||||||||||||||||||
2015 | 11.2 | % | 7.8 | % | 4.8 | % | 5.4 | % | 4.6 | % | 3.2 | % | |||||||||||||||||||||||
2014 | 5.5 | % | 6.5 | % | 10.2 | % | 8.4 | % | 12.1 | % | 11.4 | % | 13.4 | % | 14.0 | % | 11.8 | % | 13.5 | % | 14.0 | % | 16.5 | % | |||||||||||
2013 | 5.0 | % | 6.5 | % | 3.4 | % | 3.1 | % | 3.5 | % | 4.3 | % | 1.4 | % | 5.5 | % | 4.2 | % | 6.1 | % | 6.2 | % | 4.9 | % | |||||||||||
Stores opened greater than five years – The impact of the economy, over time, is best reflected in the growth performance of our stores opened greater than five years (store sites opened as follows: 2015 group – opened 2010 and earlier, 2014 group – opened 2009 and earlier, and 2013 group – opened 2008 and earlier). This group, which represented about 90% of our total sales in the first six months of 2015, is more cyclical due to the increased market share they enjoy in their local markets. During the months noted below, the stores opened greater than five years had daily sales growth rates of (compared to the same month in the preceding year):
Jan. | Feb. | Mar. | Apr. | May | June | July | Aug. | Sept. | Oct. | Nov. | Dec. | ||||||||||||||||||||||||
2015 | 10.8 | % | 7.2 | % | 4.8 | % | 5.6 | % | 4.6 | % | 3.1 | % | |||||||||||||||||||||||
2014 | 4.6 | % | 5.4 | % | 9.5 | % | 7.7 | % | 11.5 | % | 10.8 | % | 12.9 | % | 13.4 | % | 11.7 | % | 13.3 | % | 13.6 | % | 16.2 | % | |||||||||||
2013 | 3.2 | % | 5.6 | % | 2.3 | % | 2.0 | % | 2.7 | % | 3.4 | % | 0.6 | % | 4.7 | % | 3.2 | % | 5.3 | % | 6.1 | % | 4.8 | % | |||||||||||
Summarizing comments – There are three distinct influences to our growth: (1) execution, (2) currency fluctuations, and (3) economic fluctuations. This discussion centers on (2) and (3).
The change in currencies in foreign countries (primarily Canada) relative to the United States dollar impacted our net sales growth over the last several years. During the years 2013 and 2014, it lowered our net sales growth by 0.2% and 0.5%, respectively. In the first six months of 2015, it lowered our net sales growth by 1.0%.
During the first half of 2013, the fastener product line was heavily impacted by our industrial production business. These customers utilize our fasteners in the manufacture/assembly of their finished products. The end markets with the most pronounced weakening included heavy machinery manufacturers with exposure to: mining, military, agriculture, and construction. The daily sales growth in July 2013 and December 2013 were negatively impacted by the timing of the July 4th holiday (Thursday in 2013 versus Wednesday in 2012) and the Christmas/New Year holiday (Wednesday in 2013 versus Tuesday in 2012). This resulted in a 'lone' business day on Friday, July 5, 2013, in which many of our customers were closed, and three distinct one to two day work periods in the last two weeks of December 2013. The December 2013 impact was amplified due to poor weather conditions.
Our sales to customers engaged in light and medium duty manufacturing (largely related to consumer products) began to improve late in 2013 and into 2014. This makes sense given the trends in the PMI Index. In the first quarter of 2014, our sales growth was hampered in January and February due to a weak economy and foreign exchange rate fluctuations (primarily related to the Canadian dollar); however, the biggest impact was a severe winter in North America and its negative impact on
13
our customers and our trucking network. In March 2014, the weak economy and negative foreign exchange rate fluctuations continued; however, the weather normalized and our daily sales growth expanded to 11.6%. This double digit growth in March was helped by the Easter timing (April in 2014). In the second quarter of 2014, the negative impact of the Easter timing was felt, and then a 'less noisy' picture emerged in May and June. Our sales to customers engaged in heavy machinery manufacturing (primarily serving the mining, military, agricultural, and construction end markets), which represents approximately one fifth of our business, had a very weak 2013, but stabilized late in 2013 and improved in 2014.
In the first six months of 2015, our business weakened (see earlier comments). Similar to 2014, we experienced poor weather in North America; however, the real weakness was economic. The biggest impact came from customers engaged in the oil and gas business, but we also experienced weakness in other industries, as evidenced by the decline in the PMI Index.
Sequential Trends:
We find it helpful to think about the monthly sequential changes in our business using the analogy of climbing a stairway – This stairway has several predictable landings where there is a pause in the sequential gain (i.e. April, July, and October to December), but generally speaking, climbs from January to October. The October landing then establishes the benchmark for the start of the next year.
History has identified these landings in our business cycle. They generally relate to months with impaired business days (certain holidays). The first landing centers on Easter, which alternates between March and April (Easter occurred in April 2015, in April 2014, and in March 2013), the second landing centers on July 4th, and the third landing centers on the approach of winter with its seasonal impact on primarily our construction business and with the Christmas/New Year holidays. The holidays we noted impact the trends because they either move from month-to-month or because they move around during the week (the July 4th and Christmas/New Year holiday impacts are examples).
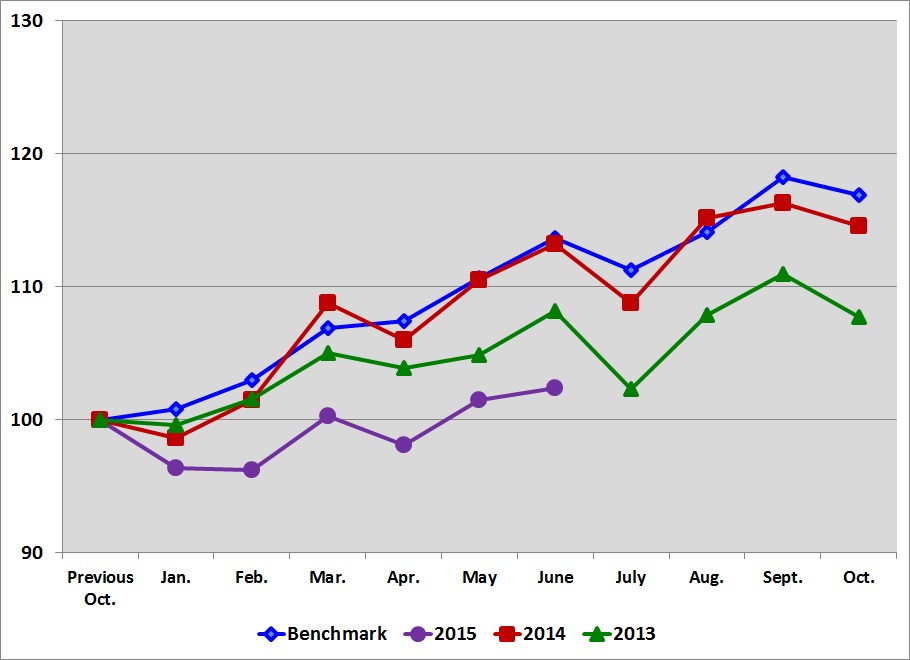
The table below shows the pattern to the sequential change in our daily sales. The line labeled 'Benchmark' is an historical average of our sequential daily sales change for the period 1998 to 2013, excluding 2008 and 2009. We believe this time frame will serve to show the historical pattern and could serve as a benchmark for current performance. We excluded the 2008 to 2009 time frame because it contains an extreme economic event and we don't believe it is comparable. The '2015', '2014', and '2013' lines represent our actual sequential daily sales changes. The '15Delta', '14Delta', and '13Delta' lines indicate the difference between the 'Benchmark' and the actual results in the respective year.
Cumulative | |||||||||||||||||||||||||||||||||||
Change from | |||||||||||||||||||||||||||||||||||
Jan. to | |||||||||||||||||||||||||||||||||||
Jan. (1) | Feb. | Mar. | Apr. | May | June | July | Aug. | Sept. | Oct. | June | Oct. | ||||||||||||||||||||||||
Benchmark | 0.8 | % | 2.2 | % | 3.8 | % | 0.4 | % | 3.1 | % | 2.7 | % | -2.1 | % | 2.5 | % | 3.7 | % | -1.2 | % | 12.6 | % | 15.9 | % | |||||||||||
2015 | -3.6 | % | -0.1 | % | 4.2 | % | -2.1 | % | 3.4 | % | 0.9 | % | 6.3 | % | |||||||||||||||||||||
15Delta | -4.4 | % | -2.3 | % | 0.4 | % | -2.5 | % | 0.3 | % | -1.8 | % | -6.3 | % | |||||||||||||||||||||
2014 | -1.4 | % | 3.0 | % | 7.1 | % | -2.6 | % | 4.2 | % | 2.5 | % | -3.8 | % | 5.8 | % | 1.0 | % | -1.5 | % | 14.8 | % | 16.2 | % | |||||||||||
14Delta | -2.2 | % | 0.8 | % | 3.3 | % | -3.0 | % | 1.1 | % | -0.2 | % | -1.7 | % | 3.3 | % | -2.7 | % | -0.3 | % | 2.2 | % | 0.3 | % | |||||||||||
2013 | -0.4 | % | 2.0 | % | 3.4 | % | -1.1 | % | 1.0 | % | 3.2 | % | -5.5 | % | 5.5 | % | 2.9 | % | -2.9 | % | 8.7 | % | 8.2 | % | |||||||||||
13Delta | -1.2 | % | -0.2 | % | -0.4 | % | -1.5 | % | -2.1 | % | 0.5 | % | -3.4 | % | 3.0 | % | -0.8 | % | -1.7 | % | -3.9 | % | -7.7 | % | |||||||||||
(1) | The January figures represent the percentage change from the previous October, whereas the remaining figures represent the percentage change from the previous month. |
14
A graph of the sequential daily sales change pattern discussed above, starting with a base of '100' in the previous October and ending with the next October, would be as follows:
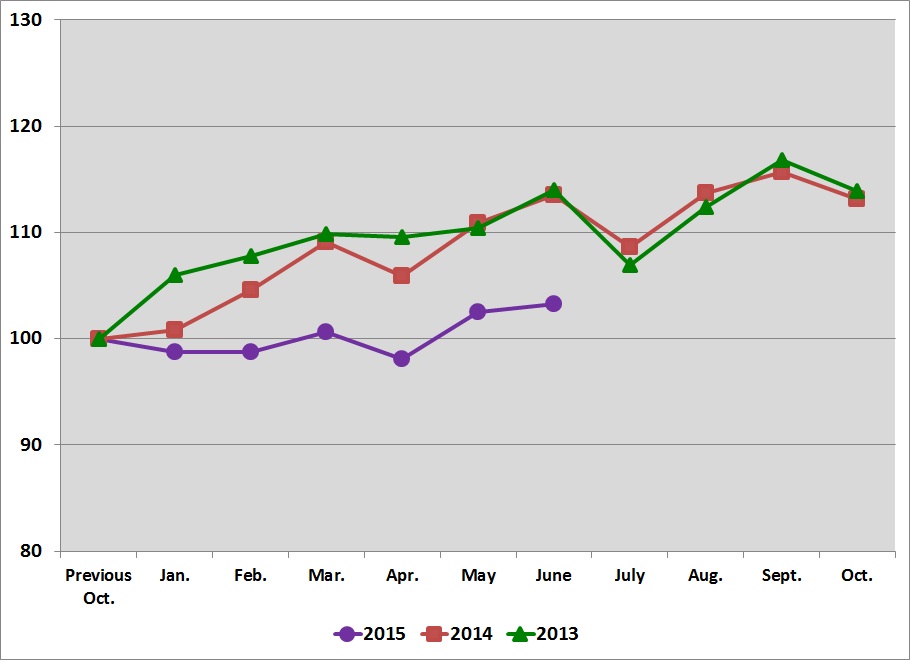
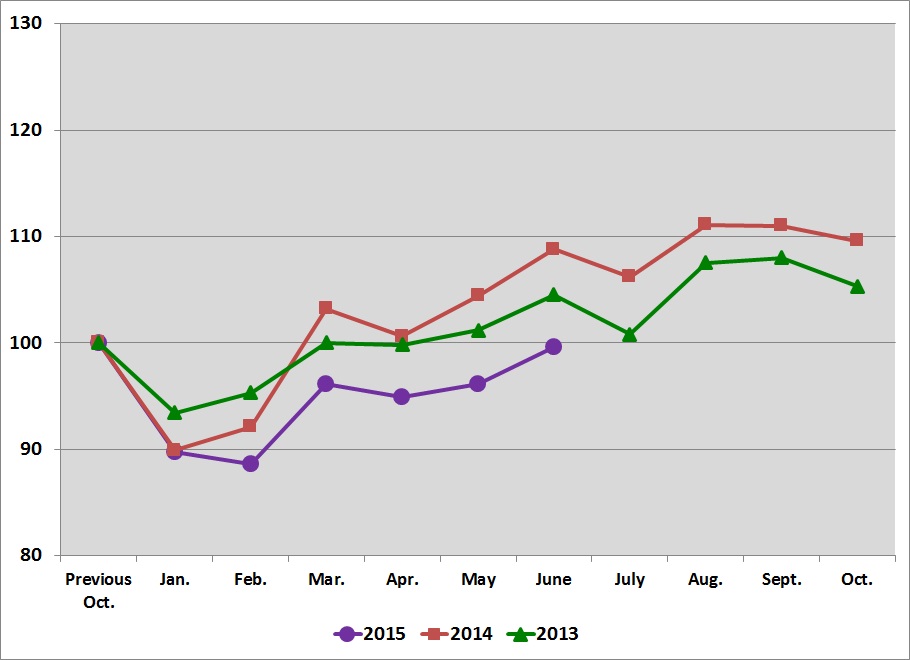
End Market Performance:
Fluctuations in end market business – The sequential trends noted above were directly linked to fluctuations in our end markets. To place this in perspective – approximately 50% of our business has historically been with customers engaged in some type of manufacturing. The daily sales to these customers grew, when compared to the same period in the prior year, as follows:
Q1 | Q2 | Q3 | Q4 | Annual | |||||||||||
2015 | 6.9 | % | 3.8 | % | |||||||||||
2014 | 9.0 | % | 11.2 | % | 13.7 | % | 13.8 | % | 12.0 | % | |||||
2013 | 7.0 | % | 5.9 | % | 4.7 | % | 7.2 | % | 6.3 | % | |||||
As indicated earlier, our manufacturing business consists of two subsets: the industrial production business (this is business where we supply products that become part of the finished goods produced by our customers and is sometimes referred to as OEM - original equipment manufacturing) and the maintenance portion (this is business where we supply products that maintain the facility or the equipment of our customers engaged in manufacturing and is sometimes referred to as MRO - maintenance, repair, and other). The industrial business is more fastener centered, while the maintenance portion is represented by all product categories.
The best way to understand the change in our industrial production business is to examine the results in our fastener product line (just under 40% of our business) which is heavily influenced by changes in our business with heavy equipment manufacturers. From a company perspective, sales of fasteners grew, when compared to the same period in the prior year, as follows (note: this information includes all end markets):
Q1 | Q2 | Q3 | Q4 | Annual | |||||||||||
2015 | 5.5 | % | 0.0 | % | |||||||||||
2014 | 1.6 | % | 5.5 | % | 9.9 | % | 11.4 | % | 6.9 | % | |||||
2013 | 1.7 | % | 1.9 | % | 1.0 | % | 1.9 | % | 1.6 | % | |||||
By contrast, the best way to understand the change in the maintenance portion of the manufacturing business is to examine the results in our non-fastener product lines. From a company perspective, sales of non-fasteners grew, when compared to the same period in the prior year, as follows (note: this information includes all end markets):
15
Q1 | Q2 | Q3 | Q4 | Annual | |||||||||||
2015 | 11.7 | % | 9.0 | % | |||||||||||
2014 | 14.2 | % | 17.1 | % | 17.6 | % | 19.0 | % | 17.2 | % | |||||
2013 | 10.8 | % | 8.5 | % | 8.9 | % | 12.0 | % | 10.1 | % | |||||
The non-fastener business demonstrated greater relative resilience over the last several years, when compared to our fastener business and to the distribution industry in general, due to our strong FAST Solutions® (industrial vending) program. However, this business was not immune to the impact of a weak industrial environment.
Our non-residential construction customers have historically represented 20% to 25% of our business. The daily sales to these customers grew when compared to the same period in the prior year, as follows:
Q1 | Q2 | Q3 | Q4 | Annual | |||||||||||
2015 | 6.2 | % | 1.6 | % | |||||||||||
2014 | 2.9 | % | 7.5 | % | 9.3 | % | 12.6 | % | 7.8 | % | |||||
2013 | 2.9 | % | 0.7 | % | 3.9 | % | 2.8 | % | 2.5 | % | |||||
Our non-residential construction business is heavily influenced by the industrial economy, particularly the energy sector. The volatility and weakness of energy prices has weakened this business, particularly in the last quarter.
A graph of the sequential daily sales trends to these two end markets in 2015, 2014, and 2013, starting with a base of '100' in the previous October and ending with the next October, would be as follows:
Manufacturing
16
Non-Residential Construction
GROWTH DRIVERS OF OUR BUSINESS
Note – Dollar amounts in this section are presented in whole dollars, not thousands.
We grow by continuously adding customers and by increasing the activity with each customer. We believe this growth is enhanced by great people located in close proximity to our customers. This allows us to provide a range of services and product availability that our competitors can't easily match. Historically, we expanded our reach by opening stores at a very fast pace. These openings were initially in the United States and expanded beyond the United States beginning in the mid 1990's.
For a little perspective, we began our business in 1967 with an idea to sell nuts and bolts (fasteners) through vending machines. We soon learned the technology of the 1960's wasn't ready, and also learned a lot of products didn't fit, so we went to 'Plan B'; sell to business users with a direct sales force. It took us a number of years to 'work out the bugs', but ten years later we began to pick up the pace of store openings. After another ten years of expansion we had approximately 50 stores and sales of about $20 million. Our need for cash to fund our growth was growing, as was our desire to allow employee ownership. This led us to a public offering in 1987.
In our first ten years of being public (1987 to 1997), we opened stores at an annual rate approaching 30% per year. In the next ten years (1997 to 2007), we opened stores at an annual rate of approximately 10% to 15% and, since 2007, at an annual rate of approximately 1% to 8%. We opened 24 stores in 2014, an annual rate of approximately 1%, have opened 8 stores in the first six months of 2015, and currently expect to open approximately 20 stores in total for 2015.
During our almost 50 years of business existence, we have constantly evolved to better serve the market (as is described in the paragraphs below) and have always been willing to challenge our approach. In our first 20 to 25 years, we closed several store locations because we felt the market was insufficient to operate a profitable 'fastener only' business. Every one of those locations was subsequently ‘reopened’ when our business model evolved to serve these markets profitably. During the last 20 to 25 years, we have enjoyed continued success with our store-based model, and we continue to challenge our approach. Based on this approach, we have closed approximately 85 stores in the last ten years - not because they weren’t successful, but rather because we felt we had a better approach to growth. In the first six months of 2014, we continued to challenge our approach and closed about 20 stores (all but four of these locations were in close proximity to another Fastenal store). In the second quarter of 2014, we took a hard look at our business and identified another 45 stores to close in the second half of 2014 (all but eight of these locations are in close proximity to another Fastenal store). During the second half of 2014, we identified some additional stores for closure and closed about 52 stores in total. Several items we think are noteworthy: the group of stores we identified for closure in the second half of 2014 was profitable in the first quarter of 2014 (our analysis measurement period); those stores operated with average sales of about $36 thousand per month. We chose to close this group because we felt this was simply a better approach to growing our business profitably. During the first six months of 2015, we closed 26 stores. Similar to 2014, we chose to close this group of stores because we felt this was simply a better approach. During the third quarter of 2014 (our analysis measurement period), 16 of these 26 stores were profitable.
17
There is a short-term price for closing these stores; and, since we believe we will maintain the vast majority of the sales associated with these locations and since most of the impacted employees have a nearby store from which to operate, the price primarily relates to the future commitments related to the leased locations. We have recorded the impaired future costs related to these commitments. The related expense was not material as these locations have relatively short lease commitments and minimal leasehold improvements. We use the term closed; however, we consider them to be consolidated into another location since the vast majority are in close proximity to another store.
During the years, our expanding footprint has provided us with greater access to more customers, and we have continued to diversify our growth drivers. This was done to provide existing store personnel with more tools to grow their business organically, and the results of this are reflected in our earlier discussion on sales growth at stores opened greater than five years. In the early 1990's, we began to expand our product lines beyond primarily fasteners, and we added new product knowledge to our bench (the non-fastener products now represent about 60% of our sales). This was our first big effort to diversify our growth drivers. The next step began in the mid to late 1990's when we began to add sales personnel with certain specialties or focus. This began with our National Accounts group in 1995, and, over time, has expanded to include individuals dedicated to: (1) sales related to our internal manufacturing division, (2) government sales, (3) internet sales, (4) construction, (5) specific products (most recently metalworking), and (6) FAST Solutions® (industrial vending). Another step occurred at our sales locations (this includes Fastenal stores as well as strategic account stores and in-plant locations) and at our distribution centers, and began with a targeted merchandising and inventory placement strategy that included our 'Customer Service Project' approximately thirteen years ago and our 'Master Stocking Hub' initiative approximately eight years ago. These strategies allowed us to better target where to stock certain products (local store, regional distribution center, master stocking hub, or supplier) and allowed us to improve our fulfillment, lower our freight costs, and improve our ability to serve a broader range of customers. During 2013 and 2014, we expanded our store based inventory offering around select industries (with an emphasis on fasteners, construction products, and safety products) and beginning in the latter half of 2013 we expanded two key employee groups: (1) the number of employees working in our stores and (2) the number of district and regional leaders supporting our stores. To improve the efficiency, accuracy, and capacity of our distribution centers, we made significant investments into distribution automation over the last several years (a majority of our facilities are now automated, and greater than 80% of our picking occurs at an automated distribution center). Finally, we also added a high frequency distribution center, internally known as T-HUB, to support vending and other high frequency selling activities. The theme that shines through in all these changes is a simple one – invest into and support our sales machine – the local store.
Over the last several years, our FAST Solutions® (industrial vending) operation has been an expanding component of our store-based business. We believe industrial vending will be an important chapter in the Fastenal story; we also believe it has the potential to be transformative to industrial distribution, and that we have a 'first mover' advantage. Given this, we have been investing aggressively to maximize the advantage.
Our expanded industrial vending portfolio consists of 20 different vending devices, with the FAST 5000 device, our helix based machine (think candy machine), representing approximately 40% of the installed machines. We have learned much about these devices over the last several years and currently have target monthly revenue ranging from under $1,000 to in excess of $3,000 per device. The following two tables provide two views of our data: (1) actual device count regardless of the type of machine and (2) ‘machine equivalent' count based on the weighted target monthly revenue of each device (compared to the FAST 5000 device, which has a $2,000 monthly revenue target). For example, the 12-door locker, with target monthly revenue of $750, would be counted as ‘0.375 machine equivalent’ (0.375 = $750/$2,000).
18
The industrial vending information related to contracts signed during each period was as follows:
Q1 | Q2 | Q3 | Q4 | Annual | ||||||||||||
Device count signed during the period | 2015 | 3,962 | 5,144 | |||||||||||||
2014 | 4,025 | 4,137 | 4,072 | 4,108 | 16,342 | |||||||||||
2013 | 6,568 | 6,084 | 4,836 | 4,226 | 21,714 | |||||||||||
'Machine equivalent' count signed during the period | 2015 | 2,916 | 3,931 | |||||||||||||
2014 | 2,974 | 3,179 | 3,189 | 3,243 | 12,585 | |||||||||||
2013 | 4,825 | 4,505 | 3,656 | 3,244 | 16,230 | |||||||||||
The industrial vending information related to installed machines at the end of each period was as follows:
Q1 | Q2 | Q3 | Q4 | ||||||||||||
Device count installed at the end of the period | 2015 | 48,545 | 50,620 | ||||||||||||
2014 | 42,153 | 43,761 | 45,596 | 46,855 | |||||||||||
2013 | 32,007 | 36,452 | 39,180 | 40,775 | |||||||||||
'Machine equivalent' count installed at the end of the | 2015 | 35,997 | 37,714 | ||||||||||||
period | 2014 | 30,326 | 31,713 | 33,296 | 34,529 | ||||||||||
2013 | 22,020 | 25,512 | 27,818 | 29,262 | |||||||||||
The following table includes some additional statistics regarding our sales and sales growth:
Q1 | Q2 | Q3 | Q4 | ||||||||||||
Percent of total net sales to customers with | 2015 | 40.5 | % | 40.9 | % | ||||||||||
industrial vending1 | 2014 | 37.8 | % | 37.0 | % | 37.8 | % | 39.3 | % | ||||||
2013 | 27.5 | % | 30.0 | % | 33.3 | % | 36.6 | % | |||||||
Daily sales growth to customers with | 2015 | 12.3 | % | 8.6 | % | ||||||||||
industrial vending2 | 2014 | 19.7 | % | 20.9 | % | 21.9 | % | 20.0 | % | ||||||
2013 | 23.9 | % | 18.9 | % | 15.2 | % | 18.7 | % | |||||||
1 The percentage of total sales (vended and traditional) to customers currently using a vending solution.
2 The growth in total sales (vended and traditional) to customers currently using a vending solution compared to the same period in the preceding year.
In addition to the industrial vending operation noted above, which primarily relates to our non-fastener business, we also provide bin stock programs (also known as ‘keep fill’ programs in the industry) to numerous customers. This business, which relates to both our maintenance customers (MRO fasteners and non-fasteners) and original equipment manufacturers (OEM fasteners), has many similar attributes to our industrial vending relationships. These attributes include a strong relationship with these customers, where we are often their preferred supplier, and a frequent level of business transactions. This business is performed without the aid of a vending machine, but does make use of the latest scanning technologies, scale systems, and our fully integrated distribution network to manage the supply chain for all sizes of customers. In recent years, we have begun to refer to this business as FMI (Fastenal Managed Inventory).
PROFIT DRIVERS OF OUR BUSINESS
As we state several times in this document, profit is important to us. For a distribution business profit and cash flow go hand in hand, and this cash flow funds our growth; creates value for our customers, our employees, our suppliers, and our shareholders; and provides us with short-term and long-term flexibility. Over time, we grow our profits by continuously working to grow sales and to improve our relative profitability. We achieve our improvements in relative profitability by improving our relative gross profit, by structurally lowering our operating and administrative expenses, or both.
We also grow our profits by allowing our inherent profitability to shine through - we refer to this as the 'pathway to profit'. The distinction is important. The ‘pathway to profit’ to which we refer is merely the natural ‘per store’ leverage that occurs as the average net sales per month of a store increases. There are two diverging trends that occur as a store grows; first, the gross profit percentage at a store generally declines and, second, our operating and administrative expenses as a percentage of sales
19
generally improve. The expense improvement starts on day one, the gross profit percentage decline typically occurs when the average sales at a store move above $100 thousand per month. Fortunately, the expense improvements typically far outweigh the gross profit percentage declines.
The best way to appreciate this dynamic is to look at the cost components of our business. The cost components of a store include the following: (1) cost of goods and (2) operating and administrative expenses. The operating and administrative expenses can be further split into (listed by relative size): (1) people costs (base pay, incentive pay, benefits, training, and payroll related taxes), (2) occupancy costs (facility expenses such as rent, property taxes, repairs, and depreciation on owned facilities, as well as utility costs, equipment expenses, and vending machine related expenses), and (3) ‘all other’ expenses. The largest component of the last category being the vehicles needed in each store to support selling activities.
The first component, costs of goods, is directly related to sales and fluctuations in sales. However, it is also heavily influenced by product and customer mix. Because of this influence, our gross profit (the residual of net sales after deducting the related cost of goods), when stated as a percentage of net sales, generally declines as the average monthly net sales of a store increases. This is due to the mix impact of larger customers.
The second component, operating and administrative expenses, does just the opposite, it generally improves as a percentage of net sales. This is due to the fixed nature of our ‘open for business’ expenses and the attractive incremental profit margin typically realized in our remaining variable expenses. The ‘open for business’ expenses are merely the expenses needed to ‘just keep the front door open’, and they relate to a base staffing level, a base facility cost, and base vehicle costs. These expenses do not generate a profit; however, they create the opportunity for future success (and expenses) that will generate profits. This future success generates a good profit and return, and drives our ‘pathway to profit’.
STATEMENT OF EARNINGS INFORMATION (percentage of net sales) for the periods ended June 30: | |||||||||||
Six-month Period | Three-month Period | ||||||||||
2015 | 2014 | 2015 | 2014 | ||||||||
Net sales | 100.0 | % | 100.0 | % | 100.0 | % | 100.0 | % | |||
Gross profit | 50.5 | % | 51.0 | % | 50.3 | % | 50.8 | % | |||
Operating and administrative expenses | 28.6 | % | 29.9 | % | 27.7 | % | 29.1 | % | |||
Gain on sale of property and equipment | 0.0 | % | 0.0 | % | 0.0 | % | 0.0 | % | |||
Operating income | 22.0 | % | 21.1 | % | 22.6 | % | 21.8 | % | |||
Net interest income (expense) | -0.1 | % | 0.0 | % | -0.1 | % | 0.0 | % | |||
Earnings before income taxes | 22.0 | % | 21.1 | % | 22.6 | % | 21.8 | % | |||
Note – Amounts may not foot due to rounding difference. | |||||||||||
Gross profit – The gross profit percentage in the first, second, third, and fourth quarters was as follows:
Q1 | Q2 | Q3 | Q4 | ||||||||
2015 | 50.8 | % | 50.3 | % | |||||||
2014 | 51.2 | % | 50.8 | % | 50.8 | % | 50.5 | % | |||
2013 | 52.3 | % | 52.2 | % | 51.7 | % | 50.6 | % | |||
Over the last several years our gross profit has fluctuated due to our mix of store sizes, customer sizes, products, geographies, end markets, and end market uses (such as industrial production business versus maintenance business). We have previously indicated a short-term expectation for gross profit of around 51%; however, we would expect this percentage to decline over time as our average store size grows (see discussion earlier under 'Profit Drivers of our Business' and below). As stated below, this structural gross profit change centers primarily on customer mix and, to a lesser degree, product mix. However, as discussed in the operating and administrative expenses section below, we would expect this structural change to improve operating and administrative expenses as a percentage of net sales, as was evident this quarter.
Ignoring the long-term trend just noted, our short-term gross profit percentages historically fluctuate due to impacts related to (1) transactional gross profit (either related to product and customer mix or to freight), (2) organizational gross profit (sourcing strength that can occur as we leverage buying scale and efficiency), and (3) supplier incentive gross profit (impacts from supplier volume allowances). In the short-term, periods of inflation or deflation can influence the first two categories, while sudden changes in business volume can influence the third (as we experienced in the second quarter of 2015 when reduced supplier incentives contributed to about half of our gross profit drop since the first quarter of 2015). The transactional gross profit, our most meaningful component, is heavily influenced by our store-based compensation programs, which are directly linked to sales growth and gross profit, and incentivize our employees to improve both.
20
An important aspect of our gross profit relates to our locations, our product mix, and our customer mix. Given the close proximity of our sales personnel to our customer’s business, we offer a very high service level with our sales, which is valued by our customers and improves our gross profit. Fasteners are our highest gross profit product line given the high transaction cost surrounding the sourcing and supply of the product for our customers. Fasteners currently account for approximately 40% of our sales. We expect any reduction in the mix of our sales attributable to fasteners to negatively impact gross profit, particularly as it relates to maintenance fasteners. Gross profit is also influenced by average store sales as noted earlier in this document. Larger stores have larger customers, whose more focused buying patterns allow us to offer them better pricing. As a result, growth in average store sales is expected to negatively impact gross profit. A final item of note, our fourth quarter has typically been the season with the most challenges surrounding gross profit. This relates to the decline in sales in November and December due to the ‘holiday season’ and due to the drop off in non-residential construction business. This drop off in sales reduces the utilization of our trucking network and can slightly reduce our gross profit.
Our gross profit, as a percentage of net sales, decreased in the first six months of 2015 when compared to the first six months of 2014. This decrease centered on transactional impacts driven by changes in product and customer mix, as well as a reduction in supplier incentives as discussed earlier in this document. Our gross profit, as a percentage of net sales, also decreased in the second quarter of 2015 when compared to the second quarter of 2014 for similar reasons.
Operating and administrative expenses - decreased as a percentage of net sales in both the six month period and in the second quarter of 2015 versus same periods of 2014.
Historically, our two largest components of operating and administrative expenses have consisted of employee related expenses (approximately 65% to 70%) and occupancy related expenses (approximately 15% to 20%). The remaining expenses cover a variety of items with selling transportation typically being the largest.
The three largest components of operating and administrative expenses grew or contracted as follows for the periods ended June 30 (compared to the same period in the preceding year):
Six-month Period | Three-month Period | ||||||||||
2015 | 2014 | 2015 | 2014 | ||||||||
Employee related expenses | 3.6 | % | 9.3 | % | 0.9 | % | 12.2 | % | |||
Occupancy related expenses | 5.4 | % | 8.9 | % | 3.7 | % | 9.2 | % | |||
Selling transportation costs | -20.4 | % | 16.7 | % | -20.7 | % | 15.9 | % | |||
Employee related expenses include: (1) payroll (which includes cash compensation, stock option expense, and profit sharing), (2) health care, (3) personnel development, and (4) social taxes. For the first six months of 2015, when compared to the first six months of 2014, our performance bonuses and commissions grew, as well as our profit sharing contribution, primarily due to our expanding growth in operating income in the first quarter of 2015 versus the first quarter of 2014. These factors, combined with an increase in full-time equivalent headcount (see table below), caused employee related expenses to grow, and were partially offset by a reduction in health care costs and by a focused reduction in overtime hours paid. The increase in the second quarter of 2015, when compared to the second quarter of 2014, was driven by the same factors as the six month period. For the first six months of 2014, when compared to the first six months of 2013, (1) our performance bonuses and commissions grew due to our expanding sales growth from the prior year, (2) our profit sharing contribution contracted due to lower relative profitability, and (3) our health care costs grew. These factors, combined with a 14.4% increase in full-time equivalent headcount, caused employee related costs to grow. Employee related expenses in the second quarter of 2014, when compared to 2013, grew for similar reasons; the noteworthy differences being a greater growth in bonuses and commissions as well as a 15.0% increase in full-time equivalent headcount.
On average, the full-time equivalent headcount grew as follows for the periods ended June 30 (compared to the same period in the preceding year):
Six-month Period | Three-month Period | ||||||||||
2015 | 2014 | 2015 | 2014 | ||||||||
Store based | 3.2 | % | 15.9 | % | 4.2 | % | 16.8 | % | |||
Total selling (includes store) | 3.4 | % | 15.2 | % | 4.2 | % | 15.9 | % | |||
Distribution | 6.8 | % | 14.4 | % | 6.3 | % | 14.6 | % | |||
Manufacturing | -0.4 | % | 10.7 | % | -0.7 | % | 12.2 | % | |||
Administrative | 6.4 | % | 8.3 | % | 6.2 | % | 7.8 | % | |||
Total headcount | 3.9 | % | 14.4 | % | 4.4 | % | 15.0 | % | |||
21
Occupancy related expenses include: (1) building rent and depreciation, (2) building utility costs, (3) equipment related to our stores and distribution locations, and (4) FAST Solutions® (industrial vending) equipment (we consider the vending equipment to be a logical extension of our store operation and classify the expense as occupancy). The increase in the first six months of 2015, when compared to the first six months of 2014, was driven by (1) an increase in the amount of FAST Solutions® (industrial vending) equipment as discussed earlier in this document, and (2) an increased investment in our distribution infrastructure over the last several years, primarily related to automation. This increase was partially offset by a reduction in utility costs at store locations and by the impact of an accrual related to closed and closing store locations in 2014. The increase in the second quarter of 2015, when compared to the second quarter of 2014, was driven by the same factors as the six month period. The increase in the first six months of 2014, when compared to the first six months of 2013, was driven by (1) an increase in the amount of FAST Solutions® (industrial vending) equipment as discussed earlier in this document, (2) an increase in building utility costs due to a severe winter in January and February 2014, (3) a nominal increase in the number of store locations, (4) an increased investment in our distribution infrastructure over the last several years, primarily related to automation, and (5) an accrual related to closed and closing store locations. The increase in the second quarter of 2014, when compared to the second quarter of 2013, was driven by the same factors as the six month period except for the winter component.
Our selling transportation costs consist primarily of our store fleet as most of the distribution fleet costs are included in the cost of sales. The decrease in the first six months of 2015, when compared to the first six months of 2014, was driven by the decline in fuel costs (see discussion below) and an increase in gains on the sales of our leased vehicles, which was partially offset by the increase in store headcount and the reduction in mileage per gallon associated with severe winter driving conditions. The decrease in the second quarter of 2015, when compared to the second quarter of 2014, was driven by the same factors as the six month period except for the winter component. The increase in the first six months of 2014, when compared to the first six months of 2013, was driven by the increase in store headcount and the reduction in mileage per gallon associated with winter driving conditions. The increase in the second quarter of 2014, when compared to the second quarter of 2013, was driven by the same factors as the six month period except for the winter component.
The last several years have seen some variation in the cost of diesel fuel and gasoline – During the first and second quarters of 2015, our total vehicle fuel costs were approximately $8.8 million and $9.1 million, respectively. During the first, second, third, and fourth quarters of 2014, our total vehicle fuel costs were approximately $11.9, $12.5, $11.5, and $9.5 million, respectively. The changes resulted from variations in fuel costs, variations in the service levels provided to our stores from our distribution centers, changes in the number of vehicles at our store locations, changes in the number of other sales centered vehicles as a result of store openings and the expansion of our non-store sales force, and changes in driving conditions. These fuel costs include the fuel utilized in our distribution vehicles (semi-tractors, straight trucks, and sprinter trucks) which is recorded in cost of sales and the fuel utilized in our store delivery and other sales centered vehicles which is included in operating and administrative expenses (the split in the last several years has been approximately 50:50 between distribution and store and other sales centered use).
Income taxes – Income taxes, as a percentage of earnings before income taxes, were approximately 37.5% and 37.1%, respectively, for each of the first six months of 2015 and 2014. As our international business and profits grow over time, the lower income tax rates in those jurisdictions, relative to the United States, reduce our effective tax rate. The increase in the first six months of 2015, when compared to the first six months of 2014, was driven by the expiration of federal tax credits in 2015, an increase in valuation allowances on deferred tax assets, and a reduction to the reserve for uncertain tax positions, due to a statute of limitations lapse, which occurred in the first quarter of 2014.
22
CASH FLOW IMPACT ITEMS
As indicated earlier, we included this section to provide some added insight into the items that impact our cash flow.
OPERATIONAL WORKING CAPITAL
The year-over-year comparison and the related dollar and percentage changes related to accounts receivable and inventories were as follows:
Balance at June 30: | Twelve-month Dollar Change | Twelve-month Percentage Change | ||||||||||||||||||||
2015 | 2014 | 2013 | 2015 | 2014 | 2015 | 2014 | ||||||||||||||||
Accounts receivable, net | $ | 537,650 | 502,330 | 436,452 | 35,320 | 65,878 | 7.0 | % | 15.1 | % | ||||||||||||
Inventories | 876,697 | 818,771 | 725,107 | 57,926 | 93,664 | 7.1 | % | 12.9 | % | |||||||||||||
Operational working capital(1) | $ | 1,414,347 | 1,321,101 | 1,161,559 | 93,246 | 159,542 | 7.1 | % | 13.7 | % | ||||||||||||
Sales in last two months | $ | 663,356 | 634,790 | 560,974 | 28,566 | 73,816 | 4.5 | % | 13.2 | % | ||||||||||||
(1) For purposes of this discussion, we are defining operational working capital as accounts receivable, net and inventories.
The growth in net accounts receivable noted above was driven by our sales growth in the final two months of the period. The strong growth in recent years of our international business and of our large customer accounts has created meaningful difficulty with managing the growth of accounts receivable relative to the growth in sales.
Our growth in inventory balances over time does not have as direct a relationship to our monthly sales patterns as does our growth in accounts receivable. This is impacted by other aspects of our business. For example, the dramatic economic slowdown in late 2008 and early 2009 caused our inventory to spike. This occurred because the lead time for inventory procurement is typically longer than the visibility we have into future monthly sales patterns. Over the last decade, we increased our relative inventory levels due to the following: (1) new store openings, (2) expanded stocking breadth at distribution centers (for example, our master stocking hub in Indianapolis expanded its product breadth over six fold from 2005 to 2011), (3) expanded direct sourcing, (4) expanded exclusive brands (private label), (5) expanded industrial vending solutions, (6) national accounts growth, (7) international growth, and (8) expanded stocking breadth at individual stores. While all of these items impacted both 2015 and 2014, items (3) through (8) had the greatest impact.
BALANCE SHEET AND CASH FLOW
Our balance sheet continues to be very strong and our operations have good cash generating characteristics. During the second quarter of 2015, we generated $81,049 (or 57.7% of net earnings) of operating cash flow (this was 61.0% in the same period in 2014); year-to-date, we generated $261,154 (or 97.5% of net earnings) of operating cash flow (this was 92.0% in the same period in 2014). Our first quarter typically has stronger cash flow characteristics due to the timing of tax payments; this benefit reverses itself in the second, third, and fourth quarters as income tax payments go out in April, June, September, and December. The remaining amounts of cash flow from operating activities are largely linked to the pure dynamics of a distribution business and its strong correlation to working capital as discussed above. During 2014, and the first six months of 2015, we incurred some debt to fund capital expenditures, purchases of our common stock, and payments of dividends as further discussed earlier in this document. This was expected and is expected to continue in 2015.
Our dividends (per share basis) were as follows in 2015 and 2014:
2015 | 2014 | ||||||||
First quarter | $ | 0.28 | $ | 0.25 | |||||
Second quarter | 0.28 | 0.25 | |||||||
Third quarter | 0.28 | * | 0.25 | ||||||
Fourth quarter | 0.25 | ||||||||
Total | $ | 0.84 | $ | 1.00 | |||||
*The third quarter dividend was declared on July 13, 2015, and is payable on August 25, 2015 to shareholders of record at the close of business on July 28, 2015.
23
STOCK PURCHASES
During the first and second quarters of 2015, we purchased 2,000,000 and 4,000,000 shares respectively, of our common stock at an average price of approximately $40.93 and $42.14 per share, respectively. During 2014, we purchased a total of 1,200,000 shares of our common stock at an average price of $44.12 per share. We currently have authority to purchase up to an additional 4,000,000 shares of our common stock.
CRITICAL ACCOUNTING POLICIES:
A discussion of the critical accounting policies related to accounting estimates is contained in our 2014 annual report on Form 10-K, and in Note 8 to the 'Notes to Condensed Consolidated Financial Statements' in this Form 10-Q.
LIQUIDITY AND CAPITAL RESOURCES:
Cash flow activity in dollars and as a percentage of net earnings was as follows:
Six-month Period | ||||||
2015 | 2014 | |||||
Net cash provided by operating activities | $ | 261,154 | 222,929 | |||
Net cash used in investing activities | $ | 83,928 | 94,911 | |||
Net cash used in financing activities | $ | 166,976 | 80,569 | |||
Net cash provided by operating activities | 97.5 | % | 92.0 | % | ||
Net cash used in investing activities | 31.3 | % | 39.1 | % | ||
Net cash used in financing activities | 62.3 | % | 33.2 | % | ||
Net cash provided by operating activities increased from the prior year. The increase was driven by growth in net earnings, the decrease in other current assets, and the increase in accounts payable. This was partially offset by the timing of income tax payments, and the cash required to fund our net working capital growth, which includes trade accounts receivable and inventory changes.
Net cash used in investing activities changed primarily due to changes in capital expenditures. Property and equipment expenditures in the first six months of 2015 and 2014 consisted of: (1) the purchase of software and hardware for Fastenal’s information processing systems, (2) the addition of certain pick-up trucks, (3) the purchase of signage, shelving, and other fixed assets related to store openings, (4) the addition of manufacturing and warehouse equipment, (5) the expansion or improvement of certain owned or leased store properties, (6) the expansion of Fastenal’s distribution/trucking fleet, (7) purchases related to FAST Solutions® (industrial vending), and (8) the expansion of distribution capabilities related to automation (including with respect to vending). Of these factors, the items related to industrial vending created the greatest impact to our capital expenditures in 2015, while the items related to industrial vending and distribution automation created the greatest impact to our capital expenditures in 2014. Disposals of property and equipment in both periods consisted of the planned disposition of certain pick-up trucks, semi-tractors, and trailers in the normal course of business.
Cash requirements for property and equipment expenditures were satisfied from net earnings, cash on hand, short-term borrowings, and the proceeds of disposals. We anticipate funding our current expansion plans with cash generated from operations, from available cash and cash equivalents, and from our borrowing capacity.
Net cash used in financing activities consisted of the payments of dividends and purchases of our common stock, partially offset by the proceeds from the exercise of stock options. During the first six months of 2015 and 2014, we utilized borrowings to fund certain needs including borrowings in the first six months of 2015 to fund the increased purchases of our common stock.
Cash Commitments – A discussion of the nature and amount of future cash commitments, other than under our revolving credit facility, is contained in our 2014 annual report on Form 10-K. That portion of the debt outstanding under our revolving credit facility classified as long-term, and the maturity of that debt, is described earlier in Note 6 to the ‘Notes to Condensed Consolidated Financial Statements’.
Unremitted Foreign Earnings – Approximately $87 million of cash and cash equivalents are held by non-U.S. subsidiaries. These funds may create foreign currency transaction gains or losses depending on the functional currency of the entity holding the cash. There are no significant restrictions that would preclude us from bringing these funds back to the U.S. The income tax impact of repatriating cash associated with certain undistributed earnings is discussed in our most recently filed annual report
24
on Form 10-K under Note 7 to the ‘Notes to Consolidated Financial Statements’. There has been no material changes in unremitted earnings in the form of cash.
Certain Risks and Uncertainties – Certain statements contained in this document do not relate strictly to historical or current facts. As such, they are considered 'forward-looking statements' that provide current expectations or forecasts of future events. These forward-looking statements are made pursuant to the safe harbor provisions of the Private Securities Litigation Reform Act of 1995. Such statements can be identified by the use of terminology such as anticipate, believe, should, estimate, expect, intend, may, plan, goal, strive, project, will, potential, momentum, trend, target, normal, view, and similar words or expressions. Any statement that is not a historical fact, including estimates, projections, future trends, and the outcome of events that have not yet occurred, is a forward-looking statement. Our forward-looking statements generally relate to our expectations regarding the business environment in which we operate, our projections of future performance, our perceived marketplace opportunities, and our strategies, goals, mission, and vision. You should understand that forward-looking statements involve a variety of risks and uncertainties, known and unknown, and may be affected by inaccurate assumptions. Consequently, no forward-looking statement can be guaranteed and actual results may vary materially. Factors that could cause our actual results to differ from those discussed in the forward-looking statements include, but are not limited to, economic downturns, weakness in the manufacturing or commercial construction industries, competitive pressure on selling prices, changes in our current mix of products, customers or geographic locations, changes in our average store size, changes in our purchasing patterns, changes in customer needs, changes in fuel or commodity prices, inclement weather, changes in foreign currency exchange rates, difficulty in adapting our business model to different foreign business environments, weak acceptance or adoption of vending technology or increased competition in industrial vending, difficulty in maintaining installation quality as our industrial vending business expands, difficulty in hiring, relocating, training or retaining qualified personnel, failure to accurately predict the number of North American markets able to support stores or to meet store opening goals, difficulty in controlling operating expenses, difficulty in collecting receivables or accurately predicting future inventory needs, dramatic changes in sales trends, changes in supplier production lead times, changes in our cash position or our need to make capital expenditures, changes in tax law, changes in the availability or price of commercial real estate, changes in the nature or price of distribution and other technology, cyber-security incidents, potential liability and reputational damage that can arise if our products are defective, and other risks and uncertainties detailed in our filings with the Securities and Exchange Commission, including our most recent annual and quarterly reports. Each forward-looking statement speaks only as of the date on which such statement is made, and we undertake no obligation to update any such statement to reflect events or circumstances arising after such date.
ITEM 3 — QUANTITATIVE AND QUALITATIVE DISCLOSURES ABOUT MARKET RISK
We are exposed to certain market risks from changes in foreign currency exchange rates, commodity steel pricing, commodity energy prices, and interest rates. Changes in these factors cause fluctuations in our earnings and cash flows. We evaluate and manage exposure to these market risks as follows:
Foreign currency exchange rates – Foreign currency fluctuations can affect our net investments and earnings denominated in foreign currencies. Our primary exchange rate exposure is with the Canadian dollar against the United States dollar. Our estimated net earnings exposure for foreign currency exchange rates was not material at the end of the period.
Commodity steel pricing – We buy and sell various types of steel products; these products consist primarily of different types of threaded fasteners. In 2013, 2014, and the first six months of 2015, we noted some deflation in overall steel pricing. We are exposed to the impacts of commodity steel pricing and our related ability to pass through the impacts to our end customers.
Commodity energy prices – We have market risk for changes in prices of gasoline, diesel fuel, natural gas, and electricity; however, this risk is mitigated in part by our ability to pass freight costs to our customers, the efficiency of our trucking distribution network, and the ability, over time, to manage our occupancy costs related to the heating and cooling of our facilities through better efficiency.
Interest rates - A description of our unsecured revolving credit facility is contained in Note 6 of the ‘Notes to Condensed Consolidated Financial Statements’ and is incorporated herein by reference. We do not believe our operations are currently subject to significant market risk for interest rate exposure under the credit facility.
ITEM 4 — CONTROLS AND PROCEDURES
Evaluation of Disclosure Controls and Procedures – As of the end of the period covered by this report, we conducted an evaluation, under the supervision and with the participation of the principal executive officer and principal financial officer, of our disclosure controls and procedures (as defined in Rules 13a-15(e) and 15d-15(e) under the Securities Exchange Act of 1934 (the 'Securities Exchange Act')). Based on this evaluation, the principal executive officer and principal financial officer concluded that our disclosure controls and procedures are effective to ensure that information required to be disclosed by us in
25
reports that we file or submit under the Securities Exchange Act is recorded, processed, summarized, and reported within the time periods specified in SEC rules and forms, and is accumulated and communicated to our management, including the principal executive officer and principal financial officer, to allow for timely decisions regarding disclosure. There was no change in our internal control over financial reporting during our most recently completed fiscal quarter that has materially affected, or is reasonably likely to materially affect, our internal control over financial reporting.
PART II — OTHER INFORMATION
ITEM 1 — LEGAL PROCEEDINGS
A description of our legal proceedings, if any, is contained in Note 6 to the 'Notes to Condensed Consolidated Financial Statements'. The description of legal proceedings, if any, in Note 6 is incorporated herein by reference.
ITEM 1A — RISK FACTORS
We are affected by risks specific to us as well as factors that affect all businesses operating in a global market. The significant factors known to us that could materially adversely affect our business, financial condition, or operating results are described in Item 2 of Part I above and in our most recently filed annual report on Form 10-K under Forward-Looking Statements and Item 1A – Risk Factors. There has been no material change in those risk factors.
ITEM 2 — UNREGISTERED SALES OF EQUITY SECURITIES AND USE OF PROCEEDS
Issuer Purchases of Equity Securities
The table below sets forth information regarding purchases of our common stock during the second quarter of 2015:
(a) | (b) | (c) | (d) | |||||||||
Period | Total Number of Shares Purchased | Average Price Paid per Share | Total Number of Shares Purchased as Part of Publicly Announced Plans or Programs | Maximum Number (or Approximate Dollar Value) of Shares that May Yet Be Purchased Under the Plans or Programs | ||||||||
April 1-30, 2015 | 3,000,000 | $41.97 | 3,000,000 | 1,000,000 | ||||||||
May 1-31, 2015 | 1,000,000 | $42.64 | 1,000,000 | 4,000,000 | 1 | |||||||
June 1-30, 2015 | 0 | $0.00 | 0 | 4,000,000 | ||||||||
Total | 4,000,000 | $42.14 | 4,000,000 | 4,000,000 | ||||||||
1 | On May 1, 2015, our board of directors increased the maximum number of shares of our common stock that may be purchased by an additional 4,000,000 shares. With the addition of the May 1, 2015 authorization, we currently have authority to purchase up to a total of 4,000,000 shares of our common stock. Any future purchases will be made under this authorization. This authorization does not have an expiration date. |
ITEM 6 — EXHIBITS
3.1 | Restated Articles of Incorporation of Fastenal Company, as amended (incorporated by reference to Exhibit 3.1 to Fastenal Company’s Form 10-Q for the quarter ended March 31, 2012) |
3.2 | Restated By-Laws of Fastenal Company (incorporated by reference to Exhibit 3.2 to Fastenal Company’s Form 8-K dated as of October 15, 2010 (File No. 0-16125)) |
10.1 | Credit Agreement dated as of May 1, 2015 among Fastenal Company, the Lenders party thereto, and Wells Fargo Bank, National Association, as Administrative Agent (incorporated by reference to Exhibit 10.1 to Fastenal Company's Form 8-K dated May 1, 2015) |
31 | Certifications under Section 302 of the Sarbanes-Oxley Act of 2002 |
32 | Certification under Section 906 of the Sarbanes-Oxley Act of 2002 |
101 | The following financial statements from Fastenal Company’s Quarterly Report on Form 10-Q for the quarter ended June 30, 2015, filed on July 17, 2015, formatted in Extensible Business Reporting Language (XBRL): (i) Condensed Consolidated Statements of Earnings, (ii) Condensed Consolidated Statements of Comprehensive Income, (iii) Condensed Consolidated Balance Sheets, (iv) Condensed Consolidated Statements of Cash Flows, and (v) the Notes to Condensed Consolidated Financial Statements. |
26
SIGNATURES
Pursuant to the requirements of the Securities Exchange Act of 1934, the registrant has duly caused this report to be signed on its behalf by the undersigned thereunto duly authorized.
FASTENAL COMPANY | ||
Date: July 17, 2015 | /s/ Leland J. Hein | |
Leland J. Hein | ||
President and Chief Executive Officer | ||
(Duly Authorized Officer) | ||
Date: July 17, 2015 | /s/ Daniel L. Florness | |
Daniel L. Florness | ||
Executive Vice President and Chief Financial Officer | ||
(Principal Financial Officer) | ||
27
INDEX TO EXHIBITS
3.1 | Restated Articles of Incorporation of Fastenal Company, as amended | (Incorporated by reference) | |
3.2 | Restated By-Laws of Fastenal Company | (Incorporated by reference) | |
10.1 | Credit Agreement dated as of May 1, 2015 among Fastenal Company, the Lenders party thereto, and Wells Fargo Bank, National Association, as Administrative Agent | (Incorporated by reference) | |
31 | Certifications under Section 302 of the Sarbanes-Oxley Act of 2002 | Electronically Filed | |
32 | Certification under Section 906 of the Sarbanes-Oxley Act of 2002 | Electronically Filed | |
101.INS | XBRL Instance Document | Electronically Filed | |
101.SCH | XBRL Taxonomy Extension Schema Document | Electronically Filed | |
101.CAL | XBRL Taxonomy Extension Calculation Linkbase Document | Electronically Filed | |
101.DEF | XBRL Taxonomy Extension Definition Linkbase Document | Electronically Filed | |
101.LAB | XBRL Taxonomy Extension Label Linkbase Document | Electronically Filed | |
101.PRE | XBRL Taxonomy Extension Presentation Linkbase Document | Electronically Filed | |
28