Attached files
| file | filename |
|---|---|
| 8-K - FIRST CONNECTICUT BANCORP, INC. 8-K 3 31 14 - First Connecticut Bancorp, Inc. | fcb8k331.htm |

Sterne Agee New England Banks Bus Tour March 31, 2014 John J. Patrick, Jr. Chairman, President and CEO Gregory A. White EVP, Chief Financial Officer Michael T. Schweighoffer EVP, Chief Lending Officer A Great Past…Dynamic Present… And a Bright Future

Forward Looking Statements Disclaimer & Forward-Looking Statements Statements in this document and presented orally at the conference, if any, concerning future results, performance, expectations or intentions are forward-looking statements. Actual results, performance or developments may differ materially from forward-looking statements as a result of known or unknown risks, uncertainties and other factors, including those identified from time to time in the Company’s filings with the Securities and Exchange Commission, press releases and other communications. Actual results also may differ based on the Company’s ability to successfully maintain and integrate customers from acquisitions. The Company intends any forward-looking statements to be covered by the Litigation Reform Act of 1995 and is including this statement for purposes of said safe harbor provisions. Readers and attendees are cautioned not to place undue reliance on forward-looking statements, which speak only as of the date of this presentation. Except as required by applicable law or regulation, the Company undertakes no obligation to update any forward-looking statements to reflect events or circumstances that occur after the date as of which such statements are made. The Company’s capital strategy includes deployment of excess capital, the success of which efforts cannot be guaranteed. *

Farmington Bank, founded in 1851, is a wholly owned subsidiary of First Connecticut Bancorp, Inc. Community bank with a strong capital position, positive trends in loan and deposit growth, and solid asset quality Focused on building long term shareholder value Experienced management team focused on organic growth strategy Clear strategic priorities Leveraged balance sheet with loans rather than investments Strong, scalable franchise in central Connecticut Broad risk management program focused on “best practices” Culture that encourages a decision-making process that allows for teamwork, yet places clear responsibility and authority with the individual Executive Summary *

Franchise Overview 22 full service branch offices De novo strategy completed in January 2014 Strategically covering affluent Hartford, CT suburbs 22 Branch Offices First Connecticut Bancorp, Inc. - NASDAQ (FBNK) Farmington Bank - wholly owned subsidiary Headquarters: Farmington, Connecticut Assets: $2.1 billion Loans: $1.8 billion Deposits: $1.5 billion Capital: $232 million (as of 12/31/13) Corporate Profile *

Market Position * Source: SNL Financial *includes limited service branches Note: Deposit data as of 6/30/2013; Pro forma for pending and recently completed transactions Too big to be small……. Too small to be big……. Rank Parent Company Name Number of Branches* Deposits in Market ($000) Market Share (%) 1 Webster Financial Corp. 26 $2,420 21.86% 2 Toronto-Dominion Bank 17 $2,134 19.28% 3 Bank of America Corp. 20 $1,650 14.90% 4 First Connecticut Bancorp Inc. 25 $1,497 13.53% 5 People's United Financial Inc. 23 $1,053 9.51% 6 Banco Santander SA 13 $793 7.16% 7 Rockville Financial Inc. 8 $587 5.30% 8 First Niagara Financial Group Inc. 9 $534 4.82% 9 Liberty Bank 10 $241 2.18% 10 Royal Bank of Scotland Group Plc 3 $159 14.40% Totals (1-10) 154 $11,068 93.20% Totals (1-20) 169 $11,875 100.00% FBNK Zip Codes of Operation Hartford County, CT Hartford County, CT Hartford County, CT Hartford County, CT Hartford County, CT Rank Institution (ST) Number of Branches * Deposits in Market ($000) Market Share (%) 1 Bank of America Corp. (NC) 42 17,416,470 51.87 2 Webster Financial Corp. (CT) 45 3,816,396 11.37 3 Toronto-Dominion Bank 25 2,549,335 7.59 4 People's United Financial Inc. (CT) 36 1,711,562 5.10 5 First Connecticut Bancorp, Inc. (CT) 25 1,496,991 4.46 6 Rockville Financial Inc. (CT) 22 1,306,135 3.89 7 Santander 24 1,297,264 3.86 8 First Niagara Finl Group (NY) 20 1,159,503 3.45 9 Wells Fargo & Co. (CA) 6 706,421 2.10 10 SBT Bancorp Inc. (CT) 4 324,632 0.97 Totals (1 - 10) 249 31,784,709 Totals (1 - 22) 295 33,578,507 Note: Market Share is for U.S. Territories only and non-retail branches are not included. Note: Market Share is for U.S. Territories only and non-retail branches are not included. Note: Market Share is for U.S. Territories only and non-retail branches are not included. Note: Market Share is for U.S. Territories only and non-retail branches are not included. Note: Market Share is for U.S. Territories only and non-retail branches are not included.

Leadership Team * Name Title Years in Industry Prior Experience John J. Patrick, Jr. Chairman, President and Chief Executive Officer 34 TD Banknorth CT, President and CEO Gregory A. White Executive Vice President, Chief Financial Officer and Treasurer 27 Rockville Bank, Chief Financial Officer and Treasurer Michael T. Schweighoffer Executive Vice President, Chief Lending Officer 26 TD Banknorth, CT State President Kenneth F. Burns Executive Vice President, Director of Retail Banking 25 Eagle Bank - EVP, Retail Banking & Marketing Catherine M. Burns Executive Vice President, Chief Risk Officer 33 TD Banknorth, Head of Community Banking Commercial Lending; Credit Manager

Strategic Accomplishments * Capital Capital Capital • Raised $172 million of capital in June 2011 Raised $172 million of capital in June 2011 Capital Capital Capital • Raised $172 million of capital in June 2011 Raised $172 million of capital in June 2011 Capital Capital Capital • TBV increased from $13.63 to $14.08 in 2013 TBV increased from $13.63 to $14.08 in 2013 Capital Capital Capital • Repurchased 2,155,490 shares of FBNK stock (since IPO 6/29/11) at an average share price of $13.96, as of 12/31/13 Repurchased 2,155,490 shares of FBNK stock (since IPO 6/29/11) at an average share price of $13.96, as of 12/31/13 Capital Capital Capital • Paid a $0.03 dividend for 9 consecutive quarters Paid a $0.03 dividend for 9 consecutive quarters Executed Organic Growth Strategy Executed Organic Growth Strategy Executed Organic Growth Strategy • Strong organic loan growth - 56% growth since 2010 Strong organic loan growth - 56% growth since 2010 Executed Organic Growth Strategy Executed Organic Growth Strategy Executed Organic Growth Strategy • Significant deposit growth - 30% growth since 2010 Significant deposit growth - 30% growth since 2010 Executed Organic Growth Strategy Executed Organic Growth Strategy Executed Organic Growth Strategy • Established a scalable residential lending platform with goal to become a market leader Established a scalable residential lending platform with goal to become a market leader Executed Organic Growth Strategy Executed Organic Growth Strategy Executed Organic Growth Strategy • Completed core system conversion in May 2013 Completed core system conversion in May 2013 Geographic Diversification of the Deposit Base Geographic Diversification of the Deposit Base Geographic Diversification of the Deposit Base • Opened 10 de novo branches since June 2010; average deposit per de novo of $42 million Opened 10 de novo branches since June 2010; average deposit per de novo of $42 million Geographic Diversification of the Deposit Base Geographic Diversification of the Deposit Base Geographic Diversification of the Deposit Base • Focus on transaction accounts and new households Focus on transaction accounts and new households Geographic Diversification of the Deposit Base Geographic Diversification of the Deposit Base Geographic Diversification of the Deposit Base • Over 5,000 net new transaction accounts in 2013 Over 5,000 net new transaction accounts in 2013 Geographic Diversification of the Deposit Base Geographic Diversification of the Deposit Base Geographic Diversification of the Deposit Base • Liability side of the balance sheet is well positioned Liability side of the balance sheet is well positioned Invested in People, Technology and Franchise Invested in People, Technology and Franchise Invested in People, Technology and Franchise • Enterprise risk management - "best practices" Enterprise risk management - "best practices" Invested in People, Technology and Franchise Invested in People, Technology and Franchise Invested in People, Technology and Franchise • Strategic initiatives to build "best in class": Strategic initiatives to build "best in class": Invested in People, Technology and Franchise Invested in People, Technology and Franchise Invested in People, Technology and Franchise • Commercial credit and underwriting • Cash management • Small business banking • Retail banking • Compliance • Residential lending • Government banking • Marketing • e-business • Operational risk * growth rates through 12/31/13 * growth rates through 12/31/13 * growth rates through 12/31/13

Our Core Business * Government Banking

Diversified Loan Portfolio *
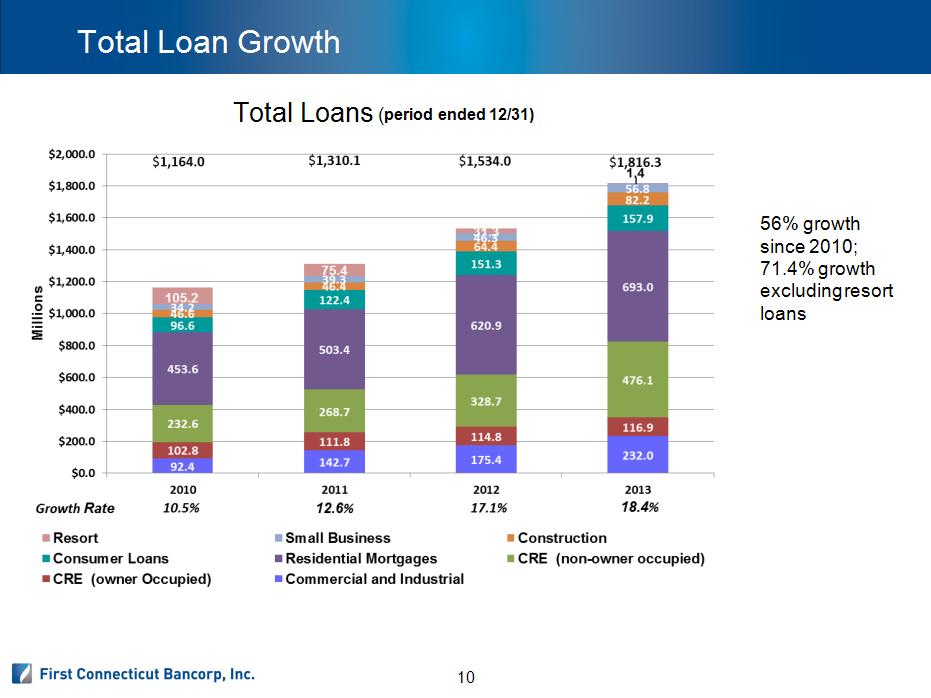
Total Loan Growth 56% growth since 2010; 71.4% growth excluding resort loans * Total Loans (period ended 12/31)

Asset Quality Metrics *

Commercial Banking * Relationship Banking Relationship Banking Relationship Banking • Platform centered on building relationships and adding value Relationship Banking Relationship Banking Relationship Banking • Broad and sophisticated lending products and capability Relationship Banking Relationship Banking Relationship Banking • 3 teams of experienced lenders cover Connecticut Relationship Banking Relationship Banking Relationship Banking • Comprehensive cash management services Major Market Segments Major Market Segments Major Market Segments • C&I: Manufacturers, distributors, healthcare providers, professional service companies, not-for-profits, higher education Major Market Segments Major Market Segments Major Market Segments • CRE: Office, Apartments, Retail, Warehouse Loan Growth Loan Growth Loan Growth • Commercial originations totaled $332 million in 2013; a 16% increase over 2012 Loan Growth Loan Growth Loan Growth • Point to point growth in commercial outstandings of $206 million, inclusive of $30 million decline in resort portfolio; 27% y-o-y growth Strong Credit Culture Strong Credit Culture Strong Credit Culture • Conservative underwriting Strong Credit Culture Strong Credit Culture Strong Credit Culture • Asset quality metrics continue to improve Strong Credit Culture Strong Credit Culture Strong Credit Culture • Focused and proactive portfolio management *growth rates through 12/31/13 *growth rates through 12/31/13

Small Business Lending * General Small Business Lending General Small Business Lending General Small Business Lending • Over 300 unique business development calls made monthly General Small Business Lending General Small Business Lending General Small Business Lending • All managers and BDO's are credit certified General Small Business Lending General Small Business Lending General Small Business Lending • Small Business Loan outstandings increased 17% in 2013; balances at $58 million on 12/31/13 SBA Lending SBA Lending SBA Lending • Currently #3 SBA lender in Connecticut SBA Lending SBA Lending SBA Lending • Preferred SBA status, allowing local decisions SBA Lending SBA Lending SBA Lending • On staff SBA specialists provide value added understanding Efficiencies and Responsiveness Efficiencies and Responsiveness Efficiencies and Responsiveness • Expedited approval process; 5.7 days average decision time Efficiencies and Responsiveness Efficiencies and Responsiveness Efficiencies and Responsiveness • Application to close in 30 days on average Efficiencies and Responsiveness Efficiencies and Responsiveness Efficiencies and Responsiveness • Dedicated underwriters using credit scoring with overview

Residential Mortgage and Consumer Lending * Mortgage Banking Platform Mortgage Banking Platform Mortgage Banking Platform • Significantly increased capabilities over last 30 months Mortgage Banking Platform Mortgage Banking Platform Mortgage Banking Platform • Enhanced technology Mortgage Banking Platform Mortgage Banking Platform Mortgage Banking Platform • Introduced broad array of products Mortgage Banking Platform Mortgage Banking Platform Mortgage Banking Platform • Developed secondary market capabilities Mortgage Banking Platform Mortgage Banking Platform Mortgage Banking Platform • Growing servicing for others portfolio: $300 million as of 12/31/13 Sales Channels Sales Channels Sales Channels • Added originators from various regional banks Sales Channels Sales Channels Sales Channels • Introduced "inside sales" channel for online applications and in house referrals Sales Channels Sales Channels Sales Channels • Established correspondent channel Loan Growth Loan Growth Loan Growth • 56% growth in residential mortgages since 2010* Loan Growth Loan Growth Loan Growth • #6 market share in Hartford County; #19 market share in Connecticut * growth rates through 12/31/13 * growth rates through 12/31/13

Diversified Deposit Base * Muni (Non Time) 13% Time 22% Checking 29% SAV/MDA 36% 100% $ 1.5 billion as of 12/31/2013

Total Deposit Growth * 29% growth since 2010 while diversifying the mix of deposits Growth Rate 14.6% 2.8% 11.4% 13.0%

Retail Banking * Branch Network Branch Network Branch Network • 22 full service branch offices; opened 10 offices in the last 3 years Branch Network Branch Network Branch Network • State of the art branch design delivers superior customer experience Branch Network Branch Network Branch Network • De novo branches achieved profitability within 12 months; achieved double digit internal rate of return within 36 months Electronic Delivery Electronic Delivery Electronic Delivery • Online banking: Over 17,300 consumers and 4,100 businesses currently signed up; goal of enrolling 65% of customer base Electronic Delivery Electronic Delivery Electronic Delivery • Mobile banking: mobile app users growing; currently over 4,400 consumers including iPad Deposit Growth Deposit Growth Deposit Growth • Overall deposit growth in 2013 of $185 million; 13% growth Deposit Growth Deposit Growth Deposit Growth • Continued double digit deposit growth for both de novo and legacy branch offices Deposit Growth Deposit Growth Deposit Growth • Focus on core/transactional deposits; 7,600 new checking accounts opened in de novo branches through 12/31/13 Wealth Management Wealth Management Wealth Management • Wealth management - strategic partnership with Essex Financial, $4 billion respected Connecticut company Wealth Management Wealth Management Wealth Management • Currently providing 5 full-time investment executives covering Bank

Business Deposits & Government Banking * Government Banking Government Banking Government Banking • Portfolio of 63 public entities as customers on 12/31/13 Government Banking Government Banking Government Banking • Overall Government deposit growth of $35 million during 2013; 21% growth Government Banking Government Banking Government Banking • Initiated new on-line tax and fee payment system Government Banking Government Banking Government Banking • Overall Government cost of funds of 0.26% as of December 2013 Commercial Cash Management Commercial Cash Management Commercial Cash Management • Seasoned Cash Management team providing solution based commercial deposit services Commercial Cash Management Commercial Cash Management Commercial Cash Management • Cash Management deposit growth of $13 million during 2013; a 12% growth Commercial Cash Management Commercial Cash Management Commercial Cash Management • Comprehensive cash management services, including account analysis, complete on-line capabilities, lockbox, sweep and commercial remote deposit capture Small Business Small Business Small Business • 881 net new checking accounts in 2013; 18% growth; balances of $143 million at 12/31/13 Small Business Small Business Small Business • Currently 5,643 free business checking accounts, which are a non-interest bearing source of funds, average balance per account of $22,000

Financial Performance * Selected Annual Financial Data (000’s) 2010 2011 2012 2013 Loans, net - at period end Loans, net - at period end Loans, net - at period end 1,157,917 1,295,177 1,520,170 1,800,987 Total assets - at period end Total assets - at period end Total assets - at period end 1,417,161 1,618,129 1,823,153 2,110,028 Average interest-earning assets Average interest-earning assets Average interest-earning assets Average interest-earning assets 1,314,112 1,490,439 1,588,119 1,777,893 Net interest margin Net interest margin Net interest margin 3.75% 3.23% 3.35% 2.99% Stockholders' equity Stockholders' equity Stockholders' equity 95,524 252,499 241,795 232,209 Total capital to risk weighted assets Total capital to risk weighted assets Total capital to risk weighted assets Total capital to risk weighted assets 10.28% 22.41% 18.80% 15.50% Tier I capital to risk weighted assets Tier I capital to risk weighted assets Tier I capital to risk weighted assets Tier I capital to risk weighted assets 9.02% 21.16% 17.55% 14.36% Tier I capital to average assets Tier I capital to average assets Tier I capital to average assets Tier I capital to average assets 6.48% 15.55% 13.89% 11.47% Tangible Book Value Tangible Book Value Tangible Book Value n/a 14.12 13.65 14.11 Stock Price Stock Price n/a 13.01 13.75 16.12 Net interest income Net interest income Net interest income 49,288 48,199 53,232 53,153 CORE Revenue (1) CORE Revenue (1) CORE Revenue (1) 54,653 53,171 61,340 63,426 Net income (loss) Net income (loss) Net income (loss) 4,869 (4,239) 3,707 3,704 EPS (2) EPS (2) n/a (0.29) 0.22 0.24 (1) Excludes prepayment penalty fees, net gain on sales of investments and Bank-owned life insurance proceeds. (1) Excludes prepayment penalty fees, net gain on sales of investments and Bank-owned life insurance proceeds. (1) Excludes prepayment penalty fees, net gain on sales of investments and Bank-owned life insurance proceeds. (1) Excludes prepayment penalty fees, net gain on sales of investments and Bank-owned life insurance proceeds. (1) Excludes prepayment penalty fees, net gain on sales of investments and Bank-owned life insurance proceeds. (1) Excludes prepayment penalty fees, net gain on sales of investments and Bank-owned life insurance proceeds. (1) Excludes prepayment penalty fees, net gain on sales of investments and Bank-owned life insurance proceeds. (1) Excludes prepayment penalty fees, net gain on sales of investments and Bank-owned life insurance proceeds. (2) Net loss per share for the year ended December 31, 2011 reflects earnings for the period from June 29, 2011, (2) Net loss per share for the year ended December 31, 2011 reflects earnings for the period from June 29, 2011, (2) Net loss per share for the year ended December 31, 2011 reflects earnings for the period from June 29, 2011, (2) Net loss per share for the year ended December 31, 2011 reflects earnings for the period from June 29, 2011, (2) Net loss per share for the year ended December 31, 2011 reflects earnings for the period from June 29, 2011, (2) Net loss per share for the year ended December 31, 2011 reflects earnings for the period from June 29, 2011, (2) Net loss per share for the year ended December 31, 2011 reflects earnings for the period from June 29, 2011, (2) Net loss per share for the year ended December 31, 2011 reflects earnings for the period from June 29, 2011, the date the Company completed a Plan of Conversion and Reorganization to December 31, 2011. the date the Company completed a Plan of Conversion and Reorganization to December 31, 2011. the date the Company completed a Plan of Conversion and Reorganization to December 31, 2011. the date the Company completed a Plan of Conversion and Reorganization to December 31, 2011. the date the Company completed a Plan of Conversion and Reorganization to December 31, 2011. the date the Company completed a Plan of Conversion and Reorganization to December 31, 2011. the date the Company completed a Plan of Conversion and Reorganization to December 31, 2011. the date the Company completed a Plan of Conversion and Reorganization to December 31, 2011.

Financial Performance * Selected Quarterly Financial Data (000’s) 4Q12 1Q13 2Q13 3Q13 4Q13 Loans, net - at period end Loans, net - at period end Loans, net - at period end Loans, net - at period end 1,520,170 1,544,687 1,588,080 1,712,507 1,800,987 Total assets - at period end Total assets - at period end Total assets - at period end Total assets - at period end 1,823,153 1,799,689 1,845,440 1,992,517 2,110,028 Average interest-earning assets Average interest-earning assets Average interest-earning assets Average interest-earning assets 1,663,498 1,669,221 1,715,539 1,792,221 1,931,552 Net interest margin Net interest margin Net interest margin 3.37% 3.07% 3.01% 2.94% 2.92% Stockholders' equity Stockholders' equity Stockholders' equity 241,795 243,214 231,541 227,864 232,209 Total capital to risk weighted assets Total capital to risk weighted assets Total capital to risk weighted assets Total capital to risk weighted assets 18.80% 18.61% 17.48% 16.12% 15.50% Tier I capital to risk weighted assets Tier I capital to risk weighted assets Tier I capital to risk weighted assets Tier I capital to risk weighted assets 17.55% 17.37% 16.25% 14.96% 14.36% Tier I capital to average assets Tier I capital to average assets Tier I capital to average assets Tier I capital to average assets 13.89% 13.84% 12.92% 12.18% 11.47% Tangible Book Value Tangible Book Value Tangible Book Value 13.65 13.78 13.81 13.88 14.11 Stock Price Stock Price 13.75 14.73 13.92 14.70 16.12 Net interest income Net interest income Net interest income 14,092 12,652 12,887 13,283 14,331 CORE Revenue (1) CORE Revenue (1) CORE Revenue (1) 16,982 16,065 15,830 15,161 16,370 Net income Net income 3,010 886 819 865 1,134 EPS EPS 0.18 0.05 0.05 0.06 0.07 (1) Excludes prepayment penalty fees, net gain on sales of investments and Bank-owned life insurance proceeds. (1) Excludes prepayment penalty fees, net gain on sales of investments and Bank-owned life insurance proceeds. (1) Excludes prepayment penalty fees, net gain on sales of investments and Bank-owned life insurance proceeds. (1) Excludes prepayment penalty fees, net gain on sales of investments and Bank-owned life insurance proceeds. (1) Excludes prepayment penalty fees, net gain on sales of investments and Bank-owned life insurance proceeds. (1) Excludes prepayment penalty fees, net gain on sales of investments and Bank-owned life insurance proceeds. (1) Excludes prepayment penalty fees, net gain on sales of investments and Bank-owned life insurance proceeds. (1) Excludes prepayment penalty fees, net gain on sales of investments and Bank-owned life insurance proceeds. (1) Excludes prepayment penalty fees, net gain on sales of investments and Bank-owned life insurance proceeds.

Financial Performance * Accomplishments Accomplishments • Diversified the balance sheet and improved interest rate risk position Accomplishments Accomplishments • Increased earning assets Accomplishments Accomplishments • Invested in people, technology and franchise (franchise is scalable to $3 billion) Accomplishments Accomplishments • Instituted measurable strategic planning process Accomplishments Accomplishments • Successfully completed core conversion Performance Data Performance Data • Tangible Book Value: $14.08 (as of 12/31/13) Performance Data Performance Data • Price / Tangible Book Value*: 110% Performance Data Performance Data • Stock Performance*: 55% appreciation since IPO (6/29/11) Capital Management Capital Management • Paid quarterly dividend each quarter since December 2011 Capital Management Capital Management • Completed 10% stock repurchase, and announced a 2nd 10% stock repurchase plan on 6/29/13 *based on the stock price of $15.51 on 2/6/14

Strategic Direction *

Conclusion *
Supplemental Information Appendix *

Income Statement 2010 – 2013 (000’s) Select Financial Data * 2010 2011 2012 2013 Net interest income Net interest income Net interest income 49,288 48,199 53,232 53,153 Provision for allowance for loan losses Provision for allowance for loan losses Provision for allowance for loan losses 6,694 4,090 1,380 1,530 Net interest income after provision Net interest income after provision Net interest income after provision Net interest income after provision for loan losses for loan losses 42,594 44,109 51,852 51,623 Net gain on loans sold Net gain on loans sold Net gain on loans sold 822 671 3,151 4,825 Net gain (loss) on sale of investments and Net gain (loss) on sale of investments and Net gain (loss) on sale of investments and Net gain (loss) on sale of investments and net impairments net impairments net impairments 1,686 89 - 340 Other noninterest income Other noninterest income Other noninterest income 4,543 4,765 6,110 5,847 Total noninterest income Total noninterest income 7,051 5,525 9,261 11,012 Noninterest expense, excluding contribution Noninterest expense, excluding contribution Noninterest expense, excluding contribution Noninterest expense, excluding contribution Noninterest expense, excluding contribution to charitable foundation (1)(2)(3) to charitable foundation (1)(2)(3) to charitable foundation (1)(2)(3) to charitable foundation (1)(2)(3) 42,674 49,573 56,106 57,762 Contribution to charitable foundation Contribution to charitable foundation Contribution to charitable foundation Contribution to charitable foundation - 6,877 - - Total noninterest expense Total noninterest expense Total noninterest expense 42,674 56,450 56,106 57,762 Income (loss) before income taxes Income (loss) before income taxes Income (loss) before income taxes Income (loss) before income taxes 6,971 (6,816) 5,007 4,873 Provision (benefit) for Income taxes Provision (benefit) for Income taxes Provision (benefit) for Income taxes 2,102 (2,577) 1,300 1,169 Net income (loss) Net income (loss) Net income (loss) 4,869 (4,239) 3,707 3,704 (1) 2011 includes $851 for accelerated benefit expenses. (1) 2011 includes $851 for accelerated benefit expenses. (1) 2011 includes $851 for accelerated benefit expenses. (1) 2011 includes $851 for accelerated benefit expenses. (1) 2011 includes $851 for accelerated benefit expenses. (2) 2012 includes $3,047 for 20% immediate vesting of stock compensation expenses, $394 for loss on sale of non-strategic (2) 2012 includes $3,047 for 20% immediate vesting of stock compensation expenses, $394 for loss on sale of non-strategic (2) 2012 includes $3,047 for 20% immediate vesting of stock compensation expenses, $394 for loss on sale of non-strategic (2) 2012 includes $3,047 for 20% immediate vesting of stock compensation expenses, $394 for loss on sale of non-strategic (2) 2012 includes $3,047 for 20% immediate vesting of stock compensation expenses, $394 for loss on sale of non-strategic (2) 2012 includes $3,047 for 20% immediate vesting of stock compensation expenses, $394 for loss on sale of non-strategic (2) 2012 includes $3,047 for 20% immediate vesting of stock compensation expenses, $394 for loss on sale of non-strategic (2) 2012 includes $3,047 for 20% immediate vesting of stock compensation expenses, $394 for loss on sale of non-strategic (2) 2012 includes $3,047 for 20% immediate vesting of stock compensation expenses, $394 for loss on sale of non-strategic properties and $1,487 for income related to recognizing the unrecognized prior service costs as a result of freezing plans. properties and $1,487 for income related to recognizing the unrecognized prior service costs as a result of freezing plans. properties and $1,487 for income related to recognizing the unrecognized prior service costs as a result of freezing plans. properties and $1,487 for income related to recognizing the unrecognized prior service costs as a result of freezing plans. properties and $1,487 for income related to recognizing the unrecognized prior service costs as a result of freezing plans. properties and $1,487 for income related to recognizing the unrecognized prior service costs as a result of freezing plans. properties and $1,487 for income related to recognizing the unrecognized prior service costs as a result of freezing plans. properties and $1,487 for income related to recognizing the unrecognized prior service costs as a result of freezing plans. properties and $1,487 for income related to recognizing the unrecognized prior service costs as a result of freezing plans. properties and $1,487 for income related to recognizing the unrecognized prior service costs as a result of freezing plans. (3) 2013 includes $633 for accelerated vesting of stock compensation expenses. (3) 2013 includes $633 for accelerated vesting of stock compensation expenses. (3) 2013 includes $633 for accelerated vesting of stock compensation expenses. (3) 2013 includes $633 for accelerated vesting of stock compensation expenses. (3) 2013 includes $633 for accelerated vesting of stock compensation expenses. (3) 2013 includes $633 for accelerated vesting of stock compensation expenses. (3) 2013 includes $633 for accelerated vesting of stock compensation expenses.

Select Financial Data * Income Statement last 5 quarters (000’s) 4Q12 1Q13 2Q13 3Q13 4Q13 Net interest income Net interest income Net interest income 14,092 12,652 12,887 13,283 14,331 Provision for allowance for loan losses Provision for allowance for loan losses Provision for allowance for loan losses Provision for allowance for loan losses 315 399 256 215 660 Net interest income after provision Net interest income after provision Net interest income after provision Net interest income after provision for loan losses for loan losses for loan losses 13,777 12,253 12,631 13,068 13,671 Net gain on loans sold Net gain on loans sold Net gain on loans sold 1,935 2,030 1,589 625 581 Net gain on sale of investments and Net gain on sale of investments and Net gain on sale of investments and Net gain on sale of investments and net impairments net impairments net impairments - - 36 304 - Other noninterest income Other noninterest income Other noninterest income Other noninterest income 1,975 1,618 1,374 1,253 1,602 Total noninterest income Total noninterest income Total noninterest income 3,910 3,648 2,999 2,182 2,183 Noninterest expense, excluding Noninterest expense, excluding Noninterest expense, excluding Noninterest expense, excluding contribution to charitable foundation (1)(2) contribution to charitable foundation (1)(2) contribution to charitable foundation (1)(2) contribution to charitable foundation (1)(2) contribution to charitable foundation (1)(2) 13,439 14,699 14,555 14,110 14,398 Contribution to charitable foundation Contribution to charitable foundation Contribution to charitable foundation Contribution to charitable foundation Contribution to charitable foundation - - - - - Total noninterest expense Total noninterest expense Total noninterest expense 13,439 14,699 14,555 14,110 14,398 Income before income taxes Income before income taxes Income before income taxes Income before income taxes 4,248 1,202 1,075 1,140 1,456 Provision for Income taxes Provision for Income taxes Provision for Income taxes 1,238 316 256 275 322 Net income Net income 3,010 886 819 865 1,134 (1) 4Q12 includes $1,487 for income related to recognizing the unrecognized prior service costs as a result of freezing plans. (1) 4Q12 includes $1,487 for income related to recognizing the unrecognized prior service costs as a result of freezing plans. (1) 4Q12 includes $1,487 for income related to recognizing the unrecognized prior service costs as a result of freezing plans. (1) 4Q12 includes $1,487 for income related to recognizing the unrecognized prior service costs as a result of freezing plans. (1) 4Q12 includes $1,487 for income related to recognizing the unrecognized prior service costs as a result of freezing plans. (1) 4Q12 includes $1,487 for income related to recognizing the unrecognized prior service costs as a result of freezing plans. (1) 4Q12 includes $1,487 for income related to recognizing the unrecognized prior service costs as a result of freezing plans. (1) 4Q12 includes $1,487 for income related to recognizing the unrecognized prior service costs as a result of freezing plans. (1) 4Q12 includes $1,487 for income related to recognizing the unrecognized prior service costs as a result of freezing plans. (1) 4Q12 includes $1,487 for income related to recognizing the unrecognized prior service costs as a result of freezing plans. (2) 1Q13 includes $633 for accelerated vesting of stock compensation expenses. (2) 1Q13 includes $633 for accelerated vesting of stock compensation expenses. (2) 1Q13 includes $633 for accelerated vesting of stock compensation expenses. (2) 1Q13 includes $633 for accelerated vesting of stock compensation expenses. (2) 1Q13 includes $633 for accelerated vesting of stock compensation expenses. (2) 1Q13 includes $633 for accelerated vesting of stock compensation expenses. (2) 1Q13 includes $633 for accelerated vesting of stock compensation expenses.

Select Financial Data * (1) Excludes prepayment penalty fees, net gain on sales of investments and Bank-owned life insurance proceeds.

Select Financial Data *
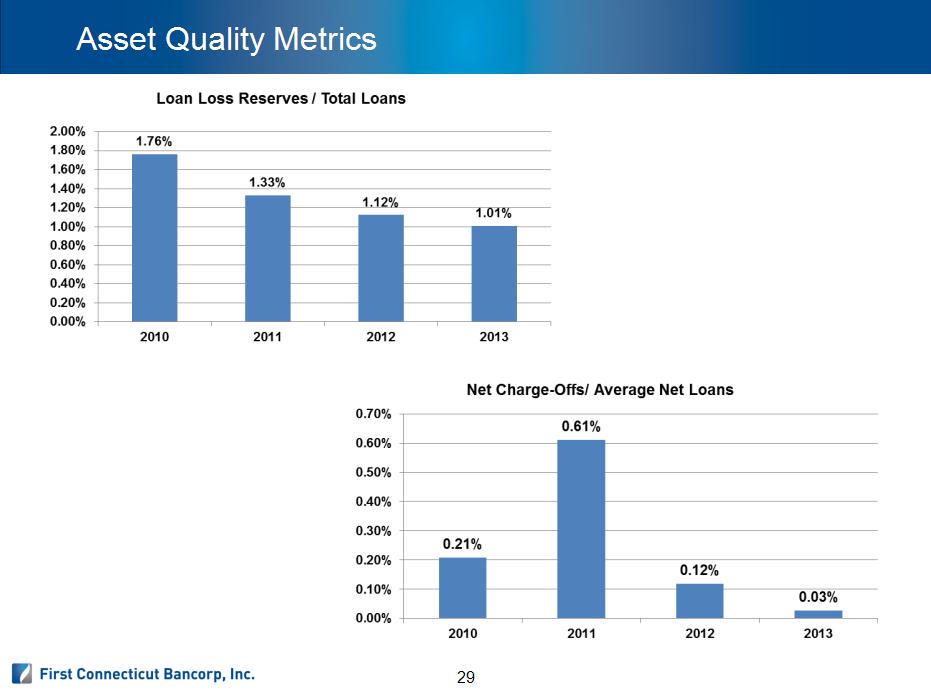
Asset Quality Metrics *

Commercial Loan Growth *
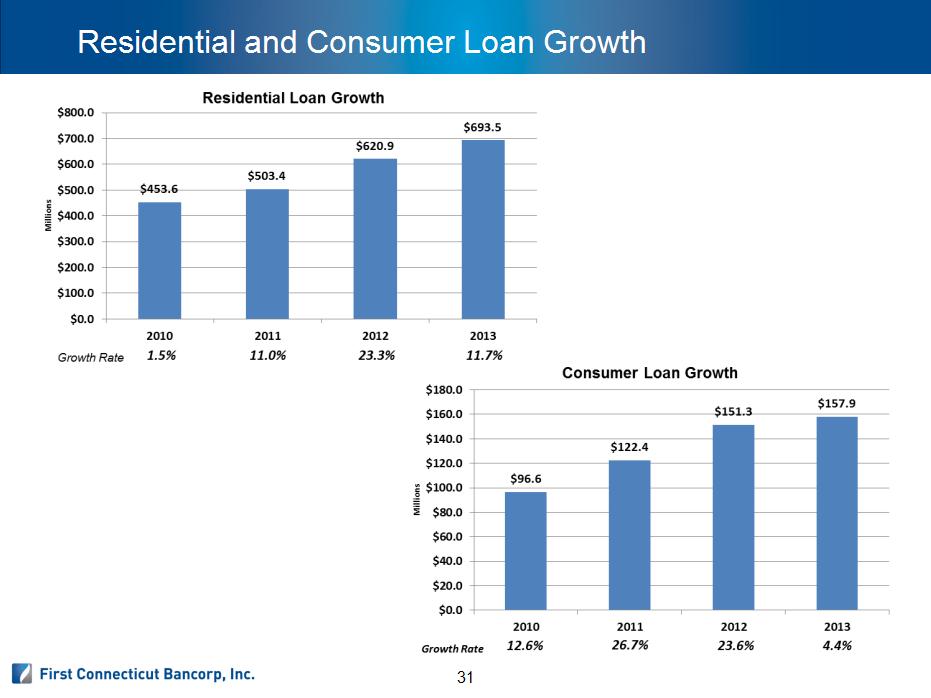
Residential and Consumer Loan Growth *

Checking Growth Consumer Checking Growth ($000’s) *

Checking Growth Business Checking Growth ($000’s) *

De Novo Branch Profitability average profitability at $20 million * De Novo Branch Deposit Growth & Point of Profitability (In Millions) average profitability at $20million

John J. Patrick, Jr. Chairman, President and Chief Executive Officer Gregory A. White Executive Vice President, Chief Financial Officer Investor Information: Jennifer H. Daukas Vice President, Investor Relations Officer 860-284-6359 or jdaukas@farmingtonbankct.com Corporate Contacts *