Attached files
| file | filename |
|---|---|
| 8-K - 8-K - EASTON-BELL SPORTS, INC. | esbi-8k_20140318.htm |
 Transaction Summary
On
February
13,
2014,
Easton-Bell
Sports,
Inc.
reached
an
agreement
to
sell
the
assets
of
its
Easton
Baseball
/
Softball business to Bauer Performance Sports (“Bauer”) for $330MM
–
Closing expected in March / April 2014
Easton-Bell Sports, Inc. also announced that it is working towards an agreement
with a third party for the sale of its Easton Hockey business
–
Easton Hockey will be an Unrestricted Subsidiary until it is sold
Proceeds from the sale will be used in conjunction with a new financing to retire
the existing Easton-Bell Sports, Inc. 2016 Senior Secured Notes, the EB
Sports Corp. HoldCo Facility, and pay anticipated transaction fees and
expenses
–
$30MM of proceeds earmarked as unrestricted HoldCo cash to fund acquisitions or
capital structure changes The contemplated new financing includes the
following: –
$150MM
5-year
ABL
(undrawn
at
closing)
(1)
–
$205MM
7-year
1
st
Lien
Term
Loan
–
$105MM
8-year
2
nd
Lien
Term
Loan
The
contemplated new financing represents, on a pro forma basis, 1st Lien Debt / Pro
Forma Adj. EBITDA of 3.3x, Total Debt / Pro Forma Adj. EBITDA of 5.0x, and
Net Debt / Pro Forma Adj. EBITDA of 4.7x Upon completion of these
transactions, Easton-Bell Sports, Inc. will be renamed BRG Sports, Inc.
Note
1.ABL revolver may be additionally drawn for seasonal working capital needs
unrelated to funding the transaction Exhibit 99.1
|
 Transaction Overview: Financing of BRG Sports
(5)
(3)
(7)
(4)
(2)
(6)
(2)
PF Capitalization | Credit Statistics
Pro Forma ($MM)
12/28/2013
Cash on Balance Sheet
19
New ABL Revolver ($150MM capacity)
0
New Term Loan (1st Lien)
205
New Term Loan (2nd Lien)
105
Total Debt
310
PF 2013E Adj. EBITDA
62
1st Lien Debt / PF Adj. EBITDA
3.3x
2nd Lien Debt / PF Adj. EBITDA
1.7x
Bank Debt / PF Adj. EBITDA
5.0x
Total Debt / PF Adj. EBITDA
5.0x
Net Debt / PF Adj. EBITDA
4.7x
Sources & Uses
Sources
Amount ($MM)
%
(1)
New ABL Revolver ($150MM capacity)
0
0
New 1st Lien Term Loan
205
32
New 2nd Lien Term Loan
105
16
Net Proceeds from Asset Sale
337
52
Total Sources
647
100
Uses
Amount ($MM)
%
(1)
Retire ABL Facility
23
4
Retire Senior Notes
350
54
Retire HoldCo Facility
145
22
HoldCo Unrestricted Cash Allocation
30
5
Partial Long-Term Incentive Payout
23
4
Transaction Costs, Financing Fees, and OID
52
8
Cash for Capitalizing Hockey
15
2
Cash for Restructuring Post-Transaction
9
1
Total Uses
647
100
Notes
1.
Figures may not add due to rounding
2.
ABL revolver may be additionally drawn for seasonal working capital needs unrelated to funding the
transaction
3.
Sale price of $330MM, adjusted for working capital, IP settlement, and escrowed proceeds 4.
Includes accrued interest of $3MM as of December 28, 2013 5.
Long-term incentive payments to Easton Sports, Inc. employees, former EBS management, group of
current BRG employees, and certain Board members
6.
Includes $10 million of financing fees and OID, bond breakage costs of $17 million ($350 million senior
notes outstanding x 4.875% call premium), and other transaction costs of $26 million
7.
A reconciliation of the non-GAAP measures presented to the comparable GAAP information can be found
on page 51 of this presentation |
 ...With Market Leading Positions
Leading Positions Across All Categories
Market Share (%)
Sources: 2013 NAERA data, Leisure Trends, Management Estimates
56%
62%
56%
42%
41%
Football Helmets
Reconditioning
Services
U.S. Mass Cycling
Accessories
Global Specialty
Cycling Helmets
U.S. Snow Helmets |
 Riddell: The Football Specialty Company
A Leader in Football Equipment
Impressive and Continuous Growth
Broad Customer Base With Little Concentration
Premier developer, manufacturer and reconditioner
of football equipment, uniforms, and accessories
Leading market positions in each category
–
56% market share by sales in helmets
–
Meaningful share increases over the past five
years
–
Majority of players wear Riddell helmets
Record revenue and EBITDA performance
–
Share-driven unit growth and consistent ASP
increases
–
High gross margins with improvement through
innovation and reconditioning relocation
–
SG&A leverage despite R&D and marketing
investments
–
Strong free cash flow profile
Industry highly concentrated, only a few key players
–
Riddell, Schutt, and Rawlings
2013E Net Sales, %
$144
$160
$177
$203
$205
43.9%
43.3%
43.1%
44.5%
44.1%
Net Sales ($MM)
Gross Margin (%)
Institutional Sales
63%
Reconditioning
24%
Consumer
13%
A favorite among NFL professionals
2009
2010
2011
2012
2013E |
 NFL-Related Litigation Summary
Case Overview
Since 2011, roughly 5,000 former NFL players have filed claims against the
NFL Only 25% of these plaintiffs have made a claim against Riddell
Although there is some overlap, the claims made against Riddell are different from
those made against the NFL The claims made in the cases naming Riddell
primarily relate to: Product Design
Product Manufacturing
Adequacy of Warnings
Riddell has denied liability in early court filings and will continue to vigorously
defend itself NFL players were not required to wear Riddell helmets, and not
all NFL players wore Riddell helmets It
is
possible
that
certain
cases
against
Riddell
will
proceed
to
“bellwether”
trials
Riddell
has
substantial
insurance
coverage
over
50+
years
for
the
NFL
player
claims
More than 80% of Riddell’s defense expenses are being paid by its
insurers |
 NFL-Related
Litigation
Summary
(Cont’d)
Timeline
&
Process
–
A
proposed
settlement
was
reached
between
the
plaintiffs
and
the
NFL
in
late
summer
2013
–
Riddell is not a party to the proposed settlement between the plaintiffs and the
NFL –
Riddell is under no obligation to settle with the plaintiffs
–
If claims against Riddell are not resolved by settlement, the litigation will
proceed and the Judge will likely rule on pending procedural motions
–
Thereafter, depending on the outcome of the first round of motions, Riddell will
likely file a second round of motions, focused more on the deficiencies in
the plaintiffs' specific claims. –
After that, discovery about facts supporting the claims and defenses may be
exchanged by the parties, depending
on
the
Court’s
rulings
on
the
Riddell
defendants’
preliminary
motions
–
Therefore, Riddell is limited in what it can discuss on these matters
In
Summer
2013,
the
MDL
Judge
ordered
the
parties
to
participate
in
mediation
We do not expect any major milestones in the case involving Riddell until the
proposed settlement between plaintiffs and the NFL gets preliminarily
approved The
court
entered
a
“gag”
order
prohibiting
Riddell
and
its
counsel
from
publicly
discussing
the
mediation
process |
 Multiple Lines of Defense
1
Product Liability Theory
Evidentiary Support / Statute of Limitations
Process and Timing
Insurance Coverage
2
3
4 |
 2013E Net Sales, %
(2)
Action Sports: Global Cycling, Snow, and Powersports Leader
Stable Core Sales Base
A combination of two market-leading brands in Bell
and Giro
–
Helmets, accessories, footwear and apparel for
cycling, snowsports, and powersports
Segment also includes:
–
Blackburn cycling accessories
–
Easton cycling wheels and components
–
Exit from non-core Mass Fitness / Football
categories, Easton wheels quality issues
–
Unfavorable 2012/2013 seasonal weather
A Winning Combination
Notes
1.Reflects
core
operations
–
excludes
Mass
Fitness/Football
and
Easton
Cycling
2.Certain items with immaterial contribution not reflected in graph
Diversified by Both Brand and Category
Core Revenue
(1)
($MM)
Core Gross Margin
(1)
(%)
Mass Accessories
24%
Mass Helmets
9%
Mass Juvenile Licensed
9%
Specialty Cycling Helmets
9%
Powersports
7%
Specialty Cycling
Helmets
14%
Snow
Helmets
8%
Footwear
4%
Other Giro
4%
Easton
6%
Blackburn
6%
6%
6%
30%
Recent performance impacted by:
Giro
Bell
Blackburn
Easton
58% |
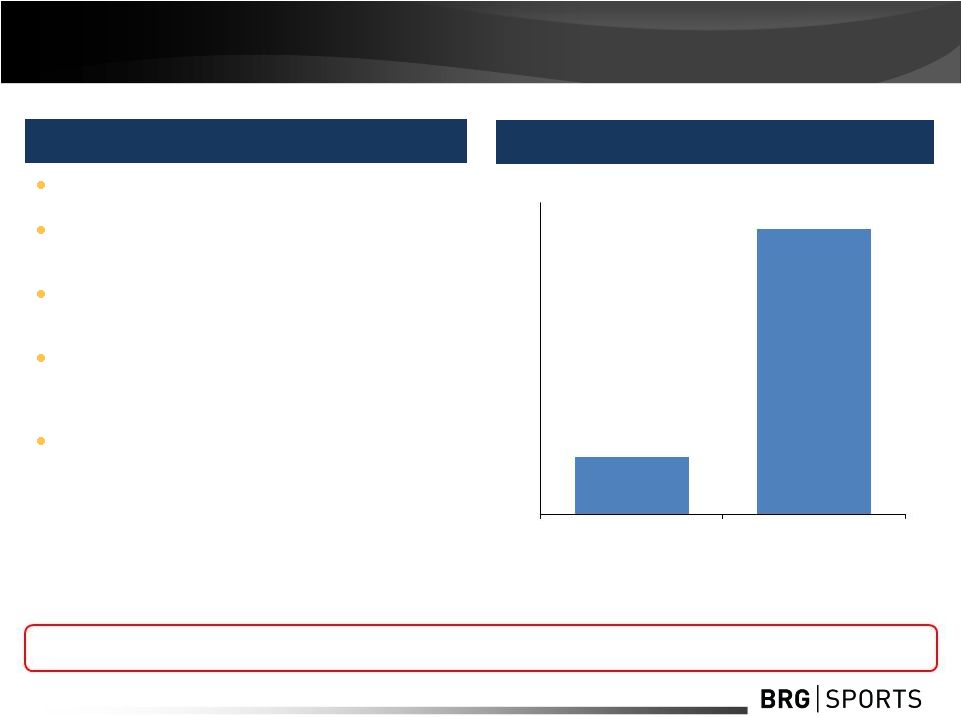 Significant Powersports Opportunity
45% Powersports 2011 to 2013E Net Sales CAGR
Highly confident 2014 growth will be even higher due
to last year’s re-acquisition of int’l distribution rights
Domestic door count could more than double in the
next few years
Co-branding arrangement with Harley-Davidson may
lead to a broader global opportunity with this
powerhouse brand
Snowmobile category expansion opportunity
Illustrative Potential if Market Share Approaches
Levels Bell Has in Other Categories
9%
40%
2013E Market Share
Illustrative 2018E Market Share
$MM
Poised for Growth
Powersports can easily exceed projections to be a $75M business in the next few
years Source: Management Estimates
$0
$20
$40
$60
$80
$100
$120 |
 Stable Financial Performance
Net
Sales
(1)
Gross
Profit
and
Margin
(1)
PF
Adj.
EBITDA
(1)(2)(3)
and
Margin
Capital
Expenditures
(4)
$MM
$MM, Margins in %
Action Sports
Riddell
Total BRG Margin
$MM, Margins in %
$MM, Margins in %
Total BRG
Notes
1.Figures may not sum due to rounding
2.A reconciliation of the non-GAAP measures presented to the comparable GAAP
information can be found on page 51 of this presentation 3.Pro forma corporate
costs of $27MM in 2011, $31MM in 2012, and $22MM in 2013 allocated to Riddell and Action Sports based on annual revenue contribution
4.Capex adjusted for costs related to new distribution center (2012: $0.4MM; 2013E:
$3.6MM) and excess corporate project costs (2011: $6.4MM; 2012: $7.6MM; 2013E: $8.0MM)
64
57
62
12
12
13
546
556
533
193
202
195
177
203
205
327
353
369
116
111
105
91
90
76
29
33
42
23
23
33
2.2%
2.1%
2.4%
36.6%
36.3%
35.3%
11.7%
10.2%
11.8%
2011
2012
2013E
2011
2012
2013E
2011
2012
2013E
2011
2012
2013E |
 Strong Cash Flow Generation
$MM
Conversion:
53.6%
33.0%
Run-Rate
Free
Cash
Flow
Bridge
(1)(2)
Notes
1.Illustratively based on 2013E PF Adj. EBITDA; figures may not sum due to
rounding 2.Assumed 42% tax rate for estimated taxes and tax-adjusted
interest. Estimated taxes calculated based on PF Adj. EBIT and pre-interest tax shield
3.Based on 2013E capex, net of costs related to new distribution center ($3.6MM) and
excess corporate project costs ($8.0MM) (2)
(2)
(3)
ILLUSTRATIVE
62
13
16
33
13
21
PF Adj. EBITDA
Maintenance Capex
Est. Taxes
Unlevered FCF
Tax-Adj. Interest
Levered FCF |
  Net
Working Capital Dynamics Historical Monthly Net Working Capital
(1)
2012
2011
$MM
Preliminary
($MM, unless otherwise noted)
2011A
2012A
2013E
LTM Avg. Days of Sales Outstanding
95
95
92
LTM Avg. Inventory Turns
4.6x
4.3x
4.2x
LTM Avg. Days Payable Outstanding
48
49
49
LTM Avg. Working Capital ($)
(1)
$139
$145
$134
LTM Avg. Working Capital % of Sales
25.4%
26.1%
25.2%
Actual
Total BRG
Action Sports
Riddell
Note
1.Net working capital includes all current assets and liabilities except cash and
cash equivalents, revolving credit facility, current portion of long-term debt, and tax related items
Change from Peak to Trough (and vice versa)
2013
Cycling category builds
inventory in Q1 for Spring
sales push
Snow category inventory
builds through Summer with
bulk of sales booked from
Aug-Oct with fill-in orders
thereafter
Cycles reflect selling
seasons
Riddell sales increase
through August with A/R
collected once high school
football season begins
|
 Product Liability Defense / Insurance
An Emphasis Within BRG
Product liability defense is a core competency of BRG Sports
–
We make great products; we fight frivolous cases and we win
“Ordinary course”
product liability suits are at an all-time low (Bell, Giro, and Riddell)
–
Helmet-related suits at Action Sports continue to decline, fitness (exited
category) contributed bulk of new suits in 2012 and 2013
Total premiums / defense / settlement expenses have remained flat at $9MM between
2011 and 2013 BRG Sports has not lost a product liability case at final
verdict in 10+ years BRG Sports maintains significant insurance for helmet
product liability –
2014 policy recently renewed with exact coverage as prior year
|
 Pro
Forma Adjusted EBITDA Reconciliation $MM
(1)
2012
2013
Preliminary GAAP Operating Income
$38.4
$26.7
Inclusion
/
(Removal)
of
Profits
for
Certain
Baseball/Softball
Business
Lines
(2)
(2.4)
(2.4)
Inclusion
of
Profits
for
Certain
Action
Sports
Business
Lines
(3)
5.0
-
Overhead
Absorption
of
Divested
/
Non
Borrower
Businesses
(4)
(12.3)
(12.2)
Non-Cash Stock Compensation
3.3
6.5
Standalone Operating Income
$32.1
$18.6
Other
Non-Recurring
and
Extraordinary
Charges,
Gains
and
Losses
(5)
0.4
16.2
Preliminary Adjusted Operating Income
(6)
$32.5
$34.8
Depreciation and Amortization
24.1
23.7
Preliminary Adjusted EBITDA
(6)
$56.6
$58.5
Pro Forma Adjustment
(7)
–
3.9
Pro Forma Adjusted EBITDA
(6)
$56.6
$62.4
Notes
1.
The financials presented for 2012 are derived from the audited subsidiary-level financials of the
Company. The financials presented for 2013 are derived from the preliminary, unaudited subsidiary-level financials of the
Company. The subsidiary-level audit for 2013 is underway. Figures may not sum due to
rounding.
2.
Revenues and expenses related to baseball / softball products sold through mass merchandisers were
historically booked through BRG Sports. This product line is being divested as part of the Easton operations being sold to
Bauer Performance Sports. Discontinued mass fitness and mass football product lines are included in
unadjusted figures. The financials presented for 2012 are derived from the audited subsidiary-level financials of the
Company. The financials presented for 2013 are derived from the preliminary, unaudited
subsidiary-level financials of the Company. The subsidiary-level audit for 2013 is underway.
3.
Certain revenues and expenses related to Easton wheels and components were historically booked through
Easton Sports. The accounting for this was changed to be included within BRG Sports in 2013.
4.
Represents corporate costs, including depreciation and amortization, allocated to the Easton Sports,
Inc. subsidiary as part of the audit process that are stranded post-divestiture and will remain with BRG Sports.
5.
Represents actual expenses historically permitted to be excluded pursuant to the Company’s Senior
Secured Credit Facilities. Such amount for 2013 includes (i) $9.7 million of expenses paid in connection with employee
severance, retention, relocation and contract termination, (ii) $2.2 million of expenses incurred in
conjunction with the divestiture of the Easton businesses, the refinancing and the acquisition of the Bell international powersports
rights, (iii) $1.3 million of extraordinary inventory write-offs and costs related to the exit from
certain product categories, (iv) $1.0 million of other extraordinary gains, losses or expenses, and (v) $1.9 million of additional
extraordinary items identified as part of Ernst & Young’s quality of earnings review; figures
may not sum due to rounding
6.
This presentation contains non-GAAP financial measures within the meaning of Regulation G
promulgated by the Securities and Exchange Commission. For purposes of Regulation G, a non-GAAP financial measure is a
numerical measure of a company's performance, financial position, or cash flows that either excludes or
includes amounts that are not normally excluded or included in the most directly comparable measure calculated and
presented in accordance with generally accepted accounting principles. Adjusted EBITDA, Pro Forma
Adjusted EBITDA, Adjusted Operating Income, and Adjusted Capital Expenditures, and any ratios derived therefrom, are
non-GAAP financial measures that exclude certain items such as asset impairments, restructuring
activities and other extraordinary gains/losses, in order to estimate our financial results and financial position on a going forward
basis. These measures should be considered in addition to results prepared in accordance with GAAP, but
are not a substitute for GAAP results.
7.
Includes full-year impact of cost reductions implemented and anticipated cost reduction initiatives
upon separation of the Easton businesses and the Financing. |