Attached files
| file | filename |
|---|---|
| EX-99.1 - EX-99.1 - Williams Industrial Services Group Inc. | a14-8252_1ex99d1.htm |
| 8-K - CURRENT REPORT OF MATERIAL EVENTS OR CORPORATE CHANGES - Williams Industrial Services Group Inc. | a14-8252_18k.htm |
Exhibit 99.2
|
|
Fourth Quarter and Year End 2013 Conference Call March 18, 2014 |

|
|
Forward-Looking Statements This presentation contains “forward-looking statements” within the meaning of that term set forth in the Private Securities Litigation Reform Act of 1995. These statements reflect our current views of future events and financial performance and are subject to a number of risks and uncertainties. Our actual results, performance or achievements may differ materially from those expressed or implied in the forward-looking statements. Risks and uncertainties that could cause or contribute to such material differences include, but are not limited to, decreased demand for new gas turbine power plants, reduced demand for, or increased regulation of, nuclear power, loss of any of our major customers, cost increases and project cost overruns, unforeseen schedule delays, poor performance by our subcontractors, cancellation of projects, competition for the sale of our products and services, shortages in, or increases in prices for, energy and materials such as steel that we use to manufacture our products, damage to our reputation, warranty or product liability claims, increased exposure to environmental or other liabilities, failure to comply with various laws and regulations, failure to attract and retain highly-qualified personnel, loss of customer relationships with critical personnel, effective integration of acquisitions, modification of preliminary 2014 outlook, volatility of our stock price, deterioration or uncertainty of credit markets, and changes in the economic, social and political conditions in the United States and other countries in which we operate, including fluctuations in foreign currency exchange rates, the banking environment or monetary policy. Other important factors that may cause actual results to differ materially from those expressed in the forward-looking statements are discussed in our filings with the Securities and Exchange Commission, including the section of our Annual Report on Form 10-K filed with the SEC on March 17, 2014 titled “Risk Factors.” Except as may be required by applicable law, we undertake no obligation to publicly update or revise any forward-looking statements, whether as a result of new information, future events or otherwise, and we caution you not to rely upon them unduly. ©Global Power 2014 2 |
|
|
Luis Manuel Ramírez President and Chief Executive Officer |
|
|
2013: Realignment Completed STRATEGY Move from product-based to solutions-oriented organization: drive revenue opportunity Expand margins through simplification, productivity improvements and organic & inorganic growth ACTION: Successful Realignment of Business and Leadership Structure STATUS Simplified organization; improved efficiencies & transparency Energized leadership team; closer to customer Driving LEAN process improvements for productivity & margin expansion Diversified customer base; broadened solutions offering GOAL: Double revenue and operating margins over next three to five years New structure drives Value and Growth ©Global Power 2014 4 |

|
|
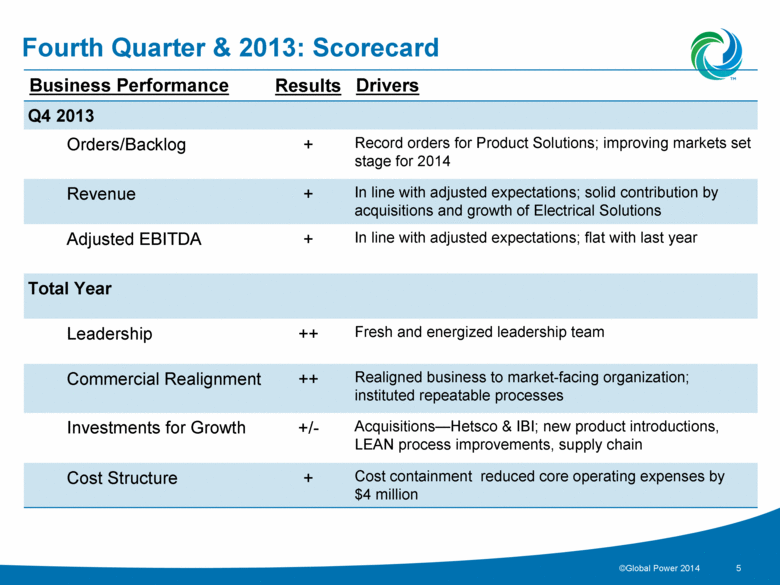
Business Performance Results Drivers Q4 2013 Orders/Backlog + Record orders for Product Solutions; improving markets set stage for 2014 Revenue + In line with adjusted expectations; solid contribution by acquisitions and growth of Electrical Solutions Adjusted EBITDA + In line with adjusted expectations; flat with last year Total Year Leadership ++ Fresh and energized leadership team Commercial Realignment ++ Realigned business to market-facing organization; instituted repeatable processes Investments for Growth +/- Acquisitions—Hetsco & IBI; new product introductions, LEAN process improvements, supply chain Cost Structure + Cost containment reduced core operating expenses by $4 million ©Global Power 2014 5 Fourth Quarter & 2013: Scorecard |
|
|
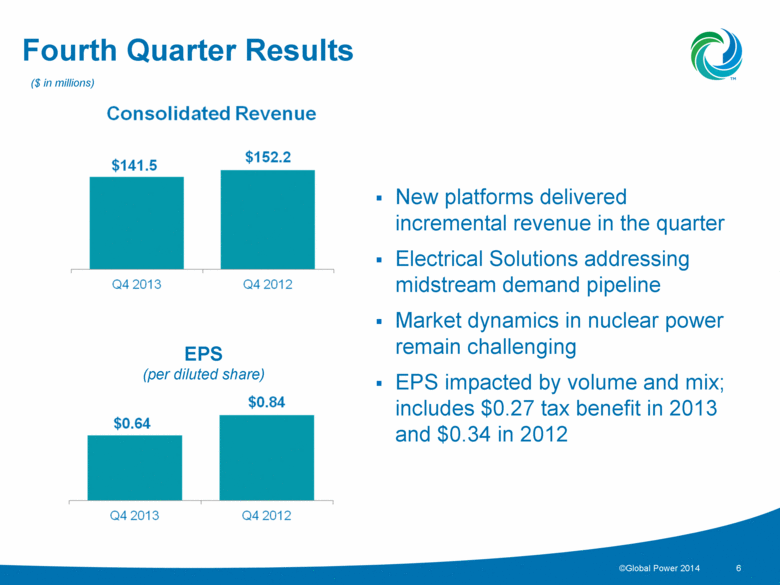
Fourth Quarter Results New platforms delivered incremental revenue in the quarter Electrical Solutions addressing midstream demand pipeline Market dynamics in nuclear power remain challenging EPS impacted by volume and mix; includes $0.27 tax benefit in 2013 and $0.34 in 2012 ($ in millions) EPS (per diluted share) ©Global Power 2014 6 |
|
|
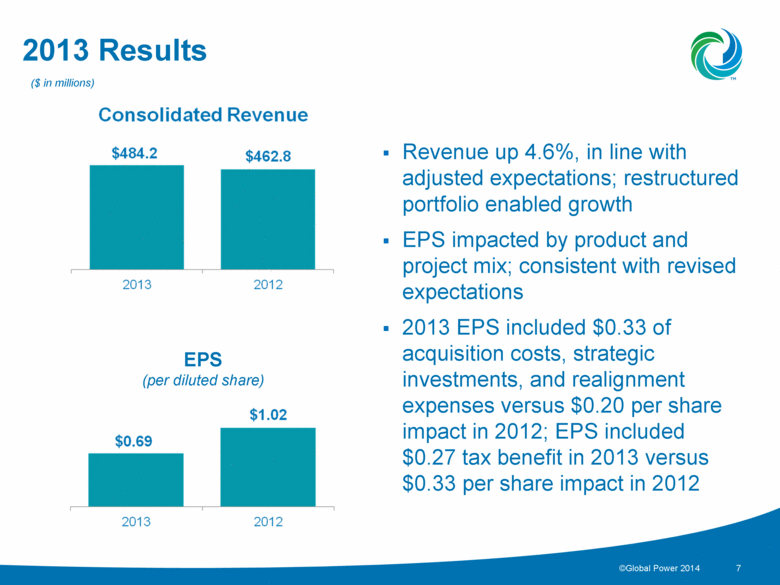
2013 Results Revenue up 4.6%, in line with adjusted expectations; restructured portfolio enabled growth EPS impacted by product and project mix; consistent with revised expectations 2013 EPS included $0.33 of acquisition costs, strategic investments, and realignment expenses versus $0.20 per share impact in 2012; EPS included $0.27 tax benefit in 2013 versus $0.33 per share impact in 2012 ($ in millions) EPS (per diluted share) ©Global Power 2014 7 |
|
|
Randy Guba Sr. Vice President and Chief Financial Officer |

|
|
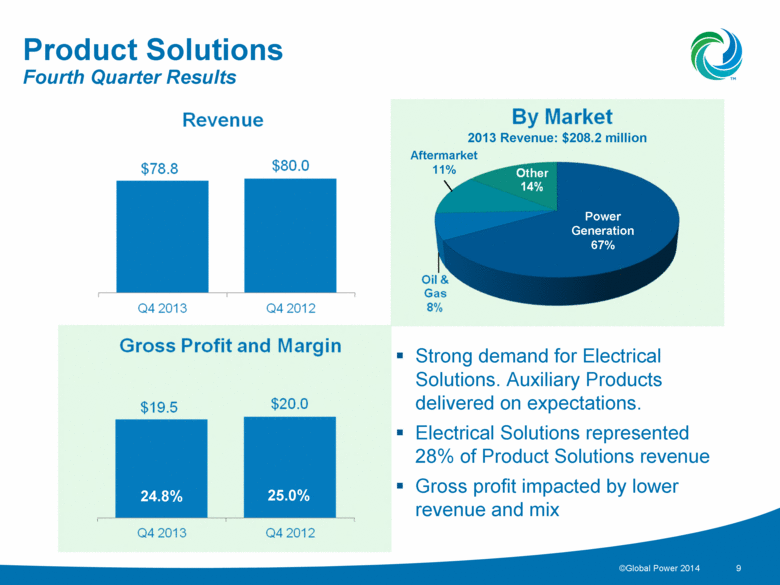
Product Solutions Strong demand for Electrical Solutions. Auxiliary Products delivered on expectations. Electrical Solutions represented 28% of Product Solutions revenue Gross profit impacted by lower revenue and mix ©Global Power 2014 9 24.8% 25.0% Fourth Quarter Results Aftermarket 11% Power Generation 67% 2013 Revenue: $208.2 million |
|
|
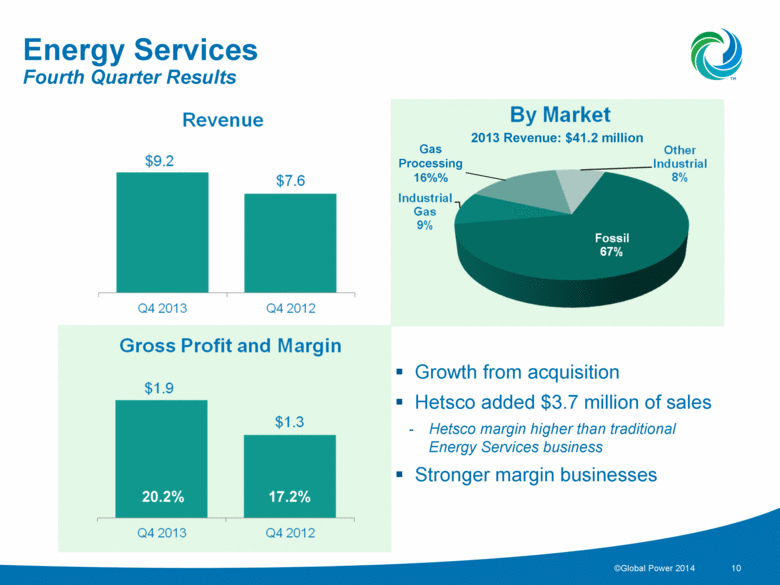
Gas Processing 16%% Energy Services Growth from acquisition Hetsco added $3.7 million of sales Hetsco margin higher than traditional Energy Services business Stronger margin businesses ©Global Power 2014 10 20.2% 17.2% Fourth Quarter Results 2013 Revenue: $41.2 million |
|
|
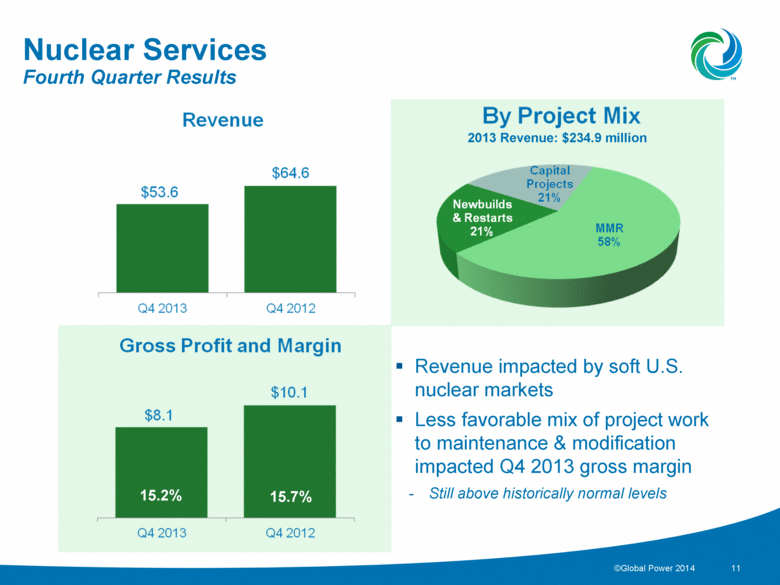
Nuclear Services Revenue impacted by soft U.S. nuclear markets Less favorable mix of project work to maintenance & modification impacted Q4 2013 gross margin Still above historically normal levels ©Global Power 2014 11 15.2% 15.7% Fourth Quarter Results 2013 Revenue: $234.9 million |
|
|
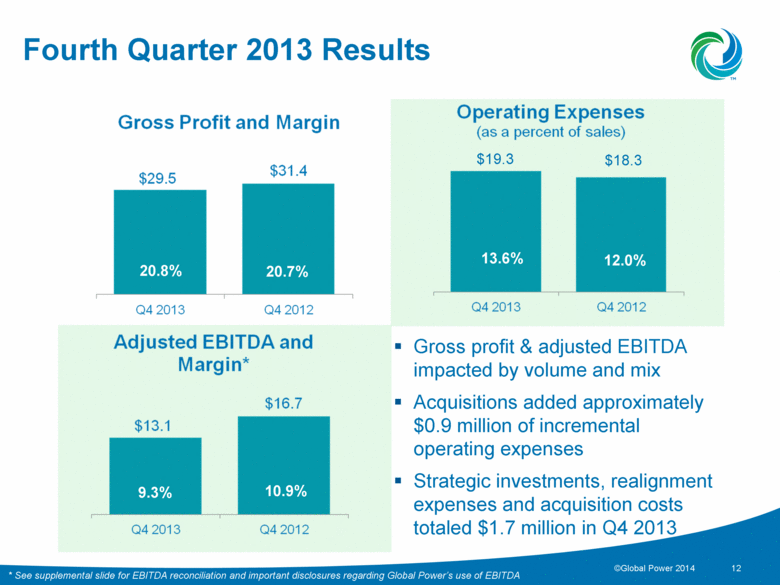
Fourth Quarter 2013 Results Gross profit & adjusted EBITDA impacted by volume and mix Acquisitions added approximately $0.9 million of incremental operating expenses Strategic investments, realignment expenses and acquisition costs totaled $1.7 million in Q4 2013 ©Global Power 2014 12 9.3% 10.9% 20.8% 20.7% * See supplemental slide for EBITDA reconciliation and important disclosures regarding Global Power’s use of EBITDA $18.3 $19.3 13.6% 12.0% |
|
|
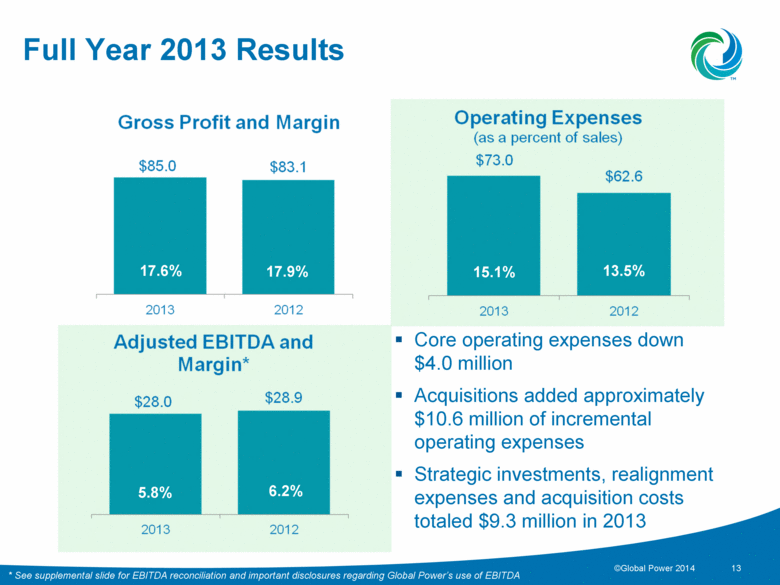
Full Year 2013 Results Core operating expenses down $4.0 million Acquisitions added approximately $10.6 million of incremental operating expenses Strategic investments, realignment expenses and acquisition costs totaled $9.3 million in 2013 ©Global Power 2014 13 5.8% 6.2% 17.6% 17.9% * See supplemental slide for EBITDA reconciliation and important disclosures regarding Global Power’s use of EBITDA 13.5% 15.1% |
|
|
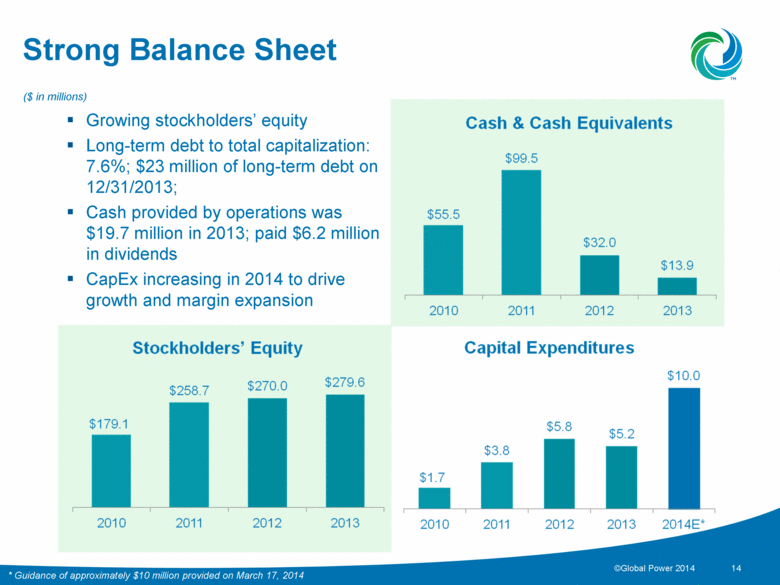
Strong Balance Sheet Growing stockholders’ equity Long-term debt to total capitalization: 7.6%; $23 million of long-term debt on 12/31/2013; Cash provided by operations was $19.7 million in 2013; paid $6.2 million in dividends CapEx increasing in 2014 to drive growth and margin expansion ($ in millions) ©Global Power 2014 14 * Guidance of approximately $10 million provided on March 17, 2014 |
|
|
Luis Manuel Ramírez President and Chief Executive Officer |
|
|
Backlog Expect 2014 growth from Product Solutions and Energy Services Energy Services: Shifting to shorter cycle business To convert to revenue in 2014 Organic book-to-bill ratio was 0.9x in Q4 2013 and 0.7x for full year No special project in year-end backlog Product Solutions: Record Q4 orders of $80.5 million Strong demand for both product categories Organic book-to-bill ratio in Q4 2013 was 1.0x and 1.2x for full year Nuclear Services: Outages decline 80% expected to convert to revenue in 2014 Book-to-bill ratio was 0.7x in the quarter, 0.8x for full year ($ in millions) ©Global Power 2014 16 $344.1 $393.7 $390.3 Energy Services Product Solutions Nuclear Services |

|
|
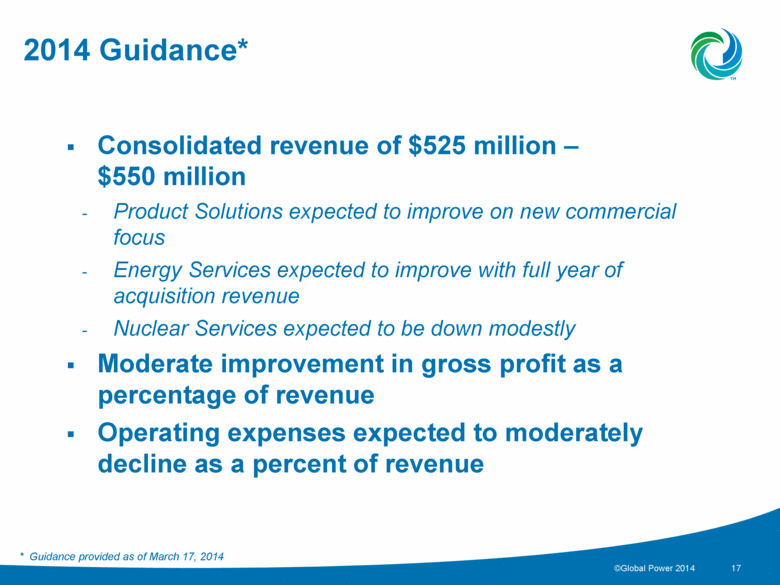
2014 Guidance* * Guidance provided as of March 17, 2014 ©Global Power 2014 17 Consolidated revenue of $525 million – $550 million Product Solutions expected to improve on new commercial focus Energy Services expected to improve with full year of acquisition revenue Nuclear Services expected to be down modestly Moderate improvement in gross profit as a percentage of revenue Operating expenses expected to moderately decline as a percent of revenue |
|
|
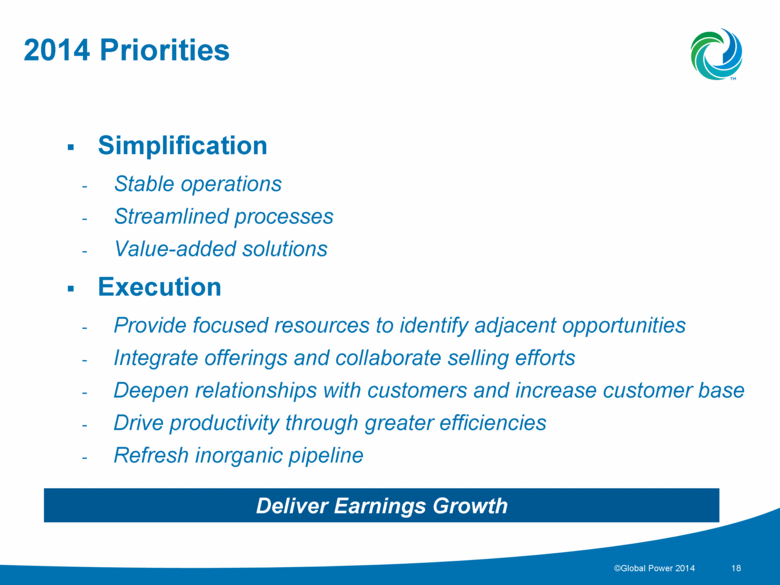
2014 Priorities ©Global Power 2014 18 Simplification Stable operations Streamlined processes Value-added solutions Execution Provide focused resources to identify adjacent opportunities Integrate offerings and collaborate selling efforts Deepen relationships with customers and increase customer base Drive productivity through greater efficiencies Refresh inorganic pipeline Deliver Earnings Growth |
|
|
Global Power Investor Day ©Global Power 2014 19 Date: Wednesday, June 11, 2014 Time: 8:00 a.m. 8:30 a.m. 12:15 p.m. Registration and continental breakfast Presentations begin Lunch Location: Le Parker Meridien, Third Floor 119 W 56th Street New York, NY 10019 RSVP: by Wednesday, May 28, 2014 If you have any questions or to RSVP, please contact Kei Advisors LLC, our investor relations firm: Karen Howard khoward@keiadvisors.com (716) 843-3942 Garett Gough ggough@keiadvisors.com (716) 846-1352 |

|
|
Fourth Quarter and Year End 2013 Conference Call March 18, 2014 |
|
|
Supplemental |

|
|
GAAP to Non-GAAP Adjusted EBITDA Reconciliation Adjusted EBITDA from continuing operations represents income from continuing operations adjusted for income taxes, interest, depreciation and amortization, and unusual expenses. The Company believes Adjusted EBITDA from continuing operations is an important supplemental measure of operating performance and uses it to assess performance and inform operating decisions. However, Adjusted EBITDA from continuing operations is not a GAAP financial measure. The Company’s calculation of Adjusted EBITDA from continuing operations should not be used as a substitute for GAAP measures of performance, including net cash provided by operations, operating income and net income. The Company’s method of calculating Adjusted EBITDA from continuing operations may vary substantially from the methods used by other companies, and investors are cautioned not to rely unduly on it. ©Global Power 2014 22 Three Months Ended December 31, Year Ended December 31, 2013 2012 2013 2012 GAAP Income from continuing operations $ 10,936 $ 14,407 $ 11,506 $ 17,570 Add back: Income tax (benefit) provision (1,014) (1,552) (437) 1,031 Interest expense, net 410 198 893 1,563 Depreciation and amortization 2,418 2,105 8,034 3,697 Non-GAAP EBITDA from continuing operations $ 12,750 $ 15,158 $ 19,996 $ 23,861 Add back: Strategic investments, realignment expenses and acquisition costs 1,658 1,495 9,311 5,061 Prior-period adjustment (1,300) - (1,300) - Non-GAAP Adjusted EBITDA from continuing operations $ 13,108 $ 16,653 $ 28,007 $ 28,922 |

|
|
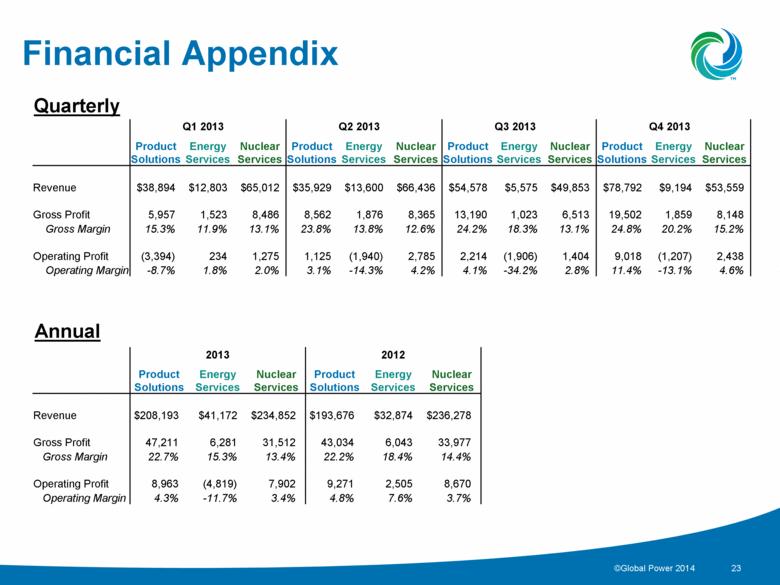
Financial Appendix ©Global Power 2014 23 Q1 2013 Q2 2013 Q3 2013 Q4 2013 Product Solutions Energy Services Nuclear Services Product Solutions Energy Services Nuclear Services Product Solutions Energy Services Nuclear Services Product Solutions Energy Services Nuclear Services Revenue $38,894 $12,803 $65,012 $35,929 $13,600 $66,436 $54,578 $5,575 $49,853 $78,792 $9,194 $53,559 Gross Profit 5,957 1,523 8,486 8,562 1,876 8,365 13,190 1,023 6,513 19,502 1,859 8,148 Gross Margin 15.3% 11.9% 13.1% 23.8% 13.8% 12.6% 24.2% 18.3% 13.1% 24.8% 20.2% 15.2% Operating Profit (3,394) 234 1,275 1,125 (1,940) 2,785 2,214 (1,906) 1,404 9,018 (1,207) 2,438 Operating Margin -8.7% 1.8% 2.0% 3.1% -14.3% 4.2% 4.1% -34.2% 2.8% 11.4% -13.1% 4.6% 2013 2012 Product Solutions Energy Services Nuclear Services Product Solutions Energy Services Nuclear Services Revenue $208,193 $41,172 $234,852 $193,676 $32,874 $236,278 Gross Profit 47,211 6,281 31,512 43,034 6,043 33,977 Gross Margin 22.7% 15.3% 13.4% 22.2% 18.4% 14.4% Operating Profit 8,963 (4,819) 7,902 9,271 2,505 8,670 Operating Margin 4.3% -11.7% 3.4% 4.8% 7.6% 3.7% Quarterly Annual |