Attached files
Table of Contents
UNITED STATES
SECURITIES AND EXCHANGE COMMISSION
WASHINGTON, D.C. 20549
FORM 10-K
ANNUAL REPORT PURSUANT TO SECTION 13 OR 15(d) OF
THE SECURITIES EXCHANGE ACT OF 1934
For the fiscal year ended December 31, 2010
Commission File No. 001-16501

Global Power Equipment Group Inc.
(Exact name of registrant as specified in its charter)
| Delaware | 73-1541378 | |
| (State or other jurisdiction of incorporation or organization) |
(I.R.S. Employer Identification No.) |
5199 N. Mingo Road
Tulsa, OK 74117
(Address of registrant’s principal executive offices and zip code)
Registrant’s telephone number, including area code: (918) 488-0828
Securities to be registered pursuant to Section 12(b) of the Act:
| Title of each class to be so registered |
Name of each exchange on which each class is to be registered | |
| Common Stock, par value $0.01 per share | The NASDAQ Stock Market LLC |
Securities registered pursuant to Section 12(g) of the Act:
NONE
Indicate by check mark if the registrant is a well-known seasoned issuer, as defined in Rule 405 of the Securities Act. Yes ¨ No x
Indicate by check mark if the registrant is not required to file reports pursuant to Section 13 or Section 15(d) of the Act. Yes ¨ No x
Indicate by check mark whether the registrant (1) has filed all reports required to be filed by Section 13 or 15(d) of the Securities Exchange Act of 1934 during the preceding 12 months (or for such shorter period that the registrant was required to file such reports), and (2) has been subject to such filing requirements for the past 90 days. Yes x No ¨
Indicate by check mark whether the registrant has submitted electronically and posted on its corporate Web site, if any, every Interactive Data File required to be submitted and posted pursuant to Rule 405 of Regulation S-T during the preceding 12 months (or for such shorter period that the registrant was required to submit and post such files). Yes ¨ No ¨
Indicate by check mark if disclosure of delinquent filers pursuant to Item 405 of Regulation S-K is not contained herein, and will not be contained, to the best of registrant’s knowledge, in definitive proxy or information statements incorporated by reference in Part III of this Form 10-K or any amendment to this Form 10-K. x
Indicate by check mark whether the registrant is a large accelerated filer, an accelerated filer, a non-accelerated filer, or a smaller reporting company. See the definitions of “large accelerated filer,” “accelerated filer” and “smaller reporting company” in Rule 12b-2 of the Exchange Act. (Check one):
| Large accelerated filer | ¨ | Accelerated filer | ¨ | |||
| Non-accelerated filer | x | Smaller reporting company | ¨ | |||
Indicate by check mark whether the registrant is a shell company (as defined in Rule 12b-2 of the Exchange Act. Yes ¨ No x
The aggregate market value of the voting and non-voting common equity held by non-affiliates computed by reference to the price at which the common equity was last sold, as of the last business day of the registrant’s most recently completed second fiscal quarter was $250,575,185. For purpose of this calculation only, without determining whether the following are affiliates of the registrant, the registrant has assumed that (i) its directors and executive officers are affiliates; and (ii) no party who has filed a Schedule 13D or 13G is an affiliate.
Indicate by check mark whether the registrant has filed all documents and reports required to be filed by Section 12, 13 or 15(d) of the Securities Exchange Act of 1934 subsequent to the distribution of securities under a plan confirmed by a court. Yes x No ¨
The number of shares outstanding of the registrant’s Common Stock as of March 11, 2011 was 15,469,287.
DOCUMENTS INCORPORATED BY REFERENCE
Portions of the registrant’s Proxy Statement for the registrant’s 2011 Annual Meeting of Stockholders are incorporated by reference into Part III of the Form 10-K to the extent stated herein. The Proxy Statement or an amended report on Form 10-K will be filed within 120 days of the registrant’s year ended December 31, 2010.
Table of Contents
Statements we make in this Form 10-K that express a belief, expectation or intention or otherwise are not limited to recounting historical facts are forward-looking statements. These forward-looking statements are subject to various risks, uncertainties and assumptions, including those noted under the headings “Cautionary Statement Regarding Forward Looking Statements” and “Risk Factors” in Items 1 and 1A of this Form 10-K.
3
Table of Contents
Cautionary Statement Regarding Forward-Looking Statements
This Form 10-K and its exhibits contain or incorporate by reference various forward-looking statements that express a belief, expectation or intention or are otherwise not statements of historical fact. Forward-looking statements generally use forward-looking words, such as “may,” “will,” “could,” “project,” “believe,” “anticipate,” “expect,” “estimate,” “continue,” “potential,” “plan,” “forecast” and other words that convey the uncertainty of future events or outcomes. Forward-looking statements include information concerning possible or assumed future results of our operations, including the following:
| • | business strategies; |
| • | operating and growth initiatives and opportunities; |
| • | competitive position; |
| • | market outlook and trends in our industry; |
| • | expected financial condition; |
| • | future cash flows; |
| • | financing plans; |
| • | expected results of operations; |
| • | future capital and other expenditures; |
| • | availability of raw materials and inventories; |
| • | plans and objectives of management; |
| • | future compliance with orders and agreements with regulatory agencies; |
| • | expected outcomes of legal or regulatory proceedings and their expected effects on our results of operations; and |
| • | any other statements regarding future growth, future cash needs, future operations, business plans and future financial results. |
These forward-looking statements represent our intentions, plans, expectations, assumptions and beliefs about future events and are subject to risks, uncertainties and other factors, including unpredictable or unanticipated factors that we have not discussed in this Form 10-K. Many of those factors are outside of our control and could cause actual results to differ materially from the results expressed or implied by the forward-looking statements.
In light of these risks, uncertainties and assumptions, the events described in the forward-looking statements might not occur or might occur to a different extent or at a different time than we have described. You should consider the areas of risk and uncertainty described above, as well as those discussed under “Item 1A–Risk Factors” in this Form 10-K. Except as may be required by applicable law, we undertake no obligation to update or revise any forward-looking statements, whether as a result of new information, future events or otherwise and we caution you not to rely upon them unduly.
Overview
Global Power Equipment Group Inc. is a comprehensive provider of power generation equipment and maintenance services for customers in the domestic and international energy, power infrastructure and service industries. When we use the terms the “Company,” “we,” “us” or “our” in this Annual Report on Form 10-K, we mean Global Power Equipment Group Inc. and its subsidiaries on a consolidated basis, unless we state or the context implies otherwise.
We use the Braden Manufacturing, Consolidated Fabricators, Williams Industrial Services Group and Deltak trade names and the logos for each of those divisions and for Global Power Equipment Group. These trade names and logos are the property of Global Power Equipment Group Inc. or its subsidiaries. Product names and company programs appearing throughout in italics are trademarks of the Company or its subsidiaries. This Annual Report on Form 10-K also may refer to brand names, trademarks, service marks and trade names of other companies and organizations, and these brand names, trademarks, service marks and trade names are the property of their respective owners.
Unless we indicate otherwise, we base the information concerning our industry contained or incorporated by reference herein on our general knowledge of and expectations concerning the industry. Our market position, market share and industry market size are based on our estimates using our internal data and estimates, based on data from various industry analyses, our internal research and adjustments and assumptions that we believe to be reasonable. We have not independently verified data from industry analyses and cannot guarantee their accuracy or completeness. In addition, we believe that data regarding the industry, market size and our market position and market share within such industry provide general guidance but are inherently imprecise. Further, our estimates and assumptions involve risks and uncertainties and are subject to change based on various factors, including those discussed in the “Risk factors” section of this Annual Report on Form 10-K. These and other factors could cause results to differ materially from those expressed in the estimates and assumptions.
4
Table of Contents
Revenues for purposes of market size, market position and market share information are based on revenues in U.S. dollars.
We design, engineer and manufacture a comprehensive range of auxiliary and heat recovery equipment primarily used to enhance the efficiency and facilitate the operation of gas turbine power plants as well as for other industrial, energy and power-related applications. With a strong competitive position in our product lines, we benefit from a large installed base of equipment in domestic and international markets.
We provide on-site specialty maintenance and outage management services for nuclear power plants and specialty maintenance and other industrial services to fossil-fuel and hydroelectric power plants and other industrial operations in the United States. These services include a comprehensive range of industrial maintenance, modification and construction services for power generation, pulp and paper, chemical, refining, manufacturing and other industrial market segments. We have the capability to combine our services and equipment resources to offer turn-key solutions for aftermarket repair applications for the North American gas turbine power generation, process and cogeneration markets.
Through predecessor entities, we have over 41 years of experience providing custom engineered products that are critical for the operation of gas turbine power plants and more than 19 years of experience providing complex outage shutdown services to operators of nuclear power plants as well as other industrial maintenance services. Our current corporate structure dates to 2001 when we made our initial public offering and listed our stock on the New York Stock Exchange. We acquired our nuclear plant and other industrial services capabilities through a transaction completed in April 2005.
Corporate Structure Overview. The following chart shows the relationship between Global Power Equipment Group Inc., which is a Delaware corporation, and each of its three primary operating subsidiaries, each of which is a Delaware limited liability company.
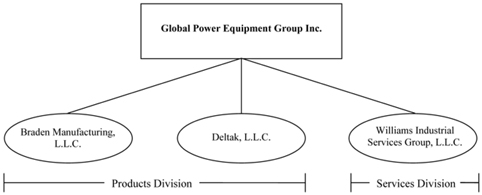
Global Power Equipment Group Inc. and all of its U.S. subsidiaries filed voluntary Chapter 11 petitions under the United States Bankruptcy Code on September 28, 2006. We successfully exited Chapter 11 on January 22, 2008 pursuant to an approved Plan of Reorganization. For details regarding the events leading to, certain consequences of, and the terms of our emergence from bankruptcy, see the discussion below in Item 1 under the heading “Bankruptcy Reorganization.”
Business Segments
We operate through two business segments that we refer to as our Products Division and our Services Division. For information about our segments see Note 12 to our consolidated financial statements included in this Form 10-K.
Through our Products Division, we engineer, design and fabricate products worldwide for the gas turbine power generation, energy and process industries. We supply auxiliary power equipment and components under the Braden Manufacturing and Consolidated Fabricators brands and heat recovery equipment under the Deltak brand. A significant portion of our products revenue originates outside of the United States.
Through our Services Division, we provide industrial technical services under the Williams Industrial Services Group brand, focusing on specialty services, outage management and overhaul of power facilities and other heavy industrial plants. Virtually all of our services revenue is from operations conducted in the United States.
5
Table of Contents
Revenues by segment for 2010, 2009 and 2008 are as follows (in thousands):
| For the Years Ended December 31, | ||||||||||||||||||||||||
| 2010 | 2009 | 2008 | ||||||||||||||||||||||
| Products Division |
$ | 142,683 | 27 | % | $ | 193,150 | 36 | % | $ | 311,603 | 56 | % | ||||||||||||
| Services Division |
377,461 | 73 | % | 347,460 | 64 | % | 245,161 | 44 | % | |||||||||||||||
| $ | 520,144 | $ | 540,610 | $ | 556,764 | |||||||||||||||||||
Products Division
We manufacture and sell two primary product lines: auxiliary power equipment and heat recovery equipment. We sell our products to the gas turbine power generation, process and cogeneration market segments. Our principal customers are gas turbine original equipment manufacturers and engineering, procurement and construction contractors. We also provide replacement parts, filter elements and aftermarket retrofit equipment to both original equipment manufacturers and end users. Our products are critical to the efficient operation of gas turbine power plants and are custom engineered to meet customer-specific requirements.
The contracts under which we sell our products are generally fixed-price contracts, virtually all of which are “lump sum bid” contracts. Under lump sum bid contracts, we bid against other contractors based on relatively fixed customer specifications.
Auxiliary Power Equipment. We provide a comprehensive range of products critical to the operation of gas turbine power plants through our Braden Manufacturing subsidiary, headquartered in Tulsa, Oklahoma. Our auxiliary power equipment product offerings, which we market under the Braden and Consolidated Fabricators brand names, include:
| • | Filter Houses. A filter house cleans debris, dirt and other contaminants from the air that enters the turbine, using either a barrier filter or a pulse filter. Barrier filters use a series of filter elements contained in a large filter house to remove airborne contaminants. Pulse filters are self-cleaning filters that use blasts of air to expel dirt or ice from the filter element. In addition to a barrier or pulse filter, a filter house may include evaporative coolers, chiller coils, fog cooling systems, anti-icing systems and a broad range of other equipment to treat the air enters the turbine. |
| • | Inlet Systems. Inlet systems are large air intake ducts that connect the filter house to the gas turbine and provide silencing for the noise emanating from the gas turbine through the inlet. The major components of an inlet system are inlet silencers, expansion joints and inlet ductwork. |
| • | Exhaust Systems. Exhaust systems direct the hot exhaust from the turbine to the atmosphere. The main components of an exhaust system are exhaust ductwork, acoustic silencing equipment and the exhaust stack. Exhaust systems are custom engineered and complex due to the severe turbulence and heat exposure that they must endure. |
| • | Diverter Dampers. Diverter dampers divert the hot exhaust from the gas turbine into a heat recovery steam generator when the power plant is operated as a combined cycle facility or into the exhaust stack in the case of a simple cycle operation. We also design and manufacture various other types of dampers. |
| • | Selective Catalytic Emission Reduction Systems. These systems, commonly referred to as SCRs, are used in simple cycle gas turbine facilities and are focused on removing oxides of nitrogen and carbon monoxide from the exhaust gas. |
| • | Packaged Skids, Precision Parts and Specialty Fabrications. We engineer these products in our Auburn, Massachusetts plant and sell them under the Consolidated Fabricators brand. Packaged skids in various configurations support the operation of the gas turbine. Precision parts and specialty fabrications are used in both new gas turbine equipment and in aftermarket applications. |
Heat Recovery Equipment. We provide heat recovery steam generator, heat recovery system generators and specialty boilers and related products through our Deltak subsidiary, headquartered in Plymouth, Minnesota. We market these products under the Deltak brand name.
| • | Heat Recovery Steam Generators. A heat recovery steam generator (commonly referred to as an “HRSG”) is a boiler that creates steam in a combined cycle power plant or a cogeneration plant using the hot exhaust emitted by the gas turbine or other heat source. This steam is either used to drive a steam turbine to produce additional electricity in a combined cycle power plant or is used for process purposes in a cogeneration plant. Each HRSG is custom designed and engineered to meet the specifications of the customer, taking into account the type of gas turbine and the environmental locale, among other factors. We design and manufacture HRSGs for applications supporting turbines up to 85 megawatt capacity for both new combined cycle and retrofitted simple cycle power plants. We have an installed base of more than 300 mid-sized HRSGs in over 20 countries. |
| • | Specialty Boilers and Related Products. Specialty boilers are a highly customized class of equipment that capture waste heat and convert it to other working fluids or to create steam. We develop creative engineering solutions to produce specialty boilers used in process heat recovery and incineration systems, small power generation systems and marine cogeneration systems. Our specialty boilers are used in a wide range of markets, including oil and gas, pulp and paper, chemicals, petrochemical, marine and food industries. We have an installed base of more than 1,100 specialty boilers in over 30 countries. |
6
Table of Contents
Supply Chain Structure. We fabricate our equipment through a combination of in-house manufacturing at our own factories in the United States and Mexico and outsourced manufacturing in other countries around the world. Our network of high-quality international manufacturing partners, located in more than 20 countries, allows us to manufacture equipment worldwide and maintain a competitive cost structure. Outsourcing a portion of our manufacturing enables us to meet increasing demand without being restricted by internal manufacturing capacity limitations and also reduces our capital expenditure requirements. Our employees work closely with our international manufacturing partners to supervise the manufacture of our products at their facilities. Our use of manufacturing facilities around the world, whether our own or those of our manufacturing partners, allows us to respond to the particular sourcing initiatives of our customers, whether those initiatives call for global sourcing or for localized supply content.
Our technical engineering capabilities enable us to design and manufacture what we believe are among the broadest ranges of gas turbine power plant and other power-related equipment to meet each customer’s specific performance requirements. We provide products for gas turbine power plants to most of the leading power industry original equipment manufacturers and to a number of leading power generating companies and engineering, procurement and construction firms within the United States and abroad.
Gas Turbine Power Generation, Process and Cogeneration Market Overview. All gas turbine power plants combine a gas turbine with a generator to produce electricity. In a simple cycle gas turbine plant, the hot exhaust coming out of the gas turbine is vented to the atmosphere through an exhaust stack. In a combined cycle plant, the hot exhaust coming out of the gas turbine is fed into a heat recovery steam generator; the HRSG captures much of the heat from the gas turbine exhaust to generate steam, which in turn is used to power a steam turbine and generate more electricity before the exhaust is vented into the atmosphere. We manufacture products that are critical components of both simple cycle and combined cycle plants, including filter houses, inlet and exhaust systems and turbine and generator components. We also manufacture specialized diverter dampers that are used in combined cycle plants between the gas turbines and the HRSG.
We believe manufacturers of equipment and components supporting gas turbine power plants are well positioned to benefit from the need for new or more efficient power generation infrastructure. The advantages of power generation plants utilizing gas turbine technologies versus other technologies include:
| • | lower construction costs; |
| • | shorter construction periods; |
| • | improved operating efficiency; |
| • | lower emissions of CO2; |
| • | minimal other environmental impact; |
| • | flexibility to expand plant capacity; |
| • | smaller geographical footprint; and |
| • | rapid start-up and shutdown time. |
As a provider of equipment for simple and combined cycle gas turbine power plants, we expect to benefit from the growth of gas turbine power plant capacity that we expect to benefit from the factors listed above.
Services Division
Our Services Division, headquartered in Atlanta, Georgia, operates under the name Williams Industrial Services Group, L.L.C. (“Williams”). Through Williams, we provide routine and specialty maintenance services to a wide range of utilities and industrial customers, including nuclear, fossil-fuel and hydroelectric power plants and pulp and paper mills. Our service offerings include industrial painting and coating, removal of hazardous materials, industrial insulation, repair and replacement of roofing systems and nuclear, fossil fuel and hydroelectric power plant maintenance. The majority of these services are designed to improve or sustain operating efficiencies and extend the useful lives of process equipment in these facilities. In addition, these services provide our customers with a credible alternative to maintaining in-house maintenance capabilities. We provide maintenance services both on a constant presence basis and as a service provider for discrete projects. By providing high quality industrial services with exemplary safety performance, we have forged long-standing relationships with many leading utility companies.
We contract for approximately 85% of the services we provide on a cost-plus basis under contracts that provide for reimbursement of costs incurred plus an amount of profit in the form of a mark-up. We contract for the remaining approximately 15% of the services we provide on a fixed-price basis. In the case of lump sum bid contracts, we bid against other contractors based on customer specifications. Fixed-price contracts present certain inherent risks, including the possibility of ambiguities in the specifications received, problems with new technologies and economic and other changes that may occur over the contract period. Accordingly, fixed-price agreements are not our preferred form of contract. However, because of efficiencies that may be realized during the contract term, fixed-price contracts may offer greater profit potential than other types of contracts.
7
Table of Contents
Service offerings include the following:
| • | Nuclear Power Plant Maintenance. We perform a full range of critical services for the nuclear facility market, including routine maintenance and modification work performed during outages, decommissioning services, cooling tower and steam generator replacement support and vessel and heat exchanger replacements. We are one of a limited number of companies qualified to perform comprehensive services in United States nuclear power plants under rules issued by the U.S. Nuclear Regulatory Commission (“NRC”). Under these rules, owners of nuclear facilities must qualify contractors by requiring the contractors to demonstrate that they will comply with NRC regulations on quality assurance, reporting of safety issues, security and control of personnel access and conduct. |
| • | Fossil Fuel and Hydroelectric Power Plant Maintenance. We provide routine maintenance, repair and capital project services primarily in coal-fired, gas-fired and hydroelectric power plants, often managing hundreds of craft employees. Services provided include electrical and mechanical maintenance, outage support, turnarounds, welding, scaffolding, staff augmentation, grounds maintenance and janitorial and custodial services. |
| • | Industrial Painting and Coatings. We perform cleaning, surface preparation, coatings application, quality control and inspection testing, utilizing Williams Insight™, our proprietary analysis system, to help our customers schedule and prioritize major coating projects based on a detailed cost/benefit analysis. Coatings applied in industrial environments are typically designed for specific applications. To satisfy these exacting requirements, many of these coatings involve multiple component mixes, require specialized application equipment and are strictly monitored and tested. |
| • | Insulation. We provide a variety of industrial insulation services, primarily in process-piping installations. These services are commonly packaged with industrial coating projects. |
| • | Roofing Systems. We routinely replace, repair and upgrade industrial facility roofing systems, primarily within the highly corrosive environments of pulp and paper manufacturing facilities. Our proprietary Pro-Tec™ Panel system allows our employees to safely work above operational equipment on roofing projects while containing all refuse materials. This allows us to rehabilitate or completely replace the roof of an industrial facility without interrupting production. |
| • | Abatement. We provide two primary abatement services for the removal of hazardous materials: removal of asbestos and removal of heavy metal based coatings such as lead paint. These services involve the demolition of the contaminated area, the collection and containment of hazardous material and arrangements for their disposal or storage. We do not take ownership of hazardous materials and do not assume responsibility for the liability associated with the materials other than for our actions meeting applicable statutory and regulatory requirements. |
| • | Valve Services. We provide integrated valve and actuator services to our customer base. These services include inspection, preventative maintenance and repair of various types of valves and actuators. We offer a broad spectrum of valve services for diagnostic testing and analysis, project management, training and engineering. |
Industrial Services Industry and Market Overview. Industrial services in the U.S. is a multi-billion dollar industry broadly defined as routine maintenance and technical services provided to industrial facilities ranging from manufacturing facilities to power generation plants. The industry is currently experiencing a shift towards outsourcing as plant operators seek to alleviate financial constraints, reduce labor costs, increase labor utilization and productivity and eliminate operational redundancies.
We expect that power industry demand for industrial maintenance services will be driven by the following factors in the future:
| • | Aging Infrastructure. According to the U.S. Department of Energy’s Energy Information Administration, more than half of the electrical generating capacity in the United States was placed in service before 1980. Coupled with the limited number of large-scale power generation facilities being constructed, the efforts to maintain older plants of all types and take advantage of newer and more efficient technologies at existing sites have created opportunities for companies providing maintenance and modification services. |
| • | Increasing Demand for Nuclear Plant Maintenance. The United States has 104 operating nuclear reactors that generate approximately 20% of annual electric production. These nuclear reactors have been in operation for an average of 30 years and require extensive ongoing engineering and maintenance services to support operations and improve performance. Nuclear power plants in the United States are subject to a rigorous program of NRC oversight, inspection, preventive and corrective maintenance, equipment replacement and equipment testing. Nuclear power plants are required by the NRC to go offline to refuel at intervals of no more than 24 months and to perform condition monitoring and preventive maintenance during every refueling outage. NRC regulations also require that nuclear generating facilities be decommissioned, or returned to “greenfield” status, at the end of their operating lives. Initially, commercial nuclear power plants in the United States were licensed to operate for 40 years, reflecting the amortization period generally used by electric utility companies for large capital investments. In 2000, the NRC issued the first license renewal to a nuclear power plant, extending its license for an additional 20 years beyond its original 40-year license. The NRC has since issued 20-year license extensions for numerous reactors and is reviewing license renewal applications for others. We expect the extended operating licenses of nuclear power plants will also increase the maintenance requirements of these facilities. |
8
Table of Contents
| • | New Nuclear Plant Construction. We expect new nuclear plants to be constructed over the next 10 years. In February 2010, the federal government announced loan guarantees for the construction of the first new nuclear unit at Southern Nuclear Operating Company’s Vogtle Nuclear Plant near Waynesboro, Georgia. We believe we are well positioned to participate in new plant construction opportunities, through our Williams Services Division. The types of services we provide are generally required in the later stages of the construction process and they are frequently subcontracted by new build contractors. |
Customers and Marketing
Products. Our Products customers include original equipment manufacturers (“OEM”), engineering procurement and construction firms, utilities and independent operators of power generation facilities and firms engaged across several process related industries. The end users of most of our products are owners and operators of gas turbine power plants, process plants and refineries. We market our products globally through a sales network consisting of employees and independent representatives. We have employed sales representatives in China, Egypt, the Netherlands and the United States. Our sales teams travel extensively and work with our local manufacturing partners to assess local market conditions, utilize local contacts and respond quickly to our customers’ needs. We focus our sales and marketing efforts on end users of our products, including the developers and operators of gas turbine power plants, and on gas turbine original equipment manufacturers, which may order our products directly or specify the use of our products.
Services. Our Services customers include major private and government owned utilities throughout the United States as well as leaders in the United States paper and industrial sectors. We market our services using dedicated sales and marketing personnel, operations personnel, and external consultants retained for specific projects. We use specific services sales initiatives to emphasize long-term renewable contracts that are augmented by small to medium sized, fixed-price projects. Our services sales initiatives directly seek to apply operational strengths to specific facilities within the targeted markets, including nuclear power, pulp and paper and other industrial plants located throughout the United States.
Revenues by Customer and Geographic Region. Our top customers vary from year-to-year depending on the relative size and duration of our projects over time. Customers that accounted for more than 10% of our consolidated revenues in 2010, 2009 and 2008 were:
| For the Years Ended December 31, | ||||||||||||
| 2010 | 2009 | 2008 | ||||||||||
| Entergy Services Inc. |
24 | % | 11 | % | * | |||||||
| Southern Company |
23 | % | 12 | % | 10 | % | ||||||
| General Electric Company |
* | 13 | % | 20 | % | |||||||
| Tennessee Valley Authority |
* | 11 | % | * | ||||||||
| * | Less than 10% |
Our revenues from each of the customers listed in the above table are derived from multiple purchase orders or contracts that are entered into, performed, and terminate independently of each other.
Our Products revenues by geographic regions for the years 2010, 2009 and 2008 are shown in the following table both on the basis of revenue recognition and on the basis of shipment destination (in thousands):
| Years ended December 31, | ||||||||||||||||||||||||
| 2010 | 2009 | 2008 | ||||||||||||||||||||||
| Revenue Recognized In |
Product Shipped To |
Revenue Recognized In |
Product Shipped To |
Revenue Recognized In |
Product Shipped To |
|||||||||||||||||||
| United States |
$ | 99,063 | $ | 52,764 | $ | 139,138 | $ | 66,320 | $ | 212,914 | $ | 105,301 | ||||||||||||
| Canada |
— | 9,585 | — | 11 | — | 22,050 | ||||||||||||||||||
| Europe |
32,009 | 11,668 | 38,471 | 31,345 | 80,792 | 20,704 | ||||||||||||||||||
| Mexico |
7,522 | 744 | 10,518 | 364 | 16,350 | 116 | ||||||||||||||||||
| Asia |
4,089 | 26,236 | 5,023 | 26,113 | 1,547 | 17,999 | ||||||||||||||||||
| Middle East |
— | 22,891 | — | 63,681 | — | 112,374 | ||||||||||||||||||
| Other |
— | 18,795 | — | 5,316 | — | 33,059 | ||||||||||||||||||
| Total |
$ | 142,683 | $ | 142,683 | $ | 193,150 | $ | 193,150 | $ | 311,603 | $ | 311,603 | ||||||||||||
Our Services revenues, virtually all of which are derived in the United States, were $377.5 million for 2010, $347.5 million for 2009 and $245.2 million for 2008.
Backlog
Our backlog consists of firm orders or blanket authorizations from our customers. Backlog may vary significantly reporting period to reporting period due to the timing of customer commitments. The time between receipt of an order and actual completion and delivery of our products varies from a few weeks, in the case of inventoried precision parts, to a year or more, in the case of custom-designed filter houses and other major plant components. We add a booking to our backlog for products when we receive an order accompanied by a written commitment from a customer. The maintenance services we provide through Williams are typically carried out under
9
Table of Contents
long-term contracts spanning several years. Upon signing a multi-year contract with a customer for services, we add to our backlog only the first twelve months of work that we expect to perform under the contract. Additional work that is not called for under the original contract is added to our backlog when we reach agreement with the customer as to the scope and pricing of that additional work. Capital project awards are typically defined in terms of scope and pricing at the time of contractual commitment from the customer. Upon receipt of a customer confirmation, capital project bookings are added to our backlog at the full contract value regardless of the time frame anticipated to complete the project.
The following table shows our backlog amounts, by segment, as of the end of each of the last three years (in thousands):
| Backlog as of December 31, | ||||||||||||
| 2010 | 2009 | 2008 | ||||||||||
| Products |
$ | 119,420 | $ | 120,760 | $ | 168,904 | ||||||
| Services |
229,913 | 194,162 | 163,906 | |||||||||
| Total |
$ | 349,333 | $ | 314,922 | $ | 332,810 | ||||||
Approximately 24% of the December 31, 2010 backlog is comprised of orders from the major customers shown in the table included above under “Customers and Marketing.” Based on production and delivery schedules, we anticipate that of our December 31, 2010 backlog, approximately 96% of the Products backlog and 87% of the Services backlog will be recognized as revenues during 2011.
Backlog is not a measure defined by generally accepted accounting principles, and our methodology for determining backlog may vary from the methodology used by other companies in determining their backlog amounts. Backlog may not be indicative of future operating results and projects in our backlog may be cancelled, modified or otherwise altered by our customers.
Engineering, Design and Maintenance Capabilities
Products. We believe the design and engineering expertise of our Products Division makes us an industry leader in the field of power generation equipment. We provide original design, retrofit and upgrade engineering and after-sales maintenance and repair of our products. Our products are custom-designed and engineered to meet the specifications of our customers. Our extensive engineering experience and proprietary designs from completed projects enhance our ability to efficiently satisfy our customers’ needs on projects that require significant engineering. As of December 31, 2010, we employed 64 degreed engineers specializing in thermal, structural, electrical/controls, mechanical, acoustical, industrial and chemical engineering and other technical areas. Our engineers and designers use a PC-based network and engineering and drafting programs such as AutoCAD™, ANSYS™, STAAD™, Solidworks™ and several internally developed proprietary programs.
Services. We provide extensive training, certifications and ongoing safety monitoring to all of our maintenance employees. For over ten years, we have maintained a safety record above the industry average, benefitting both us and our customers. We maintain a broad range of professional certifications relevant to the performance of many of the specialized services we provide. We maintain memberships and selected certifications with organizations such as the National Association of Corrosion Engineers, the Society of Protective Coatings, the American Nuclear Society, the American Society of Mechanical Engineers, the National Board of Boiler & Pressure Vessel Inspectors, the American National Standard Institutes, the American Society for Nondestructive Testing, the American Welding Society, Institute of Nuclear Power Operations and other organizations. We are one of a limited number of companies qualified to work anywhere in a United States nuclear facility and have been one of the leading providers of coatings at United States nuclear facilities for more than 35 years.
Manufacturing, Outsourcing and Contract Labor
Products. We fabricate our products using a combination of in-house manufacturing and third-party subcontractors. Most of our subcontracting work is performed outside the United States. Our network of outsourcing relationships provides us the following benefits:
| • | the flexibility to rapidly expand or contract our manufacturing capacity, with minimal impact on our capital expenditure requirements and fixed expenses; |
| • | the ability to manufacture in low-cost countries, thereby reducing the overall cost of our products; and |
| • | the ability to satisfy local content requirements. |
Subcontractors account for a significant percentage of our manufacturing costs. We provide on-site technical advisors at our subcontracted facilities to ensure high levels of quality and workmanship. While we generally have proven long-term relationships with our subcontractors, we also routinely search for additional fabricators to enhance our ability to manufacture equipment at the lowest cost while maintaining high-quality standards and on-time delivery.
Services. We provide maintenance services throughout the United States with experienced, temporary craft labor and leased equipment, directed and supervised by an experienced team of project managers across our network. Our flexible staffing and equipment model enables us to meet seasonal and outage demand without being restricted by internal capacity limitations, thus minimizing our fixed cost requirements.
10
Table of Contents
Materials and Suppliers
The principal materials for our products are carbon steel plate, stainless steel products and other structural shapes, insulation and finned tubing. We obtain these products from a number of domestic and foreign suppliers. The markets for most of the materials we use are served by a large number of suppliers and we believe that we can obtain each of the materials we require from more than one supplier.
Competition
Products. We compete with a large number of U.S. and international companies along all of our major product lines. We compete based on the price, quality, reliability and reputation of our products and our ability to engineer and design products to meet each customer’s unique specifications. Our competitors, some of which are significantly larger than we are and have significantly greater financial resources than we do, vary with respect to each product category we offer. We believe that no single competitor offers our breadth of products to the gas turbine power generation, process and cogeneration industries.
Services. The barriers to entry in industrial services are both financially and logistically low with the result that the industry is highly fragmented with no single company being dominant. Our competitors vary depending on plant geography and scope of services to be rendered. Several national vendors, which are significantly larger than we are and have significantly greater financial resources than we do, will often compete for larger maintenance and specialty opportunities that become available. Additional smaller vendors that operate on a regional basis will often compete for smaller opportunities associated with open shop labor sources. The key competitive factors in industrial services are reputation, safety record, price, service, quality, breadth of service capabilities and the ability to identify and retain qualified personnel. We believe our project management capabilities, service diversity, long-term customer relationships and safety standards differentiate us from our competitors. We also believe that the fact that we maintain a constant presence at many of our customers’ sites is a key competitive advantage because it provides us with an intimate understanding of these facilities and thereby allows us to better identify our customers’ service needs.
Employees
We had 687 full and part time employees as of December 31, 2010. Of these, 107 were employed at our facility in Mexico under a collective bargaining agreement. We regularly hire unionized craft labor on a temporary basis in the operation of our Services Division, often deploying hundreds of employees simultaneously at a single site for intensive outage work. We believe that our relationships with our employees, both permanent and temporary, are satisfactory.
Intellectual Property
We use a variety of patents, trademarks and proprietary technologies in the ordinary course of business in both our Products and Services Divisions. We rely upon patents, nondisclosure and confidentiality agreements with our employees, subcontractors, customers and others, and on various other security measures to protect our proprietary rights. Our patents related to heat exchangers generally expire in 2011; our patents related to exhaust systems generally expire in 2016; and a patent relating to a filter element clipper expires in 2027. We do not believe that any single patent or proprietary technology is material to our business and we do not believe our competitive position would be materially affected by competitors also using similar technologies and systems.
Compliance with Government Regulations
We are subject to certain federal, state and local environmental, occupational health, nuclear regulatory, export and product safety laws applicable in the countries in which we operate. We also purchase materials and equipment from third-parties, and engage subcontractors, who are also subject to these laws and regulations.
Environmental. We are subject to extensive and changing environmental laws and regulations in the United States and in foreign jurisdictions where we do business. These laws and regulations relate primarily to air and water pollutants and the management and disposal of hazardous materials. We are exposed to potential liability for personal injury or property damage caused by any release, spill, exposure or other accident involving such pollutants, substances or hazardous materials.
Health and Safety Regulations. We are subject to the requirements of the United States Occupational Safety and Health Act (OSHA) and comparable state and foreign laws. Regulations promulgated by these agencies require employers and independent contractors who perform construction services, including electrical and repair and maintenance, to implement work practices, medical surveillance systems and personnel protection programs in order to protect employees from workplace hazards and exposure to hazardous chemicals and materials. In recognition of the potential for accidents within various scopes of work, these agencies have enacted very strict and comprehensive safety regulations.
Nuclear Regulatory Commission. Owners of nuclear power plants are licensed to build, operate, and maintain those plants by the NRC. Their license requires that they qualify their suppliers and contractors to ensure that the suppliers and contractors comply with NRC regulations. Our Services Division must demonstrate to its customers that we will comply with NRC regulations related to quality assurance, reporting of safety issues, security and control of personnel access and conduct.
Export Laws. To the extent we export technical services, data and products outside of the United States, we are subject to U.S. and international laws and regulations governing international trade and exports including but not limited to the Export Administration Regulations and trade sanctions against embargoed countries, which are administered by the Office of Foreign Assets Control within
11
Table of Contents
the U.S. Department of the Treasury. A failure to comply with these laws and regulations could result in civil or criminal sanctions, including the imposition of fines, the denial of export privileges and suspension or debarment from participation in U.S. government contracts.
While we believe that we operate safely and prudently and in material compliance with all environmental, occupational health, nuclear regulatory, export and product safety laws, there can be no assurance that accidents will not occur or that we will not incur substantial liability in connection with the operation of our business. However, we believe that all our operations are in material compliance with those laws and we do not anticipate any material capital expenditures or material adverse effect on earnings or cash flows as a result of complying with those laws.
Available Information
We file reports with the SEC, including our annual reports on Form 10-K, quarterly reports on Form 10-Q, current reports on Form 8-K, and amendments to those reports filed or furnished to the SEC pursuant to the requirements of the Securities Exchange Act of 1934. The general public may read and copy any materials that we file with the SEC at the SEC’s Public Reference Room located at 100 F Street N.E., Washington, DC 20549. The public may also obtain information on the operation of the Public Reference Room by calling the SEC at 1-800-SEC-0330. The SEC maintains an Internet site, www.sec.gov, which contains reports, proxy and information statements, and other information regarding issuers that file electronically with the SEC.
You may also obtain copies of our annual reports at our website at www.globalpower.com under the heading “Investor Information”. The information disclosed on our website is not incorporated by this reference and is not a part of this Form 10-K. We will make available on our website, free of charge, all of our future periodic filings with the Securities and Exchange Commission (the “SEC”), including our Annual Reports on Form 10-K, Quarterly Reports on Form 10-Q, Current Reports on Form 8-K and any amendments to these reports, as soon as reasonably practicable after we electronically file with or furnish the reports to the SEC.
Bankruptcy Reorganization
Global Power Equipment Group Inc. and all of its U.S. subsidiaries filed voluntary petitions for relief under Chapter 11 of the U. S. Bankruptcy Code in the United States Bankruptcy Court for the District of Delaware on September 28, 2006. The bankruptcy stemmed principally from losses attributable to our large-scale HRSG product line within our Deltak L.L.C. (“Deltak”) subsidiary and associated financial reporting deficiencies. During the pendency of our bankruptcy case, we discontinued this product line, terminating personnel and divesting a foreign subsidiary that had been dedicated to that product line. We continue to serve the mid-sized HRSG segment with products that complement power generation turbines up to 85 megawatt capacity.
We successfully emerged from bankruptcy pursuant to an approved Plan of Reorganization on January 22, 2008. That plan provided for payment in full of allowed claims of all creditors other than unsecured creditors of Deltak. Those unsecured creditors are expected to share in recoveries through a $34 million fund established to satisfy allowed unsecured claims against Deltak. Upon our emergence from bankruptcy, our pre-petition equity holders received one share of our new common stock for each share of common stock held before the bankruptcy and a right to purchase additional shares of our new common stock on a pro-rata basis pursuant to a rights offering that commenced on November 6, 2007 and expired on December 13, 2007. Upon emergence from bankruptcy on January 22, 2008, we issued 5,266,885 shares of our new common stock to pre-petition equity holders in exchange for stock held before the bankruptcy. On that same date, pursuant to the rights offering, a related backstop private placement, and our Management Incentive Co-Investment Plan, we issued an additional 9,589,138 shares of our new common stock in exchange for $72.5 million in new capital. The applicable price of our common stock in the rights offering was $7.65 per share. As part of the plan, we also entered into a $150 million exit financing package comprised of a $90 million term loan and a $60 million revolver facility. (All of the share and per share numbers in this Form 10-K reflect the effect of the 1-for-9 reverse stock split of all of our outstanding shares of common stock that was effective June 30, 2010.)
Executive Officers of the Registrant
The following sets forth information regarding our current executive officers. Executive officers are appointed by, and hold office at the discretion of, our Board of Directors, subject to the terms of any employment agreements.
| Name | Position | |
| David L. Keller | President, Chief Executive Officer and Director | |
| David L. Willis | Senior Vice President and Chief Financial Officer | |
| Tracy D. Pagliara | General Counsel, Secretary, and Vice President of Business Development | |
| Dean J. Glover | Senior Vice President, President of Products Division | |
| Kenneth W. Robuck | Senior Vice President, President of Services Division | |
| Gene F. Schockemoehl | Senior Vice President and President of Braden Manufacturing, LLC | |
David L. Keller, 56, has served as our President and Chief Executive Officer and as a Director since September 2009. Mr. Keller served as the President and Chief Operating Officer of B&W, a wholly owned subsidiary of McDermott International, Inc., from March 2001 until his retirement in June 2007. B&W, a company with approximately $2 billion in revenues in 2006, supplies fossil-fuel
12
Table of Contents
fired boilers, commercial nuclear steam generators, environmental equipment and components, and boiler auxiliary equipment and provides related services, including construction services. Mr. Keller’s prior position was President of Diamond Power International, Inc., a wholly owned subsidiary of B&W, from March 1998 to February 2001. During his tenure with B&W, Mr. Keller served as a Board Chairman or Director of subsidiaries and joint ventures in the Peoples Republic of China, Denmark, the United Kingdom, Australia and South Africa.
He holds a Bachelor of Science degree in Mathematics from the University of Akron.
David L. Willis, 39, has been our Senior Vice President and Chief Financial Officer since January 2008. Mr. Willis has a broad range of leadership experience across a range of industries: restructuring advisory services, telecommunications, energy companies and public accounting. From October 2001 to January 2008, he was with the restructuring practice of Alvarez & Marsal LLC, a global professional services firm, where he served clients in advisory and interim management capacities, most recently as Senior Director, overseeing the development and implementation of initiatives to improve operational and financial performance.
Prior to Alvarez & Marsal, Mr. Willis held positions with The Williams Communications Group and Ernst & Young. Mr. Willis received his Bachelor of Business Administration degree from the Price College of Business at the University of Oklahoma and holds an M.B.A. from the University of Tulsa. He is a Certified Public Accountant and has a Certified Insolvency and Restructuring Advisor certification (inactive).
Tracy D. Pagliara, 48, has served as our General Counsel, Secretary, and Vice President of Business Development since April 2010. Prior to joining our company, Mr. Pagliara served as the Chief Legal Officer of Gardner Denver, Inc., a leading global manufacturer of highly engineered compressors, blowers, pumps and other fluid transfer equipment, from August 2000 through August 2008. He also had responsibility for other roles during his tenure with Gardner Denver, including Vice President of Administration, Chief Compliance Officer, and Corporate Secretary.
Prior to joining Gardner Denver, Mr. Pagliara held positions of increasing responsibility in the legal departments of Verizon Communications/GTE Corporation from August 1996 to August 2000 and Kellwood Company from May 1993 to August 1996, ultimately serving in the role of Assistant General Counsel for each company. Mr. Pagliara has a B.S. in Accounting and a J.D. from the University of Illinois. He is a member of the Missouri and Illinois State Bars and a Certified Public Accountant.
Dean J. Glover, 44, is Senior Vice President and President of the Products Division of Global Power Equipment Group Inc. Mr. Glover joined Braden Manufacturing in December 2005 as Chief Operating Officer and was promoted to his positions at Global Power and Deltak in September 2008. Mr. Glover has extensive international experience having lived in various international locations for most of his career. Mr. Glover has over 18 years of commercial and technical experience in the power industry. Prior to joining Global Power, Mr. Glover led the global supply chain, including manufacturing for Diebold Inc. Prior to this, Mr. Glover spent 13 years with General Electric in various managerial and technical roles and is a certified Six Sigma Master Blackbelt. Mr. Glover holds a Bachelors Degree in Mechanical Engineering from the University of Nebraska and an M.B.A. from the Kellogg Graduate School of Management, Northwestern University.
Kenneth W. Robuck, 51, is Senior Vice President and President of the Services Division of Global Power Equipment Group Inc. Mr. Robuck originally joined the Williams Group in 1995; he left the company for a brief period and returned in 2005 to run Williams Plant Services, LLC, the largest of the Williams’ subsidiaries, which is responsible for all major maintenance and construction services work. In early 2006, Mr. Robuck assumed the additional responsibility of Chief Operating Officer and was appointed President of the Williams Group in October 2007. Mr. Robuck has over 27 years experience in the nuclear power, fossil-fuel power, petrochemical and related industrial industries. Mr. Robuck is a graduate of Auburn University with a B.S. in Civil Engineering.
Gene F. Schockemoehl, 61, is Senior Vice President of Global Power Equipment Group Inc., and President of our subsidiary Braden Manufacturing, LLC. Mr. Schockemoehl has served as President of Braden since January 1994 and as Vice President of Global Power since June 1998. He was named President of Consolidated Fabricators Inc. in October 2003.
Mr. Schockemoehl began his employment at Braden in September 1968, progressing through the plant production area into management positions, and became Vice President of Operations in 1990. He served as Vice President of Sales from 1991 until his appointment as President in January 1994. Mr. Schockemoehl has a manufacturing and general business education background, having attended both Tulsa Community College and Rogers State College.
Our business, financial condition and results of operations may be impacted by one or more of the following factors, any of which could cause actual results to vary materially from historical and current results or anticipated future results.
Risk Factors Related to Our Operations
If the United States were to change its support of nuclear power, it could have a material adverse effect on our operations.
The U.S. government has been supportive of increased investment in nuclear power. However, if the federal government changed its policy or if public acceptance of nuclear technology declines, demand for nuclear power could be negatively affected and potentially increase the regulation of the nuclear power industry. It is unclear whether recent events in Japan regarding certain nuclear power plants will influence U.S. policy or public acceptance of commercial nuclear technology. Reduced demand for nuclear power or increased regulation would adversely affect our clients, which in turn could have a material adverse effect on our revenues.
13
Table of Contents
If our costs exceed the estimates we use to set the fixed-prices of our contracts, our earnings will be reduced.
Nearly all of our power generation equipment sales contracts are entered into on a fixed-price basis. As a result, our Products Division has a limited ability to recover any cost overruns. Contract prices are established based in part on our projected costs, which are subject to a number of assumptions. The costs that we incur in connection with each contract can vary, sometimes substantially, from our original projections. Because of the large scale and long duration of our contracts, unanticipated changes may occur, such as customer budget decisions, design changes, delays in receiving permits and cost increases, as well as delays in delivery of our products. We often are contractually subject to liquidated damages for late delivery. Unanticipated cost increases or delays may occur as a result of several factors, including:
| • | increases in the cost of commodities (primarily steel plate), labor or freight; |
| • | unanticipated technical problems (for example, difficulties in designing products that integrate well with new generations of gas turbines); |
| • | suppliers’ or subcontractors’ failure to perform (for example, substandard welding by a subcontractor), requiring modified execution plans or re-work. |
Cost increases or overruns that we cannot pass on to our customers or our payment of liquidated damages under our contracts will lower our earnings. Increases in commodity prices may adversely affect our gross margins.
If we are unable to control the quality or timely production of products manufactured or services provided by our subcontractors, our reputation could be adversely affected and we could lose customers. If we are unable to recover any advance progress payments made to subcontractors, our profitability would be adversely affected.
We rely on subcontractors to manufacture and assemble a substantial portion of our products as well as provide some specialty services. Subcontractors account for a significant percentage of our manufacturing costs. The quality and timing of production by our subcontractors is not totally under our control. Our subcontractors may not always meet the level of quality control and the delivery schedules required by our customers. The failure of our subcontractors to produce quality products in a timely manner could adversely affect our reputation and result in the cancellation of orders for our products, significant warranty and repair costs and the loss of customers. Alternatively, we could be required to move subcontract manufacturing to other locations, resulting in increased costs.
In addition, we make advance progress payments to subcontractors in anticipation of their completion of our orders. We may be unable to recover those advances if a subcontractor fails to complete an order, which may adversely affect our profitability.
Competition could result in decreased sales or decreased prices for our products and services.
We face, and will continue to face, significant competition for the sale of our products and services. Competition could result in a reduction in the demand for, or the prices that we can charge for, our products and services. Our success is dependent in large part on our ability to:
| • | anticipate or respond quickly to our customers’ needs and enhance and upgrade our existing products and services to meet those needs; |
| • | continue to price our products and services competitively and find low-cost subcontractors that can produce quality products; and |
| • | develop new products and services that are accepted by our customers and differentiated from our competitors’ offerings. |
Our competitors may:
| • | develop more desirable, efficient, environmentally friendly or less expensive products; |
| • | be willing to accept lower prices to protect strategic market positions or increase market share; |
| • | be better able to take advantage of acquisition opportunities; or |
| • | adapt more quickly to changes in customer requirements. |
During times of economic decline, when demand for our products decreases, our competitors may be willing to accept lower prices in order to absorb their fixed costs. As a result, we may need to lower our prices and/or devote significant resources to marketing our products in order to remain competitive. Lower prices and/or higher costs would reduce our revenues and our profitability.
Our future revenues and operating results may vary significantly from reporting period to reporting period.
Our quarterly and annual revenues and earnings have varied in the past and are likely to vary in the future. Our power generation equipment sales contracts stipulate customer-specific delivery terms that, coupled with other factors beyond our control, may result in uneven recognition of revenues and earnings over time. Customer-imposed delays can significantly impact the timing of revenue recognition. Due to our relatively large average contract size, our power generation equipment sales volume during any given period may be concentrated in relatively few orders, intensifying the magnitude of these fluctuations. Furthermore, some of our operating
14
Table of Contents
costs are fixed. As a result, we may have limited ability to reduce our operating costs in response to unanticipated decreases in our revenues or the demand for our products in any given reporting period. Therefore, our operating results in any reporting period may not be indicative of our future performance. Because we must make significant estimates related to potential costs when we recognize revenue on a percentage-of-completion basis, these costs may change significantly from reporting period to reporting period based on new project information. For example, if labor efficiency experienced on a project is lower than we estimated at the outset of the project, the costs incurred on the project will increase and the percentage of completion may be reduced from earlier estimates. In addition, most of our power generation equipment revenues are based on fixed-price contracts, and the relative profitability can vary significantly between contracts. As a result, our profitability can vary from reporting period to reporting period based on the specific contracts being recognized.
We may not be able to maintain or expand our business outside the United States because of numerous factors outside our control.
Our international operations are subject to a number of risks inherent in doing business outside the United States including:
| • | labor unrest; |
| • | regional economic uncertainty; |
| • | political instability; |
| • | restrictions on the transfer of funds into or out of a country; |
| • | currency exchange rate fluctuations; |
| • | export duties and quotas; |
| • | expropriations; |
| • | domestic and foreign customs and tariffs; |
| • | current and changing regulatory environments; |
| • | potentially adverse tax consequences; |
| • | availability of financing; |
| • | unfavorable commercial terms and conditions; and |
| • | potential for adverse dispute resolution outcomes. |
These factors may result in a decline in revenues or profitability and could adversely affect our ability to maintain or expand our business outside the United States.
We conduct our manufacturing and distribution operations on a worldwide basis and are subject to risks associated with doing business outside the United States.
We have manufacturing and distribution facilities and subcontractors in many countries outside of the United States including China, Poland, Romania and Mexico, and increasing our manufacturing footprint in low cost countries is an important element of our strategy. There are a number of risks associated with doing business internationally, including (a) exposure to local economic and political conditions, (b) social unrest such as risks of terrorism or other hostilities, (c) currency exchange rate fluctuations and currency controls, (d) export and import restrictions, and (e) the potential for shortages of trained labor. In particular, there has been social unrest in Mexico and any increased violence in or around our manufacturing facilities in Mexico could impact our business by disrupting our supply chain, and the delivery of products to customers. In addition, the increased violence in or around our manufacturing facilities in Mexico could present several risks to our employees who may be directly affected by the violence and may result in a decision by them to relocate from the area, or make it difficult for us to recruit or retain talented employees at our Mexican facilities. The likelihood of such occurrences and their potential effect on us is unpredictable and vary from country to country. Any such occurrences could be harmful to our business and our financial results.
A substantial portion of our revenues is from sales of equipment for gas turbine power plants. During periods of declining construction of new gas turbine power plants, the market for our products is significantly diminished.
The demand for our products depends on the continued construction of gas turbine power generation plants. The power generation equipment industry has experienced cyclical periods of slow growth or decline. In periods of decreased demand for new gas turbine power plants, our customers may be more likely to decrease expenditures on the types of products and systems that we supply and, as a result, our future revenues may decrease. These projects typically require funding from a healthy credit market as well. As long as credit markets are tight, funding could be difficult to obtain therefore delaying or even cancelling these types of projects entirely. A rise in the price or a shortage in the supply of natural gas could affect the profitability or operations of gas turbine power plants, which could adversely affect our future revenues. These and other factors may temper demand for our products. If in a particular geographic area prices of natural gas are so high or the supply of natural gas is so limited as to make the construction of new gas turbine power plants uneconomical in that geographic area, we may not derive any future revenues from projects in that geographic region unless and until those factors are reversed.
15
Table of Contents
Environmental laws and regulations have played a part in the increased use of gas turbine technology in various jurisdictions. These laws and regulations may change or other jurisdictions may not adopt similar laws and regulations. Changes in existing laws and regulations could result in a reduction in the building and refurbishment of gas turbine power plants. In addition, stricter environmental regulation could result in our customers seeking new ways of generating electricity that do not require the use of our products. Furthermore, although gas turbine power plants have lower carbon dioxide emissions per unit of electricity provided than coal-fired power plants, emissions from gas turbine power plants remain a concern and attempts to reduce or regulate emissions could increase the cost of gas turbine power plants and result in our customers switching to alternative sources of power.
Other current power technologies, improvements to these technologies and new alternative power technologies that compete or may compete in the future with gas turbine power plants could affect our sales and profitability. Any change in the power generation industry that results in a decline in the construction of new combined cycle power plants or a decline in the upgrading of existing simple cycle power plants to combined cycle power plants could materially adversely affect our sales.
A small number of major customers account for a significant portion of our revenues, and the loss of any of these customers could negatively impact our business.
We depend on a relatively small number of customers for a significant portion of our revenues. In 2010, two customers accounted for approximately 47% of our consolidated revenues and approximately 24% of our backlog at the end of the year. In 2009, two customers accounted for approximately 23% of our consolidated revenues and approximately 23% of our backlog at the end of the year. Other than their obligations under firm orders placed in our backlog, none of our customers have a long-term contractual obligation to purchase any material amounts of products or services from us. All of our firm orders contain cancellation provisions, which permit us to recover only our costs and a portion of our anticipated profit if a customer cancels its order. If a customer elects to cancel, we would not realize the full amount of future revenues included in our backlog. We expect to continue to depend upon a relatively small number of customers for a significant percentage of our revenues. Because our major customers represent a large part of our business, the loss of any of our major customers could negatively impact our business and results of operations. Several of our customers have the ability to internally source some of the products we manufacture. Any increase in this activity could reduce our sales.
The dollar amount of our backlog, as stated at any time, is not necessarily indicative of our future revenues.
When we receive a firm order for a project from a customer, it is added to our backlog. However, customers may cancel or delay projects for reasons beyond our control and we may be unable to replace any canceled orders with new orders. To the extent projects are delayed, the timing of our revenues could be affected. If a customer cancels an order, we may be reimbursed for the costs we have incurred. Typically, however, we have no contractual right to the full amount of the revenues reflected in our backlog contracts in the event of cancellation. In addition, projects may remain in our backlog for extended periods of time. Revenue recognition occurs over extended periods of time and is subject to unanticipated delays. Fluctuations in our reported backlog levels also result from the fact that we may receive a small number of relatively large orders in any given reporting period that may be included in our backlog. Because of these large orders, our backlog in that reporting period may reach levels that may not be sustained in subsequent reporting periods. Our backlog, therefore, is not necessarily indicative of our future revenues or of long-term industry trends.
The success of our business is partially dependent upon maintaining our safety record.
Our ability to obtain new business and retain our current business, particularly in our Services Division, is partially dependent on our continuing ability to maintain a safety record that exceeds the industry average. If we fail to maintain superior safety performance, or if serious accidents occur in spite of our safety procedures, our revenues and results of operations, particularly in our Services Division, could be materially and adversely affected.
We have been named as a defendant in asbestos personal injury lawsuits.
The Company has been named as a defendant in a limited number of asbestos personal injury lawsuits. Neither the Company nor its predecessors ever mined, manufactured, produced or distributed asbestos fiber, the material that allegedly caused the injury underlying these actions. The bankruptcy court’s discharge order issued upon emergence from bankruptcy extinguished the claims made by all plaintiffs who had filed asbestos claims against the Company before that time. The Company believes the bankruptcy court’s discharge order should serve as a bar against any later claim filed against it, including any of its subsidiaries, based on alleged injury from asbestos at any time before emergence from bankruptcy. In any event in all of the asbestos cases finalized post-bankruptcy the Company has been successful in having such claims dismissed without liability. Findings of liability on our part in any of these cases that were filed against us after we emerged from bankruptcy that remain unresolved could have an adverse effect on our financial position, results of operations or liquidity.
Efforts to increase our size through acquisitions will involve risks and could result in a material adverse effect on our business.
We intend to actively pursue additional acquisition opportunities, some of which may be material to our business and financial performance. We may not be able to grow our business in the future through acquisitions for a number of reasons, including:
| • | acquisition financing not being available on acceptable terms or at all; |
| • | encountering difficulties identifying and executing acquisitions; |
16
Table of Contents
| • | increased competition for targets, which may increase acquisition costs; |
| • | consolidation in our industry reducing the number of acquisition targets; and |
| • | competition laws and regulations preventing us from making certain acquisitions. |
In addition, there are potential risks associated with growing our business through acquisitions, including the failure to successfully integrate and realize the expected benefits of an acquisition. For example, with any past or future acquisition, there is the possibility that:
| • | the business culture of the acquired business may not match well with our culture; |
| • | technological and product synergies, economies of scale and cost reductions may not occur as expected; |
| • | management may be distracted from overseeing existing operations by the need to integrate acquired businesses; |
| • | we may acquire or assume unexpected liabilities; |
| • | unforeseen difficulties may arise in integrating operations and systems; |
| • | we may fail to retain and assimilate employees of the acquired business; |
| • | we may experience problems in retaining customers; and |
| • | problems may arise in entering new markets in which we may have little or no experience. |
These risks could have a material adverse effect on our business, financial condition and results of operations.
Compliance with environmental laws and regulations is costly, and our ongoing operations may expose us to environmental liabilities.
Our operations are subject to laws and regulations governing the discharge of materials into the environment or otherwise relating to the protection of the environment or human health and safety. We are subject to various U.S. federal statutes and the regulations implementing them, as well as similar laws and regulations at the state and local levels and in other countries in which we operate.
If we fail to comply with environmental laws or regulations, we may be subject to significant liabilities for fines, penalties or damages, or lose or be denied significant operating permits. For example, if employees of our Services Division accidentally release hazardous substances while working at a customer’s facility, we may be subject to fines and costs of clean up as well as lawsuits by third parties. In addition, some environmental laws impose liability for the costs of investigating and remediating releases of hazardous substances without regard to fault and on a joint and several basis, so that in some circumstances we may be liable for costs attributable to hazardous substances released into the environment by others.
A defect in our products could result in unanticipated warranty costs or product liability not covered by our insurance, which could adversely affect our financial condition or results of operations.
We generally provide warranties for terms of three years or less on our products. These warranties require us to repair or replace faulty products. Warranty claims could result in significant unanticipated costs. The need to repair or replace products with design or manufacturing defects could also temporarily delay the sale of new products and adversely affect our reputation.
In addition, we may be subject to product liability claims involving claims of personal injury or property damage. The sale and servicing of complex, large scale equipment used in a variety of locations and climates, and integrating a variety of manufactured and purchased components entails an inherent risk of disputes and liabilities relating to the operation and performance of the equipment and the health and safety of the workers who operate and come into contact with the machinery. Because our products are used primarily in power plants, claims could arise in different contexts, including the following:
| • | fires, explosions and power surges that can result in significant property damage or personal injury; and |
| • | equipment failure that can result in personal injury or damage to other equipment in the power plant. |
For example, a failure of a filter house provided by us could result in significant damage to costly precision components of the gas turbine generator that takes in conditioned air from the filter house. This, in turn, could cause the owner of the gas turbine to seek to recover significant damages from us. The insurance policies we maintain to cover claims of this nature are subject to deductibles and recovery limitations as well as limitations on contingencies covered, and we may therefore suffer losses from these claims for which no insurance recovery is available.
Expiration of the Price-Anderson Act’s indemnification authority could have adverse consequences on our Services Division.
We provide services to the nuclear industry through our Services Division. The Price-Anderson Act promotes the nuclear industry by offering broad indemnification to commercial nuclear power plant operators and Department of Energy (“DOE”) for liabilities arising out of nuclear incidents at power plants licensed by the NRC and at DOE nuclear facilities. That indemnification protects not only the NRC licensee or DOE prime contractor, but also others like us who may be doing work under contract or subcontract for a licensed power plant or under a DOE prime contract. To date, there has been no occasion for a determination of whether the Price-Anderson Act’s indemnification provisions apply to all nuclear liabilities that might be incurred by a radioactive materials cleanup contractor. The recently enacted Energy Policy Act extended the Price-Anderson Act for an additional 20 years. A problem related to our provision of services at a nuclear facility could lead to a damage claim against us as to which we might not be entitled to indemnification. In addition, any well-publicized problem with those services, whether actual or perceived, could adversely affect our reputation and reduce demand for our services.
17
Table of Contents
Our revenues would be adversely affected if we are unable to protect the proprietary design software programs that we use in our business.
We have developed several proprietary software programs and data to help us design our products. Our ability to protect our proprietary rights to these programs and this data is important to our success. We protect these rights through the use of internal controls, confidentiality and non-disclosure agreements and other legal protections. The legal protections afforded to our proprietary rights and the precautions we have taken may not be adequate to prevent misappropriation of our proprietary rights. We generally enter into non-disclosure and confidentiality agreements with our employees and subcontractors with access to sensitive design software and technology. However, these contractual protections do not prevent independent third-parties from developing functionally equivalent or superior technologies, programs, products or professional services. Third parties may also infringe upon or misappropriate our proprietary rights and use them to develop competing products. In addition, the laws and enforcement mechanisms of some foreign countries do not protect proprietary rights to the same extent as do United States laws. Our inability to protect our proprietary rights and enforce intellectual property rights through infringement or other enforcement proceedings could have a material adverse effect on our business, financial condition and results of operations.
If we were required to commence legal actions to enforce our intellectual property or proprietary rights or to defend ourselves against claims that we are infringing on the intellectual property or proprietary rights of others, we could incur substantial losses and/or costs and divert management’s attention from operations.
A failure to attract and retain employees who fill key requirements of our business may make it difficult to sustain or expand operations.
We must attract and retain highly qualified, experienced mechanical, design, structural and software engineers, service technicians, marketing and sales personnel and other key personnel to expand our operations. If we are unable to attract and retain necessary personnel, we may not be able to sustain or expand our operations.
Our revenues may fall sharply in times of general economic contraction and will not necessarily rise in tandem with general economic expansion.
Orders for new electrical power generation capacity are placed by our customers with long lead times. Consequently, our bookings and revenues may rise or fall sharply as total industry orders tend to follow pronounced cycles of general expansion and contraction. During a contraction phase, limited investment in new projects, deferrals of planned projects and project cancelations may significantly reduce our potential recognition of revenues and profits. At the end of an expansion phase, the existence of excess capacity will negatively affect power prices which results in a reduction in new orders. In addition to being cyclical in nature, our domestic revenues do not correlate precisely with changes in actual or forecasted new capacity due to timing differences in revenue recognition.
Demand for our products and services is cyclical and vulnerable to economic slowdowns and reductions in private industry and government spending. If economic conditions deteriorate, our revenues, profits and our financial condition may be adversely affected.
The industries we serve historically have been, and will likely continue to be, cyclical in nature and vulnerable to general slowdowns in the domestic and international economies. Consequently, our results of operations have fluctuated and may continue to fluctuate depending on the demand for products and services from these industries.
Due to the recent economic slowdown, many of our clients may face budget shortfalls or may delay capital spending that may decrease the overall demand for our products and services. Our clients may find it more difficult to obtain project financing due to limitations on the availability of credit and other uncertainties in the global credit markets. In addition, our clients may demand better pricing terms and their ability to timely pay our invoices may still be affected by the recent economic slowdown. If private industry and government spending are reduced, then our revenues, net income and overall financial condition may be adversely affected.
Systems and information technology interruption could adversely impact our ability to operate.
We depend on our information technology systems for many aspects of our business. Our business may be adversely affected if our systems are disrupted or if we are unable to improve, upgrade, integrate or expand our systems to meet our changing needs. Any damage, delay or loss of critical data associated with our systems may delay or prevent certain operations and may materially adversely affect our financial condition, results of operations and cash flows.
The supply and cost of materials we use in manufacturing our products fluctuates and could increase our operating costs.
Steel is a significant portion of the raw materials used in our products. Local shortages of steel plate sometimes arise and it is possible that an adequate supply of steel will not continue to be available in all locations on terms acceptable to us. The materials we use in our products are subject to price fluctuations that we cannot control. Changes in the cost of raw materials can have a significant effect on our gross margins. Rapid increases in material prices are difficult to pass through to customers. If we are unable to pass on these higher costs, our results of operations and financial condition could decline.
18
Table of Contents
Our participation in multi-employer pension plans could adversely impact our future earnings.
In addition to our defined benefit savings plan, we also participate in several multi-employer pension plans throughout the United States. The Pension Protection Act of 2006 may require additional funding for multi-employer plans that could cause us to be subject to higher cash contributions in the future. Additionally, market conditions and the number of participating employers remaining in each plan may affect the funded status of multi-employer plans and consequently any company withdrawal liability, if applicable. We continue to monitor and assess any full and partial withdrawal liability implications associated with these plans.
Risk Factors Related to Our Liquidity and Capital Resources
Volatility and uncertainty of the credit markets may negatively impact us.
We intend to finance our existing operations and initiatives with existing cash and cash equivalents, investments, cash flows from operations and potential borrowings under our $150 million Credit Facility (“Credit Facility”). If adverse national and international economic conditions continue or deteriorate further, it is possible that we may not be able to fully draw upon our existing Credit Facility and we may not be able to obtain new financing on favorable terms. In addition, continued deterioration in the credit markets could adversely affect the ability of many of our customers to pay us on time and the ability of many of our suppliers to meet our needs on a competitive basis. If we cannot access necessary additional funds on acceptable terms, our business and operations may be negatively impacted.
Our inability to obtain adequate surety bonding or letters of credit could reduce our ability to bid on new work, which could have a material adverse effect on our future revenues and business prospects.
In line with industry practice, we are often required to provide performance and surety bonds to clients and may be required to provide letters of credit. These bonds and letters of credit provide credit support for the client if we fail to perform our obligations under the contract. If security is required for a particular project and we are unable to obtain a bond or letter of credit on terms commercially acceptable to us, we may not be able to pursue that project. In addition, bonding may be more difficult to obtain in the future or may only be available at significant additional cost as a result of general conditions that affect the insurance and bonding markets. Surety bonds and letters of credit may cease to be available to us on commercially reasonable terms.
We are vulnerable to reductions in our liquidity because of the capital-intensive nature of our business.
Our operations could require us to utilize large sums of working capital, sometimes on short notice and sometimes without assurance of recovery of the expenditures. Circumstances or events that could create large cash outflows include a surge in orders for power generation equipment that require working capital for execution, losses resulting from fixed-price contracts, environmental liabilities, litigation risks, unexpected costs or losses resulting from acquisitions, contract initiation or completion delays, client payment problems and product liability claims. If we encounter significant working capital requirements as a result of these or other factors, we may not have sufficient liquidity or the credit capacity to meet all of our cash needs and this could have a material adverse effect on our operations.
The restrictions and covenants contained in our Credit Facility limit our ability to borrow additional money, sell assets and make acquisitions. Compliance with these restrictions and covenants may limit our ability to implement elements of our business strategy.
Our Credit Facility contains a number of significant restrictions and covenants that may pose a constraint to us by limiting our ability and that of our subsidiaries to:
| • | borrow money or make capital expenditures; |
| • | incur liens; |
| • | pay dividends or make other restricted payments; |
| • | merge or sell assets; |
| • | enter into transactions with affiliates; and |
| • | make acquisitions. |
In addition, our Credit Facility contains other restrictive covenants, including covenants that require us to maintain specified financial ratios, including leverage, fixed charges coverage and minimum liquidity. The facility includes mandatory repayment provisions that will require us to repay our indebtedness with proceeds from certain asset sales, certain debt issuances and certain insurance casualty events.
If we are unable to remain in compliance with our financial covenants currently in effect under our Credit Facility or obtain additional amendments or waivers from our lenders, we may be forced to reduce or delay capital expenditures and business acquisitions, sell assets, restructure or refinance our indebtedness, decline certain business opportunities from customers or seek additional capital.
19
Table of Contents
If we were required to write down our goodwill or long-lived assets, our results of operations and stockholders’ equity could be materially adversely affected.
We have approximately $80.4 million of goodwill recorded on our consolidated balance sheet as of December 31, 2010. Goodwill represents the excess of the aggregate purchase price over the fair value of the identifiable net assets acquired in a business combination. We are required to review goodwill for impairment at least annually in accordance with the provisions of Financial Accounting Standards Board (“FASB”) Accounting Standards Codification (“ASC”) 350, Intangibles—Goodwill and Other, using a two-step impairment test to identify potential goodwill impairment and measure the amount of a goodwill impairment loss. The first step of the test compares the fair value of a reporting unit with its carrying amount, including goodwill. If the carrying amount of a reporting unit exceeds its fair value, the second step of the goodwill impairment test is performed to measure the amount of the impairment loss, if any. Both steps of goodwill impairment testing involve significant estimates. Long-lived assets, such as property and equipment and intangible assets subject to amortization, are evaluated for impairment when events or changes in circumstances indicate that the carrying amount of the assets may not be recoverable through the estimated future cash flows from the use of these assets. If we were required to write down our goodwill or long-lived assets, our results of operations and financial position could be materially adversely affected.
We are exposed to market risks from changes in interest rates and foreign currency exchange rates.
We are subject to market risk exposure related to changes in interest rates and from fluctuations in foreign currency exchange rates. Portions of our operations are located in foreign jurisdictions and a portion of our billings is paid in foreign currencies. Changes in foreign currency exchange rates or weak economic conditions in foreign markets could therefore cause fluctuations in those revenues derived from foreign operations. For example, a decrease in the value against the U.S. dollar of the foreign currency we receive for a project as to which a significant portion of our costs are incurred in U.S. dollars would adversely affect our revenues, as expressed in U.S. dollars, and our net income from that project. In addition, sales of products and services are affected by the value of the U.S. dollar relative to other currencies. Changes in foreign currency rates can also affect the costs of our products purchased or manufactured outside the United States. Changes in interest rates or foreign currency exchange rates could materially adversely affect our results of operations and financial position.
Risk Factors Related to Our Common Stock
Our common stock, which is listed on the NASDAQ Stock Market, may from time to time experience significant price and volume fluctuations and our stockholders may not be able to resell their shares of common stock at or above the purchase price paid.
The market price of our common stock may change significantly in response to various factors and events beyond our control, including the following:
| • | the risk factors described in this Item 1A; |
| • | the significant concentration of ownership of our common stock in the hands of a small number of institutional investors; |
| • | a shortfall in operating revenue or net income from that expected by securities analysts and investors; |
| • | changes in securities analysts’ estimates of our financial performance or the financial performance of our competitors or companies in our industry; |
| • | general conditions in our customers’ industries; and |
| • | general conditions in the security markets. |
Some companies that have volatile market prices for their securities have been subject to security class action suits filed against them. If a suit were to be filed against us, regardless of the outcome, it could result in substantial costs and a diversion of our management’s attention and resources. This could have a material adverse effect on our business, results of operations and financial condition.
Future sales of our common stock may depress our stock price.
Sales of a substantial number of shares of our common stock in the public market or otherwise, either by us, a member of management or a major stockholder, or the perception that these sales could occur, could depress the market price of our common stock and impair our ability to raise capital through the sale of additional equity securities.
Because we do not expect to pay dividends for the foreseeable future, investors seeking cash dividends should not purchase shares of common stock.
We have never declared or paid any cash dividends on our common stock. We currently intend to retain future earnings, if any, to finance the expansion of our business. As a result, we do not anticipate paying any cash dividends in the foreseeable future. Our payment of any future dividends will be at the discretion of our board of directors after taking into account various factors, including but not limited to our financial condition, operating results, cash needs, growth plans and the terms of any credit agreements that we may be a party to at the time. Accordingly, investors must rely on sales of their shares after price appreciation, which may never occur, as the only way to realize any return on their investment. Investors seeking cash dividends should not purchase our shares.
20
Table of Contents
Item 1B. Unresolved Staff Comments.
None.
Our corporate office is currently located in Tulsa, Oklahoma. We have eight other U.S. facilities, as well as facilities in the Netherlands, Mexico and China. The following table sets forth information about our material facilities at December 31, 2010:
| Location |
Owned/Leased (Expiration Date) |
Principal Uses | ||
| Products Division | ||||
| Heat Recovery Equipment | ||||
| Plymouth, Minnesota | owned | Manufacturing and administrative office | ||
| Plymouth, Minnesota | leased (6/30/16) | Warehouse | ||
| Auxiliary Power Equipment | ||||
| Tulsa, Oklahoma | leased (8/31/12) | Manufacturing and administrative office | ||
| Auburn, Massachusetts | owned | Manufacturing and administrative office | ||
| Heerlen, The Netherlands | leased (7/31/13) | Administrative office | ||
| Monterrey, Mexico | owned | Manufacturing | ||
| Shanghai – Waigaoqiao Free Trade Zone, China | leased (2/28/11) | Warehouse | ||
| Shanghai – Xuhui District, China | leased (11/17/12) | Administrative office | ||
| Services Division | ||||
| Tucker, Georgia | leased (10/31/14) | Administrative office | ||
| Lakeland, Florida | leased (month-to-month) | Administrative office | ||
| Roxboro, North Carolina | leased (month-to-month) | Administrative office | ||
| East Elmhurst, New York | leased (10/31/12) | Administrative office | ||
We consider each of our facilities to be in good operating condition and sufficient for its current use. Each of our owned domestic real properties is encumbered by a lien under our Credit Facility.
We are involved from time to time in legal actions that arise in the ordinary course of our business. Although the outcomes of any such legal actions cannot be predicted, we do not believe that the resolution of any currently pending actions, either individually or in the aggregate, will have a material adverse effect on our financial position or results of operations.
Deltak Fund for Unsecured Claims in Bankruptcy.
On September 28, 2006, we and all of our U.S. subsidiaries, including Deltak, filed voluntary petitions for relief under Chapter 11 of the Bankruptcy Code in the United States Bankruptcy Court for the District of Delaware. Pursuant to an approved Plan of Reorganization, an administrator was appointed to administer a fund of approximately $34 million in cash that was intended to be distributed to the holders of allowed unsecured claims against Deltak. Under the Plan of Reorganization, the administrator has the right and duty to administer the fund and to “make, file and settle or otherwise resolve objections” to unsecured claims against Deltak.
Since January 22, 2008, the administrator has adjudicated and/or settled various unsecured claims and engaged in efforts to resolve the remaining disputed claims. As of February 28, 2011, approximately $2.8 million of cash remains in the fund subject to the control of the administrator.
Each of Mitsubishi Heavy Industries, Ltd. and Mitsubishi Power Systems Americas, Inc. initially filed a claim against Deltak in the amount of $38.3 million allegedly arising from a pre-bankruptcy contract with Deltak. After prosecution of the pending objection by the administrator, in late 2010, the administrator, the Mitsubishi entities, Deltak and Global Power entered into a settlement whereby the administrator made a cash payment of $1.1 million from the fund to the Mitsubishi entities in full satisfaction of their claims and the parties provided mutual releases.
Asbestos Cases.
The Company has been named as a defendant in a limited number of asbestos personal injury lawsuits. Neither the Company nor its predecessors ever mined, manufactured, produced or distributed asbestos fiber, the material that allegedly caused the injury underlying
21
Table of Contents
these actions. The bankruptcy court’s discharge order issued upon emergence from bankruptcy extinguished the claims made by all plaintiffs who had filed asbestos claims against the Company before that time. The Company also believes the bankruptcy court’s discharge order should serve as a bar against any later claim filed against it, including any of its subsidiaries, based on alleged injury from asbestos at any time before emergence from bankruptcy. In any event, all of the asbestos cases finalized post-bankruptcy, the Company has been successful in having dismissed without liability. The Company intends to vigorously defend all currently active actions, just as it defended the other actions that have since been dismissed, all without liability, and it does not anticipate that any of these actions will have a material adverse effect on its financial position, results of operations or liquidity. However, the outcomes of any legal action cannot be predicted and, therefore, there can be no assurance that this will be the case.
22
Table of Contents
Item 5. Market for Registrant’s Common Equity, Related Stockholder Matters and Issuer Purchases of Equity Securities.
Market Price of Our Common Stock
We implemented a 1-for-9 reverse stock split of all of our outstanding shares of common stock effective as of the close of business on June 30, 2010. All of the share and per share numbers in this Form 10-K reflect the retroactive effect of this reverse split for all periods presented.
We emerged from bankruptcy in January 2008, and no established market existed for our common stock. Our common stock issued upon our emergence from bankruptcy was quoted on the over-the-counter “Pink Sheets” under the symbol “GLPWD”. The following table sets forth the high and low sales prices per share of our common stock, as traded on the over-the-counter “Pink Sheets”, during each calendar quarter during 2009 and the first two quarters of 2010.
| 2009 Quarter Ended |
High | Low | ||||||
| March 31, 2009 |
$ | 7.20 | $ | 2.25 | ||||
| June 30, 2009 |
$ | 13.05 | $ | 3.60 | ||||
| September 30, 2009 |
$ | 11.79 | $ | 8.10 | ||||
| December 31, 2009 |
$ | 13.50 | $ | 9.18 | ||||
| 2010 Quarter Ended |
High | Low | ||||||
| March 31, 2010 |
$ | 17.10 | $ | 12.96 | ||||
| June 30, 2010 |
$ | 19.08 | $ | 13.50 | ||||
Our common stock began trading on the NASDAQ Stock Market (“NASDAQ”) under the trading symbol “GLPW” on August 5, 2010. The following table sets forth the high and low sale prices for our common stock as reported by NASDAQ for the periods indicated:
| 2010 Quarter Ended |
High | Low | ||||||
| September 30, 2010 |
$ | 16.75 | $ | 13.73 | ||||
| December 31, 2010 |
$ | 23.82 | $ | 14.64 | ||||
As of February 28, 2011, there were 112 holders of record of our common stock. We believe that the number of beneficial holders of our common stock is substantially greater than the number of holders of record.
Dividend Policy
We have not paid any cash dividends to date and currently have no intention of paying any cash dividends on our common stock in the foreseeable future. The declaration and payment of dividends is subject to the discretion of our Board of Directors. In addition, our Credit Facility currently prohibits us from paying cash dividends to our stockholders. The timing, amount and form of dividends, if any, will depend on our results of operations, financial condition and such other requirements as deemed relevant by our Board of Directors. You should not purchase our common stock with the expectation of receiving cash dividends.
Warrant Exercises
Through December 31, 2010, warrants to purchase an aggregate of 124,058 shares (out of the originally issued warrants to purchase 1,807,222 shares) had been exercised. All of the exercised warrants were exercised on a cashless basis with the result that, through December 31, 2010 we had, with respect to exercised warrants, withheld 71,974 shares and issued 52,084 shares of our common stock. The withheld shares are now held by us as treasury shares. Taking into account these exercises, 1,683,171 warrants remained outstanding as of December 31, 2010.
Item 6. Selected Financial Data.
Selected Financial Data
The following table provides selected consolidated financial data for the periods shown. The data for the last five years has been derived from our audited consolidated financial statements. Our results are not necessarily indicative of future performance or results of operations. All of the data in the table should be read in conjunction with “Management’s Discussion and Analysis of Financial Condition and Results of Operations,” in Item 7, and our consolidated financial statements and related notes included in this Annual Report on Form 10-K.
23
Table of Contents
| (In thousands, except per share data) | Years Ended December 31, | |||||||||||||||||||
| 2010 | 2009 | 2008 | 2007 | 2006 | ||||||||||||||||
| Statement of Operations | (Debtor-in-Possession) | |||||||||||||||||||
| Total revenues |
$ | 520,144 | $ | 540,610 | $ | 556,764 | $ | 403,418 | $ | 357,398 | ||||||||||
| Gross profit |
102,521 | 80,425 | 99,980 | 72,490 | 36,946 | |||||||||||||||
| Gross profit percentage |
20 | % | 15 | % | 18 | % | 18 | % | 10 | % | ||||||||||
| Selling and administrative expenses |
52,872 | 46,664 | 50,418 | 45,179 | 45,365 | |||||||||||||||
| Interest expense |
7,052 | 9,667 | 11,667 | 10,057 | 9,615 | |||||||||||||||
| Reorganization items |
(1,477 | ) | 1,030 | 23,574 | 33,102 | 26,287 | ||||||||||||||
| Income tax expense |
6,410 | 5,282 | 3,151 | 5,121 | 3,453 | |||||||||||||||
| Income (loss) from continuing operations |
37,664 | 17,782 | 11,170 | (20,969 | ) | (56,742 | ) | |||||||||||||
| Income from discontinued operations |
2,971 | 10,105 | 23,668 | 6,028 | — | |||||||||||||||
| Net income (loss) |
$ | 40,635 | $ | 27,887 | $ | 34,838 | $ | (14,941 | ) | $ | (56,147 | ) | ||||||||
| Earnings (Loss) Per Share from continuing operations: |
||||||||||||||||||||
| Basic |
$ | 2.47 | $ | 1.19 | $ | 0.78 | $ | (3.98 | ) | $ | (10.62 | ) | ||||||||
| Fully diluted |
$ | 2.31 | $ | 1.14 | $ | 0.77 | $ | (3.98 | ) | $ | (10.62 | ) | ||||||||
| Common shares outstanding: |
||||||||||||||||||||
| Weighted-average shares outstanding |
||||||||||||||||||||
| Basic |
15,254 | 14,972 | 1 | 14,267 | 5,262 | 5,267 | ||||||||||||||
| Diluted |
16,321 | 15,591 | 1 | 14,593 | 5,262 | 5,267 | ||||||||||||||
| Balance Sheet (3) |
||||||||||||||||||||
| Current assets |
$ | 158,439 | $ | 211,803 | $ | 184,800 | $ | 163,669 | $ | 138,596 | ||||||||||
| Total assets |
265,725 | 326,011 | 301,039 | 275,881 | 269,374 | |||||||||||||||
| Current liabilities |
64,555 | 145,601 | 115,132 | 143,985 | 98,135 | |||||||||||||||
| Liabilities subject to compromise |
207 | 541 | 604 | 122,435 | 126,452 | |||||||||||||||
| Long-term debt (including current portion) |
— | 65,325 | 85,000 | 20,000 | 20,000 | |||||||||||||||
| Stockholders’ equity (deficit) |
$ | 179,056 | $ | 136,478 | $ | 105,273 | 2 | $ | (205 | ) | $ | 13,946 | ||||||||
| (1) | Pursuant to our Bankruptcy Plan of Reorganization, all outstanding equity interests in the Company were canceled as of January 22, 2008. Each holder of an equity interest as of November 6, 2007 received a non-transferable, non-certificated right to purchase up to its pro rata share of the new common stock in a rights offering that commenced on November 6, 2007 and expired on December 13, 2007. As a result, on January 22, 2008, we issued 14,744,009 shares of new common stock (as adjusted for the 1-for-9 reverse stock split of our shares effective June 30, 2010). |
| (2) | Effective January 1, 2007, the Company adopted ASC 740, Income Taxes, resulting in a cumulative effect of a change in accounting principle of $1.3 million. |
| (3) | Certain 2009 amounts have been reclassified to conform to the 2010 presentation. |
Item 7. Management’s Discussion and Analysis of Financial Condition and Results of Operations.
The following discussion provides an analysis of the results for each of our business segments, an overview of our liquidity and capital resources and other items related to our business. It contains forward-looking statements about our future revenues, operating results and expectations. See “Cautionary Statement Regarding Forward-Looking Statements” and Part I, Item 1A – “Risk Factors” for a discussion of the risks, assumptions and uncertainties affecting these statements. This discussion and analysis should be read in conjunction with Part I of this Annual Report on Form 10-K as well as our consolidated financial statements and notes thereto included in this Annual Report on Form 10-K.
Overview
We are a comprehensive provider of power generation equipment and maintenance services for customers in the domestic and international energy, power infrastructure and service industries. We operate through two business segments, which we refer to as our Products Division and our Services Division.
24
Table of Contents
| • | Through our Products Division, we design, engineer and manufacture a comprehensive range of auxiliary power and heat recovery equipment primarily used to enhance the efficiency and facilitate the operation of gas turbine power plants as well as for other industrial, energy and power-related applications. |
| • | Through our Services Division, we provide on-site specialty, maintenance and outage management services for commercial nuclear reactors and specialty maintenance and other industrial services to fossil-fuel and hydroelectric power plants and other industrial operations in the United States. These services include a comprehensive range of industrial maintenance, modification, construction and specialty services. |
Material Industry Trends
Products Division. The worldwide financial crisis starting in late 2008 resulted in reduced funding for gas turbine projects in 2009 and 2010 with many projects either decreased in scope or delayed. Because our revenue from sales of auxiliary power equipment is highly dependent on the installation of new gas turbines, this has continued to have a significant impact on our revenues in 2010.
The demand for power in the United States stabilized in 2010 after two consecutive years of decline in 2008 and 2009. This two year decline, marked the first time in over 50 years that power consumption in the United States decreased for two consecutive years. With increasing power consumption and an increased focus on shale gas development in North America, we believe that demand for gas-fired power generation plants is likely to strengthen over time due to their relatively quick construction times, low capital costs and low carbon emissions as compared to other forms of fossil-fueled power plants. While renewable energy sources could reduce future gas-fired power additions, we believe gas-fired power generation is likely to continue to be the preferred choice for stand-by capacity to complement intermittent forms of renewable energy. We also believe that renewable energy sources still have a higher cost when compared to traditional forms of power generation. Economic recovery has typically been accompanied by a rise in commodity prices. In recent months we have seen substantial volatility in the commodity markets, which could have a significant impact on our costs.
Growth in international markets is expected to out-pace domestic growth. In regions where natural gas is plentiful, we expect that gas-fired power generation is likely to be the preferred choice for baseload power. Various international regions are making capital investments in natural gas pipelines and related infrastructure. These investments could contribute to more stabilized natural gas pricing which is generally favorable to the gas-fired power generation market as a whole. Our sales of heat recovery equipment are highly dependent on the oil and gas refining industry and mid-sized gas turbine installations for cogeneration and power generation. The worldwide financial crisis has resulted in decreased demand for refined petroleum products which, in turn, has reduced capital expenditures in the industry. Uncertainty surrounding climate change legislation has further delayed many projects.
In recent months, across all product lines, we have seen an increase in the number of requests for quotes and an increase in booking activity, which we believe signals a stabilizing market for the products we manufacture.
Services Division. Demand for third party plant maintenance services has been positively impacted by the aging infrastructure of nuclear power generation facilities in the United States and the increasing tendency of plant owners electing to outsource maintenance as a means of reducing fixed costs. Prospects for construction of new nuclear power plants in the United States are gaining momentum for the first time in more than thirty years although prospective projects may be delayed by macro-economic conditions including access to capital and fluctuating fuel costs projections. However, the maintenance services customer base is currently mature and, to date, the number of nuclear sites has remained unchanged. Consolidation in the industry and the trend of multi-plant customers consolidating their vendor base has also reduced the number of maintenance bid opportunities available to us and our competitors while making the impact of winning those bids more significant. Further, our customer base is increasing its reliance on full scope engineer, procure, and construct (“EPC”) firms to manage longer term capital projects. As more of these projects enter the construction phase, much of the nuclear management talent is likely to be absorbed and customers will likely seek to outsource to subcontractors to meet new build project demands. This should provide opportunities for us to capitalize on the depth and established capabilities of our Williams operations.
The demand for discretionary specialty services increased during 2010 as customers made capital investments for deferred maintenance and delayed plant upkeep. While we provide most of our specialty services as an addendum to our traditional maintenance work, we also service customers in other segments of the market including pulp and paper, conventional power and automotive. As a result of economic conditions in those segments, the growth opportunities for our specialty services are confined to niche service offerings, typically within our existing customer base.
Recent Developments
Products Division. Demand for our product lines has historically fluctuated with demand for power. We continued to see pricing pressure on our products for bids and project proposals submitted throughout 2010 due to the decrease in demand for our products and increased competition. Pricing pressure has impacted both the original equipment manufacturer and retrofit customers of our Products Division. Our use of a network of third-party fabricators to manufacture a large percentage of our auxiliary power equipment products allows us to avoid a high fixed cost infrastructure. The recent increase in proposal activity and subsequent improvements in backlog may indicate our markets are starting to stabilize. We took a balanced approach throughout 2010 between managing costs and increasing capacity in certain key areas in order to be prepared for the business cycle to return to more normalized levels:
| • | Over the course of 2010 we increased headcount in key areas in our Tulsa, Oklahoma, Auburn, Massachusetts and Monterey, Mexico operations in an effort to increase capacity in these operations; |
25
Table of Contents
| • | We made capital investments in production equipment to better position our operations for a stabilizing market; and |
| • | We continued to focus on reducing controllable expenses and made head-count reductions in our Minneapolis, Minnesota facility. |
There has been an improvement in proposal activity and a subsequent stabilization in backlog levels for both the gas turbine auxiliaries and the heat recovery product lines. We believe that more favorable pricing levels are likely to return as the demand for our products continues to improve to more normalized levels. We have retained the resources necessary and continue to make investments in order to participate and execute in a robust market recovery.
Services Division. Our level of plant maintenance and modification work performed during refueling outages at nuclear power plants has remained stable, with period-to-period fluctuations resulting from the timing of particular outages within our customer base. In addition to our traditional plant maintenance business, during 2010 we aligned with complementary service providers to provide EPC services for capital projects to a greater extent than we have historically. We see this as an area of continued future growth that would allow us to reach new customers and markets and would provide cyclical offsets to the timing of refueling outages in our traditional maintenance business. We also expanded our service offerings with other complementary offerings including providing valve maintenance and repair services and unique coating applications that enhance the value of the coatings to allow customers to obtain a longer coating life.
In both our segments, our operations are based on discrete projects subject to contract awards of varying scopes and values. Business volume fluctuates due to many factors, including the mix of work and project schedules, which are dependent on the level and timing of customer releases of new business. Significant fluctuations may occur from period to period in revenues, gross profits and operating results and are discussed below.
Critical Accounting Policies and Estimates
The preparation of our consolidated financial statements and related notes requires us to make judgments, estimates and assumptions that affect the reported amounts of assets, liabilities, revenues and expenses, and related disclosure of contingent assets and liabilities. We have based our estimates on historical experience and on various other assumptions that we believe to be reasonable under the circumstances, the results of which form the basis for making judgments about the carrying values of assets and liabilities that are not readily apparent from other sources. Actual results may differ materially from these estimates under different assumptions and conditions.
An accounting policy is considered to be critical if it requires an accounting estimate to be made based on assumptions about matters that are highly uncertain at the time the estimate is made, and if different estimates that reasonably could have been used, or changes in the accounting estimates that are reasonably likely to occur periodically, could materially impact the consolidated financial statements. We believe that the following critical accounting policies reflect the more significant estimates and assumptions used in the preparation of our consolidated financial statements. You should read the following descriptions of critical accounting policies, judgments and estimates in conjunction with our consolidated financial statements included under Page F-1 of this 10-K.
Revenue Recognition. We recognize revenues for auxiliary power equipment, except SCR, using the completed-contract method due to the short-term nature of the production period. Generally, these contracts specify separate phases of work that are frequently contracted separately. Under this method, we do not recognize any revenue until a contract phase is substantially complete, the customer takes risk of loss and title, and the installation is operating according to specifications or has been accepted by the customer. Changes in job performance, job conditions, estimated profitability and final contract settlements may result in revisions to job costs and income amounts causing final amounts to differ from those originally estimated.
We recognize revenues and costs of revenues for our heat recovery equipment product line on the percentage-of-completion method based on the percentage of actual labor hours incurred to date in relation to total estimated hours for each contract. We recognize revenues and costs of revenues for our SCR product line in the Products divison and applicable fixed-price contracts provided through our Services Division on the percentage-of-completion method based on the percentage of total costs incurred to date in relation to total estimated cost for each contract. We expense pre-contract costs as incurred. Costs related to change orders are recognized when they are incurred. Change orders are included in total estimated contract revenues when they can be reliably estimated and it is probable that the adjustment will be approved by the customer or realized.
The percentage-of-completion method is only allowed under certain circumstances in which the revenue process is long-term in nature (often in excess of one year), the products sold are highly customized and a process is in place whereby revenues, costs and margins can be reasonably estimated. Our use of the percentage-of-completion method generally results in the recognition of reasonably consistent profit margins over the life of the contracts on which we use this method because we are able to produce reasonably dependable estimates of contract billings and contract costs. We use the level of profit margin that is most likely to occur on each separate contract. If we cannot precisely determine the most likely profit margin, we use the lowest probable level of profit in the range of reasonable estimates until the results can be estimated more precisely. Our estimate of the total hours to be incurred at any particular time has a significant impact on the revenue we recognize in the relevant period. Changes in job performance, job conditions, estimated profitability, final contract settlements and resolutions of claims may result in revisions to costs and income. We
26
Table of Contents
recognize the effects of any such revisions in the period in which the revisions are determined. We recognize estimated losses on uncompleted contracts in the period in which the losses first become apparent. Under percentage-of-completion accounting, we must make key judgments in areas such as percent complete, estimates of project revenues, costs and margin, estimates of total and remaining project hours and liquidated damages assessments. Any deviations from these estimates could have a significant positive or negative impact on our results of operations.
We recognize revenues for routine services that are not provided pursuant to fixed-price contracts when services are performed and the customer assumes risk of loss, collection of the relevant receivable is probable, persuasive evidence of an arrangement exists and the sales price is fixed or determinable. Specifically, these routine service revenues are recognized as the services are performed based upon an agreed-upon price for the completed service or based upon the cost incurred and agreed upon hourly rates. On cost plus contracts, we recognize revenue as costs are incurred and we include in revenue the applicable mark up earned through the date the services are provided.
In the fourth quarter of 2006, operating with Bankruptcy Court approval, we initiated a wind down of Deltak’s large-scale HRSG product line and caused Deltak to enter into completion agreements with certain HRSG customers to complete executory contracts for delivery of HRSG units. Some of the HRSG contracts under completion agreements were in a positive cash position as of the Chapter 11 filing date because aggregate collections of billings exceeded aggregate project costs incurred. Our recognition of this excess is deferred until the earnings process is considered completed upon satisfaction of performance milestones set forth in the completion agreements. We recognize the excess of collections of billings over aggregate project costs for these contracts as Deltak meets the performance milestones as specified for avoiding the liquidated damage claims.
Long-Lived Assets. In accordance with ASC 360-10-35, Subsequent Measurement - Impairment or Disposal of Long-Lived Assets, we group long-lived assets by legal entity for purposes of recognition and measurement of an impairment loss as this is the lowest level for which cash flows are independent. Long-lived assets, such as property, plant, and equipment, and purchased intangible assets subject to amortization, are reviewed for impairment whenever events or changes in circumstances indicate that the carrying amount of an asset may not be recoverable according to ASC 360-10-05, Impairment or Disposal of Long-Lived Assets. If circumstances require a long-lived asset be tested for possible impairment, we first compare undiscounted cash flows expected to be generated by an asset to the carrying value of the asset. If the carrying value of the long-lived asset is not recoverable on an undiscounted cash flow basis, impairment is recognized to the extent that the carrying value exceeds its fair value. Fair value is determined through various valuation techniques including discounted cash flow models, quoted market values and third-party independent appraisals, as considered necessary. We have determined that no events or change in circumstances have occurred that indicate that the carrying amount of any of these long-lived assets, including goodwill, may not be recoverable. For a discussion of goodwill, see the following section.
Goodwill. The Company has made acquisitions in the past that included the recognition of goodwill, which was determined based upon previous accounting principles. Pursuant to ASC 350, Intangibles - Goodwill and Other, beginning January 1, 2009, the Company will record as goodwill the excess of the consideration transferred plus the fair value of any non-controlling interest in the acquiree at the acquisition date over the fair values of the identifiable net assets acquired.
Goodwill is not amortized, but instead tested for impairment at the reporting unit level on an annual basis or if an event occurs or circumstances change in a way to indicate that there has been a potential decline in the fair value of the reporting unit. We identify reporting units in accordance with ASC 350, Intangibles – Goodwill and Other, and ASC 280, Segment Reporting, based on how we make operating decisions, assess performance and allocate resources and on the availability of discrete financial information.
As required under ASC 360-10, we perform periodic impairment testing for all goodwill using a two-step impairment test. The first step of the test compares the fair value of a reporting unit with its carrying amount, including goodwill. If the carrying amount of a reporting unit exceeds its fair value, the second step of the goodwill impairment test is performed to measure the amount of the impairment loss, if any. During 2008, 2009 and 2010, we performed our annual impairment review of goodwill and concluded that the estimated fair value of each reporting unit substantially exceeded the related carrying value and therefore no impairment was recorded. We consider fair value to substantially exceed carrying value if the fair value is at least 110% of carrying value.
We determine fair values for each of our reporting units, Products and Services, using a combination of income and market approaches. For purposes of the income approach, fair value is determined based on the present value of estimated future cash flows, discounted at an appropriate risk-adjusted rate. We use our internal forecasts to estimate future cash flows and include an estimate of long-term future growth rates based on our most recent views of the long-term outlook for the business. Actual results may differ from those assumed in our forecast. We derive our discount rates by applying the capital asset pricing model (i.e., to estimate the cost of equity financing) and analyzing published rates for industries relevant to our reporting units. We use discount rates that are commensurate with the risks and uncertainty inherent in the respective reporting unit and in our internally developed forecasts. Valuations using the market approach reflect prices and other relevant observable information generated by market transactions involving comparable businesses.
Compared to the market approach, the income approach more closely aligns the reporting unit valuation to our specific business model, geographic markets and product and service offerings, as it is based on specific projections of the business. Required rates of return, along with uncertainty inherent in the forecasts of future cash flows, are reflected in the selection of the discount rate. Equally important, under this approach, reasonably likely scenarios and associated sensitivities can be developed for alternative future
27
Table of Contents
circumstances that may not be reflected in an observable market price. A market approach allows for comparison to actual market transactions and multiples. It can be somewhat more limited in its application because the population of potential comparables is often limited to publicly-traded companies where the characteristics of the comparative business and ours can be significantly different, market data is usually not available for divisions within larger conglomerates or non-public subsidiaries that could otherwise qualify as comparable, and the specific circumstances surrounding a market transaction (e.g., synergies between the parties, terms and conditions of the transaction, etc.) may be different or irrelevant with respect to our business. It can also be difficult under the current market conditions to identify orderly transactions between market participants in similar businesses. We assess the valuation methodology based upon the relevance and availability of data at the time of performing the valuation and weight the methodologies appropriately.
Changes in assumptions or estimates can materially affect the fair value measurement of a reporting unit, and therefore can affect the determination of whether an impairment exists. The following are key assumptions we use in making projections:
| • | Business projections. We make assumptions about the demand for our products and services in the marketplace. These assumptions drive our planning assumptions for volume, mix and pricing. We also make assumptions about our cost levels (e.g., capacity utilization, cost performance, etc.). These projections are derived using our internal business plans that are updated at least annually. |
| • | Long-term growth rate. A growth rate is used to calculate the terminal value of the reporting unit and is added to the present value of the debt-free interim cash flows. The growth rate is the expected rate at which a reporting unit’s earnings stream is projected to grow beyond the planning period. |
| • | Discount rate. When measuring possible impairment, future cash flows are discounted at a rate that is consistent with a weighted-average cost of capital that we anticipate a potential market participant would use. Weighted-average cost of capital is an estimate of the overall risk-adjusted after-tax rate of return required by equity and debt holders of a business enterprise, which is developed with the assistance of external financial advisors. |
The key assumptions that changed at December 31, 2010, compared to the prior year were limited to changes in business projections which are based on management’s view of current and future market conditions. At December 31, 2010, management’s assessment of market conditions was influenced by the length and depth of the recession, which began in 2008, and its corresponding impact on demand for power generation equipment. Management’s business projections for the Products division were limited to timing assumptions regarding a stabilizing market and expected recovery of the OEM capital expenditure cycle which had a nominal impact on the planning period as compared to prior year. Fair value remained substantially in excess of the Products division carrying value.
The Service division was less affected by the market decline due primarily to the long-term nature of their contracts and the addition of new customers and capital projects in 2010. As a result, management’s business projections for Services showed an increase in overall net income as compared to prior year projections resulting in an increase in the estimated fair value of the division over 2009.
Income Taxes. We account for income taxes using the asset and liability method under which deferred tax assets and liabilities are recognized for the estimated future tax consequences attributable to differences between the financial statement carrying amounts of existing assets and liabilities and their respective tax basis. We measure deferred tax assets and liabilities using enacted tax rates expected to be applied to taxable income in the years in which those differences are expected to be recovered or settled. We recognize in income the effect of a change in tax rates on deferred tax assets and liabilities in the period that includes the enactment date.
Under ASC 740-10, Income Taxes (“ASC 740-10”), FASB requires companies to assess whether valuation allowances should be established against their deferred tax assets based on the consideration of all available evidence, using a “more likely than not” standard. In making such assessments, significant weight is given to evidence that can be objectively verified. A company’s current or previous losses are given more weight than its future outlook, although we do consider future taxable income projections, ongoing tax planning strategies and the limitation on the use of carryforward losses in determining valuation allowance needs. We establish valuation allowances for our deferred tax assets if, based on the available evidence, it is more likely than not that some portion or all of the deferred tax assets will not be realized.
As required by ASC 740-10, we have evaluated our deferred tax assets each reporting period, including an assessment of our cumulative income over the prior three-year period, to determine if valuation allowances were required. We had a cumulative tax loss of $86.9 million for income tax years 2005, 2006 and 2007. Due to the significant negative factor of our three-year historical cumulative loss, a full valuation allowance was required for 2008 and 2009. Taxable Income was generated in 2008 and 2009 that utilized $28.1 million and $6.0 million, respectively, of the net operating loss carryover but a three-year cumulative loss remained of $52.8 million. This cumulative loss combined with uncertain market and economic conditions resulted in the full valuation allowance remaining in effect for 2010.
Valuation allowances related to deferred tax assets can be affected by changes to tax laws, changes to statutory tax rates and future taxable income levels. If we were to determine that we would not be able to realize all or a portion of our deferred tax assets in the future, we would reduce such amounts through a charge to income in the period in which that determination is made. Conversely, if we were to determine that we would be able to realize our deferred tax assets in the future in excess of the net carrying amounts, we would decrease the recorded valuation allowance through an increase to income in the period in which that determination is made.
28
Table of Contents
During the ordinary course of business, there are many transactions and calculations for which the ultimate tax determination is uncertain. As a result, we recognize tax liabilities based on estimates of whether additional taxes and interest will be due. These tax liabilities are recognized when, despite our belief that our tax return positions are supportable, we believe that certain positions may not be fully sustained upon review by tax authorities. We believe that our accruals for tax liabilities are adequate for all open audit years based on our assessment of many factors including past experience and interpretations of tax law. This assessment relies on estimates and assumptions and may involve a series of complex judgments about future events. To the extent that the final tax outcome of these matters is determined to be different than the amounts recorded, those differences will impact income tax expense in the period in which the determination is made.
Warranty Costs. We accrue estimated costs related to product and services warranty as the related revenue is recognized and included in cost of revenues. We estimate warranty costs based on past warranty claims and sales history. Our warranty terms vary by contract but generally extend for no more than three years after delivery or completion of services. We manage our exposure to warranty claims by having our field service and quality assurance personnel regularly monitor projects and maintain ongoing and regular communications with our customers.
Insurance. We self-insure a portion of our risk for health benefits and workers’ compensation. We maintain insurance coverage for other business risks including general liability insurance. We retain exposure to potential losses based on deductibles, coverage limits, and self-insured retentions. We charged approximately $5.1 million, $5.7 million and $5.2 million to expense in 2010, 2009 and 2008, respectively, with respect to health benefits and workers’ compensation claims incurred and related insurance premiums for excess claim coverage. Our reserves at December 31, 2010 and 2009 consist of estimated amounts unpaid for reported and unreported claims incurred. Our accrual for all self-insured risk retention as of December 31, 2010 was $6.7 million. As of December 31, 2010, we had $5 million in letters of credit outstanding as security for possible workers’ compensation claims.
Inflation. The effect of inflation on our financial results is minimal. Although a majority of our revenues are realized under long-term contracts, the selling prices of such contracts, established for deliveries in the future, generally reflect estimated costs to complete the projects in these future periods. In addition, many of our projects are reimbursable at actual cost plus a fee, while some of the fixed-price contracts provide for price adjustments through escalation clauses.
Recent Accounting Guidance. For a discussion of recent accounting guidance and the expected impact that the guidance could have on our consolidated financial statements, see Note 2 - Summary of Significant Accounting Policies included in Part II, Item 8 – Financial Statements and Supplementary Data.
Selected financial and operating data for our reportable business segments for the most recent three years is summarized below. This information, as well as the selected financial data provided in Item 6 and our Consolidated Financial Statements and related notes provided in Item 8 of this Annual Report on Form 10-K, should be referred to when reading our discussion and analysis of results of operations below.
29
Table of Contents
Fiscal Year 2010 Results
Our summary financial results for fiscal years 2010, 2009 and 2008 are as follows (in thousands):
| For the Years Ended December 31, | ||||||||||||
| 2010 | 2009 | 2008 | ||||||||||
| Product revenues |
$ | 142,683 | $ | 193,150 | $ | 311,603 | ||||||
| Service revenues |
377,461 | 347,460 | 245,161 | |||||||||
| Total revenues |
520,144 | 540,610 | 556,764 | |||||||||
| Cost of product revenues |
98,757 | 150,137 | 239,447 | |||||||||
| Cost of service revenues |
318,866 | 310,048 | 217,337 | |||||||||
| Cost of revenues |
417,623 | 460,185 | 456,784 | |||||||||
| Gross Profit |
102,521 | 80,425 | 99,980 | |||||||||
| Selling and administrative expenses |
52,872 | 46,664 | 50,418 | |||||||||
| Operating Income |
49,649 | 33,761 | 49,562 | |||||||||
| Interest expense |
7,052 | 9,667 | 11,667 | |||||||||
| Reorganization items |
(1,477 | ) | 1,030 | 23,574 | ||||||||
| Income tax expense |
6,410 | 5,282 | 3,151 | |||||||||
| Income from continuing operations |
37,664 | 17,782 | 11,170 | |||||||||
| Discontinued operation: |
||||||||||||
| Income from discontinued operations, net of tax |
2,971 | 7,369 | 23,668 | |||||||||
| Gain on disposal, net of tax |
— | 2,736 | — | |||||||||
| Income from discontinued operations |
2,971 | 10,105 | 23,668 | |||||||||
| Net Income |
$ | 40,635 | $ | 27,887 | $ | 34,838 | ||||||
Products:
Operating results for our Products Division in 2010 reflect lower shipment volumes compared to the prior year as a result of the depressed OEM cycle. Gross margins realized in 2010 were higher than in 2009, primarily attributable to non-recurring cost recoveries, license fees and warranty reserves adjustments based on a lower claims rate against products shipped prior to the recession. Current bookings to backlog within this segment reflect pricing commensurate with the competitive environment in which we are currently operating.
Services:
Volumes in our Services Division depend in significant part upon our clients’ scheduling of refueling outages and timing of capital project work, which historically has varied from year to year and within each calendar year. As a result, the volume of outage work in any calendar year may vary during the course of the year as projects are commenced and completed. Furthermore, we experienced a high level of capital project work throughout 2010 as we completed a significant portion of the required services on a particular capital project booked in mid-2009. Gross margins in 2010 are higher than historical gross margins due primarily to the efficient execution of several smaller capital projects completed throughout the year and favorable project close-outs as compared to 2009.
Backlog:
Our backlog consists of firm orders or blanket authorizations from our customers. Backlog may vary significantly from reporting period to reporting period due to the timing of customer commitments. The time between receipt of an order and actual completion, or delivery, of our products varies from a few weeks, in the case of inventoried precision parts, to a year or more, in the case of custom designed auxiliary power equipment and other major plant components. We add a booking to our backlog for Products Division orders when we receive a purchase order or other written contractual commitment from a customer. The maintenance services we provide through our Services Division are typically carried out under long-term contracts spanning several years. Upon signing a multi-year maintenance contract with a customer for services, we add to our backlog only the first twelve months of work that we expect to perform under the contract. Additional work that is not identified under the original contract is added to our backlog when we reach an agreement with the customer as to the scope and pricing of that additional work. Capital project awards are typically defined in terms of scope and pricing at the time of contractual commitment from the customer. Upon receipt of a customer commitment, capital project bookings are added to our backlog at full contract value regardless of the time frame anticipated to complete the project.
Backlog is not a measure defined by generally accepted accounting principles, and our methodology for determining backlog may vary from the methodology used by other companies in determining their backlog amounts. Backlog may not be indicative of future operating results and projects in our backlog may be cancelled, modified or otherwise altered by our customers.
30
Table of Contents
The following table shows our backlog, by segment, for the years ended December 31, 2010, 2009 and 2008 (in thousands):
| Backlog as of December 31, | ||||||||||||
| 2010 | 2009 | 2008 | ||||||||||
| Products |
$ | 119,420 | $ | 120,760 | $ | 168,904 | ||||||
| Services |
229,913 | 194,162 | 163,906 | |||||||||
| Total |
$ | 349,333 | $ | 314,922 | $ | 332,810 | ||||||
Consolidated backlog improved from 2009 to 2010 primarily due to the renewal of various maintenance contracts as well as a fixed price capital project that is expected to span into 2014 within our Services Division. Approximately $31.0 million of Services Division backlog as of December 31, 2010 is forecast to convert to revenue after 2011. Excluding this multi-year contract, Services backlog has remained relatively stable despite the ramp-down of the large capital project which was booked in 2009. Although the Products Division backlog was flat year-over-year, management believes the trend of increasing backlog in the second half of 2010 could signal a stabilization of the OEM markets.
Consolidated backlog declined by $17.9 million from 2008 to 2009. The increase in Services backlog during this period reflects the start-up of a capital contract booked in mid-2009 in addition to an increased scope of work associated with our customers under previously awarded contracts. These increases were partially offset by the completion of work under capital projects booked in prior periods. The $48.1 million decline in Products backlog from 2008 to 2009 reflects the state of the OEM markets as capital power projects, and our related bookings, declined sharply as a result of the recession beginning in late 2008.
Year ended December 31, 2010 compared to year ended December 31, 2009
Revenues
| (in thousands) | Variance | |||||||||||||||
| 2010 | 2009 | $ | % | |||||||||||||
| Products revenue |
$ | 142,683 | $ | 193,150 | $ | (50,467 | ) | -26.1 | % | |||||||
| Services revenue |
377,461 | 347,460 | 30,001 | 8.6 | % | |||||||||||
| Total |
$ | 520,144 | $ | 540,610 | $ | (20,466 | ) | -3.8 | % | |||||||
Product Revenues. The composition of our Products revenue varies from period to period based on our product mix, the strength of various geographic markets we serve and our ability to address those markets. The geographic dispersion of where products were shipped for the fiscal years 2010 and 2009 was as follows (in thousands):
| Variance | ||||||||||||||||
| 2010 | 2009 | $ | % | |||||||||||||
| United States |
$ | 52,764 | $ | 66,320 | $ | (13,556 | ) | -20.4 | % | |||||||
| Canada |
9,585 | 11 | 9,574 | 87,036.4 | % | |||||||||||
| Europe |
11,668 | 31,345 | (19,677 | ) | -62.8 | % | ||||||||||
| Mexico |
744 | 364 | 380 | 104.4 | % | |||||||||||
| Asia |
26,236 | 26,113 | 123 | 0.5 | % | |||||||||||
| Middle East |
22,891 | 63,681 | (40,790 | ) | -64.1 | % | ||||||||||
| Other |
18,795 | 5,316 | 13,479 | 253.6 | % | |||||||||||
| Total |
$ | 142,683 | $ | 193,150 | $ | (50,467 | ) | -26.1 | % | |||||||
The $50.5 million, or 26.1%, decrease in Products revenue for 2010 compared to 2009 resulted, in part, from the on-going reduction of demand for power and the availability of financing, which negatively impacted shipments of gas-fired turbines by OEMs. Additionally, the first half of 2009 revenues represented a higher volume of shipments for projects booked prior to the recession and contributed to more material year-over-year variances despite a well balanced product mix. Quarterly volumes beginning in the 3rd quarter of 2009 continuing through the 4th quarter of 2010 were relatively flat. Additionally, we had a $5.3 million adjustment in 2009 to reverse revenue recognized on a contract, under the percentage-of-completion method, that experienced significant cost overruns. Geographic declines were most significant in the Middle East, Europe and the United States where the reduction in demand was most prevalent and revenues were below 2009 levels by $40.8 million, $19.7 million and $13.6 million, respectively. In contrast, revenues in Canada and emerging markets such as Central and South America, increased by $9.5 million and $13.5 million, respectively.
Service Revenues. The composition of our Services revenue varies from period to period based on contract mix (lump-sum versus fixed-price and capital versus maintenance) and the number and scope of outages for our nuclear maintenance contracts.
The $30.0 million, or 8.6%, increase in Service revenues for 2010 compared to 2009 resulted from approximately $69.0 million of capital project work that began in the second half of 2009 and continued into 2010. This impact was partially offset by a decrease in revenues attributable to fewer client outages in 2010 as compared to 2009 and certain other capital projects coming to completion.
31
Table of Contents
Gross Profit / Margin %
| ($ in thousands) | Variance | |||||||||||||||
| 2010 | 2009 | $ | % | |||||||||||||
| Gross Profit - Products |
$ | 43,926 | $ | 43,013 | $ | 913 | 2.1 | % | ||||||||
| Gross Margin % |
30.8 | % | 22.3 | % | ||||||||||||
| Gross Profit - Services |
$ | 58,595 | $ | 37,412 | $ | 21,183 | 56.6 | % | ||||||||
| Gross Margin % |
15.5 | % | 10.8 | % | ||||||||||||
| Total Gross Profit |
$ | 102,521 | $ | 80,425 | $ | 22,096 | 27.5 | % | ||||||||
| Gross Margin % |
19.7 | % | 14.9 | % | ||||||||||||
Products. The gross profit for Products increased by $0.9 million, or 2.1%, from 2009 as compared to 2010. This increase is primarily the result of non-recurring cost recoveries, license fees and adjustments to our warranty reserves during 2010 that offset the overall decline in revenues. Adjustments included the normal roll off of warranty periods and changes in managements’ estimates, based on historical claims activity, to further reduce the warranty reserves required. In addition, 2009 gross margin included a non-recurring charge of $10.7 million related to cost overruns on a percentage-of-completion contract.
Services. The gross profit for Services increased by $21.2 million, or 56.6%, from 2009 compared to 2010. Approximately $3.3 million of the increase was attributable to the increase in Services revenue, approximately $1.5 million was due to non-recurring warranty and other favorable reserve adjustments with the remaining $16.7 million attributable to the efficient execution of various capital projects and smaller projects that resulted in favorable margins as compared to the prior year. Also, margins were favorably impacted by heavy capital project work in 2010 which offset fewer scheduled maintenance outages.
Selling and Administrative Expenses
| ($ in thousands) | Variance | |||||||||||||||
| 2010 | 2009 | $ | % | |||||||||||||
| Selling and administrative |
$ | 52,872 | $ | 46,664 | $ | 6,208 | 13.3 | % | ||||||||
Selling and administrative expenses include the costs associated with conducting our business, including general management, compensation and benefits of employees that are not direct costs of active projects, officers and directors, legal and professional fees and other general expenses.
Selling and administrative expenses were 13.3% higher in 2010 versus 2009. The increases in selling and administrative expenses resulted primarily from increased non-cash stock compensation of $2.1 million due to the 2010 Restricted Stock Units (“RSU”) grant and the resetting of the performance condition portion of prior years’ RSU grants, higher professional fees of approximately $2.0 million and higher personnel costs of $1.0 million. Professional fees relating to the preparation of our Registration Statement on Form 10 and to comply with public reporting requirements increased by $1.1 million in 2010 and are believed to be non-recurring. Personnel costs were higher due to an increase in headcount at the corporate and operating division level.
Interest Expense
| Variance | ||||||||||||||||
| 2010 | 2009 | $ | % | |||||||||||||
| Interest expense |
$ | 7,052 | $ | 9,667 | $ | (2,615 | ) | -27.1 | % | |||||||
Interest expense consists of term loan interest, amortization of debt issuance costs and letter of credit fees offset by interest income earned on cash balances.
Interest expense declined $2.6 million, or 27.1%, to $7.1 million for 2010 compared to $9.7 million for 2009. The decrease was primarily attributable to a $4.8 million decrease in the interest expense due to the repayment of the outstanding balance of the term loan facility on November 18, 2010. In conjunction with the repayment of the term loan facility, we recognized $1.8 million of expense associated with the write-off of unamortized debt issuance costs pertaining to the term note.
32
Table of Contents
Reorganization Expense
| Variance | ||||||||||||||||
| 2010 | 2009 | $ | % | |||||||||||||
| Reorganization items |
$ | (1,477 | ) | $ | 1,030 | $ | (2,507 | ) | -243.4 | % | ||||||
Reorganization expenses consist of professional fees and changes in liabilities subject to compromise incurred in connection with our 2008 bankruptcy proceedings.
Total reorganization costs decreased $2.5 million, or 243.4%, to a credit of $1.5 million for 2010 compared to $1.0 million for 2009. In July 2010, the U.S. Bankruptcy Court approved a settlement of certain claims against us and our Deltak subsidiary. As a result of that settlement and the related compromise by the Company of its own claim against the fund that had been established pursuant to the Company’s Plan of Reorganization to be distributed to holders of allowed unsecured claims against Deltak, we received a cash payment of $2.8 million on July 27, 2010 and recognized such amount as revenue at that time. The settlement received more than offset professional fees during 2010 to resolve open claims.
Income Tax Expense
| Variance | ||||||||||||||||
| 2010 | 2009 | $ | % | |||||||||||||
| Income tax expense |
$ | 6,410 | $ | 5,282 | $ | 1,128 | 21.4 | % | ||||||||
Income tax expense is based on estimates of the effective tax rate for the entire fiscal year. The effective income tax rate is based upon the estimated income for the year, the estimated composition of the income in different jurisdictions and discrete adjustments, if any, in the applicable fiscal year for settlements of tax audits or assessments and the resolution or identification of tax position uncertainties.
Income tax expense increased by $1.1 million, or 21.4%, to $6.4 million for 2010 compared to $5.3 million for 2009. Income tax expense for 2010 was increased by $2.7 million related to a correction of tax expense recorded in prior periods (See Note 5 to our financial statements below). Our effective tax rate was 13.8% for 2010, compared to 15.9% for 2009. The decrease in our effective tax rate was primarily due to a more favorable mix of earnings in tax jurisdictions with tax rates lower than the U.S. statutory rate, fluctuation in the valuation allowance we use in connection with deferred tax assets, and permanent differences between the book and tax treatment of certain items. Reductions we made to the valuation allowance reduced our effective tax rate by approximately 32% in 2010 and 28% in 2009. Permanent differences between book and tax treatment of certain items increased our effective tax rate by approximately 6% for 2010 and 5% for 2009.
Income from Discontinued Operations
| Variance | ||||||||||||||||
| 2010 | 2009 | $ | % | |||||||||||||
| Income from discontinued operations, net of tax |
$ | 2,971 | $ | 7,369 | $ | (4,398 | ) | -59.7 | % | |||||||
Discontinued operations are primarily comprised of income recognized from Deltak’s large-scale HRSG product line contracts. Some of the HRSG contracts under completion agreements were in a positive cash position as of the September 28, 2006, Chapter 11 filing date because aggregate collections of billings exceeded aggregated project costs incurred. Our recognition of this excess was deferred until the earnings process was considered completed upon satisfaction of performance milestones set forth in the completion agreements.
Income from discontinued operations declined $4.2 million, or 57%, to $3.2 million for 2010 compared to $7.4 million for 2009. The decline was attributable to a $4.2 million decrease in the amount of deferred revenue recognized on completion agreements from Deltak’s legacy large-scale HRSG contracts. For the first six months of 2010, we recognized the deferred revenues associated with these contracts as income from discontinued operations, upon satisfaction of performance milestones set forth in the completion agreements.
Gain on Disposal of Discontinued Operations
| Variance | ||||||||||||||||
| 2010 | 2009 | $ | % | |||||||||||||
| Gain on disposal, net |
$ | — | $ | 2,736 | $ | (2,736 | ) | -100.0 | % | |||||||
Gain on disposal of discontinued operations was $2.7 million for 2009, resulting from a November 2009 release of escrow funds attributable to our October 2007 sale of Global Power Asia, Ltd. No comparable gain was recognized in 2010.
33
Table of Contents
Outlook
Looking to 2011, we expect the OEM market to continue to stabilize, setting the table for a 2012 resumption of gas turbine power projects.
In the Services business, we plan to pursue additional capital projects, resulting in a more balanced mix with the traditional plan maintenance business in an effort to provide EPC services to a greater extent than in earlier years. If the recent events in Japan regarding certain nuclear plants do not negatively influence domestic policy regarding commercial nuclear technology, we see this as an area of continued future growth that could allow us to reach new customers and markets and provide cyclical offsets to the timing of refueling outages in our traditional maintenance business.
Year ended December 31, 2009 compared to year ended December 31, 2008
Revenues
| (in thousands) | Variance | |||||||||||||||
| 2009 | 2008 | $ | % | |||||||||||||
| Products revenue |
$ | 193,150 | $ | 311,603 | $ | (118,453 | ) | -38.0 | % | |||||||
| Services revenue |
347,460 | 245,161 | 102,299 | 41.7 | % | |||||||||||
| Total |
$ | 540,610 | $ | 556,764 | $ | (16,154 | ) | -2.9 | % | |||||||
Product Revenues. The composition of our Products revenue varies from period to period based on our product mix, the strength of various geographic markets we serve and our ability to address those markets. The geographic dispersion of where products were shipped for the fiscal years 2009 and 2008 was as follows (in thousands):
| Variance | ||||||||||||||||
| 2009 | 2008 | $ | % | |||||||||||||
| United States |
$ | 66,320 | $ | 105,301 | $ | (38,981 | ) | -37.0 | % | |||||||
| Canada |
11 | 22,050 | (22,039 | ) | -100.0 | % | ||||||||||
| Europe |
31,345 | 20,704 | 10,641 | 51.4 | % | |||||||||||
| Mexico |
364 | 116 | 248 | 213.8 | % | |||||||||||
| Asia |
26,113 | 17,999 | 8,114 | 45.1 | % | |||||||||||
| Middle East |
63,681 | 112,374 | (48,693 | ) | -43.3 | % | ||||||||||
| Other |
5,316 | 33,059 | (27,743 | ) | -83.9 | % | ||||||||||
| Total |
$ | 193,150 | $ | 311,603 | $ | (118,453 | ) | -38.0 | % | |||||||
The $118.5 million, or 38%, decrease in Products Revenues for 2009 compared to 2008 resulted largely from reductions in the demand for power and in the availability of project financing, both occurring as a result of the worldwide recession and both contributing to a sharp reduction in shipments of gas-fired turbines by OEMs. The decline was also in part due to downward pricing pressure resulting from decreased demand leading to reduced margins on lower volumes during the downward part of the economic cycle. While we benefited from the run-off of our 2008 backlog, primarily related to Middle East projects, 2009 revenues from multi-turbine Middle East projects were $48.7 million below 2008 revenues from that market. Auxiliary power equipment volumes were also down $40.9 million in the U.S. and Canada and $8.7 million in international markets other than the Middle East. These declines were partially offset by increases of $10.6 million in Europe and $8.1 million in Asia. Total Product revenues for 2008 also included $20.2 million of revenue recognized in that year on one substantial mid-sized HRSG contract in Canada. Year-over-year declines were most significant in the United States, Europe and the Middle East.
Service Revenues. The composition of our Services revenue varies from period to period based on contract mix (lump-sum versus fixed-price and capital versus maintenance) and the number and scope of outages for our nuclear maintenance contracts.
The $102.3 million, or 41.7%, increase in Service revenues for 2009 compared to 2008 resulted from $71.0 million in capital project services performed for new customers in 2009 and $36.2 million of services due to increased scope of work provided in the course of refueling outages for existing customers. Specialty services for 2009 decreased $4.9 million from 2008 due to lower levels of activity within our customer base as a result of poor economic conditions, increases in the competitive environment resulting from the lower activity levels, and fewer capital projects in the fossil fuel energy sector.
34
Table of Contents
Gross Profit / Margin %
| ($ in thousands) | Variance | |||||||||||||||
| 2009 | 2008 | $ | % | |||||||||||||
| Gross Profit - Products |
$ | 43,013 | $ | 72,156 | $ | (29,143 | ) | -40.4 | % | |||||||
| Gross Margin % |
22.3 | % | 23.2 | % | ||||||||||||
| Gross Profit - Services |
$ | 37,412 | $ | 27,824 | $ | 9,588 | 34.5 | % | ||||||||
| Gross Margin % |
10.8 | % | 11.3 | % | ||||||||||||
| Total Gross Profit |
$ | 80,425 | $ | 99,980 | $ | (19,555 | ) | -19.6 | % | |||||||
| Gross Margin % |
14.9 | % | 18.0 | % | ||||||||||||
Products. The gross profit declined by $29.1 million, or 40.4%, from 2008 compared to 2009. The decline is primarily attributable to a decline in revenues, partially offset by adjustments to our warranty reserves and other fabrication costs. The shortfall in revenues resulted in a margin decrement of $23.8 million, partially offset by reduction in warranty costs of $3.1 million and a $2.3 million reduction in fabrication and material costs. Furthermore, costs of Product revenues included a $10.7 million additional cost overrun on a percentage-of-completion contract recognized late in 2009.
Services. The gross profit for Services increased by $9.6 million, or 34.5%, from 2008 compared to 2009. This increase was primarily attributable to the increase in Services revenue resulting from heavy capital project work completed in the last half of 2009, which offset fewer scheduled maintenance outages relative to the prior year.
Selling and Administrative Expenses
| Variance | ||||||||||||||||
| 2009 | 2008 | $ | % | |||||||||||||
| Selling and administrative |
$ | 46,664 | $ | 50,418 | $ | (3,754 | ) | -7.4 | % | |||||||
Selling and administrative expenses include the costs associated with conducting our business, including general management, compensation and benefits of employees that are not direct costs of active projects, officers and directors, legal and professional fees and other general expenses.
Selling and administrative expenses were 7.4% lower in 2009 versus 2008. The decreases in selling and administrative expenses resulted from $2.5 million in cost reductions implemented within our Products Division attributable to reductions in force and control of operating expenditures. Additionally, we had a $1.3 million reduction in incentive compensation tied to the Company’s financial performance.
Interest Expense
| Variance | ||||||||||||||||
| 2009 | 2008 | $ | % | |||||||||||||
| Interest expense |
$ | 9,667 | $ | 11,667 | $ | (2,000 | ) | -17.1 | % | |||||||
Interest expense consists of term loan interest, amortization of debt issuance costs and letter of credit fees offset by interest income earned on cash balances.
Interest expense declined $2.0 million, or 17.1%, to $9.7 million for 2009 compared to $11.7 million for 2008. The decline was primarily attributable to a decrease in the interest expense for the long-term debt facility due to principal payments that reduced the balance by $19.7 million during 2009. These principal payments included $5.0 million in mandatory quarterly amortization payments and a payment of $14.7 million made in April 2009 in compliance with the annual excess cash flow sweep provision of our Credit Facility.
Reorganization Expense
| Variance | ||||||||||||||||
| 2009 | 2008 | $ | % | |||||||||||||
| Reorganization items |
$ | 1,030 | $ | 23,574 | $ | (22,544 | ) | -95.6 | % | |||||||
Reorganization expenses consist of professional fees and changes in liabilities subject to compromise incurred in connection with our 2008 bankruptcy proceedings.
35
Table of Contents
Total reorganization expenses declined $22.5 million, or 95.6%, to $1.0 million for 2009 compared to $23.6 million for 2008 due primarily to a $14.3 million increase in the estimate of liabilities subject to compromise during 2008, which did not reoccur in 2009, and an $8.1 million decrease in professional expenses. Reorganization expenses recognized in 2008 included funding of a $34 million reserve with respect to Deltak and significant professional fees incurred in connection with the January 22, 2008 emergence from Chapter 11 protection.
Income Tax Expense
| Variance | ||||||||||||||||
| 2009 | 2008 | $ | % | |||||||||||||
| Income tax expense |
$ | 5,282 | $ | 3,151 | $ | 2,131 | 67.6 | % | ||||||||
Income tax expense is based on estimates of the effective tax rate for the entire fiscal year. The effective income tax rate is based upon the estimated income for the year, the estimated composition of the income in different jurisdictions and discrete adjustments, if any, in the applicable fiscal year for settlements of tax audits or assessments and the resolution or identification of tax position uncertainties.
Income tax expense increased by $2.1 million, or 67.6%, to $5.3 million for 2009 compared to $3.2 million for 2008. Our effective tax rate was 15.9% for 2009, compared to 8.4% for 2008. The differences between our effective tax rate and the U.S. federal statutory rate of 35% principally result from the geographical distribution of our taxable income, fluctuations in the valuation allowance we use in connection with deferred tax assets, and permanent differences between the book and tax treatment of certain items. Our foreign earnings are normally taxed at lower rates than our U.S. earnings. We reduce our deferred tax assets in amounts determined by a valuation allowance when we are unable to conclude that we are more likely than not to realize a particular tax asset. Reductions we make in the valuation allowance reduce our effective tax rate. Conversely, if we increase the valuation allowance, the result is to increase our effective tax rate. Reductions we made to the valuation allowance reduced our effective tax rate by approximately 32% in 2009 and 15% in 2008. Permanent differences between book and tax treatment of certain items increased our effective tax rate by approximately 5% for 2009 and 2% for 2008. (In each case, these percentage differences are from the levels computed before taking into account the reductions in valuation allowance or the permanent differences, as the case may be.) At the end of 2009, we had approximately $50.9 million of federal and $44.6 million of state net operating loss carryforwards and $7.5 million of foreign tax credits available for possible use in future years.
Income from Discontinued Operations
| Variance | ||||||||||||||||
| 2009 | 2008 | $ | % | |||||||||||||
| Income from discontinued operations, net of tax |
$ | 7,369 | $ | 23,668 | $ | (16,299 | ) | -68.9 | % | |||||||
Discontinued operations are primarily comprised of income recognized from Deltak’s large-scale HRSG product line contracts. Some of the HRSG contracts under completion agreements were in a positive cash position as of the September 28, 2006, Chapter 11 filing date because aggregate collections of billings exceeded aggregated project costs incurred. Our recognition of this excess was deferred until the earnings process was considered completed upon satisfaction of performance milestones set forth in the completion agreements.
Income from discontinued operations declined $16.3 million, or 68.9%, to $7.4 million for 2009 compared to $23.7 million for 2008. The decline was attributable to a $16.9 million decrease in the amount of deferred revenue recognized on completion agreements from Deltak’s legacy large-scale HRSG contracts, partially offset by $0.6 million for recoveries of bad debts during 2009. As milestones contained within the completion agreements are met, deferred revenues are removed from the balance sheet and recognized as income from discontinued operations; these are non-cash events.
Gain on Disposal of Discontinued Operations
| Variance | ||||||||||||||||
| 2009 | 2008 | $ | % | |||||||||||||
| Gain on disposal, net of tax |
$ | 2,736 | $ | — | $ | 2,736 | 100.0 | % | ||||||||
Gain on disposal of discontinued operations was $2.7 million for 2009, resulting from a settlement agreement that was executed outlining the release of certain escrow funds pursuant to the sale of Global Power Asia, Ltd. in October 2007 and the Company received such funds on November 10, 2009. No comparable gain was recognized in 2008.
35
Table of Contents
Liquidity and Capital Resources
Overview
We believe a strong balance sheet is a necessary pre-requisite for creating sustainable growth in stockholder value. During the strong part of an economic cycle, adequate liquidity can be used to finance organic growth; during the weak part of an economic cycle, adequate liquidity engenders discipline on price terms and risk assumption. Through all phases of recurring economic cycles, adequate liquidity facilitates all material transactions, whether with bankers, insurance providers, vendors or customers. Adequate liquidity also provides a cushion against operational challenges such as uninsured costs or claims or adverse litigation outcomes and opens up a broader scope and larger scale of strategic alternatives, including potential acquisitions. Our liquidity position as of December 31, 2010 was strong; we had $55.5 million of cash on our balance sheet. On November 18, 2010, we repaid the outstanding balance of the term loan facility and all related interest in full on our Credit Facility.
Cash and Cash Equivalents. Cash and cash equivalents decreased $47.7 million, or 46.3%, to $55.5 million at December 31, 2010 from $103.2 million at December 31, 2009, primarily as a result of using cash to pay down $65.3 million of outstanding term debt during 2010. This decrease was partially offset by the cash generated by operations.
Credit Facility. We have a $150 million Credit Facility (“Credit Facility”) consisting of a $60 million revolving letter of credit facility, including a $25 million cash advance sub-facility, and a $90 million term loan facility. On November 18, 2010, the Company repaid the outstanding balance of the term loan and all related interest in full. At December 31, 2010, the Company had no debt outstanding and $25.0 million of unused capacity on the cash advance sub-facility.
The Credit Facility includes affirmative and negative covenants, including customary limitations on securing additional debt and liens and restrictions on transactions and payments as well as the following three financial covenants:
| • | Our maximum consolidated leverage ratio cannot exceed specified limits (3.00 at December 31, 2010). For these purposes, our consolidated leverage ratio on any date is the ratio of our consolidated debt to our domestic entity consolidated EBITDA for the four most recent quarters. |
| • | Our consolidated fixed charge ratio must be maintained at least at specified minimum levels (1.60 at December 31, 2010). For these purposes, our consolidated fixed charge ratio is the ratio of (a) our domestic entity consolidated EBITDA for the four most recent quarters reduced by our consolidated capital expenditures during and by our tax provision for that period, to (b) our domestic entity consolidated fixed charges (consisting of interest and scheduled principal payments on indebtedness) for that period. |
| • | We must maintain at all times a minimum level of liquidity ($10 million). For these purposes, our liquidity is equal to the undrawn available funds under our $25 million cash advance sub-facility plus all cash and cash equivalents held by our domestic entities. |
If we fail to comply with any of these financial covenants, if we fail to comply with certain other customary affirmative or negative covenants, if we fail to make payments when due, or if we experience a change of control or become subject to insolvency proceedings, we will be in default under the Credit Facility. For these purposes, a change of control will occur if any one person or group obtains control of 35% of our outstanding stock or if continuing directors cease to constitute at least a majority of the members of our Board of Directors. If we default, the participating banks may restrict our ability to borrow additional funds under the Credit Facility, may require that we immediately repay all outstanding loans with interest and may require the cash collateralization of outstanding letter of credit obligations. We have given a first priority lien on substantially all of our assets as security for the Credit Facility. At December 31, 2010, we were in compliance with all financial and other covenants under the Credit Facility.
Sources and Uses of Cash. Our primary sources of cash are net cash flow from operations and borrowings under our Credit Facility. Our primary uses of cash are principal and interest payments on our indebtedness, capital expenditures, working-capital and general corporate purposes.
Issuance of Common Stock and Warrants. Upon emergence from bankruptcy on January 22, 2008, we issued 5,266,885 shares of our new common stock to pre-petition equity holders in exchange for stock held before the bankruptcy on a one-for-one basis. On that same date, pursuant to the rights offering, a related private placement, and our Management Incentive Co-Investment Plan, we issued an additional 9,589,138 shares of our new common stock in exchange for $72.5 million in new equity capital. The applicable price of our common stock in the rights offering was $7.65 per share. Also on January 22, 2008 and in connection with the rights offering, we issued warrants to acquire 1,807,223 shares of our common stock at an exercise price of $7.9254 per share to the group of then-existing stockholders that backstopped the rights offering. The warrants expire on January 22, 2013. Through December 31, 2010, warrants were exercised to purchase 52,084 shares of our common stock in cashless transactions. We withheld 71,980 shares of common stock in connection with those exercises and the shares so withheld are now held by us as treasury shares. (All of the share and per share numbers in this Annual Report on Form 10-K reflect the retroactive effect of the 1-for-9 reverse stock split of all of our outstanding shares of common stock that was effective June 30, 2010.)
Liabilities Subject to Compromise. Liabilities subject to compromise include unsecured and under secured liabilities, including secured liabilities as to which there is uncertainty as to whether the value of the collateral securing the liabilities is less than, equals or exceeds such liabilities, incurred before the petition date. Balances at December 31, 2010 and 2009 were $0.2 million and $0.5 million, respectively. These amounts represent our estimates of known or potential pre-petition date claims that are likely to be
37
Table of Contents
resolved in connection with the Chapter 11 filings. These claims remain subject to further adjustments. Adjustments result from negotiations, actions of the Bankruptcy Court, rejection of executory contracts, the determination as to the value of any collateral securing claims, proofs of claim or other events.
Changes in Cash and Cash Equivalents for 2010, 2009 and 2008 are as follows (in thousands):
| Year Ended December 31, | ||||||||||||
| 2010 | 2009 | 2008 | ||||||||||
| Statement of cash flow data: |
||||||||||||
| Cash flows provided by (used in): |
||||||||||||
| Operating activities |
$ | 19,675 | $ | 63,388 | $ | (119,472 | ) | |||||
| Investing activities |
(681 | ) | 999 | (3,397 | ) | |||||||
| Financing activities |
(65,334 | ) | (19,740 | ) | 130,877 | |||||||
| Effect of exchange rate changes on cash |
(1,406 | ) | 940 | (2,051 | ) | |||||||
| Change in cash and cash equivalents |
$ | (47,746 | ) | $ | 45,587 | $ | 5,957 | |||||
Operating Activities
We believe that cash generated from our operations and available to us under our Credit Facility will be adequate to meet our working capital requirements for the foreseeable future. We expect our net operating cash flow will continue to be positive in 2011, although our Products Division could require increased levels of working capital if the OEM markets continue to strengthen.
During 2010, cash provided by our operating activities was $19.7 million. The principal sources of cash from operating activities were:
| • | Net income of $40.6 million, adjusted for non-cash charges of $7.2 million in depreciation and amortization, $3.8 million in stock based compensation, and a $2.5 million deferred income tax provision, partially offset by $3.0 million in deferred revenue recognized on completion agreements. |
| • | A $31.2 million decrease in cash associated with changes in our working capital accounts (discussed below) which is indicative of the completion of major projects in the Products Division providing cash used to pay current liabilities and an increase in working capital requirements related to the timing and payments under certain lump-sum projects in our Services Division. |
During 2009, cash provided by our operating activities was $63.4 million. The principal sources of cash from operating activities were:
| • | Net income of $27.9 million, adjusted for non-cash charges of $5.4 million for depreciation and amortization, a $3.8 million deferred income tax provision and $1.8 million in stock based compensation charges; these were partially offset by a $5.7 million in deferred revenue recognized on completion agreements and a $2.7 million gain recognized on the sale of discontinued operations. |
| • | A $32.9 million increase in cash resulting from positive changes in working capital accounts (discussed below) which is attributable to the realization of work-in-process in 2009, and an increase in accounts payable caused by the expansion of scope and capital projects in our Service Division. |
During 2008, cash used in operating activities was $119.5 million. The principal uses of cash from operating activities were:
| • | A $121.8 million decrease in cash resulting from a decrease in liabilities subject to compromise reflecting claims paid upon emergence from bankruptcy in January 2008. |
| • | A $19.0 million decrease in cash associated with changes in our working capital accounts due to the timing of cash receipts and payments in these accounts. The primary components of working capital affecting the cash decrease in 2008 included a substantial increase in accounts receivable due primarily to activity in the Products Division. |
These decreases were partially offset by:
| • | Net income of $34.8 million, adjusted for non-cash charges of $5.3 million for depreciation and amortization, $1.1 million for deferred income tax provision, $1.4 million in stock based compensation offset by $21.2 million in deferred revenue recognized on completion agreements. |
Working Capital
We continually monitor our accounts receivable and manage the operating cash flows of the Company by managing the working capital accounts in total, rather than by the individual elements. The primary elements of the Company’s working capital accounts are accounts receivable, costs and estimated earnings in excess of billings, other assets, accounts payable, billings in excess of cost and
38
Table of Contents
estimated earnings and other accrued liabilities. Accounts receivable consist of billings to our clients—a substantial portion of which is for project-related costs. Costs and estimated earnings in excess of billings consist of costs incurred on projects that have not been billed to our clients. Accounts payable consists of obligations to third parties relating primarily to costs incurred for projects that are generally billable to clients. Billings in excess of cost and estimated earnings consist of billings to and payments from our clients for costs yet to be incurred. This comprehensive view of working capital, taking into account each of the six primary elements listed, is both common and useful in our project-based industry, as it facilitates reviews of cash flow information at the total working capital level.
Working capital varies from period-to-period depending on the mix, stage of completion and commercial terms and conditions of our contracts and the timing of the related cash receipts. We experienced a decrease in cash used for working capital during 2010, as cash receipts increased relative to cash used for services rendered and purchases of materials. Conversely, we experienced an increase in cash provided by working capital during 2009 as projects held in backlog at December 31, 2008 were completed in 2009.
Investing Activities
Net cash used in investing activities for 2010 was $0.7 million, primarily applied to the purchase of fixed assets, partially offset by cash provided by a decrease in restricted cash.
Net cash provided by investing activities in 2009 was $1.0 million, made up primarily of decreases in restricted cash and proceeds from the sale of discontinued operations offset by purchases of fixed assets.
Net cash used in investing activities for 2008 was $3.4 million, made up primarily of purchases of fixed assets.
Financing Activities
Net cash used in financing activities for 2010 was $65.3 million, resulting from the repayment of our term loan facility in full related interest.
Net cash used in financing activities for 2009 was $19.7 million, primarily the result of principal payments made on our Credit Facility, partially offset by proceeds from our Credit Facility. On July 14, 2009, the Company drew down the full amount of the $25 million on the cash advance sub-facility of the Credit Facility in order to secure access to the available funds. On September 30, 2009, The CIT Group / Business Credit, Inc. sold and assigned all of their interest in and all rights and obligations under the Credit Facility to another party. The outstanding borrowings under our cash advance sub-facility, and related interest, was re-paid in full on September 30, 2009.
Net cash provided by financing activities for 2008 was $130.9 million, primarily the result of proceeds from the Credit Facility and issuance of common stock, offset partially by principal payments made on the debtor-in-possession Credit Facility and payments of debt issuance costs.
Off Balance Sheet Transactions
Our liquidity is currently not dependent on the use of off-balance sheet transactions but, in line with industry practice, we are often required to provide performance and surety bonds to customers and may be required to provide letters of credit. If performance assurances are extended to clients, generally our maximum potential exposure is limited in the contract with our customers. We frequently obtain similar performance assurances from third party vendors and subcontractors for work performed in the ordinary course of contract execution. However, the total costs of a project could exceed our original cost estimates, and we could experience reduced gross profit or possibly a loss for a given project. In some cases, where we fail to meet certain performance standards, we may be subject to contractual liquidated damages.
Contractual Obligations
Contractual obligations at December 31, 2010:
| Payments due by period (in thousands) | ||||||||||||||||||||
| Total | Less than 1 year |
1- 3 years |
3- 5 years |
More than 5 years |
||||||||||||||||
| Capital Lease Obligations |
$ | 74 | 37 | 37 | — | — | ||||||||||||||
| Operating Lease Obligations |
3,296 | 998 | 1,440 | 755 | 103 | |||||||||||||||
| Total |
$ | 3,370 | $ | 1,035 | $ | 1,477 | $ | 755 | $ | 103 | ||||||||||
39
Table of Contents
Item 7A. Quantitative and Qualitative Disclosures About Market Risk.
Interest Rate Risk. Our primary market risk exposure is volatility of interest rates, primarily in the United States. We manage interest rates through the use of a combination of fixed and floating rate debt and interest rate swap agreements. We are subject to interest rate changes on our LIBOR-based variable interest $150 million Credit Facility. As of December 31, 2010, we had no outstanding borrowings on our Credit Facility.
Interest rate sensitivity – Based on the absence of any borrowings at December 31, 2010, a 50 basis point fluctuation in short-term interest rates would have no impact on our expected pre-tax income on an annual basis.
Item 8. Financial Statements and Supplementary Data.
The financial statements and other information required by this Item are contained in the financial statements and footnotes thereto included in Item 15 and listed in the index on page F-1 of this report.
Item 9. Changes in and Disagreements With Accountants on Accounting and Financial Disclosure.
None.
Item 9A. Controls and Procedures.
Evaluation of Disclosure Controls and Procedures
We maintain disclosure controls and procedures that are designed to ensure that information required to be disclosed in our reports under the Securities Exchange Act of 1934, as amended (the “Exchange Act”), is recorded, processed, summarized and reported within the time periods specified in the SEC’s rules and forms, and that such information is accumulated and communicated to our management, including our Chief Executive Officer and Chief Financial Officer, as appropriate, to allow timely decisions regarding required disclosure based on the definition of “disclosure controls and procedures” in Rule 13a-15(e) under the Exchange Act. In designing and evaluating the disclosure controls and procedures, management recognizes that any controls and procedures, no matter how well designed and operated, can provide only reasonable assurance of achieving the desired control objectives.
We carried out an evaluation, under the supervision and with the participation of our management, including our Chief Executive Officer and our Chief Financial Officer, of the effectiveness of the design and operation of our disclosure controls and procedures as of December 31, 2010. Based on this evaluation, our Chief Executive Officer and Chief Financial Officer concluded that our disclosure controls and procedures were effective as of the end of the period covered by this report to provide reasonable assurance that the information required to be disclosed in the Company’s periodic reports is recorded, processed, summarized and reported as and when required.
Changes in Internal Control over Financial Reporting
This Annual Report does not include a report of management’s assessment regarding internal control over financial reporting or an attestation report of the Company’s registered public accounting firm due to a transition period established by rules of the SEC for newly public companies. We will be required to comply with the internal control over financial reporting requirements for the first time, and will be required to provide a management report on the effectiveness of our internal control over financial reporting and an attestation report on the effectiveness of our internal control over financial reporting from our independent registered public accounting firm, in connection with our Annual Report on Form 10-K for the year ending December 31, 2011. Although we are not yet required to comply with these requirements, we are preparing for future compliance by assessing and strengthening our system of internal control. We are in the process of performing the information system and process documentation, evaluation and testing required for management to make this assessment and for our independent registered public accounting firm to provide their attestation report. In the course of evaluation and testing, management may identify deficiencies that will be addressed and remediated. During the three months ended December 31, 2010, there was no change in our internal control over financial reporting that has materially affected, or is reasonably likely to materially affect, our internal control over financial reporting.
None
40
Table of Contents
Item 10. Directors, Executive Officers and Corporate Governance.
The information required by Item 10 with respect to the executive officers and key employees is included in Part I of the Form 10-K.
The information required by Item 10 with respect to the directors is incorporated by reference to the information included under the caption [“Election of Directors”] in our Proxy Statement for the 2011 Annual Meeting of Stockholders, which we plan to file within 120 days after December 31, 2010, the end of our fiscal year.
The information required by Item 10 with respect to compliance with Section 16 of the Exchange Act is incorporated by reference to the information included under the caption “Section 16(a) Beneficial Ownership Reporting Compliance” in our Proxy Statement for the 2011 Annual Meeting of Stockholders.
The information required by Item 10 with respect to the audit committee and the audit committee financial expert is incorporated by reference to the information included under the caption “The Board, its Committees and its Compensation Board Leadership and Committee Composition – Audit Committee” in our Proxy Statement for the 2011 Annual Meeting of Stockholders.
The information required by Item 10 with respect to the Code of Business Conduct and Ethics is posted on our website at www.globalpower.com, in the Investor Information section under “Corporate Governance—Code of Business Conduct and Ethics of Global Power Equipment Group Inc.”
We will post information regarding any amendment to, or waiver from, our Code of Business Conduct and Ethics on our website at www.globalpower.com in the Investor Information section under Governance.
Item 11. Executive Compensation.
The information required by Item 11 is incorporated by reference to the information included under the captions “Executive Compensation,” “The Board, its Committees and its Compensation - Director Compensation,” “Compensation Committee Interlocks and Insider Participation,” “Compensation Discussion and Analysis” and “Compensation Committee Report” in our Proxy Statement for the 2011 Annual Meeting of Stockholders.
Item 12. Security Ownership of Certain Beneficial Owners and Management and Related Stockholder Matters.
The information required by Item 12 is incorporated by reference to the information included under the caption “Security Ownership of Certain Beneficial Owners and Management” in our Proxy Statement for the 2011 Annual Meeting of Stockholders.
Item 13. Certain Relationships and Related Transactions and Director Independence.
The information required by Item 13 with respect to certain relationships and related transactions is incorporated by reference to the information included under the captions “Certain Relationships and Related Transactions”, and “The Board, its Committees and its Compensation - Director Independence” in our Proxy Statement for the 2011 Annual Meeting of Stockholders.
The information required by Item 13 with respect to director independence is incorporated by reference to the information included under the captions “Certain Relationships and Related Transactions”, and “The Board, its Committees and its Compensation - Director Independence” in our Proxy Statement for the 2011 Annual Meeting of Stockholders.
Item 14. Principal Accountant Fees and Services.
The information required by Item 14 with respect to the fees and services of BDO USA, LLP, our independent registered public accounting firm, and the audit committee’s pre-approved policies and procedures, are incorporated by reference to the information included under the caption “Fees Paid to Auditors” in our Proxy Statement for the 2011 Annual Meeting of Stockholders.
41
Table of Contents
Item 15. Exhibits and Financial Statement Schedules.
Documents filed as part of this Report:
Financial Statements: The following report of independent accountants and our consolidated financial statements are set forth in the index beginning on page F-1:
| • | Report of Independent Registered Public Accounting Firm |
| • | Consolidated Balance Sheets as of December 31, 2010 and 2009 |
| • | Consolidated Statement of Operations for the years ended December 31, 2010, 2009 and 2008 |
| • | Consolidated Statement of Changes in Stockholders’ Equity for the years ended December 31, 2010, 2009 and 2008 |
| • | Consolidated Statement of Cash Flows for the years ended December 31, 2010, 2009 and 2008 |
| • | Notes to Consolidated Financial Statements |
The following financial statement schedule is contained on page F-30 in this Report.
| • | Valuation and Qualifying Accounts and Reserves for the years ended December 31, 2010, 2009 and 2008 |
All other schedules are omitted because they are not applicable or the required information is shown in the consolidated financial statements or the notes thereto.
List of Exhibits
See Index to Exhibits on the pages below. The Company agrees to furnish to the SEC, upon request, copies of any long-term debt instruments that authorize an amount of securities constituting 10% or less of the total assets of the Company and its subsidiaries on a consolidated basis.
42
Table of Contents
| F-1 | Consolidated financial statements as of December 31, 2010 and 2009, and for the years ended December 31, 2010, 2009 and 2008. |
Exhibits: The following exhibits are furnished as exhibits to this Form 10-K:
| Exhibit |
Description | |
| 3.1 | Second Amended and Restated Certificate of Incorporation of Global Power Equipment Group Inc. (filed as Exhibit 3.1 to the Company’s Form 10 filed with the commission on April 30, 2010 and incorporated herein by reference). | |
| 3.2 | Certificate of Amendment, dated June 30, 2010, to Second Amended and Restated Certificate of Incorporation of Global Power Equipment Group Inc. (filed as Exhibit 3.2 to the Company’s Amendment No. 2 to Form 10 filed with the commission on July 20, 2010 and incorporated herein by reference). | |
| 3.3 | Second Amended and Restated By-Laws of Global Power Equipment Group Inc. (filed as Exhibit 3.2 to the Company’s Form 10 filed with the commission on April 30, 2010 and incorporated herein by reference). | |
| 10.1 | Credit Agreement, dated as of January 22, 2008 (the “Credit Agreement”), by and among Global Power Equipment Group Inc., certain of its subsidiaries, Morgan Stanley Senior Funding, Inc., Morgan Stanley & Co. Incorporated, The CIT Group/Business Credit Inc., General Electric Capital Corporation, and the other lenders from time to time party thereto. (filed as Exhibit 10.1 to the Company’s Amendment No. 2 to Form 10 filed with the commission on July 20, 2010 and incorporated herein by reference). + | |
| 10.2 | Amendment No. 1 to the Credit Agreement, effective as of April 24, 2008 (filed as Exhibit 10.2 to the Company’s Amendment No. 2 to Form 10 filed with the commission on July 20, 2010 and incorporated herein by reference). | |
| 10.3 | Amendment No. 2 to the Credit Agreement, effective as of July 30, 2008 (filed as Exhibit 10.3 to the Company’s Amendment No. 2 to Form 10 filed with the commission on July 20, 2010 and incorporated herein by reference). + | |
| 10.4 | Amendment No. 3 to the Credit Agreement, effective as of December 31, 2009 (filed as Exhibit 10.4 to the Company’s Form 10 filed with the commission on April 30, 2010 and incorporated herein by reference). | |
| 10.5 | Backstop Purchase Agreement, dated as of October 23, 2007, by and among Global Power Equipment Group Inc. and the purchasers party thereto (filed as Exhibit 10.5 to the Company’s Form 10 filed with the commission on April 30, 2010 and incorporated herein by reference). | |
| 10.6 | Registration Rights Agreement, dated as of January 22, 2008, by and among Global Power Equipment Group Inc. and the investors party thereto (filed as Exhibit 10.6 to the Company’s Form 10 filed with the commission on April 30, 2010 and incorporated herein by reference). | |
| 10.7 | Form of Warrant, dated January 22, 2008 (filed as Exhibit 10.7 to the Company’s Form 10 filed with the commission on April 30, 2010 and incorporated herein by reference). | |
| 10.8 | Management Incentive Co-Investment Plan of Global Power Equipment Group Inc., dated as of December 4, 2007 (filed as Exhibit 10.8 to the Company’s Form 10 filed with the commission on April 30, 2010 and incorporated herein by reference). * | |
| 10.9 | Global Power Equipment Group Inc. 2008 Management Incentive Plan (filed as Exhibit 10.9 to the Company’s Form 10 filed with the commission on April 30, 2010 and incorporated herein by reference). * | |
| 10.10 | Global Power Equipment Group Inc. Incentive Compensation Plan (filed as Exhibit 10.10 to the Company’s Form 10 filed with the commission on April 30, 2010 and incorporated herein by reference). * | |
| 10.11 | Form of Restricted Stock Award Agreement (filed as Exhibit 10.11 to the Company’s Form 10 filed with the commission on April 30, 2010 and incorporated herein by reference). * | |
| 10.12 | Form of 2008 Restricted Stock Unit Award Agreement (filed as Exhibit 10.12 to the Company’s Form 10 filed with the commission on April 30, 2010 and incorporated herein by reference). * | |
43
Table of Contents
| Exhibit |
Description | |
| 10.13 | Form of 2009 Restricted Stock Unit Award Agreement (filed as Exhibit 10.13 to the Company’s Form 10 filed with the commission on April 30, 2010 and incorporated herein by reference). * | |
| 10.14 | Global Power Equipment Group Inc. 2008 Director’s Equity Incentive Plan (filed as Exhibit 10.14 to the Company’s Form 10 filed with the commission on April 30, 2010 and incorporated herein by reference). * | |
| 10.15 | Employment Agreement, dated as of September 11, 2009, by and between Global Power Equipment Group Inc. and David L. Keller (filed as Exhibit 10.15 to the Company’s Form 10 filed with the commission on April 30, 2010 and incorporated herein by reference). * | |
| 10.16 | Amended and Restated Employment Agreement, dated as of November 21, 2006, by and between Global Power Equipment Group Inc. and John M. Matheson (filed as Exhibit 10.16 to the Company’s Form 10 filed with the commission on April 30, 2010 and incorporated herein by reference). * | |
| 10.17 | Separation Agreement, dated as of September 11, 2009, by and between Global Power Equipment Group Inc. and John M. Matheson (filed as Exhibit 10.17 to the Company’s Form 10 filed with the commission on April 30, 2010 and incorporated herein by reference). * | |
| 10.18 | Amended and Restated Employment Agreement, dated as of January 28, 2008, by and between Global Power Equipment Group Inc. and David L. Willis (filed as Exhibit 10.18 to the Company’s Form 10 filed with the commission on April 30, 2010 and incorporated herein by reference). * | |
| 10.19 | Amended and Restated Employment Agreement, dated as of September 1, 2008, by and between Global Power Equipment Group Inc. and Dean J. Glover (filed as Exhibit 10.19 to the Company’s Form 10 filed with the commission on April 30, 2010 and incorporated herein by reference). * | |
| 10.20 | Amended and Restated Employment Agreement, dated as of October 1, 2007, by and among Global Power Equipment Group Inc., Williams Industrial Services Group, L.L.C. and Kenneth W. Robuck (filed as Exhibit 10.20 to the Company’s Form 10 filed with the commission on April 30, 2010 and incorporated herein by reference). * | |
| 10.21 | Employment Agreement, dated as of November 21, 2006, by and among Global Power Equipment Group Inc., Braden Manufacturing, L.L.C. and Gene F. Schockemoehl (filed as Exhibit 10.21 to the Company’s Form 10 filed with the commission on April 30, 2010 and incorporated herein by reference). * | |
| 10.22 | Employment Agreement, dated as of March 22, 2010, by and between Global Power Equipment Group Inc. and Tracy D. Pagliara (filed as Exhibit 10.22 to the Company’s Amendment No. 2 to Form 10 filed with the commission on July 20, 2010 and incorporated herein by reference). * | |
| 10.23 | Amendment No. 4 to the Credit Agreement, effective as of June 25, 2010 (filed as Exhibit 10.23 to the Company’s Amendment No. 2 to Form 10 filed with the commission on July 20, 2010 and incorporated herein by reference). | |
| 21.1 | Subsidiaries of Global Power Equipment Group Inc. | |
| 23.1 | Consent of Independent Registered Public Accounting Firm | |
| 24.1 | Powers of Attorney for our directors and certain executive officers | |
| 31.1 | Certification by the Chief Executive Officer Pursuant to Section 302 of the Sarbanes-Oxley Act of 2002. | |
| 31.2 | Certification by the Chief Financial Officer Pursuant to Section 302 of the Sarbanes-Oxley Act of 2002. | |
| 32.1 | Certification by the Chief Executive Officer Pursuant to Section 906 of the Sarbanes-Oxley Act of 2002. | |
| 32.2 | Certification by the Chief Financial Officer Pursuant to Section 906 of the Sarbanes-Oxley Act of 2002. | |
| * | Indicates a management contract or compensatory plan or arrangement. |
| + | The Company has requested and received confidential treatment of certain information contained in this exhibit under 17 C.F.R. § 200.80 (b)(4) and § 240.24b-2. |
44
Table of Contents
Pursuant to the requirements of Section 12 of the Securities Exchange Act of 1934, the registrant has duly caused this Form to be signed on its behalf by the undersigned, thereunto duly authorized.
Dated: March 22, 2011
| GLOBAL POWER EQUIPMENT GROUP INC. | ||
| By: | /S/ DAVID L. KELLER | |
| David L. Keller, President | ||
| and Chief Executive Officer | ||
Pursuant to the requirements of the Securities Exchange Act of 1934, this report has been signed below by the following persons on behalf of the registrant and in the capacities and on the dates indicated.
| NAME |
TITLE |
DATE | ||||
| /s/ David L. Keller David L. Keller |
Chief Executive Officer, President and Director (principal executive officer) |
March 22, 2011 | ||||
| /s/ David L. Willis David L. Willis |
Chief Financial Officer and Senior Vice President (principal financial officer and principal accounting officer) |
March 22, 2011 | ||||
| /s/ Carl Bartoli Carl Bartoli |
Director | March 22, 2011 | ||||
| /s/ Terence Cryan Terence Cryan |
Director | March 22, 2011 | ||||
| /s/ Eugene I. Davis Eugene I. Davis |
Director | March 22, 2011 | ||||
| /s/ Charles Macaluso Charles Macaluso |
Director and Chairman of the Board | March 22, 2011 | ||||
| /s/ Frank E. Williams, Jr. Frank E. Williams, Jr. |
Director | March 22, 2011 | ||||
45
Table of Contents
Global Power Equipment Group Inc.
and Subsidiaries
Contents
F - 1
Table of Contents
Report of Independent Registered Public Accounting Firm
Board of Directors and Stockholders
Global Power Equipment Group Inc.
Tulsa, Oklahoma
We have audited the accompanying consolidated balance sheets of Global Power Equipment Group Inc. as of December 31, 2010 and 2009 and the related consolidated statements of operations, stockholders’ equity, and cash flows for each of the three years in the period ended December 31, 2010. In connection with our audits of the financial statements, we have also audited the financial statement schedule listed in the accompanying index. These financial statements and schedule are the responsibility of the Company’s management. Our responsibility is to express an opinion on these financial statements and schedule based on our audits.
We conducted our audits in accordance with the standards of the Public Company Accounting Oversight Board (United States). Those standards require that we plan and perform the audit to obtain reasonable assurance about whether the financial statements are free of material misstatement. The Company is not required to have, nor were we engaged to perform, an audit of its internal control over financial reporting. Our audits included consideration of internal control over financial reporting as a basis for designing audit procedures that are appropriate in the circumstances, but not for the purpose of expressing an opinion on the effectiveness of the Company’s internal control over financial reporting. Accordingly, we express no such opinion. An audit also includes examining, on a test basis, evidence supporting the amounts and disclosures in the financial statements, assessing the accounting principles used and significant estimates made by management, as well as evaluating the overall presentation of the financial statements and schedule. We believe that our audits provide a reasonable basis for our opinion.
In our opinion, the consolidated financial statements referred to above present fairly, in all material respects, the financial position of Global Power Equipment Group Inc. at December 31, 2010 and 2009, and the results of its operations and its cash flows for each of the three years in the period ended December 31, 2010, in conformity with accounting principles generally accepted in the United States of America.
Also, in our opinion, the financial statement schedule, when considered in relation to the basic consolidated financial statements taken as a whole, presents fairly, in all material respects, the information set forth therein.
| /s/ BDO USA, LLP |
|
|
| BDO USA, LLP |
Dallas, Texas
March 22, 2011
F - 2
Table of Contents
GLOBAL POWER EQUIPMENT GROUP INC. AND SUBSIDIARIES
CONSOLIDATED BALANCE SHEETS
(in thousands, except share and per share amounts)
| December 31, | ||||||||
| 2010 | 2009 | |||||||
| ASSETS |
||||||||
| Current assets: |
||||||||
| Cash and cash equivalents |
$ | 55,474 | $ | 103,220 | ||||
| Restricted cash |
1,019 | 2,018 | ||||||
| Accounts receivable, net of allowance of $2,508 and $1,588 |
58,892 | 62,267 | ||||||
| Inventories |
5,077 | 4,659 | ||||||
| Costs and estimated earnings in excess of billings |
33,076 | 29,470 | ||||||
| Other current assets |
4,901 | 10,169 | ||||||
| Total current assets |
158,439 | 211,803 | ||||||
| Property, plant and equipment, net |
12,234 | 12,945 | ||||||
| Goodwill |
80,400 | 80,400 | ||||||
| Intangible assets, net |
12,989 | 14,749 | ||||||
| Other assets |
1,663 | 6,114 | ||||||
| Total assets |
$ | 265,725 | $ | 326,011 | ||||
| LIABILITIES AND STOCKHOLDERS’ EQUITY |
||||||||
| Current liabilities: |
||||||||
| Current maturities of long-term debt |
$ | — | $ | 40,692 | ||||
| Accounts payable |
16,351 | 28,913 | ||||||
| Accrued compensation and benefits |
20,977 | 19,498 | ||||||
| Billings in excess of costs and estimated earnings |
11,335 | 31,148 | ||||||
| Accrued warranties |
6,049 | 10,981 | ||||||
| Deferred revenue |
— | 3,006 | ||||||
| Other current liabilities |
9,843 | 11,363 | ||||||
| Total current liabilities |
64,555 | 145,601 | ||||||
| Deferred tax liability |
17,748 | 14,768 | ||||||
| Other long-term liabilities |
4,159 | 3,990 | ||||||
| Long-term debt, net of current maturities |
— | 24,633 | ||||||
| Liabilities subject to compromise |
207 | 541 | ||||||
| Total liabilities |
86,669 | 189,533 | ||||||
| Commitments and contingencies (Note 10) |
||||||||
| Stockholders’ equity: [1] |
||||||||
| Common stock, $0.01 par value, 170,000,000 shares authorized and 15,586,237 and 15,263,066 shares issued, respectively and 15,469,287 and 15,220,726 shares outstanding, respectively |
1,403 | 1,374 | ||||||
| Paid-in capital |
64,653 | 61,459 | ||||||
| Accumulated other comprehensive income |
1,382 | 2,655 | ||||||
| Retained earnings |
111,629 | 70,994 | ||||||
| Treasury stock, at cost (116,950 and 42,340 common shares, respectively) |
(11 | ) | (4 | ) | ||||
| Total stockholders’ equity |
179,056 | 136,478 | ||||||
| Total liabilities and stockholders’ equity |
$ | 265,725 | $ | 326,011 | ||||
| [1] | All share numbers reflect the Company’s June 30, 2010, 1-for-9 reverse stock split. |
The accompanying notes are an integral part of these consolidated financial statements.
F - 3
Table of Contents
GLOBAL POWER EQUIPMENT GROUP INC. AND SUBSIDIARIES
STATEMENTS OF OPERATIONS
(in thousands, except share and per share amounts)
| For the Years Ended December 31, | ||||||||||||
| 2010 | 2009 | 2008 | ||||||||||
| Product revenues |
$ | 142,683 | $ | 193,150 | $ | 311,603 | ||||||
| Service revenues |
377,461 | 347,460 | 245,161 | |||||||||
| Total revenues |
520,144 | 540,610 | 556,764 | |||||||||
| Cost of product revenues |
98,757 | 150,137 | 239,447 | |||||||||
| Cost of service revenues |
318,866 | 310,048 | 217,337 | |||||||||
| Cost of revenues |
417,623 | 460,185 | 456,784 | |||||||||
| Gross profit |
102,521 | 80,425 | 99,980 | |||||||||
| Selling and administrative expenses |
52,872 | 46,664 | 50,418 | |||||||||
| Operating income |
49,649 | 33,761 | 49,562 | |||||||||
| Interest expense |
7,052 | 9,667 | 11,667 | |||||||||
| Income from continuing operations before reorganization items and income taxes |
42,597 | 24,094 | 37,895 | |||||||||
| Reorganization items |
(1,477 | ) | 1,030 | 23,574 | ||||||||
| Income from continuing operations before income taxes |
44,074 | 23,064 | 14,321 | |||||||||
| Income tax expense |
6,410 | 5,282 | 3,151 | |||||||||
| Income from continuing operations |
37,664 | 17,782 | 11,170 | |||||||||
| Discontinued operations: |
||||||||||||
| Income from discontinued operations, net of tax |
2,971 | 7,369 | 23,668 | |||||||||
| Gain on disposal, net of tax |
— | 2,736 | — | |||||||||
| Income from discontinued operations |
2,971 | 10,105 | 23,668 | |||||||||
| Net income |
$ | 40,635 | $ | 27,887 | $ | 34,838 | ||||||
| Basic earnings per weighted average common share: [1] |
||||||||||||
| Income from continuing operations |
$ | 2.47 | $ | 1.19 | $ | 0.78 | ||||||
| Income from discontinued operations |
0.19 | 0.67 | 1.66 | |||||||||
| Income per common share - basic |
$ | 2.66 | $ | 1.86 | $ | 2.44 | ||||||
| Weighted average number of shares of common stock outstanding - basic |
15,253,579 | 14,971,921 | 14,267,375 | |||||||||
| Diluted earnings per weighted average common share: |
||||||||||||
| Income from continuing operations |
$ | 2.31 | $ | 1.14 | $ | 0.77 | ||||||
| Income from discontinued operations |
0.18 | 0.65 | 1.62 | |||||||||
| Income per common share - diluted |
$ | 2.49 | $ | 1.79 | $ | 2.39 | ||||||
| Weighted average number of shares of common stock outstanding - diluted |
16,321,203 | 15,591,440 | 14,592,637 | |||||||||
| [1] | All share numbers reflect the Company’s June 30, 2010, 1-for-9 reverse stock split. |
The accompanying notes are an integral part of these consolidated financial statements.
F - 4
Table of Contents
GLOBAL POWER EQUIPMENT GROUP INC. AND SUBSIDIARIES
STATEMENTS OF STOCKHOLDERS’ EQUITY
|
Common Shares [1] |
Paid-in Capital (Deficit) |
Accumulated Other Comprehensive Income |
Retained Earnings |
Treasury Shares | Total | |||||||||||||||||||||||||||
| Shares | Amount | Shares | Amount | |||||||||||||||||||||||||||||
| Balance, December 31, 2007 |
5,261,552 | $ | 474 | $ | (14,209 | ) | $ | 5,261 | $ | 8,269 | — | $ | — | $ | (205 | ) | ||||||||||||||||
| (Debtor-in-Possession) |
||||||||||||||||||||||||||||||||
| Cancellation of common stock |
(5,261,552 | ) | (474 | ) | — | — | — | — | — | (474 | ) | |||||||||||||||||||||
| Issuance of common stock (exchange shares and rights offering) |
14,856,023 | 1,338 | 67,854 | — | — | — | — | 69,192 | ||||||||||||||||||||||||
| Issuance of warrants |
— | — | 4,639 | — | — | — | — | 4,639 | ||||||||||||||||||||||||
| Stock-based compensation |
98,038 | 8 | 1,408 | — | — | — | — | 1,416 | ||||||||||||||||||||||||
| Other comprehensive income (loss), net of tax |
||||||||||||||||||||||||||||||||
| Net income |
— | — | — | — | 34,838 | — | — | 34,838 | ||||||||||||||||||||||||
| Fair value of interest rate swap |
— | — | — | (810 | ) | — | — | — | (810 | ) | ||||||||||||||||||||||
| Foreign currency translation |
— | — | — | (3,323 | ) | — | — | — | (3,323 | ) | ||||||||||||||||||||||
| Comprehensive income: |
30,705 | |||||||||||||||||||||||||||||||
| Balance, December 31, 2008 |
14,954,061 | 1,346 | 59,692 | 1,128 | 43,107 | — | — | 105,273 | ||||||||||||||||||||||||
| Restricted stock awards |
60,866 | 5 | 107 | — | — | — | — | 112 | ||||||||||||||||||||||||
| Stock-based compensation |
182,448 | 17 | 1,662 | — | — | — | — | 1,679 | ||||||||||||||||||||||||
| Warrants exercised |
65,691 | 6 | 515 | — | — | — | — | 521 | ||||||||||||||||||||||||
| Warrants withheld |
— | — | (517 | ) | — | — | (41,913 | ) | (4 | ) | (521 | ) | ||||||||||||||||||||
| Forfeiture of restricted shares |
— | — | — | — | — | (427 | ) | — | — | |||||||||||||||||||||||
| Other comprehensive income, net of tax |
||||||||||||||||||||||||||||||||
| Net income |
— | — | — | — | 27,887 | — | — | 27,887 | ||||||||||||||||||||||||
| Fair value of interest rate swap |
— | — | — | 625 | — | — | — | 625 | ||||||||||||||||||||||||
| Foreign currency translation |
— | — | — | 902 | — | — | — | 902 | ||||||||||||||||||||||||
| Comprehensive income: |
29,414 | |||||||||||||||||||||||||||||||
| Balance, December 31, 2009 |
15,263,066 | 1,374 | 61,459 | 2,655 | 70,994 | (42,340 | ) | (4 | ) | 136,478 | ||||||||||||||||||||||
| Restricted stock awards |
17,361 | 2 | 141 | — | — | — | — | 143 | ||||||||||||||||||||||||
| Stock-based compensation |
248,075 | 22 | 3,681 | — | — | — | — | 3,703 | ||||||||||||||||||||||||
| Stock-based compensation - withheld |
— | — | (617 | ) | — | — | (42,408 | ) | (4 | ) | (621 | ) | ||||||||||||||||||||
| Warrants exercised |
58,373 | 5 | 457 | — | — | — | — | 462 | ||||||||||||||||||||||||
| Warrants withheld |
— | — | (459 | ) | — | — | (30,066 | ) | (3 | ) | (462 | ) | ||||||||||||||||||||
| Forfeiture of restricted shares |
— | — | — | — | — | (2,136 | ) | — | — | |||||||||||||||||||||||
| Fractional shares resulting from reverse stock split |
(638 | ) | — | (9 | ) | — | — | — | — | (9 | ) | |||||||||||||||||||||
| Other comprehensive income (loss), net of tax |
||||||||||||||||||||||||||||||||
| Net income |
— | — | — | — | 40,635 | — | — | 40,635 | ||||||||||||||||||||||||
| Fair value of interest rate swap |
— | — | — | 185 | — | — | — | 185 | ||||||||||||||||||||||||
| Foreign currency translation |
— | — | — | (1,458 | ) | — | — | — | (1,458 | ) | ||||||||||||||||||||||
| Comprehensive income: |
39,362 | |||||||||||||||||||||||||||||||
| Balance, December 31, 2010 |
15,586,237 | $ | 1,403 | $ | 64,653 | $ | 1,382 | $ | 111,629 | (116,950 | ) | $ | (11 | ) | $ | 179,056 | ||||||||||||||||
| [1] | All share numbers reflect the Company’s June 30, 2010, 1-for-9 reverse stock split. |
The accompanying notes are an integral part of these consolidated financial statements.
F - 5
Table of Contents
GLOBAL POWER EQUIPMENT GROUP INC. AND SUBSIDIARIES
CONSOLIDATED STATEMENTS OF CASH FLOWS
(in thousands)
| For the Years Ended December 31, | ||||||||||||
| 2010 | 2009 | 2008 | ||||||||||
| Operating activities: |
||||||||||||
| Net income |
$ | 40,635 | $ | 27,887 | $ | 34,838 | ||||||
| Adjustments to reconcile net income to net cash provided by (used in) operating activities: |
||||||||||||
| Deferred income tax provision |
2,518 | 3,803 | 1,054 | |||||||||
| Depreciation and amortization |
7,240 | 5,396 | 5,323 | |||||||||
| Gain (loss) on disposal of equipment |
39 | (26 | ) | — | ||||||||
| Gain on disposal of discontinued operations |
— | (2,736 | ) | — | ||||||||
| Stock-based compensation |
3,846 | 1,791 | 1,416 | |||||||||
| Changes in operating assets and liabilities: |
||||||||||||
| Receivables |
3,375 | (6,314 | ) | (17,437 | ) | |||||||
| Inventories |
(418 | ) | 304 | 800 | ||||||||
| Cost and estimated earnings in excess of billings |
(3,606 | ) | 16,593 | 10,735 | ||||||||
| Other current assets |
5,730 | (5,720 | ) | 3,815 | ||||||||
| Other assets |
1,271 | (569 | ) | (72 | ) | |||||||
| Accounts payable |
(12,562 | ) | 16,576 | (9,461 | ) | |||||||
| Accrued and other liabilities |
(5,240 | ) | 5,144 | (3,699 | ) | |||||||
| Billings in excess of cost and estimated earnings |
(19,813 | ) | 7,011 | (3,727 | ) | |||||||
| Deferred revenue |
(3,006 | ) | (5,689 | ) | (21,226 | ) | ||||||
| Liabilities subject to compromise |
(334 | ) | (63 | ) | (121,831 | ) | ||||||
| Net cash provided by (used in) operating activities |
19,675 | 63,388 | (119,472 | ) | ||||||||
| Investing activities: |
||||||||||||
| Net transfers of restricted cash |
999 | 995 | (9 | ) | ||||||||
| Proceeds from sale of equipment |
— | 50 | 9 | |||||||||
| Purchase of property, plant, and equipment |
(1,680 | ) | (2,793 | ) | (3,599 | ) | ||||||
| Proceeds from sale of business, net of cash sold |
— | 2,747 | — | |||||||||
| Other investing activities |
— | — | 202 | |||||||||
| Net cash used in investing activities |
(681 | ) | 999 | (3,397 | ) | |||||||
| Financing activities: |
||||||||||||
| Payments of long-term debt |
(65,325 | ) | (44,675 | ) | (25,000 | ) | ||||||
| Proceeds from issuance of debt |
— | 25,000 | 90,000 | |||||||||
| Purchase of fractional common shares |
(9 | ) | — | — | ||||||||
| Proceeds from issuance of common stock |
— | — | 72,500 | |||||||||
| Payments of debt financing costs |
— | (65 | ) | (6,623 | ) | |||||||
| Net cash (used in) provided by financing activities |
(65,334 | ) | (19,740 | ) | 130,877 | |||||||
| Effect of exchange rate changes on cash |
(1,406 | ) | 940 | (2,051 | ) | |||||||
| Net change in cash and cash equivalents |
(47,746 | ) | 45,587 | 5,957 | ||||||||
| Cash and cash equivalents, beginning of year |
103,220 | 57,633 | 51,676 | |||||||||
| Cash and cash equivalents, end of year |
$ | 55,474 | $ | 103,220 | $ | 57,633 | ||||||
The accompanying notes are an integral part of these consolidated financial statements.
F - 6
Table of Contents
GLOBAL POWER EQUIPMENT GROUP INC. AND SUBSIDIARIES
NOTES TO THE CONSOLIDATED FINANCIAL STATEMENTS
NOTE 1 – BUSINESS AND ORGANIZATION
Global Power Equipment Group Inc. and its wholly owned subsidiaries (the “Company”, “we”, “us” or “our”) designs, engineers and manufactures heat recovery and auxiliary power equipment and provides routine and specialty maintenance services to customers in the utility and industrial sectors. The Company’s corporate headquarters are located in Tulsa, Oklahoma, with facilities in Plymouth, Minnesota; Tulsa, Oklahoma; Auburn, Massachusetts; Atlanta, Georgia; Monterrey, Mexico; Shanghai, China; and Heerlen, The Netherlands.
On September 28, 2006, Global Power Equipment Group Inc. and all of its U.S. subsidiaries filed voluntary Chapter 11 petitions under the Bankruptcy Code in the United States Bankruptcy Court for the District of Delaware (“Bankruptcy Court”). The Company successfully exited Chapter 11 on January 22, 2008 pursuant to an approved Plan of Reorganization (“Plan of Reorganization” or “Plan”).
On June 30, 2010, the Company filed an amendment to its Second Amended and Restated Certificate of Incorporation to implement a 1-for-9 reverse stock split of all outstanding shares of its common stock. The reverse stock split was authorized by the stockholders at the Annual Meeting of Stockholders on April 22, 2010, and was implemented by the Board of Directors in accordance with that authority. Upon the implementation of the reverse stock split, all of the Company’s common stock outstanding on June 30, 2010 was converted, automatically and without action by any holder of those shares, into one-ninth of the number of those shares outstanding immediately before the reverse stock split (adjusted downward to avoid fractional shares). All of the share and per share numbers in these consolidated financial statements retroactively reflect the effect of the reverse stock split for all periods presented.
NOTE 2 – SUMMARY OF SIGNIFICANT ACCOUNTING POLICIES
Principles of Consolidation: The accompanying consolidated financial statements include the accounts of Global Power Equipment Group Inc. and its wholly owned subsidiaries. All intercompany accounts and transactions have been eliminated in consolidation.
Revenue Recognition: The Company is organized in two major segments: the Products Division and the Services Division. Within these segments, the Company has three primary revenue streams, Heat Recovery Equipment (comprised of the Specialty Boiler and Heat Recovery Steam Generator (“HRSG”) product lines), Auxiliary Power Equipment (comprised of the Gas Turbine-related equipment and SCR & CO Catalyst Systems (“SCR”) product lines) and Industrial Services.
Revenues and cost of revenues for the Heat Recovery Equipment product line in the Products Division are recognized on the percentage-of-completion method based on the percentage of actual hours incurred to date in relation to total estimated hours for each contract. This method is used because management considers expended labor hours to be the best available measure of progress on these contracts. Revenues and cost of revenues for the SCR product line in the Products Division and the fixed-price contracts in the Services Division are recognized on the percentage-of-completion method based on the percentage of actual costs incurred to date in relation to total estimated cost for each contract. The Company expenses pre-contract costs as incurred. Costs related to change orders are recognized when they are incurred. Change orders are included in total estimated contract revenues when they can be reliably estimated and it is probable that the adjustment will be approved by the customer or realized.
The percentage-of-completion method generally results in the recognition of reasonably consistent profit margins over the life of a contract since management has the ability to produce reasonably dependable estimates of contract billings and contract costs. The Company uses the level of profit margin that is most likely to occur on a contract. If the most likely profit margin cannot be precisely determined, the lowest probable level of profit in the range of estimates is used until the results can be estimated more precisely. The Company’s estimate of the total hours or total contract costs to be incurred at any particular time has a significant impact on the revenue recognized for the respective period. The percentage-of-completion method is only allowed under certain circumstances in which the revenue process is long-term in nature (often in excess of one year), the products, or services, sold are highly customized and a process is in place whereby revenues, costs and margins can be reasonably estimated. Changes in job performance, job conditions, estimated profitability, final contract settlements and resolution of claims may result in revisions to costs and income, and the effects of such revisions are recognized in the period that the revisions are determined. Estimated losses on uncompleted contracts are recognized in the period in which they first become apparent. Under percentage-of-completion accounting, management must also make key judgments in areas such as the percentage-of-completion, estimates of project revenues, costs and margin, estimates of total and remaining project hours and liquidated damages assessments. Any deviations from estimates could have a significant positive or negative impact on the Company’s results of operations.
F - 7
Table of Contents
Revenues for the Auxiliary Power Equipment product lines, except SCR, are recognized under the completed-contract method due to the short-term nature of the production period. Generally, these contracts specify separate phases of work which are frequently contracted separately. Under this method, no revenue can be recognized until the contract phase is substantially complete, at which time revenue is recognized and costs previously deferred are charged to expense. Also, for revenue to be recognized, the customer assumes risk of loss and title, and the installation is operating according to specifications or has been accepted by the customer. As with the Heat Recovery Equipment and SCR product lines, changes in job performance, job conditions, estimated profitability, final contract settlements and resolution of claims may result in revisions to job costs and income amounts that are different than amounts originally estimated.
Revenues for the Industrial Services business that are not recognized on the percentage-of-completion method are primarily for routine service contracts. Under these arrangements, the Company recognizes revenue when services are performed and the customer assumes risk of loss, collection of the relevant receivable is probable, persuasive evidence of an arrangement exists and the sales price is fixed or determinable. Specifically, the revenues under these contracts are recognized as the services are performed based upon an agreed-upon price for the completed services or based upon the hours incurred and agreed upon hourly rates. On cost reimbursable contracts, revenue is recognized as costs are incurred and includes applicable mark up earned through the date services are provided.
In the fourth quarter of 2006, upon approval by the Bankruptcy Court, the Company initiated a wind down of Deltak’s (a subsidiary of the Company, based in Plymouth, Minnesota) large-scale HRSG product line and Deltak entered into completion agreements with certain HRSG customers to complete executory contracts for delivery of HRSG units. Certain of the HRSG contracts under completion agreements were in a positive cash position as of the Chapter 11 filing date due to aggregate collections of billings exceeding aggregate project costs. The recognition of this excess was deferred until such time as the earnings process is considered completed through satisfaction of the performance milestones under the completion agreements thereby avoiding the liquidated damage claims. This amount is included in income from discontinued operations in the accompanying consolidated statements of operations, net of estimates of liquidated damage claims accrued for these contracts. Deferred amounts were reported in the accompanying consolidated balance sheets as deferred revenue and there was no balance at December 31, 2010. During the years ended December 31, 2010, 2009 and 2008, the Company recognized such excess as follows (in thousands):
| For the years
ended December 31, |
||||||||||||
| 2010 | 2009 | 2008 | ||||||||||
| Deferred revenue recognized |
$ | 3,014 | $ | 5,920 | $ | 22,842 | ||||||
Use of Estimates: The preparation of financial statements in conformity with accounting principles generally accepted in the United States of America requires management to make estimates and assumptions that affect the amounts reported in the financial statements and accompanying footnotes. Actual results could vary materially from those estimates.
Cash and Cash Equivalents: Cash and cash equivalents include cash on hand and on deposit with initial maturities of three months or less. The Company maintains cash in depository accounts at various FDIC insured banks and financial institutions and, at times, balances may exceed federally insured limits. The Company has never experienced any losses related to these balances. The Company’s non-interest bearing cash balances were fully insured at December 31, 2010 due to a temporary federal program in effect from December 31, 2010 through December 31, 2012. Under the program, there is no limit to the amount of insurance for eligible accounts. Beginning 2013, insurance coverage will revert to $250,000 per depositor at each financial institution, and the Company’s non-interest bearing cash balances may again exceed federally insured limits. Interest-bearing amounts on deposit in excess of federally insured limits at December 31, 2010 approximated $55 million. Although the Company maintains cash balances in interest bearing accounts in excess of the FDIC insured limits, management believes this risk is mitigated by using financial institutions that are rated investment grade according to credit rating agencies.
Accounts Receivable: Accounts receivable are reported net of allowance for doubtful accounts and discounts. The allowance is based on current market conditions, review of specific customer economics and other estimates based on the judgment of management. Account balances are charged off against the allowance after all means of collection have been exhausted and the potential for recovery is considered remote. The Company does not generally charge interest on outstanding amounts.
F - 8
Table of Contents
The Company has certain customers that represent more than 10 percent of consolidated accounts receivable. The balance for these customers as a percentage of the consolidated accounts receivable is as follows:
| December 31, | ||||||||
| Customer |
2010 | 2009 | ||||||
| Entergy Services Inc. |
25 | % | 35 | % | ||||
| Southern Company |
13 | % | 12 | % | ||||
| Siemens Energy, Inc. |
11 | % | * | |||||
| * | Less than 10% |
Inventories: Inventories consist primarily of raw materials and are stated at the lower of first-in, first-out cost or market, net of applicable reserves.
Property, Plant and Equipment: Property, plant and equipment are stated at historical cost, less accumulated depreciation. For financial reporting purposes, depreciation is calculated using the straight-line method over the estimated useful lives.
The Company’s property, plant and equipment balances, by significant asset category, are as follows (in thousands):
| Estimated Useful Lives |
December 31, | |||||||||||
| 2010 | 2009 | |||||||||||
| Land |
- | $ | 2,164 | $ | 2,129 | |||||||
| Buildings and improvements |
5-39 years | 11,762 | 11,566 | |||||||||
| Machinery and equipment |
5-12 years | 13,906 | 13,467 | |||||||||
| Furniture and fixtures |
2-10 years | 9,195 | 8,959 | |||||||||
| 37,027 | 36,121 | |||||||||||
| Less accumulated depreciation |
(24,793 | ) | (23,176 | ) | ||||||||
| Property, plant and equipment, net |
$ | 12,234 | $ | 12,945 | ||||||||
Depreciation and amortization expense was approximately $2.3 million, $2.4 million and $2.0 million for the years ended December 31, 2010, 2009 and 2008, respectively. Costs of significant additions, renewals and betterments are capitalized. When an asset is sold or otherwise disposed of, the related cost and accumulated depreciation are removed from the respective accounts and the gain or loss on disposition is reflected in the consolidated statements of operations. Depreciation expense related to capital equipment used in production is included in cost of revenues. Maintenance and repairs are charged to operations when incurred.
Goodwill: The Company has made acquisitions in the past that included the recognition of goodwill, which was determined based upon previous accounting principles. Pursuant to Financial Accounting Standards Board (“FASB”) issued Accounting Standards Codification (“ASC”) 350, Intangibles-Goodwill and Other, beginning January 1, 2009, the Company records as goodwill the excess of the consideration transferred plus the fair value of any non-controlling interest in the acquiree at the acquisition date over the fair values of the identifiable net assets acquired.
Goodwill is not amortized, but instead tested for impairment at the reporting unit level on an annual basis or if an event occurs or circumstances change in a way to indicate that there has been a potential decline in the fair value of the reporting unit. The Company has identified its reporting units in accordance with ASC 350, Intangibles – Goodwill and Other, and ASC 280, Segment Reporting, based on how the Company makes operating decisions, assesses performance, and allocates resources and on the availability of discrete financial information.
The goodwill impairment test is a two-step test. Under the first step, the fair value of the reporting unit is compared with its carrying value (including goodwill). If the fair value of the reporting unit is less than its carrying value, an indication of goodwill impairment exists for the reporting unit and the enterprise must perform step two of the impairment test (measurement). Under step two, an impairment loss is recognized for any excess of the carrying amount of the reporting unit’s goodwill over the implied fair value of that goodwill. The implied fair value of goodwill is determined by allocating the fair value of the reporting unit in a manner similar to a purchase price allocation, in accordance with ASC 805, Business Combinations. The residual fair value after this allocation is the implied fair value of the reporting unit goodwill. Fair value of the reporting unit is determined using a discounted cash flow analysis. If the fair value of the reporting unit exceeds its carrying value, step two does not need to be performed.
F - 9
Table of Contents
The Company determines fair value for each of its reporting units, Products and Services, using a combination of income and market approaches. For purposes of the income approach, fair value is determined based on the present value of estimated future cash flows, discounted at an appropriate risk-adjusted rate. Internal forecasts are used to estimate future cash flows and include an estimate of long-term future growth rates based on management’s most recent views of the long-term outlook for the business. Actual results may differ from those assumed in our forecast. The discount rate is derived by applying the capital asset pricing model (i.e., to estimate the cost of equity financing) and analyzing published rates for industries relevant to each reporting unit. The Company uses discount rates that are commensurate with the risks and uncertainty inherent in the respective reporting unit and in its internally developed forecasts. Valuations using the market approach reflect prices and other relevant observable information generated by market transactions involving comparable businesses.
Compared to the market approach, the income approach more closely aligns the reporting unit valuation to the Company’s specific business model, geographic markets and product and service offerings, as it is based on specific projections of the business. Required rates of return, along with uncertainty inherent in the forecasts of future cash flows, are reflected in the selection of the discount rate. Equally important, under this approach, reasonably likely scenarios and associated sensitivities can be developed for alternative future circumstances that may not be reflected in an observable market price. A market approach allows for comparison to actual market transactions and multiples. It can be somewhat more limited in its application because the population of potential comparables is often limited to publicly-traded companies where the characteristics of the comparative business and ours can be significantly different. Market data is usually not available for divisions within larger conglomerates or non-public subsidiaries that could otherwise qualify as comparable, and the specific circumstances surrounding a market transaction (e.g., synergies between the parties, terms and conditions of the transaction, etc.) may be different or irrelevant with respect to our business. It can also be difficult under the current market conditions to identify orderly transactions between market participants in similar businesses. The Company assesses the valuation methodology based upon the relevance and availability of data at the time of performing the valuation and weighs the methodologies appropriately.
Changes in assumptions or estimates can materially affect the fair value measurement of a reporting unit, and therefore can affect the determination of whether an impairment exists. The following are key assumptions used in making projections:
| • | Business projections. The Company makes assumptions about the demand for its products and services in the marketplace. These assumptions drive its planning assumptions for volume, mix, and pricing. In addition, assumptions about the Company’s cost levels (e.g., capacity utilization, cost performance, etc.) are made. These projections are derived using internal business plans that are updated at least annually. |
| • | Long-term growth rate. A growth rate is used to calculate the terminal value of the reporting unit, and is added to the present value of the debt-free interim cash flows. The growth rate is the expected rate at which a reporting unit’s earnings stream is projected to grow beyond the planning period. |
| • | Discount rate. When measuring possible impairment, future cash flows are discounted at a rate that is consistent with a weighted-average cost of capital that the Company anticipates a potential market participant would use. Weighted-average cost of capital is an estimate of the overall risk-adjusted after-tax rate of return required by equity and debt holders of a business enterprise, which is developed with the assistance of external financial advisors. |
The key assumptions that changed at December 31, 2010, compared to the prior year were limited to changes in business projections which are based on management’s view of current and future market conditions. At December 31, 2010, management’s assessment of market conditions was influenced by the length and depth of the recession, which began in 2008, and its corresponding impact on demand for power generation equipment. Changes in management’s projections for the Products division were limited to timing of an expected recovery in the OEM capital expenditure markets the Company serves, and resulted in an increase in the estimated fair value which remained substantially in excess of its carrying value.
The Services division was less affected by the OEM trends due primarily to the long-term nature of their contracts and the addition of new customers and capital projects in 2010. As a result, management’s business projections for Services showed an increase in overall net income as compared to prior year projections resulting in an increase in the estimated fair value of the division over 2009.
The balance for goodwill as of December 31, 2010 and 2009 are as follows (in thousands):
| Products Division |
Services Division |
Total | ||||||||||
| Goodwill |
$ | 44,488 | $ | 35,912 | $ | 80,400 | ||||||
During 2010, 2009 and 2008, the Company performed its annual impairment review of goodwill and concluded that there was no impairment.
F - 10
Table of Contents
Deferred Financing Costs: Deferred financing costs are amortized over the terms of the related debt facilities using the effective yield method. On November 18, 2010, the Company repaid the outstanding balance of the term loan facility and all related interest in full. As a result, the amortization of debt financing costs pertaining to the term note facility was accelerated increasing the amount of interest expense by $1.8 million. Total interest expense associated with the amortization of these costs was approximately $3.1 million in 2010, $1.2 million in 2009 and $1.7 million in 2008.
Long-Lived Assets: In accordance with ASC 360-10-05, Impairment or Disposal of Long-Lived Assets, long-lived assets, such as property, plant, and equipment, and purchased intangible assets subject to amortization, are reviewed for impairment whenever events or changes in circumstances indicate that the carrying amount of an asset may not be recoverable. If circumstances require a long-lived asset be tested for possible impairment, the Company first compares undiscounted cash flows expected to be generated by an asset to the carrying value of the asset. If the carrying value of the long-lived asset is not recoverable on an undiscounted cash flow basis, impairment is recognized to the extent that the carrying value exceeds its fair value. Fair value is determined through various valuation techniques including discounted cash flow models, quoted market values and third-party independent appraisals, as considered necessary. No impairments were identified in 2010, 2009 and 2008.
Major Customers: The Company has certain customers that represent more than 10 percent of consolidated revenues. The revenue for these customers as a percentage of the consolidated revenues is as follows:
| For the Years Ended December 31, | ||||||||||||
| 2010 | 2009 | 2008 | ||||||||||
| Entergy Services Inc. |
24 | % | 11 | % | * | |||||||
| Southern Company |
23 | % | 12 | % | 10 | % | ||||||
| General Electric Company |
* | 13 | % | 20 | % | |||||||
| Tennessee Valley Authority |
* | 11 | % | * | ||||||||
| * | Less than 10% |
Customers for the Products Division include original equipment manufacturers (“OEMs”), engineering and construction firms, operators of power generation facilities and firms engaged across several process-related industries. Customers for the Services Division are varied, but do include some major utility companies within the United States. The Company’s major customers vary over time due to the relative size and duration of their projects.
Cost of Revenues: Cost of revenues for both Products and Services Divisions primarily include charges for materials, direct labor and related benefits, freight (inbound and outbound), direct supplies and tools, warehousing costs and utilities related to production facilities, purchasing and receiving costs, inspection costs, internal transfer costs, and, where appropriate, an allocation of overhead.
Warranty Costs: Estimated costs related to warranty are accrued as the related revenue is recognized and included in cost of revenues. Estimated costs are based upon past warranty claims and sales history. Warranty terms vary by contract but generally provide for a term of three years or less. The Company manages its exposure to warranty claims by having its field service and quality assurance personnel regularly monitor projects and maintain ongoing and regular communications with the customers.
Shipping and Handling Costs: The Company accounts for shipping and handling costs in accordance with ASC 605-45, Principal Agent Considerations. Amounts billed to customers in sale transactions related to shipping and handling costs are recorded as revenue. Shipping and handling costs incurred are included in cost of revenues in the consolidated statements of operations.
Advertising Costs: The Company accounts for advertising costs in accordance with ASC 720-35, Advertising Costs. Generally, advertising costs are immaterial and are expensed as incurred and included in selling and administrative expense.
Selling and Administrative expense: Selling and administrative expenses are primarily comprised of indirect labor and related benefits, legal and professional fees, indirect utilities, office rent, bad debt expense and indirect travel and related expenses.
Insurance: Certain subsidiaries of the Company are self-insured for health and workers’ compensation up to certain policy limits. Amounts charged to expense amounted to approximately $5.1 million, $5.7 million and $5.2 million in 2010, 2009 and 2008, respectively, and include insurance premiums related to the excess claim coverage and claims incurred. The reserves at December 31, 2010 and 2009 consist of estimated amounts unpaid for reported and unreported claims incurred. The Company has provided $5.0 million in letters of credit at December 31, 2010, as security for possible workers’ compensation claims.
F - 11
Table of Contents
Reorganization Items: The Company successfully exited Chapter 11 on January 22, 2008. The accompanying consolidated financial statements have been presented in conformity with the provisions of ASC 852, Reorganizations. Accordingly, all pre-petition liabilities of the debtor that are subject to compromise are segregated in the accompanying consolidated balance sheets as liabilities subject to compromise. These liabilities are recorded at amounts or claims allowed by the Bankruptcy Court. ASC 852 also requires that reorganization items (direct and incremental costs, such as professional fees incurred in Chapter 11 cases) be segregated as a separate line item in the consolidated statements of operations.
As part of the Plan of Reorganization, holders of allowed unsecured claims against Deltak are entitled to receive a pro rata share of $34.0 million in cash and various other recoveries defined in the Plan. Pursuant to the Plan, the Company transferred $34.0 million in cash to settle the Deltak liabilities. This payment exceeded the recorded amount of these claims resulting in a $14.1 million charge to operations in 2008. This amount has been included in the reorganization items as a change in estimate of liabilities subject to compromise for the year ended December 31, 2008. The Company’s reorganization items are as follows (in thousands):
| For the Years Ended December 31, | ||||||||||||
| 2010 | 2009 | 2008 | ||||||||||
| Professional fees |
$ | 1,001 | $ | 1,267 | $ | 9,448 | ||||||
| Change in estimate of liabilities subject to compromise |
(2,478 | ) [1] | (237 | ) | 14,126 | |||||||
| Total |
$ | (1,477 | ) | $ | 1,030 | $ | 23,574 | |||||
| [1] | On July 12, 2010, the U.S. Bankruptcy Court approved a settlement of certain claims against the Company and its Deltak subsidiary. As a result of that settlement and the related compromise by the Company of its own claim against the fund that had been established pursuant to the Company’s Plan of Reorganization to be distributed to holders of allowed unsecured claims against Deltak, the Company received a cash payment of $2.8 million on July 27, 2010, which was credited in operations at that time. |
Fresh Start Reporting: Upon emergence from bankruptcy protection, the Company determined that Fresh Start Reporting was not required under the provisions of ASC 852, Reorganizations, because the shareholders of the Company upon emergence were the same as the shareholders of the Company immediately before confirmation of the order pursuant to which the Company emerged from bankruptcy protection. At that time, the Company reviewed the balances of all assets (including goodwill and intangibles) and determined that the fair value of goodwill remained substantially above its carrying value. Therefore, the balance of goodwill was recoverable. This determination was confirmed during the annual testing for goodwill impairment when the fair value was calculated to be substantially above the carrying value.
Income from Discontinued Operations: The Company experienced earned income in 2010, 2009 and 2008 from discontinued operations due to the winding down of the large scale HRSG operations (see Note 2 – revenue recognition) and operations in Italy and Brazil. The following table summarizes the income and loss from discontinued operations (in thousands):
| For the Years Ended December 31, | ||||||||||||
| 2010 | 2009 | 2008 | ||||||||||
| Revenue and income from discontinued operations |
$ | 3,173 | $ | 7,369 | $ | 23,701 | ||||||
| Related tax expense |
(202 | ) | — | (33 | ) | |||||||
| Income from discontinued operations |
$ | 2,971 | $ | 7,369 | $ | 23,668 | ||||||
On October 17, 2007, the Company sold its shares of Global Power Asia, Ltd. (“GPA”) for $20 million. After all applicable transaction costs were paid, the Company recognized a gain of approximately $11.2 million on the sale. At the closing of the transaction, $5.5 million of the proceeds were placed into escrow. To the extent that the Company recovered amounts from escrow, additional gain on the sale was to be recognized. On September 30, 2009, a settlement agreement was executed outlining the release of the remaining escrow funds, an amount of $2.7 million. The Company received such funds on November 10, 2009. As a result, the Company recognized an additional gain on the sale of discontinued operations during the year ended December 31, 2009 (in thousands):
| For the Years Ended December 31, | ||||||||||||
| 2010 | 2009 | 2008 | ||||||||||
| Gain on disposal of discontinued operations |
$ | — | $ | 2,747 | $ | — | ||||||
| Related tax expense |
— | (11 | ) | — | ||||||||
| Gain on disposal of discontinued operations, net of tax |
$ | — | $ | 2,736 | $ | — | ||||||
F - 12
Table of Contents
Income Taxes: The current provision for income taxes is based on current federal and state statutory rates which are adjusted based on changes in tax laws and significant fluctuations in taxable income.
Income taxes are accounted for under the asset and liability method. Under such method, deferred tax assets and liabilities are recognized for the estimated future tax consequences attributable to differences between the financial statement carrying amounts of existing assets and liabilities and their respective tax bases. Additionally, deferred tax assets and liabilities are measured using enacted tax rates expected to be applied to taxable income in the years in which those temporary differences are expected to be recovered or settled. The effect on deferred tax assets and liabilities of a change in tax rates is recognized in income in the period that includes the enactment date. A valuation allowance must be established when management believes the realization of the benefits of deferred tax assets is not deemed to be more likely than not.
In accordance with ASC 740, Income Taxes, the Company recognizes the effect of income tax positions only if the positions are more likely than not of being sustained. Recognized income tax positions are measured at the largest amount that is greater than 50% likely of being realized. Changes in recognition or measurement are reflected in the period in which those changes in judgment occur. The Company recognizes both interest and penalties related to uncertain tax position as part of the income tax provision.
Derivative Financial Instruments: ASC 815, Derivatives and Hedging, requires companies to recognize all derivative instruments as either assets or liabilities at fair value in the statement of financial position. For derivatives designated as hedges, changes in the fair value are either offset against the change in fair value, for the risk being hedged, of the assets and liabilities through earnings, or recognized in accumulated other comprehensive income until the hedged item is recognized in earnings.
The Company uses financial instruments in the management of its foreign currency exchange exposures. These financial instruments are considered derivatives under ASC 815, but do not meet hedge accounting requirements. Therefore, the Company recognizes changes in fair values of the forward agreements through selling and administrative expenses. As of December 31, 2010, there were no forward contracts outstanding.
The following table summarizes the forward contracts at December 31, 2009 (in thousands):
| Functional Currency |
Currency Hedged (Bought or sold forward) |
Hedged Foreign Currency Exposure (In equivalent U.S. Dollars) |
Notional Amount of Forward Buy Contracts (in equivalent U.S. Dollars) |
Notional Amount of Forward Sell Contracts (in equivalent U.S. Dollars) |
||||||||||
| Euro |
U.S. Dollars | $ | 3,258 | $ | 3,258 | $ | — | |||||||
| U.S. Dollars |
Mexican Pesos | 1,542 | 1,542 | — | ||||||||||
| U.S. Dollars |
Euro | 8,175 | — | 8,175 | ||||||||||
| U.S. Dollars |
South Korean Won | 3,188 | — | 3,188 | ||||||||||
| Total | $ | 16,163 | $ | 4,800 | $ | 11,363 | ||||||||
The notional amount provides one measure of the transaction volume outstanding as of the balance sheet date. Amounts ultimately realized upon final settlement of these financial instruments, along with the gains and losses on the underlying exposures within forward contracts, will depend on actual market exchange rates during the remaining life of the instruments.
In March 2008, the Company entered into an interest rate swap agreement to convert $60 million of the Credit Facility variable interest payments to a fixed rate of 2.97% which terminated in March 2010. The interest rate swap agreement constitutes a cash flow hedge and satisfies the criteria for hedge accounting prescribed by ASC 815. The Company determined that the effectiveness of the hedge would be assessed periodically by comparing the terms of the swap and the loan to assure they continue to coincide and to evaluate the counterparty’s ability to honor its obligations under the swap agreements. On October 1, 2009, the Company exercised its option to change the basis for the variable interest rate used on the Credit Facility on $21.3 million to the prime rate plus a margin. The remaining $45.3 million was based upon LIBOR plus a margin. This caused a portion of the swap to become ineffective.
F - 13
Table of Contents
The following tables show the impact of derivatives on the Company’s consolidated balance sheets (in thousands):
| As of |
December 31, 2010 | December 31, 2009 | ||||||||||
| Balance Sheet Location |
Fair Value | Balance Sheet Location |
Fair Value | |||||||||
| Foreign exchange contracts |
Other current liabilities |
$ | — | Other current liabilities |
$ | 570 | ||||||
| Interest rate contracts |
Other current liabilities |
— | Other current liabilities |
408 | ||||||||
| Loss on interest rate contract derivative (effective portion), net of tax |
Other comprehensive income |
— | Other comprehensive income |
185 | ||||||||
The following tables show the impact of derivatives not designated as hedging instruments on the Company’s consolidated statements of operations (in thousands):
| Derivatives Not Designated as Hedging Instruments under ASC |
Location of Gain (Loss) Recognized on Derivatives |
Amount of Gain (Loss) Recognized on Derivatives for the Years Ended December 31, |
||||||||||||||
| 2010 | 2009 | 2008 | ||||||||||||||
| Foreign exchange contracts |
|
Selling and administrative expenses |
|
$ | 570 | $ | (570 | ) | $ | — | ||||||
| Total |
$ | 570 | $ | (570 | ) | $ | — | |||||||||
The following tables show the impact of derivatives designated as hedging instruments on the Company’s consolidated statements of operations (in thousands):
| Derivatives Designated as Hedging Instruments under ASC 815-10 |
Location of Loss Recognized on Derivatives |
Amount of Loss Recognized on Derivatives for the Years Ended December 31, |
||||||||||||||
| 2010 | 2009 | 2008 | ||||||||||||||
| Interest rate contracts |
|
Selling and administrative expenses |
|
$ | — | $ | (99 | ) | $ | — | ||||||
| Total |
$ | — | $ | (99 | ) | $ | — | |||||||||
Fair Value of Financial Instruments: In September 2006, the FASB issued ASC 820, Fair Value Measurements and Disclosures. ASC 820-10 defines fair value, establishes a framework for measuring fair value in accordance with accounting principles generally accepted in the United States of America, and expands disclosures about fair value measurements. The Company adopted certain of the provisions of ASC 820 on January 1, 2008. Although the adoption of ASC 820 did not materially impact its financial condition, results of operations, or cash flow, the Company is now required to provide additional disclosures as part of its financial statements. ASC 820 establishes a three-tier fair value hierarchy, which categorizes the inputs used in measuring fair value. The hierarchy gives the highest priority to unadjusted quoted prices in the active markets for identical assets and liabilities and the lowest priority to unobservable inputs.
At December 31, 2010, the Company did not hold any financial instruments requiring fair value measurements to be performed.
F - 14
Table of Contents
The following table shows assets and liabilities measured at fair value as of December 31, 2009 on the Company’s consolidated balance sheet, and the input categories associated with those assets and liabilities (in thousands):
| Fair Value Measurements at Reporting Date Using | ||||||||||||||||
| Description |
Total Fair Value Assets (Liabilities) at 12/31/09 |
Quoted Prices in Active Markets for Identical Assets (Level 1) |
Significant Other Observable Inputs (Level 2) |
Significant Unobservable Inputs (Level 3) |
||||||||||||
| Foreign exchange contracts |
$ | (570 | ) | $ | — | $ | (570 | ) | $ | — | ||||||
| Interest rate contracts |
(408 | ) | — | (408 | ) | — | ||||||||||
| Total |
$ | (978 | ) | $ | — | $ | (978 | ) | $ | — | ||||||
The fair value of the foreign exchange contracts is calculated using the foreign exchange rate at the end of the period and the notional amounts as determined in the forward contract. The Company uses the calculated fair values to adjust the asset or liability as appropriate.
The fair value of interest rate swaps is calculated using proprietary models utilizing observable inputs as well as future assumptions related to interest rates and other applicable variables. These calculations are performed by the financial institutions which are counterparties to the applicable swap agreements and reported to the Company on a monthly basis. The Company uses these reported fair values to adjust the asset or liability as appropriate.
The Company’s financial instruments at December 31, 2010 and 2009 consist primarily of cash and cash equivalents, receivables, payables and debt instruments. The carrying values of these financial instruments approximate their respective fair values as they are either short-term in nature or carry interest rates which are periodically adjusted to market rates.
ASC 820 requires that companies provide a reconciliation of the beginning and ending balances for Level 3 assets and liabilities measured at fair value. Since the Company has no Level 3 assets or liabilities, no reconciliation is necessary.
Foreign Currency: Assets and liabilities of the Company’s foreign operations are translated at year-end exchange rates, and revenues and expenses are translated at average exchange rates prevailing during the period. Translation adjustments are recorded as a separate component of stockholders’ equity and other comprehensive income on the accompanying consolidated financial statements. Gains and losses from foreign currency transactions are included in operations.
Reclassifications: Certain 2009 amounts have been reclassified to conform to the 2010 presentations. The originally reported amounts for the consolidated balance sheet as of December 31, 2009 are summarized in the following table (in thousands):
| As Originally Reported |
Adjustments | As Adjusted | ||||||||||
| Costs and estimated earnings in excess of billings |
$ | 31,518 | $ | (2,048) | $ | 29,470 | ||||||
| Other current assets |
11,330 | (1,161 | ) | 10,169 | ||||||||
| Billings in excess of costs and estimated earnings |
(34,357 | ) | 3,209 | (31,148 | ) | |||||||
| Net |
$ | — | ||||||||||
Adoption of New Accounting Standards:
In December 2009, the FASB issued Accounting Standards Update (“ASU”) 2009-17, Consolidations (ASC 810) Improvements to Financial Reporting by Enterprises Involved with Variable Interest Entities (“ASU 2009 - 17”), which is effective for annual periods beginning after November 15, 2009. ASU 2009-17 requires Company management to consider a variable entity’s purpose and design and the Company’s ability to direct the activities of the variable interest entity that most significantly impact such entity’s economic performance when determining whether such entity should be consolidated. The Company adopted the provisions of ASU 2009-17 as required on January 1, 2010. The provisions had no impact on the Company’s consolidated financial position or results of operations upon adoption.
In January 2010, the FASB issued ASU 2010-06, Fair Value Measurements and Disclosures: Improving Disclosures about Fair Value Measurements, which amends ASC 820, Fair Value Measurements and Disclosures (“ASU 2010-06”) to add new requirements for disclosures about transfers into and out of Levels 1 and 2 and separate disclosures about purchases, sales, issuances, and settlements relating to Level 3 measurements. ASU 2010-06 also clarifies existing fair value disclosures about the level of disaggregation and about inputs and valuation techniques used to measure fair value. The Company adopted the provisions of ASU 2010-06 as required on January 1, 2010. See Note 2 for required disclosure.
In March 2010, the FASB issued ASU No. 2010-11, Derivatives and Hedging Scope Exception Related to Embedded Credit Derivatives (codified within ASC 815 - Derivatives and Hedging). ASU 2010-11 improves disclosures originally required
F - 15
Table of Contents
under Statement of Financial Accounting Standards No. 161, Disclosures about Derivative Instruments and Hedging Activities. ASU 2010-11 is effective for interim and annual periods beginning after June 15, 2010. The Company adopted the provisions of ASU 2010-11 on July 1, 2010, as required. The provisions had no impact on the Company’s consolidated financial position or results of operations upon adoption.
In April 2010, the FASB issued ASU No. 2010-17, Milestone Method of Revenue Recognition, which provides guidance on applying the milestone method to milestone payments for achieving specified performance measures when those payments are related to uncertain future events. However, the FASB clarified that, even if the requirements in this ASU are met, entities would not be precluded from making an accounting policy election to apply another appropriate accounting policy that results in the deferral of some portion of the arrangement consideration. The Company adopted the provisions of ASU 2010-17 on July 1, 2010, as required. The provisions had no impact on the Company’s consolidated financial position or results of operations upon adoption.
NOTE 3 – EARNINGS PER SHARE
Basic and diluted earnings per common share are calculated as follows (all share and per share numbers for all periods presented reflect the Company’s June 30, 2010 1-for-9 reverse stock split) (in thousands, except for share and per share data):
| For the Years Ended December 31, | ||||||||||||
| 2010 | 2009 | 2008 | ||||||||||
| Basic Earnings Per Common Share: |
||||||||||||
| Income from continuing operations |
$ | 37,664 | $ | 17,782 | $ | 11,170 | ||||||
| Income from discontinued operations |
2,971 | 10,105 | 23,668 | |||||||||
| Net income available to common shareholders |
$ | 40,635 | $ | 27,887 | $ | 34,838 | ||||||
| Weighted Average Common Shares Outstanding |
15,253,579 | 14,971,921 | 14,267,375 | |||||||||
| Income from continuing operations |
$ | 2.47 | $ | 1.19 | $ | 0.78 | ||||||
| Income from discontinued operations |
0.19 | 0.67 | 1.66 | |||||||||
| Basic earnings per common share |
$ | 2.66 | $ | 1.86 | $ | 2.44 | ||||||
| Diluted Earnings Per Common Share: |
||||||||||||
| Income from continuing operations |
$ | 37,664 | $ | 17,782 | $ | 11,170 | ||||||
| Income from discontinued operations |
2,971 | 10,105 | 23,668 | |||||||||
| Net income available to common shareholders |
$ | 40,635 | $ | 27,887 | $ | 34,838 | ||||||
| Weighted Average Common Shares Outstanding |
15,253,579 | 14,971,921 | 14,267,375 | |||||||||
| Dilutive effect of unvested RSUs to purchase common stock |
375,366 | 309,080 | 204 | |||||||||
| Dilutive effect of contingently returnable shares |
152,670 | 152,368 | 98,038 | |||||||||
| Dilutive effect of warrants |
539,588 | 158,071 | 227,020 | |||||||||
| Weighted Average Shares Outstanding Assuming Dilution |
16,321,203 | 15,591,440 | 14,592,637 | |||||||||
| Income from continuing operations |
$ | 2.31 | $ | 1.14 | $ | 0.77 | ||||||
| Income from discontinued operations |
0.18 | 0.65 | 1.62 | |||||||||
| Diluted earnings per common share |
$ | 2.49 | $ | 1.79 | $ | 2.39 | ||||||
Restricted Stock Awards: All common shares granted under the 2008 Director’s Equity Incentive Plan are issued when granted and vest, based on certain service conditions, over a four year period. Only vested shares are included in the Weighted Average Common Shares Outstanding for each period. Unvested restricted stock awards remain subject to forfeiture until satisfaction of certain service conditions and are included, under the treasury method, in the calculation for dilutive effect of contingently returnable shares. If the award is forfeited before the vesting period has expired, the forfeited shares are included as treasury shares.
Restricted Stock Units (“RSUs”): Common shares granted under the 2008 Management Incentive Plan are issued when the shares vest. Therefore, only the vested/issued shares are included in the Weighted Average Common Shares Outstanding for each period. Unvested restricted stock units are contingently issuable, subject to satisfaction of certain service conditions, and included, under the treasury method, in the calculation for dilutive effect of unvested RSUs to purchase common shares.
F - 16
Table of Contents
Management Co-Investment Plan: Common shares issued under the 2008 Management Co-Investment Plan were issued on January 22, 2008 and will cliff vest, based on certain service conditions, on the third anniversary of the grant date. Because none of the shares vested, none are included in the Weighted Average Common Shares Outstanding for each period. Unvested shares remain subject to forfeiture until satisfaction of certain service conditions and are included, under the treasury method, in the calculation for dilutive effect of contingently returnable shares. If an award is forfeited before the vesting period has expired, the forfeited shares are included as treasury shares.
Warrants: Diluted earnings per share include the potentially dilutive effect of outstanding warrants that are exercisable for common stock.
Diluted earnings per share include the potentially dilutive effect of outstanding warrants and restricted stock units that are convertible to common stock. For the years ended December 31, 2010, 2009 and 2008, no outstanding stock equivalents were anti-dilutive and excluded from the computations of diluted earnings per share.
NOTE 4 – GOODWILL AND OTHER INTANGIBLE ASSETS
There were no changes in the carrying amount of goodwill during 2010 or 2009. The balances for other intangible assets as of December 31, 2010 are as follows (in thousands):
| As of December 31, 2010 | ||||||||||||||||
| Weighted Average Amortization Years |
Gross Carrying Amount |
Accumulated Amortization |
Net Asset | |||||||||||||
| Intangible Assets |
||||||||||||||||
| Backlog |
1 | $ | 2,100 | $ | 2,100 | $ | — | |||||||||
| Customer Relations |
6 | 8,800 | 8,311 | 489 | ||||||||||||
| Trade Name |
Indefinite | 12,500 | — | 12,500 | ||||||||||||
| Total Intangible Assets |
$ | 23,400 | $ | 10,411 | $ | 12,989 | ||||||||||
The balances for other intangible assets as of December 31, 2009 are as follows (in thousands):
| As of December 31, 2009 | ||||||||||||||||
| Weighted Average Amortization Years |
Gross Carrying Amount |
Accumulated Amortization |
Net Asset | |||||||||||||
| Intangible Assets |
||||||||||||||||
| Backlog |
1 | $ | 2,100 | $ | 2,100 | $ | — | |||||||||
| Customer Relations |
6 | 8,800 | 6,551 | 2,249 | ||||||||||||
| Trade Name |
Indefinite | 12,500 | — | 12,500 | ||||||||||||
| Total Intangible Assets |
$ | 23,400 | $ | 8,651 | $ | 14,749 | ||||||||||
Amortization expense for 2010, 2009 and 2008 was approximately $1.8 million, $1.8 million and $1.8 million, respectively. Estimated amortization expense for the next year is $0.5 million.
During 2010, 2009 and 2008, the Company performed the annual impairment review of goodwill and concluded that the estimated fair value of each reporting unit substantially exceeded the related carrying value and therefore no impairment was recorded. See Note 2.
F - 17
Table of Contents
NOTE 5 – INCOME TAXES
In connection with the preparation of the Annual Report on Form 10-K for the year ended December 31, 2010, an error was identified in recording the income tax provision amount and related accrued income tax balance that affected several prior periods. Based on review of the quantitative and qualitative factors surrounding this error, the Company has charged current income tax expense for the year ended December 31, 2010 by $2.7 million related to these errors. The effect of these errors were individually not material to each of the past years presented in the accompanying consolidated financial statements. The following summarizes the income tax expense (in thousands):
| For the Years Ended December 31, | ||||||||||||
| 2010 | 2009 | 2008 | ||||||||||
| Current: |
||||||||||||
| Federal |
$ | 2,983 | $ | 39 | $ | (5,096 | ) | |||||
| State |
— | — | (582 | ) | ||||||||
| Foreign |
947 | 1,452 | 2,577 | |||||||||
| Total current |
3,930 | 1,491 | (3,101 | ) | ||||||||
| Deferred: |
||||||||||||
| Federal |
2,244 | 3,527 | 6,217 | |||||||||
| State |
269 | 403 | 710 | |||||||||
| Foreign |
169 | (128 | ) | (642 | ) | |||||||
| Total deferred |
2,682 | 3,802 | 6,285 | |||||||||
| Income tax expense |
$ | 6,612 | $ | 5,293 | $ | 3,184 | ||||||
Income tax expense is allocated between continuing operations and discontinued operations as follows (in thousands):
| For the Years Ended December 31, | ||||||||||||
| 2010 | 2009 | 2008 | ||||||||||
| Continuing operations |
$ | 6,410 | $ | 5,282 | $ | 3,151 | ||||||
| Discontinued operations |
202 | 11 | 33 | |||||||||
| Income tax expense |
$ | 6,612 | $ | 5,293 | $ | 3,184 | ||||||
Income before income taxes was as follows (in thousands):
| For the Years Ended December 31, | ||||||||||||
| 2010 | 2009 | 2008 | ||||||||||
| Domestic |
$ | 38,797 | $ | 14,483 | $ | 7,057 | ||||||
| Foreign |
5,277 | 8,581 | 7,264 | |||||||||
| Income from continuing operations |
44,074 | 23,064 | 14,321 | |||||||||
| Income from discontinued operations |
3,173 | 10,116 | 23,701 | |||||||||
| Income before income tax |
$ | 47,247 | $ | 33,180 | $ | 38,022 | ||||||
F - 18
Table of Contents
The components of deferred income taxes consist of the following (in thousands):
| December 31, | ||||||||
| 2010 | 2009 | |||||||
| Assets: |
||||||||
| Cost in excess of identifiable net assets of business acquired |
$ | 28,392 | $ | 32,917 | ||||
| Reserves and other accruals |
4,748 | 7,143 | ||||||
| Restructuring charges |
— | 19,041 | ||||||
| Deferred revenue |
9 | 818 | ||||||
| Tax credit carryforwards |
9,542 | 7,971 | ||||||
| Accrued compensation and benefits |
4,064 | 6,987 | ||||||
| State net operating loss carryforwards |
1,144 | 2,745 | ||||||
| Federal net operating loss carryforwards |
8,847 | 15,566 | ||||||
| Other |
839 | 1,064 | ||||||
| 57,585 | 94,252 | |||||||
| Liabilities |
||||||||
| Indefinite life intangibles |
(17,855 | ) | (15,354 | ) | ||||
| Property and equipment |
(1,428 | ) | (1,281 | ) | ||||
| Net deferred tax assets |
38,302 | 77,617 | ||||||
| Valuation allowance for net deferred tax assets |
(55,236 | ) | (92,033 | ) | ||||
| Net deferred tax liability after valuation allowance |
$ | (16,934 | ) | $ | (14,416 | ) | ||
At December 31, 2010 and 2009, the Company has recorded a valuation allowance against deferred income tax assets of approximately $55.2 million and $92.0 million, respectively, representing the amount of its deferred income tax assets in excess of the Company’s deferred income tax liabilities arising from balances other than indefinite life intangibles. The net change in valuation allowance for the year ended December 31, 2010 was a decrease in the amount of approximately $36.8 million, and the net change in valuation allowance for the year ended December 31, 2009 was a decrease in the amount of approximately $10.5 million. The valuation allowance was recorded because management was unable to conclude, in light of the cumulative tax loss realized by the Company for the three year period ended before December 31, 2010, that realization of the net deferred tax asset was more likely than not. During 2010, the Company also wrote off a deferred tax asset of $19.5 million related to restructuring charges that the Company determined no longer represented a temporary difference. The deferred tax asset was fully covered by a valuation allowance that was reversed at the same time.
Net deferred tax assets are allocated between current and long-term as follows (in thousands):
| December 31, | ||||||||
| 2010 | 2009 | |||||||
| Current deferred tax asset (included in Other current assets) |
$ | 814 | $ | 352 | ||||
| Non-current deferred tax liability |
(17,748 | ) | (14,768 | ) | ||||
| Net deferred tax liabilities after valuation allowance |
$ | (16,934 | ) | $ | (14,416 | ) | ||
F - 19
Table of Contents
The amount of the income tax provision for the years ended December 31, 2010, 2009 and 2008 differs from the statutory federal income tax rate of 35% as follows:
| For the Years Ended December 31, | ||||||||||||||||||||||||
| 2010 | 2009 | 2008 | ||||||||||||||||||||||
| Amount | Percent | Amount | Percent | Amount | Percent | |||||||||||||||||||
| Tax expense computed at the maximum U.S. statutory rate |
$ | 16,536 | 35.0 | % | $ | 11,613 | 35.0 | % | $ | 13,308 | 35.0 | % | ||||||||||||
| Difference resulting from State income taxes, net of federal income tax benefits |
269 | 0.6 | % | 403 | 1.2 | % | 1,521 | 4.0 | % | |||||||||||||||
| Foreign tax rate differences |
(85 | ) | -0.2 | % | 1,132 | 3.4 | % | (1,408 | ) | -3.7 | % | |||||||||||||
| Foreign dividends received |
2,363 | 5.0 | % | — | 0.0 | % | — | 0.0 | % | |||||||||||||||
| Dividends received deduction |
(1,042 | ) | -2.2 | % | — | 0.0 | % | — | 0.0 | % | ||||||||||||||
| Non-deductible expenses |
1,251 | 2.6 | % | 1,644 | 5.0 | % | 594 | 1.6 | % | |||||||||||||||
| Multi-year true-ups (including correction) |
2,983 | 6.3 | % | (435 | ) | -1.3 | % | (6,146 | ) | -16.2 | % | |||||||||||||
| Net gain on outbound transfer |
467 | 1.0 | % | — | 0.0 | % | — | 0.0 | % | |||||||||||||||
| Change in valuation allowance |
(15,336 | ) | -32.4 | % | (9,409 | ) | -28.4 | % | (5,721 | ) | -15.0 | % | ||||||||||||
| Effective rate differences |
(631 | ) | -1.3 | % | — | 0.0 | % | — | 0.0 | % | ||||||||||||||
| Other, net |
(163 | ) | -0.3 | % | 345 | 1.0 | % | 1,036 | 2.7 | % | ||||||||||||||
| Total |
$ | 6,612 | 14.0 | % | $ | 5,293 | 15.9 | % | $ | 3,184 | 8.4 | % | ||||||||||||
The Company has approximately $33.6 million of federal net operating loss carryforwards expiring in 2025 through 2027. The Company has state income tax loss carryforwards of approximately $28.6 million expiring in 2010 through 2029. The Company has approximately $8.5 million in foreign tax credit carryforwards expiring in 2015 through 2019.
The Company provides income taxes on the undistributed earnings of its foreign subsidiaries except to the extent that such earnings are indefinitely reinvested outside the United States. As of December 31, 2010, all of the undistributed earnings of the foreign subsidiaries, approximately $3.4 million, were considered to be reinvested indefinitely. Consequently, the Company has not provided for the federal and foreign withholding taxes on the foreign subsidiaries’ undistributed earnings. If the Company decided to repatriate all available foreign cash it would have zero impact on the total tax provision.
Effective January 1, 2007, the Company adopted ASC 740, Income Taxes, as it relates to uncertain tax positions. Currently, the Company is not under examination for income tax purposes by any taxing jurisdiction. A presentation of open tax years by jurisdiction is as follows:
| Tax Jurisdiction |
Examination in Progress |
Open Tax Years for Examination | ||
| United States |
None | 2005 to Present | ||
| Mexico |
None | 2004 to Present | ||
| China |
None | 2004 to Present | ||
| The Netherlands |
None | 2007 to Present |
The Company has elected to classify interest and penalties related to uncertain income tax positions in income tax expense. At December 31, 2010, 2009 and 2008, the Company has accrued approximately $2.1 million, $1.7 million and $1.2 million, respectively, for potential payment of interest and penalties.
F - 20
Table of Contents
Following is a reconciliation of the total amounts of unrecognized tax benefits for the years ended December 31, 2010, 2009 and 2008 (in thousands):
| For the Years Ended December 31, | ||||||||||||
| 2010 | 2009 | 2008 | ||||||||||
| Unrecognized Tax Benefits at January 1 |
$ | 4,242 | $ | 4,046 | $ | 3,499 | ||||||
| Change in Unrecognized Tax Benefits Taken During a Prior Period |
— | — | — | |||||||||
| Change in Unrecognized Tax Benefits During the Current Period |
136 | 583 | 547 | |||||||||
| Decreases in Unrecognized Tax Benefits From Settlements with Taxing Authorities |
(479 | ) | (387 | ) | — | |||||||
| Reductions to Unrecognized Tax Benefits From Lapse of Statues of Limitations |
— | — | — | |||||||||
| Unrecognized Tax Benefits at December 31 |
$ | 3,899 | $ | 4,242 | $ | 4,046 | ||||||
The Unrecognized Tax Benefits disclosed previously for 2009 and 2008 differ from the Unrecognized Tax Benefits disclosed above by $1.7 million and $1.2 million, respectively. This decrease results from the Company’s decision to remove accrued interest and penalties from the tabular rollforward. This is being done to better comport with how the disclosure of unrecognized tax benefits has evolved since the passage of ASC 740. This change in disclosure has no impact on the amounts recognized in the accompanying consolidated balance sheets. As of December 31, 2010, 2009 and 2008 the total amount of unrecognized tax benefits that, if recognized, would affect the effective tax rate are approximately $1.8 million, $1.9 million and $1.7, million respectively.
NOTE 6 – UNCOMPLETED CONTRACTS
Both the Products and Services Divisions enter into contracts that allow for periodic billings over the contract term. At any point in time, each project under construction could have either costs and estimated earnings in excess of billings or billings in excess of costs and estimated earnings. Within the Products Division, the Auxiliary Power Equipment business typically bills customers only at the completion of each phase of a contract and no earnings are recognized until each phase is complete.
Costs, earnings and billings related to uncompleted contracts consist of the following (in thousands):
| For the Years Ended December 31, | ||||||||
| 2010 | 2009 | |||||||
| Costs incurred on uncompleted contracts |
$ | 420,552 | $ | 433,124 | ||||
| Earnings recognized on uncompleted contracts |
60,652 | (128,822 | ) | |||||
| Total |
481,204 | 304,302 | ||||||
| Less - billings to date |
(459,463 | ) | (305,980 | ) | ||||
| Net |
$ | 21,741 | $ | (1,678 | ) | |||
The net amounts are included in the accompanying consolidated balance sheets under the following headings (in thousands):
| December 31, 2010 |
December 31, 2009 |
|||||||
| Costs and estimated earnings in excess of billings |
$ | 33,076 | $ | 29,470 | ||||
| Billings in excess of costs and estimated earnings |
(11,335 | ) | (31,148 | ) | ||||
| Net |
$ | 21,741 | $ | (1,678 | ) | |||
NOTE 7 – DEBT
Credit Facility: The Company has a $150 million Credit Facility (“Credit Facility”) consisting of a $60 million revolving letter of credit facility, including a $25 million cash advance sub-facility, and a $90 million term loan facility. On November 18, 2010, the Company repaid the outstanding balance of the term loan facility and all related interest in full. At December 31, 2010, the Company had $25.0 million of unused capacity on the cash advance sub-facility. The Credit Facility will terminate on January 22, 2014 and any amounts outstanding at that time will be due and payable in full.
F - 21
Table of Contents
At December 31, 2010 and 2009, the Credit Facility consisted of the following (in thousands):
| As of December 31, | ||||||||
| 2010 | 2009 | |||||||
| Term loan |
$ | — | $ | 65,325 | ||||
| Less: |
||||||||
| Current maturities of long-term debt |
||||||||
| Quarterly installments |
— | 5,000 | ||||||
| Excess cash flow sweep |
— | 35,692 | ||||||
| Long-term debt, net of current maturities |
$ | — | $ | 24,633 | ||||
The interest rate on letters of credit issued under the revolving letter of credit was 3.82% at December 31, 2010. The Company also pays an unused line fee of 0.50%. Should the Company need to borrow against the revolver facility it would pay interest at 3.82% per annum.
The Credit Facility includes customary affirmative and negative covenants, such as limitations on the creation of new indebtedness and on certain liens, restrictions on certain transactions and payments and requires maintenance of a maximum consolidated leverage ratio, minimum consolidated fixed charge ratio and minimum liquidity. A default under the Credit Facility may be triggered by events such as a failure to comply with financial covenants or other covenants under the Credit Facility, a failure to make payments when due under the Credit Facility, a change of control of the Company or certain insolvency proceedings. A default under the Credit Facility would permit the participating banks to restrict the Company’s ability to further access the Credit Facility for loans, require the immediate repayment of any outstanding loans with interest and require the cash collateralization of outstanding letter of credit obligations. The Credit Facility is secured by a first priority lien on substantially all assets of the Company.
NOTE 8 – LIABILITIES SUBJECT TO COMPROMISE
Liabilities subject to compromise include unsecured and under secured liabilities, including secured liabilities as to which there is uncertainty as to whether the value of the collateral securing such liabilities is less than, equals or exceeds such liabilities, incurred prior to the petition date. The amounts of the various categories of liabilities that are subject to compromise are set forth below. These amounts represent the Company’s estimates of known or potential pre-petition date claims that are likely to be resolved in connection with the Chapter 11 filings. Such claims remain subject to further adjustments. Adjustments result from negotiations, actions of the Bankruptcy Court, rejection of executory contracts, the determination as to the value of any collateral securing claims, proofs of claim or other events.
The amounts of liabilities subject to compromise at December 31, 2010 consisted of the following (in thousands):
| Products Division |
Services Division | Corporate | Total | |||||||||||||
| Accounts payable |
$ | — | $ | 7 | $ | — | $ | 7 | ||||||||
| Other accruals |
— | — | 200 | 200 | ||||||||||||
| Total |
$ | — | $ | 7 | $ | 200 | $ | 207 | ||||||||
The amounts of liabilities subject to compromise at December 31, 2009 consisted of the following (in thousands):
| Products Division |
Services Division | Corporate | Total | |||||||||||||
| Accounts payable |
$ | 92 | $ | 30 | $ | — | $ | 122 | ||||||||
| Other accruals |
109 | — | 310 | 419 | ||||||||||||
| Total |
$ | 201 | $ | 30 | $ | 310 | $ | 541 | ||||||||
F - 22
Table of Contents
NOTE 9 – STOCKHOLDERS’ EQUITY
Restricted Stock Awards: Pursuant to the 2008 Director’s Equity Incentive Plan, the Company is permitted to award restricted stock subject to specified restrictions on transfer, forfeiture and/or such other restrictions on incidents of ownership determined by the Compensation Committee of the Company’s Board of Directors. On January 22, 2009, the Company issued 26,144 shares of restricted stock under the 2008 Director’s Equity Incentive Plan at a grant date fair value of $5.76 per share, which approximated the quoted market price of the common stock on that date. Vesting of this restricted stock is based on certain service conditions over a four year period.
On February 9, 2009, the Company issued 34,722 shares of restricted stock under the 2008 Director’s Equity Incentive Plan at a grant date fair value of $4.95 per share, which approximated the quoted price of the common stock on that date. Vesting of this restricted stock is based on certain service conditions over a four year period.
On February 9, 2010, the Company granted 17,361 shares of restricted stock under the 2008 Director’s Equity Incentive Plan at a grant date fair value of $15.75 per share, which approximated the quoted price of the common stock on that date. Vesting of this restricted stock is based on certain service conditions over a four year period.
The following table summarizes the expense related to these restricted stock awards (in thousands):
| For the Years Ended December 31, | Future Vesting periods |
|||||||||||||||
| 2010 | 2009 | 2008 | ||||||||||||||
| Restricted stock awards granted: |
||||||||||||||||
| January 22, 2009 |
$ | 37 | $ | 73 | $ | — | $ | 41 | ||||||||
| February 9, 2009 |
43 | 39 | — | 90 | ||||||||||||
| February 9, 2010 |
63 | — | — | 211 | ||||||||||||
| Total |
$ | 143 | $ | 112 | $ | — | $ | 342 | ||||||||
Stock-based Compensation: On June 23, 2008, the Company granted 581,546 RSUs with a grant date fair value of $10.80 per unit under the 2008 Management Incentive Plan pursuant to RSU Award Agreements executed by each beneficiary of the grant. Grants of RSUs under the 2008 Management Incentive Plan are valued in terms of the quoted market price of the Company’s common stock at date of grant; however, common stock is not issued at the time of the grant. Vesting of RSUs is based on certain performance and service conditions over a four year period. The Company recognizes compensation cost for awards with performance conditions if and when the Company concludes that it is probable that the performance condition will be achieved, net of an estimate of pre-vesting forfeitures. The Company recognizes compensation cost for awards with service condition throughout the vesting term, net of an estimate of pre-vesting forfeitures. Restricted shares are issued to plan participants as vesting requirements are satisfied. In addition, on March 2, 2010, the Company issued 7,935 shares of restricted stock to the recipients of RSU awards according to specific separation agreements.
On February 9, 2009, the Company granted 540,008 RSUs with a grant date fair value of $4.95 per unit under the 2008 Management Incentive Plan. In addition, on September 14, 2009, the Company granted 83,333 RSUs with a grant date fair value of $10.80 per unit under the 2008 Management Incentive Plan. Additionally, on March 2, 2010, the Company issued 11,842 shares of restricted stock to certain recipients of RSU awards pursuant to individual separation agreements.
On March 23, 2010, the Company granted 458,888 RSUs with a grant date fair value of $15.75 per unit under the 2008 Management Incentive Plan.
The following table summarizes the expense related to these restricted stock units (in thousands):
| For the Years Ended December 31, | ||||||||||||
| 2010 | 2009 | 2008 | ||||||||||
| Restricted stock units granted: |
||||||||||||
| June 23, 2008 |
$ | 949 | $ | 866 | $ | 1,173 | ||||||
| February 9, 2009 |
1,251 | 620 | — | |||||||||
| March 23, 2010 |
1,345 | — | — | |||||||||
| Total |
$ | 3,545 | $ | 1,486 | $ | 1,173 | ||||||
Stock-based Compensation - Withheld: In April 2010, the Company issued 228,300 shares of common stock to the participants in the 2008 Management Incentive Plan pursuant to the vesting schedule. Some employees elected to have some of their shares withheld for tax purposes resulting in a $0.6 million adjustment to Paid-in Capital.
F - 23
Table of Contents
Management Co-Investment Plan: On January 22, 2008, members of management were offered the opportunity to purchase shares of the new common stock (up to an aggregate amount of $1.5 million) at the share price of $7.65 per share. With each purchase of two shares of new common stock, an additional share of restricted stock (each an “Incentive Share”) was issued. At March 31, 2010, 2,136 shares of common stock issued under the Management Co-Investment Plan were forfeited by members of management who terminated their employment with the Company prior to meeting the vesting requirements. These shares are held as treasury shares.
The following table summarizes the expense related to the Management Co-Investment Plan (in thousands):
| For the Years Ended December 31, | Future Vesting periods |
|||||||||||||||
| 2010 | 2009 | 2008 | ||||||||||||||
| Management Co-Investment Plan |
||||||||||||||||
| January 22, 2008 |
$ | 158 | $ | 225 | $ | 181 | $ | 14 | ||||||||
| Total |
$ | 158 | $ | 225 | $ | 181 | $ | 14 | ||||||||
Warrants: On January 22, 2008, the Company issued warrants to purchase 1,807,222 shares of stock with an exercise price of $7.9254. The warrants vested immediately upon issuance and expire on January 22, 2013. During the year ended December 31, 2010, warrants were exercised to purchase 88,439 shares of common stock. The stock was sold in a cashless transaction whereby the Company withheld 30,066 shares of common stock, treasury shares, as payment of the exercised purchase warrants.
Fair Market Value of Interest Rate Swap: On March 28, 2008, the Company entered into a swap agreement to convert $60 million of the Credit Facility variable interest payments to fixed rates. The amount of accumulated comprehensive income associated with interest rate swaps was $0 at December 31, 2010, a loss of $0.2 million at December 31, 2009 and $0.8 million at December 31, 2008. See Note 2 for a discussion of the interest rate swaps.
Foreign Currency Translation: Foreign assets and liabilities are translated using the exchange rate in effect at the balance sheet date, and results of operations are translated using an average rate for the period. Translation adjustments are accumulated and reported as a component of accumulated other comprehensive income. The amount of accumulated comprehensive gain related to foreign currency translation was $1.4 million at December 31, 2010, $2.8 million at December 31, 2009, and $1.9 million at December 31, 2008.
Issuance of Common Stock: Pursuant to the Plan, each holder of an equity interest as of November 6, 2007 received a non-transferable, non-certificated right (a “Right”) to purchase up to its Pro Rata shares of the new common stock (the “Rights Offering”). The Rights Offering commenced on November 6, 2007 and expired on December 13, 2007. As a result, on January 22, 2008, the Company issued 14,744,009 shares of new common stock and raised $72.5 million of new equity capital at an applicable share price of $7.65 per share. Of the $72.5 million of net cash proceeds received, $4.6 million was the value assigned to the warrants offset by $0.5 million assigned to the cancellation of 5,261,553 shares of common stock at December 31, 2007 and the remaining $68.4 million was credited to stockholders’ equity.
In addition, pursuant to the Plan the Company issued 112,014 shares of common stock for advisor success fees related to the bankruptcy. As a result, the Company charged expense and attributed an additional $0.8 million in paid in capital at an applicable share price of $7.65 per share.
NOTE 10 – COMMITMENTS AND CONTINGENCIES
Employment Agreements: The Company entered into employment agreements with terms of two to three years with certain members of management with automatic one-year renewal periods at expiration dates. The agreements provide for, among other things, compensation, benefits and severance payments.
Litigation: The Company is involved from time to time in legal actions that arise in the ordinary course of our business. The Company does not believe that the resolution of any currently pending actions, either individually or in the aggregate, will have a material adverse effect on the Company’s financial position or results of operations. However, the outcomes of any legal actions cannot be predicted, and therefore, there can be no assurance that this will be the case.
Deltak Fund for Unsecured Claims in Bankruptcy: On September 28, 2006, Global Power Equipment Group Inc. and all of its U.S. subsidiaries, including Deltak, filed voluntary petitions for relief under Chapter 11 of the Bankruptcy Code in the United States Bankruptcy Court for the District of Delaware. Pursuant to an approved Plan of Reorganization, an administrator was appointed to administer a fund of approximately $34 million in cash that was intended to be distributed to the holders of allowed unsecured claims against Deltak. Under the Plan of Reorganization, the administrator has the right and duty to administer the fund and to “make, file and settle or otherwise resolve objections” to unsecured claims against Deltak.
F - 24
Table of Contents
Each of Mitsubishi Heavy Industries, Ltd. and Mitsubishi Power Systems Americas, Inc. initially filed a claim against Deltak in the amount of $38.3 million allegedly arising from a pre-bankruptcy contract with Deltak. After prosecution of the pending objection by the administrator, in late 2010, the administrator, the Mitsubishi entities, Deltak and Global Power entered into a settlement whereby the administrator made a cash payment of $1.1 million from the fund to the Mitsubishi entities in full satisfaction of their claims and the parties provided mutual releases.
Since January 22, 2008, the administrator has adjudicated and/or settled various unsecured claims and engaged in efforts to resolve the remaining disputed claims. As of February 28, 2011, approximately $2.8 million of cash remains in the fund subject to the control of the administrator.
Certain disputed unsecured claims remain unresolved. The administrator continues to contest and otherwise seek to resolve these and all other remaining disputed claims.
Asbestos Cases: The Company has been named as a defendant in a limited number of asbestos personal injury lawsuits. Neither the Company nor its predecessors ever mined, manufactured, produced or distributed asbestos fiber, the material that allegedly caused the injury underlying these actions. The bankruptcy court’s discharge order issued upon emergence from bankruptcy extinguished the claims made by all plaintiffs who had filed asbestos claims against the Company before that time. The Company also believes the bankruptcy court’s discharge order should serve as a bar against any later claim filed against it, including any of its subsidiaries, based on alleged injury from asbestos at any time before emergence from bankruptcy. In any event in all of the asbestos cases finalized post-bankruptcy, the Company has been successful in having such cases dismissed without liability. The Company intends to vigorously defend all currently active actions, just as it defended the other actions that have since been dismissed, all without liability, and it does not anticipate that any of these actions will have a material adverse effect on its financial position, results of operations or liquidity. However, the outcomes of any legal action cannot be predicted and, therefore, there can be no assurance that this will be the case.
Warranty: Estimated costs related to product warranty are accrued as revenue is recognized and included in the cost of revenues. Estimated costs are based upon past warranty claims and sales history. Warranty terms vary by contract but generally provide for a term of three years or less. The Company manages its exposure to warranty claims by having its field service and quality assurance personnel regularly monitor projects and maintain ongoing and regular communications with the customer.
A reconciliation of the changes to the Company’s warranty reserve is as follows (in thousands):
| For the Years Ended December 31, | ||||||||
| 2010 | 2009 | |||||||
| Balance at the beginning of the period |
$ | 10,981 | $ | 11,948 | ||||
| Adjustments [1] |
(3,501 | ) | (1,393 | ) | ||||
| Provision during the period |
187 | 1,912 | ||||||
| Settlements made (in cash or in kind) during the period |
(1,618 | ) | (1,486 | ) | ||||
| Balance at the end of the period |
$ | 6,049 | $ | 10,981 | ||||
| [1] | During 2010 and 2009 warranty adjustments included the normal roll off of warranty periods and changes in managements’ estimates, based on historical claims activity, to further reduce the warranty reserves required. |
Leases: The Company leases machinery, transportation equipment and office, warehouse and manufacturing facilities under leases, which are noncancellable and expire at various dates. Total rental expense for all operating leases for 2010, 2009 and 2008 was approximately $1.5 million, $1.6 million and $1.9 million, respectively.
F - 25
Table of Contents
Future minimum annual lease payments under these noncancellable operating leases at December 31, 2010 are as follows (in thousands):
| December 31 | ||||
| 2011 |
998 | |||
| 2012 |
758 | |||
| 2013 |
682 | |||
| 2014 |
553 | |||
| 2015 |
202 | |||
| Thereafter |
103 | |||
| Total |
$ | 3,296 | ||
None of the leases include contingent rental provisions.
Employee Benefit Plans: The Company maintains a 401(k) plan covering substantially all of the Company’s employees in the United States. Expense for the Company 401(k) plan for 2010, 2009 and 2008 was approximately $1.7 million, $1.3 million and $1.1 million, respectively.
Contingencies: At December 31, 2010 and 2009, the Company had a contingent liability for issued and outstanding stand-by letters of credit, generally issued to secure performance on customer contracts. The balance of stand-by letters of credit totaled approximately $17.9 million for the domestic entities and $13.5 million (U.S. dollars) for foreign entities at December 31, 2010 and $22.2 million for the domestic entities and $13.3 million (U.S. dollars) for foreign entities at December 31, 2009. Currently, there are no amounts drawn upon these letters of credit. In addition, at December 31, 2010 and 2009, the Company had outstanding surety bonds on projects of approximately $13.0 million and $8.5 million, respectively.
The Company participates in several multi-employer pension plans throughout the United States. As of December 31, 2010, the Company received notices from certain plans that are in critical funding status; however, the Company has not withdrawn from any of these plans. Currently, each plan is developing a rehabilitation plan that may call for a reduction on participant benefits or an increase in future employer contributions. While it is reasonably possible that additional expenses may be incurred related to these plans, management cannot, at this time, estimate the amount, or range, of the potential exposure. The Company continues to monitor and assess any full and partial withdrawal liability implications associated with these plans.
The Company evaluated its banking relationships with regard to cash and available credit. The Company maintains cash in depository accounts at various FDIC insured banks and financial institutions and, at times, balances may exceed federally insured limits. We have never experienced any losses related to these balances. All of the Company’s non-interest bearing cash balances were fully insured at December 31, 2010 due to a temporary federal program in effect from December 31, 2010 through December 31, 2012. Under the program, there is no limit to the amount of insurance for eligible accounts. Beginning 2013, insurance coverage will revert to $250,000 per depositor at each financial institution, and the Company’s non-interest bearing cash balances may again exceed federally insured limits. Although the Company maintains cash balances in interest bearing accounts in excess of the FDIC insured limits, management believes this risk is mitigated by using financial institutions that are rated investment grade according to credit rating agencies. To the extent that the credit crisis affects the counterparties in the Credit Facility, the Company may have difficulty accessing all the available credit under this facility.
F - 26
Table of Contents
NOTE 11 – SUPPLEMENTAL CASH FLOW INFORMATION
Supplemental cash flow disclosures are as follows (in thousands):
| For the Years Ended December 31, | ||||||||||||
| 2010 | 2009 | 2008 | ||||||||||
| SUPPLEMENTAL DISCLOSURES OF CASH FLOW INFORMATION: |
||||||||||||
| Cash paid during the period for: |
||||||||||||
| Interest |
$ | 3,950 | $ | 8,848 | $ | 11,632 | ||||||
| Income taxes |
957 | 976 | 1,812 | |||||||||
| SUPPLEMENTAL DISCLOSURES OF NONCASH ACTIVITIES: |
||||||||||||
| Issuance of Common Shares for advisor success fees pursuant to the Plan of Reorganization |
$ | — | $ | — | $ | 856 | ||||||
NOTE 12 – SEGMENT INFORMATION
The “Management Approach” called for by ASC 280, Segment Reporting, has been used by Company management to present the segment information which follows. The Company considered the way its management team makes operating decisions and assesses performance and considered which components of its enterprise have discrete financial information available. Management makes decisions using a products and services group focus and its analysis resulted in two operating segments, Products Division and Services Division. The Company evaluates performance based on net income or loss not including certain items as noted below. Intersegment revenues and transactions were not significant. Interest expense is allocated based on the amount of capital employed for each division. Corporate assets consist primarily of cash and deferred tax assets.
The following tables present information about segment income (in thousands):
| Products Division Years Ended December 31, |
Services Division Years Ended December 31, |
|||||||||||||||||||||||
| 2010 | 2009 | 2008 | 2010 | 2009 | 2008 | |||||||||||||||||||
| Revenues |
$ | 142,683 | $ | 193,150 | $ | 311,603 | $ | 377,461 | $ | 347,460 | $ | 245,161 | ||||||||||||
| Interest expense |
3,646 | 4,713 | 6,744 | 3,406 | 4,954 | 4,923 | ||||||||||||||||||
| Depreciation and amortization |
1,893 | 1,936 | 1,711 | 2,167 | 2,215 | 2,081 | ||||||||||||||||||
| Income tax provision |
1,928 | 3,560 | 2,568 | 4,482 | 1,722 | 583 | ||||||||||||||||||
| Segment income |
10,512 | 9,088 | 32,976 | 25,675 | 9,724 | 1,768 | ||||||||||||||||||
| Total Assets |
$ | 121,056 | $ | 126,288 | $ | 153,148 | $ | 103,792 | $ | 125,015 | $ | 94,469 | ||||||||||||
The following table presents information, which reconciles segment income to consolidated net income (in thousands):
| Years ended December 31, | ||||||||||||
| 2010 | 2009 | 2008 | ||||||||||
| Net income: |
||||||||||||
| Total segment income |
$ | 36,187 | $ | 18,812 | $ | 34,744 | ||||||
| Income from discontinued operations |
2,971 | 7,369 | 23,668 | |||||||||
| Gain on sale of discontinued operations |
— | 2,736 | — | |||||||||
| Reorganization (expense) income |
1,477 | (1,030 | ) | (23,574 | ) | |||||||
| Consolidated net income |
$ | 40,635 | $ | 27,887 | $ | 34,838 | ||||||
F - 27
Table of Contents
The following table presents information, which reconciles segment assets to consolidated total assets (in thousands):
| As of December 31, | ||||||||
| 2010 | 2009 | |||||||
| Assets: |
||||||||
| Total segment assets |
$ | 224,848 | $ | 251,303 | ||||
| Non allocated corporate assets |
40,877 | 74,708 | ||||||
| Total consolidated assets |
$ | 265,725 | $ | 326,011 | ||||
The following presents revenues by geographical region based on the Company’s operating locations. Products are often shipped to other geographical areas but revenues are listed in the region in which the revenue is recognized (in thousands):
| Years ended December 31, | ||||||||||||||||||||||||
| 2010 | 2009 | 2008 | ||||||||||||||||||||||
| Revenue Recognized In |
Revenue Rendered |
Revenue Recognized In |
Revenue Rendered |
Revenue Recognized In |
Revenue Rendered |
|||||||||||||||||||
| United States |
$ | 476,524 | $ | 430,225 | $ | 486,598 | $ | 413,780 | $ | 458,075 | $ | 350,462 | ||||||||||||
| Canada |
— | 9,585 | — | 11 | — | 22,050 | ||||||||||||||||||
| Europe |
32,009 | 11,668 | 38,471 | 31,345 | 80,792 | 20,704 | ||||||||||||||||||
| Mexico |
7,522 | 744 | 10,518 | 364 | 16,350 | 116 | ||||||||||||||||||
| Asia |
4,089 | 26,236 | 5,023 | 26,113 | 1,547 | 17,999 | ||||||||||||||||||
| Middle East |
— | 22,891 | — | 63,681 | — | 112,374 | ||||||||||||||||||
| Other |
— | 18,795 | — | 5,316 | — | 33,059 | ||||||||||||||||||
| Total |
$ | 520,144 | $ | 520,144 | $ | 540,610 | $ | 540,610 | $ | 556,764 | $ | 556,764 | ||||||||||||
F - 28
Table of Contents
NOTE 13 – SELECTED QUARTERLY FINANCIAL DATA (UNAUDITED)
A summary of the quarterly operating results during 2010 and 2009 follows:
| Year Ended December 31, 2010 |
First Quarter |
Second Quarter |
Third Quarter |
Fourth Quarter |
2010 Total |
|||||||||||||||
| (In Thousands, Except Per Share Amounts) | ||||||||||||||||||||
| Total revenues |
$ | 157,150 | $ | 124,660 | $ | 116,454 | $ | 121,880 | $ | 520,144 | ||||||||||
| Gross profit |
25,257 | 24,147 | 27,033 | 26,084 | 102,521 | |||||||||||||||
| Income from continuing operations |
10,106 | 8,516 | 14,650 | 4,392 | 37,664 | |||||||||||||||
| Earnings (loss) per share from continuing operations: [1] |
||||||||||||||||||||
| Basic |
0.66 | 0.56 | 0.96 | 0.29 | 2.47 | |||||||||||||||
| Diluted |
0.63 | 0.52 | 0.89 | 0.27 | 2.31 | |||||||||||||||
| Year Ended December 31, 2009 |
First Quarter |
Second Quarter |
Third Quarter |
Fourth Quarter |
2009 Total |
|||||||||||||||
| (In Thousands, Except Per Share Amounts) | ||||||||||||||||||||
| Total revenues |
$ | 125,974 | $ | 155,805 | $ | 95,784 | $ | 163,047 | $ | 540,610 | ||||||||||
| Gross profit |
26,230 | 27,802 | 14,023 | 12,370 | 80,425 | |||||||||||||||
| Income from continuing operations |
12,016 | 10,702 | 1,013 | (5,949 | ) | 17,782 | ||||||||||||||
| Earnings (loss) per share from continuing operations: [1] |
||||||||||||||||||||
| Basic |
0.80 | 0.71 | 0.07 | (0.39 | ) | 1.19 | ||||||||||||||
| Diluted |
0.79 | 0.69 | 0.06 | (0.38 | ) | 1.14 | ||||||||||||||
| [1] | The earnings (loss) per share is calculated from the weighted average common and common stock equivalents outstanding during each quarter, which may fluctuate based on quarterly income levels and market prices. Therefore, the sum of earnings per share information for each quarter may not equal the total year amounts. |
During 2010, the Company:
| • | incurred an additional $1.8 million in interest in the fourth quarter expense related the acceleration of debt issuance costs related to paying of the term note in the Credit Facility; |
| • | incurred an increase in professional fees of $1.1 million related to our public company registration; |
| • | received from the U.S. Bankruptcy Court an approved settlement of certain claims against us and our Deltak subsidiary. As a result of that settlement and the related compromise by the Company of its own claim against the fund that had been established pursuant to the Company’s Plan of Reorganization to be distributed to holders of allowed unsecured claims against Deltak, The Company received a cash payment of $2.8 million on July 27, 2010 and recognized such amount as revenue at that time; and |
| • | experienced favorable warranty reserve adjustments of $3.1 million related to the normal roll off of warranty periods and changes in managements’ estimates, based on historical claims activity, to further reduce the warranty reserves required. |
During 2009, the Company:
| • | experienced a gain on disposal of discontinued operations of $2.7 million resulting from a settlement agreement that was executed outlining the release of certain escrow funds pursuant to the sale of Global Power Asia, Ltd. in October 2007; and |
| • | experienced $10.7 million of cost overruns on a percentage-of-complete contract recognized late in 2009. |
F - 29
Table of Contents
VALUATION AND QUALIFYING ACCOUNTS
YEARS ENDED DECEMBER 31, 2010, 2009 AND 2008
| Additions | ||||||||||||||||||||
| Balance at Beginning of Period |
Charged to Costs and Expenses |
Charged to Other Accounts |
Deductions | Balance at End of Period |
||||||||||||||||
| (in thousands) | ||||||||||||||||||||
| 2010 | ||||||||||||||||||||
| Allowance for doubtful accounts |
$ | 1,588 | $ | 1,718 | $ | — | $ | (798 | ) | $ | 2,508 | |||||||||
| Accrued warranty reserves |
$ | 10,981 | $ | 187 | $ | — | $ | (5,119 | ) | $ | 6,049 | |||||||||
| Valuation allowance for deferred tax assets |
$ | 92,033 | $ | (36,797 | ) | $ | — | $ | — | $ | 55,236 | |||||||||
| 2009 | ||||||||||||||||||||
| Allowance for doubtful accounts |
$ | 3,122 | $ | 115 | $ | — | $ | (1,649 | ) | $ | 1,588 | |||||||||
| Accrued warranty reserves |
$ | 11,948 | $ | 1,912 | $ | — | $ | (2,879 | ) | $ | 10,981 | |||||||||
| Valuation allowance for deferred tax assets |
$ | 102,535 | $ | (10,502 | ) | $ | — | $ | — | $ | 92,033 | |||||||||
| 2008 | ||||||||||||||||||||
| Allowance for doubtful accounts |
$ | 8,001 | $ | 8,283 | $ | — | $ | (13,162 | ) | $ | 3,122 | |||||||||
| Accrued warranty reserves |
$ | 5,948 | $ | 6,550 | $ | — | $ | (550 | ) | $ | 11,948 | |||||||||
| Valuation allowance for deferred tax assets |
$ | 108,257 | $ | (5,722 | ) | $ | — | $ | — | $ | 102,535 | |||||||||
The “deductions” column of allowance for doubtful accounts represents write-offs of fully reserved accounts receivable net of recoveries.
The “deductions” column for accrued warranties represents settlements made during the period and the expiration of warranties on contracts sold in prior years that did not utilize the related reserve balance.
F - 30