Attached files
| file | filename |
|---|---|
| 8-K - FORM 8-K - Wendy's Co | d655522d8k.htm |
 ICR
XChange Conference January 13, 2014
Exhibit 99.1 |
 Forward-Looking Statements
This presentation, and certain information that management may discuss in connection with
this presentation, contains
certain
statements
that
are
not
historical
facts,
including
information
concerning
possible
or
assumed
future
results
of
our
operations.
Those
statements
constitute
“forward-looking
statements”
within
the
meaning
of the Private Securities Litigation Reform Act of 1995 (The “Reform Act”). For
all forward-looking statements, we claim the protection of the safe harbor for
forward-looking statements contained in the Reform Act. Many
important
factors
could
affect
our
future
results
and
could
cause
those
results
to
differ
materially
from
those expressed in or implied by our forward-looking statements. Such factors, all of
which are difficult or impossible to predict accurately, and many of which are
beyond our control, include but are not limited to those
identified
under
the
caption
“Forward-Looking
Statements”
in
our
news
release
issued
on
January
13,
2014
and
in
the
“Special
Note
Regarding
Forward-Looking
Statements
and
Projections”
and
“Risk
Factors”
sections of our most recent Form 10-K / Form 10-Qs.
The Company is currently in the process of finalizing its financial results for the three
months and full year ended
December
29,
2013.
All
financial
results
for
those
periods
included
in
this
presentation,
or
discussed
by
management in connection with this presentation, are unaudited preliminary estimates and
represent the most current information available to management. Therefore, it is
possible that actual results may differ materially from these estimates due to the
completion of financial closing procedures, final adjustments and other
developments that may arise between now and the time the financial results for the three
months and full year ended
December
29,
2013
are
finalized.
Accordingly,
readers
should
not
place
undue
reliance
on
these
estimates. |
 Non-GAAP Financial Measures
In addition, this presentation and certain information management may discuss in
connection with this presentation reference non-GAAP financial measures, such
as adjusted earnings before interest, taxes, depreciation and amortization, or
adjusted EBITDA, and adjusted earnings per share. Adjusted EBITDA and adjusted
earnings per share exclude certain expenses, net of certain benefits. Reconciliations of non-GAAP
financial measures to the most directly comparable GAAP financial measures are provided
in the Appendix to this presentation, and are included in our news release issued
on January 13, 2014 and posted on www.aboutwendys.com.
|
 President & CEO
EMIL BROLICK |
 2013
2013
Very Rewarding Year
* Open/Under Construction
Revitalizing
brand
proposition
to
“A
Cut
Above”
through
our
“Recipe
to
Win”
Regaining product innovation leadership with the successful launch of Pretzel
Bacon Cheeseburger, Pretzel Pub Chicken and Bacon Portabella Melt on Brioche
Provided 89% total shareholder return, including returning $141 million cash to
shareholders
System Optimization successfully launched, 384 of 415 restaurants sold/in
contract
or
LOI;
reduction
of
$30
million
in
G&A
on
track
for
2H
2014
Achieved Image Activation (IA) growth targets …100 Company, 99 Franchise*
Delivered Adjusted EBITDA growth of 10.1% and Adjusted EPS growth of 71% to
76% |
 Wendy’s “A Cut Above”
Investment
•
“A Cut Above”
Brand Positioning Is Unique, It’s Working, Has Legs
•
IA Repositioning Restaurant Experience To “New QSR”
Standard
•
Product/Price Segmentation Differentiating Brand And Growing SRS
•
System Optimization Impact, EBITDA Neutral, Lifting Margins,
Increasing Earnings Quality
•
New Leadership Team, Building 5-Star Organization Talent
•
Returning Significant Cash To Shareholders While Reinvesting
•
Excellent TSR Potential With Growth & Income |
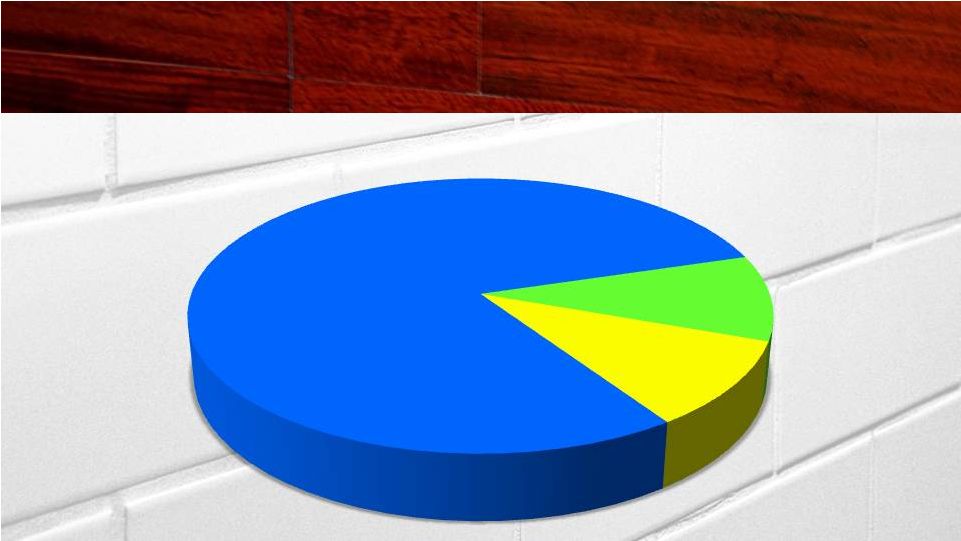 GROWTH…The Imperative
QSR
79%
Casual
Dining
10%
$435
Billion
Mid
Scale
10%
61+ Billion Visits
Source: NPD Crest
2013 Restaurant Industry Sales |
 QSR BEST
DELIVERS ON CONVENIENCE & VALUE NEEDS
11.1
11.2
76.3
10.3
9.8
78.5
+2.2
2008
2013
(1.4)
(0.8)
QSR
Mid Scale
Casual Dining
Traffic Share Y/E November
Source: NPD Crest |
 KEY BRAND
GROWTH DRIVERS BRAND
RELEVANCE
ECONOMIC MODEL
RELEVANCE |
 EXPERIENCE
HIGH
HIGH
LOW
LOW
FUNCTIONAL
FUNCTIONAL
EMOTIONAL
EMOTIONAL
BRAND VISION
A
B
C
New
QSR
Traditional
QSR |
 RECIPE
TO WIN PEOPLE
5-Star Talent
PRICE
New QSR Quality
PRODUCT
Playing a Different Game
PROMOTION
Tactically Brilliant
PLACE
Brand Transformation
PERFORMANCE
Keeping Brand Promise |
 2010
$1.418M
2011
$1.456M
2012
$1.484M
2013
$1.514M
Economic Model Improving…
N.A. COMPANY AUV |
 N.A.
COMPANY RESTAURANT MARGINS IMPROVING
2011
14.0%
2012
14.0%
2013
15.4% |
 2013A IMAGE ACTIVATION
IMAGE ACTIVATION
Company
200
* Open or Under Construction, pre-System Optimization ownership
2014E
126
110
215
Reimages
Including
New Builds
*
Company
100
Franchise
99
*
Reimages
150-200
195-245
Franchise |
 MESSAGE
MEDIA
MEDIA
CREATIVE
CREATIVE
PLAYING A DIFFERENT GAME |
 EXECUTE
EFFECTIVE HIGH-LOW STRATEGY PREMIUM
PRICE / VALUE |
 Source: Millward Brown as of August 2013
BRAND COMMUNICATIONS WORKING
BRAND COMMUNICATIONS WORKING
HIGHEST AWARENESS SINCE 2005
HIGHEST AWARENESS SINCE 2005
Total Communication Awareness
+8pts
vs 2011
40
48
2009
2010
2011
2012
YTD 2013 |
 HOW WE
GROW BRAND RELEVANCE + ECONOMIC RELEVANCE = GROWTH
Shareholder
Value-Enhancing
Initiatives
Core Organic
Growth
Strategies
Restaurant Ownership
Optimization
Financial Management
Global Growth
Restaurant Utilization &
Brand Access
New Restaurant Growth
Image / Experience Activation
North America Same-Restaurant Sales Growth |
 WHAT WE
CONTROL |
 Strategic
Reasons to Believe •
Strong Brand Heritage
•
Unique Brand Position
•
IA Contemporizing Brand Image
•
Strong Leadership Team, Growing 5-Star Talent
•
Economic Model Improving
•
Exceptional Franchisee Base and Commitment |
 Chief
Financial Officer TODD PENEGOR |
 FINANCIAL
UPDATE •
2013 Results
•
Image Activation Update
•
System Optimization Status
•
2014 & Long-Term Outlook
•
Plans to Build Shareholder Value |
 Q4
FINANCIAL HIGHLIGHTS N.A. Company SRS
3.1%
(0.2)%
2013
2012
Adjusted EBITDA*
$89.0M
$95.9M
(7.2)%
Adjusted EPS*
$0.10-0.11
$0.09
+11-22%
N.A. Company Rest. Margin
16.3%
15.9%
+40bps
* See reconciliation of Adjusted EBITDA and Adjusted EPS in the appendix
B/(W)
2-YEAR
2.9% |
 FULL YEAR
FINANCIAL HIGHLIGHTS N.A. Company SRS
1.9%
1.6%
2013
Adjusted EBITDA*
$367.1M
$333.3M
+10.1%
Adjusted EPS*
$0.29-0.30
$0.17
+71-76%
N.A. Company Rest. Margin
15.4%
14.0%
+140bps
* See reconciliation of Adjusted EBITDA and Adjusted EPS in the appendix
2012
B/(W)
2-YEAR
3.5% |
 Company
200
100
+100
Franchise*
150-200
99
+51-101
Total
350-400
199
+151-201
2013
2014
vs. 2013
REIMAGES
NEW BUILDS
Company
15
26
(11)
Franchise*
45
11
+34
Total
60
37
+23
* Open or Under Construction; excludes 24 Franchise Non-IA New Builds in
2013 Total IA Restaurants
410-460
236
+174-224
2013 IMAGE ACTIVATION TARGETS MET
2014 ACCELERATES
2014E |
 Image
Activation Aim for the SWEET SPOT
ECONOMICS
ECONOMICS
OPERATIONS
OPERATIONS
CONSUMERS
CONSUMERS
Solution: Ultra Modern Design with Customizable Upgrades
|
 |
 ONE SIZE
DOES NOT FIT ALL ~40%
~60%
25-40 YEARS OLD
< 25 YEARS OLD
Solutions for 85-90% of System
Solutions for 85-90% of System |
 IA
Target Investment and Return Designing for Optimal Financial Returns
Investment
$450-650K
$1.5-1.9M
Reimages*
Scrape &
Rebuilds*
Sustainable Sales Lift
10-20%
25-35%
Profit Flow Through
40%
40%
Percent Of IA
80%
20%
* Estimates based on Company’s current outlook; Excludes Maintenance;
Median Cost for U.S. System Construction Closure
5 weeks
13 weeks |
 System
Optimization Supports Growth Strategic Growth Initiative to Sell 415
Company-Owned Restaurants •
Concentrates Company Ownership to about 15%
•
Generates Higher Restaurant Operating Margin
•
Improves Quality and Predictability of Earnings
•
Executing in an EBITDA Neutral Fashion
•
Selling to 5-Star Franchisees who Support Wendy’s
Growth Initiatives
Sales Agreements will Include Commitments to Image Activate
180 Restaurants and Develop 100 New Restaurants over 5 Years
|
 System
Optimization Progress SOLD IN 2013
243
$138M
SOLD IN 2013
243
$138M
BUYERS IDENTIFIED
31
**
BUYERS IDENTIFIED
31
**
TOTAL
415
$235M
TOTAL
415
$235M
UNDER CONTRACT*
141
**
UNDER CONTRACT*
141
**
* Executed Asset Purchase Agreement or LOI
**
**
RESTAURANTS
PROCEEDS
** Estimated Cash Proceeds Including Technical Assistance Fees
|
 Continued
Momentum in 2014 1.6%
1.9%
2.5-3.5%
2012
2013
2014
SRS GROWTH
+60-160 bps
+30 bps
A
A
E
14.0%
15.4%
16.8-17.0%
2012
2013
2014
RESTAURANT MARGINS
+140 bps
+140-160 bps
A
A
E
N.A. Company Operated Restaurants |
 Continued
Momentum in 2014 $333M
$367M
$390-400M
2012
2013
2014
ADJUSTED EBITDA
+10%
+6-9%
A
A
E
17¢
29-30¢
34-36¢
2012
2013
2014
ADJUSTED EPS
+71-76%
Mid-teens +
A
A
E
See reconciliation of Adjusted EBITDA and Adjusted EPS in appendix
|
 2013
Adjusted EBITDA
$367M
Core
Restaurant
$30 -
$40M
Franchise Rev
& G&A Savings
$70 -
$80M
IA Impact
$0 -
$(5)M
2014E Adjusted
EBITDA
$390 -
$400M
Sold
Restaurants
$(75) -
$(80)M
2014 Improved Quality of Earnings
Expecting 6-9% Adjusted EBITDA Growth with 415 Fewer Restaurants
See reconciliation of Adjusted EBITDA and Adjusted EPS in appendix
|
 Long-Term Outlook
SAME RESTAURANT
SALES
3% +
ADJUSTED
EBITDA
Growth Rate in the High-Single
to Low-Double Digit Range
ADJUSTED
EPS
Growth Rate in Mid-Teens |
 Image
Activation System Adoption Accelerating Company Providing Leadership, Franchisees
Quickly Surpassing 2011A
2012A
2013A
2014E
2015E
2016E
2017E
COMPANY
10
57
126
215
FRANCHISE
0
2
110
195
to
245
2011A
2012A
2013A
2014E
2015E
2016E
2017E
85% COMPANY ADOPTION YE 2017
35% SYSTEM ADOPTION YE 2017
Includes Reimages & New Builds, pre-System Optimization ownership
|
 $280-290M
$275-300M
$250-275M
$175-200M
$100-125M
2014E
2015E
2016E
2017E
2018E
Investment Expected to Peak in 2014/2015 to Drive Image Activation
Capital Spending
Long-Term Perspective |
 Image Activation Investment Drives Accelerated Adjusted EBITDA Growth
2014E
2015E
2016E
2017E
2018E
Low-Double
High-Single
Adjusted EBITDA Growth
Long-Term Perspective |
 CASH
PRIORITIES Building Shareholder Value
Invest in our Business
Invest in our Business
Image Activation Reimages, including Increasing Scrape &
Rebuilds
Dividend Growth
Dividend Growth
Generally in line with EPS growth (subject to Board approval)
Share Repurchase
Share Repurchase
Offset ongoing options dilution beyond 2014
Ended 2013
with $580M
of Cash |
  Returning
Cash to Shareholders $275M
Completed $69M of Share Repurchases in 2013
Board Authorized
a Share Repurchase Program
for 2014
Expect Dutch Tender to Commence Tomorrow (Jan. 14)
Price Range of $8.50-$9.25
Leverages “Excess”
Cash
Proceeds from System Optimization of $235M
Arby’s Distribution of $40M
* See “Important Information Regarding the Anticipated Tender Offer”
in the appendix |
 Building
A Stronger Wendy’s •
Results Exceeded Adjusted EBITDA/EPS Guidance
•
Restaurant Economic Model Improving
•
2013 Image Activation Targets Met; Accelerates for 2014
•
System Optimization Enhancing Quality of Earnings
•
Finished 2013 with Significant Cash
•
2014 Positioned for Another Solid Year
•
Long-Term Guidance on Track |
 ICR
Xchange Conference January 13, 2014 |
 Important
Information Regarding the Anticipated Tender Offer This presentation
is for informational purposes only and is not an offer to buy or the solicitation of
an offer to sell any shares of the Company’s common stock. The
anticipated tender offer described in this presentation
has not yet commenced, and there can be no assurances that the
Company will commence the tender offer on the terms described in
this presentation or at all. If
the Company commences the offer, the offer will be made solely by an Offer to Purchase
and the related Letter of Transmittal, as they may be amended or
supplemented. Stockholders and investors are urged to read the
Company’s commencement tender offer statement on Schedule TO anticipated to
be filed with the SEC in connection with the offer, which will include as
exhibits the Offer to Purchase, the related Letter of Transmittal and other
offer materials, as well as any amendments or supplements to the Schedule TO
when they become available, because they will contain important
information. If the Company commences the offer, each of these documents
will be filed with the SEC, and, when available, investors may obtain them for free
from the SEC at its website (www.sec.gov) or from the Company’s information
agent in connection with the offer. |
 Low
End High End
2013
2013
2012
Adjusted EBITDA from continuing operations
89,011
$
89,011
$
95,883
$
(Less) plus:
Pension withdrawal expense in cost of sales
(13,500)
(13,500)
-
Depreciation and amortization
(47,518)
(47,518)
(36,840)
Facilities action (income) charges, net
16,040
16,040
(13,470)
Impairment of long-lived assets
(10,552)
(10,552)
(13,316)
Impairment of goodwill
(9,397)
(9,397)
-
Costs associated with closed restaurants in other operating
expense (income), net
-
-
-
Operating profit
24,084
24,084
32,257
Interest expense
(13,464)
(13,464)
(20,801)
Loss on early extinguishment of debt
(7,544)
(7,544)
-
Investment income, net
21,202
21,202
6,786
Other income (expense), net
233
233
551
Income (loss) from continuing operations before income taxes
and noncontrolling interests
24,511
24,511
18,793
Benefit from (provision for) income taxes
527
4,027
6,616
Income from continuing operations
25,038
28,538
25,409
Discontinued operations:
(Loss) income from discontinued operations, net of income taxes
(266)
(266)
1,167
Loss on disposal of discontinued operations, net of income taxes
-
-
(188)
Net (loss) income from discontinued operations
(266)
(266)
979
Net income
24,772
28,272
26,388
Net loss (income) attributable to noncontrolling
interests 410
410
-
Net income attributable to The Wendy's Company
25,182
$
28,682
$
26,388
$
Explanatory
Note:
The
Company
has
not
yet
completed
its
tax
closing
procedures
for
2013.
As
a
result,
the
Company
is
reporting
2013
Adjusted Earnings Per Share, and earnings per share as ranges. The above table
shows the low and high ends of the estimated range. Three Months
Estimated Range
Reconciliation of Adjusted EBITDA from Continuing Operations
to Net Income Attributable to The Wendy's Company
(In Thousands)
(Unaudited) |
 Low
End High End
2013
2013
2012
Adjusted EBITDA from continuing operations
367,133
$
367,133
$
333,328
$
(Less) plus:
Pension withdrawal expense in cost of sales
(13,500)
(13,500)
-
Depreciation and amortization
(182,359)
(182,359)
(146,976)
Facilities action (income) charges, net
(15,650)
(15,650)
(41,031)
Impairment of long-lived assets
(15,879)
(15,879)
(21,097)
Impairment of goodwill
(9,397)
(9,397)
-
Costs associated with closed restaurants in other operating
expense (income), net
-
-
(1,477)
Operating profit
130,348
130,348
122,747
Interest expense
(69,012)
(69,012)
(98,604)
Loss on early extinguishment of debt
(28,563)
(28,563)
(75,076)
Investment income, net
23,565
23,565
36,243
Other income (expense), net
(2,080)
(2,080)
1,565
Income (loss) from continuing operations before income taxes
and noncontrolling interests
54,258
54,258
(13,125)
Benefit from (provision for) income taxes
(17,247)
(13,747)
21,083
Income from continuing operations
37,011
40,511
7,958
Discontinued operations:
(Loss) income from discontinued operations, net of income taxes
(266)
(266)
1,951
Loss on disposal of discontinued operations, net of income taxes
-
-
(442)
Net (loss) income from discontinued operations
(266)
(266)
1,509
Net income
36,745
40,245
9,467
Net loss (income) attributable to noncontrolling
interests 855
855
(2,384)
Net income attributable to The Wendy's Company
37,600
$
41,100
$
7,083
$
Explanatory
Note:
The
Company
has
not
yet
completed
its
tax
closing
procedures
for
2013.
As
a
result,
the
Company
is
reporting
2013
Adjusted Earnings Per Share, and earnings per share as ranges. The above table
shows the low and high ends of the estimated range. Reconciliation of Adjusted
EBITDA from Continuing Operations to Net Income Attributable to The Wendy's
Company (In Thousands)
(Unaudited)
Twelve Months
Estimated Range |
 Per
share Per share
Per share
Adjusted income and adjusted earnings per share from continuing
operations 40,976
$
0.10
$
44,476
$
0.11
$
33,629
$
0.09
$
(Less) plus:
Impairment of goodwill
(9,207)
(0.02)
(9,207)
(0.02)
-
-
Depreciation of assets that will be replaced as part of the Image Activation
initiative (8,510)
(0.02)
(8,510)
(0.02)
-
-
Pension withdrawal expense in cost of sales
(8,286)
(0.02)
(8,286)
(0.02)
-
-
Impairment of long-lived assets
(6,567)
(0.02)
(6,567)
(0.02)
(8,216)
(0.02)
Loss on early extinguishment of debt
(4,692)
(0.01)
(4,692)
(0.01)
-
-
Facilities action (income) charges, net
6,774
0.02
6,774
0.02
(8,311)
(0.02)
Dividends from Arby's
14,550
0.03
14,550
0.03
2,868
0.01
Benefits of prior years' tax matters
-
-
-
-
5,439
0.01
Total adjustments
(15,938)
(0.04)
(15,938)
(0.04)
(8,220)
(0.02)
Income from continuing operations
25,038
0.06
28,538
0.07
25,409
0.07
Net (loss) income from discontinued operations
(266)
(0.00)
(266)
(0.00)
979
0.00
Net income
24,772
0.06
28,272
0.07
26,388
0.07
Net loss attributable to noncontrolling interests
410
0.00
410
0.00
-
-
Net income and earnings per share attributable to The Wendy's
Company 25,182
$
0.06
$
28,682
$
0.07
$
26,388
$
0.07
$
Per share
Per share
Per share
Adjusted income and adjusted earnings per share from continuing
operations 116,108
$
0.29
$
119,608
$
0.30
$
65,316
$
0.17
$
(Less) plus:
Facilities action (income) charges, net
(24,101)
(0.06)
(24,101)
(0.06)
(25,349)
(0.07)
Depreciation of assets that will be replaced as part of the Image Activation
initiative (23,822)
(0.06)
(23,822)
(0.06)
-
-
Loss on early extinguishment of debt
(17,829)
(0.05)
(17,829)
(0.05)
(46,547)
(0.12)
Impairment of long-lived assets
(9,899)
(0.02)
(9,899)
(0.02)
(13,017)
(0.04)
Impairment of goodwill
(9,207)
(0.02)
(9,207)
(0.02)
-
-
Pension withdrawal expense in cost of sales
(8,286)
(0.02)
(8,286)
(0.02)
-
-
(Loss) gain on sale of investment, net
(503)
(0.00)
(503)
(0.00)
17,978
0.05
Dividends from Arby's
14,550
0.03
14,550
0.03
2,868
0.01
Benefits of prior years' tax
matters -
-
-
-
7,620
0.02
Costs associated with closed restaurants in other operating expense (income),
net -
-
-
-
(911)
(0.00)
Total adjustments
(79,097)
(0.20)
(79,097)
(0.20)
(57,358)
(0.15)
Income from continuing operations
37,011
0.09
40,511
0.10
7,958
0.02
Net (loss) income from discontinued
operations (266)
(0.00)
(266)
(0.00)
1,509
0.00
Net income
36,745
0.09
40,245
0.10
9,467
0.02
Net loss (income) attributable to noncontrolling
interests 855
0.00
855
0.00
(2,384)
(0.00)
Net income and earnings per share attributable to The Wendy's
Company 37,600
$
0.09
$
41,100
$
0.10
$
7,083
$
0.02
$
Three Months
2013
Low End
High End
Estimated Range
Twelve Months
2013
2012
2013
2012
Estimated Range
Low End
High End
2013
Reconciliation of Adjusted Income and Adjusted Earnings Per Share from Continuing
Operations to Net Income and Earnings Per Share Attributable to The Wendy's
Company (In Thousands Except Per Share Amounts)
(Unaudited)
Explanatory Note: The Company has not yet completed its tax closing procedures for 2013. As a
result, the Company is reporting 2013 net Adjusted Earnings Per Share, and earnings per
share as ranges. The above table shows the low and high ends of the estimated range. |