Attached files
| file | filename |
|---|---|
| 8-K - FORM 8-K - Fidelity & Guaranty Life | d658993d8k.htm |
| EX-99.1 - EX-99.1 - Fidelity & Guaranty Life | d658993dex991.htm |
Exhibit 99.2
FIDELITY & GUARANTY LIFE HOLDINGS, INC.
ITEM 2: Management’s Discussion and Analysis of Financial Condition and Results of Operations
Management’s discussion and analysis reviews our audited consolidated financial position at September 30, 2013, and the audited consolidated results of operations for fiscal year ended September 30, 2013, and where appropriate, factors that may affect future financial performance. This analysis should be read in conjunction with our audited Consolidated Financial Statements and notes thereto appearing elsewhere in this Form 10-K.
Dollar amounts in the accompanying discussion are presented in millions, unless otherwise noted.
Presentation of Financial Information
Certain financial data relating to FGL Insurance and our other insurance subsidiaries have been derived from their statutory financial statements, which are based on SAP permitted or prescribed by the insurance regulator in their state of domicile. Statutory accounting varies in certain respects from U.S. GAAP. See Note 16 to our audited consolidated financial statements for a discussion of these differences. In particular, our statutory financial statements continue to apply a December 31 calendar year end, as they did before the FGLH Acquisition, and such financial statements were not subject to the acquisition method adjustments, which only affected our U.S.GAAP financial statements.
Due to these changes, as well as significant changes in our business strategy since the FGLH Acquisition, we do not believe it would be useful to compare our results of operations in pre- and post-acquisition periods. Therefore, our “Management’s Discussion and Analysis of Financial Condition and Results of Operations” addresses the following periods:
| • | Fiscal Year Ended September 30, 2013 compared to Fiscal Year Ended September 30, 2012. We refer to these periods as Fiscal 2013 and Fiscal 2012, respectively. The audited consolidated financial statements for Fiscal 2013 and Fiscal 2012, respectively, are included in the accompany financial statements. |
| • | Period from April 6, 2011 to September 30, 2011. We have provided a discussion of this period without comparison to prior or subsequent periods, as it represents a stub period subsequent to the FGLH Acquisition. As such, we do not believe it would be useful to compare our results of operations in pre and post-acquisition periods. |
Overview
We provide our principal life and annuity products through our insurance subsidiaries-FGL Insurance and FGL NY Insurance. Our customers range across a variety of age groups and are concentrated in the middle-income market. Our fixed indexed annuities provide for pre-retirement wealth accumulation and post-retirement income management. Our life insurance provides wealth protection and transfer opportunities through indexed universal life products. Life and annuity products are primarily distributed through IMOs and independent insurance agents.
Our principal products are sold through a network of approximately 200 independent marketing organizations (“IMOs”) representing approximately 20,000 independent agents and managing general agents. As of September 30, 2013, we had over 700,000 policyholders nationwide and we distribute our products throughout the United States.
We identify our most important 34 IMOs as “Power Partners.” Our Power Partners are currently comprised of 20 annuity IMOs and 14 life insurance IMOs. For the fiscal year ended September 30, 2013, these Power Partners accounted for approximately 78% of our sales volume. We believe that our relationships with these IMOs are strong. The average tenure of the top ten Power Partners is approximately 12 years.
Fixed annuities represent an important type of insurance policy or retirement and savings plan, and we believe these products deliver investment returns and predictable income streams to customers. In addition, we believe life insurance products present customers with a complementary alternative to annuities which allow the policyholder to earn returns on their premiums and provide a payment to the designated beneficiary upon the policyholder’s death. A significant portion of our business involves indexed products, such as FIAs and IULs. In calendar year 2013, FIAs generated approximately 94% of our total sales. These fixed indexed products tie contractual returns to specified market indices, such as the S&P 500 Index. The benefit of FIAs to our customers is to provide a portion of the gains of an underlying market index without the risk of losing the original principal. Our annuity contracts generally
1
FIDELITY & GUARANTY LIFE HOLDINGS, INC.
include “surrender charges” that discourage early redemptions. In addition, the majority of these contracts contain provisions that permit us to annually reset the parameters of the formula by which index credits are provided in response to changing market conditions
For the Fiscal Year 2013, we have written approximately $40.9 million in premiums for indexed universal life insurance policies.
Since the FGLH Acquisition, we have made several significant changes to our business. We have ceded the majority of our life insurance business, with the exception of traditional life products that contain return of premium riders, to Wilton Re to transfer the risk of the lifetime guarantee on a large portion of the universal life insurance line of business; we reduced the number of product offerings to concentrate on capital efficient products and to this end have launched several new FIA products; we began managing a significant portion of our investment portfolio internally; and we re-positioned our investment portfolio by shortening the overall duration, all of which are described in more detail below. These changes have positively impacted our recent net income and profitability.
Trends and Uncertainties
The following factors represent some of the key trends and uncertainties that have influenced the development of our business and our historical financial performance and that we believe will continue to influence our business and financial performance in the future.
Market Conditions
Market volatility has affected and may continue to affect our business and financial performance in varying ways. Volatility can pressure sales and reduce demand as consumers hesitate to make financial decisions. In the long-term, however, we believe that the 2008 through 2010 financial crisis and resultant lingering financial uncertainty will motivate individuals to seek solutions combining elements of capital preservation, income and growth. We believe current market conditions may ultimately enhance the attractiveness of our product portfolio. We continue to monitor the behavior of our customers, as evidenced by mortality rates, morbidity rates, annuitization rates and lapse rates, which adjust in response to changes in market conditions in order to ensure that our products and services remain attractive and profitable.
Interest Rate Environment
The current low interest rate environment has affected and is likely to continue to affect the demand for our products and our financial performance. Our investment portfolio, which had a fair value of approximately $16.2 billion as of September 30, 2013, consists predominantly of fixed income investments. As investments that were made in a relatively higher interest rate environment mature, we earn a lower yield as we reinvest the proceeds. Over the next 5 years, we’re expecting $6,097 million in maturities, calls, and pay-downs with an average statutory book yield of 4.65%. Assets remaining after five years have an average statutory book yield of 5.20%. This projection excludes the impact of $800 million of cash and $600 million of T-bills held temporarily at September 30, 2013. The excess cash and proceeds of T-bill sales occurring in October 2013 will be reinvested during the first quarter of the 2014 Fiscal Year, which will marginally but not materially increase maturities, calls, and pay-downs over the next five years, and will not increase the reinvestment risk from asset cash flows. There is no reinvestment risk resulting from these asset cash flows, because asset-liability modeling indicates no net reinvestment cash flow risk during the next five years. The current average yield on our fixed income investment portfolio is approximately 5.0%, and we currently anticipate that proceeds that are reinvested in fixed income investments in the second half of 2013 will earn an average yield in the range of 5.0% to 5.5%. If prevailing interest rates were to rise, we believe the yield on our new investment purchases would also rise and positively impact earnings. Rising interest rates also influence the prices of fixed income investments that we sell on the secondary market rather than holding until maturity or repayment, with rising interest rates generally leading to lower prices in the secondary market, and falling interest rates generally leading to higher prices.
2
FIDELITY & GUARANTY LIFE HOLDINGS, INC.
Certain of our products include guaranteed minimum crediting rates, most notably our fixed rate annuities. As of September 30, 2013, the GAAP reserves and average crediting rate on our fixed rate annuities were $2.5 billion and 3.5%, respectively. We are required to pay these guaranteed minimum crediting rates even if earnings on our investment portfolio decline, which would negatively impact earnings. In addition, we expect more policyholders to hold policies with comparatively high guaranteed rates for a longer period in a low interest rate environment. Conversely, a rise in average yield on our investment portfolio would positively impact earnings if the average interest rate we pay on our products does not rise correspondingly. Similarly, we expect that policyholders would be less likely to hold policies with existing guarantees as interest rates rise and the relative value of other new business offerings are increased, which would negatively impact our earnings and cash flows.
See “Management’s Discussion and Analysis of Financial Condition and Results of Operations- Quantitative and Qualitative Disclosures about Market Risk” for a more detailed discussion of interest rate risk.
Aging of the U.S. Population
We believe that the aging of the U.S. population will affect the demand for our products. As the “baby boomer” generation prepares for retirement, we believe that demand for retirement savings, growth and income products will grow. The impact of this growth may be offset to some extent by asset outflows as an increasing percentage of the population begins withdrawing assets to convert their savings into income.
Industry Factors and Trends Affecting Our Results of Operations
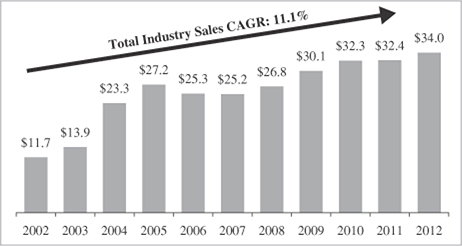
Demographics and macroeconomic factors are increasing the demand for our FIA and IUL products, for which demand is large and growing: over 10,000 people will turn 65 each day in the United States over the next 15 years. The proportion of the U.S. population over the age of 65 is expected to grow from 13% in 2010 to 18% in 2030. Due to a turbulent period for the stock market in 2007 and 2008, many middle-income Americans have grown to appreciate the security these indexed products afford. As a result, the IUL market expanded from $100 million of annual premiums in 2002 to over $1.3 billion of annual premiums in 2012. Similarly, the FIA market grew from nearly $12 billion of sales in 2002 to $34 billion of sales in 2012.
3
FIDELITY & GUARANTY LIFE HOLDINGS, INC.
The following charts demonstrate relevant market trends:
FIA Industry Sales
(dollars in billions)
IUL Industry Sales
(dollars in millions)
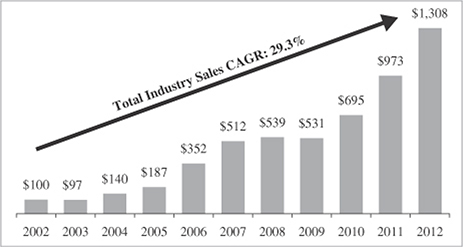
Source: Wink, Inc. (formerly AnnuitySpecs)
4
FIDELITY & GUARANTY LIFE HOLDINGS, INC.
Competition
Our insurance subsidiaries operate in highly competitive markets. We face a variety of large and small industry participants. These companies compete for the growing pool of retirement assets driven by a number of exogenous factors, such as the continued aging of the U.S. population and the reduction in financial safety nets provided by governments and corporations. In many segments, product differentiation is difficult as product development and life cycles have shortened.
The top three sellers of FIAs accounted for 37% of total FIA sales for the nine months ended September 30, 2013, the top ten carriers accounted for 72% and no single carrier represented more than 14%. During this same time period, we had a market share of approximately 3% and 1% for FIAs and IULs, respectively. The composition of the IUL segment resembles that of the FIA segment. The top three carriers accounted for 30% of total IUL sales, the top ten carriers accounted for 65% and no single carrier represented more than 14%. Our own sales of FIAs and IULs by quarter in recent years were as follows:
| FIA Sales | IUL Sales | |||||||||||||||||||||||||||||||
| (in millions) |
Fiscal 2010 | Fiscal 2011 | Fiscal 2012 | Fiscal 2013 | Fiscal 2010 | Fiscal 2011 | Fiscal 2012 | Fiscal 2013 | ||||||||||||||||||||||||
| Q1 |
$ | 177.9 | $ | 200.6 | $ | 344.5 | $ | 243.1 | $ | 3.3 | $ | 4.5 | $ | 4.2 | $ | 5.5 | ||||||||||||||||
| Q2 |
161.4 | 126.6 | 539.8 | 238.6 | 3.2 | 3.4 | 4.5 | 4.3 | ||||||||||||||||||||||||
| Q3 |
194.8 | 142.1 | 461.4 | 263.8 | 4.3 | 4.1 | 3.4 | 4.3 | ||||||||||||||||||||||||
| Q4 |
218.3 | 167.8 | 259.8 | 237.3 | 3.4 | 4.3 | 4.0 | 4.7 | ||||||||||||||||||||||||
| Total |
$ | 752.4 | $ | 637.1 | $ | 1,605.5 | $ | 982.8 | $ | 14.2 | $ | 16.3 | $ | 16.1 | $ | 18.8 | ||||||||||||||||
We had a different business model prior to the FGLH Acquisition and, since 2010, have changed our business model and reinsured substantially all of our life business as of the FGLH Acquisition Date. Thus, we do not have comparable sales data for the period from 2002 to 2010. As illustrated in “-Industry Factors and Trends Affecting Our Results of Operations” above, the FIA market grew 132% between years 2002 to 2005 before leveling off until 2009, when the market reached the first of four record years through modest growth. We believe we were a key contributor to the FIA market’s early growth, ranking in the top five in terms of market share from 2003 through 2007. Our compounded annual growth rate (“CAGR”) for the period from fiscal 2010 to September 30, 2013 is 9.3% for FGL Insurance’s FIAs and 9.8% for FGL Insurance’s IULs. Our favorable FIA results were due to the successful introduction of Prosperity Elite in September 2011, our first new product launch since the FGLH Acquisition. The new product re-engaged our distribution outlets, which increased our market share back into the top ten. Even though FGL Insurance’s IULs showed significant sales growth, the industry showed a higher growth rate, which we believe was largely due to FGL Insurance’s lower financial strength ratings relative to our main competitors.
We believe that our strong presence in the FIA market and the longevity of our relationships with our leading IMOs position us to effectively serve consumers’ increasing demand for retirement savings, income and protection solutions. We maintain strong relationships with the IMOs through product innovation, attention, and compensation. Frequent new product introductions give our IMOs something new to sell while we maintain shelf relevance. A distinct benefit to selling our products is the potential for IMOs to design products in partnership with us and have the exclusive right to sell such products for a specified time period. Our IMOs receive a high level of service from operations and direct access to senior management. Lastly, our strong compensation plan, including overrides, production bonuses and potential to participate in the Power Partner Incentive program, is designed to keep loyalty strong.
Fiscal Year 2012 shows the impact of the release of Prosperity Elite, a product developed with one of our leading IMOs. The product includes competitive features and commissions meeting our profitability targets. The IMO remained loyal with us even as we adjusted our sales volume to maintain profitability.
5
FIDELITY & GUARANTY LIFE HOLDINGS, INC.
Key Components of Our Historical Results of Operations
Under U.S. GAAP, premium collections for fixed indexed and fixed rate annuities and immediate annuities without life contingency are reported as deposit liabilities (i.e., contract holder funds) instead of as revenues. Similarly, cash payments to customers are reported as decreases in the liability for contractholder funds and not as expenses. Sources of revenues for products accounted for as deposit liabilities are net investment income, surrender and other charges deducted from contractholder funds, and net realized gains (losses) on investments. Components of expenses for products accounted for as deposit liabilities are interest-sensitive and index product benefits (primarily interest credited to account balances or the cost of providing index credits to the policyholder), amortization of DAC and VOBA, other operating costs and expenses, and income taxes.
Earnings from products accounted for as deposit liabilities are primarily generated from the excess of net investment income earned over the interest credited or the cost of providing index credits to the policyholder, known as the net investment spread. With respect to FIAs, the cost of providing index credits includes the expenses incurred to fund the annual index credits, and where applicable, minimum guaranteed interest credited. Proceeds received upon expiration or early termination of call options purchased to fund annual index credits are recorded as part of the change in fair value of derivatives, and are largely offset by an expense for index credits earned on annuity contractholder fund balances.
Our profitability depends in large part upon the amount of assets under management (“AUM”), the net investment spreads earned on our AAUM, our ability to manage our operating expenses and the costs of acquiring new business (principally commissions to agents and bonuses credited to policyholders). As we grow AUM, earnings generally increase. AUM increases when cash inflows, which include sales, exceed cash outflows. Managing net investment spreads involves the ability to manage our investment portfolios to maximize returns and minimize risks on our AUM such as interest rate changes and defaults or impairment of investments, and our ability to manage interest rates credited to policyholders and costs of the options and futures purchased to fund the annual index credits on the FIAs or IULs. We analyze returns on AAUM pre- and post-DAC and VOBA as well as pre- and post-tax to measure our profitability in terms of growth and improved earnings.
Pretax Adjusted Operating Income
Pretax Adjusted Operating Income (“Pretax AOI”) is an economic measure we use to evaluate financial performance each period for the periods subsequent to the FGLH Acquisition.
Pretax AOI is calculated by adjusting income before income taxes to adjust for interest expense and certain gains realized from the FGLH Acquisition, to eliminate the impact of net investment gains, excluding gains and losses on derivatives and including net OTTI losses recognized in operations, the effect of changes in the rates used to discount the FIA embedded derivative liability, the effects of acquisition-related reinsurance transactions, net of the corresponding DAC and VOBA impact related to these adjustments. These items fluctuate period-to-period in a manner inconsistent with our core operations. Accordingly, we believe using a measure which excludes their impact is effective in analyzing the trends of our operations. Together with income before income taxes, we believe Pretax AOI and Return on AAUM provide meaningful financial metrics that help investors understand our underlying results and profitability.
Pretax AOI should not be used as a substitute for income before income taxes. However, we believe the adjustments made to operating income in order to derive Pretax AOI are significant to gaining an understanding of our overall results of operations. For example, we could have strong operating results in a given period, yet report income before income taxes that is materially less, if during such period the fair value of our derivative assets hedging the FIA index credit obligations decreased due to general equity market conditions but the embedded derivative liability related to the index credit obligation did not decrease in the same proportion as the derivative assets because of non-equity market factors such as interest rate movements. Similarly, we could also have poor operating results in a given period yet show operating income that is materially greater, if during such period the fair value of the derivative assets increases but the embedded derivative liability did not increase in the same proportion as the derivative assets. We hedge our FIA index credits with a combination of static and dynamic strategies, which can result in earnings volatility, the effects of which are generally likely to reverse over time. Our management and
6
FIDELITY & GUARANTY LIFE HOLDINGS, INC.
board of directors review Pretax AOI, and Return on AAUM and income before income taxes as part of their examination of our overall financial results. However, these examples illustrate the significant impact derivative and embedded derivative movements can have on our income before income taxes. Accordingly, our management and board of directors perform an independent review and analysis of these items, as part of their review of our hedging results each period.
The adjustments to income before income taxes are net of DAC and VOBA amortization. Amounts attributable to the fair value accounting for derivatives hedging the FIA index credits and the related embedded derivative liability fluctuate from period to period based upon changes in the fair values of call options purchased to fund the annual index credits for FIAs, changes in the interest rates used to discount the embedded derivative liability, and the fair value assumptions reflected in the embedded derivative liability. The accounting standards for fair value measurement require the discount rates used in the calculation of the embedded derivative liability to be based on risk-free interest rates. The impact of the change in risk-free interest rates has been removed from operating income. Additionally, in evaluating our operating results, the effects of transaction-related reinsurance have been removed from reported operating income. For Fiscal 2012, these effects reflect one-time settlement adjustments related to the cession of significantly all of FGL Insurance’s remaining life insurance business that it had retained upon acquisition. For Fiscal 2013, these adjustments reflect the increase in fair value of the reinsurance related embedded derivative which is based on the change in fair value of the underlying assets held in the Front Street funds withheld portfolio.
In addition, we regularly monitor and report the production volume metric titled “Sales”. Sales are not derived from any specific GAAP income statement accounts or line items and should not be view as a substitute for any financial measure determined in accordance with GAAP. Management believes that presentation of sales as measured for management purposes enhances the understanding of our business and helps depict longer term trends that may not be apparent in the results of operations due to the timing of sales and revenue recognition.
7
FIDELITY & GUARANTY LIFE HOLDINGS, INC.
Results of Operations
Fiscal Year Ended September 30, 2013, 2012 and period from April 6, 2011 to September 30, 2011.
The following tables set forth the consolidated results of operations for Fiscal 2013, 2012 and the period April 6, 2011 to September 30, 2011:
| Fiscal Year | ||||||||||||
| 2013 | 2012 | April 6, 2011 to September 30, 2011 |
||||||||||
| Revenues: |
||||||||||||
| Premiums |
$ | 58.4 | $ | 55.3 | $ | 39.0 | ||||||
| Net investment income |
672.9 | 716.2 | 369.8 | |||||||||
| Net investment gains (losses) |
544.6 | 410.0 | (166.9 | ) | ||||||||
| Insurance and investment product fees and other |
57.7 | 40.3 | 48.9 | |||||||||
|
|
|
|
|
|
|
|||||||
| Total revenues |
$ | 1,333.6 | $ | 1,221.8 | $ | 290.8 | ||||||
|
|
|
|
|
|
|
|||||||
| Benefits and expenses: |
||||||||||||
| Benefits and other changes in policy reserves |
496.7 | 777.4 | 247.6 | |||||||||
| Acquisition and operating expenses, net of deferrals |
98.5 | 119.9 | 72.4 | |||||||||
| Amortization of intangible assets |
225.0 | 160.7 | (11.1 | ) | ||||||||
|
|
|
|
|
|
|
|||||||
| Total benefits and expenses |
$ | 820.2 | $ | 1,058.0 | $ | 308.9 | ||||||
|
|
|
|
|
|
|
|||||||
| Operating Income (loss) |
513.4 | 163.8 | (18.1 | ) | ||||||||
| Interest expense |
(20.4 | ) | (23.5 | ) | (15.4 | ) | ||||||
|
|
|
|
|
|
|
|||||||
| Income (loss) before income taxes |
493.0 | 140.3 | (33.5 | ) | ||||||||
| Income tax (expense) benefit |
(156.1 | ) | 145.7 | (41.7 | ) | |||||||
|
|
|
|
|
|
|
|||||||
| Net income |
$ | 336.9 | $ | 286.0 | $ | 8.2 | ||||||
|
|
|
|
|
|
|
|||||||
8
FIDELITY & GUARANTY LIFE HOLDINGS, INC.
Net income for Fiscal 2013 was $336.9 million, an increase of $50.9 million, from $286.0 million for the Fiscal 2012. Income before taxes in Fiscal 2013 was $493.0 million, an increase of $352.7 million, from $140.3 million for Fiscal 2012. The increase in pre-tax income was primarily due to trading gains on our available-for-sale (“AFS”) portfolio, the revaluation of assets and liabilities to reflect increased interest rates, the impact of the implementation of the annual assumption review recommendations on the FIA embedded derivative reserve and DAC amortization and unlocking calculations and mortality gains. Realized investment gains on AFS securities increased $59.8 million year over year, net of related DAC and VOBA amortization, due to portfolio re-positioning trades and implementation of a tax strategy. The increase in the interest rates during the fiscal period decreased our embedded derivative liability and increased the fair value of the reinsurance related embedded derivative resulting in an increase in operating income of $63.8 million and $75.3 million, respectively, net of related DAC and VOBA amortization. As part of the assumption review process that takes place in the September quarter each year, changes were made to the surrender rates, earned rates and future index credits to bring the assumptions in line with current and expected future experience. These assumptions are used in the FIA embedded derivative reserve and DAC and VOBA calculations and resulted in a reserve decrease of $78.8 million during the fourth quarter of Fiscal 2013, net of related DAC and VOBA amortization and unlocking impact. We also experienced immediate annuity mortality gains of $35.6 million during Fiscal 2013 due to higher large case deaths. Partially offsetting these increases to operating income was a $301.8 million increase in income tax (expense) benefit year over year. During Fiscal 2012, we recognized an income tax benefit of $145.7 largely due to a partial release of the valuation allowance held against certain deferred tax assets of $204.7 million and our change in judgment regarding the realization of certain deferred tax assets in future years due to our continued profitability since the FGLH Acquisition. Comparatively, we had income tax expense of $156.1 during Fiscal 2013 primarily due to pre-tax earnings of $493.0 million.
Net income was $8.2 million for the period from April 6, 2011 to September 30, 2011. Income for the period included adjustments related to equity market volatility and lower interest rates which impacted the value of our asset and liabilities and to transaction related activities in connection with the April 6, 2011 acquisition of FGLH. The embedded derivative liability increased $42.6 million, net of VOBA and DAC effect, primarily related to the decrease in risk free rates used to discount the liability. Additionally, settlement adjustments through September 30, 2011 of ceding the block to Wilton Re resulted in a $10.4 million charge for the period. The period also included a $13.8 million charge for letter of credit (“LOC”) facility fees due to the early termination of the facility. The facility which collateralized statutory redundant reserves ceded to a wholly owned affiliate on April 7, 2011 was replaced by recapturing the block and ceding it to Wilton Re as of October 17, 2011. Substantially offsetting these items was a $41.7 million tax benefit primarily resulting from the recognition of deferred tax assets which previously had a reserve set up against them.
Annuity sales during the Fiscal 2013, Fiscal 2012 and the period from April 6, 2011 to September 30, 2011 were $1.0 billion, $1.7 billion and $380.0 million, respectively, including $982.8 million, $1.6 billion and $310.0 million, respectively, of FIA sales. Sales of our core product, Prosperity EliteSM, which was introduced during the year ended September 30, 2011, was the primary driver of the strong sales during Fiscal 2012. The period over period declines in annuity sales was primarily due to the launch of our Prosperity EliteSM product which created positive sales momentum in fiscal 2012. Product sales declined in subsequent quarters as a result of the targeted production levels we established for the product. FIAs have become the dominant product within the fixed annuity market and industry growth is expected to continue as individuals nearing retirement increasingly seek the safety and guaranteed income benefits of fixed index annuities.
9
FIDELITY & GUARANTY LIFE HOLDINGS, INC.
Pretax AOI
The table below shows the adjustments made to reconcile income before income taxes to our Pretax AOI:
| April 6, 2011 through |
||||||||||||
| Fiscal Year | September 30, | |||||||||||
| 2013 | 2012 | 2011 | ||||||||||
| Reconciliation to income before income taxes: |
||||||||||||
| Income before taxes |
$ | 493.0 | $ | 140.3 | $ | (33.5 | ) | |||||
| Interest expense |
20.4 | 23.5 | 15.4 | |||||||||
|
|
|
|
|
|
|
|||||||
| Operating income (loss) |
513.4 | 163.8 | (18.1 | ) | ||||||||
| Effect of realized investment (gains) losses, net of offsets |
(192.2 | ) | (132.4 | ) | (0.6 | ) | ||||||
| Effect of change in FIA embedded derivative discount rate, net of offsets |
(45.2 | ) | 18.6 | 42.6 | ||||||||
| Effects of transaction-related reinsurance |
(75.3 | ) | 11.8 | 24.2 | ||||||||
|
|
|
|
|
|
|
|||||||
| Pretax AOI |
$ | 200.7 | $ | 61.8 | 48.1 | |||||||
|
|
|
|
|
|
|
|||||||
| AAUM |
15,701.9 | 16,111.9 | 16,272.3 | |||||||||
| Return on AAUM, Pretax AOI |
1.3 | % | 0.4 | % | 0.3 | % | ||||||
For Fiscal 2013, pretax AOI increased $138.9 million to $200.7 million from $61.8 million for Fiscal 2012. The increase is primarily due to annual assumption changes were made to the surrender rates, earned rates and future index credits used in the FIA embedded derivative reserve calculation which resulted in a reserve decrease of $78.8 million during the fourth quarter of Fiscal 2013, net of related DAC and VOBA amortization and unlocking impact. Also contributing to the increase were immediate annuity mortality gains of $35.6 million during Fiscal 2013 caused by large case deaths, as discussed below in benefits and other changes in policy reserves, as well as the absence of an $11.0 million charge for unclaimed death benefits recorded in Fiscal 2012 resulting from a search of the social security administration database that produced a listing of deceased policyholders that died while their policy was in force. See Note 13 in our audited consolidated financial statements for additional information regarding this charge.
For the period from April 6, 2011 to September 30, 2011, pretax AOI was $48.1 million. The accounting standards for fair value measurement require the discount rates used in the calculation of the embedded derivative liability to be based on the risk-free interest rates adjusted for our non-performance. A decline in the equity market during the period caused the fair value of our derivative assets and embedded derivative liability to decrease. However, a decrease in discount rates resulted in a partially offsetting increase in the embedded derivative liability, which we have removed from adjusted operating income. Also included in adjustments to operating income was LOC facility fees amortization due to the early termination of the facility. The facility, which collateralized redundant reserves ceded to an affiliate on April 7, 2011 was replaced by recapturing the block and ceding it to Wilton Re as of October 17, 2011. Settlement adjustments through September 30, 2011 for the life insurance business ceded to Wilton Re also resulted in a charge for the period which we have removed from operating income. In evaluating our operating results, these adjustments have been removed from operating income as acquisition-related reinsurance transactions.
10
FIDELITY & GUARANTY LIFE HOLDINGS, INC.
Revenues
Premiums. Premiums primarily reflect insurance premiums for traditional life insurance products which are recognized as revenue when due from the policyholder. We have ceded the majority of our traditional life business to unaffiliated third party reinsurers. The remaining traditional life business is primarily related to traditional life contracts that contain return of premium riders, which have not been reinsured to third party reinsurers.
For Fiscal 2013, premiums increased $3.1 million, or 5.6%, to $58.4 million from $55.3 million for Fiscal 2012, primarily due to the partial rescission of a coinsurance agreement which resulted in the return of $4.5 million of premiums previously ceded.
Net investment income. For Fiscal 2013 we had net investment income of $672.9 million compared to $716.2 million for Fiscal 2012. Investment income has been impacted by our decision in Fiscal Year 2012 to be defensive with our investment portfolio, given the interest rate environment, by continuing to reduce the credit and interest rate risk exposures in the portfolio, and to shorten the duration of the portfolio relative to our liabilities. In addition, we sold certain investments that utilized pre-acquisition tax benefits (carryforwards) which resulted in tax free capital gains. These strategies resulted in significant sales of investments during Fiscal 2012 through the first half of Fiscal 2013. The proceeds from the investment sales, including the tax free gains, were primarily held in cash, cash equivalents and treasury notes, which temporarily lowered investment income until the proceeds were reinvested. We began reinvesting the sales proceeds during the second quarter of Fiscal 2013 and saw a substantial increase in our earned yield during the second half of Fiscal 2013. However the average yield earned remained below the average yield earned for Fiscal 2012. Also contributing to the year over year decrease was the funds withheld reinsurance agreement with Front Street Re, effective December 31, 2012, which resulted in the ceding of $38.6 million of net investment income to Front Street Re.
The Company’s cash and short-term investments position is summarized as follows:
| April 6, 2011 | ||||||||||||
| to September 30, | ||||||||||||
| (in $ millions) | Fiscal 2013 | Fiscal 2012 | 2011 | |||||||||
| Q1 |
2,643.6 | 1,990.4 | N/A | |||||||||
| Q2 |
1,516.3 | 2,107.3 | N/A | |||||||||
| Q3 |
1,138.3 | 1,696.8 | 1,208.1 | |||||||||
| Q4 |
1,995.3 | 1,979.7 | 999.3 | |||||||||
AAUM (on an amortized cost basis) were $15.7 billion, $16.1 billion and $16.3 billion and the average yield earned on AAUM was 4.37%, 4.52% and 4.78% for Fiscal 2013, Fiscal 2012 and the period from April 6, 2011 to September 30, 2011, respectively, compared to interest credited and option costs of 3.14%, 3.24% and 3.46% for each period, respectively.
11
FIDELITY & GUARANTY LIFE HOLDINGS, INC.
Our net investment spread for the period is summarized as follows:
| April 6, 2011 to |
||||||||||||
| Fiscal Year | September 30, | |||||||||||
| 2013 | 2012 | 2011 | ||||||||||
| Average yield on AAUM |
4.37 | % | 4.52 | % | 4.78 | % | ||||||
| Less: Interest credited and option cost |
3.14 | % | 3.24 | % | 3.46 | % | ||||||
|
|
|
|
|
|
|
|||||||
| Net investment spread |
1.23 | % | 1.28 | % | 1.32 | % | ||||||
The net investment spread is virtually unchanged from Fiscal 2012 as the decrease in average yield earned from the investment strategy was offset by lower interest credited/option costs that resulted from lower crediting rates on a large block of fixed rate annuities renewing at a lower rate and a reduction in the cost of call options hedging the FIA index credits. The higher net investment spread for the period from April 6, 2011 to September 30, 2011was primarily due to higher yielding assets in our investment portfolio during the period.
Net investment gains (losses). For Fiscal 2013, we had net investment gains of $544.6 million compared to net investment gains of $410.0 million for Fiscal 2012. The period-over-period increase of $134.6 million is primarily due to a $118.0 million increase in fair value of the reinsurance related embedded derivative which is based on the change in fair value of the underlying assets held in the Front Street Re funds withheld portfolio (see Note 5 of the Notes to Consolidated Financial Statements, herein, for more details). The decrease in the fair value of the underlying assets was primarily due to the rise in Treasury rates during the fourth quarter of Fiscal 2013. This gain is largely offset in the balance sheet through AOCI. Additionally, net investment gains on fixed maturity and equity available-for-sale securities increased $12.4 million increase period over period is primarily due to our investment strategy described above. Included in Fiscal 2012 was $30.5 million of gains associated with the asset transfer on October 1, 2011 for the closing of the final transaction-related reinsurance transaction with Wilton Re. The $30.5 million of gains were paid to Wilton Re as part of the initial asset transfer.
For the period from April 6, 2011 to September 30, 2011, we had net investment losses of $166.9 million primarily due to net realized and unrealized losses on our derivative instruments of $171.0 million. These losses resulted primarily from the performance of the S&P 500 index, upon which a substantial portion of our call options and futures contracts are based, which decreased 15.3% during the period.
The components of the realized and unrealized gains on derivative instruments used to hedge our FIA products are as follows:
| April 6, 2011 to | ||||||||||||
| Fiscal Year | September 30, | |||||||||||
| 2013 | 2011 | 2011 | ||||||||||
| Call options: |
||||||||||||
| Gain (loss) on option expiration |
$ | 118.3 | $ | (53.0 | ) | $ | (23.2 | ) | ||||
| Change in unrealized gain/loss |
13.1 | 153.0 | (119.7 | ) | ||||||||
| Futures contracts: |
||||||||||||
| Gain (loss) on futures contracts expiration |
17.4 | 42.7 | (21.4 | ) | ||||||||
| Change in unrealized gain/loss |
0.1 | 3.4 | (6.7 | ) | ||||||||
|
|
|
|
|
|
|
|||||||
| $ | 148.9 | $ | 146.1 | $ | (171.0 | ) | ||||||
|
|
|
|
|
|
|
|||||||
12
FIDELITY & GUARANTY LIFE HOLDINGS, INC.
The average index credits to policyholders during the following periods are as follows:
| April 6, 2011 through |
||||||||||||
| Fiscal Year | September 30, | |||||||||||
| 2013 | 2012 | 2011 | ||||||||||
| S&P 500 Index: |
||||||||||||
| Point-to-point strategy |
5.25 | % | 2.68 | % | 4.63 | % | ||||||
| Monthly average strategy |
4.95 | % | 1.84 | % | 4.03 | % | ||||||
| Monthly point-to-point strategy |
4.58 | % | 0.45 | % | 2.69 | % | ||||||
| 3 Year high water mark |
23.28 | % | 17.51 | % | 0.04 | % | ||||||
A point-to-point strategy is an indexing method that calculates the percentage change in the value of the S&P 500 Index on two specified dates. In a monthly point-to-point strategy, the point-to-point changes in the S&P 500 Index for each month are added together, subject to a maximum monthly cap. A monthly average strategy calculates the average of the percentage change in the S&P 500 Index for each month over the course of a year.
For Fiscal 2013 the average credit to contractholders from index credits during the period was 5.07% compared to 1.81% for Fiscal 2012. The credits for Fiscal 2012 were based on comparing the S&P 500 on each issue date in Fiscal 2012 to the same issue date in Fiscal 2011. The volatility at different points in these periods created lower overall credits in Fiscal 2012 compared to the consistent double-digit S&P growth for those issue dates in Fiscal 2013. For the period from April 6, 2011 to September 30, 2011 the average credit to contractholders from index credits during the period was 3.61%.
Actual amounts credited to contractholder fund balances may be less than the index appreciation in the S&P 500 Index due to contractual features in the FIA contracts (caps, spreads, participation rates and asset fees) which allows us to manage the cost of the options purchased to fund the annual index credits.
Insurance and investment product fees and other. For Fiscal 2013 and 2012, insurance and investment product fees and other consists primarily of cost of insurance charges, policy fees collected from the contractholder and surrender charges assessed against policy withdrawals in excess of the policyholder’s allowable penalty-free amounts (up to 10% of the prior year’s value, subject to certain limitations). These revenues increased $17.4 million, or 43.2%, to $57.7 million for Fiscal 2013 compared to $40.3 million for Fiscal 2012. These increases are primarily due to cost of insurance revenue on new universal life policies issued during the last twelve months and policy rider fees on the Prosperity Elite product line which was introduced during the fourth quarter of Fiscal Year 2011.
Insurance and investment product fees were $48.9 million for the period from April 6, 2011 to September 30, 2011and included the cost of insurance and surrender fees associated with the IUL line of business, the majority of which we ceded to Wilton Re during the first quarter of Fiscal 2012. Thus reducing the total amount retained by the Company after 2011. Withdrawals from annuity and universal life policies subject to surrender charges were $571.9 million for the period and the average surrender charge collected on withdrawals was 3.49% for the period.
Benefits and expenses
Benefits and other changes in policy reserves. For Fiscal 2013 benefits and other changes in policy reserves decreased $280.7 million, or 36.1%, to $496.7 million from $777.4 million for Fiscal 2012, principally due to the present value of future credits and guarantee liability which decreased $202.1 million during Fiscal 2013 compared to a $7.0 million increase during Fiscal 2012. The period over period decrease of $209.1 million was primarily driven by the increase in the risk free rates which reduced reserves by $88.5 million during Fiscal 2013 compared to the decrease in rates which increased reserves $39.9 during the Fiscal 2012, a year over year decrease of $128.4 million. Additionally, annual assumption changes were made to the surrender rates, earned rates and future index credits used in the FIA embedded derivative reserve calculation which resulted in a reserve decrease of $76.2 million during the fourth quarter of Fiscal 2013.
13
FIDELITY & GUARANTY LIFE HOLDINGS, INC.
Lastly, immediate annuity policy reserves were lower in Fiscal 2013 by $35.6 million. The decrease in reserves was due to a favorable mortality experience on our immediate annuities. Upon a death, we release the reserve established for the expected remaining benefits which are based on assumptions for mortality among other things. To the extent the actual deaths in the period are higher than expected, additional reserves will be released.
For the period from April 6, 2011 to September 30, 2011 we had benefits and other changes in policy reserves of $247.6 million which includes the change in the FIA embedded derivative liability which includes the market value option liability change and the present value of future credits and guarantee liability change. The market value option liability decreased $263.6 million for the period from April 6, 2011 to September 30, 2011 primarily due to the decrease in the equity markets during the period. The present value of future credits and guarantee liability increased $121.1 million for the period primarily as a result of the decrease in the risk-free rates. Fair value accounting for derivative instruments and the embedded derivatives in the FIA contracts creates differences in the recognition of revenues and expenses from derivative instruments, including the embedded derivative liability in FIA contracts. The change in fair value of the embedded derivatives will not correspond to the change in fair value of the derivatives (purchased call options and futures contracts) because the purchased derivatives cover the next annual index period while the embedded derivative liabilities cover estimated credits over the expected life of the FIA contracts. Additionally, there were index credits, interest credits and bonuses of $292.0 million and policy benefits and other reserve movements of $98.1 million during the period. Changes in index credits are attributable to changes in the underlying indices and the amount of funds allocated by policyholders to the respective index options. Benefits also include claims incurred during the period in excess of contractholder fund balances, traditional life insurance benefits and the change in reserves for traditional life insurance products.
Below is a summary of the major components included in benefits and other changes in policy reserves for Fiscal Year 2013, 2012 and the period April 6, 2011 to September 30, 2011:
| April 6, 2011 to |
||||||||||||
| Fiscal Year | September 30, | |||||||||||
| 2013 | 2012 | 2011 | ||||||||||
| FIA market value option liability change |
$ | 6.1 | $ | 177.9 | $ | (263.6 | ) | |||||
| FIA present value future credits & guarantee liability change |
(202.1 | ) | 7.0 | 121.1 | ||||||||
| Index credits, interest credited & bonuses |
536.3 | 382.4 | 292.0 | |||||||||
| Annuity payments |
209.1 | 241.7 | 126.3 | |||||||||
| Other policy benefits and reserve movements |
(52.7 | ) | (31.6 | ) | (28.2 | ) | ||||||
|
|
|
|
|
|
|
|||||||
| Total benefits and other changes in policy reserves |
$ | 496.7 | $ | 777.4 | $ | 247.6 | ||||||
|
|
|
|
|
|
|
|||||||
Acquisition, operating and general expenses, net of deferrals. Acquisition and operating expenses, net of deferrals, decreased $21.4 million, or 17.8%, to $98.5 million for Fiscal 2013, from $119.9 million for Fiscal 2012 principally due to a $31.1 million ceding commission paid to Wilton Re. This ceding commission primarily related to $30.5 million of investment gains realized on the securities transferred to Wilton Re on October 17, 2011, the effective date of the second acquisition-related reinsurance amendment, in connection with closing the final acquisition-related reinsurance transaction with Wilton Re.
Partially offsetting this year over year decrease was a one-time expense of $10.3 million in relation to the settlement of trail commissions. In September 2013, FGL Insurance agreed to accelerate the payment of trail commissions to Creative Marketing (“Creative”), a long-standing IMO of the Company, to facilitate the purchase of Creative by its management from Aviva USA Corporation (“Aviva”).
For the period from April 6, 2011 to September 30, 2011 we had acquisition and operating expenses, net of deferrals and included a $13.8 million charge for letter of credit facility fees due to the early termination of the facility, $6.3 million in expense allowances paid to reinsurers, general operating expenses of $41.5 million, and $11.1 million of commission and bonus expenses, net of deferrals. Included in total net commission expense was $9.1 million of commission related to pre-acquisition life business which was not deferred as there was no VOBA established for it as of the Acquisition Date.
14
FIDELITY & GUARANTY LIFE HOLDINGS, INC.
Amortization of intangibles. For Fiscal 2013, amortization of intangibles increased $64.3 million, or 40.0%, to $225.0 million from $160.7 million for Fiscal 2012. The increase is primarily due to $42.7 million of amortization related to the increase in fair value of the reinsurance related embedded derivative discussed above. Amortization of intangibles is based on historical, current and future expected gross margins (pre-tax operating income before amortization). The increase in the current gross margins driven by the lower embedded derivative liability discussed above increased amortization however it was partially offset by the increase in future expected gross margins from the change in assumptions also discussed above which decreased amortization. The change in the embedded derivative liability moves with the changes in the market value of the option liability as well as with changes in interest rates. If the current embedded derivative liability increases then future margins increase, as the higher liability amortizes into income over time and vice versa. When future expected margins increase amortization generally slows down and vice versa when the future expected margins decrease. The change in assumptions during the year resulted in an increase in future expected margins and corresponding “unlocking” adjustment, reducing the net amortization in Fiscal 2013. See the “DAC and VOBA” discussion under critical accounting policies herein for additional details.
For the period from April 6, 2011 to September 30, 2011, amortization of intangibles of $(11.1) million includes capitalized accrued interest of $14.0 million, which increases the and VOBA intangible asset, less $2.0 million of net VOBA amortization based on gross margins, resulting in net negative VOBA amortization of $12.0 million, which was partially offset by $0.9 million of DAC amortization during the period from April 6, 2011 to September 30, 2011.
Other items affecting net income
Interest expense. Interest expense for Fiscal 2013 was $20.4 million, compared to interest expense of $23.5 million during Fiscal 2012. The intercompany term loan and revolving of credit facility between FGLH and HFG resulted in interest expense of $9.0 million and $23.5 million during Fiscal 2013 and Fiscal 2012, respectively. On February 28, 2013, HFG and FGLH entered into a termination and release agreement whereby HFG notified FGLH of its election to convert the loans to equity resulting in the decrease in interest expense year over year. Partially offsetting this decrease was interest expense of $9.8 million related to interest incurred on the $300.0 million of outstanding Senior Notes issued in March 2013. The outstanding notes pay interest semi-annually at a coupon rate of 6.375%.
Interest expense $15.4 million for the period April 6, 2011 to September 30, 2013 was primarily related to the intercompany term loan and revolving of credit facility between FGLH and HFG.
15
FIDELITY & GUARANTY LIFE HOLDINGS, INC.
Income tax expense (benefit). Income tax expense for Fiscal 2013 was $156.1 million net of a valuation allowance release of $18.8 million, compared to an income tax benefit of $145.7 for Fiscal 2012 which consisted of $52.1 million of tax expense and other tax related charges offset by a release in valuation of $197.8 million. The increase in income tax expense of $301.8 million for Fiscal 2013 is due to a combination of pre-tax income increasing $352.7 million year over year and a much smaller valuation allowance release in Fiscal 2013 relative to Fiscal 2012.
In assessing the recoverability of our deferred tax assets, we regularly consider the guidance outlined within ASC 740 (“Income Taxes”). The guidance requires an assessment of both positive and negative evidence in determining the realizability of deferred tax assets. A valuation allowance is required to reduce our deferred tax asset to an amount that is more likely than not to be realized. In determining the net deferred tax asset and valuation allowance, we are required to make judgments and estimates related to projections of future profitability. These judgments include the following: the timing and extent of the utilization of net operating loss carry-forwards, the reversals of temporary differences, and tax planning strategies. We have recorded a partial valuation allowance of $158.7 million against our gross deferred tax assets of $620.4 million as of September 30, 2013.
We maintain a valuation allowance against certain §382 limited capital loss carry-forwards and the deferred tax assets of our non-life insurance company subsidiaries. A valuation allowance has been placed against §382 limited capital loss carry-forwards to reduce these deferred tax assets to an amount that is more likely than not to be realized before the attributes expire. Our non-life insurance company subsidiaries have a history of losses and insufficient sources of future income in order to recognize any portion of their deferred tax assets.
The valuation allowance is reviewed quarterly and will be maintained until there is sufficient positive evidence to support a release. At each reporting date, we consider new evidence, both positive and negative, that could impact the future realization of deferred tax assets. We will consider a release of the valuation allowance once there is sufficient positive evidence that it is more likely than not that the deferred tax assets will be realized. Any release of the valuation allowance will be recorded as a tax benefit increasing net income or other comprehensive income. The valuation allowance was decreased by $18.8 million for Fiscal 2013. The adjustment is due to previously unrealizable capital loss carryforwards that were utilized during Fiscal 2013, which was partially offset by full valuation allowance placed against the current period income tax benefit of our non-life insurance company subsidiaries. For Fiscal 2012 the valuation allowance was reduced by $197.8 million when management determined that sufficient positive evidence existed, based on a change in circumstance related to the Company’s cumulative loss position, to conclude that it was more likely than not that additional deferred tax assets were realizable.
Income tax benefit for the period from April 6, 2011 to September 30, 2011 was $41.7 million. Our effective tax rate of (30.9%) was positively impacted by the release of valuation allowance attributable to our determination that certain of its deferred tax assets became more likely than not realizable during the current reporting period. We have recorded a partial valuation allowance of $375.3 million against its gross deferred tax assets of $979.9 million as of September 30, 2011.
For the period from April 6, 2011 to September 30, 2011, we recorded a release of valuation allowance of $30.0 million, related in large part to the recognition of certain acquisition-date built-in gains. The recognition of built-in gains had the effect of increasing our annual §382 limit, which in turn allowed for the release of valuation allowance against capital loss carryforwards and net operating losses previously reserved for as components within the valuation allowance.
16
FIDELITY & GUARANTY LIFE HOLDINGS, INC.
Investment Portfolio
The types of assets in which we may invest are influenced by various state laws, which prescribe qualified investment assets applicable to insurance companies. Within the parameters of these laws, we invest in assets giving consideration to three primary investment objectives: (i) maintain robust absolute returns; (ii) provide reliable yield and investment income; and (iii) preserve capital.
Our investment portfolio is designed to contribute stable earnings and balance risk across diverse asset classes and is primarily invested in high quality fixed income securities.
As of September 30, 2013 and September 30, 2012, our investment portfolio was approximately $16.2 billion and $16.6 billion, respectively, and was divided among the following asset classes:
| (dollars in millions) |
September 30, 2013 | September 30, 2012 | ||||||||||||||
| Asset Class |
Fair Value | Percent | Fair Value | Percent | ||||||||||||
| Corporates |
$ | 9,418.3 | 58.1 | % | $ | 11,009.0 | 66.5 | % | ||||||||
| ABS |
1,764.6 | 10.9 | % | 1,027.9 | 6.2 | % | ||||||||||
| Non-agency RMBS |
1,368.0 | 8.4 | % | 660.6 | 4.0 | % | ||||||||||
| Municipals |
1,007.0 | 6.2 | % | 1,224.0 | 7.4 | % | ||||||||||
| U.S. Government |
1,001.8 | 6.2 | % | 930.4 | 5.6 | % | ||||||||||
| CMBS |
454.3 | 2.8 | % | 553.8 | 3.3 | % | ||||||||||
| Hybrids |
428.8 | 2.6 | % | 528.2 | 3.2 | % | ||||||||||
| Other (primarily policy loans and derivatives) |
410.0 | 2.5 | % | 219.5 | 1.3 | % | ||||||||||
| Equities |
271.1 | 1.7 | % | 248.1 | 1.5 | % | ||||||||||
| Agency RMBS |
98.6 | 0.6 | % | 155.0 | 0.9 | % | ||||||||||
|
|
|
|
|
|
|
|
|
|||||||||
| Total investments |
$ | 16,222.5 | 100.0 | % | $ | 16,556.5 | 100.0 | % | ||||||||
|
|
|
|
|
|
|
|
|
|||||||||
Insurance statutes regulate the type of investments that our life subsidiaries are permitted to make and limit the amount of funds that may be used for any one type of investment. In light of these statutes and regulations and our business and investment strategy, we generally seek to invest in United States government and government-sponsored agency securities and corporate securities rated investment grade by established nationally recognized statistical rating organizations (each, an “NRSRO”) or in securities of comparable investment quality, if not rated.
17
FIDELITY & GUARANTY LIFE HOLDINGS, INC.
As of September 30, 2013 and September 30, 2012, our fixed maturity AFS portfolio was approximately $15.5 billion and $16.1 billion, respectively. The increase in B and below investments from September 30, 2012 to September 30, 2013 is primarily due to the acquisition of certain non-agency RMBS securities, which carry a NAIC 1 designation. The following table summarizes the credit quality, by NRSRO rating, of our fixed income portfolio:
| (dollars in millions) |
September 30, 2013 | September 30, 2012 | ||||||||||||||
| Rating |
Fair Value (c) | Percent | Fair Value | Percent | ||||||||||||
| AAA |
$ | 1,924.3 | 12.4 | % | $ | 1,842.3 | 11.5 | % | ||||||||
| AA |
2,423.1 | 15.6 | % | 2,042.9 | 12.7 | % | ||||||||||
| A |
3,791.3 | 24.4 | % | 4,280.4 | 26.6 | % | ||||||||||
| BBB |
5,508.6 | 35.4 | % | 7,084.0 | 44.0 | % | ||||||||||
| BB (a) |
468.2 | 3.0 | % | 459.0 | 2.9 | % | ||||||||||
| B and below (b) |
1,426.0 | 9.2 | % | 380.3 | 2.3 | % | ||||||||||
|
|
|
|
|
|
|
|
|
|||||||||
| Total |
$ | 15,541.5 | 100.0 | % | $ | 16,088.9 | 100 | % | ||||||||
|
|
|
|
|
|
|
|
|
|||||||||
| (a) | Includes $31.4 million and $61.7 million at September 30, 2013 and September 30, 2012, respectively, of non-agency RMBS that carry a carry a NAIC 1 designation |
| (b) | Includes $1,096.3 million and $334.9 million at September 30, 2013 and September 30, 2012, respectively, of non-agency RMBS that carry a NAIC 1 designation |
The NAIC’s Securities Valuation Office (“SVO”) is responsible for the day-to-day credit quality assessment and valuation of securities owned by state regulated insurance companies. Insurance companies report ownership of securities to the SVO when such securities are eligible for regulatory filings. The SVO conducts credit analysis on these securities for the purpose of assigning an NAIC designation and/or unit price. Typically, if a security has been rated by an NRSRO, the SVO utilizes that rating and assigns an NAIC designation based upon the following system:
| NAIC Designation |
NRSRO Equivalent Rating | |
| 1 |
AAA/AA/A | |
| 2 |
BBB | |
| 3 |
BB | |
| 4 |
B | |
| 5 |
CCC and lower | |
| 6 |
In or near default |
The NAIC adopted revised designation methodologies for non-agency RMBS, including RMBS backed by subprime mortgage loans and for CMBS. The NAIC’s objective with the revised designation methodologies for these structured securities was to increase the accuracy in assessing expected losses and to use the improved assessment to determine a more appropriate capital requirement for such structured securities. The NAIC designations for structured securities, including subprime and Alternative A-paper, or Alt-A, RMBS, are based upon a comparison of the bond’s amortized cost to the NAIC’s loss expectation for each security. Securities where modeling results in no expected loss in all scenarios are considered to have the highest designation of NAIC 1. A large percentage of our RMBS securities carry a NAIC 1 designation while the NRSRO rating indicates below investment grade. This is primarily due to the credit and intent impairments recorded by us which reduced the amortized cost on these securities to a level resulting in no expected loss in all scenarios, which corresponds to a NAIC 1 designation. The revised methodologies reduce regulatory reliance on rating agencies and allow for greater regulatory input into the assumptions used to estimate expected losses from such structured securities. In the tables below, we present the rating of structured securities based on ratings from the revised NAIC rating methodologies described above (which may not correspond to rating agency designations). All NAIC designations (e.g., NAIC 1-6) are based on the revised NAIC methodologies.
18
FIDELITY & GUARANTY LIFE HOLDINGS, INC.
The tables below present our fixed maturity securities by NAIC designation as of September 30, 2013 and September 30, 2012:
| (dollars in millions) |
September 30, 2013 | |||||||||||
| NAIC Designation |
Amortized Cost (a) | Fair Value (b) | Percent of Total Carrying Amount | |||||||||
| 1 |
$ | 9,342.0 | $ | 9,554.0 | 61.5 | % | ||||||
| 2 |
5,362.2 | 5,379.3 | 34.6 | % | ||||||||
| 3 |
405.0 | 415.4 | 2.7 | % | ||||||||
| 4 |
132.7 | 133.0 | 0.9 | % | ||||||||
| 5 |
53.9 | 53.8 | 0.3 | % | ||||||||
| 6 |
5.9 | 6.0 | — | % | ||||||||
|
|
|
|
|
|
|
|||||||
| $ | 15,301.7 | $ | 15,541.5 | 100.0 | % | |||||||
|
|
|
|
|
|
|
|||||||
| September 30, 2012 | ||||||||||||
| NAIC Designation |
Amortized Cost | Fair Value | Percent of Total Carrying Amount | |||||||||
| 1 |
$ | 8,070.1 | $ | 8,634.0 | 53.7 | % | ||||||
| 2 |
6,569.1 | 7,047.4 | 43.8 | % | ||||||||
| 3 |
381.3 | 386.4 | 2.4 | % | ||||||||
| 4 |
8.5 | 8.8 | 0.1 | % | ||||||||
| 5 |
8.2 | 8.2 | — | % | ||||||||
| 6 |
3.8 | 4.1 | — | % | ||||||||
|
|
|
|
|
|
|
|||||||
| $ | 15,041.0 | $ | 16,088.9 | 100.0 | % | |||||||
|
|
|
|
|
|
|
|||||||
19
FIDELITY & GUARANTY LIFE HOLDINGS, INC.
The amortized cost and fair value of fixed maturity AFS securities by contractual maturities as of September 30, 2013 and September 30, 2012, as applicable, are shown below. Actual maturities may differ from contractual maturities because issuers may have the right to call or prepay obligations.
| September 30, 2013 | September 30, 2012 | |||||||||||||||
| (in millions) |
Amortized Cost |
Fair Value | Amortized Cost |
Fair Value | ||||||||||||
| Corporate, Non Structured Hybrids, Municipal and U.S. Government securities: |
||||||||||||||||
| Due in one year or less |
$ | 978.5 | $ | 982.4 | $ | 700.5 | $ | 703.9 | ||||||||
| Due after one year through five years |
2,739.1 | 2,805.8 | 3,230.6 | 3,324.5 | ||||||||||||
| Due after five years through ten years |
2,972.4 | 3,000.9 | 3,692.3 | 3,995.8 | ||||||||||||
| Due after ten years |
5,007.5 | 5,037.5 | 4,972.2 | 5,532.4 | ||||||||||||
|
|
|
|
|
|
|
|
|
|||||||||
| Subtotal |
11,697.5 | 11,826.6 | 12,595.6 | 13,556.6 | ||||||||||||
| Other securities which provide for periodic payments: |
||||||||||||||||
| Asset-backed securities |
$ | 1,745.2 | $ | 1,764.6 | $ | 1,010.9 | $ | 1,027.9 | ||||||||
| Commercial-mortgage-backed securities |
431.3 | 454.3 | 520.0 | 553.8 | ||||||||||||
| Structured hybrids |
27.1 | 29.4 | 135.8 | 135.1 | ||||||||||||
| Agency residential mortgage-backed securities |
96.5 | 98.6 | 149.5 | 154.9 | ||||||||||||
| Non-agency residential mortgage-backed securities |
1,304.0 | 1,368.0 | 629.1 | 660.7 | ||||||||||||
|
|
|
|
|
|
|
|
|
|||||||||
| Total fixed maturity available-for-sale securities |
$ | 15,301.6 | $ | 15,541.5 | $ | 15,040.9 | $ | 16,089.0 | ||||||||
|
|
|
|
|
|
|
|
|
|||||||||
Subprime and Alt-A Mortgage Exposure
Between 2009 and 2011, we actively reduced our exposure to non-agency RMBS holdings where we saw fundamental concerns and prospective impairments. Consistent with this strategy and as part of the Stock Purchase Agreement with HGI, our insurance subsidiaries sold approximately $1.6 billion of structured assets.
In late 2011 and 2012, following stabilization in the housing market, and a review of the loss severity methodology utilized by the NAIC, which took into account home price appreciation vectors, rather than NRSRO ratings criteria, we began to increase exposure to non-agency RMBS securities across the spectrum, including prime, Alt-A, subprime, and option-adjustable rate mortgage securities, where the purchase price was sufficiently low enough to ensure a cushion to an NAIC 1 rating. These investment decisions were driven by rigorous analysis of the underlying collateral, as well as considerations of structural characteristics associated with these positions.
In all cases, we have been buyers of non-agency RMBS securities in the secondary market. We do not originate non-agency whole loans, regardless of underlying collateral.
Our investment in non-agency RMBS securities is predicated by the conservative and adequate cushion between purchase price and NAIC 1 rating, favorable capital characteristics, general lack of sensitivity to interest rates, positive convexity to prepayment rates, and correlation between the price of the securities and the unfolding recovery of the housing market. We believe the incremental purchases of non-agency RMBS securities brings our asset allocation back more in line with typical life insurance company’s structured exposure.
20
FIDELITY & GUARANTY LIFE HOLDINGS, INC.
The fair value of our investments in subprime and Alt-A RMBS securities, respectively, was $360.1 million and $394.9 million as of September 30, 2013, respectively, and $233.3 million and $121.6 million as of September 30, 2012, respectively. We continue to focus on NAIC 1 and 2 rated investments and have reduced our exposure to NAIC 4 or lower rated investments. The following tables summarize our exposure to subprime and Alt-A RMBS by credit quality using NAIC designations, NRSRO ratings and vintage year as of September 30, 2013 and September 30, 2012:
| NAIC Designation | NRSRO | Vintage | ||||||||||||||||||||
| September 30, 2013 |
1 | 92.5 | % | AAA | 4.8 | % | 2007 | 21.8 | % | |||||||||||||
| 2 | 6 | % | AA | 2.3 | % | 2006 | 23.9 | % | ||||||||||||||
| 3 | 0.7 | % | A | 8.7 | % | 2005 and prior | 54.3 | % | ||||||||||||||
| 4 | 0.5 | % | BBB | 3.9 | % | |||||||||||||||||
| 5 | 0.3 | % | BB and below |
80.3 | % | |||||||||||||||||
| 6 | — | % | ||||||||||||||||||||
|
|
|
|
|
|
|
|||||||||||||||||
| 100.0 | % | 100.0 | % | 100.0 | % | |||||||||||||||||
|
|
|
|
|
|
|
|||||||||||||||||
| September 30, 2012 |
1 | 92.5 | % | AAA | 11.0 | % | 2007 | 14.3 | % | |||||||||||||
| 2 | 5.0 | % | AA | 20.3 | % | 2006 | 15.5 | % | ||||||||||||||
| 3 | 1.6 | % | A | 9.9 | % | 2005 and prior | 70.2 | % | ||||||||||||||
| 4 | 0.8 | % | BBB | 0.6 | % | |||||||||||||||||
| 5 | — | % | BB and below |
58.2 | % | |||||||||||||||||
| 6 | 0.1 | % | ||||||||||||||||||||
|
|
|
|
|
|
|
|||||||||||||||||
| 100.0 | % | 100.0 | % | 100.0 | % | |||||||||||||||||
|
|
|
|
|
|
|
|||||||||||||||||
ABS Exposure
As of September 30, 2013, the ABS exposure was largely composed of NAIC 1 rated tranches of collateralized loan obligations (“CLO”), which comprised 88.8% of all ABS holdings. These exposures, typically rated NAIC 1, are senior tranches of CLOs, which have leveraged loans as their underlying collateral. The remainder of the ABS exposure was largely diversified by underlying collateral and issuer type, including credit card and automobile receivables and home equity-backed securities.
21
FIDELITY & GUARANTY LIFE HOLDINGS, INC.
The following tables summarize our exposure to ABS holdings. The non-CLO exposure represents 11.1% of total ABS assets, or 1.2% of total invested assets. As of September 30, 2013, the CLO and non-CLO positions were trading at a net unrealized gain (loss) position of $20.4 million and $(1.0) million, respectively.
The non-CLO exposure at September 30, 2012 represents 5.9% of total ABS assets, or 0.4%, of total invested assets. As of September 30, 2012, the CLO and non-CLO positions were trading at a net unrealized gain position of $16.8 million and $0.2 million respectively.
| (dollars in millions) |
September 30, 2013 | September 30, 2012 | ||||||||||||||
| Asset Class |
Fair Value | Percent | Fair Value | Percent | ||||||||||||
| ABS CLO |
1,569.4 | 88.8 | % | 967.0 | 94.1 | % | ||||||||||
| ABS Car Loan |
11.7 | 0.7 | % | 4.6 | 0.5 | % | ||||||||||
| ABS Credit Card |
— | — | % | 10.5 | 1.0 | % | ||||||||||
| ABS Home Equity |
68.1 | 3.9 | % | — | — | % | ||||||||||
| ABS Other |
107.3 | 6.1 | % | 35.7 | 3.5 | % | ||||||||||
| ABS Utility |
8.0 | 0.5 | % | 10.0 | 0.9 | % | ||||||||||
|
|
|
|
|
|
|
|
|
|||||||||
| Total ABS |
1,764.5 | 100.0 | % | 1,027.8 | 100.0 | % | ||||||||||
|
|
|
|
|
|
|
|
|
|||||||||
22
FIDELITY & GUARANTY LIFE HOLDINGS, INC.
Unrealized Losses
The amortized cost and fair value of fixed maturity securities and equity securities that were in an unrealized loss position as of September 30, 2013 and September 30, 2012 were as follows:
| September 30, 2013 | ||||||||||||||||
| (in millions) | Number of Securities |
Amortized Cost | Unrealized Losses | Fair Value | ||||||||||||
| Fixed maturity securities, available for sale: |
||||||||||||||||
| United States Government full faith and credit |
18 | $ | 758.8 | $ | (3.9 | ) | $ | 754.9 | ||||||||
| United States Government sponsored entities |
17 | 10.1 | (0.2 | ) | 9.9 | |||||||||||
| United States municipalities, states and territories |
71 | 518.5 | (40.8 | ) | 477.7 | |||||||||||
| Corporate securities: |
||||||||||||||||
| Finance, insurance and real estate |
170 | 1,867.8 | (84.2 | ) | 1,783.6 | |||||||||||
| Manufacturing, construction and mining |
48 | 537.1 | (36.0 | ) | 501.1 | |||||||||||
| Utilities and related sectors |
73 | 546.8 | (19.2 | ) | 527.6 | |||||||||||
| Wholesale/retail trade |
45 | 362.9 | (13.6 | ) | 349.3 | |||||||||||
| Services, media and other |
50 | 513.7 | (32.1 | ) | 481.6 | |||||||||||
| Hybrid securities |
6 | 55.3 | (3.3 | ) | 52.0 | |||||||||||
| Non-agency Residential mortgage backed securities |
85 | 408.5 | (13.4 | ) | 395.1 | |||||||||||
| Commercial mortgage backed securities |
10 | 33.0 | (1.6 | ) | 31.4 | |||||||||||
| Asset backed securities |
56 | 416.0 | (5.2 | ) | 410.8 | |||||||||||
| Equity Securities |
17 | 161.1 | (10.3 | ) | 150.8 | |||||||||||
|
|
|
|
|
|
|
|
|
|||||||||
| 666 | $ | 6,189.6 | $ | (263.8 | ) | $ | 5,925.8 | |||||||||
|
|
|
|
|
|
|
|
|
|||||||||
| September 30, 2012 | ||||||||||||||||
| (in millions) |
Number of securities |
Amortized Cost | Unrealized Losses | Fair Value | ||||||||||||
| Fixed maturity securities, available for sale: |
||||||||||||||||
| United States Government full faith and credit |
6 | $ | 0.9 | $ | (0.2 | ) | $ | 0.7 | ||||||||
| United States Government sponsored agencies |
10 | 7.3 | (0.1 | ) | 7.2 | |||||||||||
| United States municipalities, states and territories |
18 | 72.3 | (1.1 | ) | 71.2 | |||||||||||
| Corporate securities: |
||||||||||||||||
| Finance, insurance and real estate |
31 | 241.7 | (4.9 | ) | 236.8 | |||||||||||
| Manufacturing, construction and mining |
10 | 95.6 | (3.0 | ) | 92.6 | |||||||||||
| Utilities and related sectors |
7 | 48.5 | (0.4 | ) | 48.1 | |||||||||||
| Wholesale/retail trade |
7 | 59.1 | (1.3 | ) | 57.8 | |||||||||||
| Services, media and other |
4 | 21.9 | (0.4 | ) | 21.5 | |||||||||||
| Hybrid securities |
8 | 130.7 | (9.6 | ) | 121.1 | |||||||||||
| Non-agency residential mortgage-backed securities |
26 | 118.9 | (4.3 | ) | 114.6 | |||||||||||
| Commercial mortgage-backed securities |
9 | 13.9 | (2.4 | ) | 11.5 | |||||||||||
| Asset-backed securities |
17 | 178.9 | (1.6 | ) | 177.3 | |||||||||||
| Equity securities |
3 | 45.7 | (1.2 | ) | 44.5 | |||||||||||
|
|
|
|
|
|
|
|
|
|||||||||
| 156 | $ | 1,035.4 | $ | (30.5 | ) | $ | 1,004.9 | |||||||||
|
|
|
|
|
|
|
|
|
|||||||||
The gross unrealized loss position on the portfolio as of September 30, 2013, was $263.8 million, and an increase of 233.3 million from $30.5 million as of September 30, 2012. The following is a description of the factors causing the unrealized losses as of September 30, 2013. Through September 30, 2013, Treasury yields climbed as concerns about the cessation of Federal Reserve stimulus affected market participants. Bond mutual fund flows turned
23
FIDELITY & GUARANTY LIFE HOLDINGS, INC.
sharply negative in the last months of the quarter, and fixed income security prices declined accordingly. Longer dated assets, such as municipal bonds, were particularly affected and account for $40.8 million of the unrealized loss position; to date, this sector has not seen material price movements and we view the recent price action in municipal bonds as largely interest-rate related.
Our municipal bond exposure is a combination of general obligation bonds (fair value of $323.7 million and an amortized cost of $322.9 million) and special revenue bonds (fair value of $757.1 million and amortized cost of $748.2 million). Across all municipal bonds, the largest issuer represented 8.3% of the category, and the largest single municipal bond issuer represents less than 0.60% of the entire portfolio and is rated NAIC 1. Our focus within municipal bonds is on NAIC 1 rated instruments, and 97.2% of the municipal bond exposure is rated NAIC 1. We have no exposure to troubled municipalities, including the City of Detroit.
Finance and finance-related corporates and hybrids remain the largest component of the $263.8 unrealized loss position. We view the increase in the unrealized loss position as a function of higher Treasury yields. The unrealized loss position in non-agency RMBS increased from $4.3 million to $13.4 million as the risk-off trade affected more market sensitive asset classes, and as concerns about the strength and duration of the housing recovery affected real estate sensitive assets. These recent developments notwithstanding, we continue to see the underlying fundamentals in this asset class as supportive, and ultimately, less subject to interest rate volatility. We continue to find opportunities in non-agency residential mortgage-backed holdings, generally targeting those securities with NAIC-1 ratings.
The amortized cost and fair value of fixed maturity securities and equity securities (excluding U.S. Government and U.S. Government sponsored agency securities) in an unrealized loss position greater than 20% and the number of months in an unrealized loss position with fixed maturity investment grade securities (NRSRO rating of BBB/Baa or higher) as of September 30, 2013, were as follows:
| September 30, 2013 | September 30, 2012 | |||||||||||||||||||||||||||||||
| Number of Securities |
Amortized Cost |
Fair Value |
Gross Unrealized Losses |
Number of Securities |
Amortized Cost |
Fair Value |
Gross Unrealized Losses |
|||||||||||||||||||||||||
| Investment grade: |
||||||||||||||||||||||||||||||||
| Less than six months |
9 | 78.3 | 60.9 | (17.4 | ) | — | — | — | — | |||||||||||||||||||||||
| Six months or more and less than twelve months |
— | — | — | — | 3 | 2.6 | 0.9 | (1.7 | ) | |||||||||||||||||||||||
| Twelve months or greater |
1 | 0.6 | — | (0.6 | ) | — | — | — | — | |||||||||||||||||||||||
|
|
|
|
|
|
|
|
|
|
|
|
|
|
|
|
|
|||||||||||||||||
| Total investment grade |
10 | 78.9 | 60.9 | (18.0 | ) | 3 | 2.6 | 0.9 | (1.7 | ) | ||||||||||||||||||||||
| Below investment grade: |
||||||||||||||||||||||||||||||||
| Less than six months |
1 | — | — | — | — | — | — | — | ||||||||||||||||||||||||
| Six months or more and less than twelve months |
1 | — | — | — | 1 | 0.8 | 0.5 | (0.3 | ) | |||||||||||||||||||||||
| Twelve months or greater |
2 | 0.4 | — | (0.4 | ) | 1 | — | — | — | |||||||||||||||||||||||
|
|
|
|
|
|
|
|
|
|
|
|
|
|
|
|
|
|||||||||||||||||
| Total below investment grade |
4 | 0.4 | — | (0.4 | ) | 2 | 0.8 | 0.5 | (0.3 | ) | ||||||||||||||||||||||
|
|
|
|
|
|
|
|
|
|
|
|
|
|
|
|
|
|||||||||||||||||
| Total |
14 | 79.3 | 60.9 | (18.4 | ) | 5 | 3.4 | 1.4 | (2.0 | ) | ||||||||||||||||||||||
|
|
|
|
|
|
|
|
|
|
|
|
|
|
|
|
|
|||||||||||||||||
As of September 30, 2013 we held 10 securities that had unrealized losses greater than 20% that were in an unrealized loss position less than six months, we held one security that was in an unrealized loss position greater than six months but less than 12 months and we held three securities that were in an unrealized loss position greater than 12 months. This included 10 investment grade securities (NRSRO rating of BBB/Baa or higher) with an amortized cost and estimated fair value of $78.9 million and $60.9 million, respectively as well as four securities below investment grade with an amortized cost and estimated fair value of $0.4 million and $0.0 million, respectively.
24
FIDELITY & GUARANTY LIFE HOLDINGS, INC.
As of September 30, 2012 we held five securities that had unrealized losses greater than 20% that were in an unrealized loss position greater than six months and one security that was in an unrealized loss position greater than 12 months. This included three investment grade securities (NRSRO rating of BBB/Baa or higher) with an amortized cost and estimated fair value of $2.6 million and $0.9 million, respectively as well as two securities below investment grade with an amortized cost and estimated fair value of $0.8 million and $0.5 million, respectively.
OTTI and Watch List
We have a policy and process in place to identify securities in our investment portfolio for which we should recognize impairments.
At each balance sheet date, we identify invested assets which have characteristics (i.e. significant unrealized losses compared to amortized cost and industry trends) creating uncertainty as to our future assessment of an other-than-temporary impairment. As part of this assessment we review not only a change in current price relative to its amortized cost but the issuer’s current credit rating and the probability of full recovery of principal based upon the issuer’s financial strength. Specifically for corporate issues we evaluate the financial stability and quality of asset coverage for the securities relative to the term to maturity for the issues we own. On a quarterly basis we review structured securities for changes in default rates, loss severities and expected cash flows for the purpose of assessing potential OTTI and related credit losses to be recognized in operations. A security which has a 20% or greater change in market price relative to its amortized cost and a possibility of a loss of principal will be included on a list which is referred to as our watch list. At September 30, 2013 and September 30, 2012, our watch list included only 14 and five securities in an unrealized loss position with an amortized cost of $79.3 million and $3.4 million, unrealized losses of $18.4 million and $2.0 million, and fair value of $60.9 million and $1.4 million, respectively. Our analysis of these structured securities included cash flow testing results which demonstrated the September 30, 2013 and September 30, 2012 carrying values were fully recoverable.
There were six and six structured securities on the watch list as of September 30, 2013 and September 30, 2012, respectively. Our analysis of these structured securities included cash flow testing results which demonstrated the September 30, 2013 carrying values were fully recoverable.
European Exposure
Our investment portfolio had no direct exposure to European sovereign debt as of September 30, 2013 or September 30, 2012. During Fiscal Year 2013, we recorded a gain of $2.9 million on the elimination of our portfolio’s exposure to peripheral European financial institutions by selling bonds issued by BBVA as well as two foreign subsidiaries of Banco Santander. As of September 30, 2012, this exposure had a fair value of $77.1 million. During Fiscal Year 2012, we recorded a gain of $3.0 million on the elimination of our portfolio’s exposure to Italian banks.
AFS Securities
For additional information regarding our AFS Securities, including the amortized cost, gross unrealized gains (losses), and fair value of AFS securities as well as the amortized cost and fair value of fixed maturity AFS securities by contractual maturities as of September 30, 2013 and September 30, 2012 refer to Note 4, to our audited consolidated financial statements.
Net Investment Income and Net Investment Gains
For discussion regarding our net investment income and net investment gains refer to Note 4, to our audited consolidated financial statements.
Concentrations of Financial Instruments
For detail regarding our concentration of financial instruments refer to Note 3, to our audited consolidated financial statements.
25
FIDELITY & GUARANTY LIFE HOLDINGS, INC.
Derivatives
For additional information regarding our derivatives refer to Note 5, to our audited consolidated financial statements.
We are exposed to credit loss in the event of nonperformance by our counterparties on the call options. We attempt to reduce the credit risk associated with such agreements by purchasing such options from large, well-established financial institutions.
We will also hold cash and cash equivalents received from counterparties for call option collateral, as well as Government securities pledged as call option collateral, if our counterparty’s net exposures exceed pre-determined thresholds. See Note 5, to our audited consolidated financial statements, for additional information regarding our exposure to credit loss on call options.
26
FIDELITY & GUARANTY LIFE HOLDINGS, INC.
Liquidity and Capital Resources
Liquidity is our ability to generate sufficient cash flows to meet the cash requirements of our operating, investing and financing activities. Our ability to generate and maintain sufficient liquidity depends on the prevailing economic and competitive conditions, the profitability of our businesses, the timing of cash flows, and certain financial, business and other factors beyond our control.
If our cash flows and capital resources are insufficient to fund our obligations, we could face substantial liquidity problems and may be forced to reduce or delay investments and capital expenditures, to sell assets at a loss, or seek additional capital or restructure or refinance our indebtedness. Our ability to restructure or refinance our debt will depend on the condition of the capital markets and our financial condition at such time. Any refinancing of our debt could be at higher interest rates and may require us to comply with more onerous covenants, which could further restrict our business operations. The terms of future debt instruments may restrict us from adopting some of these alternatives. In addition, any failure to make payments on our outstanding obligations on a timely basis would likely result in a reduction of our ratings, which could harm our ability to conduct our business and to incur additional indebtedness. In the absence of such cash flows and resources, we could face substantial liquidity problems and might be required to dispose of material assets or operations to meet our obligations. We may not be able to consummate those dispositions and these proceeds may not be adequate to meet any obligations then due.
Consolidated Cash Flow Activities
Presented below is a table that summarizes the cash provided or used in our activities for the periods indicated:
| April 6, 2011 | ||||||||||||
| through September 30, | ||||||||||||
| Fiscal 2013 | Fiscal 2012 | 2011 | ||||||||||
| Net cash provided by operating activities |
$ | 226.2 | $ | 254.4 | $ | 47.9 | ||||||
| Net cash provided by investing activities |
12.2 | 53.0 | 212.6 | |||||||||
| Net cash (used in) financing activities |
(83.5 | ) | (74.0 | ) | (485.0 | ) | ||||||
|
|
|
|
|
|
|
|||||||
| Net increase in cash |
$ | 154.9 | $ | 233.4 | $ | 224.5 | ||||||
|
|
|
|
|
|
|
|||||||
Our principal sources of cash include sales of our products, income from our investment portfolio and proceeds from sales of investments. As an insurance business, we typically generate positive cash flows from operating activities, as premiums collected from our insurance products and income received from our investments exceed policy acquisition costs, benefits paid, redemptions and operating expenses. These positive cash flows are then invested to support the obligations of our insurance and investment products and the required capital supporting these products. Our cash flows from operating activities are affected by (i) the timing of premiums, (ii) fees and investment income received and (iii) benefits and expenses paid. Changes in cash from financing activities primarily relate to the issuance of, and redemption and benefit payments on, investment contracts including annuity and IUL contracts and the issuance and repayment of borrowings.
27
FIDELITY & GUARANTY LIFE HOLDINGS, INC.
Operating Activities
Cash provided by operating activities totaled $226.2 million for the Fiscal 2013 as compared to cash provided of $254.4 million for Fiscal 2012. The $28.2 million decrease in cash provided by operating activities is primarily due to a period over period change of the deferred tax asset of $432.3 million, a $176.8 million payment one-time of cash to reinsurers related to the Wilton Re reinsurance transaction in Fiscal 2012 and a $15.0 million one-time receipt of cash related to the Front Street reinsurance transaction. Offsetting these increases was a decrease in other operating of $190.9 million, a decrease of $231.4 million of interest credited and charges assessed to contractholders in Fiscal 2013 and decreases in net investment gains, future policy benefits and funds withheld of $134.6 million, $74.6 million and $216.8 million, respectively due to the Front Street transaction and larger claim payments made during Fiscal 2013.
Cash provided by operating activities for the Fiscal 2012 was $254.4 million. Cash provided by operating activities was primarily comprised of $812.2 million in investment income and $75.4 million in insurance premiums and investment product fees, offset by $314.2 million in policy acquisition and operating expenses, $176.8 million in transfers of cash to reinsurers relating to reinsurance transactions and $140.4 million in benefits paid.
Cash used in operating activities for the period from April 6, 2011 through September 30, 2011 was $47.9 million. These cash flows were derived substantially from net income before adjusting for certain non-cash charges, including $140.0 million of interest credited/index credit to contractholder account balances. This was partially offset by $52.6 million of cash transferred to reinsurers in connection with reinsurance transactions.
Investing Activities
Cash provided by investing activities was $12.2 million for Fiscal 2013, as compared to cash provided by $53.0 million for Fiscal 2012. The $40.8 million decrease in cash provided by investing activities is principally due to reinvestment from cash generated in prior periods.
Cash provided by investing activities for the Fiscal 2012 was $53.0 million. This reflects proceeds from sales, maturities and repayments, net of purchases of fixed maturity securities, and other investments of $209.3 million, offset by new investments in related party loans of $150.1 million.
Cash provided by investing activities for the period from April 6, 2011 through September 30, 2011 was $212.6 million. This reflects cash provided from sales, maturities and repayments, net of purchases of fixed maturity securities and other investments of approximately $216.0 million.
Financing Activities
Cash used in financing activities was $83.5 million for the Fiscal 2013 as compared to cash used of $74.0 million for the Fiscal 2012. The $9.5 million increase in cash used year over year is primarily the result of an increase in cash used of $341.2 million in the issuance of investment contracts including annuity and universal life insurance contracts, net of redemptions and benefit payments partially offset by $300.0 million of proceeds from issuance of new debt, less $10.2 million of issuance costs. Also, contributing to the increase in cash used in the Fiscal 2013, was a dividend payment of $73.0 million, offset by $115.0 million of repayments of debt and revolving credit facility in Fiscal 2012.
Cash used in financing activities for the Fiscal 2012 was $74.0 million. This reflects the issuance of, net of redemptions and benefit payments on, investment contracts including annuity and universal life insurance contracts of $60.9 million, offset by repayment of the $95.0 million surplus note and payment of $40.0 million of notes payable.
Cash used in financing activities for the period from April 6, 2011 through September 30, 2011 was $485.0 million. This reflects redemptions and benefit payments on annuity and universal life insurance contracts, net of issuances of $272.3 million, offset by drawdown of revolving credit facility from affiliate of $21.3 million.
28
FIDELITY & GUARANTY LIFE HOLDINGS, INC.
Holding Company
We are a holding company with limited business operations of our own. Our primary subsidiaries are insurance subsidiaries that own substantially all of our assets and conduct substantially all of our operations. Dividends from our subsidiaries and interest earned on FGLH’s investments are our principal sources of cash to pay shareholder dividends and to meet our obligations. Accordingly, our payment of dividends is dependent, to a significant extent, on the generation of cash flow by our subsidiaries and their ability to make such cash available to us, by dividend or otherwise. Our subsidiaries may not be able to, or may not be permitted to, make distributions to enable us to meet our obligations and pay dividends. See “Risk Factors—Risks Relating to Our Business—we are a holding company with no operations of our own. As a consequence, our ability to pay dividends on our stock will depend on the ability of our subsidiaries to pay dividends to us, which may be restricted by law”. Each subsidiary is a distinct legal entity and legal and contractual restrictions may also limit our ability to obtain cash from our subsidiaries. Other principal sources of cash also include sales of assets held by our subsidiaries.
Insurance Subsidiaries
The liquidity requirements of our insurance subsidiaries principally relate to the liabilities associated with their various insurance and investment products, operating costs and expenses, the payment of dividends to us, payment of principal and interest on their outstanding debt obligations and income taxes. Liabilities arising from insurance and investment products include the payment of benefits, as well as cash payments in connection with policy surrenders and withdrawals, policy loans and obligations to redeem funding agreements.
Our insurance subsidiaries have used cash flows from operations and investment activities to fund their liquidity requirements. Our insurance subsidiaries’ principal cash inflows from operating activities are derived from premiums, annuity deposits and insurance and investment product fees and other income. The principal cash inflows from investment activities result from repayments of principal, investment income and, as necessary, sales of invested assets.
Our insurance subsidiaries maintain investment strategies intended to provide adequate funds to pay benefits without forced sales of investments. Products having liabilities with longer durations, such as certain life insurance, are matched with investments having similar estimated lives such as long-term fixed maturity securities. Shorter-term liabilities are matched with fixed maturity securities that have short- and medium-term fixed maturities. In addition, our insurance subsidiaries hold highly liquid, high-quality short-term investment securities and other liquid, investment grade, fixed maturity securities to fund anticipated operating expenses, surrenders and withdrawals.
The ability of our subsidiaries to pay dividends and to make other payments is limited by the applicable laws and regulations of the states in which our subsidiaries are domiciled, which subject our subsidiaries to significant regulatory restrictions. These laws and regulations require, among other things, our insurance subsidiaries to maintain minimum solvency requirements and limit the amount of dividends these subsidiaries can pay. Along with solvency regulations, the primary driver in determining the amount of capital used for dividends is the level of capital needed to maintain desired financial strength ratings from the rating agencies. Given the economic events of 2008 through 2010 that have affected the insurance industry, both regulators and rating agencies could become more conservative in their methodology and criteria, including increasing capital requirements for our insurance subsidiaries which, in turn, could negatively affect the cash available to us from insurance subsidiaries. It is possible that in the future, our insurance subsidiaries may be unable to pay dividends or distributions to us in an amount sufficient to meet our obligations or pay dividends on our common stock due to a lack of statutory net gain from operations, a diminishing statutory policyholders surplus, changes to the Maryland or New York insurance laws or regulations or for some other reason. See “Risk Factors—We are a holding company with no operations of our own. As a consequence, our ability to pay dividends on our stock will depend on the ability of our subsidiaries to pay dividends to us, which may be restricted by law”.
29
FIDELITY & GUARANTY LIFE HOLDINGS, INC.
The following table presents dividends permitted to be paid by our insurance subsidiaries without the need for insurance regulatory approval for the calendar years presented:
| Dividends Permitted without Approval | ||||||||||||
| (in millions) |
2013 | 2012 | 2011 | |||||||||
| Subsidiary Name: |
||||||||||||
| Fidelity & Guaranty Life Insurance Company |
$ | 106.3 | $ | 84.6 | $ | 90.2 | ||||||
| Fidelity & Guaranty Life Insurance Company of New York |
1.0 | 4.5 | 0.9 | |||||||||
In addition, Raven Re, a special purpose financial captive insurance company subsidiary domiciled in Vermont, provides reinsurance to FGL Insurance related to the excess statutory reserve associated with the waiver of surrender charge feature on certain deferred annuity contracts.
In July 2013, FGL Insurance received regulatory notice of non-objection from the MIA to make distributions to FGLH in the aggregate amount of $40.0 million.
Our Indebtedness
Senior Notes
We borrow funds to provide liquidity, invest in the growth of the business and for general corporate purposes. Our ability to access these borrowings depends on a variety of factors including, but not limited to, the credit rating of FGLH, FGL Insurance’s ordinary dividend capacity and general macroeconomic conditions. In March 2013, we issued $300.0 million aggregate principal amount of 6.375% Senior Notes due April 1, 2021, at par value pursuant to the indenture, dated as of March 27, 2013, between FGLH, certain of its subsidiaries from time to time parties thereto and Wells Fargo Bank, National Association, as Trustee (the “Trustee”), and the first supplemental indenture dated as of March 27, 2013, between FGLH, certain of its subsidiaries from time to time parties thereto and the Trustee. The Senior Notes bear interest at a rate of 6.375% per annum. Interest on the Senior Notes is payable semi-annually in cash in arrears on April 1 and October 1 of each year, commencing October 1, 2013. As of September 30, 2013, FGLH had outstanding approximately $300.0 million aggregate principal amount of the Senior Notes.
With the net proceeds received from the issuance, we paid HGI a $73.0 million dividend in March 2013. In connection with the Senior Notes, we capitalized $10.2 million of debt issue costs. The fees are classified as “Other assets” in the accompanying consolidated financial statements and will be amortized to interest expense over the remaining term of the debt.
30
FIDELITY & GUARANTY LIFE HOLDINGS, INC.
Contractual Obligations and Future Capital Requirements
Contractual Obligations
The following table summarizes, as of September 30, 2013, our contractual obligations that were fixed and determinable and the payments due under those obligations in the following periods.
| Payment Due by Fiscal Period | ||||||||||||||||||||
| (in millions) | Total | 2014 | 2015 and 2016 | 2017 and 2018 | After 2018 | |||||||||||||||
| Annuity and universal life products (a) |
$ | 19,062.7 | $ | 1,898.5 | $ | 3,673.1 | $ | 2,927.7 | $ | 10,563.4 | ||||||||||
| Operating leases |
10.2 | 1.3 | 2.5 | 2.5 | 3.9 | |||||||||||||||
| Debt |
300.0 | — | — | — | 300.0 | |||||||||||||||
| Interest expense |
143.0 | 19.1 | 38.2 | 38.2 | 47.5 | |||||||||||||||
|
|
|
|
|
|
|
|
|
|
|
|||||||||||
| Total |
$ | 19,515.9 | $ | 1,918.9 | $ | 3,713.8 | $ | 2,968.4 | $ | 10,914.8 | ||||||||||
|
|
|
|
|
|
|
|
|
|
|
|||||||||||
| (a) | Amounts shown in this table are projected payments through the year 2030 which we are contractually obligated to pay our annuity and IUL policyholders. The payments are derived from actuarial models which assume a level interest rate scenario and incorporate assumptions regarding mortality and persistency, when applicable. These assumptions are based on our historical experience, but actual amounts will differ. |
FHLB
We are currently a member of the Federal Home Loan Bank of Atlanta (“FHLB”) and are required to maintain a collateral deposit that backs any funding agreements issued. We have the ability to obtain funding from the FHLB based on a percentage of the value of our assets, subject to the availability of eligible collateral. Collateral is pledged based on the outstanding balances of FHLB funding agreements. The amount of funding varies based on the type, rating and maturity of the collateral posted to the FHLB. Generally, U.S. government agency notes and mortgage backed securities are pledged to the FHLB as collateral. Market value fluctuations resulting from changes in interest rates, spreads and other risk factors for each type of assets are monitored and additional collateral is either pledged or released as needed.
Our borrowing capacity under these credit facilities does not have an expiration date as long as we maintain a satisfactory level of creditworthiness based on the FHLB’s credit assessment. As of September 30, 2013 and September 30, 2012, we had $554.8 million and $364.1 million in non-putable funding agreements, respectively, included under contract owner account balances on our consolidated balance sheet. As of September 30, 2013 and September 30, 2012, we had assets with a market value of approximately $604.9 million and $390.6 million, respectively, which collateralized the FHLB funding agreements. Assets pledged to the FHLB are included in fixed maturities, AFS, on our consolidated balance sheets.
Collateral—Derivative Contracts
Under the terms of our Over-The-Counter Derivative International Swaps and Derivatives Association, Inc. (“ISDA”) agreements, we may receive from, or deliver to, counterparties, collateral to assure that all terms of the ISDA agreements will be met with regard to the Credit Support Annex (“CSA”). The terms of the CSA call for us to pay interest on any cash received equal to the federal funds rate. As of September 30, 2013 counterparties posted $72,000 of collateral. As of September 30, 2012, no collateral was posted by our counterparties as they did not meet the net exposure thresholds. Collateral requirements are monitored on a daily basis and incorporate changes in market values of both the derivatives contract as well as the collateral pledged. Market value fluctuations are due to changes in interest rates, spreads and other risk factors.
31
FIDELITY & GUARANTY LIFE HOLDINGS, INC.
Statutory Capital and Risk-Based Capital
FGL Insurance and FGL NY Insurance are subject to minimum RBC requirements established by the insurance departments of their applicable state of domicile. The formulas for determining the amount of RBC specify various weighting factors that are applied to financial balances or various levels of activity based on the perceived degree of risk. Regulatory compliance is determined by a ratio of TAC, as defined by the NAIC, to RBC requirements, as defined by the NAIC. FGL Insurance and FGL NY Insurance exceeded the minimum RBC requirements that would require regulatory or corrective action for all periods presented herein. RBC is an important factor in the determination of the financial strength ratings of FGL Insurance. FGL Insurance and FGL NY Insurance are required to prepare statutory financial statements in accordance with statutory accounting practices prescribed or permitted by the insurance department of the state of domicile of the respective insurance subsidiary. Statutory accounting practices primarily differ from GAAP by charging policy acquisition costs to expense as incurred, establishing future policy benefit liabilities using different actuarial assumptions as well as valuing investments and certain assets and accounting for deferred taxes on a different basis. Certain assets that are not admitted under statutory accounting principles are charged directly to surplus. Statutory capital and surplus of FGL Insurance and our other insurance subsidiaries is as follows for the periods presented:
| As of | ||||||||
| (in millions) |
September 30, 2013 | September 30, 2012 | ||||||
| Subsidiary Name: |
||||||||
| Fidelity & Guaranty Life Insurance Company |
$ | 1,064.3 | $ | 861.6 | ||||
| Fidelity & Guaranty Life Insurance Company of New York |
62.2 | 45.3 | ||||||
| Raven Reinsurance Company |
157.8 | 23.8 | ||||||
We monitor the ratio of our insurance subsidiaries’ TAC to company action level risk-based capital (“CAL”). A ratio in excess of (i) 100% or (ii) in excess of 125% if there is a negative trend, indicates that the insurance subsidiary is not required to take any corrective actions to increase capital levels at the direction of the applicable state of domicile. The ratio of TAC to CAL for FGL Insurance and FGL NY Insurance is set out below for the periods presented:
| As of September 30, 2013 | As of September 30, 2012 | |||||||||||||||||||||||
| (in millions) |
CAL | TAC | Ratio | CAL | TAC | Ratio | ||||||||||||||||||
| Subsidiary Name: |
||||||||||||||||||||||||
| Fidelity & Guaranty Life Insurance Company |
$ | 252.6 | $ | 1,135.5 | 454.9 | % | $ | 253.8 | $ | 901.4 | 353.2 | % | ||||||||||||
| Fidelity & Guaranty Life Insurance Company of New York |
$ | 8.0 | $ | 63.9 | 803.0 | % | $ | 7.3 | $ | 46.2 | 632.9 | % | ||||||||||||
Future Capital Requirements
We believe that our existing cash and cash equivalents combined with our expected cash flow from operations will be sufficient to meet our projected operating and capital expenditure requirements for at least the next twelve months.
Captive Reinsurers
FGL Insurance currently has a reinsurance agreement with Raven Re, its wholly-owned captive reinsurance company, whereby FGL Insurance cedes to Raven Re a 100% quota share of FGL Insurance’s statutory reserves related to the risk that FGL Insurance does not receive contractual surrender charges that are waived in certain circumstances. As of September 30, 2013, FGL Insurance had ceded $227.9 million of statutory reserves to Raven Re; however, the reserves ceded are only reflected in FGL Insurance’s statutory financial statements. Accordingly, the only impact on our consolidated GAAP financial statements is the expense associated with the related letter of credit facility and the amortization of the up-front structuring fee. The facility fee, including the amortization of the up-front structuring fee, was $5.8 million and $0 for the Fiscal Year 2013 and Fiscal Year 2012, respectively. Raven Re does not assume or cede any business to any third parties. See “Business—Reserve Facilities—The CARVM Facility”.
32
FIDELITY & GUARANTY LIFE HOLDINGS, INC.
If our insurance regulators introduce new regulations that restrict our ability to use captive reinsurers, FGL Insurance may have to recapture the business ceded to Raven Re, which would reduce FGL Insurance’s statutory capital and surplus by the amount of ceded reserves recaptured. See “Risk Factors—Restrictions on our ability to use captive reinsurers could adversely impact our competitive position and results of operations” for further discussion.
Off Balance Sheet Arrangements
We do not have any off balance sheet arrangements as of September 30, 2013.
33
FIDELITY & GUARANTY LIFE HOLDINGS, INC.
Critical Accounting Policies and Estimates
General
The preparation of financial statements in conformity with GAAP requires us to make estimates and assumptions that affect the reported amounts of assets and liabilities and disclosure of contingent assets and liabilities at the date of the financial statements and the reported amounts of revenues and expenses during the reporting period. Critical estimates and assumptions are evaluated on an ongoing basis based on historical developments, market conditions, industry trends and other information that is reasonable under the circumstances. There can be no assurance that actual results will conform to estimates and assumptions and that reported results of operations will not be materially affected by the need to make future accounting adjustments to reflect changes in these estimates and assumptions from time to time.
We have identified the following accounting policies, judgments and estimates as critical in that they involve a higher degree of judgment and are subject to a significant degree of variability: valuation of AFS securities and derivatives, evaluation of OTTI, amortization of DAC and VOBA, reserves for future policy benefits and product guarantees, recognition of deferred income tax assets and related valuation allowances and estimates of loss contingencies.
In developing these accounting estimates and policies, we make subjective and complex judgments that are inherently uncertain and subject to material changes as facts and circumstances develop. Although variability is inherent in these estimates, we believe the amounts provided are appropriate based upon the facts available upon preparation of our audited consolidated financial statements.
The above critical accounting estimates are described in Note 2 to our audited consolidated financial statements.
Valuation of AFS Securities and Derivatives
Our fixed maturity and equity securities classified as AFS are reported at fair value, with unrealized gains and losses included within AOCI (loss), net of associated intangibles adjustments and deferred income taxes. Unrealized gains and losses represent the difference between the cost or amortized cost basis and the fair value of these investments. We measure the fair value of our AFS securities based on assumptions used by market participants, which may include inherent risk and restrictions on the sale or use of an asset. The estimate of fair value is the price that would be received to sell an asset in an orderly transaction between market participants (“exit price”) in the principal market, or the most advantageous market in the absence of a principal market, for that asset or liability. We utilize independent pricing services in estimating the fair values of AFS securities. The independent pricing services incorporate a variety of observable market data in their valuation techniques, including: reported trading prices, benchmark yields, broker-dealer quotes, benchmark securities, bids and offers, credit ratings, relative credit information and other reference data.
34
FIDELITY & GUARANTY LIFE HOLDINGS, INC.
We categorize our AFS securities into a three-level hierarchy based on the priority of the inputs to the valuation technique. The fair value hierarchy gives the highest priority to quoted prices in active markets for identical assets (Level 1) and the lowest priority to unobservable inputs (Level 3). If the inputs used to measure fair value fall within different levels of the hierarchy, the category level is based on the lowest priority level input that is significant to the fair value measurement of the instrument. The following table presents the fair value of fixed maturity and equity securities, AFS, by pricing source and hierarchy level as of September 30, 2013 and September 30, 2012.
As of September 30, 2013
| (dollars in millions) | Quoted Prices in Active Markets for Identical Assets (Level 1) |
Significant Observable Inputs (Level 2) |
Significant Unobservable Inputs (Level 3) |
Total | ||||||||||||
| Prices third party pricing services |
790.9 | 14,308.4 | — | 15,099.3 | ||||||||||||
| Priced via independent broker quotations |
— | — | 656.7 | 656.7 | ||||||||||||
| Priced via other methods |
— | — | 213.6 | 213.6 | ||||||||||||
|
|
|
|
|
|
|
|
|
|||||||||
| Total |
790.9 | 14,308.4 | 870.3 | 15,969.6 | ||||||||||||
|
|
|
|
|
|
|
|
|
|||||||||
| % of Total |
5.0 | % | 89.6 | % | 5.4 | % | 100.0 | % | ||||||||
|
|
|
|
|
|
|
|
|
|||||||||
As of September 30, 2012
| (dollars in millions) | Quoted Prices in Active Markets for Identical Assets (Level 1) |
Significant Observable Inputs (Level 2) |
Significant Unobservable Inputs (Level 3) |
Total | ||||||||||||
| Prices third party pricing services |
930.0 | 15,242.0 | — | 16,172.0 | ||||||||||||
| Priced via independent broker quotations |
— | — | 133.0 | 133.0 | ||||||||||||
| Priced via other methods |
— | — | 32.0 | 32.0 | ||||||||||||
|
|
|
|
|
|
|
|
|
|||||||||
| Total |
930.0 | 15,242.0 | 165.0 | 16,337.0 | ||||||||||||
|
|
|
|
|
|
|
|
|
|||||||||
| % of Total |
6 | % | 93 | % | 1 | % | 100 | % | ||||||||
|
|
|
|
|
|
|
|
|
|||||||||
Management’s assessment of all available data when determining fair value of the AFS securities is necessary to appropriately apply fair value accounting. The independent pricing services also take into account perceived market movements and sector news, as well as a security’s terms and conditions, including any features specific to that issue that may influence risk and marketability. Depending on the security, the priority of the use of observable market inputs may change as some observable market inputs may not be relevant or additional inputs may be necessary. We generally obtain one value from our primary external pricing service. In situations where a price is not available from the independent pricing service, we may obtain broker quotes or prices from additional parties recognized to be market participants. We believe the broker quotes are prices at which trades could be executed based on historical trades executed at broker-quoted or slightly higher prices. When quoted prices in active markets are not available, the determination of estimated fair value is based on market standard valuation methodologies, including discounted cash flows, matrix pricing, or other similar techniques.
We validate external valuations at least quarterly through a combination of procedures that include the evaluation of methodologies used by the pricing services, comparisons to valuations from other independent pricing services, analytical reviews and performance analysis of the prices against trends, and maintenance of a securities watch list. See Note 4 and Note 6 to our audited consolidated financial statements for a more complete discussion.
Our FIA contracts permit the holder to elect to receive a credit based on an interest rate or the performance of a market index. We hedge certain portions of our exposure to equity market risk by entering into derivative transactions. In doing so, we purchase derivatives consisting of a combination of call options and futures contracts on the equity indices underlying the applicable policy. These derivatives are used to fund the index credits due to contractholders under the FIA contracts. The call options are one-, two- and three-year call options, purchased to match a majority of the funding requirements underlying the FIA contracts, with the balance of the equity exposure
35
FIDELITY & GUARANTY LIFE HOLDINGS, INC.
hedged using futures contracts. On the respective anniversary dates of the applicable FIA contracts, the market index used to compute the annual index credit under the applicable FIA contract is reset. At such time, we purchase new one-, two- or three-year call options to fund the next index credit. We attempt to manage the cost of these purchases through the terms of the FIA contracts, which permit changes to caps or participation rates, subject to certain guaranteed minimums that must be maintained. We are exposed to credit loss in the event of nonperformance by our counterparties on the call options. We attempt to reduce the credit risk associated with such agreements by purchasing such options from large, well-established financial institutions as well as holding collateral when individual counterparty exposures exceed certain thresholds.
All of our derivative instruments are recognized as either assets or liabilities at fair value in our Consolidated Balance Sheets. The change in fair value of our derivative assets is recognized in our Consolidated Statements of Operations within “Net investment gains (losses)”.
Certain products contain embedded derivatives—a feature in certain FIA contracts that permits the holder to elect an interest rate return or an equity-index linked component, where interest credited to the contract is linked to the performance of various equity indices. The FIA embedded derivative is valued at fair value and included in the liability for contractholder funds in our Consolidated Balance Sheets with changes in fair value included as a component of “Benefits and other changes in policy reserves” in our Consolidated Statements of Operations.
The fair value of derivative assets and liabilities is based upon valuation pricing models and represents what we would expect to receive or pay at the balance sheet date if we canceled the options, entered into offsetting positions, or exercised the options. The fair value of futures contracts at the balance sheet date represents the cumulative unsettled variation margin (open trade equity net of cash settlements). Fair values for these instruments are determined externally by an independent actuarial firm using market observable inputs, including interest rates, yield curve volatilities and other factors. Credit risk related to the counterparty is considered when estimating the fair values of these derivatives. However, we are largely protected by collateral arrangements with counterparties when individual counterparty exposures exceed certain thresholds. The fair values of the embedded derivatives in our FIA contracts are derived using market value of options, swap rates, mortality multiplier, surrender rates and non-performance spread and are classified as Level 3. See Note 5 and Note 6 to our audited consolidated financial statements for a more complete discussion. The discount rate used to determine the fair value of our FIA embedded derivative liabilities includes an adjustment to reflect the risk that these obligations will not be fulfilled(“nonperformance risk”). Through the Fiscal 2013 Nine Months, our nonperformance risk adjustment was based on the expected loss due to default in debt obligations for similarly rated financial companies. See Note 5, Derivative Financial Instruments, and Note 6, Fair Value of Financial Instruments, to our audited consolidated financial statements for a more complete discussion.
Evaluation of OTTI
We have a policy and process in place to evaluate securities in our investment portfolio quarterly to assess whether there has been an OTTI. This evaluation process entails considerable judgment and estimation and involves monitoring market events and other items that could impact issuers. The evaluation includes but is not limited to such factors as: the length of time and the extent to which the fair value has been less than cost or amortized cost; whether the issuer is current on all payments and all contractual payments have been made as agreed; the remaining payment terms and the financial condition and near term prospects of the issuer; the lack of ability to refinance due to liquidity problems in the credit market; the fair value of any underlying collateral; the existence of any credit protection available; the intent to sell and whether it is more likely than not we would be required to sell prior to recovery for debt securities; the assessment in the case of equity securities including perpetual preferred stocks with credit deterioration that the security cannot recover to cost in a reasonable period of time; the intent and ability to retain equity securities for a period of time sufficient to allow for recovery; consideration of rating agency actions; and changes in estimated cash flows of residential mortgage and ABS. An extended and severe unrealized loss position on an AFS fixed income security may not have any impact on: (a) the ability of the issuer to service all scheduled interest and principal payments and (b) the evaluation of recoverability of all contractual cash flows or the ability to recover an amount at least equal to its amortized cost based on the present value of the expected future cash flows to be collected.
36
FIDELITY & GUARANTY LIFE HOLDINGS, INC.
When assessing our intent to sell a security or if it is more likely than not we will be required to sell a security before recovery of its amortized cost basis, we evaluate facts and circumstances such as, but not limited to, sales of investments to meet cash flow or capital needs.
We determine whether OTTI losses should be recognized for debt and equity securities by assessing all facts and circumstances surrounding each security. Where the decline in market value of debt securities is attributable to changes in market interest rates or to factors such as market volatility, liquidity and spread widening, and we anticipate recovery of all contractual or expected cash flows, we do not consider these investments to be OTTI. For equity securities, we recognize an OTTI in the period in which we do not have the intent and ability to hold the securities until recovery of cost or we determine that the security will not recover to book value within a reasonable period of time. We determine what constitutes a reasonable period of time on a security-by-security basis by considering all the evidence available, including the magnitude of any unrealized loss and its duration. Impairment analysis of the investment portfolio involves considerable judgment, is subject to considerable variability, is established using management’s best estimate and is revised as additional information becomes available. As such, changes in or deviations from the assumptions used in such analysis can have a significant effect on the results of operations. See “—OTTI and Watch List,” Note 2 and Note 4 to our audited consolidated financial statements for a more complete discussion. Also, see Note 4 to our audited consolidated financial statements for discussion around our gross unrealized losses as of September 30, 2013.
DAC and VOBA
Acquisition costs that are incremental, direct costs of contract acquisition, as well as certain costs that are directly related to successful acquisition activities are capitalized as DAC. DAC consists principally of commissions and certain costs of policy issuance that are directly related to the successful acquisition of new business. Indirect or unsuccessful acquisition costs, maintenance, product development and overhead expenses are charged to expense as incurred.
VOBA is an intangible asset that reflects the estimated fair value of in-force contracts in a life insurance company acquisition less the amount recorded as insurance contract liabilities. It represents the portion of the purchase price that is allocated to the value of the rights to receive future cash flows from the business in-force at the acquisition date.
DAC and VOBA are subject to loss recognition testing on a quarterly basis or when an event occurs that may warrant loss recognition.
For annuity products and IUL, DAC and VOBA are being amortized generally in proportion to estimated gross profits from net investment spread margins, surrender charges and other product fees, policy benefits, maintenance expenses, mortality net of reinsurance ceded and expense margins, and recognized gain (loss) on investments. Current and future period gross profits for FIA contracts also include the impact of amounts recorded for the change in fair value of derivatives and the change in fair value of embedded derivatives. At each valuation date, the most recent quarter’s estimated gross profits are updated with actual gross profits and the assumptions underlying future estimated gross profits are evaluated for continued reasonableness. If the update of assumptions causes estimated gross profits to increase, DAC and VOBA amortization will decrease, resulting in lower amortization expense in the period. The opposite result occurs when the assumption update causes estimated gross profits to decrease. Current period amortization is adjusted retrospectively through an unlocking process when estimates of current or future gross profits (including the impact of recognized investment gains and losses) to be realized from a group of products are revised. Our estimates of future gross profits are based on actuarial assumptions related to the underlying policies’ terms, lives of the policies, duration of contract, yield on investments supporting the liabilities and level of expenses necessary to maintain the polices over their entire lives. Revisions are made based on historical results and our best estimates of future experience. Estimated future gross profits vary based on a number of sources including net investment spread margins, surrender charge income, policy persistency, policy administrative expenses and recognized gains and losses on investments including credit related OTTI losses. Estimated future gross profits are sensitive to changes in interest rates which are the most significant component of gross profits.
37
FIDELITY & GUARANTY LIFE HOLDINGS, INC.
Changes in assumptions can have a significant impact on DAC and VOBA, amortization rates and results of operations. Assumptions are management’s best estimate of future outcome. Several assumptions are considered significant and require significant judgment in the estimation of gross profits and are listed below. We periodically review these assumptions against actual experience and update our assumptions based on additional information that becomes available.
| • | Assumptions related to interest rate spreads and credit losses also impact estimated gross profits for all applicable products with credited rates. These assumptions are based on the current investment portfolio yields and credit quality, estimated future crediting rates, capital markets, and estimates of future interest rates and defaults. |
| • | Other significant assumptions include estimated policyholder behavior assumptions, such as surrender, lapse, and annuitization rates. We use a combination of actual and industry experience when setting and updating our policyholder behavior assumptions and such assumptions require considerable judgment. |
We perform sensitivity analyses to assess the impact that certain assumptions have on DAC and VOBA. The following table presents the estimated instantaneous net impact to income before income taxes of various assumption changes on our DAC and VOBA. The effects presented are not representative of the aggregate impacts that could result if a combination of such changes to interest rates and other assumptions occurred.
| As of September 30, 2013 | ||||
| A change to the long-term interest rate assumption of - 50 basis points |
$ | (48.1 | ) | |
| A change to the longer-term interest assumption of +50 basis points |
38.0 | |||
| An assumed 10% increase in surrender rate |
(9.9 | ) | ||
Assumptions regarding shifts in market factors may be overly simplistic and not indicative of actual market behavior in stress scenarios.
| • | Lower assumed interest rates and higher assumed annuity surrender rates tend to decrease the balances of DAC and VOBA, thus decreasing income before income taxes. |
| • | Higher assumed interest rates and lower assumed annuity surrender rates tend to increase the balances of DAC and VOBA, thus increasing income before income taxes. |
See Note 2 and Note 7 to our audited consolidated financial statements for a more complete discussion. We continually update and assess the facts and circumstances regarding all of these critical accounting matters and other significant accounting matters affecting estimates in our financial statements.
Reserves for Future Policy Benefits and Product Guarantees
The determination of future policy benefit reserves is dependent on actuarial assumptions. The principal assumptions used to establish liabilities for future policy benefits are based on our experience. These assumptions are established at issue of the contract and include mortality, morbidity, contract full and partial surrenders, investment returns, annuitization rates and expenses. The assumptions used require considerable judgment. We review overall policyholder experience at least annually and update these assumptions when deemed necessary based on additional information that becomes available. For traditional life and immediate annuity products, assumptions used in the reserve calculation can only be changed if the reserve is deemed to be insufficient. For all other insurance products, changes in assumptions will be used to calculate reserves. Changes in, or deviations from, the assumptions used can significantly affect our reserve levels and related results of operations.
Mortality is the incidence of death amongst policyholders triggering the payment of underlying insurance coverage by the insurer. In addition, mortality also refers to the ceasing of payments on life-contingent annuities due to the death of the annuitant. We utilize a combination of actual and industry experience when setting our mortality assumptions.
38
FIDELITY & GUARANTY LIFE HOLDINGS, INC.
A surrender rate is the percentage of account value surrendered by the policyholder. A lapse rate is the percentage of account value canceled by us due to nonpayment of premiums. We make estimates of expected full and partial surrenders of our fixed annuity products. Our surrender rate experience in fiscal 2013 on the fixed annuity products has been averaging 7.1% which is within our assumed ranges. Management’s best estimate of surrender behavior incorporates actual experience over the entire period, as we believe that, over the duration of the policies, we will experience the full range of policyholder behavior and market conditions. If actual surrender rates are significantly different from those assumed, such differences could have a significant effect on our reserve levels and related results of operations.
The assumptions used to establish the liabilities for our product guarantees require considerable judgment and are established as management’s best estimate of future outcomes. We periodically review these assumptions and, if necessary, update them based on additional information that becomes available. Changes in or deviations from the assumptions used can significantly affect our reserve levels and related results of operations.
At issue, and at each subsequent valuation, we determine the present value of the cost of the GMWB rider benefits in excess of benefits that are funded by the account value. We also calculate the expected value of the future rider charges for providing for these benefits. We accumulate a reserve equal to the portion of these fees that would be required to fund the future benefits less benefits paid to date. In making these projections, a number of assumptions are made and we update these assumptions as experience emerges when required. We have minimal experience to date on policyholder behavior for our GMWB products which we began issuing in 2008, as a result, future experience could lead to significant changes in our assumptions. If emerging experience deviates from our assumptions on GMWB utilizations, such deviations could have a significant effect on our reserve levels and related results of operations.
Our aggregate reserves for future policy benefits and product guarantees on a direct and net basis as of September 30, 2013 are summarized as follows:
| Reinsurance | ||||||||||||
| (in millions) |
Direct | Recoverable | Net | |||||||||
| Fixed indexed annuities |
$ | 9,985.9 | $ | (867.7 | ) | $ | 9,118.2 | |||||
| Fixed rate annuities |
2,708.2 | (316.5 | ) | 2,391.7 | ||||||||
| Immediate annuities |
3,491.6 | (408.7 | ) | 3,082.9 | ||||||||
| Universal life |
1,164.1 | (1,054.5 | ) | 109.6 | ||||||||
| Traditional life |
1,455.3 | (1,081.2 | ) | 374.1 | ||||||||
|
|
|
|
|
|
|
|||||||
| Total |
$ | 18,805.1 | $ | (3,728.6 | ) | $ | 15,076.5 | |||||
See Note 2 to our audited consolidated financial statements for a more complete discussion.
39
FIDELITY & GUARANTY LIFE HOLDINGS, INC.
Deferred Income Tax Assets and Related Valuation Allowance
Accounting Standards Codification section 740, Income Taxes (ASC 740), provides that deferred tax assets are recognized for deductible temporary differences and operating loss and tax credit carry-forwards. A valuation allowance is recorded if, based on the weight of available evidence, it is more likely than not that a portion of or all deferred tax assets are not more-likely-than-not realizable. Assessing the need for, and the amount of, a valuation allowance for deferred tax assets requires management’s judgment, considering all available positive and negative evidence as to the reliability of deferred tax assets.
Future realization of deferred tax assets ultimately depends on the existence of sufficient taxable income of the appropriate character (i.e., ordinary income or capital gain) in either the carryback or carry-forward period under tax law. The four sources of taxable income that may be considered in determining whether a valuation allowance is required are:
| • | Future reversals of existing taxable temporary differences (i.e., offset of gross deferred tax assets against gross deferred tax liabilities); |
| • | Taxable income in prior carryback years, if carryback is permitted under tax law; |
| • | Tax planning strategies; and |
| • | Future taxable income exclusive of reversing temporary differences and carry-forwards. |
At each reporting date, management considers new evidence, both positive and negative, that could impact management’s judgment regarding the future realization of deferred tax assets. As of September 30, 2013, management gathered the following positive and negative evidence concerning the future realization of deferred tax assets:
Positive Evidence:
| • | As of September 30, 2013, we were in a cumulative income position based on pre-tax income over the prior 12-quarters; |
| • | We are projecting significant pre-tax GAAP income from continuing operations; |
| • | We have projected that the reversal of taxable temporary timing differences will unwind in the 20-year projection period; |
| • | We have a history of utilizing all significant tax attributes before they expire; and |
| • | Our inventory of §382 limited attributes has been significantly reduced. |
Negative Evidence:
| • | §382 limited carry-forwards reduce our ability to utilize tax attributes in future years; and |
| • | Brief carryback/carry-forward period for capital losses. |
Based on management’s evaluation of the above positive and negative evidence, management concluded that a partial valuation allowance continued to be necessary at September 30, 2013. This resulted in a valuation allowance release totaling $18.8 million for the Fiscal Year.
Loss Contingencies
Loss contingencies are recorded as liabilities when it is probable that a loss has been incurred and the amount of such loss can be reasonably estimated. The outcome of existing litigation and pending or potential examinations by various taxing or regulatory authorities are examples of situations evaluated as loss contingencies. Estimating the probability and magnitude of losses is often dependent upon management’s judgment of potential actions by third parties and regulators.
The establishment of litigation and regulatory reserves requires judgments concerning the ultimate outcome of pending claims against us and our subsidiaries. In applying their judgment, management utilizes opinions and estimates obtained from outside counsel to apply the appropriate accounting for contingencies. Accordingly, estimated amounts relating to certain claims have met the criteria for the recognition of a liability. Other claims for which a liability has not been recognized are reviewed on an ongoing basis in accordance with accounting guidance. A liability is recognized for all associated legal costs as incurred. Liabilities for litigation settlements, regulatory matters, legal fees and changes in these estimated amounts are not expected to have a material adverse effect on our financial position, although it is possible that the results of operations and cash flows could be materially affected by an unfavorable outcome.
40
FIDELITY & GUARANTY LIFE HOLDINGS, INC.
If the actual cost of settling these matters, whether resulting from adverse judgments or otherwise, differs from the reserves totaling $3.4 million that we have accrued as of September 30, 2013, that difference will be reflected in our results of operations when the matter is resolved or when our estimate of the cost changes. See further discussion in Note 13 to our audited consolidated financial statements.
New Accounting Standards
See Note 2, “Significant Accounting Policies and Practices” to our consolidated financial statements for a discussion of recent accounting pronouncements that have been issued and will be implemented in the future.
41
FIDELITY & GUARANTY LIFE HOLDINGS, INC.
ITEM 3: Quantitative and Qualitative Disclosures about Market Risk
Market Risk Factors
Market risk is the risk of the loss of fair value resulting from adverse changes in market rates and prices, such as interest rates, foreign currency exchange rates, commodity prices and equity prices. Market risk is directly influenced by the volatility and liquidity in the markets in which the related underlying financial instruments are traded. We have significant holdings in financial instruments and are naturally exposed to a variety of market risks. We are primarily exposed to interest rate risk and equity price risk and have some exposure to credit risk and counterparty risk, which affect the fair value of financial instruments subject to market risk.
Enterprise Risk Management
We place a high priority to risk management and risk control. As part of our effort to ensure measured risk taking, management has integrated risk management in our daily business activities and strategic planning. We have comprehensive risk management, governance and control procedures in place and have established a dedicated risk management function with responsibility for the formulation of our risk appetite, strategies, policies and limits. The risk management function is also responsible for monitoring our overall market risk exposures and provides review, oversight and support functions on risk-related issues. Our risk appetite is aligned with how our businesses are managed and how we anticipate future regulatory developments.
Our risk governance and control systems enable us to identify, control, monitor and aggregate risks and provide assurance that risks are being measured, monitored and reported adequately and effectively in accordance with the following three principles:
| • | Management of the business has primary responsibility for the day-to-day management of risk. |
| • | The risk management function has the primary responsibility to align risk taking with strategic planning through risk tolerance and limit setting. |
| • | The internal audit function provides an ongoing independent (i.e. outside of the risk organization) and objective assessment of the effectiveness of internal controls, including financial and operational risk management. |
The Chief Risk Officer (“CRO”) heads our risk management process and reports directly to our Chief Executive Officer (“CEO”). Our Enterprise Risk Committee discusses and approves all risk policies and reviews and approves risks associated with our activities. This includes volatility (affecting earnings and value), exposure (required capital and market risk) and insurance risks.
We have implemented several limit structures to manage risk. Examples include, but are not limited to, the following:
| • | At-risk limits on sensitivities of earnings and regulatory capital to the capital markets provide the fundamental framework to manage capital markets risks including the risk of asset / liability mismatch; |
| • | Duration and convexity mismatch limits; |
| • | Credit risk concentration limits; and |
| • | Investment and derivative guidelines. |
42
FIDELITY & GUARANTY LIFE HOLDINGS, INC.
We manage our risk appetite based on two key risk metrics:
| • | Regulatory Capital Sensitivities: the potential reduction, under a moderate capital markets stress scenario, of the excess of available statutory capital above the minimum required under the NAIC regulatory RBC methodology; and |
| • | Earnings Sensitivities: the potential reduction in results of operations under a moderate capital markets stress scenario. Maintaining a consistent level of earnings helps us to finance our operations, support our capital requirements and provide funds to pay dividends to stockholders. |
Our risk metrics cover the most important aspects in terms of performance measures where risk can materialize and are representative of the regulatory constraints to which our business is subject. The sensitivities for earnings and statutory capital are important metrics since they provide insight into the level of risk we take under stress scenarios. They also are the basis for internal risk management.
We are also subject to cash flow stress testing pursuant to regulatory requirements. This analysis measures the effect of changes in interest rate assumptions on asset and liability cash flows. The analysis includes the effects of:
| • | The timing and amount of redemptions and prepayments in our asset portfolio; |
| • | Our derivative portfolio; |
| • | Death benefits and other claims payable under the terms of our insurance products; |
| • | Lapses and surrenders in our insurance products; |
| • | Minimum interest guarantees in our insurance products; and |
| • | Book value guarantees in our insurance products. |
Interest Rate Risk
Interest rate risk is our primary market risk exposure. We define interest rate risk as the risk of an economic loss due to adverse changes in interest rates. This risk arises from our holdings in interest sensitive assets and liabilities, primarily as a result of investing life insurance premiums and fixed annuity deposits received in interest-sensitive assets and carrying these funds as interest-sensitive liabilities. Substantial and sustained increases or decreases in market interest rates can affect the profitability of the insurance products and the fair value of our investments, as the majority of our insurance liabilities are backed by fixed maturity securities.
The profitability of most of our products depends on the spreads between interest yield on investments and rates credited on insurance liabilities. We have the ability to adjust the rates credited, primarily caps and credit rates, on the majority of the annuity liabilities at least annually, subject to minimum guaranteed values. In addition, the majority of the annuity products have surrender and withdrawal penalty provisions designed to encourage persistency and to help ensure targeted spreads are earned. However, competitive factors, including the impact of the level of surrenders and withdrawals, may limit our ability to adjust or maintain crediting rates at the levels necessary to avoid a narrowing of spreads under certain market conditions.
In order to meet our policy and contractual obligations, we must earn a sufficient return on our invested assets. Significant changes in interest rates exposes us to the risk of not earning the anticipated spreads between the interest rate earned on our investments and the credited interest rates paid on outstanding policies and contracts. Both rising and declining interest rates can negatively affect interest earnings, spread income and the attractiveness of certain of our products.
43
FIDELITY & GUARANTY LIFE HOLDINGS, INC.
During periods of increasing interest rates, we may offer higher crediting rates on interest-sensitive products, such as IUL insurance and fixed annuities, and we may increase crediting rates on in-force products to keep these products competitive. A rise in interest rates, in the absence of other countervailing changes, will result in a decline in the market value of our investment portfolio.
As part of our ALM program, we have made a significant effort to identify the assets appropriate to different product lines and ensure investing strategies match the profile of these liabilities. Our ALM strategy is designed to align the expected cash flows from the investment portfolio with the expected liability cash flows. As such, a major component of our effort to manage interest rate risk has been to structure the investment portfolio with cash flow characteristics that are consistent with the cash flow characteristics of the insurance liabilities. We use actuarial models to simulate the cash flows expected from the existing business under various interest rate scenarios. These simulations enable us to measure the potential gain or loss in the fair value of interest rate-sensitive financial instruments, to evaluate the adequacy of expected cash flows from assets to meet the expected cash requirements of the liabilities and to determine if it is necessary to lengthen or shorten the average life and duration of our investment portfolio. The “duration” of a security is the time weighted present value of the security’s expected cash flows. Duration is used to measure a security’s sensitivity to changes in interest rates. When the durations of assets and liabilities are similar, exposure to interest rate risk is minimized because a change in the value of assets could be expected to be largely offset by a change in the value of liabilities.
Credit Risk and Counterparty Risk
We are exposed to the risk that a counterparty will default on its contractual obligation resulting in financial loss. The major source of credit risk arises predominantly in our insurance operations’ portfolios of debt and similar securities. The carrying value of our fixed maturity portfolio totaled $15.5 billion and $16.1 billion at September 30, 2013 and September 30, 2012, respectively. Our credit risk materializes primarily as impairment losses. We are exposed to occasional cyclical economic downturns, during which impairment losses may be significantly higher than the long-term historical average. This is offset by years where we expect the actual impairment losses to be substantially lower than the long-term average. Credit risk in the portfolio can also materialize as increased capital requirements as assets migrate into lower credit qualities over time. The effect of rating migration on our capital requirements is also dependent on the economic cycle and increased asset impairment levels may go hand in hand with increased asset related capital requirements.
We manage the risk of default and rating migration by applying disciplined credit evaluation and underwriting standards and limiting allocations to lower quality, higher risk investments. In addition, we diversify our exposure by issuer and country, using rating based issuer and country limits. We also set investment constraints that limit our exposure by industry segment. To limit the impact that credit risk can have on earnings and capital adequacy levels, we have portfolio-level credit risk constraints in place. Limit compliance is monitored on a daily or, in some cases, monthly basis.
In connection with the use of call options, we are exposed to counterparty credit risk—the risk that a counterparty fails to perform under the terms of the derivative contract. We have adopted a policy of only dealing with credit worthy counterparties and obtaining sufficient collateral where appropriate, as a means of mitigating the financial loss from defaults. The exposure and credit rating of the counterparties are continuously monitored and the aggregate value of transactions concluded is spread amongst seven different approved counterparties to limit the concentration in one counterparty. Our policy allows for the purchase of derivative instruments from nationally recognized investment banking institutions with the equivalent of an S&P rating of A- or higher. Collateral support documents are negotiated to further reduce the exposure when deemed necessary. See Note 5 to our audited consolidated financial statements for additional information regarding our exposure to credit loss.
44
FIDELITY & GUARANTY LIFE HOLDINGS, INC.
Information regarding the Company’s exposure to credit loss on the call options it holds is presented in the following table:
| September 30, 2013 | September 30, 2012 | |||||||||||||||||||||||||||||||||
| Counterparty |
Credit Rating (Moody’s/ S&P) |
Notional Amount |
Fair Value |
Collateral | Net Credit Risk |
Notional Amount |
Fair Value | Collateral | Net Credit Risk |
|||||||||||||||||||||||||
| Merrill Lynch |
NA/A | $ | 2,037.8 | $ | 70.7 | $ | — | $ | 70.7 | $ | 1,884.0 | $ | 64.1 | — | $ | 64.1 | ||||||||||||||||||
| Deutsche Bank |
A2/A | 1,620.4 | 51.7 | 23.0 | 28.7 | 1,816.5 | 61.7 | — | 61.7 | |||||||||||||||||||||||||
| Morgan Stanley |
Baa1/A | 2,264.1 | 75.7 | 49.0 | 26.7 | 1,634.7 | 51.6 | — | 51.6 | |||||||||||||||||||||||||
| Royal Bank of |
||||||||||||||||||||||||||||||||||
| Scotland |
A3/A | 364.3 | 20.3 | — | 20.3 | 353.9 | 19.6 | — | 19.6 | |||||||||||||||||||||||||
| Barclay’s Bank |
A2/A | 120.8 | 3.4 | — | 3.4 | 131.3 | 3.1 | — | 3.1 | |||||||||||||||||||||||||
| Credit Suisse |
A2/A- | — | — | — | — | 10.0 | 0.6 | — | 0.6 | |||||||||||||||||||||||||
|
|
|
|
|
|
|
|
|
|
|
|
|
|
|
|
|
|||||||||||||||||||
| $ | 6,407.4 | $ | 221.8 | $ | 72.0 | $ | 149.8 | $ | 5,830.4 | $ | 200.7 | $ | — | $ | 200.7 | |||||||||||||||||||
|
|
|
|
|
|
|
|
|
|
|
|
|
|
|
|
|
|||||||||||||||||||
We also have credit risk related to the ability of reinsurance counterparties to honor their obligations to pay the contract amounts under various agreements. To minimize the risk of credit loss on such contracts, we diversify our exposures among many reinsurers and limit the amount of exposure to each based on credit rating. We also generally limit our selection of counterparties with which we do new transactions to those with an “A-” credit rating or above or that are appropriately collateralized and provide credit for reinsurance. When exceptions are made to that principle, we ensure that we obtain collateral to mitigate our risk of loss. The following table presents our reinsurance recoverable balances and financial strength ratings for our five largest reinsurance recoverable balances as of September 30, 2013:
| ($ in millions) Parent Company/Principal Reinsurers |
Reinsurance Recoverable |
AM Best | Financial Strength Rating S&P |
Moody’s | ||||||
| Wilton Reassurance |
$ | 1,481.0 | A | Not rated | Not rated | |||||
| Front Street |
1,365.0 | Not rated | Not rated | Not rated | ||||||
| Security Life of Denver |
205.7 | Not rated | Not rated | A | ||||||
| Scottish RE (US), INC |
170.0 | A | A- | A3 | ||||||
| Keyport |
113.8 | A- | BBB | Baa2 | ||||||
In the normal course of business, certain reinsurance recoverables are subject to reviews by the reinsurers. We are not aware of any material disputes arising from these reviews or other communications with the counterparties, and, therefore, as of September 30, 2013, no allowance for uncollectible amounts was recorded.
45
FIDELITY & GUARANTY LIFE HOLDINGS, INC.
Equity Price Risk
We are primarily exposed to equity price risk through certain insurance products, specifically those products with guaranteed minimum withdrawal benefits. We offer a variety of FIA contracts with crediting strategies linked to the performance of indices such as the S&P 500 Index, Dow Jones Industrials or the NASDAQ 100 Index. The estimated cost of providing guaranteed minimum withdrawal benefits incorporates various assumptions about the overall performance of equity markets over certain time periods. Periods of significant and sustained downturns in equity markets, increased equity volatility or reduced interest rates could result in an increase in the valuation of the future policy benefit or policyholder account balance liabilities associated with such products, resulting in a reduction in our net income. The rate of amortization of intangibles related to FIA products and the cost of providing guaranteed minimum withdrawal benefits could also increase if equity market performance is worse than assumed.
To economically hedge the equity returns on these products, we purchase derivatives to hedge the FIA equity exposure. The primary way we hedge FIA equity exposure is to purchase over the counter equity index call options from broker-dealer derivative counterparties who generally have a minimum credit rating of Baa2 from Moody’s and A- from S&P. The second way to hedge FIA equity exposure is by purchasing exchange traded equity index futures contracts. Our hedging strategy enables us to reduce our overall hedging costs and achieve a high correlation of returns on the call options purchased relative to the index credits earned by the FIA contractholders. The majority of the call options are one-year options purchased to match the funding requirements underlying the FIA contracts. These hedge programs are limited to the current policy term of the FIA contracts, based on current participation rates. Future returns, which may be reflected in FIA contracts’ credited rates beyond the current policy term, are not hedged. We attempt to manage the costs of these purchases through the terms of our FIA contracts, which permit us to change caps or participation rates, subject to certain guaranteed minimums that must be maintained.
The derivatives are used to fund the FIA contract index credits and the cost of the call options purchased is treated as a component of spread earnings. While the FIA hedging program does not explicitly hedge statutory or U.S. GAAP income volatility, the FIA hedging program tends to mitigate a significant portion of the statutory and U.S. GAAP reserve changes associated with movements in the equity market and risk-free rates. This is due to the fact that a key component in the calculation of statutory and U.S. GAAP reserves is the market valuation of the current term embedded derivative. Due to the alignment of the embedded derivative reserve component with hedging of this same embedded derivative, there should be a reasonable match between changes in this component of the reserve and changes in the assets backing this component of the reserve. However, there may be an interim mismatch due to the fact that the hedges which are put in place are only intended to cover exposures expected to remain until the end of an indexing term. To the extent index credits earned by the contractholder exceed the proceeds from option expirations and futures income, we incur a raw hedging loss.
See Note 5 to our audited consolidated financial statements for additional details on the derivatives portfolio.
Fair value changes associated with these investments are intended to, but do not always, substantially offset the increase or decrease in the amounts added to policyholder account balances for index products. For the Fiscal 2013, the annual index credits to policyholders on their anniversaries were $319.1 million. Proceeds received at expiration on options related to such credits were $281.7 million. The shortfall is funded by our net investment spread earnings and futures income.
Other market exposures are hedged periodically depending on market conditions and our risk tolerance. The FIA hedging strategy economically hedges the equity returns and exposes us to the risk that unhedged market exposures result in divergence between changes in the fair value of the liabilities and the hedging assets. We use a variety of techniques including direct estimation of market sensitivities and value-at-risk to monitor this risk daily. We intend to continue to adjust the hedging strategy as market conditions and risk tolerance change.
Sensitivity Analysis
The analysis below is hypothetical and should not be considered a projection of future risks. Earnings projections are before tax and noncontrolling interest.
46
FIDELITY & GUARANTY LIFE HOLDINGS, INC.
Interest Rate Risk
We assess interest rate exposures for financial assets, liabilities and derivatives using hypothetical test scenarios that assume either increasing or decreasing 100 basis point parallel shifts in the yield curve, reflecting changes in either credit spreads or risk-free rates. If interest rates were to increase 100 basis points from levels at September 30, 2013, the estimated fair value of our fixed maturity securities would decrease by approximately $794.0 million of which $68.3 relates to the Front Street funds withheld assets. The fair values of the reinsurance related embedded derivative would increase by a similar amount and be reflected in the Company’s consolidated Statement of Operations. The impact on shareholders’ equity of such decrease, net of income taxes and intangibles adjustments, and the change in reinsurance related derivative would be a decrease of $192.0 million in AOCI and an increase of $30.8 million in total shareholders’ equity. If interest rates were to decrease by 100 basis points from levels at September 30, 2013, the estimated impact on the embedded derivative liability of such a decrease would be an increase of $94.8 million. The actuarial models used to estimate the impact of a one percentage point change in market interest rates incorporate numerous assumptions, require significant estimates and assume an immediate and parallel change in interest rates without any management of the investment portfolio in reaction to such change. Consequently, potential changes in value of financial instruments indicated by these simulations will likely be different from the actual changes experienced under given interest rate scenarios, and the differences may be material. Because we actively manage our investments and liabilities, the net exposure to interest rates can vary over time. However, any such decreases in the fair value of fixed maturity securities, unless related to credit concerns of the issuer requiring recognition of an OTTI, would generally be realized only if we were required to sell such securities at losses prior to their maturity to meet liquidity needs. Our liquidity needs are managed using the surrender and withdrawal provisions of the annuity contracts and through other means.
Equity Price Risk
Assuming all other factors are constant, we estimate that a decline in equity market prices of 10% would cause the market value of our equity investments to decrease by approximately $27.1 million, our derivative investments to decrease by approximately $47.9 based on equity positions and our FIA embedded derivative liability to decrease by approximately $24.2 million as of September 30, 2013. Because our equity investments are classified as AFS, the 10% decline would not affect current earnings except to the extent that it reflects OTTI. These scenarios consider only the direct effect on fair value of declines in equity market levels and not changes in asset-based fees recognized as revenue, or changes in our estimates of total gross profits used as a basis for amortizing DAC and VOBA.
47