Attached files
| file | filename |
|---|---|
| 8-K - ZALE CORPORATION 8-K - ZALE CORP | a50780681.htm |
| EX-99.1 - EXHIBIT 99.1 - ZALE CORP | a50780681ex99_1.htm |
Exhibit 99.2
ZALE CORPORATION THE DIAMOND STORE Holiday Season Fiscal Year 2014 Results January 10, 2014 1
Forward-Looking Statements This presentation contains forward-looking statements, including statements regarding future sales, expected operating performance, expenses, margins, profitability, earnings, interest expense, effective tax rate, merchandising and marketing initiatives and industry growth forecasts. Forward-looking statements are not guarantees of future performance and a variety of factors could cause the Company's actual results to differ materially from the results expressed in the forward-looking statements. These factors include, but are not limited to: if the general economy performs poorly, discretionary spending on goods that are, or are perceived to be, “luxuries” may decrease; the concentration of a substantial portion of the Company’s sales in three, relatively brief selling seasons means that the Company’s performance is more susceptible to disruptions; if the Company does not achieve targeted sales growth its operating results and earnings will be adversely impacted; most of the Company’s sales are of products that include diamonds, precious metals and other commodities, and fluctuations in the availability and pricing of commodities could impact the Company’s ability to obtain and produce products at favorable prices; the Company’s sales are dependent upon mall traffic; the Company operates in a highly competitive industry; the financing market remains difficult, and if we are unable to meet the financial commitments in our current financing arrangements it will be difficult to replace or restructure these arrangements; and changes in regulatory requirements may increase the cost or adversely affect the Company’s operations and its ability to provide consumer credit and write credit insurance. For other factors, see the Company's filings with the Securities and Exchange Commission, including its Annual Report on Form 10K for the fiscal year ended July 31, 2013, and subsequent reports on Forms 10-Q and 8-K. The Company disclaims any obligation to update or revise publicly or otherwise any forward-looking statements to reflect subsequent events, new information or future circumstances, except as required by law. 2
Solid Holiday Performance Despite Challenging Retail Environment • Comparable store sales (1) – Comparable store sales up 2.0% at constant exchange rates – Zales branded stores up 4.4%...follows a 3.1% rise in same period last year – Peoples branded stores up 2.0% at constant exchange rates…follows a 1.5% rise in same period last year • Significant margin improvement expected for Q2 fiscal year 2014 – Gross margin up approximately 200 basis points – Operating margin up approximately 100 basis points 3 (1) The Holiday Season includes the combined months of November and December. Comparable Store Sales exclude revenue recognized from warranties. The sales results of new stores are included beginning with the thirteenth full month of operations, and the sales results of closed stores are excluded from the calculation. Comparable store sales include associated ecommerce businesses.3
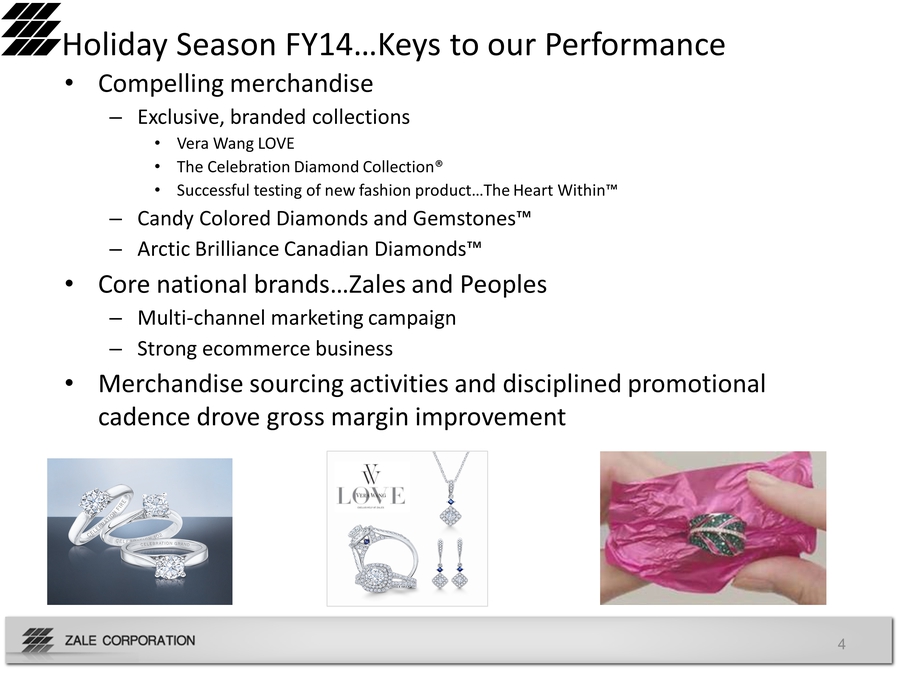
Holiday Season FY14…Keys to our Performance • Compelling merchandise – Exclusive, branded collections • Vera Wang LOVE • The Celebration Diamond Collection® • Successful testing of new fashion product…The Heart Within™ – Candy Colored Diamonds and Gemstones™ – Arctic Brilliance Canadian Diamonds™ • Core national brands…Zales and Peoples – Multi-channel marketing campaign – Strong ecommerce business • Merchandise sourcing activities and disciplined promotional cadence drove gross margin improvement 4
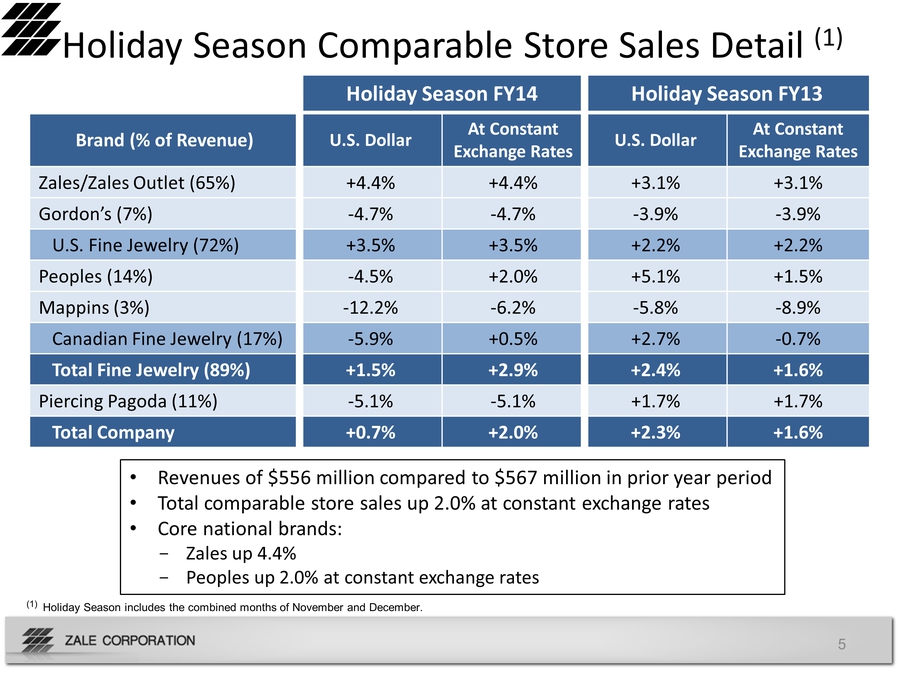
5 Holiday Season Comparable Store Sales Detail (1) Holiday Season FY14 Holiday Season FY13 Brand (% of Revenue) U.S. Dollar At Constant Exchange Rates U.S. Dollar At Constant Exchange Rates Zales/Zales Outlet (65%) +4.4% +4.4% +3.1% +3.1% Gordon’s (7%) -4.7% -4.7% -3.9% -3.9% U.S. Fine Jewelry (72%) +3.5% +3.5% +2.2% +2.2% Peoples (14%) -4.5% +2.0% +5.1% +1.5% Mappins (3%) -12.2% -6.2% -5.8% -8.9% Canadian Fine Jewelry (17%) -5.9% +0.5% +2.7% -0.7% Total Fine Jewelry (89%) +1.5% +2.9% +2.4% +1.6% Piercing Pagoda (11%) -5.1% -5.1% +1.7% +1.7% Total Company +0.7% +2.0% +2.3% +1.6% • Revenues of $556 million compared to $567 million in prior year period • Total comparable store sales up 2.0% at constant exchange rates • Core national brands: - Zales up 4.4% - Peoples up 2.0% at constant exchange rates (1) Holiday Season includes the combined months of November and December.
Q2 Fiscal Year 2014 Expectations • Gross margin of approximately 52.6 percent, up 200 basis points from prior year quarter – Flow through benefits from sourcing initiatives – Disciplined promotional cadence – Favorable commodity price environment • Operating margin of approximately 8.6 percent, up 100 basis points from prior year quarter – Increased marketing / investment spend 6
Fiscal Year 2014 Expectations • Continued revenue growth – Positive comps driven by Zales and Peoples and by increased penetration of exclusive, branded products – Partially offset by net store closures (approximately 280 basis points) Majority of closures in our regional brands, Gordon’s and Mappins, and in Pagoda Total net closures now expected to be 70 to 75 retail locations • Operating margin expansion of 50+ basis points – Net benefits from sourcing efficiencies and commodity costs – Partially offset by higher investments in SG&A • Tax expense of about $2 to $3 million • Interest expense approximately flat with FY13 • Diluted share count expected to be approximately 45 million at current stock price • Capital expenditures of $40 to $45 million – New store openings and remodels in core brands– IT infrastructure investments…point-of-sale systems and store modernization 7
ZALE CORPORATION Appendix 8
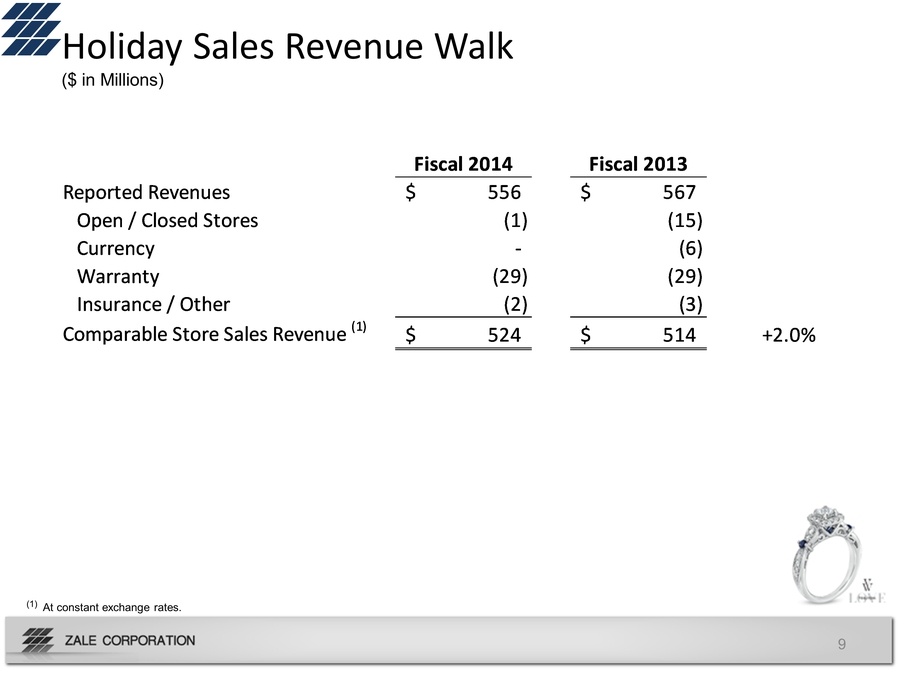
9 Holiday Sales Revenue Walk ($ in Millions) Fiscal 2014 Fiscal 2013 Reported Revenues $ 556 $ 567 Open / Closed Stores ( 1) (15) Currency - (6) Warranty (29) (29) Insurance / Other ( 2) ( 3) Comparable Store Sales Revenue (1) $ 524 $ 514 +2.0% (1) At constant exchange rates.
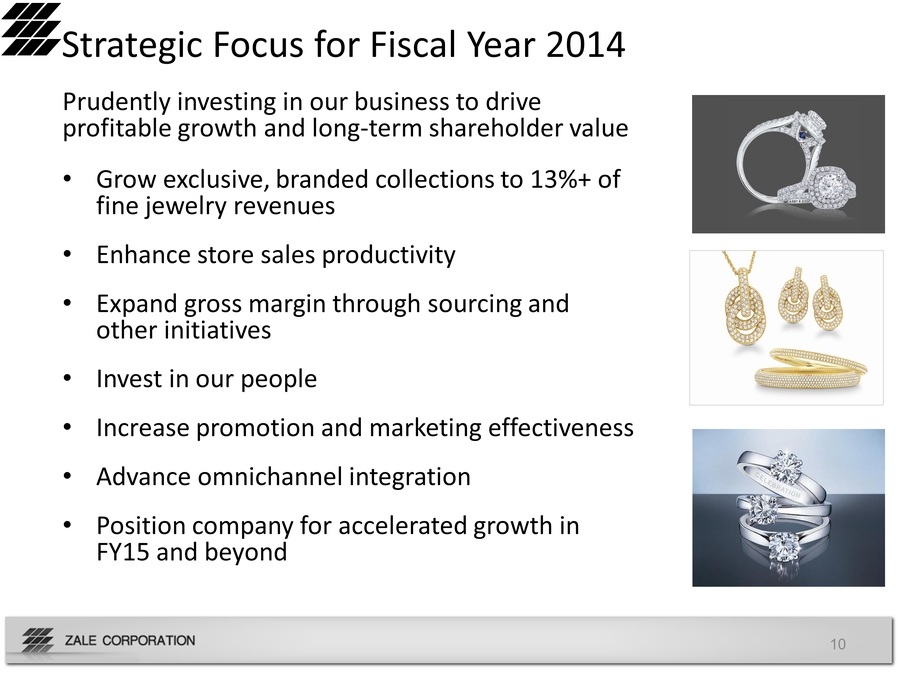
Strategic Focus for Fiscal Year 2014 Prudently investing in our business to drive profitable growth and long-term shareholder value • Grow exclusive, branded collections to 13%+ of fine jewelry revenues • Enhance store sales productivity • Expand gross margin through sourcing and other initiatives • Invest in our people • Increase promotion and marketing effectiveness • Advance omnichannel integration • Position company for accelerated growth in FY15 and beyond 10
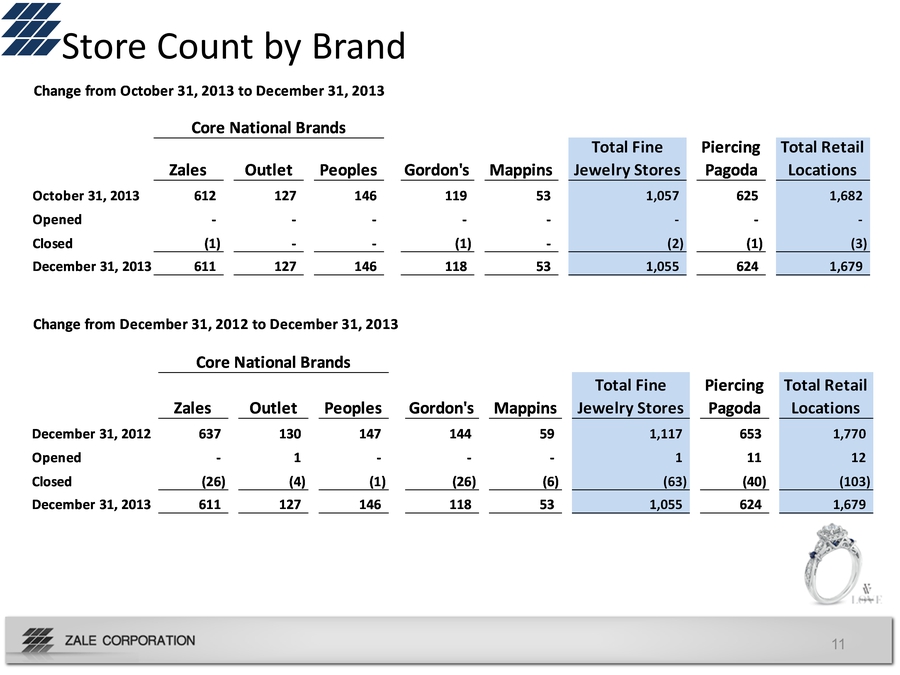
11 Store Count by Brand Change from December 31, 2012 to December 31, 2013 Zales Outlet Peoples Gordon's Mappins Total Fine Jewelry Stores Piercing Pagoda Total Retail Locations December 31, 2012 6 37 1 30 1 47 144 59 1,117 653 1,770 Opened - 1 - - - 1 11 12 Closed (26) (4) (1) (26) (6) (63) (40) (103) December 31, 2013 6 11 1 27 1 46 118 53 1,055 624 1,679 Core National Brands Change from October 31, 2013 to December 31, 2013 Zales Outlet Peoples Gordon's Mappins Total Fine Jewelry Stores Piercing Pagoda Total Retail Locations October 31, 2013 6 12 127 146 119 53 1,057 625 1,682 Opened - Closed (1) - - (1) - (2) (1) (3) December 31, 2013 6 11 127 146 118 53 1,055 624 1,679 Core National Brands