Attached files
| file | filename |
|---|---|
| EX-23.3 - EX-23.3 - STONEGATE MORTGAGE CORP | d594685dex233.htm |
| EX-23.2 - EX-23.2 - STONEGATE MORTGAGE CORP | d594685dex232.htm |
Table of Contents
As filed with the Securities and Exchange Commission on January 10, 2014
Registration No. 333-192715
UNITED STATES
SECURITIES AND EXCHANGE COMMISSION
Washington, D.C. 20549
Amendment No. 2
to
FORM S-1
REGISTRATION STATEMENT
Under
The Securities Act of 1933
Stonegate Mortgage Corporation
(Exact name of Registrant as specified in its charter)
| Ohio | 6162 | 34-1194858 | ||
| (State or Other Jurisdiction of Incorporation or Organization) |
(Primary Standard Industrial Classification Code Number) |
(IRS Employer Identification Number) |
9190 Priority Way West Drive, Suite 300
Indianapolis, IN 46240
Phone: (317) 663-5100
(Address, including zip code, and telephone number, including area code, of Registrant’s principal executive offices)
Barbara A. Cutillo, CPA
Chief Administrative Officer
9190 Priority Way West Drive, Suite 300
Indianapolis, IN 46240
Phone: (317) 663-5100
(Name, address, including zip code, and telephone number, including area code, of agent for service)
Please send copies of all communications to:
| Robert W. Downes Sullivan & Cromwell LLP 125 Broad Street New York, NY 10004 (212) 558-4000 (212) 558-3588 (Facsimile) |
Curt W. Hidde, Esq. Barnes & Thornburg LLP 11 South Meridian Street Indianapolis, IN 46204-3535 (317) 231-7707 (317) 231-7433 (Facsimile) |
Approximate date of commencement of proposed sale to the public: From time to time after the effective date of this registration statement.
If any of the securities being registered on this Form are to be offered on a delayed or continuous basis pursuant to Rule 415 under the Securities Act, check the following box. x
If this Form is filed to register additional securities for an offering pursuant to Rule 462(b) under the Securities Act, check the following box and list the Securities Act registration statement number of the earlier effective registration statement for the same offering. ¨
If this Form is a post-effective amendment filed pursuant to Rule 462(c) under the Securities Act, check the following box and list the Securities Act registration statement number of the earlier effective registration statement for the same offering. ¨
If this Form is a post-effective amendment filed pursuant to Rule 462(d) under the Securities Act, check the following box and list the Securities Act registration statement number of the earlier effective registration statement for the same offering. ¨
Indicate by check mark whether the registrant is a large accelerated filer, an accelerated filer, a non-accelerated filer, or a smaller reporting company. See the definitions of “large accelerated filer,” “accelerated filer” and “smaller reporting company” in Rule 12b-2 of the Exchange Act. (Check one):
| Large accelerated filer | ¨ | Accelerated filer | ¨ | |||
| Non-accelerated filer | x (Do not check if a smaller reporting company) | Smaller reporting company | ¨ | |||
The Registrant hereby amends this Registration Statement on such date or dates as may be necessary to delay its effective date until the Registrant shall file a further amendment which specifically states that this Registration Statement shall thereafter become effective in accordance with Section 8(a) of the Securities Act of 1933 or until this Registration Statement shall become effective on such date as the Securities and Exchange Commission, acting pursuant to said Section 8(a), may determine.
Table of Contents
The information in this prospectus is not complete and may be changed. Neither we nor the selling shareholders may sell these securities until the registration statement filed with the Securities and Exchange Commission is effective. This prospectus is not an offer to sell these securities and neither we nor the selling shareholders are soliciting an offer to buy these securities in any state where the offer or sale is not permitted.
Subject to Completion
Preliminary Prospectus dated January 10, 2014
PROSPECTUS
(Subject to completion)
6,388,889 Shares

Stonegate Mortgage Corporation
Common Stock
This prospectus relates solely to the resale of up to an aggregate of 6,388,889 shares of our common stock by the selling shareholders identified in this prospectus (which term as used in this prospectus includes pledgees, donees, transferees or other successors-in-interest). We are registering the offer and sale of the shares, which were acquired by the selling shareholders in our private offering in May 2013.
The selling shareholders may offer the shares from time to time as they may determine through public transactions or through other means described in the section entitled “Plan of Distribution” at prevailing market prices, at prices different than prevailing market prices or at privately negotiated prices. The prices at which the selling shareholders may sell the shares may be determined by the prevailing market price for the shares at the time of sale, may be different than such prevailing market prices or may be determined through negotiated transactions with third parties.
We will not receive any of the proceeds from the sale of these shares by the selling shareholders. We have agreed to pay all expenses relating to registering the shares. The selling shareholders will pay any brokerage commissions and/or similar charges incurred for the sale of these shares.
Because all of the shares offered under this prospectus are being offered by the selling shareholders, we cannot currently determine the price or prices at which our shares may be sold under this prospectus.
Our common stock is listed on the NYSE under the symbol “SGM”. On January 8, 2014, the last reported sale price of our common stock was $16.93.
We are an “emerging growth company” as defined in the Jumpstart Our Business Startups Act of 2012, and therefore have elected to comply with certain reduced public company reporting requirements.
Investing in our common stock involves risks that are described in the “Risk Factors” section beginning on page 19 of this prospectus.
Neither the Securities and Exchange Commission nor any state securities commission has approved or disapproved of these securities or determined if this prospectus is truthful or complete. Any representation to the contrary is a criminal offense.
The date of this prospectus is January , 2014.
Table of Contents
| Page | ||||
| 1 | ||||
| 17 | ||||
| 18 | ||||
| 19 | ||||
| 45 | ||||
| 48 | ||||
| 49 | ||||
| 50 | ||||
| MANAGEMENT’S DISCUSSION AND ANALYSIS OF FINANCIAL CONDITION AND RESULTS OF OPERATIONS |
51 | |||
| 102 | ||||
| 107 | ||||
| 114 | ||||
| 134 | ||||
| 141 | ||||
| 158 | ||||
| 163 | ||||
| 165 | ||||
| 171 | ||||
| CERTAIN PROVISIONS OF OHIO LAW AND STONEGATE’S ARTICLES AND REGULATIONS |
173 | |||
| MATERIAL UNITED STATES TAX CONSEQUENCES TO NON-U.S. HOLDERS OF COMMON STOCK |
182 | |||
| 186 | ||||
| 188 | ||||
| 190 | ||||
| 192 | ||||
| 193 | ||||
| CHANGE IN THE COMPANY’S INDEPENDENT REGISTERED ACCOUNTING FIRM |
194 | |||
| 195 | ||||
| F-1 | ||||
-i-
Table of Contents
Unless the context requires otherwise, references in this prospectus to “Stonegate,” the “Company,” “we,” “us” and “our” refer to Stonegate Mortgage Corporation and its consolidated subsidiaries.
In this prospectus, we refer to Long Ridge Equity Partners, LLC as “Long Ridge Equity Partners” and Stonegate Investors Holdings LLC, our largest shareholder, as “Stonegate Investors Holdings.”
You should rely only on the information contained in this prospectus or contained in any free writing prospectus filed with the Securities and Exchange Commission. Neither we nor the selling shareholders have authorized anyone to provide you with additional information or information different from that contained in this prospectus or in any free writing prospectus filed with the Securities and Exchange Commission. The information contained in this prospectus is accurate only as of the date of this prospectus, regardless of the time of delivery of this prospectus, or of any sale of our common stock.
For investors outside the United States: Neither we nor any of the selling shareholders have done anything that would permit this offering or possession or distribution of this prospectus in any jurisdiction where action for that purpose is required, other than in the United States. You are required to inform yourselves about and to observe any restrictions relating to this offering and the distribution of this prospectus outside of the United States.
Market data used in this prospectus has been obtained from independent industry sources and publications as well as from research reports prepared for other purposes. We have not independently verified the data obtained from these sources, and we cannot assure you of the accuracy or completeness of the data. Forward-looking information obtained from these sources is subject to the same qualifications and additional uncertainties regarding the other forward-looking statements in this prospectus.
-ii-
Table of Contents
This summary highlights information contained elsewhere in this prospectus and does not contain all of the information that you should consider in making your investment decision. Before investing in our common stock, you should read the entire prospectus carefully, including the sections entitled “Risk Factors” and “Management’s Discussion and Analysis of Financial Condition and Results of Operations” and our consolidated financial statements and the related notes. Unless the context otherwise requires, the information in this prospectus reflects our stock dividend of 12.861519 additional shares of our common stock for each share of our common stock that was outstanding on May 14, 2013.
Our Company
We are a leading, non-bank, integrated mortgage company focused on efficiently and effectively originating, acquiring, selling, financing and servicing U.S. residential mortgage loans. We are also one of the fastest growing non-bank mortgage originators, having grown origination volume by 209% during the nine months ended September 30, 2013 as compared to the nine months ended September 30, 2012. Our origination volume increased 12%, to $2.3 billion, during the three months ended September 30, 2013 from $2.1 billion in originations in the three months ended June 30, 2013 and grew 123% from origination volume of $1.1 billion in the three months ended September 30, 2012. Our loan originations are primarily sourced through our network of retail branches and through our relationships with approximately 1,000 third party originators (“TPOs”) as of September 30, 2013. For the nine months ended September 30, 2013, we originated $6.3 billion in loans ($2.3 billion of which were originated in the three months ended September 30, 2013) and, as of September 30, 2013, we serviced a portfolio with an unpaid principal balance of $9.7 billion, an increase of 28% from the June 30, 2013 ending unpaid principal balance of $7.6 billion, and an increase of 229% over the unpaid principal balance at September 30, 2012 of $2.9 billion.
We attribute our growth to our vertically integrated and scalable mortgage banking platform, which we believe enables us to efficiently and effectively originate, acquire, sell, finance and service residential mortgage loans, and to our on-going geographic and product expansion. Since January 1, 2012, we have expanded our business into 18 additional states and Washington, D.C., added approximately 960 correspondent and wholesale customers, opened or acquired 19 retail branch offices and as a result increased our origination volume substantially. We also recently launched additional mortgage products, including our mortgage financing business, through a wholly-owned operating subsidiary, NattyMac, LLC (“NattyMac”), which will complement our growth. We focus on originating mortgage loans associated with the purchase of residential real estate, representing 53% of our originations for the twelve months ended September 30, 2013, as opposed to the refinancing of existing mortgage loans.
Since June 2013, the U.S. residential mortgage industry has experienced an increase in interest rates. Industry-wide mortgage loan originations have declined as the recent increase in interest rates has made the refinancing of mortgage loans less attractive for borrowers. Increasing interest rates can have a direct impact on the operating results of companies in the mortgage industry, including on our operating results. Our revenues decreased 27%, to $32.3 million, in the three months ended September 30, 2012 from $44.3 million in the three months ended June 30, 2013. We believe our third quarter results reflect solid business execution during a period of rising interest rates and underscore the strength of our differentiated, vertically integrated and scalable mortgage banking platform. Our three lines of business—mortgage originations, mortgage servicing and mortgage financing—complement each other and create a natural hedge against interest rate volatility and business cyclicality, an important factor in our performance.
We were founded in 2005 by members of our executive team who held various senior level executive positions at large mortgage companies and financial institutions. The loans we originate, finance and service conform to the requirements of Government-Sponsored Enterprises (“GSEs”), such as the Federal National
-1-
Table of Contents
Mortgage Association (“Fannie Mae”) and the Federal Home Loan Mortgage Corporation (“Freddie Mac”), as well as government agencies, such as the Government National Mortgage Association (“Ginnie Mae”), the Federal Housing Administration (“FHA”), the Department of Veterans Affairs (“VA”), and private investors. We utilize proprietary technology to automate many of our core processes, which allows us to perform a high level of risk-based due diligence on each loan. We have also automated various aspects of quality control and regulatory compliance risk processes, which allows us to ensure adherence to credit, compliance and collateral standards of the GSEs and other investors. We believe that our expertise and the strength of our mortgage platform is best demonstrated by our exceptional track record as a mortgage originator and servicer, coupled with our ability to scale operations without compromising the quality of originated and serviced loans. As a result of our strong operating, technology and underwriting procedures that we apply consistently to each loan, we have not incurred any material losses related to repurchase or indemnification demands from the GSEs or other investors in our loans. We believe our lack of legacy issues and our focus on purchase versus refinance mortgages has positioned us as one of the leading non-bank integrated mortgage origination and servicing providers capable of taking advantage of growth opportunities in the mortgage sector.
Recent Events
Acquisition of Crossline Capital, Inc. On December 20, 2013, we acquired Crossline Capital, Inc., or Crossline, a California-based mortgage lender that originates and services residential mortgages. The acquisition of Crossline allows us to increase our retail origination volume through “tuck-in” acquisition. Crossline is licensed to originate mortgages in 20 states including Arizona, California, Colorado, Connecticut, Florida, Georgia, Idaho, Maryland, Massachusetts, New Hampshire, New Mexico, North Carolina, Ohio, Oregon, Pennsylvania, Rhode Island, Texas, Utah, Virginia and Washington, and is an approved FNMA Seller Servicer. In addition, Crossline operates two national mortgage origination call centers in Lake Forest, California and Scottsdale, Arizona and also operates retail mortgage origination branches in seven other locations in Southern California. The purchase price for Crossline, which, along with working capital for the business, is being funded out of our existing cash resources and line of credit facilities with our warehouse lenders, was approximately $9.4 million.
Acquisition of Wholesale Channel and Retail Assets from Nationstar Mortgage Holdings, Inc. On November 29, 2013, we acquire the wholesale lending channel and certain distributed retail assets of Nationstar Mortgage Holdings Inc., or Nationstar. The acquisition of Nationstar’s wholesale lending channel and retail assets complement our existing wholesale and retail channels and accelerates our geographic retail channel expansion. In the acquisition, we agreed to purchase the assets and offer employment to certain employees associated with these businesses. The purchase price for the assets acquired from Nationstar was approximately $0.5 million, which, along with working capital for the business, is being funded out of our existing cash resources and line of credit facilities with our warehouse lenders.
Initial Public Offering. On October 16, 2013, we sold our common stock in our initial public offering (the “IPO”). We realized net proceeds of approximately $123.9 million from the IPO, after deducting underwriting discounts and commissions and estimated offering expenses payable by us. We intend to use the net proceeds from the IPO to make investments relating to our business and for general corporate purposes.
Market Overview
The U.S. residential mortgage industry is the largest segment of the consumer finance industry with over $10.0 trillion of outstanding debt at December 31, 2012 and originations of $1.8 trillion, including $1.2 trillion of refinancing volume, for the year ending December 31, 2012. Of the 2012 total volume, over 87% of originations conformed to the requirements of the GSEs or government agencies, compared to approximately 38% and 36% in 2005 and 2006, respectively. We expect that with the proposed GSE reform, lower qualifying loan limits and higher GSE guarantee fees, origination volumes conforming to the requirements of the GSEs or government agencies
-2-
Table of Contents
(collectively referred to as “Agency mortgage loans”) will gradually decline while non-Agency mortgage loans will increase and comprise a larger portion of the mortgage loan market. The non-Agency mortgage loan market has also been stressed due to the limited ability of mortgage originators to securitize mortgage loans or sell loans to investors. According to Inside Mortgage Finance, non-Agency mortgage-backed securities (“MBS”) issuance, which accounted for 56% of all MBS in 2006, declined to less than 1% in 2012, though volumes are expected to increase with higher quality originations and increasing confidence in a housing recovery.
Participants in the mortgage industry consist of large depository institutions and non-bank originators that sell directly to the GSEs as well as other originators, referred to as TPOs, that originate loans from retail customers and sell them to a depository institution or non-bank originator (referred to as an “Aggregator”), such as ourselves. Loans are sourced through a variety of channels including retail branches, the internet and call centers, as well as acquired from TPOs such as banks, mortgage bankers and brokers. The mortgage industry is extremely fragmented and is principally comprised of a large number of regional participants. Of the over 15,000 mortgage companies that are currently licensed to originate mortgage loans in the U.S., 81% have a presence in only one state and 75% have five or fewer mortgage loan officers. These mortgage originators either sell directly to the GSEs or to Aggregators, though there is significant concentration amongst the loans sold to the GSEs. Of the $710 billion of loans sold to the GSEs during the six months ended June 30, 2013, as reported to Inside Mortgage Finance, the top 25 sellers accounted for 70%, or $495 billion, of loan originations with the remaining approximately 2,000 sellers accounting for the remaining 30% or $215 billion of loan originations.
The financial crisis led many of the largest depository institutions to reduce their participation in the mortgage market, including discontinuing the acquisition of mortgages from TPOs, and the industry remains in a period of significant transformation. Additionally, GSEs and other regulators have imposed substantial compliance requirements, increased capital requirements and proposed enhanced fees based on volume for smaller originators, thus potentially limiting participants in the sector and driving consolidation across the sector. We expect that these changes will drive more and more originators to become TPOs and sell originations to Aggregators such as ourselves, rather than the current practice of selling directly to the GSEs. During the six months ended June 30, 2013, over 1,700 sellers sold $50 million or less in loans to the GSEs, representing $21 billion or 3% of total volume. Further, we also believe that evolving market conditions, including the higher requirements to be able to sell directly to the GSEs, will also drive consolidation amongst industry participants with smaller originators lacking scale being acquired by larger participants in the sector. We believe that the fragmented mortgage industry, increasing regulation and stricter policies provide an attractive opportunity to an Aggregator such as ourselves.
As a result of regulatory and market driven changes instituted in the mortgage market, including higher capital requirements for commercial banks on mortgage servicing rights (“MSR”) and increased quality control and compliance standards for mortgage underwriting, we believe that mortgage origination activity is gradually shifting from banks to non-banks. We believe that this trend is expected to continue at an accelerated rate in the future. Additionally, because the residential mortgage industry is characterized by high barriers to entry, including the necessity for approvals required to sell loans to, and service loans for, the GSEs or government organizations, state licensing requirements, and operating and technology platform requirements, we believe that we are well positioned to lead the rapidly evolving mortgage loan origination and servicing sector.
Our Business
We are an integrated mortgage company that derives revenue from three principal sources: mortgage origination, mortgage financing and mortgage servicing. Our mortgage origination business generates income primarily through origination fees and gains upon the sale of mortgage loans sourced through our correspondent, wholesale and retail channels. We also provide financing to our correspondent customers and others while they are accumulating loans prior to selling them to Aggregators, including ourselves, through our mortgage financing business and we earn interest and fee income for these services. We also have the ability to retain the MSRs on the loans we sell and to create a recurring servicing income stream in our mortgage servicing business. We
-3-
Table of Contents
believe our three business lines are complementary and provide us with the ability to effectively and efficiently source, finance, sell and service mortgage loans.
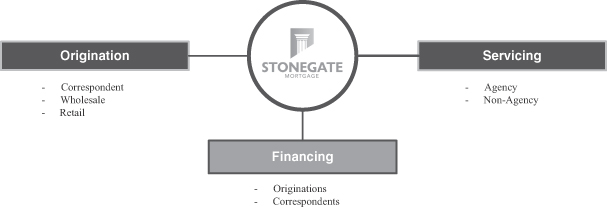
Mortgage Originations
Our mortgage origination business primarily originates and sells residential mortgage loans, which conform to the underwriting guidelines of the GSEs and government agencies. We also originate and sell jumbo loans, i.e., loans that conform to the underwriting guidelines of the GSEs, except that they exceed the maximum loan size allowed for single unit properties. We expect that as the non-Agency market continues to recover and GSE reform is approved and implemented, a larger proportion of the industry volume will be comprised of non-Agency mortgage loans. We believe we are well positioned to benefit from this shift in the market given our business model and management expertise in originating and securitizing non-Agency mortgage loans.
We are currently licensed in 39 states and Washington, D.C., including six states (California, Montana, Oregon, Rhode Island, Virginia and Washington) where we have become licensed since June 30, 2013. We intend to become licensed in all 48 of the contiguous United States in the first half of 2014. The nine states in which we are not licensed, including six states where we have a pending license application, represented approximately 15% of the overall residential mortgage origination market in 2012 and the five states where we have become licensed since June 30, 2013, represented approximately 30% of the overall residential mortgage origination market in 2012. As we become licensed in these additional states and as we increase our origination activity in the states where we have only recently become licensed, we believe our origination volume will increase substantially. Economic and housing and mortgage market conditions can vary significantly from one geographic region to another; therefore, the geographic distribution of our mortgage originations can have a direct impact on the overall performance of our servicing portfolio. As of September 30, 2013, approximately 14%, 10% and 9% of the aggregate outstanding loan balances in our servicing portfolio were concentrated in Texas, Indiana and Ohio, respectively. Although we anticipate that our origination and servicing portfolios will become less geographically concentrated over time as we expand our operations into the additional nine states where we are not currently licensed and the states where we have only recently become licensed, the geographic distribution of the mortgage loans we originate and service in the near term will likely be similar to that of our current servicing portfolio. To the extent the states where we have a higher concentration of loans experience weaker economic conditions, greater rates of decline in single family residential real estate values or reduced demand within the residential mortgage sector relative to the United States generally, the risks inherent in our business would be magnified as compared to our competitors that have a broader and less concentrated geographic footprint.
Additionally, since inception, we have focused on originating mortgage loans associated with purchase transactions as opposed to refinancings to a greater degree than many industry participants. During 2012,
-4-
Table of Contents
approximately 45% of our loan originations were purchase loans and approximately 55% were refinance transactions, compared to 29% and 71%, respectively, for the industry as a whole. We believe purchase transactions are more sustainable than refinance transactions, and typically have slower prepayment speeds in early years, making the MSRs more valuable and less volatile. Additionally, we believe that the mortgage market will increasingly shift to purchase mortgages as the housing market continues to recover, first time home buyers re-enter the housing market and interest rates increase. Further, as the non-Agency market continues to recover, we believe that our platform and management expertise in originating and securitizing these mortgages will position us well to benefit from this transformation.
We originate residential mortgage loans through three channels: correspondent, wholesale and retail. Although the majority of our originations are currently through our correspondent channel, our presence in the wholesale and retail channels makes our platform both diversified and scalable. While the channels are diverse, we constantly focus on quality control and maintaining high underwriting standards. We perform diligence on and underwrite loans through our proprietary technology platform, Online Loan Information Exchange (“OLIE”), an integrated, automated risk-based due diligence engine that automates the review process by applying business rules specific to the loan and the seller. We analyze credit, collateral and compliance risk on every loan on a pre-funding or a pre-purchase basis in order to ensure that each loan meets our investors’ standards and any applicable regulatory rules. We also capture loan data and documents associated with the loan from application through sale/securitization and servicing, giving us the ability to run additional business rules that provide indication of loan performance. We believe that the ability to offer greater transparency and data to institutional investors that purchase our loans or securities backed by our loans will provide us with a substantial advantage over our competitors in our sales executions as the mortgage market continues to evolve and we begin to securitize our own non-Agency mortgage loans.
Our three mortgage loan originations channels are discussed in more detail below.
Correspondent Channel
We acquire newly originated loans conforming to the underwriting standards of the GSEs or government agencies as well as non-Agency mortgage loans conforming to the standards of our investors from our network of correspondents across 39 states plus Washington, D.C. We identify our correspondent customers through a team of relationship managers who are responsible for signing-up customers and ensuring that we receive an adequate share of their origination volume. In addition to competitive pricing, we offer our correspondents access to a state-of-the-art technology platform, funding through our financing platform (NattyMac), including access to innovative financing programs such as early purchase facilities, as well as a timely and transparent process of acquiring their loans. In return, our correspondents provide us with high quality products that meet our underwriting standards. We track the performance of our correspondents on a score-card and terminate relationships where quality and other requirements are not met. We believe that our programs offer correspondents an attractive value proposition, including greater access to capital and liquidity, as they seek to maintain and grow their businesses. As a testament to our relationship management and product offering, our correspondent origination volume has increased from $1.2 billion in the nine months ended September 30, 2012 to $4.6 billion in the nine months ended September 30, 2013, or by 283%, including a 19% increase from $1,488.6 million in the second quarter of 2013 to $1,766.3 in the third quarter of 2013.
Our growth has been driven by adding new correspondents as well as deepening relationships with existing correspondents. Our correspondent channel represented 73% of our mortgage originations for the nine months ended September 30, 2013. We conduct financial, operational and risk reviews of each correspondent prior to initially approving them as a customer and on an annual basis to ensure compliance with our guidelines and those of the various regulators who govern our business. In addition we conduct background and financial reviews of the principals and their mortgage loan officers, and in some cases require personal guarantees. We believe that as we receive licenses in additional states and continue to increase our coverage of correspondents, we will continue to increase our market share.
-5-
Table of Contents
Wholesale Channel
Through our wholesale channel, we originate loans through a network of approximately 460 non-exclusive relationships with various approved mortgage companies and mortgage brokers. Mortgage brokers identify applicants, help them complete a loan application, gather required information and documents, and act as our liaison with the borrower during the lending process. We review and underwrite an application submitted by a broker, accept or reject the application, determine the range of interest rates and other loan terms, and fund the loan upon acceptance by the borrower and satisfaction of all conditions to the loan in much the same manner as our retail channel. By relying on brokers to market our products and assist the borrower throughout the loan application process, we can increase loan volume through our wholesale channel with proportionately lower increases in overhead costs compared with the costs of increasing loan volume through loan originations in our retail channels.
We provide a variety of Agency, government insured and non-Agency mortgage loan products to our brokers to allow them to better service their borrowers. Before approving a mortgage broker for business, we focus on several attributes including origination volume, quality of originations and tangible net worth. We also conduct financial and background checks on the principals and their mortgage loan officers through various third-party sources and in some cases we require personal guarantees. Once we begin acquiring loans from our mortgage brokers, we track the performance of the loans on an on-going basis and terminate business relationships if the loans consistently do not perform or if there is evidence of misrepresentation. During the twelve months ended September 30, 2013, we did not terminate any significant relationships due to our continued focus on underwriting loans and ensuring compliance with policies.
Retail Channel
Our retail channel primarily operates through 40 retail offices across 14 states. In this channel, company representatives originate loans through their relationships with local real estate agents, builders, telemarketing and other local contacts. This channel accounted for 15% of our 2012 originations. We expect to continue to grow our retail channel by adding new branches for at least the next 24 months. In addition, we expect that with the continued transformation of the mortgage sector there will be opportunities to acquire small retail mortgage operators as several independent mortgage originators will lack the scale to profitably originate and sell mortgages. We believe that we could provide a solution to such operators by acquiring and integrating them into our branch network. We are currently actively evaluating opportunities to acquire several of these retail originators and believe that the continued development and growth of our retail channel is central to our business strategy.
Financing
We acquired our financing platform, known as NattyMac, in August 2012, and fully integrated the platform into our mortgage banking operations in December of 2012. Founded in 1994, NattyMac earlier operated as an independent mortgage warehouse lender focused on financing prime mortgage collateral, such as Agency-eligible, government insured and government guaranteed loans that were committed for purchase by GSEs. Following our acquisition, in June 2013, we consolidated our NattyMac financing platform into a wholly-owned subsidiary which will focus on providing warehouse financing to us, our correspondent customers and others. We expect that NattyMac will be able to leverage our proprietary technology (OLIE) and our existing due diligence and underwriting processes to efficiently underwrite the warehouse lines of credit it provides for our correspondents who are its customers and others. We intend for this to create an additional source of funding for our correspondents to originate mortgage loans that meet our underwriting requirements and are eligible for us to purchase.
Our financing platform features a centralized custodian and disbursement agent allowing us to enter into participation arrangements with financial institutions, such as regional banks for an interest in our newly
-6-
Table of Contents
originated loans during the time these loans would otherwise be funded by a warehouse line or traditional repurchase facility. Additionally, by offering regional banks an opportunity to invest in a liquid high-quality asset, we are able to earn fee and net interest income. We believe that regional banks continue to have significant appetite for such investment opportunities and we believe our financing platform allows us to compete with bank-owned mortgage lenders who have access to cheaper deposit funding. We believe this is a competitive advantage over other non-bank mortgage originators and servicers who are reliant on other forms of wholesale financing to fund their operations.
Mortgage Servicing
Our mortgage servicing business is organized to maintain a high quality servicing portfolio and keep delinquency rates far below the industry average. We perform loan administration, collection and default activities, including the collection and remittance of loan payments, responding to customer inquiries, accounting for principal and interest, holding custodial (impound) funds for the payment of property taxes and insurance premiums, counseling delinquent mortgagors, modifying loans and supervising foreclosures and our property dispositions.
Our servicing model is also very focused on “recapture,” which involves actively working with existing borrowers to refinance their mortgage loans. When a loan is paid off or refinanced with a different lender, we lose the servicing fees on the loan, so our ability to recapture loans successfully is important to the longevity of our servicing cash flows. Because the refinanced loans typically have lower interest rates or lower monthly payments, and, in general, subsequently refinance more slowly and default less frequently, these refinancings also typically improve the overall quality of our servicing portfolio. For the twelve months ended September 30, 2013, we recaptured 33% of our payoffs (based on the dollar amount of refinanced mortgage loans).
Our servicing business produces strong recurring, contractual fee-based revenue with minimal credit risk. Servicing fees are primarily based on the aggregate unpaid principal balance (“UPB”) of the loans serviced and the payment structure varies by loan source and type. These include differences in rate of servicing fees as a percentage of UPB and in the structure of advances. We believe our origination business gives us a distinct advantage in building a high-quality portfolio of MSRs over those who rely heavily on purchasing MSRs from others to build their portfolios as originated portfolios generally perform better given the extensive diligence and underwriting procedures that we apply to each loan.
We service loans using a model designed to improve loan performance and reduce loan defaults and foreclosures. Our servicing portfolio consists of MSRs we retain from loans that we originate and MSRs we acquire from third party originators, including in transactions facilitated by GSEs, such as Fannie Mae and Freddie Mac. The loans we service are typically securitized by us, i.e., the loans have been pooled together with multiple other loans and interests have been sold to third party investors that are secured by loans in the securitization pool. As of September 30, 2013, our servicing portfolio contained $9.7 billion of residential first mortgages, with a weighted average coupon of 3.71% and a weighted average age of nine months. At September 30, 2013, the 90+ day delinquency rate in our servicing portfolio was 0.34%, the weighted average FICO score of our servicing portfolio was 740, and the adjusted constant prepayment rate (“CPR”) of our servicing portfolio as of September 30, 2013 was 5.80%.
Our Strengths
Leading, Non-Bank, Integrated Mortgage Company
We are a leading, non-bank, integrated mortgage company focused on efficiently and effectively originating, acquiring, selling, financing and servicing residential mortgage loans. We originate mortgages loans through our correspondent, wholesale and retail channels which provide diversity, increase scale and reduce
-7-
Table of Contents
dependency on any particular channel. During the nine months ended September 30, 2013, the correspondent, wholesale and retail channels accounted for 73%, 19% and 8%, respectively, of our origination volume. Our origination and financing businesses enable us to offer a comprehensive product suite to our customers and build an attractive mortgage servicing portfolio.
Profitable, Sustainable Business with Significant Growth Potential
We have been profitable every year since 2008 and, for the nine months ended September 30, 2013, our net income grew by 54% over the same period last year. Net income for the three months ended September 30, 2013, which was impacted by rising interest rates, was $1.7 million, compared to $9.1 million in the three months ended June 30, 2013 and $9.5 million in the three months ended September 30, 2012. The growth in net income has been driven by a significant increase in origination volume which increased by 209% during the nine months ended September 30, 2013 over the same period last year. We were able to achieve this growth as we expanded geographically into additional states, deepened correspondent relationships and expanded product offerings. We believe that we have significant growth potential as we are currently licensed in only 39 states plus Washington, D.C., representing approximately 85% of the nation’s total origination volume in 2012. These 39 states include six states (California, Montana, Oregon, Rhode Island, Virginia and Washington) where we have become licensed since June 30, 2013 and have not yet commenced any material operations. As we launch our services nationally and expand in the remaining nine contiguous United States, which accounted for approximately $287 billion, or approximately 15%, of the nation’s origination volume in 2012 and the six states where we have become licensed since June 30, 2013, which accounted for approximately $590 billion, or approximately 30%, of the nation’s origination volume in 2012, we believe that we will be able to continue to see meaningful growth in our origination volume. We will also see meaningful growth as we expect to benefit from consolidation in the mortgage market with the potential acquisition of retail originators, such as our acquisitions of Crossline and the retail assets of Nationstar.
Additionally, we are focused on purchase money volume which accounted for 53% of our origination volume for the twelve months ended September 30, 2013 compared to the industry average of 28% for the twelve months ended September 30, 2013. We believe that as refinancing volumes potentially decline with an increase in interest rates, we will be better positioned than the rest of the industry as our origination volumes will be more sustainable. Further, we also benefit from our growing mortgage servicing business which produces recurring fee income and from our financing business which provides fee and interest income.
We have made significant strategic investments in our business as we strive for growth. These investments include the opening of 19 retail branches in six states during 2012 and first half of 2013. In addition, in June 2013 we launched our non-Agency jumbo mortgage loan program and mortgage financing business to offer our customers a full suite of products. In order to achieve our growth targets, we have made significant investments and incurred significant operating expenses, which we believe will generate attractive returns over time.
Stable, Diversified and Complementary Funding Platform
Our NattyMac platform allows us to integrate a “syndicated” financing facility into our mortgage banking platform that consists of repurchase and participation agreements with major financial institutions, as well as regional and community banks. The financing facility provides a stable, low-cost diversified source of funding for our business and allows us to offer this as a service to our correspondent and other customers. We view this as a competitive advantage over other non-bank mortgage originators and servicers and a means of competing with banks that historically use deposit funding sources to finance their businesses. The platform also provides an ancillary source of fee and net interest income as we sell participations to depository institutions seeking an interest in liquid assets.
-8-
Table of Contents
We view our NattyMac platform as being complementary to our origination business as correspondents are incentivized to sell the loans warehoused on our platform to us as it provides them with greater liquidity and minimizes the capital they require in their business. We believe our “pre-funding” due diligence process also reduces credit, compliance, collateral, interest rate and market risk by allowing us to assess the salability to potential funding sources and/or other loan investors prior to funding.
Consistent Ability to Produce High Quality Loans
We are focused on originating and servicing a portfolio of high quality residential mortgage loans. The table below contains information on the quality of our loans and delinquency rates for the dates indicated.
| As of or for the |
||||||||||||
| Nine Months |
Year Ended December 31, |
|||||||||||
| 2013 |
2012 |
2011 |
||||||||||
| Average FICO score of loans originated |
729 | 747 | 741 | |||||||||
| LTV of loans originated |
85 | % | 83 | % | 84 | % | ||||||
| Servicing portfolio weighted average FICO score |
740 | 744 | 735 | |||||||||
| Servicing portfolio 90+ day delinquency rate |
0.34 | % | 0.44 | % | 0.37 | % | ||||||
We believe that our asset performance is superior to the industry due to our technologically advanced platform, consistent and conservative underwriting processes and focus on conducting a pre-funding review of each loan to ensure it meets the standards set by the GSEs or our loan investors. These practices differ from many of our competitors that apply different underwriting standards and review policies depending on the channel from which the loan is originated from. For example, some of our competitors conduct a pre-funding analysis on a sampling basis for loans acquired in the correspondent and wholesale channels but a full review on loans originated through the retail channel. We believe that our relentless focus on quality and consistency in applying underwriting policies and procedures has enabled us to have no significant repurchase demands, thus minimizing our risk profile and differentiating us from much of our competition.
Our Complementary Origination, Servicing and Financing Businesses Create a Natural Hedge Against Interest Rate Volatility and Business Cyclicality
Our principal sources of revenue, mortgage servicing, mortgage origination and mortgage financing, contribute to our stable business profile by creating a natural hedge against changes in the interest rate environment. As interest rates rise and the likelihood of refinancing decreases, MSRs generally increase in value which helps to offset any decline in origination volumes. Additionally, as long-term interest rates increase we will earn greater fee and interest income as yields on mortgage loans will increase while the funding costs will remain proportionately lower. As interest rates decline and the likelihood of refinancing increases, origination volumes tend to increase which helps to offset the decline in the value of MSRs caused by the higher probability of loan prepayment. In addition, our origination platform helps us to recapture servicing rights on loan payoffs and thus replenish our MSRs during periods of high prepayments. For the twelve months ended September 30, 2013, our recapture rate was 33% of payoffs (based on the dollar amount of refinanced mortgage loans). We expect that our recapture rate will increase further as our retail call center operations continues to expand their focus on retention of our servicing portfolio.
Robust, Proprietary Operating Platform
We believe that the current processes and systems generally used by brokers and correspondents to originate loans are fragmented and result in inconsistent data, lack of controls, and limited transparency for
-9-
Table of Contents
market participants. In response to this weakness, we have built a proprietary diligence and underwriting decision platform, OLIE, that incorporates what we believe to be the best balance of data integrity, efficiency, ease of use, speed of decision, loan quality, consistency and control. We believe this service is valued by our brokers and correspondents and offers us a distinct advantage over our competitors.
OLIE provides a transparent view of all documents and loan level data throughout the entire life of a loan, from origination through securitization and final disposition, enabling us to measure and manage the performance of our loans, giving us the ability to proactively identify trends that may negatively impact our operational or financial performance. After we originate a loan, we also capture loan data and documents associated with the loan from application through sale/securitization and servicing, giving us the ability to run additional business rules that test the effectiveness of our system and provide indication of loan performance. We believe that our current platform and our robust diligence procedures are the central reason we have not had any significant loan losses from indemnification or repurchase demands compared to other competitors who have realized significant losses. Additionally, we are able to offer greater transparency to the institutional investors that purchase our loans which is reflected in our sales execution.
Subsequent to June 30, 2013, we implemented version 1.0 and 2.0 of our “C3” automated risk-based diligence engine, which is integrated with OLIE. C3 allows us to perform an electronic quantitative risk assessment on each loan, enabling us to target our due diligence procedures on higher risk loans and thereby gain efficiencies in performing the diligence process. Our servicing of these loans gives us the ability to analyze the effectiveness of our C3 automated risk-based diligence engine and, we believe, as an integrated platform with OLIE, has provided our institutional investors with even more robust diligence procedures targeted at the loans where they seek that additional level of due diligence.
Seasoned Management Team
Our senior management team is comprised of experienced mortgage industry executives with a track record of managing all aspects of the residential mortgage business through a variety of credit cycles and market conditions. Our founder and Chief Executive Officer, Jim Cutillo, has successfully led and managed the company through the recent transformation of the mortgage industry. Additionally, our president and other members of our senior management team have an average of 20 years of experience in the mortgage banking industry. We believe our executive management team has a clear vision and common set of core values and will be able to successfully execute our rapid growth strategy.
Our Growth Drivers
We expect to drive future growth in the following ways:
Grow Origination Volume Across Channels
We intend to grow our origination volume across our channels by expanding nationally. We are currently licensed in 39 states plus Washington, D.C., which account for approximately 85% of U.S. residential mortgage originations. We intend to become licensed in all 48 contiguous United States in the first half of 2014. As we launch our services nationally and expand in the remaining nine contiguous United States, which accounted for approximately $287 billion, or approximately 15%, of the nation’s origination volume in 2012, and the six states where we have become licensed since June 30, 2013, which accounted for approximately $590 billion, or approximately 30%, of the nation’s origination market in 2012 we believe that we will be able to continue to see meaningful growth in our origination volume. This will also enable us to substantially grow our correspondent, wholesale and retail footprint and deepen existing correspondent and wholesale relationships.
-10-
Table of Contents
Expand into Non-Agency Mortgage Loans
Our extensive expertise in prime non-Agency jumbo securitization provides us the opportunity to substantially grow our non-Agency loan origination volume. We intend to focus on increasing production of loans that meet Agency criteria in nearly all respects other than loan size. These loans are generally referred to as “jumbo” loans and are originated through our existing channels. Over the last few years, this market has been hindered by the lack of an efficient capital market in which to sell such loans. We believe, as the market normalizes and non-Agency private securitization returns, we will be one of the few non-bank originators with this capability, giving us the ability to be an Aggregator for others and establishing ourselves as a market leader. The non-Agency MBS market was 56% of the total MBS market or $1.14 trillion in 2006 compared to 0.78% or $13.2 billion in 2012. In anticipation of the non-Agency market recovering and GSE reform, we intend to create a securitization shelf in 2014 and offer investors an opportunity to invest in securities backed by these loans. We may also retain the junior subordinated notes from the securitizations and create a recurring interest income stream for ourselves.
We believe that our integrated origination and servicing platform coupled with our expertise provides us with what we believe is a significant competitive advantage. We expect this investment strategy to create an attractive risk-adjusted return for our shareholders and to position us as one of the leading non-bank integrated mortgage origination and service providers.
Grow our Servicing Business
We anticipate being able to continue to retain the MSRs associated with loans we originate at attractive multiples through our integrated mortgage banking platform, whereas many of our competitors rely on purchasing MSRs. We feel our strategy is not only a more efficient utilization of capital but has less credit, collateral and compliance risk, since all loans are carefully reviewed by us prior to purchase.
We believe we can also leverage our correspondent channel to purchase MSRs from correspondent clients on a “co-issue” basis, meaning our clients originate and securitize Agency loans and concurrently transfer the servicing rights to us. This “co-issue” strategy will allow us to acquire the MSRs on an originated MSR (“OMSR”) basis versus a purchased MSR (“PMSR”) basis, since the servicing is treated as a whole loan origination. The “co-issue” strategy provides a competitive advantage over other purchasers of MSRs via bulk acquisitions as we have an existing relationship with the originator and understand their origination capabilities and techniques which drives the credit quality and performance of these loans. MSRs purchased in this way are expected to have substantially similar attributes to our originated loans with respect to note rate, credit quality and loan type. We completed our first transaction in the fourth quarter of 2013, acquiring an MSR portfolio with a UPB of approximately $142 million for a total cash purchase price of approximately $1.5 million, and continue to grow this area of our business to augment the acquisition of servicing rights. We plan to perform the same level of pre-funding due diligence on these loans prior to purchasing the servicing rights from the seller. This strategy is similar in nature to our origination strategy of offering mandatory delivery and is another delivery type that is not dependent on our origination business, making it highly scalable and efficient from an operational and financial perspective.
Grow our Mortgage Financing Business
In the current market, many correspondents lack capital to grow their businesses and, therefore, are constrained by their balance sheets from a warehouse lending perspective. A typical warehouse lender will provide financing subject to a tangible net worth covenant and require that the correspondent contribute a percentage of the principal balance to fund the warehoused loans. Often, this creates a capital constraint for the correspondent if the “take-out” or permanent investor takes too long to review or purchase the loan. We have created an early purchase facility that allows approved correspondents to sell us loans on an accelerated basis, moving them off their balance sheets and freeing up their warehouse lines so they can fund more loans. We earn fee and net interest income on
-11-
Table of Contents
these loans, which are held on average 15 days prior to sale. This also complements our mortgage origination business as we will generally acquire these loans from the correspondents, add the MSR to our portfolio and service the loans for borrowers going forward. We launched our financing business in June 2013 by hiring two dedicated experienced account executives and we expect to make additional hires as we roll out this business nationwide.
Summary Risk Factors
Our business is subject to numerous risks and uncertainties, including those highlighted in the section titled “Risk Factors” immediately following this prospectus summary. Some of these risks are:
| • | our ability to compete successfully in the highly competitive mortgage loan servicing and mortgage loan origination industries; |
| • | experiencing financial difficulties like some originators and mortgage servicers have experienced; |
| • | adverse changes in the residential mortgage market; |
| • | our ability to obtain sufficient capital to meet our financing requirements; |
| • | our ability to grow our loan origination volume; |
| • | the geographic concentration of our servicing portfolio may result in a higher rate of delinquencies and/or defaults; |
| • | our mortgage financing business is subject to risks, including the risk of default and competitive risks; |
| • | our estimates may prove to be imprecise and result in significant changes in financial performance, including valuation; |
| • | the impact on our business of federal, state and local laws and regulations concerning loan servicing, loan origination, loan modification or the licensing of individuals and entities that engage in these activities; |
| • | substantial compliance costs arising from state licensing and operational requirements or loss of our licenses; |
| • | our ability to originate and/or acquire MSRs; |
| • | our ability to recover our significant investments in personnel and our technology platform; |
| • | the implementation of our proprietary loan due diligence, scoring and decision platform on schedule, which is still in the process of being refined and implemented; |
| • | the accuracy and completeness of information we receive about borrowers and counterparties; |
| • | a significant change in delinquencies and/or defaults for the mortgage loans we service; |
| • | our ability to recapture mortgage loans from borrowers who refinance; |
| • | changes in prevailing interest rates, such as the recent increase in rates experienced since June 2013, and any corresponding effects on origination volumes or the value of our assets; |
-12-
Table of Contents
| • | our rapid growth may be difficult to sustain and manage and may place significant demands on our administrative, operational and financial resources; |
| • | our ability to identify and complete acquisitions of retail mortgage originators and other businesses; |
| • | our ability to realize all of the anticipated benefits of our acquisitions; |
| • | the change of control rules under Section 382 of the Internal Revenue Code of 1986, as amended (the “Code”), may limit our ability to use net operating loss carryforwards to reduce future taxable income; |
| • | failure to establish and maintain effective systems of internal controls; |
| • | errors in our financial models or changes in assumptions; |
| • | our ability to adapt to and implement technological changes; |
| • | the impact of the ongoing implementation of the Dodd-Frank Wall Street Reform and Consumer Protection Act of 2010 (“Dodd-Frank Act”) on our business activities and practices, costs of operations and overall results of operations; |
| • | losses due to fraudulent and negligent acts on the part of loan applicants, brokers, other vendors, existing customers, our employees and other third parties; |
| • | the loss of the services of one or more of the members of our executive management team; and |
| • | an active trading market for our common stock may not be sustained. |
Our Ownership Structure
We are an Ohio corporation that was incorporated in 1976. Prior to March 2012, our shareholders were members of our executive management team and other investors. In March 2012, Long Ridge Equity Partners, a private investment firm focused on the financial services industry, invested in us through its affiliate. We completed a private offering in May 2013, which we refer to as our May 2013 private offering, in which we issued and sold 6,388,889 shares of our common stock to various institutional investors, accredited investors and offshore investors at an offering price of $18.00 per share, and we received approximately $115 million of proceeds, before expenses. Long Ridge Equity Partners remains our largest shareholder and has entered into various agreements with us and certain other parties which are described further in “Certain Relationships and Related Party Transactions—Arrangements with Long Ridge Equity Partners and its Affiliates.”
-13-
Table of Contents
The following chart illustrates our organizational structure, after giving effect to the IPO. We have one wholly-owned subsidiary, NattyMac, LLC, an Indiana limited liability company.
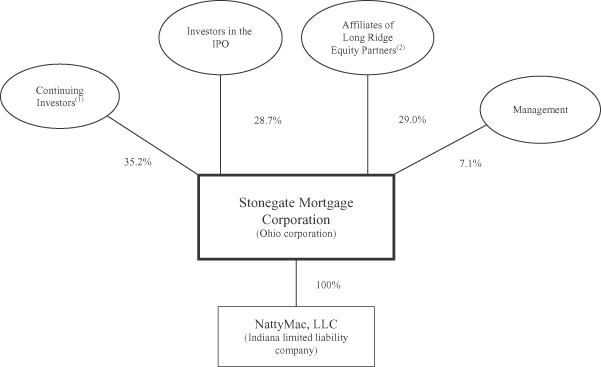
| 1 | Includes investors from our May 2013 private offering and our directors and other non-executive management shareholders (other than Stonegate Investors Holdings and its affiliates). |
| 2 | Includes the shares of common stock owned by Stonegate Investors Holdings, Long Ridge Equity Partners I, LP and Long Ridge Offshore Subsidiary Holdings, LLC, each of which is an affiliate of Long Ridge Equity Partners, LLC. Stonegate Investors Holdings and its affiliate also own warrants to purchase 242,621 shares of our common stock with an exercise price of $18.00 per share. Excludes shares issuable upon any exercise of the warrants. |
Recent Developments
Recent Industry Trends
Since June 2013, the U.S. residential mortgage industry has experienced an increase in interest rates. Industry-wide mortgage loan originations have declined as the recent increase in interest rates has made the refinancing of mortgage loans less attractive for borrowers. Increasing interest rates can have a direct impact on the operating results of companies in the mortgage industry, including on our operating results. An increase in interest rates generally could lead to the following, which may in the aggregate have an adverse effect on our results:
| • | a reduction in origination and loan lock volumes; |
| • | a shift from loan refinancing volume to purchase loan volume; |
| • | short-term contraction of the gain on sale margin of mortgage loans including negative fair market value adjustments on locked loans and loans held for sale; |
-14-
Table of Contents
| • | an increase in net interest income from financing (assuming a steeper forward yield curve); and |
| • | an increase in the value of mortgage servicing rights due to a decline in prepayment expectations. |
Emerging Growth Company Status
We are an “emerging growth company,” as defined in the Jumpstart Our Business Startups Act of 2012 (the “JOBS Act”), and we are eligible to take advantage of certain exemptions from various reporting requirements that are applicable to other public companies that are not “emerging growth companies.” These exemptions provide that, so long as a company qualifies as an “emerging growth company,” it will, among other things:
| • | be exempt from the “say on pay” provisions (requiring a non-binding shareholder vote to approve compensation of certain executive officers) and the “say on golden parachute” provisions (requiring a non-binding shareholder vote to approve golden parachute arrangements for certain executive officers in connection with mergers and certain other business combinations) of the Dodd-Frank Act, and certain disclosure requirements of the Dodd-Frank Act relating to compensation of its named executive officers; |
| • | be permitted to omit the detailed compensation discussion and analysis from proxy statements and reports filed under the Securities Exchange Act of 1934, as amended (the “Exchange Act”), and instead provide a reduced level of disclosure concerning executive compensation; and |
| • | be exempt from any rules that may be adopted by the Public Company Accounting Oversight Board (the “PCAOB”), requiring mandatory audit firm rotation or a supplement to the auditor’s report on the financial statements. |
Although we are still evaluating the JOBS Act, we may take advantage of some or all of the reduced regulatory and reporting requirements that will be available to us as long as we qualify as an “emerging growth company,” except that we have irrevocably elected not to take advantage of the extension of time to comply with new or revised financial accounting standards available under Section 102(b) of the JOBS Act.
We will, in general, qualify as an “emerging growth company” until the earliest of:
| • | the last day of our fiscal year following the fifth anniversary of the date of the IPO; |
| • | the last day of our fiscal year in which we have annual gross revenue of $1.0 billion or more; |
| • | the date on which we have, during the previous three-year period, issued more than $1.0 billion in non-convertible debt; and |
| • | the date on which we are deemed to be a “large accelerated filer,” which will occur at such time as we (1) have an aggregate worldwide market value of common equity securities held by non-affiliates of $700 million or more as of the last business day of our most recently completed second fiscal quarter, (2) have been required to file annual and quarterly reports under the Exchange Act for a period of at least 12 months and (3) have filed at least one annual report pursuant to the Exchange Act. |
-15-
Table of Contents
Registration Rights and Lock-Up Agreements
Pursuant to a Registration Rights Agreement between us and the initial purchaser/placement agent for our May 2013 private offering, which we refer to as the Registration Rights Agreement, we are required, among other things, to:
| • | file or confidentially submit with the Securities and Exchange Commission, or the SEC, a resale shelf registration statement registering all of the shares of our common stock sold in our May 2013 private offering that are not sold by selling shareholders in the IPO no later than September 12, 2013 (which is 120 days after the closing date of our May 2013 private offering); and |
| • | use our commercially reasonable efforts to cause the resale shelf registration statement to become effective under the Securities Act of 1933, as amended (the “Securities Act”), as soon as reasonably practicable after the filing, and in any event, no later than February 15, 2014, and to maintain the resale shelf registration statement continuously effective under the Securities Act for a specified period. |
We confidentially submitted with the SEC on September 9, 2013 a registration statement on Form S-1 for the resale of the shares of our common stock sold in our May 2013 private offering and when the registration statement is declared effective by the Securities and Exchange Commission, we will have satisfied our obligations under the Registration Rights Agreement.
We, and each of our officers, directors and Stonegate Investors Holdings have entered into a lock-up agreement with the lead managing underwriter, of the IPO with respect to shares of our common stock, restricting the direct or indirect sale of such securities, subject to certain exceptions, for 180 days after the date of the IPO prospectus without the prior written consent of the representatives of the underwriters in the IPO. Additionally, our other shareholders who purchased common stock in our May 2013 private offering have agreed with us, subject to certain exceptions, not to directly or indirectly sell, offer to sell, grant any option or otherwise transfer or dispose of our common stock for 60 days after the date of the IPO prospectus, which was October 9, 2013.
Our Offices
Our principal executive offices are located at 9190 Priority Way West Drive, Suite 300, Indianapolis, Indiana, 46240. Our main telephone number is (317) 663-5100. Our Internet website is www.stonegatemtg.com.
-16-
Table of Contents
The following summary describes certain terms of the offering by the selling shareholders pursuant to this prospectus and certain terms of our common stock. The “Description of Capital Stock” section of this prospectus contains a more detailed description of our common stock.
| Common stock offered by selling shareholders in this offering |
6,388,889 shares |
| Use of proceeds |
We will not receive any proceeds from the sale of our common stock by the selling shareholders pursuant to this prospectus. |
| Dividend policy |
We do not expect to pay dividends on our common stock for the foreseeable future. Instead, we anticipate that all of our earnings in the foreseeable future will be used for the operation and growth of our business. |
| Any future determination to pay dividends on our common stock will be at the discretion of our Board of Directors and will depend upon many factors, including our financial position, results of operations, liquidity, legal requirements, restrictions that may be imposed by the terms in current and future financing instruments and other factors deemed relevant by our Board of Directors. |
| Listing |
Our common stock is listed on the NYSE under the symbol “SGM”. |
| Risk factors |
Investing in our common stock involves a high degree of risk. For a discussion of factors you should consider in making an investment, see “Risk Factors” beginning on page 19. |
-17-
Table of Contents
SUMMARY HISTORICAL FINANCIAL DATA
The following tables present our summary historical financial data for the periods as of the dates indicated. The statement of operations data for the years ended December 31, 2012 and 2011 and the balance sheet data at December 31, 2012 and December 31, 2011 have been derived from our audited financial statements included elsewhere in this prospectus. Historical results are not necessarily indicative of results we expect in future periods. The statement of operations data for the nine months ended September 30, 2013 and 2012, and the balance sheet data as of September 30, 2013 have been derived from unaudited financial statements of Stonegate Mortgage Corporation included elsewhere in this prospectus. The unaudited financial statements of Stonegate Mortgage Corporation have been prepared on substantially the same basis as the audited financial statements and include all adjustments that we consider necessary for a fair presentation of our financial position and results of operations for all periods presented. Amounts presented for basic and diluted earnings per share reflect the impact of our stock dividend of 12.861519 additional shares of our common stock for each share of our common stock that was outstanding on May 14, 2013.
The data presented below should be read in conjunction with, and is qualified in its entirety by reference to, “Selected Historical Financial Data” and “Management’s Discussion and Analysis of Financial Condition and Results of Operations” and our financial statements and the notes thereto included elsewhere in this prospectus.
| Nine Months Ended September 30, |
Year Ended December 31, |
|||||||||||||||
| (in thousands, except per share data) | 2013 |
2012 |
2012 |
2011 |
||||||||||||
| (unaudited) | (unaudited) | |||||||||||||||
| Statement of Operations Data |
||||||||||||||||
| Revenues: |
||||||||||||||||
| Gains on mortgage loans held for sale |
$ | 63,791 | $ | 47,709 | $ | 73,337 | $ | 16,735 | ||||||||
| Fee income |
29,962 | 9,994 | 15,779 | 6,916 | ||||||||||||
| Changes in MSR valuation |
11,649 | — | — | — | ||||||||||||
| Other income |
11,106 | 4,330 | 6,429 | 2,371 | ||||||||||||
|
|
|
|
|
|
|
|
|
|||||||||
| Total revenues |
116,508 | 62,033 | 95,545 | 26,022 | ||||||||||||
|
|
|
|
|
|
|
|
|
|||||||||
| Expenses: |
||||||||||||||||
| Salaries, commissions and benefits |
48,604 | 21,202 | 32,737 | 13,085 | ||||||||||||
| General and administrative |
15,026 | 4,429 | 7,705 | 3,163 | ||||||||||||
| Interest expense |
10,972 | 3,734 | 6,239 | 2,728 | ||||||||||||
| Amortization of MSRs |
— | 2,584 | 3,680 | 960 | ||||||||||||
| Impairment of MSRs |
— | 5,522 | 11,698 | 2 | ||||||||||||
| Other expenses |
8,886 | 3,008 | 5,677 | 2,050 | ||||||||||||
|
|
|
|
|
|
|
|
|
|||||||||
| Total expenses |
83,488 | 40,479 | 67,736 | 21,988 | ||||||||||||
|
|
|
|
|
|
|
|
|
|||||||||
| Income before income taxes |
33,020 | 21,554 | 27,809 | 4,034 | ||||||||||||
| Income taxes |
12,487 | 8,210 | 10,724 | 1,699 | ||||||||||||
|
|
|
|
|
|
|
|
|
|||||||||
| Net income |
$ | 20,533 | $ | 13,344 | $ | 17,085 | $ | 2,335 | ||||||||
|
|
|
|
|
|
|
|
|
|||||||||
| Basic earnings per share |
$ | 1.97 | $ | 4.13 | $ | 5.31 | $ | 0.70 | ||||||||
|
|
|
|
|
|
|
|
|
|||||||||
| Diluted earnings per share |
$ | 1.42 | $ | 1.95 | $ | 2.26 | $ | 0.59 | ||||||||
|
|
|
|
|
|
|
|
|
|||||||||
| September 30, |
December 31, |
|||||||||||
| (in thousands) | 2013 |
2012 |
2011 |
|||||||||
| (unaudited) | ||||||||||||
| Balance Sheet Data |
||||||||||||
| Cash and cash equivalents |
24,564 | $ | 15,056 | $ | 403 | |||||||
| Mortgage loans held for sale, at fair value |
518,858 | 218,624 | 61,729 | |||||||||
| MSRs, at fair value |
132,907 | — | — | |||||||||
| MSRs, at lower of amortized cost or fair value |
— | 42,202 | 17,679 | |||||||||
| Total assets |
748,929 | 309,606 | 89,108 | |||||||||
| Secured borrowings |
272,610 | 102,675 | 57,894 | |||||||||
| Warehouse lines of credit |
194,709 | 100,301 | — | |||||||||
| Total liabilities |
564,991 | 254,357 | 78,692 | |||||||||
| Total stockholders’ equity |
183,938 | 55,249 | 10,415 | |||||||||
-18-
Table of Contents
Investing in our common stock involves a high degree of risk. You should carefully consider the following risk factors, as well as other information contained in this prospectus, before deciding to invest in our common stock. The occurrence of any of the following risks could materially and adversely affect our business, prospects, financial condition, results of operations and cash flow, in which case, the trading price of our common stock could decline and you could lose all or part of your investment. Some statements in this prospectus, including statements in the following risk factors, constitute forward-looking statements. Please refer to the section entitled “Cautionary Note Concerning Forward-Looking Statements.”
Risks Related to Our Business and Industry
The industry in which we operate is highly competitive and our inability to compete successfully could adversely affect our business, financial condition and results of operations.
We operate in a highly competitive industry that could become even more competitive as a result of economic, technological and regulatory changes. Our mortgage loan origination business faces competition in mortgage loan offerings, rates, fees and levels of customer service. Competition to originate mortgage loans comes primarily from large commercial banks and savings institutions, but we also compete with a growing number of national and regional mortgage companies. Financial institutions generally have significantly greater resources and access to capital than we do, which gives them the benefit of a lower cost of funds and the ability to originate more mortgage loans. Our servicing business faces competition in areas such as fees and service. Competition to service mortgage loans comes from large commercial banks, large savings institutions and large independent servicers. Additionally, our servicing competitors may decide to modify their servicing model to compete more directly with our servicing model, or our servicing model may generate lower margins as a result of competition or as overall economic conditions improve.
In addition, technological advances and heightened e-commerce activities have increased consumers’ accessibility to products and services. This has intensified competition among banks and non-banks in offering mortgage loans and servicing them. We may be unable to compete successfully in our origination and servicing businesses, and this could materially and adversely affect our business, financial condition and results of operations.
We may experience financial difficulties like some originators and mortgage servicers have experienced, which could adversely affect our business, financial condition and results of operations.
Since 2006, a number of originators and servicers of residential mortgage loans experienced serious financial difficulties and, in some cases, ceased operations. These difficulties have resulted, in part, from declining markets for mortgage loans as well as from claims for repurchases of mortgage loans previously sold under provisions requiring repurchase in the event of early payment defaults or breaches of representations and warranties regarding loan quality, compliance and certain other loan characteristics. Overall, origination volumes are down significantly in the current economic environment. According to the Mortgage Bankers Association, total U.S. residential mortgage origination volume decreased from $2.8 trillion in 2006 to $1.75 trillion in 2012. Higher delinquencies and defaults may contribute to these difficulties by reducing the value of mortgage loans and requiring originators to sell their portfolios at greater discounts to par. In addition, servicing an increasingly delinquent mortgage loan portfolio increases servicing costs without a corresponding increase in servicing compensation. The value of many residual interests retained by sellers of mortgage loans in the securitization market has also been declining. Any of the foregoing adverse developments could materially and adversely affect our business, financial condition and results of operations.
Adverse changes in the residential mortgage market would adversely affect our business, financial condition and results of operations.
Since 2007, adverse economic conditions, including high unemployment, stagnant or declining incomes and higher taxes, have impacted the residential mortgage market, resulting in unprecedented delinquency, default
-19-
Table of Contents
and foreclosure rates, all of which have led to increased losses on all types of residential mortgage loans due to sharp declines in residential real estate values. Falling home prices have resulted in higher LTVs, lower recoveries in foreclosure and an increase in losses above those that would have been realized had property values remained the same or continued to increase. As LTVs increase, borrowers sometimes have insufficient equity in their homes, which prohibits them from refinancing their existing loans. This may also provide borrowers an incentive to default on their mortgage loans even if they have the ability to make principal and interest payments, which we refer to as strategic defaults. Increased mortgage defaults negatively impact our servicing business because they increase the costs to service the underlying loans and may ultimately reduce the number of mortgages we service.
Adverse economic conditions also adversely impact our originations business. Declining home prices and increasing LTVs may preclude many potential borrowers, including borrowers whose existing loans we service, from refinancing their existing loans.
Adverse changes in the residential mortgage market may reduce the number of mortgages we service or new mortgages we originate, reduce the profitability of mortgages currently serviced by us, adversely affect our ability to sell mortgage loans originated by us or increase delinquency rates. Any of the foregoing adverse developments could materially and adversely affect our business, financial condition and results of operations.
We may be unable to obtain sufficient capital to meet the financing requirements of our business.
Our financing strategy consists primarily of using repurchase facilities and participation agreements with major financial institutions and regional and community banks. As we continue to grow, we will likely need to borrow additional money. Our ability to renew or replace our existing facilities as they expire and borrow the additional funds we will need to accomplish our growth strategy is affected by a variety of factors including:
| • | the level of liquidity in the mortgage related credit markets; |
| • | prevailing interest rates; |
| • | the strength of the lenders that provide us financing; |
| • | limitations on borrowings on repurchase facilities and participation agreements imposed by the amount of eligible collateral pledged; |
| • | limitations imposed on us under financing agreements that contain restrictive covenants and borrowing conditions that may limit our ability to raise or borrow additional funds; and |
| • | accounting changes that may impact calculations of covenants in our financing agreements. |
In the ordinary course of our business, we periodically borrow money or sell newly-originated loans to fund our mortgage loan origination and servicing operations. See “Management’s Discussion and Analysis of Financial Condition and Results of Operations—Liquidity and Capital Resources.” Our ability to fund current operations and make advances required under our mortgage loan servicing agreements depends on our ability to secure these types of financings on acceptable terms and to renew or replace existing financings as they expire. Such financings may not be available on acceptable terms or at all.
An event of default, a negative ratings action by a rating agency, an adverse action by a regulatory authority or a general deterioration in the economy that constricts the availability of credit—similar to the market conditions that we have experienced during the last five years—may increase our cost of funds and make it difficult for us to renew existing facilities or obtain new financing facilities. We intend to seek opportunities to acquire mortgage loan servicing portfolios and/or businesses that engage in mortgage loan servicing and/or mortgage loan originations. Our liquidity and capital resources may be diminished by any such transactions. Additionally, we believe that a significant acquisition may require us to raise additional capital to facilitate such a transaction, which may not be available on acceptable terms or at all.
-20-
Table of Contents
In June 2011, the Basel Committee on Banking Supervision of the Bank of International Settlements announced the final framework for strengthening capital requirements, known as Basel III, which, if implemented by U.S. bank regulatory agencies, will increase the cost of funding on financial institutions that we rely on for financing. Such Basel III requirements on financial institutions could reduce our sources of funding and increase the costs of originating and servicing mortgage loans. If we are unable to obtain sufficient capital on acceptable terms for any of the foregoing reasons, this could materially and adversely affect our business, financial condition and results of operations.
We may not be able to continue to grow our loan originations volume, which could adversely affect our business, financial condition and results of operations.
Our mortgage loan origination business consists of providing purchase money loans to homebuyers and refinancing existing loans. The origination of purchase money mortgage loans is greatly influenced by traditional business clients in the home buying process such as realtors and builders. As a result, our ability to secure relationships with such traditional business clients will influence our ability to grow our purchase money mortgage loan volume and, thus, our loan origination business.
Our loan origination business operates largely through third party mortgage brokers who do business with us on a best efforts basis, i.e., they are not obligated to do business with us. Further, our competitors also have relationships with these brokers and actively compete with us in our efforts to expand our broker networks. Accordingly, we may not be successful in maintaining our existing relationships or expanding our broker networks. If we are unable to continue to grow our loan origination business, this could adversely affect our business, financial condition and results of operations.
We are licensed in 39 states and Washington, D.C. and have a license pending in five states. We intend to become licensed in all of the contiguous United States in the first half of 2014. The nine states in which we are currently not licensed, including the states where we have a license pending, represented approximately 15% of the overall single-family residential mortgage origination market in 2012. As we become licensed in these additional states, we believe this geographic expansion will be a major driver of our growth. However, there are no assurances that we will obtain licenses in all 48 contiguous United States or that our licensing efforts will continue on the pace that we intend. If we are unable to obtain the licenses we plan to obtain, we will not be able to grow our business in accordance with our current plans, and our business, financial condition and results of operations would be materially and adversely affected.
The geographic concentration of our servicing portfolio may result in a higher rate of delinquencies and/or defaults, which could adversely affect our business, financial condition and results of operations.
The following is a summary of the loans we serviced as of September 30, 2013 by geographic concentration as measured by the total unpaid principal balance as of September 30, 2013:
| (in millions) | $UPB |
% of Total |
||||||
| Texas |
$ | 1,351.1 | 14 | % | ||||
| Indiana |
960.8 | 10 | % | |||||
| Ohio |
829.1 | 9 | % | |||||
| Illinois |
617.0 | 6 | % | |||||
| Missouri |
616.7 | 6 | % | |||||
| Georgia |
606.5 | 6 | % | |||||
| New Jersey |
581.8 | 6 | % | |||||
| Pennsylvania |
538.6 | 6 | % | |||||
| Kansas |
471.9 | 5 | % | |||||
| All other states |
3,109.1 | 32 | % | |||||
|
|
|
|
|
|||||
| Total |
$ | 9,682.6 | 100 | % | ||||
|
|
|
|
|
|||||
-21-
Table of Contents
To the extent the states where we have a higher concentration of loans experience weaker economic conditions, greater rates of decline in single family residential real estate values or reduced demand within the residential mortgage sector relative to the United States generally, the concentration of loans we service in those regions may increase the effect of the risks described in this “Risk Factors” section. Additionally, if states in which we have greater concentrations of mortgage loans were to change their licensing or other regulatory requirements to make our business cost-prohibitive, we may be required to stop doing business in those states or may be subject to higher costs of doing business in those states, which could adversely affect our business, financial condition and results of operations.
The nine states in which we are not currently licensed, including the states where we have a license pending, represented approximately 15% of the overall single-family residential mortgage origination market in 2012. Once our origination volume increases in the additional states in which are becoming licensed, we expect our geographic concentration to change and our origination and servicing of loans could be impacted by geographic concentrations in different states. To the extent those states experience weaker economic conditions or greater rates of decline in single family residential real estate values, the concentration of loans we originate and service in those regions may increase the effect of the risks to our business.
We use financial models and estimates in determining the fair value of certain assets, such as MSRs, commitments to originate loans, mortgage loans held for sale and related hedging instruments. If our estimates or assumptions prove to be incorrect, we may be required to record impairment charges, which would adversely affect our earnings.
We use internal financial models that utilize, wherever possible, market participant data to value certain of our assets, including our MSRs when they are initially acquired and newly originated loans held for sale for purposes of financial reporting. These models are complex and use asset-specific collateral data and market inputs for interest and discount rates. In addition, the modeling requirements of MSRs are complex because of the high number of variables that drive cash flows associated with MSRs. Even if the general accuracy of our valuation models is validated, valuations are highly dependent upon the reasonableness of our assumptions and the predictability of the relationships that drive the results of the models. In determining the value for MSRs, we make certain assumptions, many of which are beyond our control, including, among other things:
| • | the rates of prepayment and repayment; |
| • | projected rates of delinquencies, defaults and liquidations; |
| • | future interest rates; |
| • | our cost to service the loans; |
| • | ancillary fee income; and |
| • | amounts of future servicing advances. |
Although we have processes and procedures in place governing internal valuation models and their testing and calibration, such assumptions are complex as we must make judgments about the effect of matters that are inherently uncertain. Different assumptions could result in significant changes in financial performance, including valuation, which in turn could affect earnings or result in significant changes in the dollar amount of assets reported on the balance sheet. Additionally, if loan loss levels are higher than anticipated due to an increase in delinquencies, prepayment speeds are higher than we predict, our recapture rate on loans that are refinanced is lower than we predict, or financial market illiquidity continues beyond our estimate, the value of certain of our assets may decrease and we may be required to record impairment charges, which could adversely affect our earnings. In addition, there can be no assurance that, even if our models are correct, these assets could be sold for our carrying value should we choose or be forced to sell them in the open market.
-22-
Table of Contents
Federal, state and local laws and regulations could materially adversely affect our business, financial condition and results of operations.
Due to the highly regulated nature of the residential mortgage industry, we are required to comply with a wide array of federal, state and local laws and regulations that regulate, among other things, the manner in which we conduct our origination and servicing businesses, the fees we may charge, and the services we provide. These regulations directly impact our business and require constant compliance, monitoring and internal and external audits. A material failure to comply with any of these laws or regulations could result in the loss or suspension of our licenses to conduct our businesses or subject us to lawsuits or governmental actions, which could materially and adversely affect our business, financial condition and results of operations.
In addition, there continue to be changes in legislation and licensing requirements that are intended to improve the consumer mortgage loan experience, which require technological changes and additional implementation costs for mortgage loan originators and servicers. We expect legislative and licensing changes will continue in the foreseeable future, which will likely increase our operating expenses. Furthermore, there continue to be changes in state law that are adverse to mortgage servicers that increase costs and operational complexity of our business and impose significant penalties for violation. Any of these changes in the law could materially and adversely affect our business, financial condition and results of operations.
Federal, state and local governments have recently proposed or enacted numerous laws, regulations and rules related to mortgage loans generally and foreclosure actions in particular. These laws, regulations and rules may result in significant delays in the foreclosure process, reduced payments by borrowers, modification of the original terms of mortgage loans, permanent forgiveness of debt and increased servicing advances. In some cases, local governments have ordered moratoriums on foreclosure activity, which prevent a servicer or trustee, as applicable, from exercising any remedies they might have in respect of liquidating a severely delinquent mortgage loan. Several courts also have taken unprecedented steps to slow the foreclosure process or prevent foreclosure altogether.
Certain proposed federal legislation would permit borrowers in bankruptcy to restructure mortgage loans secured by primary residences. Bankruptcy courts could, if this legislation is enacted, reduce the principal balance of a mortgage loan that is secured by a lien on mortgaged property, reduce the mortgage interest rate, extend the term to maturity or otherwise modify the terms of a bankrupt borrower’s mortgage loan.
We originate and sell FHA and VA loans. The origination of FHA and VA loans represented approximately 29% and 37% of the dollar value of loans originated in 2012 and 2011, respectively. The housing finance reform contemplated by the Obama administration may impact the lending qualification and limits of these programs, which may adversely impact our volume of FHA and VA loan originations in the future and may increase the price of our mortgage insurance premiums or otherwise adversely affect our business, financial conditions and results of operations.
We may be subject to liability for potential violations of predatory lending laws, which could adversely impact our results of operations, financial condition and business.
Various U.S. federal, state and local laws have been enacted that are designed to discourage predatory lending practices. The U.S. federal Home Ownership and Equity Protection Act of 1994, or HOEPA, prohibits inclusion of certain provisions in residential mortgage loans that have mortgage rates or origination costs in excess of prescribed levels and requires that borrowers be given certain disclosures prior to origination. Some states have enacted, or may enact, similar laws or regulations, which in some cases impose restrictions and requirements greater than those in HOEPA. In addition, under the anti-predatory lending laws of some states, the origination of certain residential mortgage loans, including loans that are not classified as “high-cost” loans under applicable law, must satisfy a net tangible benefits test with respect to the related borrower. This test may be highly subjective and open to interpretation. As a result, a court may determine that a residential mortgage loan, for example, does not meet the test even if the related originator reasonably believed that the test was satisfied. If
-23-
Table of Contents
any of our production loans are found to have been originated in violation of predatory or abusive lending laws, we could incur losses, which could adversely impact our results of operations, financial condition and business.
We are highly dependent upon programs administered by GSEs such as Fannie Mae and Freddie Mac to generate revenues through mortgage loan sales to institutional investors. Any changes in existing U.S. government-sponsored mortgage programs could materially and adversely affect our business, financial position and results of operations.
In February 2011, the Obama Administration delivered a report to Congress regarding a proposal to reform the housing finance markets in the United States. The report, among other things, outlined various potential proposals to wind down the GSEs and reduce or eliminate over time the role of the GSEs in guaranteeing mortgages and providing funding for mortgage loans, as well as proposals to implement reforms relating to borrowers, lenders and investors in the mortgage market, including reducing the maximum size of loans that the GSEs can guarantee, phasing in a minimum down payment requirement for borrowers, improving underwriting standards and increasing accountability and transparency in the securitization process.
Our ability to generate revenues through mortgage loan sales to institutional investors depends, to a significant degree, on programs administered by the GSEs, such as Fannie Mae and Freddie Mac, a government agency, Ginnie Mae, and others that facilitate the issuance of MBS in the secondary market. These GSEs play a critical role in the residential mortgage industry, and we have significant business relationships with many of them. Most of the conforming loans we originate qualify under existing standards for inclusion in guaranteed mortgage securities backed by GSEs. We also derive other material financial benefits from these relationships, including the assumption of credit risk by these GSEs on loans included in such mortgage securities in exchange for our payment of guarantee fees and the ability to avoid certain loan inventory finance costs through streamlined loan funding and sale procedures.
Any discontinuation of, or significant reduction in, the operation of these GSEs or any significant adverse change in the level of activity in the secondary mortgage market or the underwriting criteria of these GSEs could materially and adversely affect our business, financial position and results of operations.
The conservatorship of Fannie Mae and Freddie Mac and related efforts, along with any changes in laws and regulations affecting the relationship between Fannie Mae and Freddie Mac and the U.S. federal government, could adversely affect our business and prospects.
Due to increased market concerns about the ability of Fannie Mae and Freddie Mac to withstand future credit losses associated with securities held in their investment portfolios, in July 2008, the U.S. government passed the Housing and Economic Recovery Act of 2008. In September 2008, the Federal Housing Finance Agency (“FHFA”) placed Fannie Mae and Freddie Mac into conservatorship and, together with the U.S. Treasury, established a program designed to boost investor confidence in their respective debt and MBS. As the conservator of Fannie Mae and Freddie Mac, the FHFA controls and directs the operations of Fannie Mae and Freddie Mac and may (i) take over the assets and operations of Fannie Mae and Freddie Mac with all the powers of the shareholders, the directors and the officers of Fannie Mae and Freddie Mac and conduct all business of Fannie Mae and Freddie Mac; (ii) collect all obligations and money due to Fannie Mae and Freddie Mac; (iii) perform all functions of Fannie Mae and Freddie Mac that are consistent with the conservator’s appointment; (iv) preserve and conserve the assets and property of Fannie Mae and Freddie Mac; and (v) contract for assistance in fulfilling any function, activity, action or duty of the conservator.
Although the U.S. Treasury has committed capital to Fannie Mae and Freddie Mac, these actions may not be adequate for their needs. If these actions are inadequate, Fannie Mae and Freddie Mac could continue to suffer losses and could fail to honor their guarantees and other obligations. The future roles of Fannie Mae and Freddie Mac could be significantly reduced and the nature of their guarantees could be considerably limited relative to historical measurements. Any changes to the nature of the guarantees provided by Fannie Mae and
-24-
Table of Contents
Freddie Mac could redefine what constitute Agency and government conforming MBS and could have broad adverse market implications. Such market implications could materially and adversely affect our business, financial condition and results of operations.
Unlike banks and similar financial institutions with which we compete, we are subject to state licensing and operational requirements that result in substantial compliance costs.
Because we are not a depository institution, we do not benefit from a federal exemption to state mortgage banking, loan servicing or debt collection licensing and regulatory requirements. We must comply with state licensing requirements and varying compliance requirements in every state in which we do business. Future regulatory changes may increase our costs through stricter licensing laws, disclosure laws or increased fees, or may impose conditions to licensing that we are unable to meet. In addition, we are subject to periodic examinations by state regulators, which can result in refunds to borrowers of certain fees earned by us, and we may be required to pay substantial penalties imposed by state regulators due to compliance errors. Future state legislation and changes in existing regulation may significantly increase our compliance costs or reduce the amount of ancillary fees, including late fees, that we may charge to borrowers. This could make our business cost-prohibitive in the affected state or states and could materially and adversely affect our business, financial condition and results of operations.
Our business would be adversely affected if we lose our licenses or if we are unable to obtain licenses in new markets.
Our operations are subject to regulation, supervision and licensing under various federal, state and local statutes, ordinances and regulations. In most states in which we operate, a regulatory agency regulates and enforces laws relating to mortgage loan servicing companies and mortgage loan origination companies such as us. These rules and regulations generally provide for licensing as a mortgage servicing company, mortgage origination company or third party debt default specialist, requirements as to the form and content of contracts and other documentation, licensing of our employees and employee hiring background checks, licensing of independent contractors with which we contract, restrictions on collection practices, disclosure and record-keeping requirements and enforcement of borrowers’ rights. In certain states, we are subject to periodic examination by state regulatory authorities. Some states in which we operate require special licensing or provide extensive regulation of our business.
We believe that we maintain all material licenses and permits required for our current operations and are in substantial compliance with all applicable federal, state and local laws. But we may not be able to maintain all requisite licenses and permits, and the failure to satisfy those and other regulatory requirements could result in a default under our servicing agreements and have a material adverse effect on our business, financial condition or results of operations. The states that currently do not provide extensive regulation of our business may later choose to do so, and if such states so act, we may not be able to obtain or maintain all requisite licenses and permits. The failure to satisfy those and other regulatory requirements could result in a default under our servicing agreements and have a material and adverse effect on our business, financial condition or results of operations. Furthermore, the adoption of additional, or the revision of existing, rules and regulations could materially and adversely affect our business, financial condition and results of operations.
Challenges to the MERS® System could materially and adversely affect our business, results of operations and financial condition.
MERSCORP, Inc. is a privately held company that maintains an electronic registry, referred to as the MERS System, that tracks servicing rights and ownership of loans in the United States. Mortgage Electronic Registration Systems, Inc., or MERS, a wholly-owned subsidiary of MERSCORP, Inc., can serve as a nominee for the owner of a mortgage loan and in that role initiate foreclosures or become the mortgagee of record for the loan in local land records. We may choose to use MERS as a nominee. The MERS System is widely used by participants in the mortgage finance industry.
-25-
Table of Contents
Several legal challenges in the courts and by governmental authorities have been made disputing MERS’s legal standing to initiate foreclosures or act as nominee for lenders in mortgages and deeds of trust recorded in local land records. These challenges have focused public attention on MERS and on how loans are recorded in local land records. Although most legal decisions have accepted MERS as mortgagee, these challenges could result in delays and additional costs in commencing, prosecuting and completing foreclosure proceedings, conducting foreclosure sales of mortgaged properties and submitting proofs of claim in borrower bankruptcy cases.
We may not be able to maintain or grow our business if we cannot originate and/or acquire MSRs.
Our servicing portfolio is subject to “run off,” meaning that mortgage loans we service may be prepaid prior to maturity, refinanced with a mortgage not serviced by us or liquidated through foreclosure, deed-in-lieu of foreclosure or other liquidation process or repaid through standard amortization of principal. As a result, our ability to maintain and grow the size of our servicing portfolio depends on our ability to originate additional mortgages, to recapture the servicing rights on loans that are refinanced, and to acquire the right to service additional residential mortgage loans. We may not be able to originate a sufficient volume of mortgage loans, recapture a sufficient volume of refinanced loans or acquire MSRs on additional pools of mortgage loans with sufficient volume or on terms that are favorable to us or at all, which could materially and adversely affect our business, financial condition and results of operations.
We may not be able to recapture loans from borrowers who refinance.
One of the focuses of our origination efforts is “recapture,” which involves actively working with existing borrowers to refinance their mortgage loans with us instead of another originator of mortgage loans. Borrowers who refinance have no obligation to refinance their loans with us and may choose to refinance with a different originator. If borrowers refinance with a different originator, this decreases the profitability of our primary servicing portfolio because the original loan will be repaid, and we will not have an opportunity to earn further servicing fees after the original loan is repaid. Moreover, recapture allows us to generate additional loan servicing more cost-effectively than MSRs acquired on the open market. If we are not successful in recapturing our existing loans that are refinanced, our servicing portfolio will become increasingly subject to run-off, and we may need to purchase additional MSRs on the open market to add to our servicing portfolio, which would increase ours costs and risks and decrease the profitability of our servicing business.
We may not be able to recover our significant investments in personnel and our technology platform if we cannot originate and acquire MSRs on favorable terms, which could adversely affect our business, financial condition and results of operations.
We have made, and expect to continue to make, significant investments in personnel and our technology platform to allow us to service additional loans. In particular, we invest significant resources in recruiting, training, technology and systems. We may not realize the expected benefits of these investments to the extent we are unable to increase the pool of residential mortgage loans we service, we are delayed in obtaining the right to service such loans or we do not appropriately value the MSRs that we do purchase. Any of the foregoing could adversely affect our business, financial condition and results of operations.
Our proprietary loan due diligence, scoring and decision platform is still in the process of being refined and implemented, and we may not be successful in completing its implementation as quickly as we intend, which could adversely affect our business and operations.
We believe our proprietary, automated loan due diligence, scoring and decision platform (known as OLIE) is a significant competitive advantage, but the technology in this platform is new and is still being refined and implemented. If we are unsuccessful in implementing this platform as quickly as we intend, or if we experience technical difficulties with the platform, our business and operations could be adversely affected.
-26-
Table of Contents
We depend on the accuracy and completeness of information about borrowers and counterparties and any misrepresented information could adversely affect our business, financial condition and results of operations.
In deciding whether to extend credit or to enter into other transactions with borrowers and counterparties, we may rely on information furnished to us by or on behalf of borrowers and counterparties, including financial statements and other financial information. We also may rely on representations of borrowers and counterparties as to the accuracy and completeness of that information and, with respect to financial statements, on reports of independent auditors. We additionally rely on representations from public officials concerning the licensing and good standing of the third party mortgage brokers through which we do business. While we have a practice of independently verifying the borrower information that we use in deciding whether to extend credit or to agree to a loan modification, including employment, assets, income and credit score, if any of this information is intentionally or negligently misrepresented and such misrepresentation is not detected prior to loan funding, the value of the loan may be significantly lower than expected. Whether a misrepresentation is made by the loan applicant, the mortgage broker, another third party or one of our employees, we generally bear the risk of loss associated with the misrepresentation. We have controls and processes designed to help us identify misrepresented information in our loan originations operations; however, we may not have detected or may not detect all misrepresented information in our loan originations or from our business clients. Any such misrepresented information could materially and adversely affect our business, financial condition and results of operations.
In addition, when we originate loans, we rely heavily upon information supplied by third parties, including the information contained in the loan application, appraisal, title information and employment and income documentation. If any of this information is intentionally or negligently misrepresented and such misrepresentation is not detected prior to the loan funding, the value of the loan may be significantly lower than expected, and we may be subject to repurchase or indemnification obligations under loan sales agreements. Whether a misrepresentation is made by the loan applicant, the broker, another third party or one of our own employees, we generally bear the risk of loss associated with the misrepresentation. A loan subject to a material misrepresentation is not typically saleable or is subject to repurchase if it is sold prior to detection of the misrepresentation. Even though we may have rights against persons and entities who made or knew about the misrepresentation, such persons and entities are often difficult to locate and it is often difficult to collect any monetary losses that we have suffered as a result of their actions.
A significant change in delinquencies and/or defaults for the loans we service could materially and adversely affect our business, financial condition and results of operations.
Delinquency rates are expected to have a significant impact on our revenues, our expenses and on the valuation of our MSRs as follows:
| • | Revenue. An increase in delinquencies will result in lower revenue for loans we service. We only collect servicing fees from GSEs for performing loans. Additionally, while increased delinquencies generate higher ancillary fees, including late fees, these fees are not likely to be recoverable in the event that the related loan is liquidated. In addition, an increase in delinquencies, by reducing the amount of cash held in collection and other accounts, reduces the interest income we earn on those accounts. |
| • | Expenses. An increase in delinquencies will result in a higher cost to service due to the increased time and effort required to collect payments from delinquent borrowers. It may also result in an increase in interest expense as a result of an increase in our advancing obligations. |
| • | Liquidity. An increase in delinquencies could also negatively impact our liquidity because of an increase in borrowings to make servicer advances. |
| • | Valuation of MSRs. We base the value of our MSRs on, among other things, our projections of the cash flows from the related mortgage loans. Our expectation of delinquencies is a significant |
-27-
Table of Contents
| assumption underlying those cash flow projections. If delinquencies were significantly greater than expected, the estimated fair value of our MSRs could be diminished. If the estimated fair value of MSRs is reduced, we could suffer a loss, which has a negative impact on our financial results. |
An increase in delinquency rates could therefore materially and adversely affect our business, financial condition and results of operations.
Our earnings may decrease because of changes in prevailing interest rates, such as the recent increases in interest rates experienced since June 2013, and any corresponding effects on origination volumes or the value of our assets.
Our profitability is directly affected by changes in prevailing interest rates, such as the recent increases in interest rates experienced since June 2013. Net income for the three months ended September 30, 2013, which was impacted by rising interest rates, was $1.7 million, compared to $9.1 million in the three months ended June 30, 2013 and $9.5 million in the three months ended September 30, 2012. The growth in our volume of originations and our servicing portfolio both slowed in the three months ended September 30, 2013. Our origination volume increased 12%, to $2.3 billion, during the three months ended September 30, 2013 from $2.1 billion in originations in the three months ended June 30, 2013 compared to growth of 123% from origination volume of $1.1 billion in the three months ended September 30, 2012. Our servicing portfolio increased 28% in the third quarter of 2013 from the June 30, 2013 ending unpaid principal balance of $7.6 billion to an unpaid principal balance of $9.7 billion at September 30, 2013, which was an increase of 229% over the unpaid principal balance at September 30, 2012 of $2.9 billion. The following are the material risks we face related to changes in prevailing interest rates:
| • | because many of the mortgage loans we service have adjustable rates, an increase in prevailing interest rates could generate an increase in delinquency, default and foreclosure rates resulting in an increase in both operating expenses and interest expense and could cause a reduction in the value of our assets; |
| • | an increase in prevailing interest rates could adversely affect our loan originations volume because refinancing an existing loan would be less attractive for homeowners and qualifying for a loan may be more difficult for prospective borrowers; |
| • | an increase in prevailing interest rates would increase the cost of financing servicing advances and loan originations; |
| • | a decrease in prevailing interest rates may require us to record a decrease in the value of our MSRs; and |
| • | a decrease in prevailing interest rates could reduce our earnings from our custodial deposit accounts. |
| • | We have experienced rapid growth, which may be difficult to sustain and which may place significant demands on our administrative, operational and financial resources. |
Our servicing portfolio, measured in unpaid principal balance, has grown from approximately $624 million at December 31, 2010 to approximately $9.7 billion at September 30, 2013. Our rapid growth has caused, and if it continues will continue to cause, significant demands on our legal, accounting and operational infrastructure, and increased expenses. In addition, we are required to continuously develop our systems and infrastructure in response to the increasing sophistication of the mortgage lending market and legal, accounting and regulatory developments relating to all of our business activities. Our future growth will depend, among other things, on our ability to maintain an operating platform and management system sufficient to address our growth and will require us to incur significant additional expenses and to commit additional senior management and operational resources. As a result, we face significant challenges in:
| • | maintaining adequate financial and business controls, |
| • | implementing new or updated information and financial systems and procedures, and |
| • | training, managing and appropriately sizing our work force and other components of our business on a timely and cost-effective basis. |
-28-
Table of Contents
There can be no assurance that we will be able to manage our expanding operations effectively or that we will be able to continue to grow, and any failure to do so could materially and adversely affect our business, financial condition and results of operations.
As part of our growth strategy, we intend to acquire loan origination platforms or businesses, servicing assets and businesses and other businesses that we believe complement our existing business and will contribute to our growth, and the failure to do so on attractive terms or at all or to integrate acquisitions into our operations or otherwise manage our planned growth may adversely affect us.
We can provide no assurances that we will be successful in identifying origination platforms or businesses, servicing assets and businesses or other businesses that meet our acquisition criteria or that, once identified, we will be successful in completing an acquisition. We face significant competition for attractive acquisition opportunities from other well-capitalized investors, some of which have greater financial resources and a greater access to debt and equity capital to secure and complete acquisitions than we do. As a result of such competition, we may be unable to acquire certain assets or businesses that we deem attractive or the purchase price may be significantly elevated or other terms may be substantially more onerous. In addition, we may seek to finance future acquisitions through a combination of borrowings, the use of retained cash flows, and offerings of equity and debt securities, which may not be available on advantageous terms, or at all. Any delay or failure on our part to identify, negotiate, finance on favorable terms, consummate and integrate such acquisitions could impede our growth.
We may not realize all of the anticipated benefits of our acquisitions, which could adversely affect our business, financial condition and results of operations.
We have expanded our business through acquisitions. In 2009, we merged with Swain Mortgage Company (“Swain”) to accelerate our entrance into the servicing business. In the third quarter of 2012, we acquired our financing platform and fully integrated the platform into our mortgage banking operations in December of 2012. Our ability to realize the anticipated benefits of these acquisitions and future acquisitions of servicing portfolios, origination platforms or businesses will depend, in part, on our ability to integrate those portfolios, platforms and businesses with our business. The process of acquiring assets or companies may disrupt our business and may not result in the full benefits expected. The risks associated with acquisitions include, among others:
| • | unanticipated issues in integrating information, communications and other systems; |
| • | unanticipated incompatibility of purchasing, logistics, marketing and administration methods; |
| • | direct and indirect costs and liabilities; |
| • | not retaining key employees; and |
| • | the diversion of management’s attention from ongoing business concerns. |
Moreover, the acquired portfolios, platforms or businesses may not contribute to our revenues or earnings to any material extent, and cost savings and synergies we expect at the time of an acquisition may not be realized once the acquisition has been completed. If we inappropriately value the assets or businesses we acquire or the value of the assets or businesses we acquire declines after we acquire them, the resulting charges may negatively affect the carrying value of the assets on our balance sheet and our earnings. See “—We use financial models and estimates in determining the fair value of certain assets, such as MSRs, commitments to originate loans, mortgage loans held for sale and related hedging instruments. If our estimates or assumptions prove to be incorrect, we may be required to record impairment charges, which could adversely affect our earnings.” Furthermore, if we incur additional indebtedness to finance an acquisition, the acquired business may not be able to generate sufficient cash flow to service that additional indebtedness. Unsuitable or unsuccessful acquisitions could materially and adversely affect our business, financial condition and results of operations.
-29-
Table of Contents
Our mortgage financing business is subject to risks, including the risk of default and competitive risks, which could adversely affect our results of operations.
Through NattyMac, we provide financing to correspondents and other third party residential mortgage originators with respect to the loans they originate, and these customers may default on their obligations to us, including their obligations to pay the line of credit or transfer the relevant loan under such financing arrangements. If our financing customers default on their obligations to us, we could incur losses. In addition, competition in warehouse lending has increased on a national level as new lenders, including national, community and regional banks that use deposit funds to finance loans, have begun entering the mortgage warehouse business. If increased competition negatively affects our mortgage financing business, our earnings could decrease.
The change of control rules under Section 382 of the Code may limit our ability to use net operating loss carryforwards to reduce future taxable income.
We have net operating loss (“NOL”) carryforwards for federal and state income tax purposes. Generally, NOL carryforwards can be used to reduce future taxable income. Our use of our NOL carryforwards will be limited, however, under Section 382 of the Code, if we undergo a change in ownership of more than 50% of our capital stock over a three-year period as measured under Section 382 of the Code. These complex change of ownership rules generally focus on ownership changes involving shareholders owning directly or indirectly 5% or more of our stock, including certain public “groups” of shareholders as set forth under Section 382 of the Code, including those arising from new stock issuances and other equity transactions. We believe we experienced an ownership change for these purposes in March 2012. In connection with the IPO, this offering or with another public or private offering in the future, it is likely that we will experience another ownership change within the meaning of Section 382 of the Code, measured for this purpose by including transfers and issuances of stock that took place after the ownership change that we believe occurred in March 2012. If we experience another ownership change, the resulting annual limit on the use of our NOL carryforwards (which would generally equal the product of the applicable federal long-term tax-exempt rate, multiplied by the value of our capital stock immediately before the ownership change, and potentially increased by certain existing gains, if any, recognized within five years after the ownership change if we have a net built-in gain in our assets at the time of the ownership change) could result in a meaningful increase in our federal and state income tax liability in future years. Whether an ownership change occurs by reason of trading in our stock is not within our control and the determination of whether an ownership change has occurred is complex. No assurance can be given that we will not in the future undergo another ownership change that would have a significant adverse effect on the use of our NOL carryforwards. In addition, the possibility of causing an ownership change may reduce our willingness to issue new common stock to raise capital.
As a public reporting company, we will be subject to rules and regulations established from time to time by the SEC and the NYSE regarding our internal control over financial reporting. We may not complete needed improvements to our internal control over financial reporting in a timely manner, or these internal controls may not be determined to be effective, which may adversely affect investor confidence in our company and, as a result, the market price of our common stock and your investment.
Upon completion of the IPO, we became a public reporting company subject to the rules and regulations established from time to time by the SEC and the NYSE. These rules and regulations require, among other things, that we establish and periodically evaluate procedures with respect to our internal controls over financial reporting. Reporting obligations as a public company are likely to place a considerable strain on our financial and management systems, processes and controls, as well as on our personnel. In addition, as a public company we will be required to document and test our internal controls over financial reporting pursuant to Section 404 of the Sarbanes-Oxley Act of 2002 (“Sarbanes-Oxley Act”) so that our management can certify as to the effectiveness of our internal controls over financial reporting by the time our annual report for the year ending December 31, 2014 is due and thereafter, which will require us to document and make significant changes to our internal controls over financial reporting. Likewise, our independent registered public accounting firm will be required to
-30-
Table of Contents
provide an attestation report on the effectiveness of our internal control over financial reporting when we cease to be an “emerging growth company,” as defined in the JOBS Act, although, we could potentially qualify as an “emerging growth company” until December 31, 2018. As a result, we are in the process of improving our financial and managerial controls, reporting systems and procedures, incurring substantial expenses in making such improvements and testing our systems and hiring additional personnel. However, if we are unable to remediate material weaknesses that have been identified, if our management is unable to certify the effectiveness of our internal controls (at the time they are required to do so), if our independent registered public accounting firm cannot deliver (at such time as it is required to do so) a report attesting to the effectiveness of our internal control over financial reporting or if we in the future identify and fail to remediate material weaknesses in our internal controls identified in the future, we could be subject to regulatory scrutiny and a loss of public confidence, which could harm our reputation and the market price of our common stock. In addition, if we do not maintain adequate financial and management personnel, processes and controls, we may not be able to manage our business effectively or accurately report our financial performance on a timely basis, which could cause a decline in our common stock price and adversely affect our results of operations and financial condition.
The success and growth of our business will depend upon our ability to adapt to and implement technological changes.
Our mortgage loan origination business is dependent upon our ability to effectively interface with our brokers, borrowers and other third parties and to efficiently process loan applications and closings. The origination process is becoming more dependent upon technological advancement. We are in the process of enhancing our proprietary, automated, risk-based due diligence platform (known as OLIE), which we expect to provide a highly scalable, transparent, and consistent diligence platform from loan origination to securitization.
Our due diligence platform and other technologies may not meet our expectations or maintain our needs for technological advancement. Further, the development of such technologies and maintaining and improving new technologies will require significant capital expenditures and maintaining the technological proficiency of our personnel will require significant expense.
As technological requirements increase in the future, we will have to fully develop these capabilities to remain competitive, and any failure to do so could adversely affect our business, financial condition and results of operations.
The ongoing implementation of the Dodd-Frank Act will increase our regulatory compliance burden and associated costs and place restrictions on certain originations and servicing operations, all of which could adversely affect our business, financial condition and results of operations.
The Dodd-Frank Act represents a comprehensive overhaul of the financial services industry in the United States. The Dodd-Frank Act includes, among other things: (i) the creation of a Financial Stability Oversight Council to identify emerging systemic risks posed by financial firms, activities and practices, and to improve cooperation among federal agencies; (ii) the creation of a Bureau of Consumer Financial Protection (“CFPB”) authorized to promulgate and enforce consumer protection regulations relating to financial products; (iii) the establishment of strengthened capital and prudential standards for banks and bank holding companies; (iv) enhanced regulation of financial markets, including the derivatives and securitization markets; and (v) amendments to the Truth in Lending Act aimed at improving consumer protections with respect to mortgage originations, including originator compensation, minimum repayment standards and prepayment considerations.
On January 10, 2013, the CFPB announced a rule to implement certain provisions of the Dodd-Frank Act relating to mortgage originations. Under the new originations rule, before originating a mortgage loan, lenders must determine on the basis of certain information and according to specified criteria that the prospective borrower has the ability to repay the loan. Lenders that issue loans meeting certain requirements will be presumed to comply with the new rule with respect to these loans. On January 17, 2013, the CFPB announced rules to implement certain provisions of the Dodd-Frank Act relating to mortgage servicing. The new servicing
-31-
Table of Contents
rules require servicers to meet certain benchmarks for customer service. Servicers must provide periodic billing statements and certain required notices and acknowledgments, promptly credit borrowers’ accounts for payments received and promptly investigate complaints by borrowers and are required to take additional steps before purchasing insurance to protect the lender’s interest in the property. The new servicing rules also call for additional notice, review and timing requirements with respect to delinquent borrowers, including early intervention, ongoing access to servicer personnel and specific loss mitigation and foreclosure procedures. Both the origination and servicing rules will take effect on January 10, 2014. The CFPB also issued guidelines on October 13, 2011 and January 11, 2012 indicating that it would send examiners to banks and other institutions that service and/or originate mortgage loans to assess whether consumers’ interests are protected.
The ongoing implementation of the Dodd-Frank Act, including the implementation of the new origination and servicing rules by the CFPB and the CFPB’s continuing examination of our industry, will increase our regulatory compliance burden and associated costs and place restrictions on our servicing operations, which could in turn adversely affect our business, financial condition and results of operations.
State or federal governmental examinations, legal proceedings or enforcement actions and related costs could have a material adverse effect on our liquidity, financial position and results of operations.
We are routinely involved in regulatory reviews and legal proceedings concerning matters that arise in the ordinary course of our business. An adverse result in regulatory actions or examinations or private lawsuits may adversely affect our financial results. In addition, a number of participants in our industry have been the subject of purported class action lawsuits and regulatory actions by state regulators and other industry participants have been the subject of actions by state Attorneys General. Regulatory investigations, both state and federal, can be either formal or informal. The costs of responding to the investigations can be substantial. In addition, government-mandated changes to servicing practices could lead to higher costs and additional administrative burdens, in particular regarding record retention and informational obligations.
The enforcement consent orders by, agreements with, and settlements of, certain federal and state agencies against other mortgage servicers related to foreclosure practices could impose additional compliance costs on our servicing business, which could adversely affect our business, financial condition and results of operations.
The federal and state agencies overseeing certain aspects of the mortgage market have entered into settlements and enforcement consent orders with other mortgage servicers regarding foreclosure practices that primarily relate to mortgage loans originated during the credit crisis. The enforcement consent orders require the servicers, among other things, to: (i) make significant modifications in practices for residential mortgage loan servicing and foreclosure processing, including communications with borrowers and limitations on dual-tracking, which occurs when servicers continue to pursue foreclosure during the loan modification process; (ii) establish a single point of contact for borrowers throughout the loan modification and foreclosure processes; and (iii) establish robust oversight and controls pertaining to their third party vendors, including outside legal counsel, that provide default management or foreclosure services.
Although we are not a party to any of these settlements and enforcement consent orders and lack the legacy loans that gave rise to these settlements and enforcement consent orders, the practices set forth in those settlements and consent orders are being adopted by the industry as a whole, forcing us to comply with them in order to follow standard industry practices. We may also become required to comply with these practices by our servicing agreements. While we have made and continue to make changes to our operating policies and procedures in light of these settlements and consent orders, further changes could be required, and changes to our servicing practices will increase compliance costs for our servicing business, which could adversely affect our business, financial condition and results of operations.
-32-
Table of Contents
Our foreclosure proceedings in certain states may be delayed due to inquiries by certain state Attorneys General, court administrators and state and federal government agencies, the outcome of which could have an adverse effect on business, financial condition and results of operations.
Allegations of irregularities in foreclosure processes, including so-called “robo-signing” by mortgage loan servicers, have gained the attention of the Department of Justice, regulatory agencies, state Attorneys General and the media, among other parties. Certain state Attorneys General, court administrators and government agencies, as well as representatives of the federal government, have issued letters of inquiry to mortgage servicers requesting written responses to questions regarding policies and procedures, especially with respect to notarization and affidavit procedures. Even though we have not received any letters of inquiry and we do not have the legacy loans that have been examined for irregularities in the foreclosure process, our operations may be affected by regulatory actions or court decisions that are taken in connection with these inquiries. In addition to these inquiries, several state Attorneys General have requested that certain mortgage servicers suspend foreclosure proceedings pending internal review to ensure compliance with applicable law.
The current legislative and regulatory climate could lead borrowers to contest foreclosures that they would not otherwise have contested under ordinary circumstances, and we may incur increased litigation costs if the validity of a foreclosure action is challenged by a borrower. Delays in foreclosure proceedings could also require us to make additional servicing advances by drawing on our financing facilities, or delay the recovery of advances, all or any of which could adversely affect our business, financial condition and results of operations.
We may incur increased costs and related losses if a borrower challenges the validity of a foreclosure action, if a court overturns a foreclosure or if a foreclosure subjects us to environmental liabilities, which could adversely affect our business, financial condition and results of operations.
We may incur costs if we are required to, or if we elect to, execute or re-file documents or take other action in our capacity as a servicer in connection with pending or completed foreclosures. We may incur litigation costs if the validity of a foreclosure action is challenged by a borrower. If a court overturns a foreclosure because of errors or deficiencies in the foreclosure process, we may have liability to a title insurer or the purchaser of the property sold in foreclosure. These costs and liabilities may not be legally or otherwise reimbursable to us, particularly to the extent they relate to securitized mortgage loans. In addition, if certain documents required for a foreclosure action are missing or defective, we could be obligated to cure the defect or repurchase the loan. A significant increase in litigation costs could adversely affect our liquidity, and our inability to be reimbursed for an advance could adversely affect our business, financial condition and results of operations.
In addition, in the course of our business, it is necessary to foreclose and take title to real estate, which could subject us to environmental liabilities with respect to these properties. Hazardous substances or waste, contaminants, pollutants or sources thereof may be discovered on properties during our ownership or after a sale to a third party. We could be held liable to a governmental entity or to third parties for property damage, personal injury, investigation and clean-up costs incurred by these parties in connection with environmental contamination, or may be required to investigate or clean up hazardous or toxic substances or chemical releases at such properties. The costs associated with investigation or remediation activities could be substantial and could substantially exceed the value of the real property. In addition, as the owner or former owner of a contaminated site, we may be subject to common law claims by third parties based on damages and costs resulting from environmental contamination emanating from the property. We may be unable to recover costs from any third party. These occurrences may materially reduce the value of the affected property, and we may find it difficult or impossible to use or sell the property prior to or following any environmental remediation. If we ever become subject to significant environmental liabilities, our business, financial condition and results of operations could be materially and adversely affected.
-33-
Table of Contents
Borrowers with adjustable rate mortgage loans are especially exposed to increases in monthly payments and they may not be able to refinance their loans, which could cause delinquency, default and foreclosure and therefore adversely affect our business.
At September 30, 2013, we serviced adjustable rate mortgage loans that represented less than 0.1% of our total servicing portfolio. Borrowers with adjustable rate mortgage loans are exposed to increased monthly payments when the related mortgage loan’s interest rate adjusts upward from an initial fixed rate or a low introductory rate, as applicable, to the rate computed in accordance with the applicable index and margin. Borrowers with adjustable rate mortgage loans seeking to refinance their mortgage loans to avoid increased monthly payments as a result of an upwards adjustment of the mortgage loan’s interest rate may no longer be able to find available replacement loans at comparably low interest rates. This increase in borrowers’ monthly payments, together with any increase in prevailing market interest rates, may result in significantly increased monthly payments for borrowers with adjustable rate mortgage loans, which may cause delinquency, default and foreclosure. Increased mortgage defaults and foreclosures may adversely affect our business as they increase the cost of servicing the mortgage loans we service and reduce the number of mortgage loans we service.
Our counterparties may terminate our servicing rights, which could materially and adversely affect our business, financial condition and results of operations.
The owners of the loans we service may, under certain circumstances, terminate our MSRs. As is standard in the industry, under the terms of our master servicing agreement with GSEs, GSEs have the right to terminate us as servicer of the loans we service on their behalf at any time and also have the right to cause us to sell the MSRs to a third party. In addition, failure to comply with servicing standards could result in termination of our agreements with GSEs. See “—Because we are required to follow the guidelines of the GSEs with which we do business and are not able to negotiate our fees with these entities for the purchase of our loans, our competitors may be able to sell their loans to GSEs on more favorable terms.” Some GSEs may also have the right to require us to assign the MSRs to a subsidiary and sell our equity interest in the subsidiary to a third party. If we were to have our servicing rights terminated on a material portion of our servicing portfolio, this could materially and adversely affect our business, financial condition and results of operations.
Federal and state legislative and Agency initiatives in mortgage-backed securities and securitization may adversely affect our financial condition and results of operations.
There are federal and state legislative and Agency initiatives that could, once fully implemented, adversely affect our business. For instance, the risk retention requirement under the Dodd-Frank Act requires securitizers to retain a minimum beneficial interest in MBS they sell through a securitization, absent certain qualified residential mortgage (“QRM”) exemptions. Once implemented, the risk retention requirement may result in higher costs of certain origination operations and impose on us additional compliance requirements to meet servicing and origination criteria for QRMs. Additionally, the amendments to Regulation AB relating to the registration statement required to be filed by asset-backed securities (“ABS”) issuers adopted in March 2011 by the SEC pursuant to the Dodd-Frank Act would increase compliance costs for ABS issuers, which could in turn increase our cost of funding and operations. Any of the foregoing could adversely affect our business, financial condition and results of operations.
We may be required to indemnify purchasers of the mortgage loans we originate or of the MBS backed by such loans or to repurchase the related loans if the loans fail to meet certain criteria or characteristics or under other circumstances.
The indentures governing our securitized pools of mortgage loans and our contracts with purchasers of our whole loans contain provisions that require us to indemnify purchasers of the loans we originate or of the MBS backed by such loans or to repurchase the related loans under certain circumstances. While our contracts vary, they contain provisions that require us to repurchase loans if:
| • | our representations and warranties concerning loan quality and loan circumstances are inaccurate; |
-34-
Table of Contents
| • | we fail to secure adequate mortgage insurance within a certain period after closing; |
| • | a mortgage insurance provider denies coverage; or |
| • | we fail to comply, at the individual loan level or otherwise, with regulatory requirements in the current dynamic regulatory environment. |
We believe that, as a result of the current market environment, many purchasers of residential mortgage loans are particularly aware of the conditions under which originators must indemnify them or repurchase loans they have purchased and would benefit from enforcing any repurchase remedies they may have. We believe that our exposure to repurchases under our representations and warranties includes the current unpaid balance of all loans we have sold. If we are required to indemnify or repurchase loans that we originate and sell or securitize that result in losses that exceed our reserve, this could adversely affect our business, financial condition and results of operations.
Because we are required to follow the guidelines of the GSEs with which we do business and are not able to negotiate our fees with these entities for the purchase of our loans, our competitors may be able to sell their loans to GSEs on more favorable terms.
In our transactions with the GSEs, we are required to follow specific guidelines that impact the way we service and originate mortgage loans including:
| • | our staffing levels and other servicing practices; |
| • | the servicing and ancillary fees that we may charge; |
| • | our modification standards and procedures; and |
| • | the amount of non-reimbursable advances. |
In particular, the FHFA has directed GSEs to align their guidelines for servicing delinquent mortgages they own or guarantee, which can result in monetary incentives for servicers that perform well and penalties for those that do not. In addition, FHFA has directed Fannie Mae to assess compensatory fees against servicers in connection with delinquent loans, foreclosure delays, and other breaches of servicing obligations.
We cannot negotiate these terms with the GSEs, and they are subject to change at any time. A significant change in these guidelines that has the effect of decreasing our fees or requires us to expend additional resources in providing mortgage services could decrease our revenues or increase our costs, which could adversely affect our business, financial condition and results of operations.
We are required to make servicing advances that can be subject to delays in recovery or may not be recoverable in certain circumstances, which could adversely affect our liquidity, business, financial condition and results of operations.
During any period in which a borrower is not making payments, we are required under most of our servicing agreements to advance our own funds to meet contractual principal and interest remittance requirements for investors, pay property taxes and insurance premiums, pay legal expenses and fund other protective advances. We also advance funds to maintain, repair and market real estate properties that we service. As home values change, we may have to reconsider certain of the assumptions underlying our decisions to make advances and, in certain situations, our contractual obligations may require us to make certain advances for which we may not be reimbursed. In addition, in the event a mortgage loan serviced by us defaults or becomes delinquent, the repayment to us of the advance may be delayed until the mortgage loan is repaid or refinanced or a liquidation occurs. They are typically recovered upon weekly or monthly reimbursement or from sale in the
-35-
Table of Contents
market. In the event we receive requests for advances in excess of amounts we are able to fund, we may not be able to fund these advance requests, which could materially and adversely affect our liquidity. A delay in our ability to collect an advance may adversely affect our liquidity, and our inability to be reimbursed for an advance could adversely affect our business, financial condition and results of operations.
Our hedging strategies may not be successful in mitigating our risks associated with interest rates.
From time to time, we have used various derivative financial instruments to provide a level of protection against interest rate risks, including the commitments we make to prospective borrowers, but no hedging strategy can protect us completely. The derivative financial instruments that we select may not have the effect of reducing our interest rate risks. In addition, the nature and timing of hedging transactions may influence the effectiveness of these strategies. Poorly designed strategies, improperly executed and documented transactions or inaccurate assumptions could actually increase our risks and losses. In addition, hedging strategies involve transaction and other costs. Our hedging strategies and the derivatives that we use may not be able to adequately offset the risks of interest rate volatility, and our hedging transactions may result in or magnify losses. Furthermore, interest rate derivatives may not be available on favorable terms or at all, particularly during economic downturns. Any of the foregoing risks could adversely affect our business, financial condition and results of operations.
A delay in obtaining or failure to obtain servicer ratings could have an adverse effect on our business, financial condition and results of operations.
In connection with our business of servicing non-Agency mortgage loans, we are pursuing obtaining servicer ratings from Standard & Poor’s Ratings Services, Moody’s Investors Service and Fitch Ratings as a residential mortgage loan servicer. We expect to receive those ratings, but there can be no assurances that we will receive servicer ratings from each rating agency in a timely manner, or at all. A delay in obtaining or failure to obtain servicer ratings will delay our ability to increase our non-Agency mortgage loan servicing business, which could have an adverse effect on our business, financial condition and results of operations. In addition, any ratings that we receive may be downgraded in the future. Any such downgrade could adversely affect our business, financial condition and results of operations.
Technology failures or terrorist attacks could damage our business operations and increase our costs, which could adversely affect our business, financial condition and results of operations.
The financial services industry as a whole is characterized by rapidly changing technologies, and system disruptions and failures caused by fire, power loss, telecommunications failures, unauthorized intrusion, computer viruses and disabling devices, natural disasters and other similar events may interrupt or delay our ability to provide services to our borrowers and other business partners. Security breaches, acts of vandalism and developments in computer capabilities could result in a compromise or breach of the technology that we use to protect our borrowers’ personal information and transaction data. Despite our efforts to ensure the integrity of our systems, it is possible that we may not be able to anticipate or implement effective preventive measures against all security breaches, especially because the techniques used change frequently or are not recognized until launched, and because security attacks can originate from a wide variety of sources, including third parties such as persons involved with organized crime or associated with external service providers. Those parties may also attempt to fraudulently induce employees, customers or other users of our systems to disclose sensitive information in order to gain access to our data or that of our customers or clients. These risks may increase in the future as we continue to increase our reliance on the internet and use of web-based product offerings and on the use of cybersecurity.
A successful penetration or circumvention of the security of our systems or a defect in the integrity of our systems or cybersecurity could cause serious negative consequences for our business, including significant disruption of our operations, misappropriation of our confidential information or that of our customers, or damage to our computers or operating systems and to those of our customers and counterparties. Any of the
-36-
Table of Contents
foregoing events could result in violations of applicable privacy and other laws, financial loss to us or to our customers, loss of confidence in our security measures, customer dissatisfaction, significant litigation exposure and harm to our reputation, all of which could adversely affect our business, financial condition and results of operations.
In addition, the terrorist attacks on September 11, 2001 disrupted the U.S. financial markets, including the real estate capital markets, and negatively impacted the U.S. economy in general. Any future terrorist attacks, the anticipation of any such attacks, the consequences of any military or other response by the United States and its allies, and other armed conflicts could cause consumer confidence and spending to decrease or result in increased volatility in the United States and worldwide financial markets and economy. The economic impact of these events could also adversely affect the credit quality of some of our loans and investments and the properties underlying our interests.
We may suffer losses as a result of the adverse impact of any future attacks and these losses may adversely impact our performance and may cause the market value of our shares of common stock to decline or be more volatile. A prolonged economic slowdown, recession or declining real estate values could impair the performance of our investments and harm our financial condition and results of operations, increase our funding costs, limit our access to the capital markets or result in a decision by lenders not to extend credit to us. We cannot predict the severity of the effect that potential future armed conflicts and terrorist attacks would have on us. Losses resulting from these types of events may not be fully insurable.
We have purchased certain refinancing loans where the correspondent originating the refinancing loan failed to obtain a satisfaction and release of the prior mortgage loan.
In early 2013, we became aware that we purchased certain refinancing loans with original principal amounts totaling approximately $5.2 million from a correspondent in cases where the prior mortgage loan on the property securing the mortgage loan that we purchased from the correspondent was not satisfied and released by the correspondent’s title company at the time the loan from the correspondent was made. As part of our process in purchasing a mortgage loan from a correspondent, we generally require that a closing protection letter be issued by the title insurer in favor of the borrower. A closing protection letter was obtained with respect to each of these loans. As a result, the borrower should be insured against any liens prior to ours that were not identified in connection with the issuance of that closing protection letter. We believe that our procedures, including conducting a post-purchase audit, were effective in identifying the failure by the correspondent to obtain a release of the prior mortgage loan and that our practice of obtaining closing protection letters is appropriate to protect us in these situations. We have notified the affected borrowers and the relevant insurance carriers, and we expect that the title insurance obtained in connection with the refinancings will result in our loan having a first priority status. However, there can be no assurances that the prior mortgages will be fully satisfied from the title insurance claims or that instances like this will not occur in the future.
Any failure of our internal security measures or breach of our privacy protections could cause harm to our reputation and subject us to liability, any of which could adversely affect our business, financial condition and results of operations.
In the ordinary course of our business, we receive and store certain confidential information concerning borrowers. Additionally, we enter into third party relationships to assist with various aspects of our business, some of which require the exchange of confidential borrower information. If a third party were to compromise or breach our security measures or those of the vendors, through electronic, physical or other means, and misappropriate such information, it could cause interruptions in our operations and expose us to significant liabilities, reporting obligations, remediation costs and damage to our reputation. Any of the foregoing risks could adversely affect our business, financial condition and results of operations. See also “—Technology failures or terrorist attacks could damage our business operations and increase our costs, which could adversely affect our business, financial condition and results of operations.”
-37-
Table of Contents
Our vendor relationships subject us to a variety of risks.
We have significant vendors that, among other things, provide us with financial, technology and other services to support our mortgage loan servicing and origination businesses. With respect to vendors engaged to perform activities required by servicing criteria, we have elected to take responsibility for assessing compliance with the applicable servicing criteria for the applicable vendor and are required to have procedures in place to provide reasonable assurance that the vendor’s activities comply in all material respects with servicing criteria applicable to the vendor. In the event that a vendor’s activities do not comply with the servicing criteria, it could negatively impact our servicing agreements. In addition, if our current vendors were to stop providing services to us on acceptable terms, including as a result of one or more vendor bankruptcies due to poor economic conditions, we may be unable to procure alternatives from other vendors in a timely and efficient manner and on acceptable terms, or at all. Further, we may incur significant costs to resolve any such disruptions in service and this could adversely affect our business, financial condition and results of operations.
The loss of the services of our senior executives could adversely affect our business, financial condition and results of operations.
The experience of our senior executives is a valuable asset to us. Our management team has significant experience in the residential mortgage origination and servicing industry. We have obtained a key life insurance policy on Mr. Cutillo but do not maintain and do not currently plan to obtain key life insurance policies on any of our other senior managers.
Additionally, under certain financing agreements, the loss of the services of senior executives could have adverse consequences. Under the Master Purchase Agreement between us and Barclays Bank PLC (“Barclays”), dated as of December 24, 2012, if Mr. Cutillo resigns, is removed or experiences a substantial change in management responsibilities without the approval of Barclays, an event of default would occur. If an event of default occurs, Barclays may terminate the agreement and may exercise various other remedies.
Under the Master Repurchase Agreement between us and Bank of America, N.A. (“Bank of America”), dated as of February 28, 2013, event of default is defined to include a change in key personnel without the prior written consent of Bank of America. Key personnel is defined as Mr. Cutillo as chief executive officer, Mr. Bettenburg as president and Mr. Swain as executive vice president of loan servicing. If an event of default occurs, Bank of America may declare certain amounts immediately due and payable and may exercise various other remedies. Thus, the loss of services of our senior executives could thus adversely affect our business, financial condition and results of operations.
Our business could suffer if we fail to attract and retain a highly skilled workforce.
Our future success will depend on our ability to identify, hire, develop, motivate and retain highly qualified personnel for all areas of our organization, in particular skilled managers, loan servicers, debt default specialists, loan officers and underwriters. Trained and experienced personnel are in high demand and may be in short supply in some areas. Many of the companies with which we compete for experienced employees have greater resources than we have and may be able to offer more attractive terms of employment. In addition, we invest significant time and expense in training our employees, which increases their value to competitors who may seek to recruit them. We may not be able to attract, develop and maintain an adequate skilled workforce necessary to operate our businesses, and labor expenses may increase as a result of a shortage in the supply of qualified personnel. If we are unable to attract and retain such personnel, we may not be able to take advantage of acquisitions and other growth opportunities that may be presented to us, and this could materially affect our business, financial condition and results of operations.
Negative public opinion could damage our reputation and adversely affect our earnings.
Reputation risk, or the risk to our business, earnings and capital from negative public opinion, is inherent in our business. Negative public opinion can result from our actual or alleged conduct in any number of
-38-
Table of Contents
activities, including lending and debt collection practices, corporate governance, and actions taken by government regulators and community organizations in response to those activities. Negative public opinion can also result from media coverage, whether accurate or not. Negative public opinion can adversely affect our ability to attract and retain customers and employees and can expose us to litigation and regulatory action. Although we take steps to minimize reputation risk in dealing with our customers, business partners and communities, this risk will always be present in our organization.
Risks Related to Our Organization and Structure
If the ownership of our common stock continues to be highly concentrated, it may prevent you and other minority shareholders from influencing significant corporate decisions and may result in conflicts of interest.
Affiliates of Long Ridge Equity Partners currently own approximately 29.0% of our outstanding common stock (excluding shares issuable upon exercise of the warrants owned by Long Ridge Equity Partners and Stonegate Investors Holdings, an affiliate of Long Ridge Equity Partners, to purchase an additional 242,621 shares of our common stock). As a result, Long Ridge Equity Partners will have a significant impact on any shareholder vote, including: the election of directors; mergers, consolidations and acquisitions; the sale of all or substantially all of our assets and other decisions affecting our capital structure; the amendment of our Third Amended and Restated Articles of Incorporation (the “Articles”) and our Third Amended and Restated Code of Regulations, as amended (the “Regulations”); and our winding up and dissolution. This concentration of ownership may delay, deter or prevent acts that may be favored by our other shareholders. The interests of Long Ridge Equity Partners may not always coincide with our interests or the interests of our other shareholders. This concentration of ownership may also have the effect of delaying, preventing or deterring a sale of our business or other change in control of us that our other shareholders might favor. Also, Long Ridge Equity Partners may seek to cause us to take courses of action that, in its judgment, could enhance its investment in us, but which might involve risks to our other shareholders or adversely affect us or our other shareholders, including investors in this offering. As a result, the market price of our common stock could decline or shareholders might not receive a premium over the then-current market price of our common stock upon a sale or other change in control. In addition, this concentration of share ownership may adversely affect the trading price of our common stock because investors may perceive disadvantages in owning shares in a company with a significant shareholder. See “Principal Shareholders” and “Certain Provisions of Ohio Law and Stonegate’s Articles and Regulations—Anti-Takeover Effect of Certain Provisions of Ohio Law and Our Articles and Regulations.”
We do not anticipate paying any dividends on our common stock in the foreseeable future.
We do not expect to declare or pay any cash or other dividends in the foreseeable future on our common stock because we intend to use cash flow generated by operations to grow our business. We may enter into credit agreements or other borrowing arrangements in the future that restrict or limit our ability to pay cash dividends on our common stock. See “Dividend Policy.”
Certain provisions of our Articles and Regulations and of the Second Amended and Restated Shareholders Agreement, as amended between us and Stonegate Investors Holdings could hinder, delay or prevent a change in control of us, which could adversely affect the price of our common stock.
Certain provisions of our Articles and Regulations and of the Second Amended and Restated Shareholders Agreement, as amended that we entered into with Stonegate Investors Holdings on May 15, 2013, or the Shareholders Agreement, contain provisions that could make it more difficult for a third party to acquire us without the consent of our Board of Directors or Stonegate Investors Holdings. These provisions provide for:
| • | Our Articles do not grant cumulative voting rights to our shareholders, which, if granted, would enhance the ability of minority shareholders to elect directors; |
-39-
Table of Contents
| • | A super-majority vote of the holders of at least two-thirds of our shares of common stock entitled to vote is required to amend certain provisions in our Articles which have anti-takeover effects, including the elimination of preemptive rights and the elimination of cumulative voting of shares; |
| • | Our Regulations create a staggered Board of Directors where the directors are divided into two classes (consisting of not fewer than three directors in each class), with only one class of directors standing for election in any given year beginning in 2014. Because all the members of our Board of Directors will not be elected at the same time, this may make it more difficult to gain control of our Board of Directors; |
| • | All of the directors or any individual director may be removed by the holders of no less than 75% of all shares of our common stock then entitled to vote at an election of directors, but then only for cause, which also makes it more difficult to gain control of our Board of Directors; |
| • | Our Board of Directors has the power to cause us to issue additional shares of stock of any class or series, including “blank check” preferred stock, and to fix the terms of one or more classes of series of stock without shareholder approval, which may have rights that adversely affect the rights of holders of our common stock and impede or deter any efforts to acquire control of us; |
| • | Shareholders must follow certain advance notice and information requirements to nominate individuals for election as directors or to propose matters that may be acted upon at a shareholders’ meeting, which may discourage a potential acquirer from conducting a proxy contest to elect directors or otherwise attempting to influence or gain control of us; |
| • | Our Regulations require that, among other methods, shareholders holding at least 25% of our outstanding shares of common stock must act together to require us to call a special meeting of shareholders, other than the special election meeting required under the Registration Rights Agreement if we fail to perform certain obligations under that agreement; |
| • | Our Regulations provide that vacancies on our Board of Directors (including vacancies created by an expansion of the Board of Directors) may be filled by the affirmative vote of a majority of the remaining directors then in office, even though less than a quorum, or by our shareholders; |
| • | Stonegate Investors Holdings will be able to nominate for election (i) two directors until the date on which their beneficial ownership of our common stock falls below 15% of the outstanding shares of common stock and (ii) thereafter one director until the date on which their beneficial ownership of our common stock falls below 10% of the outstanding shares of common stock; |
| • | At least one Stonegate Investors Holdings nominated director will be on each committee of our Board of Directors until the date on which their beneficial ownership of our common stock falls below 10% of the outstanding shares of common stock for so long as their representation on those committees is permitted by the corporate governance rules of the national securities exchange on which our shares of common stock are then listed; and |
| • | Stonegate Investors Holdings will have a preemptive right to purchase shares of common stock in any private offering of shares of our common stock, subject to certain exceptions, until the date on which their beneficial ownership of our common stock falls below 10% of the outstanding shares of common stock. |
In addition, these provisions may make it difficult and expensive for a third party to pursue a tender offer, a change in control or a takeover attempt that is opposed by Long Ridge Equity Partners, our management
-40-
Table of Contents
or our Board of Directors. Other shareholders who might desire to participate in these types of transactions may not have an opportunity to do so, even if the transaction is favorable to shareholders. These anti-takeover provisions could substantially impede the ability of other shareholders to benefit from a change in control or a change in our management or Board of Directors and, as a result, may adversely affect the market price of our common stock and your ability to realize any potential change of control premium. See “Certain Provisions of Ohio Law and Stonegate’s Articles and Regulations—Anti-Takeover Effect of Certain Provisions of Ohio Law and Our Articles and Regulations.”
We will have broad discretion in the use of a significant part of the net proceeds from the IPO and may not use them effectively.
Our management has broad discretion in the application of a significant part of the remaining net proceeds from the IPO. The failure by our management to apply these funds effectively could affect our ability to operate and grow our business.
Risks Related to this Offering and Ownership of Our Common Stock
An active trading market for our common stock may not be sustained.
Although our common stock is listed on the NYSE, an active trading market for our common stock on that exchange or elsewhere may not be sustained. Accordingly, if an active trading market for our common stock is not maintained, the liquidity of our common stock, your ability to sell your shares of common stock when desired and the prices that you may obtain for your shares of common stock will be adversely affected.
We are an “emerging growth company” and as a result of the reduced disclosure and governance requirements applicable to emerging growth companies, our common stock may be less attractive to investors.
We are an “emerging growth company” as defined in the JOBS Act, and we intend to take advantage of certain exemptions from various reporting requirements that are applicable to other public companies that are not emerging growth companies, including not being required to comply with the auditor attestation requirements of Section 404 of the Sarbanes-Oxley Act, reduced disclosure obligations regarding executive compensation in our periodic reports and proxy statements, and exemptions from the requirements of holding a nonbinding advisory vote on executive compensation and shareholder approval of any golden parachute payments not previously approved. We cannot predict if investors will find our common stock less attractive because we will rely on these exemptions. If some investors find our common stock less attractive as a result, there may be a less active trading market for our common stock and our stock price may be more volatile. We may take advantage of these reporting exemptions until we are no longer an emerging growth company. We will remain an emerging growth company until the earlier of (1) the last day of the fiscal year (a) following the fifth anniversary of the completion of the IPO, (b) in which we have total annual gross revenue of at least $1.0 billion, or (c) in which we are deemed to be a large accelerated filer, which means the market value of our common stock that is held by non-affiliates exceeds $700.0 million as of the prior June 30th, and (2) the date on which we have issued more than $1.0 billion in non-convertible debt during the prior three-year period.
Under Section 107(b) of the JOBS Act, emerging growth companies can delay adopting new or revised accounting standards until such time as those standards apply to private companies. We have irrevocably elected not to take advantage of this exemption from new or revised accounting standards and, therefore, we will be subject to the same new or revised accounting standards as other public companies that are not emerging growth companies.
The market price and trading volume of our common stock may be volatile, which could result in rapid and substantial losses for our shareholders.
The market price of our common stock may be highly volatile and could be subject to wide fluctuations. In addition, the trading volume in our common stock may fluctuate and cause significant price variations to
-41-
Table of Contents
occur. If the market price of our common stock declines significantly, you may be unable to resell your shares at or above your purchase price, if at all. The market price of our common stock may fluctuate or decline significantly in the future. Some of the factors that could negatively affect our share price or result in fluctuations in the price or trading volume of our common stock include:
| • | variations in our quarterly or annual operating results; |
| • | changes in our earnings estimates (if provided) or differences between our actual financial and operating results and those expected by investors and analysts; |
| • | the contents of published research reports about us or our industry or the failure of securities analysts to cover our common stock after the IPO; |
| • | additions or departures of key management personnel; |
| • | any increased indebtedness we may incur in the future; |
| • | announcements by us or others and developments affecting us; |
| • | actions by institutional shareholders; |
| • | litigation and governmental investigations; |
| • | changes in market valuations of similar companies; |
| • | speculation or reports by the press or investment community with respect to us or our industry in general; |
| • | increases in market interest rates that may lead purchasers of our shares to demand a higher yield; |
| • | announcements by us or our competitors of significant contracts, acquisitions, dispositions, strategic relationships, joint ventures or capital commitments; and |
| • | general market, political and economic conditions, including any such conditions and local conditions in the markets in which our customers are located. |
These broad market and industry factors may decrease the market price of our common stock, regardless of our actual operating performance. The stock market in general has from time to time experienced extreme price and volume fluctuations, including in recent months. In addition, in the past, following periods of volatility in the overall market and the market price of a company’s securities, securities class action litigation has often been instituted against these companies. This litigation, if instituted against us, could result in substantial costs and a diversion of our management’s attention and resources.
Members of our senior management team, our Board of Directors, continuing investors and Stonegate Investors Holdings collectively own a significant amount of our common stock or options exercisable for shares of our common stock, and future sales by these holders of shares of our common stock, or the perception that such sales could occur in the future, could have a material adverse effect on the market price of our common stock.
Mr. Cutillo, Mr. Bettenburg and other members of our senior management team, our Board of Directors, continuing investors and affiliates of Long Ridge Equity Partners beneficially own an aggregate of approximately 45.3% of our outstanding shares of common stock (excluding warrant to purchase 277,777 shares of our common stock owned by Glick Pluchenik 2011 Trust, Stonegate Investors Holdings and its affiliate, Long Ridge Equity Partners, LLC, and other option awards made to members of our senior management team and Board of Directors). Future sales by these holders of shares of our common stock, or the perception that such sales could occur in the future, could have a material adverse effect on the market price of our common stock.
-42-
Table of Contents
Holders of 6,388,889 shares of our common stock have registration rights that obligate us to register the offer and sale of their shares under the Securities Act. Once we register the offer and sale of shares for the holders of registration rights, the shares can be freely sold in the public market, subject to any applicable lock-up agreements or unless they are held by “affiliates,” as that term is defined in Rule 144 of the Securities Act.
Future offerings of debt or equity securities by us may adversely affect the market price of our common stock.
In the future, we may attempt to obtain financing or to further increase our capital resources by issuing additional shares of our common stock or offering debt or other equity securities, including commercial paper, medium-term notes, senior or subordinated notes, debt securities convertible into equity or shares of preferred stock. Future acquisitions could require substantial additional capital in excess of cash from operations. We would expect to obtain the capital required for acquisitions through a combination of additional issuances of equity, corporate indebtedness and/or cash from operations.
Issuing additional shares of our common stock or other equity securities or securities convertible into equity may dilute the economic and voting rights of our existing shareholders or reduce the market price of our common stock or both. Upon liquidation, holders of such debt securities and preferred shares, if issued, and lenders with respect to other borrowings would receive a distribution of our available assets prior to the holders of our common stock. Debt securities convertible into equity could be subject to adjustments in the conversion ratio pursuant to which certain events may increase the number of equity securities issuable upon conversion. Preferred shares, if issued, could have a preference with respect to liquidating distributions or a preference with respect to dividend payments that could limit our ability to pay dividends to the holders of our common stock. Our decision to issue securities in any future offering will depend on market conditions and other factors beyond our control, which may adversely affect the amount, timing or nature of our future offerings.
The market price of our common stock could be negatively affected by sales of substantial amounts of our common stock in the public markets.
After the IPO, there were initially 25,769,236 shares of our common stock outstanding. Of our issued and outstanding shares, all the shares of common stock sold in the IPO are freely transferable, except for any shares held by our “affiliates,” as that term is defined in Rule 144 under the Securities Act.
Each of our executive officers, directors and Stonegate Investors Holdings has entered into a lock-up agreement with respect to shares of our common stock and securities exchangeable or exercisable for shares of our common stock, restricting the direct or indirect sale of such securities, subject to certain exceptions, for 180 days after the date of the IPO prospectus without the prior written consent of Merrill Lynch, Pierce, Fenner & Smith Incorporated. Additionally, our other shareholders who purchased common stock in our May 2013 private offering have agreed with us, subject to certain exceptions, not to directly or indirectly sell, offer to sell, grant any option or otherwise transfer or dispose of our common stock for 60 days after the date of the IPO prospectus. We have agreed not to waive or otherwise modify this agreement without the prior written consent of Merrill Lynch, Pierce, Fenner & Smith Incorporated, Merrill Lynch, Pierce, Fenner & Smith Incorporated may, at any time, release, or authorize us to release, as the case may be, all or a portion of our common stock subject to the foregoing lock-up provisions. If the restrictions under the lock-up agreements are waived, shares of our common stock may become available for sale into the market, subject to applicable law, which could reduce the market price for our common stock.
The future issuance of additional common stock in connection with our incentive plans, acquisitions or otherwise will dilute all other stockholdings.
We have an aggregate of 71,889,042 shares of common stock authorized but unissued and not reserved for issuance under our incentive plans and upon the exercise of outstanding warrants. We may issue all of these shares of common stock without any action or approval by our shareholders, subject to certain exceptions. We
-43-
Table of Contents
also intend to continue to evaluate acquisition opportunities and may issue common stock in connection with these acquisitions. Any common stock issued in connection with our incentive plans, acquisitions, the exercise of outstanding stock options or otherwise, will dilute the percentage ownership held by the investors who purchase common stock in the IPO and reduce the number of authorized shares available for future issuance. Additionally, our Articles permit our Board of Directors to issue up to 25,000,000 of preferred shares on terms which will be set by the Board of Directors at the time of issuance of such preferred shares.
As a public company, we will incur additional costs and face increased demands on our management.
As a public company with shares listed on a U.S. exchange, we will need to comply with an extensive body of regulations that did not apply to us previously, including provisions of the Sarbanes-Oxley Act, regulations of the SEC and requirements of the NYSE. We expect these rules and regulations to increase our legal and financial compliance costs and to make some activities more time-consuming and costly, particularly after we are no longer an emerging growth company. For example, as a result of becoming a public company, we intend to add independent directors, create additional board committees and adopt certain policies regarding internal controls and disclosure controls and procedures. In addition, we will incur additional costs associated with our public company reporting requirements and maintaining directors’ and officers’ liability insurance. We are currently evaluating and monitoring developments with respect to these rules, which may impose additional costs on us and materially affect our business, financial condition and results of operations.
-44-
Table of Contents
CAUTIONARY NOTE CONCERNING FORWARD-LOOKING STATEMENTS
Various statements contained in this prospectus, including those that express a belief, expectation or intention, as well as those that are not statements of historical fact, are forward-looking statements. These forward-looking statements may include projections and estimates concerning the timing and success of specific projects and our future production, revenues, income and capital spending. Our forward- looking statements are generally accompanied by words such as “estimate,” “project,” “predict,” “believe,” “expect,” “intend,” “anticipate,” “potential,” “plan,” “goal” or other words that convey the uncertainty of future events or outcomes. The forward-looking statements in this prospectus speak only as of the date of this prospectus; we disclaim any obligation to update these statements unless required by law, and we caution you not to rely on them unduly. We have based these forward-looking statements on our current expectations and assumptions about future events. While our management considers these expectations and assumptions to be reasonable, they are inherently subject to significant business, economic, competitive, regulatory and other risks, contingencies and uncertainties, most of which are difficult to predict and many of which are beyond our control. These and other important factors, including those discussed under “Risk Factors” may cause our actual results, performance or achievements to differ materially from any future results, performance or achievements expressed or implied by these forward-looking statements. These risks, contingencies and uncertainties include, but are not limited to, the following:
| • | our ability to compete successfully in the highly competitive mortgage loan servicing and mortgage loan origination industries; |
| • | experiencing financial difficulties like some originators and mortgage servicers have experienced; |
| • | adverse changes in the residential mortgage market; |
| • | our ability to obtain sufficient capital to meet our operating requirements; |
| • | our ability to grow our loan origination volume; |
| • | the geographic concentration of our servicing portfolio may result in a higher rate of delinquencies and/or defaults; |
| • | our mortgage financing business is subject to risks, including the risk of default and competitive risks; |
| • | our estimates may prove to be imprecise and result in significant changes in financial performance, including valuation; |
| • | the impact on our business of federal, state and local laws and regulations concerning loan servicing, loan origination, loan modification or the licensing of individuals and entities that engage in these activities; |
| • | changes in existing U.S. government-sponsored mortgage programs; |
| • | changes in laws and regulations affecting the relationship between Fannie Mae and Freddie Mac and the U.S. federal government, along with the conservatorship of Fannie Mae and Freddie Mac and related efforts; |
| • | substantial compliance costs arising from state licensing and operational requirements; |
| • | loss of our licenses or failure to obtain licenses in new markets; |
-45-
Table of Contents
| • | our ability to originate and/or acquire mortgage servicing rights; |
| • | our ability to recover our significant investments in personnel and our technology platform; |
| • | the implementation of our proprietary loan due diligence, scoring and decision platform on schedule, which is still in the process of being refined and implemented; |
| • | the accuracy and completeness of information we receive about borrowers and counterparties; |
| • | a significant change in delinquencies and/or defaults for the mortgage loans we service; |
| • | our ability to recapture mortgage loans from borrowers who refinance; |
| • | changes in prevailing interest rates and any corresponding effects on origination volumes or the value of our assets; |
| • | our rapid growth may be difficult to sustain and manage and may place significant demands on our administrative, operational and financial resources; |
| • | our ability to identify and complete acquisitions of retail mortgage originators and other businesses; |
| • | our ability to realize all of the anticipated benefits of our acquisitions; |
| • | the change of control rules under Section 382 of the Code may limit our ability to use net operating loss carryforwards to reduce future taxable income; |
| • | failure to establish and maintain an effective system of internal controls; |
| • | errors in our financial models or changes in assumptions; |
| • | our ability to adapt to and implement technological changes; |
| • | the impact of the ongoing implementation of the Dodd-Frank Act on our business activities and practices, costs of operations and overall results of operations; |
| • | state or federal governmental examinations, legal proceedings or enforcement actions and related costs; |
| • | increased costs and related losses if a borrower challenges the validity of a foreclosure action, if a court overturns a foreclosure or if a foreclosure subjects us to environmental liabilities; |
| • | the impact of the termination of our servicing rights by counterparties; |
| • | federal and state legislative and Agency initiatives in mortgage-backed securities and securitization; |
| • | we may be required to indemnify purchasers of the loans we originate or of the MBS backed by such loans or repurchase the related loans, if the loans fail to meet certain criteria or characteristics or under other circumstances; |
| • | our inability to negotiate our fees with GSEs for the purchase of our loans; |
| • | delays in our ability to collect or be reimbursed for servicing advances; |
-46-
Table of Contents
| • | our ability to successfully mitigate our risks through hedging strategies; |
| • | our ability to obtain servicer ratings in a timely manner, or at all; |
| • | failure of our internal security measures or breach of our privacy protections; |
| • | losses due to fraudulent and negligent acts on the part of loan applicants, brokers, other vendors, existing customers, our employees and other third parties; |
| • | failure of our vendors to comply with servicing criteria; |
| • | the loss of the services of one or more of the members of our executive management team; |
| • | failure to attract and retain a highly skilled work force; |
| • | the offering price per share of common stock offered under this prospectus may not accurately reflect the value of your investment; |
| • | an active trading market for our stock may never develop or be sustained; |
| • | future sales of our common stock or other securities convertible into our common stock could cause the market value of our common stock to decline and could result in dilution; and |
| • | future offerings of debt securities or preferred stock and future offerings of equity securities that may be senior to our common stock for the purposes of dividend and liquidating distributions, may adversely affect the market price of our common stock. |
-47-
Table of Contents
We are registering these shares of common stock for resale by the selling shareholders. We will not receive any proceeds from the sale of the shares offered by this prospectus. The net proceeds from the sale of the shares offered by this prospectus will be received by the selling shareholders.
-48-
Table of Contents
We do not expect to pay dividends on our common stock for the foreseeable future. Instead, we anticipate that all of our earnings in the foreseeable future will be used for the operation and growth of our business.
Any future determination to pay dividends on our common stock will be at the discretion of our Board of Directors and will depend upon many factors, including our financial position, results of operations, liquidity, legal requirements, restrictions that may be imposed by the terms in current and future financing instruments to which we are a party, and other factors deemed relevant by our Board of Directors.
-49-
Table of Contents
SELECTED HISTORICAL FINANCIAL DATA
The following tables present selected financial information of Stonegate. The selected statement of operations data for the years ended December 31, 2012 and 2011 and the selected balance sheet data December 31, 2012 and 2011 has been derived from our audited financial statements included elsewhere in this prospectus. The statement of operations data for the nine months ended September 30, 2013 and 2012 and the balance sheet data as of September 30, 2013 have been derived from unaudited financial statements of Stonegate Mortgage Corporation included elsewhere in this prospectus. The unaudited financial statements of Stonegate Mortgage Corporation have been prepared on substantially the same basis as the audited financial statements and include all adjustments that we consider necessary for a fair presentation of our financial position and results of operations for all periods presented. Amounts presented for basic and diluted earnings per share reflect the impact of our stock dividend of 12.861519 additional shares of our common stock for each share of our common stock that was outstanding on May 14, 2013.
You should read these tables along with “Management’s Discussion and Analysis of Financial Condition and Results of Operations,” “Our Business” and our financial statements and the related notes included elsewhere in this prospectus.
| Nine Months Ended September 30, |
Year Ended December 31, |
|||||||||||||||
| (in thousands, except per share data) | 2013 |
2012 |
2012 |
2011 |
||||||||||||
| (unaudited) | (unaudited) | |||||||||||||||
| Statement of Operations Data |
||||||||||||||||
| Revenues: |
||||||||||||||||
| Gains on mortgage loans held for sale |
$ | 63,791 | $ | 47,709 | $ | 73,337 | $ | 16,735 | ||||||||
| Fee income |
29,962 | 9,994 | 15,779 | 6,916 | ||||||||||||
| Changes in MSR valuation |
11,649 | — | — | — | ||||||||||||
| Other income |
11,106 | 4,330 | 6,429 | 2,371 | ||||||||||||
|
|
|
|
|
|
|
|
|
|||||||||
| Total revenues |
116,508 | 62,033 | 95,545 | 26,022 | ||||||||||||
|
|
|
|
|
|
|
|
|
|||||||||
| Expenses: |
||||||||||||||||
| Salaries, commissions and benefits |
48,604 | 21,202 | 32,737 | 13,085 | ||||||||||||
| General and administrative |
15,026 | 4,429 | 7,705 | 3,163 | ||||||||||||
| Interest expense |
10,972 | 3,734 | 6,239 | 2,728 | ||||||||||||
| Amortization of MSRs |
— | 2,584 | 3,680 | 960 | ||||||||||||
| Impairment of MSRs |
— | 5,522 | 11,698 | 2 | ||||||||||||
| Other expenses |
8,886 | 3,008 | 5,677 | 2,050 | ||||||||||||
|
|
|
|
|
|
|
|
|
|||||||||
| Total expenses |
83,488 | 40,479 | 67,736 | 21,988 | ||||||||||||
|
|
|
|
|
|
|
|
|
|||||||||
| Income before income taxes |
33,020 | 21,554 | 27,809 | 4,034 | ||||||||||||
| Income taxes |
12,487 | 8,120 | 10,724 | 1,699 | ||||||||||||
|
|
|
|
|
|
|
|
|
|||||||||
| Net income |
$ | 20,533 | $ | 13,344 | $ | 17,085 | $ | 2,335 | ||||||||
|
|
|
|
|
|
|
|
|
|||||||||
| Basic earnings per share |
$ | 1.97 | $ | 4.13 | $ | 5.31 | $ | 0.70 | ||||||||
|
|
|
|
|
|
|
|
|
|||||||||
| Diluted earnings per share |
$ | 1.42 | $ | 1.95 | $ | 2.26 | $ | 0.59 | ||||||||
|
|
|
|
|
|
|
|
|
|||||||||
| September 30, |
December 31, |
|||||||||||
| (in thousands) | 2013 |
2012 |
2011 |
|||||||||
| (unaudited) | ||||||||||||
| Balance Sheet Data |
||||||||||||
| Cash and cash equivalents |
24,564 | $ | 15,056 | $ | 403 | |||||||
| Mortgage loans held for sale, at fair value |
518,858 | 218,624 | 61,729 | |||||||||
| MSRs, at fair value |
132,907 | — | — | |||||||||
| MSRs, at lower of amortized cost or fair value |
— | 42,202 | 17,679 | |||||||||
| Total assets |
748,929 | 309,606 | 89,108 | |||||||||
| Secured borrowings |
272,610 | 102,675 | 57,894 | |||||||||
| Warehouse lines of credit |
194,709 | 100,301 | — | |||||||||
| Total liabilities |
564,991 | 254,357 | 78,692 | |||||||||
| Total stockholders’ equity |
183,938 | 55,249 | 10,415 | |||||||||
-50-
Table of Contents
MANAGEMENT’S DISCUSSION AND ANALYSIS OF FINANCIAL CONDITION AND RESULTS OF OPERATIONS
The following Management’s Discussion and Analysis of Financial Condition and Results of Operations (“MD&A”) should be read together with our financial statements and related notes and other financial information appearing elsewhere in this prospectus. This MD&A contains forward-looking statements that involve risk, uncertainties and assumptions. See “Cautionary Note Concerning Forward-Looking Statements.” Our actual results could differ materially from those anticipated in the forward-looking statements as a result of many factors, including those discussed in “Risk Factors” and elsewhere in this prospectus. As used in this discussion and analysis, unless the context otherwise requires or indicates, references to “the Company,” “our company,” “we,” “our” and “us” refer to Stonegate Mortgage Corporation.
Overview
We are a specialty financial services firm that operates in one segment: Mortgage Banking. This determination is based on our current organizational structure, which reflects how our chief operating decision maker evaluates the performance of our business.
Our Company
We are a leading, non-bank, integrated mortgage company focused on efficiently and effectively originating, acquiring, selling, financing and servicing U.S. residential mortgage loans. We are also one of the fastest growing non-bank mortgage originators, having grown origination volume by 209% during the nine months ended September 30, 2013 as compared to the nine months ended September 30, 2012. Our origination volume increased 12%, to $2.3 billion, during the three months ended September 30, 2013 from $2.1 billion in originations in the three months ended June 30, 2013 and grew 123% from origination volume of $1.1 billion in the three months ended September 30, 2012. Our loan originations are primarily sourced through our network of retail branches and through our relationships with approximately 1,000 TPOs as of September 30, 2013. For the nine months ended September 30, 2013, we originated $6.3 billion in loans ($2.3 billion of which were originated in the three months ended September 30, 2013) and, as of September 30, 2013, we serviced a portfolio with an unpaid principal balance of $9.7 billion, an increase of 28% from the June 30, 2013 ending unpaid principal balance of $7.6 billion, and an increase of 229% over the unpaid principal balance at September 30, 2012 of $2.9 billion.
We attribute our growth to our vertically integrated and scalable mortgage banking platform, which we believe enables us to efficiently and effectively originate, acquire, sell, finance and service residential mortgage loans, and to our on-going geographic and product expansion. Since January 1, 2012, we have expanded our business into 18 additional states and Washington, D.C., added approximately 960 correspondent and wholesale customers, opened or acquired 19 retail branch offices and as a result increased our origination volume substantially. We also recently launched additional mortgage products, including our mortgage financing business, through a wholly-owned operating subsidiary, NattyMac, which will complement our growth. We focus on originating mortgage loans associated with the purchase of residential real estate, representing 53% of our originations for the twelve months ended September 30, 2013, as opposed to the refinancing of existing mortgage loans.
Since June 2013, the U.S. residential mortgage industry has experienced an increase in interest rates. Industry-wide mortgage loan originations have declined as the recent increase in interest rates has made the refinancing of mortgage loans less attractive for borrowers. Increasing interest rates can have a direct impact on the operating results of companies in the mortgage industry, including on our operating results. Our revenues decreased 27%, to $32.3 million, in the three months ended September 30, 2012 from $44.3 million in the three months ended June 30, 2013. We believe our third quarter results reflect solid business execution during a period of rising interest rates and underscore the strength of our differentiated, vertically integrated and scalable mortgage banking platform. Our three lines of business—mortgage originations, mortgage servicing and mortgage financing—complement each other and create a natural hedge against interest rate volatility and business cyclicality, an important factor in our performance.
-51-
Table of Contents
We were founded in 2005 by members of our executive team who held various senior level executive positions at large mortgage companies and financial institutions. The loans we originate, finance and service conform to the requirements of GSEs, such as Fannie Mae and Freddie Mac, as well as government agencies, such as Ginnie Mae, the FHA, the VA, and private investors. We utilize proprietary technology to automate many of our core processes, which allows us to perform a high level of risk-based due diligence on each loan. We have also automated various aspects of quality control and regulatory compliance risk processes, which allows us to ensure adherence to credit, compliance and collateral standards of the GSEs and other investors. We believe that our expertise and the strength of our mortgage platform is best demonstrated by our exceptional track record as a mortgage originator and servicer, coupled with our ability to scale operations without compromising the quality of originated and serviced loans. As a result of our strong operating, technology and underwriting procedures that we apply consistently to each loan, we have not incurred any material losses related to repurchase or indemnification demands from the GSEs or other investors in our loans. We believe our lack of legacy issues and our focus on purchase versus refinance mortgages has positioned us as one of the leading non-bank integrated mortgage origination and servicing providers capable of taking advantage of growth opportunities in the mortgage sector.
Recent Events
Acquisition of Crossline Capital, Inc. On December 20, 2013, we acquired Crossline Capital, Inc., or Crossline, a California-based mortgage lender that originates and services residential mortgages. The acquisition of Crossline allows us to increase our retail origination volume through “tuck-in” acquisition. Crossline is licensed to originate mortgages in 20 states including Arizona, California, Colorado, Connecticut, Florida, Georgia, Idaho, Maryland, Massachusetts, New Hampshire, New Mexico, North Carolina, Ohio, Oregon, Pennsylvania, Rhode Island, Texas, Utah, Virginia and Washington, and is an approved FNMA Seller Servicer. In addition, Crossline operates two national mortgage origination call centers in Lake Forest, California and Scottsdale, Arizona and also operates retail mortgage origination branches in seven other locations in Southern California. The purchase price for Crossline, which, along with working capital for the business, is being funded out of our existing cash resources and line of credit facilities with our warehouse lenders, was approximately $9.4 million.
Acquisition of Wholesale Channel and Retail Assets from Nationstar Mortgage Holdings, Inc. On November 29, 2013, we acquire the wholesale lending channel and certain distributed retail assets of Nationstar Mortgage Holdings Inc., or Nationstar. The acquisition of Nationstar’s wholesale lending channel and retail assets complement our existing wholesale and retail channels and accelerates our geographic retail channel expansion. In the acquisition, we agreed to purchase the assets and offer employment to certain employees associated with these businesses. The purchase price for the assets acquired from Nationstar was approximately $0.5 million, which, along with working capital for the business, is being funded out of our existing cash resources and line of credit facilities with our warehouse lenders.
Initial Public Offering. On October 16, 2013, we sold our common stock in our IPO. We realized net proceeds of approximately $120.9 million from the IPO, after deducting underwriting discounts and commissions and estimated offering expenses payable by us. We intend to use the net proceeds from the IPO to make investments relating to our business and for general corporate purposes.
Our Business
We are an integrated mortgage company that derives revenue from three principal sources: mortgage origination, mortgage financing and mortgage servicing. Our mortgage origination business generates income primarily through origination fees and gains upon the sale of mortgage loans sourced through our correspondent, wholesale and retail channels. We also provide financing to our correspondent customers and others while they are accumulating loans prior to selling them to Aggregators, including ourselves, through our mortgage financing business and we earn interest and fee income for these services. We also have the ability to retain the MSRs on
-52-
Table of Contents
the loans we sell and to create a recurring servicing income stream in our mortgage servicing business. We believe our three business lines are complementary and provide us with the ability to effectively and efficiently source, finance, sell and service mortgage loans.
Mortgage Originations
Our mortgage origination business primarily originates and sells residential mortgage loans, which conform to the underwriting guidelines of the GSEs and government agencies. We also originate and sell jumbo loans, i.e., loans that conform to the underwriting guidelines of the GSEs, except that they exceed the maximum loan size allowed for single unit properties. We expect that as the non-Agency market continues to recover and GSE reform is approved and implemented, a larger proportion of the industry volume will be comprised of non-Agency mortgage loans. We believe we are well positioned to benefit from this shift in the market given our business model and management expertise in originating and securitizing non-Agency mortgage loans.
We are currently licensed in 39 states and Washington, D.C. including six states (California, Montana, Oregon, Rhode Island, Virginia and Washington) where we have become licensed since June 30, 2013. We intend to become licensed in all 48 of the contiguous United States in the first half of 2014. The nine states in which we are not licensed, including six states where we have a pending license application, represented approximately 15% of the overall residential mortgage origination market in 2012 and the five states where we have become licensed since June 30, 2013, represented approximately 30% of the overall residential mortgage origination market in 2012. As we become licensed in these additional states and as we increase our origination activity in the states where we have only recently become licensed, we believe our origination volume will increase substantially. Economic and housing and mortgage market conditions can vary significantly from one geographic region to another; therefore, the geographic distribution of our mortgage originations can have a direct impact on the overall performance of our servicing portfolio. As of September 30, 2013, approximately 14%, 10% and 9% of the aggregate outstanding loan balances in our servicing portfolio were concentrated in Texas, Indiana and Ohio, respectively. Although we anticipate that our origination and servicing portfolios will become less geographically concentrated over time as we expand our operations into the additional nine states where we are not currently licensed and the states where we have only recently become licensed, the geographic distribution of the mortgage loans we originate and service in the near term will likely be similar to that of our current servicing portfolio. To the extent the states where we have a higher concentration of loans experience weaker economic conditions, greater rates of decline in single family residential real estate values or reduced demand within the residential mortgage sector relative to the United States generally, the risks inherent in our business would be magnified as compared to our competitors that have a broader and less concentrated geographic footprint.
Additionally, since inception, we have focused on originating mortgage loans associated with purchase transactions as opposed to refinancings to a greater degree than many industry participants. During 2012, approximately 45% of our loan originations were purchase loans and approximately 55% were refinance transactions, compared to 29% and 71%, respectively, for the industry as a whole. We believe purchase transactions are more sustainable than refinance transactions, and typically have slower prepayment speeds in early years, making the MSRs more valuable and less volatile. Additionally, we believe that the mortgage market will increasingly shift to purchase mortgages as the housing market continues to recover, first time home buyers re-enter the housing market and interest rates increase. Further, as the non-Agency market continues to recover, we believe that our platform and management expertise in originating and securitizing these mortgages will position us well to benefit from this transformation.
We originate residential mortgage loans through three channels: correspondent, wholesale and retail. Although the majority of our originations are currently through our correspondent channel, our presence in the wholesale and retail channels makes our platform both diversified and scalable. While the channels are diverse, we constantly focus on quality control and maintaining high underwriting standards. We perform diligence on and underwrite loans through our proprietary technology platform, OLIE, an integrated, automated risk-based
-53-
Table of Contents
due diligence engine that automates the review process by applying business rules specific to the loan and the seller. We analyze credit, collateral and compliance risk on every loan on a pre-funding or a pre-purchase basis in order to ensure that each loan meets our investors’ standards and any applicable regulatory rules. We also capture loan data and documents associated with the loan from application through sale/securitization and servicing, giving us the ability to run additional business rules that provide indication of loan performance. We believe that the ability to offer greater transparency and data to institutional investors that purchase our loans or securities backed by our loans will provide us with a substantial advantage over our competitors in our sales executions as the mortgage market continues to evolve and we begin to securitize our own non-Agency mortgage loans.
Our three mortgage loan originations channels are discussed in more detail below.
Correspondent Channel
We acquire newly originated loans conforming to the underwriting standards of the GSEs or government agencies as well as non-Agency mortgage loans conforming to the standards of our investors from our network of correspondents across 39 states plus Washington, D.C. We identify our correspondent customers through a team of relationship managers who are responsible for signing-up customers and ensuring that we receive an adequate share of their origination volume. In addition to competitive pricing, we offer our correspondents access to a state-of-the-art technology platform, funding through our financing platform (NattyMac), including access to innovative financing programs such as early purchase facilities, as well as a timely and transparent process of acquiring their loans. In return, our correspondents provide us with high quality products that meet our underwriting standards. We track the performance of our correspondents on a score-card and terminate relationships where quality and other requirements are not met. We believe that our programs offer correspondents an attractive value proposition, including greater access to capital and liquidity, as they seek to maintain and grow their businesses. As a testament to our relationship management and product offering, our correspondent origination volume has increased from $1.2 billion in the nine months ended September 30, 2012 to $4.6 billion in the nine months ended September 30, 2013, or by 283%, including a 19% increase from $1,488.6 million in the second quarter of 2013 to $1,766.3 in the third quarter of 2013.
Our growth has been driven by adding new correspondents as well as deepening relationships with existing correspondents. Our correspondent channel represented 73% of our mortgage originations for the nine months ended September 30, 2013. We conduct financial, operational and risk reviews of each correspondent prior to initially approving them as a customer and on an annual basis to ensure compliance with our guidelines and those of the various regulators who govern our business. In addition we conduct background and financial reviews of the principals and their mortgage loan officers, and in some cases require personal guarantees. We believe that as we receive licenses in additional states and continue to increase our coverage of correspondents, we will continue to increase our market share.
Wholesale Channel
Through our wholesale channel, we originate loans through a network of approximately 490 non-exclusive relationships with various approved mortgage companies and mortgage brokers. Mortgage brokers identify applicants, help them complete a loan application, gather required information and documents, and act as our liaison with the borrower during the lending process. We review and underwrite an application submitted by a broker, accept or reject the application, determine the range of interest rates and other loan terms, and fund the loan upon acceptance by the borrower and satisfaction of all conditions to the loan in much the same manner as our retail channel. By relying on brokers to market our products and assist the borrower throughout the loan application process, we can increase loan volume through our wholesale channel with proportionately lower increases in overhead costs compared with the costs of increasing loan volume through loan originations in our retail channels.
-54-
Table of Contents
We provide a variety of Agency, government insured and non-Agency mortgage loan products to our brokers to allow them to better service their borrowers. Before approving a mortgage broker for business, we focus on several attributes including origination volume, quality of originations and tangible net worth. We also conduct financial and background checks on the principals and their mortgage loan officers through various third-party sources and in some cases we require personal guarantees. Once we begin acquiring loans from our mortgage brokers, we track the performance of the loans on an on-going basis and terminate business relationships if the loans consistently do not perform or if there is evidence of misrepresentation. During the twelve months ended September 30, 2013, we did not terminate any significant relationships due to our continued focus on underwriting loans and ensuring compliance with policies.
Retail Channel
Our retail channel primarily operates through 40 retail offices across 14 states. In this channel, company representatives originate loans through their relationships with local real estate agents, builders, telemarketing and other local contacts. This channel accounted for 15% of our 2012 originations. We expect to continue to grow our retail channel by adding new branches for at least the next 24 months. In addition, we expect that with the continued transformation of the mortgage sector there will be opportunities to acquire small retail mortgage operators as several independent mortgage originators will lack the scale to profitably originate and sell mortgages. We believe that we could provide a solution to such operators by acquiring and integrating them into our branch network. We are currently actively evaluating opportunities to acquire several of these retail originators and believe that the continued development and growth of our retail channel is central to our business strategy.
Financing
We acquired our financing platform, known as NattyMac, in August 2012, and fully integrated the platform into our mortgage banking operations in December of 2012. Founded in 1994, NattyMac earlier operated as an independent mortgage warehouse lender focused on financing prime mortgage collateral, such as Agency-eligible, government insured and government guaranteed loans that were committed for purchase by GSEs. Following our acquisition, in June 2013, we consolidated our NattyMac financing platform into a wholly-owned subsidiary which will focus on providing warehouse financing to us, our correspondent customers and others. We expect that NattyMac will be able to leverage our proprietary technology (OLIE) and our existing due diligence and underwriting processes to efficiently underwrite the warehouse lines of credit it provides for our correspondents who are its customers and others. We intend for this to create an additional source of funding for our correspondents to originate mortgage loans that meet our underwriting requirements and are eligible for us to purchase.
Our financing platform features a centralized custodian and disbursement agent allowing us to enter into participation arrangements with financial institutions, such as regional banks for an interest in our newly originated loans during the time these loans would otherwise be funded by a warehouse line or traditional repurchase facility. Additionally, by offering regional banks an opportunity to invest in a liquid high-quality asset, we are able to earn fee and net interest income. We believe that regional banks continue to have significant appetite for such investment opportunities and we believe our financing platform allows us to compete with bank-owned mortgage lenders who have access to cheaper deposit funding. We believe this is a competitive advantage over other non-bank mortgage originators and servicers who are reliant on other forms of wholesale financing to fund their operations.
Mortgage Servicing
Our mortgage servicing business is organized to maintain a high quality servicing portfolio and keep delinquency rates far below the industry average. We perform loan administration, collection and default
-55-
Table of Contents
activities, including the collection and remittance of loan payments, responding to customer inquiries, accounting for principal and interest, holding custodial (impound) funds for the payment of property taxes and insurance premiums, counseling delinquent mortgagors, modifying loans and supervising foreclosures and our property dispositions.
Our servicing model is also very focused on “recapture,” which involves actively working with existing borrowers to refinance their mortgage loans. When a loan is paid off or refinanced with a different lender, we lose the servicing fees on the loan, so our ability to recapture loans successfully is important to the longevity of our servicing cash flows. Because the refinanced loans typically have lower interest rates or lower monthly payments, and, in general, subsequently refinance more slowly and default less frequently, these refinancings also typically improve the overall quality of our servicing portfolio. For the twelve months ended September 30, 2013, we recaptured 33% of our payoffs (based on the dollar amount of refinanced mortgage loans).
Our servicing business produces strong recurring, contractual fee-based revenue with minimal credit risk. Servicing fees are primarily based on the aggregate UPB of the loans serviced and the payment structure varies by loan source and type. These include differences in rate of servicing fees as a percentage of UPB and in the structure of advances. We believe our origination business gives us a distinct advantage in building a high-quality portfolio of MSRs over those who rely heavily on purchasing MSRs from others to build their portfolios as originated portfolios generally perform better given the extensive diligence and underwriting procedures that we apply to each loan.
We service loans using a model designed to improve loan performance and reduce loan defaults and foreclosures. Our servicing portfolio consists of MSRs we retain from loans that we originate and MSRs we acquire from third party originators, including in transactions facilitated by GSEs, such as Fannie Mae and Freddie Mac. The loans we service are typically securitized by us, i.e., the loans have been pooled together with multiple other loans and interests have been sold to third party investors that are secured by loans in the securitization pool. As of September 30, 2013, our servicing portfolio contained $9.7 billion of residential first mortgages, with a weighted average coupon of 3.71% and a weighted average age of 9 months. At September 30, 2013, the 90+ day delinquency rate in our servicing portfolio was 0.34%, the weighted average FICO score of our servicing portfolio was 740, and the adjusted CPR of our servicing portfolio as of September 30, 2013 was 5.80%.
Our Business Evolution
Since 2009, our mortgage banking platform has evolved in support of our business strategy. Prior to June 2009, all loans we originated were sold on a servicing-released basis into the secondary market, on either a best-efforts or assignment-of-trade basis. Our merger with Swain in 2009 allowed us to retain the servicing rights on a percentage of the mortgage loans we originated and/or acquired from our third party originators. The table below shows our origination volume during each period presented and servicing portfolio (by unpaid principal balance, or $UPB) at the end of each period presented:
| (in millions) | Nine Months Ended September 30, |
Year Ended December 31, |
||||||||||||||||||||||
| 2013 |
2012 |
2012 |
2011 |
2010 |
2009 |
|||||||||||||||||||
| Origination volume |
$ | 6,325 | $ | 2,050 | $ | 3,449 | $ | 1,050 | $ | 741 | $ | 386 | ||||||||||||
| Servicing ($UPB) |
$ | 9,683 | $ | 2,943 | $ | 4,145 | $ | 1,316 | $ | 624 | $ | 245 | ||||||||||||
-56-
Table of Contents
Our Integrated Business Model
Our integrated and scalable mortgage banking platform enables us to efficiently and effectively originate mortgage loans, generating gain on sale and fee income from the origination and servicing components of our business. We anticipate that our results of operations will be affected by various factors, some of which are beyond our control. Our principal sources of revenue include:
(i) gains on mortgage loans held for sale, including changes in the fair value of commitments to purchase or originate mortgage loans held for sale and the related hedging instruments;
(ii) fee and net interest income from our financing facility; and
(iii) fee income from loan servicing.
Origination. In evaluating revenue per mortgage loan originated, we focus on various revenue sources, including loan origination points and fees. We record gain on mortgage loans held for sale based on the terms of the originated mortgage loan or the price paid for purchased mortgage loans, the effect of any hedging activities that we undertake, the sales price of the mortgage loan and the value of any MSRs received in the transaction. Our gain on mortgage loans held for sale includes both cash and non-cash elements and realized gains (losses) associated with the mortgage loans held for sale and related derivative instruments. We recognize revenue on sale that include both cash and our estimate of the value of MSRs. These components are compared to established revenue targets and operating plans by channel.
In addition to the cost of financing our mortgage loan originations, operating costs associated with our originations component include staffing costs, sales commissions, technology, rent and other general and administrative costs.
Servicing. Servicing fee income is primarily based on the aggregate unpaid principal balance of mortgage loans serviced and varies by mortgage loan type. Other factors that impact servicing fee income include delinquency rates, prepayment speeds and loss mitigation activity. Delinquency rates on the mortgage loans we service impact the contractual servicing and ancillary fees we receive and the costs to service. Delinquent loans cost more to service than performing loans due to the additional resources and required servicing advances.
The largest cost in our servicing component is staffing cost, which is primarily impacted by delinquency levels and the size of our portfolio. Other operating costs in our servicing component include technology, occupancy, general and administrative costs and the cost of financing our servicing advances. We continually monitor these costs to improve efficiency by streamlining workflows and implementing technology-based solutions.
Subsequent to the acquisition of Swain, we also expanded various servicing operations in both Indianapolis, Indiana and Dallas, Texas, as well as invested in additional management, technology, process refinement, key vendor relationships and internal reporting/controls. These ongoing servicing platform investments allow us to drive efficiency and scalability, while maintaining customer service levels and regulatory compliance.
Financing. We earn fee income and net interest income from our mortgage financing business. For a warehouse line of credit, net interest income is the difference between the rate at which we lend funds to our customers and our borrowing costs. This spread is determined by a variety of factors, including credit quality of loan, term of the loan, prevailing interest rates, regulatory environment, and general competition. The larger the spread the higher the net interest income derived per loan. Conversely, very competitive environments, when the spread is narrower, result in lower net interest income.
-57-
Table of Contents
We intend for our financing business to provide an additional source of revenues through fee and interest income from warehouse funding to our correspondent customers. As of September 30, 2013, our financing business has commenced operations but has not generated any material revenues during the nine months ended September 30, 2013 or during the years ended December 31, 2012 and 2011.
Market Considerations
Origination. Today’s U.S. residential mortgage loan originations sector primarily offers conventional Agency and government conforming mortgage loans. Non-prime and alternative lending programs and products represent only a small fraction of total mortgage loan originations. This dynamic, along with increased capital requirements, increased regulatory and compliance burdens and increased risks associated with repurchase requirements, has led to a consolidation among mortgage lenders in both the retail and wholesale channels and has resulted in less competition. In addition to such consolidation, many mortgage loan originators have exited the market entirely.
Origination volume is impacted by changes in interest rates and the housing market. Depressed home prices and increased loan-to-value ratios may preclude many potential borrowers, including borrowers whose existing mortgage loans we service, from refinancing their existing mortgage loans. An increase in prevailing interest rates could decrease the originations volume.
In addition, there continue to be changes in legislation and licensing in an effort to simplify the consumer mortgage loan experience, which require technological changes and additional implementation costs for mortgage loan originators. We expect legislative changes will continue in the foreseeable future, which may increase our operating expenses. See “Our Business—Regulation.”
Servicing. Current trends in the mortgage servicing industry include elevated borrower delinquencies, a significant increase in loan modifications and the need for servicing expertise. In the aftermath of the 2008 U.S. financial crisis, the residential mortgage loan industry is undergoing major structural changes that affect the way residential mortgage loans are originated, owned and serviced. These changes have benefited and should continue to benefit non-bank mortgage servicers, such as us. Banks currently dominate the residential mortgage loan servicing industry, servicing over 90% of all residential mortgage loans as of December 31, 2012. Over 50% of all residential mortgage loan servicing was concentrated among just four banks as of December 31, 2012. However, banks are currently under tremendous pressure to exit or reduce their exposure to the mortgage loan servicing business as a result of increased regulatory scrutiny and capital requirements, as well as potentially significant earnings volatility.
Non-GAAP Financial Measures
Our results of operations discussed throughout this MD&A are determined in accordance with U.S. generally accepted accounting principles (“GAAP”). We also calculate adjusted revenues, adjusted net income and adjusted diluted EPS as performance measures, which are considered non-GAAP financial measures, to further aid our investors in understanding and analyzing our core operating results and comparing them among periods. Adjusted revenues exclude non-cash fair valuation adjustments related to our mortgage loans held for sale and related derivative assets and liabilities, as well as the bargain purchase gain from our 2012 acquisition of NattyMac, which we do not consider part of our core revenues. Adjusted net income and adjusted diluted EPS also exclude certain items that we do not consider part of our core operating results including expenses related to the financing of our term loan, certain other non-cash expense items and ramp-up costs associated with the launch of our non-agency jumbo loan origination program. These ramp-up costs include the advance hiring of servicing and originations staff, recruiting expenses, travel, licensing and legal expenses. In addition, adjusted net income excludes certain other non-routine income and expenses, primarily non-deferrable expenses associated with our private equity and initial public offerings and acquisition costs related to NattyMac. These non-GAAP financial measures are not intended to be considered in isolation or as a substitute for total revenues, income before income taxes, net income or diluted EPS prepared in accordance with GAAP.
-58-
Table of Contents
In addition, adjusted net income has limitations as an analytical tool, including but not limited to the following:
| • | adjusted net income does not reflect our cash expenditures or future requirements for capital expenditures or contractual commitments; |
| • | adjusted net income does not reflect changes in, or cash requirements for, our working capital needs; |
| • | adjusted net income does not reflect the cash requirements necessary to service principal payments related to the financing of the business; and |
| • | other companies in our industry may calculate adjusted net income differently, thereby limiting its usefulness as a comparative measure. |
Because of these and other limitations, adjusted net income should not be considered as a measure of discretionary cash available to us to invest in the growth of our business. Adjusted net income is a performance measure and is presented to provide additional information about our core operations.
-59-
Table of Contents
The table below reconciles net income to adjusted net income and diluted net income per share to adjusted diluted net income per share (which are the most directly comparable GAAP measures) for the nine months ended September 30, 2013 and 2012 and for the years ended December 31, 2012 and 2011:
| (In thousands, except per share data) |
Nine Months Ended | Year Ended | ||||||||||||||
| 9/30/2013 |
9/30/2012 |
12/31/2012 |
12/31/2011 |
|||||||||||||
| Total revenues |
$ | 116,508 | $ | 62,033 | $ | 95,545 | $ | 26,022 | ||||||||
| Adjustments: |
||||||||||||||||
| Changes in mortgage servicing rights valuation |
(11,649 | ) | — | — | — | |||||||||||
| Non-cash fair value adjustment for mortgage loans pipeline |
8,548 | (10,987 | ) | (11,454 | ) | (3,213 | ) | |||||||||
| NattyMac bargain purchase gain |
— | (1,172 | ) | (1,172 | ) | — | ||||||||||
|
|
|
|
|
|
|
|
|
|||||||||
| Adjusted revenues |
$ | 113,407 | $ | 49,874 | $ | 82,919 | $ | 22,809 | ||||||||
|
|
|
|
|
|
|
|
|
|||||||||
| Net income |
$ | 20,533 | $ | 13,344 | $ | 17,085 | $ | 2,335 | ||||||||
| Adjustments: |
||||||||||||||||
| Interest expense associated with term loan |
1,587 | — | — | — | ||||||||||||
| Changes in mortgage servicing rights valuation |
(11,649 | ) | — | — | — | |||||||||||
| Impairment of mortgage servicing rights |
— | 5,522 | 11,698 | 2 | ||||||||||||
| Amortization of mortgage servicing rights |
— | 2,584 | 3,680 | 960 | ||||||||||||
| Non-cash fair value adjustment for mortgage loans pipeline |
8,548 | (10,987 | ) | (11,454 | ) | (3,213 | ) | |||||||||
| Stock-based compensation expense |
1,742 | 7 | 13 | — | ||||||||||||
| Ramp-up and other non-routine expenses |
2,139 | — | — | — | ||||||||||||
| NattyMac bargain purchase gain |
— | (1,172 | ) | (1,172 | ) | — | ||||||||||
| NattyMac acquisition costs |
— | 406 | 406 | — | ||||||||||||
| Tax effect of adjustments |
(895 | ) | 1,387 | (1,224 | ) | 948 | ||||||||||
|
|
|
|
|
|
|
|
|
|||||||||
| Adjusted net income |
$ | 22,005 | $ | 11,091 | $ | 19,032 | $ | 1,032 | ||||||||
|
|
|
|
|
|
|
|
|
|||||||||
| Diluted EPS |
$ | 1.42 | $ | 1.95 | $ | 2.26 | $ | 0.59 | ||||||||
| Adjustments: |
||||||||||||||||
| Interest expense associated with term loan |
0.11 | — | — | — | ||||||||||||
| Changes in mortgage servicing rights valuation |
(0.81 | ) | — | — | — | |||||||||||
| Impairment of mortgage servicing rights |
— | 0.82 | 1.56 | — | ||||||||||||
| Amortization of mortgage servicing rights |
— | 0.38 | 0.49 | 0.27 | ||||||||||||
| Non-cash fair value adjustment for mortgage loans pipeline |
0.59 | (1.62 | ) | (1.52 | ) | (0.91 | ) | |||||||||
| Stock-based compensation expense |
0.12 | — | — | — | ||||||||||||
| Ramp-up and other non-routine expenses |
0.15 | — | — | — | ||||||||||||
| NattyMac bargain purchase gain |
— | (0.17 | ) | (0.16 | ) | — | ||||||||||
| NattyMac acquisition costs |
— | 0.06 | 0.06 | — | ||||||||||||
| Tax effect of adjustments |
(0.06 | ) | 0.22 | (0.16 | ) | 0.27 | ||||||||||
|
|
|
|
|
|
|
|
|
|||||||||
| Adjusted diluted EPS |
$ | 1.52 | $ | 1.64 | $ | 2.53 | $ | 0.22 | ||||||||
|
|
|
|
|
|
|
|
|
|||||||||
-60-
Table of Contents
Results of Operations
Three Months Ended September 30, 2013 Compared to Three Months Ended September 30, 2012
Our consolidated results of operations for the three months ended September 30, 2013 and 2012 are as follows:
| Three Months Ended September 30, |
||||||||||||||||
| 2013 |
2012 |
$ Change |
% Change |
|||||||||||||
| Gains on mortgage loans held for sale |
$ | 13,216 | $ | 24,240 | $ | (11,024 | ) | (45 | )% | |||||||
| Changes in mortgage servicing rights valuation |
2,099 | — | 2,099 | N/A | ||||||||||||
| Loan origination and other loan fees |
5,640 | 2,919 | 2,721 | 93 | % | |||||||||||
| Loan servicing fees |
5,966 | 1,504 | 4,462 | 297 | % | |||||||||||
| Interest income |
5,359 | 1,574 | 3,785 | 240 | % | |||||||||||
| Other revenue |
— | 1,172 | (1,172 | ) | (100 | )% | ||||||||||
|
|
|
|
|
|
|
|||||||||||
| Total revenues |
32,280 | 31,409 | 871 | 3 | % | |||||||||||
| Salaries, commissions and benefits |
16,477 | 9,160 | 7,317 | 80 | % | |||||||||||
| General and administrative |
6,131 | 1,913 | 4,218 | 220 | % | |||||||||||
| Interest expense |
3,297 | 1,798 | 1,499 | 83 | % | |||||||||||
| Occupancy, equipment and communications |
2,980 | 676 | 2,304 | 341 | % | |||||||||||
| Impairment of mortgage servicing rights |
— | 695 | (695 | ) | (100 | )% | ||||||||||
| Amortization of mortgage servicing rights |
— | 1,171 | (1,171 | ) | (100 | )% | ||||||||||
| Provision for mortgage repurchases and indemnifications |
414 | 525 | (111 | ) | (21 | )% | ||||||||||
| Depreciation and amortization expense |
466 | 180 | 286 | 159 | % | |||||||||||
| Loss on disposal of property and equipment |
25 | — | 25 | N/A | ||||||||||||
|
|
|
|
|
|
|
|||||||||||
| Total expenses |
29,790 | 16,118 | 13,672 | 85 | % | |||||||||||
|
|
|
|
|
|
|
|||||||||||
| Income before income taxes |
2,490 | 15,291 | (12,801 | ) | (84 | )% | ||||||||||
| Income tax expense |
807 | 5,825 | (5,018 | ) | (86 | )% | ||||||||||
|
|
|
|
|
|
|
|||||||||||
| Net income |
$ | 1,683 | $ | 9,466 | $ | (7,783 | ) | (82 | )% | |||||||
|
|
|
|
|
|
|
|||||||||||
| Weighted average diluted shares outstanding |
17,604 | 9,454 | 8,150 | 86 | % | |||||||||||
| Diluted EPS |
$ | 0.10 | $ | 1.00 | $ | (0.90 | ) | (90 | )% | |||||||
Revenues
During the three months ended September 30, 2013, total revenues increased $871, or 3%, as compared to the three months ended September 30, 2012. The increase in revenues resulted from increases in our loan servicing fees, interest income, loan origination and other loan fees and changes in MSRs valuation, partially offset by decreases in our gains on mortgage loans held for sale and other revenues. The increase in our loan servicing fees was primarily the result of our higher average servicing portfolio of $8,635,421 during the three months ended September 30, 2013, compared to an average servicing portfolio of $2,525,342 during the three months ended September 30, 2012. The increase in interest income was primarily a result of an increase in mortgage loan originations as well as higher interest rates during the three months ended September 30, 2013 as compared to September 30, 2012. Loan origination and other loan fees increased primarily as a result of the increase in the amount of loans originated during the three months ended September 30, 2013 compared to the
-61-
Table of Contents
three months ended September 30, 2012 (which increased 123%). The increase in the net change in MSRs valuation resulted from our change in accounting for our MSRs during 2013, as previously described. The decrease in our gains on mortgage loans held for sale during the three months ended September 30, 2013 was due primarily to negative fair value adjustments on derivative assets and liabilities (IRLCs and related MBS forward trades) due to rising interest rates as well as margin compression resulting from an increase in loan originations from our correspondent channel, which typically has lower profit margins. The decrease in other revenue was due to the bargain purchase gain related to the acquisition of NattyMac assets during the three months ended September 30, 2012, for which there was no comparable gain during the three months ended September 30, 2013.
Originations
The following table illustrates mortgage loan originations by type for the three months ended September 30, 2013 and 2012:
| Three Months Ended September 30, |
||||||||||||||||
| 2013 |
2012 |
|||||||||||||||
| $ |
% Total |
$ |
% Total |
|||||||||||||
| FNMA |
$ | 1,395,643 | 60 | % | $ | 735,846 | 70 | % | ||||||||
| GNMA |
943,423 | 40 | % | 314,496 | 30 | % | ||||||||||
| Non-agency jumbo |
1,394 | — | % | — | — | % | ||||||||||
|
|
|
|
|
|
|
|
|
|||||||||
| Total mortgage loan originations |
$ | 2,340,460 | 100 | % | $ | 1,050,342 | 100 | % | ||||||||
|
|
|
|
|
|
|
|
|
|||||||||
The following is a summary of mortgage loan origination volume by channel for the three months ended September 30, 2013 and 2012:
| Three Months Ended September 30, |
||||||||||||||||||||||||
| 2013 |
2012 |
|||||||||||||||||||||||
| # of |
$ |
% Total |
# of |
$ |
% Total |
|||||||||||||||||||
| Retail |
947 | $ | 152,550 | 7 | % | 860 | $ | 145,843 | 14 | % | ||||||||||||||
| Wholesale |
2,113 | 421,582 | 18 | % | 1,290 | 257,629 | 25 | % | ||||||||||||||||
| Correspondent |
9,203 | 1,766,328 | 75 | % | 3,324 | 646,870 | 61 | % | ||||||||||||||||
|
|
|
|
|
|
|
|
|
|
|
|
|
|||||||||||||
| Total mortgage loan originations |
12,263 | $ | 2,340,460 | 100 | % | 5,474 | $ | 1,050,342 | 100 | % | ||||||||||||||
|
|
|
|
|
|
|
|
|
|
|
|
|
|||||||||||||
The increased volume in the correspondent channel is consistent with our strategic direction of building a diversified and scalable origination business and retaining MSRs on residential mortgage loans. We intend on building our retail operations through acquisitions of small retail mortgage operators during the remainder of 2013 and into 2014 and by increasing our retail operations as a percentage of our overall business.
We seek to manage asset quality and control credit risk by diversifying our loan portfolio and by applying policies designed to promote sound underwriting and loan monitoring practices. We perform various levels of analysis in order to monitor the overall risk profile of our mortgage originations and servicing portfolio. This analysis includes review of the LTV, FICO scores, delinquencies, defaults and historical loan losses. Monthly risk meetings are conducted where portfolio risk analysis, such as FICO and LTV combination migration, is studied to ensure that the population distributions are in accordance with risk parameters. In addition, default activity is evaluated in the context of credit spectrum to identify any emerging credit quality trends.
-62-
Table of Contents
A summary of the mortgage loan origination volume by FICO score and LTV for the three months ended September 30, 2013 and 2012 is as follows:
| Three Months Ended September 30, 2013 |
||||||||||||||||||||||||||||
| LTV Range |
||||||||||||||||||||||||||||
| <70% |
70%-80% |
81%-90% |
91%-100% |
>100% |
Total |
% Total |
||||||||||||||||||||||
| FICO Score |
||||||||||||||||||||||||||||
| <620 |
$ | — | $ | 282 | $ | 539 | $ | 2,133 | $ | — | $ | 2,954 | — | % | ||||||||||||||
| 620-680 |
24,164 | 61,057 | 56,542 | 361,474 | 6,685 | 509,922 | 22 | % | ||||||||||||||||||||
| 681-719 |
30,801 | 96,068 | 69,549 | 288,001 | 7,889 | 492,308 | 21 | % | ||||||||||||||||||||
| >719 |
183,381 | 436,027 | 185,904 | 515,214 | 14,750 | 1,335,276 | 57 | % | ||||||||||||||||||||
|
|
|
|
|
|
|
|
|
|
|
|
|
|
|
|||||||||||||||
| Total mortgage loan originations |
$ | 238,346 | $ | 593,434 | $ | 312,534 | $ | 1,166,822 | $ | 29,324 | $ | 2,340,460 | 100 | % | ||||||||||||||
|
|
|
|
|
|
|
|
|
|
|
|
|
|
|
|||||||||||||||
| % Total |
10 | % | 26 | % | 13 | % | 50 | % | 1 | % | 100 | % | ||||||||||||||||
|
|
|
|
|
|
|
|
|
|
|
|
|
|||||||||||||||||
| Three Months Ended September 30, 2012 |
||||||||||||||||||||||||||||
| LTV Range |
||||||||||||||||||||||||||||
| <70% |
70%-80% |
81%-90% |
91%-100% |
>100% |
Total |
% Total |
||||||||||||||||||||||
| FICO Score |
||||||||||||||||||||||||||||
| <620 |
$ | 120 | $ | — | $ | 161 | $ | 841 | $ | — | $ | 1,122 | — | % | ||||||||||||||
| 620-680 |
7,023 | 15,181 | 19,326 | 123,574 | 3,001 | 168,105 | 16 | % | ||||||||||||||||||||
| 681-719 |
16,583 | 37,732 | 26,659 | 81,284 | 6,889 | 169,147 | 16 | % | ||||||||||||||||||||
| >719 |
133,376 | 265,769 | 87,383 | 195,881 | 29,559 | 711,968 | 68 | % | ||||||||||||||||||||
|
|
|
|
|
|
|
|
|
|
|
|
|
|
|
|||||||||||||||
| Total mortgage loan originations |
$ | 157,102 | $ | 318,682 | $ | 133,529 | $ | 401,580 | $ | 39,449 | $ | 1,050,342 | 100 | % | ||||||||||||||
|
|
|
|
|
|
|
|
|
|
|
|
|
|
|
|||||||||||||||
| % Total |
15 | % | 30 | % | 13 | % | 38 | % | 4 | % | 100 | % | ||||||||||||||||
|
|
|
|
|
|
|
|
|
|
|
|
|
|||||||||||||||||
Our mortgage loan originations during the three months ended September 30, 2013 have shifted toward lower FICO scores and higher LTV percentages primarily as a result of the increase toward GNMA mortgage originations, which increased from 30% of total mortgage loan originations during the three months ended September 30, 2012 to 40% of total mortgage loan originations during the three months ended September 30, 2013. GNMA mortgage loans generally allow for lower minimum FICO scores and higher maximum LTV percentages.
Servicing
The following is a summary of loan servicing fee income by component for the three months ended September 30, 2013 and 2012:
| Three Months Ended |
||||||||
| 2013 |
2012 |
|||||||
| Contractual servicing fees |
$ | 5,813 | $ | 1,448 | ||||
| Late fees |
153 | 56 | ||||||
|
|
|
|
|
|||||
| Loan servicing fees |
$ | 5,966 | $ | 1,504 | ||||
|
|
|
|
|
|||||
Our loan servicing fees increased to $5,966 during the three months ended September 30, 2013 from $1,504 during the three months ended September 30, 2012. The 297% increase in loan servicing fees was primarily the result of an 242% increase in the average UPB of mortgage loans serviced during the three months ended September 30, 2013 compared to the three months ended September 30, 2012.
-63-
Table of Contents
The following table illustrates our mortgage servicing portfolio by type as of September 30, 2013 and December 31, 2012:
| September 30, 2013 |
December 31, 2012 |
|||||||||||||||
| $ UPB |
% Total |
$ UPB |
% Total |
|||||||||||||
| FNMA |
$ | 6,025,898 | 62 | % | $ | 2,781,389 | 67 | % | ||||||||
| GNMA |
3,654,993 | 38 | % | 1,363,951 | 33 | % | ||||||||||
| FHLMC |
1,690 | — | % | — | — | % | ||||||||||
|
|
|
|
|
|
|
|
|
|||||||||
| Total servicing portfolio |
$ | 9,682,581 | 100 | % | $ | 4,145,340 | 100 | % | ||||||||
|
|
|
|
|
|
|
|
|
|||||||||
The following is a summary of mortgage loan servicing portfolio characteristics by loan type as of September 30, 2013 and 2012:
| September 30, 2013 |
||||||||||||
| Weighted Average |
Average Age (in months) |
Average Loan Amount |
||||||||||
| FNMA |
3.74 | % | 9.2 | $ | 194,836 | |||||||
| GNMA |
3.68 | % | 9.0 | $ | 157,394 | |||||||
| FHLMC |
4.42 | % | — | $ | 338,019 | |||||||
| Total |
3.71 | % | 9.1 | $ | 178,794 | |||||||
| September 30, 2012 |
||||||||||||
| Weighted Average Coupon |
Average Age |
Average Loan Amount |
||||||||||
| FNMA |
3.79 | % | 1.9 | $ | 192,952 | |||||||
| GNMA |
4.08 | % | 3.9 | $ | 130,946 | |||||||
| FHLMC |
N/A | N/A | N/A | |||||||||
| Total |
3.85 | % | 2.3 | $ | 177,000 | |||||||
Our servicing portfolio characteristics reflect the influence of overall lower interest rates in 2013 loan production. The weighted average coupon of the portfolio dropped during 2013, while the average balance and average age increased. Lower rates tend to prepay more slowly and newer loans generally have longer remaining lives. The increased average loan amounts represent expansion into certain higher-priced residential geographic areas as we continue to expand our footprint, as well as the launch of our non-agency jumbo loan program during the three months ended September 30, 2013.
Expenses
Salaries, commissions and benefits expense increased $7,317, or 80%, during the three months ended September 30, 2013 compared to the three months ended September 30, 2012 primarily as a result of the increase in our headcount from 351 employees at September 30, 2012 to 742 employees at September 30, 2013. We have increased our sales force and support staff to facilitate the growth in our loan originations, mortgage servicing and mortgage financing operations. Since origination volumes have increased, the variable commissions paid to employees were also higher during the three months ended September 30, 2013. The Company also increased its contribution to and the quality of the employee benefit packages, including health and welfare plans, incentive compensation and stock-based compensation, to continue to attract and retain talent in the markets we serve, which contributed to the increase in 2013.
General and administrative expenses increased $4,218, or 220%, during the three months ended September 30, 2013 compared to the three months ended September 30, 2012 primarily as a result of the increase in loan origination (including costs associated with the launch of our non-agency jumbo loan program) and loan servicing activities, our company-wide rebranding campaign, as well as certain non-deferrable legal and accounting expenses incurred related to the preparation for our initial public offering. We also saw an increase in travel and administrative expenses as we expanded our operations into additional states.
-64-
Table of Contents
Interest expense increased $1,499, or 83%, during the three months ended September 30, 2013 compared to the three months ended September 30, 2012 primarily as a result of the increase in the volume of mortgage loans originated and funded in the current period.
Occupancy, equipment and communication expenses increased $2,304, or 341%, during the three months ended September 30, 2013 compared to the three months ended September 30, 2012, primarily as a result of increased facility, system and computer equipment requirements to accommodate increased staffing levels, new operation centers and new retail branches.
Impairment of MSRs and amortization of MSRs decreased $695 and $1,171, respectively, during the three months ended September 30, 2013 compared to the three months ended September 30, 2012 as a result of the previously discussed change in our accounting treatment of MSRs.
The provision for mortgage repurchases and indemnifications decreased $111, or 21%, during the three months ended September 30, 2013 compared to the three months ended September 30, 2012 primarily as a result of a change in our process for reserving for mortgage repurchases and indemnifications in light of improvements in the availability of loan quality data used to determine the reserve.
Depreciation and amortization expense increased $286, or 159%, during the three months ended September 30, 2013 compared to the three months ended September 30, 2012 primarily due to increased property and equipment balances resulting from our overall growth and expansion, as well as increased amortization expense related to the NattyMac intangible assets acquired on August 30, 2012.
Income tax expenses were $807 and $5,825 for the three months ended September 30, 2013 and 2012, respectively, which represented a decrease of 86% during the three months ended September 30, 2013. The decrease was primarily due to the 84% decrease in income before income tax expense during the three months ended September 30, 2013 and, to a lesser extent, a decrease in the effective tax rate during the three months ended September 30, 2013 as a result of changes in the Company’s state apportionment factors due to its geographic expansion and resulting changes in loan origination volume mix in the various states it conducts business.
Nine Months Ended September 30, 2013 Compared to Nine Months Ended September 30, 2012
Effective January 1, 2013, the Company irrevocably elected to account for the subsequent measurement of its existing MSRs using the fair value method, whereby the MSRs are initially recorded on our balance sheet at fair value with subsequent changes in fair value recorded in earnings during the period in which the changes in fair value occur. We believe that accounting for the MSRs at fair value best reflects the impact of current market conditions on our MSRs, and our investors and other users of our financial statements will have greater insight into management’s views as to the value of our MSRs at each reporting date. Prior to January 1, 2013, the Company accounted for the subsequent measurement of its MSRs at the lower of amortized cost or estimated fair value (the “amortization method”), whereby the MSRs were initially recorded on our balance sheet at fair value and subsequently amortized in proportion to and over the period of estimated net servicing income. In addition, under the amortization method, the carrying value of the MSRs was periodically assessed for impairment at each balance sheet date. In accordance with the applicable GAAP guidance, this change in accounting principle was accounted for on a prospective basis (financial statement periods prior to 2013 have not been restated). We did not record a cumulative-effect adjustment to retained earnings as of January 1, 2013, as the net amortized carrying value of the existing MSRs as of January 1, 2013 equaled the fair value at such date due to MSR impairment charges recorded during 2012. Beginning with the nine months ended September 30, 2013, the net changes in the fair value in our MSRs are reported in our statement of operations within “Changes in mortgage servicing rights valuation.”
-65-
Table of Contents
Our consolidated results of operations for the nine months ended September 30, 2013 and 2012 are as follows:
| Nine Months Ended September 30, |
||||||||||||||||
| (in thousands, except per share data) | 2013 |
2012 |
$ Change |
% Change |
||||||||||||
| Gains on mortgage loans held for sale |
$ | 63,791 | $ | 47,709 | $ | 16,082 | 34 | % | ||||||||
| Changes in mortgage servicing rights valuation |
11,649 | — | 11,649 | N/A | ||||||||||||
| Loan origination and other loan fees |
15,638 | 6,266 | 9,372 | 150 | % | |||||||||||
| Loan servicing fees |
14,324 | 3,728 | 10,596 | 284 | % | |||||||||||
| Interest income |
11,106 | 3,158 | 7,948 | 252 | % | |||||||||||
| Other revenue |
— | 1,172 | (1,172 | ) | (100 | )% | ||||||||||
|
|
|
|
|
|
|
|||||||||||
| Total revenues |
116,508 | 62,033 | 54,475 | 88 | % | |||||||||||
| Salaries, commissions and benefits |
48,604 | 21,202 | 27,402 | 129 | % | |||||||||||
| General and administrative |
15,026 | 4,429 | 10,597 | 239 | % | |||||||||||
| Interest expense |
10,972 | 3,734 | 7,238 | 194 | % | |||||||||||
| Occupancy, equipment and communications |
6,103 | 1,726 | 4,377 | 254 | % | |||||||||||
| Impairment of mortgage servicing rights |
— | 5,522 | (5,522 | ) | (100 | )% | ||||||||||
| Amortization of mortgage servicing rights |
— | 2,584 | (2,584 | ) | (100 | )% | ||||||||||
| Provision for mortgage repurchases and indemnifications |
1,379 | 826 | 553 | 67 | % | |||||||||||
| Depreciation and amortization expense |
1,379 | 456 | 923 | 202 | % | |||||||||||
| Loss on disposal of property and equipment |
25 | — | 25 | N/A | ||||||||||||
|
|
|
|
|
|
|
|||||||||||
| Total expenses |
83,488 | 40,479 | 43,009 | 106 | % | |||||||||||
|
|
|
|
|
|
|
|||||||||||
| Income before income taxes |
33,020 | 21,554 | 11,466 | 53 | % | |||||||||||
| Income tax expense |
12,487 | 8,210 | 4,277 | 52 | % | |||||||||||
|
|
|
|
|
|
|
|||||||||||
| Net income |
$ | 20,533 | $ | 13,344 | $ | 7,189 | 54 | % | ||||||||
|
|
|
|
|
|
|
|||||||||||
| Weighted average diluted shares outstanding |
14,466 | 6,776 | 7,690 | 113 | % | |||||||||||
| Diluted EPS |
$ | 1.42 | $ | 1.95 | $ | (0.53 | ) | (27 | )% | |||||||
Revenues
During the nine months ended September 30, 2013, total revenues increased $54,475 thousand, or 88%, as compared to the nine months ended September 30, 2012. The increase in revenues resulted from increases in our gain on loans held for sale, net change in MSRs valuation, loan servicing fees, loan origination and other loan fees and interest income, partially offset by a decrease in other revenues. The increase in our gains on mortgage loans held for sale was primarily a result of the increase in the amount of loans originated during the nine months ended September 30, 2013 as compared to the nine months ended September 30, 2012 (which increased 209%), which was partially offset by unfavorable fair market value adjustments related to our derivative assets and liabilities (IRLCs and related MBS forward trades) during the nine months ended September 30, 2013 as compared to the nine months ended September 30, 2012 resulting from increasing interest rates, as well as margin compression from an increase in originations from the correspondent channel which typically has lower profit margins. The increase in the net change in MSRs valuation resulted from our change in accounting for our MSRs during 2013, as previously described. The increase in loan servicing fees was primarily the result of our higher average servicing portfolio balance of $6,797,836 thousand during the nine months ended September 30, 2013, compared to an average servicing portfolio of $1,996,297 thousand during the nine months ended September 30, 2012. Loan origination and other loan fees increased primarily as a result of the increase in loan originations during the nine months ended September 30, 2013 as compared to the nine months ended September 30, 2012. The increase in interest income was primarily a result of the increase in mortgage loan originations as well as higher interest rates during the nine months ended September 30, 2013 as compared to September 30, 2012. The decrease in other revenue was due to the bargain purchase gain related to the acquisition of NattyMac assets during the nine months ended September 30, 2012, for which there was no comparable gain during the nine months ended September 30, 2013.
-66-
Table of Contents
Originations
The following table illustrates mortgage loan originations by type for the nine months ended September 30, 2013 and 2012:
| Nine Months Ended September 30, |
||||||||||||||||
| 2013 |
2012 |
|||||||||||||||
| ($ in thousands) | $ |
% Total |
$ |
% Total |
||||||||||||
| FNMA |
$ | 3,803,440 | 60 | % | $ | 1,411,195 | 69 | % | ||||||||
| GNMA |
2,520,369 | 40 | % | 639,112 | 31 | % | ||||||||||
| Non-agency jumbo |
1,394 | — | % | — | — | % | ||||||||||
|
|
|
|
|
|
|
|
|
|||||||||
| Total mortgage loan originations |
$ | 6,325,203 | 100 | % | $ | 2,050,307 | 100 | % | ||||||||
|
|
|
|
|
|
|
|
|
|||||||||
The following is a summary of mortgage loan origination volume by channel for the nine months ended September 30, 2013 and 2012:
| Nine Months Ended September 30, |
||||||||||||||||||||||||
| 2013 |
2012 |
|||||||||||||||||||||||
| ($ in thousands) | # of |
$ |
% Total |
# of |
$ |
% Total |
||||||||||||||||||
| Retail |
3,012 | $ | 497,066 | 8 | % | 2,100 | $ | 345,310 | 17 | % | ||||||||||||||
| Wholesale |
6,193 | 1,219,944 | 19 | % | 2,797 | 536,600 | 26 | % | ||||||||||||||||
| Correspondent |
24,317 | 4,608,193 | 73 | % | 6,031 | 1,168,397 | 57 | % | ||||||||||||||||
|
|
|
|
|
|
|
|
|
|
|
|
|
|||||||||||||
| Total mortgage loan originations |
33,522 | $ | 6,325,203 | 100 | % | 10,928 | $ | 2,050,307 | 100 | % | ||||||||||||||
|
|
|
|
|
|
|
|
|
|
|
|
|
|||||||||||||
The increased volume in the correspondent channel is consistent with our strategic direction of building a diversified and scalable origination business and retaining MSRs on residential mortgage loans. We intend on building our retail operations through acquisitions of small retail mortgage operators during the remainder of 2013 and into 2014 and by increasing our retail operations as a percentage of our overall business.
While our total mortgage loan origination volume (in dollars) increased 209% between periods, mortgage loan originations by the FICO score and LTV categories remained relatively consistent as a percentage of total loans originated, considering the impact of increased government insured mortgage originations during the current period.
We seek to manage asset quality and control credit risk by diversifying our loan portfolio and by applying policies designed to promote sound underwriting and loan monitoring practices. We perform various levels of analysis in order to monitor the overall risk profile of our mortgage originations and servicing portfolio. This analysis includes review of the LTV, FICO scores, delinquencies, defaults and historical loan losses. Monthly risk meetings are conducted where portfolio risk analysis, such as FICO and LTV combination migration, is studied to ensure that the population distributions are in accordance with risk parameters. In addition, default activity is evaluated in the context of credit spectrum to identify any emerging credit quality trends.
-67-
Table of Contents
A summary of the mortgage loan origination volume by FICO score and LTV for the nine months ended September 30, 2013 and 2012 is as follows:
| Nine Months Ended September 30, 2013 |
||||||||||||||||||||||||||||
| LTV Range |
||||||||||||||||||||||||||||
| ($ in thousands) | <70% |
70%-80% |
81%-90% |
91%-100% |
>100% |
Total |
% Total |
|||||||||||||||||||||
| FICO Score |
||||||||||||||||||||||||||||
| <620 |
$ | — | $ | 282 | $ | 750 | $ | 4,783 | $ | 236 | $ | 6,051 | — | % | ||||||||||||||
| 620-680 |
65,449 | 153,233 | 192,248 | 980,233 | 25,959 | 1,417,122 | 22 | % | ||||||||||||||||||||
| 681-719 |
107,086 | 247,108 | 197,800 | 668,997 | 32,880 | 1,253,871 | 20 | % | ||||||||||||||||||||
| >719 |
689,118 | 1,200,079 | 509,144 | 1,176,195 | 73,623 | 3,648,159 | 58 | % | ||||||||||||||||||||
|
|
|
|
|
|
|
|
|
|
|
|
|
|
|
|||||||||||||||
| Total mortgage loan originations |
$ | 861,653 | $ | 1,600,702 | $ | 899,942 | $ | 2,830,208 | $ | 132,698 | $ | 6,325,203 | 100 | % | ||||||||||||||
|
|
|
|
|
|
|
|
|
|
|
|
|
|
|
|||||||||||||||
| % Total |
14 | % | 25 | % | 14 | % | 45 | % | 2 | % | 100 | % | ||||||||||||||||
|
|
|
|
|
|
|
|
|
|
|
|
|
|||||||||||||||||
| Nine Months Ended September 30, 2012 |
||||||||||||||||||||||||||||
| LTV Range |
||||||||||||||||||||||||||||
| ($ in thousands) | <70% |
70%-80% |
81%-90% |
91%-100% |
>100% |
Total |
% Total |
|||||||||||||||||||||
| FICO Score |
||||||||||||||||||||||||||||
| <620 |
$ | 120 | $ | 156 | $ | 765 | $ | 1,654 | $ | — | $ | 2,695 | — | % | ||||||||||||||
| 620-680 |
15,215 | 35,121 | 42,444 | 247,439 | 6,621 | 346,840 | 17 | % | ||||||||||||||||||||
| 681-719 |
31,736 | 72,340 | 54,219 | 162,520 | 13,611 | 334,426 | 16 | % | ||||||||||||||||||||
| >719 |
252,946 | 527,582 | 164,045 | 369,486 | 52,287 | 1,366,346 | 67 | % | ||||||||||||||||||||
|
|
|
|
|
|
|
|
|
|
|
|
|
|
|
|||||||||||||||
| Total mortgage loan originations |
$ | 300,017 | $ | 635,199 | $ | 261,473 | $ | 781,099 | $ | 72,519 | $ | 2,050,307 | 100 | % | ||||||||||||||
|
|
|
|
|
|
|
|
|
|
|
|
|
|
|
|||||||||||||||
| % Total |
15 | % | 31 | % | 13 | % | 38 | % | 3 | % | 100 | % | ||||||||||||||||
|
|
|
|
|
|
|
|
|
|
|
|
|
|||||||||||||||||
Our mortgage loan originations during the nine months ended September 30, 2013 have shifted toward lower FICO scores and higher LTV percentages primarily as a result of the increase toward GNMA mortgage originations, which increased from 31% of total mortgage loan originations during the nine months ended September 30, 2012 to 40% of total mortgage loan originations during the nine months ended September 30, 2013. GNMA mortgage loans generally allow for lower minimum FICO scores and higher maximum LTV percentages.
Servicing Fees
The following is a summary of loan servicing fee income by component for the nine months ended September 30, 2013 and 2012:
| Nine Months Ended September 30, |
||||||||
| ($ in thousands) | 2013 |
2012 |
||||||
| Contractual servicing fees |
$ | 13,982 | $ | 3,580 | ||||
| Late fees |
342 | 148 | ||||||
|
|
|
|
|
|||||
| Loan servicing fees |
$ | 14,324 | $ | 3,728 | ||||
|
|
|
|
|
|||||
Our loan servicing fees increased to $14,324 thousand during the nine months ended September 30, 2013 from $3,728 thousand during the nine months ended September 30, 2012. The 284% increase in loan servicing fees was primarily the result of a 241% increase in the average UPB of mortgage loans serviced during the nine months ended September 30, 2013 as compared to the nine months ended September 30, 2012.
-68-
Table of Contents
Expenses
Salaries, commissions and benefits expense increased $27,402 thousand, or 129%, during the nine months ended September 30, 2013 compared to the nine months ended September 30, 2012 primarily as a result of the increase in our headcount from 351 employees at September 30, 2012 to 742 employees at September 30, 2013. We increased our sales force and support staff to facilitate the growth in our loan originations, mortgage servicing and mortgage financing operations. Since origination volumes have increased significantly, the variable commissions paid to employees were also much higher in 2013. The Company also increased its contribution to and the quality of the employee benefit packages, including health and welfare plans, incentive compensation and stock-based compensation, to continue to attract and retain talent in the markets we serve, which contributed to the increase in 2013.
General and administrative expenses increased $10,597 thousand, or 239%, during the nine months ended September 30, 2013 as compared to the nine months ended September 30, 2012 primarily as a result of the increase in loan origination (including costs associated with the launch of our non-agency jumbo loan program) and loan servicing activities as well as certain non-deferrable legal and accounting expenses incurred related to our private equity offering and the preparation of our initial public offering. We also saw an increase in travel and administrative expenses as we expanded our operations into additional states.
Interest expense increased $7,238 thousand, or 194%, during the nine months ended September 30, 2013 as compared to the nine months ended September 30, 2012 primarily as a result of the increase in the volume of mortgage loans originated and funded in the current period. In addition, we experienced an increase in interest expense due to the warrants issued to a stockholder in March 2013.
Occupancy, equipment and communication expenses increased $4,377 thousand, or 254%, during the nine months ended September 30, 2013 as compared to the nine months ended September 30, 2012, primarily as a result of increased facility, system and computer equipment requirements to accommodate increased staffing levels, new operation centers and new retail branches.
Impairment of MSRs and amortization of MSRs decreased $5,522 thousand and $2,584, respectively, during the nine months ended September 30, 2013 as compared to the nine months ended September 30, 2012 as a result of the previously discussed change in our accounting treatment of MSRs.
The provision for mortgage repurchases and indemnifications increased $553 thousand, or 67%, during the nine months ended September 30, 2013 as compared to the nine months ended September 30, 2012 primarily as a result of the increase in the volume of mortgage loans originated during the current period. This increase was partially offset by a change in our process for reserving for mortgage repurchases and indemnifications during the second quarter of 2013 in light of improvements in the availability of loan quality data used to determine the reserve.
Depreciation and amortization expense increased $923 thousand, or 202%, during the nine months ended September 30, 2013 as compared to the nine months ended September 30, 2012 primarily due to increased property and equipment balances resulting from our overall growth and expansion, as well as increased amortization expense related to the NattyMac intangible assets acquired on August 30, 2012.
Income tax expenses were $12,487 thousand and $8,210 thousand for the nine months ended September 30, 2013 and 2012, respectively, which represented an increase of 52% during the nine months ended September 30, 2013. The increase was primarily due to the 53% increase income before income tax expense during the nine months ended September 30, 2013, partially offset by a decrease in the effective tax rate during the three months ended September 30, 2013 as a result of changes in the Company’s state apportionment factors due to its geographic expansion and resulting changes in loan origination volume mix in the various states it conducts business.
-69-
Table of Contents
We anticipate our aggregate servicing operating costs will increase as our portfolio increases in size. Our servicing portfolio is generally of recent vintages and consists of agency loans which tend to be of higher quality. These characteristics tend to allow our servicing platform to direct most of its efforts on creating processing efficiencies and a solid customer experience rather than addressing legacy delinquencies and resultant high servicing costs. We expect the average cost to service a loan to decrease due to economies of scale, future technology improvements and outsourcing opportunities where deemed appropriate. On a per-loan basis, we also expect that our servicing costs will improve as we spread our fixed capital investments over a larger loan servicing portfolio.
Year ended December 31, 2012 Compared to Year Ended December 31, 2011
Our results of operations for the years ended December 31, 2012 and 2011 are as follows:
| (in millions) | Years Ended December 31, |
|||||||||||
| 2012 |
2011 |
% Change |
||||||||||
| Gains on mortgage loans held for sale |
$ | 73.3 | $ | 16.7 | 339 | % | ||||||
| Loan origination and other loan fees |
9.9 | 4.3 | 130 | % | ||||||||
| Loan servicing fees |
5.9 | 2.6 | 127 | % | ||||||||
| Interest income |
5.2 | 2.4 | 117 | % | ||||||||
| Other revenue |
1.2 | — | N/A | |||||||||
|
|
|
|
|
|||||||||
| Total revenues |
95.5 | 26.0 | 267 | % | ||||||||
| Salaries, commissions and benefits |
32.7 | 13.1 | 150 | % | ||||||||
| Impairment of MSRs |
11.7 | — | N/A | |||||||||
| General and administrative |
7.7 | 3.2 | 141 | % | ||||||||
| Interest expense |
6.2 | 2.7 | 130 | % | ||||||||
| Amortization of MSRs |
3.7 | 0.9 | 311 | % | ||||||||
| Occupancy, equipment and communication |
3.0 | 1.6 | 88 | % | ||||||||
| Provision for mortgage repurchases and indemnifications |
1.9 | — | N/A | |||||||||
| Depreciation and amortization |
0.8 | 0.4 | 100 | % | ||||||||
| Loss on disposal of property and equipment |
— | 0.1 | (100 | )% | ||||||||
|
|
|
|
|
|||||||||
| Total expenses |
67.7 | 22.0 | 208 | % | ||||||||
|
|
|
|
|
|||||||||
| Income before income taxes |
27.8 | 4.0 | 595 | % | ||||||||
| Income tax expense |
10.7 | 1.7 | 529 | % | ||||||||
|
|
|
|
|
|||||||||
| Net income |
$ | 17.1 | $ | 2.3 | 643 | % | ||||||
|
|
|
|
|
|||||||||
| Average diluted shares outstanding |
7.5 | 3.5 | 114 | % | ||||||||
| Diluted net income per share |
$ | 2.26 | $ | 0.59 | 283 | % | ||||||
Revenues
For the year ended December 31, 2012, a 228% increase in mortgage loans originated drove a 267% increase in our revenues, in each case compared to the year ended December 31, 2011. The revenue increase in 2012 compared to 2011 resulted from increases in both our gain on loans held for sale and our loan servicing fee income, offset by mortgage servicing right temporary impairment adjustments amounting to $11.7 million. The increase in our gain on loans held for sale was a result of the increase in the amount of loans originated during 2012 compared to 2011 (which increased 288%), and higher margins earned on the sale of residential mortgage loans during the period. The increase in total servicing fee income was primarily the result of our higher average servicing portfolio balance of $4.1 billion for the year ended December 31, 2012, compared to $1.3 billion for the year ended December 31, 2011.
-70-
Table of Contents
We classify our non-financing revenue by component as follows for 2012 and 2011. The table also shows the loan volume originated and servicing portfolio by type: Agency (Fannie Mae, Freddie Mac) and Ginnie Mae government insured (FHA, VA and USDA):
| (in millions) | Year Ended December 31, |
|||||||
| 2012 |
2011 |
|||||||
| Revenue by Component: |
||||||||
| Origination |
$ | 88.4 | $ | 23.4 | ||||
| Servicing |
5.9 | 2.6 | ||||||
| Other |
1.2 | — | ||||||
|
|
|
|
|
|||||
| Total |
$ | 95.5 | $ | 26.0 | ||||
|
|
|
|
|
|||||
| (in millions) | Year Ended December 31, |
|||||||
| 2012 |
2011 |
|||||||
| Loan Volume Originated, by Type: |
||||||||
| Agency |
2,382 | 620 | ||||||
| Government Insured |
1,067 | 430 | ||||||
|
|
|
|
|
|||||
| Total |
$ | 3,449 | $ | 1,050 | ||||
|
|
|
|
|
|||||
| Servicing Portfolio, by Type: |
||||||||
| Agency |
$ | 2,781 | $ | 802 | ||||
| Government Insured |
1,364 | 514 | ||||||
|
|
|
|
|
|||||
| Total |
$ | 4,145 | $ | 1,316 | ||||
|
|
|
|
|
|||||
Originations
The following is a summary of mortgage loan origination volume by channel (by number of loans and sum of loan amounts) for the years ended December 31, 2012 and 2011:
| (dollars in millions) | Year Ended December 31, |
|||||||||||||||
| 2012 |
2011 |
|||||||||||||||
| # of |
Sum of |
# of |
Sum of |
|||||||||||||
| Channel: |
||||||||||||||||
| Retail |
3,039 | $ | 509 | 2,029 | $ | 317 | ||||||||||
| Wholesale |
4,554 | 894 | 2,072 | 361 | ||||||||||||
| Correspondent |
10,536 | 2,046 | 2,145 | 372 | ||||||||||||
|
|
|
|
|
|
|
|
|
|||||||||
| Total |
18,129 | $ | 3,449 | 6,246 | $ | 1,050 | ||||||||||
|
|
|
|
|
|
|
|
|
|||||||||
The trend toward the correspondent channel is consistent with our strategic direction of building a diversified and scalable origination business and retaining MSRs on residential mortgage loans. We intend on building our retail operations through acquisitions of small retail mortgage operators during 2013 and 2014 and by increasing our retail operations as a percentage of our overall business.
-71-
Table of Contents
The following is a summary of mortgage loan origination volume by FICO score (by number of loans and sum of loan amounts) for the years ended December 31, 2012 and 2011:
| (dollars in millions) | Year Ended December 31, |
|||||||||||||||
| 2012 |
2011 |
|||||||||||||||
| # of |
Sum of |
# of |
Sum of |
|||||||||||||
| FICO Score: |
||||||||||||||||
| <620 |
26 | $ | 3 | 23 | $ | 3 | ||||||||||
| 620—680 |
3,707 | 590 | 1,504 | 208 | ||||||||||||
| 681—719 |
2,998 | 541 | 1,080 | 173 | ||||||||||||
| >719 |
11,398 | 2,315 | 3,639 | 666 | ||||||||||||
|
|
|
|
|
|
|
|
|
|||||||||
| Total |
18,129 | $ | 3,449 | 6,246 | $ | 1,050 | ||||||||||
|
|
|
|
|
|
|
|
|
|||||||||
The following is a summary of mortgage loan origination volume by LTV at origination (by number of loans and sum of loan amounts) for the years ended December 31, 2012 and 2011:
| (dollars in millions) | Year Ended December 31, |
|||||||||||||||
| 2012 |
2011 |
|||||||||||||||
| # of |
Sum of |
# of |
Sum of |
|||||||||||||
| LTV Range: |
||||||||||||||||
| <70 |
2,686 | $ | 557 | 862 | $ | 157 | ||||||||||
| 70%—80% |
5,039 | 1,052 | 1,733 | 322 | ||||||||||||
| 81%—90% |
2,383 | 457 | 796 | 140 | ||||||||||||
| 91%—100% |
7,410 | 1,265 | 2,805 | 425 | ||||||||||||
| >100 |
611 | 118 | 50 | 6 | ||||||||||||
|
|
|
|
|
|
|
|
|
|||||||||
| Total |
18,129 | $ | 3,449 | 6,246 | $ | 1,050 | ||||||||||
|
|
|
|
|
|
|
|
|
|||||||||
The following is a summary of loan sales/securitizations volume by type, retained and released for the years ended December 31, 2012 and 2011:
| (dollars in millions) | GNMA Retained |
FNMA Retained |
Released |
Total Sold |
||||||||||||
| 2012 |
||||||||||||||||
| % of total |
29.2 | % | 70.0 | % | 0.8 | % | 100.0 | % | ||||||||
| Total volume |
$ | 955 | $ | 2,292 | $ | 25 | $ | 3,273 | ||||||||
| 2011 |
||||||||||||||||
| % of total |
31.3 | % | 43.2 | % | 25.5 | % | 100.0 | % | ||||||||
| Total volume |
$ | 328 | $ | 453 | $ | 267 | $ | 1,048 | ||||||||
Financing
Our net interest loss on loans held for sale was $0.2 million for the year ended December 31, 2012 compared to $0.0 million for the year ended December 31, 2011. For each year ended December 31, 2012 and December 31, 2011, there was no net income (loss) on loans/securities held for investment.
Servicing Fees
Our loan servicing fees increased from $2.6 million in 2011 to $5.9 million in 2012. The 149% increase in loan servicing fees was the result of the 215% increase in unpaid principal balance ($UPB) of mortgage loans serviced on December 31, 2012 compared to December 31, 2011.
-72-
Table of Contents
The following is a summary of serving fee income by component for the years ended December 31, 2012 and 2011:
| Year Ended December 31, |
||||||||
| (in millions) | 2012 |
2011 |
||||||
| Contractual servicing fees |
$ | 5.7 | $ | 2.5 | ||||
| Late fees |
0.2 | 0.1 | ||||||
|
|
|
|
|
|||||
| Total |
$ | 5.9 | $ | 2.6 | ||||
|
|
|
|
|
|||||
The following is a summary of mortgage loan portfolio characteristics by loan type for the years ended December 31, 2012 and 2011:
| Year Ended December 31, 2012 |
||||||||||||
| Weighted |
Average |
Average |
||||||||||
| Type: |
||||||||||||
| FNMA |
3.84 | % | 8.5 | $ | 188,942 | |||||||
| Government Insured |
3.92 | % | 10.3 | 145,877 | ||||||||
| Total |
3.86 | % | 9.0 | $ | 172,213 | |||||||
| Year Ended December 31, 2011 |
||||||||||||
| Weighted |
Average |
Average |
||||||||||
| Type: |
||||||||||||
| FNMA |
4.51 | % | 16.0 | $ | 154,281 | |||||||
| Government Insured |
4.64 | % | 11.6 | 138,011 | ||||||||
| Total |
4.56 | % | 14.3 | $ | 147,488 | |||||||
Our servicing portfolio characteristics reflect the influence of a significant amount of lower interest rate 2012 loan production. The weighted average coupon (WAC) and average age of the portfolio dropped during 2012, while the average balance increased. Lower rates tend to prepay more slowly and newer loans generally have longer remaining lives. The larger loan balances represent expansion into some higher balance geographic areas as we continue to expand our footprint.
The following is a summary of delinquencies ($UPB) by loan type as of December 31, 2012 and 2011:
| (in millions) | As of December 31, |
|||||||||||||||
| 2012 |
2012 |
|||||||||||||||
| Adjustable |
Adjustable |
Adjustable |
Adjustable |
|||||||||||||
| FNMA |
$ | — | $ | 14.7 | $ | 0.2 | $ | 6.6 | ||||||||
| Government Insured |
— | 52.9 | — | 25.2 | ||||||||||||
|
|
|
|
|
|
|
|
|
|||||||||
| Total |
$ | — | $ | 67.6 | $ | 0.2 | $ | 31.8 | ||||||||
|
|
|
|
|
|
|
|
|
|||||||||
Overall our delinquencies remain relatively low which is in line for the age of our portfolio. Delinquencies on government insured loans tend to be higher than FNMA because government insured loan programs are designed for first time home buyers and those borrowers generally have lower down payments. The low amount of delinquency on the Adjustable Rate loans is primarily due to the low percentage of these loans in our portfolio.
-73-
Table of Contents
Expenses
The 267% increase in revenues from 2011 to 2012 was accompanied by a 208% increase in expenses. Expenses and impairments increased primarily due to the increase in compensation expenses related to increased staffing levels in order to accommodate our significant growth in origination volume and a larger servicing portfolio, as well as other related increases in expenses, such as administrative, travel and office operation expenses. In addition, we recorded $11.7 million in temporary impairment against the value of our MSRs in 2012.
Salaries, commissions and benefits increased $19.6 million (150%) in 2012 compared to 2011 primarily as a result of the increase in our headcount from 198 employees at December 31, 2011 to 443 employees at December 31, 2012. We increased our sales force to expand geographically and take advantage of the low interest rate environment in 2012. Our staffing levels were increased to accommodate this significant growth in origination volume and manage the larger servicing portfolio. Since origination volumes had increased significantly, the variable commissions paid to employees were also much higher in 2012. The company also increased its contribution and the quality of the employee benefit packages to continue to attract and retain the very best talent in the markets we serve.
Impairment of MSRs of $11.7 million was recognized in 2012 as a result of primarily the difference between the weighted average coupon (WAC) rates of the portfolio (3.86%) compared to the average 30-year fixed rate mortgage coupon rate (3.59%) at 12/31/12. This can lead to higher loan prepayments which negatively affects the fair market value of the MSRs.
General and administrative expenses increased $4.5 million (141%) in 2012 compared to 2011 primarily as a result of the increase in loan origination volume and loans serviced, as well as additional states in which we obtained licenses and staff travel to support growth.
Interest expense increased $3.5 million (130%) in 2012 compared to 2011 primarily as a result of the increase in the volume of mortgage loans originated and funded throughout 2012.
Amortization of MSRs increased $2.8 million (311%) in 2012 compared to 2011 primarily as a result of the increase in unpaid principal balance of mortgage loans serviced during 2012.
Occupancy, equipment and communication expenses increased $1.4 million (88%) in 2012 compared to 2011 primarily as a result of increased facility, system and computer equipment requirements to accommodate increased staffing levels.
A provision for mortgage repurchases and indemnifications in the amount of $1.9 million was recorded in 2012 as a result of the significant increases in origination volumes and increased level of credit, compliance and collateral reviews performed by the agencies since the recent mortgage crisis.
Depreciation and amortization expense increased $0.4 million (100%) in 2012 compared to 2011 primarily due to increased property and equipment balances as well as amortization expense related to the NattyMac intangible assets acquired during the third quarter of 2012.
Income tax expenses were $10.7 million and $1.7 million in 2012 and 2011, respectively, which represented an increase of almost 530%.
-74-
Table of Contents
Results of Operations
Six Months Ended June 30, 2013 Compared to Six Months Ended June 30, 2012
Effective January 1, 2013, the Company irrevocably elected to account for the subsequent measurement of its existing MSRs using the fair value method, whereby the MSRs are initially recorded on our balance sheet at fair value with subsequent changes in fair value recorded in earnings during the period in which the changes in fair value occur. We believe that accounting for the MSRs at fair value best reflects the impact of current market conditions on our MSRs, and our investors and other users of our financial statements will have greater insight into management’s views as to the value of our MSRs at each reporting date. Prior to January 1, 2013, the Company accounted for the subsequent measurement of its MSRs at the lower of amortized cost or estimated fair value (the “amortization method”), whereby the MSRs were initially recorded on our balance sheet at fair value and subsequently amortized in proportion to and over the period of estimated net servicing income. In addition, under the amortization method, the carrying value of the MSRs was periodically assessed for impairment at each balance sheet date. In accordance with the applicable GAAP guidance, this change in accounting principle was accounted for on a prospective basis (financial statement periods prior to 2013 have not been restated). We did not record a cumulative-effect adjustment to retained earnings as of January 1, 2013, as the net amortized carrying value of the existing MSRs as of January 1, 2013 equaled the fair value at such date due to MSR impairment charges recorded during 2012. Beginning with the six months ended June 30, 2013, the net changes in the fair value in our MSRs are reported in our statement of operations within “Changes in mortgage servicing rights valuation.”
Our results of operations for the six months ended June 30, 2013 and 2012 are as follows:
| (in millions, except per share data) | Six Months Ended June 30, |
|||||||||||
| 2013 |
2012 |
% Change |
||||||||||
| Gains on mortgage loans held for sale |
$ | 50.6 | $ | 23.5 | 115 | % | ||||||
| Changes in MSRs valuation |
9.5 | — | N/A | |||||||||
| Loan origination and other loan fees |
10.0 | 3.3 | 203 | % | ||||||||
| Loan servicing fees |
8.4 | 2.2 | 282 | % | ||||||||
| Interest income |
5.7 | 1.6 | 256 | % | ||||||||
|
|
|
|
|
|||||||||
| Total revenues |
84.2 | 30.6 | 175 | % | ||||||||
| Salaries, commissions and benefits |
32.1 | 12.0 | 168 | % | ||||||||
| General and administrative |
8.9 | 2.5 | 256 | % | ||||||||
| Interest expense |
7.7 | 1.9 | 305 | % | ||||||||
| Occupancy, equipment and communications |
3.1 | 1.1 | 182 | % | ||||||||
| Provision for mortgage repurchases and indemnifications |
1.0 | 0.3 | 233 | % | ||||||||
| Depreciation and amortization |
0.9 | 0.3 | 200 | % | ||||||||
| Amortization of MSRs |
— | 1.4 | (100 | )% | ||||||||
| Impairment of MSRs |
— | 4.8 | (100 | )% | ||||||||
|
|
|
|
|
|||||||||
| Total expenses |
53.7 | 24.3 | 121 | % | ||||||||
|
|
|
|
|
|||||||||
| Income before income taxes |
30.5 | 6.3 | 384 | % | ||||||||
| Income tax expense |
11.7 | 2.4 | 388 | % | ||||||||
|
|
|
|
|
|||||||||
| Net income |
$ | 18.8 | $ | 3.9 | 382 | % | ||||||
|
|
|
|
|
|||||||||
| Weighted average diluted shares outstanding |
12.9 | 5.4 | 139 | % | ||||||||
| Diluted net income per share |
$ | 1.46 | $ | 0.70 | 109 | % | ||||||
-75-
Table of Contents
Revenues
For the six months ended June 30, 2013, a 298% increase in mortgage loans originated drove a 175% increase in our revenues, in each case compared to the six months ended June 30, 2012. The revenue increase for the six months ended June 30, 2013 compared to the six months ended June 30, 2012 resulted from increases in our gain on loans held for sale, net change in MSRs valuation, loan origination fee income and loan servicing fee income. The increases in our gain on loans held for sale and loan origination fee income were a result of the increase in the amount of loans originated during the first half of 2013 compared to the first half of 2012 (which increased 298%). The increase in the net change in MSRs valuation resulted from our change in accounting for our MSRs during the six months ended June 30, 2013, as described above. The increase in total servicing fee income was primarily the result of our higher average servicing portfolio balance of $6.1 billion for the six months ended June 30, 2013, compared to $1.8 billion for the six months ended June 30, 2012.
We classify our revenues by component as follows for the six months ended June 30, 2013 and 2012. The table also shows the loan volume originated and servicing portfolio by type: Agency (Fannie Mae, Freddie Mac) and Ginnie Mae government insured (FHA, VA and USDA):
| (in millions) | Six Months Ended June 30, |
|||||||
| 2013 |
2012 |
|||||||
| Revenue by Component: |
||||||||
| Origination |
$ | 66.3 | $ | 28.4 | ||||
| Servicing |
17.9 | 2.2 | ||||||
|
|
|
|
|
|||||
| Total |
$ | 84.2 | $ | 30.6 | ||||
|
|
|
|
|
|||||
| Loan Volume Originated, by Type: |
||||||||
| Agency |
$ | 2,408 | 675 | |||||
| Government Insured |
1,577 | 325 | ||||||
|
|
|
|
|
|||||
| Total |
$ | 3,985 | $ | 1,000 | ||||
|
|
|
|
|
|||||
| Servicing Portfolio, by Type: |
||||||||
| Agency |
$ | 4,797 | $ | 1,331 | ||||
| Government Insured |
2,791 | 777 | ||||||
|
|
|
|
|
|||||
| Total |
$ | 7,588 | $ | 2,108 | ||||
|
|
|
|
|
|||||
Originations
The following is a summary of mortgage loan origination volume by channel (by number of loans and sum of loan amounts) for the six months ended June 30, 2013 and 2012:
| (dollars in millions) | Six Months Ended June 30, |
|||||||||||||||
| 2013 |
2012 |
|||||||||||||||
| # of |
Sum of |
# of |
Sum of |
|||||||||||||
| Channel: |
||||||||||||||||
| Retail |
2,065 | $ | 344.5 | 1,240 | $ | 199.5 | ||||||||||
| Wholesale |
4,080 | 798.4 | 1,507 | 279.0 | ||||||||||||
| Correspondent |
15,114 | 2,841.9 | 2,707 | 521.5 | ||||||||||||
|
|
|
|
|
|
|
|
|
|||||||||
| Total |
21,259 | $ | 3,984.8 | 5,454 | $ | 1,000.0 | ||||||||||
|
|
|
|
|
|
|
|
|
|||||||||
-76-
Table of Contents
The trend toward the correspondent channel is consistent with our strategic direction of building a diversified and scalable origination business and retaining MSRs on residential mortgage loans. We intend on building our retail operations through acquisitions of small retail mortgage operators during the remainder of 2013 and into 2014 and by increasing our retail operations as a percentage of our overall business.
The following is a summary of mortgage loan origination volume by FICO score (by number of loans and sum of loan amounts) for the six months ended June 30, 2013 and 2012:
| (dollars in millions) | Six Months Ended June 30, |
|||||||||||||||
| 2013 |
2012 |
|||||||||||||||
| # of |
Sum of |
# of |
Sum of |
|||||||||||||
| FICO Score: |
||||||||||||||||
| < 620 |
24 | $ | 3.1 | 12 | $ | 1.6 | ||||||||||
| 620—680 |
5,516 | 907.2 | 1,178 | 178.7 | ||||||||||||
| 681—719 |
4,068 | 761.6 | 937 | 165.3 | ||||||||||||
| > 719 |
11,651 | 2,312.9 | 3,327 | 654.4 | ||||||||||||
|
|
|
|
|
|
|
|
|
|||||||||
| Total |
21,259 | $ | 3,984.8 | 5,454 | $ | 1,000.0 | ||||||||||
|
|
|
|
|
|
|
|
|
|||||||||
The following is a summary of mortgage loan origination volume by LTV at origination (by number of loans and sum of loan amounts) for the six months ended June 30, 2013 and 2012:
| (dollars in millions) | Six Months Ended June 30, |
|||||||||||||||
| 2013 |
2012 |
|||||||||||||||
| # of |
Sum of |
# of |
Sum of |
|||||||||||||
| LTV Range: |
||||||||||||||||
| < 70% |
3,210 | $ | 623.3 | 729 | $ | 142.9 | ||||||||||
| 70%—80% |
4,966 | 1,007.3 | 1,546 | 316.5 | ||||||||||||
| 81%—90% |
3,111 | 587.4 | 687 | 128.0 | ||||||||||||
| 91%—100% |
9,413 | 1,663.4 | 2,312 | 379.5 | ||||||||||||
| > 100% |
559 | 103.4 | 180 | 33.1 | ||||||||||||
|
|
|
|
|
|
|
|
|
|||||||||
| Total |
21,259 | $ | 3,984.8 | 5,454 | $ | 1,000.0 | ||||||||||
|
|
|
|
|
|
|
|
|
|||||||||
While our total mortgage loan origination volume (in dollars) increased 298% between periods, mortgage loan originations by the FICO score and LTV categories remained relatively consistent as a percentage of total loans originated, considering the impact of increased government insured mortgage originations during the current period.
We seek to manage asset quality and control credit risk by diversifying our loan portfolio and by applying policies designed to promote sound underwriting and loan monitoring practices. We perform various levels of analysis in order to monitor the overall risk profile of our mortgage originations and servicing portfolio. This analysis includes review of the LTV, FICO scores, delinquencies, defaults and historical loan losses. Monthly risk meetings are conducted where portfolio risk analysis, such as FICO and LTV combination migration, is studied to ensure that the population distributions are in accordance with risk parameters. In addition, default activity is evaluated in the context of credit spectrum to identify any emerging credit quality trends so that they may be remedied.
-77-
Table of Contents
A summary of the mortgage loan origination volume by FICO score and LTV for the six months ended June 30, 2013 and 2012:
| (in millions) | Six Months Ended June 30, 2013 |
|||||||||||||||||||||||
| LTV Range |
||||||||||||||||||||||||
| <70% |
70%-80% |
81%-90% |
91%-100% |
>100% |
Total |
|||||||||||||||||||
| FICO Score |
||||||||||||||||||||||||
| <620 |
$ | — | $ | — | $ | 0.2 | $ | 2.7 | $ | 0.2 | $ | 3.1 | ||||||||||||
| 620-680 |
41.3 | 92.2 | 135.7 | 618.7 | 19.3 | 907.2 | ||||||||||||||||||
| 681-719 |
76.3 | 151.0 | 128.3 | 381.0 | 25.0 | 761.6 | ||||||||||||||||||
| >719 |
505.7 | 764.1 | 323.2 | 661.0 | 58.9 | 2,312.9 | ||||||||||||||||||
|
|
|
|
|
|
|
|
|
|
|
|
|
|||||||||||||
| Total |
$ | 623.3 | $ | 1,007.3 | $ | 587.4 | $ | 1,663.4 | $ | 103.4 | $ | 3,984.8 | ||||||||||||
|
|
|
|
|
|
|
|
|
|
|
|
|
|||||||||||||
| (in millions) | Six Months Ended June 30, 2012 |
|||||||||||||||||||||||
| LTV Range |
||||||||||||||||||||||||
| <70% |
70%-80% |
81%-90% |
91%-100% |
>100% |
Total |
|||||||||||||||||||
| FICO Score |
||||||||||||||||||||||||
| <620 |
$ | — | $ | 0.2 | $ | 0.6 | $ | 0.8 | $ | — | $ | 1.6 | ||||||||||||
| 620-680 |
8.2 | 19.9 | 23.1 | 123.9 | 3.6 | 178.7 | ||||||||||||||||||
| 681-719 |
15.1 | 34.6 | 27.6 | 81.2 | 6.8 | 165.3 | ||||||||||||||||||
| >719 |
119.6 | 261.8 | 76.7 | 173.6 | 22.7 | 654.4 | ||||||||||||||||||
|
|
|
|
|
|
|
|
|
|
|
|
|
|||||||||||||
| Total |
$ | 142.9 | $ | 316.5 | $ | 128.0 | $ | 379.5 | $ | 33.1 | $ | 1,000.0 | ||||||||||||
|
|
|
|
|
|
|
|
|
|
|
|
|
|||||||||||||
The following is a summary of loan sales/securitizations volume by type, retained and released for the six months ended June 30, 2013 and 2012:
| (dollars in millions) | GNMA |
FNMA |
Released |
Total Sold |
||||||||||||
| Six Months Ended June 30, 2013 |
||||||||||||||||
| % of total |
40.4 | % | 59.4 | % | 0.2 | % | 100.0 | % | ||||||||
| Total volume |
$ | 1,535.0 | $ | 2,259.5 | $ | 8.6 | $ | 3,803.1 | ||||||||
| Six Months Ended June 30, 2012 |
||||||||||||||||
| % of total |
31.4 | % | 66.9 | % | 1.7 | % | 100.0 | % | ||||||||
| Total volume |
$ | 295.0 | $ | 628.1 | $ | 15.9 | $ | 939.0 | ||||||||
Servicing Fees
The following is a summary of servicing fee income by component for the six months ended June 30, 2013 and 2012:
| Six Months Ended June 30, |
||||||||
| (in millions) | 2013 |
2012 |
||||||
| Contractual servicing fees |
$ | 8.2 | $ | 2.1 | ||||
| Late fees |
0.2 | 0.1 | ||||||
|
|
|
|
|
|||||
| Total |
$ | 8.4 | $ | 2.2 | ||||
|
|
|
|
|
|||||
Our loan servicing fees increased to $8.4 million during the six months ended June 30, 2013 from $2.2 million during the six months ended June 30, 2012. The 282% increase in loan servicing fees was primarily the result of a 260% increase in the unpaid principal balance of mortgage loans serviced at June 30, 2013 compared to June 30, 2012.
-78-
Table of Contents
The following is a summary of mortgage loan portfolio characteristics by loan type for the six months ended June 30, 2013 and 2012:
| Six Months Ended June 30, 2013 |
||||||||||||
| Weighted |
Average (in |
Average |
||||||||||
| Type: |
||||||||||||
| FNMA |
3.65 | % | 8.6 | $ | 193,776 | |||||||
| Government Insured |
3.62 | % | 8.6 | 155,109 | ||||||||
| Total |
3.64 | % | 8.6 | $ | 177,499 | |||||||
| Six Months Ended June 30, 2012 |
||||||||||||
| Weighted |
Average (in |
Average |
||||||||||
| Type: |
||||||||||||
| FNMA |
4.22 | % | 12.2 | $ | 170,700 | |||||||
| Government Insured |
4.35 | % | 11.7 | 140,750 | ||||||||
| Total |
4.27 | % | 12.0 | $ | 158,293 | |||||||
Our servicing portfolio characteristics reflect the influence of a significant amount of lower interest rates in the first half of 2013 loan production. The weighted average coupon (“WAC”) and average age of the portfolio dropped during the first half of 2013, while the average balance increased. Lower rates tend to prepay more slowly and newer loans generally have longer remaining lives. The larger loan balances represent expansion into some higher balance geographic areas as we continue to expand our footprint.
The following is a summary of delinquencies ($UPB) by loan type as of June 30, 2013 and 2012. We consider any loan that is overdue by more than 30 days to be delinquent.
| (in millions) | As of June 30, |
|||||||||||||||
| 2013 |
2012 |
|||||||||||||||
| Adjustable |
Fixed |
Adjustable |
Fixed |
|||||||||||||
| FNMA |
$ | 0.1 | $ | 27.5 | $ | — | $ | 8.4 | ||||||||
| Government Insured |
— | 95.4 | — | 32.8 | ||||||||||||
|
|
|
|
|
|
|
|
|
|||||||||
| Total |
$ | 0.1 | $ | 122.9 | $ | — | $ | 41.2 | ||||||||
|
|
|
|
|
|
|
|
|
|||||||||
Overall our delinquencies remain relatively low which is in line for the age of our portfolio. Delinquencies on government insured loans tend to be higher than FNMA because government insured loan programs are designed for first time home buyers and those borrowers generally have lower down payments. The low amount of delinquency on the Adjustable Rate loans is primarily due to the low percentage of these loans in our portfolio.
Expenses
Expenses increased by 121% during the six months ended June 30, 2013 as compared to the six months ended June 30, 2012. This increase was due primarily to increased loan production and a larger servicing portfolio, which drove a 175% increase in revenues. To accommodate the growth in our loan production and servicing portfolio, we incurred additional expenses related to employee compensation (due to increased staffing levels and incentive compensation costs), and other related general and administrative expenses such as technology costs and retail branch occupancy costs.
-79-
Table of Contents
Salaries, commissions and benefits expense increased $20.1 million (168%) during the six months ended June 30, 2013 compared to the six months ended June 30, 2012 primarily as a result of the increase in our headcount from 254 employees at June 30, 2012 to 652 employees at June 30, 2013. We increased our sales force and support staff to facilitate the growth in our loan originations and mortgage servicing operations. Since origination volumes had increased significantly, the variable commissions paid to employees were also much higher in 2013. The company also increased its contribution to and the quality of the employee benefit packages, including incentive compensation and employee stock options, to continue to attract and retain talent in the markets we serve, which contributed to the increase in 2013.
General and administrative expenses increased $6.4 million (256%) during the six months ended June 30, 2013 compared to the six months ended June 30, 2012 primarily as a result of the increase in loan origination and loan servicing activities as well as $0.9 million of non-deferrable expenses. We also saw an increase in travel and administrative expenses as we expanded our operations into additional states.
Interest expense increased $5.8 million (305%) during the six months ended June 30, 2013 compared to the six months ended June 30, 2012 primarily as a result of the increase in the volume of mortgage loans originated and funded throughout 2012 and the first half of 2013, as well as increased interest expense of $1.5 million associated with the warrants issued to a stockholder in March 2013 (for additional information related to the warrants, refer to “Financings” within the “Liquidity and Capital Resources” section of this MD&A).
Occupancy, equipment and communication expenses increased $2.0 million (182%) during the six months ended June 30, 2013 compared to the six months ended June 30, 2012 primarily as a result of increased facility, system and computer equipment requirements to accommodate increased staffing levels and new retail branches.
The provision for mortgage repurchases and indemnifications increased $0.7 million (233%) during the six months ended June 30, 2013 compared to the six months ended June 30, 2012 primarily as a result of the increase in the volume of mortgage loans originated during the six months ended June 30, 2013.
Depreciation and amortization expense increased $0.6 million (200%) during the six months ended June 30, 2013 compared to the six months ended June 30, 2012 primarily due to increased property and equipment balances as well as amortization expense related to the NattyMac intangible assets acquired during the third quarter of 2012.
Amortization of MSRs and impairment of MSRs decreased $1.4 million and $4.8 million, respectively, during the six months ended June 30, 2013 compared to the six months ended June 30, 2012 as a result of the previously discussed change in our accounting treatment of MSRs.
Income tax expenses were $11.7 million and $2.4 million for the six months ended June 30, 2013 and 2012, respectively, which represented an increase of 388%, which was driven primarily by the growth in our income before income taxes as discussed above.
We anticipate our aggregate servicing operating costs will increase as our portfolio increases in size. Our servicing portfolio is generally of recent vintages and consists of Agency loans which tend to be of higher quality. These characteristics tend to allow our servicing platform to direct most of its efforts on creating processing efficiencies and a solid customer experience rather than addressing legacy delinquencies and resultant high servicing costs. We expect the average cost to service a loan to decrease due to economies of scale, future technology improvements and outsourcing opportunities where deemed appropriate. On a per-loan basis, we also expect that our servicing costs will improve as we spread our fixed capital investments over a larger loan servicing portfolio.
-80-
Table of Contents
Other Factors Influencing Our Results
Prepayment Speeds. A significant driver of our business is prepayment speed, which is the measurement of how quickly unpaid principal balance is reduced. Prepayment speeds, as reflected by the constant prepayment rate, vary according to interest rates, the type of investment, conditions in the housing and financial markets, competition and other factors, none of which can be predicted with any certainty. Prepayment spread impacts future servicing fees, value of servicing rights, float income, interest expense on advances and interest expense. In general, when interest rates rise, it is relatively less attractive for borrowers to refinance their mortgage loans and, as a result, prepayment speeds tend to decrease. This can extend the period over which we earn servicing income but reduce the demand for new mortgage loans. When interest rates fall, prepayment speeds tend to increase, thereby decreasing the value of MSRs and shortening the period over which we earn servicing income but increasing the demand for new mortgage loans.
Changing Interest Rate Environment. Generally, when interest rates rise, the value of mortgage loans and interest rate lock commitments decrease while the value of hedging instruments related to such loans and commitments increases. When interest rates fall, the value of mortgage loans and interest rate lock commitments increases and the value of hedging instruments related to such loans and commitments decrease. Decreasing interest rates also precipitate increased loan refinancing activity by borrowers seeking to benefit from lower mortgage interest rates.
Risk Management Effectiveness—Credit Risk. We are subject to the risk of potential credit losses on all of the residential mortgage loans that we hold for sale or investment as well as for losses incurred by investors in mortgage loans that we sell to them as a result of breaches of representations and warranties we make as part of the loan sales. The representations and warranties require adherence to investor or guarantor origination and underwriting guidelines, including but not limited to the validity of the lien securing the loan, property eligibility, borrower credit, income and asset requirements, and compliance with applicable federal, state and local law. The level of mortgage loan repurchase losses is dependent on economic factors, investor repurchase demand strategies, and other external conditions that may change over the lives of the underlying loans.
Risk Management Effectiveness—Interest Rate Risk. Because changes in interest rates may significantly affect our activities, our operating results will depend, in large part, upon our ability to effectively manage interest rate risks and prepayment risks, including risk arising from the change in value of our inventory of mortgage loans held for sale and commitments to fund mortgage loans and related hedging derivative instruments, as well the effects of changes in interest rates on the value of our investment in MSRs. See “—Quantitative and Qualitative Disclosures about Market Risk” for a discussion on the effects of changes in interest rates on the recorded value of our MSRs.
Liquidity. Our ability to operate profitably is dependent on both our access to capital to finance our assets and our ability to profitably sell and service mortgage loans. An important source of capital for the residential mortgage industry is warehouse financing facilities. These facilities provide funding to mortgage loan producers until the loans are sold to investors or securitized in the secondary mortgage loan market. Our ability to hold loans pending sale and/or securitization depends, in part, on the availability to us of adequate financing lines of credit at suitable interest rates. During any period in which a borrower is not making payments, if we own the MSR then we may be required to advance our own funds to meet contractual principal and interest remittance requirements for investors and advance costs of protecting the property securing the investors’ loan and the investors’ interest in the property. We finance a portion of these advances under bank lines of credit. The ability to obtain capital to finance our servicing advances at appropriate interest rates influences our ability to profitably service delinquent loans. See “—Liquidity and Capital Resources” and “—Contractual Obligations.”
Servicing Effectiveness. Our servicing fee rates for loans serviced for non-affiliates are generally at specified servicing rates that do not change with a loan’s performance status. As a mortgage loan becomes delinquent and moves through the delinquency process to settlement through acquisition of the property or partial
-81-
Table of Contents
payoff, the loan requires greater effort on our part to service. Increased mortgage delinquencies, defaults and foreclosures will therefore result in a higher cost to service those loans due to the increased time and effort required to collect payments from delinquent borrowers. Therefore, how efficiently we are able to maintain the credit quality of our portfolio of serviced mortgage loans and address the mortgage loans where the borrower has defaulted influences the level of expenses that we incur in the mortgage loan servicing process.
Critical Accounting Policies
Our financial accounting and reporting policies are in accordance with GAAP. Some of these accounting policies require us to make estimates and judgments about matters that are uncertain. The application of assumptions could have a material impact on our financial condition or results of operations. Critical accounting policies and related assumptions, estimates and disclosures are determined by management and reviewed periodically with the Audit Committee of the Board of Directors. We believe that the judgments, estimates and assumptions used in the preparation of the consolidated financial statements are appropriate given the factual circumstances at the time. A brief discussion of our most important policies and the nature of the related assumptions and estimates are presented below. For additional information regarding our other significant accounting policies, please refer to Note 2, “Basis of Presentation,” to our unaudited financial statements as of and for the period ended September 30, 2013.
Reserve for Loan Repurchases and Indemnifications
Loans sold to investors by the Company and which met investor and agency underwriting guidelines at the time of sale may be subject to repurchase or indemnification in the event of specific default by the borrower or subsequent discovery that underwriting standards were not met. In limited circumstances, the full risk of loss on loans sold is retained to the extent the liquidation of the underlying collateral is insufficient.
We establish a reserve for mortgage repurchases and indemnifications related to various representations and warranties that reflect management’s estimate of losses for loans for which we could have a repurchase obligation, whether or not we currently service those loans, based on a combination of factors. Such factors include the type of loan, the channel from which it came, loan to value (LTV) and other loan-related specifics. The process for determining the measurement of the liability involves certain unobservable inputs such as estimated repurchase demand and repurchases, and loss severity and is generally subjective and involves a high degree of management judgment and assumptions. These judgments and assumptions may have a significant effect on our measurements of the liability, and the use of different judgments and assumptions, as well as changes in market conditions, could have a material effect on our statements of operations as well as our balance sheets.
Fair Value of Financial Instruments
The Company uses fair value measurements in fair value disclosures and to record certain assets and liabilities at fair value on a recurring basis (such as MSRs, derivative assets and liabilities and loans held for sale) or on a non-recurring basis, such as measuring impairment on assets carried at amortized cost or the lower of amortized cost or fair value (for periods prior to January 1, 2013). The Company has elected fair value accounting for MSRs and loans held for sale, as permitted under current accounting guidance, to more closely align the Company’s accounting with its interest rate risk management strategies.
When observable market prices do not exist for our financial instruments, we estimate fair value primarily by using cash flow and other valuation models. Our valuation models may include adjustments, such as market liquidity and credit quality, where appropriate. Valuations of products using models or other techniques are sensitive to assumptions used for the significant inputs. The process for determining fair value using unobservable inputs, such as discount rates, prepayment speeds, default rates and cost of servicing is generally more subjective and involves a higher degree of management judgment and assumptions than the measurement
-82-
Table of Contents
of fair value using observable inputs. These judgments and assumptions may have a significant effect on our measurements of fair value, and the use of different judgments and assumptions, as well as changes in market conditions, could have a material effect on our statements of operations as well as our balance sheets.
Mortgage Servicing Rights
MSRs are non-financial assets that are created when a mortgage loan is sold and we retain the right to service the loan. The servicing of these loans includes payment processing, remittance of funds to investors, payment of taxes and insurance, collection of delinquent payments, and disposition of foreclosed properties. In return for these services, we receive servicing fee income and ancillary fee income. The MSRs are initially recorded at fair value, which is estimated by using a valuation model that calculates the present value of estimated future net servicing cash flows. The valuation model incorporates assumptions that market participants would use in estimating future net servicing income, including estimates of the cost of servicing, the discount rate, the float value, the inflation rate, estimated prepayment speeds, and default rates. We use a dynamic model to estimate the fair value of our MSRs. The model is validated internally and senior management reviews all significant assumptions quarterly. In addition, we benchmark the performance of our internal model against the results obtained from a third party valuation specialist firm and other market participant information such as surveys, broker quotes, trades in the marketplace, and other observable data.
Effective January 1, 2013, the Company elected to irrevocably account for the subsequent measurement of its existing MSRs using the fair value method, whereby the MSRs are initially recorded on our balance sheet at fair value with subsequent changes in fair value recorded in earnings during the period in which the changes in fair value occur. We believe that accounting for the MSRs at fair value best reflects the impact of current market conditions on our MSRs, and our investors and other users of our financial statements will have greater insight into management’s views as to the value of our MSRs at each reporting date. The fair value of the MSRs is assessed at each reporting date using the methods described above. In accordance with the applicable GAAP guidance, this change in accounting principle was accounted for on a prospective basis (financial statement periods prior to 2013 have not been restated). We did not record a cumulative-effect adjustment to retained earnings as of January 1, 2013, as the net amortized carrying value of the MSRs as of January 1, 2013 equaled the fair value due to MSR impairment charges recorded during 2012.
Prior to January 1, 2013, the subsequent measurement of the Company’s MSRs was recorded using the amortization method. Under the amortization method, capitalized MSRs were initially recorded at fair value and amortized over the estimated economic life of the related loans in proportion to the estimated future net servicing revenue. The net capitalized cost of MSRs was periodically evaluated to determine whether capitalized amounts were in excess of their estimated fair value. For this fair value assessment, the Company stratified its MSRs based on interest rates: (1) those with note rates below 4.00%; (2) those with note rates between 4.00% and 4.99%; and (3) those with note rates above 5.00%. If the amortized book value of the MSRs exceeded its fair value, management recorded a valuation adjustment as a reduction to the mortgage servicing right asset. However, in the event that the fair value of the MSRs recovered, the valuation allowance was reversed.
Derivative Financial Instruments
The Company enters into derivative instruments to serve the financial needs of its customers and to reduce its risk exposure to fluctuations in interest rates. For example, the Company enters into interest rate lock commitments (“IRLCs”) with certain customers to originate residential mortgage loans at specified interest rates and within a specified period of time. IRLCs on mortgage loans that are intended to be sold are accounted for as derivatives, with changes in fair value recorded in the statement of operations as part of gain or loss on sale of mortgage loans. The fair value of an IRLC is based upon changes in the fair value of the underlying mortgages estimated to be realizable upon sale into the secondary market. In estimating the fair value of an IRLC, we also adjust the fair value of the underlying mortgage loan to reflect the estimated percentage of commitments that will result in a closed mortgage loan; our estimate of this percentage will vary based on the age of the underlying commitment and changes in mortgage interest rates.
-83-
Table of Contents
The primary factor influencing the probability that a loan will fund within the terms of the IRLC is the change, if any, in mortgage rates subsequent to the commitment date. In general, the probability of funding increases if mortgage rates rise and decreases if mortgage rates fall. This is due primarily to the relative attractiveness of current mortgage rates compared to the applicant’s committed rate. The probability that a loan will fund within the terms of the IRLC also is influenced by the source of the application, age of the application, purpose of the loan (purchase or refinance) and the application approval rate.
The Company manages the interest rate risk associated with its outstanding IRLCs and loans held for sale by entering into derivative loan instruments, such as forward loan sales commitments and mandatory delivery commitments. For exchange-traded contracts, fair value is based on quoted market prices. For non-exchange traded contracts, fair value is based on dealer quotes, pricing models, and discounted cash flow methodologies. Fair value estimates also take into account counterparty credit risk and the Company’s own credit standing.
Mortgage Loans Held-for-Sale
Loans that are intended to be sold in the foreseeable future, including residential mortgages, are reported as loans held-for-sale. The Company accounts for loans held for sale under the fair value option. Fair value of loans held for sale is typically calculated using observable market information, including pricing from actual market transactions or observable market prices from other loans that have similar collateral, credit, and interest rate characteristics. Gains or losses from the sale of mortgages are recognized based upon the difference between the selling price and fair value of the related loans upon the sale of such loans. Direct mortgage loan origination costs are recognized as noninterest expense at origination.
In order to facilitate the origination and sale of mortgage loans held for sale, we have entered into various agreements with warehouse lenders. These agreements are in the form of loan participations and repurchase agreements with banks and other financial institutions. Mortgage loans held for sale are considered sold when we surrender control over the financial assets and those financial assets are legally isolated from us in the event of our bankruptcy. For loan participations that meet the sale criteria, the transferred financial assets are derecognized from the balance sheet and a gain or loss is recognized upon sale. If the sale criteria are not met, the transfer is recorded as a secured borrowing in which the assets remain on the balance sheet and the proceeds from the transaction are recognized as a liability. We account for all repurchase agreements as secured borrowings.
Business Combinations, including Intangible Assets
As part of the Company’s growth strategy, we acquired certain assets in 2012 related to a single-family residential mortgage loan warehousing platform of third parties that constituted a business combination. In connection with this acquisition, the Company recognized a bargain purchase gain, as well as certain intangible assets, including a trade name, customer relationships, and an active agent list. A significant component of the transaction’s total consideration was contingent and related to deferred purchase price for each mortgage loan subsequently funded, up to a specified maximum amount. The contingent consideration was a significant factor in the determination of the bargain purchase gain. The fair value of the contingent consideration arrangement was determined by Management, with assistance from a third party valuation provider, using the income approach; this method required Management’s estimation of the number of loans which would subsequently be funded, as well as the anticipated timing of the loans being funded. The fair value of the trade name and the customer relationship intangibles were determined using a discounted cash flow method. This method required Management to make estimates related to future revenue, expenses and income tax rates. The fair value of the agent list intangible asset was determined using a cost-to-recreate approach, which required Management to estimate the amount of time it would take to replace the active agent list, as well as future income tax rates.
Intangible assets determined to have a finite life, such as the customer relationships and active agent list, are amortized on a straight-line basis over their useful lives. If events or changes in circumstances indicate that
-84-
Table of Contents
the carrying amounts of finite-lived intangible assets may not be recoverable, Management compares the carrying value to the current fair value (determined in the same manner and with the same assumptions as discussed above) and records any required impairment. Intangible assets that are deemed to have an indefinite life, such as the trade name, are not subject to amortization but rather must be reviewed for impairment annually and more frequently if events or changes in circumstances indicate that it is more likely than not that the assets are impaired. Management exercises judgment in its assessment of qualitative factors in determining whether events or circumstances suggest that it is more likely than not that an indefinite-lived intangible asset is impaired. If Management determines it is more likely than not that the asset is impaired, Management performs a quantitative assessment of current fair value (which incorporates the same assumptions listed above) compared to carrying value and subsequently records any required impairment.
Income Taxes
We determine deferred income taxes using the balance sheet method. Under this method, the net deferred tax asset or liability is based on future tax consequences attributable to the differences between the book and tax bases of assets and liabilities, as well as operating loss and tax credit carry-forwards. Deferred tax assets and liabilities are measured using enacted tax rates expected to apply to taxable income in the years in which those temporary differences are expected to be recovered or settled. The effect of a change in tax rates on deferred tax assets and liabilities is recognized in earnings in the period that includes the enactment date. Deferred income tax expense results from changes in deferred tax assets and liabilities between periods.
Deferred tax assets are recognized subject to management’s judgment that realization is more likely than not. We determine whether a deferred tax asset is realizable based on currently available facts and circumstances, including the Company’s current and projected future tax position, the historical level of our taxable income, and estimates of our future taxable income. In most cases, the realization of deferred tax assets is based on our future profitability. On a quarterly basis, the Company evaluates its deferred tax assets to assess whether they are more likely than not to be realized in the future. If we were to experience either reduced profitability or operating losses in a future period, the realization of our deferred tax assets may no longer be considered more likely than not to be realized. In such an instance, we could be required to record a valuation allowance on our deferred tax assets by charging earnings. Management has analyzed the impact of the private equity offering that occurred on May 15, 2013 and has determined that an ownership change under Section 382 did not occur. The IRS allows for the application of two approaches (the full value methodology and the hold constant principle) for valuing companies when identifying whether a Section 382 ownership change has occurred and requires that the taxpayers apply a consistent method from year to year. The Company applied the full value method in its valuation and analysis of the Section 382 ownership change and, as a result, determined that a Section 382 ownership change did not occur. The Company has determined that no valuation allowance as of September 30, 2013 is necessary for the Company’s deferred tax assets as it is more likely than not that the recorded amounts will be realized.
In 2012, we had a change in ownership as defined by Section 382 of the Code (“Section 382”). Section 382 generally requires a corporation to limit the amount of its income in future years that can be offset by historic taxable losses (i.e. net operating loss carryovers and certain built-in losses) after a corporation has undergone an ownership change of more than 50%. In the event of an ownership change of more than 50%, an annual limitation on the amount of net operating losses available to offset future taxable income is determined by multiplying a federally stated interest rate times the value of the company on the ownership change date. As a result, utilization of certain tax attributes including net operating loss and other carry-forwards are subject to annual limitations. Our deferred tax assets at December 31, 2012 consisted primarily of net operating loss carryforwards, and no valuation allowance was deemed necessary, as we concluded that it is more likely than not that recorded amounts will be realized.
-85-
Table of Contents
Recent Accounting Developments
ASU No. 2013-01, “Balance Sheet (Topic 210): Clarifying the Scope of Disclosures about Offsetting Assets and Liabilities” was issued in January 2013. This update clarifies the scope of transactions that are subject to the disclosures about offsetting, specifically that ordinary trade receivables and receivables are not in the scope of ASU No. 2011-11. ASU No. 2011-11 applies only to derivatives, repurchase agreements and reverse purchase agreements, and securities borrowing and securities lending transactions that are offset in accordance with specific criteria contained in FASB Accounting Standards Codification or subject to a master netting arrangement or similar agreement. ASU 2013-01 is effective for fiscal years beginning on or after January 1, 2013, and interim periods within those annual periods. The adoption of ASU 2013-01 did not materially impact the Company’s financial statements.
ASU No. 2012-02 “Intangibles-Goodwill and Other (Topic 350): Testing Indefinite-Lived Intangible Assets for Impairment” was issued in July 2012. This update simplifies the guidance for testing the decline in realizable value (impairment) of indefinite-lived intangible assets other than goodwill. The amendment allows an entity the option to first assess qualitative factors to determine whether it is necessary to perform the quantitative impairment test. An organization electing to perform a qualitative assessment is no longer required to calculate the fair value of an indefinite-lived intangible asset unless the organization determines, based on a qualitative assessment, that it is “more likely than not” that the asset is impaired. This amendment is effective for annual and interim impairment tests performed for fiscal years beginning after September 15, 2012. The adoption of ASU 2012-02 did not materially impact the Company’s financial statements.
Balance Sheet
The following table presents our balance sheets as of the periods indicated:
| September 30, |
December 31, |
|||||||||||
| (in millions) | 2013 |
2012 |
2011 |
|||||||||
| Assets: |
||||||||||||
| Cash and cash equivalents |
$ | 24.6 | $ | 15.1 | $ | 0.4 | ||||||
| Restricted cash |
20.1 | 3.5 | — | |||||||||
| Mortgage loans held for sale, at fair value |
518.9 | 218.6 | 61.7 | |||||||||
| Derivative assets |
17.1 | 12.0 | 3.3 | |||||||||
| MSRs, at fair value |
132.9 | — | — | |||||||||
| MSRs, at lower of amortized cost or fair value |
— | 42.2 | 17.7 | |||||||||
| Property and equipment, net |
7.9 | 4.0 | 1.7 | |||||||||
| Intangible assets, net |
3.3 | 3.6 | — | |||||||||
| Other assets |
24.1 | 10.6 | 4.3 | |||||||||
|
|
|
|
|
|
|
|||||||
| Total Assets |
$ | 748.9 | $ | 309.6 | $ | 89.1 | ||||||
|
|
|
|
|
|
|
|||||||
| Liabilities and stockholders’ equity: |
||||||||||||
| Secured borrowings |
$ | 272.6 | $ | 102.7 | $ | 57.9 | ||||||
| Warehouse lines of credit |
194.7 | 100.3 | — | |||||||||
| Operating lines of credit |
4.7 | 5.1 | 8.2 | |||||||||
| Accounts payable and accrued expenses |
22.8 | 18.7 | 5.0 | |||||||||
| Derivative Liabilities |
23.8 | 1.8 | 1.0 | |||||||||
| Reserve for mortgage repurchases and indemnifications |
3.2 | 1.9 | — | |||||||||
| Deferred income taxes, net |
26.9 | 14.4 | 3.7 | |||||||||
| Other liabilities |
16.3 | 9.5 | 2.9 | |||||||||
|
|
|
|
|
|
|
|||||||
| Total Liabilities |
565.0 | 254.4 | 78.7 | |||||||||
|
|
|
|
|
|
|
|||||||
| Total Stockholders’ Equity |
183.9 | 55.2 | 10.4 | |||||||||
|
|
|
|
|
|
|
|||||||
| Total liabilities and stockholders’ equity |
$ | 748.9 | $ | 309.6 | $ | 89.1 | ||||||
|
|
|
|
|
|
|
|||||||
-86-
Table of Contents
Assets
Restricted cash consists of amounts restricted under broker margin account agreements.
Mortgage loans held for sale were $518.9 million at September 30, 2013, an increase of $300.3 million from December 31, 2012, primarily due to $6.0 billion in mortgage loan sales offset by $6.3 billion of loan originations during the nine months ended September 30, 2013. Mortgage loans held for sale are carried at fair value. We estimate fair value by evaluating a variety of market indicators including recent trades and outstanding commitments. Mortgage loans held for sale were $218.6 million at December 31, 2012, an increase of $156.9 million from December 31, 2011, primarily due to $3.3 billion in mortgage loan sales offset by $3.5 billion loan originations during the year ended December 31, 2012.
The following summarizes mortgage loans held for sale at fair value at September 30, 2013 and December 31, 2012 and 2011:
| (in millions) | September 30, |
December 31, |
||||||||||
| 2013 |
2012 |
2011 |
||||||||||
| Conventional |
$ | 312.7 | $ | 110.5 | $ | 27.7 | ||||||
| Government |
204.8 | 108.1 | 34.0 | |||||||||
| Non-agency Jumbo |
1.4 | — | — | |||||||||
|
|
|
|
|
|
|
|||||||
| Total |
$ | 518.9 | $ | 218.6 | $ | 61.7 | ||||||
|
|
|
|
|
|
|
|||||||
At September 30, 2013, we had pledged $496.6 million, in fair value of mortgage loans held for sale to secure borrowings under our mortgage funding arrangements with the remaining $22.2 million funded with the Company’s excess cash. At December 31, 2012 and 2011, we had pledged $218.6 million and $61.7 million, respectively, in fair value of mortgage loans held for sale to secure warehouse lines of credit.
The following summarizes derivative instruments at September 30, 2013 and December 31, 2012 and 2011:
| (in millions) | September 30, 2013 |
December 31, 2012 |
December 31, 2011 |
|||||||||||||||||||||
| Description | Net Fair Value |
Notional |
Net Fair |
Notional |
Net Fair Value |
Notional |
||||||||||||||||||
| Interest rate lock commitments |
$ | 16.6 | $ | 1,348.3 | $ | 12.0 | $ | 1,140.0 | $ | 3.3 | $ | 112.1 | ||||||||||||
| MBS forward sales contracts |
(23.4 | ) | 1,732.3 | (1.8 | ) | 967.8 | (1.0 | ) | 153.3 | |||||||||||||||
|
|
|
|
|
|
|
|
|
|
|
|
|
|||||||||||||
| Total |
$ | (6.8 | ) | $ | 3,080.6 | $ | 10.2 | $ | 2,107.8 | $ | 2.3 | $ | 265.4 | |||||||||||
|
|
|
|
|
|
|
|
|
|
|
|
|
|||||||||||||
We recorded net gains (losses) on derivatives of $(17.0) million and $4.1 million for the nine months ended September 30, 2013 and 2012, respectively, which are included in gain on mortgage loans held for sale in our statement of operations. We recorded net gains on derivatives of $7.9 million and $3.2 million for the years ended December 31, 2012 and 2011, respectively, which are included in gain on mortgage loans held for sale in our statement of operations.
We sell residential mortgage loans in the secondary market and typically retain the right to service the mortgage loans sold. Upon sale, a mortgage servicing right asset or liability is capitalized, which represents the current fair value of future net cash flows expected to be realized for performing servicing activities.
Effective January 1, 2013, the Company elected to irrevocably account for the subsequent measurement of its existing MSRs using the fair value method, whereby the MSRs are initially recorded on our balance sheet at fair value with subsequent changes in fair value recorded in earnings during the period in which the changes in fair value occur. The fair value of the MSRs is assessed at each reporting date using the methods described above
-87-
Table of Contents
in “Critical Accounting Policies.” In accordance with the applicable GAAP guidance, this change in accounting principle was accounted for on a prospective basis (financial statement periods prior to 2013 have not been restated). We did not record a cumulative-effect adjustment to retained earnings as of January 1, 2013, as the net amortized carrying value of the MSRs as of January 1, 2013 equaled the fair value due to MSR impairment charges recorded during 2012.
Prior to January 1, 2013, the subsequent measurement of the Company’s MSRs was recorded at the lower of amortized cost or estimated fair value (the “amortization method”). Under the amortization method, capitalized MSRs were initially recorded at fair value and amortized over the estimated economic life of the related loans in proportion to the estimated future net servicing revenue. The net capitalized cost of MSRs was periodically evaluated to determine whether capitalized amounts were in excess of their estimated fair value. For this fair value assessment, the Company stratified its MSRs based on interest rates: (1) those with note rates below 4.00%; (2) those with note rates between 4.00% and 4.99%; and (3) those with note rates above 5.00%. If the amortized book value of the MSRs exceeded its fair value, management recorded a valuation adjustment as a reduction to the mortgage servicing right asset. However, in the event that the fair value of the mortgage servicing right recovered, the valuation allowance was reversed.
A summary of changes in the balance of the mortgage servicing right asset and the related valuation allowance for the nine months ended September 30, 2013 and 2012 and for the years ended December 31, 2012 and 2011 is as follows:
| (in millions) | Nine Months |
Year Ended December 31, |
||||||||||||||
| 2013 |
2012 |
2012 |
2011 |
|||||||||||||
| MSRs: |
||||||||||||||||
| Balance at the beginning of period |
$ | 42.2 | $ | 17.7 | $ | 17.7 | $ | 7.1 | ||||||||
| MSRs received as proceeds from loan sales |
79.1 | 23.7 | 39.9 | 11.5 | ||||||||||||
| Amortization |
— | (2.6 | ) | (3.7 | ) | (0.9 | ) | |||||||||
| Impairment |
— | (5.5 | ) | (11.7 | ) | — | ||||||||||
| Change in fair value: |
||||||||||||||||
| Changes in valuation inputs and assumptions |
17.8 | — | — | — | ||||||||||||
| Actual portfolio runoff (payoffs and principal amortization) |
(6.2 | ) | — | — | — | |||||||||||
|
|
|
|
|
|
|
|
|
|||||||||
| Balance at end of period |
$ | 132.9 | $ | 33.3 | $ | 42.2 | $ | 17.7 | ||||||||
|
|
|
|
|
|
|
|
|
|||||||||
Because we carried our MSRs at fair value (at both initial recognition and subsequent measurement) during the nine months ended September 30, 2013, we did not record any impairment charges against our MSRs. We recorded $5.5 million in impairments for the nine month period ended September 30, 2012. Such impairments were $11.7 million for the year ended December 31, 2012 and no impairments for the year ended December 31, 2011.
The following summarizes property and equipment, net at September 30, 2013 and at December 31, 2012 and 2011:
| September 30, |
December 31, |
|||||||||||
| (in millions) | 2013 |
2012 |
2011 |
|||||||||
| Internally developed computer software |
$ | 2.3 | $ | 0.9 | $ | 0.6 | ||||||
| Purchased computer software and equipment |
4.6 | 2.5 | 0.8 | |||||||||
| Furniture and office equipment |
2.7 | 1.7 | 0.9 | |||||||||
| Leasehold improvements |
0.7 | 0.3 | 0.3 | |||||||||
|
|
|
|
|
|
|
|||||||
| Total |
10.3 | 5.4 | 2.6 | |||||||||
| Less accumulated depreciation |
(2.4 | ) | (1.4 | ) | (0.9 | ) | ||||||
|
|
|
|
|
|
|
|||||||
| Total |
$ | 7.9 | $ | 4.0 | $ | 1.7 | ||||||
|
|
|
|
|
|
|
|||||||
-88-
Table of Contents
Property and equipment, net increased $3.9 million from December 31, 2012 to September 30, 2013 as we continued to invest in computer equipment and our proprietary technology platform. Property and equipment, net increased $2.3 million from December 31, 2011 to $4.0 million at December 31, 2012 as we invested in information technology systems to support volume growth in both our servicing and originations components.
Liabilities and Stockholders’ Equity
As of September 30, 2013 and 2012 and December 31, 2012 and 2011, we had no long-term borrowings outstanding.
See “Liquidity and Capital Resources—Financings” below for a discussion of our lines of credit.
Included in our liabilities is our reserve for mortgage repurchases and indemnifications of $3.2 million at September 30, 2013 and $1.9 million at December 31, 2012. We had no reserve for repurchases and indemnifications at December 31, 2011. This liability represents our (i) estimate of losses to be incurred on the repurchase of certain loans that we previously sold and (ii) estimate of losses to be incurred for indemnification of losses incurred by purchasers or insurers with respect to loans that we sold. Certain sale contracts include provisions requiring us to repurchase a loan or indemnify the purchaser or insurer for losses if a borrower fails to make certain initial loan payments due to the acquirer or if the accompanying mortgage loan fails to meet certain customary representations and warranties. These representations and warranties are made to the loan purchasers or insurers about various characteristics of the loans, such as the manner of origination, the nature and extent of underwriting standards applied and the types of documentation being provided and typically are in place for the life of the loan. Although the representations and warranties are in place for the life of the loan, we believe that most repurchase requests occur within the first five years of the loan. In the event of a breach of the representations and warranties, we may be required to either repurchase the loan or indemnify the purchaser for losses it sustains on the loan. In addition, an investor may request that we refund a portion of the premium paid on the sale of mortgage loans if a loan is prepaid within a certain amount of time from the date of sale. We record a provision for estimated repurchases, loss indemnification and premium recapture on loans sold, which is charged to gain (loss) on mortgage loans held for sale.
The following is a summary of changes in the reserve for mortgage repurchases and indemnifications for the nine months ended September 30, 2013 and 2012 and the years ended December 31, 2012 and 2011:
| September 30, |
December 31, |
|||||||||||||||
| (in millions) | 2013 |
2012 |
2012 |
2011 |
||||||||||||
| Balance, beginning of the year |
$ | 1.9 | $ | — | $ | — | $ | — | ||||||||
| Provision for mortgage repurchases and indemnifications |
1.4 | 0.8 | 1.9 | — | ||||||||||||
| Losses on repurchases and indemnifications |
(0.1 | ) | — | — | — | |||||||||||
|
|
|
|
|
|
|
|
|
|||||||||
| Balance, end of the year |
$ | 3.2 | $ | 0.8 | $ | 1.9 | $ | — | ||||||||
|
|
|
|
|
|
|
|
|
|||||||||
Because of the uncertainty in the various estimates underlying the mortgage repurchase and indemnifications liability, there is a range of losses in excess of the recorded mortgage repurchase and indemnifications liability that is reasonably possible. The estimate of the range of possible loss for representations and warranties does not represent a probable loss, and is based on current available information, significant judgment, and a number of assumptions that are subject to change. The high end of this range of reasonably possible losses in excess of the Company’s recorded reserve was approximately $2.4 million at September 30, 2013 and was determined based upon modifying the assumptions (particularly to assume significant changes in investor repurchase demand practices) utilized in the Company’s best estimate of probable loss to reflect what the Company believes to be the high end of the reasonably possible adverse assumptions.
-89-
Table of Contents
Liquidity and Capital Resources
Overview
Liquidity measures our ability to meet potential cash requirements, including the funding of servicing advances, the payment of operating expenses, the originations of loans and the repayment of borrowings. Our unrestricted cash balance increased from $15.1 million as of December 31, 2012 to $24.6 million as of September 30, 2013, primarily due to cash inflows in our financing activities including net proceeds from borrowings under our mortgage participations, warehouse and operating lines of credit and net proceeds of $104.6 million from our May 2013 private offering, partially offset by cash outflows from operating and investing activities. We have experienced negative operating cash flows in 2013 due to the cash investment in the creation of the MSR asset, the timing of originations versus loan sales, the related increase in inventory and the increase in derivative assets related to the locked loan pipeline. The negative operating cash flows will continue in the future as we grow originations to increase the loan servicing portfolio. As the servicing fees collected from borrowers increases as the portfolio size increases, the operating cash flows are expected to increase.
Our primary sources of funds for liquidity include: (i) secured borrowings in the form of repurchase facilities and participation agreements with major financial institutions, as well as our warehouse lines of credit and operating lines of credit, (ii) private equity offerings, (iii) servicing fees and ancillary fees, (iv) payments received from sales or securitizations of loans, and (v) payments received from mortgage loans held for sale. Our primary uses of funds for liquidity include: (i) originations of loans, (ii) funding of servicing advances, (iii) payment of interest expenses, (iv) payment of operating expenses, (v) repayment of borrowings, and (vi) payments for acquisitions of MSRs.
Our financing strategy primarily consists of using repurchase facilities and participation agreements with major financial institutions, as well as regional and community banks. We believe this provides us with a stable, low cost, diversified source of funds to finance our business. See “—Financings” below. During the remainder of 2013 and into 2014, we intend to expand our network of regional banks and add a collateralized commercial paper facility giving us even more diversification and lower cost of funds. We acquired our financing platform from NattyMac in the third quarter of 2012, fully integrated the platform into our mortgage banking operations in December of 2012 and launched NattyMac’s warehouse financing operations during July 2013. The financing platform features a centralized custodian and disbursement agent located in our St. Petersburg, Florida facilities.
During July 2013 we introduced our warehouse lending products to our correspondent customers, and have yet to accumulate a significant level of warehouse lending assets. We are financing the introductory stages of building our warehousing assets through the use of cash on hand, and we are discussing the expansion of the financing facilities with our financial institution partners to encompass the financing of warehouse lines of credit. We believe that we will reach agreement with one or more financial partners to finance the warehouse lending assets created at NattyMac under terms that allow for the continued expansion of the NattyMac program.
At this time, we see no material negative trends that we believe would affect our access to long-term or short-term borrowings to maintain our current operations, or would likely cause us to cease to be in compliance with any applicable covenants in our indebtedness or that would inhibit our ability to fund operations and capital commitments for the next 12 months.
Our servicing agreements impose on us various rights and obligations that affect our liquidity. Among the most significant of these obligations is the requirement that we advance our own funds to meet contractual principal and interest payments for certain investors and to pay taxes, insurance, foreclosure costs and various other items that are required to preserve the assets being serviced. Delinquency rates and prepayment speed affect the size of servicing advance balances. These advances are typically recovered upon weekly or monthly reimbursements or from sale in the market.
-90-
Table of Contents
Because our servicing portfolio is generally of recent vintages and also because the servicing portfolio is primarily comprised of FNMA and GNMA servicing (which are generally of higher quality), the amount of delinquency and therefore advances for our current portfolio, are expected to be low. As of September 30, 2013, our servicing advances were $2.0 million, or less than 0.1%, of the unpaid principal balance of the servicing portfolio. We finance these advances using cash on hand. We are not currently anticipating that the servicing advance asset will grow in the near future beyond our capacity of financing the asset using available cash. If the servicing advances become a sizable asset on our balance sheet, we will negotiate a servicing advance facility with one or more of our financial partners, which we believe to be readily available in the market.
We intend to continue to seek opportunities to acquire loan servicing portfolios and/or businesses that engage in loan servicing and/or loan originations. Future acquisitions could require substantial additional capital in excess of cash from operations. We would expect to finance the capital required for acquisitions through a combination of additional issuances of equity, corporate indebtedness, asset-backed acquisition financing and/or cash from operations.
In May 2013, we completed our private offering of 6,388,889 shares of common stock (including 833,333 shares exercised pursuant to an overallotment option granted to the initial purchaser) at a price per share of $18.00, resulting in net proceeds of $107.3 million, after deducting the initial purchaser’s discount and placement fee of $7.7 million. We used $10 million of the gross proceeds to repay subordinated debt to a stockholder, while the remaining funds will be used to make investments relating to our business and for general corporate purposes.
In October 2013, we completed our initial public offering of 8,165,000 shares of common stock (including 1,065,000 shares exercised pursuant to an overallotment option granted to the underwriters) at a price to the public of $16.00 per share, resulting in net proceeds of $123.9 million after deducting underwriting discounts and commissions of approximately $6.7 million. We intend to use the net proceeds of this offering to make investments related to our business and for other general corporate purposes. Additionally, we may choose to expand our business through acquisitions of or investments in other businesses using cash or shares of our common stock.
Capital Resources
We are subject to various regulatory capital requirements administered by the Department of Housing and Urban Development (“HUD”), which governs non-supervised, direct endorsement mortgagees, and GNMA, which governs issuers of GNMA securities. Additionally, we are required to maintain minimum net worth requirements for many of the states in which we sell and service loans. Each state has its own minimum net worth requirement, which range from $0 to $1 million, depending on the state.
Failure to meet minimum capital requirements can result in certain mandatory and possibly additional discretionary remedial actions by regulators that, if undertaken, could (i) remove our ability to sell and service loans to or on behalf of the Agencies and (ii) have a direct material effect on our financial statements. In accordance with the regulatory capital guidelines, we must meet specific quantitative measures of assets, liabilities and certain off-balance sheet items calculated under regulatory accounting practices. Further, changes in regulatory and accounting standards, as well as the impact of future events on our results, may significantly affect our net worth adequacy. As of September 30, 2013, we met all minimum net worth requirements to which we were subject.
Financings
Our financing strategy primarily consists of using repurchase facilities and participation agreements with major financial institutions, as well as regional and community banks. We believe this provides us with a stable, low cost, diversified source of funds to finance our business. In 2013, we intend to expand our network of regional banks and large financial institution repurchase agreement facilities giving us even more diversification and lower cost of funds.
-91-
Table of Contents
We acquired our financing platform from NattyMac in the third quarter of 2012, fully integrated the platform into our mortgage banking operations in December of 2012 and launched NattyMac’s warehouse financing operations during July 2013. The financing platform features a centralized custodian and disbursement agent located in our St. Petersburg, Florida facilities to effectively manage collateral and funding of loans, and participation arrangements with smaller regional banks to provide revenue and a stable source of funding.
At September 30, 2013 and at December 31, 2012 and 2011, we had no long-term borrowings outstanding. Short-term borrowings were as follows as of September 30, 2013 and as of December 31, 2012 and 2011:
| September 30, |
December 31, |
|||||||||||||||||||||||
| 2013 |
2012 |
2011 |
||||||||||||||||||||||
| Amounts |
Weighted |
Amounts |
Weighted |
Amounts |
Weighted |
|||||||||||||||||||
| (dollars in millions) | ||||||||||||||||||||||||
| Secured borrowings |
$ | 272.6 | 2.65 | % | $ | 102.7 | 3.35 | % | $ | 57.9 | 4.03 | % | ||||||||||||
| Warehouse lines of credit |
194.7 | 2.33 | % | 100.3 | 2.59 | % | — | N/A | ||||||||||||||||
| Operating lines of credit |
4.7 | 4.04 | % | 5.1 | 4.17 | % | 8.2 | 4.24 | % | |||||||||||||||
|
|
|
|
|
|
|
|||||||||||||||||||
| $ | 472.0 | $ | 208.1 | $ | 66.1 | |||||||||||||||||||
|
|
|
|
|
|
|
|||||||||||||||||||
We maintain mortgage participation and warehouse lines of credit (collectively referred to as “mortgage funding arrangements”) with various financial institutions, primarily to fund the origination of mortgage loans which are subject to participation. As of September 30, 2013, there were seven mortgage funding arrangements, two with Merchants Bank of Indiana, two with Bank of America, N.A., one with Barclays Bank PLC, one with Bank of Virginia and one with Merit Bank, with a total maximum borrowing capacity of $962.0 million, of which $467.3 million was outstanding. As of December 31, 2012, there were four mortgage funding arrangements, two with Merchants Bank of Indiana, one with Barclays Bank PLC and one with Bank of Virginia, with a total size of $367.0 million, of which $203.0 million was outstanding. As of December 31, 2011, there were two mortgage funding arrangements, one with Merchants Bank of Indiana and one with Merit Bank, with a total size of $110.0 million, of which $57.9 million was outstanding. Each mortgage funding arrangement is collateralized by the underlying mortgage loans and related documents and instruments.
-92-
Table of Contents
The following table summarizes the amounts outstanding, interest rates and maturity dates under the mortgage funding arrangements as of September 30, 2013 and as of December 31, 2012 and 2011:
| September 30, 2013 | ||||||||
| Mortgage Funding Arrangement |
Amount |
Interest Rate |
Maturity Date | |||||
| Merchants Bank of Indiana |
$ | 273.8 | Same as the underlying mortgage rates/prime plus applicable margin | June 2014 | ||||
| Barclays Bank PLC |
127.1 | Libor plus applicable margin | December 2013 | |||||
| Bank of Virginia |
— | Same as the underlying mortgage rates |
November 2013 | |||||
| Bank of America, N.A. |
66.4 | Libor plus applicable margin | February 2014 | |||||
| Merit Bank |
|
— |
|
Same as the underlying mortgage rates | Not specified | |||
|
|
|
|||||||
| Total |
$ | 467.3 | ||||||
|
|
|
|||||||
| December 31, 2012 | ||||||||
| Mortgage Funding Arrangement |
Amount |
Interest Rate |
Maturity Date | |||||
| Merchants Bank of Indiana |
$ | 102.7 | Same as the underlying mortgage rates |
May 2013 | ||||
| Barclays Bank PLC |
100.3 | Libor plus applicable margin | December 2013 | |||||
| Bank of Virginia |
— | Same as the underlying mortgage rates |
November 2013 | |||||
|
|
|
|||||||
| Total |
$ | 203.0 | ||||||
|
|
|
|||||||
| December 31, 2011 | ||||||||
| Mortgage Funding Arrangement |
Amount |
Interest Rate |
Maturity Date | |||||
| Merchants Bank of Indiana |
$ | 57.9 | Same as the underlying mortgage rates |
May 2012 | ||||
| Merit Bank |
— | Same as the underlying mortgage rates |
Not specified | |||||
|
|
|
|||||||
| Total |
$ | 57.9 | ||||||
|
|
|
|||||||
We intend to renew the mortgage funding arrangements when they mature. All mortgage funding arrangement interest rates represent short-term rates consistent with prevailing market rates.
An alternative to financing mortgage loans with a warehouse line of credit is selling a participation interest in the related loans to a financial institution. As of September 30, 2013, we had a total of $470 million in loan participation limit that expires at various dates through June 2014. The lenders may cancel the agreements with written notice.
In January 2009, we entered into an operating line of credit agreement with Merchants Bank of Indiana to borrow up to $7.2 million, which was amended and restated in June 2013. The current agreement expires June 30, 2014. Interest under the agreement is at the prime rate (with a floor of 4%) per annum. The line is collateralized by the net servicing fee cash flows from and proceeds on Agency approved sales of MSRs. Amounts outstanding under the line amounted to $4.0 million, $4.4 million and $7.2 million at September 30, 2013, December 31, 2012 and December 31, 2011, respectively.
-93-
Table of Contents
In April 2009, we entered into a master loan participation and servicing agreement with Merit Bank. The master loan participation and servicing agreement will terminate when all mortgage loans have been paid in full or, following default on the mortgage loans, we have completed all obligations under the agreement regarding the management and sale of mortgaged property, unless terminated earlier under certain circumstances provided for therein. The master loan participation and servicing agreement provides that we may transfer to Merit Bank beneficial ownership interests in qualifying, individual residential loans. The aggregate limit of unpaid principal balance under the Merit Bank Agreement is $10.0 million.
In May 2011, we entered into a mortgage warehouse and security agreement with Merchants Bank of Indiana, which was amended and restated in June 2013. The mortgage warehouse loan and security agreement states that Merchants Bank of Indiana will establish a line of credit for us secured by our pledge of certain residential mortgage loans and the related mortgage documents to Merchants Bank. The maximum principal amount of the line of credit was $2.0 million at September 30, 2013.
In April 2009, we entered into a $1 million operating line of credit agreement with Merit Bank, which was amended and restated in June 2013. The current agreement expires December 31, 2013. Interest under the agreement is between 5.25% and 6% per annum. The line is collateralized by our stock in a closely held investment and the net servicing fee cash flows from and proceeds on Agency approved sales of MSRs. The amounts outstanding under the line amounted to $0.7 million, $0.7 million and $1.0 million at September 30, 2013, December 31, 2012 and December 31, 2011, respectively.
The above agreements contain covenants which include certain financial requirements, including maintenance of minimum tangible net worth, maximum debt to tangible net worth ratio, minimum liquidity, minimum current ratio, minimum profitability, and limitations on additional debt and transactions with affiliates, as defined in the agreement. We were in compliance with all significant covenants at September 30, 2013, December 31, 2012 and December 31, 2011.
On July 1, 2013, we entered into an amended and restated master participation agreement with Merchants Bank of Indiana. Merchants Bank of Indiana’s commitment to purchase mortgage loans pursuant to the amended and restated master participation agreement will terminate on June 30, 2014, unless terminated earlier under certain circumstances provided for therein. Such amended and restated master participation agreement provides that we may, from time to time, sell to Merchants Bank of Indiana undivided beneficial ownership interests in qualifying, single-family mortgage loans. The aggregate limit of unpaid principal balance under the amended and restated master participation agreement was $400 million at September 30, 2013.
On November 19, 2012, we entered into a master loan participation and servicing agreement with Bank of Virginia. The master loan participation and servicing agreement provides that we may, from time to time, sell to Bank of Virginia beneficial ownership interests in qualifying, single-family mortgage loans. The aggregate limit of unpaid principal balance under the Bank of Virginia Agreement is $60 million. There were no amounts outstanding under this agreement as of September 30, 2013. This agreement expired in November 2013.
On July 30, 2013, we entered into a mortgage loan participation purchase and sale agreement with Barclays Bank PLC. The mortgage loan participation purchase and sale agreement will terminate at the earliest to occur of (i) December 23, 2013, (ii) the termination of the master repurchase agreement with Barclays Bank PLC or, (iii) at the option of Barclays, the occurrence of a servicing termination event after the expiration of any applicable grace period. The mortgage loan participation purchase and sale agreement states that we may, from time to time, sell all of our beneficial right, title and interest in and to designated pools of single-family residential mortgage loans eligible in the aggregate to back securities, and in and to the servicing rights related thereto. The aggregate transaction limit is $300 million for both the master repurchase agreement and the mortgage loan participation purchase and sale agreement.
On February 28, 2013, we entered into a master repurchase agreement with Bank of America, N.A. under which, from time to time, we may transfer to Bank of America certain residential mortgage loans and/or
-94-
Table of Contents
other mortgage related assets and interests, against the transfer of funds by Bank of America, with a simultaneous agreement by Bank of America to sell to us those purchased assets at a specified date or on demand after the purchase date, against the transfer of funds by us. Under the master repurchase agreement, Bank of America will enter into transactions with us provided that the aggregate outstanding purchase price as of any date shall not exceed $100 million, and the aggregate outstanding purchase price for any type of transaction shall not exceed the applicable type sublimit.
On March 29, 2013, we entered into a term loan agreement with Stonegate Investors Holdings, LLC, our principal stockholder, to borrow a bridge loan in the principal amount of $10.0 million maturing on or before September 30, 2013 at a rate per annum equal to 5% compounded monthly commencing on the closing date and ending May 31, 2013, and thereafter at a rate per annum equal to 12.5% compounded monthly. Under the terms of the term loan agreement, we issued warrants to Stonegate Investors Holdings, LLC for the right to purchase 277,777 shares of our common stock at a price of $18.00 per share. (Stonegate Investors Holdings, LLC has since transferred warrants to purchase a total of 39,062 shares of our common stock to its affiliate, Long Ridge Equity Partners, LLC, and to Glick Pluchenik 2011 Trust.) The term loan agreement matured upon the consummation of our private equity offering in May 2013 and was repaid in full with $4.3 million of cash and 314,147 shares of our common stock, at a per share price of $18.00, totaling $5.7 million, which were issued in our May 2013 private offering for the remaining balance on the term loan. The warrants are exercisable at any time through March 29, 2018. Because the warrants meet the criteria of a derivative financial instrument that is indexed to the Company’s own stock, the warrants’ allocable fair value of $1.5 million was recorded as a debt discount. The debt discount was fully amortized into interest expense upon repayment of the term loan in full, resulting in $1.5 million of interest expense during the nine months ended September 30, 2013.
On June 24, 2013, we entered into a mortgage loan participation purchase and sale agreement with Bank of America, N.A. under which, from time to time, we may sell to Bank of America beneficial ownership interests in designated pools of qualifying, residential mortgage loans and the servicing rights relating thereto. The mortgage loan participation purchase and sale agreement will terminate in February 2014, unless terminated earlier under certain circumstances provided for therein. Under the mortgage loan participation purchase and sale agreement, Bank of America may enter into transactions with us to purchase participation certificates provided that the aggregate purchase price of such participation certificates as of any date shall not exceed $100 million.
Transfers of Financial Assets
We sell residential mortgage loans to or pursuant to programs sponsored by Fannie Mae or Ginnie Mae. We have continuing involvement in mortgage loans sold through servicing arrangements and the liability for loan indemnifications and repurchases under the representations and warranties we make to the purchasers and insurers of the loans we sell. We are exposed to interest rate risk through our continuing involvement with mortgage loans sold, including the mortgage servicing right asset, as the value of the asset fluctuates as changes in interest rates impact borrower prepayment on the underlying mortgage loans.
All mortgage loans we sell are sold on a non-recourse basis; however, representations and warranties are made that are customary for loan sale transactions, including eligibility characteristics of the mortgage loans and underwriting responsibilities, in connection with the sales of these assets.
In order to facilitate the origination and sale of mortgage loans held for sale, we have entered into various agreements with lenders. These agreements are in the form of loan participations and repurchase agreements with banks and other financial institutions. Mortgage loans held for sale are considered sold when we surrender control over the financial assets and those financial assets are legally isolated from us in the event of our bankruptcy. For loan participations and repurchase agreements that meet the sale criteria, the transferred financial assets are derecognized from the balance sheet and a gain or loss is recognized upon sale. If the sale criteria are not met, the transfer is recorded as a secured borrowing in which the assets remain on the balance sheet and the proceeds from the transaction are recognized as a liability. We account for all repurchase agreements as secured borrowings.
-95-
Table of Contents
From time to time, we may sell loans whereby the underlying risks and cash flows of the mortgage loan have been transferred to a third party through the issuance of participating interests. The terms and conditions of these interests are governed by the participation agreements. In the instances where the loan participation has qualified for sale treatment, we will act as an agent on behalf of the participating entity when negotiating the terms of the ultimate sale of the underlying mortgage loan to the government sponsored entities (FNMA and GNMA). We receive a marketing fee paid by the participating entity upon completion of the sale. In addition, we also service the underlying mortgage loans pursuant to a participation agreement for the period that the participating interests are outstanding.
Off Balance Sheet Arrangements
As of September 30, 2013, we did not have any off-balance sheet arrangements.
Contractual Obligations
Our estimated contractual obligations as of December 31, 2012 are as follows:
| Payments Due by Period |
||||||||||||||||||||
| (dollars in millions) | Total |
Less than |
1-3 Years |
3-5 Years |
More than |
|||||||||||||||
| Warehouse lines of credit (1) |
$ | 209.0 | $ | 209.0 | $ | — | $ | — | $ | — | ||||||||||
| Operating lines of credit (1) |
5.4 | 5.4 | — | — | — | |||||||||||||||
| Operating lease obligations (2) |
10.3 | 1.6 | 2.8 | 2.0 | 3.9 | |||||||||||||||
| Liability for mortgage repurchases and indemnifications |
1.9 | — | 0.3 | 1.0 | 0.6 | |||||||||||||||
| Earn-out liability (3) |
2.1 | 1.2 | 0.9 | — | — | |||||||||||||||
|
|
|
|
|
|
|
|
|
|
|
|||||||||||
| Total contractual obligations |
$ | 228.7 | $ | 217.2 | $ | 4.0 | $ | 3.0 | $ | 4.5 | ||||||||||
|
|
|
|
|
|
|
|
|
|
|
|||||||||||
| (1) | Includes estimated interest expense. |
| (2) | Represents lease obligations for office space and equipment under non-cancelable operation lease agreements. |
| (3) | Represents contingent consideration related to our acquisition of NattyMac’s single-family mortgage loan warehousing business during 2012. Contingent consideration is based on our obligation to pay $75.0 (whole dollars) for each mortgage loan subsequently funded through the acquired warehouse. For additional information, see Note R “Business Combination” to our audited financial statements for years ended December 31, 2012 and 2011. |
In addition to the above contractual obligations, the Company also had commitments to originate mortgage loans of $1,140.0 million as of December 31, 2012. Commitments to originate mortgage loans do not necessarily reflect future cash requirements as some commitments are expected to expire without being drawn upon and, therefore, those commitments have been excluded from the table above.
Quantitative and Qualitative Disclosures about Market Risk
Market risk is defined as the sensitivity of income, fair value measurements and capital to changes in interest rates, foreign currency exchange rates, commodity prices and other relevant market rates or prices. The primary market risks that we are exposed to are interest rate risks and the price risk associated with changes in interest rates. Interest rate risk is defined as risk to current or anticipated earnings or capital arising from movements in interest rates. Price risk is defined as the risk to current or anticipated earnings or capital arising from changes in the value of either assets or liabilities that are entered into as part of distributing or managing risk.
For the Company, interest rate risk and price risk arise from the financial instruments and positions we hold. This includes mortgage loans held for sale, mortgage servicing rights, and derivative financial instruments. Due to the nature of our operations, we are not subject to foreign currency exchange or commodity price risk.
-96-
Table of Contents
Our interest rate risk and the price risk associated with changes in interest rates are managed by a group of executive managers which identifies and manages the sensitivity of earnings or capital to changing interest rates to achieve our overall financial objectives. The members of this group include the Chief Financial Officer, acting as the chair, the Chief Executive Officer and other members of management. The committee meets monthly and is responsible for:
| • | understanding the nature and level of the Company’s interest rate risk and interest rate sensitivity; |
| • | assessing how that risk fits within our overall business strategies; and |
| • | ensuring an appropriate level of rigor and sophistication in the risk management process for the overall level of risk. |
Credit Risk
We have exposure to credit loss in the event of contractual non-performance by our trading counterparties and counterparties to the over-the-counter derivative financial instruments that we use in our rate risk management activities. We manage this credit risk by selecting only counterparties that we believe to be financially strong, spreading the credit risk among many such counterparties, by placing contractual limits on the amount of unsecured credit extended to any single counterparty and by entering into netting agreements with the counterparties, as appropriate.
We have entered into agreements with derivative counterparties which include netting arrangements whereby the counterparties are entitled to settle their positions on a net basis. We have been required to provide certain derivative counterparties collateral against derivative financial instruments. As of September 30, 2013, counterparties held $20.1 million of our investment securities and cash as collateral, after which we were in a net credit loss position of $23.8 million to those counterparties. As of December 31, 2012, counterparties held $3.4 million of our investment securities and cash as collateral, after which our net credit exposure was at a net credit loss position to those counterparties of $1.8 million.
For the two-year period ended September 30, 2013, we incurred no credit losses due to nonperformance of any of our counterparties.
Interest Rate Risk
Our principal market exposure is to interest rate risk, specifically long-term Treasury, LIBOR, and mortgage interest rates due to their impact on mortgage-related assets and commitments. Additionally, our escrow earnings on our mortgage servicing rights are sensitive to changes in short-term interest rates such as LIBOR. We also are exposed to changes in short-term interest rates on certain variable rate borrowings, primarily our mortgage warehouse lines of credit. We anticipate that such interest rates will remain our primary benchmark for market risk for the foreseeable future.
Our business is subject to variability in results of operations in both the mortgage origination and mortgage servicing activities due to fluctuations in interest rates. In a declining interest rate environment, we would expect our mortgage production activities’ results of operations to be positively impacted by higher loan origination volumes and loan margins. On the contrary, we would expect the results of operations of our mortgage servicing activities to decline due to higher actual and projected loan prepayments related to our loan servicing portfolio. In a rising interest rate environment, we would expect a negative impact on the results of operations of our mortgage production activities and our mortgage servicing activities’ results of operations to be positively impacted. The interaction between the results of operations of our mortgage activities is a core component of our overall interest rate risk strategy.
-97-
Table of Contents
Although our mortgage funding arrangements (mortgage participation agreements and warehouse lines of credit) carry variable rates, the majority of those funding arrangements carry interest rates that are equal to the interest rates on the underlying mortgage loans. As of September 30, 2013, approximately $273.8 million, or 59%, of our total $467.3 million in outstanding adjustable rate mortgage funding arrangements had interest rates that were equal to the underlying mortgage loans. The remaining 41% of the adjustable rate mortgage funding arrangements carried a weighted average interest rate of 2.33%, which was well below the weighted average interest rate on the related mortgage loans held for sale of 4.41% as of September 30, 2013. In addition, mortgage loans held for sale are carried on our balance sheet on average for only 15 days after closing and prior to transfer to FNMA or into pools of GNMA MBS. As a result, we believe that any negative impact related to our variable rate mortgage funding arrangements resulting from a shift in market interest rates would not be material to our consolidated financial statements as of and for the nine months ended September 30, 2013.
Mortgage Loans Held for Sale and Interest Rate Lock Commitments
Interest rate lock commitments represent an agreement to extend credit to a mortgage loan applicant, or an agreement to purchase a loan from a third-party originator, whereby the interest rate on the loan is set prior to funding. Our Mortgage loans held for sale, which are held in inventory awaiting sale into the secondary market, and our Interest rate lock commitments, are subject to changes in mortgage interest rates from the date of the commitment through the sale of the loan into the secondary market. As such, we are exposed to interest rate risk and related price risk during the period from the date of the lock commitment through (i) the lock commitment cancellation or expiration date; or (ii) the date of sale into the secondary mortgage market. Loan commitments generally range between 30 and 90 days; and our holding period of the mortgage loan from funding to sale is typically within 30 days.
The Company manages the interest rate risk associated with its outstanding interest rate lock commitments and loans held for sale by entering into derivative loan instruments such as forward loan sales commitments and mandatory delivery commitments. Management expects these derivatives will experience changes in fair value opposite to changes in fair value of the derivative loan commitments and loans held for sale, thereby reducing earnings volatility. The Company takes into account various factors and strategies in determining the portion of the mortgage pipeline (derivative loan commitments) and mortgage loans held for sale it wants to economically hedge. Our expectation of how many of our interest rate lock commitments will ultimately close is a key factor in determining the notional amount of derivatives used in hedging the position.
Sensitivity Analysis
We have exposure to economic losses due to interest rate risk arising from changes in the level or volatility of market interest rates. We assess this risk based on changes in interest rates using a sensitivity analysis. The sensitivity analysis measures the potential impact on fair values based on hypothetical changes in interest rates.
We use financial models in determining the impact of interest rate shifts on our mortgage loan portfolio, MSRs portfolio and pipeline derivatives (IRLC and forward MBS trades). A primary assumption used in these models is that an increase or decrease in the benchmark interest rate produces a parallel shift in the yield curve across all maturities.
We utilize a discounted cash flow analysis to determine the fair value of MSRs and the impact of parallel interest rate shifts on MSRs. The primary assumptions in this model are prepayment speeds, discount rates, costs of servicing and default rates. However, this analysis ignores the impact of interest rate changes on certain material variables, such as the benefit or detriment on the value of future loan originations, non-parallel shifts in the spread relationships between MBS, swaps and U.S. Treasury rates and changes in primary and secondary mortgage market spreads. For mortgage loans held for sale, IRLCs and forward delivery commitments on MBS, we rely on a model in determining the impact of interest rate shifts. In addition, for IRLCs, the borrowers’ likelihood to close their mortgage loans under the commitment is used as a primary assumption.
-98-
Table of Contents
Our total market risk is influenced by a wide variety of factors including market volatility and the liquidity of the markets. There are certain limitations inherent in the sensitivity analysis presented, including the necessity to conduct the analysis based on a single point in time and the inability to include the complex market reactions that normally would arise from the market shifts modeled.
We used September 30, 2013 market rates on our instruments to perform the sensitivity analysis. The estimates are based on the market risk sensitivity portfolios described in the preceding paragraphs and assume instantaneous, parallel shifts in interest rate yield curves. Management uses sensitivity analysis, such as those summarized below, based on a hypothetical 25 basis point increase or decrease in interest rates, on a daily basis to monitor the risks associated with changes in interest rates to our mortgage loans pipeline (the combination of mortgage loans held for sale, IRLCs and forward MBS trades). We believe the use of a 25 basis point shift (50 basis point range) is appropriate given the relatively short time period that the mortgage loans pipeline is held on our balance sheet and exposed to interest rate risk (during the processing, underwriting and closing stages of the mortgage loans which generally last approximately 60 days). We also actively manage our risk management strategy for our mortgage loans pipeline (through the use of economic hedges such as forward loan sale commitments and mandatory delivery commitments) and generally adjust our hedging position daily. In analyzing the interest rate risks associated with our MSRs, management also uses multiple sensitivity analyses (hypothetical 25, 50 and 100 basis point increases and decreases) to review the interest rate risk associated with its MSRs, as the MSRs asset is generally more sensitive to interest rate movements over a longer period of time.
These sensitivities are hypothetical and presented for illustrative purposes only. Changes in fair value based on variations in assumptions generally cannot be extrapolated because the relationship of the change in fair value may not be linear.
The following table summarizes the unfavorable estimated change in our mortgage loans pipeline as of September 30, 2013, given hypothetical instantaneous parallel shifts in the yield curve:
(in thousands)
| Down 25 bps |
Up 25 bps |
|||||||
| Mortgage loans pipeline1 |
$ | (2,813 | ) | $ | 858 | |||
| 1 | Represents unallocated mortgage loans held for sale, IRLCs and forward MBS trades that are considered “at risk” for purposes of illustrating interest rate sensitivity. Mortgage loans held for sale, IRLCs and forward MBS trades are considered to be unallocated when we have not committed the underlying mortgage loans for sale to the applicable GSEs. |
The following table summarizes the (unfavorable) favorable estimated change in our MSRs as of September 30, 2013, given hypothetical instantaneous parallel shifts in the yield curve:
| (in thousands) | Down 100 bps |
Down 50 bps |
Down 25 bps |
Up 25 bps |
Up 50 bps |
Up 100 bps |
||||||||||||||||||
| MSRs |
$ | (28,256 | ) | $ | (12,151 | ) | $ | (5,558 | ) | $ | 4,913 | $ | 9,322 | $ | 17,117 | |||||||||
Prepayment Risk
To the extent that the actual prepayment rate on the mortgage loans underlying our MSRs differs from what we projected when we initially recognized the MSRs and when we measured fair value as of the end of each reporting period, the carrying value of our investment in MSRs will be affected. In general, an increase in prepayment expectations will accelerate the amortization of our MSRs accounted for using the amortization method and decrease our estimates of the fair value of both the MSRs accounted for using the amortization method and those accounted for using the fair value method, thereby reducing net servicing income.
-99-
Table of Contents
Inflation Risk
Virtually all of our assets and liabilities are interest rate sensitive in nature. As a result, interest rates and other factors will influence our performance more than inflation. Changes in interest rates do not necessarily correlate with inflation rates or changes in inflation rates. Furthermore, our financial statements are prepared in accordance with GAAP and our activities and balance sheet are measured with reference to historical cost and/or fair value without considering inflation.
Market Value Risk
Our mortgage loans held for sale are reported at their estimated fair values. The fair value of these assets fluctuates primarily due to changes in interest rates.
Mortgage Servicing Rights
We use a discounted cash flow approach to estimate the fair value of MSRs. This approach consists of projecting servicing cash flows discounted at a rate that management believes market participants would use in the determination of value. The key assumptions used in the estimation of the fair value of MSRs include prepayment speeds, discount rates, default rates, cost to service, contractual servicing fees, escrow earnings and ancillary income. Our MSRs are subject to substantial interest rate risk as the mortgage loans underlying the MSRs permit the borrowers to prepay the loans. Therefore, the value of MSRs generally tends to vary with interest rate movements and the resulting changes in prepayment speeds. Although the level of interest rates is a key driver of prepayment activity, there are other factors that influence prepayments, including home prices, underwriting standards and product characteristics. Since our mortgage origination activities’ results of operations are also impacted by interest rate changes, our mortgage origination activities’ results of operations may fully or partially offset the change in fair value of MSRs over time.
The following sensitivity analyses are limited in that they were (i) performed at a particular point in time, (ii) only contemplate certain movements in interest rates, (iii) do not incorporate changes in interest rate volatility or changes in the relationship of one interest rate index to another, (iv) are subject to the accuracy of various models and assumptions used, including prepayment forecasts and discount rates, and (v) do not incorporate other factors that would affect our overall financial performance in such scenarios, including operational adjustments made by management to account for changing circumstances. For these reasons, the following estimates should not be viewed as an earnings forecast.
The key assumptions used in determining the fair value of MSRs are as follows as of the periods presented:
| September 30, |
December 31, | |||||
| 2013 |
2012 |
2011 | ||||
| Discount rates |
9.25% -11.00% | 9.25% -11.00% | 8.00% -11.00% | |||
| Annual prepayment speeds (by investor type): |
||||||
| Purchased FNMA1 |
15.4% | 31.8% | 17.1% | |||
| FNMA |
7.8% | 12.0% | 6.3% | |||
| GNMA I |
8.1% | 15.0% | 6.7% | |||
| GNMA II |
7.5% | 10.8% | 6.0% | |||
| FHLMC |
7.8% | NA | NA | |||
| Cost of servicing (per loan) |
$74 | $73 | $91 | |||
| 1 | Represents older, higher interest rate loans acquired from our merger with Swain during 2009. |
-100-
Table of Contents
MSRs are generally subject to loss in value when mortgage rates decrease. Decreasing mortgage rates normally encourage increased mortgage refinancing activity. Increased refinancing activity reduces the life of the loans underlying the MSRs, thereby reducing MSR value. Reductions in the value of MSRs affect income primarily through changes in fair value and impairment charges. These factors have been considered in our estimated prepayment speed assumptions used to determine the fair value of our MSRs.
In addition to the assumptions listed above, we use assumptions for default rates in determining the fair value of MSRs. These assumptions are based primarily on internal estimates, and third-party data, where applicable, to assess the reasonableness of our internal assumptions. In the MSRs valuation as of September 30, 2013 and December 31, 2012, our assumptions for default rates for FNMA were 3.94% and 2.37%, respectively. Our assumptions for default rates for GNMA as of September 30, 2013 and December 31, 2012 were 6.41% and 5.41%, respectively. Our assumption for default rates for FHLMC as of September 30, 2013 was 3.83% (there were no MSRs related to FHLMC loans as of December 31, 2012 or 2011). The default rates represent our estimate of the loans that will eventually enter foreclosure proceedings over the entire term of the portfolio’s life. These assumptions affect the future cost to service loans, future revenue earned from the portfolio, and future assumed foreclosure losses. Because our portfolio is generally comprised of recent vintages, actual future defaults may differ from our assumptions.
The hypothetical effect of an adverse change in these key assumptions would result in a decrease in fair values as follows:
| September 30, |
December 31, |
|||||||||||
| (Dollars in thousands) | 2013 |
2012 |
2011 |
|||||||||
| Base Value (000s) |
$ | 132,907 | $ | 42,202 | $ | 17,679 | ||||||
| Discount Rate |
||||||||||||
| Impact of Disc Rate + 1% |
$ | (6,737 | ) | $ | (2,071 | ) | $ | (935 | ) | |||
| Impact of Disc Rate + 2% |
$ | (12,876 | ) | $ | (3,953 | ) | $ | (1,785 | ) | |||
| Impact of Disc Rate + 3% |
$ | (18,488 | ) | $ | (5,671 | ) | $ | (2,561 | ) | |||
| CPR |
||||||||||||
| Impact of CPR * 105% |
$ | (2,777 | ) | $ | (1,278 | ) | $ | (266 | ) | |||
| Impact of CPR * 110% |
$ | (5,465 | ) | $ | (2,505 | ) | $ | (526 | ) | |||
| Impact of CPR * 120% |
$ | (10,591 | ) | $ | (4,819 | ) | $ | (1,029 | ) | |||
| Servicing Cost |
||||||||||||
| Impact of Cost to Service * 105% |
$ | (947 | ) | $ | (415 | ) | $ | (279 | ) | |||
| Impact of Cost to Service * 110% |
$ | (1,894 | ) | $ | (830 | ) | $ | (558 | ) | |||
| Impact of Cost to Service * 120% |
$ | (3,789 | ) | $ | (1,659 | ) | $ | (1,115 | ) | |||
-101-
Table of Contents
Adjustable Rate Mortgage. A mortgage loan where the interest rate on the loan adjusts periodically based on a specified index and margin agreed to at the time the loan is originated.
Adjusted Constant Prepayment Rate (“Adjusted CPR”). A calculation of the constant prepayment rate that reduces the amount of prepaid loans by the amount of loans recaptured by an entity. The rate then expresses that percentage of “net prepaid loans” as an annualized percentage of the period beginning outstanding principal balance.
Agency. Each of Fannie Mae, Freddie Mac, Ginnie Mae, Federal Housing Administration and Department of Veterans Affairs, is an “Agency.”
Aggregator. Participants in the mortgage industry that originate loans from retail customers and sell them to a depository institution or non-bank originator.
Asset-Backed Securities (“ABS”). A financial security whose income payments and value is derived from and collateralized (or “backed”) by a specified pool of underlying receivables or other financial assets.
Compensating Interest. Money paid to the owner of a mortgage loan or pool of mortgage loans on a monthly basis (typically by the servicer from its own funds) to compensate the owner of the mortgage loan for interest shortfalls caused by intra-month prepayments.
Constant Prepayment Rate (“CPR”). The rate at which a pool of mortgage loans’ remaining balance is prepaid each month. The rate is calculated on an annualized basis and expressed as a percentage of the outstanding principal balance.
Consumer Financial Protection Bureau (“CFPB”). The federal agency that holds primary responsibility for regulating consumer protection with regard to financial products and services in the United States.
Conventional Mortgage Loans. A mortgage loan that is not guaranteed or insured by the FHA, the VA or any other government agency. Although a conventional loan is not insured or guaranteed by the government, it can still follow the guidelines of GSEs.
Debt-to-Income Ratios (“DTI”). The percentage of a consumer’s monthly gross income that goes toward paying debts (including certain taxes, fees and insurance premiums). This ratio is commonly used while qualifying borrowers for mortgage loans.
Delinquent Loan. A mortgage loan that is 30 or more days past due from its scheduled due date.
Department of Housing and Urban Development (“HUD”). A cabinet-level department of the U.S. federal government that works to strengthen the housing market to bolster the economy and protect consumers; meet the need for quality affordable rental homes; utilize housing as a platform for improving quality of life; and build inclusive and sustainable communities free from discrimination.
Department of Veterans Affairs (“VA”). A cabinet-level department of the U.S. federal government, which guarantees certain home loans for qualified borrowers.
Dodd-Frank Wall Street Reform and Consumer Protection Act of 2010 (“Dodd-Frank Act”). An act passed into law on July 21, 2010 with a stated purpose to regulate the financial services industry, including securitizations, mortgage originations and mortgage sales.
-102-
Table of Contents
Emerging Growth Company (“EGC”). As defined in the JOBS Act, an EGC is an issuer that had total annual gross revenues of less than $1,000,000,000 (as such amount is indexed for inflation every 5 years by the Securities and Exchange Commission to reflect the change in the Consumer Price Index for All Urban Consumers published by the Bureau of Labor Statistics, setting the threshold to the nearest 1,000,000) during its most recently completed fiscal year.
Fair Isaac Corporation (“FICO”). Fair Isaac Corporation provides the standard measure of consumer credit risk in the United States (the “FICO Score”).
Fannie Mae (“FNMA”). The Federal National Mortgage Association, a federally chartered association that buys mortgage loans from lenders and resells them as securities in the secondary mortgage market.
Federal Housing Administration (“FHA”). A U.S. federal government agency within the Department of Housing and Urban Development. It provides mortgage insurance on loans made by FHA-approved lenders in compliance with FHA guidelines throughout the United States.
Federal Housing Finance Agency (“FHFA”). A U.S. federal government agency that has regulatory and supervisory oversight of the 14 housing-related GSEs.
Financial Crimes Enforcement Network (“FinCEN”). A bureau of the U.S. Department of Treasury. FinCEN’s mission is to safeguard the financial system from illicit use and combat money laundering and promote national security through the collection, analysis, and dissemination of financial intelligence and strategic use of financial authorities.
Float Income. Interest income earned by a servicer on (i) funds collected from borrowers during the period of time between receipt of the funds and the remittance of the funds to investors and (ii) funds collected from borrowers for the payment of taxes and insurance, where applicable.
Freddie Mac (“FHLMC”). The Federal Home Loan Mortgage Corporation, a federally chartered corporation that buys mortgage loans from lenders and resells them as securities in the secondary mortgage market.
Gain on Sales (“GOS”). The gain resulting from sales of mortgage loans recognized in the Company’s statement of operations. The gain represents the difference between the proceeds from the sales of mortgage loans and the carrying amount of the mortgage loans sold.
Generally Accepted Accounting Principles (“GAAP”). The standard framework of guidelines for financial accounting and reporting used in the United States.
Ginnie Mae (“GNMA”). The Government National Mortgage Association, a wholly-owned U.S. federal government corporation that is an agency of the Department of Housing and Urban Development. The main focus of Ginnie Mae is to ensure liquidity for U.S. federal government-insured mortgages including those insured by the FHA. Ginnie Mae guarantees to investors who purchase mortgage-backed securities the timely payment of principal and interest. Ginnie Mae securities are the only mortgage-backed securities to carry the full faith and credit guarantee of the U.S. federal government.
Government-Sponsored Enterprise (“GSE”). Financing corporations established by the United States Congress, including Fannie Mae, Freddie Mac and the Federal Home Loan Banks.
High-Touch Servicing. A servicing model that is designed to increase borrower repayment performance with a view towards home ownership preservation, and to decrease borrower delinquencies and defaults on mortgage portfolios. This model emphasizes a focus on loss mitigation and frequent interactions with borrowers—via telephone, mail, electronic communications and other personal contact methods.
-103-
Table of Contents
Home Affordable Modification Program (“HAMP”). A U.S. federal government program designed to help eligible homeowners avoid foreclosure through mortgage loan modifications. Participating servicers may be entitled to receive financial incentives in connection with loan modifications they enter into with eligible borrowers and subsequent “pay for success” fees to the extent that a borrower remains current in any agreed upon loan modification.
Home Affordable Refinance Program (“HARP”). A U.S. federal government program designed to help eligible homeowners refinance their existing mortgage loans.
Independent Loan Servicer. A loan servicer that is not affiliated with a depository institution.
Interest Rate Lock Commitments (“IRLC”). Agreements under which a lender agrees to extend credit to a borrower under certain specified terms and conditions in which the interest rate and the maximum amount of the mortgage loan are set prior to funding the mortgage loan.
Jumbo Loans. A mortgage loan with a loan amount exceeding the conforming loan limits. Under current limits, a jumbo loan represents a mortgage loan of more than $417,000, or, in certain geographies where homes are considered high cost, a mortgage loan of more than $625,500.
Jumpstart Our Business Startups Act (“JOBS Act”). An act signed into law on April 5, 2012 with the stated purpose to increase American job creation and economic growth by improving access to the public capital markets for emerging growth companies.
Loan Modification. Temporary or permanent modifications, including re-modifications, to the terms and conditions of a borrower’s original mortgage loan. Loan modifications are usually made to loans that are in default, or in imminent danger of defaulting.
Loan-to-Value Ratio (“LTV”). The unpaid principal balance of a mortgage loan as a percentage of the total appraised value of the property that secures the loan. LTV is one of the key risk factors that originators assess when qualifying borrowers for a mortgage loan. A loan with a low LTV is seen as less of a credit risk than a loan with a high LTV. An LTV over 100% indicates that the unpaid principal balance of the mortgage loan exceeds the value of the property.
London Interbank Offered Rate (“LIBOR”). An interest rate at which banks can borrow funds from other banks in the London interbank market. LIBOR is fixed on a daily basis by the British Bankers’ Association. LIBOR is derived from an average of the world’s most creditworthy banks’ interbank deposit rates for larger loans with maturities between overnight and one year. LIBOR is generally the most widely used benchmark for short-term interest rates.
Loss Mitigation. The range of servicing activities designed by a servicer to minimize the losses suffered by the owner of a mortgage loan in connection with a borrower default. Loss mitigation techniques include short-sales, deed-in-lieu of foreclosures and loan modifications, among other options.
Mortgage-Backed Securities (“MBS”). A type of asset-backed security that is secured by a mortgage loan or a group of mortgage loans.
Mortgage Servicing Right (“MSR”). The right to service a loan or pool of loans and to receive a servicing fee. Mortgage servicing rights may be bought and sold, resulting in the transfer of loan servicing obligations.
NattyMac, LLC (“NattyMac”). An Indiana limited liability company that is our wholly-owned subsidiary.
-104-
Table of Contents
Non-Agency. We refer to “non-Agency” mortgage loans as mortgage loans that are not guaranteed by Fannie Mae, Freddie Mac, Ginnie Mae, Federal Housing Administration or Department of Veterans Affairs.
New York Stock Exchange (“NYSE”). The largest stock exchange in the United States.
Online Loan Information Exchange (“OLIE”). Our proprietary information technology platform used to perform mortgage loan due diligence, underwriting and data capturing.
Originated Mortgage Servicing Right (“OMSR”). A mortgage servicing right resulting from a mortgage loan that we originated.
Origination. The process through which a lender provides a mortgage loan to a borrower.
Prepayment Speed. The rate at which mortgage prepayments occur or are projected to occur. The statistic is calculated on an annualized basis and expressed as a percentage of the outstanding principal balance.
Primary Servicer. The servicer that owns the right to service a mortgage loan or pool of mortgage loans. This differs from a subservicer, which has a contractual right with the primary servicer to service a mortgage loan or pool of mortgage loans in exchange for a subservicing fee.
Purchased MSR (“PMSR”). A mortgage servicing right that we purchase directly from a third party in a transaction where we do not buy the underlying loan and only buy the servicing right.
Qualified Residential Mortgage (“QRM”). A mortgage loan with a statistically lower risk of default, based on certain underwriting criteria. The Consumer Financial Protection Bureau, along with other governmental agencies, is currently developing the criteria for mortgage loans to be classified as QRM loans. QRM underwriting criteria are intended to reduce the likelihood of default and delinquency.
Recapture. The act of originating or acquiring a mortgage loan that was refinanced with an existing customer.
Sarbanes-Oxley Act of 2002 (“Sarbanes-Oxley Act”). An act enacted by Congress on July 30, 2002 with a stated purpose of protecting investors by improving the accuracy and reliability of corporate disclosures made pursuant to the securities laws, and for other purposes.
Servicing. The performance of contractually specified administrative functions with respect to a mortgage loan or pool of mortgage loans. Duties of a servicer typically include, among other things, collecting monthly payments, maintaining escrow accounts, providing periodic reports and managing insurance. A servicer is generally compensated with a specific fee outlined in the contract established prior to the commencement of the servicing activities.
Servicing Advance. In the course of servicing loans, servicers are required to make servicing advances that are reimbursable from collections on the related mortgage loan. There are typically three types of servicing advances: P&I Advances, T&I Advances and Corporate Advances. Servicing advances are reimbursed to the servicer if and when the borrower makes a payment on the underlying mortgage loan or upon liquidation of the underlying mortgage loan. The types of servicing advances that a servicer must make are set forth in its servicing agreement with the owner of the mortgage loan or pool of mortgage loans.
Subservicing. Subservicing is the process of outsourcing the duties of the primary servicer to a third party servicer. The third party servicer performs the servicing responsibilities for a fee and is typically not responsible for making servicing advances.
-105-
Table of Contents
Take-out Commitment. A commitment by the originator of a loan to either (a) sell one or more identified mortgage loans to a Take-out Investor or (b) (i) swap one or more identified mortgage loans with a Take-out Investor that is an Agency for an Agency security, and (ii) sell the related Agency security to a Take-out Investor, and in each case, the corresponding Take-out Investor’s commitment back to the originator to effectuate any of the foregoing, as applicable.
Take-out Investor. Either (i) an Agency or (ii) other qualifying institution which has made a Take-out Commitment.
Third Party Originators (“TPO”). A person or company involved in the process of marketing mortgage loans and gathering information from borrowers for a mortgage loan application. This information is then sold to the mortgage lender prior to closing.
United States Department of Agriculture (“USDA”). The U.S. federal executive department responsible for developing and executing federal government policy on farming, agriculture, forestry, and food.
Unpaid Principal Balance (“UPB”). The amount of principal outstanding on a mortgage loan or a pool of mortgage loans. Unpaid principal balance is used as a means of estimating future revenue stream for a servicer.
Wallet-Share. The percentage of our third party originator’s overall origination volume they sell to us.
Warehouse Facility. A type of facility used to finance mortgage loan originations consisting either of a Warehouse Repurchase Facility or a Warehouse Line of Credit Facility.
Warehouse Line of Credit Facility. Pursuant to a warehouse line of credit facility, a warehouse lender makes available to a loan originator a line of credit from which the loan originator may borrow to fund the mortgage loans it originates. The warehouse lender retains a security interest in the originated loans and the related loan files and servicing rights until the proceeds from the sale of the mortgage loans to the Takeout Investor are received.
Warehouse Repurchase Facility. Pursuant to a warehouse repurchase facility, a loan originator typically agrees to transfer to a counterparty certain mortgage loans against the transfer of funds by the counterparty, with a simultaneous agreement by the counterparty to transfer the loans back to the originator at a date certain, or on demand, against the transfer of funds from the originator.
-106-
Table of Contents
We conduct our business in the residential mortgage industry in the United States. We participate directly in three distinct, but related, businesses in the residential mortgage industry: mortgage origination, mortgage servicing and mortgage financing.
Mortgage Origination Industry Overview
According to the Mortgage Bankers Association, the total size of residential mortgage originations in 2012 was approximately $1.8 trillion, representing a 17% increase in originations over the previous year. Growth in 2012 was attributed to historic low borrowing rates, a recovering housing market, the government’s ongoing quantitative easing program and refinance programs such as HARP.
The residential mortgage market continues to be driven by Agency mortgages, i.e., mortgages that are guaranteed by Fannie Mae or Freddie Mac, or insured by government agencies such as FHA and the VA, which comprised 87% of all originations or $1.65 trillion in 2012. The remaining 13% or $252 billion of 2012 origination volume was represented by non-Agency mortgages. The proportion of non-Agency mortgages is expected to increase, as regulators for the GSEs execute on a plan to reduce the role of GSEs in the market and shift credit risks to private enterprises.
Originations in the mortgage sector include both purchase and refinance transactions. Approximately 29% of 2012 mortgage origination was purchase-driven mortgage, with 71% being refinance related. Purchase-driven mortgages are expected to increase substantially, as the economy continues to stabilize and the housing market continues to recover.
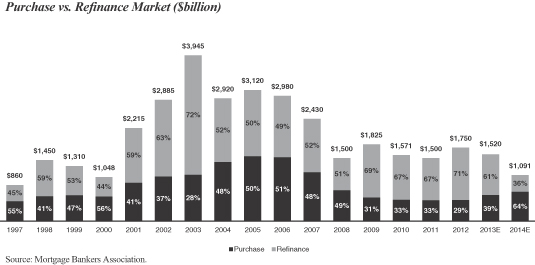
The U.S. residential mortgage market consists of a primary mortgage market that links borrowers and lenders and a secondary mortgage market that links lenders and investors. In the primary mortgage market, residential mortgage lenders such as mortgage banking companies, commercial banks, savings institutions, credit unions and other financial institutions originate or provide mortgages to borrowers. The secondary mortgage market consists of institutions engaged in buying and selling mortgages in the form of whole loans, which represent mortgages that have not been securitized, and mortgage-related securities. The GSEs and a government agency, Ginnie Mae, participate in the secondary mortgage market by purchasing mortgage loans and mortgage-related securities for investment (in the case of the GSEs) and by issuing (directly or through approved issuers) guaranteed mortgage-related securities. The residential MBS issuances today are comprised almost entirely of MBS backed by Agency loans with securities backed by non-Agency loans representing a small percentage of the overall issuances.
-107-
Table of Contents
Prior to the recent financial crisis, non-Agency MBS represented over 56% of the MBS market in 2006. It is expected that over time with GSE reform and improved pricing, non-Agency MBS issuance will gradually increase.
The mortgage industry experienced significant consolidation in the years leading up to and during the financial crisis with large banks holding the majority of origination and servicing market share. Recently, however, the top five originators (all commercial banks) have come under significant pressure to reduce their exposure to the residential mortgage business as a result of regulatory scrutiny, punitive capital treatment of MSRs and headline risks associated with the industry. According to Inside Mortgage Finance, the share on non-bank mortgage originations increased and we expect this trend to accelerate in the future.
Loan Origination Process
Residential mortgage loans are generally originated through either a direct retail lending channel or a wholesale lending channel where loans are sourced from correspondents and mortgage brokers.
A direct retail lending channel consists of distributed retail branches and/ or a centralized retail platform. A distributed retail branch network consists of independent branches staffed with loan officers where loans are originated through relationships with local real estate agents, builders, telemarketing and other local contacts. A centralized retail platform is a telephone and/ or internet based platform with multiple loan officers in one location. In a direct lending retail network, the lender controls all loan originations processes, including sourcing the borrower, taking the application and setting the interest rate, ordering the appraisal and underwriting, processing, closing and funding the loan. In an integrated mortgage banking business, retail originations can help maximize the return from a lender’s servicing portfolio. When the lender refinances a loan in its servicing portfolio, it replaces the old MSR with a new one and extends the life of the servicing cash flows associated with that loan.
Loans sourced by mortgage brokers are funded by the lender and generally closed in the lender’s name. When originating loans through mortgage brokers, the mortgage broker’s role is to identify the applicant, assist in completing the loan application, gather necessary information and documents and serve as the liaison to the borrower through the lending process. The lender reviews and underwrites the application submitted by the mortgage broker, approves or denies the application, sets the interest rate and other terms of the loan and, upon acceptance by the borrower and satisfaction of all conditions required by the lender, funds the loan. Because mortgage brokers conduct their own marketing, employ their own personnel to complete the loan applications and maintain contact with the borrowers, mortgage brokers represent an efficient loan originations channel.
Correspondent mortgage aggregators acquire loans from retail or wholesale mortgage originators and in turn sell them on the secondary market. Correspondent loans can be sold individually or in pools to the correspondent aggregators. The loans are underwritten and funded by the mortgage originator, but the loan programs are usually based on terms approved by the correspondent aggregator. Mortgage originators may offer an array of products for multiple correspondent aggregators, and act as an extension for those aggregators.
The length of time from the origination or purchase of a mortgage loan to its sale or securitization generally ranges from 10 to 60 days, depending on a variety of factors including loan volume, product type, interest rates and capital markets conditions. An important source of capital for the residential mortgage industry is warehouse lending. These facilities provide funding to mortgage loan originators until the loans are sold to investors in the secondary mortgage loan market.
Types of Mortgage Loans
Mortgage loans generally fall into one of the following five categories: prime conforming mortgage loans, prime non-conforming mortgage loans, government mortgage loans, non-prime mortgage loans and prime second-lien mortgage loans.
| • | Prime Conforming Mortgage Loans: Prime credit quality first-lien mortgage loans (i.e. mortgage loans that, in the event of default, have priority over all other liens or claims) secured by |
-108-
Table of Contents
| single-family residences that meet or “conform” to the underwriting standards established by Fannie Mae or Freddie Mac for inclusion in their guaranteed mortgage securities programs. |
| • | Prime Non-Conforming Mortgage Loans: Prime credit quality first-lien mortgage loans secured by single-family residences that either (i) do not conform to the underwriting standards established by Fannie Mae or Freddie Mac, because they have original principal amounts exceeding Fannie Mae and Freddie Mac limits, which are commonly referred to as jumbo mortgage loans, or (ii) have alternative documentation requirements and property or credit-related features (e.g., higher LTV or debt-to-income ratios (“DTI”)) but are otherwise considered prime credit quality due to other compensating factors. |
| • | Government Mortgage Loans: First-lien mortgage loans secured by single-family residences that are insured by the FHA or guaranteed by the VA and securitized into Ginnie Mae securities. |
| • | Non-prime Mortgage Loans: First-lien and certain junior lien mortgage loans secured by single-family residences, made to individuals with credit profiles that do not qualify for a prime loan, have credit-related features that fall outside the parameters of traditional prime mortgage loans or have performance characteristics that otherwise expose us to comparatively higher risk of loss. |
| • | Prime Second-Lien Mortgage Loans: Open- and closed-end mortgage loans (i.e. mortgage loans that do, in the case of an open-end loan, or do not, in the case of a closed-end loan, allow the borrower to increase the amount of the mortgage at a later time) secured by a second or more junior lien on single family residences, which include home equity mortgage loans. |
Industry Dynamics
Fragmented Origination Market
The mortgage origination market is highly fragmented. According to Inside Mortgage Finance, during the six months ended June 30, 2013, over 2,000 companies originated loans conforming with the requirements of the GSEs. Further, of the total $710 billion of originations, 70% of all originations were generated by the top 25 mortgage companies with the remaining approximately 2,000 mortgage originators representing 30% of the mortgage origination market with 73% of the originators reporting volume of less than $50 million during the six months ended June 30, 2013. The fragmented nature of the industry is also demonstrated by the fact that according to the National Mortgage Licensing Service and Registry, approximately 88% or approximately 14,000 of the over 15,000 mortgage companies licensed to operate in the U.S. operate out of a single location. We expect that the market will consolidate over the next few years with smaller sub-scale players being acquired by larger players.
Regulatory and Legislative Factors
We believe that many banks are currently under tremendous pressure to exit, or reduce their exposure to, the mortgage banking business as a result of increased regulatory scrutiny and capital requirements, headline risk associated with sizeable legal settlements and potentially significant earnings volatility. As a result of the severe dislocation in the U.S. housing market and the related fallout, regulatory and legislative attention on the mortgage industry has increased. Numerous legislative and regulatory actions have been proposed, including the following
| Increased Capital Requirements |
• If adopted, Basel III standards would impose material capital charges for banks holding mortgage servicing assets
• Imply substantially higher risk weightings for lower quality mortgage assets
|
-109-
Table of Contents
| • Increased MSR risk weightings of 250%, with limitations on capital qualification | ||
| Dodd-Frank |
• Requires any “securitizer” to retain a minimum 5% unhedged piece of the credit risk unless loans meet the “Qualified Residential Mortgage” definition
• Requires certain blackout periods to customer access when outsourcing fulfillment functions and creates the CFPB
• The Qualified Mortgage rule safe harbor limits mortgage loans to 43% DTI, loans’ annual percentage rates, or APRs, below the “higher- priced” threshold of 150 basis points over the Average Prime Offer Rate, or APOR, 3% fees costs cap, and eligibility for purchase by the GSEs or Agencies | |
| SAFE Act |
• Mandates a nationwide licensing and registration system for residential mortgage loan originators | |
| Joint Federal-State Mortgage Servicing Settlement |
• $25 billion settlement between large banks and 49 state Attorneys General and HUD
• Relates to servicing and foreclosure practices including monetary penalties and requires changes in servicing practices | |
| New CFPB Servicer Rules |
• Requires servicers to provide monthly mortgage statements with a detailed breakdown of payments, interest rate adjustment notices, prompt crediting of payments and payoff statements
• Force placed insurance requirements, error resolution and information requests from borrowers,
• Policy and procedure requirements, early notices about foreclosure prevention options
• Continuity of contact for troubled borrowers
• Loss mitigation procedures | |
| Consent Orders |
• Requires servicers to implement a single point of contact, or SPOC, for delinquent borrowers
• Stronger vendor management controls
• Procedures governing the parallel use of loss mitigation and foreclosure practices, as well as staffing levels and training | |
| Regulatory Scrutiny & Headline Risk |
• Mortgage settlements with residential MBS holders
• “Robo- signing” headlines
• Robust loan put-back from GSEs | |
-110-
Table of Contents
| • Servicing requirements regarding delinquent mortgages
• Modification of servicing compensation related to Fannie Mae and Freddie Mac loans
• New regulations from the recently formed CFPB
• Additional litigation brought by Attorneys General of nonparticipating states
• Forced place insurance risk |
We believe that as a result of the regulatory and legislative factors described above, banks are under tremendous pressure to reduce their participation in the mortgage sector, and as a result, non-bank entities, such as ourselves, will continue to gain market share.
Reform of GSEs
Due to increased market concerns about the ability of Fannie Mae and Freddie Mac to withstand future credit losses associated with securities held in their investment portfolios, in July 2008, Congress enacted the Housing and Economic Recovery Act of 2008. In September 2008, the FHFA placed Fannie Mae and Freddie Mac into conservatorship and, together with the U.S. Treasury, established a program designed to boost investor confidence in their respective debt and MBS. As the conservator of Fannie Mae and Freddie Mac, the FHFA controls and directs the operations of Fannie Mae and Freddie Mac and may (i) take over the assets and operations of Fannie Mae and Freddie Mac with all the powers of the shareholders, the directors and the officers of Fannie Mae and Freddie Mac and conduct all business of Fannie Mae and Freddie Mac; (ii) collect all obligations and money due to Fannie Mae and Freddie Mac; (iii) perform all functions of Fannie Mae and Freddie Mac that are consistent with the conservator’s appointment; (iv) preserve and conserve the assets and property of Fannie Mae and Freddie Mac; and (v) contract for assistance in fulfilling any function, activity, action or duty of the conservator.
In February 2012, the FHFA came up with a strategic plan to affirmatively withdraw the role of the GSEs in the secondary market. The plan also includes a “build out” of infrastructure for the secondary market, and allows private enterprises to actively assume more credit risks. We expect that, if carried out, this plan will be favorable for our competitive position as many of our mortgage originators would benefit from a growth in the role of non-Agency players.
Non-Agency Securitization
According to Inside Mortgage Finance, the non-Agency market generated 64% of all originations, or $1.9 billion in 2006. Post-financial crisis, that number has reduced substantially, generating only 13% or $252 billion in 2012. Over the last few years, this market has been hindered by the lack of an efficient capital market in which to sell such loans. We believe this market is poised to rebound over the next few years. The FHFA (regulator of the GSEs) has stated in its Strategic Plan that it intends to reduce the dominant role of the GSEs in the securitization market place and allow private enterprises to assume more credit risk. As the market normalizes and non-Agency private securitization returns, we will be one of the few non-bank originators with this capability, giving us the ability to be an aggregator for others and establishing ourselves as a market leader.
Mortgage Servicing Industry Overview
According to the Federal Reserve, there were approximately $10.0 trillion in residential mortgage loans outstanding in the United States as of December 31, 2012. Each mortgage loan must be serviced by a loan
-111-
Table of Contents
servicer. Owners of MSRs generally earn a contractual per-loan fee of 25 to 50 basis points per annum on the UPB of loans serviced, as well as incentive fees and associated ancillary fees, such as late fees. A loan servicer can create value for both itself and the mortgage owner by increasing the number of borrowers that remain current in their repayment obligations. Loan owners may include a lender, third-party investor or, in the case of a securitized pool of mortgages, a residential MBS trust.
Loan servicing predominantly involves loan administration, collection and default activities, including the collection and remittance of loan payments, response to customer inquiries, accounting for principal and interest, holding custodial (impound) funds for the payment of property taxes and insurance premiums, counseling delinquent mortgagors and supervising foreclosures and property dispositions.
Generally speaking, in a weak economic and credit environment with elevated delinquencies and defaults, servicing is operationally more challenging and more capital-intensive as servicers need to add and train staff to manage the increase in delinquent borrowers. In addition, servicers are generally required to make advances on delinquent mortgage loans for principal and interest payments, taxes, insurance, legal fees and property maintenance fees, all of which are typically recovered upon foreclosure or liquidation.
The majority of loan servicing in the United States is performed by banks such as Wells Fargo & Company, JPMorgan Chase & Co., Bank of America Corporation and Citigroup Inc., which together serviced 48% of all outstanding mortgage loans on 1-4 family residences as of December 31, 2012. These traditional bank servicers primarily service conventional, performing (non-delinquent) mortgages and are most effective at routine account management of portfolios with low delinquencies that require limited interaction with the borrowers. These traditional servicers however, are experiencing higher operating costs, and their performance metrics are declining in the current environment of elevated delinquencies, foreclosures, liquidation proceedings and real estate owned activity.
Servicing Advances
In the course of servicing delinquent loans, servicers are required to make advances that are reimbursable from collections on the related mortgage loan, or in the event of a non-recoverable advance, from collections on other mortgage loans in the related mortgage pool. In the case of subservicing, the advances are typically required on an intra-month basis and the subservicer is entitled to reimbursement from the owner of the MSRs. There are generally three types of advances, as defined below: P&I Advances, T&I Advances and Corporate Advances.
| • | P&I Advances: Advances to cover scheduled payments of principal and interest that have not been timely paid by borrowers. P&I Advances serve to smooth the cash flows paid to holders of securities issued by the residential MBS trust. |
| • | T&I Advances: Advances to pay specified expenses associated with the preservation of a mortgaged property or the liquidation of defaulted mortgage loans, including, but not limited to, property taxes, insurance premiums or other property related expenses that have not been timely paid by borrowers. |
| • | Corporate Advances: Advances to pay costs and expenses incurred in loan foreclosure and REO preservation and sale, including attorneys’ and other professional fees and expenses incurred in connection with foreclosure and liquidation or other legal proceedings arising in the course of servicing mortgage loans. |
A servicer may decide to stop making P&I Advances prior to a liquidation of the mortgage loan if the servicer deems future P&I Advances to be non-recoverable. In this circumstance, T&I Advances and Corporate Advances will likely continue in order to preserve the existing value of the mortgage loan and complete the foreclosure and REO sale process.
-112-
Table of Contents
Servicers of GSE securities are reimbursed by the GSE for their advances upon completion of the foreclosure sale at which point the mortgage loan is repurchased out of the MBS trust by the GSE. Servicers of GSE securities are not responsible for managing REO properties. Conversely, servicers of non-Agency MBS are obligated under the servicing agreement to make advances through liquidation of the related REO properties.
Advances are non-interest bearing assets. Non-bank servicers typically utilize securitizations or match funded liabilities to finance their advances. The securitizations are generally non-recourse to the servicer, and the advances are financed at a discount to par value accounting for the non-interest bearing nature of the asset.
Warehouse Financing Industry Overview
Warehouse financing providers provide bridge funding facilities to asset originators for the financing or temporary purchase of assets until they are sold through purchase/sale commitments to investors in secondary market transactions. The facilities, secured by financial assets, are characterized by client-specific business rules for collateral eligibility, limits management, and pricing. These facilities enable mortgage originators to meet their capital needs and efficiently fund originated loans. The terms of the funding facilities are short, ranging from fifteen to sixty days in most cases, depending on how long it takes to sell the loans to permanent investors. Upon sale of the loan, the new investor directly sends funds to the warehouse provider, who retains amounts due under the facility before forwarding the remaining balance to the mortgage originator. This cycle is repeated multiple times a month depending on loan origination volumes. At times, the warehouse financing provider also acquires the warehoused mortgage loans from the mortgage loan originator thus enabling the mortgage loan originator to receive funds quickly.
In addition to funding assets and disbursing proceeds, warehouse providers hold and review notes, ship notes, provide instructions to all participants in a transaction, maintain operating controls for monitoring and reporting collateral positions, and manage transaction and overall counterparty risk. They must demonstrate superior control of information in order to comply with strict risk management requirements while meeting multiple intra-day funding deadlines and other service level obligations.
The warehouse financing industry is primarily dominated by depository institutions that use deposit funding to finance these loans. The number of warehouse finance providers dropped sharply after the financial crisis due to higher perceived risks and focus on core business and customers. Since then, competition has increased from new entrants as well as re-entry by large banks who had earlier exited the business. This has created a slight downward pressure on pricing and margins. However, depository institutions typically only focus on larger mortgage originators leaving the small- and mid-sized originators to sell mortgage loans to aggregators. Competition by depository institutions also varies with the regulatory environment. For example, a recent ruling by the Federal Reserve raised the amount of capital required to be held by banks for warehouse loans, and the ruling is expected to reduce competition in the sector.
-113-
Table of Contents
Our Company
We are a leading, non-bank, integrated mortgage company focused on efficiently and effectively originating, acquiring, selling, financing and servicing U.S. residential mortgage loans. We are also one of the fastest growing non-bank mortgage originators, having grown origination volume by 209% during the nine months ended September 30, 2013 as compared to the nine months ended September 30, 2012. Our origination volume increased 12%, to $2.3 billion, during the three months ended September 30, 2013 from $2.1 billion in originations in the three months ended June 30, 2013 and grew 123% from origination volume of $1.1 billion in the three months ended September 30, 2012. Our loan originations are primarily sourced through our network of retail branches and through our relationships with approximately 1,000 TPOs as of September 30, 2013. For the nine months ended September 30, 2013, we originated $6.3 billion in loans ($2.3 billion of which were originated in the three months ended September 30, 2013) and, as of September 30, 2013, we serviced a portfolio with an unpaid principal balance of $9.7 billion, an increase of 28% from the June 30, 2013 ending unpaid principal balance of $7.6 billion, and an increase of 229% over the unpaid principal balance at September 30, 2012 of $2.9 billion.
We attribute our growth to our vertically integrated and scalable mortgage banking platform, which we believe enables us to efficiently and effectively originate, acquire, sell, finance and service residential mortgage loans, and to our on-going geographic and product expansion. Since January 1, 2012, we have expanded our business into 18 additional states and Washington D.C., added approximately 960 correspondent and wholesale customers, opened or acquired 19 retail branch offices and as a result increased our origination volume substantially. We also recently launched additional mortgage products, including our mortgage financing business, through a wholly-owned operating subsidiary, NattyMac, which will complement our growth. We focus on originating mortgage loans associated with the purchase of residential real estate, representing 53% of our originations for the twelve months ended September 30, 2013, as opposed to the refinancing of existing mortgage loans.
Since June 2013, the U.S. residential mortgage industry has experienced an increase in interest rates. Industry-wide mortgage loan originations have declined as the recent increase in interest rates has made the refinancing of mortgage loans less attractive for borrowers. Increasing interest rates can have a direct impact on the operating results of companies in the mortgage industry, including on our operating results. Our revenues decreased 27%, to $32.3 million, in the three months ended September 30, 2012 from $44.3 million in the three months ended June 30, 2013. We believe our third quarter results reflect solid business execution during a period of rising interest rates and underscore the strength of our differentiated, vertically integrated and scalable mortgage banking platform. Our three lines of business—mortgage originations, mortgage servicing and mortgage financing—complement each other and create a natural hedge against interest rate volatility and business cyclicality, an important factor in our performance.
We were founded in 2005 by members of our executive team who held various senior level executive positions at large mortgage companies and financial institutions. The loans we originate, finance and service conform to the requirements of GSEs, such as Fannie Mae and Freddie Mac, as well as government agencies, such as Ginnie Mae, the FHA, the VA, and private investors. We utilize proprietary technology to automate many of our core processes, which allows us to perform a high level of risk-based due diligence on each loan. We have also automated various aspects of quality control and regulatory compliance risk processes, which allows us to ensure adherence to credit, compliance and collateral standards of the GSEs and other investors. We believe that our expertise and the strength of our mortgage platform is best demonstrated by our exceptional track record as a mortgage originator and servicer, coupled with our ability to scale operations without compromising the quality of originated and serviced loans. As a result of our strong operating, technology and underwriting procedures that we apply consistently to each loan, we have not incurred any material losses related to repurchase or indemnification demands from the GSEs or other investors in our loans. We believe our lack of legacy issues
-114-
Table of Contents
and our focus on purchase versus refinance mortgages has positioned us as one of the leading non-bank integrated mortgage origination and servicing providers capable of taking advantage of growth opportunities in the mortgage sector.
Recent Events
Acquisition of Crossline Capital, Inc. On December 20, 2013, we acquired Crossline Capital, Inc., or Crossline, a California-based mortgage lender that originates and services residential mortgages. The acquisition of Crossline allows us to increase our retail origination volume through “tuck-in” acquisition. Crossline is licensed to originate mortgages in 20 states including Arizona, California, Colorado, Connecticut, Florida, Georgia, Idaho, Maryland, Massachusetts, New Hampshire, New Mexico, North Carolina, Ohio, Oregon, Pennsylvania, Rhode Island, Texas, Utah, Virginia and Washington, and is an approved FNMA Seller Servicer. In addition, Crossline operates two national mortgage origination call centers in Lake Forest, California and Scottsdale, Arizona and also operates retail mortgage origination branches in seven other locations in Southern California. The purchase price for Crossline, which, along with working capital for the business, is being funded out of our existing cash resources and line of credit facilities with our warehouse lenders, was approximately $9.4 million.
Acquisition of Wholesale Channel and Retail Assets from Nationstar Mortgage Holdings, Inc. On November 29, 2013, we acquire the wholesale lending channel and certain distributed retail assets of Nationstar Mortgage Holdings Inc., or Nationstar. The acquisition of Nationstar’s wholesale lending channel and retail assets complement our existing wholesale and retail channels and accelerates our geographic retail channel expansion. In the acquisition, we agreed to purchase the assets and offer employment to certain employees associated with these businesses. The purchase price for the assets acquired from Nationstar was approximately $0.5 million, which, along with working capital for the business, is being funded out of our existing cash resources and line of credit facilities with our warehouse lenders.
Initial Public Offering. On October 16, 2013, we sold our common stock in our IPO. We realized net proceeds of approximately $120.9 million from the IPO, after deducting underwriting discounts and commissions and estimated offering expenses payable by us. We intend to use the net proceeds from the IPO to make investments relating to our business and for general corporate purposes.
Market Overview
The U.S. residential mortgage industry is the largest segment of the consumer finance industry with over $10.0 trillion of outstanding debt at December 31, 2012 and originations of $1.8 trillion, including $1.2 trillion of refinancing volume, for the year ending December 31, 2012. Of the 2012 total volume, over 87% of originations conformed to the requirements of the GSEs or government agencies, compared to approximately 38% and 36% in 2005 and 2006, respectively. We expect that with the proposed GSE reform, lower qualifying loan limits and higher GSE guarantee fees, origination volumes conforming to the requirements of Agency mortgage loans will gradually decline while non-Agency mortgage loans will increase and comprise a larger portion of the mortgage loan market. The non-Agency mortgage loan market has also been stressed due to the limited ability of mortgage originators to securitize mortgage loans or sell loans to investors. According to Inside Mortgage Finance, non-Agency MBS issuance, which accounted for 56% of all MBS in 2006, declined to less than 1% in 2012, though volumes are expected to increase with higher quality originations and increasing confidence in a housing recovery.
Participants in the mortgage industry consist of large depository institutions and non-bank originators that sell directly to the GSEs as well as other originators, referred to as TPOs, that originate loans from retail customers and sell them to a depository institution or non-bank originator (referred to as an “Aggregator”), such as ourselves. Loans are sourced through a variety of channels including retail branches, the internet and call centers, as well as acquired from TPOs such as banks, mortgage bankers and brokers. The mortgage industry is
-115-
Table of Contents
extremely fragmented and is principally comprised of a large number of regional participants. Of the over 15,000 mortgage companies that are currently licensed to originate mortgage loans in the U.S., 81% have a presence in only one state and 75% have five or fewer mortgage loan officers. These mortgage originators either sell directly to the GSEs or to Aggregators, though there is significant concentration amongst the loans sold to the GSEs. Of the $710 billion of loans sold to the GSEs during the six months ended June 30, 2013, as reported to Inside Mortgage Finance, the top 25 sellers accounted for 70%, or $495 billion, of loan originations with the remaining approximately 2,000 sellers accounting for the remaining 30%, or $215 billion of loan originations.
The financial crisis led many of the largest depository institutions to reduce their participation in the mortgage market, including discontinuing the acquisition of mortgages from TPOs, and the industry remains in a period of significant transformation. Additionally, GSEs and other regulators have imposed substantial compliance requirements, increased capital requirements and proposed enhanced fees based on volume for smaller originators, thus potentially limiting participants in the sector and driving consolidation across the sector. We expect that these changes will drive more and more originators to become TPOs and sell originations to Aggregators such as ourselves, rather than the current practice of selling directly to the GSEs. During the six months ended June 30, 2013, over 1,700 sellers sold $50 million or less in loans to the GSEs, representing $21 billion or 3% of total volume. Further, we also believe that evolving market conditions, including the higher requirements to be able to sell directly to the GSEs, will also drive consolidation amongst industry participants with smaller originators lacking scale being acquired by larger participants in the sector. We believe that the fragmented mortgage industry, increasing regulation and stricter policies provide an attractive opportunity to an Aggregator such as ourselves.
As a result of regulatory and market driven changes instituted in the mortgage market, including higher capital requirements for commercial banks on MSRs and increased quality control and compliance standards for mortgage underwriting, we believe that mortgage origination activity is gradually shifting from banks to non-banks. We believe that this trend is expected to continue at an accelerated rate in the future. Additionally, because the residential mortgage industry is characterized by high barriers to entry, including the necessity for approvals required to sell loans to, and service loans for, the GSEs or government organizations, state licensing requirements, and operating and technology platform requirements, we believe that we are well positioned to lead the rapidly evolving mortgage loan origination and servicing sector.
Our Business
We are an integrated mortgage company that derives revenue from three principal sources: mortgage origination, mortgage financing and mortgage servicing. Our mortgage origination business generates income primarily through origination fees and gains upon the sale of mortgage loans sourced through our correspondent, wholesale and retail channels. We also provide financing to our correspondent customers and others while they are accumulating loans prior to selling them to Aggregators, including ourselves, through our mortgage financing business and we earn interest and fee income for these services. We also have the ability to retain the MSRs on
-116-
Table of Contents
the loans we sell and to create a recurring servicing income stream in our mortgage servicing business. We believe our three business lines are complementary and provide us with the ability to effectively and efficiently source, finance, sell and service mortgage loans.
Mortgage Originations
Our mortgage origination business primarily originates and sells residential mortgage loans, which conform to the underwriting guidelines of the GSEs and government agencies. We also originate and sell jumbo loans, i.e., loans that conform to the underwriting guidelines of the GSEs, except that they exceed the maximum loan size allowed for single unit properties. We expect that as the non-Agency market continues to recover and GSE reform is approved and implemented, a larger proportion of the industry volume will be comprised of non-Agency mortgage loans. We believe we are well positioned to benefit from this shift in the market given our business model and management expertise in originating and securitizing non-Agency mortgage loans.
We are currently licensed in 39 states and Washington, D.C., including six states (California, Montana, Oregon, Rhode Island, Virginia and Washington) where we have become licensed since June 30, 2013. We intend to become licensed in all 48 of the contiguous United States in the first half of 2014. The nine states in which we are not licensed, including six states where we have a pending license application, represented approximately 15% of the overall residential mortgage origination market in 2012 and the five states where we have become licensed since June 30, 2013, represented approximately 30% of the overall residential mortgage origination market in 2012. As we become licensed in these additional states and as we increase our origination activity in the states where we have only recently become licensed, we believe our origination volume will increase substantially. Economic and housing and mortgage market conditions can vary significantly from one geographic region to another; therefore, the geographic distribution of our mortgage originations can have a direct impact on the overall performance of our servicing portfolio. As of September 30, 2013, approximately 14%, 10% and 9% of the aggregate outstanding loan balances in our servicing portfolio were concentrated in Texas, Indiana and Ohio, respectively. Although we anticipate that our origination and servicing portfolios will become less geographically concentrated over time as we expand our operations into the additional nine states where we are not currently licensed and the states where we have only recently become licensed, the geographic distribution of the mortgage loans we originate and service in the near term will likely be similar to that of our current servicing portfolio. To the extent the states where we have a higher concentration of loans experience weaker economic conditions, greater rates of decline in single family residential real estate values or reduced demand within the residential mortgage sector relative to the United States generally, the risks inherent in our business would be magnified as compared to our competitors that have a broader and less concentrated geographic footprint.
Additionally, since inception, we have focused on originating mortgage loans associated with purchase transactions as opposed to refinancings to a greater degree than many industry participants. During 2012, approximately 45% of our loan originations were purchase loans and approximately 55% were refinance
-117-
Table of Contents
transactions, compared to 29% and 71%, respectively, for the industry as a whole. We believe purchase transactions are more sustainable than refinance transactions, and typically have slower prepayment speeds in early years, making the MSRs more valuable and less volatile. Additionally, we believe that the mortgage market will increasingly shift to purchase mortgages as the housing market continues to recover, first time home buyers re-enter the housing market and interest rates increase. Further, as the non-Agency market continues to recover, we believe that our platform and management expertise in originating and securitizing these mortgages will position us well to benefit from this transformation.
We originate residential mortgage loans through three channels: correspondent, wholesale and retail. Although the majority of our originations are currently through our correspondent channel, our presence in the wholesale and retail channels makes our platform both diversified and scalable. While the channels are diverse, we constantly focus on quality control and maintaining high underwriting standards. We perform diligence on and underwrite loans through our proprietary technology platform, Online Loan Information Exchange (“OLIE”), an integrated, automated risk-based due diligence engine that automates the review process by applying business rules specific to the loan and the seller. We analyze credit, collateral and compliance risk on every loan on a pre-funding or a pre-purchase basis in order to ensure that each loan meets our investors’ standards and any applicable regulatory rules. We also capture loan data and documents associated with the loan from application through sale/securitization and servicing, giving us the ability to run additional business rules that provide indication of loan performance. We believe that the ability to offer greater transparency and data to institutional investors that purchase our loans or securities backed by our loans will provide us with a substantial advantage over our competitors in our sales executions as the mortgage market continues to evolve and we begin to securitize our own non-Agency mortgage loans.
Our three mortgage loan originations channels are discussed in more detail below.
Correspondent Channel
We acquire newly originated loans conforming to the underwriting standards of the GSEs or government agencies as well as non-Agency mortgage loans conforming to the standards of our investors from our network of correspondents across 39 states plus Washington, D.C. We identify our correspondent customers through a team of relationship managers who are responsible for signing-up customers and ensuring that we receive an adequate share of their origination volume. In addition to competitive pricing, we offer our correspondents access to a state-of-the-art technology platform, funding through our financing platform (NattyMac), including access to innovative financing programs such as early purchase facilities, as well as a timely and transparent process of acquiring their loans. In return, our correspondents provide us with high quality products that meet our underwriting standards. We track the performance of our correspondents on a score-card and terminate relationships where quality and other requirements are not met. We believe that our programs offer correspondents an attractive value proposition, including greater access to capital and liquidity, as they seek to maintain and grow their businesses. As a testament to our relationship management and product offering, our correspondent origination volume has increased from $1.2 billion in the nine months ended September 30, 2012 to $4.6 billion in the nine months ended September 30, 2013, or by 283%, including a 19% increase from $1,488.6 million in the second quarter of 2013 to $1,766.3 in the third quarter of 2013.
Our growth has been driven by adding new correspondents as well as deepening relationships with existing correspondents. Our correspondent channel represented 73% of our mortgage originations for the nine months ended September 30, 2013. We conduct financial, operational and risk reviews of each correspondent prior to initially approving them as a customer and on an annual basis to ensure compliance with our guidelines and those of the various regulators who govern our business. In addition we conduct background and financial reviews of the principals and their mortgage loan officers, and in some cases require personal guarantees. We believe that as we receive licenses in additional states and continue to increase our coverage of correspondents, we will continue to increase our market share.
-118-
Table of Contents
Wholesale Channel
Through our wholesale channel, we originate loans through a network of approximately 490 non-exclusive relationships with various approved mortgage companies and mortgage brokers. Mortgage brokers identify applicants, help them complete a loan application, gather required information and documents, and act as our liaison with the borrower during the lending process. We review and underwrite an application submitted by a broker, accept or reject the application, determine the range of interest rates and other loan terms, and fund the loan upon acceptance by the borrower and satisfaction of all conditions to the loan in much the same manner as our retail channel. By relying on brokers to market our products and assist the borrower throughout the loan application process, we can increase loan volume through our wholesale channel with proportionately lower increases in overhead costs compared with the costs of increasing loan volume through loan originations in our retail channels.
We provide a variety of Agency, government insured and non-Agency mortgage loan products to our brokers to allow them to better service their borrowers. Before approving a mortgage broker for business, we focus on several attributes including origination volume, quality of originations and tangible net worth. We also conduct financial and background checks on the principals and their mortgage loan officers through various third-party sources and in some cases we require personal guarantees. Once we begin acquiring loans from our mortgage brokers, we track the performance of the loans on an on-going basis and terminate business relationships if the loans consistently do not perform or if there is evidence of misrepresentation. During the twelve months ended September 30, 2013, we did not terminate any significant relationships due to our continued focus on underwriting loans and ensuring compliance with policies.
Retail Channel
Our retail channel primarily operates through 40 retail offices across 14 states. In this channel, company representatives originate loans through their relationships with local real estate agents, builders, telemarketing and other local contacts. This channel accounted for 15% of our 2012 originations. We expect to continue to grow our retail channel by adding new branches for at least the next 24 months. In addition, we expect that with the continued transformation of the mortgage sector there will be opportunities to acquire small retail mortgage operators as several independent mortgage originators will lack the scale to profitably originate and sell mortgages. We believe that we could provide a solution to such operators by acquiring and integrating them into our branch network. We are currently actively evaluating opportunities to acquire several of these retail originators and believe that the continued development and growth of our retail channel is central to our business strategy.
Financing
We acquired our financing platform, known as NattyMac, in August 2012, and fully integrated the platform into our mortgage banking operations in December of 2012. Founded in 1994, NattyMac earlier operated as an independent mortgage warehouse lender focused on financing prime mortgage collateral, such as Agency-eligible, government insured and government guaranteed loans that were committed for purchase by GSEs. Following our acquisition, in June 2013, we consolidated our NattyMac financing platform into a wholly-owned subsidiary which will focus on providing warehouse financing to us, our correspondent customers and others. We expect that NattyMac will be able to leverage our proprietary technology (OLIE) and our existing due diligence and underwriting processes to efficiently underwrite the warehouse lines of credit it provides for our correspondents who are its customers and others. We intend for this to create an additional source of funding for our correspondents to originate mortgage loans that meet our underwriting requirements and are eligible for us to purchase.
Our financing platform features a centralized custodian and disbursement agent allowing us to enter into participation arrangements with financial institutions, such as regional banks for an interest in our newly
-119-
Table of Contents
originated loans during the time these loans would otherwise be funded by a warehouse line or traditional repurchase facility. Additionally, by offering regional banks an opportunity to invest in a liquid high-quality asset, we are able to earn fee and net interest income. We believe that regional banks continue to have significant appetite for such investment opportunities and we believe our financing platform allows us to compete with bank-owned mortgage lenders who have access to cheaper deposit funding. We believe this is a competitive advantage over other non-bank mortgage originators and servicers who are reliant on other forms of wholesale financing to fund their operations.
Mortgage Servicing
Our mortgage servicing business is organized to maintain a high quality servicing portfolio and keep delinquency rates far below the industry average. We perform loan administration, collection and default activities, including the collection and remittance of loan payments, responding to customer inquiries, accounting for principal and interest, holding custodial (impound) funds for the payment of property taxes and insurance premiums, counseling delinquent mortgagors, modifying loans and supervising foreclosures and our property dispositions.
Our servicing model is also very focused on “recapture,” which involves actively working with existing borrowers to refinance their mortgage loans. When a loan is paid off or refinanced with a different lender, we lose the servicing fees on the loan, so our ability to recapture loans successfully is important to the longevity of our servicing cash flows. Because the refinanced loans typically have lower interest rates or lower monthly payments, and, in general, subsequently refinance more slowly and default less frequently, these refinancings also typically improve the overall quality of our servicing portfolio. For the twelve months ended September 30, 2013, we recaptured 33% of our payoffs (based on the dollar amount of refinanced mortgage loans).
Our servicing business produces strong recurring, contractual fee-based revenue with minimal credit risk. Servicing fees are primarily based on the aggregate UPB of the loans serviced and the payment structure varies by loan source and type. These include differences in rate of servicing fees as a percentage of UPB and in the structure of advances. We believe our origination business gives us a distinct advantage in building a high-quality portfolio of MSRs over those who rely heavily on purchasing MSRs from others to build their portfolios as originated portfolios generally perform better given the extensive diligence and underwriting procedures that we apply to each loan.
We service loans using a model designed to improve loan performance and reduce loan defaults and foreclosures. Our servicing portfolio consists of MSRs we retain from loans that we originate and MSRs we acquire from third party originators, including in transactions facilitated by GSEs, such as Fannie Mae and Freddie Mac. The loans we service are typically securitized by us, i.e., the loans have been pooled together with multiple other loans and interests have been sold to third party investors that are secured by loans in the securitization pool. As of September 30, 2013, our servicing portfolio contained $9.7 billion of residential first mortgages, with a weighted average coupon of 3.71% and a weighted average age of nine months. At September 30, 2013, the 90+ day delinquency rate in our servicing portfolio was 0.34%, the weighted average FICO score of our servicing portfolio was 740, and the adjusted CPR of our servicing portfolio as of September 30, 2013 was 5.80%.
Our Strengths
Leading, Non-Bank, Integrated Mortgage Company
We are a leading, non-bank, integrated mortgage company focused on efficiently and effectively originating, acquiring, selling, financing and servicing residential mortgage loans. We originate mortgages loans through our correspondent, wholesale and retail channels which provide diversity, increase scale and reduce dependency on any particular channel. During the nine months ended September 30, 2013, the correspondent,
-120-
Table of Contents
wholesale and retail channels accounted for 73%, 19% and 8%, respectively, of our origination volume. Our origination and financing businesses enable us to offer a comprehensive product suite to our customers and build an attractive mortgage servicing portfolio.
Profitable, Sustainable Business with Significant Growth Potential
We have been profitable every year since 2008 and, for the nine months ended September 30, 2013, our net income grew by 54% over the same period last year. Net income for the three months ended September 30, 2013, which was impacted by rising interest rates, was $1.7 million, compared to $9.1 million in the three months ended June 30, 2013 and $9.5 million in the three months ended September 30, 2012. The growth in net income has been driven by a significant increase in origination volume which increased by 209% during the nine months ended September 30, 2013 over the same period last year. We were able to achieve this growth as we expanded geographically into additional states, deepened correspondent relationships and expanded product offerings. We believe that we have significant growth potential as we are currently licensed in only 39 states plus Washington D.C., representing approximately 85% of the nation’s total origination volume in 2012. These 39 states include six states (California, Montana, Oregon, Rhode Island, Virginia and Washington) where we have become licensed since June 30, 2013. As we launch our services nationally and expand in the remaining nine contiguous United States, which accounted for approximately $287 billion, or approximately 15%, of the nation’s origination volume in 2012 and the six states where we have become licensed since June 30, 2013, which accounted for approximately $590 billion, or approximately 30%, of the nation’s origination volume in 2012, we believe that we will be able to continue to see meaningful growth in our origination volume. We will also see meaningful growth as we expect to benefit from consolidation in the mortgage market with the potential acquisition of retail originators, such as our acquisitions of Crossline and the retail assets of Nationstar.
Additionally, we are focused on purchase money volume which accounted for 53% of our origination volume for the twelve months ended September 30, 2013 compared to the industry average of 28% for the twelve months ended September 30, 2013. We believe that as refinancing volumes potentially decline with an increase in interest rates, we will be better positioned than the rest of the industry as our origination volumes will be more sustainable. Further, we also benefit from our growing mortgage servicing business which produces recurring fee income and from our financing business which provides fee and interest income.
We have made significant strategic investments in our business as we strive for growth. These investments include the opening of 19 retail branches in six states during 2012 and first half of 2013. We intend to expand further by opening additional retail branches during the remainder of 2013 and into 2014. In addition, in June 2013 we launched our non-Agency jumbo mortgage loan program and mortgage financing business to offer our customers a full suite of products. In order to achieve our growth targets, we have made significant investments and incurred significant operating expenses, which we believe will generate attractive returns over time.
Stable, Diversified and Complementary Funding Platform
Our NattyMac platform allows us to integrate a “syndicated” financing facility into our mortgage banking platform that consists of repurchase and participation agreements with major financial institutions, as well as regional and community banks. The financing facility provides a stable, low-cost diversified source of funding for our business and allows us to offer this as a service to our correspondent and other customers. We view this as a competitive advantage over other non-bank mortgage originators and servicers and a means of competing with banks that historically use deposit funding sources to finance their businesses. The platform also provides an ancillary source of fee and net interest income as we sell participations to depository institutions seeking an interest in liquid assets.
We view our NattyMac platform as being complementary to our origination business as correspondents are incentivized to sell the loans warehoused on our platform to us as it provides them with greater liquidity and
-121-
Table of Contents
minimizes the capital they require in their business. We believe our “pre-funding” due diligence process also reduces credit, compliance, collateral, interest rate and market risk by allowing us to assess the salability to potential funding sources and/or other loan investors prior to funding.
Consistent Ability to Produce High Quality Loans
We are focused on originating and servicing a portfolio of high quality residential mortgage loans. The table below contains information on the quality of our loans and delinquency rates for the dates indicated.
| As of or for the |
||||||||||||
| Nine Months |
Year Ended December 31, |
|||||||||||
| 2013 |
2012 |
2011 |
||||||||||
| Average FICO score of loans originated |
729 | 747 | 741 | |||||||||
| LTV of loans originated |
85 | % | 83 | % | 84 | % | ||||||
| Servicing portfolio weighted average FICO score |
740 | 744 | 735 | |||||||||
| Servicing portfolio 90+ day delinquency rate |
0.34 | % | 0.44 | % | 0.37 | % | ||||||
We believe that our asset performance is superior to the industry due to our technologically advanced platform, consistent and conservative underwriting processes and focus on conducting a pre-funding review of each loan to ensure it meets the standards set by the GSEs or our loan investors. These practices differ from many of our competitors that apply different underwriting standards and review policies depending on the channel from which the loan is originated from. For example, some of our competitors conduct a pre-funding analysis on a sampling basis for loans acquired in the correspondent and wholesale channels but a full review on loans originated through the retail channel. We believe that our relentless focus on quality and consistency in applying underwriting policies and procedures has enabled us to have no significant repurchase demands, thus minimizing our risk profile and differentiating us from much of our competition.
Our Complementary Origination, Servicing and Financing Businesses Create a Natural Hedge Against Interest Rate Volatility and Business Cyclicality
Our principal sources of revenue, mortgage servicing, mortgage origination and mortgage financing, contribute to our stable business profile by creating a natural hedge against changes in the interest rate environment. As interest rates rise and the likelihood of refinancing decreases, MSRs generally increase in value which helps to offset any decline in origination volumes. Additionally, as long-term interest rates increase we will earn greater fee and interest income as yields on mortgage loans will increase while the funding costs will remain proportionately lower. As interest rates decline and the likelihood of refinancing increases, origination volumes tend to increase which helps to offset the decline in the value of MSRs caused by the higher probability of loan prepayment. In addition, our origination platform helps us to recapture servicing rights on loan payoffs and thus replenish our MSRs during periods of high prepayments. For the twelve months ended September 30, 2013, our recapture rate was 33% of payoffs (based on the dollar amount of refinanced mortgage loans). We expect that our recapture rate will increase further as our retail call center operations continues to expand their focus on retention of our servicing portfolio.
Robust, Proprietary Operating Platform
We believe that the current processes and systems generally used by brokers and correspondents to originate loans are fragmented and result in inconsistent data, lack of controls, and limited transparency for market participants. In response to this weakness, we have built a proprietary diligence and underwriting decision platform, OLIE, that incorporates what we believe to be the best balance of data integrity, efficiency, ease of use, speed of decision, loan quality, consistency and control. We believe this service is valued by our brokers and correspondents and offers us a distinct advantage over our competitors.
-122-
Table of Contents
OLIE provides a transparent view of all documents and loan level data throughout the entire life of a loan, from origination through securitization and final disposition, enabling us to measure and manage the performance of our loans, giving us the ability to proactively identify trends that may negatively impact our operational or financial performance. After we originate a loan, we also capture loan data and documents associated with the loan from application through sale/securitization and servicing, giving us the ability to run additional business rules that test the effectiveness of our system and provide indication of loan performance. We believe that our current platform and our robust diligence procedures are the central reason we have not had any significant loan losses from indemnification or repurchase demands compared to other competitors who have realized significant losses. Additionally, we are able to offer greater transparency to the institutional investors that purchase our loans which is reflected in our sales execution.
Subsequent to June 30, 2013, we implemented version 1.0 and 2.0 of our “C3” automated risk-based diligence engine, which is integrated with OLIE. C3 allows us to perform an electronic quantitative risk assessment on each loan, enabling us to target our due diligence procedures on higher risk loans and thereby gain efficiencies in performing the diligence process. Our servicing of these loans gives us the ability to analyze the effectiveness of our C3 automated risk-based diligence engine and, we believe, as an integrated platform with OLIE, has provided our institutional investors with even more robust diligence procedures targeted at the loans where they seek that additional level of due diligence.
Seasoned Management Team
Our senior management team is comprised of experienced mortgage industry executives with a track record of managing all aspects of the residential mortgage business through a variety of credit cycles and market conditions. Our founder and Chief Executive Officer, Jim Cutillo, has successfully led and managed the company through the recent transformation of the mortgage industry. Additionally, our president and other members of our senior management team have an average of 20 years of experience in the mortgage banking industry. We believe our executive management team has a clear vision and common set of core values and will be able to successfully execute our rapid growth strategy.
Our Growth Drivers
We expect to drive future growth in the following ways:
Grow Origination Volume Across Channels
We intend to grow our origination volume across our channels by expanding nationally. We are currently licensed in 39 states plus Washington, D.C., which account for approximately 85% of U.S. residential mortgage originations. These 39 states include six states where we have become licensed since June 30, 2013, and have not yet commenced any material operations. We intend to become licensed in all 48 of the contiguous United States in the first half of 2014. As we launch our services nationally and expand in the remaining nine contiguous United States, which accounted for approximately $287 billion, or approximately 15%, of the nation’s origination volume in 2012, and the six states where we have become licensed since June 30, 2013, which accounted for approximately $590 billion, or approximately 30%, of the nation’s origination market in 2012 we believe that we will be able to continue to see meaningful growth in our origination volume. This will also enable us to substantially grow our correspondent, wholesale and retail footprint and deepen existing correspondent and wholesale relationships.
Expand into Non-Agency Mortgage Loans
Our extensive expertise in prime non-Agency jumbo securitization provides us the opportunity to substantially grow our non-Agency loan origination volume. We intend to focus on increasing production of loans that meet Agency criteria in nearly all respects other than loan size. These loans are generally referred to as
-123-
Table of Contents
“jumbo” loans and are originated through our existing channels. Over the last few years, this market has been hindered by the lack of an efficient capital market in which to sell such loans. We believe, as the market normalizes and non-Agency private securitization returns, we will be one of the few non-bank originators with this capability, giving us the ability to be an Aggregator for others and establishing ourselves as a market leader. The non-Agency MBS market was 56% of the total MBS market or $1.14 trillion in 2006 compared to 0.78% or $13.2 billion in 2012. In anticipation of the non-Agency market recovering and GSE reform, we intend to create a securitization shelf in 2014 and offer investors an opportunity to invest in securities backed by these loans. We may also retain the junior subordinated notes from the securitizations and create a recurring interest income stream for ourselves.
We believe that our integrated origination and servicing platform coupled with our expertise provides us with what we believe is a significant competitive advantage. We expect this investment strategy to create an attractive risk-adjusted return for our shareholders and to position us as one of the leading non-bank integrated mortgage origination and service providers.
Grow our Servicing Business
We anticipate being able to continue to retain the MSRs associated with loans we originate at attractive multiples through our integrated mortgage banking platform, whereas many of our competitors rely on purchasing MSRs. We feel our strategy is not only a more efficient utilization of capital but has less credit, collateral and compliance risk, since all loans are carefully reviewed by us prior to purchase.
We believe we can also leverage our correspondent channel to purchase MSRs from correspondent clients on a “co-issue” basis, meaning our clients originate and securitize Agency loans and concurrently transfer the servicing rights to us. This “co-issue” strategy will allow us to acquire the MSRs on an OMSR basis versus a PMSR basis, since the servicing is treated as a whole loan origination. The “co-issue” strategy provides a competitive advantage over other purchasers of MSRs via bulk acquisitions as we have an existing relationship with the originator and understand their origination capabilities and techniques which drives the credit quality and performance of these loans. MSRs purchased in this way are expected to have substantially similar attributes to our originated loans with respect to note rate, credit quality and loan type. We completed our first transaction in the fourth quarter of 2013, acquiring an MSR portfolio with a UPB of approximately $142 million for a total cash purchase price of approximately $1.5 million, and continue to grow this area of our business to augment the acquisition of servicing rights. We plan to perform the same level of pre-funding due diligence on these loans prior to purchasing the servicing rights from the seller. This strategy is similar in nature to our origination strategy of offering mandatory delivery and is another delivery type that is not dependent on our origination business, making it highly scalable and efficient from an operational and financial perspective.
Grow our Mortgage Financing Business
In the current market, many correspondents lack capital to grow their businesses and, therefore, are constrained by their balance sheets from a warehouse lending perspective. A typical warehouse lender will provide financing subject to a tangible net worth covenant and require that the correspondent contribute a percentage of the principal balance to fund the warehoused loans. Often, this creates a capital constraint for the correspondent if the “take-out” or permanent investor takes too long to review or purchase the loan. We have created an early purchase facility that allows approved correspondents to sell us loans on an accelerated basis, moving them off their balance sheets and freeing up their warehouse lines so they can fund more loans. We earn fee and net interest income on these loans, which are held on average 15 days prior to sale. This also complements our mortgage origination business as we will generally acquire these loans from the correspondents, add the MSR to our portfolio and service the loans for borrowers going forward. We launched our financing business in June 2013 by hiring two dedicated experienced account executives and we expect to make additional hires as we roll out this business nationwide.
-124-
Table of Contents
Our Operations
Mortgage Origination Business
Our origination business is diversified and allows us to originate and acquire loans through three channels: correspondent, wholesale and retail. While the channels are diverse, our constant focus in all of the channels is on quality control and maintaining the high standards of our credit portfolio. The table below sets forth the origination volume from each channel during the nine months ended September 30, 2013 and the year ended December 31, 2012.
| (dollars in millions) |
Nine months ended September 30,
|
Year ended December 31, |
||||||||||||||
| # of Loans |
Sum of Loan |
# of Loans |
Sum of Loan |
|||||||||||||
| Channel: |
||||||||||||||||
| Retail |
3,012 | $ | 497.1 | 3,039 | $ | 508,966 | ||||||||||
| Wholesale |
6,193 | 1,219.9 | 4,554 | 893,755 | ||||||||||||
| Correspondent |
24,317 | 4,608.2 | 10,540 | 2,047,056 | ||||||||||||
|
|
|
|
|
|
|
|
|
|||||||||
| Total |
33,522 | $ | 6,325.2 | 18,133 | $ | 3,449,777 | ||||||||||
|
|
|
|
|
|
|
|
|
|||||||||
Our largest channel is our correspondent channel, which represents loans acquired from mortgage bankers or other financial institutions. Our second largest channel, the wholesale channel, involves loans solicited from brokers. Our third largest channel, the retail channel, operates primarily through 27 offices where company representatives originate loans through their relationships with local real estate agents, builders, telemarketing and other local contacts.
We originate purchase money loans and refinance existing loans, including those that we service. Our strategy is to minimize delinquencies and defaults in our portfolio through a comprehensive due diligence process. We have historically maintained a delinquency rate that is significantly below the industry average and believe our OLIE platform will enable us to keep this delinquency rate low as we grow our portfolio.
OLIE Platform
While we have consistently been a leader in incorporating new technologies for asset quality evaluation and monitoring and have in turn produced a rapidly expanding portfolio which has performed well above our peers, our proprietary OLIE system will introduce the first fully functional 100% pre-funding review system, combining credit, compliance and collateral into one asset evaluation model. Our OLIE platform allows us to evaluate a loan before we buy or fund the loan. This allows us to identify defects in a loan before we add it to our portfolio and should help us to maintain the high quality of our portfolio even as our portfolio grows rapidly. The OLIE platform automates some aspects of the underwriting function and divides potential borrowers into three underwriting categories based on whether the loan is determined to be low risk, medium risk or high risk. This allows us to efficiently evaluate loan applicants while paying increased attention to loans deemed to be high risk.
Our OLIE platform differentiates us from other non-bank, loan servicers without such platforms by:
| • | increasing the efficiency and speed of underwriting, credit, collateral and compliance decisions; |
| • | providing secondary market investors with greater transparency and more reliable data about loan quality; |
| • | helping us to create a diversified source of revenue that we believe better protects us against declining servicing cash flows; and |
| • | building brand recognition. |
-125-
Table of Contents
Origination Drivers of Profitability
Origination Volume: Our origination volume is driven by two factors, the total market size and our market share. Market size reflects the volume of residential mortgage loans expected to be originated annually in the U.S. origination market share refers to the portion of the annual U.S. residential mortgage loan origination market that we capture through our various channels. Generally, as the market size of mortgage originations or our market share increases, our opportunities increase to originate mortgage loans, generate fee income and gain on sale income and grow our servicing portfolio through the addition of MSRs. Conversely, as the size of the market or our market share decreases, our opportunities to originate mortgage loans, to generate fee income and gain on sale income and to grow our servicing portfolio through the addition of MSRs are reduced. Total market size is a function of interest rates, level of economic activity, underwriting standards, home prices, supply of credit and participation of lenders. Generally speaking, our market share is a function of the number of state licenses held, sales people employed, the products and services offered and length of time making loans in the community.
Gain on Sale of Mortgage Loans: Gain on sale represents the cash gain on sale realized from the sale of mortgage loans as well as the retained value of the MSR on the sold mortgage loans. The cash gain on sale and the value of the MSR varies, amongst other things, with supply and demand of mortgage-backed securities in the secondary market, current and expected interest rate environment, credit characteristics and other economic conditions.
Cost to Originate: Cost to originate includes the fixed and variable costs we incur in purchasing and originating our mortgage loans, including such items as personnel costs, lease costs, vendor costs and the costs of our technology. As our cost to originate increases, our earnings decrease and, conversely, as our cost to originate decreases, our earnings increase. The cost structure of our channels vary significantly with our retail channel having higher origination costs than our correspondent and retail channels. Our cost structure is also highly scalable and is capable of originating substantially higher volumes than we currently originate.
Mortgage Servicing Business
We service loans using a model designed to improve loan performance and reduce loan defaults and foreclosures. Certain of the loans underlying the MSRs that we own are credit sensitive in nature and the value of these MSRs is more likely to be affected by credit losses than by interest rate movement. The remaining loans underlying our MSRs are prime Agency and government conforming residential mortgage loans for which the value of the MSRs is more likely to be affected by interest rate movement than credit losses.
Our Servicing Model Strategic Initiatives
The strategic initiatives of our servicing business are to improve risk management, automation and reporting. To meet the first initiative of improving risk management, we are adding a dedicated risk manager, upgraded our external quality control firm and improved risk reporting. To meet our second initiative of increased automation, we are focused on using technology to automate manual processes and integrating third party systems to efficiently connect with our existing technology platforms. Finally, to meet our third initiative of improved reporting, we are enhancing our compliance, process management, performance management and ad-hoc reporting systems.
We believe these initiatives will position the company to increase the scale of our servicing operations. As our portfolio grows, we have focused on keeping our cost of service low and controllable expenses have held steady as our building scale tempers the improvement curve. Our current growth focus is on adding additional capacity in Indianapolis and breaking the processes into components that we can document. Over the longer term, we believe these initiatives will position the servicing business to move toward becoming a rated servicer. As we grow in scale, we have continued to carefully monitor delinquency trends in the portfolio to ensure that the quality of the portfolio does not deteriorate.
-126-
Table of Contents
Servicing Business Model
We service loans by purchasing the MSRs from the mortgage owner or retaining the MSRs related to the loans we originate. Pursuant to our servicing arrangements, we generally receive a contractual per loan fee between approximately 19 to 44 basis points annually on the UPB, with a weighted average across our servicing portfolio of approximately 27 basis points at September 30, 2013.
The servicing fees are typically supplemented by incentive fees and ancillary fees. Incentive fees include modification initiation and success fees from Home Affordable Modification Program (“HAMP”) and modification or collateral workout related incentives from various pool owners and GSEs. Ancillary fees include late fees, non-sufficient funds fees, convenience fees and interest income earned on loan payments that have been collected but have not yet been remitted to the owner of the mortgage loan, or “float.”
A key determinant of the profitability of our servicing portfolio is the longevity of the servicing cash flows before a loan is repaid or liquidates. We are often able to extend the longevity of the servicing cash flows through loan refinancings by retaining the servicing rights of the loans we recapture. Because the refinanced loans typically have lower interest rates or lower monthly payments, and, in general, subsequently refinance more slowly and default less frequently, these refinancings also typically improve the overall quality of our primary servicing portfolio.
We have grown our servicing portfolio to $9.7 billion in UPB as of September 30, 2013 from $175 million in UPB at the time we merged with Swain in May 2009.
Key Drivers of Profitability
The following key factors drive the amount of profit we generate from our servicing operations.
Aggregate UPB: Servicing fees are usually earned as a percentage of UPB or a per loan amount and growth in the UPB of a portfolio means growth in servicing fees. Additionally, a larger servicing portfolio generates increased ancillary fees and leads to larger custodial balances that generate greater float income. A larger servicing portfolio also drives increases in expenses, including additional interest expense to finance the servicing advances as the size of our portfolio increases.
In addition, servicers of GSE-insured loans collect servicing fees only on performing loans while servicers of non-GSE residential MBS are entitled to servicing fees on both performing loans and delinquent loans. The servicing fee relating to delinquent loans is accrued and paid from liquidation proceeds ahead of the reimbursement of advances. The aggregate UPB from which we earn fees thus depends partly on the relative number of non-performing loans we have in our portfolio.
Stability and longevity of servicing cash flows: We are able to generate servicing fees by extending the longevity of our serving cash flows. Prepayment speed, which is the measurement of how quickly UPB is reduced, thus significantly affects our profitability. Items reducing UPB include normal monthly principal payments, refinancings, voluntary property sales and involuntary property sales such as foreclosures or short sales. Prepayment speed impacts future servicing fees, fair value of servicing rights, float income, interest expense on advances and compensating interest expense. When prepayment speed increases, our servicing fees decrease faster than projected due to the shortened life of a portfolio. The converse is true when prepayment speed decreases.
Prepayment speed affects our float income as well. Decreased prepayment speed typically leads to our holding lower float balances before remitting payoff collections to the investor and lower float income due to a lower invested balance. Lower prepayments have been associated with higher delinquency rates, higher advance balances and interest expense.
-127-
Table of Contents
In addition, by actively working with borrowers, we are often able to extend the longevity of the servicing cash flows through loan refinancings by retaining the servicing rights of the loans we recapture. Because the refinanced loans typically have lower interest rates or lower monthly payments, and in general, subsequently refinance more slowly and default less frequently, these refinancings also typically improve the overall quality of our servicing portfolio.
Ability to add new servicing business: We seek to increase the size of our servicing portfolio in several ways. We increase our primary servicing portfolio by acquiring MSRs or increasing originations through our diversified origination channels.
Cost of servicing: Our profitability is inversely proportional to our cost of servicing. As a result, we actively manage our servicing costs in order to maximize profitability. However, several factors affect our servicing costs.
Delinquent loans are more expensive to service than performing loans because our cost of servicing is higher and, although credit losses are generally not a concern for our financial results, our advances to investors increase, which results in higher financing costs. Performing loans include those loans that are current or have been delinquent for less than 30 days in accordance with their original terms and those loans on which borrowers are making scheduled payments under loan modifications, forbearance plans or bankruptcy plans. We consider all other loans to be delinquent.
When borrowers are delinquent, the amount of funds that we are required to advance to the owners of the loans on behalf of the borrowers increases. While the collectability of advances is generally not an issue, we do incur significant costs to finance those advances. We intend to utilize both securitization and revolving credit facilities to finance our advances. As a result, increased delinquencies result in increased interest expense.
Mortgage Loans by State
The following is a summary of the loans we serviced as of September 30, 2013 by geographic concentration for the top nine states as measured by the total unpaid principal balance as of September 30, 2013:
| September 30, 2013 |
||||||||
| $UPB | % of Total UPB |
|||||||
| (in millions) | ||||||||
| Texas |
$ | 1,351.1 | 14 | % | ||||
| Indiana |
960.8 | 10 | % | |||||
| Ohio |
829.1 | 9 | % | |||||
| Illinois |
617.0 | 6 | % | |||||
| Missouri |
616.7 | 6 | % | |||||
| Georgia |
606.5 | 6 | % | |||||
| New Jersey |
581.8 | 6 | % | |||||
| Pennsylvania |
538.6 | 6 | % | |||||
| Kansas |
471.9 | 5 | % | |||||
| All other states |
3,109.1 | 32 | % | |||||
|
|
|
|
|
|||||
| Total |
$ | 9,682.6 | 100 | % | ||||
|
|
|
|
|
|||||
Economic and housing and mortgage market conditions can vary significantly from one geographic region to another; therefore, the geographic distribution of mortgages in a mortgage and servicing portfolio can have a direct impact on the overall performance of the portfolio. To the extent the states where we have a higher concentration of loans experience weaker economic conditions, greater rates of decline in single family residential real estate values or reduced demand within the residential mortgage sector relative to the United States generally, the effect of the risks described in “Risk Factors,” including “—Risks Related to Our Business and Industry—The geographic concentration of our servicing portfolio may result in a higher rate of delinquencies and/or defaults, which could adversely affect our business, financial condition and results of operations,” may increase.
-128-
Table of Contents
Although we anticipate that our origination and servicing portfolios will become less geographically concentrated over time as we expand our operations into the additional nine states where we are not currently licensed, the geographic distribution of the mortgage loans we originate and service in the near term will likely be similar to that of our current servicing portfolio.
Mortgage Financing Business
Drivers of Profitability
Loans Outstanding. Loans outstanding are determined by the total market size of the non-bank market and our share of the market. Market size reflects the annual volume of non-bank residential mortgage loan originations in the U.S. that are seeking non-bank financing. Our share reflects the amount of the market we capture. Generally as market size or our market share of loan originations increase, we have more opportunity to provide warehouse lending facilities. Conversely, as loan originations or our market share decreases we have fewer opportunities to extend financing credit lines.
Net Interest Income. Net interest income for a warehouse line of credit is the difference between the rate at which we lend funds to our customers and our borrowing costs. This spread is determined by a variety of factors, including credit quality of loan, term of the loan, prevailing interest rates, regulatory environment, and general competition. The larger the spread the higher the net interest income derived per loan. Conversely, in very competitive environments when the spread is narrower and results in lower net interest income.
Fee Income. Financing fee income is primarily derived by the spread between the financing cost charged to correspondent clients and the cost of raising those funds from the network of financial institutions that have provided financing facilities to the Company. Revenue is also generated by fees charged to the correspondent clients that utilize our warehousing services.
Employees
As of September 30, 2013, we had 742 employees, all of whom are based in the United States. None of our employees are members of any labor union or subject to any collective bargaining agreement and we have never experienced any business interruption as a result of any labor dispute. Our employees are allocated among our business functions as follows:
| • | 74% are in our originations business; |
| • | 10% are in our servicing business and compliance functions; and |
| • | 16% are in corporate functions, including Human Resources, Accounting and other corporate functions. |
Regulation
Our business is subject to extensive federal, state and local regulation. Our loan originations, loan servicing and debt collection operations are primarily regulated at the state level by state licensing authorities and administrative agencies. Because we do business in 39 states and Washington, D.C., we, along with certain of our employees who engage in regulated activities, must apply for licensing as a mortgage banker or lender, loan servicer, mortgage loan originator and/or debt default specialist, pursuant to applicable state law. These laws typically require that we file applications and pay certain processing fees to be approved to operate in a particular state, and that our principals and loan originators be subject to background checks, administrative review and continuing education requirements. Our servicing operations center in Indianapolis, Indiana is licensed (or maintains an appropriate statutory exemption) to service mortgage loans in 39 states and Washington D.C. Our
-129-
Table of Contents
retail loan origination channel is licensed to originate loans in the states in which it operates, and our direct origination channel is licensed to originate loans in 39 states and Washington D.C. From time to time, we receive requests from states and other agencies for records, documents and information regarding our policies, procedures and practices regarding our loan originations, loan servicing and debt collection business activities, and we are subject to periodic examinations by state regulatory agencies. We incur significant ongoing costs to comply with these licensing requirements.
While the U.S. federal government does not primarily regulate mortgage lenders or their employees, the federal Secure and Fair Enforcement for Mortgage Licensing Act of 2008 requires all states to enact laws requiring each individual who takes mortgage loan applications, or who offers or negotiates terms of a residential mortgage loan, to be individually licensed or registered as a mortgage loan originator. These laws require each mortgage loan originator to enroll in the Nationwide Mortgage Licensing System, apply for individual licenses with the state where they operate, complete a minimum of 20 hours of pre-licensing education and an annual minimum of eight hours of continuing education, and to successfully complete both national and state exams.
In addition to licensing requirements, we must comply with a number of federal consumer protection laws, including, among others:
| • | the Gramm-Leach-Bliley Act, which requires us to maintain privacy with respect to certain consumer data in our possession and to periodically communicate with consumers on privacy matters; |
| • | the Fair Debt Collection Practices Act, which regulates the timing and content of debt collection communications; |
| • | the Truth in Lending Act and Regulation Z thereunder, which require certain disclosures to mortgagors regarding the terms of their mortgage loans; |
| • | the Fair Credit Reporting Act, which regulates the use and reporting of information related to the credit history of consumers; |
| • | the Equal Credit Opportunity Act and Regulation B thereunder, which prohibit discrimination on the basis of age, race and certain other characteristics, in the extension of credit; |
| • | the Homeowners Equity Protection Act, which requires, among other things, the cancellation of mortgage insurance once certain equity levels are reached; |
| • | the Home Mortgage Disclosure Act and Regulation C thereunder, which require mortgage lenders to report certain public loan data; and |
| • | the Fair Housing Act, which prohibits discrimination in housing on the basis of race, sex, national origin, and certain other characteristics. |
Dodd-Frank Act
On July 21, 2010, President Obama signed into law the Dodd-Frank Act which regulates the financial services industry, including securitizations, mortgage originations and mortgage sales. The Dodd-Frank Act also established the CFPB to enforce laws involving consumer financial products and services, including mortgage finance. As a mortgage lender and servicer, we are subject to examination and enforcement authority of the CFPB. Because of pending litigation questioning the validity of the appointment of the Director of the CFPB, there is uncertainty as to the enforceability of regulations promulgated by the CFPB and the applicability of certain provisions in the Dodd-Frank Act to mortgage lenders that are not financial institutions. We are evaluating the extent to which the provisions of the Dodd-Frank Act will apply to us in the event that the regulations promulgated by the CFPB are nullified.
-130-
Table of Contents
The Dodd-Frank Act directs the federal banking agencies and the Securities and Exchange Commission to adopt rules requiring an issuer or other entity creating an asset-backed security (including a mortgage-backed security) to retain an economic interest in a portion of the credit risk for the assets underlying the security. The agencies have proposed a rule that provides sponsors of securitizations with various options for meeting this requirement, including retaining risk equal to at least 5% of each class of asset-backed security, 5% of par value of all asset-backed security interests issued, 5% of a representative pool of assets, or a combination of these options. Under this proposal, asset-backed securities that are collateralized exclusively by qualified residential mortgages would not be subject to these requirements. The proposed rule also recognizes that the sponsor of a Fannie Mae or Freddie Mac securitization will satisfy the rule’s risk-retention provisions, at least while those agencies remain in conservatorship or receivership with capital support from the U.S. government, because of their 100% guarantee of principal and interest payable on the sponsored securities. Because substantially all of our loans are sold to, or pursuant to programs sponsored by, Fannie Mae, Freddie Mac, or Ginnie Mae, the current proposal would exempt us from the risk-retention requirements with regard to securities backed by such loans.
We continue to evaluate all aspects of the Dodd-Frank Act and the regulations issued thereunder. The burden associated with monitoring and complying with these regulations could increase our compliance costs and restrict our origination and servicing operations, all of which could adversely affect our business, financial condition or results of operations.
Mortgage Origination
On January 10, 2013, the CFPB issued a final rule implementing the “ability to repay” requirement in the Dodd-Frank Act. The rule, among other things, requires lenders to consider a consumer’s ability to repay a mortgage loan before extending credit to the consumer, and limits prepayment penalties. The rule also establishes certain protections from liability for mortgage lenders with regard to the “qualified mortgages” they originate. For this purpose, the rule defines a “qualified mortgage” to include a loan with a borrower debt-to-income ratio of less than or equal to 43% or, alternatively, a loan eligible for purchase by Fannie Mae or Freddie Mac while they operate under Federal conservatorship or receivership, and loans eligible for insurance or guarantee by the FHA, VA or USDA. Additionally, a qualified mortgage may not: (i) contain excess upfront points and fees; (ii) have a term greater than 30 years; or (iii) include interest-only or negative amortization payments. This rule will become effective January 10, 2014 and, while we continue to evaluate its expected impact on our mortgage production operations, we do not currently anticipate a significant impact since most of the loans we currently originate would be “qualified mortgages” under the rule.
Mortgage Servicing
On January 17, 2013, the CFPB issued a series of final rules as part of an ongoing effort to address mortgage servicing reforms and create uniform standards for the mortgage servicing industry. The rules increase requirements for communications with borrowers, address requirements around the maintenance of customer account records, govern procedural requirements for responding to written borrower requests and complaints of errors, and provide guidance around servicing of delinquent loans, foreclosure proceedings and loss mitigation efforts, among other measures. These rules will be effective January 10, 2014 and will likely lead to increased costs to service loans across the mortgage industry. We are continuing to evaluate the full impact of these rules and their impact to our mortgage servicing operations.
Several state agencies overseeing the mortgage industry have entered into settlements and enforcement consent orders with mortgage servicers regarding certain foreclosure practices. These settlements and orders generally require servicers, among other things, to: (i) modify their servicing and foreclosure practices, for example, by improving communications with borrowers and prohibiting dual-tracking, which occurs when servicers continue to pursue foreclosure during the loan modification process; (ii) establish a single point of contact for borrowers throughout the loan modification and foreclosure processes; and (iii) establish robust oversight and controls of third party vendors, including outside legal counsel, that provide default management
-131-
Table of Contents
or foreclosure services on their behalf. Although we are not a party to any of these settlements or consent orders, many mortgage servicers have already voluntarily adopted these servicing and foreclosure standards. Accordingly, competitive pressures may compel us to adopt these practices as well.
Anti-Money Laundering
On February 7, 2012, the Financial Crimes Enforcement Network (“FinCEN”) finalized regulations that require non-bank residential mortgage lenders and originators to establish anti-money laundering programs and file suspicious activity reports as FinCEN requires of other types of financial institutions. The final rule was published in the Federal Register on February 14, 2012 and was effective 60 days thereafter. We are currently evaluating the effect of this regulation on our operations.
Competition
In our servicing and originations business, we compete with large financial institutions and with other independent residential mortgage loan producers and servicers, such as Wells Fargo & Company, JPMorgan Chase & Co., Bank of America Corporation, Citigroup Inc., Nationstar Mortgage Holdings Inc., PennyMac Financial Services, Inc., Ocwen Financial Corporation, Walter Investment Management Corp., Flagstar Bancorp, Inc. and U.S. Bancorp. The large financial institutions, including Wells Fargo & Company, JPMorgan Chase & Co., Bank of America Corporation and Citigroup Inc., together serviced 48% of all outstanding mortgage loans on 1-4 family residences as of December 31, 2012. These traditional bank servicers, however, are experiencing higher operating costs and increased capital requirements, thus allowing an opportunity for us to successfully compete and take advantage of growth opportunities in the mortgage sector.
Our servicing business faces competition in areas such as fees and service. Our ability to differentiate ourselves from other loan servicers through our innovative technology platforms largely determines our competitive position within the mortgage loan servicing industry.
Our mortgage loan origination business faces competition in mortgage loan offerings, rates, fees and level of customer service. Our ability to differentiate the value of our financial products primarily through our mortgage loan offerings, technology platforms, rates, fees and customer service determines our competitive position within the mortgage loan originations industry.
In our financing business, we primarily compete with depository institutions that use deposit funds to finance loans. These institutions, however, typically only focus on larger mortgage originations leaving the small- and mid-sized originators to sell mortgage loans to aggregators and with the recent regulations from the Federal Reserve, competition in this sector will likely decrease. Thus, our financing platform allows us to compete with bank-owned mortgage lenders who have access to cheaper deposit funding and provides us with a competitive advantage over other non-bank mortgage originators and servicers who are reliant on other forms of wholesale financing to fund their operations.
Seasonality
Our origination business is subject to seasonal fluctuations, and activity tends to diminish somewhat in the months of December, January and February, when home sales volume and loan origination volumes are at their lowest. This typically causes seasonal fluctuations in our origination business revenue. Our servicing business is not subject to seasonality.
Intellectual Property
We hold registered trademarks with respect to the name Stonegate Mortgage Corporation, our logos and various additional designs and word marks relating to the Stonegate Mortgage Corporation name. Additionally, we own registered trademarks with respect to the name NattyMac, their logos, and various additional designs and
-132-
Table of Contents
word marks relating to the NattyMac name that we acquired in the acquisition. We use a variety of methods, such as trademarks, patents, copyrights and trade secrets, to protect our intellectual property. We also place appropriate restrictions on our proprietary information to control access and prevent unauthorized disclosures.
Properties
Our principal executive headquarters is located in Indianapolis, Indiana. At our main campus in Indianapolis, we occupy approximately 77,421 square feet, pursuant to a lease through October 21, 2022. The main campus serves as our principal executive headquarters as well as the primary operations center and houses our corporate support personnel, wholesale and correspondent operations and servicing support staff.
We lease an additional 16,000 square feet of space in Overland Park, Kansas, which is currently due to expire in September 2016. This location houses a retail origination team and call center, as well as executive sales personnel and various administrative support functions. In addition, we lease approximately 6,335 square feet in the Minneapolis, Minnesota regional area, which is currently due to expire during 2014. These locations house IT developers and structured finance operations personnel.
As of September 30, 2013, we had 15 retail branch leases in the U.S. Our retail branch sites range from approximately 2,000 square feet to approximately 7,500 square feet. We are continuing to grow our retail branches nationwide and recently opened a branch in the Brandon, Florida area.
In addition to our retail branches, we have approximately 12 short term executive office suite leases. These sites are used by local retail sales management to grow their staff while the facilities group works to acquire a permanent longer term solution.
In the third quarter of 2013, we opened an operations site of approximately 9,192 square feet in Oak Brook, Illinois. This location includes a portion of our wholesale and correspondent operations and sales personnel.
Additionally, in the fourth quarter of 2013, we have opened three more regional operations centers – Clearwater, Florida; Dallas, Texas and Scottsdale, Arizona. We have signed leases for all three sites with general terms of five years, with a one-time option to terminate after three years. We chose these locations to expand operations because we believe all of the markets are rich in mortgage operations and servicing talent and will assist us greatly while we continue to grow our business. The Clearwater, Florida location contains approximately 32,533 square feet and houses underwriters, correspondent review and warehouse operations to support our wholly-owned subsidiary, NattyMac. The Dallas, Texas location contains approximately 22,400 square feet and houses servicing executive management as well as loan administration and customer support for our servicing business. The Scottsdale, Arizona location contains approximately 12,717 square feet and functions as a more traditional mortgage operations center with processing, underwriting and closing operations for the retail, wholesale and correspondent lending channels.
Legal Proceedings
We are subject to various legal proceedings arising in the ordinary course of business. As of September 30, 2013, there were no current or pending claims against us that we believe are material.
-133-
Table of Contents
Executive Officers and Directors
Our Board of Directors currently consists of seven directors. Of these seven directors, we believe that four will be considered “independent,” with independence being determined in accordance with the listing standards established by the NYSE.
Set forth below are the names, ages and positions of our directors and executive officers as of the date of this prospectus.
| Name |
Age | Position with the Company | ||
| James J. Cutillo |
45 | Chief Executive Officer and Director | ||
| Dan J. Bettenburg |
48 | President | ||
| John F. Macke |
48 | Chief Financial Officer | ||
| Barbara A. Cutillo |
46 | Chief Administrative Officer | ||
| Bryan D. Specht |
43 | Chief Operating Officer | ||
| Steve Landes |
45 | EVP—Loan Origination | ||
| Eric M. Scholtz |
49 | EVP—Structured Finance | ||
| Robert Meachum |
51 | EVP—Servicing | ||
| Kevin B. Bhatt |
35 | Director | ||
| James G. Brown |
49 | Director | ||
| Richard A. Kraemer |
69 | Director | ||
| Sam Levinson |
40 | Director | ||
| Richard A. Mirro |
62 | Director | ||
| Joseph Scott Mumphrey |
56 | Director |
Jim Cutillo—Mr. Cutillo co-founded Stonegate in 2005 with Ms. Cutillo, and since that time has served as the Company’s Chief Executive Officer and a Director. Prior to founding Stonegate, he was a director for GMAC Residential Funding in Minneapolis, Minn. from May of 2002 to August of 2004. From 1997 to 2002, Mr. Cutillo was a partner at NISYS, a firm that provided business process and software solutions in the mortgage banking and financial services industries. He served on active duty with the 101st Airborne, Ft. Campbell, Kentucky and in the Indiana National Guard. We believe Mr. Cutillo is qualified to serve on our Board of Directors because he is our Chief Executive Officer and founder, and an accomplished financial services executive with experience in the mortgage banking arena. Pursuant to his employment agreement, Mr. Cutillo is entitled to be nominated as a director of the Company for as long as his employment agreement is in effect and he serves as our CEO.
Dan Bettenburg—Mr. Bettenburg joined Stonegate in May 2011 as President. Before joining Stonegate, he founded and managed New Market Holdings, LLC, a venture formed to invest in small to mid-sized mortgage banking firms, where he worked from January 2010 to May 2011, when he invested in Stonegate. Prior to that, he was the Executive Vice President and Senior Managing Director at GMAC Residential Funding Corporation (“RFC”), an industry-leading lender and issuer of mortgage-backed securities, where he was employed from 1991 to July 2008. From 2005 to July 2008, Mr. Bettenburg was responsible for Homecomings Financial—Wholesale and led its growth in loan origination volume from $14 billion in 2005 to over $28 billion in 2007. He also led the eCommerce business of GMAC Residential Funding for seven years, which included the responsibility for design, development of Assetwise, GMAC Residential Funding’s industry-leading automated loan decisioning engine, as well as a complete suite of business-to-business systems and tools that automated transactions between GMAC Residential Funding and its broker and correspondent lender clients. Mr. Bettenburg holds a BA degree in Financial Management with a minor in Economics from the University of St. Thomas in St. Paul, Minnesota.
-134-
Table of Contents
John Macke—Mr. Macke joined Stonegate in January 2012 as Executive Vice President of Capital Markets and in April 2013 he became our Chief Financial Officer. From May 2010 to December 2011, Mr. Macke was the Executive Vice President and Chief Financial Officer of Americare Ambulance Service, a provider of emergent and non-emergent ambulance transportation. Prior to that, from May 2008 to January 2010, Mr. Macke was the Chief Financial Officer and Founder of Automated Call Technologies, a telecommunications transaction processing business. Additionally, from 1987 to 2006, Mr. Macke was with Irwin Mortgage, a residential mortgage lending company, where he was the senior vice president responsible for capital markets, strategy and business development. He spent a large portion of his career managing the financial analysis department which included servicing valuation and MSRs hedging among other duties. Mr. Macke was also the Chief Operating Officer of Freedom Mortgage after its acquisition of Irwin Mortgage. He holds an MBA from the Kelley School of Business at Indiana University and a BS degree in finance from the University of Dayton.
Barbara A. Cutillo—Ms. Cutillo co-founded the company in 2005 with Mr. Cutillo, and served as Chief Financial Officer until April 2013. She currently serves as the Chief Administrative Officer and leads the company’s corporate support areas which include: strategic planning, legal, human resources and corporate communications. Prior to co-founding Stonegate in 2005, Ms. Cutillo was the Director of Finance for a non-regulated subsidiary of Citizens Gas and Coke Utility in Indianapolis, Indiana from 1997 to 2000. The subsidiary provided venture capital and/or mezzanine debt to companies in the natural gas industry. She has deep finance and accounting experience having been a Senior Associate for Coopers & Lybrand where she was engaged in the audit practice. She holds a BS in Accounting from University of Kentucky, an MBA in Finance from the Kelley School of Business at Indiana University and a current CPA designation in the state of Indiana.
Bryan Specht—Mr. Specht joined Stonegate in December 2012 as Chief Operating Officer. Mr. Specht brings nearly 20 years of experience managing retail, correspondent and wholesale mortgage lending operations. He joined Stonegate from Citibank, a global financial services company, where he worked from March 2011 to October 2012 as Senior Vice President of Operations leading Bank Retail Fulfillment, and from January 2005 to May 2009 as Senior Vice President, Operations Director. In between his two jobs with Citibank, Mr. Specht worked for GMAC Mortgage, a national provider of mortgages, home loans, and refinancing options, from May 2009 to February 2011, where he was Vice President, Senior Operations Director. Mr. Specht is responsible for Stonegate’s operations in retail, wholesale and correspondent channels. Mr. Specht holds a BS degree in accounting from Western State College of Colorado.
Steve Landes—Mr. Landes joined Stonegate in February 2008 as Executive Vice President of Loan Origination. He oversees the company’s retail, wholesale and correspondent lending channels. Mr. Landes’ experience in mortgage lending encompasses 22 years, including positions as Senior Vice President of Retail Lending at Novastar Mortgage from April 2000 to February 2006, where he was responsible for 4,500 employees in over 400 retail offices throughout the Unites States; CEO of Ampro Financial Services, a national title company, from March 2002 to August 2003 and Regional President for IndyMac Bank from February 2006 to January 2008, with responsibility for sales and operations of the wholesale and correspondent lending channels throughout the central United States. Mr. Landes holds a BS degree in finance from the University of Central Missouri.
Eric Scholtz—Mr. Scholtz joined Stonegate in January 2013 as Executive Vice President of Structured Finance. Mr. Scholtz is a capital markets executive with over 20 years’ experience in the structuring, pricing and trading of mortgage and asset-backed securities. Prior to joining Stonegate, Mr. Scholtz served in a number of senior executive positions at GMAC Residential Funding from May 1986 to February 2007, most recently as Executive Vice President of Capital Markets and Senior Vice President, Head of Trading where he was responsible for the acquisition and ultimate sale/securitization of $150 billion annual volume in Agency and non-Agency mortgage loans. Mr. Scholtz is a graduate of the University of Iowa.
Robert Meachum—Mr. Meachum joined Stonegate in March 2013 as Executive Vice President of Servicing. Mr. Meachum has over 20 years’ experience in mortgage banking and has held executive positions at
-135-
Table of Contents
Homeward Residential (previously American Home), Saxon Mortgage and GMAC ResCap. Prior to joining Stonegate, he served as Senior Vice President, Subservicing and Special Servicing from April 2012 to March 2013 at Homeward Residential, a banking firm involved in the acquisition, purchase, sale, securitization, and servicing of residential mortgages. He was responsible for Homeward’s fee-based servicing, including business development, sub- and special servicing operations and oversight of primary servicing operations. From October 2007 to March 2012, Mr. Meachum served as Executive Vice President, Servicing at Saxon Mortgage Services Inc., a wholly-owned subsidiary of Morgan Stanley and one of the nation’s premier subprime servicers with a particular focus on managing distressed assets. As EVP, Servicing at Saxon, Mr. Meachum was responsible for managing the operational credit risk of Saxon’s $37 billion servicing portfolio and developing the business strategy and turnaround efforts of Saxon’s servicing platform. Additionally, Mr. Meachum served as a director for the Board of Directors of Saxon Mortgage Services Inc. and its subsidiaries from January 2011 to January 2012. At GMAC ResCap, Mr. Meachum served as Managing Director for Homecomings Financial, whose servicing portfolio exceeded $100 billion, where he was responsible for servicing and consumer originations. Mr. Meachum earned degrees in Political Science and Accounting from Southern Methodist University and is a Certified Public Accountant.
Kevin Bhatt—Mr. Bhatt is a partner of Long Ridge Equity Partners, a private investment firm focused on the financial services industry that is an affiliate of ours. Prior to joining Long Ridge in February 2010, he was a Vice President of AEA Investors, a leading middle market private equity firm, from July 2006 to February 2010. Mr. Bhatt earned his B.A. degree in economics with honors from Princeton University and his Master of Business Administration degree from Harvard Business School. We believe Mr. Bhatt is qualified to serve on our Board of Directors because of his numerous years of experience in the financial industry and deep understanding of our business. Mr. Bhatt was designated as a director nominee by Stonegate Investors Holdings pursuant to the Shareholders Agreement and has been a member of our Board of Directors since February 2012.
Jim Brown—Mr. Brown is the co-founder and Managing Partner of Long Ridge Equity Partners, a private investment firm focused on the financial services industry that is an affiliate of ours, which he founded in July 2007. He is also a Managing Director of TH Lee Putnam Ventures, a technology-focused private equity firm, which he co-founded in August 1999. Mr. Brown has served as a director for Liquidnet’s Board of Directors since March 2000 and as a director for FXCM’s Board of Directors since January 2008. Mr. Brown graduated from New York University with a B.S. and graduated with honors from Wharton Business School of the University of Pennsylvania with a Masters of Business Administration. We believe Mr. Brown is qualified to serve on our Board of Directors because of his extensive experience investing in and serving on the boards of growth companies, and because of his deep understanding of our business. Mr. Brown was designated as a director nominee by Stonegate Investors Holdings pursuant to the Shareholders Agreement and has been a member of our Board of Directors since February 2012.
Richard Kraemer—Mr. Kraemer has been a member of our Board of Directors since May 2013 and brings with him over 35 years of experience. His knowledge comes from holding several senior executive positions at multiple banks and public companies as well as taking positions on several boards. Mr. Kraemer is a retired investor. Mr. Kraemer served as Chairman of the Board of Directors of Saxon Capital Inc., a publicly-traded mortgage real estate investment trust (“REIT”), from 2001 through 2006. Mr. Kraemer is a member of the Board of Directors of FBR Capital Markets and Urban Financial. Mr. Kraemer also served as a trustee and member of the audit committee of American Financial Realty Trust (NYSE: AFR), a publicly-traded REIT, from 2002 to 2008. From 1996 to 1999, Mr. Kraemer was Vice Chairman of Republic New York Corporation, a publicly-traded holding company for Republic National Bank. From 1993 to 1996, Mr. Kraemer was Chairman and Chief Executive Officer of Brooklyn Bancorp, a publicly-traded holding company for Crossland Federal Savings Bank. Mr. Kraemer earned his Bachelor of Science degree in Business Administration with a major in Real Estate from Pace University, New York. We believe Mr. Kraemer is qualified to serve on our Board of Directors because of his executive expertise with financial institutions and his extensive board service of several publicly-traded companies.
-136-
Table of Contents
Sam Levinson—Mr. Levinson has been a member of our Board of Directors since May 2013. Since 2004 Sam Levinson has been a principal and managing partner at Glick Family Investments, a private family office located in New York, New York where he oversees private equity investments. Mr. Levinson has experience serving as a member on several boards and as a Chairman of the Audit Committee for Canary Wharf Group. Mr. Levinson has served as a director of Canary Wharf Group in London, a U.K. property developer and manager of office and retail space, since 2004; of Songbird Estates, Canary Wharf Group’s holding company, since 2004; of Coleman Cable Inc., a manufacturer of wire and cable, since 2005; of American European Group Insurance Company since 2006 and of Dynasty Financial Partners, LLC, which provides investment and technology platforms for independent financial, investment, and wealth management advisors, since 2011. Additionally, Mr. Levinson served as a director of West Coast Bancorp of Portland, Oregon from February 2011 until its sale in April 2013. Mr. Levinson is also the founder, president and controlling shareholder of Trapeze Inc., a real estate investment company, where he has served since 2002. We believe Mr. Levinson is qualified to serve on our Board of Directors because he is an experienced executive and director with numerous years of experience in the financial industry.
Richard A. Mirro—Mr. Mirro brings over 35 years of industry experience to Stonegate’s Board of Directors and currently serves as our Lead Independent Director. For six years, he served North American Mortgage Corporation as President and Chief Operating Officer (1996-1999) and then as Chairman and Chief Executive Officer (1999-2002). Prior to that, he spent a decade from February 1986 to August 1996, with Chase Manhattan Mortgage where he held a variety of titles, including Chief Operations Officer, Chairman and Chief Executive Officer. Mr. Mirro also served as the CEO of Fleet Mortgage from August 1996 to December 1996. Mr. Mirro earned his B.A. in economics from St. Vincent College and a Master of Arts in mathematical economics from Duquesne University. We believe Mr. Mirro is qualified to serve on our Board of Directors because he is an accomplished financial services executive with more than 30 years of experience in the mortgage banking arena. Mr. Mirro was designated as a director nominee by Stonegate Investors Holdings pursuant to the Shareholders Agreement and has been a member of our Board of Directors since February 2012.
Scott Mumphrey—Mr. Mumphrey has been a member of our Board of Directors since February 2010 and brings with him over 35 years of executive management experience. He has extensive expertise in long and short range strategic planning, development, operations and property management. He is currently a principal at Second Curve Investments, LLC, a private equity and advisory services firm he co-founded in 2009 focused on small to moderate sized companies. Additionally, Mr. Mumphrey has served as an organizational consultant to Beijing Hualian Group, a leading Chinese retail enterprise, from October 2012 to the present. Prior to founding Second Curve Investments, LLC, he worked for Simon Property Group, the largest real estate company in the world, as President of Simon Management Group from 2002 to 2009. He was also Executive Vice President of Property Management for Simon Property Group, Inc. from 1992 to 1999. Mr. Mumphrey joined Simon Property Group and Melvin Simon & Associates, Inc. in 1974. Mr. Mumphrey earned his B.S. degree in Business Administration from Louisiana State University. We believe Mr. Mumphrey is qualified to serve on our Board of Directors because of his extensive executive management experience, his advisory work with multiple startup companies, and his investment background.
James J. Cutillo, our Chief Executive Officer and a Director, and Barbara A. Cutillo, our Chief Administrative Officer, are married. There are no other family relationships among any of our directors, director nominees or executive officers.
-137-
Table of Contents
Board of Directors
Our current Code of Regulations (the “Regulations”) provides that our Board of Directors shall consist of not less than six and not more than eleven directors as the Board of Directors or shareholders may from time to time determine. Our Regulations currently provide for a staggered Board of Directors with two separate “classes” of directors which are comprised of at least three directors each. Our directors are divided into the following classes:
| Class I |
Class II | |
| Kevin B. Bhatt | James J. Cutillo | |
| Joseph Scott Mumphrey | James G. Brown | |
| Richard A. Kraemer | Sam Levinson | |
| Richard A. Mirro |
The initial terms of the Class I and Class II directors expire in 2014 and 2015, respectively.
Under our shareholders’ agreement, as amended (the “Shareholders’ Agreement”) with Stonegate Investors Holdings, which is our largest shareholder, Stonegate Investors Holdings is entitled to nominate (i) two directors until the date on which their beneficial ownership of our common stock falls below 15% of the outstanding shares of common stock and (ii) thereafter one director until the date on which their beneficial ownership of our common stock falls below 10% of the outstanding shares of common stock. In addition, at least one Stonegate Investors Holdings nominated director will be on each committee of our Board of Directors until the date on which their beneficial ownership of our common stock falls below 10% of the outstanding shares of common stock for so long as their representation on those committees is permitted by the corporate governance rules of the national securities exchange on which our shares of common stock are then listed. See “Certain Relationships and Related Party Transactions” for a further description of the Shareholders’ Agreement.
Our Board of Directors has determined that Messrs. Mirro, Kraemer, Levinson and Mumphrey are our independent directors with independence being determined in accordance with the NYSE listing standards. Our independent directors will meet regularly in executive sessions without members of management present. Our lead independent director will lead those executive sessions.
Our Board of Directors believes its members collectively have or will have the experience, qualifications, attributes and skills to effectively oversee the management of our company, including a high degree of personal and professional integrity, an ability to exercise sound business judgment on a broad range of issues, sufficient experience and background to have an appreciation of the issues facing our company, a willingness to devote the necessary time to Board of Directors duties, a commitment to representing the best interests of our company and our shareholders and a dedication to enhancing stockholder value.
Committees of the Board of Directors
Our Board of Directors has three committees: the Audit Committee, the Compensation Committee and the Corporate Governance and Nominating Committee. Each of these committees consists of three members:
Audit Committee. The Audit Committee assists the Board of Directors in overseeing our accounting and financial reporting processes and the audits of our financial statements. Further, the Audit Committee supervises the Company’s internal audit function. The members of our audit committee are Mr. Mirro, who is the chair of the committee, Mr. Bhatt and Mr. Kraemer.
All members of our Audit Committee meet the requirements for financial literacy under the applicable rules and regulations of the SEC and the NYSE. Our Board of Directors has affirmatively determined that Messrs. Mirro and Kraemer are independent directors of our Audit Committee as defined under the applicable
-138-
Table of Contents
rules and regulations of the SEC and the NYSE. While our Board of Directors determined that Mr. Bhatt is not independent for purposes of serving on the Audit Committee, we intend to rely on the SEC’s and NYSE’s transition rules applicable to companies completing an initial public offering. Under the SEC’s and NYSE’s transition rules, we are only required to have one independent director on our Audit Committee beginning on the date of the IPO. Between the period that is 90 days after the IPO and one year thereafter, we are required to have a majority of independent directors on our Audit Committee. Thereafter, our audit committee is required to be comprised entirely of independent directors.
Our Board of Directors has determined that all members of our Audit Committee qualify as “audit committee financial experts” under SEC rules and regulations.
Compensation Committee. The Compensation Committee supports the Board of Directors in fulfilling its oversight responsibilities relating to senior management and director compensation, including the administration of the 2011 Omnibus Incentive Plan, the 2013 Omnibus Incentive Compensation Plan and the 2013 Non-Employee Director Plan.
The members of our Compensation Committee are Mr. Levinson, who is the chair of the Committee, Mr. Bhatt and Mr. Mumphrey. Our Board of Directors has affirmatively determined that Mr. Levinson is an independent director of our Compensation Committee as defined under the applicable rules and regulations of the SEC and the NYSE. While our Board of Directors determined that Mr. Bhatt is not independent for purposes of serving on the Compensation Committee, we intend to rely on the NYSE’s transition rules applicable to companies completing an initial public offering. Under the NYSE’s transition rules we are required to have a majority of independent directors within 90 days of such listing and all independent directors within one year of the listing of our common stock on the NYSE. Any “independent” directors, as defined under the rules of the NYSE, appointed to the Compensation Committee will also be “non-employee” directors as defined in Rule 16b-3(b)(3) under the Exchange Act and “outside” directors within the meaning of Section 162(m)(4)(c)(i) of the Code.
Corporate Governance and Nominating Committee. The Corporate Governance and Nominating Committee assists the Board of Directors in identifying and recommending candidates to fill vacancies on the Board of Directors and for election by the shareholders, recommending committee assignments for members to the Board of Directors, overseeing the Board of Directors’ annual evaluation of the performance of the Board of Directors, its committees and individual directors, reviewing compensation received by directors for service on the Board of Directors and its committees and developing and recommending to the Board of Directors appropriate corporate governance policies, practices and procedures for our company.
The members of our Corporate Governance and Nominating Committee are Mr. Kraemer, who is the chair of the committee, Mr. Brown and Mr. Mirro. Our Board of Directors has affirmatively determined that Messrs. Kraemer and Mirro are independent directors of our Corporate Governance and Nominating Committee as defined under the applicable rules and regulations of the SEC and the NYSE. While our Board of Directors determined that Mr. Brown is not independent for purposes of serving on the Corporate Governance and Nominating Committee, we intend to rely on the NYSE’s transition rules applicable to companies completing an initial public offering. Under the NYSE’s transition rules, we are required to have a majority of independent directors within 90 days of the listing of our common stock on the NYSE listing and all independent directors within one year of such listing.
| Director |
Audit Committee |
Compensation |
Corporate | |||
| Kevin B. Bhatt |
Member | Member | ||||
| James G. Brown |
Member | |||||
| Richard A. Kraemer |
Member | Chair | ||||
| Sam Levinson |
Chair | |||||
| Richard A. Mirro |
Chair | Member | ||||
| Joseph Scott Mumphrey |
Member |
-139-
Table of Contents
We may make changes or additional appointments to our committees.
Compensation Committee Interlocks and Insider Participation
Effective July 24, 2013, our Board of Directors formed the Compensation Committee as described above. The Compensation Committee of our Board of Directors will have responsibility for establishing and administering compensation programs and practices with respect to our executive officers, including the named executive officers. Prior to July 24, 2013, the compensation of our executive officers was determined by our Chief Executive Officer and the Board of Directors. None of our executive officers currently serves or in the past year has served as a member of the board of directors or compensation committee of any entity that has one or more executive officers serving on our Board of Directors or Compensation Committee.
Conflict of Interest and Business Ethics Policy
Our Board of Directors has established a conflict of interest and business ethics policy that applies to our officers, directors and employees. Among other matters, our conflict of interest and business ethics policy is designed to ensure that all employees avoid any conflict between their personal interests and those of our company. The purpose of the policy is to ensure that our honesty and integrity, and therefore our reputation, are not compromised. The fundamental principle guiding the policy is that no employee or director should have, or appear to have, personal interests or relationships that actually or potentially conflict with the best interests of our company as further governed by applicable rules and regulations.
Limitations on Liabilities and Indemnification of Directors and Officers
For information concerning limitations of liability and indemnification applicable to our directors, executive officers and, in certain circumstances, employees, see “Certain Provisions of Ohio Law and of Stonegate’s Articles and Regulations,” and “Certain Relationships and Related Party Transactions.”
-140-
Table of Contents
EXECUTIVE AND DIRECTOR COMPENSATION
Summary Compensation Table
The following table presents compensation awarded in 2013 and 2012 to our principal executive officer and our two other most highly compensated persons serving as executive officers as of December 31, 2013 or paid to or accrued for those executive officers for services rendered during 2013 and 2012. We refer to these executive officers as our “named executive officers.”
| Name & Principal Position |
Year |
Salary |
Bonus1 |
Equity |
Nonequity |
All Other |
Total |
|||||||||||||||||||||
| Jim Cutillo |
2013 | $ | 384,377 | $ | — | $ | 6,498,819 | $ | — | $ | 810,275 | $ | 7,693,471 | |||||||||||||||
| Chief Executive Officer and Director |
2012 | $ | 294,174 | $ | — | $ | — | $ | 600,000 | $ | 56,115 | $ | 950,289 | |||||||||||||||
| Dan Bettenburg |
2013 | $ | 300,006 | $ | — | $ | 913,079 | $ | — | $ | 38,882 | $ | 1,251,967 | |||||||||||||||
| President |
2012 | $ | 252,503 | $ | 505,006 | $ | — | $ | — | $ | 24,233 | $ | 781,742 | |||||||||||||||
| Steve Landes |
2013 | $ | 206,584 | $ | — | $ | 652,198 | $ | 99,687 | $ | 48,821 | $ | 1,007,290 | |||||||||||||||
| EVP—Loan Origination |
2012 | $ | 179,171 | $ | 229,842 | $ | — | $ | 120,750 | $ | 38,546 | $ | 568,309 | |||||||||||||||
| 1 | Mr. Bettenburg’s and Mr. Landes’ annual bonuses for 2012 were determined by the Board in its discretion. Annual bonuses for 2013 are not yet calculable as of the date of this filing and therefore have not been reported in this table. The Company anticipates that such bonuses will be determined in February, 2014. See “Executive and Director Compensation—Bonuses” below and the description of the employment agreements of Messrs. Cutillo and Bettenberg under “Executive and Director Compensation—Employment Agreements” below for a description of the bonus eligibility of our named executive officers. |
| 2 | Based on the grant-date fair value of the stock options awarded to each named executive officer determined in accordance with FASB ASC Topic 718. We used the Black-Scholes option pricing model to estimate the fair value of the stock options granted on the grant date. Refer to Note 18 to our consolidated financial statements as of and for the Six Months Ended June 30, 2013 included in this Registration Statement for additional information regarding the assumptions used in the Black-Scholes option pricing model for stock options granted during 2013. |
| 3 | Annual incentive plan compensation amounts for 2013 are not yet calculable as of the date of this filing and therefore have not been reported in this table. The Company anticipates that such amounts will be determined in February, 2014. During 2013, Mr. Landes was awarded quarterly incentive bonuses based on actual performance measured against certain operational targets. Mr. Landes’ maximum aggregate quarterly bonus opportunity for 2013 based on these targets was $206,579. See “Executive and Director Compensation—Bonuses” below and the description of the employment agreements of Messrs. Cutillo and Bettenberg under “Executive and Director Compensation—Employment Agreements” below for a description of the nonequity incentive plan compensation eligibility of our named executive officers. |
| 4 | Mr. Cutillo’s employment agreement provides certain targets for his annual bonuses, as discussed below in connection with his employment agreement. All or a portion of the annual bonus, at the election of Mr. Cutillo, may be payable in shares of our common stock in accordance with the terms of his employment agreement. Mr. Cutillo elected to receive $475,000 of his $600,000 annual bonus for 2012 in the form of stock. For 2012, in addition to his discretionary bonus, Mr. Landes was also awarded quarterly bonuses based on actual performance measured against certain operational targets, as described below. Mr. Landes’ maximum aggregate quarterly bonus opportunity for 2012 based on these targets was $180,000. |
| 5 | All Other Compensation includes: for each named executive officer, company matching 401(k) contributions, monthly automobile payments, auto insurance premiums and health insurance premiums; for Mr. Cutillo, the foregiveness of Mr. Cutillo’s note payable to the Company in the amount of $214,273, monthly country club dues, disability insurance premiums, certain attorney’s fees and other personal travel related expenses. Mr. Cutillo also received a $250,000 bonus upon the completion of the May 2013 private equity offering and an additional $250,000 bonus upon the completion of the IPO; and for Messrs. Bettenburg and Landes, rental and utilities costs for an apartment in Indianapolis, Indiana. |
-141-
Table of Contents
Outstanding Equity Awards at Fiscal Year End
The table below reports the number of stock options held by each of our named executive officers as of December 31, 2013. The options were granted on May 15, 2013 and vest in four equal installments on each of the first four anniversaries of the grant date, with the exception of Mr. Cutillo’s options which vest in four equal annual installments on each of the first four anniversaries of January 1, 2013, in each case, subject to continued employment with us (with, in the case of Mr. Cutillo, limited accelerated vesting upon certain qualifying terminations of employment). See “Amended and Restated 2011 Omnibus Incentive Plan—Awards to Mr. Cutillo; Other Awards to Senior Management” for further discussion of these stock option grants.
| Option Awards |
||||||||||||
| Name |
Number of Securities |
Option Exercise |
Option |
|||||||||
| Jim Cutillo |
897,218 | 18.00 | May 15, 2023 | |||||||||
| Dan Bettenburg |
125,611 | 18.00 | May 15, 2023 | |||||||||
| Steve Landes |
89,722 | 18.00 | May 15, 2023 | |||||||||
Bonuses
The Company maintains an annual bonus program (the “Annual Incentive Plan”). Participants in the Annual Incentive Plan are selected by the Board of Directors after being recommended for participation by the Chief Executive Officer. The Board of Directors sets a maximum bonus payout based on a participant’s salary, establishes performance goals for each participant and determines whether such goals have been met for the annual performance period pursuant to the terms of the plan (including, for Mr. Cutillo, certain targets provided under his employment agreement, as discussed below, and for Mr. Landes, additional quarterly bonuses based on achievement of certain operational metrics, including cost and risk management and hiring and retention of employees, compared to budgeted targets). Our Board of Directors relies primarily on the judgment of its members in making bonus determinations after reviewing our performance and financial condition for the year and carefully evaluating an executive officer’s performance during the year. In addition, our Board of Directors considers an executive officer’s leadership qualities, business responsibilities and length of career with us in determining an appropriate bonus amount. To date, bonuses for our executive officers have been approved by our Board of Directors on a discretionary basis in those instances where it desires to reward outstanding performance during the fiscal year by our executive officers. The Board has not yet determined the amount of annual bonuses for 2013 (other than with respect to quarterly bonuses for Mr. Landes, as reported above in the Summary Compensation Table).
Employment Agreements
Employment Agreement with Mr. Cutillo. We have entered into an employment agreement with Mr. Cutillo, which became effective on March 9, 2012, and was amended on May 14, 2013. The agreement’s term expires on May 14, 2015, with subsequent automatic two-year renewals, unless either party provides the other with at least 60 days’ prior notice of non-renewal. During the term of the agreement, Mr. Cutillo will serve as our Chief Executive Officer and the Company will nominate him to serve as a member of the Board of Directors.
Material terms of the employment agreement include:
| • | an annual base salary of $400,000, reconsidered for an increase annually by the Board of Directors, provided that Mr. Cutillo’s base salary for any year shall not be less than his base salary for the prior year unless the decrease is part of a company payroll reduction policy and the decrease is not disproportionate to that of other executives; |
-142-
Table of Contents
| • | eligibility for annual cash performance bonuses of up to 200% of base salary, as discussed below; |
| • | eligibility for a bonus of up to $2,250,000 in connection with a Designated Sale (defined below) or certain employment terminations, in either case, prior to an initial public offering, as discussed below; |
| • | eligibility for a special one-time cash bonus of $250,000 upon the completion of an initial public offering, as discussed below; |
| • | eligibility for grants of awards under the Amended and Restated 2011 Omnibus Incentive Plan, as amended, and the 2013 Omnibus Incentive Plan at the sole discretion of the Board of Directors; and |
| • | participation in our benefit plans on the same basis as our other senior executives, with full payment of Mr. Cutillo’s health insurance premiums to the extent permitted by tax law (and if not permitted, a cash payment intended to cover the cost of such premiums). |
During 2012, Mr. Cutillo’s annual rate of base salary was $300,000. In response to a salary survey of our industry peers during 2012, the Board of Directors reviewed our total executive compensation levels and determined to target our total executive compensation between the 50th and 75th percentile of our peer group. As a result, upon amending Mr. Cutillo’s employment agreement on May 14, 2013, his annual rate of base salary was increased to $400,000 in order to position his total compensation within the range targeted relative to our peer group.
Mr. Cutillo’s employment agreement provides for an annual bonus based on financial targets and strategic goals. Fifty percent of the annual bonus will be based on the achievement of financial targets, and 50% will be based on strategic goals, as specified by the Board of Directors for the calendar year. Mr. Cutillo will receive a bonus payment equal to 50% of his base salary if we achieve or exceed the “budgeted targets” and 100% of his base salary if we achieve or exceed the “stretch targets” (as defined in the employment agreement) based on net income and EBITDA as set forth in the annual budget for the calendar year. If net income and EBITDA fall between the budgeted targets and the stretch targets, Mr. Cutillo will receive an amount equal to between 50% and 100% of base salary determined based on straight-line interpolation. All or a portion of the annual bonus, at the election of Mr. Cutillo, may be payable in shares of our common stock, in accordance with the terms set forth in his employment agreement. Mr. Cutillo elected to receive $475,000 of his $600,000 annual bonus for 2012 in the form of stock.
Mr. Cutillo is eligible for a special one-time payment (the “Designated Payment”) upon the earlier to occur of (1) a Designated Sale (as defined below) or (2) Mr. Cutillo’s termination of employment for any reason, in either case, prior to the completion of an initial public offering generating proceeds of at least $50 million (an “IPO”). The amount of the Designated Payment that may be earned ranges from $1,000,000 to $2,250,000 depending on the Company’s share price received in connection with either a Designated Sale or on the last day of Mr. Cutillo’s employment, as applicable. The Designated Payment is subject to a four-year vesting schedule with 25% of the payment vesting on each of January 1, 2014, January 1, 2015, January 1, 2016 and January 1, 2017, with accelerated vesting of 100% for the Designated Payment upon a Change in Control (as defined below). The vested portion of the Designated Payment will be paid in a lump sum in cash (or, at the Company’s discretion, shares of the Company’s common stock) on the first regular payroll date following Mr. Cutillo’s termination or such certain sale transaction, as applicable. Mr. Cutillo’s entitlement to the Designated Payment will terminate upon the completion of the IPO.
A Designated Sale is the first to occur of (a) a transaction in which we merge or consolidate with another company after which less than 50% of the voting power of the surviving corporation is represented by shares that were shares of the Company’s common stock prior to such merger or (b) a sale of 80% or more of the then outstanding shares of the Company’s common stock, provided, in any case, that the consideration received
-143-
Table of Contents
by our shareholders consists solely of cash or readily marketable and tradable securities, but excluding, in each case, transactions with Long Ridge Capital or its controlled affiliates. Change in Control means (i) the acquisition by any person or group of more than 25% of the total voting power of the Company’s common stock or (ii) a merger, after which less than 50% of the total voting power of the surviving company is represented by shares that were shares of the Company’s common stock prior to the merger, but excluding, in each case, transactions with Long Ridge Capital or its controlled affiliates.
Mr. Cutillo received a special, one-time bonus equal to $250,000 upon the completion of the IPO. Mr. Cutillo was also previously paid a similar one-time cash bonus of $250,000 upon the completion of the May 2013 private offering.
If we terminate Mr. Cutillo’s employment for “cause,” he will be entitled to receive his annual base salary through the termination date, reimbursement for any unreimbursed business expenses incurred in accordance with Company policy prior to the date of termination, and such employee benefits, if any, as to which he has a vested right under the terms and conditions of the employee benefit plans or policies of the Company, all reduced by amounts owed by Mr. Cutillo to the Company, and Mr. Cutillo’s earned but unused vacation (the “Accrued Payments”), but thereafter will have no further rights under the employment agreement. “Cause” generally means failure to exercise duties after written notice, dishonest actions including fraud and embezzlement, conviction of certain crimes, excessive alcohol use in the workplace, use of illegal drugs, misconduct that might subject us to liability, breach of duty of loyalty, Mr. Cutillo’s breach of his employment agreement or any other agreement with us, insubordination, or being found guilty by a court of law of discrimination or harassment of any employee.
If Mr. Cutillo resigns without “good reason,” he will be entitled to receive his annual base salary through the termination date and payment of the Accrued Payments. “Good reason” generally means a diminution in Mr. Cutillo’s base salary (other than a diminution resulting from a payroll reduction policy generally impacting all Company employees or generally impacting all senior executives of the Company and the decrease to Mr. Cutillo’s base salary is not materially disproportionate to the percentage decrease in salary applicable to other senior executives of the Company), a material diminution in Mr. Cutillo’s authority, duties or responsibilities that typically would result in Executive no longer being the CEO or reporting to the Board of Directors of a similarly situated company, a material change in the geographic location in which Mr. Cutillo must work or any other action of the Company constituting a material breach of the employment agreement, or Mr. Cutillo no longer serving on the Board of Directors.
If we terminate Mr. Cutillo’s employment without “cause” (other than by reason of death or disability) or Mr. Cutillo resigns for “good reason,” in each case as provided by the employment agreement, he will be entitled to receive his annual base salary through the termination date, payment of the Accrued Payments, the annual bonus earned by Mr. Cutillo and, subject to the execution of a release of claims in favor of us, continuation for one year of his then current base salary, paid in semi-monthly payments over a period of twelve months in accordance with our standard payroll policy.
If Mr. Cutillo is terminated by us due to “disability” (as defined in the employment agreement) or dies during the term of the agreement, he or his estate will, in each case, be entitled to his annual base salary through the termination date, payment of the Accrued Payments and any annual bonus earned by Mr. Cutillo.
Prior to the later of the date of (a) an initial public offering pursuant to which any shares of our common stock become traded on an established securities exchange and (b) the expiration of any market-standoff or lock-up period imposed on Mr. Cutillo in connection with such an initial public offering, Mr. Cutillo, or if applicable, the representative of his estate or other guardian, has the right to cause us to repurchase all of the shares of our capital stock and all “eligible stock options” (as defined in the employment agreement) owned beneficially or of record by him upon his resignation, “disability,” death or termination without “cause,” or the acquisition of our
-144-
Table of Contents
company by a third-party that is primarily engaged in a business that is not the core business of our company. If Mr. Cutillo exercises this put option, he will sell the shares to us at a purchase price equal to the product of (a) the number of purchased shares held by Mr. Cutillo on the date of purchase and (b) the per share “market value” (as defined in the employment agreement) as of the date he or the representative of his estate delivers written notice to us exercising the option.
If Mr. Cutillo ceases to be employed by us for any reason, prior to the date on which any shares of our common stock become publicly traded on an established securities exchange, we will have the right, but not the obligation, to purchase all, but not less than all, of the shares and all eligible stock options owned beneficially or of record by Mr. Cutillo at the then-current “market value” of the shares (as defined in the employment agreement), subject to terms and conditions in his employment agreement. Our option to purchase such shares continues for one year following termination of Mr. Cutillo’s employment. Our repurchase right will terminate on the date any of our shares become publicly traded on an established securities exchange.
The employment agreement also contains a confidentiality provision, which applies indefinitely, non-competition restrictions which apply during the term of the employment agreement and for one year following Mr. Cutillo’s termination for any reason and customer and employee non-solicitation restrictions which apply for two years following Mr. Cutillo’s termination for any reason.
Employment Agreement with Mr. Bettenburg. We have entered into an employment agreement with Mr. Bettenburg, which became effective on May 10, 2011, and was amended and restated on May 14, 2013. The agreement provides for at-will employment, meaning that either we or Mr. Bettenburg can terminate the agreement at any time for any or no reason. During the term of the agreement, Mr. Bettenburg will serve as our President.
Material terms of the employment agreement include:
| • | an annual base salary of $300,000, redetermined annually by the Board of Directors; |
| • | eligibility for annual cash performance bonuses of up to 200% of base salary, as determined by the Board of Directors in its sole discretion, payable in cash or grants of stock, as determined by the Board of Directors; |
| • | eligibility for grants of awards under the Amended and Restated 2011 Omnibus Incentive Plan, as amended, and the 2013 Omnibus Incentive Plan, at the sole discretion of the Board of Directors; and |
| • | participation in our benefit plans on the same basis as peer executives, with full payment by us of Mr. Bettenburg’s health insurance premiums to the extent permitted by tax law (and if not permitted, a cash payment intended to cover the cost of such premiums). |
If we terminate Mr. Bettenburg’s employment for “cause” (as defined in the employment agreement), he will be entitled to his annual base salary through the termination date, reimbursement for any unreimbursed business expenses incurred in accordance with Company policy prior to the date of termination, and such employee benefits, if any, as to which he may be entitled under the employee benefit plans or policies of the Company according to their terms, all reduced by amounts owned by Mr. Bettenburg to the Company (the “Accrued Payments”), but thereafter will have no further rights under the agreement. “Cause” generally means failure to exercise duties after written notice, dishonest actions including fraud and embezzlement, conviction of certain crimes, excessive alcohol use in the workplace, use of illegal drugs, misconduct that might subject us to liability, breach of Mr. Bettenburg’s duty of loyalty, Mr. Bettenburg’s breach of his employment agreement or any other agreement with us, insubordination, or being found guilty by a court of law of discrimination or harassment of any employee (or entering a settlement agreement for such a discrimination or harassment claim).
-145-
Table of Contents
If Mr. Bettenburg resigns without “good reason” is terminated by us due to “disability” (each as defined in the employment agreement) or dies during the term of the agreement, he will, in each case, be entitled to payment of the Accrued Payments and his annual bonus, if any, prorated based on the number of days he was employed by us during the year of termination. “Good reason” generally means a material diminution in Mr. Bettenburg’s base salary (other than a similar diminution that impacts other similarly situated executives), a material diminution in Mr. Bettenburg’s authority, duties or responsibilities that typically would result in Executive no longer reporting to the CEO or the Board of Directors of a similarly situated company or any other action of the Company constituting a material breach of the employment agreement.
If we terminate Mr. Bettenburg’s employment without “cause” (other than by reason of death or disability) or Mr. Bettenburg resigns for “good reason,” in each case as provided by the employment agreement, he will be entitled to payment of the Accrued Payments, his annual bonus, if any, prorated based on the number of days Mr. Bettenburg was employed by us during the year of termination and, subject to the execution of a release of claims in favor of us, a lump sum cash payment in an amount equal to one-times Mr. Bettenburg’s then-current base salary.
If Mr. Bettenburg ceases to be employed by us for any reason or no reason, we will have the right, but not the obligation, prior to the date on which any shares of our common stock become publicly traded on an established securities exchange, to purchase all, but not less than all, of the shares and any or all eligible stock options owned beneficially or of record by Mr. Bettenburg at the then-current “value per share” (as defined in the employment agreement), subject to terms and conditions in his employment agreement. Our option to purchase such shares continues for one year following termination of Mr. Bettenburg’s employment. Our repurchase right will terminate on the date any of our shares become publicly traded on an established securities exchange.
The employment agreement also contains a confidentiality provision, which applies indefinitely, non-competition restrictions that apply during the term of the employment agreement and customer and employee non-solicitation restrictions which apply for two years following Mr. Bettenburg’s termination of employment for any reason.
401(k) Plan
The 401(k) Plan, is a tax-qualified defined contribution savings plan for the benefit of all eligible employees of the Company. Employee contributions, including after-tax contributions, are permitted by means of pay reduction. The 401(k) Plan also provides for regular employer matching contributions up to a maximum of 100% of employee contributions up to 4% of a participant’s plan compensation. All employee contributions and earnings on employee contributions are at all times fully vested. Beginning with the second year of service, employer matching contributions are vested at a rate of 20% per year of service and are completely vested after six years of service.
Pension Benefits; Nonqualified Deferred Compensation
We do not currently offer any defined pension plans or any nonqualified deferred compensation plans to our named executive officers.
2013 Omnibus Incentive Compensation Plan
On August 2, 2013, our Board of Directors approved the adoption of the 2013 Omnibus Incentive Compensation Plan (the “2013 Plan”), and our shareholders approved the 2013 Plan at our August 29, 2013 annual meeting.
The purpose of the 2013 Plan is to give us a competitive advantage in attracting, retaining and motivating employees and consultants (other than non-employee directors) of our company and to provide the company and our affiliates with a plan providing incentives more directly linked to the success of our company
-146-
Table of Contents
and increases in shareholder value. To accomplish these purposes, the 2013 Plan provides for the grant of stock options (both stock options intended to be incentive stock options under Section 422 of the Code and non-qualified stock options), stock appreciation rights (“SARs”), restricted stock, restricted stock units, dividend equivalent rights, other stock-based or cash-based awards (collectively, “awards”). Incentive stock options may be granted only to employees; all other awards may be granted to employees and consultants. Our non-employee directors are not permitted to participate in the 2013 Plan.
The 2013 Plan is applicable to all awards granted on or after August 29, 2013 (the date the 2013 Plan was approved by our shareholders the) (“Effective Date”), and replaces our Amended and Restated 2011 Omnibus Incentive Plan (as amended and restated, the “2011 Plan”) for awards granted on or after the Effective Date. No new grants will be made under the 2011 Plan after the Effective Date. The terms and conditions of awards granted under the 2011 Plan prior to the Effective Date will not be affected by the adoption or approval of the 2013 Plan, and the 2011 Plan will remain effective with respect to such awards.
Shares Subject to the 2013 Plan
A total of 419,250 shares of our common stock were reserved and available for issuance under the 2013 Plan, which included the number of shares available for grant under the 2011 Plan as of the Effective Date (315,925 as of July 31, 2013). If an award granted under the 2013 Plan expires, is forfeited or is settled in cash, the shares of our common stock not acquired pursuant to the award will again become available for subsequent issuance under the 2013 Plan. The following types of shares under the 2013 Plan shall not become available for the grant of new awards under the 2013 Plan: (i) shares withheld to satisfy income or employment withholding taxes and (ii) shares tendered to us to pay the exercise price of an option.
The aggregate number of shares of our common stock that may be granted to any employee during a calendar year in the form awards (other than stock options and SARs) that are intended to comply with Section 162(m) of the Code, may not exceed 350,000 (taking into account any transition relief available thereunder). The aggregate number of shares of our common stock that may be granted to any single individual during a calendar year in the form of stock options may not exceed 350,000. The aggregate number of shares of our common stock that may be granted to any single individual during a calendar year in the form of SARs may not exceed 350,000.
Administration of the 2013 Plan
The 2013 Plan will be administered by the Compensation Committee of our Board of Directors (the “Committee”). Subject to the terms of the 2013 Plan, the Committee will determine which employees and consultants will receive awards under the 2013 Plan, the dates of grant, the number and types of awards to be granted, the exercise or purchase price of each award, and the terms and conditions of the awards, including the period of their exercisability and vesting and the fair market value applicable to a stock award. Each award will be evidenced by an award agreement, which will contain terms and conditions deemed appropriate by the Committee and which may be amended by the Committee.
In addition, the Committee has the authority to determine whether any award may be settled in cash, shares of our common stock, other securities, or other awards or property. The Committee has the authority to interpret the 2013 Plan, to make all determinations in administering the 2013 Plan, and may adopt any administrative rules, regulations, procedures and guidelines governing the 2013 Plan or any awards granted under the 2013 Plan as it deems to be appropriate. The Committee may also delegate any of its powers, responsibilities or duties to any person who is not a member of the Committee or any administrative group within the company. Our Board of Directors may also grant awards or administer the 2013 Plan.
-147-
Table of Contents
Conditions on Awards
All of the awards described below are subject to the conditions, limitations, restrictions, vesting and forfeiture provisions determined by the Committee, in its sole discretion subject to certain limitations provided in the 2013 Plan. Each award granted under the 2013 Plan will be evidenced by an award agreement, which will govern that award’s terms and conditions. Unless otherwise approved by the Committee, awards are not assignable other than by will or the laws of descent and distribution.
The Committee may, prior to grant, condition the vesting of or the lapsing of any applicable vesting restrictions or conditions on awards upon the attainment of performance goals, continuation of service, or any other term or conditions. If performance goals are established by the Committee in connection with the grant of an award, and the Committee intends for the award to comply with the “performance based compensation” provisions of Code Section 162(m) (taking into account any transition relief available thereunder), they will be based upon performance criteria which may include, without limitation, one or more of the following: asset growth; combined net worth; debt to equity ratio; earnings per share; revenues; investment performance; operating income (with or without investment income or income taxes); cash flow; margin; net income (before or after taxes); earnings before interest, taxes, depreciation and/or amortization; return on total capital, equity, revenue or assets; and increase in the fair market value of the Company’s common stock. The vesting conditions placed on any award need not be the same with respect to each grantee and the Committee shall have the sole discretion to amend any outstanding award to accelerate or waive any or all restrictions, vesting provisions or conditions set forth in the award agreement. Any of the above criteria may be used with or without adjustment for extraordinary items or nonrecurring items and may be based upon the attainment of specified levels of Company or affiliate performance relative to the performance of other corporations.
Notwithstanding any other provision of the 2013 Plan to the contrary, all awards under the 2013 Plan, except for those that serve as a material inducement to a person or persons being hired by the company or any subsidiary, will be subject to a minimum vesting schedule of at least thirty-six months following the date of grant of the award, provided, however, that (1) such vesting schedule may be on a monthly, quarterly or yearly pro-rata basis and (2) all awards for which vesting will lapse on achievement of performance goals will be subject to a minimum vesting schedule of at least twelve months.
Types of Equity-Based Awards
The 2013 Plan provides for the grant of stock options intended to meet the requirements of “incentive stock options” under Section 422 of the Code as well as “non-qualified stock options” that do not meet such requirements, SARs, restricted stock, restricted stock units, dividend equivalent rights and other stock-based or cash-based awards, all of which may be structured at the discretion of the Committee to satisfy the performance-based compensation requirements of Section 162(m) of the Code (taking into account any transition relief available thereunder). Incentive stock options may be granted only to employees. All other awards may be granted to employees and consultants. Our non-employee directors are not permitted to participate in the 2013 Plan.
Stock Options
An award of a stock option gives a grantee the right to purchase a certain number of shares of our common stock during a specified term in the future at an exercise price equal to at least 100% of the fair market value of our common stock on the grant date. The term of a stock option may not exceed 10 years from the date of grant. Incentive stock options will be exercisable in any calendar year only to the extent that the aggregate grant date fair market value of our common stock with respect to which the incentive stock options are exercisable for the first time does not exceed $100,000. No incentive stock option may be granted to any person who, at the time of the grant, owns or is deemed to own stock possessing more than 10% of our total combined voting power or that of any of our affiliates unless (i) the option exercise price is at least 110% of the fair market
-148-
Table of Contents
value of the stock subject to the option on the date of grant and (ii) the term of the incentive stock option does not exceed five years from the date of grant. The exercise price of any stock option may be paid using (i) check, (ii) shares of our common stock previously owned by the grantee and (iii) other legal consideration approved by the company and permitted by applicable law or any combination of the foregoing. The Committee may also allow for cashless exercise.
Stock Appreciation Rights
A SAR entitles the grantee to receive an amount equal to the difference between the fair market value of our common stock on the exercise date and the exercise price of the SAR (which may not be less than 100% of the fair market value of a share of our common stock on the grant date), multiplied by the number of shares subject to the SAR. The term of a SAR may not exceed 10 years from the date of grant. If the SAR is granted in connection with a stock option under the 2013 Plan then (i) the grantee, upon exercise of all or any part of the SAR, must surrender to us, unexercised, that portion of the underlying stock option relating to the same number of shares as is covered by the SAR (or the portion of the SAR so exercised), (ii) the SAR will terminate and no longer be exercisable upon the termination or exercise of the related stock option and stock options which have been so surrendered shall no longer be exercisable to the extent the related SARs have been exercised, and (iii) the SAR will be exercisable only to the extent that the related stock option is exercisable and the SAR shall expire no later than the date on which the related stock option expires. The grantee may exercise a SAR by providing written notice to the company. Payment to a grantee upon the exercise of a SAR may be either in cash or shares of our common stock as determined by the Committee.
Restricted Stock
A restricted stock award is an award of outstanding shares of our common stock that does not vest until a specified period of time has elapsed, or other vesting conditions have been satisfied as determined by the Committee, and which will be forfeited if the conditions to vesting are not met. Unless the Committee chooses to use another system, the Committee will issue a certificate in respect to the shares of restricted stock, registered in the name of the grantee, and the company may hold the certificate until the restrictions upon the award have lapsed. During the period that any restrictions apply, the transfer of stock awards is generally prohibited. Grantees generally have all of the rights of a stockholder as to those shares, including the right to vote the shares, however except as otherwise determined by the Committee the grantee shall not have the right to receive dividend payments on the shares subject to their award during the vesting period and the grantee will have the right to the unpaid dividends upon the lapsing of restrictions on those shares. To the extent the award of restricted stock permits a Section 83(b) election, if the grantee makes the election, the grantee will promptly file a copy of the election with the company.
Restricted Stock Units
A restricted stock unit is an unfunded and unsecured obligation to issue a share of common stock (or an equivalent cash amount) to the grantee in the future. Restricted stock units become payable on terms and conditions determined by the Committee and will be settled either in cash or shares of our common stock or other securities or property, or any combination, as determined by the Committee.
Dividend Equivalent Rights
Dividend equivalent rights entitle the grantee to receive amounts equal to ordinary cash dividends that are paid on the shares underlying a grant while the grant is outstanding. Dividend equivalent rights may be paid in cash, in shares of our common stock or in a combination of the two. The Committee will determine whether dividend equivalent rights will be conditioned upon the vesting or payment of the grant to which they relate and the other terms and conditions of the grant.
-149-
Table of Contents
Other Stock-Based or Cash-Based Awards
Under the 2013 Plan, the Committee may grant other types of equity-based, equity-related or cash-based awards subject to such terms and conditions that the Committee may determine. Such awards may include the grant or offer for sale of unrestricted shares of our common stock, performance share awards, and performance units settled in cash.
Performance-Based Awards
At the discretion of the Committee, awards may be granted in a manner which is intended to be deductible by the company under Section 162(m) of the Code (taking into account any transition relief available thereunder). In such event, the performance-based award will be determined based on the attainment of written objective performance goals based on the performance criteria described above approved by the Committee for a performance period established by the Committee (i) while the outcome for that performance period is substantially uncertain and (ii) no more than 90 days after the commencement of the performance period to which the performance goal relates or, if the performance period is less than one year, the number of days which is equal to 25% of the relevant performance period. When setting performance goals, the Committee will also prescribe a formula to determine the amount of the performance-based award that may be payable upon the level of attainment of the performance goals during the performance period. Following the completion of each performance period, the Committee will have the sole discretion to determine whether the applicable performance goals have been met with respect to each individual, and if they have, will certify the amount of the applicable performance-based award.
Effect of a Termination Event
Except as otherwise provided in the award agreement, if a termination of a grantee’s relationship with the Company occurs, any award or portion of an award that is unvested as of the termination date will be terminated and be forfeited as of the termination date. Except as otherwise provided in the award agreement, any stock option or SAR or portion of a stock option or SAR that has previously vested as of the termination date (and is otherwise exercisable) will terminate and be forfeited three months after the termination date, unless termination results from the participant’s death or disability, in which case the termination and forfeiture will take place one year after the termination date.
Adjustments
In order to prevent the enlargement or dilution of rights as a result of any increase or decrease in the number of our shares resulting from stock splits, extraordinary dividends, stock dividends, recapitalizations, spinoff, splitup, combination, reclassification, merger, consolidation and certain other events affecting our common stock, the Committee will make adjustments as it deems appropriate in (i) the maximum number of shares of our common stock reserved for issuance as grants, (ii) the maximum number of awards that any individual participating in the 2013 Plan may be granted in any calendar year, (iii) the number and kind of shares covered by outstanding grants, (iv) the kind of shares that may be issued under the 2013 Plan and (v) the exercise price of any outstanding stock awards, if applicable.
Amendment; Termination
Our Board of Directors or the Committee may amend or terminate the 2013 Plan at any time, provided that no such amendment may materially adversely impair the rights of a grantee of an award without the grantee’s consent. Our shareholders must approve any amendment if their approval is required in order to comply with the Code, applicable laws, or applicable stock exchange requirements. Unless terminated sooner by our Board of Directors or extended with shareholder approval, the 2013 Plan will terminate on August 1, 2013, but any outstanding award will remain in effect until the underlying shares are delivered or the award lapses.
-150-
Table of Contents
Change of Control
Unless the Committee determines otherwise, or as otherwise provided in the applicable award agreement, in the event of a change in control, the Committee may also (i) provide for the assumption of or the issuance of substitute awards, (ii) provide that for a period of at least 20 days prior to the change in control, stock options or SARs that would not otherwise become exercisable prior to a change in control will be exercisable as to all shares of common stock, as the case may be, subject thereto and that any stock options or SARs not exercised prior to the consummation of the change in control will terminate and be of no further force or effect as of the consummation of the change in control, (iii) modify the terms of such awards to add events or conditions (including the termination of employment within a specified period after a change of control) upon which the vesting of such awards will accelerate or (iv) settle awards for an amount (as determined in the sole discretion of the Committee) of cash or securities (in the case of stock options and SARs that are settled in cash, the amount paid shall be equal to the in-the-money spread value, if any, of such awards).
In general terms, a change of control under the 2013 Plan occurs:
| • | if a person, other than Long Ridge Equity Partners, becomes a beneficial owner of our capital stock representing 25% of the voting power of our outstanding capital stock; |
| • | if the Board of Directors immediately after the initial public offering of our common stock and directors whose appointment or election is endorsed by two-thirds of the incumbent directors no longer constitute a majority of the board; |
| • | if we merge with another entity, unless (i) the business combination is with Long Ridge Equity Partners or (ii)(a) more than 50% of the combined voting power of the merged entity or its parent is represented by our voting securities that were outstanding immediately prior to the merger, (b) the Board of Directors prior to the merger constitutes at least a majority of the board of the merged entity or its parent following the merger and (c) no person is or becomes the beneficial owner of 25% or more of the combined voting power of the outstanding capital stock eligible to elect directors of the merged entity or its parent; |
| • | if we sell or dispose of all or substantially all of our assets; or |
| • | if we are liquidated or dissolved. |
Clawback
All awards under the 2013 Plan will be subject to any clawback or recapture policy, if any, that we may adopt from time to time and are subject to repayment if conditions are not met, and offset, as set forth in the 2013 Plan.
2013 Non-Employee Director Plan
On August 2, 2013, our Board of Directors approved the adoption of the 2013 Non-Employee Director Plan (the “2013 Director Plan”), and our shareholders approved the 2013 Director Plan on August 29, 2013 at our 2013 Annual Meeting.
The description of the 2013 Non-Employee Director Plan is the same as the description for the 2013 Plan, except for the following key differences: (i) the 2013 Non-Employee Director Plan does not replace another equity plan; (ii) a total of 104,812 shares of our common stock will be reserved and available for issuance under the 2013 Non-Employee Director Plan; (iii) the aggregate fair value (determined as of the grant date) of shares of our common stock that may be granted to any single non-employee director during a calendar year may not
-151-
Table of Contents
exceed $300,000; (iv) there is no separate limit on the number of shares of our common stock that may be granted to any single individual during a calendar year in the form of stock options or SARs; (v) our non-employee directors are the only permitted grantees in the 2013 Non-Employee Director Plan; (vi) incentive stock options may not be granted to non-employee directors; (vii) unless the Committee determines otherwise, performance-based awards will not be granted under our 2013 Non-Employee Director Plan; and (viii) awards to non-employee directors will not be subject to a minimum vesting schedule.
Amended and Restated 2011 Omnibus Incentive Plan
In 2011, we adopted the 2011 Plan to give us a competitive advantage in attracting, retaining and motivating employees, consultants and directors and to more directly link incentives to the success of the Company and increases in shareholder value. The 2011 Plan was amended on April 10, 2013 to increase the number of shares of our common stock available for grant under the 2011 Plan from 1,386,151 to 2,467,350 and was amended and restated on May 8, 2013. On August 29, 2013, our shareholders approved the 2013 Plan to replace the 2011 Plan, and therefore, no further issuances or awards will be made pursuant to the 2011 Plan.
The 2011 Plan provided for the grant of stock options (both incentive stock options and nonqualified stock options), SARs, restricted stock, performance units, phantom stock, restricted stock units and stock awards, with each grant evidenced by an award agreement providing the terms of the award.
Eligibility
Awards under the 2011 Plan were granted to the employees, consultants and directors of the Company and its affiliates who are responsible for or contribute to the management, growth and profitability of the business of the Company and/or its affiliates.
Administration
The 2011 Plan is administered by the Committee. Among other things, the Committee determined the grantees of awards under the 2011 Plan, the type of awards granted, the number of shares of our common stock subject to awards and the terms and conditions of such awards (including the vesting, acceleration or forfeiture conditions). Vesting conditions may be based on the continued service of the participant or any other term or condition (including achievement of performance goals). If performance goals were established by the Committee in connection with the grant of an award, they are based upon performance criteria which may include, without limitation, one or more of the following: asset growth; combined net worth; debt to equity ratio; earnings per share; revenues; investment performance; operating income (with or without investment income or income taxes); cash flow; margin; net income (before or after taxes); earnings before interest, taxes, depreciation and/or amortization; return on total capital, equity, revenue or assets; and increase in the fair market value of the Company’s common stock. The vesting conditions placed on any award need not be the same with respect to each participant and the Committee shall have the sole discretion at any time to accelerate or waive, in whole or in part, any or all remaining restrictions on vesting or exercisability with respect to any or all of the awards. Any of the above criteria may be used with or without adjustment for extraordinary items or nonrecurring items and may be based upon the attainment of specified levels of Company or affiliate performance relative to the performance of other corporations.
In addition, the Committee has the authority to modify, amend or adjust the terms and conditions of any award, suspend the vesting or exercise of an award in connection with a transaction involving the Company and determine the circumstances under which an award may be settled in cash, common stock, other securities, other awards, other property, or any combination of the foregoing. The Committee has the authority to adopt, alter, waive and repeal any administrative rules, guidelines and practices governing the 2011 Plan or an award thereunder as the Committee deems advisable, to interpret the terms and provisions of the 2011 Plan, to interpret, amend or waive the terms or provisions of any award under the 2011 Plan (and related award agreement), to
-152-
Table of Contents
correct any defect, supply any omission or reconcile any inconsistency in the 2011 Plan and otherwise supervise the administration of the 2011 Plan. Any determination made by the Committee shall be made in the sole discretion of the Committee or its delegate, are not required to be uniform across participants, and all such decisions shall be final, binding and conclusive on all persons, including the Company, its affiliates and participants in the 2011 Plan.
Indemnification and No Liability
The 2011 Plan contains an indemnification and no liability provision. No member of the Committee, the Board of Directors or any officer or employee of the Company will be personally liable for any mistake of judgment made in good faith. The Company will indemnify and hold harmless any employee, officer or director to whom any duty or power relating to the administration or interpretation of the 2011 Plan may be allocated or delegated against any cost, expense or liability arising out of any act or omission to act in connection with the 2011 Plan unless it arises out of the individual’s own fraud or bad faith.
Adjustments to Shares Subject to the 2011 Plan
The Committee may make or provide for adjustments in number and kind of shares granted under the 2011 Plan, in the number and kind of shares subject to outstanding awards and in the exercise price per share applicable to outstanding awards if the Committee in its sole discretion, exercised in good faith, determines adjustment is required to prevent dilution or enlargement of the rights of participants that would otherwise result from (i) any stock dividend, stock split, share combination or exchange, recapitalization or other change in the Company’s capital structure, (ii) any merger, share exchange, consolidation, split-up, spin-off, split-off, reorganization, partial or complete liquidation, or issuance of rights or warrants to purchase securities, affecting or involving the Company or (iii) any other corporate transaction or event having an effect similar to any of the foregoing. At the time of the IPO, 611,542 shares had been granted and/or exercised and were no longer available for grant, and options to purchase 1,539,880 shares were outstanding.
Material Transaction
Except as provided in an award agreement with a participant, if we experience a transaction, determined by the Board of Directors to be material, including the consummation of a sale of the Company or all or substantially all of our assets, a sale of the majority of the stock of the Company, a merger or consolidation transaction or any other transaction deemed appropriate by the Board of Directors, the Board of Directors may, in its sole discretion, provide for treatment of awards in any manner it deems appropriate. This includes, but is not limited to, substituting all awards under the 2011 Plan for alternative consideration as it may determine to be equitable in the circumstances, the acceleration of vesting or lapsing of any restriction and requiring and exercise of and payment of any awards to occur at the time of the material transaction and/or provision of the same consideration, calculated on a per share basis, as the holders of shares were entitled to receive as if the award was exercised and the restrictions lapsed. Adjustments in connection with a material transaction and the manner of application of the provisions will be determined solely by the Board of Directors.
Stock Options
The 2011 Plan authorizes the grant of incentive stock options (under Section 422 of the Code) and options that do not qualify as incentive stock options (nonqualified stock options). The exercise price of each option was determined by the Committee, provided that the price cannot be less than 100% of the fair market value of the shares of our common stock on the date on which the option is granted (or 110% of the shares’ fair market value on the grant date in the case of an incentive stock option granted to an individual who is a “ten percent stockholder” under Sections 422 and 424 of the Code). Incentive stock options will be exercisable in any calendar year only to the extent that the aggregate fair market value of the common stock with respect to which the incentive stock options are exercisable for the first time does not exceed $100,000. A stock option may be
-153-
Table of Contents
exercised by giving written notice of exercise to the Company specifying the number of shares subject to the stock options to be purchased, accompanied by payment in full of the purchase price by certified or bank check or such other instrument the Company may accept. If permitted by the Committee and applicable securities laws, the participant may deliver common stock already owned, cause to be withheld from the stock option shares of common stock or deliver a certified or bank check or other instrument that the Company accepts. The term of an option cannot exceed ten years from the date of grant (or five years in the case of an incentive stock option granted to a “ten percent stockholder”). Incentive stock options may only be granted to our employees.
Effect of a Termination Event
Except as otherwise provided in the award agreement, if a termination of a participant’s relationship with the Company (whether as an employee, consultant or director) occurs, any award or portion of an award that is unvested as of the termination date will be terminated and be forfeited as of the employment termination date. Any stock option or portion of a stock option that has previously vested as of the termination date (and is otherwise exercisable) will terminate and be forfeited three months after the termination date, unless termination results from the participant’s death or disability, in which case the termination and forfeiture will take place one year after the termination date.
Amendment; Termination
The Board of Directors may amend, modify or terminate the 2011 Plan at any time, provided that no amendment, modification or termination may in any manner adversely affect any award granted pursuant to the 2011 Plan prior to the date of the termination, amendment or modification without consent of the participant or, if applicable, the transferee. Our shareholders will be required to approve any amendment to the extent such approval is necessary and desirable under the Code or any other applicable law or regulation.
Federal Income Tax Consequences
The following discussion is intended only as a brief summary of the U.S. federal income tax rules that are generally relevant to awards that may be granted under the 2013 Plan, the 2013 Director Plan and the 2011 Plan, based upon the U.S. federal tax laws currently in effect, and is not intended to constitute (and is not) tax advice. The laws governing the tax aspects of awards are highly technical and such laws are subject to change. The discussion is general in nature and does not take into account a number of considerations which may apply in light of the circumstances of a particular participant under the 2013 Plan, the 2013 Director Plan or the 2011 Plan. The income tax consequences under applicable foreign, state or local tax laws may not be the same as under U.S. federal income tax laws. Tax consequences to participants may vary based on their individual circumstances, and participants in the 2013 Plan, the 2013 Director Plan and the 2011 Plan are strongly urged to consult their own tax advisors regarding their federal, state, local, foreign and other tax consequences.
Code Section 409A
All awards under the 2013 Plan, the 2013 Director Plan and the 2011 Plan that are intended to be exempt from Section 409A of the Code (“Section 409A”) shall be interpreted, administered and construed to comply with and preserve such exemption, and all awards granted under the 2013 Plan, the 2013 Director Plan and the 2011 Plan that are intended to be “deferred compensation” subject to Section 409A shall be interpreted, administered and construed to comply with Section 409A; the Board of Directors and the Committee shall have full authority to give effect to this intent. To the extent necessary to do so, in the case of any conflict or potential inconsistency between the 2013 Plan, the 2013 Director Plan or the 2011 Plan, as applicable, and a provision of any award or award agreement with respect to an award, the 2013 Plan, the 2013 Director Plan or the 2011 Plan, as applicable, shall govern.
Nonqualified Stock Options and SARs
Upon the grant of a nonqualified stock option or SAR, assuming the exercise price is at least equal to the fair market value of a share of common stock on the date of grant, the award holder will not recognize any
-154-
Table of Contents
taxable income and the Company will not be entitled to a deduction. Upon the exercise of a nonqualified stock option or SAR, the excess of the fair market value of the shares acquired on the exercise of the nonqualified stock option or SAR over the exercise price or the cash paid in settlement of the SAR (the “spread”) will constitute compensation taxable to the award holder as ordinary income. The Company, in computing its U.S. federal income tax, will generally be entitled to a deduction in an amount equal to the compensation taxable to the award holder.
Incentive Stock Options
An optionee will not recognize taxable income on the grant or exercise of an incentive stock option. However, the spread at exercise will constitute an item includible in alternative minimum taxable income, and, thereby, may subject the optionee to the alternative minimum tax. Such alternative minimum tax may be payable even though the optionee receives no cash upon the exercise of the incentive stock option.
Upon the disposition of shares of stock acquired pursuant to the exercise of an incentive stock option, after the later of (i) two years from the date of grant of the incentive stock option or (ii) one year after the transfer of the shares to the optionee (the “ISO Holding Period”), the optionee will recognize long-term capital gain or loss, as the case may be, measured by the difference between the stock’s selling price and the exercise price. The Company is not entitled to any tax deduction by reason of the grant or exercise of an incentive stock option, or by reason of a disposition of stock received upon exercise of an incentive stock option if the ISO Holding Period is satisfied. Different rules apply if the optionee disposes of the shares of stock acquired pursuant to the exercise of an incentive stock option before the expiration of the ISO Holding Period.
Restricted Stock
A grantee who is awarded restricted stock will not recognize any taxable income for federal income tax purposes in the year of the award, provided that the shares of common stock are subject to restrictions (that is, the restricted stock is nontransferable and subject to a substantial risk of forfeiture). However, if permitted by the Company the grantee may timely elect under Section 83(b) of the Code to recognize compensation income in the year of the award in an amount equal to the fair market value of the common stock on the date of the award (less the purchase price, if any), determined without regard to the restrictions. If the grantee does not make such a Section 83(b) election, the fair market value of the common stock on the date the restrictions lapse (less the purchase price, if any) will be treated as compensation income to the grantee and will be taxable in the year the restrictions lapse, and dividends paid while the common stock is subject to restrictions will be recognized by the grantee as ordinary income and subject to withholding taxes. If we comply with applicable reporting requirements, if applicable, we will be entitled to a business expense deduction in the same amount and generally at the same time as the grantee recognizes ordinary income.
Performance Units; Phantom Stock and Restricted Stock Units
There are no immediate tax consequences of receiving an award of performance units, phantom stock or restricted stock units, as long as the award is subject to restrictions (that is, the award is not transferrable and is subject to a substantial risk of forfeiture). A grantee who is awarded performance units, phantom stock or restricted stock units will be subject to FICA tax and withholding at vesting, and will be required to recognize ordinary income in an amount equal to the fair market value of the award at the end of the restriction period. If we comply with applicable reporting requirements, we will be entitled to a business expense deduction in the same amount and generally at the same time as the grantee recognizes ordinary income.
Unrestricted Stock
Participants who are awarded unrestricted common stock will be required to recognize ordinary income in an amount equal to the fair market value of the shares of common stock on the date of the award, reduced by the amount, if any, paid for such shares. If we comply with applicable reporting requirements, we will be entitled to a business expense deduction in the same amount and generally at the same time as the grantee recognizes ordinary income.
-155-
Table of Contents
Awards to Mr. Cutillo; Other Awards to Senior Management
In connection with the May 2013 private offering we made grants of stock options to certain of our executives and other key employees to purchase up to 1,402,501 shares of our common stock in the aggregate at an exercise price of $18.00 a share, including grants to Mr. Cutillo to purchase 897,218 shares, Mr. Bettenburg to purchase 125,611 shares, and Mr. Landes to purchase 89,722 shares. These options are subject in all respects to the terms and conditions set forth in the 2011 Plan and the award agreements pursuant to which these options were granted. In the event that the grantee’s employment is terminated, prior to the date on which any shares of our common stock become publicly traded on an established securities exchange the options are subject to the Company’s call right, consistent with the Company’s call right described above in connection with Mr. Cutillo’s and Mr. Bettenburg’s employment agreements. Except for the options granted to Mr. Cutillo, the options vest, subject to the grantee’s continued employment with the Company, in equal annual installments on each of the first through fourth anniversaries of the grant date. Other provisions, including with respect to termination of employment, are described above in connection with the summary of the 2011 Plan.
Mr. Cutillo’s stock option award vests in equal annual installments of 25% on each of January 1, 2014, January 1, 2015, January 1, 2016 and January 1, 2017, subject, in each case, to his continued employment with the Company or earlier termination of employment without cause, resignation for good reason or a Change in Control. Mr. Cutillo’s option award provides that if his employment is terminated by the Company without “cause” or if he resigns for “good reason,” the option award will vest to the extent that it would have vested had Mr. Cutillo continued to be employed through the next January 1 following his termination date. Mr. Cutillo’s option award vests in full upon a Change in Control (as defined in his employment agreement). Awards to employees other than Mr. Cutillo vest in equal annual installments of 25% on each of the first through fourth anniversaries of the grant date, subject to continued employment with the Company through each such vesting date.
Other Equity Awards
Equity awards not granted as described above under “Awards to Mr. Cutillo; Other Awards to Senior Management” are reserved for further issuance under the 2013 Plan up to the number of shares reserved and not previously issued.
Director Compensation
Effective May 15, 2013, our Board of Directors established a compensation program for all our directors. Pursuant to this compensation program, we pay, on a quarterly basis, the following fees to each of our directors:
| • | an annual cash retainer of $60,000; |
| • | additional Board of Directors fees and committee fees as follows: |
| • | Lead Independent Director—$50,000 annually |
| • | Audit Committee Chair—$15,000 annually |
| • | Compensation Committee Chair—$10,000 annually |
| • | Corporate Governance and Nominating Committee Chair—$10,000 annually |
In connection with the May 2013 private offering, we made grants of stock options to purchase up to 35,888 shares of our common stock in the aggregate at an exercise price of $18.00 a share to two of our directors, Messrs. Kraemer and Levinson. These options are subject in all respects to the terms and conditions set forth in
-156-
Table of Contents
the 2011 Plan and the award agreements pursuant to which these options were granted. In the event that the grantee’s service is terminated, prior to the date on which any shares of our common stock become publicly traded on an established securities exchange, the options are subject to the Company’s call right, consistent with the Company’s call right described above in connection with Mr. Cutillo’s and Mr. Bettenburg’s employment agreements. These options vest, subject to the grantee’s continued service with the Company, in equal annual installments on each of the first through fourth anniversaries of the grant date. Other provisions, including with respect to termination of service, are described above in connection with the summary of the 2011 Plan.
We will also reimburse our directors for reasonable out-of-pocket expenses incurred in connection with the performance of their duties as directors, including without limitation travel expenses in connection with their attendance in-person at Board of Directors and committee meetings. Directors who are employees will not receive any compensation for their services as directors.
The following table presents compensation awarded in 2012 to our non-employee directors as of December 31, 2012 or paid to or accrued for those directors for services rendered during 2012.
| Name |
Fees Earned or |
Option Awards |
All Other |
Total ($) |
||||||||||||
| Richard A. Mirro |
75,000 | 78,931 | 0 | 153,931 | ||||||||||||
| (1) | On March 9, 2012 and pursuant to the letter agreement with Mr. Mirro, we granted Mr. Mirro stock options to purchase 101,494 shares of our common stock at an exercise price of $3.97 per share. The stock options vest in twelve equal successive quarterly installments beginning June 30, 2012 and ending June 30, 2015, subject to continued service with the Company. If Mr. Mirro ceases to serve as a member of the Board of Directors, all of the stock options will be forfeited and/or exercisable as provided in the 2011 Plan. The amount in this column represents the aggregate grant date fair value of the stock option grant, computed in accordance with FASB ASC Topic 718. |
Director Agreement
Compensation paid to Mr. Mirro for his service as a director in 2012 was determined pursuant to a letter agreement with Mr. Mirro, which became effective on March 9, 2012. The letter designated Mr. Mirro as a non-executive director of the Company. Material terms of the letter agreement include: (1) a fee of $50,000 annually, paid in four equal quarterly installments; (2) a fee of $5,000 for each calendar quarter Mr. Mirro serves on the Audit Committee; (3) a fee of $5,000 for each calendar quarter Mr. Mirro serves on the Risk Committee; (4) a fee of $5,000 for each regularly scheduled quarterly meeting of the Board of Directors that Mr. Mirro attends; and (5) an option grant, as described below. Mr. Mirro’s letter agreement was terminated effective as of May 15, 2013, at which time he became entitled to receive the same director compensation that all of the other outside directors are entitled to receive.
-157-
Table of Contents
CERTAIN RELATIONSHIPS AND RELATED PARTY TRANSACTIONS
Under SEC rules, a related person is an officer, director, nominee for director or beneficial holder of more than 5% of any class of our voting securities since the beginning of the last fiscal year or an immediate family member of any of the foregoing. Our Board of Directors has approved a written related party transaction policy that took effect July 24, 2013. Pursuant to this policy, directors, executive officers and senior managers are required to report to the Chief Administrative Officer any transactions or circumstances that may create or appear to create a conflict between the personal interests of the individual and the interests of the Company, regardless of the amount involved. All other employees are required to make such reports to the head of their particular department. The Chief Administrative Officer will report these transactions which involve executive officers and directors to the Audit Committee or the Board of Directors, which may grant a waiver. Such waiver must be promptly disclosed as required by SEC or NYSE rules. Any waiver for other employees may be made only by the Chief Administrative Officer. The Audit Committee, Board of Directors or Chief Administrative Officer, as applicable, in making a decision, will consider various factors, including the benefit of the transaction to the Company, the terms of the transaction and whether they are at arm’s-length and in the ordinary course of the Company’s business, the direct or indirect nature of the related person’s interest in the transaction, the size and expected term of the transaction, and other facts and circumstances that bear on the materiality of the related party transaction under applicable law and listing standards.
Prior to the adoption of the written policy, our Board of Directors used similar processes and controls to obtain information from our directors, executive officers and significant shareholders regarding related party transactions and then determined, based on the facts and circumstances, whether we or a related person had a direct or indirect material interest in these transactions.
Arrangements with Long Ridge Equity Partners and its Affiliates
Long Ridge Equity Partners controls our largest shareholder, Stonegate Investors Holdings. Long Ridge Equity Partners is a private investment firm focused on the financial services industry.
Investor Rights Agreement
In connection with the investment by Stonegate Investors Holdings in us, we entered into an Investor Rights Agreement which was amended in May 2013 pursuant to which Stonegate Investors Holdings is entitled to various registration, preemptive and information rights with respect to our securities owned by it. Subsequently, in September 2013, we entered into a second amendment. Specifically, the Investor Rights Agreement, as amended, provides Stonegate Investors Holdings with the following registration rights:
Specified Registration. Stonegate Investors Holdings may request, at any time after the earlier of (1) March 9, 2015 and (2) the date that is six months after the effective date of our first registration statement for a public offering of our securities, that we register all or part of the securities held by Stonegate Investors Holdings, including shares of common stock owned by it following the May 2013 private offering and shares of common stock issued upon exercise of the warrants owned by it described below.
Company Registration. If we determine to register any of our securities (other than in certain excluded registrations), we have agreed to promptly notify Stonegate Investors Holdings and use our commercially reasonable efforts to include in that registration all or part of the securities held by Stonegate Investors Holdings that Stonegate Investors Holdings requests that we include.
Stonegate Investors Holdings is entitled to five registration requests on the terms described above under the Investor Rights Agreement. In this public offering and in any company registration, the registration rights of Stonegate Investors Holdings will be pari passu with the registration rights of the holders in the May 2013 private offering. Stonegate Investors Holdings will have priority over the investors in the May 2013 private offering with respect to its specified registrations and any future registrations that it requests under the terms of the Investor Rights Agreement.
-158-
Table of Contents
The Investor Rights Agreement contains customary provisions relating to registration rights, including, without limitation, customary rights relating to registration procedures, our obligation to pay registration expenses (other than selling expenses), our right to defer certain registrations, the right of Stonegate Investors Holdings to distribute their equity securities by means of an underwriting, cutback rights, holdback rights, indemnification, reporting, cooperation, transfer and assignment, and termination.
The Investor Rights Agreement provides that if we grant any other person registration rights that are more favorable to the holder of those registration rights than the registration rights of Stonegate Investors Holdings under the Investor Rights Agreement, the registration rights of Stonegate Investors Holdings under the Investor Rights Agreement shall be deemed to be amended to incorporate such more favorable provisions.
In addition to the registration rights, the Investor Rights Agreement, as amended, provides that, so long as Stonegate Investors Holdings continues to own at least 10% of the shares of our outstanding common stock, Stonegate Investors Holdings has the right of first refusal to purchase its pro rata share of any securities that we propose to issue and sell in a private offering or private placement, subject to certain exceptions. In any such offering, Stonegate Investors Holdings is required to pay the same consideration and accept the same material terms as any other prospective purchaser of such securities.
The Investor Rights Agreement also provides that Stonegate Investors Holdings will have the right to request and receive certain financial information so long as it continues to own at least 10% of the shares of our outstanding common stock.
Termination. The right to request registration or inclusion in any registration pursuant to the Investors Right Agreement the will terminate on the earlier of (i) the date on which all shares of common stock issued or issuable upon conversion of the preferred shares subject to such agreement are sold pursuant to such registration or may immediately be sold without limitation under Rule 144 or other similar applicable law, rule or regulation during any consecutive 90-day period, and (ii) five years after the closing of our initial public offering.
Shareholders’ Agreement
In connection with our May 2013 private offering, we entered into an amendment to the Shareholders’ Agreement with Stonegate Investors Holdings and our other shareholders pursuant to which Stonegate Investors Holdings has various governance and other rights. Subsequently, in September 2013, we entered into a second amendment. Specifically, the amendments to the Shareholders’ Agreement provide for the following with respect to the composition of our Board of Directors and committees thereof:
| • | After the completion of our initial public offering of our shares of common stock, Stonegate Investors Holdings will be permitted to designate two members to our Board so long as it owns at least 15% of the shares of our outstanding common stock and one member to our Board so long as it owns at least 10% and not more than 15% of the shares of our outstanding common stock. We have also agreed that a majority of the members of our Board will be independent within the meaning of the corporate governance rules of the NYSE. |
| • | Subject to the corporate governance rules of the NYSE, if shares of our common stock are then admitted for trading, Stonegate Investors Holdings is permitted to designate one member to each committee of our Board. |
Management Agreement
In connection with the investment in Stonegate Investors Holdings in us in March 2012, we entered into a Management Agreement with Long Ridge Equity Partners pursuant to which Long Ridge Equity Partners was entitled to a management fee in consideration of the consulting and advisory services that it provides to us. In
-159-
Table of Contents
connection with the May 2013 private offering, we agreed with Long Ridge Equity Partners LLC to terminate the Management Agreement upon payment of the management fee for 2013 (in the amount of $320,000) and our agreement to make an additional payment of $500,000 to Long Ridge Equity Partners LLC upon the earlier of the consummation of our initial public offering of our shares of common stock and May 15, 2014 (the first anniversary of the consummation of the May 2013 private offering). Thus, we paid Long Ridge Equity Partners LLC a management fee of $320,000 upon consummation of the May 2013 private offering and paid them a termination fee of $500,000 at the closing date of the IPO.
Loan and Security Agreement
On March 29, 2013, we entered into a term loan agreement with Stonegate Investors Holdings, LLC, our principal stockholder, to borrow a bridge loan in the principal amount of $10.0 million maturing on or before September 30, 2013 at a rate per annum equal to 5% compounded monthly commencing on the closing date and ending May 31, 2013, and thereafter at a rate per annum equal to 12.5% compounded monthly. Under the terms of the term loan agreement, we issued warrants to Stonegate Investors Holdings, LLC for the right to purchase 277,777 shares of our common stock at a price of $18.00 per share. The term loan agreement matured upon the consummation of our May 2013 private offering and was repaid in full with $4.3 million of cash and 314,147 shares of our common stock, at a per share price of $18.00, totaling $5.7 million, which were issued in our May 2013 private offering for the remaining balance on the term loan. The warrants are exercisable at any time through March 29, 2018. Because the warrants meet the criteria of a derivative financial instrument that is indexed to the Company’s own stock, the warrants’ allocable fair value of $1.5 million was recorded as a debt discount. The debt discount was fully amortized into interest expense upon repayment of the term loan in full, resulting in $1.5 million of interest expense during the six months ended June 30, 2013.
Warrant Agreement
As part of the consideration for granting the SIH Loan, we entered into a warrant agreement, dated as of March 29, 2013, between us and Stonegate Investors Holdings (the “Warrant Agreement”), which gives the holder thereof the right to subscribe for and purchase our common stock (the “Warrants”). The holder is entitled to purchase up to 277,777 shares of common stock at an exercise price of $18.00 per share, in each case subject to adjustments for recapitalizations and reclassifications. (Stonegate Investors Holdings, LLC has since transferred warrants to purchase a total of 39,062 shares of our common stock to its affiliate, Long Ridge Equity Partners, LLC, and to Glick Pluchenik 2011 Trust.) The term of the Warrants commenced on May 15, 2013 (the closing of our issuance of common stock in the May 2013 private offering) and will remain exercisable for five years until May 15, 2018.
The purchase price can be paid, at the election of the holder of the Warrants, by (i) cash or check or (ii) on a net issuance basis, by surrender of all or a portion of the Warrants for common stock to be exercised. To the extent the Warrants are not previously exercised as to all shares subject to them, and if the fair market value of one share of common stock is greater than the exercise price of $18.00, the Warrants will be deemed automatically exercised on a net issuance basis as of immediately before their expiration. The Warrants, after the date that they become exercisable, are transferrable, in whole or in part, without charge to the holder (except for transfer taxes), upon surrender of the Warrants.
Voting Agreement
Under the Registration Rights Agreement, which we entered into in connection with the May 2013 private offering, and our code of regulations, if we have not caused this shelf registration statement for the resale of the shares sold in the May 2013 private offering to be declared effective by the SEC by the 75th day after the closing date of the initial public offering, subject to extension under certain circumstances, we will be required to call a special meeting of our shareholders (a “Special Election Meeting”) to consider and vote upon proposals to expand the size of our Board of Directors by three and to elect three new independent directors nominated by the
-160-
Table of Contents
holders of the shares of common stock sold in the IPO to fill those three vacancies, unless the holders of at least 75% of the outstanding shares of our common stock entitled to vote thereon, excluding shares beneficially owned by our directors and officers and by Stonegate Investors Holdings, consent to a waiver or deferral of the requirement that we hold the special meeting.
Upon the completion of the May 2013 private offering, we, Stonegate Investors Holdings and FBR Capital Markets & Co. entered into a Voting Agreement pursuant to which (1) Stonegate Investors Holdings will not be entitled to nominate any director nominees at the Special Election Meeting, (2) any shares our common stock beneficially owned by Stonegate Investors Holdings will be counted as present for quorum purposes at the Special Election Meeting, (3) Stonegate Investors Holdings will be required to vote all its shares FOR the proposal to expand the size of the Board of Directors by three at the Special Election Meeting, (4) if we hold a Special Election Meeting because we have not caused a shelf registration statement for the resale of the shares sold in the May 2013 private offering, or a registration statement relating to an initial public offering of our common stock, to be declared effective by the SEC by June 30, 2014, Stonegate Investors Holdings will have the right either to vote all of its shares FOR the election of the three nominees at the Special Election Meeting or to withhold its vote with respect to the election of the three nominees, if we hold a Special Election Meeting because we have completed an initial public offering of our common stock prior to June 30, 2014, but we have not caused a shelf registration statement for the resale of the shares sold in the IPO to be declared effective by the SEC by the 75th day after the closing date of the IPO, Stonegate Investors Holdings will be required to vote its shares FOR the election of the three nominees at the Special Election Meeting. In no event will Stonegate Investors Holdings have the right to vote its shares against the election of the three nominees. The term of the Voting Agreement will expire on the first to occur of the date that our obligation to call the Special Election Meeting expires or November 30, 2014.
Arrangements with Certain Executive Officers and Directors
In 2011, New Market Holdings, LLC issued two subordinated notes to us for $250,000 each (or $500,000 in aggregate total amount). Each subordinated note bore a 10% interest rate and each note was repaid in full on March 30, 2012, in accordance with its terms. Dan Bettenburg, our President, is the founder and manager New Market Holdings, LLC.
In 2012, Steve Landes, our EVP—Loan Origination, issued a subordinated note to us for $250,000. The subordinated note bore a 10% interest rate and was repaid in full on March 30, 2012, in accordance with its terms.
Through June 30, 2013 we had an agreement with an entity in which Scott Mumphrey, one of our directors, is a principal to manage and grow our Home Improvement Program division, which primarily focuses on the origination of certain FHA and Fannie Mae loans. In accordance with the terms of our agreement, the entity in which Mr. Mumphrey is a principal received an annual management fee of $107,500 payable quarterly through January 15, 2014, 10% of all revenue generated by the division payable quarterly through January 15, 2014, and 33.33% of the annual net income of the division for calendar 2012 and 2013. The management fees amounted to $339,362 for the year ended December 31, 2012. This agreement terminated on June 30, 2013 and we agreed to pay $159,384 in fees upon termination.
During 2008-2011, we extended loans to Jim Cutillo, our Chief Executive Officer. The notes were made at various times during those years and bore interest at the “Prime Rate” per year as announced by the Wall Street Journal on December 31 each year. All of the notes were scheduled to mature on April 1, 2014, and the total of all notes issued to Mr. Cutillo, including accrued interest, amounted to $214,273. During June 2013, the notes and accrued interest were forgiven by the disinterested members of our Board of Directors in contemplation of our initial public offering in order for us to be in compliance with the provisions of Section 402 of the Sarbanes-Oxley Act, which prohibits public companies from extending loans to its directors or officers. The forgiven notes will be considered taxable compensation to Mr. Cutillo during 2013 and we recorded $214,273 of expense associated with the forgiven notes within “Salaries, commissions and benefits” on our statement of operations for the six months ended June 30, 2013.
-161-
Table of Contents
Compensation paid to Mr. Mirro for his service as a director in 2012 was determined pursuant to a letter agreement with Mr. Mirro, which became effective on March 9, 2012. The letter designated Mr. Mirro as a non-executive director of the Company. Material terms of the letter agreement include: (1) a fee of $50,000 annually, paid in four equal quarterly installments; (2) a fee of $5,000 for each calendar quarter Mr. Mirro serves on the Audit Committee; (3) a fee of $5,000 for each calendar quarter Mr. Mirro serves on the Risk Committee; (4) a fee of $5,000 for each regularly scheduled quarterly meeting of the Board of Directors that Mr. Mirro attends; and (5) an option grant, as described above. Mr. Mirro’s letter agreement was terminated effective as of May 15, 2013, at which time he became entitled to receive the same compensation that all of the other outside directors are entitled to receive.
-162-
Table of Contents
The following table sets forth the beneficial ownership of shares of our common stock as of the date of this prospectus, by (1) each person known by us to be the beneficial owner of five percent or more of shares of our common stock, (2) each of our named executive officers, (3) each of our directors and (4) all of our executive officers and directors as a group.
The SEC has defined “beneficial ownership” of a security to mean the possession, directly or indirectly, of voting power and/or investment power over such security. In computing the number of shares beneficially owned by a person and the percentage ownership of that person, shares of our common stock subject to options or other rights held by that person that are exercisable or will become exercisable within 60 days after the date of this prospectus, are deemed outstanding, while such shares are not deemed outstanding for purposes of computing percentage ownership of any other person. Each person named in the table has sole voting and investment power with respect to all of the shares of our common stock shown as beneficially owned by such person, except as otherwise set forth in the notes to the table.
The percentages reflect beneficial ownership immediately prior to this offering as determined in accordance with Rule 13d-3 under the Exchange Act. The address for all beneficial owners in the table below is 9190 Priority Way West Drive, Suite 300, Indianapolis, IN 46240.
| Common Stock |
||||||||
| Immediately Prior to |
||||||||
| Name of Beneficial Owner |
Number of |
Percent of |
||||||
| 5% or Greater Shareholders after Offering: |
||||||||
| Affiliates of Long Ridge Equity Partners |
7,403,292 | 29.7 | % | |||||
| Glick Pluchenik 2011 Trust |
1,077,296 | 4.4 | % | |||||
| Executive Officers and Directors: |
||||||||
| James J. Cutillo |
732,220 | 3.0 | % | |||||
| Barb Cutillo (3) |
— | — | ||||||
| Bryan Specht |
— | — | ||||||
| Daniel J. Bettenburg |
611,542 | 2.5 | % | |||||
| John Macke |
— | — | ||||||
| Steve Landes |
291,091 | 1.2 | % | |||||
| Eric Scholtz |
55,556 | 0.2 | % | |||||
| Robert Meachum |
55,555 | 0.2 | % | |||||
| Kevin Bhatt (4) |
7,403,292 | 29.7 | % | |||||
| James Brown (4) |
7,403,292 | 29.7 | % | |||||
| Richard Mirro (5) |
101,494 | 0.4 | % | |||||
| Scott Mumphrey (6) |
585,150 | 2.4 | % | |||||
| Richard Kraemer |
— | — | ||||||
| Sam Levinson (7) |
1,638,407 | 6.6 | % | |||||
| All executive officers and directors as a group (14 persons) |
11,474,307 | 45.9 | % | |||||
| (1) | Includes (1) 6,930,757 shares of common stock currently held by of record Stonegate Investors Holdings, (2) 91,984 shares of common stock currently held of record by Long Ridge Equity Partners, LLC, (3) 104,691 shares of common stock currently held of record by Long Ridge Equity Partners I, LP, (4) 33,239 shares of common stock currently held of record by Long Ridge Offshore Subsidiary Holdings, LLC, (5) 238,715 shares of common stock available for immediate purchase at $18.00 per share by Stonegate Investors Holdings pursuant to their Warrant Agreement, which is described further under |
-163-
Table of Contents
| “Certain Relationships and Related Party Transactions—Arrangements with Long Ridge Equity Partners and its Affiliates—Warrant Agreement” following a distribution to Glick Pluchenik 2011 Trust and Long Ridge Equity Partners, LLC of warrants to purchase 35,156 and 3,906 shares, respectively, of common stock in September 2013 and (6) 3,906 shares of common stock available for immediate purchase at $18.00 per share by Long Ridge Equity Partners, LLC pursuant to the exercise of warrants described above. |
| (2) | Includes 1,042,140 shares of common stock currently held of record by Glick Pluchenik 2011 Trust and 35,156 shares of common stock available for immediate purchase at $18.00 per share by Glick Pluchenik 2011 Trust pursuant to the exercise of warrants described under “Certain Relationships and Related Party Transactions—Arrangements with Long Ridge Equity Partners and its Affiliates—Warrant Agreement.” |
| (3) | Ms. Cutillo may be deemed to be the beneficial owner of shares beneficially owned by Mr. Cutillo, her spouse. Ms. Cutillo disclaims beneficial ownership of such shares. |
| (4) | Messrs. Bhatt and Brown are each principals and officers of certain affiliates of Long Ridge Equity Partners and thus may have control of such shares. Although each of Messrs. Bhatt and Brown may be deemed to be the beneficial owner of shares beneficially owned by affiliates of Long Ridge Equity Partners, each of them disclaims beneficial ownership of any such shares except to the extent of their undivided pecuniary interest. |
| (5) | Represents immediately exercisable options to purchase 101,494 shares of common stock granted under the 2011 Omnibus Incentive Plan. |
| (6) | All shares of common stock are owned of record by Second Curve Investments, LLC of which Scott Mumphrey and his spouse own 50 percent of the outstanding voting equity interests. |
| (7) | Represents 111,111 shares of common stock owned by Diaco Investments LP, 1,042,140 shares of common stock currently held of record by Glick Pluchenik 2011 Trust, 35,156 shares of common stock available for immediate purchase at $18.00 per share by Glick Pluchenik 2011 Trust pursuant to the exercise of warrants described above and 450,000 shares of common stock purchased by Siget NY Partners, LP in this offering. Mr. Levinson is the chief investment officer of Siget NY Partners, LP, which is the investment management company for Diaco Investments LP, and a principal and managing partner of Glick Family Investments, a private family office located in New York, New York, which is affiliated with the Glick Pluchenik 2011 Trust. |
-164-
Table of Contents
The selling shareholders listed in the table below may from time to time offer and sell any or all shares of our common stock set forth below pursuant to this prospectus. When we refer to selling shareholders in this prospectus, we mean the persons listed in the table below, and the pledgees, donees, permitted transferees, assignees, successors and others who later come to hold any of the selling shareholders’ interests in shares of our common stock other than through a public sale.
Certain selling shareholders may be deemed underwriters as defined in the Securities Act. Any profits realized by the selling shareholders may be deemed underwriting commissions.
The following table sets forth, as of the date of this prospectus, the name of the selling shareholders for whom we are registering shares for resale to the public, and the number of such shares that each such selling shareholder may offer pursuant to this prospectus. The shares offered by the selling shareholders were originally issued and sold by us in our May 2013 private offering.
We have been advised that, as noted below in the footnotes to the table, 11 of the selling shareholders are affiliates of broker-dealers. We have been advised that each of such selling shareholders purchased our shares of common stock in the ordinary course of business, not for resale, and that none of such selling shareholders had, at the time of purchase, any agreements or understandings, directly or indirectly, with any person to distribute such shares. All selling shareholders are subject to Rule 105 of Regulation M and are precluded from engaging in any short selling activities prior to effectiveness of the registration of which this prospectus forms a part.
Except as noted below in the footnotes to the table, none of the selling shareholders have, or have had since our inception, any position, office or other material relationship with us or any of our affiliates. Based on information provided to us by the selling shareholders and as of the date the same was provided to us, assuming that the selling shareholders sell all the shares of our common stock beneficially owned by them that have been registered by us and do not acquire any additional shares during the offering, the selling shareholders will not own any shares other than those appearing in the column entitled “Number of Shares Owned After the Offering.” We cannot advise as to whether the selling shareholders will in fact sell any or all of such shares. In addition, the selling shareholders may have sold, transferred or otherwise disposed of, or may sell, transfer or otherwise dispose of, at any time and from time to time, the shares in transactions exempt from the registration requirements of the Securities Act after the date on which they provided the information set forth on the table below.
| Name of Selling Shareholder |
Number of Shares of |
Number of Shares of |
Number of Shares of |
|||||||||
| 683 Capital Partners, LP1 |
352,777 | 352,777 | — | |||||||||
| Arbiter Partners QP LP2 |
111,111 | 111,111 | — | |||||||||
| Balaji Venkataraman |
1,736 | 1,736 | — | |||||||||
| BlueCrest Multi Strategy Master Fund Limited3 |
500,000 | 500,000 | — | |||||||||
| BulwarkBay Credit Opportunities Master Fund Ltd.4 |
90,000 | 90,000 | — | |||||||||
| Clough Global Equity Fund5 |
111,111 | 111,111 | — | |||||||||
| Consector Partners Master Fund LP6 |
170,000 | 170,000 | — | |||||||||
| CQS Directional Opportunities Master Fund Limited7 |
555,555 | 555,555 | — | |||||||||
| Diaco Investments LP8 |
336,111 | 111,111 | 225,000 | |||||||||
| Empyrean Investments, LLC9 |
555,555 | 555,555 | — | |||||||||
| Eric M. Scholtz10 |
55,556 | 55,556 | — | |||||||||
| Fairway Fund Limited11 |
1,776 | 1,776 | — | |||||||||
| Fore ERISA Multi Strategy Fund, Ltd.12 |
3,071 | 3,071 | — | |||||||||
-165-
Table of Contents
| Name of Selling Shareholder |
Number of Shares of |
Number of Shares of |
Number of Shares of |
|||||||||
| Fore Multi Strategy Master Fund, Ltd.13 |
32,653 | 32,653 | — | |||||||||
| Great American Insurance Company14 |
500,000 | 500,000 | — | |||||||||
| Great American Life Insurance Company15 |
500,000 | 500,000 | — | |||||||||
| Great Gable Partners, LP16 |
25,000 | 25,000 | — | |||||||||
| International Investment House17 |
42,535 | 42,535 | — | |||||||||
| J. Steven Emerson IRA R/O II |
65,079 | 65,079 | — | |||||||||
| J. Steven Emerson Roth IRA |
60,000 | 60,000 | — | |||||||||
| Joan Sherman |
8,681 | 8,681 | — | |||||||||
| Long Pond Offshore Master, L.P.18 |
517,140 | 517,140 | — | |||||||||
| Long Pond U.S. Master, LP19 |
316,193 | 316,193 | — | |||||||||
| Long Ridge Equity Partners I, LP20 |
104,691 | 104,691 | — | |||||||||
| Long Ridge Offshore Subsidiary Holdings, LLC21 |
33,239 | 33,239 | — | |||||||||
| Malta Hedge Fund II, L.P.22 |
132,300 | 43,700 | 88,600 | |||||||||
| Malta Hedge Fund, L.P.23 |
20,141 | 6,841 | 13,300 | |||||||||
| Malta MLC Fund, L.P.24 |
52,898 | 13,198 | 39,700 | |||||||||
| Malta MLC Offshore, Ltd.25 |
22,016 | 5,616 | 16,400 | |||||||||
| Malta Offshore, Ltd.26 |
46,419 | 15,519 | 30,900 | |||||||||
| Malta Titan Fund, L.P.27 |
80,770 | 19,570 | 61,200 | |||||||||
| Mark E. Etchison WFBNA Custodian Trad IRA28 |
5,556 | 5,556 | — | |||||||||
| Merestone Partners LP29 |
65,100 | 30,000 | 35,100 | |||||||||
| Mida Holdings30 |
458,717 | 59,896 | 398,821 | |||||||||
| Monashee Capital Partners LP31 |
50,000 | 50,000 | — | |||||||||
| Napier Park Mortgage/Credit Opportunity Fund Ltd.32 |
91,666 | 91,666 | — | |||||||||
| National Interstate Insurance Company33 |
55,555 | 55,555 | — | |||||||||
| Paris Securities Corporation34 |
7,813 | 7,813 | — | |||||||||
| Paul L. Wyner35 |
5,555 | 5,555 | — | |||||||||
| Prime Capital Master SPC – GOT WAT MAC Segregated Portfolio36 |
13,200 | 13,200 | — | |||||||||
| Robert Scott Conway37 |
5,556 | 5,556 | — | |||||||||
| Robert W. Meachum38 |
55,555 | 55,555 | — | |||||||||
| SGATE, LLC39 |
55,556 | 55,556 | — | |||||||||
| SOAM Phoenix Partners, L.P.40 |
26,067 | 6,667 | 19,400 | |||||||||
| Stephen M. Pawlyshyn41 |
6,000 | 6,000 | — | |||||||||
| Talkot Fund, L.P.42 |
67,500 | 67,500 | — | |||||||||
| The Raptor Evolution Fund L.P.43 |
56,153 | 56,153 | — | |||||||||
| The Raptor Evolution Fund Offshore L.P.44 |
18,847 | 18,847 | — | |||||||||
| United Teacher Associates Insurance Company45 |
55,556 | 55,556 | — | |||||||||
| V3 Capital Management, L.P.46 |
355,000 | 355,000 | — | |||||||||
| Waterstone Market Neutral Master Fund, Ltd47 |
273,144 | 273,144 | — | |||||||||
| Waterstone MF Fund Ltd.48 |
50,800 | 50,800 | — | |||||||||
| Waterstone Offshore AD Fund, Ltd49 |
65,000 | 65,000 | — | |||||||||
| Waterstone Offshore ER Fund, Ltd50 |
42,300 | 42,300 | — | |||||||||
| XOL HOLDING S.A.L.51 |
27,000 | 27,000 | — | |||||||||
|
|
|
|
|
|
|
|||||||
| Total |
7,317,310 | 6,388,889 | 928,421 | |||||||||
|
|
|
|
|
|
|
|||||||
| 1. | Voting and investment control over the shares held by 683 Capital Partners, LP is exercised by Ari Zweiman. The address of the shareholder is 3 Columbus Circle, Suite 2205, New York, NY 10019. |
-166-
Table of Contents
| 2. | Voting and investment control over the shares held by Arbiter Partners QP LP is exercised by Paul J. Isaac. The address of the shareholder is c/o Arbiter Partners Capital Management LLC, 11 East 44th Street, Suite 700, New York, NY 10017. |
| 3. | BlueCrest Multi Strategy Credit Master Fund Limited is the legal and beneficial owner of the securities and controls the voting rights. However, pursuant to an investment management agreement entered into between BlueCrest Multi Strategy Credit Master Fund Limited and BlueCrest Capital Management LLP, BlueCrest Multi Strategy Credit Master Fund Limited has delegated to BlueCrest Capital Management LLP investment and voting power and it has the power to appoint certain of its affiliates or non-affiliates to carry out such investment and/or voting powers with respect to securities held by BlueCrest Multi Strategy Credit Master Fund Limited. BlueCrest Capital Management LLP is ultimately owned by its principals and majority controlled by Michael Platt. The address of the shareholder is c/o BlueCrest Capital Management (New York) LP, 9 West 57th Street, 12th Floor, New York, NY 10019. |
| 4. | Voting power and investment power is held by BulwarkBay Investment Group LLC and Craig Carlozzi as Managing Member of BulwarkBay Investment Group LLC. The address of the shareholder is 15 Broad Street, 4th Floor, Boston, MA 02109. |
| 5. | Voting and investment control over the shares held by Clough Global Equity Fund is exercised by Eric A. Brock. The address of the shareholder is One Post Office Square, 40th Floor, Boston, MA 02109. |
| 6. | Voting and investment control over the shares held by Consector Partners Master Fund LP is exercised by William Black. The address of the shareholder is 712 Fifth Ave, 8th Floor, New York, NY 10019. |
| 7. | Voting and investment control over the shares held by CQS Directional Opportunities Master Fund Limited is exercised by Mark Unferth. The address of the shareholder is c/o 33 Grovensor Place, 5th Floor, London SW1X 7HY, United Kingdom. |
| 8. | Voting and investment control over the shares held by Diaco Investments LP is exercised by Sam Levinson. The address of the shareholder is 810 7th Avenue, 28th Floor, New York, NY 10019. Mr. Levinson is a director of the registrant. |
| 9. | Voting and investment control over the shares held by Empyrean Investments, LLC is exercised by Michael Price. The address of the shareholder is 10250 Constellation Blvd, Suite 2950, Los Angeles, CA 90067. |
| 10. | Mr. Scholtz is the Executive Vice President of Structured Finance of the registrant. |
| 11. | As investment manager under an investment management agreement, Fore Research & Management, LP may exercise dispositive and voting power with respect to the shares owned by Fairway Fund Limited, Fore ERISA Multi Strategy Fund, Ltd. and Fore Multi Strategy Master Fund, Ltd. Fore Research & Management, LP disclaims beneficial ownership of such shares. Matthew Li, LLC is the general partner of Fore Research & Management, LP. Matthew Li is the managing member of Matthew Li, LLC. Each of Mr. Li and Matthew Li, LLC disclaim beneficial ownership of the shares owned by Fairway Fund Limited, Fore ERISA Multi Strategy Fund, Ltd. and Fore Multi Strategy Master Fund, Ltd. The address of the shareholder is 510 Madison Avenue, 11th Floor, New York, NY 10022. |
| 12. | As investment manager under an investment management agreement, Fore Research & Management, LP may exercise dispositive and voting power with respect to the shares owned by Fairway Fund Limited, Fore ERISA Multi Strategy Fund, Ltd. and Fore Multi Strategy Master Fund, Ltd. Fore Research & Management, LP disclaims beneficial ownership of such shares. Matthew Li, LLC is the general partner of Fore Research & Management, LP. Matthew Li is the managing member of Matthew Li, LLC. Each of Mr. Li and Matthew Li, LLC disclaim beneficial ownership of the shares owned by Fairway Fund Limited, Fore ERISA Multi Strategy Fund, Ltd. and Fore Multi Strategy Master Fund, Ltd. The address of the shareholder is 510 Madison Avenue, 11th Floor, New York, NY 10022. |
-167-
Table of Contents
| 13. | As investment manager under an investment management agreement, Fore Research & Management, LP may exercise dispositive and voting power with respect to the shares owned by Fairway Fund Limited, Fore ERISA Multi Strategy Fund, Ltd. and Fore Multi Strategy Master Fund, Ltd. Fore Research & Management, LP disclaims beneficial ownership of such shares. Matthew Li, LLC is the general partner of Fore Research & Management, LP. Matthew Li is the managing member of Matthew Li, LLC. Each of Mr. Li and Matthew Li, LLC disclaim beneficial ownership of the shares owned by Fairway Fund Limited, Fore ERISA Multi Strategy Fund, Ltd. and Fore Multi Strategy Master Fund, Ltd. The address of the shareholder is 510 Madison Avenue, 11th Floor, New York, NY 10022. |
| 14. | Great American Insurance Company is a wholly-owned subsidiary of American Financial Group, Inc. The board of directors of American Financial Group, Inc., consisting of Carl H. Linder III, S. Craig Linder, Kenneth C. Ambrecht, John B. Berding, Joseph E. Consolino, Virginia C. Drosos, James E. Evans, Terry S. Jacobs, Gregory G. Joseph, William W. Verity and John I. Von Lehman, exercises voting and investment control over the shares held by the shareholder. The address of the shareholder is 301 East Fourth Street, Cincinnati, OH 45202. The shareholder is affiliated with a registered broker-dealer. |
| 15. | Great American Life Insurance Company is a wholly-owned subsidiary of American Financial Group, Inc. The board of directors of American Financial Group, Inc., consisting of Carl H. Linder III, S. Craig Linder, Kenneth C. Ambrecht, John B. Berding, Joseph E. Consolino, Virginia C. Drosos, James E. Evans, Terry S. Jacobs, Gregory G. Joseph, William W. Verity and John I. Von Lehman, exercises voting and investment control over the shares held by the shareholder. The address of the shareholder is 301 East Fourth Street, Cincinnati, OH 45202. The shareholder is affiliated with a registered broker-dealer. |
| 16. | Voting and investment control over the shares held by Great Gable Partners, LP is exercised Jacques A. Soenens. The address of the shareholder is 301 Battery St., 2nd Floor, San Francisco, CA 94111. |
| 17. | Voting and investment control over the shares held by International Investment House is exercised by Michel Daher and Abdallah Daher. The address of the shareholder is Delta Trading SAL Building, Ferzol Main Road—P.O. Box 241, Lebanon. |
| 18. | Voting and investment control over the shares held by Long Pond Offshore Master, L.P. is exercised by John Khoury. The address of the shareholder is 410 Park Avenue, Suite 920, New York, NY 10022. |
| 19. | Voting and investment control over the shares held by Long Pond U.S. Master, LP is exercised by John Khoury. The address of the shareholder is 410 Park Avenue, Suite 920, New York, NY 10022. |
| 20. | Voting and investment control over the shares held by Long Ridge Equity Partners I, LP is exercised by Kevin Bhatt and James Brown. Affiliates of the shareholder own common stock of the registrant as follows: 6,930,757 shares by Stonegate Investors Holdings, LLC, 238,715 shares underlying a warrant held by Stonegate Investors Holdings, LLC, 91,984 shares held by Long Ridge Equity Partners LLC, and 33,239 shares held by Long Ridge Offshore Subsidiary Holdings, LLC. Kevin Bhatt and James Brown, who have voting and investment authority over the above shares and those of the shareholder, are directors of the registrant. The address of the shareholder is 1120 Avenue of the Americas, 1807, New York, NY 10036. |
| 21. | Voting and investment control over the shares held by Long Ridge Equity Partners I, LP is exercised by Kevin Bhatt and James Brown. Affiliates of the undersigned own common stock of the registrant as follows: 6,930,757 shares by Stonegate Investors Holdings, LLC, 238,715 shares underlying a warrant held by Stonegate Investors Holdings, LLC, 91,984 shares held by Long Ridge Equity Partners LLC, and 104,691 shares held by Long Ridge Equity Partners I, LP. Kevin Bhatt and James Brown, who have voting and investment authority over the above shares and those of the shareholder, are directors of the registrant. The address of the shareholder is 1120 Avenue of the Americas, 1807, New York, NY 10036. |
-168-
Table of Contents
| 22. | Voting and investment control over the shares held by Malta Hedge Fund II, L.P. is exercised Terry Maltese. The address of the shareholder is c/o Sandler O’Neill Asset Management, LLC, 150 East 52nd Street, 30th Floor, New York, NY 10022. The shareholder is affiliated with a registered broker-dealer. |
| 23. | Voting and investment control over the shares held by Malta Hedge Fund, L.P. is exercised Terry Maltese. The address of the shareholder is c/o Sandler O’Neill Asset Management, LLC, 150 East 52nd Street, 30th Floor, New York, NY 10022. The shareholder is affiliated with a registered broker-dealer. |
| 24. | Voting and investment control over the shares held by Malta MLC Fund, L.P. is exercised Terry Maltese. The address of the shareholder is c/o Sandler O’Neill Asset Management, LLC, 150 East 52nd Street, 30th Floor, New York, NY 10022. The shareholder is affiliated with a registered broker-dealer. |
| 25. | Voting and investment control over the shares held by Malta MLC Offshore, Ltd. is exercised Terry Maltese. The address of the shareholder is c/o Sandler O’Neill Asset Management, LLC, 150 East 52nd Street, 30th Floor, New York, NY 10022. The shareholder is affiliated with a registered broker-dealer. |
| 26. | Voting and investment control over the shares held by Malta Offshore, Ltd. is exercised Terry Maltese. The address of the shareholder is c/o Sandler O’Neill Asset Management, LLC, 150 East 52nd Street, 30th Floor, New York, NY 10022. The shareholder is affiliated with a registered broker-dealer. |
| 27. | Voting and investment control over the shares held by Malta Titan Fund, L.P. is exercised Terry Maltese. The address of the shareholder is c/o Sandler O’Neill Asset Management, LLC, 150 East 52nd Street, 30th Floor, New York, NY 10022. The shareholder is affiliated with a registered broker-dealer. |
| 28. | Mr. Etchison is a Senior Vice President – Retail Lending of the registrant. |
| 29. | Voting and investment control over the shares held by Merestone Partners LP is exercised by John Garofalo and Andrew St. Pierre. The address of the shareholder is 125 High Street, High Street Tower 27, Boston, MA 02110. |
| 30. | Voting and investment control over the shares held by Mida Holdings is exercised by Michel Daher. The address of the shareholder is Delta Trading SAL Building, Ferzol Main Road—P.O. Box 241, Lebanon. |
| 31. | Voting and investment control over the shares held by Monashee Capital Partners LP is exercised by Tom Wynn. The address of the shareholder is 125 High Street, 28th Floor, Boston, MA 02110. |
| 32. | Voting and investment control over the shares held by Napier Park Mortgage/Credit Opportunity Fund is exercised by Rajesh Agarwal. The address of the shareholder is 399 Park Ave, 7th Floor, New York, New York 10022. |
| 33. | National Interstate Insurance Company is a wholly-owned subsidiary of National Interstate Corporation. The board of directors of National Interstate Corporation, consisting of Joseph E. Consolino, Gary J. Gruber, Keith A. Jensen, Donald D Larson, David W. Michelson, Vito C. Peraino, Joel Schiavone, Donald W. Schwegman, Alan R. Spachman, and Michael A. Spachman, exercises voting and investment control over the shares held by National Interstate Insurance Company. The address of the shareholder is 3250 Interstate Dr., Richfield, OH 44286. The shareholder is affiliated with a registered broker-dealer. |
| 34. | Voting and investment control over the shares held by Paris Securities Corporation is exercised by Jan Marks. The address of the shareholder is P.O. Box 1294, Madison, NJ 07940. |
| 35. | Mr. Wyner is a Senior Vice President – TPO of the registrant. |
| 36. | Voting control over the shares held by Prime Capital Master SPC – GOT WAT MAC Segregated Portfolio is exercised by Chris Parks. Investment control over the shares held by Prime Capital Master SPC – GOT WAT MAC Segregated Portfolio is exercised by Shawn Bergerson. The address of the shareholder is 2 Carlson Parkway, Suite 260, Plymouth, MN 55447. |
-169-
Table of Contents
| 37. | Mr. Conway is a Senior Vice President – Strategy and Business Development of the registrant. |
| 38. | Mr. Meachum is the Executive Vice President of Servicing of the registrant. |
| 39. | Voting and investment control over the shares held by SGATE, LLC is exercised by Christopher Russell and Kenneth Cron. The address of the shareholder is 100 Washington Boulevard, 5th Floor, Stamford, CT 06902. |
| 40. | Voting and investment control over the shares held by SOAM Phoenix Partners, L.P. is exercised Terry Maltese. The address of the shareholder is c/o Sandler O’Neill Asset Management, LLC, 150 East 52nd Street, 30th Floor, New York, NY 10022. The shareholder is affiliated with a registered broker-dealer. |
| 41. | Mr. Pawlyshyn is a Vice President of Non Agency Trading of the registrant. |
| 42. | Voting and investment control over the shares held by Talkot Fund, L.P. is exercised Thomas B. Akin. The address of the shareholder is 2400 Bridgeway, Suite 300, Sausalito, CA 94965. |
| 43. | Voting and investment control over the shares held by The Raptor Evolution Fund L.P. is exercised James J. Pallotta. The address of the shareholder is 280 Congress Street, Floor 12, Boston, MA 02210. |
| 44. | Voting and investment control over the shares held by The Raptor Evolution Fund Offshore L.P. is exercised James J. Pallotta. The address of the shareholder is 280 Congress Street, Floor 12, Boston, MA 02210. |
| 45. | United Teacher Associates Insurance Company is a wholly-owned subsidiary of American Financial Group, Inc. The board of directors of American Financial Group, Inc., consisting of Carl H. Linder III, S. Craig Linder, Kenneth C. Ambrecht, John B. Berding, Joseph E. Consolino, Virginia C. Drosos, James E. Evans, Terry S. Jacobs, Gregory G. Joseph, William W. Verity and John I. Von Lehman, exercises voting and investment control over the shares held by the shareholder. The address of the shareholder is 301 East Fourth Street, Cincinnati, OH 45202. The shareholder is affiliated with a registered broker-dealer. |
| 46. | Voting and investment control over the shares held by V3 Capital Management, L.P. is exercised Charles Fitzgerald. The address of the shareholder is 400 Park Avenue, Suite 1430, New York, NY 10022. |
| 47. | Voting control over the shares held by Waterstone Market Neutral Master Fund, Ltd is exercised by Chris Parks. Investment control over the shares held by Waterstone Market Neutral Master Fund, Ltd is exercised by Shawn Bergerson. The address of the shareholder is 2 Carlson Parkway, Suite 260, Plymouth, MN 55447. |
| 48. | Voting control over the shares held by Waterstone MF Fund Ltd. is exercised by Chris Parks. Investment control over the shares held by Waterstone MF Fund Ltd. is exercised by Shawn Bergerson. The address of the shareholder is 2 Carlson Parkway, Suite 260, Plymouth, MN 55447. |
| 49. | Voting control over the shares held by Waterstone Offshore AD Fund, Ltd is exercised by Chris Parks. Investment control over the shares held by Waterstone Offshore AD Fund, Ltd is exercised by Shawn Bergerson. The address of the shareholder is 2 Carlson Parkway, Suite 260, Plymouth, MN 55447. |
| 50. | Voting control over the shares held by Waterstone Offshore ER Fund, Ltd is exercised by Chris Parks. Investment control over the shares held by Waterstone Offshore ER Fund, Ltd is exercised by Shawn Bergerson. The address of the shareholder is 2 Carlson Parkway, Suite 260, Plymouth, MN 55447. |
| 51. | Voting and investment control over the shares held by XOL HOLDING S.A.L. is exercised by Joseph Nasrallah. The address of the shareholder is Mina El Hosn Omar Daouk Street, Starco Center, P.O. Box 11-1499, Beirut, Lebanon. |
-170-
Table of Contents
General
Stonegate currently has 125,000,000 authorized shares of stock consisting of 100,000,000 shares of common stock, $0.01 par value, and 25,000,000 shares of preferred stock.
As of December 5, 2013, there were:
| • | 25,769,236 shares of common stock issued and outstanding held by 21 shareholders of record, and no shares of preferred stock issued and outstanding; |
| • | 1,539,880 shares of our common stock issuable upon the exercise of outstanding stock options; and |
| • | 277,777 shares of our common stock issuable upon the exercise of outstanding warrants. |
Common Stock
Holders of our common stock are entitled to one vote for each share of our common stock they hold on all matters to be voted on by the common shareholders. Subject to the superior terms of any preferred stock which may be issued and outstanding at any time, the holders of our common stock are also entitled to share in the net assets of Stonegate upon liquidation.
Holders of our common stock are not entitled to any dividends unless declared by the Board of Directors of Stonegate, and such dividends are subject to the rights of the holders of any preferred stock discussed below. Holders of our common stock are not entitled to any preemptive rights in connection with the issuance of any additional shares of capital stock of Stonegate in the future (except as otherwise agreed by contract) and are not entitled to cumulate their votes in the election of directors or otherwise.
Warrants
On March 29, 2013 we issued warrants to Stonegate Investors Holdings. The warrants give the holder thereof the right to subscribe for 277,777 shares of our common stock at $18.00 per share. In September 2013, Stonegate Investors Holdings, LLC transferred warrants to purchase a total of 39,062 shares of our common stock to its affiliate, Long Ridge Equity Partners, LLC, and to Glick Pluchenik 2011 Trust. For a description of the Warrant Agreement and the terms thereof, see “Certain Relationships and Related Party Transactions—Warrant Agreement.”
Preferred Stock
Under our current articles of incorporation (but subject to the limitations prescribed by law), our Board of Directors may issue shares of preferred stock in one or more series, and may establish from time to time the number of shares to be included in such series and may fix the designation, powers, privileges, preferences and relative participating, optional or other rights, if any, of the shares of each such series and any qualifications, limitations or restrictions thereof. When and if we issue preferred stock, we will establish the applicable preemptive rights, dividend rights, voting rights, conversion privileges, redemption rights, sinking fund rights, rights upon voluntary or involuntary liquidation, dissolution or winding up and any other relative rights, preferences and limitations for the particular preferred stock series.
We believe that the ability of our Board of Directors to issue preferred stock provides us with flexibility in structuring possible future financings and acquisitions and to meet other corporate needs that might arise. The authorized shares of our preferred stock, as well as shares of our common stock, are available for issuance without further shareholder action, unless applicable law or applicable NYSE rules require such action.
-171-
Table of Contents
Market Listing
Our common stock is listed on the NYSE under the symbol “SGM”.
Transfer Agent and Registrar
We have retained American Stock Transfer & Trust Company, LLC as the transfer agent and registrar for our common stock.
Registration Rights
The purchasers of common stock in our May 2013 private offering are entitled to the benefits of a Registration Rights Agreement between us and the initial purchaser and placement agent in that May 2013 private offering, acting for itself and for the benefit of the investors in that May 2013 private offering, the form of which has been filed as an exhibit to the registration statement of which this prospectus forms a part.
Under the Registration Rights Agreement, we agreed, at our expense, to use our commercially reasonable efforts to confidentially submit or file with the SEC as soon as reasonably practicable but in no event later than September 12, 2013 (which is 120 days after the closing date of the May 2013 private offering) a shelf registration statement registering for resale the registrable shares (as defined in the Registration Rights Agreement) plus any additional shares of common stock issued in respect thereof whether by stock dividend, stock distribution, stock split, or otherwise. We refer to this registration statement as the “resale shelf registration statement.” We are obligated to use our commercially reasonable efforts to cause the shelf registration statement to become effective under the Securities Act as soon as reasonably practicable after filing, and in any event, subject to certain exceptions, no later than February 15, 2014, and to maintain its continuous effectiveness under the Securities Act, subject to certain blackout periods, for the period described in the Registration Rights Agreement.
On September 9, 2013, we confidentially submitted the shelf registration statement for the resale of the shares sold in our May 2013 private offering to the SEC, and if and when this registration statement is declared effective by the SEC, we will have satisfied the filing requirements described above.
In addition, if we have not caused this shelf registration statement to be declared effective by the SEC by the 75th day after the closing date of the initial public offering, subject to extension under certain circumstances, then the Registration Rights Agreement will require that we hold a special meeting of our shareholders for the purpose of considering and voting on proposals to expand the Board of Directors by three and elect three new independent directors to our Board of Directors who are nominated by the holders of the shares sold in the May 2013 private offering, unless the holders of at least 75% of the outstanding shares of our common stock entitled to vote thereon, excluding shares beneficially owned by our directors and officers and by Stonegate Investors Holdings, consent to a waiver or deferral of the requirement that we hold the special meeting.
We will agree to indemnify each selling shareholder, if any, for certain violations of federal or state securities laws in connection with any registration statement in which such selling shareholder sells its shares of our common stock pursuant to these registration rights.
The preceding summary of certain provisions of the Registration Rights Agreement is not intended to be complete, and is subject to, and qualified in its entirety by reference to, all of the provisions of the Registration Rights Agreements, the form of which has been filed as an exhibit to the registration statement of which this prospectus forms a part.
-172-
Table of Contents
CERTAIN PROVISIONS OF OHIO LAW AND
STONEGATE’S ARTICLES AND REGULATIONS
We are an Ohio corporation, and therefore the rights of our shareholders are governed by the applicable laws of the State of Ohio, including the Ohio Revised Code and our Articles and Regulations.
The following summary discusses the material provisions of our Articles and Regulations, as well as the material rights of our shareholders under Ohio law.
The statements in this section are qualified in their entirety by reference to, and are subject to the detailed provisions of Chapter 1701 of the Ohio Revised Code (otherwise known as the Ohio General Corporation Law), other applicable Ohio laws, and our Articles and Regulations, as applicable.
Authorized Capital Stock
Our Articles authorize 100,000,000 shares of common stock, $0.01 par value, of which 25,769,236 shares are issued and outstanding as of the date of this prospectus, and 25,000,000 shares of preferred stock, of which no shares are issued and outstanding.
Number and Election of Board of Directors
Under Ohio law, a corporation’s articles of incorporation or code of regulations determines the number of directors. Unless the articles of incorporation or code of regulations fixes the number or provides a manner of fixing or changing the number of directors by the shareholders, the shareholders may fix or change the number of directors at a shareholders’ meeting for the election of directors by the affirmative vote of a majority of the shares represented at the meeting and entitled to vote. In our Regulations, we have set this shareholder approval threshold at two-thirds of the shares entitled to vote. Our Regulations also provide for no fewer than six and no more than eleven directors, the specific number of which can also be established by our Board of Directors from time to time or our shareholders. Our Board of Directors has established the current number of directors at seven.
Our Regulations currently provide for a staggered Board of Directors with two separate “classes” of directors with at least three directors in each class with the Class I directors elected to serve until the annual meeting of shareholders in 2014 and the Class II directors elected to serve until the annual meeting of shareholders in 2015. Thereafter, at each annual meeting of shareholders, the Board of Director candidates shall be elected for two year terms. Director candidates receiving the most votes shall be elected and each director shall hold office until the expiration of the term of office for the class to which such director is elected, unless such director earlier resigns, is removed, or dies.
Ohio law provides that each shareholder of an Ohio corporation has the right to vote cumulatively in the election of directors if certain notice requirements are satisfied, unless the articles of incorporation of the corporation to eliminate cumulative voting for directors. Except as our Board of Directors may provide when fixing the rights of any preferred shares, our Articles do not allow cumulative voting rights in director elections or otherwise.
Removal of Directors
Under Ohio law, a director may be removed with or without cause by a majority of the shares entitled to elect directors in place of those removed, unless the articles of incorporation or code of regulations specify a greater vote; except that if the corporation has a classified Board of Directors and is an “issuing public corporation” (as defined by the Ohio General Corporation Law), then cause is required. Our Regulations provide that all of the directors (or any director) may be removed by the affirmative vote of the holders of no less than
-173-
Table of Contents
75% of our shares entitled to vote at an election of directors, but only for cause. Ohio law also provides that a director may be removed by order of court if he or she has been found to be of unsound mind or adjudicated a bankrupt.
Newly Created Directorships and Vacancies
Under Ohio law, unless a corporation’s articles of incorporation or code of regulations provide otherwise, the remaining directors of a corporation may fill any vacancy in the Board of Directors by the affirmative vote of a majority of the remaining directors. Directors elected to fill a vacancy serve the balance of the unexpired term. Our Regulations provide that any vacancy may be filled by the affirmative vote of a majority of the remaining directors then in office, even though less than a quorum. Our shareholders are also authorized to fill the vacancies.
Our Regulations also contain provisions similar to the special shareholder meeting provisions contained in the Registration Rights Agreement to require that we hold a special meeting of our shareholders for the purpose of considering and voting on proposals to expand the size of the Board of Directors by three and to elect three new independent directors to our Board of Directors, if (i) prior to June 30, 2014, either a shelf registration statement for the resale of the shares sold in this offering has not been declared effective by the SEC or we have not completed our initial public offering of our common stock pursuant to a registration statement filed for that purpose, or (ii) we have completed an initial public offering of our common stock prior to June 30, 2014, but we have not caused a shelf registration statement for the resale of the shares sold in this offering to be declared effective by the SEC by the 75th day after the closing date of the initial public offering, subject to extension under certain circumstances, unless the holders of at least 75% of the registrable shares, excluding shares beneficially owned by our directors, officers and affiliates and by Stonegate Investors Holdings, consent to a waiver or deferral of the requirement that we hold the special meeting.
Quorum of Directors
Under Ohio law, unless the articles of incorporation or code of regulations provide otherwise, a majority of the authorized number of directors is necessary to constitute a quorum for a meeting of the directors, except that a majority of the directors in office constitutes a quorum for filling a vacancy in the Board of Directors. Our Regulations provide that a majority of directors in office constitutes a quorum.
Chairman of the Board and Lead Director
Our Regulations permit the Board of Directors to appoint, from among its members, a Chairman of the Board and one or more Vice Chairman of the Board who may either be executive or non-executive chairman as determined by the Board of Directors. Our Regulations provide that the Chairman of the Board, if elected, shall perform all of the typical functions of a chairman, including presiding at all meetings of shareholders and the Board of Directors.
Our Regulations also permit the Board of Directors to elect, from among its members, an independent Lead Director who shall have such powers and duties as prescribed by the Board of Directors. We envision that the Board of Directors would elect a Lead Director only if we did not have a Chairman of the Board or if we had a Chairman of the Board who is not independent as determined under the listing standards of NYSE and applicable SEC rules. Currently, we do not have a Chairman of the Board, and Richard A. Mirro serves as our independent Lead Director.
Annual Meetings of Shareholders
Under Ohio law, an annual meeting of shareholders for the election of directors shall be held on a date designated by, or in the manner provided for in, the articles of incorporation or the code of regulations. In the
-174-
Table of Contents
absence of such designation, the annual meeting shall be held on the first Monday of the fourth month following the close of each fiscal year of the corporation. When the annual meeting is not held or directors are not elected thereat, they may be elected at a special meeting called for that purpose. Our Regulations provide that the annual meeting of shareholders shall be held at such time and place within or without the State of Ohio as may be designated by the directors or, in the absence of a designation by the directors, the Chairman of the Board of Directors, if any, the Chief Executive Officer, the Secretary, or any other individual entitled to give notice pursuant to the Regulations. The Regulations also provide that not more than sixty days nor less than ten days before the date fixed for a meeting of shareholders, whether annual or special, notice of the time, place, and purposes of the meeting, and the means, if any, by which shareholders can be present and vote at the meeting through communications equipment, shall be given.
Special Meetings of Shareholders
Under Ohio law, a special meeting of a corporation’s shareholders may be called by the chairman of the Board of Directors, the president (or vice president, if authorized to exercise the president’s authority, in case of the president’s death or disability), the Board of Directors, a holder of shares representing at least 25% of the outstanding shares entitled to vote at the special meeting (unless the articles of incorporation or code of regulations provide for a greater or lesser amount not more than 50%), or by any other person authorized by the corporation’s articles of incorporation or code of regulations. All shareholders of record entitled to vote must be given notice of all shareholder meetings not less than seven nor more than sixty days before the date of the shareholder meeting, unless the articles of incorporation or the code of regulations specify a longer period. Our Regulations provide that any of the following persons may call a special meeting of shareholders: the Chairman of the Board of Directors, the Chief Executive Officer, the Board of Directors by action at a meeting, a majority of the Board of Directors acting without a meeting, or by the person or persons who hold at least 25% of all of our outstanding shares entitled to be voted on any proposal to be submitted at the meeting. The notice requirements for special meetings are the same as for annual meetings under the Regulations.
Quorum of Shareholders
Under Ohio law, unless the articles of incorporation or the code of regulations otherwise provide, the shareholders present in person, by proxy, or by the use of communications equipment at any meeting of shareholders shall constitute a quorum for such meeting. Our Regulations provide that, to constitute a quorum at any meeting of shareholders, there shall be present in person, by proxy, or by the use of communications equipment, shareholders of record entitled to exercise not less than 50% of our voting power in respect of any one of the purposes for which the meeting is called.
Voting Requirements
Under the Ohio General Corporation Law, each shareholder is entitled to one vote per share unless the corporation’s articles of incorporation provide otherwise. Under our Articles, the holders of our shares of common stock are entitled to one vote per share on all matters to be voted on by the shareholders, and such proposals generally may be authorized by the affirmative vote of the holders of a majority of the voting power of the corporation, whether in person, by proxy, or by the use of communications equipment, on any matter properly brought before the meeting. Ohio law provides that holders of a particular class of shares are entitled to vote as a separate class if the rights of that class are affected in certain respects by mergers, consolidations, or amendments to the articles of incorporation. Special voting requirements for amendments to articles and regulations, and for mergers, dissolution, dispositions of all or substantially all of an Ohio corporation’s assets, and majority share acquisitions and combinations are discussed below.
Action By Written Consent
Except as otherwise expressly permitted by law, the Ohio General Corporation Law allows actions that could be taken at a meeting of shareholders to be taken without such a meeting, by unanimous written consent of
-175-
Table of Contents
shareholders that would have been entitled to vote on the matter if a meeting were held. The writing or writings must be filed with or entered upon the records of the corporation. The Ohio General Corporation Law also allows this right to act by written consent to be eliminated in the articles of incorporation. Neither our Articles nor our Regulations deny our shareholders the ability to act by written consent under the Ohio General Corporation Law.
Rights of Preferred Shareholders
If any of our preferred shares were to be issued, the rights of the holders of our shares of common stock would likely be subordinated to the rights, powers, and preferences of holders of such preferred shares, including with respect to any voting, dividend, and liquidation rights, as may be designated in the Articles or by resolution of the Board of Directors.
Business Conducted at Shareholder Meetings
Our Regulations provide that, except as may be otherwise provided in the express terms of any outstanding preferred shares of Stonegate or any agreement between Stonegate and one or more of its shareholders, nominations for election to the Board of Directors may be made at an annual meeting of shareholders only (i) pursuant to the notice of meetings (or any supplement thereto), (ii) by or at the direction of the Board of Directors, or (iii) by any shareholder who is a shareholder of record at the time the shareholder’s notice is delivered to us, who is entitled to vote at the meeting, and who complies with the advance notice and other procedures set forth in our Regulations. Ohio law and our Regulations provide that only those individuals who are properly nominated as directors in accordance with the Regulations may be elected as directors.
Our Regulations provide that business to be conducted at an annual meeting of shareholders must be (i) specified in the notice of the meeting, (ii) otherwise properly brought before the meeting by the presiding officer or by or at the direction of a majority of the entire Board of Directors, or (iii) otherwise properly requested to be brought before the meeting by a shareholder in accordance with the advance notice provisions of our Regulations. To be properly brought before a special meeting, business must be (i) specified in the notice of the meeting, or (ii) otherwise brought before the meeting by the presiding officer or by or at the direction of a majority of the entire Board of Directors.
Amendment of Articles
Under the Ohio General Corporation Law, shareholders may adopt amendments to the articles of incorporation by the affirmative vote of two-thirds of the shares entitled to vote on the proposal unless the corporation’s articles of incorporation provide for a greater or lesser vote; however, the articles of incorporation must require the affirmative vote of at least a majority of the voting power of the corporation. Under the Ohio General Corporation Law, certain amendments may also be enacted by directors. Ohio law also provides that holders of a particular class of shares of an Ohio corporation are entitled to vote as a separate class if the rights of that class are affected in certain respects by an amendment to the articles of incorporation.
Our Articles provide that, notwithstanding the provisions of Ohio law described above, shareholders may amend the Articles by the affirmative vote of a majority of our voting power; provided that, the affirmative vote of the holders of shares entitling them to exercise two-thirds of our voting power, shall be necessary to adopt a proposed amendment to Article III (Indemnification), or Section 2 (No Preemptive Rights), Section 3 (No Cumulative Voting of Shares), Section 4 (Directors Authority to Amend Articles) or Section 5 (Shareholder Voting Requirements) of Article IV of the Articles.
Notwithstanding any contrary provision of the Ohio Revised Code or our Articles, our Articles provide the Board of Directors with the authority to amend our Articles, by the affirmative vote of a majority of the directors then in office, in the following cases: (A) an amendment to change our corporate name; (B) an
-176-
Table of Contents
amendment to change the place in the State of Ohio of our principal office; (C) when the Board of Directors has declared a dividend or distribution of any class of outstanding shares to be paid in shares of the same class, an amendment to proportionately increase the authorized number of shares of the class, provided that we have only one class of shares outstanding or the dividend or distribution is not substantially prejudicial to the holders of any other class of shares, and further provided that such an amendment be adopted concurrently with the amendment described in clause (E) below when the dividend or distribution is declared on outstanding shares with par value; (D) an amendment to change each issued and unissued authorized shares of an outstanding class into a greater number of shares of that class and to proportionately increase the authorized number of shares of that class, provided that we have only one class of shares outstanding or the change is not substantially prejudicial to the holders of any other class of shares, and further provided that such an amendment be adopted concurrently with the amendment described in clause (E) below when the change is made to outstanding shares with par value; and (E) concurrently with the adoption of an amendment under clause (C) or (D) above, an amendment decreasing the par value of issued and unissued shares of a particular class to the extent necessary to prevent an increase in the aggregate par value of the outstanding shares of the class as a result of the dividend or distribution described in clause (C) or the change described in clause (D) above.
Amendment of Code of Regulations
Under Ohio law, with certain exceptions, shareholders may amend or adopt the code of regulations consistent with Ohio law and the corporation’s articles of incorporation, by the affirmative vote of a majority of shares entitled to vote if done at a shareholders meeting. Shareholders may amend the code of regulations without a meeting with the written consent of the holders of two-thirds of the shares entitled to vote on the proposal. Ohio law provides that a corporation’s articles of incorporation or code of regulations may increase or decrease the required shareholder vote, but may not allow approval by less than a majority of the voting power. Our Regulations provide that the Regulations may be amended (i) by the Board of Directors by majority vote, (ii) at a meeting of the shareholders by the affirmative vote of the shareholders of record entitled to exercise two-thirds of the voting power on such proposal, or (iii) by the written consent of the shareholders of record entitled to exercise two-thirds of the voting power on such proposal. Notwithstanding the foregoing requirements, the provisions of the Regulations relating to the removal and vacancies of directors may only be amended by the affirmative vote or written consent of shareholders entitled to exercise 75% of our voting power.
Business Combinations
Ohio law generally requires approval of mergers, dissolution, dispositions of all or substantially all of an Ohio corporation’s assets, and majority share acquisitions and combinations involving issuance of shares representing one-sixth or more of the voting power of the corporation immediately after the consummation of the transaction (other than so-called “parent-subsidiary” mergers under Ohio Revised Code Section 1708.80 and Section 1701.802) by two-thirds of the voting power of the corporation, unless the articles of incorporation of the corporation specify a different proportion (but not less than a majority) and by the affirmative vote of the holders of shares of any particular class that is entitled to vote by our Articles. Our Articles reduce the voting requirement for these transactions to a majority of our voting power from two-thirds.
Chapter 1704 of the Ohio Revised Code prohibits an “interested shareholder” (10% or greater shareholder) from engaging in a wide range of business combinations (such as mergers and significant asset sales) with an “issuing public corporation” for three years after the date on which a shareholder becomes an interested shareholder (i.e. the share acquisition date), unless the directors of the corporation approved the transaction or the share purchase by the interested shareholder prior to the share acquisition date. As a result, if any person were to acquire our common stock with 10% or more of our voting power without first obtaining approval by the Board of Directors, that person would be required to wait for three years before engaging in certain transactions with us. Even after three years, certain fair price/supermajority vote provisions would apply to transactions between the interested shareholder and us. Our Articles expressly state that the provisions of Chapter 1704 of the Ohio Revised Code do not apply to us.
-177-
Table of Contents
Control Share Acquisitions
Under Section 1701.831 of the Ohio Revised Code (otherwise known as the Ohio Control Share Acquisition Statute), unless the articles of incorporation or code of regulations of an Ohio corporation otherwise provide, any control share acquisition of an issuing public corporation can only be made with the prior approval of the shareholders of the corporation. This statute requires that specified notice and informational filings and special shareholder meetings and voting procedures must occur before consummation of a proposed “control share acquisition.” A “control share acquisition” is defined as any acquisition of shares of an “issuing public corporation” that would entitle the acquirer to exercise or direct the voting power of the issuing public corporation in the election of directors within any of the following ranges: (i) one-fifth or more, but less than one-third, of the voting power; (ii) one-third or more, but less than a majority, of the voting power; or (iii) a majority or more of the voting power.
An “issuing public corporation” is an Ohio corporation with 50 or more shareholders that has its principal place of business, principal executive offices, or substantial assets within the State of Ohio. Assuming compliance with the notice and information filing requirements, the proposed control share acquisition may take place only if, at a duly convened special meeting of shareholders, the acquisition is approved by both a majority of the voting power of the corporation entitled to vote in the election of directors represented at the meeting and a majority of the portion of the voting power remaining after excluding the voting power of the interested shares. Our Articles expressly provide that the provisions of Section 1701.831 of the Ohio Revised Code do not apply to us.
Dissenters’ Rights
Under Ohio law, dissenting shareholders of an Ohio corporation are entitled to appraisal rights (otherwise known as dissenters’ rights) in connection with:
| • | the lease, sale, exchange, transfer, or other disposition of all or substantially all of the assets of the corporation; |
| • | certain amendments to the corporation’s articles of incorporation; |
| • | the corporation being merged into or consolidated with another corporation; and |
| • | any merger, combination, or majority share acquisition in which the corporation is the acquiring corporation, if the shareholders of the corporation are entitled to voting rights in connection with such transaction. |
Ohio law provides that a shareholder of an Ohio corporation must deliver a written demand to the corporation (i) prior to the meeting where the proposal giving rise to dissenters’ rights was approved if the corporation gave timely notice of dissenters’ rights before such vote, or (ii) not later than ten days after the taking of the vote on the matter giving rise to appraisal rights and must not have voted in favor of the matters in order to retain those rights, if the corporation did not give timely notice of dissenters’ rights.
Shareholders are not entitled to dissenters’ rights if the shares involved are listed on a national securities exchange, such as the NYSE.
Profit Recapture Provision
Section 1707.043 of the Ohio Revised Code provides that if a shareholder disposes of an Ohio corporation’s stock for a profit of more than $250,000 within 18 months after announcing an intention to make a proposal to acquire control of the corporation, then the corporation may recover the profit unless the shareholder proves in court that:
| • | its sole purpose in making the proposal was to acquire control of the corporation and it had reasonable grounds to believe it would succeed; or |
-178-
Table of Contents
| • | it did not make the proposal for the purpose of manipulating the market, increasing its profit, or decreasing its loss, and the proposal did not have a material effect on the price or trading volume of the shares of the Ohio corporation. |
Section 1707.043 of the Ohio Revised Code only applies to corporations that have shares listed on a national securities exchange or are regularly quoted in an over-the-counter market.
Dividends
Ohio law provides that an Ohio corporation may pay dividends in cash, property, or shares of an Ohio corporation’s capital stock. Ohio law provides that an Ohio corporation may pay dividends out of surplus in certain circumstances and must notify the shareholders of the corporation if a dividend is paid out of capital surplus. Dividends cannot be paid in violation of the rights of another class of shares or when the company is insolvent or reasonably believes paying a dividend could cause insolvency.
Preemptive Rights
Our Articles specifically eliminate preemptive rights, except as may otherwise be provided by the Board of Directors in connection with the fixing of rights of any class or series of preferred shares issued in the future or as otherwise agreed by contract.
Liability of Directors and Officers; Indemnification; Insurance
Under Ohio law and our Articles, a director of an Ohio corporation generally is not liable for monetary damages unless it is proved by clear and convincing evidence that the director’s action or failure to act was undertaken with deliberate intent to cause injury to the corporation or with reckless disregard for the best interests of the corporation.
Notwithstanding the foregoing, in addition to any other liabilities imposed by law upon directors of a corporation, directors shall be jointly and severally liable to the corporation if they vote for or assent to any of the following:
| • | the payment of a dividend or distribution, the making of a distribution of assets to shareholders or the purchase or redemption of the corporation’s own shares, contrary in any such case to law or the articles of incorporation; |
| • | a distribution of assets to shareholders during the winding up of the affairs of the corporation, on dissolution or otherwise, without the payment of all known obligations of the corporation or without making adequate provision for their payment; or |
| • | the making of a loan, other than in the usual course of business, to an officer, director or shareholder of the corporation, other than if at the time of the making of the loan, a majority of the disinterested directors of the corporation voted for the loan and, taking into account the terms and provisions of the loan and other relevant factors, determined that the making of the loan could reasonably be expected to benefit the corporation. |
Under the Ohio General Corporation Law, generally, a corporation may indemnify any current or former director, officer, employee, or agent for reasonable expenses incurred in connection with the defense or settlement of any threatened, pending, or completed litigation related to the person’s position with the corporation or related to the person’s service (as a director, trustee, officer, employee, member, manager, or agent) to another corporation at the request of the indemnifying corporation, if he or she acted in good faith and in a manner he or she reasonably believed to be in, or not opposed to, the best interests of the corporation. If the litigation involved a criminal action or proceeding, the person must also have had no reasonable cause to believe his or her conduct was unlawful. Ohio law requires indemnification for reasonable expenses incurred if the
-179-
Table of Contents
person was successful in the defense of the litigation. Finally, Ohio law requires a corporation to provide expenses to a person in advance of final disposition of the litigation if the person undertakes to repay any advanced amounts if it is ultimately determined that he or she is not entitled to indemnification. Stonegate’s Articles require indemnification of current and former directors and officers, and of officers and directors serving as directors, officers, or trustees of other corporations, partnerships, joint ventures, trusts, or other enterprises at the request of Stonegate, to the fullest extent permitted by law. In addition, Ohio law and Stonegate’s Articles permit Stonegate to purchase insurance coverage for such liability.
Insofar as indemnification for liabilities arising under the Securities Act may be permitted to directors, officers and controlling persons of Stonegate pursuant to the foregoing provisions, or otherwise, we have been advised that in the opinion of the SEC such indemnification is against public policy as expressed in the Securities Act and is, therefore, unenforceable.
Duties of Directors
Ohio law requires a director of an Ohio corporation to perform his or her duties as a director:
| • | in good faith; |
| • | with the care an ordinarily prudent person in a like position would exercise under similar circumstances; and |
| • | in a manner the director reasonably believes to be in or not opposed to the best interests of the corporation. |
Under Ohio law, a director will not be found to have violated his or her duties as a director, unless it is proved by clear and convincing evidence that the director has not met this standard. This standard applies in any action brought against a Stonegate director, including actions involving or affecting a change or potential change in control of Stonegate, a termination or potential termination of the director’s service to us as a director, or the director’s service in any other position or relationship with us.
In determining what a director reasonably believes to be in the best interests of the corporation, the director must consider the interests of the corporation’s shareholders and may consider, in his or her discretion, any of the following:
| • | the interests of the corporation’s employees, suppliers, creditors, and customers; |
| • | the economy of the state and nation; |
| • | community and societal considerations; and |
| • | the long-term and short-term interests of the corporation and its shareholders, including the possibility that these interests may be best served by the continued independence of the corporation. |
Anti-Takeover Effect of Certain Provisions of Ohio Law and Our Articles and Regulations
Our Articles and Regulations and Ohio law contain provisions that may delay, defer, or prevent a change in control or other transaction that might involve a premium price for our shares of common stock or otherwise be in the best interests of our shareholders, including:
| • | a Board of Directors divided into two classes with only one class standing for election each year, and each class serving a two-year term; |
-180-
Table of Contents
| • | supermajority vote and “for cause” requirements for the removal of directors; |
| • | requirement that, among other methods, shareholders holding at least 25% of Stonegate’s outstanding shares must act together to require us to call a special meeting of shareholders; |
| • | the power of the Board of Directors to cause us to issue additional shares of stock of any class or series and to fix the terms of one or more classes of series of stock without shareholder approval; and |
| • | advance notice requirements for director nominations and shareholder proposals. |
Likewise, if the provision of the Articles opting out of the control share acquisition and business combination provisions of the Ohio General Corporation Law were rescinded, these provisions of the Ohio General Corporation Law could have similar anti-takeover effects.
-181-
Table of Contents
MATERIAL UNITED STATES TAX CONSEQUENCES
TO NON-U.S. HOLDERS OF COMMON STOCK
This section summarizes certain United States federal income and estate tax consequences of the acquisition, ownership and disposition of common stock by a non-U.S. holder. You are a non-U.S. holder if you are, for United States federal income tax purposes:
| • | a nonresident alien individual, |
| • | a foreign corporation, or |
| • | an estate or trust that in either case is not subject to United States federal income tax on a net income basis on income or gain from common stock. |
This section does not consider the specific facts and circumstances that may be relevant to a particular non-U.S. holder and does not address the treatment of a non-U.S. holder under the laws of any state, local or foreign taxing jurisdiction.
This section is based on the tax laws of the United States, including the Code, existing and proposed regulations, and administrative and judicial interpretations, all as currently in effect. These laws are subject to change, possibly on a retroactive basis.
If a partnership holds the common stock, the United States federal income tax treatment of a partner will generally depend on the status of the partner and the tax treatment of the partnership. A partner in a partnership holding the common stock should consult its tax advisor with regard to the United States federal income tax treatment of an investment in the common stock.
You should consult a tax advisor regarding the United States federal tax consequences of acquiring, owning and disposing of common stock in your particular circumstances, as well as any tax consequences that may arise under the laws of any state, local or foreign taxing jurisdiction.
Dividends
Except as described below, if you are a non-U.S. holder of common stock, dividends paid to you are subject to withholding of United States federal income tax at a 30% rate or at a lower rate if you are eligible for the benefits of an income tax treaty that provides for a lower rate. Even if you are eligible for a lower treaty rate, we and other payors will generally be required to withhold at a 30% rate (rather than the lower treaty rate) on dividend payments to you, unless you have furnished to us or another payor:
| • | a valid Internal Revenue Service Form W-8BEN or an acceptable substitute form upon which you certify, under penalties of perjury, your status as a non-United States person and your entitlement to the lower treaty rate with respect to such payments, or |
| • | in the case of payments made outside the United States to an offshore account (generally, an account maintained by you at an office or branch of a bank or other financial institution at any location outside the United States), other documentary evidence establishing your entitlement to the lower treaty rate in accordance with U.S. Treasury regulations. |
If you are eligible for a reduced rate of United States withholding tax under a tax treaty, you may obtain a refund of any amounts withheld in excess of that rate by filing a refund claim with the Internal Revenue Service.
If dividends paid to you are “effectively connected” with your conduct of a trade or business within the United States, and, if required by a tax treaty, the dividends are attributable to a permanent establishment that
-182-
Table of Contents
you maintain in the United States, we and other payors generally are not required to withhold tax from the dividends, provided that you have furnished to us or another payor a valid Internal Revenue Service Form W-8ECI or an acceptable substitute form upon which you represent, under penalties of perjury, that:
| • | you are a non-United States person, and |
| • | the dividends are effectively connected with your conduct of a trade or business within the United States and are includible in your gross income. |
“Effectively connected” dividends are taxed at rates applicable to United States citizens, resident aliens and domestic United States corporations.
If you are a corporate non-U.S. holder, “effectively connected” dividends that you receive may, under certain circumstances, be subject to an additional “branch profits tax” at a 30% rate or at a lower rate if you are eligible for the benefits of an income tax treaty that provides for a lower rate.
Gain on Disposition of Common Stock
If you are a non-U.S. holder, you generally will not be subject to United States federal income tax on gain that you recognize on a disposition of common stock unless:
| • | the gain is “effectively connected” with your conduct of a trade or business in the United States, and the gain is attributable to a permanent establishment that you maintain in the United States, if that is required by an applicable income tax treaty as a condition for subjecting you to United States taxation on a net income basis, |
| • | you are an individual, you hold the common stock as a capital asset, you are present in the United States for 183 or more days in the taxable year of the sale and certain other conditions exist, or |
| • | we are or have been a United States real property holding corporation for United States federal income tax purposes and you held, directly or indirectly, at any time during the five-year period ending on the date of disposition, more than 5% of the common stock and you are not eligible for any treaty exemption. We have not been, are not and do not anticipate becoming a United States real property holding corporation for United States federal income tax purposes. |
An individual non-U.S. holder described in the second bullet point above will be subject to a flat 30% United States federal income tax on the gain derived from a disposition of common stock, which may be offset by U.S.-source capital losses, even though he or she is not considered a resident of the United States. An individual or corporate non-U.S. holder described in the first or third bullet points above will be subject to United States federal income tax at regular graduated rates on the gain derived from a disposition of common stock.
If you are a corporate non-U.S. holder, “effectively connected” gains that you recognize may also, under certain circumstances, be subject to an additional “branch profits tax” at a 30% rate or at a lower rate if you are eligible for the benefits of an income tax treaty that provides for a lower rate.
Federal Estate Taxes
Common stock held by a non-U.S. holder at the time of death will be included in the holder’s gross estate for United States federal estate tax purposes, unless an applicable estate tax treaty provides otherwise.
-183-
Table of Contents
Withholdable Payments to Foreign Financial Entities and Other Foreign Entities
A 30% withholding tax will be imposed on certain payments to you or certain foreign financial institutions, investment funds and other non-United States persons receiving payments on your behalf if you or such institutions fail to comply with information reporting requirements (“FATCA withholding”). Withholdable payments will include U.S.-source dividends and the gross proceeds from the sale or other disposition of stock that can produce U.S.-source dividends. Dividend payments you receive after June 30, 2014 could be subject to this withholding if you are subject to the information reporting requirements and fail to comply with them or if you hold shares of our common stock through another person (e.g., a foreign bank or broker) that is subject to such withholding because it fails to comply with these requirements (even if you would not otherwise have been subject to withholding). However, FATCA withholding will not apply to payments of gross proceeds from a sale or other disposition of common stock before January 1, 2017.
Backup Withholding and Information Reporting
If you are a non-U.S. holder, we and other payors are required to report payments of dividends on Internal Revenue Service Form 1042-S even if the payments are exempt from withholding. You are otherwise generally exempt from backup withholding and information reporting requirements with respect to:
| • | dividend payments and |
| • | the payment of the proceeds from the sale of common stock effected at a United States office of a broker, |
as long as the income associated with such payments is otherwise exempt from United States federal income tax, and:
| • | the payor or broker does not have actual knowledge or reason to know that you are a United States person and you have furnished to the payor or broker: |
| • | a valid Internal Revenue Service Form W-8BEN or an acceptable substitute form upon which you certify, under penalties of perjury, that you are a non-United States person, or |
| • | other documentation upon which it may rely to treat the payments as made to a non-United States person in accordance with U.S. Treasury regulations, or |
| • | you otherwise establish an exemption. |
Payment of the proceeds from the sale of common stock effected at a foreign office of a broker generally will not be subject to information reporting or backup withholding. However, a sale of common stock that is effected at a foreign office of a broker will be subject to information reporting and backup withholding if:
| • | the proceeds are transferred to an account maintained by you in the United States, |
| • | the payment of proceeds or the confirmation of the sale is mailed to you at a United States address, or |
| • | the sale has some other specified connection with the United States as provided in U.S. Treasury regulations, |
unless the broker does not have actual knowledge or reason to know that you are a United States person and the documentation requirements described above are met or you otherwise establish an exemption.
-184-
Table of Contents
In addition, a sale of common stock will be subject to information reporting if it is effected at a foreign office of a broker that is:
| • | a United States person, |
| • | a controlled foreign corporation for United States tax purposes, |
| • | a foreign person 50% or more of whose gross income is effectively connected with the conduct of a United States trade or business for a specified three-year period, or |
| • | a foreign partnership, if at any time during its tax year: |
| • | one or more of its partners are “United States persons,” as defined in U.S. Treasury regulations, who in the aggregate hold more than 50% of the income or capital interest in the partnership, or |
| • | such foreign partnership is engaged in the conduct of a United States trade or business, |
unless the broker does not have actual knowledge or reason to know that you are a United States person and the documentation requirements described above are met or you otherwise establish an exemption. Backup withholding will apply if the sale is subject to information reporting and the broker has actual knowledge that you are a United States person.
You generally may obtain a refund of any amounts withheld under the backup withholding rules that exceed your income tax liability by filing a refund claim with the Internal Revenue Service.
-185-
Table of Contents
The following is a summary of certain considerations associated with the purchase of the shares of our common stock by employee benefit plans that are subject to Title I of the United States Employee Retirement Income Security Act of 1974, as amended (“ERISA”), plans, individual retirement accounts and other arrangements that are subject to Section 4975 of the Code and entities whose underlying assets are considered to include “plan assets” of any such plan, account or arrangement (each, a “Plan”), as well as arrangements that are subject to provisions under any federal, state, local, non-U.S. or other laws or regulations that are similar to Title I of ERISA or Section 4975 of the Code (such arrangements, “Non-ERISA Arrangements” and such provisions, “Similar Laws”). THE FOLLOWING IS MERELY A SUMMARY, HOWEVER, AND SHOULD NOT BE CONSTRUED AS LEGAL ADVICE OR AS COMPLETE IN ALL RELEVANT RESPECTS. ALL INVESTORS ARE URGED TO CONSULT THEIR LEGAL ADVISORS BEFORE INVESTING IN US AND TO MAKE THEIR OWN INDEPENDENT DECISION.
General Fiduciary Matters
ERISA and the Code impose certain duties on persons who are fiduciaries of a Plan and prohibit certain transactions involving the assets of a Plan and its fiduciaries or other interested parties. Under ERISA and the Code, any person who exercises any discretionary authority or control over the administration of such an Plan or the management or disposition of the assets of such a Plan, or who renders investment advice for a fee or other compensation to such a Plan, is generally considered to be a fiduciary of the Plan.
In considering an investment in shares of our common stock with a portion of the assets of any Plan or Non-ERISA Arrangement, a fiduciary should determine whether the investment is in accordance with the documents and instruments governing the Plan or Non-ERISA Arrangement and the applicable provisions of ERISA, the Code or any Similar Law relating to a fiduciary’s duties to the Plan or Non-ERISA Arrangement including, without limitation, the prudence, diversification, delegation of control and prohibited transaction provisions of ERISA, the Code and any other applicable Similar Laws.
Prohibited Transaction Issues
Section 406 of ERISA and Section 4975 of the Code prohibit Plans from engaging in specified transactions involving plan assets with persons or entities who are “parties in interest,” within the meaning of ERISA, or “disqualified persons,” within the meaning of Section 4975 of the Code, unless an exemption is available. A party in interest or disqualified person who engages in a non-exempt prohibited transaction may be subject to excise taxes and other penalties and liabilities under ERISA and the Code, and a prohibited transaction may result in the disqualification of an IRA. In addition, the fiduciary of the Plan that engages in such a non-exempt prohibited transaction may be subject to penalties and liabilities under ERISA and the Code.
The acquisition and/or holding of shares of our common stock by a Plan with respect to which we or an underwriter is considered a party in interest or a disqualified person may constitute or result in a direct or indirect prohibited transaction under Section 406 of ERISA and/or Section 4975 of the Code, unless the investment is acquired and is held in accordance with an applicable statutory, class or individual prohibited transaction exemption. In this regard, the United States Department of Labor (the “DOL”) has issued prohibited transaction class exemptions, or “PTCEs,” that may apply to the acquisition and holding of our common stock. These class exemptions include, without limitation, PTCE 84-14 respecting transactions determined by independent qualified professional asset managers, PTCE 90-1 respecting insurance company pooled separate accounts, PTCE 91-38 respecting bank collective investment funds, PTCE 95-60 respecting life insurance company general accounts and PTCE 96-23 respecting transactions determined by in-house asset managers. In addition, Section 408(b)(17) of ERISA and Section 4975(d)(20) of the Code provide an exemption from the prohibited transaction provisions of ERISA and Section 4975 of the Code for the acquisition and the disposition of the common stock, provided that neither the issuer of the securities nor any of its affiliates (directly or indirectly) have or exercise any
-186-
Table of Contents
discretionary authority or control or render any investment advice with respect to the assets of any Plan involved in the transaction and provided further that the Plan pays no more than adequate consideration in connection with the transaction. There can be no assurance that all of the conditions of any such exemptions will be satisfied.
Representation
Accordingly, by acceptance of the shares of our common stock, each purchaser or subsequent transferee of our common stock will be deemed to have represented and warranted either that (i) no portion of such purchaser’s or transferee’s assets used to acquire such shares constitutes assets of any Benefit Plan Investor or (ii) the purchase of our common stock by such purchaser or transferee will not constitute a non-exempt prohibited transaction under Section 406 of ERISA or Section 4975 of the Code or similar violation under any applicable Similar Laws.
Responsibility for Purchase
Purchasers of our common stock have exclusive responsibility for ensuring that their acquisition and holding of our common stock does not violate the fiduciary or prohibited transaction rules of ERISA or the Code, or any similar provision of applicable Similar Laws. In addition, the foregoing discussion is general in nature, is not intended to be all-inclusive, and is based on laws in effect on the date of this prospectus. Such discussion should not be construed as legal advice. Due to the complexity of these rules and the penalties that may be imposed upon persons involved in non-exempt prohibited transactions, it is particularly important that fiduciaries, or other persons considering purchasing shares of our common stock on behalf of, or with the assets of, any Plan or Non-ERISA Arrangement consult with counsel regarding the potential applicability of ERISA, Section 4975 of the Code and Similar Laws to such investment and whether an exemption would be applicable to the purchase of shares of our common stock.
-187-
Table of Contents
SHARES ELIGIBLE FOR FUTURE SALE
General
We have 25,769,236 shares of our common stock outstanding. Of the total shares of our common stock outstanding, 17,604,236 shares, comprised of all shares issued (i) prior to the May 2013 private offering, (ii) in connection with the conversion of our Series B Convertible Preferred Stock, Series C Convertible Preferred Stock and Series D Convertible Preferred Stock, (iii) pursuant to option exercises by, or other stock purchases or grants to, our directors and officers and (iv) in our May 2013 private offering; are “restricted” securities under the meaning of Rule 144 promulgated under the Securities Act and may not be sold in the absence of registration under the Securities Act unless an exemption from registration is available, including exemptions contained in Rule 144. 6,361,889 of such shares issued in our May 2013 private offering are being registered pursuant to this registration statement, once effective, at which point they can be freely sold in the market, subject to any applicable lock-up agreements or unless they are held by “affiliates,” as that term is defined in Rule 144 of the Securities Act.
Rule 144
In general, under Rule 144, a person (or persons whose shares are aggregated) who is not an affiliate of ours and has not been one of our affiliates at any time during the three months preceding a sale, and who has beneficially owned the restricted securities proposed to be sold for at least one year, including the holding period of any prior owner other than an affiliate, is entitled to sell his or her securities without registration and without complying with the manner of sale, public information, volume limitation or notice provisions of Rule 144. In addition, under Rule 144, once we have been subject to the reporting requirements of the Exchange Act for at least 90 days, a person (or persons whose securities are aggregated) who is not an affiliate of ours and has not been one of our affiliates at any time during the three months preceding a sale, may sell his or her securities without registration, subject to the continued availability of current public information about us after only a six-month holding period. Any sales by affiliates under Rule 144, even after the applicable holding periods, are subject to requirements and/or limitations with respect to volume, manner of sale, notice and the availability of current public information about us.
No assurance can be given as to the likelihood that an active trading market for our common stock will develop, the liquidity of any such market, the ability of our shareholders to sell their shares or the prices that our shareholders may obtain for any of their shares. No prediction can be made as to the effect, if any, that future sales of shares of our common stock, or the availability of shares of our common stock for future sale, will have on the market price prevailing from time to time. Sales of substantial amounts of our common stock, or the perception that such sales could occur, may adversely affect prevailing market prices of our securities. See “Risk Factors—Risks Related to This Offering and Ownership of Our Common Stock.”
For a description of certain restrictions on transfers of our common stock held by certain of our shareholders, see “Plan of Distribution.”
Omnibus Incentive Plans
In 2011, we adopted the 2011 Omnibus Incentive Plan. In connection with our May 2013 private offering, the 2011 Omnibus Incentive Plan was amended and restated (as amended and restated, the “2011 Plan”) to, among other things, increase the number of shares of our common stock available for grant from 1,386,151 to 2,467,350. At the time of this offering, 611,542 shares had been granted and/or exercised pursuant to options under the 2011 Plan and were no longer available for grant, and options to purchase 1,539,880 shares were outstanding under the 2011 Plan. The remaining 315,925 shares that were available for grant under the 2011 Plan prior to the approval of our 2013 Omnibus Incentive Compensation Plan (the “2013 Plan”) are now available for grant under our 2013 Plan, described below. For a description of our 2011 Plan, see “Management—Amended and Restated 2011 Omnibus Incentive Plan.”
-188-
Table of Contents
On August 29, 2013, the 2013 Plan was approved by our shareholders at our 2013 annual meeting. A total of 419,250 shares of our common stock are reserved and available for issuance under the 2013 Plan, which includes the 315,925 shares available for grant under the 2011 Plan as of the effective date of the 2013 Plan. For a description of our 2013 Plan, see “Management—2013 Omnibus Incentive Compensation Plan.”
Lock-Up Periods
For a description of certain lock-up periods, see “Description of Capital Stock—Registration Rights” and “Plan of Distribution.”
-189-
Table of Contents
We are registering the shares covered by this prospectus to permit the selling shareholders to conduct public secondary trading of these shares from time to time after the date of this prospectus. We will not receive any of the proceeds of the sale of the shares offered by this prospectus. The aggregate proceeds to the selling shareholders from the sale of the shares will be the purchase price of the shares less any discounts and commissions. Each selling shareholder reserves the right to accept and, together with their respective agents, to reject, any proposed purchase of shares to be made directly or through agents.
The selling shareholders and any of their pledgees, assignees and successors-in-interest may, from time to time, sell any or all of their shares of common stock offered by this prospectus on any stock exchange, market or trading facility on which the shares are traded. These sales may be at fixed or negotiated prices. The selling shareholders may use any one or more of the following methods when selling the shares offered by this prospectus:
| • | ordinary brokerage transactions and transactions in which the broker dealer solicits purchasers; |
| • | block trades in which the broker dealer will attempt to sell the shares as agent but may position and resell a portion of the block as principal to facilitate the transaction; |
| • | purchases by a broker dealer as principal and resale by the broker dealer for its account; |
| • | broker dealers may agree with the selling shareholders to sell a specified number of such shares at a stipulated price per share; |
| • | a combination of any such methods of sale; and |
| • | any other method permitted pursuant to applicable law. |
In connection with these sales, the selling shareholders may enter into hedging transactions with broker-dealers or other financial institutions that in turn may:
| • | engage in short sales of shares of the common stock in the course of hedging their positions; |
| • | sell shares of the common stock short and deliver shares of the common stock to close out short positions; |
| • | loan or pledge shares of the common stock to broker-dealers or other financial institutions that in turn may sell shares of the common stock; |
| • | enter into option or other transactions with broker-dealers or other financial institutions that require the delivery to the broker-dealer or other financial institution of shares of the common stock, which the broker-dealer or other financial institution may resell under the prospectus; or |
| • | enter into transactions in which a broker-dealer makes purchases as a principal for resale for its own account or through other types of transactions. |
Broker dealers engaged by the selling shareholders may arrange for other brokers dealers to participate in sales. Broker dealers may receive commissions or discounts from the selling shareholders (or, if any broker dealer acts as agent for the purchaser of shares, from the purchaser) in amounts to be negotiated. We have been informed by the selling shareholders that they do not expect these commissions and discounts to exceed what is customary in the types of transactions involved.
-190-
Table of Contents
To our knowledge, there are currently no plans, arrangements or understandings between any selling shareholder and any underwriter, broker-dealer or agent regarding the sale of the shares by the selling shareholders.
In compliance with the guidelines of the Financial Industry Regulatory Authority, or FINRA, the aggregate maximum discount, commission or agency fees or other items constituting underwriting compensation to be received by any FINRA member or independent broker-dealer will not exceed 8% of the proceeds from any offering pursuant to this prospectus and any applicable prospectus supplement.
Any shares covered by this prospectus that qualify for sale under Rule 144 or Regulation D of the Securities Act may be sold under Rule 144 or Regulation D, as applicable, rather than under this prospectus. The shares covered by this prospectus may also be sold to non-U.S. persons outside the U.S. in accordance with Regulation S under the Securities Act rather than under this prospectus. The shares may be sold in some states only through registered or licensed brokers or dealers. In addition, in some states the shares may not be sold unless the shares have been registered or qualified for sale or an exemption from registration or qualification is available and complied with.
-191-
Table of Contents
The validity of the common stock offered hereby will be passed upon for us by Barnes & Thornburg LLP, who represents us on an ongoing basis. In addition, certain legal matters will be passed upon for us by Sullivan & Cromwell LLP, New York, New York.
-192-
Table of Contents
The financial statements of Stonegate Mortgage Corporation as of December 31, 2012 and 2011, and the related statements of operations, changes in stockholders’ equity, and cash flows for the years ended December 31, 2012 and 2011, have been included herein in reliance upon the report of Richey, May & Co., LLP, independent registered public accounting firm, appearing elsewhere herein, and upon the authority of said firm as experts in accounting and auditing.
The consolidated financial statements of Stonegate Mortgage Corporation as of June 30, 2013, and for the six months ended June 30, 2013, have been included herein in reliance upon the report of KPMG LLP, independent registered public accounting firm, appearing elsewhere herein, and upon the authority of said firm as experts in accounting and auditing.
-193-
Table of Contents
CHANGE IN THE COMPANY’S INDEPENDENT REGISTERED ACCOUNTING FIRM
On June 17, 2013, the Company engaged KPMG LLP (“KPMG”) as the Company’s independent registered public accounting firm for the Company’s year ending December 31, 2013. As a result of the engagement of KPMG, on June 17, 2013, the Company dismissed Richey May LLP (“Richey May”) as the Company’s independent registered public accounting firm, which dismissal was approved by the Company’s audit committee on June 17, 2013.
During the years ended December 31, 2012 and 2011, Richey May’s reports on the Company’s consolidated financial statements did not contain an adverse opinion or disclaimer of opinion, and were not qualified or modified as to uncertainty, audit scope or accounting principles. During the years ended December 31, 2012 and 2011 and the subsequent interim period through June 17, 2013, (i) there were no disagreements between the Company and Richey May regarding any matter of accounting principles or practices, financial statement disclosure or auditing scope or procedure, which, if not resolved to the satisfaction of Richey May would have caused Richey May to make reference to the subject matter of the disagreement with its reports on the Company’s financial statements; and (ii) there were no reportable events as described in paragraph (a)(1)(v) of Item 304 of Regulation S-K.
On December 5, 2013, the Company provided Richey May with a copy of the disclosures it is making in response to Item 304 of Regulation S-K, and requested Richey May furnish it with a letter addressed to the Securities and Exchange Commission stating whether it agrees with the above statements. A copy of the letter, dated December 6, 2013, will be filed as Exhibit 16.1 to the Company’s registration statement on Form S-1.
During the years ended December 31, 2012 and 2011 and the subsequent interim period through June 17, 2013, the Company did not consult with KPMG regarding either (i) application of accounting principles to a specified transaction, either completed or proposed, or the type of audit opinion that might be rendered on the Company’s financial statements; or (ii) any matter that was either the subject of a disagreement (as defined in paragraph (a)(1)(iv) of Item 304 of Regulation S-K and the related instructions thereto) or a “reportable event” (as defined in Paragraph (a)(1)(v) of Item 304 of Regulation S-K).
-194-
Table of Contents
WHERE YOU CAN FIND MORE INFORMATION
We have filed with the SEC a registration statement on Form S-1 (including exhibits, schedules, and amendments) under the Securities Act with respect to the shares of common stock offered by this prospectus. This prospectus does not contain all the information set forth in the registration statement. For further information about us and the shares of common stock to be sold in this offering, you should refer to the registration statement. Statements contained in this prospectus relating to the contents of any contract, agreement or other document are not necessarily complete and are qualified in all respects by the complete text of the applicable contract, agreement or other document, a copy of which has been filed as an exhibit to the registration statement. Whenever this prospectus refers to any contract, agreement, or other document, you should refer to the exhibits that are a part of the registration statement for a copy of the contract, agreement, or document.
You may read and copy all or any portion of the registration statement or any other information we file at the SEC’s public reference room at 100 F Street, N.E., Room 1580, Washington, D.C. 20549. You can request copies of these documents, upon payment of a duplicating fee, by writing to the SEC. Please call the SEC at 1-800-SEC-0330 for further information about the operation of the public reference rooms. Our SEC filings, including the registration statement, are also available to you on the SEC’s Website, (http://www.sec.gov).
We are subject to the information and periodic reporting requirements of the Exchange Act. Under the Exchange Act, we must file annual, quarterly and current reports, as well as proxy statements and other information with the SEC. These periodic reports, proxy statements, and other information will be available for inspection and copying at the SEC’s Public Reference Room and the website of the SEC referred to above. We intend to make this information available on the investor relations section of our website, www.stonegatemtg.com. Information on, or accessible through, our website is not part of this prospectus.
-195-
Table of Contents
F-1
Table of Contents
STONEGATE MORTGAGE CORPORATION
CONSOLIDATED BALANCE SHEETS
(Unaudited)
| (In thousands, except share and per share data) | September 30, |
December 31, |
||||||
| Assets |
||||||||
| Cash and cash equivalents |
$ | 24,564 | $ | 15,056 | ||||
| Restricted cash |
20,132 | 3,445 | ||||||
| Mortgage loans held for sale, at fair value |
518,858 | 218,624 | ||||||
| Servicing advances |
1,952 | 938 | ||||||
| Derivative assets |
17,071 | 11,989 | ||||||
| Mortgage servicing rights, at fair value |
132,907 | — | ||||||
| Mortgage servicing rights, at lower of amortized cost or fair value |
— | 42,202 | ||||||
| Property and equipment, net |
7,859 | 4,026 | ||||||
| Intangible assets, net |
3,320 | 3,590 | ||||||
| Investment in closely held entity, at cost |
740 | 740 | ||||||
| Loans eligible for repurchase from GNMA |
13,909 | 7,116 | ||||||
| Notes receivable from stockholders |
— | 222 | ||||||
| Other assets |
7,617 | 1,658 | ||||||
|
|
|
|
|
|||||
| Total assets |
$ | 748,929 | $ | 309,606 | ||||
|
|
|
|
|
|||||
| Liabilities and stockholders’ equity |
||||||||
| Liabilities |
||||||||
| Secured borrowings |
272,610 | 102,675 | ||||||
| Warehouse lines of credit |
194,709 | 100,301 | ||||||
| Operating lines of credit |
4,684 | 5,131 | ||||||
| Accounts payable and accrued expenses |
22,772 | 18,606 | ||||||
| Derivative liabilities |
23,825 | 1,787 | ||||||
| Reserve for mortgage repurchases and indemnifications |
3,202 | 1,917 | ||||||
| Due to related parties |
309 | 348 | ||||||
| Contingent earn-out liability |
2,103 | 2,095 | ||||||
| Liability for loans eligible for repurchase from GNMA |
13,909 | 7,116 | ||||||
| Deferred income tax liabilities, net |
26,868 | 14,381 | ||||||
|
|
|
|
|
|||||
| Total liabilities |
$ | 564,991 | $ | 254,357 | ||||
|
|
|
|
|
|||||
| Commitments and contingencies—Note 14 |
||||||||
| Stockholders’ equity |
||||||||
| Preferred stock, without par value, shares authorized—25,000,000; shares issued and outstanding—0 and 8,342,112 |
— | 33,000 | ||||||
| Common stock, par value $0.01, shares authorized—100,000,000; shares issued and outstanding: 17,604,236 and 3,464,798 |
176 | 28 | ||||||
| Treasury stock, at cost—591,554 and 630,699 shares |
(1,707 | ) | (1,820 | ) | ||||
| Additional paid-in capital |
144,127 | 3,205 | ||||||
| Retained earnings |
41,342 | 20,836 | ||||||
|
|
|
|
|
|||||
| Total stockholders’ equity |
183,938 | 55,249 | ||||||
|
|
|
|
|
|||||
| Total liabilities and stockholders’ equity |
$ | 748,929 | $ | 309,606 | ||||
|
|
|
|
|
|||||
See accompanying notes to the unaudited consolidated financial statements.
F-2
Table of Contents
STONEGATE MORTGAGE CORPORATION
CONSOLIDATED STATEMENTS OF INCOME
(Unaudited)
| (In thousands, except per share data) | Three Months Ended |
Nine Months Ended |
||||||||||||||
| 2013 |
2012 |
2013 |
2012 |
|||||||||||||
| Revenues |
||||||||||||||||
| Gains on mortgage loans held for sale |
$ | 13,216 | 24,240 | 63,791 | $ | 47,709 | ||||||||||
| Changes in mortgage servicing rights valuation |
2,099 | — | 11,649 | — | ||||||||||||
| Loan origination and other loan fees |
5,640 | 2,919 | 15,638 | 6,266 | ||||||||||||
| Loan servicing fees |
5,966 | 1,504 | 14,324 | 3,728 | ||||||||||||
| Interest income |
5,359 | 1,574 | 11,106 | 3,158 | ||||||||||||
| Other revenue |
— | 1,172 | — | 1,172 | ||||||||||||
|
|
|
|
|
|
|
|
|
|||||||||
| Total revenues |
32,280 | 31,409 | 116,508 | 62,033 | ||||||||||||
| Expenses |
||||||||||||||||
| Salaries, commissions and benefits |
16,477 | 9,160 | 48,604 | 21,202 | ||||||||||||
| General and administrative expense |
6,131 | 1,913 | 15,026 | 4,429 | ||||||||||||
| Interest expense |
3,297 | 1,798 | 10,972 | 3,734 | ||||||||||||
| Occupancy, equipment and communication |
2,980 | 676 | 6,103 | 1,726 | ||||||||||||
| Impairment of mortgage servicing rights |
— | 695 | — | 5,522 | ||||||||||||
| Amortization of mortgage servicing rights |
— | 1,171 | — | 2,584 | ||||||||||||
| Provision for mortgage repurchases and indemnifications |
414 | 525 | 1,379 | 826 | ||||||||||||
| Depreciation and amortization expense |
466 | 180 | 1,379 | 456 | ||||||||||||
| Loss on disposal of property and equipment |
25 | — | 25 | — | ||||||||||||
|
|
|
|
|
|
|
|
|
|||||||||
| Total expenses |
29,790 | 16,118 | 83,488 | 40,479 | ||||||||||||
|
|
|
|
|
|
|
|
|
|||||||||
| Income before income tax expense |
2,490 | 15,291 | 33,020 | 21,554 | ||||||||||||
| Income tax expense |
807 | 5,825 | 12,487 | 8,210 | ||||||||||||
|
|
|
|
|
|
|
|
|
|||||||||
| Net income |
1,683 | 9,466 | 20,533 | 13,344 | ||||||||||||
| Less: preferred stock dividends |
— | (19 | ) | (27 | ) | (99 | ) | |||||||||
|
|
|
|
|
|
|
|
|
|||||||||
| Net income attributable to common stockholders |
$ | 1,683 | $ | 9,447 | $ | 20,506 | $ | 13,245 | ||||||||
|
|
|
|
|
|
|
|
|
|||||||||
| Earnings per share |
||||||||||||||||
| Basic |
$ | 0.10 | $ | 2.90 | $ | 1.97 | $ | 4.13 | ||||||||
|
|
|
|
|
|
|
|
|
|||||||||
| Diluted |
$ | 0.10 | $ | 1.00 | $ | 1.42 | $ | 1.95 | ||||||||
|
|
|
|
|
|
|
|
|
|||||||||
See accompanying notes to the unaudited consolidated financial statements.
F-3
Table of Contents
STONEGATE MORTGAGE CORPORATION
CONSOLIDATED STATEMENTS OF CHANGES IN STOCKHOLDERS’ EQUITY
(Unaudited)
| (In thousands) | Preferred Stock |
Common Stock |
Treasury |
Additional |
Retained |
Total |
||||||||||||||||||||||||||
| Shares |
Amount |
Shares |
Amount |
|||||||||||||||||||||||||||||
| Balance at December 31, 2012 |
8,342 | $ | 33,000 | 2,834 | $ | 28 | $ | (1,820 | ) | $ | 3,205 | $ | 20,836 | $ | 55,249 | |||||||||||||||||
| Net income |
— | — | — | — | — | — | 20,533 | 20,533 | ||||||||||||||||||||||||
| Stock option expense |
— | — | — | — | — | 1,615 | — | 1,615 | ||||||||||||||||||||||||
| Issuance of stock warrant |
— | — | — | — | — | 1,522 | — | 1,522 | ||||||||||||||||||||||||
| Issuance of common stock under discretionary incentive plan |
— | — | 39 | — | 113 | 325 | — | 438 | ||||||||||||||||||||||||
| Preferred stock dividends |
— | — | — | — | — | — | (27 | ) | (27 | ) | ||||||||||||||||||||||
| Conversion of preferred stock to common stock |
(8,342 | ) | (33,000 | ) | 8,342 | 84 | — | 32,916 | — | — | ||||||||||||||||||||||
| Issuance of common stock under Rule 144A offering, net of initial purchaser’s discount, placement fee and equity issuance costs |
— | — | 6,389 | 64 | — | 104,544 | — | 104,608 | ||||||||||||||||||||||||
|
|
|
|
|
|
|
|
|
|
|
|
|
|
|
|
|
|||||||||||||||||
| Balance at September 30, 2013 |
— | $ | — | 17,604 | $ | 176 | $ | (1,707 | ) | $ | 144,127 | $ | 41,342 | $ | 183,938 | |||||||||||||||||
|
|
|
|
|
|
|
|
|
|
|
|
|
|
|
|
|
|||||||||||||||||
| Balance at December 31, 2011 |
693 | $ | 2,500 | 3,057 | $ | 31 | $ | — | $ | 4,015 | $ | 3,869 | $ | 10,415 | ||||||||||||||||||
| Net income |
— | — | — | — | — | — | 13,344 | 13,344 | ||||||||||||||||||||||||
| Stock option expense |
— | — | — | — | — | 7 | — | 7 | ||||||||||||||||||||||||
| Preferred stock dividends |
— | — | — | — | — | — | (99 | ) | (99 | ) | ||||||||||||||||||||||
| Issuance of common stock |
— | — | 408 | 4 | — | 996 | 1,000 | |||||||||||||||||||||||||
| Issuance of Series D preferred stock, net of underwriting costs |
6,049 | 24,000 | — | — | — | (1,638 | ) | — | 22,362 | |||||||||||||||||||||||
| Redemption of Series A preferred stock |
(416 | ) | (1,500 | ) | (1,500 | ) | ||||||||||||||||||||||||||
| Purchases of treasury stock |
— | — | (315 | ) | — | (910 | ) | — | — | (910 | ) | |||||||||||||||||||||
|
|
|
|
|
|
|
|
|
|
|
|
|
|
|
|
|
|||||||||||||||||
| Balance at September 30, 2012 |
6,326 | $ | 25,000 | 3,150 | $ | 35 | $ | (910 | ) | $ | 3,380 | $ | 17,114 | $ | 44,619 | |||||||||||||||||
|
|
|
|
|
|
|
|
|
|
|
|
|
|
|
|
|
|||||||||||||||||
See accompanying notes to the unaudited consolidated financial statements.
F-4
Table of Contents
STONEGATE MORTGAGE CORPORATION
CONSOLIDATED STATEMENTS OF CASH FLOWS
(Unaudited)
| (In thousands) | Nine Months Ended September 30, |
|||||||
| 2013 |
2012 |
|||||||
| Operating activities |
||||||||
| Net income |
$ | 20,533 | $ | 13,344 | ||||
| Adjustments to reconcile net income to net cash used in operating activities: |
||||||||
| Depreciation and amortization expense |
1,379 | 456 | ||||||
| Loss on disposal of property and equipment |
25 | — | ||||||
| Bargain purchase gain |
— | (1,172 | ) | |||||
| Amortization of debt discount |
1,522 | — | ||||||
| Foregiveness of note receivable from stockholder |
214 | — | ||||||
| Gains on mortgage loans held for sale |
(63,791 | ) | (47,709 | ) | ||||
| Amortization of mortgage servicing rights |
— | 2,584 | ||||||
| Impairment of mortgage servicing rights |
— | 5,522 | ||||||
| Changes in mortgage servicing rights valuation |
(11,649 | ) | — | |||||
| Provision for reserve for mortgage repurchases and indemnifications |
1,379 | 826 | ||||||
| Stock-based compensation expense |
1,742 | 7 | ||||||
| Deferred income tax expense |
12,487 | 8,211 | ||||||
| Change in contingent earn-out liability |
8 | — | ||||||
| Proceeds from sales and principal payments of mortgage loans held for sale |
6,026,889 | 1,903,842 | ||||||
| Originations and purchases of mortgage loans held for sale |
(6,325,203 | ) | (2,050,307 | ) | ||||
| Repurchases and indemnifications of previously sold loans |
(322 | ) | — | |||||
| Changes in operating assets and liabilities: |
||||||||
| Restricted cash |
(16,687 | ) | (8,625 | ) | ||||
| Servicing advances |
(1,014 | ) | (203 | ) | ||||
| Other assets |
(5,959 | ) | (111 | ) | ||||
| Accounts payable and accrued expenses |
4,491 | 7,178 | ||||||
| Due to related parties |
(39 | ) | 181 | |||||
|
|
|
|
|
|||||
| Net cash used in operating activities |
(353,995 | ) | (165,976 | ) | ||||
| Investing activities |
||||||||
| Purchases of property and equipment |
(4,967 | ) | (1,117 | ) | ||||
| Purchase of assets in a business combination |
— | (512 | ) | |||||
| Repayment of notes receivable from stockholder |
8 | (19 | ) | |||||
|
|
|
|
|
|||||
| Net cash used in investing activities |
(4,959 | ) | (1,648 | ) | ||||
| Financing activities |
||||||||
| Proceeds from borrowings under mortgage funding arrangements and operating lines of credit |
13,932,187 | — | ||||||
| Repayments of borrowings under mortgage funding arrangements and operating lines of credit |
(13,668,292 | ) | — | |||||
| Net proceeds from borrowings under mortgage funding arrangements and operating lines of credit |
— | 148,850 | ||||||
| Proceeds from borrowing from stockholder |
10,000 | — | ||||||
| Repayment of borrowing from stockholder |
(4,345 | ) | — | |||||
| Repayment of borrowing of subordinated debt |
— | (750 | ) | |||||
| Payments of capital lease obligations |
(14 | ) | — | |||||
| Net proceeds from issuance of common stock |
101,645 | 1,000 | ||||||
| Proceeds from issuance of preferred stock |
— | 24,000 | ||||||
| Payment for redemption of preferred stock |
— | (1,500 | ) | |||||
| Purchase of treasury stock |
— | (910 | ) | |||||
| Payment of equity issuance costs |
(2,692 | ) | (1,638 | ) | ||||
| Preferred stock dividends |
(27 | ) | (99 | ) | ||||
|
|
|
|
|
|||||
| Net cash provided by financing activities |
368,462 | 168,953 | ||||||
|
|
|
|
|
|||||
| Change in cash and cash equivalents |
9,508 | 1,329 | ||||||
| Cash and cash equivalents at beginning of period |
15,056 | 403 | ||||||
|
|
|
|
|
|||||
| Cash and cash equivalents at end of period |
$ | 24,564 | $ | 1,732 | ||||
|
|
|
|
|
|||||
See accompanying notes to the unaudited consolidated financial statements.
F-5
Table of Contents
STONEGATE MORTGAGE CORPORATION
NOTES TO UNAUDITED CONSOLIDATED FINANCIAL STATEMENTS
SEPTEMBER 30, 2013
(In Thousands, Except Share and Per Share Data or As Otherwise Stated Herein)
1. Organization and Operations
References to the terms “we”, “our”, “us”, “Stonegate” or the “Company” used throughout these Notes to Unaudited Consolidated Financial Statements refer to Stonegate Mortgage Corporation and, unless the context otherwise requires, its wholly-owned subsidiary, NattyMac, LLC (“NattyMac”), an Indiana limited liability company established in June 2013. The Company was initially incorporated in the State of Indiana in January 2005. As a result of an acquisition and subsequent merger with Swain Mortgage Company in 2009, the Company is now an Ohio corporation. The Company’s headquarters is in Indianapolis, Indiana.
The Company is a specialty financial services firm focused on the U.S. residential mortgage market. The Company originates, acquires, sells, finances and services residential mortgage loans. The Company predominantly sells mortgage loans to the Federal National Mortgage Association (“Fannie Mae” or “FNMA”), to the Federal Home Loan Mortgage Corporation (“Freddie Mac” or “FHLMC”) and in Government National Mortgage Association (“Ginnie Mae” or “GNMA”) pools of mortgage backed securities (“MBS”). Both FNMA and FHLMC are considered government-sponsored enterprises (“GSEs”). The Company’s integrated and scalable residential mortgage banking platform enables us to efficiently and effectively originate, acquire, sell, finance and service residential mortgage loans. The Company’s platform and operating model provides its constituents visibility and access to essential data, documents and analytics related to the loan and originator performance over time. The Company’s principal sources of revenue include (i) gain on sale of mortgage loans from loan securitizations and whole loan sales, and fee income from originations, (ii) fee income from loan servicing, and (iii) fee and net interest income from its financing facilities.
2. Basis of Presentation
The accompanying unaudited consolidated financial statements include the accounts of Stonegate and its subsidiary, NattyMac, and have been prepared in conformity with U.S. generally accepted accounting principles (“GAAP”) for interim financial information and in accordance with the instructions to Form 10-Q and Article 10 of Regulation S-X as promulgated by the Securities and Exchange Commission. Accordingly, they do not include all of the information and footnotes required by GAAP for complete financial statements. The Company has omitted certain financial disclosures that would substantially duplicate the disclosures in its audited consolidated financial statements as of and for the six months ended June 30, 2013 and as of and for the year ended December 31, 2012, unless the information contained in those disclosures materially changed or is required by GAAP. In the opinion of management, all adjustments, including normal recurring adjustments, necessary for a fair statement of the consolidated financial statements as of and for the three and nine months ended September 30, 2013 and 2012 have been recorded. All intercompany accounts and transactions have been eliminated in consolidation. The results of operations for the three and nine months ended September 30, 2013 are not necessarily indicative of the results that may be expected for the full year ending December 31, 2013. These unaudited consolidated financial statements should be read in conjunction with the Company’s audited consolidated financial statements as of and for the six months ended June 30, 2013 and as of and for the year ended December 31, 2012 included in the Company’s final prospectus dated October 9, 2013.
In the normal course of business, companies in the mortgage banking industry encounter certain economic and regulatory risks. Economic risks include interest rate risk and credit risk. The Company is subject to interest rate risk to the extent that in a rising interest rate environment, the Company may experience a decrease in loan production, as well as decreases in the value of mortgage loans held for sale and in commitments to originate loans, which may negatively impact the Company’s operations. Conversely, in a decreasing interest
F-6
Table of Contents
STONEGATE MORTGAGE CORPORATION
NOTES TO UNAUDITED CONSOLIDATED FINANCIAL STATEMENTS
SEPTEMBER 30, 2013
(In Thousands, Except Share and Per Share Data or As Otherwise Stated Herein)
2. Basis of Presentation (Continued)
rate environment, the value of the Company’s mortgage servicing rights (“MSRs”) may decrease, which could negatively impact the Company’s operations. Credit risk is the risk of default that may result from the borrowers’ inability or unwillingness to make contractually required payments during the period in which loans are being held for sale.
As of September 30, 2013, the Company did not have any off-balance sheet arrangements.
On May 14, 2013, the Company granted a stock dividend of 12.861519 shares of common stock for each share of common stock held as of that date, which was determined to be in substance a stock split for accounting and financial reporting purposes. All actual share, weighted-average share and per share amounts and all references to stock compensation data and prices of the Company’s common stock have been adjusted to reflect this stock split for all periods presented.
Certain prior period amounts have been reclassified to conform to the current period presentation.
3. Earnings Per Share
The following is a reconciliation of net income attributable to common shareholders and a table summarizing the basic and diluted earnings per share calculations for the three and nine months ended September 30, 2013 and 2012:
| Three Months Ended |
Nine Months Ended |
|||||||||||||||
| 2013 |
2012 |
2013 |
2012 |
|||||||||||||
| Net income: |
||||||||||||||||
| Net income |
$ | 1,683 | $ | 9,466 | $ | 20,533 | $ | 13,344 | ||||||||
| Less: Preferred stock dividends |
— | (19 | ) | (27 | ) | (99 | ) | |||||||||
|
|
|
|
|
|
|
|
|
|||||||||
| Net income attributable to common shareholders |
$ | 1,683 | $ | 9,447 | $ | 20,506 | $ | 13,245 | ||||||||
|
|
|
|
|
|
|
|
|
|||||||||
| Weighted average shares outstanding (in thousands): |
||||||||||||||||
| Denominator for basic earnings per share—weighted average common shares outstanding |
17,604 | 3,252 | 10,386 | 3,209 | ||||||||||||
| Effect of dilutive shares—employee and director stock options and convertible preferred stock |
— | 6,202 | 4,080 | 3,567 | ||||||||||||
|
|
|
|
|
|
|
|
|
|||||||||
| Denominator for diluted earnings per share |
17,604 | 9,454 | 14,466 | 6,776 | ||||||||||||
|
|
|
|
|
|
|
|
|
|||||||||
| Earnings per share: |
||||||||||||||||
| Basic |
$ | 0.10 | $ | 2.90 | $ | 1.97 | $ | 4.13 | ||||||||
|
|
|
|
|
|
|
|
|
|||||||||
| Diluted |
$ | 0.10 | $ | 1.00 | $ | 1.42 | $ | 1.95 | ||||||||
|
|
|
|
|
|
|
|
|
|||||||||
During the three and nine months ended September 30, 2013, weighted average shares of 1,817,657 and 1,801,959, respectively, were excluded from the denominator for diluted earnings per share because the shares (which related to stock options and warrants) were anti-dilutive. During the three and nine months ended September 30, 2012, weighted average shares of 156,940 and 112,253, respectively, were excluded from the denominator for diluted earnings per share because the shares (which related to stock options) were anti-dilutive.
F-7
Table of Contents
STONEGATE MORTGAGE CORPORATION
NOTES TO UNAUDITED CONSOLIDATED FINANCIAL STATEMENTS
SEPTEMBER 30, 2013
(In Thousands, Except Share and Per Share Data or As Otherwise Stated Herein)
4. Business Combinations
Pending Acquisition of Wholesale Channel and Retail Assets from Nationstar Mortgage Holdings, Inc.
On November 7, 2013, the Company announced that it had entered into a binding letter of intent to acquire the wholesale lending channel and certain distributed retail assets of Nationstar Mortgage Holdings Inc. (“Nationstar”). The acquisition of Nationstar’s wholesale lending channel and retail assets will compliment the Company’s existing wholesale and retail channels and accelerate its geographic expansion. Pursuant to the terms of the letter of intent, the Company agreed to purchase the assets and offer employment to certain employees associated with these businesses. The purchase price will be the net book value of the fixed assets acquired from Nationstar, which, along with the working capital for the business, will be funded out of our existing cash resources as well as our mortgage participation and warehouse lines of credit arrangements.
Pending Acquisition of Crossline Capital, Inc.
On November 13, 2013 the Company entered into a definitive agreement to acquire Crossline Capital, Inc. (“Crossline”), a California-based mortgage lender that originates, funds, and services residential mortgages. The acquisition of Crossline will allow the Company to increase its origination volume through geographic expansion. Crossline is licensed to originate mortgages in 20 states including Arizona, California, Colorado, Connecticut, Florida, Georgia, Idaho, Maryland, Massachusetts, New Hampshire, New Mexico, North Carolina, Ohio, Oregon, Pennsylvania, Rhode Island, Texas, Utah, Virginia and Washington, and is an approved FNMA Seller Servicer. In addition, it operates two national mortgage origination call centers in Lake Forest, CA and Scottsdale, AZ and also operates retail mortgage origination branches in seven other locations in Southern California.
The purchase price will be based on (i) the estimated book value of Crossline at the closing date (subject to contractual purchase price adjustments) and (ii) the estimated fair value of potential contingent consideration under an earn-out arrangement, which, along with the working capital for the business, will be funded out of our existing cash resources as well as our mortgage participation and warehouse lines of credit arrangements.
Acquisition of Assets from NattyMac, LLC
On August 30, 2012, the Company acquired all rights, title and interest in the assets of the NattyMac, LLC (“NattyMac”) single-family mortgage loan warehousing business. Founded in 1994 in St. Petersburg, FL, NattyMac operated as an independent mortgage warehouse lender focused on financing prime mortgage loans that were committed for purchase by GSEs. NattyMac’s strong reputation in the mortgage banking industry, along with its warehouse financing platform and experienced staff, will complement the Company’s existing business and allow the Company to provide an additional source of funding to its customers.
F-8
Table of Contents
STONEGATE MORTGAGE CORPORATION
NOTES TO UNAUDITED CONSOLIDATED FINANCIAL STATEMENTS
SEPTEMBER 30, 2013
(In Thousands, Except Share and Per Share Data or As Otherwise Stated Herein)
4. Business Combinations (Continued)
Acquisition of Assets from NattyMac, LLC (Continued)
The following table summarizes the total consideration transferred for NattyMac and the fair value of assets acquired on the acquisition date:
| Consideration: |
||||
| Cash consideration |
$ | 512 | ||
| Fair value of contingent consideration |
2,095 | |||
|
|
|
|||
| Total consideration |
2,607 | |||
| Fair value of assets acquired: |
||||
| Identifiable intangible assets |
3,710 | |||
| Property and equipment |
57 | |||
| Other assets |
12 | |||
|
|
|
|||
| Total fair value of assets acquired |
3,779 | |||
|
|
|
|||
| Bargain purchase gain |
$ | 1,172 | ||
|
|
|
|||
| Acquisition-related expenses |
$ | 406 | ||
|
|
|
The acquisition of NattyMac’s assets was determined to be a bargain purchase, as the fair value of the identified assets acquired exceeded the aggregate consideration transferred. Accordingly, the Company recognized a bargain purchase gain which is classified as “Other revenue” in its consolidated results of operations for the three and nine months ended September 30, 2012.
As part of the acquisition of the assets of NattyMac, the Company agreed to pay NattyMac’s sellers a deferred purchase price of $75 (whole dollars) for each mortgage loan funded through the mortgage loan warehousing business acquired from NattyMac. The potential undiscounted amount of all future payments that the Company could be required to make under the contingent consideration arrangement is between $0 and $2,250. There is no expiration date for the fulfillment of the contingent consideration arrangement. The fair value of the contingent consideration arrangement was estimated to be approximately $2,103 and $2,095 as of September 30, 2013 and December 31, 2012, respectively, and was estimated by applying the income approach. The fair value of the contingent consideration as of September 30, 2013 and December 31, 2012 was based on key assumptions including (i) the Company’s revised estimate of the number and timing of mortgage loans to be funded and (ii) discount rates of 5.37% and 5.3%, respectively. The Company’s revised estimated fair value of the contingent earn-out liability of $2,103 as of September 30, 2013 increased from its original acquisition-date estimated fair value of $2,095 primarily due to the estimated timing of mortgage loan fundings from the NattyMac warehousing business. At September 30, 2013, 44 mortgage loans had been funded through NattyMac’s single-family warehousing business and the Company expects that the full amount of contingent consideration will be paid over a 18-month period. The Company made its first contingent consideration payment in the amount of $3 in October 2013 for mortgage loans funded during the three months ended September 30, 2013.
F-9
Table of Contents
STONEGATE MORTGAGE CORPORATION
NOTES TO UNAUDITED CONSOLIDATED FINANCIAL STATEMENTS
SEPTEMBER 30, 2013
(In Thousands, Except Share and Per Share Data or As Otherwise Stated Herein)
5. Derivative Financial Instruments
The Company does not designate any of its derivative instruments as hedges. The following summarizes the Company’s outstanding derivative instruments as of September 30, 2013 and December 31, 2012:
| September 30, 2013: | Fair Value |
|||||||||||||||
| Notional |
Balance Sheet Location |
Asset |
(Liability) |
|||||||||||||
| Interest rate lock commitments |
$ | 1,348,334 | Derivative assets/liabilities | $ | 16,695 | $ | (94 | ) | ||||||||
| MBS forward trades |
1,732,259 | Derivative assets/liabilities | 376 | (23,731 | ) | |||||||||||
|
|
|
|
|
|
|
|||||||||||
| Total derivative financial instruments |
$ | 3,080,593 | $ | 17,071 | $ | (23,825 | ) | |||||||||
|
|
|
|
|
|
|
|||||||||||
| December 31, 2012: | Fair Value |
|||||||||||||||
| Notional |
Balance Sheet Location |
Asset |
(Liability) |
|||||||||||||
| Interest rate lock commitments |
$ | 1,139,963 | Derivative assets/liabilities | $ | 11,989 | $ | — | |||||||||
| MBS forward trades |
967,780 | Derivative assets/liabilities | — | (1,787 | ) | |||||||||||
|
|
|
|
|
|
|
|||||||||||
| Total derivative financial instruments |
$ | 2,107,743 | $ | 11,989 | $ | (1,787 | ) | |||||||||
|
|
|
|
|
|
|
|||||||||||
The following summarizes the effect of the Company’s derivative financial instruments on its consolidated statements of income for the three and nine months ended September 30, 2013 and 2012:
| Derivative (Losses) Gains Recognized |
||||||||||||||||
| Three Months Ended |
Nine Months Ended |
|||||||||||||||
| 2013 |
2012 |
2013 |
2012 |
|||||||||||||
| Interest rate lock commitments |
$ | 30,521 | $ | 11,896 | $ | 4,612 | $ | 18,394 | ||||||||
| MBS forward trades |
(68,794 | ) | (11,698 | ) | (21,568 | ) | (14,279 | ) | ||||||||
|
|
|
|
|
|
|
|
|
|||||||||
| Net derivative (losses) gains1 |
$ | (38,273 | ) | $ | 198 | $ | (16,956 | ) | $ | 4,115 | ||||||
|
|
|
|
|
|
|
|
|
|||||||||
| 1 | All derivative (losses) gains are included within “Gains on mortgage loans held for sale” on the Company’s consolidated statements of income. |
The Company has exposure to credit loss in the event of contractual non-performance by its trading counterparties and counterparties to the over-the-counter derivative financial instruments that the Company uses in its rate risk management activities. The Company manages this credit risk by selecting only counterparties that the Company believes to be financially strong, spreading the credit risk among many such counterparties, by placing contractual limits on the amount of unsecured credit extended to any single counterparty and by entering into netting agreements with the counterparties, as appropriate.
The Company has entered into agreements with derivative counterparties which include netting arrangements whereby the counterparties are entitled to settle their positions on a net basis. In certain circumstances, the Company is required to provide certain derivative counterparties collateral against derivative financial instruments. As of September 30, 2013 and December 31, 2012, counterparties held $20,132 and $3,445, respectively, of the Company’s cash and cash equivalents in margin accounts as collateral (which is classified as “Restricted cash” on the the Company’s consolidated balance sheets), after which the Company was in a net credit loss position of $23,825 and $1,787 at September 30, 2013 and December 31, 2012, respectively, to those counterparties. For the nine months ended September 30, 2013 and 2012, the Company incurred no credit losses due to non-performance of any of its counterparties.
F-10
Table of Contents
STONEGATE MORTGAGE CORPORATION
NOTES TO UNAUDITED CONSOLIDATED FINANCIAL STATEMENTS
SEPTEMBER 30, 2013
(In Thousands, Except Share and Per Share Data or As Otherwise Stated Herein)
6. Mortgage Loans Held for Sale
The following summarizes mortgage loans held for sale at fair value as of September 30, 2013 and December 31, 2012:
| September 30, |
December 31, |
|||||||
| Conventional |
$ | 312,688 | $ | 110,493 | ||||
| Governmental |
204,756 | 108,131 | ||||||
| Non-agency jumbo |
1,414 | — | ||||||
|
|
|
|
|
|||||
| Total mortgage loans held for sale, at fair value |
$ | 518,858 | $ | 218,624 | ||||
|
|
|
|
|
|||||
Under certain of the Company’s mortgage funding arrangements (including secured borrowings and warehouse lines of credit), the Company is required to pledge mortgage loans as collateral to secure borrowings. The mortgage loans pledged as collateral must equal at least 100% of the related outstanding borrowings under the mortgage funding arrangements. The outstanding borrowings are monitored and the Company is required to deliver additional collateral if the amount of the outstanding borrowings exceeds the fair value of the pledged mortgage loans. As of September 30, 2013, the Company had pledged $496,622 in fair value of mortgage loans held for sale as collateral to secure debt under its mortgage funding arrangements, with the remaining $22,236 of mortgage loans held for sale funded with the Company’s excess cash. As of December 31, 2012, the Company had pledged $218,624 in fair value of mortgage loans held for sale as collateral to secure debt under its mortgage funding arrangements. The mortgage loans held as collateral by the respective lenders are restricted solely to satisfy the Company’s borrowings under those mortgage funding arrangements. Refer to Note 10 “Debt” for additional information related to the Company’s outstanding borrowings as of September 30, 2013 and December 31, 2012.
7. Mortgage Servicing Rights
The Company sells residential mortgage loans in the secondary market and typically retains the right to service the loans sold. Upon sale, an MSR asset is capitalized, which represents the current fair value of the future net cash flows expected to be realized for performing servicing activities.
Effective January 1, 2013, the Company elected to irrevocably account for the subsequent measurement of its existing MSRs using the fair value method, whereby the MSRs are initially recorded on our balance sheet at fair value with subsequent changes in fair value recorded in earnings during the period in which the changes in fair value occur. We believe that accounting for the MSRs at fair value best reflects the impact of current market conditions on our MSRs, and our investors and other users of our financial statements will have greater insight into management’s views as to the value of our MSRs at each reporting date. The fair value of the MSRs is assessed at each reporting date using the methods described above. In accordance with the applicable GAAP guidance, this change in accounting principle was accounted for on a prospective basis (financial statement periods prior to 2013 have not been restated). We did not record a cumulative-effect adjustment to retained earnings as of January 1, 2013, as the net amortized carrying value of the MSRs as of January 1, 2013 equaled the fair value due to MSR impairment charges recorded during 2012.
Prior to January 1, 2013, the subsequent measurement of the Company’s MSRs was recorded using the amortization method. Under the amortization method, capitalized MSRs were initially recorded at fair value and
F-11
Table of Contents
STONEGATE MORTGAGE CORPORATION
NOTES TO UNAUDITED CONSOLIDATED FINANCIAL STATEMENTS
SEPTEMBER 30, 2013
(In Thousands, Except Share and Per Share Data or As Otherwise Stated Herein)
7. Mortgage Servicing Rights (Continued)
amortized over the estimated economic life of the related loans in proportion to the estimated future net servicing revenue. The net capitalized cost of MSRs was periodically evaluated to determine whether capitalized amounts were in excess of their estimated fair value. For this fair value assessment, the Company stratified its MSRs based on interest rates: (1) those with note rates below 4.00%; (2) those with note rates between 4.00% and 4.99%; and (3) those with note rates above 5.00%. If the amortized book value of the MSRs exceeded its fair value, management recorded a valuation adjustment as a reduction to the mortgage servicing right asset. However, in the event that the fair value of the MSRs recovered, the valuation allowance was reversed.
On November 1, 2013, the Company purchased an MSR portfolio with an unpaid principal balance (“UPB”) of approximately $142 million from an unrelated third party, for a total cash purchase price of approximately $1.5 million. The MSRs purchased have substantially similar attributes to the Company’s existing MSRs created through its own mortgage loan originations with respect to note rates, credit quality and loan types. The Company plans to continue to service the underlying mortgage loans and will account for the MSRs using the fair value method.
The Company’s total mortgage servicing portfolio at September 30, 2013 and December 31, 2012 is summarized as follows (based on the UPB of the underlying mortgage loans):
| September 30, |
December 31, |
|||||||
| FNMA |
$ | 6,025,898 | $ | 2,781,389 | ||||
| GNMA |
3,654,993 | 1,363,951 | ||||||
| FHLMC |
1,690 | — | ||||||
|
|
|
|
|
|||||
| Total mortgage servicing portfolio |
$ | 9,682,581 | $ | 4,145,340 | ||||
|
|
|
|
|
|||||
| MSRs balance |
$ | 132,907 | $ | 42,202 | ||||
|
|
|
|
|
|||||
| MSRs balance as a percentage of total mortgage servicing portfolio |
1.37 | % | 1.02 | % | ||||
|
|
|
|
|
|||||
A summary of the changes in the balance of MSRs for the three and nine months ended September 30, 2013 and 2012 is as follows:
| Three Months Ended |
Nine Months Ended |
|||||||||||||||
| 2013 |
2012 |
2013 |
2012 |
|||||||||||||
| Balance at beginning of period |
$ | 99,209 | $ | 22,835 | $ | 42,202 | $ | 17,679 | ||||||||
| MSRs received as proceeds from loan sales |
31,599 | 12,290 | 79,056 | 23,686 | ||||||||||||
| Changes in valuation inputs and assumptions |
4,279 | — | 17,797 | — | ||||||||||||
| Actual portfolio runoff (payoffs and principal amortization) |
(2,180 | ) | — | (6,148 | ) | — | ||||||||||
| Amortization of MSRs |
— | (1,171 | ) | — | (2,584 | ) | ||||||||||
| Impairment of MSRs |
— | (695 | ) | — | (5,522 | ) | ||||||||||
|
|
|
|
|
|
|
|
|
|||||||||
| Balance at end of period |
$ | 132,907 | $ | 33,259 | $ | 132,907 | $ | 33,259 | ||||||||
|
|
|
|
|
|
|
|
|
|||||||||
F-12
Table of Contents
STONEGATE MORTGAGE CORPORATION
NOTES TO UNAUDITED CONSOLIDATED FINANCIAL STATEMENTS
SEPTEMBER 30, 2013
(In Thousands, Except Share and Per Share Data or As Otherwise Stated Herein)
7. Mortgage Servicing Rights (Continued)
The following is a summary of the components of loan servicing fees as reported in the Company’s consolidated statements of income for the three and nine months ended September 30, 2013 and 2012:
| Three Months Ended |
Nine Months Ended |
|||||||||||||||
| 2013 |
2012 |
2013 |
2012 |
|||||||||||||
| Contractual servicing fees |
$ | 5,813 | $ | 1,448 | $ | 13,982 | $ | 3,580 | ||||||||
| Late fees |
153 | 56 | 342 | 148 | ||||||||||||
|
|
|
|
|
|
|
|
|
|||||||||
| Loan servicing fees |
$ | 5,966 | $ | 1,504 | $ | 14,324 | $ | 3,728 | ||||||||
|
|
|
|
|
|
|
|
|
|||||||||
8. Fair Value Measurements
The Company uses fair value measurements in fair value disclosures and to record certain assets and liabilities at fair value on a recurring basis, such as MSRs (beginning January 1, 2013), derivatives and loans held for sale, or on a nonrecurring basis, such as when measuring MSRs upon initial recognition and measuring impairments on MSRs (for periods prior to January 1, 2013), intangible assets and long-lived assets. The Company has elected fair value accounting for loans held for sale to more closely align the Company’s accounting with its interest rate risk strategies without having to apply the operational complexities of hedge accounting.
The Company groups its assets and liabilities at fair value in three levels, based on the markets in which the assets and liabilities are traded and the reliability of the assumptions used to determine fair value. These levels are:
| Level Input: |
Input Definition: | |
| Level 1 |
Unadjusted, quoted prices in active markets for identical assets or liabilities. | |
| Level 2 |
Prices determined using other significant observable inputs. Observable inputs are inputs that other market participants would use in pricing an asset or liability and are developed based on market data obtained from sources independent of the Company. These may include quoted prices for similar assets and liabilities, interest rates, prepayment speeds, credit risk and others. | |
| Level 3 |
Prices determined using significant unobservable inputs. In situations where quoted prices or observable inputs are unavailable (for example, when there is little or no market activity), unobservable inputs may be used. Unobservable inputs reflect the Company’s own assumptions about the factors that market participants would use in pricing the asset or liability, and are based on the best information available in the circumstances. | |
An asset or liability’s level within the fair value hierarchy is based on the lowest level of input that is significant to the fair value measurement.
While the Company believes its valuation methods are appropriate and consistent with those used by other market participants, the use of different methods or assumptions to estimate the fair value of certain
F-13
Table of Contents
STONEGATE MORTGAGE CORPORATION
NOTES TO UNAUDITED CONSOLIDATED FINANCIAL STATEMENTS
SEPTEMBER 30, 2013
(In Thousands, Except Share and Per Share Data or As Otherwise Stated Herein)
8. Fair Value Measurements (Continued)
financial statement items could result in a different estimate of fair value at the reporting date. Those estimated values may differ significantly from the values that would have been used had a readily available market for such items existed, or had such items been liquidated, and those differences could be material to the consolidated financial statements.
Management incorporates lack of liquidity into its fair value estimates based on the type of asset or liability measured and the valuation method used. The Company uses discounted cash flow techniques to estimate fair value. These techniques incorporate forecasting of expected cash flows discounted at appropriate market discount rates that are intended to reflect the lack of liquidity in the market.
The following describes the methods used in estimating the fair values of certain financial statement items:
Mortgage Loans Held for Sale: The Company’s mortgage loans held for sale at fair value are saleable into the secondary mortgage markets and their fair values are estimated using quoted market or contracted prices or market price equivalents.
Derivative Financial Instruments: The Company estimates the fair value of interest rate lock commitments based on the value of the underlying mortgage loan, quoted MBS prices and estimates of the fair value of the MSRs and the probability that the mortgage loan will fund within the terms of the interest rate lock commitment. The Company estimates the fair value of forward sales commitments based on quoted MBS prices.
Mortgage Servicing Rights: The Company uses a discounted cash flow approach to estimate the fair value of MSRs. This approach consists of projecting servicing cash flows discounted at a rate that management believes market participants would use in their determinations of value. The key assumptions used in the estimation of the fair value of MSRs include prepayment speeds, discount rates, default rates, cost to service, contractual servicing fees and escrow earnings.
The following are the major categories of assets and liabilities measured at fair value on a recurring basis as of September 30, 2013:
| Level 1 |
Level 2 |
Level 3 |
Total |
|||||||||||||
| Assets: |
||||||||||||||||
| Cash equivalents |
$ | 7,510 | $ | — | $ | — | $ | 7,510 | ||||||||
| Mortgage loans held for sale |
— | 518,858 | — | 518,858 | ||||||||||||
| Derivative assets (IRLCs) |
— | 16,695 | — | 16,695 | ||||||||||||
| Derivative assets (MBS forward trades) |
— | 376 | — | 376 | ||||||||||||
| MSRs |
— | — | 132,907 | 132,907 | ||||||||||||
|
|
|
|
|
|
|
|
|
|||||||||
| Total assets |
$ | 7,510 | $ | 535,929 | $ | 132,907 | $ | 676,346 | ||||||||
|
|
|
|
|
|
|
|
|
|||||||||
| Liabilities: |
||||||||||||||||
| Derivative liabilities (IRLCs) |
— | 94 | — | 94 | ||||||||||||
| Derivative liabilities (MBS forward trades) |
— | 23,731 | — | 23,731 | ||||||||||||
| Contingent earn-out liability |
— | — | 2,103 | 2,103 | ||||||||||||
|
|
|
|
|
|
|
|
|
|||||||||
| Total liabilities |
$ | — | $ | 23,825 | $ | 2,103 | $ | 25,928 | ||||||||
|
|
|
|
|
|
|
|
|
|||||||||
F-14
Table of Contents
STONEGATE MORTGAGE CORPORATION
NOTES TO UNAUDITED CONSOLIDATED FINANCIAL STATEMENTS
SEPTEMBER 30, 2013
(In Thousands, Except Share and Per Share Data or As Otherwise Stated Herein)
8. Fair Value Measurements (Continued)
The following are the major categories of assets and liabilities measured at fair value on a recurring basis as of December 31, 2012:
| Level 1 |
Level 2 |
Level 3 |
Total |
|||||||||||||
| Assets: |
||||||||||||||||
| Cash equivalents |
$ | 10,957 | $ | — | $ | — | $ | 10,957 | ||||||||
| Mortgage loans held for sale |
— | 218,624 | — | 218,624 | ||||||||||||
| Derivative assets (IRLCs) |
— | 11,989 | — | 11,989 | ||||||||||||
|
|
|
|
|
|
|
|
|
|||||||||
| Total assets |
$ | 10,957 | $ | 230,613 | $ | — | $ | 241,570 | ||||||||
|
|
|
|
|
|
|
|
|
|||||||||
| Liabilities: |
||||||||||||||||
| Derivative liabilties (MBS forward trades) |
— | 1,787 | — | 1,787 | ||||||||||||
| Contingent earn-out liability |
— | — | 2,095 | 2,095 | ||||||||||||
|
|
|
|
|
|
|
|
|
|||||||||
| Total liabilities |
$ | — | $ | 1,787 | $ | 2,095 | $ | 3,882 | ||||||||
|
|
|
|
|
|
|
|
|
|||||||||
Mortgage loans held for sale are carried at estimated fair value pursuant to the fair value option. Gains from changes in estimated fair values and are included in “Gains on mortgage loans held for sale” on the Company’s consolidated statements of income and amounted to $22,199 and $5,606, respectively, for the three and nine months ended September 30, 2013. Gains from changes in estimated fair values amounted to $5,353 and $7,363, respectively, for the three and nine months ended September 30, 2012.
The following are the fair values and related UPB due upon maturity for loans held for sale accounted under the fair value option as of September 30, 2013 and December 31, 2012:
| September 30, 2013 |
December 31, 2012 |
|||||||||||||||
| Fair Value |
UPB |
Fair Value |
UPB |
|||||||||||||
| Current through 89 days delinquent |
$ | 518,163 | $ | 494,220 | $ | 218,556 | $ | 212,693 | ||||||||
| 90 or more days delinquent |
695 | 905 | 68 | 68 | ||||||||||||
|
|
|
|
|
|
|
|
|
|||||||||
| Total |
$ | 518,858 | $ | 495,125 | $ | 218,624 | $ | 212,761 | ||||||||
|
|
|
|
|
|
|
|
|
|||||||||
F-15
Table of Contents
STONEGATE MORTGAGE CORPORATION
NOTES TO UNAUDITED CONSOLIDATED FINANCIAL STATEMENTS
SEPTEMBER 30, 2013
(In Thousands, Except Share and Per Share Data or As Otherwise Stated Herein)
8. Fair Value Measurements (Continued)
A reconciliation of the beginning and ending balances of the Company’s assets (MSRs) measured at fair value on a recurring basis using Level 3 inputs during the three and nine months ended September 30, 2013 is as follows:
| Three Months |
Nine Months |
|||||||
| Balance at beginning of period |
$ | 99,209 | $ | 42,202 | ||||
| Changes in fair value recognized in earnings1 |
2,099 | 11,649 | ||||||
| Purchases |
— | — | ||||||
| Sales |
— | — | ||||||
| Issuances |
31,599 | 79,056 | ||||||
| Settlements |
— | — | ||||||
| Transfers into Level 3 |
— | — | ||||||
| Transfers out of Level 3 |
— | — | ||||||
|
|
|
|
|
|||||
| Balance at end of period |
$ | 132,907 | $ | 132,907 | ||||
|
|
|
|
|
|||||
| Changes in fair value recognized in net income during the |
$ | 2,099 | $ | 11,649 | ||||
|
|
|
|
|
|||||
| 1 | Recognized in the consolidated statements of income within “Changes in mortgage servicing rights valuation” |
A reconciliation of the beginning and ending balances of the Company’s liability (contingent earn-out liability) measured at fair value on a recurring basis using Level 3 inputs for the three and nine months ended September 30, 2013 and 2012 is as follows:
| Three Months Ended September 30, |
Nine Months Ended September 30, |
|||||||||||||||
| 2013 | 2012 | 2013 | 2012 | |||||||||||||
| Balance at beginning of period |
$ | 2,160 | $ | — | $ | 2,095 | $ | — | ||||||||
| Changes in fair value recognized in earnings1 |
(57 | ) | — | 8 | — | |||||||||||
| Purchases2 |
— | 2,095 | — | 2,095 | ||||||||||||
| Sales |
— | — | — | — | ||||||||||||
| Issuances |
— | — | — | — | ||||||||||||
| Settlements |
— | — | — | — | ||||||||||||
| Transfers into Level 3 |
— | — | — | — | ||||||||||||
| Transfers out of Level 3 |
— | — | — | — | ||||||||||||
|
|
|
|
|
|
|
|
|
|||||||||
| Balance at end of period |
$ | 2,103 | $ | 2,095 | $ | 2,103 | $ | 2,095 | ||||||||
|
|
|
|
|
|
|
|
|
|||||||||
| 1 | Recognized in the consolidated statements of income within “General and administrative expense” |
| 2 | Contingent earn-out liability resulted from the Company’s purchase of assets from NattyMac during August 2012. See Note 4 “Business Combinations” for additional information related to business combination and contingent consideration arrangement. |
Transfers between levels, if any, are recorded as of the beginning of the reporting period. During the three and nine months ended September 30, 2013 and 2012, there were no transfers between levels.
F-16
Table of Contents
STONEGATE MORTGAGE CORPORATION
NOTES TO UNAUDITED CONSOLIDATED FINANCIAL STATEMENTS
SEPTEMBER 30, 2013
(In Thousands, Except Share and Per Share Data or As Otherwise Stated Herein)
8. Fair Value Measurements (Continued)
Fair Value of Other Financial Instruments
As of September 30, 2013 and December 31, 2012, all financial instruments were either recorded at fair value or the carrying value approximated fair value. For financial instruments that were not recorded at fair value, such as cash, restricted cash, servicing advances, secured borrowings, warehouse and operating lines of credit, accounts payable and accrued expenses, their carrying values approximated fair value due to the short-term nature of such instruments.
9. Transfers and Servicing of Financial Assets
Residential mortgage loans are sold to FNMA or FHLMC or transferred into pools of GNMA MBS. The Company has continuing involvement in mortgage loans sold through servicing arrangements and the liability for loan indemnifications and repurchases under the representation and warranties it makes to the investors and insurers of the loans it sells. The Company is exposed to interest rate risk through its continuing involvement with mortgage loans sold, including the MSRs, as the value of the asset fluctuates as changes in interest rates impact borrower prepayment.
All loans are sold on a non-recourse basis; however, representations and warranties have been made that are customary for loan sale transactions, including eligibility characteristics of the mortgage loans and underwriting responsibilities, in connection with the sales of these assets.
In order to facilitate the origination and sale of mortgage loans held for sale, the Company entered into various agreements with warehouse lenders. Such agreements are in the form of loan participations and repurchase agreements with banks and other financial institutions. Mortgage loans held for sale are considered sold when the Company surrenders control over the financial assets and such financial assets are legally isolated from the Company in the event of bankruptcy. For loan participations and repurchase agreements that meet the sale criteria, the transferred financial assets are derecognized from the balance sheet and a gain or loss is recognized upon sale. If the sale criteria are not met, the transfer is recorded as a secured borrowing in which the assets remain on the balance sheet and the proceeds from the transaction are recognized as a liability. All repurchase agreements are accounted for by the Company as secured borrowings.
From time to time, the Company may sell loans whereby the underlying risks and cash flows of the mortgage loan have been transferred to a third party through the issuance of participating interests. The terms and conditions of these interests are governed by the participation agreements. In the instances where the loan participation has qualified for sale treatment, the Company will act as an agent on behalf of the participating entity when negotiating the terms of the ultimate sale of the underlying mortgage loans to FNMA, FHLMC or into pools of GNMA MBS. The Company will receive a marketing fee paid by the participating entity upon completion of the sale. In addition, the Company will also service the underlying mortgage loans to the participation agreement for the period that the participating interests are outstanding. As of September 30, 2013 and 2012 all participation arrangements were accounted for by the Company as secured borrowings.
F-17
Table of Contents
STONEGATE MORTGAGE CORPORATION
NOTES TO UNAUDITED CONSOLIDATED FINANCIAL STATEMENTS
SEPTEMBER 30, 2013
(In Thousands, Except Share and Per Share Data or As Otherwise Stated Herein)
9. Transfers and Servicing of Financial Assets (Continued)
The following table sets forth information regarding cash flows for the nine months ended September 30, 2013 and 2012 relating to loan sales in which the Company has continuing involvement:
| September 30, |
||||||||
| 2013 |
2012 |
|||||||
| Proceeds from new loan sales |
$ | 5,984 | $ | 28,392 | ||||
| Proceeds from loan servicing fees |
$ | 14,017 | $ | 6,229 | ||||
| Proceeds from servicing advances |
$ | 704 | $ | 591 | ||||
| Repurchases and indemnifications of previously sold loans |
$ | (322 | ) | $ | — | |||
The following table sets forth information related to outstanding loans sold as of September 30, 2013 and December 31, 2012 for which the Company has continuing involvement:
| September 30, |
December 31, |
|||||||
| Total unpaid principal balance |
$ | 9,682,581 | $ | 4,145,340 | ||||
| Loans 30-89 days delinquent |
$ | 133,343 | $ | 61,076 | ||||
| Loans delinquent 90 or more days or in foreclosure |
$ | 26,130 | $ | 11,350 | ||||
The key assumptions (or range of assumptions) used in determining the fair value of the Company’s MSRs as of September 30, 2013 and December 31, 2012 are as follows:
| September 30, 2013 |
December 31, 2012 |
|||||||
| Discount rates |
9.25% - 11.00 | % | 9.25% - 11.00 | % | ||||
| Annual prepayment speeds (by investor type): |
||||||||
| Purchased FNMA1 |
15.4 | % | 31.8 | % | ||||
| FNMA |
7.8 | % | 12.0 | % | ||||
| GNMA I |
8.1 | % | 15.0 | % | ||||
| GNMA II |
7.5 | % | 10.8 | % | ||||
| FHLMC |
7.8 | % | N/A | |||||
| Cost of servicing (per loan) |
$ | 74 | $ | 73 | ||||
| 1 | Represents older, higher interest rate loans acquired from the Company’s merger with Swain in 2009. |
The key assumptions (or range of assumptions) used in determining the fair value of the Company’s MSRs at initial recognition during the three and nine months ended September 30, 2013 and 2012 are as follows:
| Three Months Ended September 30 |
Nine Months Ended September 30 |
|||||||||||||||
| 2013 |
2012 |
2013 |
2012 |
|||||||||||||
| Discount rates |
9.25% - 11.00 | % | 8.00% - 11.00 | % | 9.25% - 11.00 | % | 8.00% - 11.00 | % | ||||||||
| Annual prepayment speeds (by investor type): |
||||||||||||||||
| Purchased FNMA1 |
14.7% - 16.6 | % | 27.9% - 29.4 | % | 14.7% - 28.0 | % | 16.8% - 29.4 | % | ||||||||
| FNMA |
8.1% - 8.2 | % | 11.5% - 14.3 | % | 8.1% - 10.4 | % | 6.0% - 13.2 | % | ||||||||
| GNMA I |
8.0% - 8.1 | % | 11.2% - 13.4 | % | 8.0% - 12.9 | % | 6.7% - 13.4 | % | ||||||||
| GNMA II |
7.4% - 7.6 | % | 8.7% - 10.9 | % | 7.4% - 9.3 | % | 6.0% - 11.3 | % | ||||||||
| FHLMC |
7.8 | % | N/A | 7.8 | % | N/A | ||||||||||
| Cost of servicing (per loan) |
$ | 74 | $ | 70 | $ | 73 - $74 | $ | 70 - $90 | ||||||||
| 1 | Represents older, higher interest rate loans acquired from the Company’s merger with Swain in 2009. |
F-18
Table of Contents
STONEGATE MORTGAGE CORPORATION
NOTES TO UNAUDITED CONSOLIDATED FINANCIAL STATEMENTS
SEPTEMBER 30, 2013
(In Thousands, Except Share and Per Share Data or As Otherwise Stated Herein)
9. Transfers and Servicing of Financial Assets (Continued)
MSRs are generally subject to loss in value when mortgage rates decrease. Decreasing mortgage rates normally encourage increased mortgage refinancing activity. Increased refinancing activity reduces the life of the loans underlying the MSRs, thereby reducing MSR value. Reductions in the value of MSRs affect income through changes in fair value. These factors have been considered in the estimated prepayment speed assumptions used to determine the fair value of the Company’s MSRs.
In addition to the assumptions provided above, the Company uses assumptions for default rates in determining the fair value of MSRs. These assumptions are based primarily on internal estimates, and the Company also obtains third-party data, where applicable, to assess the reasonableness of its internal assumptions. In the MSRs valuation as of September 30, 2013, the Company’s assumptions for default rates for FNMA, GNMA and FHLMC mortgage loans were 3.94%, 6.41% and 3.83%, respectively. In the MSRs valuation as of December 31, 2012, the Company’s assumptions for default rates for FNMA and GNMA were 2.37%, and 5.41%, respectively (there were no MSRs related to FHLMC mortgage loans as of December 31, 2012). The default rates represent the Company’s estimate of the loans will eventually enter foreclosure proceedings over the entire term of the portfolio’s life. These assumptions affect the future cost to service loans, future revenue earned from the portfolio, and future assumed foreclosure losses. Because the Company’s portfolio is generally comprised of recent vintages, actual future defaults may differ from the Company’s assumptions.
The hypothetical effect of an adverse change in these key assumptions would result in a decrease in fair values as follows as of September 30, 2013 and December 31, 2012:
| September 30, |
December 31, |
|||||||
| Discount rates: |
||||||||
| Impact of discount rate + 1% |
$ | (6,737 | ) | $ | (2,071 | ) | ||
| Impact of discount rate + 2% |
$ | (12,876 | ) | $ | (3,953 | ) | ||
| Impact of discount rate + 3% |
$ | (18,488 | ) | $ | (5,671 | ) | ||
| Prepayment speeds: |
||||||||
| Impact of prepayment speed * 105% |
$ | (2,777 | ) | $ | (1,278 | ) | ||
| Impact of prepayment speed * 110% |
$ | (5,465 | ) | $ | (2,505 | ) | ||
| Impact of prepayment speed * 120% |
$ | (10,591 | ) | $ | (4,819 | ) | ||
| Cost of servicing: |
||||||||
| Impact of cost of servicing * 105% |
$ | (947 | ) | $ | (415 | ) | ||
| Impact of cost of servicing * 110% |
$ | (1,894 | ) | $ | (830 | ) | ||
| Impact of cost of servicing * 120% |
$ | (3,789 | ) | $ | (1,659 | ) | ||
As the table demonstrates, the Company’s methodology for estimating the fair value of MSRs is highly sensitive to changes in assumptions. For example, actual prepayment experience may differ and any difference may have a material effect on MSR fair value. Changes in fair value resulting from changes in assumptions generally cannot be extrapolated because the relationship of the change in assumption to the change in fair value may not be linear. Also, in this table, the effect of a variation in a particular assumption on the fair value of the MSRs is calculated without changing any other assumption; in reality, changes in one factor may be associated with changes in another (for example, decreases in market interest rates may indicate higher prepayments; however, this may be partially offset by lower prepayments due to other factors such as a borrower’s diminished
F-19
Table of Contents
STONEGATE MORTGAGE CORPORATION
NOTES TO UNAUDITED CONSOLIDATED FINANCIAL STATEMENTS
SEPTEMBER 30, 2013
(In Thousands, Except Share and Per Share Data or As Otherwise Stated Herein)
9. Transfers and Servicing of Financial Assets (Continued)
opportunity to refinance), which may magnify or counteract the sensitivities. Thus, any measurement of MSR fair value is limited by the conditions existing and assumptions made as of a particular point in time. Those assumptions may not be appropriate if they are applied to a different point in time.
10. Debt
Short-term borrowings outstanding as of September 30, 2013 and December 31, 2012 are as follows:
| September 30, 2013 |
December 31, 2012 |
|||||||||||||||
| Amount |
Weighted |
Amount |
Weighted |
|||||||||||||
| Secured borrowings |
$ | 272,610 | 2.65 | % | $ | 102,675 | 3.35 | % | ||||||||
| Warehouse lines of credit |
194,709 | 2.33 | % | 100,301 | 2.59 | % | ||||||||||
| Operating lines of credit |
4,684 | 4.04 | % | 5,131 | 4.17 | % | ||||||||||
|
|
|
|
|
|||||||||||||
| Total short-term borrowings |
$ | 472,003 | $ | 208,107 | ||||||||||||
|
|
|
|
|
|||||||||||||
The Company maintains mortgage participation and warehouse lines of credit arrangements (collectively referred to as “mortgage funding arrangements”) with various financial institutions, primarily to fund the origination of mortgage loans which are subject to participation. As of September 30, 2013 the Company held mortgage funding arrangements with 5 separate financial institutions and a total maximum borrowing capacity of $972,000. Each mortgage funding arrangement is collateralized by the underlying mortgage loans.
The following table summarizes the amounts outstanding, interest rates and maturity dates under the Company’s various mortgage funding arrangements as of September 30, 2013:
| Mortgage Funding Arrangements |
Amount |
Interest Rate |
Maturity Date | |||||
| Merchants Bank of Indiana |
$ | 273,807 | Same as the underlying mortgage rates, less contractual service fee/prime plus 1.00% | June 2014 | ||||
| Barclays Bank PLC |
127,068 | LIBOR plus applicable margin | December 2013 | |||||
| Bank of Virginia |
— | Same as the underlying mortgage rates | November 2013 | |||||
| Bank of America, N.A. |
66,444 | LIBOR plus applicable margin | February 2014 | |||||
| Merit Bank |
— | Same as the underlying mortgage rates | Not Specified | |||||
|
|
|
|||||||
| Total |
$ | 467,319 | ||||||
|
|
|
|||||||
The Company intends to renew the mortgage funding arrangements when they mature and has no reason to believe the Company will be unable to do so.
On March 29, 2013, the Company entered into a Secured Term Promissory Note agreement (the “Note”) with a stockholder to borrow $10,000. The Note was scheduled to mature on September 30, 2013 and beared interest at 5.00% (compounded monthly), through May 31, 2013, and thereafter at an interest rate of 12.50% (compounded monthly). The Note was repaid in full on May 15, 2013 with $4,345 of cash and 314,147 shares of the Company’s common stock, at a per share price of $18.00, totaling $5,655 issued under the Company’s private equity offering were sent directly to the stockholder for the remaining balance on the Note.
F-20
Table of Contents
STONEGATE MORTGAGE CORPORATION
NOTES TO UNAUDITED CONSOLIDATED FINANCIAL STATEMENTS
SEPTEMBER 30, 2013
(In Thousands, Except Share and Per Share Data or As Otherwise Stated Herein)
11. Reserve for Mortgage Repurchases and Indemnifications
The following is a summary of changes in the reserve for mortgage repurchases and indemnifications for the three and nine months ended September 30, 2013 and 2012:
| Three Months Ended |
Nine Months Ended |
|||||||||||||||
| 2013 |
2012 |
2013 |
2012 |
|||||||||||||
| Balance at beginning of period |
$ | 2,844 | $ | 301 | $ | 1,917 | $ | — | ||||||||
| Provision for mortgage repurchases and indemnifications |
414 | 525 | 1,379 | 826 | ||||||||||||
| Losses on repurchases and indemnifications |
(56 | ) | — | (94 | ) | — | ||||||||||
|
|
|
|
|
|
|
|
|
|||||||||
| Balance at end of period |
$ | 3,202 | $ | 826 | $ | 3,202 | $ | 826 | ||||||||
|
|
|
|
|
|
|
|
|
|||||||||
Because of the uncertainty in the various estimates underlying the mortgage repurchase and indemnifications liability, there is a range of losses in excess of the recorded reserve for mortgage repurchase and indemnifications that is reasonably possible. The estimate of the range of possible loss for representations and warranties does not represent a probable loss and is based on current available information, significant judgment and a number of assumptions that are subject to change. The high end of this range of reasonably possible losses in excess of the Company’s recorded reserve was approximately $2,362 at September 30, 2013, and was determined based upon modifying the assumptions (particularly to assume significant changes in investor repurchase demand practices) utilized in the Company’s best estimate of probable loss to reflect what it believes to be the high end of reasonably possible adverse assumptions.
12. Related Party Transactions
Through May 15, 2013, the Company had an agreement with a stockholder to pay an annual management fee of $320 for consulting and advisory services and strategic planning. The agreement was terminated on May 15, 2013 in conjunction with the Company’s private offering of common stock (see Note 15 “Capital Stock” for additional information related to the equity restructuring) and the Company agreed to pay the full annual management fee of $320. The Company also agreed to pay the stockholder an additional fee of $500 upon the earlier of the consummation of an initial public offering of its shares of common stock or May 15, 2014. The total management fees amounted to $125 and $508, respectively, for the three and nine months ended September 30, 2013 and $163 and $163, respectively, for the three and nine months ended September 30, 2012.
Through June 30, 2013, the Company had an agreement with a stockholder to manage and grow the Company’s Home Improvement Program division, which primarily focuses on the origination of FHA 203k loans and Fannie Mae Home Style renovation loans. In accordance with the terms of the agreement the stockholder was to receive an annual management fee of $108 payable quarterly through January 15, 2014, 10% of all revenue generated by the division payable quarterly through January 15, 2014, and 33.33% of the annual net income of the division for the calendar year ending December 31, 2013. This agreement was terminated on June 30, 2013 and the Company agreed to pay $159 in fees upon termination. The total related fees amounted to $0 and $159, respectively, for the three and nine months ended September 30, 2013 and $9 and $109, respectively, for the three and nine months ended September 30, 2012.
The Company had $0 and $222 of notes receivable outstanding from stockholders at September 30, 2013 and December 31, 2012, respectively. During the nine months ended September 30, 2013, the Company forgave a note receivable from its Chief Executive Officer (“CEO”) in the amount of $214, which was considered taxable income to the CEO and compensation expense to the Company.
F-21
Table of Contents
STONEGATE MORTGAGE CORPORATION
NOTES TO UNAUDITED CONSOLIDATED FINANCIAL STATEMENTS
SEPTEMBER 30, 2013
(In Thousands, Except Share and Per Share Data or As Otherwise Stated Herein)
13. Income Taxes
During the three months ended September 30, 2013 and 2012, the Company recognized income tax expense of $807 and $5,825, respectively, which represents effective tax rates of 32.4% and 38.1%, respectively. During the nine months ended September 30, 2013 and 2012, the Company recognized income tax expense of $12,487 and $8,210, respectively, which represents effective tax rates of 37.8% and 38.1%, respectively. The decrease in the effective tax rates during 2013 resulted primarily from changes in the Company’s state apportionment factors during the three months ended September 30, 2013 due to its geographic expansion and resulting changes in loan origination volume mix in the various states it conducts business.
As of September 30, 2013, the Company had federal and state net operating loss carryforwards of $61,385 and $39,947, respectively. As of December 31, 2012, the Company had federal and state net operating loss carryforwards of $15,230 and $11,444, respectively. The increase in both the federal and state net operating loss carryforwards during the nine months ended September 30, 2013 was due primarily to increases in timing differences related to originated MSRs and derivative assets and liabilities (IRLCs and related forward MBS trades). Because the Company’s primary business activity consists of the origination and sale of mortgage loans with the retention of servicing rights, these sales typically result in the recognition of gains for book purposes. However, because the servicing retained by the Company constitutes normal servicing, as that term is defined in applicable income tax guidance of the Internal Revenue Code, these sales do not result in the recognition of a corresponding amount of taxable gain. Similarly, the Company’s IRLCs and related forward MBS trades are recorded as derivative financial instruments and changes in fair value are recorded for book purposes under GAAP. However, the IRLCs and forward MBS trades with respect to the IRLCs are not subject to mark-to-market adjustments for tax purposes. The Company’s federal and state net operating loss carryforwards are available to offset future taxable income and expire from 2027 through 2033.
The Company analyzed the impact of its private equity offering that occurred on May 15, 2013 (as further described in Note 15 “Capital Stock”) and determined that an ownership change under Section 382 of the Internal Revenue Code (“Section 382 ownership change”) did not occur. The Internal Revenue Service allows for the application of two approaches (the full value method and the hold constant principle) for valuing companies when identifying whether a Section 382 ownership change has occurred and requires that the taxpayers apply a consistent method from year to year. The Company applied the full value method in its valuation and analysis of the Section 382 ownership change and, as a result, determined that a Section 382 ownership change did not occur.
As a result of a significant investment made by holders of Series D convertible preferred stock (as further described in Note 15, “Capital Stock”) on March 9, 2012, the Company experienced a Section 382 ownership change. Management performed an analysis of the resulting annual limitation on the utilization of the Company’s net operating loss carryforwards and, based on that analysis, determined that it is more likely than not that these net operating loss carryforwards will be utilized prior to their expiration. Accordingly, no valuation allowance has been established at September 30, 2013.
F-22
Table of Contents
STONEGATE MORTGAGE CORPORATION
NOTES TO UNAUDITED CONSOLIDATED FINANCIAL STATEMENTS
SEPTEMBER 30, 2013
(In Thousands, Except Share and Per Share Data or As Otherwise Stated Herein)
14. Commitments and Contingencies
Commitments to Extend Credit
The Company enters into interest rate lock commitments (“IRLCs”) with customers who have applied for residential mortgage loans and meet certain credit and underwriting criteria. These commitments expose the Company to market risk if interest rates change and the loan is not economically hedged or committed to an investor. The Company is also exposed to credit loss if the loan is originated and not sold to an investor and the customer does not perform. The collateral upon extension of credit typically consists of a first deed of trust in the mortgagor’s residential property. Commitments to originate loans do not necessarily reflect future cash requirements as some commitments are expected to expire without being drawn upon. Total commitments to originate loans as of September 30, 2013 and December 31, 2012 approximated $1,348,334 and $1,139,963, respectively.
Litigation
The Company is subject to various legal proceedings arising out of the ordinary course of business. As of September 30, 2013, there were no material current or pending claims against the Company.
Other Contingencies
During the nine months ended September 30, 2013, the Company became aware that it had purchased certain refinancing loans, with a total principal amount of $5,163, from a correspondent lender where the prior mortgage loan on the property securing the mortgage loan that was purchased from the correspondent was not satisfied and released by the correspondent’s title company at the time the loan from the correspondent was made. As part of the Company’s process in purchasing a mortgage loan from a correspondent, it generally requires that a closing protection letter be issued by the title insurer in favor of the borrower. A closing protection letter was obtained with respect to each of these purchased loans. As a result, the Company believes the borrower is insured against any liens prior to ours that were not identified in connection with the issuance of that closing protection letter. The Company believes that its procedures, including conducting a post-purchase audit, were effective in identifying the failure by the correspondent to obtain a release of the prior mortgage loan and that the Company’s practice of obtaining closing protection letters is appropriate to protect it in these situations. The Company has notified the affected borrowers and the relevant insurance carriers, and it expects that the title insurance obtained in connection with the refinancings will result in the loan having a first priority status. However, there can be no assurances that the prior mortgages will be fully satisfied from the title insurance claims. As a result, the Company has included certain specific reserves in its provision for reserve for mortgage repurchases and indemnifications during the nine months ended September 30, 2013 related to these purchased correspondent loans.
15. Capital Stock
Initial Public Offering
On October 16, 2013, the Company completed its initial public offering of 8,165,000 shares of common stock (including 1,065,000 shares exercised pursuant to an overallotment option granted to the underwriters) at a price to the public of $16.00 per share, resulting in net proceeds of approximately $123,928 after deducting underwriting discounts and commissions of approximately $6,712.
F-23
Table of Contents
STONEGATE MORTGAGE CORPORATION
NOTES TO UNAUDITED CONSOLIDATED FINANCIAL STATEMENTS
SEPTEMBER 30, 2013
(In Thousands, Except Share and Per Share Data or As Otherwise Stated Herein)
15. Capital Stock (Continued)
Equity Restructuring
On May 14, 2013, all outstanding shares of the Company’s convertible preferred stock (Series B, C and D) were converted into shares of the Company’s common stock on a one-for-one basis. On May 14, 2013, immediately following the conversion of preferred stock to common stock, each share of common stock held was split into 13.861519 shares of common stock.
On May 15, 2013, the Company sold 6,388,889 shares of its common stock at a per share price of $18.00, for total gross proceeds of $115,000, under a private offering under the exemptions of the Securities Act of 1933, as amended (the “Securities Act”). The initial purchaser’s discount and placement fee related to this offering totaled $7,700 and the Company incurred additional equity issuance costs totaling $2,692 related to this offering.
Issuance of Warrants
On March 29, 2013, in conjunction with a $10,000 term loan the Company entered into with a stockholder, the Company issued a warrants to the stockholder for the right to purchase 277,777 shares of its common stock at a price of $18.00 per share. The warrants are exercisable at any time through May 15, 2018. Because the warrants met the criteria of a derivative financial instrument that is indexed to the Company’s own stock, the warrants’ allocable fair value of $1,522 was recorded as a component of “Additional paid in capital” and resulted in a debt discount in the same amount. The debt discount was fully amortized into interest expense upon the repayment of the term loan in full, resulting in $1,522 of interest expense during the nine months ended September 30, 2013.
Series A Convertible Preferred Stock (“Series A Preferred Shares”)
During the nine months ended September 30, 2012, all 415,845 outstanding Series A Preferred Shares were redeemed and retired, at a per share redemption price of $3.61, for a total cash redemption payment of $1,500. In addition, at the time of the redemption, accrued and unpaid dividends of $43 were paid in cash to the sellers of the Series A Preferred Shares. As a result of this redemption, there were no outstanding Series A Preferred Shares as of September 30, 2012.
Series D Convertible Preferred Stock (“Series D Preferred Shares”)
During the nine months ended September 30, 2012, the Board of Directors issued 6,048,058 Series D Preferred Shares at per share price of $3.97, for total cash proceeds of $24,000. The Company incurred equity issuance costs totaling $1,638 related to the issuance of the Series D Preferred Shares.
Use of Capital and Common Stock Repurchases
Prior to the conversion of the Company’s outstanding convertible preferred stock to common stock in May 2013, the Company paid cash dividends of $0 and $27 to its convertible preferred stockholders during the three and nine months ended September 30, 2013, respectively. The Company paid total cash dividends of $19 and $99 to its convertible preferred stockholders during the three and nine months ended September 30, 2012,
F-24
Table of Contents
STONEGATE MORTGAGE CORPORATION
NOTES TO UNAUDITED CONSOLIDATED FINANCIAL STATEMENTS
SEPTEMBER 30, 2013
(In Thousands, Except Share and Per Share Data or As Otherwise Stated Herein)
15. Capital Stock (Continued)
Use of Capital and Common Stock Repurchases (Continued)
respectively. The Company does not expect to pay dividends on its common stock for the foreseeable future. The declaration of future dividends and the establishment of the per share amount, record dates and payment dates for any such future dividends are subject to the final determination of the Company’s Board of Directors, and will be dependent upon future earnings, cash flows, financial requirements and other factors.
The Company repurchased 315,350 shares of its common stock, at a per share price of $2.89, for a total cost of $910 during the nine months ended September 30, 2012, funding the repurchase from cash on hand. The shares were repurchased from a related party, who at the time of the repurchase was a member of the Company’s Board of Directors. Repurchases of common stock are accounted for using the cost method, with common stock in treasury classified in the balance sheet as a reduction of stockholders’ equity. Stock repurchases are discretionary as the Company is under no obligation to repurchases shares. The Company may repurchase shares when it believes it is a prudent use of capital. There were no repurchases of common stock during the nine months ended September 30, 2013.
16. Stock-Based Compensation
Stock Options
A summary of stock option activity for the nine months ended September 30, 2013 is as follows:
| Number of |
Weighted |
Weighted Remaining |
Aggregate |
|||||||||||||
| Outstanding at December 31, 2012 |
101,494 | $ | 3.97 | |||||||||||||
| Granted |
1,438,386 | $ | 18.00 | |||||||||||||
| Exercised |
— | N/A | ||||||||||||||
| Forfeited or expired |
— | N/A | ||||||||||||||
|
|
|
|||||||||||||||
| Outstanding at September 30, 2013 |
1,539,880 | $ | 17.08 | 9.5 | $ | 1,424 | ||||||||||
|
|
|
|||||||||||||||
| Exercisable at September 30, 2013 |
42,289 | $ | 3.97 | 8.5 | $ | 593 | ||||||||||
|
|
|
|||||||||||||||
The Company uses the Black-Scholes option pricing model to estimate the fair value of stock options granted. The following assumptions were used to estimate the fair value of options granted during the nine months ended September 30, 2013 and 2012:
| Nine Months Ended September 30, |
||||||||
|
2013 |
2012 |
|||||||
| Fair value of underlying common stock |
$ | 18.00 | $ | 3.97 | ||||
| Volatility |
40.00 | % | 18.00 | % | ||||
| Dividend yield |
— | % | — | % | ||||
| Risk-free interest rate |
1.08 | % | 1.01 | % | ||||
| Expected term (years) |
6.22 | 5.75 | ||||||
F-25
Table of Contents
STONEGATE MORTGAGE CORPORATION
NOTES TO UNAUDITED CONSOLIDATED FINANCIAL STATEMENTS
SEPTEMBER 30, 2013
(In Thousands, Except Share and Per Share Data or As Otherwise Stated Herein)
16. Stock-Based Compensation (Continued)
Stock Options (Continued)
The weighted average grant-date fair values per share of the stock options granted during the nine months ended September 30, 2013 and 2012 was $7.25 and $0.78, respectively.
During the nine months ended September 30, 2013, as a result of the May 14, 2013 stock-split, the Company modified a stock option award made to one non-employee director. The terms of the award were modified to increase the number of stock options from 7,322 shares to 101,494 shares and to decrease the exercise price of the stock options from $55.00 per share to $3.97 per share. The total incremental compensation costs resulting from this modification was $1,449, of which $128 and $554 were recorded as stock-based compensation expense during the three and nine months ended September 30, 2013, respectively.
17. Segment Information
The Company’s organizational structure is currently comprised of one operating segment: Mortgage Banking. This determination is based on the Company’s current organizational structure, which reflects how the chief operating decision maker evaluates the performance of the business.
The Mortgage Banking segment includes the Mortgage Originations, Mortgage Servicing and Mortgage Financing lines of business. The Mortgage Originations business primarily originates and sells residential mortgage loans, which conform to the underwriting guidelines of the GSEs and government agencies. The Mortgage Servicing business includes loan administration, collection and default activities, including the collection and remittance of loan payments, responding to customer inquiries, collection of principal and interest payments, holding custodial funds for the payment of property taxes and insurance premiums, counseling delinquent mortgagors, modifying loans and supervising foreclosures on the Company’s property dispositions. The Mortgage Financing business includes warehouse lending activities to correspondent customers by the Company’s NattyMac subsidiary, which commenced operations in July 2013.
The principal sources of revenue from the Mortgage Banking segment include:
| • | Gains on mortgage loans held for sale including changes in the fair value of commitments to purchase or originate mortgage loans held for sale and the related hedging instruments; |
| • | Fee income from loan servicing; and |
| • | Fee and net interest income from the Company’s financing facility. |
The Company’s chief operating decision maker evaluates the performance of the Mortgage Banking segment based on the measurement basis of income before income taxes. Refer to the Company’s consolidated statements of income for the three and nine months ended September 30, 2013 and 2012 included in this Form 10-Q for details related to operating revenues, income before income taxes and depreciation and amortization for the Mortgage Banking segment. Refer to the Company’s consolidated balance sheets as of September 30, 2013 and December 31, 2012 included in this Form 10-Q for details of the assets and equity components of the Mortgage Banking segment.
F-26
Table of Contents
STONEGATE MORTGAGE CORPORATION
NOTES TO UNAUDITED CONSOLIDATED FINANCIAL STATEMENTS
SEPTEMBER 30, 2013
(In Thousands, Except Share and Per Share Data or As Otherwise Stated Herein)
17. Segment Information (Continued)
The major components of revenues by product/service for the Mortgage Banking segment for the three and nine months ended September 30, 2013 and 2012 are as follows:
| Three Months Ended |
Nine Months Ended |
|||||||||||||||
| 2013 |
2012 |
2013 |
2012 |
|||||||||||||
| Mortgage originations |
||||||||||||||||
| Gains on mortgage loans held for sale |
$ | 13,216 | $ | 24,240 | $ | 63,791 | $ | 47,709 | ||||||||
| Loan origination and other loan fees |
5,637 | 2,919 | 15,635 | 6,266 | ||||||||||||
| Interest income |
5,351 | 1,574 | 11,098 | 3,158 | ||||||||||||
|
|
|
|
|
|
|
|
|
|||||||||
| Total mortgage originations |
24,204 | 28,733 | 90,524 | 57,133 | ||||||||||||
| Mortgage servicing |
||||||||||||||||
| Changes in mortgage servicing rights valuation |
2,099 | — | 11,649 | — | ||||||||||||
| Loan servicing fees |
5,966 | 1,504 | 14,324 | 3,728 | ||||||||||||
|
|
|
|
|
|
|
|
|
|||||||||
| Total mortgage servicing |
8,065 | 1,504 | 25,973 | 3,728 | ||||||||||||
| Mortgage financing |
||||||||||||||||
| Financing fees |
3 | — | 3 | — | ||||||||||||
| Interest income |
8 | — | 8 | — | ||||||||||||
|
|
|
|
|
|
|
|
|
|||||||||
| Total mortgage financing |
11 | — | 11 | — | ||||||||||||
| Other |
— | 1,172 | — | 1,172 | ||||||||||||
|
|
|
|
|
|
|
|
|
|||||||||
| Total revenues |
$ | 32,280 | $ | 31,409 | $ | 116,508 | $ | 62,033 | ||||||||
|
|
|
|
|
|
|
|
|
|||||||||
18. Supplemental Cash Flow Information
Supplemental cash flow information and non-cash activities for the nine months ended September 30, 2013 and 2012 are as follows:
| Nine Months Ended |
||||||||
| 2013 |
2012 |
|||||||
| Cash paid for interest |
$ | 9,368 | $ | 3,612 | ||||
| Cash paid for taxes |
$ | — | $ | — | ||||
| Settlement of employee’s incentive compensation with shares of common stock |
$ | 438 | $ | — | ||||
| Non-cash financing activities: |
||||||||
| Conversion of preferred stock to common stock |
$ | 33,000 | $ | — | ||||
| Repayment of term loan with shares of common stock |
$ | 5,655 | $ | — | ||||
F-27
Table of Contents
REPORT OF INDEPENDENT REGISTERED PUBLIC ACCOUNTING FIRM
The Board of Directors and Stockholders
Stonegate Mortgage Corporation:
We have audited the accompanying consolidated balance sheet of Stonegate Mortgage Corporation and subsidiary (the Company) as of June 30, 2013, and the related consolidated statements of operations, changes in stockholders’ equity, and cash flows for the six-month period ended June 30, 2013. These consolidated financial statements are the responsibility of the Company’s management. Our responsibility is to express an opinion on these consolidated financial statements based on our audit.
We conducted our audit in accordance with the standards of the Public Company Accounting Oversight Board (United States). Those standards require that we plan and perform the audit to obtain reasonable assurance about whether the financial statements are free of material misstatement. An audit includes examining, on a test basis, evidence supporting the amounts and disclosures in the financial statements. An audit also includes assessing the accounting principles used and significant estimates made by management, as well as evaluating the overall financial statement presentation. We believe that our audit provides a reasonable basis for our opinion.
In our opinion, the consolidated financial statements referred to above present fairly, in all material respects, the financial position of Stonegate Mortgage Corporation and its subsidiary as of June 30, 2013, and the results of their operations and their cash flows for the six-month period ended June 30, 2013, in conformity with U.S. generally accepted accounting principles.
/s/ KPMG LLP
Indianapolis, Indiana
September 6, 2013
F-28
Table of Contents
STONEGATE MORTGAGE CORPORATION
JUNE 30, 2013
| (in thousands, except share and per share data) | ||||
| Assets |
||||
| Cash and cash equivalents |
$ | 31,556 | ||
| Restricted cash |
2,500 | |||
| Mortgage loans held for sale, at fair value |
418,000 | |||
| Servicing advances |
1,249 | |||
| Derivative assets |
50,928 | |||
| Mortgage servicing rights, at fair value |
99,209 | |||
| Property and equipment, net |
6,314 | |||
| Intangible assets, net |
3,410 | |||
| Investment in closely held entity, at cost |
740 | |||
| Loans eligible for repurchase from GNMA |
12,421 | |||
| Other assets |
2,555 | |||
|
|
|
|||
| Total assets |
$ | 628,882 | ||
|
|
|
|||
| Liabilities and stockholders’ equity |
||||
| Liabilities |
||||
| Secured borrowings |
$ | 246,516 | ||
| Warehouse lines of credit |
92,354 | |||
| Operating lines of credit |
1,505 | |||
| Accounts payable and accrued expenses |
43,574 | |||
| Derivative liabilities |
19,409 | |||
| Reserve for mortgage repurchases and indemnifications |
2,844 | |||
| Due to related parties |
582 | |||
| Contingent earn-out liability |
2,160 | |||
| Liability for loans eligible for repurchase from GNMA |
12,421 | |||
| Deferred income tax liabilities, net |
26,061 | |||
|
|
|
|||
| Total liabilities |
447,426 | |||
|
|
|
|||
| Commitments and contingencies (Note 16) |
||||
| Stockholders’ equity |
||||
| Preferred stock, without par value, shares authorized—25,000,000 shares issued and outstanding—none |
— | |||
| Common stock, $0.01 par value, shares authorized—100,000,000 shares issued and outstanding—17,604,236 |
176 | |||
| Treasury stock—591,554 shares at cost |
(1,707 | ) | ||
| Additional paid-in capital |
143,328 | |||
| Retained earnings |
39,659 | |||
|
|
|
|||
| Total stockholders’ equity |
181,456 | |||
|
|
|
|||
| Total liabilities and stockholders’ equity |
$ | 628,882 | ||
|
|
|
|||
See accompanying notes to the consolidated financial statements.
F-29
Table of Contents
STONEGATE MORTGAGE CORPORATION
CONSOLIDATED STATEMENT OF OPERATIONS
FOR THE SIX MONTHS ENDED JUNE 30, 2013
| (in thousands, except per share data) | ||||
| Revenues |
||||
| Gains on mortgage loans held for sale |
$ | 50,575 | ||
| Changes in mortgage servicing rights valuation |
9,550 | |||
| Loan origination and other loan fees |
9,998 | |||
| Loan servicing fees |
8,358 | |||
| Interest income |
5,747 | |||
|
|
|
|||
| Total revenues |
84,228 | |||
| Expenses |
||||
| Salaries, commissions and benefits |
32,127 | |||
| General and administrative |
8,895 | |||
| Interest expense |
7,675 | |||
| Occupancy, equipment and communication |
3,123 | |||
| Provision for mortgage repurchases and indemnifications |
965 | |||
| Depreciation and amortization |
913 | |||
|
|
|
|||
| Total expenses |
53,698 | |||
|
|
|
|||
| Income before income tax expense |
30,530 | |||
| Income tax expense |
11,680 | |||
|
|
|
|||
| Net income |
18,850 | |||
| Less: Preferred stock dividends |
(27 | ) | ||
|
|
|
|||
| Net income attributable to common stockholders |
$ | 18,823 | ||
|
|
|
|||
| Net income per share |
||||
| Basic |
$ | 2.80 | ||
|
|
|
|||
| Diluted |
$ | 1.46 | ||
|
|
|
|||
See accompanying notes to the consolidated financial statements.
F-30
Table of Contents
STONEGATE MORTGAGE CORPORATION
CONSOLIDATED STATEMENT OF CHANGES IN STOCKHOLDERS’ EQUITY
FOR THE SIX MONTHS ENDED JUNE 30, 2013
| (in thousands) | Preferred Stock | Common Stock | Treasury Stock |
Additional Paid-in Capital |
Retained Earnings |
Total Stockholders’ Equity |
||||||||||||||||||||||||||
| Shares | Amount | Shares | Amount | |||||||||||||||||||||||||||||
| Balance at December 31, 2012 |
8,342 | $ | 33,000 | 2,834 | $ | 28 | $ | (1,820 | ) | $ | 3,205 | $ | 20,836 | $ | 55,249 | |||||||||||||||||
| Net income |
— | — | — | — | — | — | 18,850 | 18,850 | ||||||||||||||||||||||||
| Stock option expense |
— | — | — | — | — | 786 | — | 786 | ||||||||||||||||||||||||
| Issuance of stock warrant |
— | — | — | — | — | 1,522 | — | 1,522 | ||||||||||||||||||||||||
| Issuance of common stock under discretionary incentive plan |
— | — | 39 | — | 113 | 325 | — | 438 | ||||||||||||||||||||||||
| Preferred stock dividends |
— | — | — | — | — | — | (27 | ) | (27 | ) | ||||||||||||||||||||||
| Conversion of preferred stock to common stock |
(8,342 | ) | (33,000 | ) | 8,342 | 84 | — | 32,916 | — | — | ||||||||||||||||||||||
| Issuance of common stock under Rule 144A offering, net of initial purchaser’s discount, placement fee and equity issuance costs |
— | — | 6,389 | 64 | — | 104,574 | — | 104,638 | ||||||||||||||||||||||||
|
|
|
|
|
|
|
|
|
|
|
|
|
|
|
|
|
|||||||||||||||||
| Balance at June 30, 2013 |
— | $ | — | 17,604 | $ | 176 | $ | (1,707 | ) | $ | 143,328 | $ | 39,659 | $ | 181,456 | |||||||||||||||||
|
|
|
|
|
|
|
|
|
|
|
|
|
|
|
|
|
|||||||||||||||||
See accompanying notes to the consolidated financial statements.
F-31
Table of Contents
STONEGATE MORTGAGE CORPORATION
CONSOLIDATED STATEMENT OF CASH FLOWS
FOR THE SIX MONTHS ENDED JUNE 30, 2013
| (in thousands) | ||||
| Operating activities |
||||
| Net income |
$ | 18,850 | ||
| Adjustments to reconcile net income to net cash provided by (used in) operating activities: |
||||
| Depreciation and amortization |
913 | |||
| Amortization of debt discount |
1,522 | |||
| Forgiveness of note receivable from stockholder |
214 | |||
| Gains on mortgage loans held for sale |
(50,575 | ) | ||
| Changes in mortgage servicing rights valuation |
(9,550 | ) | ||
| Provision for reserve for mortgage repurchases and indemnifications |
965 | |||
| Proceeds from sale and principal payments of mortgage loans held for sale |
3,767,169 | |||
| Originations and purchases of mortgage loans held for sale |
(3,984,743 | ) | ||
| Stock-based compensation expense |
913 | |||
| Deferred income tax expense |
11,680 | |||
| Change in contingent earn-out liability |
65 | |||
| Changes in operating assets and liabilities: |
||||
| Restricted cash |
945 | |||
| Servicing advances |
(311 | ) | ||
| Other assets |
(897 | ) | ||
| Accounts payable and accrued expenses |
25,293 | |||
| Reserve for mortgage repurchases and indemnification |
(38 | ) | ||
| Due to related parties |
234 | |||
|
|
|
|||
| Net cash used in operating activities |
(217,351 | ) | ||
| Investing activities |
||||
| Purchases of property and equipment |
(3,021 | ) | ||
| Repayment of notes receivable from stockholder |
8 | |||
|
|
|
|||
| Net cash used in investing activities |
(3,013 | ) | ||
| Financing activities |
||||
| Proceeds from borrowings under mortgage funding arrangements and operating lines of credit |
8,772,156 | |||
| Repayments of borrowings under mortgage funding arrangements and operating lines of credit |
(8,639,889 | ) | ||
| Proceeds from borrowing from stockholder |
10,000 | |||
| Repayment of borrowing from stockholder |
(4,345 | ) | ||
| Payments of capital lease obligations |
(14 | ) | ||
| Net proceeds from issuance of common stock |
101,645 | |||
| Payments of equity issuance costs |
(2,662 | ) | ||
| Preferred stock dividends |
(27 | ) | ||
|
|
|
|||
| Net cash provided by financing activities |
236,864 | |||
|
|
|
|||
| Change in cash and cash equivalents |
16,500 | |||
| Cash and cash equivalents at beginning of period |
15,056 | |||
|
|
|
|||
| Cash and cash equivalents at end of period |
$ | 31,556 | ||
|
|
|
|||
See accompanying notes to the consolidated financial statements.
F-32
Table of Contents
STONEGATE MORTGAGE CORPORATION
NOTES TO CONSOLIDATED FINANCIAL STATEMENTS
JUNE 30, 2013
(In Thousands, Except Share and Per Share Data or as Otherwise Stated Herein)
1. Organization and Operations
References to the terms “we”, “our”, “us”, “Stonegate” or the “Company” used throughout these Notes to Consolidated Financial Statements refer to Stonegate Mortgage Corporation and, unless the context otherwise requires, its wholly-owned subsidiary, NattyMac, LLC (“NattyMac”), an Indiana limited liability company established in June 2013.
The Company is a specialty financial services firm focused on the U.S. residential mortgage market. The Company originates, acquires, sells, finances and services residential mortgage loans. The Company predominantly sells mortgage loans to the Federal National Mortgage Association (“Fannie Mae” or “FNMA”), which is a government-sponsored enterprise (“GSE”), and in Government National Mortgage Association (“Ginnie Mae” or “GNMA”) pools. The Company’s integrated and scalable residential mortgage banking platform enables us to efficiently and effectively originate, acquire, sell, finance and service residential mortgage loans. The Company’s platform and operating model provides its constituents visibility and access to essential data, documents and analytics related to the loan and originator performance over time. The Company’s principal sources of revenue include (i) gain on sale of mortgage loans from loan securitizations and whole loan sales, and fee income from originations, (ii) fee income from loan servicing, and (iii) fee and net interest income from its financing facilities.
The Company was initially incorporated in the State of Indiana in January 2005. As a result of an acquisition and subsequent merger with Swain Mortgage Company in 2009, the Company is now an Ohio corporation. The Company’s headquarters is in Indianapolis, Indiana and it has lending offices throughout the United States.
2. Basis of Presentation and Significant Accounting Policies
Basis of Presentation: The accompanying consolidated financial statements include the accounts of Stonegate and its subsidiary, NattyMac, and have been prepared in conformity with U.S. generally accepted accounting principles (“GAAP”). All intercompany accounts and transactions have been eliminated in consolidation.
Use of Estimates: The preparation of financial statements in conformity with GAAP requires us to make estimates and assumptions that affect the amounts reported in the Company’s consolidated financial statements and accompanying notes. Actual results could differ from those estimates. Material estimates that are particularly significant relate to the Company’s fair value measurements of mortgage loans held for sale, mortgage servicing rights (“MSRs”) and derivative assets and liabilities, as well as its estimates for the reserve for mortgage repurchases and indemnifications and any deferred tax asset valuation allowance.
Risks and Uncertainties: In the normal course of business, companies in the mortgage banking industry encounter certain economic and regulatory risks. Economic risks include interest rate risk and credit risk. The Company is subject to interest rate risk to the extent that in a rising interest rate environment, the Company may experience a decrease in loan production, as well as decreases in the value of mortgage loans held for sale and in commitments to originate loans, which may negatively impact the Company’s operations. Conversely, in a decreasing interest rate environment, the value of the Company’s MSRs may decrease, which could negatively impact the Company’s operations. Credit risk is the risk of default that may result from the borrowers’ inability or unwillingness to make contractually required payments during the period in which loans are being held for sale.
F-33
Table of Contents
The Company sells loans to investors without recourse. As such, the investors have assumed the risk of loss or default by the borrower. However, the Company is usually required by these investors to make certain standard representations and warranties relating to credit information, loan documentation and collateral. To the extent that the Company does not comply with such representations, or there are early payment defaults, the Company may be required to repurchase the loans or indemnify these investors for any losses from borrower defaults. The Company performs due diligence prior to funding mortgage loans as part of its loan underwriting process, whereby the Company analyzes credit, collateral and compliance risk of all loans in an effort to ensure the mortgage loans the investors’ standards. However, if a loan is repurchased, the Company could incur a loss as part of recording such loan at fair value, which may be less than the amount paid to purchase the loan. In addition, if loans pay off within a specified time frame, the Company may be required to refund a portion of the sales proceeds to the investors.
The Company’s business requires substantial cash to support its operating activities. As a result, the Company is dependent on its lines of credit, and other financing facilities in order to finance its continued operations. If the Company’s principal lenders decided to terminate or not to renew any of these credit facilities with the Company, the loss of borrowing capacity would have a material adverse impact on the Company’s financial statements unless the Company found a suitable alternative source of financing.
Consolidation: The Company’s loans held for sale are sold predominantly to FNMA. The Company also transfers loans in GNMA guaranteed mortgage backed securities (“MBS”) by pooling eligible loans through a pool custodian and assigning rights to the loans to GNMA. FNMA and GNMA provide credit enhancement of the loans through certain guarantee provisions. These securitizations involve variable interest entities (“VIEs”) as the trusts or similar vehicles, by design, that either (1) lack sufficient equity to permit the entity to finance its activities without additional subordinated financial support from other parties, or (2) have equity investors that do not have the ability to make significant decisions relating to the entity’s operations through voting rights, or do not have the obligation to absorb the expected losses, or do not have the right to receive the residual returns of the entity.
The primary beneficiary of a VIE (i.e., the party that has a controlling financial interest) is required to consolidate the assets and liabilities of the VIE. The primary beneficiary is the party that has both (1) the power to direct the activities of an entity that most significantly impact the VIE’s economic performance; and (2) through its interests in the VIE, the obligation to absorb losses or the right to receive benefits from the VIE that could potentially be significant to the VIE. The Company typically retains the right to service the loans. Because of the power of FNMA and GNMA over the VIEs that hold the assets from these residential mortgage loan securitizations, principally through its rights and responsibilities as master servicer for FNMA and as approver of issuers for GNMA and the guarantee provisions provided by FNMA and GNMA,, the Company is not the primary beneficiary of the VIEs and therefore the VIEs are not consolidated by the Company.
The Company performs on-going reassessments of: (1) whether entities previously evaluated under the majority voting-interest framework have become VIEs, based on certain events, and therefore become subject to the VIE consolidation framework; and (2) whether changes in the facts and circumstances regarding the Company’s involvement with a VIE cause the Company’s consolidation determination to change.
Revenue Recognition: Mortgage Loans Held for Sale: Mortgage loans held for sale are carried at fair value under the fair value option with changes in fair value recognized in current period earnings. At the date of funding of the mortgage loan held for sale, the funded amount of the loan plus the related derivative asset or
F-34
Table of Contents
liability of the associated interest rate lock commitment becomes the initial recorded investment in the mortgage loan held for sale. Such amount approximates the fair value of the loan.
Mortgage loans held for sale are considered de-recognized (sold) when the Company surrenders control over the financial assets. Control is considered to have been surrendered when the transferred assets have been isolated from the Company, beyond the reach of the Company and its creditors; the purchaser obtains the right (free of conditions that constrain it from taking advantage of that right) to pledge or exchange the transferred assets; and the Company does not maintain effective control over the transferred assets through an agreement that both entitles and obligates the Company to repurchase or redeem the transferred assets before their maturity or the ability to unilaterally cause the holder to return specific assets. Such transfers may involve securitizations, participation agreements or repurchase agreements. If the criteria above are not met, such transfers are accounted for as secured borrowings, in which the assets remain on the balance sheet, the proceeds from the transaction are recognized as a liability and no MSRs are recorded for those transferred loans.
Gains and losses from the sale of mortgages are recognized based upon the difference between the sales proceeds and carrying value of the related loans upon sale and is recorded in gain on mortgage loans held for sale in the statement of operations. The sales proceeds reflect the cash received and the initial fair value of the separately recognized mortgage servicing rights less the fair value of the incurred provision for mortgage repurchases and indemnifications. Gain on mortgage loans held for sale also includes the unrealized gains and losses associated with the mortgage loans held for sale and the realized and unrealized gains and losses from derivatives.
Mortgage Servicing Rights and Change in Mortgage Servicing Rights Valuation: The Company capitalizes MSRs at fair value at the time the underlying loans are de-recognized (sold) and when the Company retains the right to service such loans. To determine the fair value of the MSRs, the Company uses a valuation model that calculates the present value of future cash flows from servicing. The valuation model incorporates assumptions that market participants would use in estimating future net servicing income, including estimates of the cost of servicing, the discount rate, float value, the inflation rate, estimated prepayment speeds, and default rates. MSRs currently are not actively traded in the markets, accordingly, considerable judgment is required to estimate their fair value and the exercise of that judgment can materially impact current period earnings.
Prior to January 1, 2013, the Company accounted for the subsequent measurement of its MSRs at the lower of amortized cost or fair value. Effective January 1, 2013, the Company elected to irrevocably account for the subsequent measurement of its existing MSRs using the fair value method, whereby the subsequent changes in the fair value of the MSRs are recorded in earnings during the period in which the changes occur. Under the fair value method, the fair value of the MSRs is assessed at each reporting date using the methods described above. In accordance with the applicable GAAP guidance, this change in accounting principle was accounted for on a prospective basis (financial statement periods prior to 2013 were not restated). The Company did not record a cumulative-effect adjustment to retained earnings as of January 1, 2013, as the net amortized carrying value of the MSRs as of January 1, 2013 equaled the fair value at such date due to MSR impairment charges recorded during 2012. During the period January 1, 2013 through June 30, 2013, all of the Company’s MSRs were accounted for at fair value.
Loan Origination and Other Loan Fees: Loan origination and other loan fee income represents revenue earned from originating mortgage loans. Loan origination and other loan fees generally represent flat, per-loan fee amounts and are recognized as revenue, net of loan origination costs, at the time the loans are funded.
F-35
Table of Contents
Loan Servicing Fees: Loan servicing fee income represents revenue earned for servicing mortgage loans. The servicing fees are based on a contractual percentage of the outstanding principal balance and recognized as revenue as the related mortgage payments are collected. Corresponding loan servicing costs are charged to expense as incurred.
Interest Income: Interest income on mortgage loans is accrued to income based upon the principal amount outstanding and contractual interest rates. Income recognition is discontinued when loans become 90 days delinquent or when in management’s opinion, the collectability of principal and income becomes doubtful.
Derivative Financial Instruments: All derivative financial instruments are recognized as either assets or liabilities and measured at fair value. The Company accounts for all of its derivatives as free-standing derivatives and does not designate any for hedge accounting. Therefore, the gain or loss resulting from the change in the fair value of the derivative is recognized in the Company’s results of operations during the period of change.
The Company enters into commitments to originate residential mortgage loans held for sale, at specified interest rates and within a specified period of time, with customers who have applied for a loan and meet certain credit and underwriting criteria (interest rate lock commitments). These interest rate lock commitments (“IRLCs”) meet the definition of a derivative financial instrument and are reflected in the balance sheet at fair value with changes in fair value recognized in current period earnings. Unrealized gains and losses on the IRLCs are recorded as derivative assets and derivative liabilities, respectively, and are measured based on the value of the underlying mortgage loan, quoted MBS prices, estimates of the fair value of the mortgage servicing rights and the probability that the mortgage loan will fund within the terms of the interest rate lock commitment, net of estimated commission expenses.
The Company manages the interest rate and price risk associated with its outstanding IRLCs and loans held for sale by entering into derivative instruments such as forward loan sales commitments and mandatory delivery commitments. Management expects these derivatives will experience changes in fair value opposite to changes in fair value of the IRLCs and loans held for sale, thereby reducing earnings volatility. The Company takes into account various factors and strategies in determining the portion of the mortgage pipeline (IRLCs) and loans held for sale it wants to economically hedge.
To the extent derivatives subject to master netting arrangements meet applicable requirements, the Company presents the derivative balances and related cash collateral amounts net on the balance sheet.
Reserve for Loan Repurchases and Indemnifications: Loans sold to investors by the Company and which met investor and agency underwriting guidelines at the time of sale may be subject to repurchase or indemnification in the event of specific default by the borrower or subsequent discovery that underwriting standards were not met. The Company may, upon mutual agreement, agree to repurchase the loans or indemnify the investor against future losses on such loans. In such cases, the Company bears any subsequent credit loss on the loans. The Company has established an initial reserve liability for expected losses related to these representations and warranties at the date the loans are de-recognized from the balance sheet based on the fair value of such reserve liability. Subsequently, based on changing facts and circumstances or changes in certain estimates and assumptions, the reserve liability is adjusted with a corresponding amount recorded to provision for reserve for mortgage repurchases and indemnifications. In assessing the adequacy of the reserve, management evaluates various factors including actual losses on repurchases and indemnifications during the period, historical
F-36
Table of Contents
loss experience, known delinquent and other problem loans, delinquency trends in the portfolio of sold loans and economic trends and conditions in the industry. Actual losses incurred are reflected as charge-offs against the reserve liability.
Loans Eligible for Repurchase from GNMA: When the Company has the unilateral right to repurchase GNMA pool loans it has previously sold (generally loans that are more than 90 days past due), the Company then records the loan on its balance sheet. The recognition of previously sold loans does not impact the accounting for the previously recognized mortgage servicing rights. At June 30, 2013, delinquent or defaulted mortgage loans currently in GNMA pools that the Company has recognized as a liability on its balance sheet totaled $12,421. There were no actual repurchases of GNMA delinquent or defaulted mortgage loans during the six months ended June 30, 2013.
Servicing Advances: Servicing advances represent escrows and advances paid by the Company on behalf of customers and investors to cover delinquent balances for property taxes, insurance premiums and other out-of-pocket costs. Advances are made in accordance with the servicing agreements and are recoverable upon collection of future borrower payments or foreclosure of the underlying loans. The Company periodically reviews these receivables for collectability and amounts are written off when they are deemed uncollectible.
Property and Equipment: Property and equipment is recorded at cost, net of accumulated depreciation. Depreciation is computed using the straight-line method over estimated useful lives of three to ten years for furniture and equipment and three years for computer software. Leasehold improvements are amortized using the straight-line method over the shorter of the related lease term or their estimated economic useful lives.
Intangible Assets: The finite-lived purchased intangible assets consist of customer relationships and an active agent list, which have useful lives of eight years and five years, respectively. Intangible assets with finite lives are amortized over their estimated lives using a straight line amortization method. The Company evaluates the estimated remaining useful lives on intangible assets to determine whether events or changes in circumstances warrant a revision to the remaining periods of amortization. If an intangible asset’s estimated useful life is changed, the remaining net carrying amount of the intangible asset is amortized prospectively over that revised remaining useful life. Additionally, an intangible asset that initially is deemed to have a finite useful life would cease being amortized if it is subsequently determined to have an indefinite useful life. Such intangible asset is then tested for impairment. The Company reviews such intangibles for impairment whenever events or changes in circumstances indicate their carrying amounts may not be recoverable, in which case an impairment charge would be recorded to earnings.
The indefinite-lived purchased intangible asset consists of a trade name. Intangible assets with an indefinite useful life are not subject to amortization but are reviewed for impairment annually or more frequently whenever events or changes in circumstances indicate that the carrying amount of an intangible asset may not be recoverable. The Company first assesses qualitative factors to determine whether the existence of events or circumstances leads to a determination that is more likely than not that an indefinite-lived intangible asset is impaired. If the Company determines that it is more likely than not that the intangible asset is impaired, a quantitative impairment test is performed. For the quantitative impairment test, the Company estimates and compares the fair value of an indefinite-lived intangible asset with its carrying amount. If the carrying amount of an intangible asset exceeds its fair value, the amount of the impairment is measured as the difference between the carrying amount of the asset and its fair value. Impairment is permanently recognized by writing down the asset to the extent that the carrying value exceeds the estimated fair value.
F-37
Table of Contents
Long-Lived Assets: The Company periodically assesses long-lived assets, including property and equipment and definite-lived intangible assets, for recoverability whenever events or changes in circumstances indicate that their carrying amounts may not be recoverable. If management identifies an impairment indicator, it assesses recoverability by comparing the carrying amount of the asset to the undiscounted cash flows expected to result from the use and eventual disposition of the asset. An impairment loss is recognized in earnings whenever the carrying amount is not recoverable. No such impairment was recognized for the six months ended June 30, 2013.
Investment in Closely Held Entity: Investment in closely held entity consists of shares of voting common and preferred stock, which the Company owns in a non-publicly traded entity. The investment is carried at cost as the Company does not exercise significant influence over the entity’s operating and financial activities. The Company has determined it is not practical to estimate the fair value of the investment. The Company periodically evaluates this investment for impairment and no impairment charges were recorded during the six months ended June 30, 2013.
Stock Split: On May 14, 2013, the Company granted a stock dividend of 12.861519 shares of common stock for each share of common stock held as of that date, which was determined to be in substance a stock split. All actual share, weighted-average share and per share amounts and all references to stock compensation data and prices of the Company’s common stock have been adjusted to reflect this stock split for the entire period presented.
Stock-Based Compensation: The Company grants stock options to certain executive officers, key employees and independent directors. Stock options have been granted for a fixed number of shares with an exercise price at least equal to the fair value of the shares at the date of grant. The stock options granted are recognized as compensation expense in the statement of operations based on their grant-date fair values.
Advertising and Marketing: The Company uses primarily print, broadcast and web-based advertising and marketing to promote its products. Advertising and marketing is expensed as incurred and totaled $1,001 for the six months ended June 30, 2013.
Income Taxes: Income taxes are provided for the tax effects of transactions reported in the financial statements and consist of taxes currently due plus deferred taxes related primarily to differences between the basis of certain assets and liabilities for financial and tax reporting. The deferred taxes represent the future tax return consequences of those differences, which will either be taxable or deductible when the assets and liabilities are recovered or settled. Deferred tax assets are recognized to the extent that realization is “more likely than not”.
The Company’s income tax expense includes assessments related to uncertain tax positions taken or expected to be taken by the Company. Management has concluded that it currently does not have any significant uncertain tax positions. If applicable, the Company will recognize interest and penalties related to unrecognized tax benefits as a component of income tax expense. The open tax years subject to examination by taxing authorities include the years ended December 31, 2011, 2010, and 2009. The Company has no federal or state tax examinations in process as of June 30, 2013.
Cash and Cash Equivalents: The Company classifies cash and temporary investments with original maturities of three months or less as cash and cash equivalents, which totaled $13,332 at June 30, 2013. The
F-38
Table of Contents
Company typically maintains cash in financial institutions in excess of FDIC limits. The Company evaluates the creditworthiness of these financial institutions in determining the risk associated with these cash balances.
Restricted Cash: The Company maintains certain cash balances that are restricted under broker margin account agreements.
Supplemental Cash Flow Information: Supplemental cash flow information and non-cash activities for the six months ended June 30, 2013 are as follows:
| Cash paid for interest |
$ | 5,821 | ||
| Cash paid for taxes |
$ | — | ||
| Settlement of employee’s incentive compensation with shares of common stock |
$ | 438 | ||
| Non-cash Investing Activities: |
||||
| Receipt of MSRs created in loan sales activity |
$ | 47,457 | ||
| Non-cash Financing Activities: |
||||
| Conversion of preferred stock to common stock |
$ | 33,000 | ||
| Repayment of term loan with shares of common stock |
$ | 5,655 | ||
Escrow and Fiduciary Funds: The Company maintains segregated bank accounts in trust for investors and escrow balances for mortgagors. The balances of these accounts amounted to $141,209 at June 30, 2013 and were excluded from the Company’s consolidated balance sheet as of June 30, 2013.
Net Income Per Share: Basic net income per share is computed based on the weighted average number of common shares outstanding during the period presented. Diluted net income per share is computed based on the weighted-average number of common shares plus the effect of dilutive potential common shares outstanding during the period presented using the treasury stock method. Dilutive potential common shares represent employee and director stock options and convertible preferred stock.
3. Recent Accounting Pronouncements
Financial Accounting Standards Board (“FASB”) Accounting Standards Update (“ASU”) ASU No. 2013-01, Balance Sheet (Topic 210): Clarifying the Scope of Disclosures about Offsetting Assets and Liabilities (“ASU 2013-01”), was issued in January 2013. This ASU clarifies the scope of transactions that are subject to the disclosures about offsetting, specifically that ordinary trade receivables and receivables are not in the scope of ASU No. 2011-11. ASU No. 2011-11 applies only to derivatives, repurchase agreements and reverse purchase agreements, and securities borrowing and securities lending transactions that are offset in accordance with specific criteria contained in FASB Accounting Standards Codification or subject to a master netting arrangement or similar agreement. ASU 2013-01 was effective for fiscal years beginning on or after January 1, 2013, and interim periods within those annual periods. The adoption of ASU 2013-01 did not materially impact the Company’s financial statements.
ASU No. 2012-02, Intangibles-Goodwill and Other (Topic 350): Testing Indefinite-Lived Intangible Assets for Impairment (“ASU 2012-02”), was issued in July 2012. This update simplifies the guidance for testing the decline in realizable value (impairment) of indefinite-lived intangible assets other than goodwill. The amendment allows an entity the option to first assess qualitative factors to determine whether it is necessary to
F-39
Table of Contents
perform the quantitative impairment test. An organization electing to perform a qualitative assessment is no longer required to calculate the fair value of an indefinite-lived intangible asset unless the organization determines, based on a qualitative assessment, that it is “more likely than not” that the asset is impaired. This amendment is effective for annual and interim impairment tests performed for fiscal years beginning after September 15, 2012. The adoption of ASU 2012-02 did not materially impact the Company’s financial statements.
4. Net Income per Share
The following is a reconciliation of net income attributable to common shareholders and a table summarizing the basic and diluted net income per share calculations for the six months ended June 30, 2013:
| Net income: |
||||
| Net income |
$ | 18,850 | ||
| Less: Preferred stock dividends |
(27 | ) | ||
|
|
|
|||
| Net income attributable to common shareholders |
$ | 18,823 | ||
|
|
|
|||
| Weighted-average shares outstanding: |
||||
| Denominator for basic net income per share—weighted-average common shares outstanding |
6,717 | |||
| Effect of dilutive shares—employee and director stock options and convertible preferred stock |
6,153 | |||
|
|
|
|||
| Denominator for diluted net income per share |
12,870 | |||
|
|
|
|||
| Net income per share: |
||||
| Basic |
$ | 2.80 | ||
|
|
|
|||
| Diluted |
$ | 1.46 | ||
|
|
|
|||
5. Derivative Financial Instruments
The Company does not designate any of its derivative instruments as hedges. The following summarizes the Company’s outstanding derivative instruments at June 30, 2013:
|
|
Fair Value |
|||||||||||||
| Notional |
Balance Sheet Location |
Asset |
(Liability) |
|||||||||||
| IRLCs |
$ | 1,450,868 | Derivative assets/liabilities | $ | 4,246 | $ | (18,166 | ) | ||||||
| MBS forward trades |
1,888,223 | Derivative assets/liabilities | 46,682 | (1,243 | ) | |||||||||
|
|
|
|
|
|
|
|||||||||
| Total derivative financial instruments |
$ | 3,339,091 | $ | 50,928 | $ | (19,409 | ) | |||||||
|
|
|
|
|
|
|
|||||||||
F-40
Table of Contents
The following summarizes the effect of the Company’s derivative financial instruments on its consolidated statement of operations for the six months ended June 30, 2013:
| Statement of Operations Location |
Derivative Gains (Losses) Recognized |
|||||
| IRLCs |
Gains on mortgage loans held for sale | $ | (25,909 | ) | ||
| MBS forward trades |
Gains on mortgage loans held for sale | 47,226 | ||||
|
|
|
|||||
| Net derivative gain |
$ | 21,317 | ||||
|
|
|
|||||
The Company has exposure to credit loss in the event of contractual non-performance by its trading counterparties and counterparties to the over-the-counter derivative financial instruments that the Company uses in its rate risk management activities. The Company manages this credit risk by selecting only counterparties that the Company believes to be financially strong, spreading the credit risk among many such counterparties, by placing contractual limits on the amount of unsecured credit extended to any single counterparty and by entering into netting agreements with the counterparties, as appropriate.
The Company has entered into agreements with derivative counterparties which include netting arrangements whereby the counterparties are entitled to settle their positions on a net basis. The Company is required to provide certain derivative counterparties collateral against derivative financial instruments. As of June 30, 2013, counterparties held $2,500 of the Company’s cash and cash equivalents in margin accounts as collateral, after which the Company was in a net credit loss position of $19,409 to those counterparties. For the six months ended June 30, 2013, the Company incurred no credit losses due to non-performance of any of its counterparties.
6. Mortgage Loans Held for Sale
The following summarizes mortgage loans held for sale at fair value at June 30, 2013:
| Conventional |
$ | 250,201 | ||
| Governmental |
167,799 | |||
|
|
|
|||
| Total mortgage loans held for sale, at fair value |
$ | 418,000 | ||
|
|
|
Under certain of the Company’s mortgage funding arrangements, the Company is required to pledge mortgage loans as collateral to secure borrowings. The mortgage loans pledged as collateral must equal at least 100% of the related outstanding borrowings under the mortgage funding arrangements. The outstanding borrowings are monitored and the Company is required to deliver additional collateral if the amount of the outstanding borrowings exceeds the fair value of the pledged mortgage loans. At June 30, 2013 the Company had pledged approximately $347,090 in fair value of mortgage loans held for sale as collateral to secure debt under its mortgage funding arrangements, with the remaining $70,910 of mortgage loans held for sale funded with the Company’s excess cash. The mortgage loans held as collateral by the respective lenders are restricted solely to satisfy the Company’s borrowings under those mortgage funding arrangements. Refer to Note 12 “Debt” for additional information related to the Company’s borrowings as of June 30, 2013.
F-41
Table of Contents
7. Mortgage Servicing Rights
The Company had total MSRs at fair value on its consolidated balance sheet of $99,209 at June 30, 2013. The Company’s total mortgage servicing portfolio is summarized as follows (based on the unpaid principal balance) at June 30, 2013:
| FNMA |
$ | 4,796,917 | ||
| GNMA |
2,791,344 | |||
|
|
|
|||
| Total mortgage servicing portfolio |
$ | 7,588,261 | ||
|
|
|
|||
| MSRs as a percentage of mortgage servicing portfolio |
1.31 | % | ||
|
|
|
A summary of the changes in the balance of MSRs for the six months ended June 30, 2013 is as follows:
| Beginning balance at December 31, 2012 |
$ | 42,202 | ||
| MSRs received as proceeds from loan sales |
47,457 | |||
| Changes in valuation inputs and assumptions |
13,519 | |||
| Actual portfolio runoff (payoffs and principal amortization) |
(3,969 | ) | ||
|
|
|
|||
| Ending balance at June 30, 2013 |
$ | 99,209 | ||
|
|
|
The following is a summary of the components of loan servicing fees as reported in the consolidated statement of operations for the six months ended June 30, 2013:
| Contractual servicing fees |
$ | 8,169 | ||
| Late fees |
189 | |||
|
|
|
|||
| Loan servicing fees |
$ | 8,358 | ||
|
|
|
8. Fair Value Measurements
The Company uses fair value measurements in fair value disclosures and to record certain assets and liabilities at fair value on a recurring basis, such as MSRs, derivatives and loans held for sale, or on a nonrecurring basis, such as when measuring impairments on intangible and long-lived assets. The Company has elected fair value accounting for loans held for sale and MSRs to more closely align the Company’s accounting with its interest rate risk strategies without having to apply the operational complexities of hedge accounting.
The Company groups its assets and liabilities at fair value in three levels, based on the markets in which the assets and liabilities are traded and the reliability of the assumptions used to determine fair value. These levels are:
| Level Input: |
Input Definition: | |
| Level 1 |
Unadjusted, quoted prices in active markets for identical assets or liabilities. | |
| Level 2 |
Prices determined using other significant observable inputs. Observable inputs are inputs that other market participants would use in pricing an asset or liability and are developed based on market data obtained from sources independent of the Company. These may include quoted prices for similar assets and liabilities, interest rates, prepayment speeds, credit risk and others. | |
F-42
Table of Contents
| Level Input: |
Input Definition: | |
| Level 3 |
Prices determined using significant unobservable inputs. In situations where quoted prices or observable inputs are unavailable (for example, when there is little or no market activity), unobservable inputs may be used. Unobservable inputs reflect the Company’s own assumptions about the factors that market participants would use in pricing the asset or liability, and are based on the best information available in the circumstances. | |
An asset or liability’s level within the fair value hierarchy is based on the lowest level of input that is significant to the fair value measurement.
While the Company believes its valuation methods are appropriate and consistent with those used by other market participants, the use of different methods or assumptions to estimate the fair value of certain financial statement items could result in a different estimate of fair value at the reporting date. Those estimated values may differ significantly from the values that would have been used had a readily available market for such items existed, or had such items been liquidated, and those differences could be material to the financial statements.
Management incorporates lack of liquidity into its fair value estimates based on the type of asset or liability measured and the valuation method used. The Company uses discounted cash flow techniques to estimate fair value. These techniques incorporate forecasting of expected cash flows discounted at appropriate market discount rates that are intended to reflect the lack of liquidity in the market.
The following describes the methods used in estimating the fair values of certain financial statement items:
Cash Equivalents: Cash equivalents primarily consist of highly rated money market funds with maturities of three months or less, and are purchased daily with specific yield rates.
Mortgage Loans Held for Sale: The Company’s mortgage loans held for sale at fair value, are saleable into the secondary mortgage markets and their fair values are estimated using quoted market or contracted prices or market price equivalents.
Derivative Financial Instruments: The Company estimates the fair value of interest rate lock commitments based on the value of the underlying mortgage loan, quoted MBS prices and estimates of the fair value of the MSRs and the probability that the mortgage loan will fund within the terms of the interest rate lock commitment. The Company estimates the fair value of forward sales commitments based on quoted MBS prices.
Mortgage Servicing Rights: The Company uses a discounted cash flow approach to estimate the fair value of MSRs. This approach consists of projecting servicing cash flows discounted at a rate that management believes market participants would use in their determinations of value. The key assumptions used in the estimation of the fair value of MSRs include prepayment speeds, discount rates, default rates, cost to service, contractual servicing fees, escrow earnings and ancillary income.
F-43
Table of Contents
The following are the major categories of assets and liabilities measured at fair value on a recurring basis as of June 30, 2013:
| Level 1 |
Level 2 |
Level 3 |
Total |
|||||||||||||
| Assets: |
||||||||||||||||
| Cash equivalents |
$ | 13,332 | $ | — | $ | — | $ | 13,332 | ||||||||
| Mortgage loans held for sale |
— | 418,000 | 418,000 | |||||||||||||
| IRLCs (derivative assets) |
4,246 | 4,246 | ||||||||||||||
| MBS forward trades (derivative assets) |
46,682 | 46,682 | ||||||||||||||
| MSRs |
99,209 | 99,209 | ||||||||||||||
|
|
|
|
|
|
|
|
|
|||||||||
| Total assets |
$ | 13,332 | $ | 468,928 | $ | 99,209 | $ | 581,469 | ||||||||
|
|
|
|
|
|
|
|
|
|||||||||
| Liabilities: |
||||||||||||||||
| IRLCs (derivative liabilities) |
$ | — | $ | 18,166 | $ | — | $ | 18,166 | ||||||||
| MBS forward trades (derivative liabilities) |
— | 1,243 | — | 1,243 | ||||||||||||
| Contingent earn-out liability |
— | — | 2,160 | 2,160 | ||||||||||||
|
|
|
|
|
|
|
|
|
|||||||||
| Total liabilities |
$ | — | $ | 19,409 | $ | 2,160 | $ | 21,569 | ||||||||
|
|
|
|
|
|
|
|
|
|||||||||
Mortgage loans held for sale are carried at estimated fair value pursuant to the fair value option. Losses from changes in estimated fair values amounted to $23,328 for the six months ended June 30, 2013, and are included in gain on mortgage loans held for sale on the statement of operations.
Following are the fair value and related unpaid principal amounts due upon maturity for loans held for sale accounted under the fair value option at June 30, 2013:
| Fair Value |
Unpaid |
|||||||
| Current through 89 days delinquent |
$ | 417,321 | $ | 417,507 | ||||
| 90 or more days delinquent |
679 | 905 | ||||||
|
|
|
|
|
|||||
| Total |
$ | 418,000 | $ | 418,412 | ||||
|
|
|
|
|
|||||
A reconciliation of the beginning and ending balances of the Company’s assets (MSRs) measured at fair value on a recurring basis using Level 3 inputs for the six months ended June 30, 2013 is as follows:
| Beginning balance at December 31, 2012 |
$ | 42,202 | ||
| Changes in fair value recognized in earnings 1 |
9,550 | |||
| Purchases |
— | |||
| Sales |
— | |||
| Issuances |
47,457 | |||
| Settlements |
— | |||
| Transfers into Level 3 |
— | |||
| Transfers out of Level 3 |
— | |||
|
|
|
|||
| Ending balance at June 30, 2013 |
$ | 99,209 | ||
|
|
|
|||
| Changes in fair value recognized in net income during the period related to assets still held |
$ | 9,550 | ||
|
|
|
| 1 | Recognized in the consolidated statement of operations within “Changes in mortgage servicing rights valuation” |
F-44
Table of Contents
A reconciliation of the beginning and ending balances of the Company’s liability (contingent earn-out liability) measured at fair value on a recurring basis using Level 3 inputs for the six months ended June 30, 2013 is as follows:
| Beginning balance at December 31, 2012 |
$ | 2,095 | ||
| Changes in fair value recognized in earnings 2 |
65 | |||
| Purchases |
— | |||
| Sales |
— | |||
| Issuances |
— | |||
| Settlements |
— | |||
| Transfers into Level 3 |
— | |||
| Transfers out of Level 3 |
— | |||
|
|
|
|||
| Ending balance at June 30, 2013 |
$ | 2,160 | ||
|
|
|
| 2 | Recognized in the consolidated statement of operations within “General and administrative expense” |
See Note 16 “Commitments and Contingencies” for additional information related to the contingent earn-out liability.
Transfers between levels, if any, are recorded as of the beginning of the reporting period. During the six months ended June 30, 2013, there were no transfers between levels.
Fair Value of Other Financial Instruments
As of June 30, 2013, all financial instruments were either recorded at fair value or the carrying value approximated fair value. For financial instruments that were not recorded at fair value, such as cash, restricted cash, servicing advances, secured borrowings, warehouse lines of credit, operating lines of credit, accounts payable and accrued expenses, their carrying values approximated fair value due to the short-term nature of such instruments.
9. Property and Equipment
The following summarizes property and equipment at June 30, 2013:
| Internally developed computer software |
$ | 2,155 | ||
| Purchased computer software and equipment |
3,765 | |||
| Furniture and office equipment |
2,057 | |||
| Leasehold improvements |
402 | |||
|
|
|
|||
| Property and equipment, gross |
8,379 | |||
| Accumulated depreciation and amortization |
(2,065 | ) | ||
|
|
|
|||
| Property and equipment, net |
$ | 6,314 | ||
|
|
|
Total depreciation and amortization expense related to property and equipment for the six months ended June 30, was $733, which includes amortization expense related to internally developed software of $211.
F-45
Table of Contents
10. Intangible Assets
The components of the Company’s intangible assets as of June 30, 2013 are as follows:
| Gross Carrying Amount |
Accumulated Amortization |
Net Carrying Amount |
||||||||||
| Finite-lived intangible assets: |
||||||||||||
| Customer relationships |
$ | 2,350 | $ | (245 | ) | $ | 2,105 | |||||
| Active agent list |
330 | (55 | ) | 275 | ||||||||
|
|
|
|
|
|
|
|||||||
| Total finite-lived intangible assets |
$ | 2,680 | $ | (300 | ) | $ | 2,380 | |||||
|
|
|
|
|
|
|
|||||||
| Indefinite-lived intangible assets: |
||||||||||||
| NattyMac trade name |
$ | 1,030 | ||||||||||
|
|
|
|||||||||||
The Company recorded amortization expense related to its definite-lived intangible assets of $180 during the six months ended June 30, 2013. The Company did not record any impairment charges relating to the indefinite-lived intangible assets during the six months ended June 30, 2013.
Estimated amortization expense for each of the years ending June 30, is as follows: 2014, $360; 2015, $360; 2016, $360; 2017, $360; 2018, $305; thereafter, $635. Estimated amortization expense was based on existing intangible asset balances as of June 30, 2013. Actual amortization expense may vary from these estimates.
11. Transfers and Servicing of Financial Assets
Residential mortgage loans are transferred to FNMA or into pools of GNMA MBS. The Company has continuing involvement in mortgage loans sold through servicing arrangements and the liability for loan indemnifications and repurchases under the representation and warranties it makes to the investors and insurers of the loans it sells. The Company is exposed to interest rate risk through its continuing involvement with mortgage loans sold, including the mortgage servicing right asset, as the value of the asset fluctuates as changes in interest rates impact borrower prepayment on the underlying mortgage loans.
All loans are sold on a non-recourse basis; however, representations and warranties have been made that are customary for loan sale transactions, including eligibility characteristics of the mortgage loans and underwriting responsibilities, in connection with the sales of these assets.
In order to facilitate the origination and sale of mortgage loans held for sale, the Company entered into various agreements with warehouse lenders. Such agreements are in the form of loan participations and repurchase agreements with banks and other financial institutions. Mortgage loans held for sale are considered sold when the Company surrenders control over the financial assets and such financial assets are legally isolated from the Company in the event of bankruptcy. For loan participations and repurchase agreements that meet the sale criteria, the transferred financial assets are derecognized from the balance sheet and a gain or loss is recognized upon sale. If the sale criteria are not met, the transfer is recorded as a secured borrowing in which the assets remain on the balance sheet and the proceeds from the transaction are recognized as a liability. All repurchase agreements are accounted for by the Company as secured borrowings.
F-46
Table of Contents
From time to time, the Company may sell loans whereby the underlying risks and cash flows of the mortgage loan have been transferred to a third party through the issuance of participating interests. The terms and conditions of these interests are governed by the participation agreements. In the instances where the loan participation has qualified for sale treatment, the Company will act as an agent on behalf of the participating entity when negotiating the terms of the ultimate sale of the underlying mortgage loan to FNMA or in GNMA pools. The Company will receive a marketing fee paid by the participating entity upon completion of the sale. In addition, the Company will also service the underlying mortgage loans to the participation agreement for the period that the participating interests are outstanding. As of June 30, 2013 all participation arrangements were accounted for by the Company as secured borrowings.
The following table sets forth information regarding cash flows for the six months ended June 30, 2013 relating to loan sales in which the Company has continuing involvement:
| Proceeds from new loan sales |
$ | 67,425 | ||
| Proceeds from loan servicing fees |
$ | 7,652 | ||
| Proceeds from servicing advances |
$ | 310 | ||
| Repurchase and indemnification of previously sold loans |
$ | — |
The following table sets forth information related to outstanding loans sold as of June 30, 2013 for which the Company has continuing involvement:
| Unpaid principal balance |
$ | 7,588,261 | ||
| Loans 30-89 days delinquent |
$ | 103,784 | ||
| Loans delinquent 90 or more days or in foreclosure |
$ | 21,780 |
The Company incurred losses totaling $38 during the six months ended June 30, 2013 representing uncollectible interest on outstanding mortgage loans in which it has continuing involvement.
The key assumptions (or range of assumptions) used in determining the fair value of the Company’s MSRs as of June 30, 2013 are as follows:
| Discount rates |
9.25% – 11.00% | |
| Annual prepayment speeds (by investor type): |
||
| Purchased FNMA |
20.9% | |
| FNMA |
8.5% | |
| GNMA I |
9.0% | |
| GNMA II |
8.0% | |
| Cost of servicing (per loan) |
$74 |
F-47
Table of Contents
The key assumptions (or range of assumptions) used in determining the fair value of the Company’s MSRs at initial recognition during the six months ended June 30, 2013 are as follows:
| Discount rates |
9.25% – 11.00% | |
| Annual prepayment speeds (by investor type): |
||
| Purchased FNMA |
20.9% – 29.7% | |
| FNMA |
8.5% – 10.4% | |
| GNMA I |
9.0% – 12.9% | |
| GNMA II |
8.0% – 9.3% | |
| Cost of servicing (per loan) |
$73 – 74 |
MSRs are generally subject to loss in value when mortgage rates decrease. Decreasing mortgage rates normally encourage increased mortgage refinancing activity. Increased refinancing activity reduces the life of the loans underlying the MSRs, thereby reducing MSR value. Reductions in the value of MSRs affect income through changes in fair value. These factors have been considered in the estimated prepayment speed assumptions used to determine the fair value of the Company’s MSRs.
In addition to the assumptions listed above, the Company uses assumptions for default rates in determining the fair value of MSRs. These assumptions are based primarily on internal estimates, and the Company also obtains third-party data, where applicable, to assess the reasonableness of its internal assumptions. In the MSRs valuation as of June 30, 2013, the Company’s assumptions for default rates for FNMA and GNMA mortgage loans were 2.85% and 6.38%, respectively. The default rates represent the Company’s estimate of the loans will eventually enter foreclosure proceedings over the entire term of the portfolio’s life. These assumptions affect the future cost to service loans, future revenue earned from the portfolio, and future assumed foreclosure losses. Because the Company’s portfolio is generally comprised of recent vintages, actual future defaults may differ from the Company’s assumptions.
The hypothetical effect of an adverse change in these key assumptions would result in a decrease in fair values as follows as of June 30, 2013:
| Discount rates: |
||||
| Impact of discount rate + 1% |
$ | (4,902 | ) | |
| Impact of discount rate + 2% |
$ | (9,376 | ) | |
| Impact of discount rate + 3% |
$ | (13,474 | ) | |
| Prepayment speeds: |
||||
| Impact of prepayment speed * 105% |
$ | (2,162 | ) | |
| Impact of prepayment speed * 110% |
$ | (4,255 | ) | |
| Impact of prepayment speed * 120% |
$ | (8,240 | ) | |
| Cost of servicing: |
||||
| Impact of cost of servicing * 105% |
$ | (717 | ) | |
| Impact of cost of servicing * 110% |
$ | (1,434 | ) | |
| Impact of cost of servicing * 120% |
$ | (2,868 | ) |
As the table demonstrates, the Company’s methodology for estimating the fair value of MSRs is highly sensitive to changes in assumptions. For example, actual prepayment experience may differ and any difference may have a material effect on MSR fair value. Changes in fair value resulting from changes in assumptions
F-48
Table of Contents
generally cannot be extrapolated because the relationship of the change in assumption to the change in fair value may not be linear. Also, in this table, the effect of a variation in a particular assumption on the fair value of the MSRs is calculated without changing any other assumption; in reality, changes in one factor may be associated with changes in another (for example, decreases in market interest rates may indicate higher prepayments; however, this may be partially offset by lower prepayments due to other factors such as a borrower’s diminished opportunity to refinance), which may magnify or counteract the sensitivities. Thus, any measurement of MSR fair value is limited by the conditions existing and assumptions made as of a particular point in time. Those assumptions may not be appropriate if they are applied to a different point in time.
12. Debt
Short-term borrowings outstanding as of June 30, 2013 are as follows:
| Amount |
Weighted |
|||||||
| Secured borrowings |
$ | 246,516 | 3.56 | % | ||||
| Warehouse lines of credit |
92,354 | 2.55 | % | |||||
| Operating lines of credit |
1,505 | 4.59 | % | |||||
|
|
|
|||||||
| Total short-term borrowings |
$ | 340,375 | ||||||
|
|
|
|||||||
The Company maintains mortgage participation and warehouse lines of credit arrangements (collectively referred to as “mortgage funding arrangements”) with various financial institutions, primarily to fund the origination of mortgage loans which are subject to participation. As of June 30, 2013 the Company held mortgage funding arrangements with four separate financial institutions and a total maximum borrowing capacity of $762,000. Each mortgage funding arrangement is collateralized by the underlying mortgage loans. During July 2013, the Company subsequently increased the size of one of its mortgage funding arrangements by $200,000, thereby increasing the total borrowing capacity under all mortgage funding arrangements to $962,000.
The following table summarizes the amounts outstanding, interest rates and maturity dates under the Company’s mortgage funding arrangements as of June 30, 2013:
| Mortgage Funding |
Amount |
Interest Rate |
Maturity Date | |||||
| Party A |
$ | 246,732 | Same as the underlying mortgage rates/prime plus 1.00% |
June 2014 | ||||
| Party B |
76,758 | LIBOR plus applicable margin | December 2013 | |||||
| Party C |
— | Same as the underlying mortgage rates | November 2013 | |||||
| Party D |
15,380 | LIBOR plus applicable margin | February 2014 | |||||
|
|
|
|||||||
| $ | 338,870 | |||||||
|
|
|
|||||||
The Company intends to renew the warehouse lines of credit when they mature and has no reason to believe the Company will be unable to do so.
The warehouse lines of credit are generally tied to the loan participation agreements executed with the same financial institutions. Pursuant to the loan participation agreements, the Company periodically sells
F-49
Table of Contents
beneficial ownership interests in its mortgage loan receivables. As of June 30, 2013, the Company has a total of $460,000 in loan participation limit that expires through June 30, 2014. The lenders may cancel the agreements with written notice.
The Company has a $7,200 operating line of credit agreement, which expires on December 31, 2013. Interest under the agreement is at the prime rate (with a floor of 4.00%) per annum. The line is collateralized by the net servicing fee cash flows from and proceeds on approved sales of mortgage servicing rights. The amount outstanding under the line amounted to $800 with an interest rate of 4.00% at June 30, 2013.
The Company has a $1,000 operating line of credit agreement, which expires on June 30, 2014. Interest under the agreement ranges between 5.25% and 6% per annum. The line is collateralized by the Company’s cost method investment in this lender and the net servicing fee cash flows from and proceeds on approved sales of mortgage servicing rights. The amount outstanding under the line amounted to $705 with an interest rate of 5.25% at June 30, 2013.
The above agreements contain covenants which include certain financial requirements, including maintenance of minimum tangible net worth, maximum debt to tangible net worth ratio, minimum liquidity, minimum current ratio, minimum profitability, and limitations on additional debt and transactions with affiliates, as defined in the agreement.
On March 29, 2013, the Company entered into a Secured Term Promissory Note agreement (the “Note”) with a stockholder to borrow $10,000. The Note was scheduled to mature on September 30, 2013 and beared interest at 5.00% (compounded monthly), through May 31, 2013, and thereafter at an interest rate of 12.50% (compounded monthly). The Note was repaid in full on May 15, 2013 with $4,345 of cash, and 314,147 shares of the Company’s common stock, at a per share price of $18.00, totaling $5,655 issued under the Rule 144A equity offering were sent directly to the stockholder for the remaining balance on the term loan.
As of and for the six months ended June 30, 2013, the Company had no outstanding long-term borrowings.
13. Reserve for Mortgage Repurchases and Indemnifications
The following is a summary of changes in the reserve for mortgage repurchases and indemnifications for the six months ended June 30, 2013:
| Balance at December 31, 2012 |
$ | 1,917 | ||
| Provision for reserve for mortgage repurchases and indemnifications |
965 | |||
| Write-offs |
(38 | ) | ||
|
|
|
|||
| Balance at June 30, 2013 |
$ | 2,844 | ||
|
|
|
Because of the uncertainty in the various estimates underlying the mortgage repurchase and indemnifications liability, there is a range of losses in excess of the recorded reserve for mortgage repurchase and indemnifications that is reasonably possible. The estimate of the range of possible loss for representations and warranties does not represent a probable loss, and is based on current available information, significant judgment and a number of assumptions that are subject to change. The high end of this range of reasonably possible losses
F-50
Table of Contents
in excess of the Company’s recorded reserve was approximately $1,900 at June 30, 2013, and was determined based upon modifying the assumptions (particularly to assume significant changes in investor repurchase demand practices) utilized in the Company’s best estimate of probable loss to reflect what it believes to be the high end of reasonably possible adverse assumptions.
14. Related Party Transactions
Through May 15, 2013, the Company had an agreement with a stockholder to pay an annual management fee of $320 for consulting and advisory services and strategic planning. The agreement was terminated on May 15, 2013 in conjunction with the Company’s private offering of common stock (see Note 17 “Capital Stock” for additional information related to the equity restructuring) and the Company agreed to pay the full annual management fee of $320. The Company also agreed to pay the stockholder an additional fee of $500 upon the earlier of the consummation of an initial public offering of its shares of common stock or May 15, 2014. The total management fees amounted to $383 for the six months ended June 30, 2013.
Through June 30, 2013, the Company had an agreement with a stockholder to manage and grow the Company’s Home Improvement Program division, which primarily focuses on the origination of FHA 203k loans and Fannie Mae Home Style renovation loans. In accordance with the terms of the agreement the stockholder was to receive an annual management fee of $108 payable quarterly through January 15, 2014, 10% of all revenue generated by the division payable quarterly through January 15, 2014, and 33.33% of the annual net income of the division for the calendar year ending December 31, 2013. This agreement was terminated on June 30, 2013 and the Company agreed to pay $159 in fees upon termination.
The Company had no notes receivable outstanding from stockholders at June 30, 2013. During the six months ended June 30, 2013, the Company forgave a note receivable from a stockholder in the amount of $214, which was considered taxable income to the stockholder and compensation expense to the Company.
15. Income Taxes
The components of income tax expense are as follows for the six months ended June 30, 2013:
| Current income tax expense |
$ | — | ||
| Deferred income tax expense |
11,680 | |||
|
|
|
|||
| Total income tax expense |
$ | 11,680 | ||
|
|
|
The following is a reconciliation of income tax expense recorded on the Company’s consolidated statement of operations to the expected statutory federal corporate income tax rate for the six months ended June 30, 2013:
| Amount | Percent | |||||||
| Statutory federal income tax expense |
$ | 10,686 | 35.0 | % | ||||
| State income tax expense, net of federal tax benefit |
976 | 3.2 | % | |||||
| Non-deductible expenses |
82 | 0.2 | % | |||||
| Other |
(64 | ) | (0.2 | )% | ||||
|
|
|
|
|
|||||
| Total income tax expense |
$ | 11,680 | 38.2 | % | ||||
|
|
|
|
|
|||||
F-51
Table of Contents
The tax effects of significant temporary differences which gave rise to the Company’s deferred tax assets and liabilities are as follows as of June 30, 2013:
| Deferred tax assets relating to: |
| |||
| Net operating loss carryforwards |
$ | 11,511 | ||
| Reserve for mortgage repurchases and indemnifications |
1,086 | |||
| Incentive compensation accrual |
1,070 | |||
| Deferred rent and leasehold improvements |
317 | |||
| Vacation accrual and contributions |
47 | |||
| Stock-based compensation |
300 | |||
|
|
|
|||
| Total deferred tax assets |
$ | 14,331 | ||
|
|
|
|||
| Deferred tax liabilities relating to: |
||||
| Property and equipment |
$ | 989 | ||
| Intangible assets |
293 | |||
| Loans held for sale and related derivatives |
1,628 | |||
| MSRs |
37,482 | |||
|
|
|
|||
| Total deferred tax liabilities |
$ | 40,392 | ||
|
|
|
|||
| Net deferred tax liabilities |
$ | 26,061 | ||
|
|
|
|||
As of June 30, 2013, the Company had federal and state net operating loss carryforwards of approximately $30,135 and $26,295 respectively, available to offset taxable income and expiring from 2027 through 2033.
The Company has analyzed the impact of the Rule 144A equity offering that occurred on May 15, 2013 (as described in Note 17 “Capital Stock” within these audited financial statements) and has determined that an ownership change under Section 382 of the Internal Revenue Code (“Section 382 ownership change”) has not occurred. The Internal Revenue Service allows for the application of two approaches (the full value method and the hold constant principle) for valuing companies when identifying whether a Section 382 ownership change has occurred and requires that the taxpayers apply a consistent method from year to year. The Company applied the full value method in its valuation and analysis of the Section 382 ownership change and, as a result, determined that a Section 382 ownership change did not occur.
The Company experienced a Section 382 ownership change during 2012. Management has performed an analysis of the resulting annual limitation on the utilization of the Company’s net operating loss carryforwards and, based on that analysis, has determined that it is more likely than not that these net operating loss carryforwards will be utilized prior to their expiration. Accordingly, no valuation allowance has been established at June 30, 2013.
16. Commitments and Contingencies
Commitments to Extend Credit
The Company enters into IRLCs with customers who have applied for residential mortgage loans and meet certain credit and underwriting criteria. These commitments expose the Company to market risk if interest
F-52
Table of Contents
rates change and the loan is not economically hedged or committed to an investor. The Company is also exposed to credit loss if the loan is originated and not sold to an investor and the customer does not perform. The collateral upon extension of credit typically consists of a first deed of trust in the mortgagor’s residential property. Commitments to originate loans do not necessarily reflect future cash requirements as some commitments are expected to expire without being drawn upon. Total commitments to originate loans as of June 30, 2013 approximated $1,450,868.
Contingent Earn-Out Liability
As part of the Company’s 2012 acquisition of the assets of NattyMac’s single-family mortgage loan warehousing business, the Company agreed to pay NattyMac’s sellers a deferred purchase price of $75 (whole dollars) for each mortgage loan funded through the mortgage loan warehousing business acquired from NattyMac. The potential undiscounted amount of all future payments that the Company could be required to make under the contingent consideration arrangement is between $0 and $2,250. The fair value of the contingent consideration arrangement was estimated to be approximately $2,160 as of June 30, 2013 and was estimated by applying the income approach. The fair value of the contingent consideration as of June 30, 2013 was based on key assumptions including (i) the Company’s revised estimate of the number and timing of mortgage loans to be funded; and (ii) a discount rate of 4.79%. The Company’s revised estimated fair value of the contingent earn-out liability of $2,160 as of June 30, 2013 increased from its original acquisition-date estimated fair value of $2,095 primarily due to the estimated timing of mortgage loan fundings from the NattyMac warehousing business. At June 30, 2013, no mortgage loans had been funded through NattyMac’s single-family warehousing business and the Company had not yet made any contingent consideration payments. NattyMac commenced operations during July 2013 with its funding of mortgage loans, and the Company expects that the full amount of contingent consideration will be paid over a 14-month period, beginning in August 2013.
Leases
The Company leases office space and equipment under non-cancelable operating agreements expiring through June 2023. Rent expense amounted to $1,273 for the six months ended June 30, 2013. Future minimum rental payments under the leases having an initial or remaining non-cancelable term in excess of one year are as follows at June 30, 2013:
| Years Ending June 30: |
||||
| 2014 |
$ | 1,957 | ||
| 2015 |
1,892 | |||
| 2016 |
1,774 | |||
| 2017 |
1,355 | |||
| 2018 |
1,244 | |||
| Thereafter |
4,808 | |||
|
|
|
|||
| Total minimum payments required |
$ | 13,030 | ||
|
|
|
Regulatory Net Worth Requirements
The Company is subject to various regulatory capital requirements administered by the Department of Housing and Urban Development (“HUD”), which governs non-supervised, direct endorsement mortgagees,
F-53
Table of Contents
GNMA, which governs issuers of GNMA MBS, and FNMA, which governs issuers of FNMA securities. Additionally, the Company is required to maintain minimum net worth requirements for many of the states in which it sells and services loans. Each state has its own minimum net worth requirement; these range from $0 to $1,000, depending on the state.
Failure to meet minimum capital requirements can result in certain mandatory and possibly additional discretionary remedial actions by regulators that, if undertaken, could (i) remove the Company’s ability to sell and service loans to or on behalf of the Agencies and (ii) have a direct material effect on the Company’s financial statements. In accordance with the regulatory capital guidelines, the Company must meet specific quantitative measures of assets, liabilities and certain off-balance sheet items calculated under regulatory accounting practices. Further, changes in regulatory and accounting standards, as well as the impact of future events on the Company’s results, may significantly affect the Company’s net worth adequacy.
The Company calculates its compliance with the regulatory capital and minimum net worth requirements annually at its calendar year-end. The Company was in compliance with all minimum net worth requirements as of December 31, 2012 (its most recent calendar year-end).
Litigation
The Company is subject to various legal proceedings arising out of the ordinary course of business. As of June 30, 2013, there were no material current or pending claims against the Company.
Other Contingencies
During the six months ended June 30, 2013, the Company became aware that it had purchased certain refinancing loans, with a total principal amount of $5,163, from a correspondent lender where the prior mortgage loan on the property securing the mortgage loan that was purchased from the correspondent was not satisfied and released by the correspondent’s title company at the time the loan from the correspondent was made. As part of the Company’s process in purchasing a mortgage loan from a correspondent, it generally requires that a closing protection letter be issued by the title insurer in favor of the borrower. A closing protection letter was obtained with respect to each of these purchased loans. As a result, the Company believes the borrower is insured against any liens prior to ours that were not identified in connection with the issuance of that closing protection letter. The Company believes that its procedures, including conducting a post-purchase audit, were effective in identifying the failure by the correspondent to obtain a release of the prior mortgage loan and that the Company’s practice of obtaining closing protection letters is appropriate to protect it in these situations. The Company has notified the affected borrowers and the relevant insurance carriers, and it expects that the title insurance obtained in connection with the refinancings will result in the loan having a first priority status. However, there can be no assurances that the prior mortgages will be fully satisfied from the title insurance claims. As a result, the Company has included certain specific reserves in its provision for reserve for mortgage repurchases and indemnifications during the six months ended June 30, 2013 related to these purchased correspondent loans.
17. Capital Stock
2013 Equity Restructuring
On May 14, 2013, all outstanding shares of the Company’s convertible preferred stock (Series B, C and D) were converted into shares of the Company’s common stock on a one-for-one basis. On May 14, 2013,
F-54
Table of Contents
immediately following the conversion of preferred stock to common stock, each share of common stock held was split into 13.861519 shares of common stock.
On May 15, 2013, the Company sold 6,388,889 shares of its common stock at a per share price of $18.00, for total gross proceeds of $115,000, under a private offering to qualified institutional buyers pursuant to Rule 144A of the Securities Act of 1933, as amended (the “Securities Act”). The 6,388,889 shares sold were not registered under the Securities Act. The initial purchaser’s discount and placement fee related to this offering totaled $7,700 and the Company incurred additional equity issuance costs totaling $2,662 related to this offering.
Use of Capital and Common Stock Repurchases
Prior to the conversion of the Company’s outstanding convertible preferred stock to common stock in May 2013, the Company paid cash dividends of $27 to its convertible preferred stockholders during the six months ended June 30, 2013. The declaration of future dividends and the establishment of the per share amount, record dates and payment dates for any such future dividends are subject to the final determination of the Company’s Board of Directors, and will be dependent upon future earnings, cash flows, financial requirements and other factors.
The Company repurchased 630,699 shares of its common stock, at a per share price of $2.89, for $1,820 million during 2012, funding the repurchase from cash on hand. The shares were repurchased from a related party, who at the time of the repurchase was a member of the Company’s Board of Directors. Repurchases of common stock are accounted for using the cost method, with common stock in treasury classified in the balance sheet as a reduction of stockholders’ equity. Stock repurchases are discretionary as the Company is under no obligation to repurchases shares. The Company may repurchase shares when it believes it is a prudent use of capital. There were no repurchases of common stock during the six months ended June 30, 2013.
Issuance of Warrant
On March 29, 2013, in conjunction with the $10,000 term loan the Company entered into with a stockholder, the Company issued a warrant to the stockholder for the right to purchase 277,777 shares of its common stock at a price $18.00 per share. The warrant is exercisable at any time through May 15, 2018. Because the warrant meets the criteria of a derivative financial instrument that is indexed to the Company’s own stock, the warrant’s allocable fair value of $1,522 was recorded as a component of “Additional paid in capital” and resulted in a debt discount in the same amount. The debt discount was fully amortized into interest expense upon repayment of the term loan in full, resulting in $1,522 of interest expense during the six months ended June 30, 2013.
18. Stock-Based Compensation
In 2011, the Company adopted the 2011 Omnibus Incentive Plan (the “Plan”) for employees, consultants and non-employee directors. The Plan was amended on April 10, 2013 to increase the number of shares of the Company’s common stock available for grant from 1,386,151 to 2,467,350 and was amended and restated again on May 8, 2013 to add a mandatory anti-dilution provision for certain events as described in the Plan. The Plan provides for the grant of stock options (both incentive stock options and nonqualified stock options), stock appreciation rights, restricted stock, performance units, phantom stock, restricted stock units and stock awards, with each grant evidenced by an award agreement providing the terms of the award. The
F-55
Table of Contents
Company’s current policy for issuing shares of its common stock upon exercise of stock options is to first issue shares out of treasury stock, of which there were 591,554 shares available as of June 30, 2013. Once the Company’s shares of treasury stock are depleted, the Company expects that it would either issue new shares or repurchase outstanding shares of its common stock to settle stock option exercises. The Company currently has no plans to repurchase shares of its common stock.
Stock Options
Nonqualified stock options are granted for a fixed number of shares with an exercise price at least equal to the fair value of the shares at the grant date. Nonqualified stock options granted during 2012 vest over three years in equal quarterly installments and have a term of ten years from the grant date. Nonqualified stock options granted during 2013 generally vest over four years in equal annual installments and have a term of ten years from the grant date. Stock options granted do not contain any voting or dividend rights prior to exercise. The Company recognizes compensation expense associated with the stock option grants using the straight-line method over the requisite service period. The Company has not granted any stock appreciation rights, restricted stock, performance units, phantom stock, restricted stock units or stock awards.
A summary of stock option activity for the six months ended June 30, 2013 is as follows:
| Number of |
Weighted |
Weighted |
Aggregate |
|||||||||||||
| Outstanding at December 31, 2012 |
101,494 | $ | 3.97 | |||||||||||||
| Granted |
1,438,386 | $ | 18.00 | |||||||||||||
| Exercised |
— | N/A | ||||||||||||||
| Forfeited or expired |
— | N/A | ||||||||||||||
|
|
|
|||||||||||||||
| Outstanding at June 30, 2013 |
1,539,880 | $ | 17.08 | 9.8 | $ | 1,424 | ||||||||||
|
|
|
|||||||||||||||
| Exercisable at June 30, 2013 |
33,831 | $ | 3.97 | 8.7 | $ | 475 | ||||||||||
|
|
|
|||||||||||||||
During the six months ended June 30, 2013, 16,916 stock options with a per-share exercise price of $3.97, an aggregate intrinsic value of $237 and remaining contractual term of 8.7 years, vested.
The Company uses the Black-Scholes option pricing model to estimate the fair value of stock options granted. The following assumptions were used to estimate the fair value of options granted during the six months ended June 30, 2013:
| Fair value of underlying common stock |
$ | 18.00 | ||
| Volatility |
40.00 | % | ||
| Dividend yield |
— | |||
| Risk-free interest rate |
1.08 | % | ||
| Weighted average expected term (years) |
6.22 |
The weighted average grant-date fair value per share of the stock options granted during the six months ended June 30, 2013 was $7.25.
F-56
Table of Contents
Volatility was estimated based on the historical volatility of comparable publicly traded companies. The dividend yield was based on an estimate of future dividend yields. The risk-free interest rate was based on the U.S. Treasury zero-coupon yield curve in effect at the time of the grants. The expected term was calculated for each grant using the simplified method, as the Company’s outstanding stock option grant met certain U.S. Securities and Exchange criteria for the use of the simplified method.
During the six months ended June 30, 2013, as a result of the Company’s May 14, 2013 stock-split, the Company modified a stock option award made to one non-employee director. The terms of the award were modified so that the director’s number of options were increased from 7,322 shares to 101,494 shares and the exercise price of the stock options were decreased from $55.00 per share to $3.97 per share. The total incremental compensation costs resulting from this modification was $1,449, of which $426 was recorded as stock-based compensation expense during the six months ended June 30, 2013.
During the six months ended June 30, 2013, the Company recognized total stock-based compensation expense related to stock options of $786, as well as related tax benefits of $300. Total unrecognized stock-based compensation costs related to non-vested stock option grants as of June 30, 2013 was $11,161 and will be recognized using the straight-line method over the weighted average remaining requisite service period of 3.5 years.
As of June 30, 2013, there were 315,925 shares of common stock available for future grants under the Plan.
Stock Awards
On May 10, 2013, the Company issued 39,145 shares of common stock (from its treasury shares) to an employee who elected to receive his 2012 incentive compensation in the form of shares of the Company’s common stock, as allowed under his employment agreement. The election under the employment agreement that allowed the employee to receive incentive compensation in either cash or the Company’s common stock was accounted for as a tandem award compensation agreement. The fair value of the tandem award was determined to be $602 on the date the employee made the election to receive his incentive compensation in stock. Stock-based compensation expense recognized for this tandem award was $127 and $475, respectively, for the six months ended June 30, 2013 and the year ended December 31, 2012. The number of shares of common stock issued to this employee upon settlement reflected a net settlement for payroll tax withholding.
19. Retirement Benefit Plans
The Company has a 401(k) profit sharing plan covering substantially all employees. Employees may contribute amounts subject to certain IRS and plan limitations. The Company may make discretionary matching and non-elective contributions, subject to certain limitations. During the six months ended June 30, 2013, the Company contributed $526 to the 401(k) profit sharing plan.
20. Segment Information
The Company’s organizational structure is currently comprised of one operating segment: Mortgage Banking. This determination is based on the Company’s current organizational structure, which reflects how the chief operating decision maker evaluates the performance of the business.
F-57
Table of Contents
The Mortgage Banking segment includes the Mortgage Originations, Mortgage Servicing and Mortgage Financing lines of business. The Mortgage Originations business primarily originates and sells residential mortgage loans, which conform to the underwriting guidelines of the GSEs and government agencies. The Mortgage Servicing business includes loan administration, collection and default activities, including the collection and remittance of loan payments, responding to customer inquiries, collection of principal and interest payments, holding custodial funds for the payment of property taxes and insurance premiums, counseling delinquent mortgagors, modifying loans and supervising foreclosures on the Company’s property dispositions. The Mortgage Financing business consists of the NattyMac single-family mortgage loan warehousing business that we acquired in August 2012 and which had not yet commenced operations as of June 30, 2013.
The principal sources of revenue from the Mortgage Banking segment include:
| • | Gains on mortgage loans held for sale, including changes in the fair value of commitments to purchase or originate mortgage loans held for sale and the related hedging instruments; |
| • | Fee and net interest income from the Company’s financing facility; and |
| • | Fee income from loan servicing. |
The Company’s chief operating decision maker evaluates the performance of the Mortgage Banking segment based on the measurement basis of income before income taxes. Refer to the Company’s consolidated statement of operations for the six months ended June 30, 2013 included in these audited consolidated financial statements for details related to operating revenues, income before income taxes and depreciation and amortization for the Mortgage Banking segment. Refer to the Company’s consolidated balance sheet as of June 30, 2013 for details of the assets and equity components of the Mortgage Banking segment.
The major components of operating revenues by product/service for the Mortgage Banking segment for the six months ended June 30, 2013 are as follows:
| Mortgage Originations |
||||
| Gains on mortgage loans held for sale |
$ | 50,575 | ||
| Loan origination and other loan fees |
9,998 | |||
| Interest income |
5,747 | |||
|
|
|
|||
| Total Originations |
66,320 | |||
| Mortgage Servicing |
||||
| Change in MSRs valuation, net of portfolio runoff |
9,550 | |||
| Loan servicing fees |
8,358 | |||
|
|
|
|||
| Total Servicing |
17,908 | |||
|
|
|
|||
| Total operating revenues |
$ | 84,228 | ||
|
|
|
F-58
Table of Contents
REPORT OF INDEPENDENT REGISTERED PUBLIC ACCOUNTING FIRM
To the Board of Directors
Stonegate Mortgage Corporation
Indianapolis, Indiana
We have audited the accompanying balance sheets of Stonegate Mortgage Corporation as of December 31, 2012 and 2011, and the related statements of operations, changes in stockholders’ equity, and cash flows for the years then ended. These financial statements are the responsibility of the Company’s management. Our responsibility is to express an opinion on these financial statements based on our audits.
We conducted our audits in accordance with the standards of the Public Company Accounting Oversight Board (United States). Those standards require that we plan and perform the audits to obtain reasonable assurance about whether the financial statements are free of material misstatement. The Company is not required to have, nor were we engaged to perform, an audit of its internal control over financial reporting. Our audits included consideration of internal control over financial reporting as a basis for designing audit procedures that are appropriate in the circumstances, but not for the purpose of expressing an opinion on the effectiveness of the Company’s internal control over financial reporting. Accordingly, we express no such opinion. An audit also includes examining, on a test basis, evidence supporting the amounts and disclosures in the financial statements, assessing the accounting principles used and significant estimates made by management, as well as evaluating the overall financial statement presentation. We believe that our audits provide a reasonable basis for our opinion.
In our opinion, the financial statements referred to above present fairly, in all material respects, the financial position of Stonegate Mortgage Corporation as of December 31, 2012 and 2011, and the results of its operations and its cash flows for the years then ended in conformity with accounting principles generally accepted in the United States of America.
/s/ Richey, May & Co., LLP
Englewood, Colorado
March 30, 2013
F-59
Table of Contents
STONEGATE MORTGAGE CORPORATION
DECEMBER 31,
| 2012 |
2011 |
|||||||
| ASSETS |
||||||||
| Cash and cash equivalents |
$ | 15,055,645 | $ | 402,768 | ||||
| Restricted cash |
3,445,378 | — | ||||||
| Mortgage loans held for sale, at fair value |
218,623,951 | 61,728,834 | ||||||
| Accounts receivable |
939,854 | 229,468 | ||||||
| Servicing advances |
937,990 | 347,341 | ||||||
| Derivative assets |
11,988,706 | 3,347,255 | ||||||
| Mortgage servicing rights, at lower of amortized cost or fair value |
42,202,394 | 17,679,198 | ||||||
| Furniture, fixtures, equipment and leasehold improvements, net |
3,609,910 | 1,446,833 | ||||||
| Capitalized software, net |
415,809 | 336,063 | ||||||
| Intangible assets, net |
3,590,083 | — | ||||||
| Prepaid expenses |
606,424 | 279,455 | ||||||
| Investment in closely held entity, at cost |
740,000 | 740,000 | ||||||
| Notes receivable, stockholders |
222,023 | 289,523 | ||||||
| Loans subject to repurchase rights from Ginnie Mae |
7,116,173 | 2,011,265 | ||||||
| Deposits |
111,853 | 269,560 | ||||||
|
|
|
|
|
|||||
| TOTAL ASSETS |
$ | 309,606,193 | $ | 89,107,563 | ||||
|
|
|
|
|
|||||
| LIABILITIES AND STOCKHOLDERS’ EQUITY |
||||||||
| Secured borrowings |
$ | 102,675,252 | $ | 57,893,665 | ||||
| Warehouse lines of credit |
100,301,201 | — | ||||||
| Operating lines of credit |
5,131,213 | 8,195,812 | ||||||
| Subordinated debt, related parties |
— | 750,000 | ||||||
| Accounts payable |
8,851,586 | 889,510 | ||||||
| Accrued compensation and benefits |
4,701,568 | 354,773 | ||||||
| Accrued other expenses |
5,052,610 | 3,693,345 | ||||||
| Derivative liabilities |
1,786,505 | 1,045,529 | ||||||
| Liability for mortgage repurchases and indemnifications |
1,916,805 | — | ||||||
| Due to related parties |
348,264 | 202,148 | ||||||
| Earn-out liability |
2,094,854 | — | ||||||
| Liability for loan repurchase rights from Ginnie Mae |
7,116,173 | 2,011,265 | ||||||
| Deferred income taxes, net |
14,381,215 | 3,656,052 | ||||||
|
|
|
|
|
|||||
| Total liabilities |
254,357,246 | 78,692,099 | ||||||
|
|
|
|
|
|||||
| COMMITMENTS AND CONTINGENCIES (Note P) |
||||||||
| STOCKHOLDERS’ EQUITY |
||||||||
| Preferred stock, Series A, B, C, D $.001 par value; 13,861,519 shares authorized, 8,342,112 and 693,076 shares issued and outstanding, respectively |
32,999,990 | 2,500,000 | ||||||
| Common stock, $.001 par value; 20,792,279 shares authorized; 3,464,798 and 3,057,103 shares issued and outstanding, respectively |
250 | 221 | ||||||
| Treasury stock, 630,699 common shares |
(1,820,000 | ) | — | |||||
| Additional paid-in-capital |
3,232,645 | 4,046,033 | ||||||
| Retained earnings |
20,836,062 | 3,869,210 | ||||||
|
|
|
|
|
|||||
| Total stockholders’ equity |
55,248,947 | 10,415,464 | ||||||
|
|
|
|
|
|||||
| TOTAL LIABILITIES AND STOCKHOLDERS’ EQUITY |
$ | 309,606,193 | $ | 89,107,563 | ||||
|
|
|
|
|
|||||
The accompanying notes are an integral part of these financial statements.
F-60
Table of Contents
STONEGATE MORTGAGE CORPORATION
FOR THE YEARS ENDED DECEMBER 31,
| 2012 |
2011 |
|||||||
| REVENUE |
||||||||
| Gain on mortgage loans held for sale, net of direct costs of $8,629,442 and $3,286,986, respectively |
$ | 73,336,538 | $ | 16,735,380 | ||||
| Loan origination and other loan fees |
9,871,363 | 4,287,855 | ||||||
| Loan servicing fees |
5,908,044 | 2,627,558 | ||||||
| Interest income |
5,257,371 | 2,370,792 | ||||||
| Other revenue |
1,172,058 | — | ||||||
|
|
|
|
|
|||||
| Total revenue |
95,545,374 | 26,021,585 | ||||||
|
|
|
|
|
|||||
| EXPENSES |
||||||||
| Salaries, commissions and benefits |
32,736,538 | 13,085,459 | ||||||
| Occupancy, equipment and communication |
2,998,613 | 1,606,895 | ||||||
| General and administrative |
7,706,079 | 3,162,930 | ||||||
| Amortization of mortgage servicing rights |
3,679,545 | 959,886 | ||||||
| Impairment of mortgage servicing rights |
11,698,022 | 1,765 | ||||||
| Provision for loan losses related to repurchase liability |
1,916,805 | — | ||||||
| Interest expense |
6,238,734 | 2,727,500 | ||||||
| Depreciation |
403,903 | 193,295 | ||||||
| Amortization, intangible assets |
346,074 | 164,145 | ||||||
| Loss on disposal of property and equipment |
11,414 | 85,541 | ||||||
|
|
|
|
|
|||||
| Total expenses |
67,735,727 | 21,987,416 | ||||||
|
|
|
|
|
|||||
| INCOME BEFORE INCOME TAXES |
27,809,647 | 4,034,169 | ||||||
| INCOME TAXES |
10,724,261 | 1,699,452 | ||||||
|
|
|
|
|
|||||
| NET INCOME |
$ | 17,085,386 | $ | 2,334,717 | ||||
|
|
|
|
|
|||||
| EARNINGS PER SHARE |
||||||||
| Basic |
$ | 5.31 | $ | 0.70 | ||||
|
|
|
|
|
|||||
| Diluted |
$ | 2.26 | $ | 0.59 | ||||
|
|
|
|
|
|||||
The accompanying notes are an integral part of these financial statements.
F-61
Table of Contents
STONEGATE MORTGAGE CORPORATION
STATEMENT OF CHANGES IN STOCKHOLDERS’ EQUITY
FOR THE YEARS ENDED DECEMBER 31, 2012 AND 2011
| Preferred Stock |
Common Stock |
Treasury Stock |
Additional Paid-In Capital |
Retained Earnings |
Total |
|||||||||||||||||||||||||||
| Shares |
Amount |
Shares |
Amount |
|||||||||||||||||||||||||||||
| Balance, December 31, 2010 |
429,707 | $ | 1,550,000 | 2,853,255 | $ | 206 | $ | — | $ | 3,586,812 | $ | 1,791,864 | $ | 6,928,882 | ||||||||||||||||||
| Issuance of common stock |
— | — | 203,848 | 15 | — | 499,989 | — | 500,004 | ||||||||||||||||||||||||
| Issuance of Series C preferred stock |
263,369 | 950,000 | — | — | — | — | — | 950,000 | ||||||||||||||||||||||||
| Underwriting costs, Series C preferred stock issuance |
— | — | — | — | — | (40,768 | ) | — | (40,768 | ) | ||||||||||||||||||||||
| Preferred stock dividends |
— | — | — | — | — | — | (257,371 | ) | (257,371 | ) | ||||||||||||||||||||||
| Net income |
— | — | — | — | — | — | 2,334,717 | 2,334,717 | ||||||||||||||||||||||||
|
|
|
|
|
|
|
|
|
|
|
|
|
|
|
|
|
|||||||||||||||||
| Balance, December 31, 2011 |
693,076 | 2,500,000 | 3,057,103 | 221 | — | 4,046,033 | 3,869,210 | 10,415,464 | ||||||||||||||||||||||||
| Stock compensation expense |
— | — | — | — | — | 13,155 | — | 13,155 | ||||||||||||||||||||||||
| Issuance of common stock |
— | — | 407,695 | 29 | — | 999,971 | — | 1,000,000 | ||||||||||||||||||||||||
| Issuance of Series D preferred stock |
8,064,881 | 31,999,990 | — | — | — | — | — | 31,999,990 | ||||||||||||||||||||||||
| Underwriting costs, Series D preferred stock issuance |
— | — | — | — | — | (1,826,514 | ) | — | (1,826,514 | ) | ||||||||||||||||||||||
| Redemption of Series A preferred stock |
(415,845 | ) | (1,500,000 | ) | — | — | — | — | — | (1,500,000 | ) | |||||||||||||||||||||
| Purchase of treasury stock |
— | — | — | — | (1,820,000 | ) | — | — | (1,820,000 | ) | ||||||||||||||||||||||
| Preferred stock dividends |
— | — | — | — | — | — | (118,534 | ) | (118,534 | ) | ||||||||||||||||||||||
| Net income |
— | — | — | — | — | — | 17,085,386 | 17,085,386 | ||||||||||||||||||||||||
|
|
|
|
|
|
|
|
|
|
|
|
|
|
|
|
|
|||||||||||||||||
| Balance, December 31, 2012 |
8,342,112 | $ | 32,999,990 | 3,464,798 | $ | 250 | $ | (1,820,000 | ) | $ | 3,232,645 | $ | 20,836,062 | $ | 55,248,947 | |||||||||||||||||
|
|
|
|
|
|
|
|
|
|
|
|
|
|
|
|
|
|||||||||||||||||
The accompanying notes are an integral part of these financial statements.
F-62
Table of Contents
STONEGATE MORTGAGE CORPORATION
FOR THE YEARS ENDED DECEMBER 31,
| 2012 |
2011 |
|||||||
| CASH FLOWS FROM OPERATING ACTIVITIES |
||||||||
| Net income |
$ | 17,085,386 | $ | 2,334,717 | ||||
| Adjustments to reconcile net income to net cash provided by (used in) operating activities: |
||||||||
| Bargain purchase, NattyMac acquisition |
(1,172,058 | ) | — | |||||
| Depreciation expense |
403,903 | 193,295 | ||||||
| Amortization, intangible assets |
346,074 | 164,145 | ||||||
| Amortization, mortgage servicing rights |
3,679,545 | 959,886 | ||||||
| Impairment, mortgage servicing rights |
11,698,022 | 1,765 | ||||||
| Gain on mortgage loans held for sale |
(73,336,538 | ) | (16,735,380 | ) | ||||
| Provision for loan losses related to repurchase and indemnification liability |
1,916,805 | — | ||||||
| Proceeds from sale and principal payments of mortgage loans held for sale |
3,325,948,888 | 1,068,263,734 | ||||||
| Originations and purchases of mortgage loans held for sale |
(3,449,407,328 | ) | (1,050,433,712 | ) | ||||
| Loss on disposal of property and equipment |
11,414 | 85,541 | ||||||
| Stock compensation expense |
13,155 | — | ||||||
| Deferred income taxes |
10,724,261 | 1,703,985 | ||||||
| (Increase) decrease in - |
||||||||
| Restricted cash |
(3,445,378 | ) | 750,000 | |||||
| Accounts receivable |
(710,386 | ) | (181,545 | ) | ||||
| Servicing advances |
(590,649 | ) | (20,966 | ) | ||||
| Derivative assets |
(8,641,451 | ) | — | |||||
| Prepaid expenses |
(326,969 | ) | (106,479 | ) | ||||
| Deposits |
157,707 | (226,701 | ) | |||||
| Increase (decrease) in- |
||||||||
| Accounts payable |
7,962,076 | 624,714 | ||||||
| Accrued compensation and benefits |
4,346,795 | 129,922 | ||||||
| Accrued other expenses |
1,359,265 | 1,700,655 | ||||||
| Derivative liabilities |
740,976 | |||||||
| Liability for mortgage repurchases and indemnification |
— | — | ||||||
| Due to related parties |
146,116 | — | ||||||
|
|
|
|
|
|||||
| Net cash (used in) provided by operating activities |
(151,090,369 | ) | 9,207,576 | |||||
|
|
|
|
|
|||||
| CASH FLOWS FROM INVESTING ACTIVITIES |
||||||||
| Purchase of furniture, fixtures, equipment and leasehold improvements |
(2,578,394 | ) | (1,025,625 | ) | ||||
| Acquisition of capitalized software |
(305,903 | ) | (200,325 | ) | ||||
| Acquisition of intangible assets |
(443,088 | ) | — | |||||
| Advances (repayments) notes receivable, stockholders |
67,500 | (62,500 | ) | |||||
|
|
|
|
|
|||||
| Net cash used in investing activities |
(3,259,885 | ) | (1,288,450 | ) | ||||
|
|
|
|
|
|||||
| CASH FLOWS FROM FINANCING ACTIVITIES |
||||||||
| Borrowings under mortgage funding arrangements and operating lines of credit |
145,082,788 | 6,054,934 | ||||||
| Repayments under mortgage funding arrangements and operating lines of credit |
(3,064,599 | ) | (16,044,254 | ) | ||||
| Borrowings, subordinate debt |
— | 750,000 | ||||||
| Repayments, subordinate debt |
(750,000 | ) | — | |||||
| Repayments of capital lease obligations |
— | (7,979 | ) | |||||
| Issuance of common stock |
1,000,000 | 500,004 | ||||||
| Issuance of preferred stock |
31,999,990 | 909,232 | ||||||
| Underwriting costs, preferred stock issuance |
(1,826,514 | ) | — | |||||
| Redemption of Series A preferred stock |
(1,500,000 | ) | — | |||||
| Purchase of treasury stock |
(1,820,000 | ) | — | |||||
| Preferred stock dividends |
(118,534 | ) | (257,371 | ) | ||||
|
|
|
|
|
|||||
| Net cash provided by (used in) financing activities |
169,003,131 | (8,095,434 | ) | |||||
|
|
|
|
|
|||||
The accompanying notes are an integral part of these financial statements.
F-63
Table of Contents
STONEGATE MORTGAGE CORPORATION
STATEMENTS OF CASH FLOWS
FOR THE YEARS ENDED DECEMBER 31,
| 2012 |
2011 |
|||||||
| INCREASE (DECREASE) IN CASH AND CASH EQUIVALENTS |
14,652,877 | (176,308 | ) | |||||
| CASH AND CASH EQUIVALENTS, BEGINNING OF YEAR |
402,768 | 579,076 | ||||||
|
|
|
|
|
|||||
| CASH AND CASH EQUIVALENTS, END OF YEAR |
$ | 15,055,645 | $ | 402,768 | ||||
|
|
|
|
|
|||||
| SUPPLEMENTAL INFORMATION |
||||||||
| Cash paid for interest |
$ | 6,203,104 | $ | 2,249,556 | ||||
|
|
|
|
|
|||||
| Cash paid for taxes |
$ | — | $ | — | ||||
|
|
|
|
|
|||||
NON-CASH INVESTING AND FINANCING ACTIVITIES
The Company retained mortgage servicing rights of $39,902,528 and $11,510,883 in connection with loan sales during the years ended December 31, 2012 and 2011, respectively.
In connection with the NattyMac acquisition in 2012, the Company paid cash of $511,828, accrued an earn-out liability of $2,094,854 for the contingent consideration arrangement, and recorded identifiable intangible assets of $3,710,000, property and equipment of $56,913 and other assets of $11,827.
The Company recognized loans subject to repurchase rights from GNMA and the related liability of $7,116,173 and $2,011,265 for the years ended December 31, 2012 and 2011, respectively.
The accompanying notes are an integral part of these financial statements.
F-64
Table of Contents
STONEGATE MORTGAGE CORPORATION
A. ORGANIZATION AND OPERATIONS
We are a specialty financial services firm focused on the U.S. residential mortgage market. We originate, acquire, sell, finance and service agency and non-agency residential mortgage loans. Our vertically integrated and scalable residential mortgage banking platform enables us to efficiently and effectively originate, acquire, sell, finance and service residential mortgage loans. Our platform and operating model provides our constituents visibility and access to essential data, documents and analytics related to the loan and originator performance over time. Our principal sources of revenue include (i) gain on sale from securitizations and whole loan sales, and fee income from originations, (ii) fee income from loan servicing, and (iii) fee and net interest income from our syndicated financing facility.
The Company was initially incorporated in the State of Indiana in January 2005. As a result of an acquisition and subsequent downstream merger with Swain Mortgage Company in 2009, we are now an Ohio corporation. Our headquarters is in Indianapolis, Indiana and we have offices throughout the central United States.
B. SUMMARY OF SIGNIFICANT ACCOUNTING POLICIES
Basis of Presentation
The accompanying financial statements are prepared on the accrual basis in accordance with accounting principles generally accepted in the United States of America (“GAAP”).
Use of Estimates
The preparation of financial statements in conformity with GAAP requires management to make estimates and assumptions that affect the reported amounts of assets and liabilities, the disclosure of contingent assets and liabilities at the date of the financial statements and the reported amounts of revenues and expenses during the reporting period. Actual results could materially differ from those estimates.
Risks and Uncertainties
In the normal course of business, companies in the mortgage banking industry encounter certain economic and regulatory risks. Economic risks include interest rate risk and credit risk. The Company is subject to interest rate risk to the extent that in a rising interest rate environment, the Company may experience a decrease in loan production, as well as decreases in the value of mortgage loans held for sale and in commitments to originate loans, which may negatively impact the Company’s operations. Credit risk is the risk of default that may result from the borrowers’ inability or unwillingness to make contractually required payments during the period in which loans are being held for sale.
The Company sells loans to investors without recourse. As such, the investors have assumed the risk of loss or default by the borrower. However, the Company is usually required by these investors to make certain standard representations and warranties relating to credit information, loan documentation and collateral.
To the extent that the Company does not comply with such representations, or there are early payment defaults, the Company may be required to repurchase the loans or indemnify these investors for any losses from borrower defaults. In addition, if loans pay off within a specified time frame, the Company may be required to refund a portion of the sales proceeds to the investors.
F-65
Table of Contents
STONEGATE MORTGAGE CORPORATION
NOTES TO FINANCIAL STATEMENTS
B. SUMMARY OF SIGNIFICANT ACCOUNTING POLICIES (Continued)
Risks and Uncertainties (Continued)
The Company’s business requires substantial cash to support its operating activities. As a result, the Company is dependent on its lines of credit, and other financing facilities in order to finance its continued operations. If the Company’s principal lenders decided to terminate or not to renew any of these credit facilities with the Company, the loss of borrowing capacity would have a material adverse impact on the Company’s financial statements unless the Company found a suitable alternative source of financing.
Consolidation
The Company’s loans held for sale are sold predominantly to Fannie Mae (FNMA), which is a government-sponsored enterprise (“GSE”). The Company also issues Ginnie Mae (GNMA) securities by pooling eligible loans through a pool custodian and assigning rights to the loans to GNMA. FNMA and GNMA provide credit enhancement of the loans through certain guarantee provisions. These securitizations involve variable interest entities (VIEs) as the trusts or similar vehicles, by design, that either (1) lack sufficient equity to permit the entity to finance its activities without additional subordinated financial support from other parties, or (2) have equity investors that do not have the ability to make significant decisions relating to the entity’s operations through voting rights, or do not have the obligation to absorb the expected losses, or do not have the right to receive the residual returns of the entity.
The primary beneficiary of a VIE (i.e., the party that has a controlling financial interest) is required to consolidate the assets and liabilities of the VIE. The primary beneficiary is the party that has both (1) the power to direct the activities of an entity that most significantly impact the VIE’s economic performance; and (2) through its interests in the VIE, the obligation to absorb losses or the right to receive benefits from the VIE that could potentially be significant to the VIE. The Company typically retains the right to service the loans. Because of the power of FNMA and GNMA over the VIEs that hold the assets from these residential mortgage loan securitizations, principally through its rights and responsibilities as master servicer, the Company is not the primary beneficiary of the VIEs and therefore the VIEs are not consolidated.
The Company performs on-going reassessments of: (1) whether entities previously evaluated under the majority voting-interest framework have become VIEs, based on certain events, and therefore become subject to the VIE consolidation framework; and (2) whether changes in the facts and circumstances regarding the Company’s involvement with a VIE cause the Company’s consolidation determination to change.
Derivatives
All derivatives are recognized as either assets or liabilities and measured at fair value. The Company accounts for all of its derivatives as free-standing derivatives and does not designate any for hedge accounting.
The Company enters into commitments to originate residential mortgage loans held for sale, at specified interest rates and within a specified period of time, with customers who have applied for a loan and meet certain credit and underwriting criteria (interest rate lock commitments). These interest rate lock commitments meet the definition of a derivative and are reflected in the balance sheet at fair value with changes in fair value recognized in current period earnings. Unrealized gains and losses on the interest rate lock commitments, reflected as derivative assets and derivative liabilities, respectively, are measured based on the value of the underlying mortgage loan, quoted Agency mortgage backed security (MBS) prices, estimates of the fair value of the mortgage servicing rights and the probability that the mortgage loan will fund within the terms of the interest rate lock commitment.
F-66
Table of Contents
STONEGATE MORTGAGE CORPORATION
NOTES TO FINANCIAL STATEMENTS
B. SUMMARY OF SIGNIFICANT ACCOUNTING POLICIES (Continued)
Derivatives (Continued)
The Company manages the interest rate price risk associated with its outstanding interest rate lock commitments and loans held for sale by entering into derivative loan instruments such as forward loan sales commitments, mandatory delivery commitments, options and futures contracts. Management expects these derivatives will experience changes in fair value opposite to changes in fair value of the interest rate lock commitments and loans held for sale, thereby reducing earnings volatility. The Company takes into account various factors and strategies in determining the portion of the mortgage pipeline (interest lock commitments) and loans held for sale it wants to economically hedge.
To the extent derivatives subject to master netting arrangements meet applicable requirements, the Company presents the derivative balances and related cash collateral amounts net on the balance sheet.
Mortgage Loans Held for Sale and Revenue Recognition
Mortgage loans held for sale are carried at fair value under the fair value option with changes in fair value recognized in current period earnings. At the date of funding of the mortgage loan held for sale, the funded amount of the loan plus the related derivative asset or liability of the associated interest rate lock commitment becomes the initial recorded investment in the mortgage loan held for sale. Such amount is expected to approximate the fair value of the loan.
Mortgage loans held for sale are considered sold when the Company surrenders control over the financial assets. Control is considered to have been surrendered when the transferred assets have been isolated from the Company, beyond the reach of the Company and its creditors; the purchaser obtains the right (free of conditions that constrain it from taking advantage of that right) to pledge or exchange the transferred assets; and the Company does not maintain effective control over the transferred assets through an agreement that both entitles and obligates the Company to repurchase or redeem the transferred assets before their maturity or the ability to unilaterally cause the holder to return specific assets.
Such sales may involve securitizations, participation agreements or repurchase agreements. If the criteria above is not met, such sales transactions are accounted for as secured borrowings, in which the assets remain on the balance sheet and the proceeds from the transaction are recognized as a liability.
Gains and losses from the sale of mortgages are recognized based upon the difference between the sales proceeds and carrying value of the related loans upon sale and is recorded in gain on mortgage loans held for sale. The sales proceeds reflect the cash received and the initial fair value of the separately recognized mortgage servicing rights less the fair value of the incurred liability for mortgage repurchases and indemnifications. Gain on mortgage loans held for sale also includes the unrealized gains and losses associated with the mortgage loans held for sale and the realized and unrealized gains and losses from derivatives.
Interest income on mortgage loans is accrued to income based upon the principal amount outstanding and contractual interest rates. Income recognition is discontinued when loans become 90 days delinquent or when in management’s opinion, the collectability of principal and income becomes doubtful.
F-67
Table of Contents
STONEGATE MORTGAGE CORPORATION
NOTES TO FINANCIAL STATEMENTS
B. SUMMARY OF SIGNIFICANT ACCOUNTING POLICIES (Continued)
Mortgage Servicing Rights
The Company capitalizes mortgage servicing rights (“MSRs”) at fair value at the time the underlying loans are sold and the Company assumes the obligation to service the loans. To determine the fair value of the MSRs, the Company uses a valuation model that calculates the present value of future cash flows. The valuation model incorporates assumptions that market participants would use in estimating future net servicing income, including estimates of the cost of servicing, the discount rate, float value, the inflation rate, estimated prepayment speeds, and default rates. MSRs currently are not actively traded in the markets, accordingly, considerable judgment is required to estimate their fair value and the exercise of that judgment can materially impact current period earnings.
The Company subsequently amortizes the MSRs using the amortization method whereby amortization is recognized in proportion to the estimated future net servicing revenue. The net capitalized cost of the MSRs is periodically evaluated to determine that capitalized amounts are not in excess of their estimated fair value. Estimates of remaining loan lives and prepayment rates are incorporated into the model. For this purpose, the Company stratifies its mortgage servicing rights into three pools based upon interest rates, those with notes rates below 4.00%, note rates between 4.00% and 4.99% and note rates above 5.00%.
The Company periodically evaluates its MSRs for impairment. Impairment is assessed based on fair value at each reporting date using estimated prepayment speeds of the underlying mortgage loans serviced and stratification based on risk characteristics of the underlying loans (predominantly interest rate). As mortgage interest rates fall, prepayment speeds are usually faster and the value of the MSR asset generally decreases, requiring additional valuation allowance. Conversely, as mortgage interest rates rise, prepayment speeds are usually slower and the value of the MSR asset generally increases, requiring less valuation allowance. A valuation allowance is established, through a charge to earnings, to the extent the amortized cost of the MSR exceeds the estimated fair value by stratification. If it is later determined that all or a portion of the temporary impairment no longer exists for a stratification, the valuation is reduced through a recovery to earnings. An other-than-temporary impairment (i.e. recoverability is considered remote when considering interest rates and loan pay off activity) is recognized as a write-down of the MSR asset and the related valuation allowance (to the extent a valuation allowance is available) and then against earnings. A direct write-down permanently reduces the carrying value of the MSR asset and valuation allowance, precluding subsequent recoveries.
Liability for Loan Repurchases and Indemnifications
Loans sold to investors by the Company and which met investor and agency underwriting guidelines at the time of sale may be subject to repurchase or indemnification in the event of specific default by the borrower or subsequent discovery that underwriting standards were not met. The Company may, upon mutual agreement, agree to repurchase the loans or indemnify the investor against future losses on such loans. In such cases, the Company bears any subsequent credit loss on the loans. The Company has established a liability for potential losses related to these representations and warranties with a corresponding amount/adjustment recorded to the provision for loan loss. In assessing the adequacy of the liability, management evaluates various factors including actual losses on repurchases and indemnifications during the period, historical loss experience, known delinquent and other problem loans, and economic trends and conditions in the industry.
F-68
Table of Contents
STONEGATE MORTGAGE CORPORATION
NOTES TO FINANCIAL STATEMENTS
B. SUMMARY OF SIGNIFICANT ACCOUNTING POLICIES (Continued)
GNMA Securitization Loan Repurchases
When the Company has the unilateral right to repurchase GNMA pool loans it has previously sold (generally loans that are more than 90 days past due), the Company then records the loan on its balance sheet. The recognition of previously sold loans does not impact the accounting for the previously recognized mortgage servicing rights. At December 31, 2012 and 2011, delinquent or defaulted mortgage loans currently in GNMA pools that the Company has recognized on its balance sheet totaled $7.1 million and $2.0 million, respectively.
Loan Servicing Fees
Loan servicing fees represent fees earned for servicing loans for various investors. The servicing fees are based on a contractual percentage of the outstanding principal balance and recognized into revenue as the related mortgage payments are received. Loan servicing expenses are charged to operations as incurred.
Servicing Advances
Servicing advances represent escrows and advances on behalf of customers and investors to cover delinquent balances for property taxes, insurance premiums and other out-of-pocket costs. Advances are made in accordance with the servicing agreements and are recoverable upon liquidation. The Company periodically reviews the advances for collectability and amounts are written off when they are deemed uncollectible.
Furniture, Fixtures, Equipment and Leasehold Improvements
Furniture, fixture and equipment are recorded at cost and depreciated using straight-line methods over estimated useful lives of three to ten years. Leasehold improvements are amortized using the straight-line method over the shorter of the related lease term or their estimated economic useful lives.
Capitalized Software
The Company capitalized certain third-party consulting costs related to computer software for internal use. Software is amortized using the straight-line method over estimated lives of three years. Amortization expense amounted to $226,157 and $164,145 for the years ended December 31, 2012 and 2011, respectively.
Intangible Assets
The finite-lived purchased intangible assets consist of customer relationships and an active agent list, which have useful lives of 8 years and 5 years, respectively. Intangible assets with finite lives are amortized over their estimated lives using a straight line amortization method. The Company evaluates the estimated remaining useful lives on intangible assets to determine whether events or changes in circumstances warrant a revision to the remaining periods of amortization. If the estimate of an intangible asset’s useful life is changed, the remaining carrying amount of the intangible asset is amortized prospectively over that revised remaining useful life. Additionally, an intangible asset that initially is deemed to have a finite useful life would cease being amortized if it is subsequently determined to have an indefinite useful life. Such intangible asset is then tested for impairment. The Company reviews such intangibles for impairment whenever events or changes in circumstances indicate their carrying amounts may not be recoverable, in which case an impairment charge would be recorded.
F-69
Table of Contents
STONEGATE MORTGAGE CORPORATION
NOTES TO FINANCIAL STATEMENTS
B. SUMMARY OF SIGNIFICANT ACCOUNTING POLICIES (Continued)
Intangible Assets (Continued)
The indefinite-lived purchased intangible asset consists of a trade name. Intangible assets with an indefinite useful life are not subject to amortization but are reviewed for impairment annually or more frequently whenever events or changes in circumstances indicate that the carrying amount of an intangible asset may not be recoverable. The Company first assesses qualitative factors to determine whether the existence of events or circumstances leads to a determination that is more likely than not that an indefinite-lived intangible asset is impaired. If the Company determines that it is more likely than not that the intangible asset is impaired, a quantitative impairment test is performed. For the quantitative impairment test, the Company compares the fair value of an indefinite-lived intangible asset with its carrying amount. If the carrying amount of an intangible asset exceeds its fair value, the amount of the impairment is measured as the difference between the carrying amount of the asset and its fair value. Impairment is permanently recognized by writing down the asset to the extent that the carrying value exceeds the estimated fair value.
Long-Lived Assets
The Company periodically assesses long-lived assets for recoverability whenever events or changes in circumstances indicate that their carrying amounts may not be recoverable. If management identifies an impairment indicator, it assesses recoverability by comparing the carrying amount of the asset to the undiscounted cash flows expected to result from the use and eventual disposition of the asset. An impairment loss is recognized whenever the carrying amount is not recoverable. No such impairment was recognized for the years ended December 31, 2012 and 2011, respectively.
Investment in Closely Held Entity
Investment in closely held entity consists of shares of voting common and preferred stock, which the Company owns in a non-publicly traded entity. The investment is carried at cost as the Company does not exercise significant influence over the entity’s operating and financial activities. The Company has determined it is not practical to estimate the fair value of the investment. Based upon its evaluation, the Company has not identified any event or change in circumstances occurring during the period that may have a significant adverse effect on the fair value of the investment.
Stock-Based Compensation
The Company recognizes expense relating to its stock-based compensation based upon the fair value of the award on the grant date. The cost is recognized over the vesting or service period.
Advertising and Marketing
Advertising and marketing is expensed as incurred and amounted to $1,059,475 and $413,692 for the years ended December 31, 2012 and 2011, respectively.
Income Taxes
Income taxes are provided for the tax effects of transactions reported in the financial statements and consist of taxes currently due plus deferred taxes related primarily to differences between the basis of certain assets and liabilities for financial and tax reporting. The deferred taxes represent the future tax return consequences of those differences, which will either be taxable or deductible when the assets and liabilities are recovered or settled. Deferred tax assets are recognized to the extent that realization is “more likely than not.”
F-70
Table of Contents
STONEGATE MORTGAGE CORPORATION
NOTES TO FINANCIAL STATEMENTS
B. SUMMARY OF SIGNIFICANT ACCOUNTING POLICIES (Continued)
Income Taxes (Continued)
The Company’s income tax expense includes assessments related to uncertain tax positions taken or expected to be taken by the Company. Management has concluded that it currently does not have any significant uncertain tax positions. If applicable, the Company will recognize interest and penalties related to unrecognized tax benefits as a component of income tax expense. The open tax years subject to examination by taxing authorities include the years ended December 31, 2011, 2010, and 2009. The Company has no federal or state tax examinations in process as of December 31, 2012.
Cash and Cash Equivalents
For cash flow purposes, the Company considers cash and temporary investments with original maturities of three months or less, to be cash and cash equivalents. The Company typically maintains cash in financial institutions in excess of FDIC limits. The Company evaluates the creditworthiness of these financial institutions in determining the risk associated with these cash balances.
Restricted Cash
The Company maintains cash balances that are restricted under broker margin account agreements.
Escrow and Fiduciary Funds
The Company maintains segregated bank accounts in trust for investors and escrow balances for mortgagors. The balances of these accounts amounted to $98,423,192 and $23,668,462 at December 31, 2012 and 2011, respectively, and are excluded from the Company’s balance sheet.
Reclassifications
Certain reclassifications have been made to prior year balances to conform to the current year financial statement presentation.
Earnings Per Share
Basic earnings per share is computed based on the weighted average number of common shares outstanding during the period presented. Diluted earnings per share is computed based on the weighted-average number of common shares plus the effect of dilutive potential common shares outstanding during the period presented using the treasury stock method. Dilutive potential common shares represent convertible preferred stock and employee and director stock options.
C. MORTGAGE LOANS HELD FOR SALE, AT FAIR VALUE
The following summarizes mortgage loans held for sale at fair value at December 31:
| 2012 |
2011 |
|||||||
| Conventional |
$ | 110,492,545 | $ | 27,748,435 | ||||
| Governmental |
108,131,406 | 33,980,399 | ||||||
|
|
|
|
|
|||||
| $ | 218,623,951 | $ | 61,728,834 | |||||
|
|
|
|
|
|||||
At December 31, 2012 and 2011, the Company had pledged approximately $218 million and $61 million, respectively, in fair value of mortgage loans held for sale to secure mortgage funding arrangements.
F-71
Table of Contents
STONEGATE MORTGAGE CORPORATION
NOTES TO FINANCIAL STATEMENTS
D. DERIVATIVE INSTRUMENTS
The following summarizes derivative instruments at December 31:
| December 31, 2012 |
December 31, 2011 |
|||||||||||||||
| Description |
Fair Value |
Notional Amount |
Fair Value |
Notional |
||||||||||||
| Interest rate lock commitments |
$ | 11,988,706 | $ | 1,139,963,000 | $ | 3,347,255 | $ | 112,085,000 | ||||||||
| MBS forward sales contracts |
(1,786,505 | ) | $ | 967,780,000 | (1,045,529 | ) | $ | 153,320,000 | ||||||||
|
|
|
|
|
|||||||||||||
| Total |
$ | 10,202,201 | $ | 2,301,726 | ||||||||||||
|
|
|
|
|
|||||||||||||
The Company recorded net gains (losses) on derivatives of $(4,089,161) and $156,834 for the years ended December 31, 2012 and 2011, respectively, which are included in gain on mortgage loans held for sale in the statement of operations.
E. FURNITURE, FIXTURES, EQUIPMENT AND LEASEHOLD IMPROVEMENTS
The following summarizes furniture, fixtures, and equipment and leasehold improvements at December 31:
| 2012 |
2011 |
|||||||
| Computer equipment |
$ | 2,502,390 | $ | 806,651 | ||||
| Furniture and office equipment |
1,650,540 | 941,346 | ||||||
| Leasehold improvements |
304,061 | 245,608 | ||||||
|
|
|
|
|
|||||
| Total |
4,456,991 | 1,993,605 | ||||||
| Less accumulated depreciation |
(847,081 | ) | (546,772 | ) | ||||
|
|
|
|
|
|||||
| $ | 3,609,910 | $ | 1,446,833 | |||||
|
|
|
|
|
|||||
Depreciation and amortization expense amounted to $403,903 and $193,295 for the years ended December 31, 2012 and 2011, respectively.
F. MORTGAGE SERVICING RIGHTS
The Company sells residential mortgage loans in the secondary market and typically retains the right to service the loans sold. Upon sale, an MSR asset or liability is capitalized, which represents the current fair value of future net cash flows expected to be realized for performing servicing activities. As the Company has not elected to subsequently measure its existing class of servicing assets under the fair value measurement method, the Company follows the amortization method. MSRs are amortized in proportion to and over the period of estimated net servicing income, and assessed for impairment at each reporting date. MSRs are carried at the lower of initial capitalized amount, net of accumulated amortization, or estimated fair value.
The Company periodically evaluates it MSRs for impairment. Impairment is assessed based on fair value at each reporting date using estimated prepayment speeds of the underlying mortgage loans serviced and stratifications based on the risk characteristics of the underlying loans (predominantly interest rate). For this purpose, the Company stratifies its MSRs into three pools based upon interest rates: those with note rates below 4.00%, note rates between 4.00% and 4.99%, and note rates above 5%.
F-72
Table of Contents
STONEGATE MORTGAGE CORPORATION
NOTES TO FINANCIAL STATEMENTS
F. MORTGAGE SERVICING RIGHTS (Continued)
A summary of changes in the balance of the MSR asset and the related valuation allowance for the years ended December 31 is as follows:
| 2012 |
2011 |
|||||||
| Mortgage Servicing Rights: |
||||||||
| Balance at the beginning of year |
$ | 17,679,198 | $ | 7,129,966 | ||||
| Loans sold, servicing retained |
39,902,528 | 11,510,883 | ||||||
| Amortization |
(3,679,545 | ) | (959,886 | ) | ||||
| Valuation allowance |
(11,699,787 | ) | (1,765 | ) | ||||
|
|
|
|
|
|||||
| Balance at end of year |
$ | 42,202,394 | $ | 17,679,198 | ||||
|
|
|
|
|
|||||
| Valuation Allowance: |
||||||||
| Balance at the beginning of year |
$ | 1,765 | $ | — | ||||
| Additions |
11,698,022 | 1,765 | ||||||
| Reductions |
— | — | ||||||
|
|
|
|
|
|||||
| Balance at end of year |
$ | 11,699,787 | $ | 1,765 | ||||
|
|
|
|
|
|||||
The fair value of MSRs was approximately $42.2 million, $17.7 million, and $7.1 million as of December 31, 2012, 2011 and 2010, respectively.
The Company did not record any other-than-temporary impairment for the years ended December 31, 2012 and 2011.
The Company’s mortgage servicing portfolio is summarized as follows at December 31:
| 2012 |
2011 |
|||||||
| FNMA |
$ | 2,781,388,717 | $ | 801,789,123 | ||||
| GNMA |
1,363,951,053 | 514,099,118 | ||||||
|
|
|
|
|
|||||
| Total Servicing Portfolio |
$ | 4,145,339,770 | $ | 1,315,888,241 | ||||
|
|
|
|
|
|||||
| MSRs, net to servicing portfolio |
1.02 | % | 1.34 | % | ||||
|
|
|
|
|
|||||
The following table summarizes the Company’s estimated future MSR amortization expense. These estimates are based on existing asset balances, the current interest rate environment, and prepayment speeds as of December 31, 2012. The actual amortization expense the Company recognizes in any given period may be significantly different depending upon acquisition or sale activities, changes in interest rates, prepayment speeds, market conditions, or circumstances that indicate the carrying amount of an asset may not be recoverable.
| Year Ending December 31, |
Amount |
|||
| 2013 |
$ | 6,944,548 | ||
| 2014 |
5,566,146 | |||
| 2015 |
4,562,793 | |||
| 2016 |
3,948,227 | |||
| 2017 |
3,523,627 | |||
| Thereafter |
29,356,840 | |||
|
|
|
|||
| $ | 53,902,181 | |||
|
|
|
|||
F-73
Table of Contents
STONEGATE MORTGAGE CORPORATION
NOTES TO FINANCIAL STATEMENTS
G. NOTES RECEIVABLE, STOCKHOLDERS
The Company has notes receivable outstanding to stockholders in the amount of $222,023 and $289,523 as of December 31, 2012 and 2011, respectively. The notes are unsecured and bear interest at the prime rate with outstanding principal and interest due on April 1, 2014.
H. INTANGIBLES
The Company’s purchased intangibles associated with the NattyMac acquisition (Note R) for the year ended December 31, 2012 are comprised of:
| Gross Carrying |
Accumulated |
Net Carrying |
Weighted-Average | |||||||||||
| Amortized Intangible Assets: |
||||||||||||||
| Customer Relationships |
$ | 2,350,000 | $ | (97,917 | ) | $ | 2,252,083 | 8 Years | ||||||
| Active Agent List |
330,000 | (22,000 | ) | 308,000 | 5 Years | |||||||||
|
|
|
|
|
|
|
|||||||||
| Total |
$ | 2,680,000 | $ | (119,917 | ) | $ | 2,560,083 | |||||||
|
|
|
|
|
|
|
|||||||||
| Unamortized Intangible Assets: |
||||||||||||||
| “NattyMac” Trade Name |
$ | 1,030,000 | ||||||||||||
|
|
|
|||||||||||||
The Company did not have any purchased intangible assets for the fiscal year ended December 31, 2011.
The Company recorded amortization expense on its intangible assets of $119,917 and $0 for the years ended December 31, 2012 and 2011, respectively. The projections of amortization expense for the next five years are based on existing asset balances at December 31, 2012. Future amortization expense may vary from these projections.
The following table provides the estimated future amortization expense from amortized intangible assets.
| Estimated Amortization Expense |
Customer |
Active |
||||||
| 2013 |
$ | 293,750 | $ | 66,000 | ||||
| 2014 |
293,750 | 66,000 | ||||||
| 2015 |
293,750 | 66,000 | ||||||
| 2016 |
293,750 | 66,000 | ||||||
| 2017 |
293,750 | 44,000 | ||||||
| Thereafter |
783,333 | — | ||||||
|
|
|
|
|
|||||
| $ | 2,252,083 | $ | 308,000 | |||||
|
|
|
|
|
|||||
The Company did not record any impairment charges relating to the indefinite-lived intangible asset for the year ended December 31, 2012.
I. TRANSFERS OF FINANCIAL ASSETS
Residential mortgage loans are sold to or pursuant to programs sponsored by FNMA or GNMA. The Company has continuing involvement in mortgage loans sold through servicing arrangements and the liability for loan indemnifications and repurchases under the representation and warranties it makes to the purchasers and
F-74
Table of Contents
STONEGATE MORTGAGE CORPORATION
NOTES TO FINANCIAL STATEMENTS
I. TRANSFERS OF FINANCIAL ASSETS (Continued)
insurers of the loans it sells. The Company is exposed to interest rate risk through its continuing involvement with mortgage loans sold, including the mortgage servicing right asset, as the value of the asset fluctuates as changes in interest rates impact borrower prepayment on the underlying mortgage loans.
All loans are sold on a non-recourse basis; however, representations and warranties have been made that are customary for loan sale transactions, including eligibility characteristics of the mortgage loans and underwriting responsibilities, in connection with the sales of these assets.
In order to facilitate the origination and sale of mortgage loans held for sale, the Company entered into various agreements with warehouse lenders. Such agreements are in the form of loan participations and repurchase agreements with banks and other financial institutions. Mortgage loans held for sale are considered sold when the Company surrenders control over the financial assets and such financial assets are legally isolated from the Company in the event of bankruptcy. For loan participations and repurchase agreements that meet the sale criteria, the transferred financial assets are derecognized from the balance sheet and a gain or loss is recognized upon sale. If the sale criteria are not met, the transfer is recorded as a secured borrowing in which the assets remain on the balance sheet and the proceeds from the transaction are recognized as a liability. All repurchase agreements are accounted for by the Company as secured borrowings.
From time to time, the Company may sell loans whereby the underlying risks and cash flows of the mortgage loan have been transferred to a third party through the issuance of participating interests. The terms and conditions of these interests are governed by the participation agreements. In the instances where the loan participation has qualified for sale treatment, the Company will act as an agent on behalf of the participating entity when negotiating the terms of the ultimate sale of the underlying mortgage loan to the government- sponsored entities (FNMA AND GNMA). The Company will receive a marketing fee paid by the participating entity upon completion of the sale. In addition, the Company will also service the underlying mortgage loans to the participation agreement for the period that the participating interests are outstanding.
The following table sets forth information regarding cash flows relating to loan sales in which the Company has continuing involvement:
| 2012 |
2011 |
|||||||
| Cash Flows: |
||||||||
| Proceeds from new loan sales |
$ | 28,391,912 | $ | 4,335,097 | ||||
| Servicing fees |
$ | 6,229,292 | $ | 2,623,678 | ||||
| Net servicing advances |
$ | 590,648 | $ | 137,548 | ||||
| Purchase of previously transferred financial assets |
$ | — | $ | — | ||||
| Year-End Information: |
||||||||
| Unpaid principal balance, loans outstanding |
$ | 4,145,339,770 | $ | 1,316,048,814 | ||||
| Loans delinquent 90 or more days or in foreclosure |
$ | 11,349,867 | $ | 5,523,749 | ||||
| Loans delinquent 30-89 days |
$ | 61,075,698 | $ | 26,398,700 | ||||
F-75
Table of Contents
STONEGATE MORTGAGE CORPORATION
NOTES TO FINANCIAL STATEMENTS
J. DEBT OBLIGATIONS
Short-Term Borrowings:
Short-term borrowings were as follows for the years ended December 31:
| 2012 |
2011 |
|||||||||||||||
| Amounts |
Weighted |
Amounts |
Weighted |
|||||||||||||
| Secured borrowings |
$ | 102,675,252 | 3.35 | % | $ | 57,893,665 | 4.03 | % | ||||||||
| Warehouse lines of credit |
100,301,201 | 2.59 | % | — | N/A | |||||||||||
| Operating lines of credit |
5,131,213 | 4.17 | % | 8,195,812 | 4.24 | % | ||||||||||
|
|
|
|
|
|||||||||||||
| $ | 208,107,666 | $ | 66,089,477 | |||||||||||||
|
|
|
|
|
|||||||||||||
The Company maintains mortgage participation and warehouse lines of credit (collectively referred to as “mortgage funding arrangements”) with various financial institutions, primarily to fund the origination of mortgage loans which are subject to participation. As of December 31, 2012, there were three mortgage funding arrangements with three financial institutions with a total maximum borrowing capacity of $365,000,000, of which $202,976,453 was outstanding. As of December 31, 2011, there were two mortgage funding arrangements with two financial institutions with a total size of $115,000,000, of which $57,893,665 was outstanding. Each mortgage funding arrangements is collateralized by the underlying mortgages.
The following table summarizes the interest rate and maturity for the mortgage funding arrangement outstanding as of December 31, 2012 and 2011:
| December 31, 2012 |
Interest Rate |
Maturity Date | ||
| Mortgage funding arrangement-Party A |
Same as the underlying mortgage rates |
May 2013 | ||
| Mortgage funding arrangement-Party B |
Libor plus applicable margin | December 2013 | ||
| Mortgage funding arrangement-Party C |
Same as the underlying mortgage rates |
No maturity date |
| December 31, 2011 |
Interest Rate |
Maturity Date | ||
| Mortgage funding arrangement-Party A |
Same as the underlying mortgage rates |
May 2012 | ||
| Mortgage funding arrangement-Party C |
Same as the underlying mortgage rates |
No maturity date |
The Company intends to renew the mortgage funding arrangements when they mature.
The mortgage funding arrangements are generally tied to the loan participation agreements executed with the same financial institutions. Pursuant to the loan participation agreements, the Company periodically sells beneficial ownership interests in its mortgage loan receivables. As of December 31, 2012, the Company has a total of $30,000,000 in loan participation limit that expires in 2013. The lenders may cancel the agreements with written notice. The Company reviews loan participation agreements to determine if they constitute a sale for accounting purposes. If the loan participation agreements do not meet the sale accounting criteria, they are treated as secured borrowings.
The Company has a $7.2 million operating line of credit agreement with a financial institution expiring May 31, 2013. Interest under the agreement is at the prime rate (with a floor of 4%) per annum. The line is
F-76
Table of Contents
STONEGATE MORTGAGE CORPORATION
NOTES TO FINANCIAL STATEMENTS
J. DEBT OBLIGATIONS (Continued)
Short-Term Borrowings: (Continued)
collateralized by the net servicing fee cash flows from and proceeds on agency approved sales of mortgage servicing rights. Amounts outstanding under the line amounted to $4,417,463 and $7,197,150 at December 31, 2012 and 2011, respectively.
The Company has a $1.0 million operating line of credit agreement expiring June 30, 2013. Interest under the agreement is between 5.25% and 6% per annum; the line is collateralized by the Company’s stock in a closely held investment and the net servicing fee cash flows from and proceeds on agency approved sales of mortgage servicing rights. The amounts outstanding under the line amounted to $713,750 and $998,662 at December 31, 2012 and 2011, respectively.
The above agreements contain covenants which include certain financial requirements, including maintenance of minimum tangible net worth, maximum debt to tangible net worth ratio, minimum liquidity, minimum current ratio, minimum profitability, and limitations on additional debt and transactions with affiliates, as defined in the agreement. The Company was in compliance with all significant covenants at December 31, 2012 and 2011.
The Company had $750,000 in subordinated notes payable due to related parties at December 31, 2011. The debt bore interest at 10% per annum and matured April 30, 2012.
Long-Term Borrowings:
At December 31, 2012 and 2011, the Company had no long-term borrowings outstanding.
K. LIABILITY FOR MORTGAGE REPURCHASES AND INDEMNIFICATIONS
The following is a summary of changes in the liability for mortgage repurchases and indemnifications for the years ended December 31:
| 2012 |
2011 |
|||||||
| Balance, beginning of the year |
$ | — | $ | — | ||||
| Provision for losses on mortgage repurchases and indemnifications |
1,916,805 | — | ||||||
| Loan indemnification and charge offs |
— | — | ||||||
|
|
|
|
|
|||||
| Balance, end of the year |
$ | 1,916,805 | $ | — | ||||
|
|
|
|
|
|||||
Because of the uncertainty in the various estimates underlying the mortgage repurchase and indemnifications liability, there is a range of losses in excess of the recorded mortgage repurchase and indemnifications liability that is reasonably possible. The estimate of the range of possible loss for representations and warranties does not represent a probable loss, and is based on current available information, significant judgment, and a number of assumptions that are subject to change. The high end of this range of reasonably possible losses in excess of the Company’s recorded liability was $690,000 at December 31, 2012 and was determined based upon modifying the assumptions utilized in the Company’s best estimate of probable loss to reflect what the Company believes to be the high end of the reasonably possible adverse assumptions.
F-77
Table of Contents
STONEGATE MORTGAGE CORPORATION
NOTES TO FINANCIAL STATEMENTS
L. RELATED PARTY TRANSACTIONS
The Company has an agreement with the Series D preferred stockholder to pay an annual management fee equal to 1% of the stockholder’s committed capital amount for consulting and advisory services and strategic planning. The term of the agreement extends through the earlier of ten years (March 9, 2022), a change in control of the Company, or the stockholder ceasing to own 10% of the capital stock of the Company. The management fee amounted to $237,778 for the year ended December 31, 2012 and is included in general and administrative expenses and due to related parties.
The Company has an agreement with a stockholder to manage and grow the Company’s Home Improvement Program division which primarily focuses on the origination of FHA 203k loans and Fannie Mae Home Style renovation loans. In accordance with the terms of the agreement the stockholder will receive an annual management fee of $107,500 payable quarterly through January 15, 2014, 10% of all revenue generated by the division payable quarterly through January 15, 2014, and 33.33% of the annual net income of the division for calendar 2012 and 2013. The management fees amounted to $339,362 for the year ended December 31, 2012 and are included in general and administrative expenses. The balance outstanding at December 31, 2012 amounted to $110,486 and is included in due to related parties as of December 31, 2012.
The Company had amounts due to related parties of $202,148 at December 31, 2011. The amounts were unsecured, non-interest bearing and due on demand and were repaid during 2012.
M. STOCKHOLDERS’ EQUITY
Common Stock
The Company’s Amended and Restated Articles of Incorporation authorize the issuance of 20,792,279 shares of common stock, par value $0.001 per share. As of December 31, 2012, the Company had 3,464,798 shares of common stock issued and outstanding. During the year ended December 31, 2012, the Company issued 407,695 shares of common stock, upon exercise of options, at a per share price of $2.45, for total cash proceeds of $1 million. During the year ended December 31, 2011, the Company issued 203,848 shares of common stock, at a per share price of $2.45, for total cash proceeds of $0.5 million.
The Company paid no dividends to its common shareholders in 2012 and 2011. The declaration of future dividends and the establishment of the per share amount, record dates and payment dates for any such future dividends are subject to the final determination of the Board, and will be dependent upon future earnings, cash flows, financial requirements and other factors.
Treasury Stock
The Company repurchased 630,699 shares of its common stock, at a per share price of $2.89, for approximately $1.8 million during 2012, funding the repurchase program from cash on hand. The shares were repurchased from a related party, who at the time of the repurchase was a member of the Company’s Board of Directors. There was no treasury stock in fiscal year 2011. Repurchases of common stock are accounted for using the cost method, with common stock in treasury classified in the balance sheet as a reduction of stockholders’ equity.
Preferred Stock
The Company has authorized a total of 13,861,519 shares of preferred stock (all series) with a $.001 par value per share. The Company has issued Series A, B, C, and D Convertible Preferred Stock (“Series A, B, C or D Preferred Shares”), all of which are convertible into common stock. The Series D Preferred Shares have dividend and liquidation preference over the Series C Preferred Shares, and both Series C and D Preferred Shares have preference over Series B Preferred Shares and common stock at face value, plus any unpaid cumulative
F-78
Table of Contents
STONEGATE MORTGAGE CORPORATION
NOTES TO FINANCIAL STATEMENTS
M. STOCKHOLDERS’ EQUITY (Continued)
Preferred Stock (Continued)
dividends. The Series B Preferred Shares have equal liquidation preference with common stock. As of December 31, 2012, the Company had $19,000 of unpaid cumulative dividends.
Series A Convertible Preferred Stock (“Series A Preferred Shares”)
On October 1, 2009, Stonegate issued a total of 415,845 Series A Preferred Shares, at a per share price of $3.61, to two investors. The Series A Preferred Shares accrued cumulative dividends at an annual rate of 15%, payable quarterly in arrears. The holders of the Series A Preferred Shares were entitled to receive (as a special dividend as and when declared by the Board of Directors of the Company) an amount equal to 30% of all net cash proceeds received by the Company, if any, from the sale of servicing rights on residential first mortgage loans originated and sold on a servicing retained basis. No special dividends were declared by the Board in 2012 or 2011.
Each Series A Preferred Share was convertible, at the option of the holder, on a 1:1 basis into shares of common stock subject to adjustment for stock dividends, splits, and similar equity transactions. The Series A Conversion Price was equal to the Series A Preferred Shares original issue price.
The Series A Preferred Shares had no voting rights, except that the approval of the holders of a majority of the Series A Preferred Shares (voting as a separate class) was required for certain matters including any amendment to the articles of incorporation or code of regulations of the Company materially altering the rights or obligations of the holders of the Series A Preferred Shares, the redemption of the Series A Preferred Shares prior to December 23, 2010, and any other events requiring that the holders of the Series A Preferred Shares vote as a separate class as a matter of law.
On March 9, 2012, all 415,845 Series A Preferred Shares were redeemed and retired, at a per share redemption price of $3.61, for a total cash redemption payment of $1.5 million. In addition, at the time of the redemption, accrued and unpaid dividends of $42,534 were paid in cash to the sellers of the Series A Preferred Shares. As a result of this redemption, there were no outstanding Series A Preferred Shares at December 31, 2012.
Series B Convertible Preferred Stock (“Series B Preferred Shares”)
As of December 31, 2012, the Board of Directors had issued 13,862 Series B Preferred Shares at $3.61 per share; there were no issuances in 2011 or 2012. Holders of Series B Preferred Shares are entitled to receive cash dividends at the discretion of the Board of Directors. The dividends are to be calculated as a specified percentage (also determined by the Board of Directors) of net income as contractually defined. No such special dividend had been declared as of December 31, 2012.
Each Series B Preferred Share is convertible, at the option of the holder, on a 1:1 basis into shares of common stock subject to adjustment for stock dividends, splits, and similar equity transactions and is redeemable by the Company at any time. The Series B Conversion Price is equal to the Series B original issue price.
Each outstanding Series B Preferred Share will be deemed, immediately prior to the occurrence of any liquidation, dissolution or winding up of the Company, to have converted into one common share and will participate in distributions resulting from any such liquidation event on the same basis as all other common shares.
The Series B Preferred Shares have no voting rights, except that the approval of the holders of a majority of all Series B Preferred Shares (voting as a separate class) will be required for certain matters, including any amendment to the articles of incorporation or code of regulations of the Company materially
F-79
Table of Contents
STONEGATE MORTGAGE CORPORATION
NOTES TO FINANCIAL STATEMENTS
M. STOCKHOLDERS’ EQUITY (Continued)
Preferred Stock (Continued)
altering the rights or obligations of the holders of the Series B Preferred Shares, and any other events requiring that the holders of the Series B Preferred Shares vote as a separate class as a matter of law.
Series C Convertible Preferred Stock (“Series C Preferred Shares”)
In 2011, the Board of Directors issued 263,369 Series C Preferred Shares at $3.61 per share. Each Series C Preferred Share accrues cumulative dividends at an annual rate of 8%, payable quarterly in arrears.
Each Series C Preferred Share is convertible, at the option of the holder, on a 1:1 basis into shares of common stock subject to adjustment for stock dividends, splits, and similar equity transactions, and will further only be convertible (i) in connection with a sale of the Company or an initial public offering, (ii) within 60 days after the Company receives its annual audited financial statements each year, and (iii) when the shares have been called for redemption by the Company. The Series C preferred share is redeemable by the Company at any time.
The Series C Preferred Shares have no voting rights, except that the approval of the holders of a majority of the Series C Preferred Shares (voting as a separate class) will be required for certain matters, including any amendment to the articles of incorporation or code of regulations of the Company materially altering the rights or obligations of the holders of the Series C Preferred Shares, the redemption of the Series C Preferred Shares prior to December 31, 2012, and any other events requiring that the holders of the Series C Preferred Shares vote as a separate class as a matter of law. The Company has the option to redeem the Series C Preferred Shares for the original face value plus any accrued but unpaid dividends.
Series D Convertible Preferred Stock (“Series D Preferred Shares”)
During 2012, the Board of Directors issued 8,064,881 Series D Preferred Shares at $3.97 per share, in separate closings in March, July and December 2012. Each Series D Preferred Share accrues cumulative dividends at an annual rate of 7%. The dividends compound annually and accrue daily whether or not declared by the Board of Directors. The dividends are payable (i) when declared by the Board of Directors, (ii) when dividends are declared, paid or set aside on any class or series of shares ranking junior to the Series D Preferred Shares, assuming the holders of a majority of Series D Preferred Shares consent thereto, (iii) upon a liquidation, winding up or dissolution of the Company (including certain sale transactions that would anticipate a liquidation of the Company thereafter), and (iv) upon the redemption of the Series D Preferred Shares.
Each Series D Preferred Share is convertible, at the option of the holder at any time, on a 1:1 basis into shares of common stock subject to adjustment for stock dividends, splits, and similar equity transactions and is not redeemable by the Company. The holders of the Series D Preferred Shares have the right to vote on an as-converted basis together with the holders of the common stock on all matters to be voted upon by the shareholders. At December 31, 2012, the Series D Preferred Shareholders owned approximately 72% of the Company’s outstanding shares of capital stock.
If between March 9, 2017 and March 9, 2018, the current holders of the Series D Shares ever own less than 50% of the outstanding voting stock of the Company, the holders of at least a majority of the Series D Preferred Shares may require the Company to redeem all of the Series D Preferred Shares for an amount equal to the greater of the (i) original purchase price of the Series D Preferred Shares plus all accrued or declared but unpaid dividends, and (ii) the then fair market value of the shares of common stock into which the Series D Preferred Shares are convertible.
F-80
Table of Contents
STONEGATE MORTGAGE CORPORATION
NOTES TO FINANCIAL STATEMENTS
M. STOCKHOLDERS’ EQUITY (Continued)
2011 Stock Incentive Plan
The Company has authorized 1,386,152 shares of common stock for grant as an incentive to key employees, consultants and directors. The option price per share and other terms and conditions are to be determined by committee; however, the option price may not be less than the fair market value of the common stock on the grant date and the options must have an exercise date no more than 10 years from the grant date. During 2012, the Company granted a director, stock options to purchase 101,494 shares of the Company’s common stock at an exercise price of $3.97 per share.
The fair value of the option award was estimated on the date of grant using the Black-Scholes option pricing model and the following assumptions: per share fair value of the options granted- $3.97; expected volatility-18%; expected dividend yield-0%; expected term-5.75 years and risk free interest rate-1.01%. The risk free interest rate is based on the U.S. Treasury zero-coupon yield curve in effect at the time of the grant. Volatility was estimated based on the volatility of comparable public companies.
The options vest and become exercisable in twelve equal quarterly periods from June 30, 2012 through June 30, 2015. The options may be exercised any time after vesting but no later than March 8, 2022. 16,916 units vested during 2012 and 84,578 units were still outstanding as of December 31, 2012. There was no other activity in the plan during 2012. Compensation expense recorded amounted to $13,155 for the year ended December 31, 2012. Unamortized costs at December 31, 2012 amounted to $65,776 and will be recognized ratably over the vesting period.
N. INCOME TAXES
The components of income tax expense are as follows for the years ended December 31:
| 2012 |
2011 |
|||||||
| Current income tax |
$ | — | $ | (4,533 | ) | |||
| Deferred income tax |
10,724,261 | 1,703,985 | ||||||
|
|
|
|
|
|||||
| $ | 10,724,261 | $ | 1,699,452 | |||||
|
|
|
|
|
|||||
The following is a reconciliation of income taxes to the expected statutory federal corporate income tax rates for the years ended December 31:
| 2012 |
2011 |
|||||||
| Statutory federal income tax |
$ | 9,733,376 | $ | 1,371,617 | ||||
| State tax, net of federal benefit |
960,704 | 301,091 | ||||||
| Non-deductible expenses |
30,181 | 26,744 | ||||||
|
|
|
|
|
|||||
| $ | 10,724,261 | $ | 1,699,452 | |||||
|
|
|
|
|
|||||
F-81
Table of Contents
STONEGATE MORTGAGE CORPORATION
NOTES TO FINANCIAL STATEMENTS
N. INCOME TAXES (Continued)
The tax effects of significant temporary differences which gave rise to the Company’s deferred tax assets and liabilities are as follows at December 31:
| 2012 |
2011 |
|||||||
| Deferred tax assets— |
||||||||
| Net operating loss carryforwards |
$ | 5,843,603 | $ | 3,969,055 | ||||
| Liability for mortgage repurchases and indemnifications |
735,478 | — | ||||||
|
|
|
|
|
|||||
| 6,579,081 | 3,969,055 | |||||||
|
|
|
|
|
|||||
| Deferred tax liabilities— |
||||||||
| Fixed assets, intangibles and other |
(873,674 | ) | (126,244 | ) | ||||
| Loans held for sale and derivatives |
(4,258,143 | ) | (875,667 | ) | ||||
| Mortgage servicing rights |
(15,828,479 | ) | (6,623,196 | ) | ||||
|
|
|
|
|
|||||
| (20,960,296 | ) | (7,625,107 | ) | |||||
|
|
|
|
|
|||||
| Net deferred tax asset (liability) |
$ | (14,381,215 | ) | $ | (3,656,052 | ) | ||
|
|
|
|
|
|||||
As of December 31, 2012, the Company had federal and state net operating loss carryforwards of approximately $15.2 million and $11.4 million, respectively. As of December 31, 2011, the Company had federal and state net operating loss carryforwards of approximately $11.3 million and $7.5 million, respectively. These net operating loss carryforwards are available to offset taxable income and expiring from 2027 through 2032.
As a result of a significant investment by holders of Series D preferred stock on March 9, 2012, the Company experienced a change in ownership as that term is defined in Section 382 of the Internal Revenue Code and the regulations thereunder (“Section 382”). As a result of this change in ownership, utilization of certain tax attributes including net operating loss and other carryforwards are subject to annual limitations. In some cases, these annual limitations can result in net operating losses expiring before they are fully utilized. Management has determined that no valuation allowance is necessary for the recorded deferred tax assets as it has concluded that it is more likely than not that the recorded amounts will be realized.
The Company’s net operating loss carryforwards through March 9, 2012 (the “pre-change loss”) are subject to an annual limitation on their utilization going forward. The annual limitation as determined under Section 382 has been calculated to be approximately $700,000 permitting the utilization of approximately $14.1 million over the 20-year carryforward period. The amount of pre-change net operating loss carryforwards of approximately $12.4 million was less than this limitation. Therefore, management has determined that no adjustment is required to reduce the deferred tax asset in 2012 for potential expiring unused net operating loss carryforwards.
O. EMPLOYEE BENEFIT PLANS
Profit Sharing Plan
The Company has a 401(k) profit sharing plan covering substantially all employees. Employees may contribute amounts subject to certain IRS and plan limitations. The Company may make discretionary matching and non-elective contributions. For the years ended December 31, 2012 and 2011, the Company contributed $384,392 and $163,085, respectively, to the Plan.
F-82
Table of Contents
STONEGATE MORTGAGE CORPORATION
NOTES TO FINANCIAL STATEMENTS
P. COMMITMENTS AND CONTINGENCIES
Commitments to Extend Credit
The Company enters into interest rate lock commitments with customers who have applied for residential mortgage loans and meet certain credit and underwriting criteria. These commitments expose the Company to market risk if interest rates change and the loan is not economically hedged or committed to an investor. The Company is also exposed to credit loss if the loan is originated and not sold to an investor and the customer does not perform. The collateral upon extension of credit typically consists of a first deed of trust in the mortgagor’s residential property. Commitments to originate loans do not necessarily reflect future cash requirements as some commitments are expected to expire without being drawn upon. Total commitments to originate loans at December 31, 2012 and 2011 approximated $1,139,964,000 and $197,024,000, respectively.
Leases
The Company leases office space and equipment under non-cancelable operating agreements expiring through May 2022. Rent expense amounted to $1,259,216 and $745,620 for the years ended December 31, 2012 and 2011, respectively. Future minimum rental payments under the leases having an initial or remaining non-cancelable term in excess of one year are as follows at December 31, 2012:
| Year Ending December 31, |
Amount |
|||
| 2013 |
$ | 1,599,763 | ||
| 2014 |
1,396,034 | |||
| 2015 |
1,359,994 | |||
| 2016 |
1,106,919 | |||
| 2017 |
894,757 | |||
| Thereafter |
3,899,368 | |||
|
|
|
|||
| $ | 10,256,835 | |||
|
|
|
|||
Regulatory Net Worth Requirements
The Company is subject to various regulatory capital requirements administered by the Department of Housing and Urban Development (HUD), which governs non-supervised, direct endorsement mortgagees, and (GNMA), which governs issuers of GNMA securities. Additionally, the Company is required to maintain minimum net worth requirements for many of the states in which it sells and services loans. Each state has its own minimum net worth requirement; these range from $0 to $1 million, depending on the state.
Failure to meet minimum capital requirements can result in certain mandatory and possibly additional discretionary remedial actions by regulators that, if undertaken, could (i) remove the Company’s ability to sell and service loans to or on behalf of the Agencies and (ii) have a direct material effect on the Company’s financial statements. In accordance with the regulatory capital guidelines, the Company must meet specific quantitative measures of assets, liabilities and certain off-balance sheet items calculated under regulatory accounting practices. Further, changes in regulatory and accounting standards, as well as the impact of future events on the Company’s results, may significantly affect the Company’s net worth adequacy.
F-83
Table of Contents
STONEGATE MORTGAGE CORPORATION
NOTES TO FINANCIAL STATEMENTS
P. COMMITMENTS AND CONTINGENCIES (Continued)
Regulatory Net Worth Requirements (Continued)
The Company met all minimum net worth requirements to which it was subject as of December 31, 2012 and 2011. The Company’s required and actual net worth amounts are presented in the following table:
| December 31, 2012 |
December 31, 2011 |
|||||||||||||||
| Net Worth (1) |
Net Worth Required |
Net Worth (1) |
Net Worth Required |
|||||||||||||
| HUD |
$ | 51,436,841 | $ | 1,000,000 | $ | 10,125,941 | $ | 1,000,000 | ||||||||
| GNMA |
$ | 51,436,841 | $ | 5,779,739 | $ | 10,125,941 | $ | 3,736,186 | ||||||||
| FNMA |
$ | 51,436,841 | $ | 2,500,000 | $ | 10,125,941 | $ | 2,500,000 | ||||||||
| Various States |
$ | 51,436,841 | $ | 0-$1,000,000 | $ | 10,125,941 | $ | 0-$1,000,000 | ||||||||
| (1) | Calculated in compliance with the respective agency’s requirements |
Litigation
The Company is subject to various legal proceedings arising out of the ordinary course of business. As of December 31, 2012, there were no material current or pending claims against the Company.
Q. FAIR VALUE OF FINANCIAL INSTRUMENTS
The Company uses fair value measurements in fair value disclosures and to record certain assets and liabilities at fair value on a recurring basis, such as derivatives and loans held for sale, or on a nonrecurring basis, such as measuring impairment on assets carried at amortized cost. The Company has elected fair value accounting for loans held for sale to more closely align the Company’s accounting with its interest rate risk strategies without having to apply the operational complexities of hedge accounting.
The Company groups its assets and liabilities at fair value in three levels, based on the markets in which the assets and liabilities are traded and the reliability of the assumptions used to determine fair value. These levels are:
| • | Level 1-Quoted prices in active markets for identical assets or liabilities; |
| • | Level 2-Prices determined using other significant observable inputs. Observable inputs are inputs that other market participants would use in pricing an asset or liability and are developed based on market data obtained from sources independent of the Company. These may include quoted prices for similar assets and liabilities, interest rates, prepayment speeds, credit risk and others; |
| • | Level 3—Prices determined using significant unobservable inputs. In situations where quoted prices or observable inputs are unavailable (for example, when there is little or no market activity), unobservable inputs may be used. Unobservable inputs reflect the Company’s own assumptions about the factors that market participants would use in pricing the asset or liability, and are based on the best information available in the circumstances. |
An asset or liability’s level within the fair value hierarchy is based on the lowest level of input that is significant to the fair value measurement.
F-84
Table of Contents
STONEGATE MORTGAGE CORPORATION
NOTES TO FINANCIAL STATEMENTS
Q. FAIR VALUE OF FINANCIAL INSTRUMENTS (Continued)
While the Company believes its valuation methods are appropriate and consistent with those used by other market participants, the use of different methods or assumptions to estimate the fair value of certain financial statement items could result in a different estimate of fair value at the reporting date. Those estimated values may differ significantly from the values that would have been used had a readily available market for such items existed, or had such items been liquidated, and those differences could be material to the financial statements.
Management incorporates lack of liquidity into its fair value estimates based on the type of asset or liability measured and the valuation method used. The Company uses discounted cash flow techniques to estimate fair value. These techniques incorporate forecasting of expected cash flows discounted at appropriate market discount rates that are intended to reflect the lack of liquidity in the market.
The following describes the methods used in estimating the fair values of Level 2 and Level 3 fair value financial statement items:
Mortgage Loans
The Company’s mortgage loans held for sale at fair value, are saleable into the secondary mortgage markets and their fair values are estimated using quoted market or contracted prices or market price equivalents.
Derivative Financial Instruments
The Company estimates the fair value of interest rate lock commitments based on the value of the underlying mortgage loan, quoted Agency mortgage backed security (MBS) prices and estimates of the fair value of the MSRs and the probability that the mortgage loan will fund within the terms of the interest rate lock commitment. The Company estimates the fair value of forward sales commitments based on quoted MBS prices.
Mortgage Servicing Rights
The Company uses a discounted cash flow approach to estimate the fair value of MSRs. This approach consists of projecting servicing cash flows discounted at a rate that management believes market participants would use in their determinations of value. The key assumptions used in the estimation of the fair value of MSRs include prepayment speeds, discount rates, default rates, cost to service, contractual servicing fees, escrow earnings and ancillary income.
The key assumptions used in determining the fair value of MSRs when they are initially recognized are as follows:
| 2012 |
2011 |
|||||||
| Discount rates |
9.25%-11.00 | % | 8.00%-11.00 | % | ||||
| Annual prepayment speeds (by investor type): |
||||||||
| Purchased FNMA1 |
31.8 | % | 17.1 | % | ||||
| FNMA |
12.0 | % | 6.3 | % | ||||
| GNMA I |
15.0 | % | 6.7 | % | ||||
| GNMA II |
10.8 | % | 6.0 | % | ||||
| Cost of servicing |
$ | 73 | $ | 91 | ||||
| 1 | Represents older, higher interest rate loans acquired from our merger with Swain during 2009. |
F-85
Table of Contents
STONEGATE MORTGAGE CORPORATION
NOTES TO FINANCIAL STATEMENTS
Q. FAIR VALUE OF FINANCIAL INSTRUMENTS (Continued)
Mortgage Servicing Rights (Continued)
MSRs are generally subject to loss in value when mortgage rates decrease. Decreasing mortgage rates normally encourage increased mortgage refinancing activity. Increased refinancing activity reduces the life of the loans underlying the MSRs, thereby reducing MSR value. Reductions in the value of MSRs affect income primarily through change in fair value and impairment charges. These factors have been considered in our estimated prepayment speed assumptions used to determine the fair value of our MSRs.
In addition to the assumptions listed above, the Company uses assumptions for default rates in determining the fair value of MSRs. These assumptions are based primarily on internal estimates, and we also obtain third-party data, where applicable, to assess the reasonableness of our internal assumptions. In the MSRs valuation as of December 31, 2012, our assumptions for default rates for FNMA and GNMA mortgage loans were 2.37% and 5.41%, respectively, and represent our estimate of the loans that will eventually enter foreclosure proceedings over the entire term of the portfolio’s life. These assumptions affect the future cost to service loans, future revenue earned from the portfolio, and future assumed foreclosure losses. Because our portfolio is generally comprised of recent vintages, actual future defaults may differ from the Company’s assumptions.
The hypothetical effect of an adverse change in these key assumptions would result in a decrease in fair values as follows at December 31:
| 2012 |
2011 |
|||||||
| Discount rate |
||||||||
| Effect on value- 1% adverse change |
$ | (2,071,000 | ) | $ | (935,000 | ) | ||
| Effect on value- 2% adverse change |
$ | (3,953,000 | ) | $ | (1,785,000 | ) | ||
| Prepayment speeds |
||||||||
| Effect on value- 5% adverse change |
$ | (1,278,000 | ) | $ | (266,000 | ) | ||
| Effect on value- 10% adverse change |
$ | (2,505,000 | ) | $ | (526,000 | ) | ||
| Cost of servicing |
||||||||
| Effect on value- 5% adverse change |
$ | (415,000 | ) | $ | (279,000 | ) | ||
| Effect on value- 10% adverse change |
$ | (830,000 | ) | $ | (558,000 | ) | ||
These sensitivities are hypothetical and should be used with caution. As the table demonstrates, the Company’s methodology for estimating the fair value of MSRs is highly sensitive to changes in assumptions. For example, actual prepayment experience may differ and any difference may have a material effect on MSR fair value. Changes in fair value resulting from changes in assumptions generally cannot be extrapolated because the relationship of the change in assumption to the change in fair value may not be linear. Also, in this table, the effect of a variation in a particular assumption on the fair value of the MSRs is calculated without changing any other assumption; in reality, changes in one factor may be associated with changes in another (for example, decreases in market interest rates may indicate higher prepayments; however, this may be partially offset by lower prepayments due to other factors such as a borrower’s diminished opportunity to refinance), which may magnify or counteract the sensitivities. Thus, any measurement of MSR fair value is limited by the conditions existing and assumptions made as of a particular point in time. Those assumptions may not be appropriate if they are applied to a different point in time.
F-86
Table of Contents
STONEGATE MORTGAGE CORPORATION
NOTES TO FINANCIAL STATEMENTS
Q. FAIR VALUE OF FINANCIAL INSTRUMENTS (Continued)
Mortgage Servicing Rights (Continued)
The following are the major categories of assets and liabilities measured at fair value on a recurring basis as of December 31:
| December 31, 2012 |
||||||||||||||||
| Description |
Level 1 |
Level 2 |
Level 3 |
Total |
||||||||||||
| Loans held for sale |
$ | — | $ | 218,623,951 | $ | — | $ | 218,623,951 | ||||||||
| Interest rate lock commitments |
— | 11,988,706 | — | 11,988,706 | ||||||||||||
| MBS forward sales contracts |
— | (1,786,505 | ) | — | (1,786,505 | ) | ||||||||||
|
|
|
|
|
|
|
|
|
|||||||||
| Total |
$ | — | $ | 228,826,152 | $ | — | $ | 228,826,152 | ||||||||
|
|
|
|
|
|
|
|
|
|||||||||
| December 31, 2011 |
||||||||||||||||
| Description |
Level 1 |
Level 2 |
Level 3 |
Total |
||||||||||||
| Loans held for sale |
$ | — | $ | 61,728,834 | $ | — | $ | 61,728,834 | ||||||||
| Interest rate lock commitments |
— | 3,347,255 | — | 3,347,255 | ||||||||||||
| MBS forward sales contracts |
— | (1,045,529 | ) | — | (1,045,529 | ) | ||||||||||
|
|
|
|
|
|
|
|
|
|||||||||
| Total |
$ | — | $ |
64,030,560 |
|
$ | — | $ | 64,030,560 | |||||||
|
|
|
|
|
|
|
|
|
|||||||||
Fair Value of Other Financial Instruments
As of December 31, 2012 and 2011, all financial instruments were either recorded at fair value or the carrying value approximated fair value, with the exception of debt. For financial instruments that were not recorded at fair value, such as cash and cash equivalents and restricted cash and cash equivalents, the carrying value approximates fair value due to the short-term nature of such instruments. These financial instruments are classified within Level 1 of the valuation hierarchy.
As of December 31, 2012 and 2011, the total fair value of debt was $208 million and $66.1 million, respectively, and substantially all of the debt is measured using Level 2 inputs. As of December 31, 2012 and 2011, fair value was estimated using a discounted cash flow model incorporating assumptions based on current market information available for similar debt instruments.
Mortgage loans held for sale are carried at estimated fair value pursuant to the fair value option. Gains from changes in estimated fair values amounted to $3,528,122 and $1,565,087 for the years ended December 31, 2012 and 2011, respectively, and are included in gain on mortgage loans held for sale on the statement of operations.
Following are the fair value and related principal amounts due upon maturity for loans held for sale accounted under the fair value option at December 31, 2012 and 2011:
| December 31, 2012 |
||||||||||||
| Fair Value |
Principal |
Difference |
||||||||||
| Current through 89 days delinquent |
$ | 218,555,787 | $ | 212,693,103 | $ | 5,862,684 | ||||||
| 90 or more days delinquent |
68,164 | 68,164 | — | |||||||||
|
|
|
|
|
|
|
|||||||
| $ | 218,623,951 | $ | 212,761,267 | $ | 5,862,684 | |||||||
|
|
|
|
|
|
|
|||||||
F-87
Table of Contents
STONEGATE MORTGAGE CORPORATION
NOTES TO FINANCIAL STATEMENTS
Q. FAIR VALUE OF FINANCIAL INSTRUMENTS (Continued)
Fair Value of Other Financial Instruments (Continued)
| December 31, 2011 |
||||||||||||
| Fair Value |
Principal |
Difference |
||||||||||
| Current through 89 days delinquent |
$ | 61,656,995 | $ | 59,322,433 | $ | 2,334,562 | ||||||
| 90 or more days delinquent |
71,839 | 71,839 | — | |||||||||
|
|
|
|
|
|
|
|||||||
| $ | 61,728,834 | $ | 59,394,272 | $ | 2,334,562 | |||||||
|
|
|
|
|
|
|
|||||||
The following are the major categories of assets and liabilities measured at fair value on a nonrecurring basis as of December 31:
| December 31, 2012 |
||||||||||||||||
| Description |
Level 1 |
Level 2 |
Level 3 |
Total |
||||||||||||
| Mortgage servicing rights |
$ | — | $ | — | $ | 42,202,394 | $ | 42,202,394 | ||||||||
|
|
|
|
|
|
|
|
|
|||||||||
| Total |
$ | — | $ | — | $ | 42,202,394 | $ | 42,202,394 | ||||||||
|
|
|
|
|
|
|
|
|
|||||||||
| December 31, 2011 |
||||||||||||||||
| Description |
Level 1 |
Level 2 |
Level 3 |
Total |
||||||||||||
| Mortgage servicing rights |
$ | — | $ | — | $ | 17,679,198 | $ | 17,679,198 | ||||||||
|
|
|
|
|
|
|
|
|
|||||||||
| Total |
$ | — | $ | — | $ | 17,679,198 | $ | 17,679,198 | ||||||||
|
|
|
|
|
|
|
|
|
|||||||||
R. BUSINESS COMBINATION
As part of the Company’s growth strategy, on August 30, 2012, the Company acquired all rights, title, and interest in the assets of NattyMac’s single-family mortgage loan warehousing business. Founded in 1994 in St. Petersburg, FL, NattyMac operated as an independent mortgage warehouse lender focused on financing prime mortgage loans that were committed for purchase by GSEs. NattyMac’s strong reputation in the mortgage banking industry, along with its warehouse financing platform and experienced staff, will complement the Company’s existing business and allow us to provide an additional source of funding for our correspondent customers. The following table summarizes the consideration paid for NattyMac and the amount of net assets acquired recognized at the acquisition date:
| At August 30, 2012 |
Amount |
|||
| Consideration: |
||||
| Cash |
$ | 511,828 | ||
| Contingent Consideration |
2,094,854 | |||
|
|
|
|||
| Fair Value, Total Consideration Transferred |
2,606,682 | |||
|
|
|
|||
| Recognized Amounts of Indentifiable Assets Acquired: |
||||
| Property and Equipment |
$ | 56,913 | ||
| Other Assets |
11,827 | |||
| Indentifiable Intangible Assets |
3,710,000 | |||
|
|
|
|||
| Total Indentifiable Intangible Assets |
$ | 3,778,740 | ||
|
|
|
|||
| Bargain Purchase Gain |
$ | 1,172,058 | ||
|
|
|
|||
| Acquisition-Related Costs |
$ | 405,704 | ||
|
|
|
|||
F-88
Table of Contents
STONEGATE MORTGAGE CORPORATION
NOTES TO FINANCIAL STATEMENTS
R. BUSINESS COMBINATION (Continued)
The contingent consideration arrangement represents a deferred purchase price of $75 for each mortgage loan subsequently funded through the single-family mortgage loan warehousing business acquired from NattyMac. The deferred purchase price shall not exceed $2.25 million in the aggregate. The potential undiscounted amount of all future payments that the Company could be required to make under the contingent consideration arrangement is between $0 and $2.25 million. The fair value of the contingent consideration arrangement was estimated to be approximately $2.1 million at the acquisition date by applying the income approach. The fair value of the contingent consideration is based on key assumptions including (i) management’s estimate of number and timing of mortgage loans to be funded each quarter; and (ii) a discount rate of 5.3%. We estimated, at the acquisition date, that all mortgage loans would be funded over a 22-month period. At December 31, 2012, the earn-out liability for the contingent consideration arrangement amounted to $2.1 million. At December 31, 2012, no mortgage loans had been funded through NattyMac’s single-family warehousing business and the Company had not yet made any contingent consideration payments.
The fair value of the contingent consideration and the identified net assets acquired are provisional pending receipt of the final valuations. Additionally, the Company continues to obtain and assess facts and circumstances that existed as of the acquisition date that, if known, may have resulted in the recognition of additional assets and/or liabilities as of that date. The measurement period relating to the business combination is not expected to exceed more than one year from the acquisition date.
The acquisition of NattyMac’s single-family mortgage loan warehousing business was determined to be a bargain purchase for financial reporting purposes. The bargain purchase gain was recognized because the fair value of the identified net assets acquired exceeded the aggregate of the consideration transferred. Accordingly, the Company recognized a resulting bargain purchase gain of $1,172,058 on the acquisition date which is included in operations.
S. CONCENTRATION OF CREDIT RISK
The Company has exposure to credit loss in the event of contractual non-performance by its trading counterparties and counterparties to the over-the-counter derivative financial instruments that we use in our rate risk management activities. The Company manages this credit risk by selecting only counterparties that the Company believes to be financially strong, spreading the credit risk among many such counterparties, by placing contractual limits on the amount of unsecured credit extended to any single counterparty and by entering into netting agreements with the counterparties, as appropriate.
We have entered into agreements with derivative counterparties which include netting arrangements whereby the counterparties are entitled to settle their positions on a net basis. We have been required to provide certain derivative counterparties collateral against derivative financial instruments. As of December 31, 2012, counterparties held $3,445,356 of our investment securities and cash as collateral, after which the Company was in a net credit loss position of $1,658,853 to those counterparties. As of December 31, 2011, counterparties held $500,000 of our investment securities and cash as collateral, after which our net credit exposure was at a net credit gain position to those counterparties.
For the two-year period ended December 31, 2012, we incurred no credit losses due to non- performance of any of our counterparties.
F-89
Table of Contents
STONEGATE MORTGAGE CORPORATION
NOTES TO FINANCIAL STATEMENTS
T. EARNINGS PER SHARE
The following is a reconciliation of net income to net income attributable to common stockholders and a table summarizing the basic and diluted earnings per share calculations:
| Year Ended December 31, |
||||||||
| 2012 |
2011 |
|||||||
| Net income |
$ | 17,085,386 | $ | 2,334,717 | ||||
| Preferred stock dividends |
(118,534 | ) | (257,371 | ) | ||||
|
|
|
|
|
|||||
| Net income attributable to common stockholders |
$ | 16,966,852 | $ | 2,077,346 | ||||
|
|
|
|
|
|||||
| Weighted-average shares outstanding |
||||||||
| Denominator for basic earnings per share—weighted-average common shares outstanding |
3,193,122 | 2,985,058 | ||||||
| Effect of dilutive shares—convertible preferred stock and employee and director stock options |
4,324,245 | 533,194 | ||||||
|
|
|
|
|
|||||
| Denominator for diluted earnings per share |
7,517,367 | 3,518,252 | ||||||
|
|
|
|
|
|||||
| Earnings per share |
||||||||
| Basic |
$ | 5.31 | $ | 0.70 | ||||
|
|
|
|
|
|||||
| Diluted |
$ | 2.26 | $ | 0.59 | ||||
|
|
|
|
|
|||||
U. SEGMENT INFORMATION
Our organizational structure is currently comprised of one operating segment: Mortgage Banking. This determination is based on our current organizational structure, which reflects how our chief operating decision maker evaluates the performance of our business.
Our Mortgage Banking segment includes our Mortgage Originations, Mortgage Servicing and Mortgage Financing lines of business. The Mortgage Originations business primarily originates and sells residential mortgage loans, which conform to the underwriting guidelines of the GSEs and government agencies. The Mortgage Servicing business includes loan administration, collection and default activities, including the collection and remittance of loan payments, responding to customer inquiries, collection of principal and interest payments, holding custodial funds for the payment of property taxes and insurance premiums, counseling delinquent mortgagors, modifying loans and supervising foreclosures on our property dispositions. Our Mortgage Financing business consists of the NattyMac single-family mortgage loan warehousing business that we acquired in August 2012 and which had not yet commenced operations as of December 31, 2012.
Our principal sources of revenue from our Mortgage Banking segment include:
| (i) | Gains on mortgage loans held for sale, including changes in the fair value of commitments to purchase or originate mortgage loans held for sale and the related hedging instruments; |
| (ii) | Fee and net interest income from our financing facility; and |
| (iii) | Fee income from loan servicing. |
F-90
Table of Contents
STONEGATE MORTGAGE CORPORATION
NOTES TO FINANCIAL STATEMENTS
U. SEGMENT INFORMATION (Continued)
Our chief operating decision maker evaluates the performance of our Mortgage Banking business based on the measurement basis of income before income tax expense. Refer to our statements of operations for the years ended December 31, 2012 and 2011 included in these audited financial statements for details related to operating revenues, income before income taxes and depreciation and amortization for our Mortgage Banking segment. Refer to our balance sheet as of December 31, 2012 and 2011 for details of the assets and equity components of our Mortgage Banking segment.
The major components of operating revenues by product/service for our Mortgage Banking segment for the years ended December 31, 2012 and 2011 are as follows:
| Year Ended December 31, |
||||||||
| 2012 |
2011 |
|||||||
| Originations |
||||||||
| Gains on mortgage loans held for sale |
$ | 73,336,538 | $ | 16,735,380 | ||||
| Loan origination and other loan fees |
9,871,363 | 4,287,855 | ||||||
| Interest income |
5,257,371 | 2,370,792 | ||||||
|
|
|
|
|
|||||
| Total Origination |
88,465,272 | 23,394,027 | ||||||
| Servicing |
||||||||
| Loan servicing fees |
5,908,044 | 2,627,558 | ||||||
|
|
|
|
|
|||||
| Total Servicing |
5,908,044 | 2,627,558 | ||||||
| Other |
1,172,058 | — | ||||||
|
|
|
|
|
|||||
| Total operating revenues |
$ | 95,545,374 | $ | 26,021,585 | ||||
|
|
|
|
|
|||||
Other revenue presented above represents the gain from the bargain purchase of NattyMac assets in August 2012. Refer to “Note R. Business Combination” for additional information regarding the Company’s acquisition of NattyMac assets.
V. SUBSEQUENT EVENTS
On February 28, 2013, the Company entered into a Custodial and Disbursement Agreement (“CDA”) with Bank of America, N.A, and U.S. Bank National Association, as well as a Master Repurchase Agreement (“MRA”) with Bank of America, N.A., in order that the Company may, from time to time, transfer to Bank of America N.A., participation certificates representing 100% beneficial ownership interests in certain residential mortgage loans and/or other mortgage related assets and interests, against the transfer of funds by Bank of America N.A., with a simultaneous agreement by Bank of America N.A. to sell to the Company such purchased assets at a specified date or on demand after the purchase date, against the transfer of funds by the Company.
Bank of America N.A. will enter into transactions with the Company provided that the aggregate outstanding purchase price as of any date shall not exceed $100,000,000, and the aggregate outstanding purchase price for any type of transaction shall not exceed the applicable type sublimit.
On March 29, 2013, the Company entered into a Term Loan agreement with Stonegate Investors Holdings LLC, in the principal amount of up to $10,000,000 maturing on September 30, 2013 at a rate per annum equal to 5% compounded monthly commencing on the closing date and ending May 31, 2013, and thereafter at a
F-91
Table of Contents
STONEGATE MORTGAGE CORPORATION
NOTES TO FINANCIAL STATEMENTS
V. SUBSEQUENT EVENTS (Continued)
rate per annum equal to 12.5% compounded monthly. Under the terms of the agreement, the Company has issued a warrant agreement to the lender for the right to purchase a variable number of shares of the Company’s common stock equivalent to 5,000,000 common shares divided by an exercise price determined in accordance with the agreement.
Management has evaluated subsequent events through March 30, 2013, the date on which the financial statements were available to be issued.
F-92
Table of Contents
6,388,889 Shares
Stonegate Mortgage Corporation
Common Stock
PROSPECTUS
, 2013
Table of Contents
PART II
INFORMATION NOT REQUIRED IN PROSPECTUS
Item 13. Other Expenses of Issuance and Distribution.
The following table sets forth the fees and expenses in connection with the issuance and distribution of the securities being registered. Except for the Securities and Exchange Commission registration fee and the Financial Industry Regulatory Authority, or FINRA, filing fee, all amounts are estimates.
| Amount Paid |
||||
| SEC registration fee |
$ | 13,799 | ||
| FINRA filing fee |
16,571 | |||
| Legal fees and expenses |
100,000 | |||
| Accounting fees and expenses |
5,000 | |||
| Printing expenses |
225,000 | |||
| Miscellaneous |
4,630 | |||
|
|
|
|||
| Total |
365,000 | |||
|
|
|
|||
Item 14. Indemnification of Directors and Officers.
Under Ohio law and Stonegate’s current Articles of Incorporation, a director of an Ohio corporation generally is not liable for monetary damages unless it is proved by clear and convincing evidence that the director’s action or failure to act was undertaken with deliberate intent to cause injury to the corporation or with reckless disregard for the best interests of the corporation.
Under the Ohio General Corporation Law, generally, a corporation may indemnify any current or former director, officer, employee, or agent for reasonable expenses incurred in connection with the defense or settlement of any threatened, pending, or completed litigation related to the person’s position with the corporation or related to the person’s service (as a director, trustee, officer, employee, member, manager, or agent) to another corporation at the request of the indemnifying corporation, if he or she acted in good faith and in a manner he or she reasonably believed to be in, or not opposed to, the best interests of the corporation. If the litigation involved a criminal action or proceeding, the person must also have had no reasonable cause to believe his or her conduct was unlawful. Ohio law requires indemnification for reasonable expenses incurred if the person was successful in the defense of the litigation. Finally, Ohio law requires a corporation to provide expenses to a person in advance of final disposition of the litigation if the person undertakes to repay any advanced amounts if it is ultimately determined that he or she is not entitled to indemnification. Our Articles require indemnification of current and former directors and officers, and of officers and directors serving as directors, officers, or trustees of other corporations, partnerships, joint ventures, trusts, or other enterprises at our request, to the fullest extent permitted by law. In addition, Ohio law and our Articles permit us to purchase insurance coverage for such liability, and we have done so.
Item 15. Recent Sales of Unregistered Securities
On May 15, 2013, we issued an aggregate of 6,388,889 shares of our common stock to institutional and accredited investors for a purchase price of $18.00 per share in reliance on the exemption from registration under Section 4(a)(2) of the Securities Act.
On May 15, 2013, we granted options to purchase 1,438,389 shares of our common stock at $18.00 per share to certain of our key employees in reliance on the exemption from registration provided by Rule 701 of the Securities Act. These options have not been exercised and remain outstanding.
II-1
Table of Contents
On March 29, 2013, we issued a warrant to Stonegate Investors Holdings LLC to purchase 277,777 shares of our common stock at an exercise price of $18.00 per share in reliance on the exemption from registration under Section 4(a)(2) of the Securities Act. This warrant was issued as part of the consideration for a loan from Stonegate Investors Holdings LLC in an amount of $10,000,000.
On various dates from March 9, 2012 through December 24, 2012 pursuant to an agreement signed on March 9, 2012, and subsequently amended in May and June of 2012, we issued 8,064,881 shares of our Series D Convertible Preferred Stock at the originally agreed upon price of $3.97 per share to Stonegate Investors Holdings in reliance on the exemption from registration available under Section 4(a)(2) of the Securities Act. The shares of Series D Convertible Preferred Stock were convertible into shares of our common stock on a 1:1 basis and were converted into shares of our common stock on such basis immediately prior to the May 2013 private offering.
On March 9, 2012, we granted an option to purchase 101,494 shares of our common stock at $3.97 per share to one of our directors in reliance on the exemption from registration provided by Rule 701 of the Securities Act. This option has not been exercised and remains outstanding.
On May 10, 2011 we issued 203,847 shares of our common stock to one of our executive officers at $2.45 per share and granted him an option to purchase 407,695 shares of common stock at $2.45 per share under our 2011 Omnibus Incentive Plan in reliance on the exemption from registration provided by Rule 701 promulgated under the Securities Act. On May 4, 2012, the employee exercised his option, and we issued the 407,695 shares of common stock to the employee at $2.45 per share in reliance on the exemption from registration provided by Rule 701.
Between April 21, 2011 and December 18, 2011, we issued 263,367 shares of our Series C Convertible Preferred Stock to 7 accredited investors at $3.61 per share in reliance on the exemption from registration available under Section 4(a)(2) of the Securities Act. The shares of Series C Convertible Preferred Stock were convertible into shares of our common stock on a 1:1 basis and were converted into shares of our common stock on such basis immediately prior to the May 2013 private offering.
On August 19, 2010, we issued 13,861 shares of our Series B Convertible Preferred Stock to a single accredited investor at $3.61 per share in reliance on the exemption from registration available under Section 4(a)(2) of the Securities Act. The shares of Series B Convertible Preferred Stock were convertible into shares of our common stock on a 1:1 basis and were converted into shares of our common stock on such basis immediately prior to the May 2013 private offering.
Item 16. Exhibits and Financial Statement Schedules.
(a) Exhibits
| Number |
Description | |
| 3.1* | Third Amended and Restated Articles of Incorporation of the Registrant (incorporated by reference to Exhibit 3.1 to Stonegate Mortgage Corporation Amendment No. 1 to S-1 filed September 30, 2013) | |
| 3.2* | Third Amended and Restated Code of Regulations of the Registrant (incorporated by reference to Exhibit 3.2 to Stonegate Mortgage Corporation S-1 filed September 6, 2013) | |
| 4.1* | Specimen Common Stock Certificate (incorporated by reference to Exhibit 4.1 to Stonegate Mortgage Corporation Amendment No. 1 to S-1 filed September 30, 2013) | |
| 5.1* | Opinion of Barnes & Thornburg LLP | |
II-2
Table of Contents
| Number |
Description | |
| 10.1* | Registration Rights Agreement, dated as of May 15, 2013, between Stonegate Mortgage Corporation and FBR Capital Markets & Co. (incorporated by reference to Exhibit 10.1 to Stonegate Mortgage Corporation S-1 filed September 6, 2013) | |
| 10.2†* | Stonegate Mortgage Corporation Amended and Restated 2011 Omnibus Incentive Plan (incorporated by reference to Exhibit 10.2 to Stonegate Mortgage Corporation S-1 filed September 6, 2013) | |
| 10.3†* | Option Agreement, dated as of May 15, 2013, between Stonegate Mortgage Corporation and James J. Cutillo (incorporated by reference to Exhibit 10.3 to Stonegate Mortgage Corporation S-1 filed September 6, 2013) | |
| 10.4†* | Form of Option Agreement (incorporated by reference to Exhibit 10.4 to Stonegate Mortgage Corporation S-1 filed September 6, 2013) | |
| 10.5†* | Employment Agreement, dated as of March 9, 2012, between Stonegate Mortgage Corporation and James J. Cutillo (incorporated by reference to Exhibit 10.5 to Stonegate Mortgage Corporation S-1 filed September 6, 2013) | |
| 10.6†* | First Amendment to Employment Agreement, dated as of May 14, 2013, between Stonegate Mortgage Corporation and James J. Cutillo (incorporated by reference to Exhibit 10.6 to Stonegate Mortgage Corporation S-1 filed September 6, 2013) | |
| 10.7†* | Amended and Restated Employment Agreement, dated as of May 14, 2013, between Stonegate Mortgage Corporation and Daniel J. Bettenburg (incorporated by reference to Exhibit 10.7 to Stonegate Mortgage Corporation S-1 filed September 6, 2013) | |
| 10.8†* | Letter Agreement, dated as of May 14, 2013, between Stonegate Mortgage Corporation and John F. Macke (incorporated by reference to Exhibit 10.8 to Stonegate Mortgage Corporation S-1 filed September 6, 2013) | |
| 10.9†* | Letter Agreement, dated as of March 9, 2012, between Stonegate Mortgage Corporation and Richard Mirro (incorporated by reference to Exhibit 10.9 to Stonegate Mortgage Corporation S-1 filed September 6, 2013) | |
| 10.10* | Purchase/Placement Agreement, dated as of May 8, 2013, between Stonegate Mortgage Corporation and FBR Capital Markets & Co. (incorporated by reference to Exhibit 10.10 to Stonegate Mortgage Corporation S-1 filed September 6, 2013) | |
| 10.11* | Investor Rights Agreement, dated as of March 9, 2012, between Stonegate Mortgage Corporation and Stonegate Investors Holdings LLC (incorporated by reference to Exhibit 10.11 to Stonegate Mortgage Corporation S-1 filed September 6, 2013) | |
| 10.12* | Amendment No. 1 to Investor Rights Agreement, dated as of May 15, 2013, between Stonegate Mortgage Corporation and Stonegate Investors Holdings LLC (incorporated by reference to Exhibit 10.12 to Stonegate Mortgage Corporation S-1 filed September 6, 2013) | |
| 10.13* | Amended and Restated Shareholders’ Agreement, dated as of March 9, 2012, by and among Stonegate Mortgage Corporation, Stonegate Investors Holdings LLC, and certain Other Stockholders (incorporated by reference to Exhibit 10.13 to Stonegate Mortgage Corporation S-1 filed September 6, 2013) | |
| 10.14* | Amendment No. 1 to Amended and Restated Shareholders’ Agreement, dated as of May 15, 2013, among Stonegate Mortgage Corporation, Stonegate Investors Holdings LLC, and certain Other Stockholders (incorporated by reference to Exhibit 10.14 to Stonegate Mortgage Corporation S-1 filed September 6, 2013) | |
| 10.15* | Voting Agreement, dated as of May 15, 2013, among Stonegate Mortgage Corporation, Stonegate Investors Holdings LLC, and FBR Capital Markets & Co. (incorporated by reference to Exhibit 10.15 to Stonegate Mortgage Corporation S-1 filed September 6, 2013) | |
II-3
Table of Contents
| Number |
Description | |
| 10.16* | Master Repurchase Agreement, dated as of February 28, 2013, by and between Bank of America, N.A. and Stonegate Mortgage Corporation (incorporated by reference to Exhibit 10.16 to Stonegate Mortgage Corporation S-1 filed September 6, 2013) | |
| 10.17* | Mortgage Loan Participation Purchase and Sale Agreement, dated June 24, 2013, by and between Stonegate Mortgage Corporation and Bank of America, N.A. (incorporated by reference to Exhibit 10.17 to Stonegate Mortgage Corporation S-1 filed September 6, 2013) | |
| 10.18* | Master Loan Participation and Servicing Agreement, dated as of November 19, 2012, by and between Stonegate Mortgage Corporation and Bank of Virginia (incorporated by reference to Exhibit 10.18 to Stonegate Mortgage Corporation S-1 filed September 6, 2013) | |
| 10.19* | Master Repurchase Agreement, dated as of December 24, 2012, between Barclays Bank PLC and Stonegate Mortgage Corporation (incorporated by reference to Exhibit 10.19 to Stonegate Mortgage Corporation S-1 filed September 6, 2013) | |
| 10.20* | Mortgage Loan Participation Purchase and Sale Agreement, dated as of December 24, 2012, between Stonegate Mortgage Corporation and Barclays Bank PLC (incorporated by reference to Exhibit 10.20 to Stonegate Mortgage Corporation S-1 filed September 6, 2013) | |
| 10.21* | Amended and Restated Mortgage Warehouse Loan and Security Agreement dated May 1, 2011 between Stonegate Mortgage Corporation and Merchants Bank of Indiana (incorporated by reference to Exhibit 10.21 to Stonegate Mortgage Corporation S-1 filed September 6, 2013) | |
| 10.22* | Amended and Restated Master Participation Agreement, dated as of July 1, 2012, between Stonegate Mortgage Corporation and Merchants Bank of Indiana (incorporated by reference to Exhibit 10.22 to Stonegate Mortgage Corporation Amendment No. 1 to S-1 filed September 30, 2013) | |
| 10.23* | Amendment No. 2 to Investor Rights Agreement, dated as of September 29, 2013, between Stonegate Mortgage Corporation and Stonegate Investors Holdings LLC (incorporated by reference to Exhibit 10.23 to Stonegate Mortgage Corporation Amendment No. 1 to S-1 filed September 30, 2013) | |
| 10.24* | Amendment No. 2 to Amended and Restated Shareholders’ Agreement, dated as of September 29, 2013, among Stonegate Mortgage Corporation, Stonegate Investors Holdings LLC, and certain Other Stockholders (incorporated by reference to Exhibit 10.24 to Stonegate Mortgage Corporation Amendment No. 1 to S-1 filed September 30, 2013) | |
| 10.25†* | Stonegate Mortgage Corporation 2013 Non-Employee Director Plan (incorporated by reference to Exhibit 10.25 to Stonegate Mortgage Corporation Amendment No. 1 to S-1 filed September 30, 2013) | |
| 10.26†* | Stonegate Mortgage Corporation 2013 Omnibus Incentive Compensation Plan (incorporated by reference to Exhibit 10.26 to Stonegate Mortgage Corporation Amendment No. 1 to S-1 filed September 30, 2013) | |
| 10.27†* | Stonegate Mortgage Corporation Annual Incentive Plan | |
| 10.28†* | Form of Restricted Stock Unit Award Agreement (incorporated by reference to Exhibit 4.3 to the Registration Statement on Form S-8 filed on November 26, 2013 (File No. 333-192557)) | |
| 10.29†* | Form of Option Agreement (incorporated by reference to Exhibit 4.4 to the Registration Statement on Form S-8 filed on November 26, 2013 (File No. 333-192557) | |
| 11.1* | Statement Regarding Computation of Per Share Earnings | |
| 16.1* | Letter from Richey, May & Co., LLP dated December 6, 2013 | |
II-4
Table of Contents
| Number |
Description | |
| 21.1* | Subsidiaries of the Registrant (incorporated by reference to Exhibit 21.1 to Stonegate Mortgage Corporation S-1 filed September 6, 2013) | |
| 23.1* | Consent of Barnes & Thornburg LLP (included in Exhibit 5.1) | |
| 23.2 | Consent of Richey, May & Co. LLP | |
| 23.3 | Consent of KPMG LLP | |
| 24.1* | Power of Attorney (on signature page) | |
| 101* | The following materials from Stonegate Mortgage Corporation’s Registration Statement on Form S-1/A formatted in Extensible Business Reporting Language (XBRL): (i) Balance Sheet as of June 30, 2013; (ii) Statement of Operations for the Six Months Ended June 30, 2013; (iii) Statement of Changes in Stockholders’ Equity for the Six Months Ended June 30, 2013; (iv) Statement of Cash Flows for the Six Months Ended June 30, 2013; and (v) related notes | |
| * | Previously filed |
| † | Indicates management contract or compensation plan |
(b) Financial Statement Schedules
All schedules have been omitted because they are not required or because the required information is given in the financial statements or notes to those statements.
Item 17. Undertakings.
The undersigned Registrant hereby undertakes:
(1) To file, during any period in which offers or sales are being made, a post-effective amendment to this registration statement:
(i) To include any prospectus required by Section 10(a)(3) of the Securities Act;
(ii) To reflect in the prospectus any facts or events arising after the effective date of the registration statement (or the most recent post-effective amendment thereof) which, individually or in the aggregate, represent a fundamental change in the information set forth in the registration statement. Notwithstanding the foregoing, any increase or decrease in volume of securities offered (if the total dollar value of securities offered would not exceed that which was registered) and any deviation from the low or high end of the estimated maximum offering range may be reflected in the form of prospectus filed with the Securities and Exchange Commission pursuant to Rule 424(b) if, in the aggregate, the changes in volume and price represent no more than a 20% change in the maximum aggregate offering price set forth in the “Calculation of Registration Fee” table in the effective registration statement; and
(iii) To include any material information with respect to the plan of distribution not previously disclosed in the registration statement or any material change to such information in the registration statement.
II-5
Table of Contents
(2) That, for the purpose of determining any liability under the Securities Act, each such post-effective amendment shall be deemed to be a new registration statement relating to the securities offered therein, and the offering of such securities at that time shall be deemed to be the initial bona fide offering thereof.
(3) To remove from registration by means of a post-effective amendment any of the securities being registered which remain unsold at the termination of the offering.
(4) That, for the purpose of determining liability under the Securities Act to any purchaser, each prospectus filed pursuant to Rule 424(b) as part of a registration statement relating to an offering, other than registration statements relying on Rule 430B or other than prospectuses filed in reliance on Rule 430A, shall be deemed to be part of and included in the registration statement as of the date it is first used after effectiveness. Provided, however, that no statement made in a registration statement or prospectus that is part of the registration statement or made in a document incorporated or deemed incorporated by reference into the registration statement or prospectus that is part of the registration statement will, as to a purchaser with a time of contract of sale prior to such first use, supersede or modify any statement that was made in the registration statement or prospectus that was part of the registration statement or made in any such document immediately prior to such date of first use.
(5) Insofar as indemnification for liabilities arising under the Securities Act may be permitted to directors, officers and controlling persons of the registrant pursuant to the foregoing provisions, or otherwise, the registrant has been advised that in the opinion of the Securities and Exchange Commission such indemnification is against public policy as expressed in the Act, and is, therefore, unenforceable. In the event that a claim for indemnification against such liabilities (other than the payment by the registrant of expenses incurred or paid by a director, officer or controlling person of the registrant in the successful defense of any action, suit or proceeding) is asserted by such director, officer or controlling person in connection with the securities being registered, the registrant will, unless in the opinion of its counsel the matter has been settled by controlling precedent, submit to a court of appropriate jurisdiction the question whether such indemnification by it is against public policy as expressed in the Act and will be governed by the final adjudication of such issue.
II-6
Table of Contents
SIGNATURES
Pursuant to the requirements of the Securities Act of 1933, as amended, the Registrant has duly caused this Amendment No. 2 to the Registration Statement to be signed on its behalf by the undersigned, thereunto duly authorized, in the city of Indianapolis, Indiana, on January 10, 2014.
| STONEGATE MORTGAGE CORPORATION. | ||
| By: | /s/ James J. Cutillo | |
| James J. Cutillo | ||
| Chief Executive Officer | ||
Pursuant to the requirements of the Securities Act of 1933, as amended, this Amendment No. 2 to the Registration Statement has been signed by the following persons in the capacities and on the dates indicated.
| Name |
Title |
Date | ||
| * James J. Cutillo |
Chief Executive Officer and Director (principal executive officer) |
January 10, 2014 | ||
| * John F. Macke |
Chief Financial Officer (principal financial officer and principal accounting officer) |
January 10, 2014 | ||
| * Kevin B. Bhatt |
Director |
January 10, 2014 | ||
| * James Gerard Brown |
Director |
January 10, 2014 | ||
| * Richard A. Mirro |
Director |
January 10, 2014 | ||
| * Joseph Scott Mumphrey |
Director |
January 10, 2014 | ||
| * Richard A. Kraemer |
Director |
January 10, 2014 | ||
| * Sam Levinson |
Director |
January 10, 2014 | ||
| *By: | /s/ James J. Cutillo | |
| Attorney-in-fact | ||
II-7
Table of Contents
EXHIBIT INDEX
Some of the agreements included as exhibits to this registration statement contain representations and warranties by the parties to the applicable agreement. These representations and warranties were made solely for the benefit of the other parties to the applicable agreement and (1) were not intended to be treated as categorical statements of fact, but rather as a way of allocating the risk to one of the parties if those statements prove to be inaccurate; (2) may have been qualified in such agreement by disclosures that were made to the other party in connection with the negotiation of the applicable agreement; (3) may apply contract standards of “materiality” that are different from “materiality” under the applicable securities laws; and (4) were made only as of the date of the applicable agreement or such other date or dates as may be specified in the agreement.
| Number |
Description | |
| 3.1* | Third Amended and Restated Articles of Incorporation of the Registrant (incorporated by reference to Exhibit 3.1 to Stonegate Mortgage Corporation Amendment No. 1 to S-1 filed September 30, 2013) | |
| 3.2* | Third Amended and Restated Code of Regulations of the Registrant (incorporated by reference to Exhibit 3.2 to Stonegate Mortgage Corporation S-1 filed September 6, 2013) | |
| 4.1* | Specimen Common Stock Certificate (incorporated by reference to Exhibit 4.1 to Stonegate Mortgage Corporation Amendment No. 1 to S-1 filed September 30, 2013) | |
| 5.1* | Opinion of Barnes & Thornburg LLP | |
| 10.1* | Registration Rights Agreement, dated as of May 15, 2013, between Stonegate Mortgage Corporation and FBR Capital Markets & Co. (incorporated by reference to Exhibit 10.1 to Stonegate Mortgage Corporation S-1 filed September 6, 2013) | |
| 10.2†* | Stonegate Mortgage Corporation Amended and Restated 2011 Omnibus Incentive Plan (incorporated by reference to Exhibit 10.2 to Stonegate Mortgage Corporation S-1 filed September 6, 2013) | |
| 10.3†* | Option Agreement, dated as of May 15, 2013, between Stonegate Mortgage Corporation and James J. Cutillo (incorporated by reference to Exhibit 10.3 to Stonegate Mortgage Corporation S-1 filed September 6, 2013) | |
| 10.4†* | Form of Option Agreement (incorporated by reference to Exhibit 10.4 to Stonegate Mortgage Corporation S-1 filed September 6, 2013) | |
| 10.5†* | Employment Agreement, dated as of March 9, 2012, between Stonegate Mortgage Corporation and James J. Cutillo (incorporated by reference to Exhibit 10.5 to Stonegate Mortgage Corporation S-1 filed September 6, 2013) | |
| 10.6†* | First Amendment to Employment Agreement, dated as of May 14, 2013, between Stonegate Mortgage Corporation and James J. Cutillo (incorporated by reference to Exhibit 10.6 to Stonegate Mortgage Corporation S-1 filed September 6, 2013) | |
| 10.7†* | Amended and Restated Employment Agreement, dated as of May 14, 2013, between Stonegate Mortgage Corporation and Daniel J. Bettenburg (incorporated by reference to Exhibit 10.7 to Stonegate Mortgage Corporation S-1 filed September 6, 2013) | |
| 10.8†* | Letter Agreement, dated as of May 14, 2013, between Stonegate Mortgage Corporation and John F. Macke (incorporated by reference to Exhibit 10.8 to Stonegate Mortgage Corporation S-1 filed September 6, 2013) | |
| 10.9†* | Letter Agreement, dated as of March 9, 2012, between Stonegate Mortgage Corporation and Richard Mirro (incorporated by reference to Exhibit 10.9 to Stonegate Mortgage Corporation S-1 filed September 6, 2013) | |
II-8
Table of Contents
| Number |
Description | |
| 10.10* | Purchase/Placement Agreement, dated as of May 8, 2013, between Stonegate Mortgage Corporation and FBR Capital Markets & Co. (incorporated by reference to Exhibit 10.10 to Stonegate Mortgage Corporation S-1 filed September 6, 2013) | |
| 10.11* | Investor Rights Agreement, dated as of March 9, 2012, between Stonegate Mortgage Corporation and Stonegate Investors Holdings LLC (incorporated by reference to Exhibit 10.11 to Stonegate Mortgage Corporation S-1 filed September 6, 2013) | |
| 10.12* | Amendment No. 1 to Investor Rights Agreement, dated as of May 15, 2013, between Stonegate Mortgage Corporation and Stonegate Investors Holdings LLC (incorporated by reference to Exhibit 10.12 to Stonegate Mortgage Corporation S-1 filed September 6, 2013) | |
| 10.13* | Amended and Restated Shareholders’ Agreement, dated as of March 9, 2012, by and among Stonegate Mortgage Corporation, Stonegate Investors Holdings LLC, and certain Other Stockholders (incorporated by reference to Exhibit 10.13 to Stonegate Mortgage Corporation S-1 filed September 6, 2013) | |
| 10.14* | Amendment No. 1 to Amended and Restated Shareholders’ Agreement, dated as of May 15, 2013, among Stonegate Mortgage Corporation, Stonegate Investors Holdings LLC, and certain Other Stockholders (incorporated by reference to Exhibit 10.14 to Stonegate Mortgage Corporation S-1 filed September 6, 2013) | |
| 10.15* | Voting Agreement, dated as of May 15, 2013, among Stonegate Mortgage Corporation, Stonegate Investors Holdings LLC, and FBR Capital Markets & Co. (incorporated by reference to Exhibit 10.15 to Stonegate Mortgage Corporation S-1 filed September 6, 2013) | |
| 10.16* | Master Repurchase Agreement, dated as of February 28, 2013, by and between Bank of America, N.A. and Stonegate Mortgage Corporation (incorporated by reference to Exhibit 10.16 to Stonegate Mortgage Corporation S-1 filed September 6, 2013) | |
| 10.17* | Mortgage Loan Participation Purchase and Sale Agreement, dated June 24, 2013, by and between Stonegate Mortgage Corporation and Bank of America, N.A. (incorporated by reference to Exhibit 10.17 to Stonegate Mortgage Corporation S-1 filed September 6, 2013) | |
| 10.18* | Master Loan Participation and Servicing Agreement, dated as of November 19, 2012, by and between Stonegate Mortgage Corporation and Bank of Virginia (incorporated by reference to Exhibit 10.18 to Stonegate Mortgage Corporation S-1 filed September 6, 2013) | |
| 10.19* | Master Repurchase Agreement, dated as of December 24, 2012, between Barclays Bank PLC and Stonegate Mortgage Corporation (incorporated by reference to Exhibit 10.19 to Stonegate Mortgage Corporation S-1 filed September 6, 2013) | |
| 10.20* | Mortgage Loan Participation Purchase and Sale Agreement, dated as of December 24, 2012, between Stonegate Mortgage Corporation and Barclays Bank PLC (incorporated by reference to Exhibit 10.20 to Stonegate Mortgage Corporation S-1 filed September 6, 2013) | |
| 10.21* | Amended and Restated Mortgage Warehouse Loan and Security Agreement dated May 1, 2011 between Stonegate Mortgage Corporation and Merchants Bank of Indiana (incorporated by reference to Exhibit 10.21 to Stonegate Mortgage Corporation S-1 filed September 6, 2013) | |
| 10.22* | Amended and Restated Master Participation Agreement, dated as of July 1, 2012, between Stonegate Mortgage Corporation and Merchants Bank of Indiana (incorporated by reference to Exhibit 10.22 to Stonegate Mortgage Corporation Amendment No. 1 to S-1 filed September 30, 2013) | |
| 10.23* | Amendment No. 2 to Investor Rights Agreement, dated as of September 29, 2013, between Stonegate Mortgage Corporation and Stonegate Investors Holdings LLC (incorporated by reference to Exhibit 10.23 to Stonegate Mortgage Corporation Amendment No. 1 to S-1 filed September 30, 2013) | |
II-9
Table of Contents
| Number |
Description | |
| 10.24* | Amendment No. 2 to Amended and Restated Shareholders’ Agreement, dated as of September 29, 2013, among Stonegate Mortgage Corporation, Stonegate Investors Holdings LLC, and certain Other Stockholders (incorporated by reference to Exhibit 10.24 to Stonegate Mortgage Corporation Amendment No. 1 to S-1 filed September 30, 2013) | |
| 10.25†* | Stonegate Mortgage Corporation 2013 Non-Employee Director Plan (incorporated by reference to Exhibit 10.25 to Stonegate Mortgage Corporation Amendment No. 1 to S-1 filed September 30, 2013) | |
| 10.26†* | Stonegate Mortgage Corporation 2013 Omnibus Incentive Compensation Plan (incorporated by reference to Exhibit 10.26 to Stonegate Mortgage Corporation Amendment No. 1 to S-1 filed September 30, 2013) | |
| 10.27†* | Stonegate Mortgage Corporation Annual Incentive Plan | |
| 10.28†* | Form of Restricted Stock Unit Award Agreement (incorporated by reference to Exhibit 4.3 to the Registration Statement on Form S-8 filed on November 26, 2013 (File No. 333-192557)) | |
| 10.29†* | Form of Option Agreement (incorporated by reference to Exhibit 4.4 to the Registration Statement on Form S-8 filed on November 26, 2013 (File No. 333-192557) | |
| 11.1* | Statement Regarding Computation of Per Share Earnings | |
| 16.1* | Letter from Richey, May & Co., LLP dated December 6, 2013 | |
| 21.1* | Subsidiaries of the Registrant (incorporated by reference to Exhibit 21.1 to Stonegate Mortgage Corporation S-1 filed September 6, 2013) | |
| 23.1* | Consent of Barnes & Thornburg LLP (included in Exhibit 5.1) | |
| 23.2 | Consent of Richey, May & Co. LLP | |
| 23.3 | Consent of KPMG LLP | |
| 24.1* | Power of Attorney (on signature page) | |
| 101* | The following materials from Stonegate Mortgage Corporation’s Registration Statement on Form S-1/A formatted in Extensible Business Reporting Language (XBRL): (i) Balance Sheet as of June 30, 2013; (ii) Statement of Operations for the Six Months Ended June 30, 2013; (iii) Statement of Changes in Stockholders’ Equity for the Six Months Ended June 30, 2013; (iv) Statement of Cash Flows for the Six Months Ended June 30, 2013; and (v) related notes | |
| * | Previously filed |
| † | Indicates management contract or compensation plan |
II-10