Attached files
| file | filename |
|---|---|
| 8-K - 8-K - Nuverra Environmental Solutions, Inc. | d630950d8k.htm |
 Investor Presentation November 2013
Exhibit 99.1 |
| Legal
Disclaimer 2
ABOUT FORWARD-LOOKING STATEMENTS:
This presentation may contain "forward-looking statements" within the meaning of
the safe harbor provisions of the United States Private Securities Litigation Reform Act of
1995. Words such as "expect," "estimate," "project," "budget,"
"forecast," "anticipate," "intend," "plan," "may," "will," "could," "should," "believes," "predicts," "potential,"
"continue," and similar expressions are intended to identify such forward-looking
statements. Forward-looking statements in the presentation include, without limitation,
forecasts of growth, revenues, business activity, adjusted EBITDA and pipeline expansion, and
future benefits from UMO cost reductions, statements regarding possible divestitures,
timing of such divestitures, acquisitions, financings and other matters that involve known and unknown risks, uncertainties and other factors that may cause results,
levels of activity, performance or achievements to differ materially from results expressed or
implied by this presentation. Such risk factors include, among others: difficulties
encountered in acquiring and integrating businesses; uncertainties in evaluating goodwill and
long-lived assets for potential impairment; potential financial impact of litigation;
whether certain markets grow as anticipated; pricing pressures; risks associated with our
indebtedness; low oil and or natural gas prices; changes in customer drilling activities
and capital expenditure plans; shifts in production into shale areas in which we currently do
not have operations; control of costs and expenses; and the competitive and regulatory
environment. Additional risks and uncertainties are set forth in the Company's Annual Report on Form 10-K for the fiscal year ended December 31, 2012, as well as
the Company's other reports filed with the United States Securities and Exchange Commission,
which are available at http://www.sec.gov/ as well as the Company's web site at
http://nuverra.com/. As a result of the foregoing considerations and the other limitations of
non-GAAP measures described elsewhere herein, you are cautioned not to place undue
reliance on these forward-looking statements, which speak only as of the date of this presentation. All forward-looking statements are qualified in their entirety by this
cautionary statement. The Company undertakes no obligation to publicly update or revise any
forward-looking statements, whether as a result of new information, future events
or otherwise. ABOUT NON-GAAP FINANCIAL MEASURES:
This presentation contains non-GAAP financial measures as defined by the rules and
regulations of the United States Securities and Exchange Commission. A non-GAAP financial
measure is a numerical measure of a company’s historical or future financial performance,
financial position or cash flows that excludes amounts, or is subject to adjustments
that have the effect of excluding amounts, that are included in the most directly comparable
measure calculated and presented in accordance with GAAP in the statements of
operations or balance sheets of the Company; or includes amounts, or is subject to adjustments
that have the effect of including amounts, that are excluded from the most directly
comparable measure so calculated and presented. Reconciliations of these non-GAAP financial measures to their comparable GAAP financial measures are included in
the attached financial tables.
These non-GAAP financial measures are provided because management of the Company uses
these financial measures in maintaining and evaluating the Company’s ongoing
financial results and trends. Management uses this non-GAAP information as an indicator of
business performance, and evaluates overall management with respect to such indicators.
Management believes that excluding items such as acquisition expenses, amortization of intangible assets, stock-based compensation, asset impairments,
restructuring charges and other non-recurring charges, among other items that are
inconsistent in amount and frequency (as with acquisition expenses), or determined pursuant
to complex formulas that incorporate factors, such as market volatility, that are beyond our
control (as with stock-based compensation), for purposes of calculating these non-
GAAP financial measures facilitates a more meaningful evaluation of the Company’s current
operating performance and comparisons to the past and future operating performance. The
Company believes that providing non-GAAP financial measures such as EBITDA, adjusted EBITDA, adjusted net income (loss), adjusted net income (loss) per
share, and operating working capital, in addition to related GAAP financial measures, provides
investors with greater transparency to the information used by the Company’s
management in its financial and operational decision-making. These non-GAAP measures
should be considered in addition to, but not as a substitute for, measures of financial
performance prepared in accordance with GAAP. |
 3
We put our energy behind sustainability.™
Innovative Environmental Solutions
•
Reduce environmental footprint
•
Recycle natural resources
•
Develop beneficial use of waste streams
•
Provide responsible disposal |
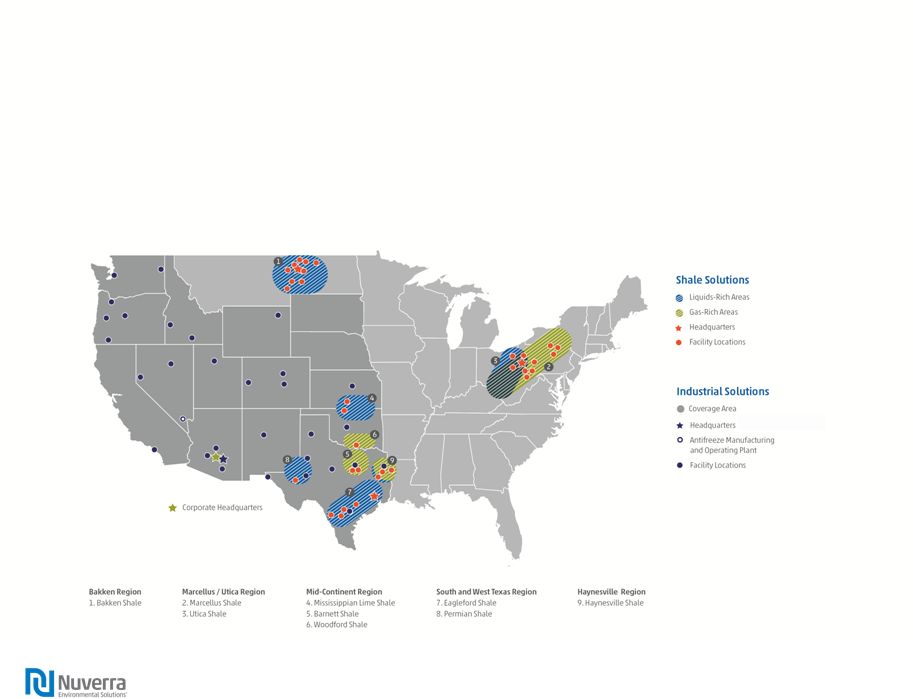 National
Operating Platform 4
Shale Solutions – provides environmental
solutions for the shale oil and natural
gas end market.
Industrial Solutions - provides environmental solutions for the retail,
automotive and manufacturing end market. |
 Our Strategy: Full
Cycle Environmental Solutions •
Approximately 1,300 trucks
•
Approximately 5,600 tanks
•
Approximately 170 rail cars
•
50 miles of freshwater delivery pipeline
•
50 miles of produced water collection pipeline
•
AWS plant –
a wastewater treatment
recycling facility specifically designed to
treat and recycle water involved in the
hydraulic fracturing process in the
Marcellus Shale area
•
34 TFI treatment facilities –
process UMO
into RFO
•
56 liquid waste
disposal wells
•
Solid waste
landfill
•
Liquid and solid
waste
Disposal
Recycling
Treatment
Collection
Delivery
5
•
Fresh water to
drilling sites for
hydraulic fracturing
•
Drilling mud
•
Water procurement
•
E&P liquid waste
from fracking
•
E&P liquid waste
from ongoing
production
•
E&P solid waste
•
Used oil filters
•
Anti-freeze
•
Used motor oil into
Reprocessed Fuel Oil
•
Oily waste water
•
Used oil filters
•
Anti-freeze
•
E&P flowback water |
 Nuverra
Today 6
Long-term secular tailwinds
–
Domestic energy renaissance
–
Increasing focus on health, safety and environment
–
Stricter regulatory environment
–
Need for national service provider
Focus on Shale Solutions
–
Planned Divestiture of TFI
Transition to full cycle environmental solutions
–
Landfill
–
Water recycling
–
Solid waste treatment
Financial Discipline
–
Divesting non-core assets
–
New divisional structure reduces financial and operational risk and complexity
–
Capital discipline
–
Focus on return on capital |
 Key Near-Term
Priorities 7
Sale of TFI
–
Engaged investment banking firm
–
Expected to close in late Q1/ early Q2
–
Increases company’s financial flexibility
Flexible Capital Structure
–
Evaluating various credit facilities/senior debt structures to maximize flexibility and
optionality Operational Improvements in Certain Basins
Focus on Disposal, Treatment and Recycling Solutions
–
ND landfill volumes increasing as more customers receiving internal approvals
–
Expect to conduct our first H2O Forward frac during the first quarter of 2014
–
Exploring solid waste treatment options |
 2014 Industry
Outlook 8
Increased Year-on-Year Activity
–
Increasing 2014 E&P capital budgets
–
Third-party forecasts projecting increased activity
–
Recent equity/debt capital raises -
$11.5B in capital raised in 2H:2013 by 22 E&P companies
Continued shift to “manufacturing”
of oil and gas assets
–
More pad drilling
–
More frac stages and longer laterals
–
Fewer days to production
Increased focus on environmental issues
–
Water sourcing and disposal
–
Solid waste disposal
Natural gas plays continue to remain challenged
–
Pockets of activity due to lower cost structure |
 Expanding Our
Service Offerings Disposal
Recycling
Treatment
Collection
Delivery
9
Bakken Landfill Acquisition
•
Key component of Nuverra strategy to provide closed-loop
environmental
solutions
–
liquids
and
solids
•
Operations started in August and volumes have ramped up as
operators have received requisite internal approval
Disposal
Treatment & Recycling
Halliburton
H20
Forward
Service
•
Allows E&P operators to treat and re-use flowback and produced
water
•
Nuverra will provide surface environmental solutions, including
logistics and treatment
•
Permits approved by state, anticipate first frac in Q1:2014
SM |
 Delivering
Environmental Solutions with Science & Engineering
10
•
•
•
•
•
Partnered with premier technology provider to oil
and gas companies to provide a recycled water
solution
•
Halliburton H20
Forward allows E&P operators
to treat and re-use flowback and produced water in
fracking operations, reducing the overall use of
fresh water
Formed a JV with EERC to identify alternatives
for managing solid waste cuttings
Third-party scientific support
Vast experience in the oil and gas industry
JV will bolster Company’s efforts to develop
solids treatment solutions and identify potential
beneficial uses of solid waste byproducts
SM |
 Summary Pro Forma
Combined Financial Data 11
Note: Figures above are pro forma for TFI and Power Fuels transactions.
(1) Adjusted
EBITDA
Less
Capex.
Despite industry challenges in 2013, NES generated free cash flow
and paid down debt -
$32.5mm YTD revolver paydown
Year to-date 2013, the Company has generated $76.4mm of operating cash flow
Revenue
Adjusted EBITDA
Cash Capital Expenditures
Unlevered
Free
Cash
Flow
$153
$248
$548
$730
$654
$100
$200
$300
$400
$500
$600
$700
$800
2009
2010
2011
2012
LTM Sept '13
$37
$76
$173
$209
$122
$0
$50
$100
$150
$200
$250
2009
2010
2011
2012
LTM Sept '13
$35
$55
$240
$129
$48
$0
$50
$100
$150
$200
$250
$300
2009
2010
2011
2012
LTM Sept '13
$2
$21
-$67
$80
$74
-$80
-$60
-$40
-$20
$0
$20
$40
$60
$80
$100
2009
2010
2011
2012
LTM Sept '13
1
$0 |
 Appendix |
 Pro Forma
Combined Adjusted EBITDA Reconciliation (Unaudited)
13
Twelve Months Ended,
December 31, 2009
December 31, 2010
December 31, 2011
December 31, 2012 September 30, 2013
($Millions)
Net income (loss) from continuing operations
(3.7)
$
31.2
$
92.1
$
100.0
$
(210.1)
$
Depreciation
12.5
19.7
49.2
82.3
88.2
Amortization
5.1
6.0
8.9
16.6
28.7
Interest expense (income)
7.3
9.1
18.1
34.7
51.8
Income tax (benefit)
(0.4)
(3.1)
1.6
(57.7)
(104.1)
EBITDA from continuing operations
20.8
$
62.9
$
169.9
$
175.9
$
(145.4)
$
Transaction & integration
0.3
$
2.1
$
2.6
$
9.2
$
5.7
$
A/R reserve
accrual -
-
-
4.4
-
Environmental accrual
-
-
-
1.7
2.8
Loss on disposal of assets/asset impairment
-
-
-
8.6
212.6
Stock-based compensation
2.1
0.9
2.1
3.6
4.5
Legal Fees and Settlement
-
-
-
-
21.1
Other
13.4
10.4
(1.2)
6.0
20.8
Adjusted EBITDA from continuing operations
36.6
$
76.4
$
173.4
$
209.4
$
122.1
$
|