Attached files
| file | filename |
|---|---|
| EX-32.1 - EXHIBIT 32.1 - Nuverra Environmental Solutions, Inc. | nes_20171231xex321.htm |
| EX-31.2 - EXHIBIT 31.2 - Nuverra Environmental Solutions, Inc. | nes_20171231xex312.htm |
| EX-31.1 - EXHIBIT 31.1 - Nuverra Environmental Solutions, Inc. | nes_20171231xex311.htm |
| EX-21.1 - EXHIBIT 21.1 - Nuverra Environmental Solutions, Inc. | nes_20171231xex211.htm |
UNITED STATES
SECURITIES AND EXCHANGE COMMISSION
Washington, D.C. 20549
__________________________________
FORM 10-K
__________________________________
(Mark One)
ý | ANNUAL REPORT PURSUANT TO SECTION 13 OR 15(d) OF THE SECURITIES EXCHANGE ACT OF 1934 |
For the fiscal year ended: December 31, 2017
Or
¨ | TRANSITION REPORT PURSUANT TO SECTION 13 OR 15(d) OF THE SECURITIES EXCHANGE ACT OF 1934 |
For the transition period from to
Commission File Number: 001-33816
__________________________________

(A Delaware Corporation)
__________________________________
I.R.S. Employer Identification No. 26-0287117
14624 N. Scottsdale Rd., Suite 300, Scottsdale, Arizona 85254
Telephone: (602) 903-7802
__________________________________
Securities registered pursuant to Section 12(b) of the Act:
Title of each class | Name of each exchange on which registered | |
Common Stock, $0.01 par value | NYSE American | |
Securities registered pursuant to Section 12(g) of the Act:
None
__________________________________
Indicate by check mark if the registrant is a well-known seasoned issuer, as defined in Rule 405 of the Securities Act. Yes ¨ No ý
Indicate by check mark if the registrant is not required to file reports pursuant to Section 13 or Section 15(d) of the Act. Yes ¨ No ý
Indicate by check mark whether the registrant (1) has filed all reports required to be filed by Section 13 or 15(d) of the Securities Exchange Act of 1934 during the preceding 12 months (or for such shorter period that the registrant was required to file such reports), and (2) has been subject to such filing requirements for the past 90 days. Yes ý No ¨
Indicate by check mark whether the registrant has submitted electronically and posted on its corporate website, if any, every Interactive Data File required to be submitted and posted pursuant to Rule 405 of Regulation S-T during the preceding 12 months (or for such shorter period that the registrant was required to submit and post such files). Yes ý No ¨
Indicate by check mark if disclosure of delinquent filers pursuant to Item 405 of Regulation S-K is not contained herein, and will not be contained, to the best of registrant’s knowledge, in definitive proxy or information statements incorporated by reference in Part III of this Form 10-K or any amendment to this Form 10-K. ¨
Indicate by check mark whether the Company is a large accelerated filer, an accelerated filer, a non-accelerated filer, or a smaller reporting company. See definitions of “large accelerated filer,” “accelerated filer,” and “smaller reporting company” in Rule 12b-2 of the Exchange Act. (Check one):
Large accelerated filer | ¨ | Accelerated filer | ¨ | |
Non-accelerated filer | ¨ (Do not check if a smaller reporting company) | Smaller reporting company | ý | |
Emerging growth company | ¨ | |||
If an emerging growth company, indicate by check mark if the registrant has elected not to use the extended transition period for complying with any new or revised financial accounting standards provided pursuant to Section 13(a) of the Exchange Act. ¨
Indicate by check mark whether the Company is a shell company (as defined in Rule 12b-2 of the Exchange Act). Yes ¨ No ý
As of June 30, 2017, the last business day of the registrant’s most recently completed second fiscal quarter, the aggregate market value of the voting and non-voting common equity held by non-affiliates of the registrant was $0.2 million based on the closing sale price of $0.01 on such date as reported on the OTC Pink Marketplace. Shares held by executive officers, directors and persons owning directly or indirectly more than 10% of the outstanding common stock have been excluded from the preceding number because such persons may be deemed to be affiliates of the registrant. This determination of affiliate status is not necessarily a conclusive determination for any other purposes. On August 7, 2017, the old common stock was canceled, and new shares of common stock were issued, pursuant to the chapter 11 plan of reorganization. The new shares of common stock began trading on the NYSE American on October 12, 2017.
Indicate by check mark whether the registrant has filed all the documents and reports required to be filed by Section 12, 13 or 15(d) of the Securities Exchange Act of 1934 subsequent to the distribution of securities under a plan of confirmation by a court. Yes ý No ¨
The number of shares outstanding of the registrant’s common stock as of February 28, 2018 was 11,695,580.
__________________________________
Documents Incorporated by Reference
Part III of this Annual Report on Form 10-K incorporates by reference information from the Definitive Information Statement for the registrant’s 2018 Annual Meeting of Stockholders or a Form 10-K/A to be filed with the Securities and Exchange Commission not later than 120 days after the registrants fiscal year ended December 31, 2017.
1
TABLE OF CONTENTS
2
CAUTIONARY NOTE ON FORWARD-LOOKING STATEMENTS
In addition to historical information, this Annual Report on Form 10-K (“Annual Report”) contains forward-looking statements within the meaning of Section 27A of the United States Securities Act of 1933, as amended, or the “Securities Act,” and Section 21E of the United States Securities Exchange Act of 1934, as amended, or the “Exchange Act.” These statements relate to our expectations for future events and time periods. All statements other than statements of historical fact are statements that could be deemed to be forward-looking statements, including, but not limited to, statements regarding:
• | the expected benefits of our completed restructuring under chapter 11 of the United States Bankruptcy Code to improve our long-term capital structure; |
• | future financial performance and growth targets or expectations; |
• | market and industry trends and developments, including, but not limited to, statements regarding fluctuations in oil and natural gas prices and third-party projections for the markets in which we operate; and |
• | the potential benefits of our completed and any future merger, acquisition, disposition, restructuring, and financing transactions. |
You can identify these and other forward-looking statements by the use of words such as “anticipates,” “expects,” “intends,” “plans,” “predicts,” “believes,” “seeks,” “estimates,” “may,” “might,” “will,” “should,” “would,” “could,” “potential,” “future,” “continue,” “ongoing,” “forecast,” “project,” “target” or similar expressions, and variations or negatives of these words.
These forward-looking statements are based on information available to us as of the date of this Annual Report and our current expectations, forecasts and assumptions, and involve a number of risks and uncertainties. Accordingly, forward-looking statements should not be relied upon as representing our views as of any subsequent date. Future performance cannot be ensured, and actual results may differ materially from those in the forward-looking statements. Some factors that could cause actual results to differ include, among others:
• | the effects of our completed restructuring on the Company and the interests of various constituents; |
• | risks and uncertainties associated with the restructuring process, including the outcome of a pending appeal of the order confirming the plan of reorganization and our ability to execute the requirements of the plan of reorganization subsequent to the effective date; |
• | our inability to maintain relationships with suppliers, customers, employees and other third parties as a result of our chapter 11 filing; |
• | the bankruptcy and, as applicable, appellate court’s rulings in our chapter 11 cases, including appeals thereof, and the outcome of our chapter 11 cases in general; |
• | risks associated with third-party motions, objections, and appeals in our chapter 11 cases, including the pending appeal of the confirmation of the plan of reorganization; |
• | the length of time the Company will operate under chapter 11 protection; |
• | the effects of the increased advisory costs to execute a reorganization; |
• | risks associated with our indebtedness, including changes to interest rates, deterioration in the value of our machinery and equipment or accounts receivables, our ability to manage our liquidity needs and to comply with covenants under our credit facilities; |
• | our ability to attract, motivate and retain key executives and qualified employees in key areas of our business, including as a result of our completed chapter 11 restructuring; |
• | financial results that may be volatile and may not reflect historical trends due to, among other things, changes in commodity prices or general market conditions, acquisition and disposition activities, fluctuations in consumer trends, pricing pressures, changes in raw material or labor prices or rates related to our business and changing regulations or political developments in the markets in which we operate; |
3
• | our ability to attract and retain a sufficient number of qualified truck drivers in light of industry-wide driver shortages and high-turnover; |
• | risks associated with our ability to collect outstanding receivables as a result of liquidity constraints on our customers resulting from low oil and/or natural gas prices; |
• | the availability of less favorable credit and payment terms due to the downturn in our industry, our financial condition, and the chapter 11 proceeding, including more stringent or costly payment terms from our vendors, which may further constrain our liquidity and reduce availability under our revolving credit facility; |
• | risks associated with our capital structure, including our ability to access necessary funding to generate sufficient operating cash flow to meet our debt service obligations; |
• | risks associated with the limited trading volume of our common stock on the NYSE American Stock Exchange, including potential fluctuations in the trading prices of our common stock; |
• | changes in customer drilling, completion and production activities, operating methods and capital expenditure plans, including impacts due to low oil and/or natural gas prices or the economic or regulatory environment; |
• | difficulties in identifying and completing acquisitions and divestitures, and differences in the type and availability of consideration or financing for such acquisitions and divestitures; |
• | difficulties in successfully executing our growth initiatives, including difficulties in permitting, financing and constructing pipelines and waste treatment assets and in structuring economically viable agreements with potential customers, joint venture partners, financing sources and other parties; |
• | higher than forecasted capital expenditures to maintain and repair our fleet of trucks, tanks, equipment and disposal wells; |
• | fluctuations in prices, transportation costs and demand for commodities such as oil and natural gas; |
• | risks associated with the operation, construction and development of saltwater disposal wells, solids and liquids treatment and transportation assets, landfills and pipelines, including access to additional locations and rights-of-way, environmental remediation obligations, unscheduled delays or inefficiencies and reductions in volume due to micro- and macro-economic factors or the availability of less expensive alternatives; |
• | risks associated with new technologies and the impact on our business; |
• | the effects of competition in the markets in which we operate, including the adverse impact of competitive product announcements or new entrants into our markets and transfers of resources by competitors into our markets; |
• | risks associated with the reliance on third-party analyst and expert market projections and data for the markets in which we operate; |
• | changes in economic conditions in the markets in which we operate or in the world generally, including as a result of political uncertainty; |
• | reduced demand for our services due to regulatory or other influences related to extraction methods such as hydraulic fracturing, shifts in production among shale areas in which we operate or into shale areas in which we do not currently have operations or the loss of key customers; |
• | the impact of changes in laws and regulation on waste management and disposal activities, including those impacting the delivery, storage, collection, transportation, treatment and disposal of waste products, as well as the use or reuse of recycled or treated products or byproducts; |
• | control of costs and expenses; |
• | present and possible future claims, litigation or enforcement actions or investigations; |
• | natural disasters, such as hurricanes, earthquakes and floods, or acts of terrorism, or extreme weather conditions, that may impact our business locations, assets, including wells or pipelines, distribution channels, or which otherwise disrupt our or our customers’ operations or the markets we serve; |
4
• | the threat or occurrence of international armed conflict; |
• | the unknown future impact on our business from legislation and governmental rulemaking, including the Affordable Care Act, the Dodd-Frank Wall Street Reform, the Tax Cuts and Jobs Act, and the Consumer Protection Act and the rules to be promulgated thereunder; |
• | risks involving developments in environmental or other governmental laws and regulations in the markets in which we operate and our ability to effectively respond to those developments including laws and regulations relating to oil and natural gas extraction businesses, particularly relating to water usage, and the disposal, transportation and treatment of liquid and solid wastes; and |
• | other risks identified in this Annual Report or referenced from time to time in our filings with the United States Securities and Exchange Commission. |
You are cautioned not to place undue reliance on any forward-looking statements, which speak only as of the date of this Annual Report. Except as required by law, we do not undertake any obligation to update or release any revisions to these forward-looking statements to reflect any events or circumstances, whether as a result of new information, future events, changes in assumptions or otherwise, after the date hereof.
5
NUVERRA ENVIRONMENTAL SOLUTIONS, INC.
PART I
Item 1. Business
When used in this Annual Report, the terms “Nuverra,” the “Company,” “we,” “our,” and “us” refer to Nuverra Environmental Solutions, Inc. and its consolidated subsidiaries, unless otherwise specified.
Overview
Nuverra is a leading provider of comprehensive, full-cycle environmental solutions to customers focused on the development and ongoing production of oil and natural gas from shale formations in the United States. We provide one-stop, total environmental solutions and wellsite logistics management, including delivery, collection, treatment and disposal of solid and liquid materials that are used in and generated by the drilling, completion, and ongoing production of shale oil and natural gas. We utilize a broad array of assets to meet our customers’ logistics and environmental management needs. Our logistics assets include trucks and trailers, temporary and permanent pipelines, temporary and permanent storage facilities, ancillary rental equipment, and liquid and solid waste disposal sites. We provide a suite of solutions to customers who demand safety, environmental compliance and accountability from their service providers.
Our service offering focuses on providing comprehensive environmental and logistics management solutions within three primary groups:
• | Logistics and Wellsite Services: Delivery of freshwater to wellsites, freshwater procurement and transfer services, staging and storage of equipment and materials, rental of wellsite equipment, and construction services including wellpads. |
• | Water Midstream: Collection and transportation of produced water from wellsites to disposal network via trucking or a fixed pipeline system, supplying freshwater for drilling and completion via pipeline system, gathering systems for collection and transportation of flowback and produced water to disposal wells. |
• | Disposal Wells and Landfill: Liquid waste water from hydraulic fracturing operations, liquid waste water from well production, and solid drilling waste. |
Business Strategy
Nuverra strives to be a leader in the oilfield services sector by providing value to our customers through an integrated service offering of water management solutions. Our strategy is focused on: (1) reinvesting in our core business in order to drive organic growth and provide a stable revenue stream, (2) maximizing our attractive asset base to capitalize on favorable industry trends, and (3) continuing to develop leading service offerings as the water management industry continues to evolve.
Our produced water hauling and disposal business provides a reliable revenue stream, as produced water is generated with or without drilling rig activity. While prices fluctuate throughout each industry cycle, produced water volumes typically increase or remain relatively stable. Spears & Associates, an industry market share research firm, estimates in their January 2018 report entitled, “The US Oilfield Water Management Services Market” (the “Report”) that produced water volumes for disposal will increase anywhere between 5% to 6% annually for the years 2018 through 2022.
Our network of assets are strategically located in the Rocky Mountain, Northeast and Southern regions. We have built a strong reputation in the industry as a result of providing our customers with excellent service quality over many years. Within the oilfield service sector, there are several key buying factors that determine the value we provide to our customers, such as: commitment to health, safety and environment; service quality including regulatory compliance; price; capacity and proximity; and technology. We continue to evolve our service offerings to address the critical value drivers while adapting to the changing water management industry. The current trend of integrated gathering and disposal systems is driving increased use of water pipelines. Our saltwater disposal wells (or “SWDs”) and pipelines are an integral part of our produced water business. SWDs provide core assets that we can leverage to provide incremental offerings on existing disposal and water midstream projects. We are also evaluating additional geographic and service line growth opportunities. As we continue to refine our portfolio and footprint, we may consider opportunistic asset sales to provide additional capital to fund our growth investments.
6
Market Overview
Nuverra operates in the large and fragmented market for water management. Spears & Associates estimates in their Report that the 2018 market size in the United States (or “U.S.”) for oilfield water management is approximately $28.6 billion. The primary services in Spears & Associates’ market estimate include water hauling, water disposal, water treatment, water storage, water acquisition, water flowback, and water transfer services. Nuverra provides the vast majority of these services, but does not have a presence in all U.S. geographic markets. Therefore, management believes there is significant opportunity for market share gains as the Company expands its resources. Spears & Associates’ projects in their Report that the U.S. oilfield water hauling market to be $8.4 billion in 2018 for a compounded annual growth rate of 34% from 2016 through 2018.
Nuverra is well positioned to benefit from the favorable trends in the broader oilfield services industry, such as hydraulic fracturing activity and rig counts. The U.S. rig counts in the shale basins in which we operate are expected to increase in 2018 by 13%, and currently represents approximately 26% of the total U.S. rig counts according to the Spears & Associates Report. There is opportunity for Nuverra to capitalize on these positive industry trends, specifically in our landfill, wellsite rentals, and water transfer services. These services deliver higher margins and provide us with the ability to enhance our profits during industry expansion cycles.
From a geographic perspective, Nuverra remains focused on being the premier service provider in our core areas of the Bakken, Marcellus, Utica, and Haynesville basins. We continue to evaluate growth opportunities in other areas such as the Permian, Midcontinent, and Niobrara basins. However, we do not plan to enter a market unless we believe we can generate attractive profitability and returns on invested capital. While some basins offer significant levels of activity, attractive economics for certain service providers are not assured given the amount of competition in those basins.
Advances in drilling technology and the development of unconventional North American hydrocarbon plays allow previously inaccessible or non-economical formations in the earth’s crust to be accessed by utilizing high pressure methods from water injection (or the process known as hydraulic fracturing) combined with proppant fluids (containing sand grains or ceramic beads) to create new perforation depths and fissures to extract natural gas, oil, and other hydrocarbon resources. Significant amounts of water are required for hydraulic fracturing operations, and subsequently, complex water flows, in the forms of flowback and produced water, represent a waste stream generated by these methods of hydrocarbon exploration and production. In addition to the liquid product stream involved in the hydraulic fracturing process, there are also significant environmental solid waste streams that are generated during the drilling and completion of a well. During the drilling process, a combination of the cut rock, or “cuttings,” mixed with the liquid used to drill the well, is returned to the surface and must be handled in accordance with environmental and other regulations. Historically, much of this solid waste byproduct was buried at the well site. We believe customers will increasingly focus on the treatment and offsite disposal or recycling of the solid waste byproduct. Produced water volumes, which represent water from the formation produced alongside hydrocarbons over the life of the well, are generally driven by geological considerations, combined with marginal costs of production and frequently create a multi-year demand for our services once the well has been drilled and completed.
Water treatment and recycling are key strategies within the industry as participants aim to minimize freshwater usage and reduce disposal. However, according to the Spears & Associates Report, roughly 60% - 70% of treatment and recycling costs relate to logistics. Nuverra is well positioned to provide our customers with leading logistics solutions to address these market challenges.
Operations
Our business consists of operations in shale basins where customers’ exploration and production (“E&P”) activities are predominantly focused on shale oil and natural gas as follows:
• | Oil shale areas: includes our operations in the Bakken and Eagle Ford shale areas. During 2017, 64% of our revenues from continuing operations were derived from these shale areas. |
• | Natural gas shale areas: includes our operations in the Marcellus, Utica, Haynesville, and gas sections of the Eagle Ford shale areas. During 2017, 36% of our revenues from continuing operations were derived from these shale areas. |
Our business operations are comprised of three geographically distinct divisions, which are further described in Note 22 of the Notes to Consolidated Financial Statements herein:
• | Rocky Mountain Division: comprising the Bakken shale area; |
• | Northeast Division: comprising the Marcellus and Utica shale areas; and |
7
• | Southern Division: comprising the Haynesville and Eagle Ford shale areas. |
The shale areas, which comprise our operating divisions, are further described below:
• | The Bakken and underlying Three Forks formations are the two primary reservoirs currently being developed in the Williston Basin, which covers most of western North Dakota, eastern Montana, northwest South Dakota and southern Saskatchewan. According to the Assumptions to the Annual Energy Outlook 2017 report issued in July of 2017 by the United States Energy Information Administration (or the “EIA”) with data as of January 1, 2015, the Bakken and Three Forks Shale formations contain an estimated 23.5 billion barrels of technically recoverable oil reserves. |
• | The Marcellus Shale area is located in the Appalachian Basin in the Northeastern United States, primarily in Pennsylvania, West Virginia, New York and Ohio. The Marcellus Shale is the largest natural gas field in North America with approximately 211.3 trillion cubic feet (or “Tcf”) of technically recoverable natural gas, according to the EIA’s report issued in July of 2017 with data as of January 1, 2015. |
• | Adjacent to the Marcellus Shale is the Utica Shale, located primarily in southwestern Pennsylvania and eastern Ohio. Still in the early stages of development, the Utica Shale play has three identified areas: oil, condensate and dry natural gas. According to the EIA’s report issued in July of 2017 with data as of January 1, 2015, the Utica Shale is estimated to have approximately 199.2 Tcf of technically recoverable natural gas and 2.2 billion barrels of technically recoverable oil reserves. |
• | The Haynesville Shale area is located across northwest Louisiana and east Texas, and extends into Arkansas. The Haynesville Shale area is the third largest natural gas-producing basin in North America, with an estimated 76.8 Tcf of technically recoverable natural gas according to the EIA’s report issued in July of 2017 with data as of January 1, 2015. |
• | The Eagle Ford Shale area is a natural gas and oil play located across southern Texas. The play contains a high liquid component, which has led to the definition of three areas: oil, condensate and dry gas. The Eagle Ford Shale is estimated to have approximately 52.2 Tcf of technically recoverable natural gas and 15.5 billion barrels of technically recoverable oil reserves, according to the EIA’s report issued in July of 2017 with data as of January 1, 2015. |
As part of our environmental and logistics management solutions for water and water-related services, we serve E&P customers seeking fresh water acquisition, temporary or permanent water transmission and storage, transportation, or disposal of fresh flowback and produced water in connection with shale oil and natural gas hydraulic fracturing operations. We also provide services for water pit excavations, well site preparation and well site remediation. We own an approximately 60-mile underground twin pipeline network in the Haynesville Shale for the collection of produced water and the delivery of fresh water. The pipeline network can handle volumes up to approximately 60 thousand barrels per day and is scalable up to approximately 100 thousand barrels per day. We have a fleet of approximately 630 heavy duty trucks including 80 specialty trucks and 550 water trucks used for delivery and collection, and over 2,850 storage tanks. We also own or lease 48 operating saltwater disposal wells in the Bakken, Marcellus/Utica, Haynesville, and Eagle Ford Shale areas.
Within our environmental and logistics management solutions for solid materials, we provide collection, transportation, and disposal options for solid waste generated by drilling and completion activities, including an oilfield solids disposal landfill that we own and operate in the Bakken Shale area. The landfill is located on a 50-acre site with current permitted capacity of more than 1.7 million cubic yards of airspace. We believe that permitted capacity at this site could be expanded up to a total of 5.8 million cubic yards in the future.
A significant part of the Company’s service offering involves trucking operations. Nuverra’s fleet of more than 630 trucks positions the Company among the top 20 in the Petroleum & Chemical sector according to Transport Topics’ 2017 Top 100 Private Carriers. The Company is experiencing the same driver shortage challenge that most trucking companies are facing. As a result of these challenges, Nuverra has successfully implemented trucking price increases and continues to explore methods to increase truck driver recruitment and retention.
Our fleet utilizes GPS and other automation tools that we expect to upgrade as technology progresses. Our service has long included electronic logging devices (ELDs). New regulations from the U.S. Department of Transportation that include the requirement for electronic logs (rather than paper logs that can be adjusted) that became effective in December of 2017 are not expected to impact our business. We anticipate that many of our competitors will have to adopt ELDs and adhere to the same rules that we currently follow. We believe this new change can significantly improve the trucking industry compliance with
8
existing rules and regulations and be a positive factor for Nuverra since many of our less sophisticated competitors will now bear generally equivalent compliance costs that are currently part of our cost structure.
Customers
Our customers include major domestic and international oil and natural gas companies, foreign national oil and natural gas companies and independent oil and natural gas production companies. For the year ended December 31, 2017, our three largest customers were Continental Resources, Hess Corporation, and Southwestern Energy which represented 10%, 9% and 9%, respectively, of our total consolidated revenues. The loss of any one of these three customers could have a material adverse affect on the Company.
Competition
Our competition includes small regional service providers, as well as larger companies with operations throughout the continental United States and internationally. Some of our competitors are Select Energy Services, Key Energy Services, Inc., Basic Energy Services, Inc., C&J Energy Services, Inc., Superior Energy Services, Inc., Clean Harbors, Inc., TETRA Technologies, Inc., Pioneer Energy Services Corp, MBI Energy Services, Stallion Oilfield Services, Waste Connections, Pinnergy, Ltd., McKenzie Energy Partners, LLC, and Buckhorn Energy Services, LLC.
Health, Safety & Environment
We are committed to excellence in health, safety and environment (“HS&E”) in our operations, which we believe is a critical characteristic of our business. Our customers in the unconventional shale basins require us to meet high standards on HS&E matters. As a result, we believe that being a leading environmental solutions company with a national presence and a dedicated focus on environmental solutions is a competitive advantage relative to smaller, regional companies, as well as companies that provide certain environmental services as ancillary offerings.
Seasonality
Certain of our business divisions are impacted by seasonal factors. Generally, our business is negatively impacted during the winter months due to inclement weather, fewer daylight hours and holidays. During periods of heavy snow, ice or rain, we may be unable to move our trucks and equipment between locations, thereby reducing our ability to provide services and generate revenue. In addition, these conditions may impact our customers’ operations, and, as our customers’ drilling and/or hydraulic fracturing activities are curtailed, our services may also be reduced.
Intellectual Property
We operate under numerous trade names and own several trademarks, the most important of which are “Nuverra,” “HWR,” “Power Fuels,” and “Heckmann Water Resources.” We also have access, through certain exclusive business relationships, to various water treatment technologies which, based on our experience, we utilize to create cost-effective and proprietary total water treatment solutions for our customers.
Operating Risks
Our operations are subject to hazards inherent in our industry, including accidents and fires that could cause personal injury or loss of life, damage to or destruction of property, equipment and the environment, suspension of operations and litigation, as described in Note 19 of the Notes to the Consolidated Financial Statements herein, associated with these hazards. Because our business involves the transportation of environmentally regulated materials, we may also experience traffic accidents or pipeline breaks that may result in spills, property damage and personal injury. We have implemented a comprehensive HS&E program designed to minimize accidents in the workplace, enhance our safety programs, maintain environmental compliance and improve the efficiency of our operations.
Governmental Regulation, Including Environmental Regulation and Climate Change
Our operations are subject to stringent United States federal, state and local laws and regulations concerning the discharge of materials into the environment or otherwise relating to health and safety or the protection of the environment. Additional laws and regulations, or changes in the interpretations of existing laws and regulations, that affect our business and operations may be adopted, which may in turn impact our financial condition. The following is a summary of the more significant existing health, safety and environmental laws and regulations to which our operations are subject.
9
Hazardous Substances and Waste
The United States Comprehensive Environmental Response, Compensation, and Liability Act, as amended, referred to as “CERCLA” or the “Superfund” law, and comparable state laws impose liability without regard to fault or the legality of the original conduct on certain defined persons, including current and prior owners or operators of a site where a release of hazardous substances occurred and entities that disposed or arranged for the disposal of the hazardous substances found at the site. Under CERCLA, these “responsible persons” may be liable for the costs of cleaning up the hazardous substances, for damages to natural resources and for the costs of certain health studies.
In the course of our operations, we occasionally generate materials that are considered “hazardous substances” and, as a result, may incur CERCLA liability for cleanup costs. Also, claims may be filed for personal injury and property damage allegedly caused by the release of hazardous substances or other pollutants. We also generate solid wastes that are subject to the requirements of the United States Resource Conservation and Recovery Act, as amended, or “RCRA,” and comparable state statutes.
Although we use operating and disposal practices that are standard in the industry, hydrocarbons or other wastes may have been released at properties owned or leased by us now or in the past, or at other locations where these hydrocarbons and wastes were taken for treatment or disposal. Under CERCLA, RCRA and analogous state laws, we could be required to clean up contaminated property (including contaminated groundwater), or to perform remedial activities to prevent future contamination.
Air Emissions
The Clean Air Act, as amended, or “CAA,” and similar state laws and regulations restrict the emission of air pollutants and also impose various monitoring and reporting requirements. These laws and regulations may require us to obtain approvals or permits for construction, modification or operation of certain projects or facilities and may require use of emission controls.
Global Warming and Climate Change
While we do not believe our operations raise climate change issues different from those generally raised by the commercial use of fossil fuels, legislation or regulatory programs that restrict greenhouse gas emissions in areas where we conduct business or that would require reducing emissions from our truck fleet could increase our costs. From another perspective, a carbon constrained environment would likely reward hydrocarbons produced from low cost areas.
Water Discharges
We operate facilities that are subject to requirements of the United States Clean Water Act, as amended, or “CWA,” and analogous state laws for regulating discharges of pollutants into the waters of the United States and regulating quality standards for surface waters. Among other things, these laws impose restrictions and controls on the discharge of pollutants, including into navigable waters as well as the protection of drinking water sources. Spill prevention, control and counter-measure requirements under the CWA require implementation of measures to help prevent the contamination of navigable waters in the event of a hydrocarbon spill. Other requirements for the prevention of spills are established under the United States Oil Pollution Act of 1990, as amended, or “OPA”, which amended the CWA and applies to owners and operators of vessels, including barges, offshore platforms and certain onshore facilities. Under OPA, regulated parties are strictly liable for oil spills and must establish and maintain evidence of financial responsibility sufficient to cover liabilities related to an oil spill for which such parties could be statutorily responsible.
State Environmental Regulations
Our operations involve the storage, handling, transport and disposal of bulk waste materials, some of which contain oil, contaminants and other regulated substances. Various environmental laws and regulations require prevention, and where necessary, cleanup of spills and leaks of such materials and some of our operations must obtain permits that limit the discharge of materials. Failure to comply with such environmental requirements or permits may result in fines and penalties, remediation orders and revocation of permits. In Texas, we are subject to rules and regulations promulgated by the Texas Railroad Commission and the Texas Commission on Environmental Quality, including those designed to protect the environment and monitor compliance with water quality. In Louisiana, we are subject to rules and regulations promulgated by the Louisiana Department of Environmental Quality and the Louisiana Department of Natural Resources as to environmental and water quality issues, and the Louisiana Public Service Commission as to allocation of intrastate routes and territories for waste water transportation. In Pennsylvania, we are subject to the rules and regulations of the Pennsylvania Department of Environmental Protection and the Pennsylvania Public Service Commission. In Ohio, we are subject to the rules and regulations of the Ohio Department of Natural Resources and the Ohio Environmental Protection Agency. In North Dakota, we are subject to the rules and regulations of the North Dakota Department of Health, the North Dakota Industrial Commission, Oil and Gas Division, and
10
the North Dakota State Water Commission. In Montana, we are subject to the rules and regulations of the Montana Department of Environmental Quality and the Montana Board of Oil and Gas.
Occupational Safety and Health Act
We are subject to the requirements of the United States Occupational Safety and Health Act, as amended, or “OSHA,” and comparable state laws that regulate the protection of employee health and safety. OSHA’s hazard communication standard requires that information about hazardous materials used or produced in our operations be maintained and provided to employees, state and local government authorities and citizens.
Saltwater Disposal Wells
We operate saltwater disposal wells that are subject to the CWA, the Safe Drinking Water Act, or “SDWA,” and state and local laws and regulations, including those established by the Underground Injection Control Program of the United States Environmental Protection Agency, or “EPA,” which establishes minimum requirements for permitting, testing, monitoring, record keeping and reporting of injection well activities. Our saltwater disposal wells are located in Louisiana, Montana, North Dakota, Ohio and Texas. Regulations in many states require us to obtain a permit to operate each of our saltwater disposal wells in those states. These regulatory agencies have the general authority to suspend or modify one or more of these permits if continued operation of one of our saltwater wells is likely to result in pollution of freshwater, tremors or earthquakes, substantial violation of permit conditions or applicable rules, or leaks to the environment. Any leakage from the subsurface portions of the saltwater wells could cause degradation of fresh groundwater resources, potentially resulting in cancellation of operations of a well, issuance of fines and penalties from governmental agencies, incurrence of expenditures for remediation of the affected resource and claims by third parties for property damages and personal injuries.
Transportation Regulations
We conduct interstate motor carrier (trucking) operations that are subject to federal regulation by the Federal Motor Carrier Safety Administration, or “FMCSA,” a unit within the United States Department of Transportation, or “USDOT.” The FMCSA publishes and enforces comprehensive trucking safety regulations, including rules on commercial driver licensing, controlled substance testing, medical and other qualifications for drivers, equipment maintenance, and drivers’ hours of service, referred to as “HOS.” The agency also performs certain functions relating to such matters as motor carrier registration (licensing), insurance, and extension of credit to motor carriers’ customers. Another unit within USDOT publishes and enforces regulations regarding the transportation of hazardous materials, or “hazmat.” The waste water and other water flows we transport by truck are generally not regulated as hazmat at this time.
Our intrastate trucking operations are also subject to various states environmental and waste water transportation regulations discussed under “Environmental Regulations” above. Federal law also allows states to impose insurance and safety requirements on motor carriers conducting intrastate business within their borders, and to collect a variety of taxes and fees on an apportioned basis reflecting miles actually operated within each state.
HOS regulations establish the maximum number of hours that a commercial truck driver may work and are intended to reduce the risk of fatigue and fatigue-related crashes and harm to driver health. Due to the specialized nature of our operations in the oil and gas industry, we qualify for an exception in the federal HOS rules (i.e., the “Oilfield Exemption”). Drivers of most property-carrying commercial motor vehicles have to take at least 34 hours off duty in order to reset their accumulated hours under the 60/70-hour rule, but drivers of property-carrying commercial motor vehicles that are used exclusively to support oil and gas activities can restart with just 24 hours off under the Oilfield Exemption. However, there are other HOS regulations that affect our operations, including the 11-Hour Driving Limit, 14-Hour On Duty Limit, 30-Minute Rest Break, 60/70-Hour Limit On Duty in 7/8 consecutive days. Compliance with these rules directly impacts our operating costs.
Employees
As of December 31, 2017, we had 791 full time employees, of whom 195 were executive, managerial, sales, general, administrative, and accounting staff, and 596 were truck drivers, service providers and field workers. We have not experienced, and do not expect, any work stoppages, and believe that we maintain a satisfactory working relationship with our employees.
Emergence from Chapter 11 Reorganization
On May 1, 2017, the Company and certain of its material subsidiaries (collectively with the Company, the “Nuverra Parties”) filed voluntary petitions under chapter 11 of the United States Bankruptcy Code (the “Bankruptcy Code”) in the United States Bankruptcy Court for the District of Delaware (the “Bankruptcy Court”) to pursue prepackaged plans of reorganization (together, and as amended, the “Plan”). On July 25, 2017, the Bankruptcy Court entered an order (the “Confirmation Order”)
11
confirming the Plan. The Plan became effective on August 7, 2017 (the “Effective Date”), when all remaining conditions to the effectiveness of the Plan were satisfied or waived. Although the Nuverra Parties emerged from bankruptcy on the Effective Date, the bankruptcy cases will remain pending until closed by the Bankruptcy Court. See Note 4 on “Emergence from Chapter 11 Reorganization” of the Notes to Consolidated Financial Statements herein for additional details.
Upon emergence, we elected to apply fresh start accounting effective July 31, 2017, to coincide with the timing of our normal accounting period close. Refer to Note 5 on “Fresh Start Accounting” of the Notes to Consolidated Financial Statements herein for additional information on the selection of this date. As a result of the application of fresh start accounting, as well as the effects of the implementation of the Plan, a new entity for financial reporting purposes was created, and as such, the condensed consolidated financial statements on or after August 1, 2017, are not comparable with the condensed consolidated financial statements prior to that date.
References to “Successor” or “Successor Company” refer to the financial position and results of operations of the reorganized Company subsequent to July 31, 2017. References to “Predecessor” or “Predecessor Company” refer to the financial position and results of operations of the Company on and prior to July 31, 2017.
Available Information
Information that we file with or furnish to the SEC, including our Annual Reports on Form 10-K, Quarterly Reports on Form 10-Q, Current Reports on Form 8-K, and any amendments to or exhibits included in these reports, are available free of charge on our website at www.nuverra.com soon after such reports are filed with or furnished to the SEC. From time to time, we also post announcements, updates, events, investor information and presentations on our website in addition to copies of all recent press releases. Our reports, including any exhibits included in such reports, that are filed with or furnished to the SEC are also available on the SEC’s website at www.sec.gov. You may also read and copy any materials we file with or furnish to the SEC at the SEC’s Public Reference Room at 100 F Street, NE, Room 1580, Washington, D.C. 20549; information on the operation of the Public Reference Room may be obtained by calling the SEC at 1-800-SEC-0330. You may request copies of these documents from the SEC, upon payment of a duplicating fee, by writing to the SEC at its principal office at 100 F Street, NE, Room 1580, and Washington, D.C. 20549.
Neither the contents of our website nor that maintained by the SEC are incorporated into or otherwise a part of this filing. Further, references to the URLs for these websites are intended to be inactive textual references only.
Item 1A. Risk Factors
This section describes material risks to our businesses that currently are known to us. You should carefully consider the risks described below. If any of the risks and uncertainties described in the cautionary factors described below actually occur, our business, financial condition and results of operations could be materially and adversely affected. The risks and factors listed below, however, are not exhaustive. Other sections of this Annual Report on Form 10-K include additional factors that could materially and adversely impact our business, financial condition and results of operations. Moreover, we operate in a rapidly changing environment. Other known risks that we currently believe to be immaterial could become material in the future. We also are subject to legal and regulatory changes. New factors emerge from time to time and it is not possible to predict the impact of all these factors on our business, financial condition or results of operations.
Risks Related to the Completed Restructuring and Our Indebtedness
We recently emerged from bankruptcy, which could adversely affect our business and relationships.
Due to a severe industry downturn beginning in late 2014, on May 1, 2017, the Company and certain of its material subsidiaries (collectively with the Company, the “Nuverra Parties”) filed voluntary petitions under chapter 11 of the United States Bankruptcy Code (the “Bankruptcy Code”) in the United States Bankruptcy Court for the District of Delaware (the “Bankruptcy Court”) to pursue prepackaged plans of reorganization (together, and as amended, the “Plan”). On July 25, 2017, the Bankruptcy Court entered an order confirming the plan (the “Confirmation Order”). The Plan became effective on August 7, 2017 (the “Effective Date”), when all remaining conditions to the effectiveness of the Plan were satisfied or waived, and the Nuverra Parties emerged from chapter 11. Although the Nuverra Parties emerged from bankruptcy on the Effective Date, the bankruptcy cases will remain pending until closed by the Bankruptcy Court.
Our recent emergence from chapter 11 could adversely affect our business and relationships with customers, employees, suppliers and others. Due to uncertainties, many risks exist, including the following:
12
• | we may have difficulty obtaining the capital we need to run and grow our business; |
• | key suppliers could terminate their relationship with us or require financial assurances or enhanced performance; |
• | our ability to renew existing contracts and compete for new business may be adversely affected; |
• | our ability to attract, motivate and/or retain key executives and employees may be adversely affected; |
• | employees may be distracted from performance of their duties or more easily attracted to other employment opportunities, and |
• | competitors may take business away from us, and our ability to attract and retain customers may be negatively impacted. |
The occurrence of one or more of these events could have a material adverse effect on our operations, financial condition, and results of operations. We cannot assure you that having been through chapter 11 will not adversely affect our operations in the future.
Upon our emergence from chapter 11, the composition of our shareholder base and concentration of equity ownership changed significantly. As a result, the future strategy and plans of the Company may differ materially from those of the past.
Upon our emergence from chapter 11, two shareholder groups beneficially own approximately 90% (the “Significant Shareholders”) of our issued and outstanding common stock and, therefore, have significant control on the outcome of matters submitted to a vote of shareholders, including, but not limited to, electing directors and approving corporate transactions. As a result, the future strategy and plans of the Company may differ materially from those of the past. Circumstances may occur in which the interests of the Significant Shareholders could be in conflict with the interests of other shareholders, and the Significant Shareholders would have substantial influence to cause us to take actions that align with their interests. Should conflicts arise, we can provide no assurance that the Significant Shareholders would act in the best interests of other shareholders or that any conflicts of interest would be resolved in a manner favorable to our other shareholders.
The effects of the pending appeal of the Confirmation Order in the District Court for the District of Delaware are difficult to predict.
On July 26, 2017, David Hargreaves, an individual holder of our pre-Effective Date 9.875% Senior Notes due 2018 (the “2018 Notes”), appealed the Confirmation Order to the Bankruptcy Court and filed a motion for a stay pending appeal from the Bankruptcy Court. The Company and the unsecured creditors’ committee opposed the stay in the Bankruptcy Court. On August 3, 2017, the Bankruptcy Court entered an order denying the motion for a stay pending appeal, concluding that: “The Bankruptcy Court’s ruling is consistent with existing precedent, and Appellant has failed to establish that he will suffer irreparable harm in absence of a stay.” Notwithstanding the denial of the motion for stay pending appeal, Hargreaves’ appeal remains pending in the Bankruptcy Court. The ultimate outcome of this appeal and its effects on the Confirmation Order are impossible to predict with certainty. No assurance can be given that the appeal will not affect the finality, validity and enforceability of the Confirmation Order. If the Confirmation Order is overturned or modified on appeal, there could be adverse effects on our businesses.
Our actual financial results after emergence from chapter 11 may not be comparable to our projections filed with the Bankruptcy Court in the course of our chapter 11 cases, and will not be comparable to our historical financial results as a result of the implementation of our Plan and the transactions contemplated thereby.
We filed with the Bankruptcy Court projected financial information to demonstrate to the Bankruptcy Court the feasibility of our Plan and our ability to continue operations following our emergence from chapter 11. Those projections were prepared solely for the purpose of the chapter 11 cases and have not been, and will not be, updated on an ongoing basis and should not be relied upon by investors. At the time they were prepared, the projections reflected numerous assumptions concerning our anticipated future performance with respect to then prevailing and anticipated market and economic conditions that were and remain beyond our control and that may not materialize. Projections are inherently subject to substantial and numerous uncertainties and to a wide variety of significant business, economic and competitive risks and the assumptions underlying the projections and/or valuation estimates may prove to be wrong in material respects. Actual results will likely vary significantly from those contemplated by the projections. As a result, investors should not rely on those projections.
13
Information contained in our historical financial statements will not be comparable to the information contained in our financial statements after the application of fresh start accounting.
This Annual Report on Form 10-K reflects the consummation of the Plan and the adoption of fresh start accounting. As a result, our financial statements from and after the Effective Date will not be comparable to our financial statements for prior periods. This will make it difficult for shareholders to assess our performance in relation to prior periods. Please see Note 5 on “Fresh Start Accounting” in the Notes to Condensed Consolidated Financial Statements for further information.
There is no guarantee that the warrants issued by us in accordance with the Plan will become in the money, and unexercised warrants may expire worthless.
As long as our stock price is below $39.82 per share, the warrants will have limited economic value, and they may expire worthless. Additionally, no warrant holder has, by virtue of holding or having a beneficial interest in the warrants, the right to vote, consent, receive any cash dividends, allotments or rights or other distributions paid, allotted or distributed or distributable to the holders of common stock, or to exercise any rights whatsoever as a stockholder unless, until, and only to the extent such warrant holder becomes a holder of record of shares of common stock issued upon settlement of warrants.
The amount of our debt and the covenants in the agreements governing our debt could negatively impact our business operations, financial condition, results of operations, and business prospects.
Although we reduced the amount of our debt by approximately $500 million as a result of the reorganization, as of December 31, 2017, we had approximately $39.0 million of total debt. Our level of indebtedness, and the covenants contained in the agreements governing our debt, could have important consequences for our operations, including:
• | making it more difficult for us to satisfy our obligations under the agreements governing our indebtedness and increasing the risk that we may default on our debt obligations; |
• | requiring us to dedicate a substantial portion of our cash flow from operations to required payments on indebtedness, thereby reducing the availability of cash flow for working capital, capital expenditures and other general business activities; |
• | limiting our ability to obtain additional financing in the future for working capital, capital expenditures, acquisitions, general corporate purposes and other activities; |
• | limiting management’s flexibility in operating our business; |
• | limiting our flexibility in planning for, or reacting to, changes in our business and the industry in which we operate; |
• | diminishing our ability to successfully withstand a downturn in our business or the economy generally; |
• | placing us at a competitive disadvantage against less leveraged competitors; and |
• | making us vulnerable to increases in interest rates, because our debt has variable interest rates. |
Each of our debt instruments contain certain negative covenants that impose specific restrictions on us. These restrictions include, among others, our ability to incur additional debt; operationally prepay, redeem, or purchase any indebtedness; pay dividends or make other distributions, make other restricted payments and investments; create liens; enter into certain merger, consolidation, reorganization, or recapitalization transactions; merge consolidate, or transfer or dispose of substantially all of our assets; and enter into certain types of transactions with affiliates. In addition, there are a number of affirmative covenants with which we must comply. A breach of any of these negative or affirmative covenants could result in a default under our indebtedness. If we default, our lenders will no longer be obligated to extend credit to us, and they could declare all amounts of outstanding debt, together with accrued interest, to be immediately due and payable. The results of such actions would have a significant impact on our results of operations, financial position, and cash flows. We likely would not have sufficient liquidity to repay all of our outstanding indebtedness.
14
Our ability to meet our obligations under our indebtedness depends in part on our earnings and cash flows and those of our subsidiaries and on our ability and the ability of our subsidiaries to pay dividends or advance or repay funds to us.
We conduct all of our operations through our subsidiaries. Consequently, our ability to service our debt is dependent, in large part, upon the earnings from the businesses conducted by our subsidiaries. Our subsidiaries are separate and distinct legal entities and have no obligation to pay any amounts to us, whether by dividends, loans, advances or other payments. The ability of our subsidiaries to pay dividends and make other payments to us depends on their earnings, capital requirements and general financial conditions and is restricted by, among other things, applicable corporate and other laws and regulations as well as, in the future, agreements to which our subsidiaries may be a party.
Our borrowings under our revolving credit facility and first lien term loan facility expose us to interest rate risk.
Our earnings are exposed to interest rate risk associated with borrowings under our revolving credit facility and first lien term loan facility. Our revolving credit facility and first lien term loan facility carry a floating interest rate; therefore, as interest rates increase, so will our interest costs, which may have a material adverse effect on our financial condition, results of operations and cash flows.
Risks Related to Our Company
Our business depends on spending by our customers in the oil and natural gas industry in the United States, and this spending and our business has been, and may in the future be, adversely affected by industry and financial market conditions that are beyond our control. The substantial and extended decline in oil and natural gas prices beginning in the second half of 2014 and continuing into 2017 resulted in lower expenditures by our customers, which led to a material adverse effect on our financial condition, results of operations and cash flows, and another such decline could materially adversely affect our financial condition, results of operations and cash flows in the future.
We depend on our customers’ willingness to make operating and capital expenditures to explore, develop and produce oil and natural gas in the United States. These expenditures are generally dependent on current oil and natural gas prices and the industry’s view of future oil and natural gas prices, including the industry’s view of future economic growth and the resulting impact on demand for oil and natural gas. The substantial and extended decline in oil and natural gas prices beginning in the second half of 2014 and continuing into 2017 resulted in significant reductions in our customers’ operating and capital expenditures, which had a material adverse effect on our financial condition, results of operations and cash flows. The extended decline resulted in diminished demand for oilfield services and downward pressure on the prices customers were willing to pay for services such as ours.
Due to oil prices beginning to recover in 2017 from historic lows, we have seen drilling and completion activities increase in all basins. We would expect continued stability in oil prices or further price growth to lead to increased drilling and completion activities by our customer base during 2018 when compared to 2017. Increased drilling and completion activities would likely lead to a higher demand for our services in 2018; however, there is no guarantee that oil prices will remain stable or increase, drilling and completion activities in basins will continue to increase, or we will see an increase in a demand for our services in 2018. Another downturn in oil and natural gas prices could materially adversely affect our financial condition, results of operations and cash flows in the future.
Industry conditions are influenced by numerous factors over which we have no control, including:
• | the domestic and worldwide price and supply of gas, natural gas liquids and oil, including the natural gas inventories and oil reserves of the United States; |
• | changes in the level of consumer demand; |
• | the price and availability of alternative fuels; |
• | weather conditions; |
• | the availability, proximity and capacity of pipelines, other transportation facilities and processing facilities; |
• | the level and effect of trading in commodity futures markets, including by commodity price speculators and others; |
15
• | the nature and extent of domestic and foreign governmental regulations and taxes; |
• | actions of the members of the Organization of the Petroleum Exporting Countries or “OPEC,” relating to oil price and production controls; |
• | the level of excess production and projected rates of production growth; |
• | geo-political instability or armed conflict in oil and natural gas producing regions; and |
• | overall domestic and global economic and market conditions. |
Our operating margins and profitability may be negatively impacted by changes in fuel and energy costs. In addition, due to certain fixed costs, our operating margins and earnings may be sensitive to changes in revenues.
Our business is dependent on availability of fuel for operating our fleet of trucks. Changes and volatility in the price of crude oil can adversely impact the prices for these products and therefore affect our operating results. The price and supply of fuel is unpredictable and fluctuates based on events beyond our control, including geopolitical developments, supply and demand for oil and natural gas, actions by OPEC and other oil and natural gas producers, war and unrest in oil producing countries, regional production patterns, and environmental concerns.
Furthermore, our facilities, fleet and personnel subject us to fixed costs, which make our margins and earnings sensitive to changes in revenues. In periods of declining demand, we may be unable to cut costs at a rate sufficient to offset revenue declines, which may put us at a competitive disadvantage to firms with lower or more flexible cost structures, and may result in reduced operating margins and/or higher operating losses. These effects could have a material adverse effect on our financial condition, results of operations and cash flows.
Future charges due to possible impairments of assets may have a material adverse effect on our results of operations and stock price.
As discussed more fully in Note 8 of the Notes to the Consolidated Financial Statements, we recorded total impairment charges of $4.9 million for long-lived assets classified as held for sale during the year ended December 31, 2017, which was included in “Impairment of long-lived assets” in the consolidated statement of operations. During the year ended December 31, 2016, we recorded total impairment charges for long-lived assets of $42.2 million. These charges were due to the carrying value of assets for certain basins not being recoverable, as well as for assets that were classified as held for sale during 2016. If there is further deterioration in our business operations or prospects, our stock price, the broader economy or our industry, including further declines in oil and natural gas prices, the value of our long-lived assets, or those we may acquire in the future, could decrease significantly and result in additional impairment and financial statement write-offs.
The testing of long-lived assets for impairment requires us to make significant estimates about our future performance and cash flows, as well as other assumptions. These estimates can be affected by numerous factors, including changes in the composition of our reporting units; changes in economic, industry or market conditions; changes in business operations; changes in competition; or potential changes in the share price of our common stock and market capitalization. Changes in these factors, or differences in our actual performance compared with estimates of our future performance, could affect the fair value of long-lived assets, which may result in further impairment charges. We perform the assessment of potential impairment at least annually, or more often if events and circumstances require.
Should the value of our long-lived assets become impaired, we would incur additional charges which could have a material adverse effect on our consolidated results of operations and could result in us incurring additional net operating losses in future periods. We cannot accurately predict the amount or timing of any impairment of assets. Any future determination requiring the write-off of a significant portion of long-lived assets, although not requiring any additional cash outlay, could have a material adverse effect on our results of operations and stock price.
The litigation environment in which we operate poses a significant risk to our businesses.
We are often involved in the ordinary course of business in a number of lawsuits involving employment, commercial, and environmental issues, other claims for injuries and damages, and various shareholder and class action litigation, among other matters. We may experience negative outcomes in such lawsuits in the future. Any such negative outcomes could have a material adverse effect on our business, liquidity, financial condition and results of operations. We evaluate litigation claims and legal proceedings to assess the likelihood of unfavorable outcomes and to estimate, if possible, the amount of potential losses. Based on these assessments and estimates, we establish reserves and disclose the relevant litigation claims or legal proceedings, as appropriate. These assessments and estimates are based on the information available to management at the time and involve a
16
significant amount of judgment. Actual outcomes or losses may differ materially from such assessments and estimates. The settlement or resolution of such claims or proceedings may have a material adverse effect on our results of operations. In addition, judges and juries in certain jurisdictions in which we conduct business have demonstrated a willingness to grant large verdicts, including punitive damages, to plaintiffs in personal injury, property damage and other tort cases. We use appropriate means to contest litigation threatened or filed against us, but the litigation environment in these areas poses a significant business risk to us and could cause a significant diversion of management’s time and resources, which could have a material adverse effect on our financial condition, results of operations and cash flows.
The hazards and risks associated with the transport, storage, and handling, treatment and disposal of our customers’ waste (such as fires, spills, explosions and accidents) may expose us to personal injury claims, property damage claims and/or products liability claims from our employees, customers or third parties. As protection against such claims and operating hazards, we maintain insurance coverage against some, but not all, potential losses. However, we may sustain losses for uninsurable or uninsured risks, or in amounts in excess of existing insurance coverage. As more fully described in Note 19 of the Notes to Consolidated Financial Statements herein, due to the unpredictable nature of personal injury litigation, it is not possible to predict the ultimate outcome of these claims and lawsuits, and we may be held liable for significant personal injury or damage to property or third parties, or other losses, that are not fully covered by our insurance, which could have a material adverse effect on our financial condition, results of operations and cash flows.
Significant capital expenditures are required to conduct our business, and our failure or inability to make sufficient capital investments could significantly harm our business prospects.
The development of our business and services, excluding acquisition activities, requires capital expenditures. During the year ended December 31, 2017, we made cash capital expenditures of approximately $5.4 million, which primarily related to expenditures to extend the useful life and productivity on our fleet of trucks, tanks, equipment and disposal wells. We continue to focus on finding ways to improve the utilization of our existing assets and optimizing the allocation of resources in the various shale areas in which we operate. Our capital expenditure program is subject to market conditions, including customer activity levels, commodity prices, industry capacity and specific customer needs. In addition to capital expenditures required to maintain our current level of business activity, we may incur capital expenditures to support future growth of our business.
We expect capital spending levels in 2018 to increase. Prolonged reductions or delays in capital expenditures could delay or diminish future cash flows and adversely affect our business and results of operations. Our planned capital expenditures for 2018 are expected to be financed through cash flow from operations, borrowings under our credit facility and term loan facilities, capital leases, or a combination of the foregoing. Future cash flows from operations are subject to a number of risks and variables, such as the level of drilling activity and oil and natural gas production of our customers, prices of natural gas and oil, and the other risk factors discussed herein. Our ability to obtain capital from other sources, such as the capital markets, is dependent upon many of those same factors as well as the orderly functioning of credit and capital markets. To the extent we fail to have adequate funds, we could be required to further reduce or defer our capital spending, or pursue other funding alternatives which may not be as economically attractive to us, which in turn could have a materially adverse effect on our financial condition, results of operations and cash flows.
The compensation we offer our drivers is subject to market conditions, and we may find it necessary to increase driver compensation and/or modify the benefits provided to our employees in future periods.
Maintaining a staff of qualified truck drivers is critical to the success of our operations. We and other companies in the oil and natural gas industry suffer from a high turnover rate of drivers. The high turnover rate requires us to continually recruit a substantial number of drivers in order to operate existing equipment. If we are unable to continue to attract and retain a sufficient number of qualified drivers, we could be forced to, among other things, increase driver compensation and/or modify our benefit packages, or operate with fewer trucks and face difficulty meeting customer demands, any of which could adversely affect our growth and profitability. Additionally, in anticipation of or in response to geographical and market-related fluctuations in the demand for our services, we strategically relocate our equipment and personnel from one area to another, which may result in operating inefficiencies, increased labor, fuel and other operating costs and could adversely affect our growth and profitability. As a result, our driver and employee training and orientation costs could be negatively impacted. We also utilize the services of independent contractor truck drivers to supplement our trucking capacity in certain shale areas on an as-needed basis. There can be no assurance that we will be able to enter into these types of arrangements on favorable terms, or that there will be sufficient qualified independent contractors available to meet our needs, which could have a material adverse effect on our financial condition, results of operations and cash flows.
17
We depend on certain key customers for a significant portion of our revenues. The loss of any of these key customers or the loss of any contracted volumes could result in a decline in our business.
We rely on a limited number of customers for a significant portion of our revenues. Our three largest customers represented 10%, 9% and 9%, respectively, of our total consolidated revenues for the year ended December 31, 2017 and in total equaled 27% of our consolidated accounts receivable at December 31, 2017. The loss of all, or even a portion, of the revenues from these customers, as a result of competition, market conditions or otherwise, could have a material adverse effect on our business, results of operations, financial condition, and cash flows. A reduction in exploration, development and production activities by key customers due to the current declines in oil and natural gas prices, or otherwise, could have a material adverse effect on our financial condition, results of operations and cash flows.
Customer payment delays of outstanding receivables could have a material adverse effect on our liquidity, consolidated results of operations, and consolidated financial condition.
We often provide credit to our customers for our services, and are therefore subject to our customers delaying or failing to pay outstanding invoices. In weak economic environments, customers’ delays and failures to pay often increase due to, among other reasons, a reduction in our customers’ cash flow from operations and their access to credit markets. If our customers delay or fail to pay a significant amount of outstanding receivables, it could reduce our availability under our revolving credit facility or otherwise have a material adverse effect on our liquidity, financial condition, results of operations and cash flows.
We may be unable to achieve or maintain pricing to our customers at a level sufficient to cover our costs, which would negatively impact our profitability.
We may be unable to charge prices to our customers that are sufficient to cover our costs. Our pricing is subject to highly competitive market conditions, and we may be unable to increase or maintain pricing as market conditions change. Likewise, customers may seek pricing declines more precipitously than our ability to reduce costs. In certain cases, we have entered into fixed price agreements with our customers, which may further limit our ability to raise the prices we charge our customers at a rate sufficient to offset any increases in our costs. Additionally, some customers’ obligations under their agreements with us may be permanently or temporarily reduced upon the occurrence of certain events, some of which are beyond our control, including force majeure events. Force majeure events may include (but are not limited to) events such as revolutions, wars, acts of enemies, embargoes, import or export restrictions, strikes, lockouts, fires, storms, floods, acts of God, explosions, mechanical or physical failures of our equipment or facilities of our customers. If the amounts we are able to charge customers are insufficient to cover our costs, or if any customer suspends, terminates or curtails its business relationship with us, the effects could have a material adverse impact on our financial condition, results of operations and cash flows.
We operate in competitive markets, and there can be no certainty that we will maintain our current customers or attract new customers or that our operating margins will not be impacted by competition.
The industries in which our business operates are highly competitive. We compete with numerous local and regional companies of varying sizes and financial resources. Competition has intensified during this downturn, and could further intensify in the future. Furthermore, numerous well-established companies are focusing significant resources on providing similar services to those that we provide that will compete with our services. We cannot assure you that we will be able to effectively compete with these other companies or that competitive pressures, including possible downward pressure on the prices we charge for our products and services, or customer perception of our completed chapter 11 filing, will not arise. In addition, the current declines in oil and natural gas prices may result in competitors moving resources from higher-cost exploration and production areas to relatively lower-cost exploration and production areas where we are located thereby increasing supply and putting further downward pressure on the prices we can charge for our products and services, including our rental business. In the event that we cannot effectively compete on a continuing basis, or competitive pressures arise, such inability to compete or competitive pressures could have a material adverse effect on our financial condition, results of operations and cash flows.
Market projections and data are forward-looking in nature.
Our strategy is based in part on our own market projections and on third-party analyst, industry observer, and expert reports and market projections, which are forward-looking in nature and are inherently subject to numerous risks and uncertainties. This Annual Report contains forward-looking market projections based on studies and reports produced by third-party market analysts and experts. The predictions by us or such third-party market analysts or experts are subject to numerous factors that could change or emerge in the future, and any market data we rely upon, whether from third parties or otherwise, may be inaccurate or based on flawed assumptions at the time such predictions were made. The inaccuracy of any such market projections and/or market data could adversely affect our operating results and financial condition, and we urge you to carefully
18
consider the validity and limitations of any such market data or projections we include in this Annual Report and in any of our other filings with the SEC.
Any interruption in our services due to pipeline ruptures or spills or necessary maintenance could impair our financial performance and negatively affect our brand.
Our water transport pipelines are susceptible to ruptures and spills, particularly during start up and initial operation, and require ongoing inspection and maintenance. We may experience difficulties in maintaining the operation of our pipelines, which may cause downtime and delays. We also may be required to periodically shut down all or part of our pipelines for regulatory compliance and inspection purposes. Any interruption in our services due to pipeline breakdowns or necessary maintenance, inspection or regulatory compliance could reduce revenues and earnings and result in remediation costs. While we have business interruption insurance coverage for our pipeline which would help mitigate lost revenues and remediation costs should a rupture, spill or other shut-down occur, there can be no assurances as to how much lost revenue or remediation costs our business interruption insurance would cover, if any. Transportation interruptions at our pipelines, even if only temporary, could severely harm our business and reputation, and could have a material adverse effect on our financial condition, results of operations and cash flows.
Our operations are subject to risks inherent in the oil and natural gas industry, some of which are beyond our control. These risks may not be fully covered under our insurance policies.
Our operations are subject to operational hazards, including accidents or equipment failures that can cause pollution and other damage to the environment. Pursuant to applicable law, we may be required to remediate the environmental impact of any such accidents or incidents, which may include costs related to site investigation and soil, groundwater and surface water cleanup. In addition, hazards inherent in the oil and natural gas industry, such as, but not limited to, accidents, blowouts, explosions, pollution and other damage to the environment, fires and hydrocarbon spills, may delay or halt operations at extraction sites which we service. These conditions can cause:
• | personal injury or loss of life; |
• | liabilities from pipeline breaks and accidents by our fleet of trucks and other equipment; |
• | damage to or destruction of property, equipment and the environment; and |
• | the suspension of operations. |
The occurrence of a significant event or a series of events that together are significant, or adverse claims in excess of the insurance coverage that we maintain or that are not covered by insurance, could have a material adverse effect on our financial condition, results of operations and cash flows. Litigation arising from a catastrophic occurrence at a location where our equipment and services are being used may result in our being named as a defendant in lawsuits asserting large claims.
We maintain insurance coverage that we believe to be customary in the industry against these hazards. We may not be able to maintain adequate insurance in the future at rates we consider reasonable. In addition, insurance may not be available to cover any or all of the risks to which we are subject, or, even if available, the coverage provided by such insurance may be inadequate, or insurance premiums or other costs could make such insurance prohibitively expensive. It is also possible that, when we renew our insurance coverages, our premiums and deductibles will be higher, and certain insurance coverage either will be unavailable or considerably more expensive, than it has been in the past. In addition, our insurance is subject to coverage limits, and some policies exclude coverage for damages resulting from environmental contamination.
Improvements in or new discoveries of alternative energy technologies or our customers’ operating methodologies could have a material adverse effect on our financial condition and results of operations.
Because our business depends on the level of activity in the oil and natural gas industry, any improvement in or new discoveries of alternative energy technologies (such as wind, solar, geothermal, fuel cells and biofuels) that increase the use of alternative forms of energy and reduce the demand for oil and natural gas could have a material adverse effect on our financial condition, results of operations and cash flows. In addition, technological changes in our customers’ operating methods could decrease the need for management of water and other wellsite environmental services or otherwise affect demand for our services.
Seasonal weather conditions and natural disasters could severely disrupt normal operations and harm our business.
Areas in which we operate are adversely affected by seasonal weather conditions, primarily in the winter and spring. During periods of heavy snow, ice or rain, our customers may curtail their operations or we may be unable to move our trucks between
19
locations or provide other services, thereby reducing demand for, or our ability to provide services and generate revenues. For example, many municipalities impose weight restrictions on the roads that lead to our customers’ job sites in the spring due to the muddy conditions caused by spring thaws, limiting our access and our ability to provide service in these areas. In addition, the regions in which we operate have in the past been, and may in the future be, affected by natural disasters such as hurricanes, windstorms, floods and tornadoes. In certain areas, our business may be dependent on our customers’ ability to access sufficient water supplies to support their hydraulic fracturing operations. To the extent severe drought conditions or other factors prevent our customers from accessing adequate water supplies, our business could be negatively impacted. Future natural disasters or inclement weather conditions could severely disrupt the normal operation of our business, or our customers’ business, and have a material adverse effect on our financial condition, results of operations and cash flows.
Our financial and operating performance may be affected by the inability to renew landfill operating permits, obtain new landfills and expand existing ones.
We currently own one landfill and our ability to meet our financial and operating objectives may depend, in part, on our ability to acquire, lease, or renew landfill operating permits, expand existing landfills and develop new landfill sites. It has become increasingly difficult and expensive to obtain required permits and approvals to build, operate and expand solid waste management facilities, including landfills. Operating permits for landfills in states where we operate must generally be renewed every five to ten years, although some permits are required to be renewed more frequently. These operating permits often must be renewed several times during the permitted life of a landfill. The permit and approval process is often time consuming, requires numerous hearings and compliance with zoning, environmental and other requirements, is frequently challenged by special interest and other groups, and may result in the denial of a permit or renewal, the award of a permit or renewal for a shorter duration than we believed was otherwise required by law, or burdensome terms and conditions being imposed on our operations. We may not be able to obtain new landfill sites or expand the permitted capacity of our landfills when necessary. In addition, we may be unable to make the contingent consideration payment required upon the issuance of a second special waste disposal permit to expand the current landfill. Any of these circumstances could have a material adverse effect on our financial condition, results of operations and cash flows.
Our ability to use net operating loss and tax credit carryforwards and certain built-in losses to reduce future tax payments may be limited.
Our ability to utilize our net operating loss carryforwards to offset future taxable income and to reduce federal and state income tax liabilities is subject to certain requirements, limitations and restrictions, including Internal Revenue Code Section 382 which under certain circumstances may substantially limit our ability to offset future tax liabilities with federal net operating loss carryforwards.
Future changes in ownership could eliminate or limit our use of net operating loss carryforwards.
Pursuant to United States Internal Revenue Code Section 382, if we undergo an ownership change, the net operating loss carryforward limitations would impose an annual limit on the amount of the taxable income that may be offset by our net operating losses generated prior to the ownership change. We have determined that an ownership change occurred on April 15, 2016 as a result of the debt restructuring that occurred during fiscal 2016. In addition, another ownership change occurred on August 7, 2017 as a result of the chapter 11 reorganization described further in Note 4. The limitation under Section 382 may result in federal net operating loss carryforwards expiring unused. Subject to the impact of those rules as a result of past or future restructuring transactions, we may be unable to use all or a significant portion of our net operating loss carryforwards to offset future taxable income.
We are self-insured against many potential liabilities, and our reserves may not be sufficient to cover future claims.
We maintain high deductible or self-insured retention insurance policies for certain exposures including automobile, workers’ compensation and certain employee group health insurance plans. We carry policies for certain types of claims to provide excess coverage beyond the underlying policies and per incident deductibles or self-insured retentions. Because many claims against us do not exceed the deductibles under our insurance policies, we are effectively self-insured for a substantial portion of our claims. Our insurance accruals are based on claims filed and estimates of claims incurred but not reported. The insurance accruals are influenced by our past claims experience factors, which have a limited history, and by published industry development factors. The estimates inherent in these accruals are determined using actuarial methods that are widely used and accepted in the insurance industry. If our insurance claims increase or if costs exceed our estimates of insurance liabilities, we could experience a decline in profitability and liquidity, which would adversely affect our business, financial condition or results of operations. In addition, should there be a loss or adverse judgment or other decision in an area for which we are self-insured, then our business, financial condition, results of operations and liquidity may be adversely affected.
20
We evaluate our insurance accruals, and the underlying assumptions, regularly throughout the year and make adjustments as needed. While we believe that the recorded amounts are reasonable, there can be no assurance that changes to our estimates will not occur due to limitations inherent in the estimation process. Changes in our assumptions and estimates could have a material adverse effect on our financial condition, results of operations and cash flows.
Security breaches and other disruptions could compromise our information and expose us to liability, which would cause our business and reputation to suffer.
In the ordinary course of business, we collect and store sensitive data, including intellectual property, our proprietary business information and that of our customers, suppliers and business partners, and personally identifiable information of our customers and employees, in our data centers and on our networks. The secure processing, storage, maintenance and transmission of this information is critical to our operations and business strategy. Despite our security measures, our information technology and infrastructure may be vulnerable to attacks by hackers or breached due to employee error, malfeasance or other disruptions. Any such breach could compromise our networks and the information stored there could be accessed, publicly disclosed, lost or stolen. Any such access, disclosure or other loss of information could result in legal claims or proceedings, liability under laws that protect the privacy of personal information, and regulatory penalties, disrupt our operations and the services we provide to customers, and damage our reputation, and cause a loss of confidence in our products and services, which could adversely affect our business, operating margins, revenues and competitive position. These effects could have a material adverse effect on our financial condition, results of operations and cash flows.
A failure in our operational systems, or those of third parties, may adversely affect our business.
Our business is dependent upon our operational and technological systems to process a large amount of data. If any of our financial, operational, or other data processing systems fail or have other significant shortcomings, our financial results could be adversely affected. Our financial results could also be adversely affected if an employee causes our operational systems to fail, either as a result of inadvertent error or by deliberately tampering with or manipulating our operational systems. In addition, dependence upon automated systems may further increase the risk that operational system flaws, employee tampering or manipulation of those systems could result in losses that are difficult to detect. We are heavily reliant on technology for communications, financial reporting, treasury management and many other important aspects of our business. Any failure in our operational systems could have a material adverse impact on our business. Third-party systems on which we rely could also suffer operational failures. Any of these occurrences could disrupt our business, including the ability to close our financial ledgers and report the results of our operations publicly on a timely basis or otherwise have a material adverse effect on our financial condition, results of operations and cash flows.
Risk Factors Related To Our Common Stock
We cannot assure you that an active trading market for our common stock will develop or be maintained, and the market price of our common stock may be volatile, which could cause the value of your investment to decline.
The common stock of the reorganized Company was listed on the NYSE American Stock Exchange (the “NYSE American”) on October 12, 2017. We cannot assure you that an active public market for our common stock will develop or, if it develops, be sustained. We currently have a limited trading volume of our common stock. In the absence of an active public trading market, it may be difficult to liquidate your investment in our common stock. The trading price of our common stock on the NYSE American may fluctuate significantly. Numerous factors, including many over which we have no control, may have a significant impact on the market price of our common stock. These risks include, among other things:
• | our operating and financial performance and prospects; |
• | our ability to repay our debt; |
• | investor perceptions of us and the industry and markets in which we operate; |
• | future sales, or the availability for sale, of equity or equity-related securities; |
• | changes in earnings estimates or buy/sell recommendations by analysts; |
• | limited trading volume of our common stock; and |
• | general financial, domestic, economic and other market conditions. |
21
The trading price of our common stock may not reflect accurately the value of our business.
As a result of our completed restructuring, ownership of our common stock is highly concentrated, and there are a limited number of shares available for trading on the NYSE American or any other public market. As a result, reported trading prices for our common stock at any given time may not reflect accurately the underlying economic value of our business at that time. Reported trading prices could be higher or lower than the price a shareholder would be able to receive in a sale transaction, and there can be no assurance that there will be sufficient public trading in our common stock to create a liquid trading market that accurately reflects the underlying economic value of our business.
The resale of shares of our common stock, including shares issuable upon exercise of our warrants, may adversely affect the market price of our common stock.
At the time of our emergence from bankruptcy, we granted registration rights to certain stockholders. The shares of our outstanding common stock held by these stockholders will be registered for resale under a registration statement pursuant to the Securities Act. The shares held by these stockholders constitute approximately 90% of our outstanding common stock as of February 28, 2018, all of which may be sold in the public markets pursuant to an effective registration statement.
Furthermore, as of February 28, 2018, there were 118,137 warrants outstanding, which were issued to the holders of our pre-Effective Date 2018 Notes and holders of certain claims relating to the rejection of executory contracts and unexpired leases. The exercise price of the warrants is $39.89. To the extent such warrants are exercised, additional shares of our common stock will be issued, which will result in dilution to the holders of our common stock and increase the number of shares eligible for resale in the public market.
The sale of a significant number of shares of our common stock, including shares issuable upon exercise of our warrants, or substantial trading in our common stock or the perception in the market that substantial trading in our common stock will occur, may adversely affect the market price of our common stock.
Our stock price may be volatile, which could result in substantial losses for investors in our securities.
The stock markets have experienced extreme volatility that has often been unrelated to the operating performance of particular companies. These broad market fluctuations may adversely affect the trading price of our common stock. The market price of our common stock may also fluctuate significantly in response to the following factors, some of which are beyond our control:
• | variations in our quarterly operating results and changes in our liquidity position; |
• | changes in securities analysts’ estimates of our financial performance; |
• | inaccurate or negative comments about us on social networking websites or other media channels; |
• | changes in market valuations of similar companies; |
• | announcements by us or our competitors of significant contracts, acquisitions, strategic partnerships, joint ventures, capital commitments, new products or product enhancements, as well as our or our competitors’ success or failure in successfully executing such matters; |
• | announcements by us of strategic plans to restructure our indebtedness or of a bankruptcy filing; |
• | changes in the price of oil and natural gas; |
• | loss of a major customer or failure to complete significant transactions; and |
• | additions or departures of key personnel. |
If securities analysts do not publish research or reports about our business or if they downgrade our stock, the price of our stock could decline.
The trading market for our shares of common stock could rely in part on the research and reporting that industry or financial analysts publish about us or our business. We do not control these analysts. Furthermore, if one or more of the analysts who do
22
cover us downgrades our stock, the price of our stock could decline. If one or more of these analysts ceases coverage of our company, we could lose visibility in the market, which in turn could cause our stock price to decline.
Future sales by us or our existing shareholders could depress the market price of our common stock.
If we or our existing shareholders sell a large number of shares of our common stock, the market price of our common stock could decline significantly. Further, even the perception in the public market that we or our existing shareholders might sell shares of common stock could depress the market price of the common stock.
We may issue a substantial number of shares of our common stock in the future and shareholders may be adversely affected by the issuance of those shares.
We may raise additional capital by issuing shares of common stock, or other securities convertible into common stock, which will increase the number of shares of common stock outstanding and may result in substantial dilution in the equity interest of our current shareholders and may adversely affect the market price of our common stock. The issuance, and the resale or potential resale, of shares of our common stock could adversely affect the market price of our common stock and could be dilutive to our shareholders.
We currently do not intend to pay any dividends on our common stock.
We currently do not intend to pay any dividends on our common stock, and restrictions and covenants in our debt agreements may prohibit us from paying dividends now or in the future. While we may declare dividends at some point in the future, subject to compliance with such restrictions and covenants, we cannot assure you that you will ever receive cash dividends as a result of ownership of our common stock and any gains from investment in our common stock may only come from increases in the market price of our common stock, if any.
Certain of our charter and bylaw provisions and Delaware law, as well as the substantial ownership of our common stock by a small number of shareholders, could subject us to anti-takeover effects or could have a material negative impact on our business.
Provisions of our certificate of incorporation and bylaws, each as amended and restated, and Delaware law may discourage, delay or prevent a merger or acquisition that shareholders may consider favorable, including transactions in which you might otherwise receive a premium for your shares. In addition, these provisions may frustrate or prevent any attempts by our shareholders to replace or remove our management and board of directors. These provisions include:
• | authorizing the issuance of “blank check” preferred stock without any need for action by shareholders; |
• | establishing a classified board of directors, so that only approximately one-third of our directors are elected each year; |
• | providing our board of directors with the ability to set the number of directors and to fill vacancies on the board of directors occurring between shareholder meetings; |
• | providing that directors may only be removed for “cause” and only by the affirmative vote of the holders of at least a majority in voting power of our issued and outstanding capital stock; and |
• | limiting the ability of our shareholders to call special meetings. |
We are also subject to provisions of the Delaware corporation law that, in general, prohibit any business combination with a beneficial owner of 15% or more of our common stock for three years following the date the beneficial owner acquired at least 15% of our stock, unless various conditions are met, such as approval of the transaction by our board of directors. Together, these charter and statutory provisions could make the removal of management more difficult and may discourage transactions that otherwise could involve payment of a premium over prevailing market prices for our common stock.
The existence of the foregoing provisions and anti-takeover measures, as well as the significant percentage of common stock beneficially owned by our Significant Shareholders, could limit the price that investors might be willing to pay in the future for shares of our common stock. They could also deter potential acquirers of our Company, thereby reducing the likelihood that you could receive a premium for your common stock in an acquisition.
23
Risks Related to Environmental and Other Governmental Regulation
We are subject to United States federal, state and local laws and regulations relating to health, safety, transportation, and protection of natural resources and the environment. Under these laws and regulations, we may become liable for significant penalties, damages or costs of remediation. Any changes in laws and regulations could increase our costs of doing business.
Our operations, and those of our customers, are subject to United States federal, state and local laws and regulations relating to health, safety, transportation and protection of natural resources and the environment and worker safety, including those relating to waste management and transportation and disposal of produced water and other materials. For example, we are subject to environmental regulation relating to disposal into injection wells, which can pose some risks of environmental liability, including leakage from the wells to surface or subsurface soils, surface water or groundwater. Liability under these laws and regulations could result in cancellation of well operations, fines and penalties, expenditures for remediation, and liability for property damage and personal injuries. In addition, federal, state and local laws and regulations may be passed which would have the effect of increasing costs to our customers and possibly decreasing demand for our services. For example, if new laws and regulations are passed requiring increased safety measures for rail transport of crude oil, such laws and regulations may make it more difficult and expensive for customers to transport their product, which could decrease our customers’ demand for our services and negatively affect our results of operations and financial condition. Similarly, many of our customers have intrastate pipeline operations that are subject to regulation by various agencies of the states in which they are located. If new laws and/or regulations that further regulate intrastate pipelines are adopted in response to equipment failures, spills, negative environmental effects, or public sentiment, our customers may face increased costs of compliance, and thus reduce demand for our services.
Our business involves the use, handling, storage, and contracting for recycling or disposal of environmentally sensitive materials. Accordingly, we are subject to regulation by federal, state, and local authorities establishing investigation and health and environmental quality standards, and liability related thereto, and providing penalties for violations of those standards. We also are subject to laws, ordinances, and regulations governing investigation and remediation of contamination at facilities we operate or to which we send hazardous or toxic substances or wastes for treatment, recycling, or disposal. In particular, CERCLA imposes joint, strict, and several liability on owners or operators of facilities at, from, or to which a release of hazardous substances has occurred; parties that generated hazardous substances that were released at such facilities; and parties that transported or arranged for the transportation of hazardous substances to such facilities. A majority of states have adopted statutes comparable to and, in some cases, more stringent than CERCLA. If we were to be found to be a responsible party under CERCLA or a similar state statute, we could be held liable for all investigative and remedial costs associated with addressing such contamination. In addition, claims alleging personal injury or property damage may be brought against us as a result of alleged exposure to hazardous substances resulting from our operations.
Failure to comply with these laws and regulations could result in the assessment of significant administrative, civil or criminal penalties, imposition of cleanup and site restoration costs and liens, revocation of permits, and orders to limit or cease certain operations. In addition, certain environmental laws impose strict and/or joint and several liability, which could cause us to become liable for the conduct of others or for consequences of our own actions that were in compliance with all applicable laws at the time of those actions. For example, if a landfill or disposal operator mismanages our wastes in a way that creates an environmental hazard, we and all others who sent materials could become liable for cleanup costs, fines and other expenses many years after the disposal or recycling was completed. Future events, such as the discovery of currently unknown matters, spills caused by future pipeline ruptures, changes in existing environmental laws and regulations or their interpretation, and more vigorous enforcement policies by regulatory agencies, may give rise to additional expenditures or liabilities, which could impair our operations and could have a material adverse effect on our financial condition, results of operations and cash flows.
Although we believe that we are in substantial compliance with all applicable laws and regulations, legal requirements are changing frequently and are subject to interpretation. New laws, regulations and changing interpretations by regulatory authorities, together with uncertainty regarding adequate testing and sampling procedures, new pollution control technology and cost benefit analysis based on market conditions are all factors that may increase our future capital expenditures to comply with environmental requirements. Accordingly, we are unable to predict the ultimate cost of future compliance with these requirements or their effect on our operations.
Increased regulation of hydraulic fracturing, including regulation of the quantities, sources and methods of water use and disposal, could result in reduction in drilling and completing new oil and natural gas wells or minimize water use or disposal, which could adversely impact the demand for our services.
Demand for our services depends, in large part, on the level of exploration and production of oil and natural gas and the oil and natural gas industry’s willingness to purchase our services. Most of our customer base uses hydraulic fracturing to drill new oil
24
and natural gas wells. Hydraulic fracturing is a process that is used to release hydrocarbons, particularly natural gas, from certain geological formations. The process involves the injection of water (typically mixed with significant quantities of sand and small quantities of chemical additives) under pressure into the formation to fracture the surrounding rock and stimulate movement of hydrocarbons through the formation. The process is typically regulated by state oil and natural gas commissions and has been exempt (except when the fracturing fluids or propping agents contain diesel fuels) since 2005 from United States federal regulation pursuant to the SDWA.
The EPA is conducting a comprehensive study of the potential environmental impacts of hydraulic fracturing activities, and a committee of the United States House of Representatives is also conducting an investigation of hydraulic fracturing practices. The results of the EPA study and House investigation could lead to restrictions on hydraulic fracturing. On February 11, 2014, the EPA released a revised underground injection control (UIC) program permitting guidance for wells that use diesel fuels during hydraulic fracturing activities. The EPA developed the guidance to clarify how companies can comply with a law passed by Congress in 2005, which exempted hydraulic fracturing operations from the requirement to obtain a UIC permit, except in cases where diesel fuel is used as a fracturing fluid. On July 16, 2015, the EPA’s Inspector General (IG) issued a report entitled “Enhanced EPA Oversight and Action Can Further Protect Water Resources From the Potential Impacts of Hydraulic Fracturing” stating that the EPA should enhance its oversight of permit issuance for hydraulic fracturing by state and develop a plan for responding to concerns about chemicals used in hydraulic fracturing. On May 19, 2014, the EPA issued an Advance Notice of Proposed Rulemaking announcing its intention to develop a rule under the Toxic Substances Control Act (“TSCA”) to require disclosure of chemicals used in hydraulic fracturing, and the EPA’s current regulatory agenda estimates that the proposed TSCA rule will be issued in June 2018. On October 15, 2012, the new EPA regulations under the Clean Air Act went into effect that require reductions in certain criteria and hazardous air pollutant emissions from hydraulic fracturing wells.
On June 13, 2016, the EPA finalized regulations under the Clean Water Act to prohibit wastewater discharges from hydraulic fracturing and other natural gas production to municipal sewage plants (called publicly owned treatment works (POTWs)), with an effective date of August 29, 2016. In December 2016, the EPA announced that it was extending the compliance date of this new rule to August 29, 2019 for those onshore unconventional oil and gas extraction facilities that had been lawfully discharging extraction wastewater to POTWs prior to August 29, 2019, while keeping the August 29, 2016 effective date for all other facilities. In December 2016, the EPA issued a final report entitled “Hydraulic Fracturing for Oil and Gas: Impacts from the Hydraulic Fracturing Water Cycle on Drinking Water Resources in the United States” that concluded that hydraulic fracturing can impact drinking water resources under some circumstances, but stated that the national frequency of impacts on drinking water could not be estimated due to significant data gaps and uncertainties in the available data. In March 2015, the Department of the Interior (“DOI”) issued regulations requiring that hydraulic fracturing wells constructed on federal lands comply with certain standards and requiring companies engaged in hydraulic fracturing on federal lands to disclose certain chemicals used in the hydraulic fracturing process. The regulations were enjoined by a federal district court in June 2016, and the DOI is currently appealing the ruling to the U.S. Court of Appeals. Legislation has been introduced before Congress to provide for federal regulation of hydraulic fracturing, including, for example, requiring disclosure of chemicals used in the fracturing process or seeking to repeal the exemption from the SWDA. If adopted, such legislation would add an additional level of regulation and necessary permitting at the federal level and could make it more difficult to complete wells using hydraulic fracturing. Similar laws and regulations with respect to chemical disclosure also exist or are being considered in several states, including certain states in which we operate, that could restrict hydraulic fracturing. The Delaware River Basin Commission is also considering regulations which may impact “hydrofracturing” water practices in certain areas of Pennsylvania, New York, New Jersey and Delaware. Some local governments have also sought to restrict drilling in certain areas.
Additionally, in response to concerns about seismic activity being triggered by the injection of produced waters into underground wells, certain regulators have adopted or are considering additional requirements related to seismic safety for hydraulic fracturing activities. For example, in January 2012, the Ohio Department of Natural Resources issued a temporary moratorium on the development of hydraulic fracturing disposal wells in northeast Ohio due to minor earthquakes reported in the area. In Texas, the Texas Railroad Commission (the “RRC”) amended its existing oil and natural gas disposal well regulations to require applicants for new disposal wells to conduct seismic activity searches utilizing the U.S. Geological Survey to assess whether the RRC should impose limits on existing wells, including a temporary injection ban. Finally, the state of Arkansas imposed a moratorium on waste water injection in certain areas due to concerns that hydraulic fracturing may be related to increased earthquake activity. Such laws and regulations could delay or curtail production of oil and natural gas by our customers, and thus reduce demand for our services.
Future United States federal, state or local laws or regulations could significantly restrict, or increase costs associated with hydraulic fracturing and make it more difficult or costly for producers to conduct hydraulic fracturing operations, which could result in a decline in exploration and production. New laws and regulations, and new enforcement policies by regulatory agencies, could also expressly restrict the quantities, sources and methods of water use and disposal in hydraulic fracturing and
25
otherwise increase our costs and our customers’ cost of compliance, which could minimize water use and disposal needs even if other limits on drilling and completing new wells were not imposed. Any decline in exploration and production or any restrictions on water use and disposal could result in a decline in demand for our services and have a material adverse effect on our business, financial condition, results of operations and cash flows.
Delays or restrictions in obtaining permits by our customers for their operations or by us for our operations could impair our business.
In most states, our customers are required to obtain permits from one or more governmental agencies in order to perform drilling and completion activities and we may be required to procure permits for construction and operation of our disposal wells and pipelines. Such permits are typically required by state agencies, but can also be required by federal and local governmental agencies. The requirements for such permits vary depending on the location where our, or our customers’, activities will be conducted. As with all governmental permitting processes, there is a degree of uncertainty as to whether a permit will be granted, the time it will take for a permit to be issued, and the conditions which may be imposed in connection with the granting of the permit. Delays or restrictions in obtaining saltwater disposal well permits could adversely impact our growth, which is dependent in part on new disposal capacity.
Our customers have been affected by moratoriums that have been imposed on the issuance of permits for drilling and completion activities in certain jurisdictions. For example, in December 2010, the State of New York imposed a moratorium on certain drilling and completion activities. In 2011, the state announced plans to lift the moratorium, however, in December 2014 the state announced that it intended to take action to prohibit certain drilling and completion activities, including hydraulic fracturing, in the state. A similar moratorium has been in place within the Delaware River Basin pending issuance of regulations by the Delaware River Basin Commission. Other states, including Texas, Arkansas, Pennsylvania, Wyoming and Colorado, have enacted laws and regulations applicable to our business activities, including disclosure of information regarding the substances used in hydraulic fracturing. California is presently considering similar requirements. The EPA published a rule on January 9, 2014 requiring oil and natural gas companies using hydraulic fracturing off the coast of California to disclose the chemicals they discharge into the ocean. Some of the drilling and completion activities of our customers may take place on federal land, requiring leases from the federal government to conduct such drilling and completion activities. In some cases, federal agencies have canceled oil and natural gas leases on federal lands. Consequently, our operations in certain areas of the country may be interrupted or suspended for varying lengths of time, causing a loss of revenue and potentially having a materially adverse effect on our financial condition, results of operations and cash flows.
We are subject to the trucking safety regulations, which are likely to be amended, and made stricter, as part of the initiative known as Compliance, Safety, Accountability, or “CSA.” If our current USDOT safety rating of “Satisfactory” is downgraded in connection with this initiative, our business and results of our operations may be adversely affected.
As part of the CSA initiative, the FMCSA is continuously revising its safety rating methodology and implementation of the same. These revisions will likely link safety ratings more closely to roadside inspection and driver violation data gathered and analyzed from month to month under the FMCSA’s new Safety Measurement System, or “SMS” and may place increased scrutiny on carriers transporting significant quantities of hazardous material. This linkage could result in greater variability in safety ratings than the current system. Preliminary studies by transportation consulting firms indicate that “Satisfactory” ratings (or any equivalent under a new SMS-based system) may become more difficult to achieve and maintain under such a system. If our operations lose their current “Satisfactory” rating, which is the highest and best rating under this initiative, we may lose some of our customer contracts that require such a rating, adversely affecting our financial condition, results of operations and cash flows.
Item 1B. Unresolved Staff Comments
None.
Item 2. Properties
We lease our corporate headquarters in Scottsdale, Arizona and we own or lease numerous facilities including administrative offices, sales offices, truck yards, maintenance and warehouse facilities, a landfill facility, and a water treatment facility in 10 other states. We also own or lease 48 saltwater disposal wells in Louisiana, Montana, North Dakota, Ohio and Texas as of December 31, 2017. We believe that we have satisfactory title to the properties owned and used in our businesses, subject to liens for taxes not yet payable, liens incident to minor encumbrances, liens for credit arrangements (including liens under our credit facility) and easements and restrictions that do not materially detract from the value of these properties, our interests in these properties, or the use of these properties in our businesses.
26
We believe all properties that we currently occupy are suitable for their intended uses. We believe that we have sufficient facilities to conduct our operations. However, we continue to evaluate the purchase or lease of additional properties or the consolidation of our properties, as our business requires.
Item 3. Legal Proceedings
We are party to legal proceedings and potential claims arising in the ordinary course of our business, including, but not limited to, claims related to employment matters, contractual disputes, personal injuries and property damage. In addition, various legal actions, claims and governmental inquiries and proceedings are pending or may be instituted or asserted in the future against us and our subsidiaries. See “Legal Matters” section in Note 19 of the Notes to the Consolidated Financial Statements herein for a description of our legal proceedings.
Item 4. Mine Safety Disclosures
None.
27
PART II
Item 5. Market for Registrant’s Common Equity, Related Stockholder Matters and Issuer Purchases of Equity Securities
Market Information
Our common stock is listed on the NYSE American under the symbol “NES” and has been trading on the NYSE American since October 12, 2017. Prior to the commencement of our voluntarily chapter 11 proceedings, our pre-Effective Date common stock was trading on the OTCQB U.S. Market (the “OTCQB”) beginning on January 20, 2016. Prior to listing on the OTCQB, our pre-Effective Date common stock was trading on the New York Stock Exchange (the “NYSE”).
As an issuer may not be listed on the OTCQB if it is subject to bankruptcy or reorganization proceedings, upon filing the Plan with the Bankruptcy Court, our pre-Effective Date common stock was removed from the OTCQB and began trading on the OTC Pink Open Market (the “OTC Pink”) beginning on May 2, 2017. As a result of the cancellation of the pre-Effective Date common stock pursuant to the Plan, the Company ceased trading on the OTC Pink on the Effective Date. From the Effective Date until our listing on the NYSE American on October 12, 2017, there was no active public trading market for our common stock.
The table below presents the intra-day high and low price per share of our common stock, as reported by the NYSE, OTCQB, OTC Pink, or the NYSE American, as applicable, for each of the quarters in the years ended December 31, 2016 and 2017, respectively:
For the Year Ending December 31, 2016 | High | Low | ||||||
First Quarter - Predecessor | $ | 0.55 | $ | 0.13 | ||||
Second Quarter - Predecessor | $ | 0.45 | $ | 0.22 | ||||
Third Quarter - Predecessor | $ | 0.30 | $ | 0.17 | ||||
Fourth Quarter - Predecessor | $ | 0.27 | $ | 0.14 | ||||
For the Year Ending December 31, 2017 | High | Low | ||||||
First Quarter - Predecessor | $ | 0.55 | $ | 0.12 | ||||
Second Quarter - Predecessor | $ | 0.27 | $ | 0.01 | ||||
Third Quarter - Predecessor (a) | $ | 0.02 | $ | 0.01 | ||||
Fourth Quarter - Successor (b) | $ | 26.25 | $ | 9.25 | ||||
(a) The Predecessor common stock stopped trading on August 7, 2017, and the Successor common stock did not begin trading until October 12, 2017. As such, the third quarter high and low prices represent the time the Predecessor common stock was trading prior to being canceled on August 7, 2017.
(b) Represents the trading of the Successor common stock upon listing on October 12, 2017 through December 31, 2017.
Holders
As of February 28, 2018, there was one holder of record of our common stock. The one holder of record is CEDE & CO., a nominee of The Depository Trust Company, which held all 11,695,580 shares of our issued and outstanding common stock. This number of record holders does not include beneficial holders whose shares are held in “street name,” meaning that the shares are held for their accounts by brokers or other nominees. In these instances, the brokers or other nominees are included in the number of record holders, but the underlying beneficial holders of the common stock held in “street name” are not.
Dividends
We have not paid any dividends on our common stock to date, and we currently do not intend to pay dividends in the future. The payment of dividends in the future will be contingent upon our revenues and earnings, if any, capital requirements and general financial condition. The payment of any dividends will be within the discretion of our board of directors and will be subject to other limitations as may be contained in our agreements governing our indebtedness. It is the present intention of our board of directors to retain all earnings, if any, for use in our business operations and, accordingly, our board does not anticipate declaring any dividends in the foreseeable future.
28
Unregistered Sales of Equity Securities
There were no unregistered sales of our equity securities during the fiscal year ended December 31, 2017, except as disclosed in our Current Report on Form 8-K filed with the SEC on August 11, 2017.
Repurchases of Equity Securities
During the three months ended December 31, 2017, there were no repurchases of our common stock.
Recent Performance
The following performance graph and related information shall not be deemed “filed” with the SEC, nor shall such information be incorporated by reference into any future filing under the Securities Act or Exchange Act, except to the extent that we specifically incorporate it by reference into such filing.
Stock Performance Graph
The following performance graph compares the performance of our common stock to the Russell 2000 Index, our previous peer group as determined by management, and a new peer group established by management after emergence from chapter 11. The previous peer group consisted of the following companies: Key Energy Services, Inc., Basic Energy Services, Inc., Superior Energy Services, Inc., and Pioneer Energy Services Corp. The new peer group, which was established by management after emergence from chapter 11 and selected based upon an industry and/or line-of-business basis, consists of the following companies: Select Energy Services, Key Energy Services, Inc., Basic Energy Services, Inc., C&J Energy Services, Inc., Superior Energy Services, Inc., Clean Harbors, Inc., and Tetra Technologies, Inc. We feel that the Russell 2000 Index and the new peer group provides a more meaningful comparison to our common stock's performance now that we have completed our restructuring and we intend to compare our performance to these two indices going forward.
The graph below compares the cumulative total return to holders of our common stock following our listing with the NYSE American with the cumulative total returns of the listed Russell 2000 Index, our previous peer group and our new peer group. The graph assumes that the value of the investment in each index (including reinvestment of dividends) was $100 at October 12, 2017 and tracks the return on the investment through February 15, 2018.
29
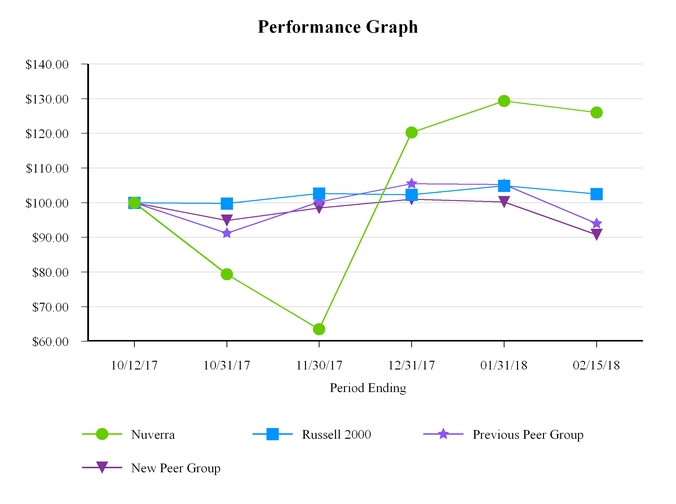
Company / Index | October 12, 2017 | October 31, 2017 | November 30, 2017 | December 31, 2017 | January 31, 2018 | February 15, 2018 | ||||||||||||||||||
Nuverra | $ | 100.00 | $ | 79.37 | $ | 63.49 | $ | 120.24 | $ | 129.30 | $ | 125.99 | ||||||||||||
Russell 2000 Index | 100.00 | 99.75 | 102.68 | 102.27 | 104.89 | 102.50 | ||||||||||||||||||
Previous Peer Group | 100.00 | 91.18 | 100.16 | 105.49 | 105.21 | 93.98 | ||||||||||||||||||
New Peer Group | 100.00 | 94.87 | 98.45 | 101.01 | 100.18 | 90.75 | ||||||||||||||||||
30
Item 6. Selected Financial Data
The following table presents selected consolidated financial information and other operational data for our business. You should read the following information in conjunction with Item 7 of this Annual Report on Form 10-K entitled “Management’s Discussion and Analysis of Financial Condition and Results of Operations,” and the consolidated financial statements and related notes included elsewhere in this Annual Report on Form 10-K.
Statement of Operations Data
Successor | Predecessor | ||||||||||||||||||||||||
Five Months Ended | Seven Months Ended | Years Ended | |||||||||||||||||||||||
December 31, | July 31, | December 31, | |||||||||||||||||||||||
2017 | 2017 | 2016 | 2015 | 2014 | 2013 | ||||||||||||||||||||
($ in thousands except per share data) | |||||||||||||||||||||||||
Total revenue | $ | 80,188 | $ | 95,883 | $ | 152,176 | $ | 356,699 | $ | 536,282 | $ | 525,816 | |||||||||||||
Loss from operations (2)(3)(4)(5) | (40,959 | ) | (36,660 | ) | (117,388 | ) | (144,839 | ) | (417,654 | ) | (149,659 | ) | |||||||||||||
(Loss) income from continuing operations (1)(2)(3)(4)(5) | (47,895 | ) | 168,289 | (167,621 | ) | (195,167 | ) | (457,178 | ) | (134,040 | ) | ||||||||||||||
(Loss) income from discontinued operations, net of income taxes (4)(5) | — | — | (1,235 | ) | (287 | ) | (58,426 | ) | (98,251 | ) | |||||||||||||||
Net (loss) income | (47,895 | ) | 168,611 | (168,856 | ) | (195,454 | ) | (515,604 | ) | (232,291 | ) | ||||||||||||||
Weighted average shares outstanding: | |||||||||||||||||||||||||
Basic | 11,696 | 150,940 | 90,979 | 27,681 | 26,090 | 24,492 | |||||||||||||||||||
Diluted | 11,696 | 174,304 | 90,979 | 27,681 | 26,090 | 24,492 | |||||||||||||||||||
Earnings per common share: | |||||||||||||||||||||||||
Basic (loss) income from continuing operations | $ | (4.09 | ) | $ | 1.12 | $ | (1.84 | ) | $ | (7.05 | ) | $ | (17.52 | ) | $ | (5.47 | ) | ||||||||
Basic loss from discontinued operations | — | — | (0.01 | ) | (0.01 | ) | (2.24 | ) | (4.01 | ) | |||||||||||||||
Net (loss) income per basic common share | $ | (4.09 | ) | $ | 1.12 | $ | (1.85 | ) | $ | (7.06 | ) | $ | (19.76 | ) | $ | (9.48 | ) | ||||||||
Diluted (loss) income from continuing operations | $ | (4.09 | ) | $ | 0.97 | $ | (1.84 | ) | $ | (7.05 | ) | $ | (17.52 | ) | $ | (5.47 | ) | ||||||||
Diluted loss from discontinued operations | — | — | (0.01 | ) | (0.01 | ) | (2.24 | ) | (4.01 | ) | |||||||||||||||
Net (loss) income per diluted common share | $ | (4.09 | ) | $ | 0.97 | $ | (1.85 | ) | $ | (7.06 | ) | $ | (19.76 | ) | $ | (9.48 | ) | ||||||||
(1) | Income from continuing operations for the seven months ended July 31, 2017 included $223.5 million of “Reorganization items, net,” which included the $194.8 million net gain on debt discharge as a result the chapter 11 filing and fresh start accounting. See Note 5 in the Notes to the Consolidated Financial Statements herein for further information. |
(2) | Loss from operations and loss from continuing operations for the year ended December 31, 2016 included long-lived asset impairment charges of $42.2 million. |
(3) | Loss from operations and loss from continuing operations for the year ended December 31, 2015 included a goodwill impairment charge of $104.7 million. |
(4) | Loss from operations and loss from continuing operations for the year ended December 31, 2014 included a goodwill impairment charge of $304.0 million, and a long-lived asset impairment charge of $112.4 million. Additionally, impairment charges of $74.4 million were incurred as part of the sale of the industrial solutions division (discussed further below), which is included within “Loss from discontinued operations, net of income taxes.” |
31
(5) | Loss from operations and loss from continuing operations for the year ended December 31, 2013 included long-lived asset impairment charges of $111.9 million. |
Additionally, during the fourth quarter of 2013, our board of directors approved and committed to a plan to divest our Thermo Fluids Inc. (“TFI”) subsidiary, which comprised our industrial solutions business. As such, all prior periods were restated to reflect TFI as discontinued operations. Loss from discontinued operations, net of income taxes for the year ended December 31, 2013 included $98.5 million in goodwill impairment charges associated with our industrial solutions business. On April 11, 2015, we completed the TFI disposition with Safety-Kleen, Inc. for $85.0 million in an all-cash transaction. The working capital adjustments were completed during the year ended December 31, 2016. See Note 23 in the Notes to the Consolidated Financial Statements herein for further information.
Balance Sheet Data
Successor | Predecessor | ||||||||||||||||||||
As of December 31, | As of December 31, | ||||||||||||||||||||
2017 | 2016 | 2015 | 2014 | 2013 | |||||||||||||||||
($ in thousands) | |||||||||||||||||||||
Consolidated balance sheet data: | |||||||||||||||||||||
Cash and cash equivalents | $ | 5,488 | $ | 994 | $ | 39,309 | $ | 13,367 | $ | 8,783 | |||||||||||
Total current assets | 53,423 | 33,478 | 94,481 | 154,672 | 161,691 | ||||||||||||||||
Property, plant and equipment, net | 229,874 | 294,179 | 406,188 | 475,982 | 498,541 | ||||||||||||||||
Goodwill (1) | 27,139 | — | — | 104,721 | 408,696 | ||||||||||||||||
Total assets (1) | 311,322 | 342,604 | 522,619 | 871,572 | 1,410,763 | ||||||||||||||||
Current portion of long-term debt (2) | 5,525 | 465,835 | 499,709 | 4,863 | 5,464 | ||||||||||||||||
Current liabilities | 28,387 | 492,967 | 545,087 | 96,193 | 124,538 | ||||||||||||||||
Long-term debt (2) | 33,524 | 5,956 | 11,758 | 592,455 | 549,713 | ||||||||||||||||
Total liabilities (2) | 68,349 | 511,670 | 560,890 | 718,625 | 766,394 | ||||||||||||||||
Total shareholders’ equity (deficit) | 242,973 | (169,066 | ) | (38,271 | ) | 152,947 | 644,369 | ||||||||||||||
(1) | The goodwill balance as of December 31, 2017 is a result of fresh start accounting upon emergence from chapter 11. See Note 5 in the Notes to the Consolidated Financial Statements herein for further information. |
Previously, goodwill was reduced to zero in 2015 as a result of a goodwill impairment charge of $104.7 million. The 2014 decrease in goodwill and total assets related to a goodwill and intangible asset impairment charge of $304.0 million and $112.4 million, respectively. Total assets as of December 31, 2014 and 2013 also reflect a reduction in goodwill relating to impairment charges for TFI of $48.0 million and $98.5 million, respectively, which were included in assets held for sale at those year ends.
(2) | The decrease in the current portion of long-term debt, long-term debt and total liabilities as of December 31, 2017 is a result of approximately $470.0 million in debt obligations being settled as part of the reorganization adjustments under fresh start accounting upon emergence from chapter 11. See Note 4 and Note 5 in the Notes to the Consolidated Financial Statements herein for further information. |
For the years ended December 31, 2016 and December 31, 2015, the carrying value of the Predecessor Company’s asset-based lending facility, 2018 Notes and Predecessor Company’s 12.5%/10.0% Senior Secured Second Lien Notes due 2021 (the “2021 Notes”) were presented as current as a result of either breaching or the probability of breaching one of the financial covenants.
32
Item 7. Management’s Discussion and Analysis of Financial Condition and Results of Operations
This Management’s Discussion and Analysis of Financial Condition and Results of Operations should be read in conjunction with our Consolidated Financial Statements, and the Notes and Schedules related thereto, which are included in this Annual Report.
Company Overview
Nuverra is a leading provider of comprehensive, full-cycle environmental solutions to customers focused on the development and ongoing production of oil and natural gas from shale formations in the United States. We provide one-stop, total environmental solutions and wellsite logistics management, including delivery, collection, treatment and disposal of solid and liquid materials that are used in and generated by the drilling, completion, and ongoing production of shale oil and natural gas.
We operate in shale basins where customer exploration and production (“E&P”) activities are predominantly focused on shale oil and natural gas as follows:
• | Oil shale areas: includes our operations in the Bakken and Eagle Ford Shale areas. |
• | Natural gas shale areas: includes our operations in the Marcellus, Utica, and Haynesville Shale areas. |
We support our customers’ demand for diverse, comprehensive and regulatory compliant environmental solutions required for the safe and efficient drilling, completion and production of oil and natural gas from shale formations.
Our service offering focuses on providing comprehensive environmental and logistics management solutions within three primary groups:
• | Logistics and Wellsite Services: Delivery of freshwater to wellsites, freshwater procurement and transfer services, staging and storage of equipment and materials, rental of wellsite equipment, and construction services including wellpads. |
• | Water Midstream: Collection and transportation of produced water from wellsites to disposal network via trucking or a fixed pipeline system, supplying freshwater for drilling and completion via pipeline system, gathering systems for collection and transportation of flowback and produced water to disposal wells. |
• | Disposal Wells and Landfill: Liquid waste water from hydraulic fracturing operations, liquid waste water from well production, and solid drilling waste. |
We utilize a broad array of assets to meet our customers’ logistics and environmental management needs. Our logistics assets include trucks and trailers, temporary and permanent pipelines, temporary and permanent storage facilities, ancillary rental equipment, treatment facilities, and liquid and solid waste disposal sites. We continue to expand our suite of solutions to customers who demand safety, environmental compliance and accountability from their service providers.
In order to address our liquidity issues due to the prolonged depression in oil and natural gas prices, on May 1, 2017, the Company and certain of its material subsidiaries (collectively with the Company, the “Nuverra Parties”) filed voluntary petitions under chapter 11 of the United States Bankruptcy Code (the “Bankruptcy Code”) in the United States Bankruptcy Court for the District of Delaware (the “Bankruptcy Court”) to pursue prepackaged plans of reorganization (together, and as amended, the “Plan”). On July 25, 2017, the Bankruptcy Court entered an order (the “Confirmation Order”) confirming the Plan. The Plan became effective on August 7, 2017 (the “Effective Date”), when all remaining conditions to the effectiveness of the Plan were satisfied or waived. Although the Nuverra Parties emerged from bankruptcy on the Effective Date, the bankruptcy cases will remain pending until closed by the Bankruptcy Court.
Upon emergence, we elected to apply fresh start accounting effective July 31, 2017, to coincide with the timing of our normal accounting period close. Refer to Note 5 on “Fresh Start Accounting” in the Notes to the Financial Statements for additional information on the selection of this date. As a result of the application of fresh start accounting, as well as the effects of the implementation of the Plan, a new entity for financial reporting purposes was created, and as such, the condensed consolidated financial statements on or after August 1, 2017, are not comparable with the condensed consolidated financial statements prior to that date.
33
References to “Successor” or “Successor Company” refer to the financial position and results of operations of the reorganized Company subsequent to July 31, 2017. References to “Predecessor” or “Predecessor Company” refer to the financial position and results of operations of the Company on and prior to July 31, 2017.
Trends Affecting Our Operating Results
Our results are driven by demand for our services, which are in turn affected by E&P spending trends in the shale basins in which we operate, in particular the level of drilling and completion activities (which impacts the amount of environmental waste products being managed) and active wells (which impacts the amount of produced water being managed). In general, drilling and completion activities in the oil and natural gas industry is affected by the market prices (or anticipated prices) for those commodities.
Due to oil prices beginning to recover in 2017 from historic lows, drilling and completion activities increased in all of our active basins. We would expect continued stability in oil prices or further price growth to lead to increased drilling and completion activities by our customer base during 2018 when compared to 2017. Increased drilling and completion activities would likely lead to a higher demand for our services in 2018; however, there is no guarantee that oil prices will remain stable or increase, drilling and completion activities in basins will continue to increase, or we will see an increase in a demand for our services in 2018.
Our results are also driven by a number of other factors, including (i) availability of our equipment, which we have built through acquisitions and capital expenditures, (ii) transportation costs, which are affected by fuel costs, (iii) utilization rates for our equipment, which are also affected by the level of our customers’ drilling and production activities and competition, and our ability to relocate our equipment to areas in which oil and natural gas exploration and production activities are growing, (iv) the availability of qualified drivers (or alternatively, subcontractors) in the areas in which we operate, particularly in the Bakken, Marcellus, and Utica shale basins, (v) labor costs, which we saw increase during 2017, (vi) developments in governmental regulations, (vii) seasonality and weather events (viii) pricing and (ix) our health, safety and environmental performance record.
The following table summarizes our total revenues, (loss) income from continuing operations before income taxes, and (loss) income from continuing operations for five months ended December 31, 2017, the seven months ended July 31, 2017, and the years ended December 31, 2016 and 2015 (in thousands):
_________________________
Successor | Predecessor | |||||||||||||||
Five Months Ended December 31, | Seven Months Ended July 31, | Years Ended December 31, | ||||||||||||||
2017 | 2017 | 2016 | 2015 | |||||||||||||
Revenue - from predominantly oil shale basins (a) | $ | 51,207 | $ | 62,302 | $ | 92,650 | $ | 241,403 | ||||||||
Revenue - from predominantly natural gas shale basins (b) | 28,981 | 33,581 | 59,526 | 115,296 | ||||||||||||
Total revenue | $ | 80,188 | $ | 95,883 | $ | 152,176 | $ | 356,699 | ||||||||
(Loss) income from continuing operations before income taxes | $ | (48,242 | ) | $ | 168,289 | $ | (166,814 | ) | $ | (195,284 | ) | |||||
(Loss) income from continuing operations | (47,895 | ) | 168,611 | (167,621 | ) | (195,167 | ) | |||||||||
(a) | Represents revenues that are derived from predominantly oil-rich areas consisting of the Bakken, Eagle Ford, Mississippian and Tuscaloosa Marine Shale areas (prior to our substantial exit from the Mississippian and Tuscaloosa Marine shale basins during the three months ended March 31, 2015). Note that the Utica shale basin was previously included in the oil shale basins until the three months ended September 30, 2015 when it was reclassified as a natural gas shale basin. |
(b) | Represents revenues that are derived from predominantly natural gas-rich areas consisting of the Marcellus, Utica, and Haynesville shale basins. Note that the Utica shale basin was previously included in the oil shale basins until the three months ended September 30, 2015 when it was reclassified as a natural gas shale basin. |
34
Results of Operations
Year Ended December 31, 2017 Compared to the Year Ended December 31, 2016
The following table sets forth for each of the periods indicated our statements of operations data (dollars in thousands):
Successor | Predecessor | |||||||||||||||||
Five Months Ended | Seven Months Ended | Year Ended | Increase (Decrease) | |||||||||||||||
December 31, 2017 | July 31, 2017 | December 31, 2016 | 2017 (Combined) versus 2016 | |||||||||||||||
Service revenue | $ | 72,395 | $ | 86,564 | $ | 139,886 | $ | 19,073 | 13.6 | % | ||||||||
Rental revenue | 7,793 | 9,319 | 12,290 | 4,822 | 39.2 | % | ||||||||||||
Total revenue | 80,188 | 95,883 | 152,176 | 23,895 | 15.7 | % | ||||||||||||
Costs and expenses: | ||||||||||||||||||
Direct operating expenses | 67,077 | 81,010 | 129,624 | 18,463 | 14.2 | % | ||||||||||||
General and administrative expenses | 10,615 | 22,552 | 37,013 | (3,846 | ) | (10.4 | )% | |||||||||||
Depreciation and amortization | 38,551 | 28,981 | 60,763 | 6,769 | 11.1 | % | ||||||||||||
Impairment of long-lived assets | 4,904 | — | 42,164 | (37,260 | ) | 100.0 | % | |||||||||||
Total costs and expenses | 121,147 | 132,543 | 269,564 | (15,874 | ) | (5.9 | )% | |||||||||||
Loss from operations | (40,959 | ) | (36,660 | ) | (117,388 | ) | (39,769 | ) | (33.9 | )% | ||||||||
Interest expense, net | (2,187 | ) | (22,792 | ) | (54,530 | ) | (29,551 | ) | (54.2 | )% | ||||||||
Other income, net | 411 | 4,247 | 5,778 | (1,120 | ) | (19.4 | )% | |||||||||||
Loss on extinguishment of debt | — | — | (674 | ) | (674 | ) | (100.0 | )% | ||||||||||
Reorganization items, net | (5,507 | ) | 223,494 | — | 217,987 | 100.0 | % | |||||||||||
(Loss) income from continuing operations before income taxes | (48,242 | ) | 168,289 | (166,814 | ) | 286,861 | 172.0 | % | ||||||||||
Income tax benefit (expense) | 347 | 322 | (807 | ) | 1,476 | (182.9 | )% | |||||||||||
(Loss) income from continuing operations | (47,895 | ) | 168,611 | (167,621 | ) | 288,337 | 172.0 | % | ||||||||||
Loss from discontinued operations, net of income taxes | — | — | (1,235 | ) | (1,235 | ) | (100.0 | )% | ||||||||||
Net (loss) income | $ | (47,895 | ) | $ | 168,611 | $ | (168,856 | ) | $ | 289,572 | 171.5 | % | ||||||
Service Revenue
Service revenue consists of fees charged to customers for the sale and transportation of fresh water and saltwater by our fleet of logistics assets and/or through water midstream assets owned by us to customer sites for use in drilling and completion activities and from customer sites to remove and dispose of flowback and produced water originating from oil and natural gas wells. Service revenue also includes fees for solids management services. Service revenue for the year ended December 31, 2017 was $159.0 million, up $19.1 million, or 13.6%, from $139.9 million for the year ended December 31, 2016. Increases in drilling and completion activities in all divisions during 2017 led to higher service revenue for the year ended December 31, 2017 as compared to the year ended December 31, 2016. The primary driver of the increase in demand in the basins we operate was a 73% increase in average operating drilling rigs from those operating in the prior year.
Rental Revenue
Rental revenue consists of fees charged to customers for use of equipment owned by us over the term of the rental period, as well as other fees charged to customers for items such as delivery and pickup. Rental revenue for the year ended December 31, 2017 was $17.1 million, up $4.8 million, or 39.2%, from $12.3 million for the year ended December 31, 2016. The increase was the result of higher utilization of our rental fleet in all divisions in conjunction with the increase in drilling and completion activities in 2017 due to higher oil prices.
Direct Operating Expenses
Direct operating expenses for the year ended December 31, 2017 were $148.1 million, compared to $129.6 million for the year ended December 31, 2016, an increase of 14.2%. The increase in direct operating expenses is attributable to higher revenues as
35
a result of increased activities in all divisions. Additionally, direct operating expenses during the years ended December 31, 2017 and December 31, 2016, included a loss on the sale of assets of $5.7 million and $3.5 million, respectively.
General and Administrative Expenses
General and administrative expenses for the year ended December 31, 2017 were $33.2 million, down $3.8 million from $37.0 million for the year ended December 31, 2016. The decrease in general and administrative expenses is primarily attributable to lower legal and professional fees as the costs relating to the chapter 11 filing are included in “Reorganization items, net” on the consolidated statement of operations, while the costs incurred with the restructuring of our indebtedness in 2016 were included in general and administrative expenses. Offsetting the lower legal and professional fees were increased payroll costs.
Depreciation and Amortization
Depreciation and amortization for the year ended December 31, 2017 was $67.5 million, up $6.8 million from $60.8 million for the year ended December 31, 2016. The increase is primarily attributable to an increase in our depreciable base as a result of fresh start accounting after emerging from chapter 11. The overall value of property, plant and equipment increased as a result of the valuations completed in coordination with fresh start accounting. Additionally, the assets were assigned shorter useful lives during the valuation process, thus increasing depreciation expense.
Impairment of Long-Lived Assets
During the year ended December 31, 2017, management approved plans to sell certain assets located in both the Rocky Mountain and Southern divisions, including trucks and tanks. These assets qualified to be classified as assets held for sale and as a result the assets were recorded at the lower of net book value or fair value less costs to sell. This resulted in a long-lived asset impairment charge of $4.9 million for the year ended December 31, 2017.
During the year ended December 31, 2016, management approved plans to sell certain assets located in both the Northeast and Southern divisions, which resulted in a long-lived asset impairment charge of $4.8 million for the year ended December 31, 2016. Additionally, long-lived assets, such as property, plant and equipment and purchased intangibles subject to amortization, are reviewed for impairment whenever events or changes in circumstances indicate that the carrying amount of such assets may not be recoverable. During the year ended December 31, 2016, there were indicators that the assets in the Bakken, Eagle Ford, Haynesville and Marcellus/Utica basins were not recoverable and as a result we recorded long-lived asset impairment charges of $37.4 million.
See also Note 8 in the Notes to the Consolidated Financial Statements herein for further discussion.
Interest Expense, net
Interest expense, net during the year ended December 31, 2017 was $25.0 million compared to $54.5 million for the year ended December 31, 2016. The decrease is primarily due to the reduction in our outstanding debt balance during 2017 as a result of the consummation of the Plan. As of December 31, 2017, our outstanding debt balance was $39.0 million, while as of December 31, 2016, outstanding debt was $487.6 million. The significant decrease in debt has dramatically lowered our annual interest expense. See Note 11 in the Notes to the Consolidated Financial Statements herein for further details.
Other Income, net
Other income, net was $4.7 million for the year ended December 31, 2017 compared to $5.8 million for the year ended December 31, 2016. The decrease is primarily attributable to the gain on the sale of Underground Solutions Inc. (or “UGSI”) of $1.7 million during the year ended December 31, 2016 (see Note 21 in the Notes to the Consolidated Financial Statements). During the years ended December 31, 2017 and 2016, we recorded gains of $4.3 million and $3.3 million, respectively, associated with the change in fair value of the derivative warrant liability. We issued warrants with derivative features upon our emergence from chapter 11 during the year ended December 31, 2017, and in connection with our debt restructuring during the year ended December 31, 2016. These instruments are accounted for as derivative liabilities with any decrease or increase in the estimated fair value recorded in “Other income, net.” See Note 12 and Note 13 in the Notes to the Consolidated Financial Statements for further details on the warrants.
Loss on Extinguishment of Debt
During the year ended December 31, 2016, we executed two amendments to our Predecessor asset-based lending facility and as a result wrote-off $0.7 million of unamortized debt issuance costs associated with the Predecessor asset-based lending facility.
36
Reorganization Items, net
Expenses, gains and losses directly associated with the chapter 11 proceedings are reported as “Reorganization items, net” in the consolidated statement of operations for the year ended December 31, 2017, which includes the net gain on debt discharge, professional and insurance fees, debtor in possession credit agreement financing costs, retention bonus payments, and other chapter 11 related items. See Note 5 in the Notes to the Consolidated Financial Statements herein for further details.
Income Taxes
The income tax benefit for the year ended December 31, 2017 was $0.7 million (a (0.6%) effective rate) compared to expense of $0.8 million (a (0.5%) effective rate) in the prior year. The effective tax rate in 2017 is primarily the result of federal alternative minimum tax and the change in valuation allowance attributable to long-lived assets. See Note 17 in the Notes to the Consolidated Financial Statements herein for additional information on income taxes.
Loss from Discontinued Operations
Loss from discontinued operations in the years ended December 31, 2016 represents the final closing adjustments of TFI, our industrial solutions business, which was sold in April of 2015. Such loss, which is presented net of income taxes, was $1.2 million for the year ended December 31, 2016. See Note 23 in the Notes to the Consolidated Financial Statements herein for additional information.
Results of Operations
Year Ended December 31, 2016 Compared to the Year Ended December 31, 2015
The following table sets forth for each of the periods indicated our statements of operations data (dollars in thousands):
Year Ended | ||||||||||||||
December 31, | Increase (Decrease) | |||||||||||||
2016 | 2015 | 2016 versus 2015 | ||||||||||||
Service revenue | $ | 139,886 | 327,655 | $ | (187,769 | ) | (57.3 | )% | ||||||
Rental revenue | 12,290 | 29,044 | (16,754 | ) | (57.7 | )% | ||||||||
Total revenue | 152,176 | 356,699 | (204,523 | ) | (57.3 | )% | ||||||||
Costs and expenses: | ||||||||||||||
Direct operating expenses | 129,624 | 279,881 | (150,257 | ) | (53.7 | )% | ||||||||
General and administrative expenses | 37,013 | 39,327 | (2,314 | ) | (5.9 | )% | ||||||||
Depreciation and amortization | 60,763 | 70,511 | (9,748 | ) | (13.8 | )% | ||||||||
Impairment of long-lived assets | 42,164 | — | 42,164 | 100.0 | % | |||||||||
Impairment of goodwill | — | 104,721 | (104,721 | ) | (100.0 | )% | ||||||||
Other, net | — | 7,098 | (7,098 | ) | (100.0 | )% | ||||||||
Total costs and expenses | 269,564 | 501,538 | (231,974 | ) | (46.3 | )% | ||||||||
Loss from operations | (117,388 | ) | (144,839 | ) | (27,451 | ) | (19.0 | )% | ||||||
Interest expense, net | (54,530 | ) | (49,194 | ) | 5,336 | 10.8 | % | |||||||
Other income, net | 5,778 | 894 | 4,884 | 546.3 | % | |||||||||
Loss on extinguishment of debt | (674 | ) | (2,145 | ) | (1,471 | ) | (68.6 | )% | ||||||
Loss from continuing operations before income taxes | (166,814 | ) | (195,284 | ) | (28,470 | ) | (14.6 | )% | ||||||
Income tax (expense) benefit | (807 | ) | 117 | (924 | ) | 789.7 | % | |||||||
Loss from continuing operations | (167,621 | ) | (195,167 | ) | (27,546 | ) | (14.1 | )% | ||||||
Loss from discontinued operations, net of income taxes | (1,235 | ) | (287 | ) | 948 | 330.3 | % | |||||||
Net loss | $ | (168,856 | ) | $ | (195,454 | ) | $ | (26,598 | ) | (13.6 | )% | |||
Service Revenue
Service revenue for the year ended December 31, 2016 was $139.9 million, down $187.8 million, or 57.3%, from $327.7 million for the year ended December 31, 2015. Continued lower drilling and completion activities in all divisions during 2016, as well as pricing pressures, led to lower service revenue for the year ended December 31, 2016 as compared to the year ended
37
December 31, 2015. The primary driver of the decreased demand in the basins we serve was a 57% decline in average operating oil rigs from those operating in the prior year.
Rental Revenue
Rental revenue for the year ended December 31, 2016 was $12.3 million, down $16.8 million, or 57.7%, from $29.0 million for the year ended December 31, 2015. The decrease was the result of lower utilization of our rental fleet in all divisions in conjunction with the continued reduction in drilling and completion activities in 2016 due to depressed oil prices.
Direct Operating Expenses
Direct operating expenses for the year ended December 31, 2016 were $129.6 million, compared to $279.9 million for the year ended December 31, 2015, a decrease of 53.7%. The decrease in direct operating expenses is attributable to lower revenues as a result of decreased activities, as well as our continued focus on our cost-management initiatives. Additionally, direct operating expenses during the year ended December 31, 2016 included a loss on the sale of assets of $3.5 million, while the year ended December 31, 2015 included a gain on the sale of assets of $0.3 million.
General and Administrative Expenses
General and administrative expenses for the year ended December 31, 2016 were $37.0 million, down $2.3 million from $39.3 million for the year ended December 31, 2015. The decrease in general and administrative expenses is primarily attributable to lower compensation and benefit expenses as a result of headcount reductions in response to the continued decrease in drilling and completion activities, offset by $14.3 million in legal and professional fees incurred in connection with the out-of-court restructuring of our indebtedness in fiscal 2016.
Depreciation and Amortization
Depreciation and amortization for the year ended December 31, 2016 was $60.8 million, down $9.7 million from $70.5 million for the year ended December 31, 2015. The decrease is primarily attributable to a lower depreciable asset base as we have reduced capital spending and sold underutilized or non-core assets as a result of lower oil prices and decreased activities by our customers.
Impairment of Long-Lived Assets
During the year ended December 31, 2016, management approved plans to sell certain assets located in both the Northeast and Southern divisions, including trucks, tanks, and a parcel of land. These assets qualified to be classified as assets held for sale and as a result the assets were recorded at the lower of net book value or fair value less costs to sell. This resulted in a long-lived asset impairment charge of $4.8 million for the year ended December 31, 2016.
Additionally, long-lived assets, such as property, plant and equipment and purchased intangibles subject to amortization, are reviewed for impairment whenever events or changes in circumstances indicate that the carrying amount of such assets may not be recoverable. During the year ended December 31, 2016, there were indicators that the assets in the Bakken, Eagle Ford, Haynesville and Marcellus/Utica basins were not recoverable and as a result we recorded long-lived asset impairment charges of $37.4 million.
No charges were recorded for the impairment of long-lived assets line for the year ended December 31, 2015. See also Note 8 in the Notes to the Consolidated Financial Statements herein for further discussion.
Impairment of Goodwill
We recorded goodwill impairment charges of $104.7 million related to our Rocky Mountain division during the year ended December 31, 2015 as a result of our annual impairment test, thereby eliminating all remaining goodwill on the consolidated balance sheet.
Other, net
During the year ended December 31, 2015, we recorded a charge totaling approximately $7.1 million to restructure our business in certain shale basins and reduce costs, including an exit from the Mississippian shale area and the Tuscaloosa Marine Shale logistics business. Included in the $7.1 million of restructuring charges is approximately $5.9 million for the impairment of certain assets in the Mississippian shale area.
38
Interest Expense, net
Interest expense, net during the year ended December 31, 2016 was $54.5 million compared to $49.2 million for the year ended December 31, 2015. The increase is primarily due to the restructuring of our indebtedness during the year ended December 31, 2016. As part of the debt restructuring, a portion of our 2018 Notes were exchanged for new 2021 Notes whereby the interest due on October 15, 2016 was payable in kind at an annual rate of 12.5%. Additionally, we entered into a new term loan with interest payable in kind at 13% compounded monthly.
Other Income, net
Other income, net was $5.8 million for the year ended December 31, 2016 compared to $0.9 million for the year ended December 31, 2015. The increase is attributable to the gain on the sale of UGSI of $1.7 million during the year ended December 31, 2016. Additionally, we recorded a $3.3 million gain associated with the change in fair value of the derivative warrant liability. We issued warrants with derivative features in connection with our debt restructuring during the year ended December 31, 2016. These instruments are accounted for as derivative liabilities with any decrease or increase in the estimated fair value recorded in “Other income, net.”
Loss on Extinguishment of Debt
During the year ended December 31, 2016, we executed two amendments to our Predecessor asset-based lending facility and as a result wrote-off $0.7 million of unamortized debt issuance costs associated with the Predecessor asset-based lending facility. During the year ended December 31, 2015, as a result of two amendments to our Predecessor asset-based lending facility, we wrote-off a portion of the unamortized debt issuance costs associated with the Predecessor asset-based lending facility of approximately $2.1 million.
Income Taxes
The income tax expense for the year ended December 31, 2016 was $0.8 million (a (0.5%) effective rate) compared to a benefit of $0.1 million (a near zero effective rate) in the prior year. The effective tax rate in 2016 is primarily the result of federal alternative minimum tax and the change in valuation allowance attributable to long-lived assets. See Note 17 in the Notes to the Consolidated Financial Statements herein for additional information on income taxes.
Loss from Discontinued Operations
Loss from discontinued operations in the years ended December 31, 2016 and 2015 represents the financial results and final closing adjustments of TFI, our industrial solutions business, which was sold in April of 2015. Such loss, which is presented net of income taxes, was $1.2 million and $0.3 million for the years ended December 31, 2016 and 2015, respectively. See Note 23 in the Notes to the Consolidated Financial Statements herein for additional information.
Liquidity and Capital Resources
Cash Flows and Liquidity
Our consolidated financial statements have been prepared assuming that we will continue as a going concern, which contemplates continuity of operations, realization of assets, and liquidation of liabilities in the normal course of business. Our primary sources of capital for 2017 have included cash generated by our operations, asset sales, restructuring transactions including borrowings from our Predecessor term loan, debtor in possession financing, Successor first lien term loan, Successor second lien term loan, and Successor revolving facility. At December 31, 2017, our total indebtedness was $39.0 million, and we had cash and cash equivalents of $5.5 million with $9.3 million of net availability under the Successor revolving facility and $5.7 million available as a delayed draw under the Successor second lien term loan.
In order to address our prior liquidity issues due to the prolonged depression in oil and natural gas prices, on May 1, 2017, the Nuverra Parties commenced the chapter 11 cases and filed the Plan, which was subsequently amended. On July 25, 2017, the Bankruptcy Court entered an order confirming the amended Plan. The Plan became effective on August 7, 2017. See the “Emergence from Chapter 11 Reorganization” discussion later in this section for further details on the Restructuring and the Plan.
39
The following table summarizes our sources and uses of cash from continuing operations for the five months ended December 31, 2017, seven months ended July 31, 2017, and the years ended December 31, 2016 and 2015 (in thousands):
Successor | Predecessor | |||||||||||||||
Five Months Ended December 31, | Seven Months Ended July 31, | Years Ended December 31, | ||||||||||||||
Net cash (used in) provided by continuing operations: | 2017 | 2017 | 2016 | 2015 | ||||||||||||
Operating activities | $ | (6,461 | ) | $ | (18,949 | ) | (26,251 | ) | 49,827 | |||||||
Investing activities | 8,388 | (6,451 | ) | 14,732 | 68,178 | |||||||||||
Financing activities | (3,632 | ) | 31,599 | (26,796 | ) | (93,118 | ) | |||||||||
Net (decrease) increase in cash and cash equivalents from continuing operations | $ | (1,705 | ) | $ | 6,199 | $ | (38,315 | ) | $ | 24,887 | ||||||
As of December 31, 2017, we had cash and cash equivalents of $5.5 million, an increase of $4.5 million from December 31, 2016. The primary reason for the increase in cash and cash equivalents is due to the termination of our Predecessor Revolving Facility which required a daily cash sweep of our collection lockbox and certain depository accounts, the proceeds of which were required to be applied against the outstanding balance of the Predecessor asset-based lending facility. Our Successor revolving facility does not impose a similar restriction on our cash.
Operating Activities
Net cash used in operating activities was $25.4 million for the year ended December 31, 2017. The net income from continuing operations, after adjustments for non-cash items, used cash of $15.6 million as compared to $31.1 million in 2016, as described below. Changes in operating assets and liabilities used $9.8 million primarily due to an increase in accounts receivable as a result of higher activity levels and billings in the current year, offset by lower accrued liabilities. The non-cash items and other adjustments included the non-cash reorganization items of $218.6 million arising primarily from the gain on debt discharge due to the consummation of the Plan, a $4.3 million gain resulting from the change in the fair value of the derivative warrant liability, a $0.6 million change in deferred income taxes and a $0.1 million gain on the sale of UGSI, all offset by $67.5 million of depreciation expense and amortization of intangible assets, $11.9 million in accrued interest added to debt principal, $4.9 million in impairment of long-lived assets, a $5.4 million loss on the disposal of property, plant and equipment, amortization of debt issuance costs of $2.1 million, stock-based compensation of $1.1 million, and bad debt expense of $0.9 million.
Net cash used in operating activities was $26.3 million for the year ended December 31, 2016. The net loss from continuing operations, after adjustments for non-cash items, used cash of $31.1 million. Changes in operating assets and liabilities provided $4.8 million primarily due to a decrease in accounts receivable as a result of lower activity levels and billings in the current year, offset by a decrease in accounts payable and accrued liabilities. The non-cash items and other adjustments resulted in $60.8 million of depreciation and amortization of intangible assets, $42.2 million in impairment of long-lived assets, $26.7 million in accrued interest added to debt principal, amortization of debt issuance costs of $6.2 million, a $3.5 million loss on the disposal of property, plant and equipment, stock-based compensation of $1.1 million, and the write-off of debt issuance costs of $0.7 million, partially offset by a $3.3 million gain resulting from the change in the fair value of the derivative warrant liability and a $1.7 million gain on the sale of UGSI.
Net cash provided by operating activities was $49.8 million for the year ended December 31, 2015. The net loss from continuing operations, after adjustments for non-cash items, used cash of $6.3 million. Changes in operating assets and liabilities provided cash of $56.1 million primarily due to a decrease in accounts receivable due to a focused effort on collections and lower activity levels. The non-cash items and other adjustments included $104.7 million in impairment of goodwill, $70.5 million of depreciation and amortization of intangible assets, $5.9 million in impairment of long-lived assets, amortization of debt issuance costs of $4.8 million, and the write-off of debt issuance costs of $2.1 million.
Investing Activities
Net cash provided by investing activities was $1.9 million for the year ended December 31, 2017, which primarily consisted of $7.1 million of proceeds from the sale of property, plant and equipment, offset by $5.4 million of purchases of property, plant and equipment.
Net cash provided by investing activities was $14.7 million for the year ended December 31, 2016 which consisted primarily of $10.7 million of proceeds from the sale of property, plant and equipment, $5.0 million in proceeds from the sale of UGSI, and a $2.8 million decrease in restricted cash due primarily to the release of funds from escrow as a result of the completion of the
40
post-closing working capital reconciliation related to the sale of TFI, partially offset by $3.8 million of purchases of property, plant and equipment.
Net cash provided by investing activities was $68.2 million for the year ended December 31, 2015 and consisted primarily of $78.9 million of proceeds from the sale of TFI, $12.7 million in proceeds from sales of property, plant and equipment, offset by $19.2 million of purchases of property, plant and equipment.
Financing Activities
Net cash provided by financing activities was $28.0 million for the year ended December 31, 2017 and was primarily comprised of $36.1 million of proceeds from the Successor first and second lien term loans, $15.7 million in proceeds from the Predecessor term loan, $6.9 million in proceeds from the debtor in possession term loan, offset by $23.2 million in net repayments on our Predecessor asset-based lending facility and $5.2 million in payments under capital leases, notes payable and other financing activities.
Net cash used in financing activities was $26.8 million for the year ended December 31, 2016 and was primarily due to $79.2 million of net repayments on the Predecessor asset-based lending facility, offset by $55.0 million in proceeds from the issuance of the Predecessor term loan.
Net cash used in financing activities was $93.1 million for the year ended December 31, 2015 and was primarily a result of using the proceeds received from the sale of TFI to make $81.6 million in payments on our Predecessor asset-based lending facility. Additionally, we used cash of $11.2 million for payments under capital leases, notes payable and other financing activities, and $0.2 million for payments of debt issuance costs.
Capital Expenditures
Cash required for capital expenditures (related to continuing operations) for the year ended December 31, 2017 totaled $5.4 million compared to $3.8 million for the year ended December 31, 2016. Capital expenditures for the year ended December 31, 2017 primarily related to expenditures to extend the useful life and productivity on our fleet of trucks, tanks, equipment and disposal wells. Although we did not enter into any new capital leases during the year ended December 31, 2017, historically, a portion of our transportation-related capital requirements were financed through capital leases, which are excluded from the capital expenditures figures cited in the preceding sentences. We continue to focus on improving the utilization of our existing assets and optimizing the allocation of resources in the various shale basins in which we operate. Our capital expenditures program is subject to market conditions, including customer activity levels, commodity prices, industry capacity and specific customer needs. Our planned capital expenditures for 2018 are expected to be financed through cash flow from operations, borrowings under our Successor credit facility and term loan facilities, capital leases, or a combination of the foregoing.
Indebtedness
Prior to the consummation of the Plan which provided for the restructuring of our indebtedness, we were highly leveraged and a substantial portion of our liquidity needs resulted from debt service requirements and from funding our costs of operations and capital expenditures. As of December 31, 2017, we had $39.0 million of indebtedness outstanding, consisting of $14.3 million under the Successor First Lien Term Loan, $21.0 million under the Successor Second Lien Term Loan, and $3.8 million of capital leases for vehicle financings.
In connection with the our emergence from the chapter 11 cases, all of the following agreements, and all outstanding interests and obligations thereunder, were terminated on the Effective Date:
• | Amended and Restated Credit Agreement, as amended through the Fourteenth Amendment thereto, dated as of February 3, 2014, by and among Wells Fargo Bank, National Association (“Wells Fargo”), the lenders named therein, and the Company (the “Predecessor Revolving Facility”); |
• | Term Loan Credit Agreement, as amended through the Ninth Amendment thereto, dated as of April 15, 2016, by and among Wilmington, the lenders named therein, and the Company (the “Predecessor Term Loan”); |
• | Indenture governing the Company’s 2018 Notes, dated April 10, 2012, among the Company, its subsidiaries, and The Bank of New York Mellon, N.A. (the “2018 Notes Indenture”); |
• | Indenture governing the Company’s 2021 Notes, dated April 15, 2016, among the Company, Wilmington, and the guarantors party thereto (the “2021 Notes Indenture”); |
41
• | Debtor-in-Possession Credit Agreement, dated as of April 30, 2017 and effective as of May 3, 2017, by and among the Company, the lenders party thereto, Wells Fargo, and other agents party thereto (the “DIP Credit Agreement”); and |
• | Debtor-in-Possession Term Loan Credit Agreement, dated as of April 30, 2017, by and among the Company, the lenders party thereto, and Wilmington (the “DIP Term Loan Agreement”). |
The termination of the 2018 Notes and the 2021 Notes, and the indentures under which they were issued, resulted in the Company becoming exempt from the reporting requirements under Rule 3-10 of Regulation S-X of the SEC with respect to the 2018 Notes and 2021 Notes. See Note 25 in the Notes to the Consolidated Financial Statements herein for further details.
First Lien Credit Agreements
On the Effective Date, pursuant to the Plan, the Company entered into a $45.0 million First Lien Credit Agreement (the “Credit Agreement”) by and among the lenders party thereto (the “Credit Agreement Lenders”), ACF FinCo I, LP, as administrative agent (the “Credit Agreement Agent”), and the Company. Pursuant to the Credit Agreement, the Credit Agreement Lenders agreed to extend to the Company a $30.0 million senior secured revolving credit facility (the “Successor Revolving Facility”) and a $15.0 million senior secured term loan facility (the “Successor First Lien Term Loan”) (i) to repay obligations outstanding under the Predecessor Revolving Facility and debtor in possession asset based lending facility, (ii) to make certain payments as provided in the Plan, (iii) to pay costs and expenses incurred in connection with the Plan, and (iv) for working capital, transaction expenses, and other general corporate purposes. The Credit Agreement also contains an accordion feature that provides for an increase in availability of up to an additional $20.0 million, subject to the satisfaction of certain terms and conditions contained in the Credit Agreement.
The Successor Revolving Facility and the Successor First Lien Term Loan mature on August 7, 2020, at which time the Company must repay the outstanding principal amount of the Successor Revolving Facility and the Successor First Lien Term Loan, together with interest accrued and unpaid thereon. The Successor Revolving Facility may be repaid and, subject to the terms and conditions of the Credit Agreement, reborrowed at any time during the term of the Credit Agreement. The principal amount of the Successor First Lien Term Loan shall be repaid in installments of $178.6 thousand beginning on September 1, 2017 and the first day of each calendar month thereafter prior to maturity. Interest on the Successor Revolving Facility accrues at an annual rate equal to the LIBOR Rate (as defined in the Credit Agreement) plus 5.25%, and interest on the Successor First Lien Term Loan accrues at an annual rate equal to the LIBOR Rate plus 7.25%; however, if there is an Event of Default (as defined in the Credit Agreement), the Credit Agreement Agent, in its sole discretion, may increase the applicable interest rate at a per annum rate equal to three percentage points above the annual rate otherwise applicable thereunder.
The Credit Agreement also contains certain affirmative and negative covenants, including a fixed charge coverage ratio covenant, as well as other terms and conditions that are customary for revolving credit facilities and term loans of this type. As of December 31, 2017, we were in compliance with all covenants.
Second Lien Term Loan Credit Agreement
On the Effective Date, pursuant to the Plan, the Company also entered into a Second Lien Term Loan Credit Agreement (the “Second Lien Term Loan Agreement”) by and among the lenders party thereto (the “Second Lien Term Loan Lenders”), Wilmington Savings Fund Society, FSB (“Wilmington”), as administrative agent (the “Second Lien Term Loan Agent”), and the Company. Pursuant to the Second Lien Term Loan Agreement, the Second Lien Term Loan Lenders agreed to extend to the Company a $26.8 million second lien term loan facility (the “Successor Second Lien Term Loan”), of which $21.1 million was advanced on the Effective Date and up to an additional $5.7 million (“Delayed Draw Term Loan”) is available at the request of the Company after the closing date subject to the satisfaction of certain terms and conditions specified in the Second Lien Term Loan Agreement. The Second Lien Term Loan Lenders extended the Successor Second Lien Term Loan, among other things, (i) to repay obligations outstanding under the Predecessor Revolving Facility and debtor in possession asset based revolving facility, (ii) to make certain payments as provided in the Plan, (iii) to pay costs and expenses incurred in connection with the Plan, and (iv) for working capital, transaction expenses and other general corporate purposes.
The Successor Second Lien Term Loan matures on February 7, 2021, at which time the Company must repay all outstanding obligations under the Successor Second Lien Term Loan. The principal amount of the Successor Second Lien Term Loan shall be repaid in installments of $263.2 thousand beginning on October 1, 2017, and the first day of each fiscal quarter thereafter prior to maturity, with such amount to be proportionally increased as the result of the incurrence of a Delayed Draw Term Loan. Interest on the Successor Second Lien Term Loan accrues at an annual rate equal to 11.0%, with 5.5% payable in cash and 5.5% payable in kind prior to February 7, 2018 (or such later date as the Company may select in accordance with the terms of the Second Lien Term Loan Agreement) and, on or after February 7, 2018 (or such later date), at an annual rate equal to 11.0%,
42
payable in cash, in arrears, on the first day of each month. However, upon the occurrence and during the continuation of an Event of Default (as defined in the Second Lien Term Loan Agreement) due to a voluntary or involuntary bankruptcy filing, automatically, or any other Event of Default, at the election of the Second Lien Term Loan Agent, the Successor Second Lien Term Loan and all obligations thereunder shall bear interest at an annual rate equal to three percentage points above the annual rate otherwise applicable thereunder.
The Second Lien Term Loan Agreement also contains certain affirmative and negative covenants, including a fixed charge coverage ratio covenant, as well as other terms and conditions that are customary for term loans of this type. As of December 31, 2017, we were in compliance with all covenants.
Security Agreements
On August 7, 2017, in connection with the Credit Agreement, the Company entered into (i) a First Lien Guaranty and Security Agreement by and among the Company, the other grantors party thereto, and the Credit Agreement Agent to grant a first lien security interest in all of such grantor’s as collateral provided therein to secure the obligations under the Credit Agreement and (ii) a First Lien Trademark Security Agreement, by and among the Company, the other grantors party thereto, and the Credit Agreement Agent to grant a first lien security interest in certain trademark collateral as provided therein to secure obligations under the Credit Agreement.
On August 7, 2017, in connection with the Second Lien Term Loan Agreement, the Company entered into (i) a Second Lien Guaranty and Security Agreement by and among the Company, the other grantors party thereto, and the Second Lien Term Loan Agent to grant a second lien security interest in all of such grantor’s collateral as provided therein to secure the obligations under the Second Lien Term Loan Agreement and (ii) a Second Lien Trademark Security Agreement, by and among the Company, the other grantors party thereto, and the Second Lien Term Loan Agent to grant a second lien security interest in certain trademark collateral as provided therein to secure obligations under the Second Lien Term Loan Agreement.
Intercreditor Agreement and Intercompany Subordination Agreement
On August 7, 2017, in connection with the Credit Agreement and the Second Lien Term Loan Agreement, the Company acknowledged the terms and conditions under a Subordination and Intercreditor Agreement (the “Intercreditor Agreement”), dated as of August 7, 2017, by and among the Credit Agreement Agent and the Second Lien Term Loan Agent to set forth the terms and conditions of the relationship between the lenders and the secured parties under the Credit Agreement and Second Lien Term Loan Agreement. On August 7, 2017, the Company entered into an Intercompany Subordination Agreement (the “Intercompany Agreement”), dated as of August 7, 2017, by and among the Company and the other obligors named therein to agree to subordinate its indebtedness to the Credit Agreement Lenders and the Second Lien Term Loan Lenders.
Emergence from Chapter 11 Reorganization
On May 1, 2017, the Nuverra Parties filed voluntary petitions under chapter 11 of the Bankruptcy Code in the Bankruptcy Court to pursue the Plan. On July 25, 2017, the Bankruptcy Court entered the Confirmation Order confirming the Plan. On July 26, 2017, David Hargreaves, an individual holder of our Predecessor 2018 Notes, appealed the Confirmation Order to the District Court for the District of Delaware (the “District Court”) and filed a motion for a stay pending appeal from the District Court. On August 3, 2017, the District Court entered an order denying the motion for a stay pending appeal. Notwithstanding the denial of the motion for stay pending appeal, Hargreaves’ appeal remains pending in the District Court.
The Nuverra Parties emerged from the bankruptcy proceedings on the Effective Date. Although the Nuverra Parties emerged from bankruptcy on the Effective Date, the bankruptcy cases will remain pending until closed by the Bankruptcy Court.
On the Effective Date, the Company:
• | Adopted a Second Amended and Restated Certificate of Incorporation and Third Amended and Restated Bylaws of the Company; |
• | Appointed three new members to the Company’s Board of Directors to replace the directors of the Company who were deemed to have resigned on the Effective Date; |
• | Entered into the Credit Agreement, pursuant to which the Credit Agreement Lenders agreed to extend the Company the Successor Revolving Facility and the Successor First Lien Term Loan; |
• | Entered into the Second Lien Term Loan Credit Agreement, pursuant to which the Second Lien Term Loan Lenders extended the Company the Successor Second Lien Term Loan; |
43
• | Issued 7,900,000 shares of common stock of the reorganized Company to the holders of the Predecessor Company’s 2021 Notes; |
• | Issued 100,000 shares of common stock of the reorganized Company to the Affected Classes (as defined in the Plan); |
• | Issued 3,695,580 shares of common stock of the reorganized Company to holders of Supporting Noteholder Term Loan Claims (as defined in the Plan) and to the Credit Agreement Lenders for the Exit Financing Commitment Fee (as defined in the Plan); |
• | Issued 118,137 warrants to purchase common stock of the reorganized Company, with an exercise price of $39.82 per share and an exercise term expiring seven years from the Effective Date; |
• | Entered into a Registration Rights Agreement with certain holders of the reorganized Company’s common stock party thereto; |
• | Entered into a Warrant Agreement with American Stock Transfer & Trust Company LLC, the Company’s transfer agent; |
• | Paid in full in cash all administrative expense claims, priority tax claims, priority claims, and debtor in possession revolving credit facility claims; |
• | Paid all undisputed, non-contingent customer, vendor, or other obligations not specifically compromised under the Plan; and |
• | Assumed Mark D. Johnsrud’s, the Company’s former Chairman and Chief Executive Officer, Second Amended and Restated Employment Agreement, dated April 28, 2017 and entered into an Amended and Restated Employment Agreement with Joseph M. Crabb, the Company’s Executive Vice President and Chief Legal Officer. |
On the Effective Date, all of the following agreements, and all outstanding interests and obligations thereunder, were terminated:
• | Predecessor Revolving Facility; |
• | Predecessor Term Loan; |
• | 2018 Notes Indenture; |
• | 2021 Notes Indenture; |
• | DIP Credit Agreement; and |
• | DIP Term Loan Agreement. |
In addition, on the Effective Date, pursuant to the Plan, (i) all shares of the Company’s pre-Effective Date common stock and all other previously issued and outstanding equity interests in the Company, and any rights of any holder in respect thereof, were canceled and discharged and (ii) all agreements, instruments, and other documents evidencing, relating to or connected with the Company’s pre-Effective Date common stock and all other previously issued and outstanding equity interests of the Company, and any rights of any holder in respect thereof, were canceled and discharged and of no further force or effect.
As a result of the cancellation of the Company’s pre-Effective Date common stock on the Effective Date, the Company’s pre-Effective Date common stock ceased trading on the OTC Pink under the symbol “NESCQ.” On October 12, 2017, the Company’s post-Effective Date common stock was listed and began trading on the NYSE American under the symbol “NES.” See “Risks Related to our Common Stock” on page 22 of this Annual Report.
The foregoing is a summary of the substantive provisions of the Plan and the transactions related to and contemplated thereunder and is not intended to be a complete description of, or a substitute for, a full and complete reading of, the Plan and the other documents referred to above.
44
Contractual Obligations
The following table details our contractual cash obligations as of December 31, 2017 (in thousands). See Note 18 in the Notes to the Consolidated Financial Statements for additional information.
Payments due by Period | ||||||||||||||||||||
Less than 1 Year | 1-3 Years | 3-5 Years | More than 5 Years | Total | ||||||||||||||||
Debt obligations including capital leases (1) | $ | 5,525 | $ | 15,683 | $ | 17,841 | $ | — | $ | 39,049 | ||||||||||
Interest on debt and capital leases (2) | 4,079 | 5,885 | 339 | — | 10,303 | |||||||||||||||
Operating leases (3) | 3,696 | 792 | 238 | 572 | 5,298 | |||||||||||||||
Contingent consideration (4) | 500 | — | — | — | 500 | |||||||||||||||
Asset retirement obligation (5) | — | 1,626 | 826 | 3,983 | 6,435 | |||||||||||||||
Total | $ | 13,800 | $ | 23,986 | $ | 19,244 | $ | 4,555 | $ | 61,585 | ||||||||||
(1) | Principal payments are reflected when contractually required. |
(2) | Estimated interest on debt for all periods presented is calculated using interest rates available as of December 31, 2017 and includes fees for the unused portion of our Successor Revolving Facility. |
(3) | Represents operating leases primarily for facilities, vehicles and rental equipment. |
(4) | Represents the $0.5 million due related to the acquisition of Ideal Oilfield Disposal LLC, which is payable when the Ideal settlement counterparties deliver the required permits and certificates necessary for the issuance of the second special waste disposal permit. See Note 12 to the Consolidated Financial Statements for further information on the settlement. |
(5) | Represents estimated future costs related to the closure and/or remediation of our disposal wells and landfill. As we are uncertain as to when these future costs will be paid, the majority of the obligation has been presented in the more than five years column. |
Off Balance Sheet Arrangements
As of December 31, 2017, we did not have any material off-balance-sheet arrangements other than operating leases, as defined in Item 303(a)(4)(ii) of SEC Regulation S-K.
Critical Accounting Policies and Estimates
Our discussion and analysis of financial condition and results of operations are based upon our audited consolidated financial statements, which have been prepared in accordance with GAAP. The preparation of these financial statements requires management to make estimates and judgments that affect the reported amounts in the consolidated financial statements and accompanying notes. Actual results, however, may materially differ from our calculated estimates.
We believe the following critical accounting policies affect the more significant judgments and estimates used in the preparation of our financial statements and changes in these judgments and estimates may impact future results of operations and financial condition. For additional discussion of our accounting policies see Note 3 in the Notes to the Consolidated Financial Statements included in this Annual Report on Form 10-K.
Allowance for Doubtful Accounts
Accounts receivable are recognized and carried at the original invoice amount less an allowance for doubtful accounts. We provide an allowance for doubtful accounts to reflect the expected uncollectability of trade receivables for both billed and unbilled receivables on our service and rental revenues. We perform ongoing credit evaluations of prospective and existing customers and adjust credit limits based upon payment history and the customer’s current credit worthiness, as determined by a review of their current credit information. In addition, we continuously monitor collections and payments from customers and maintain a provision for estimated credit losses based upon historical experience and any specific customer collection issues that have been identified. Inherent in the assessment of the allowance for doubtful accounts are certain judgments and estimates including, among others, the customer’s willingness or ability to pay, our compliance with customer invoicing requirements, the effect of general economic conditions and the ongoing relationship with the customer. Additionally, if the financial condition of a specific customer or our general customer base were to deteriorate, resulting in an impairment of their ability to make
45
payments, additional allowances may be required. Accounts receivable are presented net of allowances for doubtful accounts of approximately $1.9 million, $1.7 million and $3.5 million at December 31, 2017, 2016 and 2015 respectively.
Impairment of Long-Lived Assets and Intangible Assets with Finite Useful Lives
We review long-lived assets including intangible assets with finite useful lives for impairment whenever events or changes in circumstances indicate the carrying value of a long-lived asset (or asset group) may not be recoverable. If an impairment indicator is present, we evaluate recoverability by comparing the estimated future cash flows of the asset group, on an undiscounted basis, to their carrying values. The asset group represents the lowest level for which identifiable cash flows are largely independent of the cash flows of other groups of assets and liabilities. If the undiscounted cash flows exceed the carrying value, no impairment is present. If the undiscounted cash flows are less than the carrying value, the impairment is measured as the difference between the carrying value and the fair value of the long-lived asset (or asset group). Our determination that an event or change in circumstance has occurred potentially indicating the carrying amount of an asset (or asset group) may not be recoverable generally includes but is not limited to one or more of the following: (1) a deterioration in an asset’s financial performance compared to historical results, (2) a shortfall in an asset’s financial performance compared to forecasted results, (3) changes affecting the utility and estimated future demands for the asset, (4) a significant decrease in the market price of an asset, (5) a current expectation that a long-lived asset will be sold or disposed of significantly before the end of its previously estimated useful life, (6) a significant adverse change in the extent or manner in which a long-lived asset (asset group) is being used or in its physical condition, and (7) declining operations and severe changes in projected cash flows.
We recorded total impairment charges of $4.9 million for long-lived assets classified as held for sale during the year ended December 31, 2017, which was included in “Impairment of long-lived assets” in the consolidated statement of operations. During the year ended December 31, 2016, we recorded total impairment charges for long-lived assets of $42.2 million. These charges were due to the carrying value of assets for certain basins not being recoverable, as well as for assets that were classified as held for sale during 2016. We recorded long-lived asset impairment charges associated with our restructuring of $5.9 million during the year ended December 31, 2015, which was included in “Other, net” in the consolidated statement of operations (See Note 9). We could recognize future impairments to the extent adverse events or changes in circumstances result in conditions in which long-lived assets are not recoverable. See Note 8 in the Notes to the Consolidated Financial Statements for additional information on our impairment charges.
Income Taxes and Valuation of Deferred Tax Assets
We are subject to federal income taxes and state income taxes in those jurisdictions in which we operate. We exercise judgment with regard to income taxes in interpreting whether expenses are deductible in accordance with federal income tax and state income tax codes, estimating annual effective federal and state income tax rates and assessing whether deferred tax assets are, more likely than not, expected to be realized. The accuracy of these judgments impacts the amount of income tax expense we recognize each period.
With regard to the valuation of deferred tax assets, we record valuation allowances to reduce net deferred tax assets to the amount considered more likely than not to be realized. All available evidence is considered to determine whether, based on the weight of that evidence, a valuation allowance for deferred tax assets is needed. See Note 17 to our Consolidated Financial Statements herein for further information regarding the valuation of our deferred tax assets and the impact of new legislation.
Future realization of the tax benefit of an existing deductible temporary difference or carryforward ultimately depends on the existence of sufficient taxable income of the appropriate character (for example ordinary income or capital gain) within the carryback or carryforward periods available under the tax law. We have had significant pretax losses in recent years. Accordingly, we do not have income in carryback years. These cumulative losses also present significant negative evidence about the likelihood of income in carryforward periods.
Future reversals of existing taxable temporary differences are another source of taxable income that is used in this analysis. As a result, deferred tax liabilities in excess of deferred tax assets generally will provide support for recognition of deferred tax assets. However, most of our deferred tax assets are associated with net operating loss (“NOL”) carryforwards, which statutorily expire after a specified number of years; therefore, we compare the estimated timing of these taxable timing difference reversals with the scheduled expiration of our NOL carryforwards, considering any limitations on use of NOL carryforwards, and record a valuation allowance against deferred tax assets that would expire unused.
As a matter of law, we are subject to examination by federal and state taxing authorities. We have estimated and provided for income taxes in accordance with settlements reached with the Internal Revenue Service in prior audits. Although we believe that the amounts reflected in our tax returns substantially comply with the applicable federal and state tax regulations, both the IRS and the various state taxing authorities can take positions contrary to our position based on their interpretation of the law. A
46
tax position that is challenged by a taxing authority could result in an adjustment to our income tax liabilities and related tax provision.
We measure and record tax contingency accruals in accordance with GAAP which prescribes a threshold for the financial statement recognition and measurement of a tax position taken or expected to be taken in a return. Only positions meeting the “more likely than not” recognition threshold at the effective date may be recognized or continue to be recognized. A tax position is measured at the largest amount that is greater than 50 percent likely of being realized upon ultimate settlement.
Revenue Recognition
We recognize revenues in accordance with Accounting Standards Codification 605 (ASC 605 “Revenue Recognition”) and Staff Accounting Bulletin No 104, and accordingly all of the following criteria must be met for revenues to be recognized: persuasive evidence of an arrangement exists, delivery has occurred or services have been rendered, the price to the buyer is fixed and determinable and collectability is reasonably assured.
The majority of our revenues are from the transportation of fresh and saltwater by our trucks or through temporary or permanent water transport pipelines to customer sites for use in drilling and hydraulic fracturing activities and from customer sites to remove and dispose of flowback and produced water originating from oil and natural gas wells. Revenues are also generated through fees charged for disposal of oilfield wastes in our landfill, disposal of fluids in our disposal wells and from the rental of tanks and other equipment. Certain customers are under contract with us to utilize our saltwater pipeline. Transportation and disposal rates are generally based on a fixed fee per barrel of disposal water or, in certain circumstances transportation is based on an hourly rate. Revenue is recognized based on the number of barrels transported or disposed of at hourly rates for transportation services, depending on the customer contract. Rates for other services are based on negotiated rates with our customers and revenue is recognized when the services have been performed.
Environmental and Legal Contingencies
We have established liabilities for environmental and legal contingencies. We record a loss contingency for these matters when it is probable that a liability has been incurred and the amount of the loss can be reasonably estimated. In determining the liability, we consider a number of factors including, but not limited to, the jurisdiction of the claim, related claims, insurance coverage when insurance covers the type of claim and our historic outcomes in similar matters, if applicable. A significant amount of judgment and the use of estimates are required to quantify our ultimate exposure in these matters. The determination of liabilities for these contingencies is reviewed periodically to ensure that we have accrued the proper level of expense. The liability balances are adjusted to account for changes in circumstances for ongoing issues, including the effect of any applicable insurance coverage for these matters. While we believe that the amount accrued is adequate, future changes in circumstances could impact these determinations.
We record obligations to retire tangible, long-lived assets on our balance sheet as liabilities, which are recorded at a discount when we incur the liability. A certain amount of judgment is involved in estimating the future cash flows of such obligations, as well as the timing of these cash flows. If our assumptions and estimates on the amount or timing of the future cash flows change, it could potentially have a negative impact on our earnings.
Recently Issued Accounting Pronouncements
See the “Recently Issued Accounting Pronouncements” section of Note 3 on Significant Accounting Policies in the Notes to the Consolidated Financial Statements herein for a complete description of recent accounting standards which may be applicable to our operations. The significant accounting standards that have been adopted during the year ended December 31, 2017 are described in Note 2 on Basis of Presentation in the Notes to the Consolidated Financial Statements herein.
Item 7A. Quantitative and Qualitative Disclosures about Market Risk
Inflation
Inflationary factors, such as increases in our cost structure, could impair our operating results. Although we do not believe that inflation has had a material impact on our financial position or results of operations to date, a high rate of inflation in the future may have an adverse effect on our ability to maintain current levels of gross margin and selling, general and administrative expenses as a percentage of sales revenue if the selling prices of our products do not increase with these increased costs.
47
Commodity Risk
We are subject to market risk exposures arising from declines in oil and natural gas drilling activity in unconventional areas, which is primarily a function of the market price for oil and natural gas. Various factors beyond our control affect the market prices for oil and natural gas, including but not limited to the level of consumer demand, governmental regulation, the price and availability of alternative fuels, political instability in foreign markets, weather-related factors and the overall economic environment. Market prices for oil and natural gas historically have been volatile and unpredictable, and we expect this volatility to continue in the future. Prolonged declines in the market price of oil and/or natural gas could contribute to declines in drilling activity and accordingly would reduce demand for our services. We attempt to manage this risk by strategically aligning our assets with those areas where we believe demand is highest and market conditions for our services are most favorable. If there is further deterioration in our business operations or prospects, our stock price, the broader economy or our industry, including further declines in oil and natural gas prices, the value of our long-lived assets, or those we may acquire in the future, could decrease significantly and result in additional impairment and financial statement write-offs which could have a material adverse effect on our financial condition, results of operations and cash flows.
Interest Rates
As of December 31, 2017 the outstanding principal balance on Successor Revolving Facility was $0.0 million, while the outstanding principal balance on the Successor First Lien Term Loan was $14.3 million. Interest on the Successor Revolving Facility accrues at an annual rate equal to the LIBOR Rate (as defined in the Credit Agreement) plus 5.25%, and interest on the Successor First Lien Term Loan accrues at an annual rate equal to the LIBOR Rate plus 7.25%. The weighted average interest rate for the five months ended December 31, 2017 was 6.62% for the Successor Revolving Facility and 8.62% for the Successor First Lien Term Loan. We have assessed our exposure to changes in interest rates on variable rate debt by analyzing the sensitivity to our earnings assuming various changes in market interest rates. Assuming a hypothetical increase of 1% to the interest rates on the average outstanding balance of our variable rate debt portfolio during the five months ended December 31, 2017, our net interest expense for five months ended December 31, 2017 would have increased by an estimated $0.1 million.
Item 8. Financial Statements and Supplementary Data
The financial statements and supplementary data required by Regulation S-X are included in Item 15. “Exhibits, Financial Statement Schedules” contained in Part IV, Item 15 of this Annual Report on Form 10-K.
Item 9. Changes in and Disagreements with Accountant on Accounting and Financial Disclosure
None.
Item 9A. Controls and Procedures
Disclosure controls and procedures are controls and other procedures that are designed to ensure that information required to be disclosed in company reports filed or submitted under the Securities Exchange Act of 1934, as amended (the “Exchange Act”) is recorded, processed, summarized and reported within the time periods specified in the rules and forms of the Securities and Exchange Commission, and that such information is accumulated and communicated to management, including our Chief Executive Officer and Chief Financial Officer, as appropriate, to allow timely decisions regarding required disclosure.
Evaluation of Disclosure Controls and Procedures
An evaluation of the effectiveness of our disclosure controls and procedures was performed under the supervision of, and with the participation of, management, including our Chief Executive Officer and Chief Financial Officer, as of the end of the period covered by this Annual Report on Form 10-K. Based on this evaluation, our Chief Executive Officer and Chief Financial Officer concluded that our disclosure controls and procedures are effective.
Management’s Annual Report on Internal Control over Financial Reporting
The Company’s management is responsible for establishing and maintaining adequate internal control over financial reporting as defined in Rules 13a-15(f) and 15d-15(f) under the Securities Exchange Act of 1934. The Company’s internal control system is designed to provide reasonable assurance regarding the reliability of financial reporting and the preparation of the consolidated financial statements for external purposes in accordance with accounting principles generally accepted in the United States of America.
The Company’s internal control over financial reporting includes those policies and procedures that (1) pertain to the maintenance of records that, in reasonable detail, accurately and fairly reflect the transactions and dispositions of the assets of
48
the Company; (2) provide reasonable assurance that transactions are recorded as necessary to permit preparation of consolidated financial statements in accordance with generally accepted accounting principles, and that receipts and expenditures of the Company are being made only in accordance with authorizations of management and directors of the Company; and (3) provide reasonable assurance regarding prevention or timely detection of unauthorized acquisition, use or disposition of the Company’s assets that could have a material effect on the consolidated financial statements.
Because of its inherent limitations, internal control over financial reporting may not prevent or detect misstatements. Also, projections of any evaluation of effectiveness to future periods are subject to the risk that controls may become inadequate because of changes in conditions, or that the degree of compliance with the policies or procedures may deteriorate.
Management assessed the effectiveness of the Company’s internal control over financial reporting as of December 31, 2017. In making its assessment of internal control over financial reporting, management used the criteria set forth by the Committee of Sponsoring Organizations of the Treadway Commission (COSO) in Internal Control—Integrated Framework (2013). Based on this assessment, management concluded that our internal control over financial reporting was effective as of December 31, 2017.
Due to our aggregate market value of the voting and non-voting common equity held by non-affiliates falling below $75.0 million as of June 30, 2017, and our corresponding status as a smaller reporting company, our independent registered public accounting firm, Moss Adams LLP, was not required to issue an audit report on the effectiveness of our internal control over financial reporting for the year ended December 31, 2017.
Changes in Internal Control over Financial Reporting
There were no changes in our internal control over financial reporting during the three months ended December 31, 2017 that materially affected, or were reasonably likely to materially affect, our internal control over financial reporting.
Item 9B. Other Information
None.
49
PART III
Item 10. Directors, Executive Officers and Corporate Governance
The information required by this item will be contained in, and is incorporated by reference to, the Definitive Information Statement for our 2018 Annual Meeting of Stockholders or a Form 10-K/A which, in either case, we will file with the Securities and Exchange Commission within 120 days after our fiscal year ended December 31, 2017.
Item 11. Executive Compensation
The information required by this item will be contained in, and is incorporated by reference to, the Definitive Information Statement for our 2018 Annual Meeting of Stockholders or a Form 10-K/A which, in either case, we will file with the Securities and Exchange Commission within 120 days after our fiscal year ended December 31, 2017.
Item 12. Security Ownership of Certain Beneficial Owners and Management and Related Stockholder Matters
The information required by this item will be contained in, and is incorporated by reference to, the Definitive Information Statement for our 2018 Annual Meeting of Stockholders or a Form 10-K/A which, in either case, we will file with the Securities and Exchange Commission within 120 days after our fiscal year ended December 31, 2017.
Item 13. Certain Relationships and Related Transactions, and Director Independence
The information required by this item will be contained in, and is incorporated by reference to, the Definitive Information Statement for our 2018 Annual Meeting of Stockholders or a Form 10-K/A which, in either case, we will file with the Securities and Exchange Commission within 120 days after our fiscal year ended December 31, 2017.
Item 14. Principal Accounting Fees and Services
The information required by this item will be contained in, and is incorporated by reference to, the Definitive Information Statement for our 2018 Annual Meeting of Stockholders or a Form 10-K/A which, in either case, we will file with the Securities and Exchange Commission within 120 days after our fiscal year ended December 31, 2017.
50
PART IV
Item 15. Exhibits, Financial Statement Schedules
(a) | The following documents are filed as part of this Annual Report on Form 10-K: |
1. Audited Consolidated Financial Statements:
Page | ||
2. Financial Statement Schedules: All financial statement schedules have been omitted since they are not required, not applicable, or the information is otherwise included in the audited consolidated financial statements.
(b) | The exhibits listed on the “Exhibit Index” set forth below are filed with this Annual Report on Form 10-K or incorporated by reference as set forth therein. |
Exhibit Number | Description | ||||
2.1 | |||||
2.2 | |||||
3.1 | |||||
3.2 | |||||
4.1 | |||||
4.2 | |||||
4.3 | |||||
4.4 | |||||
51
Exhibit Number | Description | ||||
10.1 | |||||
10.1 | A | ||||
10.1 | B | ||||
10.1 | C | ||||
10.1 | D | ||||
10.1 | E | ||||
10.1 | F | ||||
10.1 | G | ||||
10.1 | H | ||||
10.1 | I | ||||
10.1 | J | ||||
52
Exhibit Number | Description | ||||
10.1 | K | ||||
10.1 | L | ||||
10.1 | M | ||||
10.1 | N | ||||
10.1 | O | ||||
10.1 | P | ||||
10.1 | Q | ||||
10.1 | R | ||||
10.1 | S | ||||
10.1 | T | ||||
10.1 | U | ||||
10.1 | V | ||||
10.1 | W | ||||
10.1 | X | ||||
10.2 | † | ||||
10.2 | A | † | |||
10.2 | B | † | |||
10.3 | † | ||||
53
Exhibit Number | Description | ||||
10.3 | A | † | |||
10.3 | B | † | |||
10.4 | |||||
10.4 | A | ||||
10.4 | B | ||||
10.5 | |||||
10.5 | A | ||||
10.5 | B | ||||
10.5 | C | ||||
10.5 | D | ||||
10.5 | E | ||||
10.5 | F | ||||
10.5 | G | ||||
10.5 | H | ||||
10.5 | I | ||||
54
Exhibit Number | Description | ||||
10.5 | J | ||||
10.5 | K | ||||
10.5 | L | ||||
10.5 | M | ||||
10.5 | N | ||||
10.5 | O | ||||
10.6 | † | ||||
10.7 | |||||
10.8 | |||||
10.9 | |||||
10.10 | |||||
10.10 | A | ||||
10.10 | B | ||||
10.11 | |||||
55
Exhibit Number | Description | ||||
10.11 | A | ||||
10.11 | B | ||||
10.12 | |||||
10.13 | |||||
10.14 | † | ||||
16.1 | |||||
21.1 | * | ||||
24.1 | * | ||||
31.1 | * | ||||
31.2 | * | ||||
32.1 | * | ||||
101.INS | * | XBRL Instance Document | |||
101.SCH | * | XBRL Taxonomy Extension Schema Document | |||
101.CAL | * | XBRL Taxonomy Extension Calculation Linkbase Document | |||
101.DEF | * | XBRL Taxonomy Extension Definition Linkbase Document | |||
101.LAB | * | XBRL Taxonomy Extension Definition Linkbase Document | |||
101.PRE | * | XBRL Taxonomy Extension Presentation Linkbase Document | |||
* | Filed herewith | ||||
† | Compensatory plan, contract or arrangement in which directors or executive officers may participate | ||||
Item 16. Form 10-K Summary
None.
56
SIGNATURES
Pursuant to the requirements of Section 13 or 15(d) of the Securities Act of 1934, the registrant has duly caused this report to be signed on its behalf by the undersigned, thereunto duly authorized, in the City of Scottsdale, State of Arizona, on March 16, 2018.
Nuverra Environmental Solutions, Inc. | |||
By: | /s/ CHARLES K. THOMPSON | ||
Name: | Charles K. Thompson | ||
Title: | Chairman of the Board and Interim Chief Executive Officer | ||
POWER OF ATTORNEY
KNOW ALL PERSONS BY THESE PRESENTS, that each person whose signature appears below constitutes and appoints Charles K. Thompson as his true and lawful attorney-in-fact and agent, with full power of substitution and resubstitution, for him and in his name, place, and stead, in any and all capacities, to sign any and all amendments to this Annual Report on Form 10-K and to file the same, with all exhibits thereto and other documents in connection therewith, with the Securities and Exchange Commission, granting unto said attorney-in-fact and agent, full power and authority to do and perform each and every act and thing requisite and necessary to be done in connection therewith as fully to all intents and purposes as he might or could do in person, hereby ratifying and confirming all that said attorney-in-fact and agent, or his substitute or substitutes, may lawfully do or cause to be done by virtue hereof.
Pursuant to the requirements of the Securities Act of 1934, this report has been signed by the following persons in the capacities and on the dates indicated.
Signature | Title | Date | ||
/s/ CHARLES K. THOMPSON | Chairman of the Board, Interim Chief Executive Officer, and Director (Principal Executive Officer) | March 16, 2018 | ||
Charles K. Thompson | ||||
/s/ EDWARD A. LANG | Executive Vice President and Chief Financial Officer (Principal Financial Officer) | March 16, 2018 | ||
Edward A. Lang | ||||
/s/ STACY W. HILGENDORF | Vice President, Corporate Controller (Principal Accounting Officer) | March 16, 2018 | ||
Stacy W. Hilgendorf | ||||
/s/ JOHN B. GRIGGS | Director | March 16, 2018 | ||
John B. Griggs | ||||
/s/ MICHAEL Y. MCGOVERN | Director | March 16, 2018 | ||
Michael Y. McGovern | ||||
57
INDEX TO FINANCIAL STATEMENTS
NUVERRA ENVIRONMENTAL SOLUTIONS, INC. AND SUBSIDIARIES
The following financial statements of the Company and its subsidiaries required to be included in Item 15(a)(1) of Form 10-K are listed below:
Page | ||
Audited Consolidated Financial Statements: | ||
Supplementary Financial Data:
The supplementary financial data of the Registrant and its subsidiaries required to be included in Item 15(a)(2) of Form 10-K have been omitted as not applicable or because the required information is included in the Consolidated Financial Statements or in the notes thereto.
58
Report of Independent Registered Public Accounting Firm
To the Shareholders and the Board of Directors of
Nuverra Environmental Solutions, Inc.
Opinion on the Financial Statements
We have audited the accompanying consolidated balance sheet of Nuverra Environmental Solutions, Inc. (the “Company”) as of December 31, 2017 (Successor), the related consolidated statements of operations, changes in shareholders’ equity and cash flows for the period from August 1, 2017 through December 31, 2017 (Successor), and the period from January 1, 2017 through July 31, 2017 (Predecessor), and the related notes (collectively referred to as the “consolidated financial statements”). In our opinion, the consolidated financial statements present fairly, in all material respects, the consolidated financial position of the Company as of December 31, 2017 (Successor), and the consolidated results of its operations and its cash flows for the period from August 1, 2017 through December 31, 2017 (Successor), and the period from January 1, 2017 through July 31, 2017 (Predecessor), in conformity with accounting principles generally accepted in the United States of America.
Basis of Presentation
As discussed in Note 2 to the consolidated financial statements, on July 25, 2017, the United States Bankruptcy Court for the District of Delaware entered an order confirming the plan for reorganization, which became effective on August 7, 2017. Accordingly, the accompanying consolidated financial statements have been prepared in conformity with Accounting Standards Codification Topic 852, Reorganizations, for the Successor as a new entity with assets, liabilities and a capital structure having carrying amounts not comparable with prior periods (Predecessor) as described in Note 2.
Basis for Opinion
These consolidated financial statements are the responsibility of the Company’s management. Our responsibility is to express an opinion on the Company’s consolidated financial statements based on our audit. We are a public accounting firm registered with the Public Company Accounting Oversight Board (United States) (“PCAOB”) and are required to be independent with respect to the Company in accordance with the U.S. federal securities laws and the applicable rules and regulations of the Securities and Exchange Commission and the PCAOB.
We conducted our audit in accordance with the standards of the PCAOB. Those standards require that we plan and perform the audit to obtain reasonable assurance about whether the consolidated financial statements are free of material misstatement, whether due to error or fraud. The Company is not required to have, nor were we engaged to perform, an audit of its internal control over financial reporting. As part of our audit we are required to obtain an understanding of internal control over financial reporting but not for the purpose of expressing an opinion on the effectiveness of the Company’s internal control over financial reporting. Accordingly, we express no such opinion.
Our audit included performing procedures to assess the risks of material misstatement of the consolidated financial statements, whether due to error or fraud, and performing procedures to respond to those risks. Such procedures included examining, on a test basis, evidence regarding the amounts and disclosures in the consolidated financial statements. Our audit also included evaluating the accounting principles used and significant estimates made by management, as well as evaluating the overall presentation of the consolidated financial statements. We believe that our audit provides a reasonable basis for our opinion.
/s/ Moss Adams LLP
Denver, Colorado
March 16, 2018
We have served as the Company’s auditor since 2017.
59
Report of Independent Registered Public Accounting Firm
To the Board of Directors and Stockholders
Nuverra Environmental Solutions, Inc.
We have audited the accompanying consolidated balance sheet of Nuverra Environmental Solutions, Inc. and subsidiaries (collectively, the “Company”) as of December 31, 2016, and the related consolidated statements of operations, changes in equity and cash flows for the year then ended. These financial statements are the responsibility of the Company’s management. Our responsibility is to express an opinion on these financial statements based on our audit.
We conducted our audit in accordance with the standards of the Public Company Accounting Oversight Board (United States). Those standards require that we plan and perform the audit to obtain reasonable assurance about whether the financial statements are free of material misstatement. The Company is not required to have, nor were we engaged to perform, an audit of its internal control over financial reporting. Our audits included consideration of internal control over financial reporting as a basis for designing audit procedures that are appropriate in the circumstances, but not for the purpose of expressing an opinion on the effectiveness of the Company’s internal control over financial reporting. Accordingly, we express no such opinion. An audit also includes examining, on a test basis, evidence supporting the amounts and disclosures in the financial statements, assessing the accounting principles used and significant estimates made by management, as well as evaluating the overall financial statement presentation. We believe that our audit provides a reasonable basis for our opinion.
In our opinion, the consolidated financial statements referred to above present fairly, in all material respects, the financial position of Nuverra Environmental Solutions, Inc. and subsidiaries as of December 31, 2016, and the results of their operations and their cash flows for the year then ended in conformity with U.S. generally accepted accounting principles.
The accompanying financial statements have been prepared assuming that the Company will continue as a going concern. As discussed in Note 2 to the consolidated financial statements, the Company has incurred recurring losses from operations and has limited cash resources, which raises substantial doubt about the Company’s ability to continue as a going concern. Management’s plans in regard to these matters also are described in Note 2. The consolidated financial statements do not include any adjustments that might result from the outcome of this uncertainty.
/s/ Hein & Associates LLP
Denver, Colorado
April 14, 2017
60
Report of Independent Registered Public Accounting Firm
The Board of Directors and Stockholders
Nuverra Environmental Solutions, Inc.:
We have audited the accompanying consolidated statements of operations, changes in equity, and cash flows of Nuverra Environmental Solutions, Inc. and subsidiaries (the Company) for the year ended December 31, 2015. These consolidated financial statements are the responsibility of the Company’s management. Our responsibility is to express an opinion on these consolidated financial statements based on our audit.
We conducted our audit in accordance with the standards of the Public Company Accounting Oversight Board (United States). Those standards require that we plan and perform the audit to obtain reasonable assurance about whether the financial statements are free of material misstatement. An audit includes examining, on a test basis, evidence supporting the amounts and disclosures in the financial statements. An audit also includes assessing the accounting principles used and significant estimates made by management, as well as evaluating the overall financial statement presentation. We believe that our audit provides a reasonable basis for our opinion.
In our opinion, the consolidated financial statements referred to above present fairly, in all material respects, the results of operations and the cash flows of Nuverra Environmental Solutions, Inc. and subsidiaries for the year ended December 31, 2015, in conformity with U.S. generally accepted accounting principles.
The accompanying consolidated financial statements have been prepared assuming that the Company will continue as a going concern. As discussed in note 2 to the consolidated financial statements, the Company has incurred recurring losses from operations and has limited cash resources, which raise substantial doubt about its ability to continue as a going concern. Management’s plans in regard to these matters are also described in note 2. The consolidated financial statements do not include any adjustments that might result from the outcome of this uncertainty.
/s/ KPMG LLP
Phoenix, Arizona
March 11, 2016
61
NUVERRA ENVIRONMENTAL SOLUTIONS, INC. AND SUBSIDIARIES
CONSOLIDATED BALANCE SHEETS
(In thousands)
Successor | Predecessor | ||||||
December 31, | December 31, | ||||||
2017 | 2016 | ||||||
Assets | |||||||
Cash and cash equivalents | $ | 5,488 | $ | 994 | |||
Restricted cash | 1,296 | 1,420 | |||||
Accounts receivable, net | 30,965 | 23,795 | |||||
Inventories | 4,089 | 2,464 | |||||
Prepaid expenses and other receivables | 8,594 | 3,516 | |||||
Other current assets | 226 | 107 | |||||
Assets held for sale | 2,765 | 1,182 | |||||
Total current assets | 53,423 | 33,478 | |||||
Property, plant and equipment, net | 229,874 | 294,179 | |||||
Equity investments | 48 | 73 | |||||
Intangibles, net | 547 | 14,310 | |||||
Goodwill | 27,139 | — | |||||
Deferred income taxes | 84 | — | |||||
Other assets | 207 | 564 | |||||
Total assets | $ | 311,322 | $ | 342,604 | |||
Liabilities and Shareholders’ Equity (Deficit) | |||||||
Accounts payable | $ | 7,946 | $ | 4,047 | |||
Accrued liabilities | 13,939 | 18,787 | |||||
Current contingent consideration | 500 | — | |||||
Current portion of long-term debt | 5,525 | 465,835 | |||||
Derivative warrant liability | 477 | 4,298 | |||||
Total current liabilities | 28,387 | 492,967 | |||||
Deferred income taxes | — | 495 | |||||
Long-term debt | 33,524 | 5,956 | |||||
Long-term contingent consideration | — | 8,500 | |||||
Other long-term liabilities | 6,438 | 3,752 | |||||
Total liabilities | 68,349 | 511,670 | |||||
Commitments and contingencies | |||||||
Predecessor Preferred stock $0.001 par value (1,000 shares authorized, no shares issued and outstanding at December 31, 2016) | — | — | |||||
Predecessor Common stock, $0.001 par value (350,000 shares authorized, 152,433 shares issued and 150,919 outstanding at December 31, 2016) | — | 152 | |||||
Successor Preferred stock $0.01 par value (1,000 shares authorized, no shares issued and outstanding at December 31, 2017) | — | — | |||||
Successor Common stock, $0.01 par value (75,000 shares authorized, 11,696 issued and outstanding at December 31, 2017) | 117 | — | |||||
Additional paid-in capital | 290,751 | 1,407,867 | |||||
Treasury stock, at cost (1,514 shares at December 31, 2016) | — | (19,807 | ) | ||||
Accumulated deficit | (47,895 | ) | (1,557,278 | ) | |||
Total shareholders’ equity (deficit) | 242,973 | (169,066 | ) | ||||
Total liabilities and shareholders’ equity (deficit) | $ | 311,322 | $ | 342,604 | |||
The accompanying notes are an integral part of these statements.
62
NUVERRA ENVIRONMENTAL SOLUTIONS, INC. AND SUBSIDIARIES
CONSOLIDATED STATEMENTS OF OPERATIONS
(In thousands, except per share amounts)
Successor | Predecessor | |||||||||||||||
Five Months Ended December 31, | Seven Months Ended July 31, | Years Ended December 31, | ||||||||||||||
2017 | 2017 | 2016 | 2015 | |||||||||||||
Revenue: | ||||||||||||||||
Service revenue | $ | 72,395 | $ | 86,564 | $ | 139,886 | $ | 327,655 | ||||||||
Rental revenue | 7,793 | 9,319 | 12,290 | 29,044 | ||||||||||||
Total revenue | 80,188 | 95,883 | 152,176 | 356,699 | ||||||||||||
Costs and expenses: | ||||||||||||||||
Direct operating expenses | 67,077 | 81,010 | 129,624 | 279,881 | ||||||||||||
General and administrative expenses | 10,615 | 22,552 | 37,013 | 39,327 | ||||||||||||
Depreciation and amortization | 38,551 | 28,981 | 60,763 | 70,511 | ||||||||||||
Impairment of long-lived assets | 4,904 | — | 42,164 | — | ||||||||||||
Impairment of goodwill | — | — | — | 104,721 | ||||||||||||
Other, net | — | — | — | 7,098 | ||||||||||||
Total costs and expenses | 121,147 | 132,543 | 269,564 | 501,538 | ||||||||||||
Loss from operations | (40,959 | ) | (36,660 | ) | (117,388 | ) | (144,839 | ) | ||||||||
Interest expense, net | (2,187 | ) | (22,792 | ) | (54,530 | ) | (49,194 | ) | ||||||||
Other income, net | 411 | 4,247 | 5,778 | 894 | ||||||||||||
Loss on extinguishment of debt | — | — | (674 | ) | (2,145 | ) | ||||||||||
Reorganization items, net | (5,507 | ) | 223,494 | — | — | |||||||||||
(Loss) income from continuing operations before income taxes | (48,242 | ) | 168,289 | (166,814 | ) | (195,284 | ) | |||||||||
Income tax benefit (expense) | 347 | 322 | (807 | ) | 117 | |||||||||||
(Loss) income from continuing operations | (47,895 | ) | 168,611 | (167,621 | ) | (195,167 | ) | |||||||||
Loss from discontinued operations, net of income taxes | — | — | (1,235 | ) | (287 | ) | ||||||||||
Net (loss) income | $ | (47,895 | ) | $ | 168,611 | $ | (168,856 | ) | $ | (195,454 | ) | |||||
Earnings per common share: | ||||||||||||||||
Basic (loss) income from continuing operations | $ | (4.09 | ) | $ | 1.12 | $ | (1.84 | ) | $ | (7.05 | ) | |||||
Basic loss from discontinued operations | — | — | (0.01 | ) | (0.01 | ) | ||||||||||
Net (loss) income per basic common share | $ | (4.09 | ) | $ | 1.12 | $ | (1.85 | ) | $ | (7.06 | ) | |||||
Diluted (loss) income from continuing operations | $ | (4.09 | ) | $ | 0.97 | $ | (1.84 | ) | $ | (7.05 | ) | |||||
Diluted loss from discontinued operations | — | — | (0.01 | ) | (0.01 | ) | ||||||||||
Net (loss) income per diluted common share | $ | (4.09 | ) | $ | 0.97 | $ | (1.85 | ) | $ | (7.06 | ) | |||||
Weighted average shares outstanding: | ||||||||||||||||
Basic | 11,696 | 150,940 | 90,979 | 27,681 | ||||||||||||
Diluted | 11,696 | 174,304 | 90,979 | 27,681 | ||||||||||||
The accompanying notes are an integral part of these statements.
63
NUVERRA ENVIRONMENTAL SOLUTIONS, INC. AND SUBSIDIARIES
CONSOLIDATED STATEMENTS OF CHANGES IN SHAREHOLDERS’ EQUITY
(In thousands)
Total | Common Stock | Additional Paid-In Capital | Treasury Stock | Accumulated Deficit | ||||||||||||||||||||||||
Shares | Amount | Shares | Amount | |||||||||||||||||||||||||
Balance at December 31, 2014 (Predecessor) | $ | 152,947 | 28,937 | $ | 29 | $ | 1,365,537 | (1,449 | ) | $ | (19,651 | ) | $ | (1,192,968 | ) | |||||||||||||
Stock-based compensation | 2,321 | — | — | 2,321 | — | $ | — | $ | — | |||||||||||||||||||
Issuance of common stock to employees | (13 | ) | 157 | — | (13 | ) | — | — | — | |||||||||||||||||||
Treasury stock acquired through surrender of shares for tax withholding | (149 | ) | — | — | — | (40 | ) | (149 | ) | — | ||||||||||||||||||
401(k) match issued | 2,002 | 508 | 1 | 2,001 | — | — | — | |||||||||||||||||||||
ESPP distribution | 75 | 22 | — | 75 | — | — | — | |||||||||||||||||||||
Net loss | (195,454 | ) | — | — | — | — | — | (195,454 | ) | |||||||||||||||||||
Balance at December 31, 2015 (Predecessor) | $ | (38,271 | ) | 29,624 | $ | 30 | $ | 1,369,921 | (1,489 | ) | $ | (19,800 | ) | $ | (1,388,422 | ) | ||||||||||||
Stock-based compensation | 1,125 | — | — | 1,125 | — | $ | — | $ | — | |||||||||||||||||||
Issuance of common stock to employees | — | 309 | — | — | — | — | — | |||||||||||||||||||||
Issuance of common stock for debt converted to equity | 31,697 | 101,072 | 101 | 31,596 | — | — | — | |||||||||||||||||||||
Issuance of common stock for warrants exercised | 229 | 1,070 | 1 | 228 | — | — | — | |||||||||||||||||||||
Issuance of common stock for rights offering | 5,000 | 20,312 | 20 | 4,980 | — | — | — | |||||||||||||||||||||
Treasury stock acquired through surrender of shares for tax withholding | (7 | ) | — | — | — | (25 | ) | (7 | ) | — | ||||||||||||||||||
ESPP distribution | 17 | 46 | — | 17 | — | — | — | |||||||||||||||||||||
Net loss | (168,856 | ) | — | — | — | — | — | (168,856 | ) | |||||||||||||||||||
Balance at December 31, 2016 (Predecessor) | $ | (169,066 | ) | 152,433 | $ | 152 | $ | 1,407,867 | (1,514 | ) | $ | (19,807 | ) | $ | (1,557,278 | ) | ||||||||||||
Stock-based compensation | 457 | — | — | 457 | — | $ | — | $ | — | |||||||||||||||||||
Issuance of common stock to employees | — | 32 | — | — | — | — | — | |||||||||||||||||||||
Issuance of common stock for warrants exercised | — | 15 | — | — | — | — | — | |||||||||||||||||||||
Treasury stock acquired through surrender of shares for tax withholding | (2 | ) | — | — | — | (12 | ) | (2 | ) | — | ||||||||||||||||||
Net income | 168,611 | — | — | — | — | — | 168,611 | |||||||||||||||||||||
Balance at July 31, 2017 (Predecessor) | — | 152,480 | 152 | 1,408,324 | (1,526 | ) | (19,809 | ) | (1,388,667 | ) | ||||||||||||||||||
Implementation of Plan and Application of Fresh Start Accounting: | ||||||||||||||||||||||||||||
Cancellation of Predecessor Equity | — | (152,480 | ) | (152 | ) | (1,408,324 | ) | 1,526 | 19,809 | 1,388,667 | ||||||||||||||||||
Issuance of Successor common stock and warrants | 290,191 | 11,696 | 117 | 290,074 | — | — | — | |||||||||||||||||||||
Balance at August 1, 2017 (Successor) | $ | 290,191 | $ | 11,696 | $ | 117 | $ | 290,074 | $ | — | $ | — | $ | — | ||||||||||||||
Stock-based compensation | 677 | — | — | 677 | — | — | — | |||||||||||||||||||||
Net loss | (47,895 | ) | — | — | — | — | — | (47,895 | ) | |||||||||||||||||||
Balance at December 31, 2017 (Successor) | $ | 242,973 | 11,696 | $ | 117 | $ | 290,751 | — | $ | — | $ | (47,895 | ) | |||||||||||||||
The accompanying notes are an integral part of these consolidated financial statements.
64
NUVERRA ENVIRONMENTAL SOLUTIONS, INC. AND SUBSIDIARIES
CONSOLIDATED STATEMENTS OF CASH FLOWS
(In thousands)
Successor | Predecessor | |||||||||||||||
Five Months Ended | Seven Months Ended | Years Ended | ||||||||||||||
December 31, | July 31, | December 31, | ||||||||||||||
2017 | 2017 | 2016 | 2015 | |||||||||||||
Cash flows from operating activities: | ||||||||||||||||
Net (loss) income | $ | (47,895 | ) | $ | 168,611 | $ | (168,856 | ) | $ | (195,454 | ) | |||||
Adjustments to reconcile net (loss) income to net cash (used in) provided by operating activities: | ||||||||||||||||
Income from discontinued operations, net of income taxes | — | — | — | (906 | ) | |||||||||||
Loss on the sale of TFI | — | — | 1,235 | 1,534 | ||||||||||||
Depreciation and amortization of intangible assets | 38,551 | 28,981 | 60,763 | 70,511 | ||||||||||||
Amortization of debt issuance costs, net | — | 2,135 | 6,165 | 4,800 | ||||||||||||
Accrued interest added to debt principal | 473 | 11,474 | 26,684 | — | ||||||||||||
Stock-based compensation | 677 | 457 | 1,125 | 2,321 | ||||||||||||
Impairment of long-lived assets | 4,904 | — | 42,164 | 5,921 | ||||||||||||
Impairment of goodwill | — | — | — | 104,721 | ||||||||||||
Gain on sale of UGSI | (76 | ) | — | (1,747 | ) | — | ||||||||||
Loss (gain) on disposal of property, plant and equipment | 5,695 | (258 | ) | 3,512 | (321 | ) | ||||||||||
Bad debt expense (recoveries) | 91 | 788 | (283 | ) | (1,110 | ) | ||||||||||
Change in fair value of derivative warrant liability | (239 | ) | (4,025 | ) | (3,311 | ) | — | |||||||||
Loss on extinguishment of debt | — | — | 674 | 2,145 | ||||||||||||
Deferred income taxes | (242 | ) | (337 | ) | 225 | (1 | ) | |||||||||
Other, net | 4,503 | (11,295 | ) | 560 | (456 | ) | ||||||||||
Reorganization items, non-cash | — | (218,600 | ) | — | — | |||||||||||
Changes in operating assets and liabilities: | ||||||||||||||||
Accounts receivable | (3,521 | ) | (4,528 | ) | 18,676 | 67,735 | ||||||||||
Prepaid expenses and other receivables | (312 | ) | 472 | (285 | ) | 543 | ||||||||||
Accounts payable and accrued liabilities | (5,034 | ) | 3,682 | (13,507 | ) | (17,059 | ) | |||||||||
Other assets and liabilities, net | (4,036 | ) | 3,494 | (45 | ) | 4,903 | ||||||||||
Net cash (used in) provided by operating activities from continuing operations | (6,461 | ) | (18,949 | ) | (26,251 | ) | 49,827 | |||||||||
Net cash used in operating activities from discontinued operations | — | — | — | (708 | ) | |||||||||||
Net cash (used in) provided by operating activities | (6,461 | ) | (18,949 | ) | (26,251 | ) | 49,119 | |||||||||
Cash flows from investing activities: | ||||||||||||||||
Proceeds from the sale of TFI | — | — | — | 78,897 | ||||||||||||
Proceeds from the sale of property, plant and equipment | 4,034 | 3,083 | 10,696 | 12,732 | ||||||||||||
Purchases of property, plant and equipment | (2,231 | ) | (3,149 | ) | (3,826 | ) | (19,201 | ) | ||||||||
Proceeds from the sale of UGSI | 76 | — | 5,032 | — | ||||||||||||
Change in restricted cash | 6,509 | (6,385 | ) | 2,830 | (4,250 | ) | ||||||||||
Net cash provided by (used in) investing activities from continuing operations | 8,388 | (6,451 | ) | 14,732 | 68,178 | |||||||||||
Net cash used in investing activities from discontinued operations | — | — | — | (181 | ) | |||||||||||
Net cash provided by (used in) investing activities | 8,388 | (6,451 | ) | 14,732 | 67,997 | |||||||||||
65
Successor | Predecessor | |||||||||||||||
Five Months Ended | Seven Months Ended | Years Ended | ||||||||||||||
December 31, | July 31, | December 31, | ||||||||||||||
2017 | 2017 | 2016 | 2015 | |||||||||||||
Cash flows from financing activities: | ||||||||||||||||
Proceeds from Predecessor revolving credit facility | — | 106,785 | 154,514 | — | ||||||||||||
Payments on Predecessor revolving credit facility | — | (129,964 | ) | (233,667 | ) | (81,647 | ) | |||||||||
Proceeds from Predecessor term loan | — | 15,700 | 55,000 | — | ||||||||||||
Proceeds from debtor in possession term loan | — | 6,875 | — | — | ||||||||||||
Proceeds from Successor First and Second Lien Term Loans | — | 36,053 | — | — | ||||||||||||
Payments on Successor First and Second Lien Term Loans | (1,241 | ) | — | — | — | |||||||||||
Proceeds from Successor revolving facility | 79,464 | — | — | |||||||||||||
Payments on Successor revolving facility | (79,464 | ) | — | — | — | |||||||||||
Payments for debt issuance costs | — | (1,053 | ) | (1,029 | ) | (225 | ) | |||||||||
Issuance of stock | — | — | 5,000 | — | ||||||||||||
Payments on vehicle financing and other financing activities | (2,391 | ) | (2,797 | ) | (6,614 | ) | (11,246 | ) | ||||||||
Net cash (used in) provided by financing activities from continuing operations | (3,632 | ) | 31,599 | (26,796 | ) | (93,118 | ) | |||||||||
Net cash used in financing activities from discontinued operations | — | — | — | (105 | ) | |||||||||||
Net cash (used in) provided by financing activities | (3,632 | ) | 31,599 | (26,796 | ) | (93,223 | ) | |||||||||
Net (decrease) increase in cash and cash equivalents | (1,705 | ) | 6,199 | (38,315 | ) | 23,893 | ||||||||||
Cash and cash equivalents - beginning of period | 7,193 | 994 | 39,309 | 15,416 | ||||||||||||
Cash and cash equivalents - end of period | 5,488 | 7,193 | 994 | 39,309 | ||||||||||||
Less: cash and cash equivalents of discontinued operations - end of year | — | — | — | — | ||||||||||||
Cash and cash equivalents of continuing operations - end of year | $ | 5,488 | $ | 7,193 | $ | 994 | $ | 39,309 | ||||||||
Supplemental disclosure of cash flow information: | ||||||||||||||||
Cash paid for interest | $ | 1,003 | $ | 1,912 | $ | 25,154 | $ | 43,382 | ||||||||
Cash (refunded) paid for taxes, net | (324 | ) | 193 | 610 | 323 | |||||||||||
Conversion of debt to equity | — | — | 31,697 | — | ||||||||||||
Common stock issued for 401(k) match | — | — | — | 2,001 | ||||||||||||
Purchases of property, plant and equipment under capital leases | — | — | — | 2,890 | ||||||||||||
Property, plant and equipment purchases in accounts payable | 754 | 218 | 252 | 1,203 | ||||||||||||
Conversion of accrued interest on principal debt balance | 474 | 11,474 | 26,684 | 416 | ||||||||||||
Deferred financing costs financed through principal debt balance | — | 1,570 | 3,220 | — | ||||||||||||
Deferred financing costs in accounts payable and accrued liabilities | — | — | — | 86 | ||||||||||||
The accompanying notes are an integral part of these statements.
66
NUVERRA ENVIRONMENTAL SOLUTIONS, INC. AND SUBSIDIARIES
NOTES TO THE CONSOLIDATED FINANCIAL STATEMENTS
Note 1 - Organization and Nature of Business Operations
Description of Business
Nuverra Environmental Solutions, Inc., a Delaware Corporation, together with its subsidiaries (collectively, “Nuverra”, the “Company”, “we”, “us” or “our”) provides comprehensive, full-cycle environmental solutions to customers focused on the development and ongoing production of oil and natural gas from shale formations in the United States. We provide one-stop, total environmental solutions and wellsite logistics management, including delivery, collection, treatment and disposal of solid and liquid materials that are used in and generated by the drilling, completion, and ongoing production of shale oil and natural gas.
We operate in shale basins where customer exploration and production (“E&P”) activities are predominantly focused on shale oil and natural gas as follows:
• | Oil shale areas: includes our operations in the Bakken and Eagle Ford Shale areas. |
• | Natural gas shale areas: includes our operations in the Marcellus, Utica, and Haynesville Shale areas. |
We support our customers’ demand for diverse, comprehensive and regulatory compliant environmental solutions required for the safe and efficient drilling, completion and production of oil and natural gas from shale formations.
Our service offering focuses on providing comprehensive environmental and logistics management solutions within three primary groups:
• | Logistics and Wellsite Services: Delivery of freshwater to wellsites, freshwater procurement and transfer services, staging and storage of equipment and materials, rental of wellsite equipment, and construction services including wellpads. |
• | Water Midstream: Collection and transportation of produced water from wellsites to disposal network via trucking or a fixed pipeline system, supplying freshwater for drilling and completion via pipeline system, gathering systems for collection and transportation of flowback and produced water to disposal wells. |
• | Disposal Wells and Landfill: Liquid waste water from hydraulic fracturing operations, liquid waste water from well production, and solid drilling waste. |
We utilize a broad array of assets to meet our customers’ logistics and environmental management needs. Our logistics assets include trucks and trailers, temporary and permanent pipelines, temporary and permanent storage facilities, ancillary rental equipment, treatment facilities, and liquid and solid waste disposal sites. We continue to expand our suite of solutions to customers who demand safety, environmental compliance and accountability from their service providers.
Our business is divided into three operating divisions, which we consider to be operating and reportable segments of our continuing operations: (1) the Northeast division comprising the Marcellus and Utica Shale areas, (2) the Southern division comprising the Haynesville and Eagle Ford Shale areas and (3) the Rocky Mountain division comprising the Bakken Shale area. Corporate/Other includes certain corporate costs and losses from discontinued operations, as well as certain other corporate assets.
Note 2 - Basis of Presentation
The accompanying audited consolidated financial statements have been prepared in accordance with the rules and regulations of the SEC. In our opinion, the consolidated financial statements include the normal, recurring adjustments necessary for a fair statement of the information required to be set forth herein.
All dollar and share amounts in the footnote tabular presentations are in thousands, except per share amounts and unless otherwise noted.
Unless stated otherwise, any reference to balance sheet, income statement, statement of operations and cash flow items in these accompanying audited consolidated financial statements refers to results from continuing operations. We have not included a statement of comprehensive income as there were no transactions to report in the 2017, 2016, or 2015 periods presented. The business comprising what was previously called the industrial solutions division is presented as discontinued operations in our
67
consolidated financial statements for the years ended December 31, 2017, 2016, and 2015. See Note 23 for additional information.
Principles of Consolidation
Our consolidated financial statements include the accounts of Nuverra and our subsidiaries. All intercompany accounts, transactions and profits are eliminated in consolidation.
On May 1, 2017, the Company and certain of its material subsidiaries (collectively with the Company, the “Nuverra Parties”) filed voluntary petitions under chapter 11 of the United States Bankruptcy Code (the “Bankruptcy Code”) in the United States Bankruptcy Court for the District of Delaware (the “Bankruptcy Court”) to pursue prepackaged plans of reorganization (together, and as amended, the “Plan”). On July 25, 2017, the Bankruptcy Court entered an order (the “Confirmation Order”) confirming the Plan. The Plan became effective on August 7, 2017 (the “Effective Date”), when all remaining conditions to the effectiveness of the Plan were satisfied or waived. Although the Nuverra Parties emerged from bankruptcy on the Effective Date, the bankruptcy cases will remain pending until closed by the Bankruptcy Court. See Note 4 on “Emergence from Chapter 11 Reorganization” for additional details.
Upon emergence, we elected to apply fresh start accounting effective July 31, 2017, to coincide with the timing of our normal accounting period close. Refer to Note 5 on “Fresh Start Accounting” for additional information on the selection of this date. As a result of the application of fresh start accounting, as well as the effects of the implementation of the Plan, a new entity for financial reporting purposes was created, and as such, the condensed consolidated financial statements on or after August 1, 2017, are not comparable with the condensed consolidated financial statements prior to that date.
References to “Successor” or “Successor Company” refer to the financial position and results of operations of the reorganized Company subsequent to July 31, 2017. References to “Predecessor” or “Predecessor Company” refer to the financial position and results of operations of the Company on and prior to July 31, 2017.
Going concern
Our consolidated financial statements have been prepared assuming that we will continue as a going concern, which contemplates continuity of operations, realization of assets, and liquidation of liabilities in the normal course of business.
Previously, our accumulated deficit, net losses, large outstanding debt balance, and limited liquidity raised substantial doubt about our ability to continue as a going concern within one year from the date the December 31, 2016 and December 31, 2015 financial statements were issued. As a result, the Reports of the Independent Registered Public Accounting Firm dated April 14, 2017 and March 11, 2016 included an explanatory paragraph regarding our ability to continue as a going concern.
Although we had a net loss for the five months ended December 31, 2017, we believe that the successful implementation of the Plan contemplated by our Restructuring, coupled with the exit financing we entered into upon our emergence from the chapter 11 cases, has provided us with sufficient liquidity to support our operations and service our debt obligations, and therefore substantial doubt about our ability to continue as a going concern no longer exists.
Recently Adopted Accounting Pronouncements
We adopted the guidance in Accounting Standard Update (or “ASU”) No. 2016-09, Compensation - Stock Compensation: Improvements to Employee Share-Based Payment Accounting (“ASU 2016-09”) as of January 1, 2017 when it became effective. Under the new standard, income tax benefits and deficiencies are recognized as income tax expense or benefit in the income statement and the tax effects of exercised or vested awards are treated as discrete items in the reporting period in which they occur. Additionally, excess tax benefits are recognized regardless of whether the benefit reduces taxes payable in the current period and are classified along with other income tax cash flows as an operating activity. Upon adopting ASU 2016-09, an entity can make an entity-wide accounting policy election to either estimate the number of awards that are expected to vest or account for forfeitures when they occur. We have selected to make an entity wide accounting policy election to continue to estimate the number of awards that are expected to vest. We have adopted the other provisions of the new guidance on a prospective basis, except when the modified retrospective transition method was specifically required. The adoption of this guidance has not had a significant impact on our condensed consolidated financial statements.
In January 2017, the Financial Accounting Standards Board (or “FASB”) issued ASU No. 2017-04, Intangibles - Goodwill and Other (Topic 350) - Simplifying the Test for Goodwill Impairment, which eliminates the requirement to calculate the implied fair value of goodwill to measure a goodwill impairment charge. Instead, entities will record an impairment charge based on the
68
excess of a reporting unit’s carrying amount over its fair value. We early adopted this ASU in the fourth quarter of 2017 in conjunction with our annual impairment test as of October 1st. Previously our goodwill was tested for impairment annually at September 30th. However, upon emergence we determined that our goodwill will be tested for impairment annually at October 1st and more frequently if events or circumstances lead to a determination that it is more likely than not that the fair value of a reporting unit is less than its carrying amount. The amendments in this ASU were applied on a prospective basis and the adoption did not have a significant impact on the consolidated financial statements.
Note 3 - Significant Accounting Policies
Use of Estimates
Our consolidated financial statements have been prepared in conformity with generally accepted accounting principles in the United States (“GAAP”). The preparation of the financial statements requires management to make estimates and judgments that affect the reported amounts of assets and liabilities and the disclosure of contingencies at the date of the financial statements, as well as the reported amounts of revenues and expenses during the reporting period. Estimates have been prepared using the most current and best available information, however actual results could differ from those estimates.
Cash Equivalents
We consider all highly liquid investments with original maturities of three months or less when purchased to be cash equivalents. We maintain bank accounts in the United States, with a majority of funds considered cash equivalents invested in institutional money market funds. We have not experienced any historical losses in such accounts and believe that the risk of any loss is minimal.
Restricted Cash
On the Effective Date, we entered into a new $45.0 million First Lien Credit Agreement (the “Credit Agreement”) by and among the lenders party thereto (the “Credit Agreement Lenders”), ACF FinCo I, LP, as administrative agent (the “Credit Agreement Agent”), and the Company. Pursuant to the Credit Agreement, the Credit Agreement Lenders agreed to extend to the Company a $30.0 million senior secured revolving credit facility (the “Successor Revolving Facility”) and a $15.0 million senior secured term loan facility (the “Successor First Lien Term Loan”). As our collections on our accounts receivable serve as collateral on the Successor Revolving Facility, all amounts collected are initially recorded to “Restricted cash” on the consolidated balance sheet as these funds are not available for operations until our Credit Agreement Lenders release the funds to us approximately one day later. As such, we expect our restricted cash balance to be anywhere between $0.2 million and $2.0 million at any given time depending upon recent collections. We had a restricted cash balance of $1.3 million as of December 31, 2017.
On March 10, 2016, we entered into an amendment to our guaranty and security agreement related to our Predecessor asset-based lending facility. This amendment implemented a daily cash sweep of our collection lockbox and certain depository accounts, the proceeds of which were required to be applied against the outstanding balance of the Predecessor asset-based lending facility. As a result of the sweep occurring one day in arrears, we had an ending balance of $1.4 million in our collection lockbox and certain depository accounts on December 31, 2016, which was classified as “Restricted cash” on the consolidated balance sheet as this cash was not available for operations and was subsequently swept by the lender on January 1, 2017, and applied against the outstanding balance under the Predecessor asset-based lending facility.
Accounts Receivable
Accounts receivable are recognized and carried at original billed and unbilled amounts less allowances for estimated uncollectible amounts and estimates for potential credits. Inherent in the assessment of these allowances are certain judgments and estimates including, among others, the customer’s willingness or ability to pay, our compliance with customer invoicing requirements, the effect of general economic conditions and the ongoing relationship with the customer. Accounts with outstanding balances longer than the payment terms are considered past due. We write off trade receivables when we determine that they have become uncollectible. Bad debt expense is reflected as a component of “General and administrative expenses” in the consolidated statements of operations.
Unbilled accounts receivable result from revenue earned for services rendered where customer billing is still in progress at the balance sheet date. Such amounts totaled approximately $11.4 million at December 31, 2017.
69
The following table summarizes activity in the allowance for doubtful accounts:
Successor | Predecessor | ||||||||||||||||
Five Months Ended December 31, | Seven Months Ended July 31, | Years Ended December 31, | |||||||||||||||
2017 | 2017 | 2016 | 2015 | ||||||||||||||
Balance at beginning of period | $ | 1,970 | $ | 1,664 | $ | 3,524 | $ | 7,557 | |||||||||
Bad debt expense (recoveries) | 91 | 788 | (283 | ) | (1,110 | ) | |||||||||||
Write-offs, net | (140 | ) | (482 | ) | (1,577 | ) | (2,923 | ) | |||||||||
Balance at end of period | $ | 1,921 | $ | 1,970 | $ | 1,664 | $ | 3,524 | |||||||||
Fair Value of Financial Instruments
Fair value is the price that would be received to sell an asset or paid to transfer a liability in an orderly transaction between market participants at the measurement date. The carrying amounts of our cash equivalents, accounts receivable and accounts payable approximate fair value due to the short-term nature of these instruments. The carrying value of our contingent consideration is adjusted to fair value at the end of each reporting period using a probability-weighted discounted cash flow model. See Note 12 for disclosures on the fair value of our contingent consideration at December 31, 2017 and 2016.
The fair value of our Predecessor asset-based lending facility, Successor Revolving Facility, Predecessor term loan, Successor First Lien Term Loan, Successor second lien term loan, note payable and other debt obligations including capital leases secured by various properties and equipment, bears interest at rates commensurate with market rates and therefore their respective carrying values approximate fair value. Our Predecessor 9.875% Senior Notes due 2018 (the “2018 Notes”) and Predecessor 12.5%/10.0% Senior Secured Second Lien Notes due 2021 (the “2021 Notes”) were carried at cost with their estimated fair values are based on reported trading prices. See Note 11 for disclosures on the fair value of our debt instruments at December 31, 2017.
Property, Plant and Equipment
Property and equipment is recorded at cost. Depreciation is recorded using the straight-line method over the estimated useful lives of the related assets ranging from three to thirty-nine years. Our landfill is depreciated using the units-of-consumption method based on estimated remaining airspace. Leasehold improvements are depreciated over the life of the lease or the life of the asset, whichever is shorter. The range of useful lives for the components of property, plant and equipment are as follows:
Buildings | 15-39 years |
Building and land improvements | 5-20 years |
Pipelines | 10-30 years |
Disposal wells | 3-10 years |
Machinery and equipment | 3-15 years |
Equipment under capital leases | 4-6 years |
Motor vehicles and trailers | 3-11 years |
Rental equipment | 5-15 years |
Office equipment | 3-7 years |
Expenditures for betterments that increase productivity and/or extend the useful life of an asset are capitalized. Maintenance and repair costs are charged to expense as incurred. Upon disposal, the related cost and accumulated depreciation of the assets are removed from their respective accounts, and any gains or losses are included in “Direct operating expenses” in the consolidated statements of operations. Depreciation expense was $66.3 million, $58.2 million, and $67.6 million for the years ended December 31, 2017, 2016 and 2015, respectively, and is characterized as a component of “Depreciation and amortization” in the consolidated statements of operations.
Debt Issuance Costs
We capitalize costs associated with the issuance of debt and amortize them as additional interest expense over the lives of the respective debt instrument on a straight-line basis, which approximates the effective interest method. Debt issuance costs related to a recognized debt liability are presented in the balance sheet as a direct deduction from the carrying amount of that debt liability, consistent with debt discounts. There were no unamortized debt issuance costs as of December 31, 2017. The unamortized balance of debt issuance costs presented in “Long-term debt” was $9.0 million at December 31, 2016. These debt
70
issuance costs were subsequently written off during the seven months ended July 31, 2017 as part of fresh start accounting which is discussed in further detail in Note 5.
Deferred initial up-front commitment fees paid by a borrower to a lender represent the benefit of being able to access capital over the contractual term, and therefore, meet the definition of an asset. There were no debt issuance costs that met the definition of an asset as of December 31, 2017 and 2016.
Upon the prepayment of related debt, we accelerate the recognition of the unamortized cost, which is included in “Loss on extinguishment of debt” in the consolidated statements of operations. Additionally, when executing amendments to our debt agreements, if the borrowing capacity of the new arrangement is less than the borrowing capacity of the old arrangement, then: (1) any fees paid to the creditor and any third-party costs incurred are associated with the new arrangement (that is deferred and amortized over the term of the new arrangement); and (2) any unamortized debt issuance costs relating to the old arrangement at the time of the change are written off in proportion to the decrease in borrowing capacity of the old arrangement. The portion of the unamortized debt issuance costs written off in such circumstances are included in “Loss on extinguishment of debt” in the consolidated statements of operations. During the years ended December 31, 2016 and 2015, we wrote off debt issuance costs of $0.7 million, and $2.1 million, respectively.
Goodwill
Goodwill represents the excess of the purchase price over the fair value of the net assets of businesses acquired. The application of fresh start accounting upon emergence from chapter 11 resulted in a goodwill balance of $27.1 million as of July 31, 2017. Previously our goodwill was tested for impairment annually at September 30th. However, upon emergence we have determined that our goodwill will be tested for impairment annually at October 1st and more frequently if events or circumstances lead to a determination that it is more likely than not that the fair value of a reporting unit is less than its carrying amount.
The goodwill impairment test involves a two-step process; however, if, after assessing the totality of events or circumstances, an entity determines it is not more likely than not that the fair value of a reporting unit is less than its carrying amount, then performing the two-step impairment test is unnecessary. In the event a determination is made that it is more likely than not that the fair value of a reporting unit is less than its carrying value, the first step of the two-step process must be performed. The first step of the test, used to identify potential impairment, compares the estimated fair value of a reporting unit with its carrying amount, including goodwill. If the fair value of a reporting unit exceeds its carrying amount, goodwill of the reporting unit is not considered to be impaired and the second step of the impairment test is unnecessary. If the carrying amount of a reporting unit exceeds its fair value, the second step of the impairment test must be performed to measure the amount of the impairment loss, if any.
Historically, the second step of the goodwill impairment test compared the implied fair value of reporting unit goodwill with the carrying amount of that goodwill. In January 2017, the FASB issued ASU No. 2017-04, Intangibles - Goodwill and Other (Topic 350) - Simplifying the Test for Goodwill Impairment, which eliminated the requirement to calculate the implied fair value of goodwill to measure a goodwill impairment charge. Instead, entities will record an impairment charge based on the excess of a reporting unit’s carrying amount over its fair value. We early adopted this ASU in the fourth quarter of 2017 in conjunction with our annual impairment test as of October 1st. The amendments in this ASU were applied on a prospective basis and the adoption did not have a significant impact on the consolidated financial statements.
Impairment of Long-Lived Assets and Intangible Assets with Finite Useful Lives
Long-lived assets, such as property, plant and equipment and purchased intangibles subject to amortization, are reviewed for impairment whenever events or changes in circumstances indicate that the carrying amount of such assets may not be recoverable. Recoverability of assets to be held and used is assessed by a comparison of the carrying amount of such assets to the sum of the estimated undiscounted future cash flows expected to be generated by the assets. Cash flow estimates are based upon, among other things, historical results adjusted to reflect the best estimate of future market rates, utilization levels, and operating performance. Estimates of cash flows may differ from actual cash flows due to various factors, including changes in economic conditions or changes in an asset’s operating performance. Long-lived assets are grouped at the basin level for purposes of assessing their recoverability as we concluded that the basin level is the lowest level for which identifiable cash flows are largely independent of the cash flows of the other assets and liabilities. For assets that do not pass the recoverability test, the asset group’s fair value is compared to the carrying amount. If the asset group’s fair value is less than the carrying amount, impairment losses are recorded for the amount by which the carrying amount of such assets exceeds the fair value.
We recorded total impairment charges of $4.9 million for long-lived assets classified as held for sale during the year ended December 31, 2017, which was included in “Impairment of long-lived assets” in the consolidated statement of operations (Note 8). During the year ended December 31, 2016, we recorded total impairment charges for long-lived assets of $42.2 million.
71
These charges were due to the carrying value of assets for certain basins not being recoverable, as well as for assets that were classified as held for sale during 2016 (Note 8). We recorded long-lived asset impairment charges associated with our restructuring of $5.9 million during the year ended December 31, 2015, which was included in “Other, net” in the consolidated statement of operations (Note 8 and Note 9).
Asset Retirement Obligations
We record the fair value of estimated asset retirement obligations associated with tangible long-lived assets in the period incurred. Retirement obligations associated with long-lived assets are those for which there is an obligation for closures and/or site remediation at the end of the assets’ useful lives. These obligations are initially estimated based on discounted cash flow estimates and are accreted to full value over time through charges to interest expense (Note 18). In addition, asset retirement costs are capitalized as part of the related asset’s carrying value and are depreciated on a straight line basis for disposal wells and using a units-of-consumption basis for landfill costs over the assets’ respective useful lives.
Revenue Recognition
We recognize revenues in accordance with Accounting Standards Codification 605 (ASC 605 “Revenue Recognition”) and Staff Accounting Bulletin No 104, and accordingly all of the following criteria must be met for revenues to be recognized: persuasive evidence of an arrangement exists, delivery has occurred or services have been rendered, the price to the buyer is fixed and determinable and collectability is reasonably assured. Revenues are generated upon the performance of contracted services under formal and informal contracts with direct customers. Taxes assessed on sales transactions are presented on a net basis and are not included in revenue.
The majority of our revenues are from the transportation of fresh and saltwater by Company-owned trucks, or through temporary or permanent water transport pipelines to customer sites for use in drilling and hydraulic fracturing activities and from customer sites to remove and dispose of flowback and produced water originating from oil and natural gas wells. Revenues are also generated through fees charged for disposal of oilfield waste in our landfill, disposal of fluids in our disposal wells and from the rental of tanks and other equipment. Certain customers are under contract with us to utilize our saltwater pipeline. Transportation and disposal rates are generally based on a fixed fee per barrel of disposal water or, in certain circumstances, transportation is based on an hourly rate. Revenue is recognized based on the number of barrels transported or disposed of at hourly rates for transportation services, depending on the customer contract. Rates for other services are based on negotiated rates with our customers and revenue is recognized when the services have been performed.
Concentration of Customer Risk
Three of our customers comprised 27%, 29% and 35% of our consolidated revenues for the years ended December 31, 2017, 2016 and 2015 respectively, and 27%, 19% and 31% of our consolidated accounts receivable at December 31, 2017, 2016 and 2015, respectively.
We depend on our customers’ willingness to make operating and capital expenditures to explore, develop and produce oil and natural gas in the United States. These expenditures are generally dependent on current oil and natural gas prices and the industry’s view of future oil and natural gas prices, including the industry’s view of future economic growth and the resulting impact on demand for oil and natural gas. Any decline in oil and natural gas prices could result in reductions in our customers’ operating and capital expenditures. Declines in these expenditures could result in project modifications, delays or cancellations, general business disruptions, delays in, or nonpayment of, amounts owed to us, increased exposure to credit risk and bad debts, and a general reduction in demand for our services. These effects could have a material adverse effect on our financial condition, results of operations and cash flows.
Direct Operating Expenses
Direct operating expenses consists primarily of wages and benefits for employees performing operational activities, fuel expense associated with transportation and logistics activities, and costs to repair and maintain transportation and rental equipment and disposal wells.
Income Taxes
Income taxes are accounted for using the asset and liability method. Under this method, deferred income tax assets and liabilities are recognized for the expected future tax consequences attributable to temporary differences between the financial statement carrying amounts of existing assets and liabilities and their respective tax bases including temporary differences related to assets acquired in business combinations. Deferred tax assets are also recognized for net operating loss, capital loss and tax credit carryforwards. Deferred income tax assets and liabilities are measured using enacted tax rates expected to apply
72
to taxable income in the years in which the related temporary differences are expected to be recovered or settled. The effect on deferred tax assets and liabilities of a change in tax rates is recognized in income in the period that includes the enactment date. A valuation allowance is provided for those deferred tax assets for which realization of the related benefits is not more likely than not.
We measure and record tax contingency accruals in accordance with GAAP which prescribes a threshold for the financial statement recognition and measurement of a tax position taken or expected to be taken in a return. Only positions meeting the “more likely than not” recognition threshold may be recognized or continue to be recognized. A tax position is measured at the largest amount that is greater than 50 percent likely of being realized upon ultimate settlement. Our policy is to recognize interest and penalties accrued on any unrecognized tax benefits as a component of income tax expense.
Share-Based Compensation
Share-based compensation for all share-based payment awards granted is based on the grant-date fair value. Generally, awards of stock options granted to employees vest in equal increments over a three-year service period from the date of grant and awards of restricted stock awards or units vest over a two or three year service period from the date of grant. The grant date fair value of the award is recognized to expense on a straight-line basis over the requisite service period. As of December 31, 2017 there was approximately $4.5 million of unrecognized compensation cost, net of estimated forfeitures, for unvested stock options which are expected to vest over a weighted average period of approximately 2.6 years. See Note 16 for additional information.
Advertising
Advertising costs are expensed as incurred. Advertising expense was approximately $0.4 million, $0.1 million and $0.5 million for the years ended December 31, 2017, 2016 and 2015, respectively.
Recently Issued Accounting Pronouncements - Revenue Recognition
In May 2014, the FASB issued ASU No. 2014-09, Revenue from Contracts with Customers (Topic 606). The amendments in this update will be added to the Account Standards Codification (“ASC”) as ASC 606, Revenue from Contracts with Customers, and replaces the guidance in ASC 605, Revenue Recognition. The new guidance in ASC 606 requires entities to recognize revenue when control of the promised goods or services is transferred to customers at an amount that reflects the consideration to which the entity expects to be entitled to in exchange for those goods and services.
On January 1, 2018, we adopted the guidance in ASC 606 and all the related amendments (the “new revenue standard”) and applied the new revenue standard to all contracts using the modified retrospective method. The impact of the new revenue standard was not material and there was no adjustment required to the opening balance of retained earnings. We expect the impact of the adoption of the new revenue standard to be immaterial to our net income on an ongoing basis.
Under the new standard, our revenues are disaggregated by revenue source which includes the following categories: (i) water transfer services, (ii) disposal services, (iii) other service revenues, and (iv) rental revenues. A description of these revenue sources and how revenue will be recognized under the new revenue standard for these revenue sources is noted below.
Water Transfer Services
The majority of our revenues are from the transportation of fresh water by Company-owned trucks, or through temporary or permanent water transport pipelines to customer sites for use in drilling and hydraulic fracturing activities and from customer sites, or to remove and dispose of flowback and produced salt water originating from oil and natural gas wells. Water transfer rates for trucking are generally based upon a fixed fee per barrel of disposal water, but in certain circumstances may be based upon an hourly rate. Under the new revenue standard, revenue will be recognized once the water has been transferred, or over time, based upon the number of barrels transported or disposed of or at the agreed upon hourly rate, depending upon the customer contract. Contracts for the use of our saltwater pipeline are priced at a fixed fee per disposal barrel transferred. Under the new revenue standard, revenues for the pipeline will be recognized over time from when the water is injected into our pipeline until the transfer is complete. Water transfer services are all generally completed within 24 hours with no remaining performance obligation outstanding at the end of each month.
73
Disposal Services
Revenues for disposal services are generated through fees charged for disposal of oilfield wastes in our landfill and disposal of fluids in our disposal wells. Disposal rates are generally based on a fixed fee per barrel of disposal water, and revenues are recognized once the disposal has occurred. The performance obligation for disposal services is considered complete once the disposal occurs. Therefore, disposal services revenues will be recognized at a point in time under the new revenue standard.
Other Revenues
Other revenues primarily includes revenues from small-scale construction or maintenance projects and the sale of “junk” or “slop” oil obtained through the skimming of disposal water. Under the new revenue standard, revenue for construction and maintenance projects, which generally span approximately two to three months, will be recognized over time under the milestone method which is considered an output method. We believe that this output method is appropriate for our construction business as when we negotiate such contracts we create milestone billings based upon when we anticipate incurring project costs and when we transfer goods and services to our customers. Additionally, since our construction contracts are short term in nature, we believe the contractual milestone dates occur close together over time such that there is no risk that we would not recognize revenue for goods or services transferred to the customer. All construction costs are expensed as incurred. Under the new revenue standard, revenue will be recognized for “junk” or “slop” oil at a point in time once the goods are transferred.
Rental Revenues
We generate rental revenues from the rental of tanks and other equipment. Rental rates are based upon negotiated rates with our customers and revenue is recognized over the rental service period. Revenues from rental equipment are not within the scope of the new revenue standard, but rather are recognized under ASC 840, Leases. When ASC 842, Leases, becomes effective on January 1, 2019, the Company will continue to recognize the revenues from rental equipment under this new standard as a lessor.
Practical Expedients
The new revenue standard requires the transaction price to exclude amounts collected on behalf of third parties. However, the new revenue standard also provides a practical expedient to allow entities to make an accounting policy election to exclude from the measurement of the transaction price all taxes assessed by a governmental authority. Upon implementing the new revenue standard we adopted this practical expedient and will exclude sales and usage-based taxes from the transaction price, rather than making a jurisdiction-by-jurisdiction assessment.
Other Recently Issued Accounting Pronouncements
In February 2016, the FASB issued ASU No. 2016-02, Leases (Topic 842) (“ASU 2016-02”), which requires an entity that is a lessee to recognize the assets and liabilities arising from leases on the balance sheet. This guidance also requires disclosures about the amount, timing and uncertainty of cash flows arising from leases. This guidance is effective for annual reporting periods beginning after December 15, 2018, and interim periods within those annual periods, using a modified retrospective approach. Early adoption of ASU 2016-02 is permitted. While we are currently assessing the impact ASU 2016-02 will have on our consolidated financial statements, we expect the primary impact upon adoption will be the recognition, on a discounted basis, of our minimum commitments under non-cancelable operating leases on our consolidated balance sheets resulting in the recording of right of use assets and lease obligations. Based upon the current effective date, the new guidance would first apply to our reporting period starting January 1, 2019.
In August 2016, the FASB issued ASU No. 2016-15, Statement of Cash Flows (Topic 230): Classification of Certain Cash Receipts and Cash Payments (“ASU 2016-15”) related to the classification of certain cash receipts and cash payments on the statement of cash flows. The pronouncement provides clarification and guidance on eight specific cash flow presentation issues that have developed due to diversity in practice. The issues include, but are not limited to, debt prepayment or extinguishment costs, settlement of zero-coupon debt, proceeds from the settlement of insurance claims, and contingent consideration payments made after a business combination. The pronouncement is effective for fiscal years, and for interim periods within those fiscal years, beginning after December 15, 2017, with early adoption permitted. We plan to adopt this pronouncement for our fiscal year beginning January 1, 2018, and don’t believe that this new guidance will have a significant impact on the consolidated statement of cash flows.
74
In November 2016, the FASB issued ASU No. 2016-18, Statement of Cash Flows (Topic 230): Restricted Cash (“ASU 2016-18”). This guidance requires that a statement of cash flows explain the change during the period in the total of cash, cash equivalents, and restricted cash. As a result, restricted cash will be included with cash and cash equivalents when reconciling the beginning-of-period and end-of-period total amounts shown on the statement of cash flows. The new guidance is effective for fiscal years beginning after December 15, 2017, and interim periods within those fiscal years. Early adoption is permitted, and the new guidance is to be applied retrospectively. The adoption of this guidance is not expected to have a significant impact on our consolidated statement of cash flows, other than the classification of restricted cash within the beginning-of-period and end-of-period totals on the consolidated statement of cash flows, as opposed to being excluded from these totals.
Note 4 - Emergence from Chapter 11 Reorganization
On May 1, 2017, the Nuverra Parties filed voluntary petitions under chapter 11 of the Bankruptcy Code in the Bankruptcy Court to pursue the Plan. On July 25, 2017, the Bankruptcy Court entered the Confirmation Order confirming the Plan. On July 26, 2017, David Hargreaves, an individual holder of our pre-Effective Date 9.875% Senior Notes due 2018 (the “2018 Notes”), appealed the Confirmation Order to the District Court for the District of Delaware (the “District Court”) and filed a motion for a stay pending appeal from the District Court. On August 3, 2017, the District Court entered an order denying the motion for a stay pending appeal. Notwithstanding the denial of the motion for stay pending appeal, Hargreaves’ appeal remains pending in the District Court.
The Nuverra Parties emerged from the bankruptcy proceedings on the Effective Date. Although the Nuverra Parties emerged from bankruptcy on the Effective Date, the bankruptcy cases will remain pending until closed by the Bankruptcy Court.
On the Effective Date, the Company:
• | Adopted a Second Amended and Restated Certificate of Incorporation and Third Amended and Restated Bylaws of the Company; |
• | Appointed three new members to the Company’s Board of Directors to replace the directors of the Company who were deemed to have resigned on the Effective Date; |
• | Entered into the Credit Agreement, pursuant to which the Credit Agreement Lenders agreed to extend the Successor Revolving Facility and the Successor First Lien Term Loan; |
• | Entered into a new $26.8 million Second Lien Term Loan Credit Agreement by and among the lenders party thereto (the “Second Lien Term Loan Lenders”), Wilmington Savings Fund Society, FSB (“Wilmington”), as administrative agent (the “Second Lien Term Loan Agent”), and the Company, pursuant to which the Second Lien Term Loan Lenders extended the Company a $26.8 million second lien term loan facility (the “Successor Second Lien Term Loan”); |
• | Issued 7,900,000 shares of common stock of the reorganized Company to the holders of the Predecessor Company’s 2021 Notes; |
• | Issued 100,000 shares of common stock of the reorganized Company to the Affected Classes (as defined in the Plan); |
• | Issued 3,695,580 shares of common stock of the reorganized Company to holders of Supporting Noteholder Term Loan Claims (as defined in the Plan) and to the Credit Agreement Lenders for the Exit Financing Commitment Fee (as defined in the Plan); |
• | Issued 118,137 warrants to purchase common stock of the reorganized Company, with an exercise price of $39.82 per share and an exercise term expiring seven years from the Effective Date; |
• | Entered into a Registration Rights Agreement with certain holders of the reorganized Company’s common stock party thereto; |
• | Entered into a Warrant Agreement with American Stock Transfer & Trust Company LLC, the Company’s transfer agent; |
• | Paid in full in cash all administrative expense claims, priority tax claims, priority claims, and debtor in possession revolving credit facility claims; |
• | Paid all undisputed, non-contingent customer, vendor, or other obligations not specifically compromised under the Plan; and |
• | Assumed Mark D. Johnsrud’s, the Company’s former Chairman and Chief Executive Officer, Second Amended and Restated Employment Agreement, dated April 28, 2017 and entered into an Amended and Restated Employment Agreement with Joseph M. Crabb, the Company’s Executive Vice President and Chief Legal Officer. |
75
On the Effective Date, all of the following agreements, and all outstanding interests and obligations thereunder, were terminated:
• | Amended and Restated Credit Agreement, as amended through the Fourteenth Amendment thereto, dated as of February 3, 2014, by and among Wells Fargo Bank, National Association (“Wells Fargo”), the lenders named therein, and the Company (the “Predecessor Revolving Facility”); |
• | Term Loan Credit Agreement, as amended through the Ninth Amendment thereto, dated as of April 15, 2016, by and among Wilmington, the lenders named therein, and the Company (the “Predecessor Term Loan”); |
• | Indenture governing the Company’s 2018 Notes, dated April 10, 2012, among the Company, its subsidiaries, and The Bank of New York Mellon, N.A. (the “2018 Notes Indenture”); |
• | Indenture governing the Company’s 2021 Notes, dated April 15, 2016, among the Company, Wilmington, and the guarantors party thereto (the “2021 Notes Indenture”); |
• | Debtor-in-Possession Credit Agreement, dated as of April 30, 2017 and effective as of May 3, 2017, by and among the Company, the lenders party thereto, Wells Fargo, and other agents party thereto (the “DIP Credit Agreement”); and |
• | Debtor-in-Possession Term Loan Credit Agreement, dated as of April 30, 2017, by and among the Company, the lenders party thereto, and Wilmington (the “DIP Term Loan Agreement”). |
In addition, on the Effective Date, pursuant to the Plan, (i) all shares of the Company’s pre-Effective Date common stock and all other previously issued and outstanding equity interests in the Company, and any rights of any holder in respect thereof, were canceled and discharged and (ii) all agreements, instruments, and other documents evidencing, relating to or connected with the Company’s pre-Effective Date common stock and all other previously issued and outstanding equity interests of the Company, and any rights of any holder in respect thereof, were canceled and discharged and of no further force or effect.
As a result of the cancellation of the Company’s pre-Effective Date common stock on the Effective Date, the Company’s pre-Effective Date common stock ceased trading on the OTC Pink Marketplace under the symbol “NESCQ.” On October 12, 2017, the Company’s post-Effective Date common stock was listed and began trading on the NYSE American Stock Exchange under the symbol “NES.” See “Risks Related to our Common Stock” on page 22 of this Annual Report.
The foregoing is a summary of the substantive provisions of the Plan and the transactions related to and contemplated thereunder and is not intended to be a complete description of, or a substitute for, a full and complete reading of, the Plan and the other documents referred to above.
Note 5 - Fresh Start Accounting
In connection with our emergence from chapter 11 on the Effective Date, we applied the provisions of fresh start accounting, pursuant to FASB ASC 852, Reorganizations (“ASC 852”), to our consolidated financial statements. We qualified for fresh start accounting as (i) the holders of existing voting shares of the Predecessor Company received less than 50% of the voting shares of the emerging entity and (ii) the reorganization value of our assets immediately prior to confirmation was less than the post-petition liabilities and allowed claims. ASC 852 requires that fresh start accounting be applied when the Bankruptcy Court enters the Confirmation Order confirming the Plan, or as of a later date when all material conditions precedent to the effectiveness of the Plan are resolved, which for us was August 7, 2017. We elected to apply fresh start accounting effective July 31, 2017, to coincide with the timing of our normal accounting period close. We evaluated the events between July 31, 2017 and August 7, 2017 and concluded that the use of an accounting convenience date of July 31, 2017 did not have a material impact on our results of operations or financial position.
The implementation of the Plan and the application of fresh start accounting materially changed the carrying amounts and classifications reported in our condensed consolidated financial statements and resulted in a new entity for financial reporting purposes. As a result, the financial statements after July 31, 2017 are not comparable with the financial statements on and prior to July 31, 2017.
Fresh start accounting reflects the value of the Successor Company as determined in the confirmed Plan. Under fresh start accounting, asset values are remeasured and allocated based on their respective fair values in conformity with the purchase method of accounting for business combinations in FASB ASC 805, Business Combinations. Liabilities existing as of the Effective Date, other than deferred taxes, were recorded at the present value of amounts expected to be paid using appropriate risk adjusted interest rates. Deferred taxes were determined in conformity with applicable accounting standards. Predecessor accumulated depreciation, accumulated amortization, and accumulated deficit were eliminated. Reorganization value represents the fair value of the Successor Company’s assets before considering liabilities. The excess reorganization value over the fair value of identified tangible and intangible assets is reported as goodwill.
76
Reorganization Value
Under ASC 852, the Successor Company must determine a value to be assigned to the equity of the emerging company as of the date of adoption of fresh start accounting. To facilitate this calculation, we estimated the enterprise value of the Successor Company by relying equally on a discounted cash flow (or “DCF”) analysis under the income approach and the guideline public company method under the market approach. Enterprise value represents the fair value of an entity’s interest-bearing debt and stockholders’ equity.
To estimate enterprise value utilizing the DCF method, we established an estimate of future cash flows for the period ranging from 2017 to 2023 and discounted the estimated future cash flows to present value. The expected cash flows for the period 2017 to 2021 were based on the financial projections and assumptions utilized in the disclosure statement. The expected cash flows for the period 2022 to 2023 were derived from earnings forecasts and assumptions regarding growth and margin projections, as applicable. A terminal value was included based on the cash flow of the final year of the forecast period.
The discount rate of 11.3% was estimated based on an after-tax weighted average cost of capital (or “WACC”) reflecting the rate of return that would be expected by a market participant. The WACC also takes into consideration a company specific risk premium reflecting the risk associated with the overall uncertainty of the financial projections used to estimate future cash flows.
The guideline public company analysis identified a group of comparable companies that have operating and financial characteristics comparable in certain respects to us, including comparable lines of business, business risks and market presence. Under this methodology, certain financial multiples and ratios that measure financial performance and value are calculated for each selected company and then compared to the implied multiples from the DCF analysis. We considered enterprise value as a multiple of each selected company for which there was publicly available earnings before interest, taxes, depreciation and amortization (or “EBITDA”).
In the disclosure statement associated with the Plan, which was confirmed by the Bankruptcy Court, we estimated a range of enterprise values between $270.0 million and $335.0 million, with a midpoint of $302.5 million. We deemed it appropriate to use the midpoint between the low end and high end of the range to determine the final enterprise value of $302.5 million utilized for fresh start accounting.
The estimated enterprise value and the equity value are highly dependent on the achievement of the future financial results contemplated in the projections that were set forth in the Plan. The estimates and assumptions made in the valuation are inherently subject to significant uncertainties. The primary assumptions for which there is a reasonable possibility of occurrence of a variation that would have significantly affected the reorganization value include the assumptions regarding revenue growth, operating expenses, the amount and timing of capital expenditures and the discount rate utilized.
The following table reconciles the enterprise value to the estimated fair value of the Successor common stock, par value of $0.01 per share, as of the Effective Date:
Enterprise value | $ | 302,500 | ||
Plus: Cash and cash equivalents and restricted cash | 14,998 | |||
Plus: Non-operating assets | 14,400 | |||
Fair value of invested capital | 331,898 | |||
Less: Fair value of First and Second Lien Term Loans | (36,053 | ) | ||
Less: Fair value of capital leases | (5,654 | ) | ||
Shareholders’ equity of Successor Company | $ | 290,191 | ||
Shares outstanding of Successor Company | 11,696 | |||
Implied per share value | $ | 24.81 | ||
77
The following table reconciles the enterprise value to the estimated reorganization value as of the Effective Date:
Enterprise value | $ | 302,500 | ||
Plus: Cash and cash equivalents and restricted cash | 14,998 | |||
Plus: Other non-operating assets | 14,400 | |||
Fair value of invested capital | 331,898 | |||
Plus: Current liabilities, excluding current portion of long-term debt | 32,011 | |||
Plus: Non-current liabilities, excluding long-term debt | 6,441 | |||
Reorganization value of Successor Assets | $ | 370,350 | ||
Warrants
Pursuant to the Plan, on the Effective Date, we issued to the holders of the 2018 Notes and holders of certain claims relating to the rejection of executory contracts and unexpired leases 118,137 warrants with an exercise price of $39.82 and a term expiring seven years from the Effective Date. Each warrant is exercisable for one share of our common stock, par value $0.01.
The warrants were recorded as derivative liabilities on the “Derivative warrant liability” line in the condensed consolidated balance sheet. At issuance, the warrants were recorded at fair value, which was computed using a Monte Carlo simulation model (Level 3). Future changes in these factors could have a significant impact on the computed fair value of the derivative warrant liability. As such, we expect future changes in the fair value of the warrants could vary significantly from quarter to quarter. See Note 12 and Note 13 for further discussion on the warrants and the assumptions used to calculate the fair value.
Personal Property
To estimate the fair value of personal property, such as machinery and equipment, we utilized a combination of the cost and market approaches. For assets valued via the cost approach, we applied trend indices from published sources to estimate reproduction cost if the asset was new. We then assigned valuation lives specific to each category of asset based on industry sources and our experience to assess physical and functional depreciation. For the assets valued via the market approach, such as trucks and tanks, we researched market values from published sources and reviewed comparable sales data and sales offers received to estimate fair value.
Real Property
The real property consists of land, buildings, and disposal wells. Real property was valued considering the three generally accepted approaches to value: cost, sales comparison and income capitalization. Due to the special-use nature of most of the real property, we relied on the cost and sales comparison approaches. To estimate the replacement cost if the real property was new and determine the economic life of the improvements, we utilized data provided by a valuation service. Depreciation estimates of the improvements were based on information obtained during physical inspections, discussions with building engineers, and general observations of the improvements’ condition. Land was valued as if it were vacant and available through application of the sales comparison approach. For commercial office properties that have leasing potential, we also utilized the income approach to estimate the values. Comparable rents and listing properties were researched an analyzed and adjusted to estimate market rents with the values derived from direct capitalization analysis.
Intangible Assets
The intangible assets were valued with a combination of the income and cost approach. In order to estimate the fair value of the customer relationships, we determined that the excess earnings method under the income approach was appropriate since the inherent value of this intangible asset lies in its ability to generate current and future income, as well as the fact that identifiable revenue streams could be estimated. We utilized the cost approach to value the other intangibles such the assembled workforce and disposal well permits.
78
Consolidated Statement of Financial Position
The following fresh start condensed consolidated balance sheet presents the implementation of the Plan and adoption of fresh start accounting as of July 31, 2017. The “Reorganization Adjustments” have been recorded within the condensed consolidated balance sheet to reflect the effects of the Plan, including discharge of liabilities subject to compromise. The “Fresh Start Adjustments” reflect the estimated fair value adjustments as a result of the adoption of fresh start accounting.
Predecessor | Reorganization | Fresh Start | Successor | ||||||||||||
Company | Adjustments | Adjustments | Company | ||||||||||||
Assets | |||||||||||||||
Cash and cash equivalents | $ | 2,728 | $ | 4,465 | A | $ | — | $ | 7,193 | ||||||
Restricted cash | 8,011 | (206 | ) | B | — | 7,805 | |||||||||
Accounts receivable, net | 27,535 | — | — | 27,535 | |||||||||||
Inventories | 3,935 | — | — | 3,935 | |||||||||||
Prepaid expenses and other receivables | 3,200 | 282 | C | — | 3,482 | ||||||||||
Other current assets | 924 | (500 | ) | C | — | 424 | |||||||||
Assets held for sale | 631 | 3,913 | D | — | 4,544 | ||||||||||
Total current assets | 46,964 | 7,954 | — | 54,918 | |||||||||||
Property, plant and equipment, net | 265,097 | (8,678 | ) | D | 30,869 | P | 287,288 | ||||||||
Equity investments | 59 | — | — | 59 | |||||||||||
Intangibles, net | 13,093 | (763 | ) | D | (11,723 | ) | Q | 607 | |||||||
Goodwill | — | — | 27,139 | R | 27,139 | ||||||||||
Other assets | 339 | — | — | 339 | |||||||||||
Total assets | $ | 325,552 | $ | (1,487 | ) | $ | 46,285 | $ | 370,350 | ||||||
Liabilities and Shareholders’ Equity (Deficit) | |||||||||||||||
Accounts payable | $ | 6,331 | $ | 1,967 | E | $ | — | $ | 8,298 | ||||||
Accrued liabilities | 30,549 | (12,168 | ) | F | (298 | ) | S | 18,083 | |||||||
Current contingent consideration | — | 1,000 | G | — | 1,000 | ||||||||||
Current portion of long-term debt | 41,007 | (37,665 | ) | H | — | 3,342 | |||||||||
Derivative warrant liability | — | 717 | I | — | 717 | ||||||||||
Other current liabilities | — | 3,913 | J | — | 3,913 | ||||||||||
Total current liabilities | 77,887 | (42,236 | ) | (298 | ) | 35,353 | |||||||||
Deferred income taxes | 472 | — | (314 | ) | T | 158 | |||||||||
Long-term debt | 2,312 | 35,000 | K | 1,053 | 38,365 | ||||||||||
Long-term contingent consideration | — | — | — | — | |||||||||||
Other long-term liabilities | 3,694 | (461 | ) | L | 3,050 | U | 6,283 | ||||||||
Liabilities subject to compromise | 480,595 | (480,595 | ) | M | — | — | |||||||||
Total liabilities | 564,960 | (488,292 | ) | 3,491 | 80,159 | ||||||||||
Commitments and contingencies | |||||||||||||||
Shareholders’ deficit: | |||||||||||||||
Common stock (Successor) | — | 117 | N | — | 117 | ||||||||||
Additional paid-in-capital (Successor) | — | 290,074 | N | — | 290,074 | ||||||||||
Common stock (Predecessor) | 152 | — | (152 | ) | V | — | |||||||||
Additional paid-in capital (Predecessor) | 1,408,324 | — | (1,408,324 | ) | V | — | |||||||||
Treasury stock (Predecessor) | (19,809 | ) | — | 19,809 | V | — | |||||||||
(Accumulated deficit) retained earnings | (1,628,075 | ) | 196,614 | O | 1,431,461 | W | — | ||||||||
Total shareholders’ equity (deficit) | (239,408 | ) | 486,805 | 42,794 | 290,191 | ||||||||||
Total liabilities and shareholders’ equity (deficit) | $ | 325,552 | $ | (1,487 | ) | $ | 46,285 | $ | 370,350 | ||||||
79
Reorganization Adjustments
A. Reflects the cash receipts (payments) from implementation of the Plan:
Receipt of Successor First Lien Term Loan and Successor Second Lien Term Loan Proceeds | $ | 35,000 | ||
Payment of debtor in possession revolving facility, including accrued interest and fees | (30,461 | ) | ||
Payment of debtor in possession term loan interest | (90 | ) | ||
Cash payment in association with settlement of the 2018 Notes | (350 | ) | ||
Release of restricted cash to unrestricted cash | 206 | |||
Refund of professional fees | 160 | |||
Net Cash Receipts | $ | 4,465 | ||
B. Reflects the release of restricted cash to unrestricted cash.
C. Reflects the reclassification of a rental security deposit to prepaid rent (or “Prepaid expenses and other receivables”) from
“Other current assets” in connection with settlement of lease claims. Also included in “Other current assets” is the settlement for the lease rejection damages, see below:
Reclassification of a rental security deposit to prepaid rent | $ | (282 | ) | |
Settlement for the lease rejection damages | (218 | ) | ||
Adjustment to Other current assets | $ | (500 | ) | |
D. As part of the Plan and settlement of claims, the $7.4 million note payable (or “the AWS Note”) that arose in connection with Appalachian Water Services, LLC (“AWS”), was settled in the fourth quarter of fiscal 2017 in exchange for the membership interests in AWS, return of the water treatment facility in the Marcellus Shale area, including all assets related to the operations of the water treatment facility in “as-is, where-is” condition, together with $75,000 for reimbursement of certain costs and deferred maintenance. The adjustments reflect the reclassification of property, plant and equipment exchanged for the release of claims related to the AWS Note from “Property, plant and equipment, net” to “Assets held for sale,” as well as the write-off of intangibles associated with AWS.
Elimination of property, plant and equipment related to AWS settlement | $ | (8,678 | ) | |
Elimination of intangible assets related to AWS settlement | (763 | ) | ||
Recognition of assets held for sale on the AWS settlement | 3,913 | |||
Accrual of cash payment in connection with the AWS settlement (See F) | (75 | ) | ||
Loss on settlement of the AWS note payable | $ | (5,603 | ) | |
E. The reorganization adjustment to “Accounts payable” represents the reinstatement of the pre-petition accounts payable that was previously classified as “Liabilities subject to compromise.”
F. The reorganization adjustment to “Accrued liabilities” are noted in the table below.
Accrual of the $75,000 related to the AWS settlement | $ | 75 | ||
Write-off of short-term deferred rent related to the Scottsdale Headquarters lease | (330 | ) | ||
Write-off of accrued interest related to the 2018 and 2021 Notes | (11,650 | ) | ||
Decrease in accrued interest for DIP Facilities due to cash payment | (263 | ) | ||
Net decrease in Accrued liabilities | $ | (12,168 | ) | |
G. Reflects the contingent consideration due for the Ideal Oilfield Disposal LLC (“Ideal”) settlement. Of the remaining $1.0 million balance due, $0.5 million was paid in August 2017 subsequent to the Effective Date and the other $0.5 million is payable upon delivery of the required permits.
H. Reflects the payment or conversion to equity of the Predecessor Revolving Facility and debtor in possession credit facilities in connection with emergence on the Effective Date.
80
I. Reflects the recognition of the derivative warrant liability for the warrants issued in connection with the Plan. See Note 12 and Note 13 for further discussion on the warrants and the assumptions used to calculate the fair value.
J. Reflects the reclassification of the AWS debt prior to the surrender of the AWS assets classified as “Assets held for sale” pursuant to the Plan.
K. Represents the new Successor First Lien Term Loan and Successor Second Lien Term Loan at fair value, net of debt issuance costs:
Successor First Lien Term Loan at fair value | $ | 15,000 | ||
Successor Second Lien Term Loan at fair value | 21,053 | |||
Debt issuance costs associated with the Successor Second Lien Term Loan | (1,053 | ) | ||
Fair Value of the Successor First Lien Term Loan and Successor Second Lien Term Loan, net of debt issuance costs | $ | 35,000 | ||
L. Reflects the write-off of long-term deferred rent associated with the Scottsdale headquarters lease which was rejected and settled as part of the chapter 11 filing.
M. Liabilities subject to compromise were settled as follows in accordance with the Plan:
Outstanding principal amount of 2018 Notes, net of discounts/premiums and debt issuance costs | $ | (40,020 | ) | |
Outstanding principal amount of 2021 Notes, net of discounts/premiums and debt issuance costs | (347,658 | ) | ||
Outstanding principal amount of Term Loan, net of discounts/premiums and debt issuance costs | (78,264 | ) | ||
Outstanding principal amount on the AWS note payable | (3,913 | ) | ||
Ideal original contingent consideration | (8,500 | ) | ||
Pre-petition accounts payable | (1,967 | ) | ||
Derivative warrant liability | (273 | ) | ||
Balance of Liabilities subject to compromise | $ | (480,595 | ) | |
Reinstatement of pre-petition accounts payable | $ | 1,967 | ||
Reinstatement of a portion of the Ideal contingent consideration pursuant to the settlement agreement | 1,000 | |||
Reinstatement of the AWS note payable pursuant to the settlement agreement | 3,913 | |||
Payment to the 2018 Noteholders pursuant to the Plan | 350 | |||
Write-off of accrued interest related to the 2018 and 2021 Notes | (11,650 | ) | ||
Record the issuance of Successor common equity | 290,191 | |||
Recoveries pursuant to the Plan | $ | 285,771 | ||
Net gain on debt discharge | $ | (194,824 | ) | |
N. Distribution of 11,695,580 Successor shares of common stock at a par value of $0.01 per share:
Record issuance of shares of Successor common stock at par value of $0.01 per share | $ | 117 | ||
Record additional paid-in capital from the issuance of Successor common stock | 290,074 | |||
Fair value of Successor common equity | $ | 290,191 | ||
81
O. Reflects the cumulative impact of the reorganization adjustments on “(Accumulated deficit) retained earnings” discussed above:
Net gain on debt discharge | $ | 194,824 | ||
Loss on settlement of the AWS note payable | (5,603 | ) | ||
Write-off of a portion of the Ideal contingent consideration due to settlement | 7,500 | |||
Settlement of the lease rejection claim associated with the Scottsdale Headquarters lease | (218 | ) | ||
Write-off of the deferred rent associated with the Scottsdale Headquarters lease | 790 | |||
Issuance of warrants to the 2018 Noteholders and other parties pursuant to the Plan | (717 | ) | ||
Refund of professional fees | 160 | |||
Professional fees related to the reorganization under the Plan | (122 | ) | ||
Net retained earnings impact resulting from implementation of the Plan | $ | 196,614 | ||
Fresh Start Adjustments
P. Reflects the increase in net book value of property, plant and equipment to estimated fair value. The following table summarizes the components of property, plant and equipment, net as of July 31, 2017 of the Predecessor Company and the Successor Company:
Successor | Predecessor | |||||||
Land | $ | 10,779 | $ | 11,495 | ||||
Buildings | 29,349 | 27,145 | ||||||
Building, leasehold and land improvements | 8,690 | 10,724 | ||||||
Pipelines | 66,962 | 58,533 | ||||||
Disposal wells | 41,195 | 20,872 | ||||||
Landfill | 4,500 | 20,539 | ||||||
Machinery and equipment | 16,724 | 20,169 | ||||||
Equipment under capital leases | 10,045 | 6,499 | ||||||
Motor vehicles and trailers | 55,333 | 34,069 | ||||||
Rental equipment | 36,748 | 46,300 | ||||||
Office equipment | 3,046 | 1,954 | ||||||
Construction in process | 3,917 | 6,798 | ||||||
Property, plant and equipment, net | $ | 287,288 | $ | 265,097 | ||||
Q. Reflects the reduction in net book value of intangible assets to estimated fair value.
R. The adjustment represents the reorganization value of assets in excess of amounts allocated to identified tangible and intangible assets as follows:
Reorganization value of Successor assets | $ | 370,350 | ||
Less: Fair value of Successor assets (excluding goodwill) | 343,211 | |||
Reorganization value of Successor assets in excess of fair value - Successor Goodwill | $ | 27,139 | ||
The Successor goodwill by segment is $4.9 million for the Rocky Mountain division, $19.5 million for the Northeast division, and $2.7 million for the Southern division. Upon emergence, we have determined that our goodwill will be tested for impairment annually at October 1st and more frequently if events or circumstances lead to a determination that it is more likely than not that the fair value of a reporting unit is less than its carrying amount. There were no indicators of goodwill impairment at October 1, 2017.
S. Reflects an adjustment to Accrued liabilities to adjust the environmental liabilities to estimated fair value.
T. Reflects the impact of the reorganization and fresh start adjustments on deferred taxes.
82
U. Reflects the adjustment to increase the net book value of asset retirement obligations to estimated fair value.
V. Reflects the cancellation of Predecessor equity to (Accumulated deficit) retained earnings.
W. Reflects the cumulative impact of the fresh start accounting adjustments discussed above on (Accumulated deficit) retained earnings as follows:
Property, plant and equipment fair value adjustment | $ | 30,869 | ||
Intangible assets fair value adjustment | (11,723 | ) | ||
Reorganization value in excess of amounts allocable to identified assets - Successor goodwill | 27,139 | |||
Asset retirement obligation fair value adjustment | (3,050 | ) | ||
Environmental liability fair value adjustment | 298 | |||
Recording the fair value of debt issuance costs for the new Successor First Lien Term Loan and Successor Second Lien Term Loan | (1,053 | ) | ||
Adjustment to deferred income taxes | 314 | |||
Change in assets and liabilities resulting from fresh start adjustments | $ | 42,794 | ||
Elimination of Predecessor common stock to (accumulated deficit) retained earnings | $ | 152 | ||
Elimination of Predecessor additional paid-in capital to (accumulated deficit) retained earnings | 1,408,324 | |||
Elimination of Predecessor treasury stock to (accumulated deficit) retained earnings | (19,809 | ) | ||
Net impact of fresh start adjustments on (accumulated deficit) retained earnings | $ | 1,431,461 | ||
Reorganization Items, net
Reorganization items, net represents liabilities settled, net of amounts incurred subsequent to the chapter 11 filing as a direct result of the Plan and are classified as “Reorganization items, net” in our Condensed Consolidated Statement of Operations. The following table summarizes reorganization items, net for the five months ended December 31, 2017, and the seven months ended July 31, 2017:
Successor | Predecessor | ||||||||
Five Months Ended | Seven Months Ended | ||||||||
December 31, | July 31, | ||||||||
2017 | 2017 | ||||||||
Net gain on debt discharge | $ | — | $ | 194,824 | |||||
Change in assets and liabilities resulting from fresh start adjustments | — | 42,794 | |||||||
Settlement of the AWS note payable | — | (5,603 | ) | ||||||
Fair value of warrants issued to the 2018 Noteholders and other parties pursuant to the Plan | — | (717 | ) | ||||||
Professional and insurance fees | (7,306 | ) | (9,090 | ) | |||||
DIP credit agreement financing costs | 3,962 | (5,702 | ) | ||||||
Retention bonus payments | (2,158 | ) | (806 | ) | |||||
Other costs | (5 | ) | 7,794 | ||||||
Reorganization items, net | $ | (5,507 | ) | $ | 223,494 | ||||
83
Note 6 - Property, Plant and Equipment, net
Property, plant and equipment consists of the following:
Successor | Predecessor | ||||||
December 31, | December 31, | ||||||
2017 | 2016 | ||||||
Land | $ | 10,779 | $ | 11,496 | |||
Buildings | 29,349 | 28,194 | |||||
Building, leasehold and land improvements | 8,677 | 14,240 | |||||
Pipelines | 67,234 | 71,076 | |||||
Disposal wells | 41,321 | 36,399 | |||||
Landfill | 5,587 | 28,130 | |||||
Machinery and equipment | 16,479 | 37,058 | |||||
Equipment under capital leases | 9,079 | 16,419 | |||||
Motor vehicles and trailers | 44,172 | 126,822 | |||||
Rental equipment | 26,216 | 58,181 | |||||
Office equipment | 3,043 | 7,403 | |||||
261,936 | 435,418 | ||||||
Less accumulated depreciation | (35,789 | ) | (148,886 | ) | |||
Construction in process | 3,727 | 7,647 | |||||
Property, plant and equipment, net | $ | 229,874 | $ | 294,179 | |||
Depreciation expense for the seven months ended July 31, 2017 was $27.8 million, and $38.5 million for the five months ended December 31, 2017. Depreciation expense for the years ended December 31, 2016 and 2015 was $58.2 million, and $67.6 million, respectively. See Note 8 for discussion on impairment charges recorded for long-lived assets during the five months ended December 31, 2017, and the years ended December 31, 2016 and 2015.
Note 7 - Intangible Assets
Intangible Assets
Intangible assets consist of the following:
Successor | Predecessor | |||||||||||||||||||||||||||
December 31, 2017 | December 31, 2016 | |||||||||||||||||||||||||||
Gross Carrying Amount | Accumulated Amortization | Net | Remaining Useful Life | Gross Carrying Amount | Accumulated Amortization | Net | Remaining Useful Life | |||||||||||||||||||||
Customer relationships | $ | — | $ | — | $ | — | 0 | $ | 11,731 | $ | (8,229 | ) | $ | 3,502 | 5.7 | |||||||||||||
Disposal permits | 594 | (47 | ) | 547 | 6.2 | 1,269 | (612 | ) | 657 | 4.1 | ||||||||||||||||||
Customer contracts | — | — | — | 0 | 17,352 | (7,201 | ) | 10,151 | 9.8 | |||||||||||||||||||
$ | 594 | $ | (47 | ) | $ | 547 | 6.2 | $ | 30,352 | $ | (16,042 | ) | $ | 14,310 | 8.5 | |||||||||||||
The remaining weighted average useful lives shown are calculated based on the net book value and remaining amortization period of each respective intangible asset. The disposal permits are related to the Rocky Mountain, Northeast and Southern divisions. We had a subsequent adjustment to the fresh start accounting described in Note 5 for the gross carrying amount of the disposal permits as a result of a revised valuation estimate, which lowered the gross carrying amount of the disposal permits from $608 thousand as reported in our quarterly report on Form 10-Q for the period ended September 30, 2017, to $594 thousand. The reduction in the gross carrying amount of the disposal permits was not material and charged to “Direct operating expenses” on the consolidated statement of operations during the three months ended December 31, 2017.
Amortization expense, which is calculated using either the straight-line method or an accelerated method based upon estimated future cash flows, was $1.2 million for the seven months ended July 31, 2017, and $0.0 million for the five months ended December 31, 2017. Amortization expense was $2.6 million and $2.9 million for the years ended December 31, 2016 and 2015, respectively.
84
As of December 31, 2017 future amortization expense of intangible assets is estimated to be:
2018 | $ | 111 | |
2019 | 111 | ||
2020 | 94 | ||
2021 | 62 | ||
2022 | 55 | ||
Thereafter | 114 | ||
Total | $ | 547 | |
Note 8 - Assets Held for Sale and Impairment of Long-Lived Assets and Goodwill
Impairment charges recorded for the five months ended December 31, 2017, and the years ended December 31, 2016 and 2015, related to continuing operations by reportable segment were as follows:
Northeast | Southern | Rocky Mountain | Total | |||||||||||||
Five Months Ended December 31, 2017 - Successor | ||||||||||||||||
Impairment of property, plant and equipment, net | $ | — | $ | 238 | $ | 4,666 | $ | 4,904 | ||||||||
Total | $ | — | $ | 238 | $ | 4,666 | $ | 4,904 | ||||||||
Year Ended December 31, 2016 - Predecessor | ||||||||||||||||
Impairment of property, plant and equipment, net | $ | 8,025 | $ | 2,427 | $ | 31,712 | $ | 42,164 | ||||||||
Total | $ | 8,025 | $ | 2,427 | $ | 31,712 | $ | 42,164 | ||||||||
Year Ended December 31, 2015 - Predecessor | ||||||||||||||||
Impairment of property, plant and equipment, net | $ | — | $ | 5,921 | $ | — | $ | 5,921 | ||||||||
Impairment of goodwill | $ | — | $ | — | $ | 104,721 | $ | 104,721 | ||||||||
Total | $ | — | $ | 5,921 | $ | 104,721 | $ | 110,642 | ||||||||
The fair values of each of the reporting units as well as the related assets and liabilities utilized to determine the impairment were measured using Level 2 and Level 3 inputs as described in Note 12.
Assets Held for Sale
During the five months ended December 31, 2017, management approved plans to sell certain underutilized assets, primarily trucks and tanks, located in the Rocky Mountain and Southern divisions. We began to actively market these assets, which we expect to sell within one year. In accordance with applicable accounting guidance, the assets were recorded at the lower of net book value or fair value less costs to sell. Upon reclassification we ceased to recognize depreciation expense on the assets. As the fair value of the assets reclassified as held for sale during the five months ended December 31, 2017 was lower than its net book value, an impairment charge of $4.9 million was recognized, and is included in “Impairment of long-lived assets” on our consolidated statement of operations. Of the $4.9 million recorded during five months ended December 31, 2017, $4.7 million related to the Rocky Mountain division and $0.2 million related to the Southern division.
During the year ended December 31, 2016, management approved plans to sell certain assets located in both the Northeast and Southern divisions, including trucks, tanks, and a parcel of land. As the fair value of the assets was lower than its net book value, an impairment charge of $4.8 million was recognized during the year ended December 31, 2016, and is included in “Impairment of long-lived assets” on our consolidated statement of operations. Of the $4.8 million recorded during the year ended December 31, 2016, $2.4 million related to the Southern division and $2.4 million related to the Northeast division. The fair value of the assets was measured using third party quoted prices for similar assets (Level 3).
85
Impairment of Long-Lived Assets
Long-lived assets, such as property, plant and equipment and purchased intangibles subject to amortization, are reviewed for impairment whenever events or changes in circumstances indicate that the carrying value of such assets may not be recoverable. Due to the sale of underutilized or non-core assets as a result of lower oil prices and the continued decrease in activities by our customers, in addition to lower capital spending, there were indicators that the carrying value of our assets may not be recoverable during the year ended December 31, 2016.
Our impairment review during the three months ended September 30, 2016 concluded that the carrying value of the Haynesville and Marcellus asset groups were not recoverable as the carrying value exceeded our estimate of future undiscounted cash flows for these two basins. As a result, we recorded an impairment charge for the Marcellus asset group (Northeast division) of $5.7 million during the three months ended September 30, 2016 as the carrying value exceeded fair value. No impairment charge was necessary for the Haynesville asset group as the fair value was greater than the carrying value. The fair value of the Marcellus and Haynesville asset groups was determined primarily using the cost and market approaches (Level 3).
Our impairment review during the three months ended December 31, 2016 concluded that the carrying value of the Bakken and Eagle Ford asset groups were not recoverable as the carrying value exceeded our estimate of future undiscounted cash flows for these two basins. As a result, we recorded an impairment charge for the Bakken asset group (Rocky Mountain division) of $31.7 million during the three months ended December 31, 2016 as the carrying value exceeded fair value. No impairment charge was necessary for the Eagle Ford asset group as the fair value was greater than the carrying value. The fair value of the Bakken and Eagle Ford asset groups was determined primarily using the cost and market approaches (Level 3).
During the year ended December 31, 2015, we recognized impairment charges of $5.9 million for long-lived assets. These impairment charges were recorded to “Other, net” in the consolidated statement of operations as part of restructuring expenses related to the exit of the MidCon Shale area (See Note 9 for additional discussion).
If reduced customer activity levels continue to result in decreased demand for our services for a prolonged period of time, or if we otherwise make further downward adjustments to our projections, our actual cash flows could be less than our estimated cash flows, which could result in future impairment charges for long-lived assets.
Impairment of Goodwill
As of September 30, 2015, and prior to the annual goodwill impairment test, the entire goodwill balance of the predecessor entity of $104.7 million related to the Rocky Mountain division. To measure the fair value of the Rocky Mountain reporting unit, we used a combination of the discounted cash flow method and the guideline public company method. Based upon the results of the first step of the goodwill impairment test, we concluded that the fair value of the Rocky Mountain reporting unit was less than its carrying value, thereby requiring us to proceed to the second step of the goodwill impairment test. As part of the second step, we determined that for the Rocky Mountain reporting unit, the carrying value of the goodwill exceeded the implied fair value of the reporting unit goodwill. Accordingly, during the three months ended September 30, 2015, we recognized an impairment charge of $104.7 million related to our Rocky Mountain division. This impairment charge is shown as “Impairment of goodwill” in the consolidated statement of operations.
Note 9 - Restructuring and Exit Costs
In March 2015, we initiated a plan to restructure our business in certain shale basins and reduce costs, including an exit from the MidCon Shale area and the Tuscaloosa Marine Shale logistics business. Additionally, we closed certain yards within the Northeast and Southern divisions and transferred the related assets to our other operating locations, primarily in the Eagle Ford shale basin. Based on costs incurred in connection with the restructuring plan, we recorded a total of $7.1 million during the year ended December 31, 2015. During the three months ended December 31, 2015, we determined it was no longer cost effective to move the remaining equipment still located in the exited MidCon basin to other basins, nor was it in our best interest to sell these assets, and therefore the assets still remaining in the MidCon basin should be viewed as a separate asset group for purposes of reviewing long-lived assets for impairment. As a result of the impairment review, we recorded an impairment charge of $5.9 million on the remaining MidCon assets during the three months ended December 31, 2015, which is included in the total restructuring charges for the year ended December 31, 2015.
86
The restructuring charges are characterized as “Other, net” in the accompanying consolidated statements of operations for the year ended December 31, 2015. Such costs consisted of the following:
Predecessor | ||||
Year Ended December 31, 2015 | ||||
Severance and termination benefits | $ | 724 | ||
Asset impairment charge | 5,921 | |||
Contract termination costs and exit costs | 453 | |||
Total restructuring and exit costs | $ | 7,098 | ||
Approximately $6.6 million, $0.1 million and $0.4 million of the total charge for the year ended December 31, 2015 was recorded in the Southern, Northeast and Corporate operating segments, respectively.
The remaining liability for the restructuring and exit costs incurred represents lease exit costs under non-cancellable operating leases and totaled approximately $0.1 million as of December 31, 2017, which is included as “Accrued liabilities” in the consolidated balance sheets. A rollforward of the liability from December 31, 2016 through December 31, 2017 is as follows:
Lease Exit Costs | ||||
Restructuring and exit costs accrued at December 31, 2016 - Predecessor | $ | 130 | ||
Cash payments | (48 | ) | ||
Restructuring and exit costs accrued at December 31, 2017 - Successor | $ | 82 | ||
Note 10 - Accrued Liabilities
Accrued liabilities consisted of the following at December 31, 2017 and December 31, 2016:
Successor | Predecessor | ||||||
December 31, | December 31, | ||||||
2017 | 2016 | ||||||
Accrued payroll and employee benefits | $ | 3,304 | $ | 2,432 | |||
Accrued insurance | 2,701 | 3,887 | |||||
Accrued legal | 1,749 | 3,570 | |||||
Accrued taxes | 2,362 | 1,458 | |||||
Accrued interest | 161 | 4,699 | |||||
Accrued operating costs | 2,663 | 1,255 | |||||
Accrued other | 999 | 1,486 | |||||
Total accrued liabilities | $ | 13,939 | $ | 18,787 | |||
87
Note 11 - Debt
Debt consisted of the following at December 31, 2017 and December 31, 2016:
_____________________
Successor | Predecessor | |||||||||||||||
December 31, 2017 | December 31, 2016 | |||||||||||||||
Interest Rate | Maturity Date | Fair Value of Debt (h) | Carrying Value of Debt | Carrying Value of Debt | ||||||||||||
Predecessor Revolving Facility (a) | 6.15% | Mar. 2017 | $ | — | $ | — | $ | 22,679 | ||||||||
Successor Revolving Facility (b) | 6.74% | Aug. 2020 | — | — | — | |||||||||||
2018 Notes (c) | 9.875% | Apr. 2018 | — | — | 40,436 | |||||||||||
2021 Notes (d) | 10.00% | Apr. 2021 | — | — | 351,294 | |||||||||||
Predecessor Term Loan (e) | 13.00% | Apr. 2018 | — | — | 60,711 | |||||||||||
Successor First Lien Term Loan (j) | 8.74% | Aug. 2020 | 14,285 | 14,285 | — | |||||||||||
Successor Second Lien Term Loan (j) | 11.00% | Feb. 2021 | 21,000 | 21,000 | — | |||||||||||
Vehicle financings (f) | 4.12% | Various | 3,764 | 3,764 | 7,699 | |||||||||||
Note payable (g) | 4.25% | Apr. 2019 | — | — | 4,778 | |||||||||||
Total debt | $ | 39,049 | 39,049 | 487,597 | ||||||||||||
Original issue discount and premium for 2018 Notes | — | (27 | ) | |||||||||||||
Original issue discount and premium for 2021 Notes | — | (282 | ) | |||||||||||||
Debt issuance costs presented with debt (i) | — | (8,998 | ) | |||||||||||||
Debt discount for issuance of warrants (i) | — | (6,499 | ) | |||||||||||||
Total debt, net | 39,049 | 471,791 | ||||||||||||||
Less: current portion of long-term debt (k)(l) | (5,525 | ) | (465,835 | ) | ||||||||||||
Long-term debt | $ | 33,524 | $ | 5,956 | ||||||||||||
(a) | The interest rate presented represents the interest rate on the $40.0 million Predecessor Revolving Facility at December 31, 2016. |
(b) | The interest rate presented represents the interest rate on the $30.0 million Successor Revolving Facility at December 31, 2017. |
(c) | The interest rate presented represents the coupon rate on the Predecessor Company's 2018 Notes, excluding the effects of deferred financing costs, original issue discounts and original issue premiums. Including the impact of these items, the effective interest rate on the 2018 Notes is approximately 11.0%. Interest payments were due semi-annually on April 15 and October 15 of each year. The 2018 Notes were canceled on the Effective Date. |
(d) | The interest rate presented represents the current coupon rate on the Predecessor Company's 2021 Notes, excluding the effects of deferred financing costs, original issue discounts and original issue premiums. Including the impact of these items, the effective interest rate on the 2021 Notes is approximately 12.4%. Interest was previously paid in kind semi-annually by increasing the principal amount payable and due at maturity and/or in cash as follows: interest payable on October 15, 2016 was paid in kind at an annual rate of 12.5%; interest payable after October 15, 2016 but on or before April 15, 2018 will be paid at a rate of 10.0% with 50% in kind and 50% in cash; interest payable after April 15, 2018 will be paid in cash at a rate of 10.0% until maturity. The 2021 Notes were canceled on the Effective Date. |
(e) | The Predecessor Term Loan accrued interest at a rate of 13.0% compounded monthly and which was paid in kind by increasing the principal amount payable thereunder. Principal including the paid in kind interest was due April 15, 2018. The Predecessor Term Loan was canceled on the Effective Date. |
(f) | Vehicle financings consist of capital lease arrangements related to fleet purchases with a weighted-average annual interest rate of approximately 4.12%, which mature in varying installments between 2017 and 2020. |
(g) | The note payable balance as of December 31, 2016 represented the remaining amount due from acquiring the remaining interest of our former partner in AWS in 2015. Principal and interest payments were due in equal quarterly installments |
88
through April 2019. In connection with our chapter 11 filing, the note payable to AWS was settled. See Note 5 and Note 19 for discussion on the AWS Note payable settlement.
(h) | Our Successor Revolving Facility, Successor First Lien Term Loan, Successor Second Lien Term Loan, and vehicle financings bear interest at rates commensurate with market rates and therefore their respective carrying values approximate fair value. |
(i) | There were no unamortized debt issuance costs as of December 31, 2017. The debt discount for the issuance of the Predecessor warrants represented the initial fair value of the warrants issued in connection with the debt restructuring that occurred during the year ended December 31, 2016, which was amortized through interest expense over the term of the 2021 Notes and the Predecessor Term Loan. As described further in Note 13, these Predecessor warrants were accounted for as derivative liabilities. Upon emergence from chapter 11 on the Effective Date, all warrants outstanding under the Predecessor Company were canceled under the Plan. |
(j) | Interest on the Successor First Lien Term Loan accrues at an annual rate equal to the LIBOR Rate plus 7.25%. Interest on the Successor Second Lien Term Loan accrues at both an annual rate equal to 11.0%, with 5.5% payable in cash and 5.5% payable in kind prior to February 7, 2018 (or such later date as the Company may select in accordance with terms of the Second Lien Term Loan Agreement) and on or after February 7, 2018 (or such later date), at an annual rate equal to 11.0%, payable in cash, in arrears, on the first day of each month. |
(k) | The principal payments due within one year for the Successor First Lien Term Loan, Successor Second Lien Term Loan, and vehicle financings are included in current portion of long-term debt as of December 31, 2017. |
(l) | As the scheduled maturity date of the Predecessor Revolving Facility was March 31, 2017, the carrying value of the Predecessor Revolving Facility was presented in current portion of long-term debt in the consolidated balance sheet as of December 31, 2016. Further, due to the default of the Predecessor Revolving Facility as of March 31, 2017, and the resulting cross-default of the 2018 Notes, 2021 Notes and Predecessor Term Loan, these items were also included in current portion of long-term debt as of December 31, 2016. Finally, the principal payments due within one year for the vehicle financings and note payable were also included in current portion of long-term debt as of December 31, 2016. |
The required principal payments for all borrowings for each of the five years following the Successor balance sheet date are as follows:
2018 | $ | 5,525 | |
2019 | 4,012 | ||
2020 | 11,671 | ||
2021 | 17,841 | ||
2022 | — | ||
Thereafter | — | ||
Total | $ | 39,049 | |
Indebtedness
Prior to the consummation of the Plan which provided for the restructuring of our indebtedness, we were highly leveraged and a substantial portion of our liquidity needs resulted from debt service requirements and from funding our costs of operations and capital expenditures. As of December 31, 2017, we had $39.0 million of indebtedness outstanding, consisting of $14.3 million under the Successor First Lien Term Loan, $21.0 million under the Successor Second Lien Term Loan, and $3.8 million of capital leases for vehicle financings.
In connection with our emergence from the chapter 11 cases, all of the following agreements, and all outstanding interests and obligations thereunder, were terminated on the Effective Date:
• | Predecessor Revolving Facility; |
• | Predecessor Term Loan; |
• | 2018 Notes Indenture; |
• | 2021 Notes Indenture; |
• | DIP Credit Agreement; and |
• | DIP Term Loan Agreement. |
89
The termination of the 2018 Notes and the 2021 Notes, and the indentures under which they were issued, resulted in the Company becoming exempt from the reporting requirements under Rule 3-10 of Regulation S-X of the SEC with respect to the 2018 Notes and 2021 Notes. See Note 25 for further details.
First Lien Credit Agreements
On the Effective Date, pursuant to the Plan, the Company entered into the Credit Agreement. Pursuant to the Credit Agreement, the Credit Agreement Lenders agreed to extend to the Company the Successor Revolving Facility and the Successor First Lien Term Loan (i) to repay obligations outstanding under the Predecessor Revolving Facility and debtor in possession asset based lending facility, (ii) to make certain payments as provided in the Plan, (iii) to pay costs and expenses incurred in connection with the Plan, and (iv) for working capital, transaction expenses, and other general corporate purposes. The Credit Agreement also contains an accordion feature that provides for an increase in availability of up to an additional $20.0 million, subject to the satisfaction of certain terms and conditions contained in the Credit Agreement.
The Successor Revolving Facility and the Successor First Lien Term Loan mature on August 7, 2020, at which time the Company must repay the outstanding principal amount of the Successor Revolving Facility and the Successor First Lien Term Loan, together with interest accrued and unpaid thereon. The Successor Revolving Facility may be repaid and, subject to the terms and conditions of the Credit Agreement, reborrowed at any time during the term of the Credit Agreement. The principal amount of the Successor First Lien Term Loan shall be repaid in installments of $178.6 thousand beginning on September 1, 2017 and the first day of each calendar month thereafter prior to maturity. Interest on the Successor Revolving Facility accrues at an annual rate equal to the LIBOR Rate (as defined in the Credit Agreement) plus 5.25%, and interest on the Successor First Lien Term Loan accrues at an annual rate equal to the LIBOR Rate plus 7.25%; however, if there is an Event of Default (as defined in the Credit Agreement), the Credit Agreement Agent, in its sole discretion, may increase the applicable interest rate at a per annum rate equal to three percentage points above the annual rate otherwise applicable thereunder.
The Credit Agreement also contains certain affirmative and negative covenants, including a fixed charge coverage ratio covenant, as well as other terms and conditions that are customary for revolving credit facilities and term loans of this type. As of December 31, 2017, we were in compliance with all covenants.
Second Lien Term Loan Credit Agreement
On the Effective Date, pursuant to the Plan, the Company also entered into the Second Lien Term Loan Agreement. Pursuant to the Second Lien Term Loan Agreement, the Second Lien Term Loan Lenders agreed to extend to the Company the Successor Second Lien Term Loan, of which $21.1 million was advanced on the Effective Date and up to an additional $5.7 million (“Delayed Draw Term Loan”) is available at the request of the Company after the closing date subject to the satisfaction of certain terms and conditions specified in the Second Lien Term Loan Agreement. The Second Lien Term Loan Lenders extended the Successor Second Lien Term Loan, among other things, (i) to repay obligations outstanding under the Predecessor Revolving Facility and debtor in possession asset based revolving facility, (ii) to make certain payments as provided in the Plan, (iii) to pay costs and expenses incurred in connection with the Plan, and (iv) for working capital, transaction expenses and other general corporate purposes.
The Successor Second Lien Term Loan matures on February 7, 2021, at which time the Company must repay all outstanding obligations under the Successor Second Lien Term Loan. The principal amount of the Successor Second Lien Term Loan shall be repaid in installments of $263.2 thousand beginning on October 1, 2017, and the first day of each fiscal quarter thereafter prior to maturity, with such amount to be proportionally increased as the result of the incurrence of a Delayed Draw Term Loan. Interest on the Successor Second Lien Term Loan accrues at an annual rate equal to 11.0%, with 5.5% payable in cash and 5.5% payable in kind prior to February 7, 2018 (or such later date as the Company may select in accordance with the terms of the Second Lien Term Loan Agreement) and, on or after February 7, 2018 (or such later date), at an annual rate equal to 11.0%, payable in cash, in arrears, on the first day of each month. However, upon the occurrence and during the continuation of an Event of Default (as defined in the Second Lien Term Loan Agreement) due to a voluntary or involuntary bankruptcy filing, automatically, or any other Event of Default, at the election of the Second Lien Term Loan Agent, the Successor Second Lien Term Loan and all obligations thereunder shall bear interest at an annual rate equal to three percentage points above the annual rate otherwise applicable thereunder.
The Second Lien Term Loan Agreement also contains certain affirmative and negative covenants, including a fixed charge coverage ratio covenant, as well as other terms and conditions that are customary for term loans of this type. As of December 31, 2017, we were in compliance with all covenants.
90
Security Agreements
On August 7, 2017, in connection with the Credit Agreement, the Company entered into (i) a First Lien Guaranty and Security Agreement by and among the Company, the other grantors party thereto, and the Credit Agreement Agent to grant a first lien security interest in all of such grantor’s as collateral provided therein to secure the obligations under the Credit Agreement and (ii) a First Lien Trademark Security Agreement, by and among the Company, the other grantors party thereto, and the Credit Agreement Agent to grant a first lien security interest in certain trademark collateral as provided therein to secure obligations under the Credit Agreement.
On August 7, 2017, in connection with the Second Lien Term Loan Agreement, the Company entered into (i) a Second Lien Guaranty and Security Agreement by and among the Company, the other grantors party thereto, and the Second Lien Term Loan Agent to grant a second lien security interest in all of such grantor’s collateral as provided therein to secure the obligations under the Second Lien Term Loan Agreement and (ii) a Second Lien Trademark Security Agreement, by and among the Company, the other grantors party thereto, and the Second Lien Term Loan Agent to grant a second lien security interest in certain trademark collateral as provided therein to secure obligations under the Second Lien Term Loan Agreement.
Intercreditor Agreement and Intercompany Subordination Agreement
On August 7, 2017, in connection with the Credit Agreement and the Second Lien Term Loan Agreement, the Company acknowledged the terms and conditions under a Subordination and Intercreditor Agreement (the “Intercreditor Agreement”), dated as of August 7, 2017, by and among the Credit Agreement Agent and the Second Lien Term Loan Agent to set forth the terms and conditions of the relationship between the lenders and the secured parties under the Credit Agreement and Second Lien Term Loan Agreement. On August 7, 2017, the Company entered into an Intercompany Subordination Agreement (the “Intercompany Agreement”), dated as of August 7, 2017, by and among the Company and the other obligors named therein to agree to subordinate its indebtedness to the Credit Agreement Lenders and the Second Lien Term Loan Lenders.
Note 12 - Fair Value Measurements
Measurements
Fair value represents an exit price, representing the amount that would be received to sell an asset or paid to transfer a liability in an orderly transaction between market participants. As such, fair value is a market-based measurement that should be determined based on assumptions that market participants would use in pricing an asset or liability. GAAP establishes a three-tier fair value hierarchy, which prioritizes the inputs used in measuring fair value as follows:
• | Level 1 — Observable inputs such as quoted prices in active markets that are accessible at the measurement date for identical assets or liabilities; |
• | Level 2 — Inputs, other than the quoted prices in active markets, that are observable either directly or indirectly; and |
• | Level 3 — Unobservable inputs in which there is little or no market data, which require the reporting entity to develop its own assumptions. |
Assets and liabilities measured at fair value on a recurring basis as of December 31, 2017 and December 31, 2016 and the fair value hierarchy of the valuation techniques we utilized to determine such fair value included significant unobservable inputs (Level 3) and were as follows:
Successor | Predecessor | ||||||
December 31, 2017 | December 31, 2016 | ||||||
Derivative warrant liability | $ | 477 | $ | 4,298 | |||
Contingent consideration | 500 | 8,500 | |||||
Derivative Warrant Liability
Our derivative warrant liability is adjusted to reflect the estimated fair value at each quarter end, with any decrease or increase in the estimated fair value recorded in “Other income, net” in the consolidated statements of operations. We used Level 3 inputs for the valuation methodology of the derivative liabilities. The estimated fair values were computed using a Monte Carlo simulation model. The key inputs in determining our derivative warrant liability included our stock price, the volatility of our
91
stock price or the volatility of our peer group, and the risk free interest rate. Future changes in these factors could have a significant impact on the computed fair value of the derivative warrant liability. As such, we expect future changes in the fair value of the warrants could vary significantly from quarter to quarter.
Upon emergence from chapter 11 on the Effective Date, all warrants outstanding under the Predecessor Company were canceled under the Plan. Additionally, on the Effective Date, pursuant to the Plan we issued to the holders of the 2018 Notes and holders of certain claims relating to the rejection of executory contracts and unexpired leases 118,137 warrants with an exercise price of $39.82 and a term expiring seven years from the Effective Date. Each warrant is exercisable for one share of our common stock, par value $0.01. The warrants issued under the Successor Company were also determined to be derivative liabilities (See Note 13).
The following table provides a reconciliation of the beginning and ending balances of the “Derivative warrant liability” presented in the consolidated balance sheets as of December 31, 2017 and December 31, 2016.
Successor | Predecessor | ||||||
December 31, 2017 | December 31, 2016 | ||||||
Balance at beginning of period | $ | — | $ | — | |||
Issuance of warrants | 717 | 7,838 | |||||
Exercise of warrants | — | (229 | ) | ||||
Adjustments to estimated fair value | (240 | ) | (3,311 | ) | |||
Balance at end of period | $ | 477 | $ | 4,298 | |||
Contingent Consideration
We are liable for contingent consideration payments in connection with the Ideal acquisition. The fair value of the contingent consideration obligation was determined using a probability-weighted income approach at the acquisition date and is revalued at each reporting date or more frequently if circumstances dictate based on changes in the discount periods and rates, changes in the timing and amount of the revenue estimates and changes in probability assumptions with respect to the likelihood of achieving the performance measurements upon which the obligation is based.
We had previously determined that it would be unlikely that the required permits and certificates necessary for the issuance of a second special waste disposal permit to Ideal would be issued within one year, and as such presented the $8.5 million contingent consideration liability related to the Ideal acquisition as “Long-term contingent consideration” in the consolidated balance sheet as of December 31, 2016.
On June 28, 2017, certain of the Nuverra Parties filed a motion with the Bankruptcy Court seeking authorization to resolve unsecured claims related to the $8.5 million contingent consideration from the Ideal acquisition (the “Ideal Settlement”). On July 11, 2017, the Bankruptcy Court entered an order authorizing the Ideal Settlement. Pursuant to the approved settlement terms, the $8.5 million contingent claim was replaced with an obligation on the part of the applicable Nuverra Party to transfer $0.5 million to the counterparties to the Ideal Settlement upon emergence from chapter 11, and $0.5 million when the Ideal Settlement counterparties deliver the required permits and certificates necessary for the issuance of the second special waste disposal permit. The $0.5 million due upon emergence from chapter 11 was paid during the five months ended December 31, 2017. The remaining $0.5 million due when the counterparties deliver the required permits and certificates necessary for the issuance of the second special waste disposal permit has been classified as current, as these permits and certificates are expected to be received within one year.
Changes to the fair value of contingent consideration are recorded as “Other income, net” in the consolidated statements of operations. The fair value measurement is based on significant inputs not observable in the market, which are referred to as Level 3 inputs.
92
Changes to contingent consideration obligations during the five months ended December 31, 2017, the seven months ended July 31, 2017, and the year ended December 31, 2016 were as follows:
Successor | Predecessor | |||||||||||
Five Months Ended December 31, 2017 | Seven Months Ended July 31, 2017 | Year Ended December 31, 2016 | ||||||||||
Balance at beginning of period | $ | 1,000 | $ | 8,500 | $ | 8,628 | ||||||
Cash payments | (500 | ) | — | (128 | ) | |||||||
Changes in fair value of contingent consideration, net | — | — | — | |||||||||
Write-off of contingent consideration due to settlement in chapter 11 | — | (7,500 | ) | — | ||||||||
Balance at end of period | 500 | 1,000 | 8,500 | |||||||||
Less: current portion | (500 | ) | (1,000 | ) | — | |||||||
Long-term portion of contingent consideration | $ | — | $ | — | $ | 8,500 | ||||||
Other
In addition to our assets and liabilities that are measured at fair value on a recurring basis, we are required by GAAP to measure certain assets and liabilities at fair value on a nonrecurring basis after initial recognition. Generally, assets, liabilities and reporting units are measured at fair value on a nonrecurring basis as a result of impairment reviews and any resulting impairment charge. In connection with our impairment review of long-lived assets described in Note 8, the fair value of our asset groups is determined primarily using the cost and market approaches (Level 3).
Note 13 - Derivative Warrants
Predecessor Warrants
During the year ended December 31, 2016, we issued 26.4 million warrants with 17.5 million warrants for the exchange of 2018 Notes for new 2021 Notes, 0.1 million warrants for the exchange of 2018 Notes for common stock, and 8.8 million warrants to the lenders under the Predecessor Term Loan. All warrants were issued with an exercise price of $0.01 and had a term of ten years.
Upon emergence from chapter 11 on the Effective Date, all warrants outstanding under the Predecessor Company were canceled under the Plan. The following table shows the Predecessor warrant activity for the seven months ended July 31, 2017, and the year ended December 31, 2016:
Predecessor | |||||
Seven Months Ended July 31, 2017 | Year Ended December 31, 2016 | ||||
Outstanding at the beginning of period | 25,283 | — | |||
Issued | — | 26,400 | |||
Exercised | (16 | ) | (1,117 | ) | |
Canceled due to emergence from chapter 11 | (25,267 | ) | — | ||
Outstanding at the end of the period | — | 25,283 | |||
Successor Warrants
Pursuant to the Plan, on the Effective Date, we issued to the holders of the 2018 Notes, and holders of certain claims relating to the rejection of executory contracts and unexpired leases, 118,137 warrants with an exercise price of $39.82 and a term expiring seven years from the Effective Date. Each warrant is exercisable for one share of our common stock, par value $0.01.
93
The following table shows the Successor warrant activity for the five months ended December 31, 2017:
Successor | |||
Five Months Ended | |||
December 31, 2017 | |||
Outstanding at the beginning of the period | — | ||
Issued | 118 | ||
Exercised | — | ||
Outstanding at the end of the period | 118 | ||
Fair Value of Warrants
We accounted for warrants in accordance with the accounting guidance for derivatives, which sets forth a two-step model to be applied in determining whether a financial instrument is indexed to an entity’s own stock which would qualify such financial instruments for a scope exception. This scope exception specifies that a contract that would otherwise meet the definition of a derivative financial instrument would not be considered as such if the contract is both (i) indexed to the entity’s own stock and (ii) classified in the shareholders’ equity section of the entity’s balance sheet. We determined that the Predecessor warrants were ineligible for equity classification due to the anti-dilution provisions in the contract, and the Successor warrants were ineligible for equity classification as the warrants are not indexed to our common stock. As such, the warrants were recorded as derivative liabilities at fair value on the “Derivative warrant liability” line in the consolidated balance sheet. The warrants are classified as a current liability in the consolidated balance sheet as they could be exercised by the holders at any time.
As discussed previously in Note 12, the fair value of the derivative warrant liability was estimated using a Monte Carlo simulation model on the date of issue and is re-measured at each quarter end until expiration or exercise of the underlying warrants with the resulting fair value adjustment recorded in “Other income, net” in the consolidated statement of operations.
The fair value of the derivative warrant liability was estimated using the following model inputs:
Successor | Predecessor | ||||||||||||
Period Ended | At Issuance | Period Ended | |||||||||||
December 31, 2017 | August 7, 2017 | December 31, 2016 | |||||||||||
Exercise price | $ | 39.82 | $ | 39.82 | $ | 0.01 | |||||||
Closing stock price (a) | $ | 18.18 | $ | 22.28 | $ | 0.18 | |||||||
Risk free rate | 2.29 | % | 2.07 | % | 2.40 | % | |||||||
Expected volatility | 40.59 | % | 39.39 | % | 79.5 | % | |||||||
(a) As the Company’s post-Effective Date common stock did not begin trading on the NYSE American Stock Exchange until October 12, 2017, the closing stock price used to estimate the fair value of the derivative warrant liability on August 7, 2017 was the implied price per share assuming an enterprise value of $302.5 million before fresh start accounting adjustments.
Note 14 - Equity
Equity Issuances in 2017 - Successor
On the Effective Date, we filed the Second Amended and Restated Certificate of Incorporation of the Company with the office of the Secretary of State of the State of Delaware and adopted the Third Amended and Restated Bylaws of the Company. The Second Amended and Restated Certificate of Incorporation provides that we are authorized to issue a total of 76.0 million shares of capital stock, of which 1.0 million shares shall be preferred stock, par value $0.01, and 75.0 million shares shall be common stock, par value of $0.01, of the reorganized Company.
As previously discussed in Note 4, upon emergence from chapter 11, the following shares of common stock of the reorganized Company were issued:
• | 7,900,000 shares of common stock of the reorganized Company to the holders of the Predecessor Company’s 2021 Notes; |
94
• | 100,000 shares of common stock of the reorganized Company to the Affected Classes (as defined in the Plan); and |
• | 3,695,580 shares of common stock of the reorganized Company to holders of Supporting Noteholder Term Loan Claims (as defined in the Plan) and to the Credit Agreement Lenders for the Exit Financing Commitment Fee (as defined in the Plan). |
Additionally, pursuant to the Plan, on the Effective Date, we issued to the holders of the 2018 Notes, and holders of certain claims relating to the rejection of executory contracts and unexpired leases, 118,137 warrants with an exercise price of $39.82 and a term expiring seven years from the Effective Date. Each warrant is exercisable for one share of our common stock, par value $0.01. There were no warrant exercises during the five months ended December 31, 2017.
Equity Issuances in 2017 - Predecessor
During the seven months ended July 31, 2017, we issued common stock for our share-based compensation program which is discussed further in Note 16. Additionally, common stock was issued as a result of certain debtholders exercising the warrants received in connection with the debt restructuring during the year ended December 31, 2016.
On the Effective Date, pursuant to the Plan, (i) all shares of the Company’s pre-Effective Date common stock and all other previously issued and outstanding equity interests in the Company, and any rights of any holder in respect thereof, were canceled and discharged and (ii) all agreements, instruments, and other documents evidencing, relating to or connected with the Company’s pre-Effective Date common stock and all other previously issued and outstanding equity interests of the Company, and any rights of any holder in respect thereof, were canceled and discharged and of no further force or effect.
Equity Issuances in 2016 - Predecessor
In connection with our debt restructuring in 2016, a total of 101,071,875 shares of common stock were issued, with 2,837,500 to tendering holders electing to exchange their 2018 Notes for common stock, and 98,234,375 to our former Chairman and Chief Executive Officer, Mr. Mark D. Johnsrud, for exchanging $31.4 million in principal 2018 Notes for common stock. Additionally, we issued 20,312,500 shares of common stock to Mr. Johnsrud on November 28, 2016 in consideration for the $5.0 million he funded for the planned rights offering which failed to be consummated by November 15, 2016, of which 19.5 million shares represented the underlying subscription rights and 0.8 million shares represented the backstop fee.
During the year ended December 31, 2016, we also issued common stock for our share-based compensation program and our ESPP plan which is discussed further in Note 16. Additionally, common stock was issued as a result of certain debtholders exercising the warrants received in connection with the debt restructuring during the year ended December 31, 2016.
Equity Issuances in 2015 - Predecessor
The only issuances of common stock during the year ended December 31, 2015 related to share-based compensation and our ESPP, as well as our match on our employee benefit plan discussed in Note 20.
Note 15 - Earnings Per Share
Basic and diluted loss per common share from continuing operations, basic and diluted loss per common share from discontinued operations and net loss per basic and diluted common share have been computed using the weighted average number of shares of common stock outstanding during the period.
For the five months ended December 31, 2017, and years ended December 31, 2016 and 2015, no shares of common stock underlying stock options, restricted stock, or warrants were included in the computation of diluted earnings per share (“EPS”) from continuing operations because the inclusion of such shares would be anti-dilutive based on the net losses from continuing operations reported for those periods. Additionally, for the five months ended December 31, 2017, and the years ended December 31, 2016 and 2015, no shares of common stock underlying stock options, restricted stock, or warrants were included in the computations of diluted EPS from loss from discontinued operations or diluted EPS from net loss per common share, because such shares were excluded from the computation of diluted EPS from continuing operations for those periods.
For the purpose of the computation of EPS, shares issued in connection with acquisitions that are contingently returnable are classified as issued but are not included in the basic weighted average number of shares outstanding until all applicable conditions are satisfied such that the shares are no longer contingently returnable. As of December 31, 2017 and 2016, there were no contingently returnable shares. As of December 31, 2015 contingently returnable shares of approximately 0.3 million shares were excluded from the computation of basic EPS as these shares were subject to sellers’ indemnification obligations and were being held in escrow.
95
The following table presents the calculation of basic and diluted net (loss) income per common share, as well as the potentially dilutive stock-based awards that were excluded from the calculation of diluted loss per share for the periods presented:
Successor | Predecessor | |||||||||||||||
Five Months Ended December 31, 2017 | Seven Months Ended July 31, 2017 | Year Ended December 31, 2016 | Year Ended December 31, 2015 | |||||||||||||
Numerator: | ||||||||||||||||
(Loss) income from continuing operations | $ | (47,895 | ) | $ | 168,611 | (167,621 | ) | (195,167 | ) | |||||||
Loss from discontinued operations | — | — | (1,235 | ) | (287 | ) | ||||||||||
Net (loss) income | $ | (47,895 | ) | $ | 168,611 | $ | (168,856 | ) | $ | (195,454 | ) | |||||
Denominator: | ||||||||||||||||
Weighted average shares—basic | 11,696 | 150,940 | 90,979 | 27,681 | ||||||||||||
Common stock equivalents | — | 23,364 | — | — | ||||||||||||
Weighted average shares—diluted | 11,696 | 174,304 | 90,979 | 27,681 | ||||||||||||
Earnings per common share: | ||||||||||||||||
Basic (loss) income from continuing operations | $ | (4.09 | ) | $ | 1.12 | $ | (1.84 | ) | $ | (7.05 | ) | |||||
Basic loss from discontinued operations | — | — | (0.01 | ) | (0.01 | ) | ||||||||||
Net (loss) income per basic common share | $ | (4.09 | ) | $ | 1.12 | $ | (1.85 | ) | $ | (7.06 | ) | |||||
Diluted (loss) income from continuing operations | $ | (4.09 | ) | $ | 0.97 | $ | (1.84 | ) | $ | (7.05 | ) | |||||
Diluted loss from discontinued operations | $ | — | — | (0.01 | ) | (0.01 | ) | |||||||||
Net (loss) income per diluted common share | $ | (4.09 | ) | $ | 0.97 | $ | (1.85 | ) | $ | (7.06 | ) | |||||
Dilutive stock-based awards excluded: | ||||||||||||||||
Warrants | — | — | 11,655 | — | ||||||||||||
Total | — | — | 11,655 | — | ||||||||||||
Antidilutive stock-based awards excluded | 827 | 593 | 845 | 799 | ||||||||||||
Note 16 - Share-based Compensation
Successor Share-based Compensation
The Second Amended and Restated Employment Agreement of Mr. Mark D. Johnsrud, our former Chairman and Chief Executive Officer, which was assumed by the Company on the Effective Date, provides for the issuance to Mr. Johnsrud of two tranches of options to purchase (i) 2.5% of the outstanding equity securities of the reorganized Company, on a fully diluted basis, at a premium exercise price equal to the value of a share of the reorganized Company’s common stock at an enterprise valuation of $475.0 million and (ii) 2.5% of the outstanding equity securities of the reorganized Company, on a fully diluted basis, at a premium exercise price equal to the value of a share of the reorganized Company’s common stock at an enterprise valuation of $525.0 million. Each tranche of options will vest in substantially equal installments on the first three anniversaries following the Effective Date. Pursuant to Mr. Johnsrud’s Second Amended and Restated Employment Agreement and the Plan, the grant of stock options to Mr. Johnsrud was effective as of the Effective Date. On February 23, 2018, following the approval of the form of option agreement by the Compensation and Nominating Committee of the Board (the “Compensation Committee”), the Company and Mr. Johnsrud entered into a Notice of Grant of CEO Stock Options and Stock Option Award Agreement (the “Award Agreement”) to provide for the terms and conditions of Mr. Johnsrud’s stock option grant. Pursuant to the Award Agreement, Mr. Johnsrud was awarded 354,411 options to purchase common stock, with an exercise price of $37.03 per share, in Tranche 1, and 354,411 options to purchase common stock, with an exercise price of $41.31 per share, in Tranche 2. The stock options in Tranche 1 and Tranche 2 vest in three equal installments on the first three anniversaries of the Effective Date.
96
Pursuant to the requirements of the Plan, on February 22, 2018, the Board approved the Nuverra Environmental Solutions, Inc. 2017 Long Term Incentive Plan (the “Incentive Plan”). The Incentive Plan is intended to provide for the grant of equity-based awards to designated members of the Company’s management and employees. Pursuant to the terms of the Plan, the Incentive Plan became effective on the Effective Date. The maximum number of shares of the Company’s common stock that is available for the issuance of awards under the Incentive Plan is 1,772,058.
On February 22, 2018, the Compensation Committee authorized the grant of performance-based restricted stock units (“PRSUs”) and time-based restricted stock units (“TRSUs”) under the Incentive Plan to Mr. Johnsrud, Edward A. Lang, the Company’s Executive Vice President and Chief Financial Officer, and Joseph M. Crabb, the Company’s Executive Vice President and Chief Legal Officer. On the applicable vesting date, the PRSUs and TRSUs will be settled for shares of common stock if all applicable conditions have been met. Mr. Johnsrud received 531,618 PRSUs, which vest in equal installments on the first two anniversaries of the Effective Date. Mr. Lang and Mr. Crabb each received an award of 62,022 PRSUs, which vest in three equal installments on December 31, 2018, December 31, 2019, and December 31, 2010. Vesting of the PRSUs is subject to the achievement of pre-established performance targets during the applicable performance measurement periods. Mr. Johnsrud received 531,618 TRSUs, which vest in three equal installments on the date of grant, which was February 23, 2018, and the first two anniversaries of the Effective Date. Mr. Lang and Mr. Crabb each received an award of 62,022 TRSUs, which vest in three equal installments on December 31, 2018, December 31 ,2019, and December 31, 2020.
On February 22, 2018, the Compensation Committee adopted the 2018 Restricted Stock Plan for Directors (the “Restricted Stock Plan”), which is subject to ratification by the Company’s shareholders at the Company’s 2018 Annual Meeting. The Restricted Stock Plan provides for the grant of restricted stock to the non-employee directors of the Company. The Restricted Stock Plan limits the shares that may be issued thereunder to 100,000 shares of common stock. On February 22, 2018, the Compensation Committee authorized award grants of restricted stock to the current non-employee directors of the Company, which will be issued upon ratification of the Restricted Stock Plan by the Company’s shareholders. Each non-employee director received 4,688 shares of restricted stock for service during part of fiscal year 2017 and for fiscal 2018, all of which will fully vest on the first anniversary of the grant date.
Share-based Compensation Expense
The total share-based compensation expense, net of estimated forfeitures, included in “General and administrative expenses” in the accompanying condensed consolidated statements of operations for the five months ended December 31, 2017 was as follows:
Successor | ||||
Five Months Ended | ||||
December 31, 2017 | ||||
Stock options | $ | 677 | ||
Total expense | $ | 677 | ||
There was no income tax expense or benefit related to share-based compensation recognized in the consolidated statement of operations for the five months ended December 31, 2017. At December 31, 2017, the total unrecognized share-based compensation expense, net of estimated forfeitures, was $4.5 million and is expected to be recognized over a weighted average period of 2.6 years.
We measure the cost of employee services received in exchange for awards of stock options based on the fair value of those awards at the date of grant. The fair value of stock options on the date of grant is amortized to compensation expense on a straight-line basis over the requisite service period. The exercise price for stock options is equal to the market price of our common stock on the date of grant. The maximum contractual term of stock options is 10 years. We estimate the fair value of stock options using a Black-Scholes option-pricing model.
The assumptions used to estimate the fair value of stock options granted during the five months ended December 31, 2017 are as follows:
97
Successor | ||||
Five Months Ended | ||||
December 31, 2017 | ||||
Volatility | 45.6 | % | ||
Expected term (years) | 10.0 | |||
Risk free interest rate | 2.3 | % | ||
Expected dividend yield | — | % | ||
Weighted average fair value | $ | 10.02 | ||
The expected term of stock options represents the period of time that the stock options granted are expected to be outstanding taking into consideration the contractual term of the options and termination history and option exercise behaviors of our employees. The expected volatility is based on the leverage-adjusted peer volatility methodology. The risk-free interest rate represents the U.S. Treasury bill rate for the expected term of the related stock options. The dividend yield represents our anticipated cash dividend over the expected term of the stock options.
Stock Options
Awards of stock options generally vest in equal increments over a three-year service period from the date of grant. A summary of stock option activity during the five months ended December 31, 2017 is presented below:
Successor | |||||||||||||||
Options | Shares Outstanding | Shares Exercisable | Weighted-Average Exercise Price | Weighted-Average Remaining Contractual Term (Years) | Aggregate Intrinsic Value | ||||||||||
August 1, 2017 | — | $ | — | ||||||||||||
Granted | 709 | $ | 39.17 | ||||||||||||
Exercised | — | $ | — | ||||||||||||
Forfeited, canceled, or expired | — | $ | — | ||||||||||||
December 31, 2017 | 709 | $ | 39.17 | 9.6 | $ | — | |||||||||
Exercisable at December 31, 2017 | — | $ | — | 0.0 | $ | — | |||||||||
Predecessor Share-based Compensation
Prior to the Effective Date, we granted stock options, stock appreciation rights, restricted common stock and restricted stock units, performance shares and units, other share-based awards and cash-based awards to our employees, directors, consultants and advisors pursuant to the Nuverra Environmental Solutions, Inc. 2009 Equity Incentive Plan (as amended, the “2009 Plan”). As previously noted in Note 4, on the Effective Date pursuant to the Plan, all of the pre-Effective Date share-based compensation awards issued and outstanding under the 2009 Plan were canceled.
98
Share-based Compensation Expense
The total share-based compensation expense, net of forfeitures, included in “General and administrative expenses” recognized in the consolidated statements of operations was as follows:
Predecessor | ||||||||||||
Seven Months Ended July 31, | Year Ended December 31, | Year Ended December 31, | ||||||||||
2017 | 2016 | 2015 | ||||||||||
Stock options | $ | 109 | $ | 213 | $ | 536 | ||||||
Restricted stock | 153 | 412 | 428 | |||||||||
Restricted stock units | 195 | 500 | 1,357 | |||||||||
Total share-based compensation expense | $ | 457 | $ | 1,125 | $ | 2,321 | ||||||
There was no income tax expense or benefit related to share-based compensation recognized in the consolidated statement of operations for the seven months ended July 31, 2017, or the years ended December 31, 2016 and 2015.
We measured the cost of employee services received in exchange for awards of stock options based on the fair value of those awards at the date of grant. The fair value of stock options on the date of grant was amortized to compensation expense on a straight-line basis over the requisite service period. The exercise price for stock options was equal to the market price of our common stock on the date of grant. The maximum contractual term of stock options was 10 years. We estimated the fair value of stock options using a Black-Scholes option-pricing model.
There were no stock options granted during the seven months ended July 31, 2017 and the year ended December 31, 2016. The assumptions used to estimate the fair value of stock options granted in the year ended December 31, 2015 are as follows:
Predecessor | ||||
Year Ended December 31, | ||||
2015 | ||||
Volatility | 55.3 | % | ||
Expected term (years) | 8.0 | |||
Risk free interest rate | 1.8 | % | ||
Expected dividend yield | — | % | ||
Weighted average fair value | $ | 1.55 | ||
The expected term of stock options represents the period of time that the stock options granted are expected to be outstanding taking into consideration the contractual term of the options and termination history and option exercise behaviors of our employees. The expected volatility is based on the historical price volatility of our common stock. The risk-free interest rate represents the U.S. Treasury bill rate for the expected term of the related stock options. The dividend yield represents our anticipated cash dividend over the expected term of the stock options.
We measured the cost of employee services received in exchange for awards of restricted stock or restricted stock units based on the market value of our common shares at the date of grant. The fair value of the restricted stock or restricted stock units was amortized on a straight-line basis over the requisite service period. Certain restricted stock units were subject to a performance condition established at the date of grant. Actual results against the performance condition were measured at the end of the performance period, which typically coincides with the vesting period. For these awards with performance conditions, the fair value of the restricted stock units was amortized on a straight-line basis over the requisite service period based upon the fair market value on the date of grant, adjusted for the anticipated or actual achievement against the established performance condition.
99
Stock Options
Awards of stock options generally vest in equal increments over a three-year service period from the date of grant. A summary of stock option activity during the seven months ended July, 31, 2017, and the years ended December 31, 2016 and 2015 is presented below:
Predecessor | |||||||||||||||
Options | Shares Outstanding | Shares Exercisable | Weighted-Average Exercise Price | Weighted-Average Remaining Contractual Term (Years) | Aggregate Intrinsic Value | ||||||||||
December 31, 2014 | 232 | $ | 40.30 | ||||||||||||
Granted | 736 | $ | 5.29 | ||||||||||||
Exercised | — | $ | — | ||||||||||||
Forfeited, canceled, or expired | (145 | ) | $ | 28.06 | |||||||||||
December 31, 2015 | 823 | $ | 11.16 | 8.6 | $ | — | |||||||||
Exercisable at December 31, 2015 | 92 | $ | 40.63 | 5.3 | $ | — | |||||||||
Granted | — | $ | — | ||||||||||||
Exercised | — | $ | — | ||||||||||||
Forfeited, canceled, or expired | (456 | ) | $ | 7.58 | |||||||||||
December 31, 2016 | 367 | $ | 13.55 | 7.2 | $ | — | |||||||||
Exercisable at December 31, 2016 | 185 | $ | 21.24 | 6.3 | $ | — | |||||||||
Granted | — | $ | — | ||||||||||||
Exercised | — | $ | — | ||||||||||||
Forfeited, canceled, or expired | (367 | ) | $ | 13.55 | |||||||||||
July 31, 2017 | — | $ | — | 0.0 | $ | — | |||||||||
Exercisable at July 31, 2017 | — | $ | — | 0.0 | $ | — | |||||||||
Restricted Stock Awards
Shares of restricted stock awards generally vest over a two or three year service period from the date of grant. A summary of non-vested restricted stock award activity during the seven months ended July 31, 2017, and the years ended December 31, 2016 and 2015 is presented below:
Predecessor | |||||||
Non-Vested Restricted Stock | Shares | Weighted-Average Grant-Date Fair Value | |||||
Non-vested at December 31, 2014 | 66 | $ | 9.78 | ||||
Granted | 420 | $ | 1.25 | ||||
Vested | (39 | ) | $ | 10.23 | |||
Forfeited | — | $ | — | ||||
Non-vested at December 31, 2015 | 447 | $ | 1.73 | ||||
Granted | — | $ | — | ||||
Vested | (236 | ) | $ | 2.00 | |||
Forfeited | (1 | ) | $ | 41.50 | |||
Non-vested at December 31, 2016 | 210 | $ | 1.25 | ||||
Granted | — | $ | — | ||||
Vested | — | $ | — | ||||
Forfeited or canceled | (210 | ) | $ | 1.25 | |||
Non-vested at July 31, 2017 | — | $ | — | ||||
There were no shares that vested during the seven months ended July 31, 2017. The total fair value of the shares vested during the years ended December 31, 2016 and 2015, was approximately $0.5 million and $0.4 million, respectively.
100
Restricted Stock Units
Shares of restricted stock units generally vest over a two or three year service period from the date of grant. Certain restricted stock units are subject to a performance condition established at the date of grant. Actual results against the performance condition are measured at the end of the performance period, which typically coincides with the vesting period.
A summary of non-vested restricted stock unit activity during the seven months ended July 31, 2017 and the years ended December 31, 2016 and 2015 is presented below:
Predecessor | |||||||
Non-Vested Restricted Stock Units | Shares | Weighted-Average Grant-Date Fair Value | |||||
Non-vested at December 31, 2014 | 248 | $ | 18.42 | ||||
Granted | 164 | $ | 3.54 | ||||
Vested | (123 | ) | $ | 20.00 | |||
Forfeited | (29 | ) | $ | 10.94 | |||
Non-vested at December 31, 2015 | 260 | $ | 8.04 | ||||
Granted | 1 | $ | 0.30 | ||||
Vested | (71 | ) | $ | 11.69 | |||
Forfeited | (151 | ) | $ | 4.81 | |||
Non-vested at December 31, 2016 | 39 | $ | 13.93 | ||||
Granted | — | $ | — | ||||
Vested | (32 | ) | $ | 14.81 | |||
Forfeited or canceled | (7 | ) | $ | 9.96 | |||
Non-vested at July 31, 2017 | — | $ | — | ||||
The total fair value of units vested during the seven months ended July 31, 2017, and the years ended December 31, 2016 and 2015 was approximately $0.5 million, $0.8 million and $2.5 million, respectively.
Employee Stock Purchase Plan - Predecessor
Effective September 1, 2013, we established a noncompensatory employee stock purchase plan (“ESPP”) which permits all regular full-time employees and employees who work part time over 20 hours per week to purchase shares of our common stock at a five percent discount. Annual employee contributions are limited to twenty-five thousand dollars, are voluntary and made through a bi-weekly payroll deduction. Due to low employee participation in the plan, we suspended our ESPP effective July 1, 2016.
On the Effective Date, pursuant to the Plan, (i) all shares of the Company’s pre-Effective Date common stock and all other previously issued and outstanding equity interests in the Company, and any rights of any holder in respect thereof, were canceled and discharged and (ii) all agreements, instruments, and other documents evidencing, relating to or connected with the Company’s pre-Effective Date common stock and all other previously issued and outstanding equity interests of the Company, and any rights of any holder in respect thereof, were canceled and discharged and of no further force or effect. As a result the ESPP was terminated on the Effective Date.
101
Note 17 - Income Taxes
The following table shows the components of the income tax expense (benefit) for the periods indicated:
Successor | Predecessor | |||||||||||||||
Five Months Ended December 31, | Seven Months Ended July 31, | Year Ended December 31, | Year Ended December 31, | |||||||||||||
2017 | 2017 | 2016 | 2015 | |||||||||||||
Current income tax expense (benefit): | ||||||||||||||||
Federal | $ | (251 | ) | $ | — | $ | 477 | $ | (137 | ) | ||||||
State | 146 | 15 | 105 | 21 | ||||||||||||
Total Current | (105 | ) | 15 | 582 | (116 | ) | ||||||||||
Deferred income tax expense (benefit): | ||||||||||||||||
Federal | (186 | ) | (51 | ) | 217 | 115 | ||||||||||
State | (56 | ) | (286 | ) | 8 | (116 | ) | |||||||||
Total Deferred | (242 | ) | (337 | ) | 225 | (1 | ) | |||||||||
Total income tax (benefit) expense from continuing operations | $ | (347 | ) | $ | (322 | ) | $ | 807 | $ | (117 | ) | |||||
A reconciliation of the income tax (expense) benefit and the amount computed by applying the statutory federal income tax rate of 35% to loss from continuing operations before income taxes is as follows:
Successor | Predecessor | |||||||||||
Five Months Ended December 31, | Seven Months Ended July 31, | Year Ended December 31, | Year Ended December 31, | |||||||||
2017 | 2017 | 2016 | 2015 | |||||||||
U.S. federal income tax benefit at statutory rate | 35.0 | % | 35.0 | % | 35.0 | % | 35.0 | % | ||||
State and local income taxes, net of federal benefit | 1.5 | % | 0.8 | % | 3.3 | % | 0.9 | % | ||||
Compensation | (0.5 | )% | 0.1 | % | (0.2 | )% | (0.6 | )% | ||||
Impact of fresh start accounting adjustments | — | % | 3.3 | % | — | % | — | % | ||||
Impairment of goodwill | — | % | — | % | — | % | (18.8 | )% | ||||
Tax Act revaluation of deferred tax balances | 69.9 | % | — | % | — | % | — | % | ||||
Change in valuation allowance | (105.5 | )% | (40.3 | )% | (38.7 | )% | (16.4 | )% | ||||
Other | 0.3 | % | 0.9 | % | 0.1 | % | (0.1 | )% | ||||
Benefit (expense) for income taxes | 0.7 | % | (0.2 | )% | (0.5 | )% | — | % | ||||
102
Significant components of our deferred tax assets and liabilities as of December 31, 2017 and 2016 are as follows:
Successor | Predecessor | ||||||
December 31, | December 31, | ||||||
2017 | 2016 | ||||||
Deferred tax assets: | |||||||
Reserves | $ | 494 | $ | 1,604 | |||
Deferred financing costs | 233 | 530 | |||||
Net operating losses | 65,600 | 123,382 | |||||
Federal credit carryover | 226 | 477 | |||||
Equity based compensation | — | 624 | |||||
Long-term debt | — | 74,412 | |||||
Intangible asset and goodwill | 11,982 | 16,781 | |||||
Capital loss carry forward | 42,671 | 67,766 | |||||
Other | 3,663 | 6,360 | |||||
Total | 124,869 | 291,936 | |||||
Less: Valuation allowance | (88,766 | ) | (236,080 | ) | |||
Total deferred tax assets | 36,103 | 55,856 | |||||
Deferred tax liabilities: | |||||||
Fixed assets | (35,538 | ) | (55,649 | ) | |||
Other | (481 | ) | (702 | ) | |||
Total deferred tax liabilities | (36,019 | ) | (56,351 | ) | |||
Net deferred tax asset (liability) | $ | 84 | $ | (495 | ) | ||
On December 22, 2017, the President of the United States signed into law the Tax Cuts and Jobs Act tax reform legislation (the “Tax Act”). This legislation makes significant changes in U.S. tax law including a reduction in the corporate statutory income tax rates from 35% to 21%, changes to net operating loss carryforwards and carrybacks, and a repeal of the corporate alternative minimum tax. As a result of the enacted law, we were required to revalue deferred tax assets and liabilities as of December 22, 2017 using the new statutory rate and have reflected this revaluation in our effective tax rate reconciliation. The Tax Act’s impact in 2017 reduced the value of our net deferred tax asset balance by $50.8 million at December 31, 2017. As we are subject to a valuation allowance, there was no material impact to our tax provision. The other provisions of the Tax Act did not have a material impact on the 2017 consolidated financial statements.
As of December 31, 2017, we had net operating loss (“NOL”) carryforwards for federal income tax purposes of approximately $251.6 million, which expire in 2031 through 2037, state NOL carryforwards of approximately $277.3 million, which expire in 2018 through 2037, federal alternative minimum tax credits of $0.2 million, which do not expire and will be refunded over a four year period beginning in 2018, and capital loss carryforwards of approximately $188.5 million, which begin to expire in 2019. Pursuant to United States Internal Revenue Code Section 382, if we undergo an ownership change, the NOL carryforward limitations would impose an annual limit on the amount of the taxable income that may be offset by our NOLs generated prior to the ownership change. We have determined that an ownership change occurred on April 15, 2016 as a result of the debt restructuring that occurred during fiscal 2016. In addition, another ownership change occurred on August 7, 2017 as a result of the chapter 11 reorganization described further in Note 4. The limitation under Section 382 may result in federal NOLs expiring unused. Subject to the impact of those rules as a result of past or future restructuring transactions, we may be unable to use all or a significant portion of our NOLs to offset future taxable income.
As required by GAAP, we assess the recoverability of our deferred tax assets on a regular basis and record a valuation allowance for any such assets where recoverability is determined to be not more likely than not. As a result of our continued losses, we determined that our deferred tax liabilities were not sufficient to fully realize our deferred tax assets prior to the expiration of our NOLs, and accordingly, a valuation allowance continues to be required to be recorded against our deferred tax assets. We have recorded a decrease of approximately $147.3 million to our valuation allowance during the year ended December 31, 2017. The decrease in the valuation allowance during 2017 primarily relates to the impact of fresh start accounting adjustments and debt forgiveness, as well as the decrease in the federal statutory income tax rate as a result of the Tax Act. We recorded an increase of approximately $64.4 million to our valuation allowance during the year ended December
103
31, 2016. As a result of the restructuring of our debt in 2016, we realized $211.8 million of cancellation of debt income, of which $65.1 million was excluded from income due to an insolvency exception and $146.7 million was recognized for income tax purposes during the year ended December 31, 2016. We reduced our net operating loss carryforward by the amount of the insolvency exclusion during 2016.
A reconciliation of our valuation allowance on deferred tax assets for the years ended December 31, 2017 and 2016 is as follows:
Successor | Predecessor | |||||||
Year Ended December 31, | Year Ended December 31, | |||||||
2017 | 2016 | |||||||
Balance at beginning of period | $ | 236,080 | $ | 171,720 | ||||
Additions to valuation allowance | — | 64,360 | ||||||
Valuation allowance release, net | (147,314 | ) | — | |||||
Balance at end of period | $ | 88,766 | $ | 236,080 | ||||
As of December 31, 2017 and 2016 we did not have any unrecognized tax benefits as the previous unrecognized tax benefits lapsed due to the statute of limitations.
We recognize potential accrued interest and penalties related to unrecognized tax benefits as a component of income tax expense. We did not have any accrued interest and penalties as of December 31, 2017 and 2016. To the extent interest and penalties are not assessed with respect to uncertain tax positions, amounts accrued will be reduced and reflected as a reduction of the overall income tax provision.
We are subject to the following significant taxing jurisdictions: U.S. federal, Pennsylvania, Louisiana, North Dakota, Ohio, Texas, West Virginia, and Arizona. We have had NOLs in various years for federal purposes and for many states. The statute of limitations for a particular tax year for examination by the Internal Revenue Service is generally three years subsequent to the filing of the associated tax return. However, the Internal Revenue Service can adjust NOL carryovers up to three years subsequent to the last year in which the loss carryover is finally used. Accordingly, there are multiple years open to examination. The statute of limitations is generally three to four years for many of the states where we operate. The Company is currently not under income tax examination in any tax jurisdictions.
Note 18 - Commitments and Contingencies
Environmental Liabilities
We are subject to the environmental protection and health and safety laws and related rules and regulations of the United States and of the individual states, municipalities and other local jurisdictions where we operate. Our continuing operations are subject to rules and regulations promulgated by the Texas Railroad Commission, the Texas Commission on Environmental Quality, the Louisiana Department of Natural Resources, the Louisiana Department of Environmental Quality, the Ohio Department of Natural Resources, the Pennsylvania Department of Environmental Protection, the North Dakota Department of Health, the North Dakota Industrial Commission, Oil and Gas Division, the North Dakota State Water Commission, the Montana Department of Environmental Quality and the Montana Board of Oil and Gas, among others. These laws, rules and regulations address environmental, health and safety and related concerns, including water quality and employee safety. We have installed safety, monitoring and environmental protection equipment such as pressure sensors and relief valves, and have established reporting and responsibility protocols for environmental protection and reporting to such relevant local environmental protection departments as required by law.
We believe we are in material compliance with all applicable environmental protection laws and regulations in the United States and the states in which we operate. We believe that there are no unrecorded liabilities in connection with our compliance with environmental laws and regulations. We did not have any accruals related to environmental matters as of December 31, 2017. The consolidated balance sheet as of December 31, 2016 included accruals totaling $2.8 million for various environmental matters.
104
Lease Obligations
Included in property and equipment in the accompanying consolidated balance sheets are the following assets held under capital leases at December 31, 2017:
Successor | |||
Leased equipment | $ | 9,079 | |
Less accumulated depreciation | (3,241 | ) | |
Leased equipment, net | $ | 5,838 | |
Capital lease obligations consist primarily of vehicle leases with periods expiring at various dates through 2020 at variable interest rates and fixed interest rates, which were approximately 4.12% at December 31, 2017. Capital lease obligations amounted to $3.8 million and $7.7 million, at December 31, 2017 and 2016, respectively.
We also rent transportation equipment, real estate and certain office equipment under operating leases. Certain real estate leases require us to pay maintenance, insurance, taxes and certain other expenses in addition to the stated rentals. Lease expense under operating leases and rental contracts amounted to $5.0 million for the combined Predecessor and Successor periods during the year ended December 31, 2017, $5.4 million for the year ended December 31, 2016, and $6.1 million for the year ended December 31, 2015.
At December 31, 2017, future minimum lease payments, by year and in the aggregate, under all noncancelable leases were as follows at:
Successor | |||||||
Operating Leases | Capital Leases | ||||||
2018 | $ | 3,696 | $ | 2,519 | |||
2019 | 600 | 884 | |||||
2020 | 192 | 622 | |||||
2021 | 131 | — | |||||
2022 | 107 | — | |||||
Thereafter | 572 | — | |||||
Total minimum lease payments | $ | 5,298 | 4,025 | ||||
Less amount representing executory costs | (61 | ) | |||||
Net minimum lease payments | 3,964 | ||||||
Less amount representing interest (4.12% at December 31, 2017) | (200 | ) | |||||
Present value of net minimum lease payments | $ | 3,764 | |||||
Asset Retirement Obligations
At December 31, 2017 and 2016, we had approximately $6.4 million and $3.1 million, respectively, of asset retirement obligations related to our disposal wells and landfill which are recorded in “Other long-term liabilities” in the accompanying consolidated balance sheet.
The following table provides a reconciliation of the beginning and ending balances of our asset retirement obligations as of December 31, 2017 and December 31, 2016:
Successor | Predecessor | |||||||
December 31, 2017 | December 31, 2016 | |||||||
Balance at beginning of period | $ | 3,138 | $ | 3,035 | ||||
Adjustment to increase the net book value to fair value (see Note 4) | 3,050 | — | ||||||
Changes in estimate | 78 | (47 | ) | |||||
Accretion expense | 471 | 150 | ||||||
Cash payments | (302 | ) | — | |||||
Balance at end of period | $ | 6,435 | $ | 3,138 | ||||
105
Surety Bonds and Letters of Credit
At December 31, 2017 and 2016, we had surety bonds outstanding of approximately $8.2 million and $9.8 million, respectively, primarily to support financial assurance obligations related to our landfill and disposal wells. Additionally, at December 31, 2017 and 2016, we had outstanding irrevocable letters of credit totaling $4.0 million and $4.5 million, respectively, to support various agreements, leases and insurance policies.
Note 19 - Legal Matters
There are various lawsuits, claims, investigations and proceedings that have been brought or asserted against us, which arise in the ordinary course of business, including actions with respect to securities and shareholder class actions, personal injury, vehicular and industrial accidents, commercial contracts, legal and regulatory compliance, securities disclosure, labor and employment, and employee benefits and environmental matters, the more significant of which are summarized below. We record a provision for these matters when it is both probable that a liability has been incurred and the amount of the loss can be reasonably estimated. Any provisions are reviewed at least quarterly and are adjusted to reflect the impact and status of settlements, rulings, advice of counsel and other information and events pertinent to a particular matter.
We are subject to various legal proceedings and claims incidental to or arising in the ordinary course of our business. Based on information currently known to our management, we do not expect the outcome in any of these known legal proceedings, individually or collectively, to have a material adverse effect on our consolidated financial condition, results of operations or cash flows. Litigation is inherently unpredictable, however, and it is possible that our financial condition, results of operations or cash flow could be materially affected in any particular period by the resolution of one or more of the legal matters pending against us.
Chapter 11 Proceedings
As previously discussed herein, on May 1, 2017, the Nuverra Parties filed voluntary petitions under chapter 11 of the Bankruptcy Code in the Bankruptcy Court to pursue the Plan. On July 25, 2017, the Bankruptcy Court entered the Confirmation Order confirming the Plan. The Plan became effective on the Effective Date, when all remaining conditions to the effectiveness of the Plan were satisfied or waived. Although the Nuverra Parties emerged from bankruptcy on the Effective Date, the bankruptcy cases will remain pending until closed by the Bankruptcy Court.
AWS Arbitration Demand and Note Payable Settlement
On April 28, 2015, our former partner in AWS issued to us a Demand for Arbitration pursuant to the terms of the AWS operating agreement, relating to alleged breaches by us of certain of our obligations under the operating agreement. We entered into a settlement of this matter with our former partner in June 2015 whereby we purchased the remaining interest in AWS for $4.0 million in cash and a $7.4 million note payable (or the “AWS Note”) with principal and interest due in equal quarterly installments through April 2019. Pursuant to the terms of the AWS Note, if we failed to meet the payment terms of the obligation, or if we became insolvent or declared bankruptcy, all remaining outstanding balances on the AWS Note would become immediately due and payable. As we failed to meet the payment terms of the obligation and filed the chapter 11 cases, all outstanding balances on the AWS Note became immediately due and payable.
Pursuant to Section 362 of the Bankruptcy Code, the filing of the chapter 11 cases automatically stayed most actions against the Nuverra Parties, including actions to collect indebtedness incurred prior to the filing of the Plan or to exercise control over the Nuverra Parties’ property. Subject to certain exceptions under the Bankruptcy Code, the filing of the chapter 11 cases also automatically stayed the continuation of most legal proceedings or the filing of other actions against or on behalf of the Nuverra Parties or their property to recover on, collect or secure a claim arising prior to the filing of the cases or to exercise control over property of the Nuverra Parties’ bankruptcy estates. As a result, the filing of the chapter 11 cases with the Bankruptcy Court automatically stayed any potential action to collect the outstanding balance on the AWS Note.
On July 17, 2017, the Nuverra Parties filed a motion with the Bankruptcy Court seeking authorization to resolve unsecured claims related to the AWS Note. Pursuant to the proposed settlement terms, the Nuverra Parties agreed to transfer to the holders of the AWS Note, their water treatment facility in the Marcellus Shale area, including all assets related to the operations of the water treatment facility in “as-is, where-is” condition, together with $75,000 for reimbursement of certain costs and deferred maintenance. In exchange for the water treatment facility and the $75,000 payment, the holders of the AWS Note agreed to release their claims related to the AWS Note and enter into with certain of the Nuverra Parties a lease of five acres of land that can be used by the Nuverra Parties to operate a truck depot.
106
On July 21, 2017, the Bankruptcy Court entered an order authorizing the AWS Note payable settlement. The settlement, including the transfer of the water treatment facility, was completed during the fourth quarter of 2017.
Confirmation Order Appeal
On July 26, 2017, David Hargreaves, an individual holder of 2018 Notes, appealed the Confirmation Order to the District Court and filed a motion for a stay pending appeal from the District Court. The Company and the unsecured creditors’ committee opposed the stay in the District Court. On August 3, 2017, the District Court entered an order denying the motion for a stay pending appeal. Notwithstanding the denial of the motion for stay pending appeal, Hargreaves’ appeal remains pending in the District Court. The ultimate outcome of this appeal and its effects on the Confirmation Order are impossible to predict with certainty. While we do not expect the appeal to affect the finality, validity, and enforceability of the Confirmation Order, there can be no assurances to that effect.
Note 20 - Employee Benefit Plans
Effective September 1, 2013, we established a defined contribution 401(k) plan (the “Plan”) that is subject to the provisions of the Employee Retirement Income Security Act of 1974. The Plan covers substantially all employees who have met certain eligibility requirements except those employees working less than 25 hours per week. Employees may participate in the Plan on the first day of the first month following 60 days of employment. Historically, we have provided a quarterly match in shares of our common stock equal to 100% of each participant’s annual contribution up to 3% of each participant’s annual compensation and 50% of each participant’s annual contribution up to an additional 2% of each participant’s annual compensation.
In March 2015, we suspended our matching contribution to the Plan. As a result, matching contributions to the Plan were $0.7 million for the year ended December 31, 2015, and there was no matching contribution to the Plan during the year ended December 31, 2016. On April 1, 2017, we reinstated a cash match using the same matching formula we have historically used to calculate the match. Cash matching contributions to the Plan were $1.2 million for the year ended December 31, 2017.
Note 21 - Related Party and Affiliated Company Transactions
Related Party Transactions
Mr. Johnsrud, our former Chairman and Chief Executive Officer, is the sole member of an entity that owns apartment buildings in North Dakota which are rented to certain of our employees at rates that are believed to be equal to or below market rates. We do not pay or indirectly subsidize any portion of these rental payments.
We periodically purchase fresh water for resale to customers from a sole proprietorship owned by Mr. Johnsrud. We did not purchase any fresh water for resale from the sole proprietorship during the year ended December 31, 2017. Our purchases during the years ended December 31, 2016 and 2015 amounted to $0.1 million and $1.3 million, respectively. No amounts were due to the sole proprietorship at December 31, 2017 and 2016, respectively.
Mr. Johnsrud is the sole member of an entity that owns land in North Dakota on which three of our saltwater disposal wells are situated. We have agreed to pay the entity a per-barrel royalty fee in exchange for the use of the land, which is consistent with rates charged by non-affiliated third parties under similar arrangements. We paid royalties of approximately $43.5 thousand, $0.1 million and $0.2 million during years ended December 31, 2017, 2016 and 2015, respectively. There were no royalties payable to the entity as of December 31, 2017 and 2016.
On December 6, 2017, following the approval of the transaction by the Company’s Audit Committee in accordance with the Company’s Corporate Governance Guidelines, we entered into a Salt Water Injection Easement and Surface Use Agreement with Mr. Johnsrud and his spouse for the Best I-1 and Best E-1 wells, which are to be located in McKenzie County, North Dakota. The wells are being constructed on land owned by Mr. Johnsrud and his spouse as part of a joint scientific study with the University of North Dakota Energy & Environmental Research Center. Mr. Johnsrud will be entitled to receive a royalty for salt water injected into the Best I-1 and Best E-1 wells after they become operational.
Cost Method Investment - Underground Solutions, Inc.
During 2009, we acquired an approximate 7% investment in Underground Solutions, Inc. (“UGSI”) a supplier of water infrastructure pipeline products, whose chief executive officer, Andrew D. Seidel, was a member of our board of directors. Our interest in UGSI was accounted for as a cost method investment.
On February 18, 2016, Aegion Corporation (or “Aegion”) announced the completion of the acquisition of UGSI, whereby Aegion paid approximately $85.0 million to acquire UGSI. Our total proceeds as a result of the acquisition were approximately
107
$5.2 million. In April of 2016, we received proceeds of $5.0 million, which exceeded our cost basis of approximately $3.2 million. As such during the three months ended June 30, 2016, we recognized a net gain on the sale of approximately $1.7 million, including approximately $0.1 million in costs incurred by us in the closing. During the three months ended September 30, 2016, and the two months ended September 30, 2017, we received additional proceeds of $53.0 thousand and $76.0 thousand, respectively, due to adjustments to the final closing working capital statement. There still remains approximately $0.1 million in escrow pending the review of other final closing adjustments and indemnifications.
Note 22 - Segments
We evaluate business segment performance based on income (loss) before income taxes exclusive of corporate general and administrative costs and interest expense, which are not allocated to the segments. Our business is divided into three operating divisions, which we consider to be operating and reportable segments of our continuing operations: (1) the Northeast division comprising the Marcellus and Utica Shale areas, (2) the Southern division comprising the Haynesville and Eagle Ford Shale areas and (3) the Rocky Mountain division comprising the Bakken Shale area. Corporate/Other includes certain corporate costs and losses from discontinued operations, as well as assets held for sale and certain other corporate assets.
As discussed in Note 9, in March of 2015, we initiated a plan to restructure our business in certain shale basins and reduce costs, including an exit from the MidCon shale area. As such, revenues and costs associated with revenue generating activities for the MidCon shale area were included in the Southern division for the three months ended March 31, 2015, with minimal or no revenue activity thereafter. As a result of our restructuring in the MidCon, some remaining operating expenses for shut-down activities, as well as depreciation and amortization, neither of which is considered material, have been included in the Southern division for the five months ended December 31, 2017, seven months ended July 31, 2017, and the years ended December 31, 2016 and 2015.
108
Financial information for our reportable segments related to continuing operations is presented below.
Northeast | Southern | Rocky Mountain | Corporate/ Other | Total | |||||||||||||||
Five Months Ended December 31, 2017 - Successor | |||||||||||||||||||
Revenue | $ | 17,234 | $ | 16,467 | $ | 46,487 | $ | — | $ | 80,188 | |||||||||
Direct operating expenses | 14,836 | 12,005 | 40,236 | — | 67,077 | ||||||||||||||
General and administrative expenses | 1,156 | 1,574 | 2,640 | 5,245 | 10,615 | ||||||||||||||
Depreciation and amortization | 10,816 | 9,533 | 18,108 | 94 | 38,551 | ||||||||||||||
Operating loss | (9,574 | ) | (6,883 | ) | (19,163 | ) | (5,339 | ) | (40,959 | ) | |||||||||
Reorganization items, net | (98 | ) | (88 | ) | (939 | ) | (4,382 | ) | (5,507 | ) | |||||||||
Loss from continuing operations before income taxes | (9,819 | ) | (7,106 | ) | (20,219 | ) | (11,098 | ) | (48,242 | ) | |||||||||
Total assets (a) | 54,218 | 111,457 | 137,213 | 8,434 | 311,322 | ||||||||||||||
Seven Months Ended July 31, 2017 - Predecessor | |||||||||||||||||||
Revenue | 20,751 | 18,586 | 56,546 | — | 95,883 | ||||||||||||||
Direct operating expenses | 21,117 | 13,056 | 46,837 | — | 81,010 | ||||||||||||||
General and administrative expenses | 1,917 | 1,684 | 3,877 | 15,074 | 22,552 | ||||||||||||||
Depreciation and amortization | 5,352 | 7,542 | 15,964 | 123 | 28,981 | ||||||||||||||
Operating loss | (7,635 | ) | (3,696 | ) | (10,132 | ) | (15,197 | ) | (36,660 | ) | |||||||||
Reorganization items, net | 28,000 | 22,448 | (4,658 | ) | 177,704 | 223,494 | |||||||||||||
Loss from continuing operations before income taxes | 20,194 | 18,650 | (14,854 | ) | 144,299 | 168,289 | |||||||||||||
Year Ended December 31, 2016 - Predecessor | |||||||||||||||||||
Revenue | 36,446 | 33,166 | 82,564 | — | 152,176 | ||||||||||||||
Direct operating expenses | 36,673 | 27,885 | 65,066 | — | 129,624 | ||||||||||||||
General and administrative expenses | 2,632 | 2,951 | 5,951 | 25,479 | 37,013 | ||||||||||||||
Depreciation and amortization | 13,446 | 15,559 | 31,498 | 260 | 60,763 | ||||||||||||||
Operating loss | (24,330 | ) | (15,656 | ) | (51,663 | ) | (25,739 | ) | (117,388 | ) | |||||||||
Loss from continuing operations before income taxes | (24,226 | ) | (15,741 | ) | (51,951 | ) | (74,896 | ) | (166,814 | ) | |||||||||
Total assets (a) | 46,094 | 107,350 | 184,116 | 5,044 | 342,604 | ||||||||||||||
Year Ended December 31, 2015 - Predecessor | |||||||||||||||||||
Revenue | 92,135 | 68,543 | 196,021 | — | 356,699 | ||||||||||||||
Direct operating expenses | 74,364 | 58,303 | 147,214 | — | 279,881 | ||||||||||||||
General and administrative expenses | 4,606 | 4,891 | 6,824 | 23,006 | 39,327 | ||||||||||||||
Depreciation and amortization | 16,667 | 18,188 | 35,043 | 613 | 70,511 | ||||||||||||||
Operating loss | (3,624 | ) | (19,422 | ) | (97,781 | ) | (24,012 | ) | (144,839 | ) | |||||||||
Loss from continuing operations before income taxes | (4,228 | ) | (19,526 | ) | (97,632 | ) | (73,898 | ) | (195,284 | ) | |||||||||
(a) Total assets exclude intercompany receivables eliminated in consolidation.
Note 23 - Discontinued Operations
Following an assessment of various alternatives regarding our industrial solutions business in the third quarter of 2013 and a decision to focus exclusively on its shale solutions business, our board of directors approved and committed to a plan to divest Thermo Fluids Inc. (“TFI”) in the fourth quarter of 2013. On February 4, 2015, we entered into a definitive agreement with Safety-Kleen, Inc. (“Safety-Kleen”), a subsidiary of Clean Harbors, Inc., whereby Safety-Kleen agreed to acquire TFI for $85.0 million in an all-cash transaction, subject to working capital adjustments.
109
On April 11, 2015, we completed the TFI disposition with Safety-Kleen as contemplated by the previously disclosed purchase agreement. Pursuant to the purchase agreement, the purchase price paid at closing was adjusted based upon an estimated working capital adjustment, subject to a post-closing reconciliation, to reflect TFI’s actual working capital (calculated in accordance with the purchase agreement) on the closing date. After giving effect to the indemnity escrow, the estimated working capital adjustment and the payment of transaction fees and other expenses, the amount of net cash proceeds on the closing date was approximately $74.6 million.
Also pursuant to the purchase agreement, $4.3 million of the purchase price was deposited into an escrow account to satisfy our indemnification obligations under the purchase agreement. The post-closing working capital reconciliation was completed during the year ended December 31, 2016, and as a result we recorded an additional loss on the sale of TFI of $1.3 million, bringing the total loss on sale to $1.5 million. A total of $4.3 million was released from escrow, of which $3.0 million was returned to us and $1.3 million was paid to Safety-Kleen for the post-closing working capital reconciliation and certain indemnification claims.
We classified TFI as discontinued operations in our consolidated statements of operations for the years ended December 31, 2016 and 2015. As the final post-closing working capital reconciliation was completed during the year ended December 31, 2016, there was no activity related to TFI for the five months ended December 31, 2017, or the seven months ended July 31, 2017. The following table provides selected financial information of discontinued operations related to TFI:
Predecessor | ||||||||
Year Ended December 31, | Year Ended December 31, | |||||||
2016 | 2015 | |||||||
Revenue | $ | — | $ | 19,100 | ||||
Income from discontinued operations before income taxes | $ | — | $ | 1,171 | ||||
Income tax expense | — | (265 | ) | |||||
Income from discontinued operations | $ | — | $ | 906 | ||||
Loss on sale of TFI, net of taxes | (1,235 | ) | (1,193 | ) | ||||
Loss on discontinued operations, net of income taxes | $ | (1,235 | ) | $ | (287 | ) | ||
Note 24 - Selected Quarterly Financial Data (Unaudited)
Summarized quarterly financial information for 2017 and 2016 is as follows:
Predecessor | Successor | |||||||||||||||||||
Three Months Ended | Three Months Ended | One Month Ended | Two Months Ended | Three Months Ended | ||||||||||||||||
March 31, | June 30, | July 31, | September 30, | December 31, | ||||||||||||||||
2017 | ||||||||||||||||||||
Revenue | $ | 39,223 | $ | 41,538 | 15,122 | $ | 33,758 | $ | 46,430 | |||||||||||
(Loss) income from continuing operations | (35,962 | ) | (19,587 | ) | 224,160 | (16,993 | ) | (30,902 | ) | |||||||||||
Net (loss) income | (35,962 | ) | (19,587 | ) | 224,160 | (16,993 | ) | (30,902 | ) | |||||||||||
Earnings per common share: | ||||||||||||||||||||
Net (loss) income per basic common share | $ | (0.24 | ) | $ | (0.13 | ) | 1.48 | $ | (1.45 | ) | $ | (2.64 | ) | |||||||
Net (loss) income per diluted common share | (0.24 | ) | (0.13 | ) | 1.42 | (1.45 | ) | (2.64 | ) | |||||||||||
110
Predecessor | ||||||||||||||||
Three Months Ended | ||||||||||||||||
March 31, | June 30, | September 30, | December 31, | |||||||||||||
2016 | ||||||||||||||||
Revenue | $ | 46,975 | $ | 33,978 | $ | 35,441 | $ | 35,782 | ||||||||
Loss from continuing operations | (27,271 | ) | (40,638 | ) | (38,396 | ) | (61,316 | ) | ||||||||
Income (loss) from discontinued operations | 55 | (1,290 | ) | — | — | |||||||||||
Net loss | (27,216 | ) | (41,928 | ) | (38,396 | ) | (61,316 | ) | ||||||||
Earnings per common share: | ||||||||||||||||
Basic and diluted loss from continuing operations | (0.98 | ) | (0.60 | ) | (0.30 | ) | (0.45 | ) | ||||||||
Basic and diluted loss from discontinued operations | — | (0.02 | ) | — | — | |||||||||||
Net loss per basic and diluted common share | $ | (0.98 | ) | $ | (0.62 | ) | $ | (0.30 | ) | $ | (0.45 | ) | ||||
Note 25 - Subsidiary Guarantors
The 2018 Notes and the 2021 Notes of the Predecessor Company were registered securities. As a result of these registered securities, we are required to present the following condensed consolidating financial information for the Predecessor periods pursuant to Rule 3-10 of SEC Regulation S-X, Financial Statements of Guarantors and Issuers of Guaranteed Securities Registered or Being Registered. Our Successor Revolving Facility, Successor First Lien Term Loan, and Successor Second Lien Term Loan are not registered securities. Therefore, the presentation of condensed consolidating financial information is not required for the Successor period.
The following tables present consolidating financial information for Nuverra Environmental Solutions, Inc. (“Parent”) and its 100% wholly-owned subsidiaries (the “Guarantor Subsidiaries”) as of December 31, 2016, for the seven months ended July 31, 2017, and for the years ended December 31, 2016 and 2015.
111
CONSOLIDATING BALANCE SHEET
DECEMBER 31, 2016
Predecessor | |||||||||||||||
Parent | Guarantor Subsidiaries | Eliminations | Consolidated | ||||||||||||
ASSETS | |||||||||||||||
Cash and cash equivalents | $ | 913 | $ | 81 | $ | — | $ | 994 | |||||||
Restricted cash | 475 | 945 | — | 1,420 | |||||||||||
Accounts receivable, net | — | 23,795 | — | 23,795 | |||||||||||
Other current assets | 1,022 | 5,065 | — | 6,087 | |||||||||||
Assets held for sale | — | 1,182 | — | 1,182 | |||||||||||
Total current assets | 2,410 | 31,068 | — | 33,478 | |||||||||||
Property, plant and equipment, net | 2,363 | 291,816 | — | 294,179 | |||||||||||
Equity investments | (51,590 | ) | 73 | 51,590 | 73 | ||||||||||
Intangible assets, net | — | 14,310 | — | 14,310 | |||||||||||
Other assets | 363,291 | 94,388 | (457,115 | ) | 564 | ||||||||||
Total assets | $ | 316,474 | $ | 431,655 | $ | (405,525 | ) | $ | 342,604 | ||||||
LIABILITIES AND EQUITY | |||||||||||||||
Accounts payable | $ | 412 | $ | 3,635 | $ | — | $ | 4,047 | |||||||
Accrued liabilities | 6,961 | 11,826 | — | 18,787 | |||||||||||
Current contingent consideration | — | — | — | — | |||||||||||
Current portion of long-term debt | 459,313 | 6,522 | — | 465,835 | |||||||||||
Derivative warrant liability | 4,298 | — | — | 4,298 | |||||||||||
Total current liabilities | 470,984 | 21,983 | — | 492,967 | |||||||||||
Deferred income taxes | (71,645 | ) | 72,140 | — | 495 | ||||||||||
Long-term debt | — | 5,956 | — | 5,956 | |||||||||||
Long-term contingent consideration | — | 8,500 | — | 8,500 | |||||||||||
Other long-term liabilities | 86,201 | 374,666 | (457,115 | ) | 3,752 | ||||||||||
Total shareholders’ deficit | (169,066 | ) | (51,590 | ) | 51,590 | (169,066 | ) | ||||||||
Total liabilities and shareholders’ deficit | $ | 316,474 | $ | 431,655 | $ | (405,525 | ) | $ | 342,604 | ||||||
112
CONSOLIDATING STATEMENTS OF OPERATIONS
SEVEN MONTHS ENDED JULY 31, 2017
Predecessor | |||||||||||||||
Parent | Guarantor Subsidiaries | Eliminations | Consolidated | ||||||||||||
Revenue | $ | — | $ | 95,883 | $ | — | $ | 95,883 | |||||||
Costs and expenses: | |||||||||||||||
Direct operating expenses | — | 81,010 | — | 81,010 | |||||||||||
General and administrative expenses | 15,074 | 7,478 | — | 22,552 | |||||||||||
Depreciation and amortization | 123 | 28,858 | — | 28,981 | |||||||||||
Total costs and expenses | 15,197 | 117,346 | — | 132,543 | |||||||||||
Loss from operations | (15,197 | ) | (21,463 | ) | — | (36,660 | ) | ||||||||
Interest expense, net | (22,333 | ) | (459 | ) | — | (22,792 | ) | ||||||||
Other income, net | 4,125 | 136 | — | 4,261 | |||||||||||
Income (loss) from equity investments | 101,462 | (14 | ) | (101,462 | ) | (14 | ) | ||||||||
Reorganization items, net | 177,704 | 45,790 | — | 223,494 | |||||||||||
Income (loss) from continuing operations before income taxes | 245,761 | 23,990 | (101,462 | ) | 168,289 | ||||||||||
Income tax (expense) benefit (a) | (77,150 | ) | 77,472 | — | 322 | ||||||||||
Income (loss) from continuing operations | 168,611 | 101,462 | (101,462 | ) | 168,611 | ||||||||||
Loss from discontinued operations, net of income taxes | — | — | — | — | |||||||||||
Net income (loss) | $ | 168,611 | $ | 101,462 | $ | (101,462 | ) | $ | 168,611 | ||||||
(a) The Parent's tax benefit offsets the tax expense reflected in the Guarantor Subsidiaries.
113
CONSOLIDATING STATEMENTS OF OPERATIONS
YEAR ENDED DECEMBER 31, 2016
Predecessor | |||||||||||||||
Parent | Guarantor Subsidiaries | Eliminations | Consolidated | ||||||||||||
Revenue | $ | — | $ | 152,176 | $ | — | $ | 152,176 | |||||||
Costs and expenses: | |||||||||||||||
Direct operating expenses | — | 129,624 | — | 129,624 | |||||||||||
General and administrative expenses | 25,479 | 11,534 | — | 37,013 | |||||||||||
Depreciation and amortization | 260 | 60,503 | — | 60,763 | |||||||||||
Impairment of long-lived assets | — | 42,164 | — | 42,164 | |||||||||||
Total costs and expenses | 25,739 | 243,825 | — | 269,564 | |||||||||||
Loss from operations | (25,739 | ) | (91,649 | ) | — | (117,388 | ) | ||||||||
Interest expense, net | (53,541 | ) | (989 | ) | — | (54,530 | ) | ||||||||
Other income, net | 3,311 | 752 | — | 4,063 | |||||||||||
Loss on extinguishment of debt | (674 | ) | — | — | (674 | ) | |||||||||
(Loss) income from equity investments | (126,597 | ) | (32 | ) | 128,344 | 1,715 | |||||||||
(Loss) income from continuing operations before income taxes | (203,240 | ) | (91,918 | ) | 128,344 | (166,814 | ) | ||||||||
Income tax benefit (expense) | 35,619 | (36,426 | ) | — | (807 | ) | |||||||||
(Loss) income from continuing operations | (167,621 | ) | (128,344 | ) | 128,344 | (167,621 | ) | ||||||||
Loss from discontinued operations, net of income taxes | (1,235 | ) | — | — | (1,235 | ) | |||||||||
Net (loss) income | $ | (168,856 | ) | $ | (128,344 | ) | $ | 128,344 | $ | (168,856 | ) | ||||
114
CONSOLIDATING STATEMENTS OF OPERATIONS
YEAR ENDED DECEMBER 31, 2015
Predecessor | |||||||||||||||
Parent | Guarantor Subsidiaries | Eliminations | Consolidated | ||||||||||||
Revenue | $ | — | $ | 356,699 | $ | — | $ | 356,699 | |||||||
Costs and expenses: | |||||||||||||||
Direct operating expenses | — | 279,881 | — | 279,881 | |||||||||||
General and administrative expenses | 23,006 | 16,321 | — | 39,327 | |||||||||||
Depreciation and amortization | 613 | 69,898 | — | 70,511 | |||||||||||
Impairment of goodwill | — | 104,721 | — | 104,721 | |||||||||||
Other, net | 393 | 6,705 | — | 7,098 | |||||||||||
Total costs and expenses | 24,012 | 477,526 | — | 501,538 | |||||||||||
Loss from operations | (24,012 | ) | (120,827 | ) | — | (144,839 | ) | ||||||||
Interest expense, net | (47,741 | ) | (1,453 | ) | — | (49,194 | ) | ||||||||
Other income, net | — | 958 | — | 958 | |||||||||||
Loss on extinguishment of debt | (2,145 | ) | — | — | (2,145 | ) | |||||||||
(Loss) income from equity investments | (130,855 | ) | (64 | ) | 130,855 | (64 | ) | ||||||||
(Loss) income from continuing operations before income taxes | (204,753 | ) | (121,386 | ) | 130,855 | (195,284 | ) | ||||||||
Income tax benefit (expense) | 9,586 | (9,469 | ) | — | 117 | ||||||||||
(Loss) income from continuing operations | (195,167 | ) | (130,855 | ) | 130,855 | (195,167 | ) | ||||||||
Loss from discontinued operations, net of income taxes | (287 | ) | — | — | (287 | ) | |||||||||
Net (loss) income | $ | (195,454 | ) | $ | (130,855 | ) | $ | 130,855 | $ | (195,454 | ) | ||||
115
CONSOLIDATING STATEMENT OF CASH FLOWS
SEVEN MONTHS ENDED JULY 31, 2017
Predecessor | |||||||||||
Parent | Guarantor Subsidiaries | Consolidated | |||||||||
Cash flows from operating activities: | |||||||||||
Net cash used in operating activities | (18,672 | ) | (277 | ) | (18,949 | ) | |||||
Cash flows from investing activities: | |||||||||||
Proceeds from the sale of property and equipment | — | 3,083 | 3,083 | ||||||||
Purchase of property, plant and equipment | — | (3,149 | ) | (3,149 | ) | ||||||
Change in restricted cash | (5,666 | ) | (719 | ) | (6,385 | ) | |||||
Net cash used in investing activities | (5,666 | ) | (785 | ) | (6,451 | ) | |||||
Cash flows from financing activities: | |||||||||||
Proceeds from Predecessor revolving credit facility | 106,785 | — | 106,785 | ||||||||
Payments on Predecessor revolving credit facility | (129,964 | ) | — | (129,964 | ) | ||||||
Proceeds from Predecessor term loan | 15,700 | — | 15,700 | ||||||||
Proceeds from debtor in possession term loan | 6,875 | — | 6,875 | ||||||||
Proceeds from Successor First and Second Lien Term Loans | 36,053 | — | 36,053 | ||||||||
Payments for debt issuance costs | (1,053 | ) | — | (1,053 | ) | ||||||
Payments on vehicle financing and other financing activities | — | (2,797 | ) | (2,797 | ) | ||||||
Net cash provided by (used in) financing activities | 34,396 | (2,797 | ) | 31,599 | |||||||
Net increase (decrease) in cash | 10,058 | (3,859 | ) | 6,199 | |||||||
Cash and cash equivalents - beginning of year | 913 | 81 | 994 | ||||||||
Cash and cash equivalents - end of year | $ | 10,971 | $ | (3,778 | ) | $ | 7,193 | ||||
116
CONSOLIDATING STATEMENT OF CASH FLOWS
YEAR ENDED DECEMBER 31, 2016
Predecessor | |||||||||||
Parent | Guarantor Subsidiaries | Consolidated | |||||||||
Cash flows from operating activities: | |||||||||||
Net cash (used in) provided by operating activities | (28,392 | ) | 2,141 | (26,251 | ) | ||||||
Cash flows from investing activities: | |||||||||||
Proceeds from the sale of property and equipment | 27 | 10,669 | 10,696 | ||||||||
Purchase of property, plant and equipment | — | (3,826 | ) | (3,826 | ) | ||||||
Proceeds from the sale of UGSI | 5,032 | — | 5,032 | ||||||||
Change in restricted cash | 3,775 | (945 | ) | 2,830 | |||||||
Net cash provided by investing activities | 8,834 | 5,898 | 14,732 | ||||||||
Cash flows from financing activities: | |||||||||||
Proceeds from Predecessor revolving credit facility | 154,514 | — | 154,514 | ||||||||
Payments on Predecessor revolving credit facility | (233,667 | ) | — | (233,667 | ) | ||||||
Proceeds from Predecessor term loan | 55,000 | — | 55,000 | ||||||||
Payments for debt issuance costs | (1,029 | ) | — | (1,029 | ) | ||||||
Issuance of Predecessor stock | 5,000 | — | 5,000 | ||||||||
Payments on vehicle financing and other financing activities | (7 | ) | (6,607 | ) | (6,614 | ) | |||||
Net cash used in financing activities | (20,189 | ) | (6,607 | ) | (26,796 | ) | |||||
Net (decrease) increase in cash | (39,747 | ) | 1,432 | (38,315 | ) | ||||||
Cash and cash equivalents - beginning of year | 40,660 | (1,351 | ) | 39,309 | |||||||
Cash and cash equivalents - end of year | $ | 913 | $ | 81 | $ | 994 | |||||
117
CONSOLIDATING STATEMENT OF CASH FLOWS
YEAR ENDED DECEMBER 31, 2015
Predecessor | |||||||||||
Parent | Guarantor Subsidiaries | Consolidated | |||||||||
Cash flows from operating activities: | |||||||||||
Net cash provided by operating activities from continuing operations | $ | 33,977 | $ | 15,850 | $ | 49,827 | |||||
Net cash used in operating activities from discontinued operations | — | (708 | ) | (708 | ) | ||||||
Net cash provided by operating activities | 33,977 | 15,142 | 49,119 | ||||||||
Cash flows from investing activities: | |||||||||||
Proceeds from the sale of TFI | 78,897 | — | 78,897 | ||||||||
Proceeds from the sale of property and equipment | 255 | 12,477 | 12,732 | ||||||||
Purchase of property, plant and equipment | — | (19,201 | ) | (19,201 | ) | ||||||
Change in restricted cash | (4,250 | ) | — | (4,250 | ) | ||||||
Net cash provided by (used in) investing activities from continuing operations | 74,902 | (6,724 | ) | 68,178 | |||||||
Net cash used in investing activities from discontinued operations | — | (181 | ) | (181 | ) | ||||||
Net cash provided by (used in) investing activities | 74,902 | (6,905 | ) | 67,997 | |||||||
Cash flows from financing activities: | |||||||||||
Payments on Predecessor revolving credit facility | (81,647 | ) | — | (81,647 | ) | ||||||
Payments for debt issuance costs | (225 | ) | — | (225 | ) | ||||||
Payments on vehicle financing and other financing activities | (148 | ) | (11,098 | ) | (11,246 | ) | |||||
Net cash used in financing activities from continuing operations | (82,020 | ) | (11,098 | ) | (93,118 | ) | |||||
Net cash used in financing activities from discontinued operations | — | (105 | ) | (105 | ) | ||||||
Net cash used in financing activities | (82,020 | ) | (11,203 | ) | (93,223 | ) | |||||
Net increase (decrease) in cash | 26,859 | (2,966 | ) | 23,893 | |||||||
Cash and cash equivalents - beginning of year | 13,801 | 1,615 | 15,416 | ||||||||
Cash and cash equivalents - end of year | 40,660 | (1,351 | ) | 39,309 | |||||||
Less: cash and cash equivalents of discontinued operations - end of year | — | — | — | ||||||||
Cash and cash equivalents of continuing operations - end of year | $ | 40,660 | $ | (1,351 | ) | $ | 39,309 | ||||
118
Note 26 - Subsequent Events
On March 1, 2018, the Board determined it was in the best interests of the Company to cease our operations in the Eagle Ford Shale area in order to focus on other opportunities. As a result, the Company plans to exit the Eagle Ford Shale area and will begin divesting the assets used in the operation of our business in that basin. The Company expects to complete the closure of our business in the Eagle Ford Shale area by the end of the second quarter of fiscal 2018.
119