Attached files
| file | filename |
|---|---|
| EXCEL - IDEA: XBRL DOCUMENT - Nuverra Environmental Solutions, Inc. | Financial_Report.xls |
| EX-23.1 - CONSENT OF KPMG LLP - Nuverra Environmental Solutions, Inc. | d266990dex231.htm |
| EX-31.2 - CERTIFICATION OF CHIEF FINANCIAL OFFICER - Nuverra Environmental Solutions, Inc. | d266990dex312.htm |
| EX-23.2 - CONSENT OF GHP HORWATH, P.C. - Nuverra Environmental Solutions, Inc. | d266990dex232.htm |
| EX-32.1 - CERTIFICATION OF CEO AND CFO - Nuverra Environmental Solutions, Inc. | d266990dex321.htm |
| EX-21.1 - SUBSIDIARIES OF HECKMANN CORP - Nuverra Environmental Solutions, Inc. | d266990dex211.htm |
| EX-31.1 - CERTIFICATION OF CHIEF EXECUTIVE OFFICER - Nuverra Environmental Solutions, Inc. | d266990dex311.htm |
Table of Contents
UNITED STATES
SECURITIES AND EXCHANGE COMMISSION
Washington, D.C. 20549
FORM 10-K
| x | ANNUAL REPORT PURSUANT TO SECTION 13 OR 15(d) OF THE SECURITIES EXCHANGE ACT OF 1934 |
For the fiscal year ended: December 31, 2011
| ¨ | TRANSITION REPORT PURSUANT TO SECTION 13 OR 15(d) OF THE SECURITIES EXCHANGE ACT OF 1934 |
For the transition period from to
Commission File Number: 001-33816

Heckmann Corporation
(A Delaware Corporation)
I.R.S. Employer Identification No. 26-0287117
300 Cherrington Parkway, Suite 200, Coraopolis, Pennsylvania 15108
Telephone: (412) 329-7275
Securities registered pursuant to Section 12(b) of the Act:
| Title of each class |
Name of each exchange on which registered | |
| Common Stock, $0.001 par value | New York Stock Exchange |
Securities registered pursuant to Section 12(g) of the Act:
None
Indicate by check mark if the registrant is a well-known seasoned issuer, as defined in Rule 405 of the Securities Act. Yes ¨ No x
Indicate by check mark if the registrant is not required to file reports pursuant to Section 13 or Section 15(d) of the Act. Yes ¨ No x
Indicate by check mark whether the registrant (1) has filed all reports required to be filed by Section 13 or 15(d) of the Securities Exchange Act of 1934 during the preceding 12 months (or for such shorter period that the registrant was required to file such reports), and (2) has been subject to such filing requirements for the past 90 days. Yes x No ¨
Indicate by check mark whether the registrant has submitted electronically and posted on its corporate website, if any, every Interactive Data File required to be submitted and posted pursuant to Rule 405 of Regulation S-T during the preceding 12 months (or for such shorter period that the registrant was required to submit and post such files). Yes x No ¨
Indicate by check mark if disclosure of delinquent filers pursuant to Item 405 of Regulation S-K is not contained herein, and will not be contained, to the best of registrant’s knowledge, in definitive proxy or information statements incorporated by reference in Part III of this Form 10-K or any amendment to this Form 10-K. x
Indicate by check mark whether the Company is a large accelerated filer, an accelerated filer, a non-accelerated filer, or a smaller reporting company. See definitions of “large accelerated filer,” “accelerated filer,” and “smaller reporting company” in Rule 12b-2 of the Exchange Act. (Check one):
| Large accelerated filer | ¨ | Accelerated filer | x | |||
| Non-accelerated filer | ¨ (Do not check if a smaller reporting company) | Smaller reporting company | ¨ |
Indicate by check mark whether the Company is a shell company (as defined in Rule 12b-2 of the Exchange Act). Yes ¨ No x
As of June 30, 2011, the last business day of the registrant’s most recently completed second fiscal quarter, the aggregate market value of the voting and non-voting common equity held by non-affiliates of the registrant was $632,552,451 based on the closing sale price on such date as reported on the New York Stock Exchange. Shares held by executive officers, directors and persons owning directly or indirectly more than 10% of the outstanding common stock have been excluded from the preceding number because such persons may be deemed to be affiliates of the registrant. This determination of affiliate status is not necessarily a conclusive determination for any other purposes.
The number of shares outstanding of the registrant’s common stock as of March 5, 2012 was 126,726,124.
Documents Incorporated by Reference
Portions of the registrant’s Proxy Statement for the 2012 Annual Meeting of Stockholders to be held on May 8, 2012, are incorporated by reference into Part III, Items 10-14 of this Annual Report on Form 10-K.
Table of Contents
HECKMANN CORPORATION AND SUBSIDIARIES
FORM 10-K
ANNUAL REPORT For the Year Ended December 31, 2011
| Page | ||||||
| Item 1. |
3 | |||||
| Item 1A. |
12 | |||||
| Item 1B. |
23 | |||||
| Item 2. |
23 | |||||
| Item 3. |
23 | |||||
| Item 4. |
24 | |||||
| Item 5. |
25 | |||||
| Item 6. |
27 | |||||
| Item 7. |
Management’s Discussion and Analysis of Financial Condition and Results of Operations |
29 | ||||
| Item 7A. |
40 | |||||
| Item 8. |
40 | |||||
| Item 9. |
Changes in and Disagreements with Accountants on Accounting and Financial Disclosure |
40 | ||||
| Item 9A. |
40 | |||||
| Item 9B. |
42 | |||||
| Item 10. |
43 | |||||
| Item 11. |
43 | |||||
| Item 12. |
Security Ownership of Certain Beneficial Owners and Management and Related Stockholder Matters |
43 | ||||
| Item 13. |
Certain Relationships and Related Transactions, and Director Independence |
43 | ||||
| Item 14. |
43 | |||||
| Item 15. |
44 | |||||
| 45 | ||||||
| 45 | ||||||
| F-1 | ||||||
Table of Contents
Cautionary Note on Forward-Looking Statements
In addition to historical information, this Annual Report contains forward-looking statements within the meaning of Section 27A of the United States Securities Act of 1933, as amended or the “Securities Act” and Section 21E of the United States Securities Exchange Act of 1934, as amended or the “Exchange Act”. These statements relate to our expectations for future events and time periods. All statements other than statements of historical fact are statements that could be deemed to be forward-looking statements, including, but not limited to, statements regarding:
| • | future financial performance and growth targets or expectations; |
| • | market and industry trends and developments; |
| • | the benefits of our completed and future acquisition and disposition transactions and our expansion plans and opportunities, including future acquisitions; and |
| • | plans to increase operational capacity, including well and pipeline construction or expansion. |
You can identify these and other forward-looking statements by the use of words such as “anticipates,” “expects,” “intends,” “plans,” “predicts,” “believes,” “seeks,” “estimates,” “may,” “will,” “should,” “would,” “could,” “potential,” “future,” “continue,” “ongoing,” “forecast,” “project,” “target” or similar expressions, and variations or negatives of these words.
These forward-looking statements are based on information available to us as of the date of this Annual Report and our current expectations, forecasts and assumptions and involve a number of risks and uncertainties. Accordingly, forward-looking statements should not be relied upon as representing our views as of any subsequent date and we do not undertake any obligation to update forward-looking statements to reflect events or circumstances after the date they were made.
Future performance cannot be ensured. Actual results may differ materially from those in the forward-looking statements. Some factors that could cause actual results to differ include:
| • | financial results that may be volatile and may not reflect historical trends due to, among other things, acquisition and disposition activities, fluctuations in consumer trends, pricing pressures, changes in raw material or labor prices or rates related to our business and changing regulations or political developments in the markets in which we operate; |
| • | difficulties encountered in integrating acquired assets, businesses and management teams; |
| • | our ability to attract, motivate and retain key executives and qualified employees in key areas of our business; |
| • | fluctuations in prices and demand for commodities such as natural gas and oil; |
| • | changes in customer drilling activities and capital expenditure plans, including impacts due to low natural gas prices; |
| • | difficulties in identifying and completing acquisitions and differences in the type and availability to us of consideration or financing for such acquisitions; |
| • | risks associated with the operation, construction and development of salt water disposal wells and pipelines, including access to additional disposal well locations and pipeline rights-of-way, and unscheduled delays or inefficiencies; |
| • | the effects of competition in the markets in which we operate, including the adverse impact of competitive product announcements or new entrants into our markets; |
| • | changes in economic conditions in the markets in which we operate or in the world generally; |
1
Table of Contents
| • | reduced demand for our services, including due to regulatory or other influences related to extraction methods such as hydrofracturing, or the loss of key customers; |
| • | control of costs and expenses; |
| • | present and possible future claims, litigation or enforcement actions or investigations; |
| • | natural disasters, such as hurricanes, earthquakes and floods, or acts of terrorism that may impact our corporate headquarters or our assets, including our wells or pipelines, our distribution channels, or which otherwise disrupt the markets we serve; |
| • | the threat or occurrence of international armed conflict and terrorist activities; |
| • | the unknown future impact on our business from the Dodd-Frank Wall Street Reform and Consumer Protection Act and the rules to be promulgated under it; |
| • | risks involving developments in environmental or other governmental laws and regulations in the markets in which we operate and our ability to effectively respond to those developments including laws and regulations relating to oil and gas extraction businesses, particularly relating to water usage, disposal, transportation and treatment; and |
| • | other risks identified in this Annual Report. |
You are cautioned not to place undue reliance on any forward-looking statements, which speak only as of the date of this Annual Report. Except as required by law, we do not undertake any obligation to update or release any revisions to these forward-looking statements to reflect any events or circumstances, whether as a result of new information, future events, changes in assumptions or otherwise, after the date hereof.
When used in this Annual Report, the terms “Heckmann,” the “Company,” “we,” “our,” and “us” refer to Heckmann Corporation and its consolidated subsidiaries, unless otherwise specified.
2
Table of Contents
| Item 1. | Business |
Our Business
Overview
Heckmann Corporation was incorporated in Delaware on May 29, 2007, as a blank check company. We moved our corporate headquarters in 2011 from California to Pittsburgh, Pennsylvania, where we are located in the heart of some of our core operating areas. We currently have a single reporting segment, our water solutions for energy development business.
We are a services-based company focused on total water and wastewater solutions for shale or “unconventional” oil and gas exploration and production. We address the pervasive demand for diverse water and wastewater solutions required for the exploration and production of oil and gas in an integrated and efficient manner through various service and product offerings. Our services include water delivery and disposal, trucking, fluids handling, treatment, temporary and permanent pipeline facilities, and water infrastructure services for oil and gas exploration and production companies. All of our operations included in our water solutions for energy development business segment are branded as Heckmann Water Resources, or “HWR.” We also hold a minority interest in the water infrastructure solutions and pipeline supplier Underground Solutions, Inc., or “UGSI”, (OTC: UGSI).
We currently operate multi-modal water disposal, treatment, trucking and pipeline transportation operations in select shale areas in the United States, including the Eagle Ford, Haynesville, Marcellus, Utica, Barnett and Tuscaloosa Marine Shale areas. We are currently extending our businesses and operations into other hydrocarbon-rich shale areas. We serve customers seeking fresh water acquisition, temporary water transmission and storage, transportation, treatment or disposal of fresh water and complex water flows, such as flowback and produced brine water, in connection with shale oil and gas hydraulic fracturing drilling, or “hydrofracturing,” operations. We also transport fresh water for production and provide services for site preparation, water pit excavations and remediation. At each of our wastewater disposal wells, we also separate and recover meaningful amounts of waste oil for reprocessing and sale into the secondary market.
Hydrofracturing is a procedure whereby packers (plugs) are set every 250 feet to 300 feet of the horizontal portion of the well bore and up to ten 2,000 horsepower hydraulic pumps deliver high pressure fluids that contain microscopic ceramic beads or sand that are utilized as proppants and keep the fissures and fractures open along the bedding-planes created by the high pressure fluids. The fissures and fractures created by the high pressure fluid and held open by sand or ceramic beads that are left behind provide a pathway to allow the gas and oil to flow into the drill hole. Each hydrofractured well uses millions of gallons of water, depending on the particular formation and the depth of the vertical portion of the well and length of the horizontal portion. The fresh water for hydrofracturing must be delivered and stored near the well pad for use over several weeks during the hydrofracturing process. The water comes back to the surface beginning with the well flowback, and continues to flow as produced water throughout the life of the well. The initial flowback and subsequent produced water has to be transported and treated for reuse or disposed.
3
Table of Contents
Our strategy is to provide an integrated and efficient complete water solution to our customers through a full suite of services which we have built and will continue to build through organic growth and acquisitions. Our largest water solutions acquisition to date, Complete Vacuum and Rental, Inc., or “CVR”, was completed on November 30, 2010, allowing us to provide a full range of produced water transportation and disposal solutions, including a large transportation fleet and deep-injection disposal wells, to natural gas operators in the region surrounding our existing PVC 50-mile brine water transportation pipeline in the Haynesville Shale area. We completed several additional acquisitions during the first half of 2011, acquiring fresh water and produced water transportation and disposal operations in the Eagle Ford, Marcellus, Utica, Haynesville and Barnett Shale areas, including:
Devonian Industries: we acquired substantially all of the assets and the business of Devonian Industries, a fresh water and produced water transportation and frac tank rental company operating in southwestern Pennsylvania, southeastern Ohio and northern West Virginia (the Marcellus and Utica Shale areas);
Excalibur Energy Services: we acquired Excalibur Energy Services Inc., a fresh water and produced water transportation company, and its affiliate Blackhawk, LLC, a frac tank rental company, operating in the northern Pennsylvania Marcellus shale area, as well as the Eagle Ford and Barnett Shale areas in Texas;
Bear Creek: we acquired certain assets from Bear Creek Services, LLC, including fresh water and produced water transportation operations and two salt water disposal wells in the Haynesville Shale area of Texas with complementary transportation operations extending into Louisiana;
Sand Hill: we acquired certain fresh water and produced water transportation assets and two salt water disposal wells in the Haynesville Shale area from Sand Hill Foundation LLC pursuant to a Bankruptcy Code section 363 sale transaction; and
Consolidated Petroleum: we acquired substantially all of the assets and business of Consolidated Petroleum, Inc., a temporary water transportation and rental company operating in the Eagle Ford Shale and Haynesville Shale areas.
As a result of acquisitions and our organic growth, we now own and operate a fleet of more than 600 trucks for water transportation and more than 1,100 frac tanks. We are also beginning to take delivery on our order of LNG-powered heavy trucks, which we expect will have lower operating and maintenance costs than diesel trucks, and longer average service lives. In addition, we have 25 operating salt water disposal, or underground injection, wells in the Haynesville and Eagle Ford shale areas with permitted combined capacity of approximately 403,000 barrels per day. We are currently in the process of acquiring or permitting additional disposal wells and capacity in the Eagle Ford, Tuscaloosa Marine and Utica/Marcellus Shale areas, as well as other select hydrocarbon-rich shale areas.
We also develop underground pipelines for the efficient delivery of fresh water and removal of produced water in the Haynesville Shale area in connection with hydrofracturing operations. In December of 2011, we converted a 30-mile section of our PVC pipeline from use as a transporter of produced water to a transporter of fresh water for use in hydrofracturing. The freshwater is moved from the fresh water PVC line to the well pad with temporary water transmission pipelines.
We have completed the majority of our 50-mile fiberglass pipeline that transports produced water to our disposal wells. The pipeline is supported by a network of deep injection disposal wells which we believe is not only an efficient solution for our customers, but also provides us with a strategic competitive position. The fiberglass produced water pipeline has the capacity to transport up to 120,000 barrels per day of produced water. The increased capacity and reliability of the fiberglass pipe line will allow us to expand the line further east to gain more produced water in the future through additional laterals tied directly to our customers’ wells and through the construction of an additional trucking terminal at the east end of the pipeline. We currently operate a
4
Table of Contents
trucking terminal at approximately the mid-point of the pipeline. This important combination of local trucking and pipeline facilities was developed to provide customers with more economical access to our disposal wells.
In addition, we own over 200 miles of portable polyethylene and aluminum pipe and associated pumps and other equipment that are used above ground for pumping and transporting water from wells, streams, ponds and special holding areas, including our frac tanks, to hydraulic fracturing wells in the Haynesville, Marcellus and Eagle Ford Shale areas. We are currently expanding these services to the Utica, Eaglebine, and Permian Shale areas. These assets also enhance our service capabilities to our underground pipeline network in the Haynesville Shale area and are available to complement our current service offerings to our customers throughout all shale areas in which we operate. We will continue to expand our operations into additional hydrocarbon-rich shale plays and will continue to expand our suite of services we offer to our customers in order to provide an ever broader and more efficient and comprehensive total water solution.
Disposition of Bottled Water Business. Previously, we owned and operated a bottled water business through our subsidiary, China Water and Drinks, Inc., or “China Water”. On September 30, 2011, we completed the disposition of all of our current bottled water operations though the sale of all of the shares of China Water Drinks (H.K.) Holdings Limited, a subsidiary of China Water, to Pacific Water & Drinks (HK) Group Limited (“Pacific Water”) in exchange for shares of Pacific Water equal to 10% of its outstanding equity. Following the completion of the disposition, we abandoned all of our remaining non-U.S. legal entities related to China Water.
Shale Oil and Gas Industry
Advances in drilling technology and development of unconventional North American hydrocarbon resources—oil and gas shale fields—allow previously inaccessible or non-economical formations in the earth’s crust to be exploited by utilizing high water pressure methods (or the process known as hydraulic fracturing) combined with proppant fluids (containing sand grains or microscopic ceramic beads) to crack open new perforation depths and fissures to extract large quantities of natural gas, oil, and other hydrocarbon condensates. Complex water flows represent the largest waste stream from these methods of hydrocarbon exploration and production. We provide, and continue to develop, total water service solutions for the effective and efficient delivery, treatment and disposal of fresh water, flow back and produced water flows anticipated by increasing exploration in these unconventional oil and gas shale fields.
Water issues are critical to the development of the unconventional energy industry. Millions of gallons of fresh water are necessary for each drilled frac well. We expect developers to drill and frac thousands of wells to retrieve the trapped natural gas, oil and other natural resources. The water must be delivered to the well site, by truck or pipeline, stored on site (generally in temporary ponds or frac tanks), and then delivered to the well head for hydrofracturing operations. The water is injected at extremely high pressures, breaking the shale and releasing the oil and/or natural gas. The water is then returned to the surface over time: approximately 15%–20% of the water is returned as flow back water within the first two to three weeks after the hydrofracturing has commenced, and the remaining water is generally returned to the surface as produced water over the life of the well. All of these waters are then re-used, recycled or treated and disposed off-site.
Total water consumption by the energy sector is expected to grow by three to four times, increasing from approximately 4.3 billion gallons of water per day (BGD) in 1995 to approximately 12-15 BGD by 2035, according to the Report to Congress on Energy and Water Interdependencies, 2006 (Journal of Energy Security). Today, energy development companies spend an estimated $50.0 billion every year transporting, recycling and/or disposing of these complex waters to not only comply with local, state, provincial and federal environmental laws, but also in order to deliver fresh water for initial hydrofracturing operations.
With more than three quadrillion cubic feet of recoverable natural gas and over 1 trillion barrels of recoverable oil in previously undiscovered, unproven and unconventional natural gas and oil reserves in the United States, there is substantial growth projected for shale oil and gas production, especially in the shale plays where we operate. Additional large global energy development companies are entering the shale areas, and we believe that our water services will be vital to their effective, efficient, and legally compliant treatment, transport, and disposal of flow back and produced water volumes at the surface.
5
Table of Contents
Demand for our water solutions supporting well completion activities is a function of the willingness of our customers, oil and natural gas exploration and production companies, to make operating and capital expenditures to explore for, develop and produce natural gas and oil, which generally varies in relation to the price or anticipated price of oil and natural gas. Oil and natural gas prices can be affected by various factors, including demand for oil and natural gas, demand for and costs of alternative fuels, overall economic activity levels and governmental policies and regulations. While generally, as the supply of oil and natural gas decreases and/or demand increases, driving up prices, demand for our services will increase as oil and natural gas producers attempt to maximize the productivity of their wells in a high priced environment. In a lower oil and natural gas price environment, demand for our services generally is expected to decrease as oil and natural gas producers decrease their activity. However, a significant portion of our business is focused on transporting, treating or disposing produced water from oil and gas wells that continues to flow over the life of the well. This portion of our business is not as impacted by current oil and gas prices as our services that support well completion activities.
Shale Areas Where We Operate
We primarily operate in the Eagle Ford, Marcellus, Utica, Haynesville, Tuscaloosa Marine and Barnett Shale areas. We also continue to strategically expand our operations into other oil- and liquids-rich shale areas.
The Haynesville Shale area is located across northwest Louisiana (primarily in Caddo, Bossier, Red River, DeSoto, Webster and Bienville Parishes), east Texas (primarily in Harrison, Panola, Shelby and Nacogdoches Counties), and extends into Arkansas. There is an estimated 250 Tcf of recoverable gas in the Haynesville Shale area, and despite the recent downturn in commodity prices, the Haynesville Shale area is the largest natural gas-producing basin in North America, producing nearly 7.6 Bcf/d as of October 2011, or more than 7% of U.S. total natural gas production. The recent decline in natural gas prices has led to a decrease in new well drilling in the Haynesville Shale, and we have responded by transferring a portion of our mobile assets to more oil- and liquids-rich shale plays.
The Eagle Ford Shale is a gas and oil play located across southern Texas (primarily in Atacosa, Dewitt, Dimmitt, Frio, Gonzales, Karnes, LaSalle, Lavaca, Live Oak, Maverick, McMullen, Webb and Wilson counties). The play contains a high liquid component, which has led to the definition of three areas: oil, condensate and dry gas. Still in its emerging stages of discovery, the Eagle Ford Shale is estimated to have approximately 20.8 Tcf of technically recoverable gas and 3.4 Bbbl of technically recoverable oil, according to the U.S. Energy Information Administration (EIA). We have been actively transferring our operating assets (trucks and frac tanks) to oil- and liquids-rich basins such as the Eagle Ford Shale.
The Marcellus Shale gas play is located in the Appalachian Basin in the Northeastern United States (primarily in Pennsylvania, West Virginia, New York and Ohio). The Marcellus Shale is the largest natural gas field in North America with approximately 141 Tcf of technically recoverable gas, according to the EIA. Adjacent to the Marcellus Shale is the emerging Utica Shale, located primarily in southwestern Pennsylvania and eastern Ohio. Still in its earliest stages of development, the Utica Shale play has three identified areas similar to the Eagle Ford Shale: oil, condensate and dry gas. According to the EIA, the Utica Shale has an estimated technically recoverable reserve potential of between 1.3 and 5.5 Bbbl of oil and 3.8 to 15.7 Tcf of natural gas We have also been actively transferring our operating assets (trucks and frac tanks) to the Marcellus and Utica Shale areas, where drilling activity is more robust.
The Barnett Shale is located within the Fort Worth and Permian Basins in Texas and is estimated to have approximately 43.4 Tcf of technically recoverable gas, according to the EIA. The Barnett Shale is the second largest natural gas-producing basin in the United States, producing approximately 5.7 Bcf/d as of October 2011, or approximately 6% of total U.S. natural gas production.
The Tuscaloosa Marine Shale area, located in southern Louisiana, is an emerging oil- and liquids-rich shale play. We are actively transferring to and adding additional operating assets in the Tuscaloosa Shale.
6
Table of Contents
Competitive Strengths
Our strategy is to capture market share in the emerging subsector of water infrastructure and water disposal and treatment services for oil and natural gas producers by providing comprehensive commercial solutions to oil and gas exploration and production companies, mining companies and utilities. We believe we hold significant competitive advantages primarily due to:
| • | Management team with extensive experience in water industry consolidation. Our management has more than 100 years of combined global water industry experience, with a strong emphasis on acquiring and building sustainable water businesses, including operational excellence, technology development and acquisition, regulatory acumen and financial discipline. |
| • | Strong market position. We maintain a strong market share for our services in our core operating areas. Our fleet of more than 600 trucks for water transportation and more than 1,100 frac tanks represents one of the largest fleets in the United States, and our goal is to be the top provider of water disposal and treatment services in our core operating areas. Our market position allows us to expand the range of services we offer. |
| • | Our pure play water solutions model offers a complete cycle of water solutions for the oil and gas exploration and production industry, particularly in the shale plays. We believe that our total water solutions strategy is the most effective method for dealing with complex water flows from energy development, particularly in the shale areas which have experienced rapid growth in natural resources discovery and production. Because we handle all stages of water management for our customers, and because this constitutes our core business rather than an ancillary service, we believe that our total water solutions services are unique in the industry and differentiate us from our competitors. |
| • | Growing operating presence in the most productive shale areas of the United States. We own substantial pipeline, transportation, disposal and treatment assets in major shale plays and have been expanding in these areas through a combination of acquisitions and organic growth. The shale areas in which we operate are experiencing extremely rapid growth in the number of wells drilled, and we believe that we are well placed and well equipped to continue to capture additional business as our customers increase their activities in these areas. In addition, large global energy companies, with stringent health, safety, and environmental compliance requirements, have entered the shale areas. We believe that our total water solutions platform, coupled with our strong balance sheet and our experienced management, will be attractive to those companies. |
| • | Ability to economically replicate our full service model throughout shale regions. With a well-established and growing regional footprint, we are also well capitalized for future acquisitions, ongoing expansion and investment in disposal capacity within the shale gas regions in which we currently operate and in other shale areas as exploration and production expands. Our flexibility allows us to offer our clients consistency and reliability in their water services needs as their drilling rigs are relocated within the shale plays. |
Customers
Our customers include major United States and international oil and gas companies, foreign national oil and gas companies and independent oil and natural gas production companies that are active in our core areas of operations. Chesapeake Energy Corp. represented 25% of our total revenues for the year ended December 31, 2011. El Paso E&P Company, L.P. and Exco Production Company, L.P. represented 16% and 12% of our revenues for the year ended December 31, 2010, respectively.
Competitors
Some aspects of water treatment and water handling are provided, as ancillary offerings to their core businesses, by many large international and domestic competitors including Schlumberger, Baker- Hughes, BJ Services, Key Energy Services and Basic Energy Services. However, none of these companies focus entirely on
7
Table of Contents
the water aspects of hydrofracturing, a key aspect of our strategic focus. The fluids handling aspects of hydraulic fracturing primarily consists of numerous small, regionally focused enterprises or companies that have increased in size with the explosive local growth in the various shale areas. This highly fragmented industry creates several opportunities for our businesses, including our “buy-and-build” management and operational strategy.
Certain of these competitors have longer industry tenure and greater resources than us. As a result, the market in which we operate is highly competitive. Competition is influenced by such factors as price, capacity, availability of work crews, health, safety and environmental programs, legal compliance, technology, reputation and experience of the service provider. We believe we can compete effectively in the emerging subsector of water handling and treatment, recycling, and reuse, whether closed loop or full service, as a result of our extensive water industry experience, diverse scope of water transport, treatment and disposal assets, water transport experience, industry alliances and strong balance sheet.
Seasonality
Our water solutions for energy development business is impacted by seasonal factors. Generally, our business is negatively impacted during the winter months due to inclement weather, fewer daylight hours and holidays. During periods of heavy snow, ice or rain, we may not be able to move our trucks and equipment between locations, thereby reducing our ability to provide services and generate revenues. In addition, these conditions may impact our customer’s operations, and, as our customers’ drilling activities are curtailed, our services may also be reduced. Weather plays less of a role in areas where we have pipelines and, as we continue to construct or acquire additional pipeline capacity, we expect that weather will have less of an impact on our business.
Business and Growth Strategy
We are focused on increasing our stockholder value, operational efficiencies and financial performance by pursuing the following strategies:
| • | Expand within our markets. We intend to continue strengthening our presence both within our geographic markets and into new hydrocarbon-rich shale areas through a combination of internal growth and acquisitions of businesses with strong customer relationships, well-maintained equipment and experienced and skilled personnel. We typically enter into new markets or operations through the acquisition of businesses with strong management teams that will allow us to expand within these markets. Management of acquired companies often remain with us and retain key positions within our organization, which we believe mitigates the inherent integration risks related to an acquired company and enhances our attractiveness as an acquisition partner. Our executive management team, including our Chairman and Chief Executive Officer, has successfully implemented this “buy and build” strategy for over two decades with several companies. |
| • | Pursue growth in core segments through selective capital deployment. We intend to continue growing our business through selective business and asset acquisitions and upgrading our existing assets, consistent with our “buy and build” strategy. We make capital investment decisions that we believe will support our long-term growth strategy; in particular, since many of our acquisitions are smaller companies that have experienced strong recent growth, particularly those acquisitions in the shale plays, we are able to supply the capital necessary for these enterprises to continue to grow (for example, through the acquisition of additional trucks, trailers, frac tanks, or ancillary services) and, at the same time, provide these businesses with professional managerial and operational expertise in order to build an integrated company that can successfully support our growth. |
| • | Cost management. We are developing and implementing a set of core practices and standards that are implemented across our business to facilitate training, maintenance efficiency and cost leverage. Back office functions have recently been consolidated and centralized. We have instituted a comprehensive health, safety and environmental program to protect our people assets and the assets of our customers. |
8
Table of Contents
| We routinely conduct preventive maintenance to assure maximum availability of our assets. These practices and programs are designed to allow us to provide our customers with reliable, comprehensive and efficient services while maintaining an effective, competitive cost structure. |
| • | Financial and Operational Discipline. Our experienced management team and our board of directors, provide us with depth and breadth of experience in all aspects of the water industry, including operations, management and financial analysis. Our experience gives us the ability to identify and analyze potential business opportunities and industry trends, allowing us to act quickly yet prudently on acquisitions and other business opportunities and to integrate them into our existing businesses. Our financial discipline provides us with the ability to analyze risk in a manner that judiciously deploys capital to achieve our investment return objectives. |
Intellectual Property
We operate under numerous trade names and own several trademarks, the most important of which are “Heckmann”, “HWR”, and “Heckmann Water Resources”, that we believe provide us with a competitive advantage in the various markets in which we operate or intend to operate. We also have access, through certain exclusive and business relationships, to various water treatment technologies which, based on our experience, we utilize to create unique, cost-effective and proprietary total water treatment solutions for our customers.
Operating Risks
Our operations are subject to hazards inherent in our industry, including accidents and fires that could cause personal injury or loss of life, damage to or destruction of property, equipment and the environment, and suspension of operations. Because our business involves the transportation of materials, we may also experience traffic accidents or pipeline breaks which may result in spills, property damage and personal injury. We have implemented a comprehensive health, safety and environmental program designed to minimize accidents in the workplace, enhance our safety programs, maintain environmental compliance and improve the efficiency of our operations.
Governmental Regulation, including Environmental Regulation and Climate Change
Our operations are subject to various United States federal, state and local laws and regulations pertaining to health, safety and the environment. Additional laws and regulations, or changes in the interpretations of existing laws and regulations, that affect our business and operations may be adopted, which may in turn impact our financial condition. The following is a summary of the more significant existing environmental, health and safety laws and regulations to which our operations are subject.
| • | Hazardous Substances and Waste. The United States Comprehensive Environmental Response, Compensation, and Liability Act, as amended, referred to as “CERCLA” or the “Superfund” law, and comparable state laws, impose liability without regard to fault or the legality of the original conduct on certain defined persons, including current and prior owners or operators of a site where a release of hazardous substances occurred and entities that disposed or arranged for the disposal of the hazardous substances found at the site. Under CERCLA, these “responsible persons” may be liable for the costs of cleaning up the hazardous substances, for damages to natural resources and for the costs of certain health studies. |
In the course of our operations, we occasionally generate materials that are considered “hazardous substances” and, as a result, may incur CERCLA liability for cleanup costs. Also, claims may be filed for personal injury and property damage allegedly caused by the release of hazardous substances or other pollutants. We also generate solid wastes that are subject to the requirements of the United States Resource Conservation and Recovery Act, as amended, or “RCRA,” and comparable state statutes.
9
Table of Contents
Although we use operating and disposal practices that are standard in the industry, hydrocarbons or other wastes may have been released at properties owned or leased by us now or in the past, or at other locations where these hydrocarbons and wastes were taken for treatment or disposal. Under CERCLA, RCRA and analogous state laws, we could be required to clean up contaminated property (including contaminated groundwater), or to perform remedial activities to prevent future contamination.
| • | Air Emissions. The Clean Air Act, as amended, or “CAA,” and similar state laws and regulations restrict the emission of air pollutants and also impose various monitoring and reporting requirements. These laws and regulations may require us to obtain approvals or permits for construction, modification or operation of certain projects or facilities and may require use of emission controls. |
| • | Global Warming and Climate Change. While we do not believe our operations raise climate change issues different from those generally raised by the commercial use of fossil fuels, legislation or regulatory programs that restrict greenhouse gas emissions in areas where we conduct business or that would require reducing emissions from our truck fleet could increase our costs. |
| • | Water Discharges. We operate facilities that are subject to requirements of the United States Clean Water Act, as amended, or “CWA,” and analogous state laws for regulating discharges of pollutants into the waters of the United States and regulating quality standards for surface waters. Among other things these laws impose restrictions and controls on the discharge of pollutants, including into navigable waters as well as protecting drinking water sources. Spill prevention, control and counter-measure requirements under the CWA require implementation of measures to help prevent the contamination of navigable waters in the event of a hydrocarbon spill. Other requirements for the prevention of spills are established under the United States Oil Pollution Act of 1990, as amended, or “OPA”, which amended the CWA and applies to owners and operators of vessels, including barges, offshore platforms and certain onshore facilities. Under OPA, regulated parties are strictly liable for oil spills and must establish and maintain evidence of financial responsibility sufficient to cover liabilities related to an oil spill for which such parties could be statutorily responsible. |
| • | State Environmental Regulations. Our operations involve the storage, handling, transport and disposal of bulk waste materials, some of which contain oil, contaminants and other regulated substances. Various environmental laws and regulations require prevention, and where necessary, cleanup of spills and leaks of such materials and some of our operations must obtain permits that limit the discharge of materials. Failure to comply with such environmental requirements or permits may result in fines and penalties, remediation orders and revocation of permits. In Texas, we are subject to rules and regulations promulgated by the Texas Railroad Commission and the Texas Commission on Environmental Quality, including those designed to protect the environment and monitor compliance with water quality. In Louisiana, we are subject to rules and regulations promulgated by the Louisiana Department of Environmental Quality and the Louisiana Department of Natural Resources as to environmental and water quality issues, and the Louisiana Public Service Commission as to allocation of intrastate routes and territories for waste water transportation. In Pennsylvania, we are subject to the rules and regulations of the Pennsylvania Department of Environmental Protection and the Pennsylvania Public Service Commission. In Ohio, we are subject to the rules and regulations of the Ohio Department of Natural Resources and the Ohio Environmental Protection Agency. |
| • | Occupational Safety and Health Act. We are subject to the requirements of the United States Occupational Safety and Health Act, as amended, or “OSHA,” and comparable state laws that regulate the protection of employee health and safety. OSHA’s hazard communication standard requires that information about hazardous materials used or produced in our operations be maintained and provided to employees, state and local government authorities and citizens. |
| • | Saltwater Disposal Wells. We operate salt water disposal wells that are subject to the CWA, Safe Drinking Water Act, and state and local laws and regulations, including those established by the Underground Injection Control Program of the United States Environmental Protection Agency, or “EPA,” which establishes the minimum program requirements. All of our salt water disposal wells are |
10
Table of Contents
| located in Texas. Regulations in Texas, Louisiana and Ohio require us to obtain a permit to operate each of our salt water disposal wells. The regulatory authorities may suspend or modify one of our permits if a well operation is likely to result in pollution of freshwater, substantial violation of permit conditions or applicable rules, or if the well leaks into the environment. |
| • | Transportation regulations. We conduct interstate motor carrier (trucking) operations that are subject to federal regulation by the Federal Motor Carrier Safety Administration, or “FMCSA,” a unit within the United States Department of Transportation, or “USDOT.” The FMCSA publishes and enforces comprehensive trucking safety regulations, including rules on commercial driver licensing, controlled substance testing, medical and other qualifications for drivers, equipment maintenance, and drivers’ hours of service, referred to as “HOS.” The agency also performs certain functions relating to such matters as motor carrier registration (licensing), insurance, and extension of credit to motor carriers’ customers. Another unit within USDOT publishes and enforces regulations regarding the transportation of hazardous materials, or “hazmat,” but the waste water and other water flows we transport by truck are not normally regulated as hazmat at this time. |
In December 2010, the FMCSA launched a program called Compliance, Safety, Accountability, or “CSA,” in an effort to improve commercial truck and bus safety. A component of CSA is the Safety Measurement System, or “SMS,” which will continuously analyze all safety violations recorded by the federal and state law enforcement personnel to determine a carrier’s safety performance. The SMS is intended to allow the FMCSA to identify carriers with safety issues and intervene to address those problems. Although our trucking operations currently hold a “Satisfactory” safety rating from FMCSA (the best rating available), the agency has announced a future intention to revise its safety rating system by making greater use of SMS data in lieu of on-site compliance audits of carriers. We cannot predict the effect of such a revision on our safety rating.
Our intrastate trucking operations are also subject to the state environmental and waste water transportation regulations discussed under “—Environmental Regulations” above. Federal law also allows states to impose insurance and safety requirements on motor carriers conducting intrastate business within their borders, and to collect a variety of taxes and fees on an apportioned basis reflecting miles actually operated within that state.
The HOS regulations establish the maximum number of hours that a commercial truck driver may work. FMCSA issued a new rule in December 2011 which would reduce the number of hours a commercial truck driver could work during his or her work day. The effective date of the rule is February 27, 2012, and the compliance date of selected provisions is July 1, 2013. The new rule, which is intended to reduce the risk of fatigue and fatigue-related crashes and the harm to driver health in several ways, among other things prohibits a driver from driving if more than eight hours have passed since the driver’s last off-duty or sleeper berth break of at least 30 minutes and limits the use of the restart to once a week, which, on average, will cut the maximum work week from 82 to 70 hours. The effect of reduced driver hours may raise operating costs for many if not most truck fleets.
Employees
As of December 31, 2011, we had 1,178 full-time employees, of whom 107 were executive, managerial, sales, general, administrative, and accounting staff, and 1,071 were truck drivers, service providers and field workers. None of our employees are under collective bargaining agreements. We believe that we maintain a satisfactory working relationship with our employees and we have not experienced any significant labor disputes.
Additional Information
Information that we furnish to or file with the United States Securities and Exchange Commission, or the “SEC”, including our Annual Reports on Form 10-K, Quarterly Reports on Form 10-Q, Current Reports on Form 8-K, and any amendments to or exhibits included in these reports, are available free of charge on our website at
11
Table of Contents
www.heckmanncorp.com soon after such reports are furnished to or filed with the SEC. From time to time, we also post announcements, updates, events, investor information and presentations on our website in addition to copies of all recent press releases. Our reports, including any exhibits included in such reports, that are filed with or furnished to the SEC are also available on the SEC’s website at www.sec.gov. You may also read and copy any materials filed or furnished by the Company with the SEC at the SEC’s Public Reference Room at 100 F Street, NE, Room 1580, Washington, D.C. 20549; information on the operation of the Public Reference Room may be obtained by calling the SEC at 1-800-SEC-0330. You may request copies of these documents from the SEC, upon payment of a duplicating fee, by writing to the SEC at its principal office at 100 F Street, NE, Room 1580, and Washington, D.C. 20549.
Neither the contents of our website nor that maintained by the SEC are incorporated into or otherwise a part of this filing. Further, references to the URLs for these websites are intended to be inactive textual references only.
| Item 1A. | Risk Factors |
You should carefully consider the risks described below. If any of the risks and uncertainties described in the cautionary factors described below actually occurs, our business, financial condition and results of operations could be materially and adversely affected. The risks and factors listed below, however, are not exhaustive. Other sections of this Annual Report on 10-K include additional factors that could materially and adversely impact our business, financial condition and results of operations. Moreover, we operate in a rapidly changing environment. In addition, we are subject to legal and regulatory changes. New factors emerge from time to time and it is not possible to predict the impact of all these factors on our business, financial condition or results of operations.
Risks Related to Our Company
We may not be able to grow successfully through future acquisitions or successfully manage future growth, and we may not be able to effectively integrate the businesses we do acquire.
Our business strategy includes growth through the acquisitions of other businesses. We may not be able to continue to identify attractive acquisition opportunities or successfully acquire those opportunities identified fitting pursuant to our strategies. In order to complete acquisitions, we would expect to require additional debt and/or equity financing, which could increase our interest expense, leverage and shares outstanding. In addition, we may not be successful in integrating current or future acquisitions into our existing operations, which may result in unforeseen operational difficulties or diminished financial performance or require a disproportionate amount of our management’s attention.
Even if we are successful in integrating our current or future acquisitions into our existing operations, we may not derive the benefits, such as operational or administrative synergies, that we expected from such acquisitions, which may result in the commitment of our capital resources without the expected returns on such capital. Also, competition for acquisition opportunities may escalate, increasing our cost of making further acquisitions or causing us to refrain from making additional acquisitions.
Additional risks related to our acquisition strategy include, but are not limited to:
| • | the potential disruption of our existing businesses; |
| • | entering new markets or industries in which we have limited prior experience; |
| • | difficulties integrating and retaining key management, sales, research and development, production and other personnel; |
| • | difficulties integrating or expanding information technology systems and other business processes to accommodate the acquired businesses; |
12
Table of Contents
| • | risks associated with integrating financial reporting and internal control systems; and |
| • | Whether any necessary additional debt or equity financing will be available on terms acceptable to us, or at all, and the impact of such financing on our operating performance and earnings per share. |
We are vulnerable to the potential difficulties associated with rapid growth.
We believe that our future success depends on our ability to manage rapid growth that we expect to experience organically and through acquisitions, and the demands and additional responsibilities that our growth will place on our management. The following factors could present difficulties to us: lack of sufficient executive-level personnel, increased administrative burden, long lead times associated with acquiring additional equipment; availability of suitable acquisition candidates and of additional disposal well capacity and pipeline right-of-way; and the and ability to provide focused service attention to our customers.
Future charges due to possible impairments of acquired assets may have a material adverse effect on our financial condition and results of operations, and stock price.
A portion of our assets is comprised of goodwill and other intangible assets, which may be subject to future impairment that would result in financial statement write-offs. Goodwill and other intangible assets represent approximately 22.1% of our total assets as of December 31, 2011. If there is a material change in our business operations or prospects, the value of our intangible assets, or those we may acquire in the future, could decrease significantly.
On an ongoing basis and at least annually, we will evaluate whether the carrying value of our intangible assets may no longer be recoverable, in which case a charge to earnings may be necessary. Any future determination requiring the write-off of a significant portion of unamortized intangible assets, although not requiring any additional cash outlay, could have a material adverse effect on our financial condition, results of operations and stock price.
Our ability to succeed will largely depend upon the efforts of our directors and officers, and in particular our Chairman and Chief Executive Officer, Mr. Richard J. Heckmann. The loss of Mr. Heckmann could adversely affect our business and operations.
Our ability to succeed is largely dependent upon the efforts of our executive officers and directors, especially Mr. Heckmann, our Chairman and Chief Executive Officer. Even though we believe that our success depends largely on the continued services of Mr. Heckmann, we have not entered into an employment agreement with Mr. Heckmann, nor obtained “key man” life insurance. Accordingly, we cannot be sure that Mr. Heckmann will remain with the Company for the immediate or foreseeable future. In addition, though Mr. Heckmann has expressed a commitment of his full time efforts to our success, he is not required to commit any specified amount of time to the Company’s affairs and, as a result, he may have conflicts of interest in allocating management time among various business activities, including identifying potential business acquisitions and monitoring the related due diligence and closing process. The loss of the services of Mr. Heckmann or any other of our other executive officers and directors could have a material adverse effect on our ability to successfully achieve our business objectives.
We have had, and may have in the future, material weaknesses in our internal control over financial reporting that could cause investors to lose confidence in our reported financial information and thereby cause a decline in our stock price.
As of December 31, 2011, our management concluded that our internal control over financial reporting was effective to provide reasonable assurance that the information required to be disclosed in our reports filed with the SEC under the Exchange Act are recorded, processed, summarized and reported within the time periods specified in the SEC’s rules and forms, and are accumulated and communicated to our management, including our Chief
13
Table of Contents
Executive Officer, as appropriate to allow timely decisions regarding required disclosure. However, we have had in the past and may have in the future material weaknesses in our internal control over financial reporting.
If we are unable to address any material weaknesses in our internal control over financial reporting, we may have errors in our financial statements that could result in a restatement of our financial statements, cause us to fail to meet our reporting deadlines, and cause investors to lose confidence in our reported financial information, leading to a decline in our stock price.
We are engaged in litigation and subject to an SEC inquiry relating to China Water and a negative outcome in any of these proceedings could materially adversely affect us.
As described in greater detail in “Item 3. Legal Proceedings” in this Annual Report, we and certain of our directors and officers are involved in litigation arising from or relating to our China Water acquisition in October 2008, including a purported class action and a derivative action. In addition, on June 10, 2011, we received a subpoena from the Denver Regional Office of the SEC seeking information and documents concerning China Water. We are cooperating and intend to continue to cooperate fully with the SEC with respect to its requests. A negative outcome of the SEC inquiry could result in the SEC imposing fines or penalties on us, or requiring us to satisfy other remedies including modifications to business practices and implementing compliance programs.
The litigation and the SEC inquiry are also causing us to incur substantial legal fees and expenses as well as requiring management time and involvement. The outcome of the litigation and the SEC inquiry are uncertain and, if adversely decided or settled against us or any of our officers or directors, could have a material adverse impact on our business, financial condition, results of operations and cash flows.
Changes to the fair market or carrying value of our investments in UGSI and Pacific Water could affect the value of these investments and any potential recordable income from the investments, which could result in a write down.
As of December 31, 2011, we own approximately 7% of Underground Solutions, Inc., or “UGSI”, a supplier of water infrastructure pipeline products, which we acquired in 2009 for a total investment of $7.2 million dollars. We also have a 10% interest in Pacific Water, acquired in connection with Pacific Water’s acquisition of our current bottled water operations in 2011. There is no or limited liquidity in the stock of either company. Changes to the fair market or carrying value of our investments in UGSI and Pacific Water could affect the value of our investment and result in a substantial write down.
Risks Related to Our Operations
Our business depends on spending by the oil and natural gas industry in the United States, and this spending and our business has been, and may continue to be, adversely affected by industry and financial market conditions that are beyond our control.
We depend on our customers’ willingness to make operating and capital expenditures to explore, develop and produce oil and natural gas in the United States. Declines in these expenditures, due to the low natural gas price environment or other factors, could result in project modification, delays or cancellations, general business disruptions, and delays in, or nonpayment of, amounts owed to us. Customers’ expectations for lower market prices for oil and natural gas, as well as the availability of capital for operating and capital expenditures, may also cause our customers to curtail spending, thereby reducing demand for our services.
Industry conditions are influenced by numerous factors, over which we have no control, including:
| • | domestic and worldwide supplies of natural gas, natural gas liquids and oil, including U.S. inventories of natural gas and oil reserves; |
| • | weather conditions; |
14
Table of Contents
| • | changes in the level of consumer demand; |
| • | the price and availability of alternative fuels; |
| • | the availability, proximity and capacity of pipelines, other transportation facilities and processing facilities; |
| • | the level and effect of trading in commodity futures markets, including by commodity price speculators and others; |
| • | the price and level of foreign imports; |
| • | the nature and extent of domestic and foreign governmental regulations and taxes; |
| • | the ability of the members of the Organization of Petroleum Exporting Countries to agree to and maintain oil price and production controls; |
| • | political instability or armed conflict in oil and natural gas producing regions; and |
| • | Overall domestic and global economic and market conditions. |
The volatility of the oil and natural gas industry and the impact on exploration and production activity could adversely impact the level of drilling activity by some of our customers or in some of the regions in which we operate. For example, natural gas spot prices have fallen significantly in late 2011 and the number of active drilling rigs operating in the Haynesville and Barnett Shale plays has declined over the past 12 months with many of these rigs moving to other areas including the Utica/Marcellus and Eagle Ford Shale plays. This reduction in activity may cause a decline in the demand for our services or adversely affect the price of our services, and the financial results of our operations, particularly if rigs are moved to areas in which we do not currently operate. In addition, reduced discovery rates of new oil and natural gas reserves in our market areas also may have a negative long-term impact on our business, even in an environment of stronger oil and natural gas prices, to the extent existing production is not replaced and the number of producing wells for us to service declines.
Recent declines in natural gas prices have caused many oil and natural gas producers to announce reductions in capital budgets for future periods. Limitations on the availability of capital, or higher costs of capital, for financing expenditures may cause these and other oil and natural gas producers to make additional reductions to capital budgets in the future even if commodity prices increase from current levels. These cuts in spending have curtailed drilling programs as well as discretionary spending on well services, which may result in a reduction in the demand for our services, the rates we can charge and our utilization. In addition, certain of our customers could become unable to pay their vendors and service providers, including us. Any of these conditions or events could adversely affect our operating results and cash flows.
Significant capital expenditures are required to conduct our business.
The development of our business and services, excluding acquisition activities, requires substantial capital expenditures. During the year ended December 31, 2011, we made capital expenditures of approximately $148.9 million. We fund our capital expenditures through a combination of cash flows from operations and borrowings under our bank credit facilities and, to the extent those sources are not sufficient, we may fund capital expenditures from the proceeds of debt and equity issuances. Future cash flows from operations are subject to a number of risks and variables, such as the level of production of our customers, prices of natural gas and oil, and the other risk factors discussed herein. Our ability to obtain capital from other sources, such as the capital markets, is dependent upon many of those same factors as well as the orderly functioning of credit and capital markets. To the extent we fail to have adequate funds, we could be required to reduce our capital spending, or pursue other funding alternatives, which in turn could adversely affect our business and results of operations.
15
Table of Contents
Any interruption in our services due to pipeline ruptures or spills or necessary maintenance could impair our financial performance and negatively affect our brand.
Our water transport pipelines are susceptible to ruptures and spills and require ongoing maintenance. We may experience difficulties in maintaining the operation of our pipelines, thereby causing downtime and delays. For example, in 2010, we had breaks in our 50-mile pipeline in eastern Texas that resulted in a delay in transporting our customers’ water. While we have announced plans to add a new pipeline for additional capacity and operational efficiencies, any interruption in our services due to pipeline breakdowns or necessary maintenance could reduce sales revenues and earnings. Transportation interruptions at our pipelines, even if only temporary, could severely harm our business and reputation.
Our operations are subject to risks inherent in the oil and natural gas industry, some of which are beyond our control. These risks may not be fully covered under our insurance policies.
Our operations are subject to operational hazards, including accidents or equipment issues that can cause pollution and other damage to the environment. For example, produced water from our pipelines has leaked into private property on several occasions. As required pursuant to applicable law, we remediated the environmental impact, including related to site investigation and soil, groundwater and surface water cleanup.
In addition, hazards inherent in the oil and natural gas industry, such as, but not limited to, accidents, blowouts, explosions, pollution and other damage to the environment, fires and hydrocarbon spills, may delay or halt operations at extraction sites which we service. These conditions can cause:
| • | personal injury or loss of life; |
| • | liabilities from pipeline breaks and accidents by our fleet of trucks and other equipment; |
| • | damage to or destruction of property, equipment and the environment; and |
| • | The suspension of operations. |
The occurrence of a significant event or a series of events that together are significant, or adverse claims in excess of the insurance coverage that we maintain or that are not covered by insurance, could have a material adverse effect on our financial condition and results of operations. In addition, claims for loss of oil and natural gas production and damage to formations can occur in the well services industry. Litigation arising from a catastrophic occurrence at a location where our equipment and services are being used may result in our being named as a defendant in lawsuits asserting large claims.
We maintain insurance coverage that we believe to be customary in the industry against these hazards. We may not be able to maintain adequate insurance in the future at rates we consider reasonable. In addition, insurance may not be available to cover any or all of the risks to which we are subject or, even if available, it may be inadequate or insurance premiums or other costs could make such insurance prohibitively expensive. It is likely that, in our insurance renewals, our premiums and deductibles will be higher, and certain insurance coverage either will be unavailable or considerably more expensive than it has been in the recent past. In addition, our insurance is subject to coverage limits, and some policies exclude coverage for damages resulting from environmental contamination.
We are subject to United States federal, state and local laws and regulations relating to health, safety, transportation, and protection of natural resources and the environment. Under these laws and regulations, we may become liable for significant penalties, damages or costs of remediation. Any changes in laws and regulations could increase our costs of doing business.
Our operations, and those of our customers, are subject to United States federal, state and local laws and regulations relating to health, safety, transportation and protection of natural resources and the environment, including those relating to waste management and transportation and disposal of produced-water and other
16
Table of Contents
materials. For example, we are subject to environmental regulation relating to disposal into injection wells, which can pose some risks of environmental liability, including leakage from the wells to surface or subsurface soils, surface water or groundwater. Liability under these laws and regulations could result in cancellation of well operations, fines and penalties, expenditures for remediation, and liability for property damage and personal injuries.
Failure to comply with these laws and regulations could result in the assessment of significant administrative, civil or criminal penalties, imposition of cleanup and site restoration costs and liens, revocation of permits, and orders to limit or cease certain operations. In addition, certain environmental laws impose strict and/or joint and several liability, which could cause us to become liable for the conduct of others or for consequences of our own actions that were in compliance with all applicable laws at the time of those actions. Future events, such as the discovery of currently unknown matters, spills caused by future pipeline ruptures, changes in existing environmental laws and regulations or their interpretation, and more vigorous enforcement policies by regulatory agencies, may give rise to additional expenditures or liabilities, which could impair our operations and adversely affect our business and results of operations.
Improvements in or new discoveries of alternative energy technologies could have a material adverse effect on our financial condition and results of operations.
Because our business depends on the level of activity in the oil and natural gas industry, any improvement in or new discoveries of alternative energy technologies (such as wind, solar, geothermal, fuel cells and biofuels) that increase the use of alternative forms of energy and reduce the demand for oil and natural gas could have a material adverse impact on our business, financial condition and results of operations. In addition, technological changes could decrease the quantities of water required for hydrofracturing operations or otherwise affect demand for our services.
Increased regulation of hydraulic fracturing, including regulation of the quantities, sources and methods of water use and disposal, could result in reduction in drilling and completing new oil and natural gas wells or minimize water use or disposal, which could adversely impact the demand for our services.
Demand for our services depends, in large part, on the level of exploration and production of oil and gas and the oil and gas industry’s willingness to purchase our services. Most of our customer base uses hydraulic fracturing to drill new oil and gas wells. Hydraulic fracturing is a process that is used to release hydrocarbons, particularly natural gas, from certain geological formations. The process involves the injection of water (typically mixed with significant quantities of sand and small quantities of chemical additives) under pressure into the formation to fracture the surrounding rock and stimulate movement of hydrocarbons through the formation. The process is typically regulated by state oil and gas commissions and has been exempt (except when the fracturing fluids or propping agents contain diesel fuels) since 2005 from United States federal regulation pursuant to the Safe Drinking Water Act.
The EPA is conducting a comprehensive study of the potential environmental impacts of hydraulic fracturing activities, and a committee of the United States House of Representatives is also conducting an investigation of hydraulic fracturing practices. The results of the EPA study and House investigation could lead to restrictions on hydraulic fracturing. The EPA is currently working on new guidance for application of the Safe Drinking Water Act permits for drilling or completing processes that use fracturing fluids or propping agents containing diesel fuels. In addition, the EPA proposed regulations under the federal Clean Air Act in July 2011 regarding certain criteria and hazardous air pollutant emissions from hydraulic fracturing wells and, in October 2011, announced its intention to propose regulations by 2014 under the federal Clean Water Act to regulate wastewater discharges from hydraulic fracturing and other gas production. Legislation has been introduced before Congress to provide for federal regulation of hydraulic fracturing, including, for example, requiring disclosure of chemicals used in the fracturing process or seeking to repeal the exemption from the Safe Drinking Water Act. If adopted, such legislation would add an additional level of regulation and necessary permitting at
17
Table of Contents
the federal level and could make it more difficult to complete wells using hydraulic fracturing. Similar laws and regulations with respect to chemical disclosure also exist or are being considered by the United States Department of Interior and in several states, including certain states in which we operate, that could restrict hydraulic fracturing. The Delaware River Basin Commission is also considering regulations which may impact hydrofracturing water practices in certain areas of Pennsylvania, New York, New Jersey and Delaware. Some local governments have also sought to restrict drilling in certain areas.
Future United States federal, state or local laws or regulations could significantly restrict, or increase costs associated with hydraulic fracturing and make it more difficult or costly for producers to conduct hydraulic fracturing operations, which could result in a decline in exploration and production. New laws and regulations, and new enforcement policies by regulatory agencies, could also expressly restrict the quantities, sources and methods of water use and disposal in hydraulic fracturing and otherwise increase our costs and our customers’ cost of compliance, which could minimize water use and disposal needs even if other limits on drilling and completing new wells were not imposed. Any decline in exploration and production or any restrictions on water use and disposal could result in a decline in demand for our services and have a material adverse effect on our business, financial condition, results of operations and cash flows.
Delays or restrictions in obtaining permits by our customers for their operations or by us for our operations could impair our business.
In most states, our customers are required to obtain permits from one or more governmental agencies in order to perform drilling and completion activities and we may be required to procure permits for construction and operation of our disposal wells and pipelines. Such permits are typically required by state agencies, but can also be required by federal and local governmental agencies. The requirements for such permits vary depending on the location where our or our customers’, activities will be conducted. As with all governmental permitting processes, there is a degree of uncertainty as to whether a permit will be granted, the time it will take for a permit to be issued, and the conditions which may be imposed in connection with the granting of the permit. Delays or restrictions in obtaining salt water disposal well permits could adversely impact our growth, which is dependent in part on new disposal capacity.
Recently, our customers have been affected by moratoriums on the issuance of permits that have been imposed upon drilling and completion activities in certain jurisdictions. For example, in December 2010, the State of New York imposed a moratorium on certain drilling and completion activities. In 2011, the state announced plans to lift the moratorium, however, there is a proposal in the New York legislature to extend the moratorium for another year. A similar moratorium has been in place within the Delaware River Basin pending issuance of regulations by the Delaware River Basin Commission. Other states, including Texas, Arkansas, Pennsylvania, Wyoming and Colorado, have enacted laws and regulations applicable to our business activities including disclosure of information regarding the substances used in hydraulic fracturing. California is presently considering similar requirements. Some of the drilling and completion activities of our customers may take place on federal land, requiring leases from the federal government to conduct such drilling and completion activities. In some cases, federal agencies have cancelled oil and natural gas leases on federal lands. Consequently, our operations in certain areas of the country may be interrupted or suspended for varying lengths of time, causing a loss of revenue and potentially having a materially adverse effect on our operations. Any such changes could have a material adverse effect on our financial condition and results of operations.
We are subject to the trucking safety regulations, which are likely to be amended, and made stricter, as part of the initiative known as Compliance, Safety, Accountability, or “CSA.” If our current USDOT safety rating of “Satisfactory” is downgraded in connection with this initiative, our business and results of our operations may be adversely affected.
As part of the CSA initiative, the FMCSA is expected to open a rulemaking docket in 2012 (originally expected in 2011) for purposes of changing its safety rating methodology. Any new methodology adopted in the rulemaking is likely to link safety ratings more closely to roadside inspection and driver violation data gathered
18
Table of Contents
and analyzed from month to month under the FMCSA’s new Safety Measurement System, or “SMS.” This linkage could result in greater variability in safety ratings than the current system, in which a safety rating is based on relatively infrequent on-site compliance audits at a carrier’s places of business. Preliminary studies by transportation consulting firms indicate that “Satisfactory” -ratings (or any equivalent under a new SMS-based system) may become more difficult to achieve and maintain under such a system. If we lose our current “Satisfactory” rating, which is the highest and best rating under this initiative, we may lose some of our customer contracts that require such a rating, adversely affecting our business prospects and results of operations.
Seasonal weather conditions and natural disasters could severely disrupt normal operations and harm our business.
We operate in the southern, mid-western and eastern United States. These areas are adversely affected by seasonal weather conditions, primarily in the winter and spring. During periods of heavy snow, ice or rain, our customers may curtail their operations or we may be unable to move our trucks between locations or provide other services, thereby reducing demand for, or our ability to provide services and generate revenues. For example, many municipalities impose weight restrictions on the paved roads that lead to our customers’ jobsites in the spring due to the muddy conditions caused by spring thaws, limiting our access and our ability to provide service in these areas. In February 2011, portions of Texas had record snowfalls. In September 2011, portions of Pennsylvania had record rainfall and flooding. During those periods, we and our customers had to significantly reduce or halt operations, resulting in a loss of revenue. In addition, the regions in which we operate have in the past been, and may in the future be, affected by natural disasters such as hurricanes, windstorms, floods tornadoes and droughts, causing disruptions in our and our customers’ operations. Future natural disasters or inclement weather conditions could severely disrupt the normal operation of our or our customers’ business and have a material adverse effect on our financial condition and results of operations.
Failure to obtain and retain skilled technical personnel could impede our operations.
We require skilled personnel to operate and provide technical services and support for our business. Competition for the personnel required for our businesses intensifies as activity increases. In periods of high utilization it may become more difficult to find and retain qualified individuals. This could increase our costs or have other adverse effects on our operations.
Increases in driver compensation or difficulty in attracting and retaining qualified drivers could adversely affect our profitability.
During 2011, we increased the number of truck drivers employed with us to approximately 670 as of December 31, 2011, compared to approximately 200 as of December 31, 2010. Maintaining a staff of qualified truck drivers is critical to the success of our operations. We have in the past experienced difficulty in attracting and retaining sufficient numbers of qualified drivers. A shortage of qualified drivers and intense competition for drivers from other companies may create difficulties in some regions. The compensation we offer our drivers is subject to market conditions, and we may find it necessary to increase driver compensation and /or modify the benefits provided to our employees in future periods.
In addition, we and other companies in the oil and gas industry suffer from a high turnover rate of drivers. The high turnover rate requires us to continually recruit a substantial number of drivers in order to operate existing equipment. If we are unable to continue to attract and retain a sufficient number of qualified drivers, we could be forced to, among other things, adjust our compensation packages, increase the number of our trucks without drivers, or operate with fewer trucks and face difficulty meeting customer demands, any of which could adversely affect our growth and profitability.
Additionally, in anticipation of or in response to geographical fluctuations in the demand for our services, it may be necessary from time to time to relocate our equipment and personnel from one shale area to another, which may result in operating inefficiencies and increased labor, fuel and other operating costs which could adversely affect our growth and profitability.
19
Table of Contents
Risks Related to Our Common Stock
We may issue a substantial number of shares of our common stock in the future and stockholders may be adversely affected by the issuance of those shares.
We may raise additional capital by issuing shares of common stock, which will increase the number of common shares outstanding and may result in dilution in the equity interest of our current stockholders and may adversely affect the market price of our common stock. We have filed a registration statement on Form S-4 with the SEC which allows us, in connection with acquisitions, to issue up to 15.0 million shares of common stock that are freely tradable upon issuance. As of March 5, 2012, we had 13.4 million shares of our common stock available for issuance under this registration statement. We have also filed a shelf registration statement on Form S-3 which, upon effectiveness, would allow us to issue up to $400.0 million in debt, equity and hybrid securities. In addition, we have issued shares of our common stock pursuant to private placement exemptions from Securities Act registration requirements, including in connection with acquisitions, and may do so in the future. The issuance, and the resale or potential resale, of shares of our common stock in connection with acquisitions or otherwise could adversely affect the market price of our common stock, and could be dilutive to our stockholders depending on the performance of the acquired business and other factors.
Our stock price may be volatile, which could result in substantial losses for investors in our securities.
The stock markets have experienced extreme volatility that has often been unrelated to the operating performance of particular companies. These broad market fluctuations may adversely affect the trading price of our common stock.
The market price of our common stock may also fluctuate significantly in response to the following factors, some of which are beyond our control:
| • | variations in our quarterly operating results; |
| • | changes in securities analysts’ estimates of our financial performance; |
| • | changes in market valuations of similar companies; |
| • | announcements by us or our competitors of significant contracts, acquisitions, strategic partnerships, joint ventures, capital commitments, new products or product enhancements; |
| • | changes in the price of oil and natural gas; |
| • | loss of a major customer or failure to complete significant transactions; and |
| • | additions or departures of key personnel. |
The trading price of our common stock on the New York Stock Exchange, or “NYSE,” since our initial public offering has ranged from a high of $10.74 on September 3, 2008 to a low of $3.30 on July 10, 2009. The last reported price of our common stock on the NYSE on March 5, 2012 was $5.26 per share.
We currently do not intend to pay any dividends on our common stock.
We currently do not intend to pay any dividends on our common stock, and restrictions and covenants in our commercial credit facilities may prohibit us from paying dividends now or in the future. While we may declare dividends at some point in the future, subject to compliance with such restrictions and covenants, we cannot assure you that you will ever receive cash dividends as a result of ownership of our common stock and any gains from investment in our common stock may only come from increases in our stock prices, if any.
20
Table of Contents
We are subject to anti-takeover effects of certain charter and bylaw provisions and Delaware law, as well as of our substantial insider ownership.
Provisions of our certificate of incorporation and bylaws, each as amended and restated, and Delaware law may discourage, delay or prevent a merger or acquisition that stockholders may consider favorable, including transactions in which you might otherwise receive a premium for your shares. In addition, these provisions may frustrate or prevent any attempts by our stockholders to replace or remove our management and board of directors. These provisions include:
| • | authorizing the issuance of “blank check” preferred stock without any need for action by stockholders; |
| • | establishing a classified board of directors, so that only approximately one-third of our directors are elected each year; |
| • | providing our board of directors the ability to set the number of directors and to fill vacancies on the board of directors occurring between stockholder meetings; |
| • | providing that directors may only be removed only for “cause” and only by the affirmative vote of the holders of at least a majority in voting power of our issued and outstanding capital stock; and |
| • | limiting the ability of our stockholders to call special meetings. |
We are also subject to provisions of the Delaware corporation law that, in general, prohibit any business combination with a beneficial owner of 15% or more of our common stock for three years following the date the beneficial owner acquired at least 15% of our stock, unless various conditions are met, such as approval of the transaction by our board of directors. Together, these charter and statutory provisions could make the removal of management more difficult and may discourage transactions that otherwise could involve payment of a premium over prevailing market prices for our common stock.
The existence of the foregoing provisions and anti-takeover measures, as well as the significant common stock beneficially owned by our Chairman and Chief Executive Officer, Richard J. Heckmann, could limit the price that investors might be willing to pay in the future for shares of our common stock. They could also deter potential acquirers of our company, thereby reducing the likelihood that you could receive a premium for your common stock in an acquisition.
Risks Related to Our Debt
We may not be able to generate sufficient cash flow to meet our debt service obligations.
Our ability to make payments on our indebtedness, and to fund planned capital expenditures, will depend on our ability to generate cash in the future. This, to a certain extent, is subject to conditions in the oil and natural gas industry, general economic and financial conditions, competition in the markets where we operate, the impact of legislative and regulatory actions on how we conduct our business and other factors, all of which are beyond our control. This risk could be exacerbated by any economic downturn or instability in United States and global credit markets.
We cannot assure you that our business will generate sufficient cash flow from operations to service our outstanding indebtedness, or that future borrowings will be available to us in an amount sufficient to enable us to pay our indebtedness or to fund our other capital needs. If our business does not generate sufficient cash flow from operations to service our outstanding indebtedness, we may have to undertake alternative financing plans, such as:
| • | refinancing or restructuring our debt; |
| • | selling assets; |
21
Table of Contents
| • | reducing or delaying acquisitions or capital investments; or |
| • | seeking to raise additional capital. |
We may not be able to implement alternative financing plans, if necessary, on commercially reasonable terms or at all, and implementing any such alternative financing plans may not allow us to meet our debt obligations. Our inability to generate sufficient cash flow to satisfy our debt obligations, or to obtain alternative financings, could materially and adversely affect our business, financial condition, results of operations and future prospects for growth.
In addition, a downgrade in our credit rating would make it more difficult for us to raise additional debt financing in the future. However, such a credit downgrade would not have an effect on our currently outstanding senior secured credit facility.
The amount of our debt and the covenants in the agreements governing our debt could negatively impact our financial condition, results of operations and business prospects.
At December 31, 2011, we had $144.1 million of outstanding indebtedness. Our level of indebtedness, and the covenants contained in the agreements governing our debt, could have important consequences for our operations, including:
| • | making it more difficult for us to satisfy our obligations under our indebtedness and increasing the risk that we may default on our debt obligations; |
| • | requiring us to dedicate a substantial portion of our cash flow from operations to required payments on indebtedness, thereby reducing the availability of cash flow for working capital, capital expenditures and other general business activities; |
| • | limiting our ability to obtain additional financing in the future for working capital, capital expenditures, acquisitions and general corporate and other activities; |
| • | limiting management’s flexibility in operating our business; |
| • | limiting our flexibility in planning for, or reacting to, changes in our business and the industry in which we operate; |
| • | diminishing our ability to withstand successfully a downturn in our business or the economy generally; |
| • | placing us at a competitive disadvantage against less leveraged competitors; and |
| • | making us vulnerable to increases in interest rates, because certain debt will vary with prevailing interest rates. |
We may be required to repay all or a portion of our debt on an accelerated basis in certain circumstances. If we fail to comply with the covenants and other restrictions in the agreements governing our debt, it could lead to an event of default and the consequent acceleration of our obligation to repay outstanding debt. Our ability to comply with debt covenants and other restrictions may be affected by events beyond our control, including general economic and financial conditions.
In particular, under the terms of our indebtedness, we must comply with certain financial ratios and satisfy certain financial condition tests, several of which become more restrictive over time and could require us to take action to reduce our debt or take some other action in order to comply with them. Our ability to satisfy required financial ratios and tests can be affected by events beyond our control, including prevailing economic, financial and industry conditions, and we cannot assure you that we will continue to meet those ratios and tests in the future. A breach of any of these covenants, ratios or tests could result in a default under our indebtedness. If we default, our credit facility lenders will no longer be obligated to extend credit to us and they could elect to declare
22
Table of Contents
all amounts outstanding under the indenture or senior secured credit facility, as applicable, together with accrued interest, to be immediately due and payable. The results of such actions would have a significant negative impact on our results of operations, financial position and cash flows.
Our variable rate indebtedness subjects us to interest rate risk, which could cause our debt service obligations to increase significantly.
Borrowings under our senior secured credit facility bear interest at variable rates, exposing us to interest rate risk. If interest rates increase, our debt service obligations on the variable rate indebtedness would increase even though the amount borrowed remained the same, and our net income and cash available for servicing our indebtedness would decrease.
| Item 1B. | Unresolved Staff Comments |
None.
| Item 2. | Properties |
We lease our corporate headquarters offices in Coraopolis, Pennsylvania and we own or lease numerous facilities including administrative offices, sales offices, truck yards, maintenance facilities, warehouses and well disposal sites in Louisiana, Texas, West Virginia, Pennsylvania and California. For the year ended December 31, 2011, the total rent expense associated with our leased properties was approximately $591,000. We believe that we have satisfactory title to the properties owned and used in our businesses, subject to liens for taxes not yet payable, liens incident to minor encumbrances, liens for credit arrangements (including liens under the New Credit Facility) and easements and restrictions that do not materially detract from the value of these properties, our interests in these properties, or the use of these properties in our businesses.
We believe all properties that we currently occupy are suitable for their intended uses. We believe that we have sufficient facilities to conduct our operations. However, we continue to evaluate the purchase or lease of additional properties or the consolidation of our properties, as our business requires.
| Item 3. | Legal Proceedings |
We are party to various litigation matters, including regulatory and administrative proceedings arising out of the normal course of business, the more significant of which are summarized below. The ultimate outcome of each of these matters cannot presently be determined, nor can the liability that could potentially result from a negative outcome be reasonably estimated presently for every case. The liability we may ultimately incur with respect to any one of these matters in the event of a negative outcome may be in excess of amounts currently accrued with respect to such matters and, as a result of these matters, may potentially be material to our financial position or results of operations. We review our litigation activities and determine if an unfavorable outcome to us is considered “remote,” “reasonably possible” or “probable” as defined by generally accepted accounting principals of the United States, or “U.S. GAAP”. Where we have determined an unfavorable outcome is probable and is reasonably estimable, we have accrued for potential litigation losses. In addition to the matters described below, we are involved in various other claims and legal actions, including regulatory and administrative proceedings arising out of the normal course of our business. We do not expect that the outcome of such other claims and legal actions will have a material adverse effect on our financial position or results of operations.
Class Action. On May 21, 2010, Richard P. Gielata, an individual purporting to act on behalf of stockholders, served a class action lawsuit filed May 6, 2010 against the Company and various directors and officers in the United States District Court for the District of Delaware captioned In re Heckmann Corporation Securities Class Action (C.A. No. 10-378-LPS-MPT), or the “Class Action”. The Class Action alleges violations of federal securities laws in connection with the acquisition of China Water. The Company responded by filing a
23
Table of Contents
motion to transfer the Class Action to California and a motion to dismiss the case. On October 6, 2010, the Magistrate Judge issued a report and recommendation to the District Court Judge to deny the motion to transfer. On October 8, 2010, the court-appointed lead plaintiff, Matthew Haberkorn, filed an Amended Class Action Complaint that adds China Water as a defendant. On October 25, 2010, the Company filed objections to the Magistrate Judge’s report and recommendation on the motion to transfer. The court adopted the report and recommendation on the motion to transfer on March 31, 2011. The Company filed a motion to dismiss the Amended Class Action Complaint and a reply to lead plaintiff’s opposition to the motion to dismiss. On June 16, 2011, the Magistrate Judge issued a report and recommendation to the District Court Judge to deny the motion to dismiss. The Company filed objections to the Magistrate Judge’s report and recommendation on the motion to dismiss. Plaintiff has filed a response to the Company’s objections. On October 25, 2011, the court heard oral argument on the Company’s objections to the report and recommendation on the motion to dismiss. The court has not yet ruled on the objections. On February 2, 2012, Plaintiff filed motion to modify the automatic discovery stay in place pursuant to the Private Securities Litigation Reform Act. The Company filed an opposition on February 13, 2012. On February 15, 2012, the Magistrate Judge entered an order modifying the discovery stay and requiring the Company to produce documents to plaintiff that have been produced in the Derivative Action described below.
Derivative Action. On November 18, 2010, Melissa Hess filed a stockholder derivative complaint, purportedly on behalf of the Company, against various officers and directors in the Superior Court of California, County of Riverside captioned Hess v. Heckmann, et al., or the “Derivative Action”. The Derivative Action alleges claims for breach of fiduciary duty, waste of corporate assets, and unjust enrichment in connection with the acquisition of China Water. The Company responded to the Derivative Action on February 1, 2011 by filing a motion to stay the case until the Class Action is resolved and a demurrer seeking to dismiss the case. The Company filed a reply to Plaintiff’s opposition to the motion to stay and demurrer on May 25, 2011. The court held a hearing on the demurrer and motion to stay on June 21, 2011. On July 20, 2011, the court issued orders overruling the Company’s demurrer and denying its motion to stay the Derivative Action. On August 24, 2011, the Company’s board of directors formed a special litigation committee and delegated to the special litigation committee the Board’s full power and authority to investigate the Derivative Action to determine whether it is in the best interests of the Company to allow the Derivative Action to proceed on behalf of the Company. On September 2, 2011, the Company filed a motion to stay the Derivative Action pending completion of the special litigation committee’s investigation and determination. On September 26, 2011, the Court held a hearing on the Company’s motion to stay. On October 3, 2011, the court issued an order denying the Company’s motion to stay without prejudice and a separate order requiring Defendants to respond to plaintiff’s request for production of documents within thirty days. On October 28, 2011, the special litigation committee filed a motion to stay the Derivative Action pending completion of its investigation and determination. After meeting and conferring on discovery matters, on December 2, 2011, the special litigation committee, plaintiff and defendants entered into a stipulation and proposed order to vacate the motion to stay filed by the special litigation committee, and, on December 5, 2011, the Court entered the order.
The outcome of the Class Action and Derivative Action could have a material adverse effect on our consolidated financial statements.
On June 10, 2011, we received a subpoena from the Denver Regional Office of the SEC seeking information and documents concerning the Company’s acquisition of China Water in 2008. The Company is cooperating fully with the SEC with respect to its requests.
| Item 4. | Not Applicable |
24
Table of Contents
HECKMANN CORPORATION
| Item 5. | Market for Registrant’s Common Equity, Related Stockholder Matters, and Issuer Purchases of Equity Securities |
Price Range of Common Stock
Our common stock trades on the NYSE under the symbol “HEK.” The following table sets forth, for the periods indicated, the range of high and low sales prices per share of our common stock as reported on the NYSE:
| Common Stock | ||||||||
| Year Ended December 31, 2010: |
High | Low | ||||||
| First quarter |
$ | 6.34 | $ | 4.87 | ||||
| Second quarter |
6.22 | 4.64 | ||||||
| Third quarter |
4.93 | 3.64 | ||||||
| Fourth quarter |
5.17 | 3.80 | ||||||
| Year Ended December 31, 2011: |
High | Low | ||||||
| First quarter |
$ | 6.58 | $ | 4.83 | ||||
| Second quarter |
6.48 | 5.59 | ||||||
| Third quarter |
6.28 | 5.22 | ||||||
| Fourth quarter |
6.95 | 5.09 | ||||||
Prior to November 9, 2011, we also had outstanding units, each consisting of one share of common stock and a warrant entitling the holder to purchase from us one share of common stock at an exercise price of $6.00. Both the units and these warrants had been listed on the NYSE and traded under the symbols “HEK.U” and “HEK.WS,” respectively. On November 9, 2011, all remaining unexercised warrants expired and were cancelled. As a result, the units were also cancelled. Both the warrants and the units have been delisted from the NYSE. We have outstanding privately-placed warrants exercisable for 941,176 shares of our common stock at an exercise price of $6.38 per share that expire on January 24, 2013, and privately-placed warrants exercisable for 626,866 shares of our common stock at an exercise price of $2.02 per share that expire on August 22, 2012.
Holders
As of December 31, 2011, there were 40 holders of record of our common stock.
Dividends
We have not paid any dividends on our common stock to date. The payment of dividends in the future will be contingent upon our revenues and earnings, if any, capital requirements and general financial condition. The payment of any dividends will be within the discretion of our board of directors and will be subject to other limitations as may be contained in our commercial credit facilities. It is the present intention of our board of directors to retain all earnings, if any, for use in our business operations and, accordingly, our board does not anticipate declaring any dividends in the foreseeable future.
Sales of Unregistered Equity Securities
We did not make any sales of unregistered equity securities during year ended December 31, 2011.
Repurchase of Equity Securities
In 2011, our board of directors approved an extension to March 11, 2012, of our discretionary equity buy-back plan, pursuant to which we are authorized to purchase our warrants and up to 20 million shares of our common stock in open market and private transactions.
25
Table of Contents
During the fourth quarter of 2011, we did not repurchase any warrants or shares of our common stock.
Performance Graph
The following graphs compare the cumulative total shareholder return for our common stock from November 20, 2007, the date our common stock first became separately tradable, through December 31, 2011 with the comparable cumulative return of two indices, the S&P 500 Index and the Dow Jones Industrial Average Index.
The graphs assume $100 invested on November 20, 2007 in our common stock and $100 invested at that same time in each of the two indices.
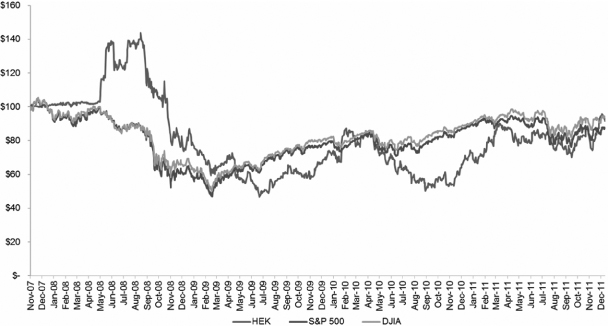
Securities Authorized for Issuance under Equity Compensation Plans
The following table provides information as of December 31, 2011, with respect to shares of our common stock that may be issued under the Heckmann Corporation 2009 Equity Incentive Plan, which is our only existing equity compensation plan under which grants can be made.
Equity Compensation Plan Information
| Plan Category |
Number of securities to be issued upon exercise of outstanding awards (a) |
Weighted Average exercise price of outstanding awards |
Number of securities remaining available for future issuance under equity compensation plans (excluding securities reflected in column(a)) |
|||||||||
| Equity compensation plans approved by stockholders |
3,210,000 | (1) | $ | 4.84 | 963,393 | (2) | ||||||
| Equity compensation plans not approved by stockholders |
— | — | — | |||||||||
| Total |
3,210,000 | $ | 4.84 | 963,393 | ||||||||
| (1) | The sum of options to acquire 2,709,750 shares of common stock and 1,326,857 restricted stock units awarded under the Heckmann Corporation 2009 Equity Incentive Plan less 826,607 shares issued thereunder. |
| (2) | Available as of December 31, 2011. |
26
Table of Contents
| Item 6. | Selected Financial Data |
The Selected Financial Data should be read in conjunction with Item 7. “Management’s Discussion and Analysis of Financial Condition and Results of Operations” and Item 8. “Financial Statements and Supplementary Data,” both contained herein.
The following table summarizes the relevant financial data for our business and should be read in conjunction with our consolidated financial statements, and the notes and schedules related thereto, which are included in this Annual Report.
Income Statement Data
Predecessor Company
| In thousands, except share and per share data |
January 1, 2008 to October 29, 2008 (5) |
Year ended December 31, 2007 (5) |
Year ended December 31, 2006 (5) |
|||||||||
| (Loss) income from discontinued operations |
$ | (121,000 | ) | $ | (36,522 | ) | $ | 6,263 | ||||
| Net (loss) income per share—basic and diluted: |
||||||||||||
| (Loss) income from discontinued operations |
$ | (1.28 | ) | $ | (0.47 | ) | $ | 0.10 | ||||
| Weighted average shares outstanding—basic and diluted |
94,521,000 | 77,772,000 | 59,872,000 | |||||||||
Successor Company
| In thousands, except share and per share data |
Year ended December 31, 2011 (1) (5) |
Year ended December 31, 2010 (2) (5) |
Year ended December 31, 2009 (3) (5) |
Year ended December 31, 2008 (5) |
For the Period May 29, 2007 (Inception) through December 31, 2007 |
|||||||||||||||
| Revenue |
$ | 156,837 | $ | 15,208 | $ | 3,820 | $ | — | $ | — | ||||||||||
| Loss from operations (4) |
(5,412 | ) | (19,513 | ) | (7,474 | ) | (1,974 | ) | (169 | ) | ||||||||||
| (Loss) income from continuing operations |
(108 | ) | (10,300 | ) | (3,317 | ) | 5,256 | 1,146 | ||||||||||||
| Loss from discontinued operations |
(22,898 | ) | (4,393 | ) | (392,078 | ) | (20,173 | ) | — | |||||||||||
| Net (loss) income attributable to the Heckmann Corporation |
(23,006 | ) | (14,693 | ) | (395,395 | ) | (14,917 | ) | 1,146 | |||||||||||
| (Loss) income per share from continuing operations: |
||||||||||||||||||||
| Basic |
* | (0.09 | ) | (0.03 | ) | 0.07 | 0.03 | |||||||||||||
| Diluted |
* | (0.09 | ) | (0.03 | ) | 0.06 | 0.03 | |||||||||||||
| (Loss) income per share from discontinued operations: |
||||||||||||||||||||
| Basic |
(0.20 | ) | (0.05 | ) | (3.58 | ) | (0.27 | ) | — | |||||||||||
| Diluted |
$ | (0.20 | ) | $ | (0.05 | ) | $ | (3.58 | ) | $ | (0.27 | ) | $ | — | ||||||
| Weighted average shares outstanding |
||||||||||||||||||||
| Basic |
114,574,730 | 108,819,384 | 109,575,057 | 74,853,651 | 25,305,415 | |||||||||||||||
| Diluted |
114,574,730 | 108,819,384 | 109,575,057 | 89,907,431 | — | |||||||||||||||
| * | Less than $0.01 |
| (1) | 2011 results include amounts from the acquisitions of Bear Creek Services, LLC, Devonian Industries, Inc. Sand Hill Foundation, LLC, Excalibur Energy Services, Inc. and Blackhawk, LLC and Consolidated Petroleum, Inc. from their acquisition dates of April 1, 2011, April 4, 2011, April 12, 2011, May 5, 2011 and June 14, 2011, respectively. |
27
Table of Contents
| (2) | 2010 results include amounts from the acquisition of CVR since November 30, 2010, the date of its acquisition. |
| (3) | 2009 results include amounts from HWR since July 1, 2009, the date HWR acquired all of the limited liability company interests of Charis Partners, LLC and all of the assets of Greer Exploration Corporation and Silversword Partnerships. |
| (4) | Includes expenses of $2.1 million in 2011 and $11.8 million in 2010 in connection with start-up and commissioning of HWR’s Haynesville pipeline. |
| (5) | On September 30, 2011, we completed the disposition, through a sale and abandonment, of the China Water bottled water business. The bottled water business has, for all periods presented herein, been reported as discontinued operations of financial reporting purposes. These reclassifications have no effect on our previously reported net income (loss). |
Balance Sheet Data (Successor Company)
All amounts shown are from continuing operations only
| In thousands, except share and per share data |
December 31, 2011 |
December 31, 2010 |
December 31, 2009 |
December 31, 2008 |
December 31, 2007 |
|||||||||||||||
| Cash and cash equivalents |
$ | 80,194 | $ | 80,752 | $ | 123,407 | $ | 270,194 | $ | 430,647 | ||||||||||
| Total current assets |
139,671 | 186,021 | 155,418 | 281,359 | 430,647 | |||||||||||||||
| Property, plant and equipment, net |
270,054 | 85,696 | 32,857 | — | — | |||||||||||||||
| Goodwill |
90,008 | 41,008 | 7,257 | — | — | |||||||||||||||
| Total assets |
539,681 | 355,671 | 308,448 | 428,571 | 430,647 | |||||||||||||||
| Current maturities of long-term debt |
11,914 | 11,221 | — | — | — | |||||||||||||||
| Long-term debt, less current portion |
132,156 | 20,474 | — | — | — | |||||||||||||||
| Total liabilities |
197,871 | 72,680 | 20,265 | 755 | 20,838 | |||||||||||||||
| Total equity of Heckmann Corporation |
341,810 | 301,621 | 310,981 | 743,759 | 281,125 | |||||||||||||||
28
Table of Contents
| Item 7. | Management’s Discussion and Analysis of Financial Condition and Results of Operations |
This Management’s Discussion and Analysis of Financial Condition and Results of Operations should be read in conjunction with our accompanying consolidated financial statements and related notes. See “Cautionary Note on Forward-Looking Statements” and Part 1A. “Risk Factors” included in this Annual Report for a description of important factors that could cause actual results to differ from expected results.
Company Overview
We are a services-based company focused on total water solutions for shale or “unconventional” oil and gas exploration and production. We operate in one business segment, water solutions for energy development, which is branded HWR, and includes our water delivery and disposal, trucking, fluids handling, treatment and temporary and permanent pipeline transport facilities and water infrastructure services for oil and gas exploration and production companies. Our strategy is to provide an integrated and efficient complete water solution to our customers through a full suite of services which we have built and will continue to build through organic growth and acquisitions.
We currently operate multi-modal water disposal, treatment, trucking and pipeline transportation operations in select shale areas in the United States including the Marcellus, Utica , Eagle Ford, Haynesville, Barnett and Tuscaloosa Marine Shale areas. We are currently expanding our business and operations into other hydrocarbon-rich shale plays. We serve customers seeking fresh water acquisition, temporary water transmission and storage, transportation, treatment or disposal of fresh water and complex water flows, such as flowback and produced brine water, in connection with shale oil and gas hydraulic fracturing drilling, or “hydrofracturing” operations. We also transport fresh water for production and provide services for site preparation, water pit excavations and remediation.
2011 Operational Developments
In addition to the acquisitions completed during the second quarter of 2011, as described in Note 3 of Notes to Consolidated Financial Statements, notable achievements during 2011 included:
Disposition of Our Bottled Water Business. Through our previously wholly owned subsidiary, China Water, we produced bottled water products at seven bottled water facilities in the People’s Republic of China, or “PRC,” including purified water, mineralized water and oxygenated water, which we supplied to beverage companies and servicing companies in the PRC. On September 30, 2011, we completed the sale of all of the shares of China Water Drinks (H.K.) Holdings Limited, a subsidiary of China Water, to Pacific Water in exchange for shares of Pacific Water equal to 10% of its outstanding equity. Following the completion of the disposition, we abandoned all of our remaining non-U.S. legal entities related to China Water. Together, the sale and abandonment result in the disposition and discontinuation of all of our bottled water business. As a result of these transactions, we recorded a loss from discontinued operations of $23.7 million in the third quarter of 2011, of which $17.9 million was a one-time non-cash charge.
New Credit Facility. On September 7, 2011, we and our HWR subsidiaries entered into a Credit Agreement, or the “New Credit Facility”, with Regions Bank, as administrative and collateral agent, RBS Citizens Bank, N.A. and First National Bank of Pennsylvania, as co-syndication agents, Wells Fargo Bank, National Association, as documentation agent, Regions Capital Markets and RBS Citizens Bank, N.A., as joint lead arrangers and joint book managers, and certain other lenders party thereto. The New Credit Facility provides initially for a total of $160 million in borrowing capacity, including a $70 million term loan facility and a $90 million revolving credit facility (of which up to $5 million may be utilized in the form of commercial and standby letters of credit and up to $10 million of which may be utilized as a swingline facility). The New Credit Facility also contains an uncommitted “accordion” feature, which permits us under certain circumstances to increase commitments under the revolving credit facility, or to establish additional term loans, up to an additional
29
Table of Contents
$40 million in the aggregate, for a total aggregate amount of borrowings of $200 million. As of December 31, 2011, we had borrowings of $140.2 million under the New Credit Facility, with up to $59.8 million available for future borrowings. See “—Liquidity and Capital Resources”.
Exercise and Expiration of Warrants. At January 1, 2011, we had outstanding warrants exercisable for 64.8 million shares of our common stock. In 2011, warrants were exercised for 8,783,074 shares of common stock, resulting in cash proceeds to us in the amount of $47.9 million. On November 9, 2011, all of the publicly-issued warrants, totaling 55.3 million, expired on their own terms. Remaining outstanding are approximately 1.56 million privately-issued warrants to purchase our common stock.
Pipeline Expansion. We have completed the majority of our 50 mile fiberglass pipeline that transports produced water to our disposal wells. The pipeline is supported by a network of deep injection disposal wells which we believe is not only an efficient solution for our customers, but also provides us with a strategic competitive position. The fiberglass produced water pipeline has the capacity to transport up to 120,000 barrels per day of produced water. The increased capacity and reliability of the fiberglass pipeline will allow us to expand the line further east to gain more produced water in the future through additional laterals tied directly to our customers’ wells and through the construction of an additional trucking terminal at the east end of the pipeline.
Results of Operations
Our operating results are substantially affected by our acquisition activities, and the expenses we incur in connection with those activities, which can limit comparability of our results from period to period. Results are also driven by demand for our services, which are in turn affected by the level of drilling activity (which impacts the amount of flowback water being processed) and active wells (which impacts the amount of produced water being processed) in the shale areas in which we operate. Activity in the oil and gas drilling industry is affected by market prices for those commodities. Recent declines in natural gas prices have caused many oil and natural gas producers to announce reductions in capital budgets for future periods. These cuts in spending curtailed drilling programs as well as discretionary spending on well services in certain shale areas and accordingly reduced demand for our services in these areas. We have been actively transferring certain operating assets to oil- and liquids-rich basins where drilling activity is more robust. To the extent such cuts in spending continue to curtail drilling programs, we will continue to redeploy our operating assets where possible.
Year Ended December 31, 2011 Compared to the Year Ended December 31, 2010
| (in thousands) |
2011 | 2010 | ||||||
| Revenue |
$ | 156,837 | $ | 15,208 | ||||
| Cost of sales |
123,509 | 11,337 | ||||||
|
|
|
|
|
|||||
| Gross profit |
33,328 | 3,871 | ||||||
| Operating expenses |
38,740 | 23,384 | ||||||
|
|
|
|
|
|||||
| Loss from operations |
(5,412 | ) | (19,513 | ) | ||||
| Interest income (expense), net |
(4,243 | ) | 2,087 | |||||
| Loss from equity investment |
(462 | ) | (689 | ) | ||||
| Other income, net |
6,232 | 4,411 | ||||||
|
|
|
|
|
|||||
| Loss before income taxes |
(3,885 | ) | (13,704 | ) | ||||
| Income tax benefit |
3,777 | 3,404 | ||||||
|
|
|
|
|
|||||
| Loss from continuing operations |
(108 | ) | (10,300 | ) | ||||
| Loss from discontinued operations |
(22,898 | ) | (4,393 | ) | ||||
|
|
|
|
|
|||||
| Net loss |
$ | (23,006 | ) | $ | (14,693 | ) | ||
|
|
|
|
|
|||||
30
Table of Contents
Revenue
Revenue for 2011 grew to $156.8 million from $15.2 million in 2010. The significant year-over-year growth in revenue resulted from (a) the full year effect of the CVR acquisition which we consummated on November 30, 2010, (b) the five acquisitions that we closed in the second quarter of 2011, and (c) revenues resulting from a significant capital investment program during 2011, including an expansion of the Company’s fleet and disposal well assets. Revenues from our pipeline operations were negatively impacted during 2011 as a result of start-up and commissioning activities discussed below.
Cost of Sales and Gross Profit
Cost of sales for the year ended December 31, 2011 was $123.5 million, resulting in total gross profit of approximately $33.3 million, or 21.3% of revenue. Cost of sales for the year ended December 31, 2010 was $11.3 million, resulting in total gross profit of $3.9 million, or 25.5% of sales. Included in cost of sales for the years ended December 31, 2011 and 2010 is depreciation expense of approximately $21.4 million and $3.4 million, respectively. The significantly higher depreciation expense in 2011 is attributable to the acquisitions in 2011 and 2010 (see Note 3) and capital expenditures.
Operating Expenses
Operating expenses for the year ended December 31, 2011 totaled $38.7 million, compared to $23.4 million for the year ended December 31, 2010. Operating expenses in 2011 included approximately $2.4 million of stock-based compensation, amortization expense of approximately $3.9 million, a $2.2 million increase to the bad debt reserve, and approximately $2.1 million of start-up and commissioning costs related to our underground pipeline in the Haynesville Shale area. Also included in operating expenses for the year ended December 31, 2011 was approximately $0.9 million of transaction costs associated with the acquisitions completed in the second quarter of 2011. Operating expenses for the year ended December 31, 2010 included pipeline start-up and commissioning costs of approximately $11.8 million resulting from repairs and remediation of certain segments of the Haynesville pipeline, amortization expense of $1.2 million, stock-based compensation expense of $1.0 million and $0.5 million in transaction costs related to the CVR acquisition. Excluding these items, general and administrative expense increased largely due to the impact of the 2010 and 2011 acquisitions as well as increased staffing and other costs required to support the Company’s growth and the integration of the acquired businesses.
Loss from Operations
Loss from operations was $5.4 million and $19.5 million for December 31, 2011 and 2010, respectively, primarily as a result of the items mentioned above.
Interest Income, net
During the year ended December 31, 2011, we recorded net interest expense of approximately $4.2 million as opposed to $2.1 million of interest income for the year ended December 31, 2010. The decrease was primarily due to lower interest rates for invested funds and lower investment balances in the year ended December 31, 2011 compared to the same period of 2010, and increased borrowings under our New Credit Facility throughout 2011 (Note 10).
Loss from Equity Investment
During the year ended December 31, 2011, we recorded a loss of approximately $0.5 million related to our joint venture with Energy Transfer Partners, L.P. that was terminated on July 8, 2011. For the year ended December 31, 2010, we recorded an equity loss of approximately $0.7 related to the joint venture.
Other Income (Expense), net
Other income (expense), net for the year ended December 31, 2011 totaled approximately $6.2 million, consisting primarily of net reductions to liabilities for contingent consideration which were adjusted through
31
Table of Contents
earnings. Such changes result from re-assessment of the performance-based earn-outs related to (a), our acquisition of the Excalibur Energy Services, Inc. on May 6, 2011, (b) the CVR acquisition in 2010, and (c) the acquisition of Charis Partners LLC, on July 1, 2009.
For the period ended December 31, 2010, other income was primarily attributable to a $4.2 million change in the fair value of the contingent consideration associated with the performance-based earn-out related to the Charis acquisition in 2009. As a result of pipeline start-up and commissioning expenses incurred in the year ended December 31, 2010, management determined that the earn-out obligation related to the 2010 profitability target for the Charis acquisition would not be met. Accordingly, the liability for contingent consideration was adjusted through earnings.
Income Tax Benefit
The income tax benefit for the year ended December 31, 2011 was approximately $3.8 million compared to an income tax benefit for the year ended December 31, 2010 of approximately $3.4 million. The primary factors affecting income taxes and the effective income tax benefit rate in 2011 was the deferred tax assets relating to net operating loss carry forwards and changes to the associated valuation allowance established for net operating loss carry forwards. In 2010, the income tax benefit was primarily attributable to a carryback of net operating losses.
Net loss from continuing operations
Our net loss for the year ended December 31, 2011 was $0.1 million compared to $10.3 million for the year ended December 31, 2010, primarily as a result of the items referred to above.
Loss from Discontinued Operations
Our net loss from discontinued operations for the year ended December 31, 2011 was approximately $22.9 million compared to a net loss of $4.4 million for the year ended December 31, 2010. The increased loss was attributable to our September 30, 2011 sale and abandonment of our China Water business (see Note 12).
Year Ended December 31, 2010 Compared to the Year Ended December 31, 2009
| (in thousands) |
2010 | 2009 | ||||||
| Revenue |
$ | 15,208 | $ | 3,820 | ||||
| Cost of sales |
11,337 | 2,100 | ||||||
|
|
|
|
|
|||||
| Gross profit |
3,871 | 1,720 | ||||||
| Operating expenses |
23,384 | 9,194 | ||||||
|
|
|
|
|
|||||
| Loss from operations |
(19,513 | ) | (7,474 | ) | ||||
| Interest income, net |
2,087 | 3,928 | ||||||
| Loss from equity investment |
(689 | ) | — | |||||
| Other income, net |
4,411 | 149 | ||||||
|
|
|
|
|
|||||
| Loss before income taxes |
(13,704 | ) | (3,397 | ) | ||||
| Income tax benefit |
3,404 | 80 | ||||||
|
|
|
|
|
|||||
| Loss from continuing operations |
(10,300 | ) | (3,317 | ) | ||||
| Loss from discontinued operations |
(4,393 | ) | (392,078 | ) | ||||
|
|
|
|
|
|||||
| Net loss |
$ | (14,693 | ) | $ | (395,395 | ) | ||
|
|
|
|
|
|||||
Revenue
Revenue for the year ended December 31, 2010 were $15.2 million, which represents revenues from our water solutions for energy development business as compared to net sales for the year ended December 31, 2009
32
Table of Contents
of $3.8 million. Revenues for the year ended December 31, 2010 from water disposal operations were significantly greater than the year ended December 31, 2009, reflecting full year revenues from the July 2009 acquisition of HWR and one month of sales from the November 2010 acquisition of CVR. Revenues from water disposal operations were negatively impacted for the year ended December 31, 2010 as a result of start-up and commissioning activities discussed below.
Cost of Sales and Gross Profit
The cost of sales for the year ended December 31, 2010 was $11.3 million, resulting in total gross profit of $3.9 million, or 25.7% of sales. All of the gross profit was attributable to water disposal revenues. The cost of goods sold for the year ended December 31, 2009 was $2.1 million, resulting in total gross profit of $1.7 million, or 45.0% of sales. All of this gross profit was attributable to water disposal revenues. Gross profits were lower than expected due to interruptions encountered as a result of start-up and commissioning activities on the Haynesville pipeline during the second and third quarters of 2010.
Operating Expenses
Operating expenses for the year ended December 31, 2010 totaled $23.4 million, compared to $9.2 million for the year ended December 31, 2009.
Operating expense for the year ended December 31, 2010 included pipeline start-up and commissioning costs of approximately $11.8 million resulting from anomalies in certain segments of the Haynesville pipeline. Accordingly, we reduced the operating pressures below normal operating pressures as we performed additional testing procedures and remediated the anomalies. The pressure reductions and shutdowns that were undertaken to remediate anomalies reduced throughput and adversely impacted our operating costs and revenues during the year ended December 31, 2010.
General and administrative expenses for the year ended December 31, 2010 were $11.6 million which included approximately $1.0 million of stock based compensation and amortization expense of approximately $1.2 million. General and administrative expenses for the year ended December 31, 2009 were $9.2 million which included approximately $2.9 million of stock based compensation and amortization expense of approximately $0.1 million. In addition, during the first quarter of 2009, we adopted the Financial Accounting Standard Board’s or “FASB” revised authoritative guidance for business combinations, which requires that acquisition related costs be expensed in the period in which the costs are incurred. This differs from previous accounting treatment in which acquisition related expenses were included as part of the purchase price of an acquired company. We incurred approximately $0.2 million in acquisition related costs in connection with our acquisition by HWR of our saltwater disposal and transport business in the year ended December 31, 2009, and approximately $0.5 million in acquisition related costs in connection with our acquisition of CVR in the year ended December 31, 2010.
Loss from Operations
Loss from operations was $19.5 million and $7.5 million for December 31, 2010 and 2009, respectively, primarily as a result of the items mentioned above.
Interest Income, net
During the years ended December 31, 2010 and 2009, we recorded interest income on invested funds of approximately $2.1 million and $3.9 million, respectively. The decrease was primarily due to lower interest rates for invested funds and lower investment balances in 2010 compared to 2009.
Loss from Equity Investment
During the year ended December 31, 2010, we recorded a loss of approximately $0.7 million representing the Company’s 50% interest in a joint venture. The joint venture was subsequently terminated on July 8, 2011.
33
Table of Contents
Other Income, net
During the year ended December 31, 2010, we recorded other income of approximately $4.4 million compared to other income of $0.1 million for the same period in 2009. The increase was primarily attributable to a $4.2 million change in the fair value of the contingent consideration associated with the performance based earn-out related to the Charis acquisition. As a result of pipeline start-up and commissioning expenses incurred in the twelve months ended December 31, 2010, management determined that the earn-out obligation related to the 2010 profitability target for the Charis acquisition would not be met.
Income Tax Benefit
The income tax benefit for the year ended December 31, 2010 was approximately $3.4 million related primarily to losses sustained from pipeline start-up and commissioning expenses during the year. The income tax benefit for the year ended December 31, 2009 was approximately $80,000.
Loss from Continuing Operations
Our net loss from continuing operations for the year ended December 31, 2010 was $10.3 million compared to $3.3 million for the year ended December 31, 2009. The change relates primarily to the items mentioned above.
Loss from Discontinued Operations
Our loss from discontinued operations for the year ended December 31, 2010 was $4.4 million compared to a loss of $392.0 million for the year ended December 31, 2009. The increased 2009 loss relates primarily to the $357.5 million non-cash goodwill impairment charge based upon finalizing our goodwill analysis on the China Water acquisition, a $6.8 million impairment to the carrying value of fixed assets related to the closure of the Beijing bottled water factory, which was acquired by China Water prior to October 30, 2008, $5.3 million of expense related to the deconsolidation of Shen Yang Aixin, $4.5 million of reimbursements made to Xu Hong Bin, the former president and chairman of China Water, that were previously capitalized, $9.3 million of bad debt expense, a $3.9 million loss on disposal of property, plant and equipment, and provisions for liabilities of $1.3 million.
Net loss
Our net loss for the year ended December 31, 2010 was $14.7 million compared to $395.4 million for the year ended December 31, 2009. The change relates primarily to the items mentioned above.
Capital Expenditures
During the year ended December 31, 2011, we made capital expenditures totalling $150.9 million, including an expansion of our fleet of trucks and trailers, additional salt water disposal wells and construction of a pipeline in the Haynesville Shale area. Our capital expenditures, excluding acquisitions, are expected to be approximately $70.0 million for 2012. A significant portion of our planned capital expenditures can be adjusted to reflect changes in our expectations for future customer spending and we will manage these investments to match market demand.
Liquidity and Capital Resources
We require cash to fund our operating expenses and working capital requirements, including outlays for capital expenditures, strategic acquisitions and investments, repurchases of our securities, and lease payments. Our primary sources of liquidity are cash on hand and cash generated from operations and from our New Credit Facility. Cash generated from operations is a function of such factors as changes in demand for our products and services, competitive pricing pressures, effective management of the utilization of our assets, our ability to
34
Table of Contents
achieve reductions in operating expenses, and the impact of integration on our productivity. We seek to preserve our cash balances by investing in marketable securities consisting of high grade corporate notes and United States government securities purchased in accordance with our investment policy, which allows us to invest and reinvest in United States government securities having a maturity of five years or less, and other obligations of United States government agencies and instrumentalities, including government sponsored enterprises, commercial paper, corporate notes and bonds, short term instruments that are direct obligations of issuers, long term instruments that are direct obligations of issuers, and municipal notes and bonds with a maturity of five years or less. We avoid any involvement with mortgage backed securities, collateralized mortgage obligations, auction rate securities, collateralized debt obligations, credit default swaps and similar high risk and/or exotic financial instruments. However, as required pursuant to the terms of our New Credit Facility, we maintain a floating-to-fixed interest rate swap in the notional amount of $35.0 million. Any decisions regarding the size of individual investments or their composition must comply with our investment policy with the intent to yield higher obtainable returns with the understanding that the investment may need to be liquidated in the near term to consummate strategic business combinations.
As of December 31, 2011, we had cash and cash equivalents of approximately $80.2 million, and approximately $5.2 million of marketable securities, for an aggregate of approximately $85.4 million in cash and cash equivalents and short-term investments. In addition, we had outstanding borrowings under our New Credit Facility of $140.2 million, with up to $59.8 million available thereunder for future borrowings assuming exercise of the uncommitted “accordion feature.” Under our New Credit Facility, we are required to maintain at least $20.0 million in cash and cash equivalents at all times as well as to comply with certain financial covenants. As of December 31, 2011 we were in compliance with these covenants. We believe that our cash, cash equivalents, investments and availability on our revolving line of credit under our New Credit Facility will be sufficient to facilitate planned capital expenditures that we may undertake this year. We may, however, seek to raise additional financing during the next twelve months in order to support our growth, including possible acquisitions, or to maintain a strong balance sheet with sufficient cash and liquidity. However, there can be no assurance that our liquidity will be adequate over time. Our capital expenditures may be greater than we expect if we decide to bring capacity on line more rapidly. If our capital resources are insufficient to satisfy our liquidity requirements, we may seek to sell additional equity or debt securities or obtain other forms of financing.
Cash Flows for Year Ended December 31, 2011 compared to the Year Ended December 31, 2010
Net cash used in operating activities from continuing operations was $9.3 million for the year ended December 31, 2011 compared to $3.4 million for the year ended December 31, 2010. The increase in cash used was primarily attributable to a significant increase in accounts receivable during 2011 stemming largely from revenue growth during the period, and was exacerbated by slower customer payments during the fourth quarter of 2011. Net cash used in operating activities from discontinued operations was $4.7 million compared to net cash used in operations from discontinued operations of $0.7 million in the year ago period.
Net cash used in investing activities from continuing operations was $142.3 million for the year ended December 31, 2011 compared to $37.7 million for the year ended December 31, 2010. The increase was primarily attributable to $59.7 million of additional cash paid for acquisitions in 2011 as compared to the year ago period, and an additional $133.5 million of capital expenditures to support business growth compared to 2010. These higher cash requirements for investments were partially offset by approximately $87.4 million of additional net cash proceeds realized from the liquidation of available–for–sale securities and redemption of certificates of deposit. Net cash used in investing activities by discontinued operations was $5.8 million for the year ended December 31, 2011 compared to $0.5 million in the year ago period.
Net cash provided by financing activities from continuing operations was $151.0 million for the year ended December 31, 2011 compared to $1.6 million of cash used in financing activities from continuing operations for the year ended December 31, 2010. The increase was primarily attributable to $47.9 million of cash proceeds received in the fourth quarter of 2011 from the exercise of previously issued warrants for approximately
35
Table of Contents
7.9 million shares of our common stock at an exercise price of $6.00 per warrant and net borrowings under our New Credit Facility totalling $108.8 million. Financing activities from discontinued operations was not significant during 2011 and 2010.
Cash Flows for Year Ended December 31, 2010 compared to the Year Ended December 31, 2009
Net cash used in operating activities from continuing operations was $3.4 million for the year ended December 31, 2010 compared to $3.6 million for the year ended December 31, 2009. Net cash used in operations from discontinued operations was $0.7 million compared to net cash used in operations from discontinued operations of $2.4 million in the year ago period. The improvement was attributable to lower working capital requirements for the discontinued operations in 2010.
Net cash used in investing activities from continuing operations was $37.7 million for the year ended December 31, 2010 compared to $106.8 million for the year ended December 31, 2009. The reduction was primarily attributable to lower spending for additions to fixed assets year over year of $2.5 million, lower net spending on equity investments of $6.0 million, lower net cash proceeds from available-for-sale securities of $73.0 million, offset by additional cash used to consummate business combinations of $12.0 million ($28.6 million was used to consummate the November 30, 2010 acquisition of CVR (see “Note 3). Net cash used in investing activities by discontinued operations was $0.5 million for the year ended December 31, 2010 compared to net cash used in investing activities by discontinued operations of $16.0 million in the year ago period. The improvement was attributable to lower spending for capital expenditures.
Net cash used in financing activities from continuing operations was $1.6 million for the year ended December 31, 2010 compared to $18.4 million for the year ended December 31, 2009. The decrease was primarily related to reduced purchases of shares of our common stock and warrants of $12.9 million and $2.4 million, respectively, for the year ended December 31, 2010 compared to the year ago period. Net cash used in financing activities from discontinued operations was $1.0 million for the year ended December 31, 2010 compared to net cash provided by financing activities of $1.7 million for the year ago period. The reduction was attributable to repayments on long term debt obligations made by the discontinued operation in the year ended December 31, 2010.
Contractual Obligations
The following table summarizes contractual obligations and borrowings as of December 31, 2011, and the timing and effect that these commitments are expected to have on our liquidity and capital requirements in future periods. Potential payments for contingent consideration have been excluded from the table below. We expect to fund other commitments primarily with operating cash flows generated in the normal course of business. Interest expense was estimated at current applicable rates. In 2011, we entered into a contract to purchase up to 200 Peterbilt LNG heavy duty trucks. As of March 5, 2012, we have purchased approximately 85 of these LNG trucks. We intend to continue to make purchases of LNG trucks pursuant to this contract, subject to the terms of the contract and market conditions.
| Payments Due by Period | ||||||||||||||||||||
| Less than 1 Year |
1 to 3 Years |
3 to 5 Years |
More than 5 Years |
Total | ||||||||||||||||
| (Amounts in Thousands) | ||||||||||||||||||||
| Debt obligations |
$ | 11,914 | $ | 23,149 | $ | 109,007 | $ | — | $ | 144,070 | ||||||||||
| Interest expense |
6,084 | 10,800 | 4,716 | — | 21,600 | |||||||||||||||
| Quarterly obligation under purchase agreement (Note 3) |
462 | — | — | — | 462 | |||||||||||||||
| Operating and capital lease obligations |
1,257 | 1,541 | 571 | 201 | 3,570 | |||||||||||||||
|
|
|
|
|
|
|
|
|
|
|
|||||||||||
| Total |
$ | 19,717 | $ | 35,490 | $ | 114,294 | $ | 201 | $ | 169,702 | ||||||||||
|
|
|
|
|
|
|
|
|
|
|
|||||||||||
36
Table of Contents
Off Balance Sheet Arrangements
We do not have off-balance sheet arrangements, financings, obligations or other relationships with unconsolidated entities or other persons, also known as “variable interest entities.”
Recent Accounting Pronouncements
Fair Value Measurement
In May 2011, the FASB issued Accounting Standards Update, or “ASU” 2011-04, Fair Value Measurement (Topic 820): Amendments to Achieve Common Fair Value Measurement and Disclosure Requirements in U.S. GAAP and IFRSs. ASU 2011-04 generally provides a uniform framework for fair value measurements and related disclosures between U.S. GAAP and International Financial Reporting Standards (“IFRS”). Additional disclosure requirements in the update include: (1) for Level 3 fair value measurements, quantitative information about unobservable inputs used, a description of the valuation process used by the entity, and a qualitative discussion about the sensitivity of the measurements to changes in the unobservable inputs; (2) for an entity’s use of a nonfinancial asset that is different from the asset’s highest and best use, the reason for the difference; (3) for financial instruments not measured at fair value but for which disclosure of fair value is required, the fair value hierarchy level in which the fair value measurements were determined; and (4) the disclosure of all transfers between Level 1 and Level 2 of the fair value hierarchy. This update is effective for annual and interim periods beginning on or after December 15, 2011. The effect of ASU 2011-04 on the consolidated financial statements and related disclosures is not expected to be significant.
Comprehensive Income
In June 2011, the FASB issued ASU 2011-05, Comprehensive Income (Topic 220). ASU 2011-05 gives an entity the option to present the total of comprehensive income, the components of net income, and the components of other comprehensive income either in a single continuous statement of comprehensive income or in two separate but consecutive statements; the option to present components of other comprehensive income as part of the statement of changes in stockholders’ equity was eliminated. The items that must be reported in other comprehensive income or when an item of other comprehensive income must be reclassified to net income were not changed. Additionally, no changes were made to the calculation and presentation of earnings per share. This update is effective for annual and interim periods beginning on or after December 15, 2011. The effect of ASU 2011-05 on the consolidated financial statements and related disclosures is not expected to be significant.
Critical Accounting Policies
The preparation of financial statements and related disclosures in conformity with generally accepted accounting principles in the United States requires management to make assumptions, estimates and judgments that affect the amounts reported in the financial statements, including the notes thereto, and related disclosures of commitments and contingencies, if any. We consider our critical accounting policies to be those that require the most significant judgments and estimates in the preparation of our financial statements, including the following:
Allowance for Doubtful Accounts
We perform ongoing credit evaluations of customers and adjusts credit limits based upon payment history and the customer’s current credit worthiness, as determined by a review of their current credit information. We continuously monitor collections and payments from customers and maintain a provision for estimated credit losses based upon historical experience and any specific customer collection issues that have been identified. If the financial condition of a specific customer or the Company’s general customer base were to deteriorate, resulting in an impairment of their ability to make payments, additional allowances may be required. Accounts receivable are presented net of allowances for doubtful accounts of approximately $2.6 million and $1.2 million at December 31, 2011 and 2010, respectively.
37
Table of Contents
Goodwill
We test goodwill for impairment on an annual basis, regardless of whether adverse events or changes in circumstances have occurred. We perform a qualitative assessment to determine whether it is “more likely than not” that the fair value of the reporting unit is less than its carrying amount. If it is concluded that it is “more likely than not” that the fair value of a reporting unit is less than its carrying amount, it is necessary to perform the two-step goodwill impairment test. Otherwise the two-step goodwill impairment test is not required.
We determine our reporting units at the individual operating segment level, or one level below, when there is discrete financial information available that is regularly reviewed by segment management for evaluating operating results.
We estimate the fair value of the reporting unit utilizing a combination of three valuation techniques: discounted cash flow (Income Approach), market comparable method (Market Approach) and market capitalization (Direct Market Data Method). The Income Approach is based on management’s operating budget and internal five-year forecast. This approach utilizes forward-looking assumptions and projections, and considers factors impacting long-range plans that may not be comparable to other companies and that are not yet publicly available. The Market Approach considers potentially comparable companies and transactions within the industries where our reporting units participate, and applies their trading multiples to ours. This approach utilizes data from actual marketplace transactions, but reliance on its results is limited by difficulty in identifying companies that are specifically comparable to us, considering the diversity of the our businesses, their relative sizes and levels of complexity. We also use the Direct Market Data Method by comparing its book value and the estimates of fair value of our reporting unit to our market capitalization as of and at dates near the testing date. Management uses this comparison as additional evidence of the fair value of the Company, as its market capitalization may be suppressed by other factors such as the control premium associated with a controlling shareholder. Management evaluates and weights the results based on a combination of the Income and Market Approaches, and, in situations where the Income Approach results differ significantly from the Market and Direct Market Data Approaches, management re-evaluates and adjusts, if necessary, its assumptions.
Future declines in sales and/or operating profit, declines in the Company’s stock price, or other changes in our business or the markets for its products could result in impairments of goodwill and other intangible assets.
Accounting for the Impairment of Long-Lived Assets other than Goodwill
We review the carrying values of property and equipment, intangible assets and other long-lived assets for impairment whenever events or changes in circumstances indicate that the carrying amounts may not be recoverable.
Our determination that an adverse event or change in circumstance has occurred that indicates that the carrying amounts may not be recoverable will generally involve (1) a deterioration in an asset’s financial performance compared to historical results, (2) a shortfall in an asset’s financial performance compared to forecasted results, or (3) changes affecting the utility and estimated future demands for the asset. During 2011, there were no events or circumstances that caused us to review the carrying value of our intangible assets and property and equipment.
If the sum of the estimated future cash flows (undiscounted) from an asset is less than its carrying amount, an impairment loss may be recognized. If the carrying value were to exceed the undiscounted cash flows, the impairment to be recognized is measured by the amount by which the carrying amount of the asset exceeds its fair market value. We could record impairments in the future if changes in long-term market conditions, expected future operating results or the utility of the assets results in changes for our impairment test calculations which negatively impact the fair value of our property and equipment and intangible assets.
38
Table of Contents
Accounting for Business Combinations
We allocate the purchase price of acquisitions to the assets acquired and liabilities assumed based on their estimated fair value at the date of acquisition. Any purchase price in excess of the net fair value of the assets acquired and liabilities assumed is allocated to goodwill. The fair value of certain of our assets and liabilities is determined by (1) using estimates of replacement costs for tangible fixed assets and (2) using discounted cash flow valuation methods for estimating identifiable intangibles such as customer contracts and customer relationship intangibles (Income Approach). The purchase price allocation requires subjective estimates that, if incorrectly estimated, could be material to our consolidated financial statements including the amount of depreciation and amortization expense. The determination of the final purchase price allocation could extend over several quarters resulting in the use of preliminary estimates that are subject to adjustment until finalized. This Income approach used to value identifiable intangible assets utilizes forward-looking assumptions and projections, but considers factors unique to each of our businesses and related long-range plans that may not be comparable to other companies and that are not yet publicly available. The Income Approach requires us to calculate the present value of estimated future cash flows. In making this calculation, management makes estimates regarding future revenues and expenses, projected capital expenditures, changes in working capital and the appropriate discount rate, however actual results could differ significantly from these estimates. The projections also include assumptions related to including current and estimated economic trends and outlook, operating costs, and other factors which are beyond management’s control.
Valuation of Deferred Tax Assets
We record deferred income tax assets and liabilities on our consolidated balance sheet related to events that impact our financial statements and tax returns in different periods. In order to compute these deferred tax balances, we first analyze the differences between the book basis and tax basis of our assets and liabilities (referred to as “temporary differences”). These temporary differences are then multiplied by current tax rates to arrive at the balances for the deferred income tax assets and liabilities. A valuation allowance is provided on deferred tax assets that do not meet the “more likely than not” realization threshold. We recognize a tax position if it is more likely than not it will be sustained upon examination. The tax position is measured at the largest amount that is greater than 50 percent likely of being realized upon ultimate settlement. If our expectations about the future tax consequences of past events should prove to be inaccurate, the balances of our deferred income tax assets and liabilities could require significant adjustments in future periods. Such adjustments could cause a material effect on our results of operations for the period of the adjustment.
Before giving effect to any valuation allowances, we are in an overall net deferred tax asset position at December 31, 2011, primarily relating to net operating loss carry forwards (including a loss in 2011 on the sale and abandonment of China Water). During 2011, in our judgment, the deferred tax assets did not meet the “more likely than not” realization threshold under U.S. GAAP principally due to our recent history of losses from continuing operations, and as a result, we continued to record a valuation allowance fully offsetting our net deferred tax assets.
Any future reversal of the valuation allowance would have a favorable impact on our net income but would have no effect on our cash flows. While a reversal, if any, of the valuation allowance would have a positive effect on the Company’s net income in the period of reversal, our net income in periods after such reversal would be reduced as a result of an increase in the provision for income taxes to approximately the statutory rate.
39
Table of Contents
| Item 7A. | Quantitative and Qualitative Disclosure About Market Risk |
Inflation
Inflationary factors, such as increases in the cost of our products and overhead costs, could impair our operating results. Although we do not believe that inflation has had a material impact on our financial position or results of operations to date, a high rate of inflation in the future may have an adverse effect on our ability to maintain current levels of gross margin and selling, general and administrative expenses as a percentage of sales revenue if the selling prices of our products do not increase with these increased costs.
Interest Rates
Our exposure to market risk for changes in interest rates relates to our New Credit Facility. As required under our New Credit Facility, we have entered into a floating-to-fixed interest rate swap agreement with a notional value of $35 million in order to manage the interest rate risk of this variable rate debt. Assuming the level of indebtedness we had outstanding at December 31, 2011, if interest rates were to increase 1% our annual interest expense would increase by approximately $1.1 million.
| Item 8. | Financial Statements and Supplementary Data |
The financial statements and supplementary data required by Regulation S-X are included in Item 15. “Exhibits, Financial Statements Schedules” contained in Part IV, Item 15 of this Annual Report on Form 10-K.
| Item 9. | Changes in and Disagreements with Accountants on Accounting and Financial Disclosure |
In 2011, there were no disagreements with accountants on accounting and financial disclosures.
| Item 9A. | Controls and Procedures |
(a) Evaluation of Disclosure Controls and Procedures
As of the end of the period covered by this Annual Report, our management, under the supervision and with the participation of our Chief Executive Officer (Principal Executive Officer) and Chief Financial Officer (Principal Financial Officer), updated the evaluation of our disclosure controls and procedures (as defined in Rule 13a-15(e) of the Exchange Act). Based upon, and as of the date of that evaluation, our Chief Executive Officer and Chief Financial Officer concluded that our disclosure controls and procedures were effective to provide reasonable assurance that the information required to be disclosed in our reports filed with the SEC under the Exchange Act are recorded, processed, summarized and reported within the time periods specified in the SEC’s rules and forms, and are accumulated and communicated to our management, including the Chief Executive Officer, as appropriate to allow timely decisions regarding required disclosure.
(b) Management’s Report on Internal Control over Financial Reporting
Our management is responsible for establishing and maintaining adequate internal control over financial reporting as defined in Rule 13a-15(f) under the Exchange Act. The Exchange Act defines internal control over financial reporting as a process designed by, or under the supervision of, a Company’s principal executive and principal financial officers and effected by a Company’s Board of Directors, management and other personnel, to provide reasonable assurance regarding the reliability of financial reporting and the preparation of financial statements for external purposes in accordance with accounting principles generally accepted in the United States of America and includes those policies and procedures that: (1) pertain to the maintenance of records that in reasonable detail accurately and fairly reflect the transactions and dispositions of the assets of the Company; (2) provide reasonable assurance that transactions are recorded as necessary to permit preparation of financial statements in accordance with United States generally accepted accounting principles, or U.S.GAAP, and that receipts and expenditures of the Company are being made only in accordance with authorizations of management
40
Table of Contents
and directors of the Company; and (3) provide reasonable assurance regarding prevention or timely detection of unauthorized acquisition, use, or disposition of the Company’s assets that could have a material effect on the financial statements.
There are inherent limitations in the effectiveness of any system of internal controls, including the possibility of human error and the circumvention or overriding of controls, such that internal control over financial reporting may not prevent or detect misstatements. Also, projections of any evaluation of effectiveness to future periods are subject to the risk that controls may become inadequate because of changes in conditions, or that the degree of compliance with the policies and procedures may deteriorate. A material weakness is a deficiency, or a combination of deficiencies, in internal controls over financial reporting, such that there is a reasonable possibility that a material misstatement of the Company’s annual or interim financial statements will not be prevented or detected on a timely basis. A significant deficiency is a deficiency, or a combination of deficiencies, in internal control over financial reporting that is less severe than a material weakness, yet important enough to merit attention by those responsible for oversight of our financial reporting.
Management, with the participation and under the supervision of our Chief Executive Officer and our Chief Financial Officer, assessed the effectiveness of our internal control over financial reporting as of December 31, 2011. In assessing the effectiveness of our internal controls over financial reporting as of December 31, 2011, we used the criteria set forth by the Committee of Sponsoring Organizations of the Treadway Commission, or COSO, in Internal Control—Integrated Framework. Based on our assessment, we determined that our internal controls over financial reporting were effective based on those criteria.
KPMG LLP, or “KPMG”, our independent registered public accounting firm, has performed an audit of the effectiveness of our company’s internal control over financial reporting as of December 31, 2011, and, as part of its audit, has issued its attestation report on the effectiveness of our company’s internal control over financial reporting herein as of December 31, 2011. KPMG’s attestation report is included in this Annual Report on Form 10-K. This audit is required to be performed in accordance with the standards of the Public Company Accounting Oversight Board (United States).
(c) Changes in Internal Controls over Financial Reporting
There were no changes in our internal control over financial reporting, during the fiscal quarter ended December 31, 2011 that have materially affected, or are reasonably likely to materially affect, our internal control over financial reporting.
41
Table of Contents
Report of Independent Registered Public Accounting Firm
The Board of Directors
Heckmann Corporation:
We have audited Heckmann Corporation’s internal control over financial reporting as of December 31, 2011, based on criteria established in Internal Control—Integrated Framework issued by the Committee of Sponsoring Organizations of the Treadway Commission (COSO). Heckmann Corporation’s management is responsible for maintaining effective internal control over financial reporting and for its assessment of the effectiveness of internal control over financial reporting, included in the accompanying Management’s Report on Internal Control over Financial Reporting. Our responsibility is to express an opinion on the Company’s internal control over financial reporting based on our audit.
We conducted our audit in accordance with the standards of the Public Company Accounting Oversight Board (United States). Those standards require that we plan and perform the audit to obtain reasonable assurance about whether effective internal control over financial reporting was maintained in all material respects. Our audit included obtaining an understanding of internal control over financial reporting, assessing the risk that a material weakness exists, and testing and evaluating the design and operating effectiveness of internal control based on the assessed risk. Our audit also included performing such other procedures as we considered necessary in the circumstances. We believe that our audit provides a reasonable basis for our opinion.
A company’s internal control over financial reporting is a process designed to provide reasonable assurance regarding the reliability of financial reporting and the preparation of financial statements for external purposes in accordance with generally accepted accounting principles. A company’s internal control over financial reporting includes those policies and procedures that (1) pertain to the maintenance of records that, in reasonable detail, accurately and fairly reflect the transactions and dispositions of the assets of the company; (2) provide reasonable assurance that transactions are recorded as necessary to permit preparation of financial statements in accordance with generally accepted accounting principles, and that receipts and expenditures of the company are being made only in accordance with authorizations of management and directors of the company; and (3) provide reasonable assurance regarding prevention or timely detection of unauthorized acquisition, use, or disposition of the company’s assets that could have a material effect on the financial statements.
Because of its inherent limitations, internal control over financial reporting may not prevent or detect misstatements. Also, projections of any evaluation of effectiveness to future periods are subject to the risk that controls may become inadequate because of changes in conditions, or that the degree of compliance with the policies or procedures may deteriorate.
In our opinion, Heckmann Corporation maintained, in all material respects, effective internal control over financial reporting as of December 31, 2011, based on criteria established in Internal Control—Integrated Framework issued by the Committee of Sponsoring Organizations of the Treadway Commission.
We also have audited, in accordance with the standards of the Public Company Accounting Oversight Board (United States), the consolidated balance sheet of Heckmann Corporation and subsidiaries as of December 31, 2011, and the related consolidated statements of operations, comprehensive loss, changes in equity, and cash flows for the year then ended, and our report dated March 8, 2012 expressed an unqualified opinion on those consolidated financial statements.
KPMG LLP
Pittsburgh, Pennsylvania
March 8, 2012
| Item 9B. | Other Information |
None.
42
Table of Contents
HECKMANN CORPORATION
| Item 10. | Directors, Executive Officers and Corporate Governance |
The information required by this item is incorporated by reference from our proxy statement to be filed pursuant to Regulation 14A within 120 days after our year ended December 31, 2011 in connection with our 2012 Annual Meeting of Stockholders, or “Proxy Statement”.
| Item 11. | Executive Compensation |
The information required by this item is incorporated by reference to our Proxy Statement.
| Item 12. | Security Ownership of Certain Beneficial Owners and Management and Related Stockholder Matters |
The information required by this item is incorporated by reference to our Proxy Statement.
| Item 13. | Certain Relationships and Related Transactions, and Director Independence |
The information required by this item is incorporated by reference to our Proxy Statement.
| Item 14. | Principal Accounting Fees and Services |
The information required by this item is incorporated by reference to our Proxy Statement.
43
Table of Contents
HECKMANN CORPORATION
| Item 15. | Exhibits, Financial Statement Schedules |
(a) The following documents are filed as part of this Annual Report on Form 10-K:
| (1) | Audited Consolidated Financial Statements |
| Heckmann Corporation |
||||
| F-2 | ||||
| F-4 | ||||
| F-5 | ||||
| F-6 | ||||
| F-7 | ||||
| F-10 | ||||
| F-12 | ||||
| (2) | Financial Statement Schedules |
All financial statement schedules have been omitted since they are not required, not applicable, or the information is otherwise included in the audited consolidated financial statements.
(b) The Exhibit Index is included following the audited consolidated financial statements.
44
Table of Contents
Pursuant to the requirements of Section 13 or 15(d) of the Securities Exchange Act of 1934, the registrant has duly caused this Annual Report on Form 10-K to be signed on its behalf by the undersigned, thereunto duly authorized.
| HECKMANN CORPORATION | ||||||
| Date: March 8, 2012 | By: | /s/ RICHARD J. HECKMANN | ||||
| Name: | Richard J. Heckmann | |||||
| Title: | Chief Executive Officer | |||||
KNOW ALL PERSONS BY THESE PRESENT: That the undersigned officers and directors of Heckmann Corporation do hereby constitute and appoint Richard J. Heckmann, W. Christopher Chisholm and Damian C. Georgino, and each of them, the lawful attorney and agent or attorneys and agents with power and authority to do any and all acts and things and to execute any and all instruments which said attorneys and agents, or either of them, determine may be necessary or advisable or required to enable Heckmann Corporation to comply with the Securities and Exchange Act of 1934, as amended, and any rules or regulations or requirements of the Securities and Exchange Commission in connection with this Report. Without limiting the generality of the foregoing power and authority, the powers granted include the power and authority to sign the names of the undersigned officers and directors in the capacities indicated below to this Report or amendments or supplements thereto, and each of the undersigned hereby ratifies and confirms all that said attorneys and agents, or either of them, shall do or cause to be done by virtue hereof. This Power of Attorney may be signed in several counterparts.
IN WITNESS WHEREOF, each of the undersigned has executed this Power of Attorney as of the date indicated opposite his name.
Pursuant to the requirements of the Securities Exchange Act of 1934, this Annual Report has been signed below by the following persons on behalf of the registrant and in the capacities and on the dates indicated.
| Date: March 8, 2012 | By: | /s/ RICHARD J. HECKMANN | ||||
| Name: | Richard J. Heckmann | |||||
| Title: | Chairman of the Board and Chief Executive Officer (Principal Executive Officer) |
| Date: March 8, 2012 | By: | /s/ W. CHRISTOPHER CHISHOLM | ||||
| Name: | W. Christopher Chisholm | |||||
| Title: | Executive Vice President and Chief Financial Officer (Principal Financial Officer and Principal Accounting Officer) |
| Date: March 8, 2012 | By: | /s/ LOU L. HOLTZ | ||||
| Name: | Lou L. Holtz | |||||
| Title: | Director |
| Date: March 8, 2012 | By: | /s/ DR. ALFRED E. OSBORNE, JR. | ||||
| Name: | Dr. Alfred E. Osborne, Jr. | |||||
| Title: | Director |
45
Table of Contents
| Date: March 8, 2012 | By: | /s/ J. DANFORTH QUAYLE | ||||
| Name: | J. Danforth Quayle | |||||
| Title: | Director |
| Date: March 8, 2012 | By: | /s/ ANDREW D. SEIDEL | ||||
| Name: | Andrew D. Seidel | |||||
| Title: | Director |
| Date: March 8, 2012 | By: | /s/ EDWARD A. BARKETT | ||||
| Name: | Edward A. Barkett | |||||
| Title: | Director |
| Date: March 8, 2012 | By: | /s/ KEVIN L. SPENCE | ||||
| Name: | Kevin L. Spence | |||||
| Title: | Director |
| Date: March 8, 2012 | By: | /s/ ROBERT B. SIMONDS, JR. | ||||
| Name: | Robert B. Simonds, Jr. | |||||
| Title: | Director |
46
Table of Contents
| Page | ||||
| Heckmann Corporation |
||||
| F-2 | ||||
| F-4 | ||||
| F-5 | ||||
| F-6 | ||||
| F-7 | ||||
| F-10 | ||||
| F-12 | ||||
Table of Contents
Report of Independent Registered Public Accounting Firm
The Board of Directors
Heckmann Corporation:
We have audited the accompanying consolidated balance sheet of Heckmann Corporation and subsidiaries as of December 31, 2011 and the related consolidated statements of operations, comprehensive loss, changes in equity, and cash flows for the year then ended. These consolidated financial statements are the responsibility of the Company’s management. Our responsibility is to express an opinion on these consolidated financial statements based on our audit.
We conducted our audit in accordance with the standards of the Public Company Accounting Oversight Board (United States). Those standards require that we plan and perform the audit to obtain reasonable assurance about whether the financial statements are free of material misstatement. An audit includes examining, on a test basis, evidence supporting the amounts and disclosures in the financial statements. An audit also includes assessing the accounting principles used and significant estimates made by management, as well as evaluating the overall financial statement presentation. We believe that our audit provides a reasonable basis for our opinion.
In our opinion, the consolidated financial statements referred to above present fairly, in all material respects, the financial position of Heckmann Corporation and subsidiaries as of December 31, 2011, and the results of their operations and their cash flows for the year then ended in conformity with U.S. generally accepted accounting principles.
We have also audited, in accordance with standards of the Public Company Accounting Oversight Board (United States), Heckmann Corporation’s internal controls over financial reporting as of December 31, 2011, based on criteria established in Internal Controls—Integrated Framework issued by the Committee of Sponsoring Organizations of the Treadway Commission (COSO), and our report dated March 8, 2012 expressed an unqualified opinion on the effectiveness of the Company’s internal control over financial reporting.
KPMG LLP
Pittsburgh, Pennsylvania
March 8, 2012
F-2
Table of Contents
REPORT OF INDEPENDENT REGISTERED PUBLIC ACCOUNTING FIRM
Board of Directors and Stockholders
Heckmann Corporation
We have audited the accompanying consolidated balance sheet of Heckmann Corporation and subsidiaries (the “Company”) as of December 31, 2010, and the related consolidated statements of operations, comprehensive loss, changes in equity and cash flows for each of the years in the two-year period ended December 31, 2010. The Company’s management is responsible for these financial statements. Our responsibility is to express an opinion on these financial statements based on our audits.
We conducted our audits in accordance with the standards of the Public Company Accounting Oversight Board (United States). Those standards require that we plan and perform the audits to obtain reasonable assurance about whether the financial statements are free of material misstatement. An audit includes examining, on a test basis, evidence supporting the amounts and disclosures in the financial statements. An audit also includes assessing the accounting principles used and significant estimates made by management, as well as evaluating the overall financial statement presentation. We believe that our audits provide a reasonable basis for our opinion.
In our opinion, the consolidated financial statements referred to above present fairly, in all material respects, the financial position of Heckmann Corporation and subsidiaries as of December 31, 2010, and the results of their operations and their cash flows for each of the years in the two-year period ended December 31, 2010, in conformity with accounting principles generally accepted in the United States of America.
GHP Horwath, P.C.
Denver, Colorado
March 14, 2011 (December 7, 2011 as to the effects of the discontinued operations presentation for 2010 and 2009 as described in Note 12).
F-3
Table of Contents
HECKMANN CORPORATION AND SUBSIDIARIES
Consolidated Balance Sheets
(In thousands, except share and per share data)
| December 31, | ||||||||
| 2011 | 2010 | |||||||
| ASSETS |
||||||||
| Current Assets |
||||||||
| Cash and cash equivalents |
$ | 80,194 | $ | 80,752 | ||||
| Certificates of deposit |
— | 11,830 | ||||||
| Marketable securities |
5,169 | 75,554 | ||||||
| Accounts receivable, net |
47,985 | 13,616 | ||||||
| Inventories |
760 | 151 | ||||||
| Prepaid expenses and other receivables |
4,519 | 2,070 | ||||||
| Income tax receivable |
— | 1,980 | ||||||
| Other current assets |
1,044 | 68 | ||||||
| Current assets held for sale |
— | 17,218 | ||||||
|
|
|
|
|
|||||
| Total current assets |
139,671 | 203,239 | ||||||
|
|
|
|
|
|||||
| Property, plant and equipment, net |
270,054 | 85,696 | ||||||
| Marketable securities |
— | 14,619 | ||||||
| Equity investments |
7,682 | 7,628 | ||||||
| Intangible assets, net |
29,489 | 20,605 | ||||||
| Goodwill |
90,008 | 41,008 | ||||||
| Other |
2,777 | 94 | ||||||
| Long-term assets held for sale |
— | 28,364 | ||||||
|
|
|
|
|
|||||
| TOTAL ASSETS |
$ | 539,681 | $ | 401,253 | ||||
|
|
|
|
|
|||||
| LIABILITIES AND EQUITY |
||||||||
| Current Liabilities |
||||||||
| Accounts payable |
$ | 19,992 | $ | 7,238 | ||||
| Accrued expenses |
11,693 | 5,024 | ||||||
| Current portion of contingent consideration |
5,730 | 7,316 | ||||||
| Current portion of long-term debt |
11,914 | 11,221 | ||||||
| Current liabilities held for sale |
— | 23,823 | ||||||
|
|
|
|
|
|||||
| Total current liabilities |
49,329 | 54,622 | ||||||
|
|
|
|
|
|||||
| Deferred income taxes |
6,880 | 8,773 | ||||||
| Long-term debt, less current portion |
132,156 | 20,474 | ||||||
| Long-term contingent consideration |
7,867 | 6,384 | ||||||
| Other long-term liabilities |
1,639 | 6,250 | ||||||
| Long-term liabilities held for sale |
— | 1,673 | ||||||
| Commitments and contingencies (Note 11) |
||||||||
| Equity |
||||||||
| Preferred stock, $0.001 par value, 1,000,000 shares authorized; no shares issued or outstanding |
— | — | ||||||
| Common stock, $0.001 par value, 500,000,000 shares authorized; 139,163,067 shares issued and 124,854,504 shares outstanding at December 31, 2011; 127,489,387 shares issued and 114,180,184 shares outstanding at December 31, 2010 |
139 | 127 | ||||||
| Additional paid-in capital |
814,875 | 747,187 | ||||||
| Purchased warrants |
(6,844 | ) | (6,844 | ) | ||||
| Treasury stock |
(19,503 | ) | (15,089 | ) | ||||
| Accumulated other comprehensive income |
8 | 99 | ||||||
| Accumulated deficit |
(446,865 | ) | (423,859 | ) | ||||
|
|
|
|
|
|||||
| Total equity of Heckmann Corporation |
341,810 | 301,621 | ||||||
|
|
|
|
|
|||||
| Noncontrolling interest |
— | 1,456 | ||||||
|
|
|
|
|
|||||
| TOTAL EQUITY |
341,810 | 303,077 | ||||||
|
|
|
|
|
|||||
| TOTAL LIABILITIES AND EQUITY |
$ | 539,681 | $ | 401,253 | ||||
|
|
|
|
|
|||||
The accompanying notes are an integral part of these consolidated financial statements.
F-4
Table of Contents
HECKMANN CORPORATION AND SUBSIDIARIES
Consolidated Statements of Operations
(In thousands, except share and per share data)
| Year ended December 31, | ||||||||||||
| 2011 | 2010 | 2009 | ||||||||||
| Revenue |
$ | 156,837 | $ | 15,208 | $ | 3,820 | ||||||
| Cost of sales |
123,509 | 11,337 | 2,100 | |||||||||
|
|
|
|
|
|
|
|||||||
| Gross profit |
33,328 | 3,871 | 1,720 | |||||||||
| Operating expenses: |
||||||||||||
| General and administrative expenses |
36,651 | 11,554 | 9,194 | |||||||||
| Pipeline start-up and commissioning |
2,089 | 11,830 | — | |||||||||
|
|
|
|
|
|
|
|||||||
| Total operating expenses |
38,740 | 23,384 | 9,194 | |||||||||
|
|
|
|
|
|
|
|||||||
| Loss from operations |
(5,412 | ) | (19,513 | ) | (7,474 | ) | ||||||
| Interest income (expense), net |
(4,243 | ) | 2,087 | 3,928 | ||||||||
| Loss from equity investment |
(462 | ) | (689 | ) | — | |||||||
| Other, net |
6,232 | 4,411 | 149 | |||||||||
|
|
|
|
|
|
|
|||||||
| Loss from continuing operations before income taxes |
(3,885 | ) | (13,704 | ) | (3,397 | ) | ||||||
| Income tax benefit |
3,777 | 3,404 | 80 | |||||||||
|
|
|
|
|
|
|
|||||||
| Loss from continuing operations |
(108 | ) | (10,300 | ) | (3,317 | ) | ||||||
| Loss from discontinued operations, net of income taxes |
(22,898 | ) | (4,393 | ) | (392,078 | ) | ||||||
|
|
|
|
|
|
|
|||||||
| Net loss attributable to Heckmann Corporation |
$ | (23,006 | ) | $ | (14,693 | ) | $ | (395,395 | ) | |||
|
|
|
|
|
|
|
|||||||
| Net loss per share attributable to common stockholders |
||||||||||||
| Basic and Diluted |
||||||||||||
| Loss from continuing operations |
$ | * | $ | (0.09 | ) | $ | (0.03 | ) | ||||
| Loss from discontinued operations |
(0.20 | ) | (0.05 | ) | (3.58 | ) | ||||||
|
|
|
|
|
|
|
|||||||
| Net loss per share |
$ | (0.20 | ) | $ | (0.14 | ) | $ | (3.61 | ) | |||
|
|
|
|
|
|
|
|||||||
| Weighted average number of shares outstanding: |
||||||||||||
| Basic and Diluted |
114,574,730 | 108,819,384 | 109,575,057 | |||||||||
|
|
|
|
|
|
|
|||||||
| * | less than $0.01 |
The accompanying notes are an integral part of these consolidated financial statements.
F-5
Table of Contents
HECKMANN CORPORATION AND SUBSIDIARIES
Consolidated Statements of Comprehensive Loss
(In thousands)
| Year ended December 31, | ||||||||||||
| 2011 | 2010 | 2009 | ||||||||||
| Net loss attributable to Heckmann Corporation |
$ | (23,006 | ) | $ | (14,693 | ) | $ | (395,395 | ) | |||
| Add back: income attributable to noncontrolling interest |
(1,456 | ) | — | (143 | ) | |||||||
|
|
|
|
|
|
|
|||||||
| Net loss |
(24,462 | ) | (14,693 | ) | (395,538 | ) | ||||||
|
|
|
|
|
|
|
|||||||
| Other comprehensive income, net of tax: |
||||||||||||
| Foreign currency translation (loss) gain |
21 | (114 | ) | 31 | ||||||||
| Reclassification of net gains from sales of available for sale securities included in earnings |
— | (311 | ) | — | ||||||||
| Unrealized (loss) gain on available-for-sale securities |
(112 | ) | (119 | ) | 523 | |||||||
|
|
|
|
|
|
|
|||||||
| Total other comprehensive (loss) income, net of tax |
(91 | ) | (544 | ) | 554 | |||||||
|
|
|
|
|
|
|
|||||||
| Comprehensive loss, net of tax |
$ | (24,553 | ) | $ | (15,237 | ) | $ | (394,984 | ) | |||
|
|
|
|
|
|
|
|||||||
The accompanying notes are an integral part of these consolidated financial statements.
F-6
Table of Contents
HECKMANN CORPORATION AND SUBSIDIARIES
Consolidated Statements of Changes in Equity
For the years ended December 31, 2011, 2010 and 2009
(In thousands, except share data)
| Heckmann Corporation Stockholders | ||||||||||||||||||||||||||||||||||||||||||||
| Total | Common Stock | Additional Paid-In Capital |
Purchased Warrants |
Treasury Stock | Retained Earnings (Accumulated Deficit) |
Accumulated Other Comprehensive Income |
Non-controlling Interest |
|||||||||||||||||||||||||||||||||||||
| Number | Amount | Number | Amount | Number | Amount | |||||||||||||||||||||||||||||||||||||||
| Balance at December 31, 2008 |
746,604 | 126,606,323 | 126 | 757,720 | 405,400 | (405 | ) | — | — | (13,771 | ) | 89 | 2,845 | |||||||||||||||||||||||||||||||
| Purchase of treasury stock |
(14,000 | ) | 13,032,098 | $ | (14,000 | ) | — | |||||||||||||||||||||||||||||||||||||
| 3,361,000 common shares canceled in connection with Settlement and Release Agreement |
(28,031 | ) | (3,361,000 | ) | (3 | ) | (28,028 | ) | — | — | — | — | — | — | — | |||||||||||||||||||||||||||||
| 1,576,577 common shares issued in connection with acquisition (Note 3) |
6,101 | 1,576,577 | 1 | 6,100 | — | — | — | — | — | — | ||||||||||||||||||||||||||||||||||
| Stock based compensation |
1,567 | 260,840 | — | 1,567 | — | — | — | — | — | — | ||||||||||||||||||||||||||||||||||
| Purchase of warrants |
(4,405 | ) | — | — | — | 6,166,696 | (4,405 | ) | — | — | — | — | ||||||||||||||||||||||||||||||||
| Noncontrolling interest in acquired company |
672 | — | — | — | — | — | — | — | — | — | 672 | |||||||||||||||||||||||||||||||||
| Deconsolidation of Shen Yang Aixin |
(1,212 | ) | — | — | — | — | — | — | — | — | — | (1,212 | ) | |||||||||||||||||||||||||||||||
| Issuance of 200,000 common shares in connection with Settlement and Release Agreement |
831 | 200,000 | 831 | — | — | — | — | — | — | |||||||||||||||||||||||||||||||||||
| Comprehensive loss: |
||||||||||||||||||||||||||||||||||||||||||||
| Net loss |
(395,538 | ) | — | — | — | — | — | — | — | (395,395 | ) | — | (143 | ) | ||||||||||||||||||||||||||||||
| Unrealized gains from available for sale securities |
523 | — | — | — | — | — | — | — | — | 523 | — | |||||||||||||||||||||||||||||||||
| Foreign currency translation gain |
31 | — | — | — | — | — | — | — | — | 31 | — | |||||||||||||||||||||||||||||||||
|
|
|
|||||||||||||||||||||||||||||||||||||||||||
| Comprehensive loss |
(394,984 | ) | ||||||||||||||||||||||||||||||||||||||||||
|
|
|
|
|
|
|
|
|
|
|
|
|
|
|
|
|
|
|
|
|
|
|
|||||||||||||||||||||||
| Balance at December 31, 2009 |
313,143 | 125,282,740 | 124 | 738,190 | 6,572,096 | (4,810 | ) | 13,032,098 | (14,000 | ) | (409,166 | ) | 643 | 2,162 | ||||||||||||||||||||||||||||||
F-7
Table of Contents
HECKMANN CORPORATION AND SUBSIDIARIES
Consolidated Statements of Changes in Equity—(Continued)
For the years ended December 31, 2011, 2010 and 2009
(In thousands, except share data)
| Heckmann Corporation Stockholders | ||||||||||||||||||||||||||||||||||||||||||||
| Total | Common Stock | Additional Paid-In Capital |
Purchased Warrants |
Treasury Stock | Retained Earnings (Accumulated Deficit) |
Accumulated Other Comprehensive Income |
Non-controlling Interest |
|||||||||||||||||||||||||||||||||||||
| Number | Amount | Number | Amount | Number | Amount | |||||||||||||||||||||||||||||||||||||||
| Balance at December 31, 2009 |
313,143 | 125,282,740 | 124 | 738,190 | 6,572,096 | (4,810 | ) | 13,032,098 | (14,000 | ) | (409,166 | ) | 643 | 2,162 | ||||||||||||||||||||||||||||||
| Purchase of treasury stock for cash |
(1,089 | ) | — | — | — | — | — | 276,465 | (1,089 | ) | — | — | — | |||||||||||||||||||||||||||||||
| Purchase of warrants for cash |
(2,034 | ) | — | — | — | 4,759,101 | (2,034 | ) | — | — | — | — | — | |||||||||||||||||||||||||||||||
| Issuance of common stock in connection with acquisition (Note 3) |
7,773 | 2,008,562 | 2 | 7,771 | — | — | — | — | — | — | ||||||||||||||||||||||||||||||||||
| Stock based compensation (Note 8) |
967 | — | 1 | 966 | — | — | — | — | — | — | ||||||||||||||||||||||||||||||||||
| Exercise of warrants for cash |
66 | 11,000 | — | 66 | — | — | — | — | — | — | — | |||||||||||||||||||||||||||||||||
| Issuance of 138,335 common shares in connection with May 9, 2009 equity grant |
138,335 | — | — | — | — | — | — | — | — | |||||||||||||||||||||||||||||||||||
| Exercise of stock options for cash |
194 | 48,750 | 194 | |||||||||||||||||||||||||||||||||||||||||
| Divestiture of Harbin |
(706 | ) | — | — | — | — | — | — | — | — | — | (706 | ) | |||||||||||||||||||||||||||||||
| Comprehensive loss: |
||||||||||||||||||||||||||||||||||||||||||||
| Net loss |
(14,693 | ) | — | — | — | — | — | — | — | (14,693 | ) | — | — | |||||||||||||||||||||||||||||||
| Unrealized gains from available for sale securities |
(119 | ) | — | — | — | — | — | — | — | — | (119 | ) | — | |||||||||||||||||||||||||||||||
| Reclassification of net gains included in net income |
(311 | ) | — | — | — | — | — | — | — | — | (311 | ) | — | |||||||||||||||||||||||||||||||
| Foreign currency translation loss |
(114 | ) | — | — | — | — | — | — | — | — | (114 | ) | — | |||||||||||||||||||||||||||||||
|
|
|
|||||||||||||||||||||||||||||||||||||||||||
| Comprehensive loss |
(15,237 | ) | ||||||||||||||||||||||||||||||||||||||||||
|
|
|
|
|
|
|
|
|
|
|
|
|
|
|
|
|
|
|
|
|
|
|
|||||||||||||||||||||||
| Balance at December 31, 2010 |
$ | 303,077 | 127,489,387 | $ | 127 | $ | 747,187 | 11,331,197 | $ | (6,844 | ) | 13,308,563 | $ | (15,089 | ) | $ | (423,859 | ) | $ | 99 | $ | 1,456 | ||||||||||||||||||||||
|
|
|
|
|
|
|
|
|
|
|
|
|
|
|
|
|
|
|
|
|
|
|
|||||||||||||||||||||||
F-8
Table of Contents
HECKMANN CORPORATION AND SUBSIDIARIES
Consolidated Statements of Changes in Equity—(Continued)
For the years ended December 31, 2011, 2010 and 2009
(In thousands, except share data)
| Heckmann Corporation Stockholders | ||||||||||||||||||||||||||||||||||||||||||||
|
|
Common Stock | Additional Paid-In Capital |
Purchased Warrants |
Treasury Stock | Retained Earnings (Accumulated Deficit) |
Accumulated Other Comprehensive Income |
Non-controlling Interest |
|||||||||||||||||||||||||||||||||||||
| Total | Number | Amount | Number | Amount | Number | Amount | ||||||||||||||||||||||||||||||||||||||
| Balance at December 31, 2010 |
303,077 | 127,489,387 | 127 | 747,187 | 11,331,197 | (6,844 | ) | 13,308,563 | (15,089 | ) | (423,859 | ) | 99 | 1,456 | ||||||||||||||||||||||||||||||
| Purchase of common stock |
(4,414 | ) | — | — | — | — | — | 1,000,000 | (4,414 | ) | — | — | — | |||||||||||||||||||||||||||||||
| Issuance of common stock in connection with acquisitions (Note 3) |
16,925 | 2,700,844 | 3 | 16,922 | — | — | — | — | — | — | — | |||||||||||||||||||||||||||||||||
| Issuance of stock to employees and consultants (Note 8) |
— | 189,762 | — | — | — | — | — | — | — | — | — | |||||||||||||||||||||||||||||||||
| Exercise of warrants for cash |
47,912 | 8,783,074 | 9 | 47,903 | — | — | — | — | — | — | — | |||||||||||||||||||||||||||||||||
| Stock-based compensation (Note 8) |
2,863 | — | — | 2,863 | — | — | — | — | — | — | — | |||||||||||||||||||||||||||||||||
| Comprehensive loss: |
||||||||||||||||||||||||||||||||||||||||||||
| Net loss |
(24,462 | ) | — | — | — | — | — | — | — | (23,006 | ) | — | (1,456 | ) | ||||||||||||||||||||||||||||||
| Foreign currency translation gain |
21 | 21 | ||||||||||||||||||||||||||||||||||||||||||
| Unrealized gains from available for sale securities |
(112 | ) | — | — | — | — | — | — | — | — | (112 | ) | — | |||||||||||||||||||||||||||||||
|
|
|
|||||||||||||||||||||||||||||||||||||||||||
| Comprehensive loss |
(24,553 | ) | — | — | — | — | — | — | — | — | — | — | ||||||||||||||||||||||||||||||||
|
|
|
|
|
|
|
|
|
|
|
|
|
|
|
|
|
|
|
|
|
|
|
|||||||||||||||||||||||
| Balance at December 31, 2011 |
$ | 341,810 | 139,163,067 | $ | 139 | $ | 814,875 | 11,331,197 | $ | (6,844 | ) | 14,308,563 | $ | (19,503 | ) | $ | (446,865 | ) | $ | 8 | $ | — | ||||||||||||||||||||||
|
|
|
|
|
|
|
|
|
|
|
|
|
|
|
|
|
|
|
|
|
|
|
|||||||||||||||||||||||
The accompanying notes are an integral part of these consolidated financial statements.
F-9
Table of Contents
HECKMANN CORPORATION AND SUBSIDIARIES
Consolidated Statements of Cash Flows
(In thousands)
| For the year ended December 31, |
||||||||||||
| 2011 | 2010 | 2009 | ||||||||||
| Operating activities |
||||||||||||
| Net loss |
$ | (23,006 | ) | $ | (14,693 | ) | $ | (395,595 | ) | |||
| Adjustments to reconcile net loss to net cash used in operating activities: |
||||||||||||
| Loss from discontinued operations |
22,898 | 4,393 | 392,078 | |||||||||
| Depreciation |
21,413 | 3,365 | 598 | |||||||||
| Amortization |
3,868 | 1,240 | 108 | |||||||||
| Stock-based compensation |
2,401 | 966 | 2,894 | |||||||||
| Impairment of property, plant and equipment |
— | 621 | — | |||||||||
| Bad debt expense |
2,206 | 94 | — | |||||||||
| Loss from equity investments |
462 | 689 | — | |||||||||
| Change in fair value of contingent consideration |
(5,777 | ) | (4,232 | ) | — | |||||||
| Deferred income taxes |
(4,277 | ) | (719 | ) | (754 | ) | ||||||
| Other |
(362 | ) | 1,347 | — | ||||||||
| Changes in operating assets and liabilities, net of business acquisitions and purchase price adjustments (Note 3): |
||||||||||||
| Accounts receivable |
(31,205 | ) | (241 | ) | (1,191 | ) | ||||||
| Inventory |
243 | 337 | 12 | |||||||||
| Prepaid expenses and other receivables |
(4,306 | ) | 2,285 | (147 | ) | |||||||
| Accounts payable and accrued expenses |
5,340 | 2,628 | (377 | ) | ||||||||
| Deferred revenues |
(345 | ) | (573 | ) | — | |||||||
| Income tax payable |
244 | 262 | (234 | ) | ||||||||
| Other assets |
924 | (1,122 | ) | (1,000 | ) | |||||||
|
|
|
|
|
|
|
|||||||
| Net cash used in operating activities from continuing operations |
(9,279 | ) | (3,353 | ) | (3,608 | ) | ||||||
| Net cash used in operating activities from discontinued operations |
(4,683 | ) | (749 | ) | (2,440 | ) | ||||||
|
|
|
|
|
|
|
|||||||
| Net cash used in operating activities |
(13,962 | ) | (4,102 | ) | (6,048 | ) | ||||||
|
|
|
|
|
|
|
|||||||
| Investing activities |
||||||||||||
| Cash paid for acquisitions, net of cash acquired (Note 3) |
(88,334 | ) | (28,635 | ) | (16,566 | ) | ||||||
| Purchase of property plant and equipment |
(150,921 | ) | (17,443 | ) | (19,970 | ) | ||||||
| Proceeds from sale of available-for-sale securities |
120,062 | 168,392 | 85,153 | |||||||||
| Purchase of available-for-sale securities |
(34,947 | ) | (157,478 | ) | (148,194 | ) | ||||||
| Cash paid for equity investment and joint venture |
(16 | ) | (1,135 | ) | (7,182 | ) | ||||||
| Proceeds from (purchases of) certificates of deposit |
11,830 | (1,367 | ) | — | ||||||||
|
|
|
|
|
|
|
|||||||
| Net cash used in investing activities of continuing operations |
(142,326 | ) | (37,666 | ) | (106,759 | ) | ||||||
| Net cash used in investing activities of discontinued operations |
(5,777 | ) | (537 | ) | (16,025 | ) | ||||||
|
|
|
|
|
|
|
|||||||
| Net cash used in investing activities |
(148,103 | ) | (38,203 | ) | (122,784 | ) | ||||||
|
|
|
|
|
|
|
|||||||
F-10
Table of Contents
HECKMANN CORPORATION AND SUBSIDIARIES
Consolidated Statements of Cash Flows—(Continued)
(In thousands)
| For the year ended December 31, |
||||||||||||
| 2011 | 2010 | 2009 | ||||||||||
| Financing activities |
||||||||||||
| Payments on long term-debt |
(73,914 | ) | (193 | ) | — | |||||||
| Borrowings under revolving credit facility |
72,799 | — | — | |||||||||
| Borrowings under term loans |
109,885 | — | — | |||||||||
| Payment of deferred financing costs |
(2,764 | ) | — | — | ||||||||
| Cash paid to repurchase warrants |
— | (2,034 | ) | (4,405 | ) | |||||||
| Cash paid to purchase treasury stock |
(4,414 | ) | (1,088 | ) | (14,000 | ) | ||||||
| Cash proceeds from exercise of warrants |
47,912 | 66 | — | |||||||||
| Cash proceeds from exercise of stock options |
— | 194 | — | |||||||||
| Deferred payments |
(1,025 | ) | — | — | ||||||||
| Proceeds from notes payable |
2,568 | 1,418 | — | |||||||||
|
|
|
|
|
|
|
|||||||
| Net cash provided by (used in) financing activities of continuing operations |
151,047 | (1,637 | ) | (18,405 | ) | |||||||
| Net cash provided by (used in) financing activities of discontinued operations |
— | (992 | ) | 1,705 | ||||||||
|
|
|
|
|
|
|
|||||||
| Net cash provided by (used in) financing activities |
151,047 | (2,629 | ) | (16,700 | ) | |||||||
| Net decrease in cash |
(11,018 | ) | (44,934 | ) | (145,532 | ) | ||||||
| Cash and cash equivalents—beginning of period |
91,212 | 136,050 | 281,683 | |||||||||
| Effect of change in foreign exchange rate on cash and cash equivalents |
— | 96 | (101 | ) | ||||||||
|
|
|
|
|
|
|
|||||||
| Cash and cash equivalents—end of period |
$ | 80,194 | $ | 91,212 | $ | 136,050 | ||||||
| Less: cash and cash equivalents of discontinued operations at year end |
— | 10,460 | 12,643 | |||||||||
|
|
|
|
|
|
|
|||||||
| Cash and cash equivalents of continuing operations at year end |
$ | 80,194 | $ | 80,752 | $ | 123,407 | ||||||
|
|
|
|
|
|
|
|||||||
| Non-cash investing and financing activities |
||||||||||||
| Common stock issuances for business acquisitions |
$ | 16,925 | $ | 7,773 | $ | 6,101 | ||||||
| Property, plant and equipment purchased in exchange for accounts payable |
$ | 7,890 | $ | 2,030 | $ | — | ||||||
| Supplemental cash flow information: |
||||||||||||
| Cash paid for interest |
$ | (2,784 | ) | $ | (106 | ) | $ | (17 | ) | |||
| Cash paid for income taxes |
$ | (162 | ) | $ | (389 | ) | $ | (143 | ) | |||
The accompanying notes are an integral part of these consolidated financial statements.
F-11
Table of Contents
HECKMANN CORPORATION AND SUBSIDIARIES
NOTES TO CONSOLIDATED FINANCIAL STATEMENTS
(Tabular dollars in thousands, except share and per share amounts)
Note 1—Organization and Nature of Business Operations
Heckmann Corporation, a Delaware Corporation, together with its subsidiaries (collectively, the “Company”, “we”, “us” or “our”), is a services-based company focused on total water solutions for shale or “unconventional” oil and gas exploration. We operate in one business segment: water solutions for energy development.
Our business, which we refer to as Heckmann Water Resources or HWR, addresses the pervasive demand for diverse water and wastewater solutions required for the production of oil and gas in an integrated and efficient manner through various service and product offerings. HWR’s services include water delivery and disposal, trucking, fluids handling, treatment and temporary and permanent pipeline facilities, and water infrastructure services for oil and gas exploration and production companies. HWR also transports fresh water for production and provides services for site preparation, water pit excavations and remediation.
HWR currently operates multi-modal water disposal, treatment, trucking and pipeline transportation operations in select shale areas in the United States in the Haynesville, Eagle Ford, Marcellus, Utica, Barnett and Tuscaloosa Marine Shale areas. HWR serves customers seeking fresh water acquisition, temporary water transmission and storage, transportation, treatment or disposal of fresh water and complex wastewater flows, such as flowback and produced brine water, in connection with shale oil and gas hydraulic fracturing drilling, or “hydrofracturing,” operations.
Our strategy is to provide an integrated and efficient complete water solution to our customers through a full suite of services which we have built and will continue to build through organic growth and acquisitions.
Basis of Presentation. The accompanying audited consolidated financial statements of the Company have been prepared by management in accordance with the instructions to Form 10-K of the United States Securities and Exchange Commission (the “SEC”). These statements include all normal reoccurring adjustments considered necessary by management to present a fair statement of the consolidated balance sheets, results of operations, and cash flows.
The business comprising our former bottled water segment is presented as discontinued operations in the Company’s consolidated financial statements. See Note 12—“Discontinued Operations” for additional information. Unless stated otherwise, any reference to income statement items in these accompanying audited consolidated financial statements refers to results from continuing operations.
Note 2—Summary of Significant Accounting Policies
Principles of Consolidation—The consolidated financial statements include the accounts of the Company and its subsidiaries. All material intercompany accounts, transactions and profits are eliminated in consolidation.
Accounting Estimates—The Company’s consolidated financial statements have been prepared in conformity with generally accepted accounting principles in the United States (“U.S. GAAP”). The preparation of the financial statements requires management to make estimates and judgments that affect the reported amounts of assets and liabilities and the disclosure of contingencies at the date of the financial statements, as well as the reported amounts of revenues and expenses during the reporting period. Estimates have been prepared on the basis of the most current and best available information, however, actual results could differ from those estimates.
F-12
Table of Contents
Earnings Per Share—Basic earnings per share (“EPS”) excludes dilution and is computed by dividing income (loss) applicable to common stockholders by the weighted average number of common shares outstanding for the period. Diluted EPS is based upon the weighted average number of common shares outstanding during the period plus the additional weighted average common equivalent shares during the period. Common equivalent shares result from the assumed exercises of outstanding warrants, restricted stock and stock options, the proceeds of which are then assumed to have been used to repurchase outstanding shares of common stock. Inherently, stock warrants are deemed to be anti-dilutive when the average market price of the common stock during the period is less than the exercise prices of the stock warrants.
For the purpose of the computation of earnings per share, shares issued in connection with acquisitions that are returnable are considered contingently returnable shares and although classified as issued, are not included in the basic weighted average number of shares outstanding until all necessary conditions are met that no longer cause the shares to be contingently returnable. Accordingly, excluded from the computation of basic EPS are approximately 931,000 contingently returnable shares that are subject to sellers indemnification obligations and accordingly are held in escrow as of December 31, 2011. There were approximately 1,937,000 contingently returnable shares held in escrow as of December 31, 2010 and none as of December 31, 2009.
Deferred Financing Costs—Debt issuance costs incurred in connection with the issuance of long-term debt are capitalized and amortized to interest expense based on the term of the related debt using the straight-line method, which approximates the effective interest method. As of December 31, 2011, the unamortized amount was $2,638,000 and is included in other long-term assets in the accompanying consolidated balance sheets.
Equity Investments—Equity investments in companies over which the Company has no ability to exercise significant influence are accounted for under the cost method. Equity investments in companies over which the Company has the ability to exercise significant influence but does not hold a controlling interest are accounted for under the equity method and the Company’s income or loss on these investments is recorded in non-operating income or expense.
Concentrations of Customer Risk—One of the Company’s customers comprised 25% of the Company’s consolidated revenues and 29% of the Company’s consolidated accounts receivable for the year ended December 31, 2011. Two of the Company’s customers comprised 16% and 12%, respectively, of total consolidated revenues for the year ended December 31, 2010. Three of the Company’s customers comprised 17%, 16%, and 12%, respectively, of the Company’s consolidated accounts receivable for the year ended December 31, 2010. Three of the Company’s customers comprised 20%, 13% and 10%, respectively, of the Company’s consolidated revenues for the year ended December 31, 2009. None of the Company’s customers comprised more than 10% of the Company’s consolidated accounts receivable for the year ended December 31, 2009.
Cash and Cash Equivalents—The Company considers all highly liquid investments with original maturities of three months or less when purchased to be cash equivalents. The Company maintains bank accounts in the United States. The Company has not experienced any historical losses in such accounts and believes that the risk of any loss is minimal. A majority of the funds held in the United States are invested in institutional money market funds.
Marketable Securities—All of the Company’s investments in marketable securities are classified as available-for-sale. These marketable securities are stated at fair value with any unrealized gains or losses recorded in accumulated other comprehensive income (loss), a component of equity, until realized. Other-than-temporary declines in market value from original cost are included in the current year’s operations. In determining whether an other-than-temporary decline in the market value has occurred, the Company considers the duration that, and extent to which, fair value of the investment is below its cost. Realized gains and losses are calculated based on specific identification to the individual securities involved with the resulting gains and losses included in non-operating income and expense on the consolidated statements of operations.
F-13
Table of Contents
Accounts Receivable, net—Accounts receivable are recognized and carried at the original invoice amount less an allowance for any uncollectible amounts. The Company provides an allowance for doubtful accounts to reflect the expected uncollectibility of trade receivables. Inherent in the assessment of the allowance for doubtful accounts are certain judgments and estimates including, among others, the customer’s willingness or ability to pay, the effect of general economic conditions and the ongoing relationship with the customer. Accounts with outstanding balances longer than the payment terms are considered past due. The Company writes off trade receivables when it determines that they have become uncollectible.
The table below sets forth the Company’s allowance for doubtful accounts for the years ended December 31, 2011, 2010 and 2009:
| 2011 | 2010 | 2009 | ||||||||||
| Balance at beginning of period |
$ | 1,232 | $ | — | $ | — | ||||||
| Additions: Bad debt expense |
2,206 | 94 | — | |||||||||
| Acquisition of CVR |
— | 1,138 | — | |||||||||
| Write-offs of uncollectible accounts |
(802 | ) | — | — | ||||||||
|
|
|
|
|
|
|
|||||||
| Balance at end of period |
$ | 2,636 | $ | 1,232 | $ | — | ||||||
|
|
|
|
|
|
|
|||||||
Property, Plant and Equipment, net—Property, plant and equipment are recorded at cost and depreciated using the straight-line method over the estimated useful lives of the assets. Additions and major replacements or betterments are added to the assets at cost. Maintenance and repair costs and minor replacements are charged to expense when incurred. When assets are replaced or otherwise disposed, the cost and accumulated depreciation are removed from the accounts and the gains or losses, if any, are reflected in the consolidated statement of operations.
Subsequent to the completion of the original 50-mile PVC pipeline in February 2010, HWR incurred significant costs for pipeline start up, commissioning, integrity testing and remediation. As a result, during the year ended December 31, 2011 and 2010, the Company recorded start up and commissioning expenses of approximately $2.1 million and $11.8 million, respectively, within operations.
Depreciation is computed using the following estimated useful lives:
| Buildings |
20-25 years | |||
| Motor vehicles |
5-10 years | |||
| Disposal wells |
10 years | |||
| Pipelines |
30 years | |||
| Office equipment |
5-10 years | |||
| Machinery and equipment |
3-15 years |
Goodwill and Intangibles—Goodwill represents the excess of the purchase price over the fair value of the net assets of the businesses acquired. Authoritative guidance requires that goodwill be tested for impairment at the reporting unit level (operating segment or one level below an operating segment) on an annual basis and between annual tests when circumstances indicate that the recoverability of the carrying amount of goodwill may be in doubt. Application of the goodwill impairment test requires judgment, including the identification of reporting units, assigning assets and liabilities to reporting units, assigning goodwill to reporting units, and determining the fair value. Significant judgments are required to estimate the fair value of a reporting unit including estimating future cash flows, determining appropriate discount rates and other assumptions. The Company performs this impairment analysis annually during the third quarter of each fiscal year. The Company adopted Accounting Standards Update (“ASU”) No. 2011- 08, Intangibles-Goodwill and Other (Topic 350) during the third quarter of 2011. The updated standard permits an entity to make a qualitative assessment of whether it is more likely than not that a reporting unit’s fair value is less than its carrying value before applying
F-14
Table of Contents
the more quantitative two-step impairment test. On September 30, 2011 the Company disposed of its bottled water segment and as such now operates as one reportable segment. The disposition and subsequent abandonment of the bottled water segment resulted in goodwill impairment of $6 million. Based on qualitative assessments, management does not believe it is more likely than not that the fair value of the remaining reporting unit is less than its carrying value. Intangible assets with estimatable lives are amortized in a pattern consistent with the asset’s identifiable cash flows or using a straight-line method over their remaining estimated benefit periods if the pattern of cash flows is not estimatable. See Note 7 of the Notes to Consolidated Financial Statements for additional disclosures related to goodwill and intangible assets.
Accounting for the Impairment of Long-Lived Assets other than Goodwill—In accordance with authoritative guidance, the Company reviews the carrying value of intangibles and other long-lived assets for impairment whenever events or changes in circumstances indicate that the carrying amount of an asset may not be recoverable. Recoverability of long-lived assets is measured by comparison of their carrying amounts to the undiscounted cash flows that the asset or asset group is expected to generate. If the carrying amount of the assets exceeds the undiscounted cash flows the impairment to be recognized is measured by the amount by which the carrying amount of the asset exceeds its fair market value.
Fair Value of Financial Instruments—The carrying amounts of the Company’s cash equivalents, accounts receivable and accounts payable approximate fair value due to the short-term nature of these instruments. The carrying value of the Company’s marketable securities are adjusted to fair value as of the balance sheet date. The Company’s long-term debt, secured by various properties, bears interest at rates commensurate with market rates and therefore management believes carrying values approximate fair values. The fair value of the contingent consideration was determined using a probability-weighted discounted cash flow model.
Revenue Recognition—We recognize revenues in accordance with Staff Accounting Bulletin No 104, and accordingly all of the following criteria must be met for revenues to be recognized: persuasive evidence of an arrangement exists, delivery has occurred or services have been rendered, the price to the buyer is fixed and determinable and collectibility is reasonably assured. The majority of our revenue results from contracts with direct customers and revenues are generated upon performance of contracted services.
Services provided to our customers primarily include the transportation of fresh water and saltwater by Company-owned trucks or through a temporary or permanent water transport pipeline. Revenues are also generated through fees from our disposal wells and rental of tanks. Certain customers, limited to those under contract with us to utilize the pipeline, have an obligation to dispose of a minimum quantity (number of barrels) of saltwater over the contract period. Transportation and disposal rates are generally based on a fixed fee per barrel of disposal water or, in certain circumstances, transportation is based on an hourly rate. Revenue is recognized based on the number of barrels transported or disposed or at hourly rates for transportation. Rates for other services are based on negotiated rates with our customers and revenue is recognized when the services have been performed.
Income taxes—Deferred tax assets and liabilities are recognized for the expected future tax consequences of events that have been included in the financial statements or tax returns. Under this method, deferred income taxes are recognized for the tax consequences in future years of differences between the tax bases of assets and liabilities and their financial reporting amounts at each period-end based on enacted tax laws and statutory tax rates applicable to the periods in which the differences are expected to affect taxable income. Valuation allowances are established, when necessary, to reduce deferred tax assets to the amount that will more likely than not be realized. The Company recognizes a tax position if it is more likely than not that it will be sustained upon examination. The tax position is measured at the largest amount that is greater than 50 percent likely of being realized upon ultimate settlement. The Company’s policy is to recognize interest and penalties accrued on any unrecognized tax benefits as a component of income tax expense. As of December 31, 2011 and 2010, the Company had no interest or penalties accrued for uncertain tax positions.
F-15
Table of Contents
Reclassifications and Comparability
Certain reclassifications have been made to prior periods’ financial statements in order to conform them to the current period’s presentation.
Recently Issued Accounting Pronouncements
Fair Value Measurement
In May 2011, the Financial Accounting Standard Board (“FASB”) issued Accounting Standards Update ASU 2011-04, Fair Value Measurement (Topic 820): Amendments to Achieve Common Fair Value Measurement and Disclosure Requirements in U.S. GAAP and IFRSs. ASU 2011-04 generally provides a uniform framework for fair value measurements and related disclosures between U.S. GAAP and International Financial Reporting Standards (“IFRS”). Additional disclosure requirements in the update include: (1) for Level 3 fair value measurements, quantitative information about unobservable inputs used, a description of the valuation process used by the entity, and a qualitative discussion about the sensitivity of the measurements to changes in the unobservable inputs; (2) for an entity’s use of a nonfinancial asset that is different from the asset’s highest and best use, the reason for the difference; (3) for financial instruments not measured at fair value but for which disclosure of fair value is required, the fair value hierarchy level in which the fair value measurements were determined; and (4) the disclosure of all transfers between Level 1 and Level 2 of the fair value hierarchy. This update is effective for annual and interim periods beginning on or after December 15, 2011. The effect of ASU 2011-04 on the consolidated financial statements and related disclosures is not expected to be significant.
Comprehensive Income
In June 2011, the FASB issued ASU 2011-05, Comprehensive Income (Topic 220). ASU 2011-05 gives an entity the option to present the total of comprehensive income, the components of net income, and the components of other comprehensive income either in a single continuous statement of comprehensive income or in two separate but consecutive statements; the option to present components of other comprehensive income as part of the statement of changes in stockholders’ equity was eliminated. The items that must be reported in other comprehensive income or when an item of other comprehensive income must be reclassified to net income were not changed. Additionally, no changes were made to the calculation and presentation of earnings per share. This update is effective for annual and interim periods beginning on or after December 15, 2011. The effect of ASU 2011-05 on the consolidated financial statements and related disclosures is not expected to be significant.
Intangibles—Goodwill and Other
In September 2011, the FASB issued ASU No. 2011-08, Intangibles—Goodwill and Other (Topic 350) that permits an entity to make a qualitative assessment of whether it is more likely than not that a reporting unit’s fair value is less than its carrying amount before applying the two step goodwill impairment test. The updated guidance requires that, if an entity concludes that it is more likely than not that the fair value of a reporting unit exceeds its carrying amount; it would not be required to perform the two-step impairment test for the reporting unit. The provisions of the updated guidance are effective for annual and interim periods beginning after December 15, 2011 with early adoption permitted. The Company adopted ASU 2011-08 in the third quarter of 2011. The adoption of this guidance did not affect the Company’s results of operations, financial position or liquidity.
F-16
Table of Contents
Note 3—Business Acquisitions
In 2011, the Company completed the following acquisitions, with an aggregate purchase price of approximately $110.2 million, comprised of $88.5 million cash consideration (less cash acquired of $0.2 million), 2,700,844 shares of the Company’s common stock with an estimated fair value of approximately $16.9 million, and approximately $5.0 million of contingent consideration. In conjunction with these acquisitions, the Company incurred transaction costs of approximately $0.9 million, which are reported in selling, general and administrative expenses in the accompanying consolidated statements of operations. These acquisitions enhanced the service offerings of the Company and expanded its geographic coverage.
| Company name |
Form of acquisition |
Date of acquisition | ||
| Bear Creek Services, LLC |
Fresh water and produced water transportation assets and salt water disposal wells | April 1, 2011 | ||
| Devonian Industries |
Substantially all of the assets and certain liabilities | April 4, 2011 | ||
| Sand Hill Foundation, LLC |
Fresh water and produced water transportation assets and salt water disposal wells | April 12, 2011 | ||
| Excalibur Energy Services, Inc. and Blackhawk, LLC |
100% of the outstanding equity interests | May 5, 2011 | ||
| Consolidated Petroleum, Inc. |
Substantially all of the assets and certain liabilities | June 14, 2011 | ||
As of December 31, 2011 the final allocation of the purchase price for these acquisitions is summarized as follows:
| Land |
$ | 1,281 | ||
| Equipment |
34,451 | |||
| Salt Water disposal wells |
14,000 | |||
| Customer relationships |
10,120 | |||
| Disposal permits |
2,340 | |||
| Other assets |
6,835 | |||
| Goodwill |
50,289 | |||
| Deferred income tax liabilities |
(3,956 | ) | ||
| Other liabilities |
(5,103 | ) | ||
|
|
|
|||
| Total |
$ | 110,257 | ||
|
|
|
|||
The purchase agreement with Excalibur Energy Services, Inc. contains a contingent consideration clause in the form of an earn-out provision based upon the achievement of an $8.8 million EBITDA target at the end of the first fiscal year after the May 5, 2011 closing date. At the date of acquisition, the Company recorded a liability of $2.5 million as the estimated fair value of this contingent consideration. As of December 31, 2011, the Company determined that the performance based EBITDA target would not be met and accordingly recorded an increase to non-operating income of approximately $2.5 million, net of interest expense accretion, as a result of the change in the fair value of the contingent consideration. Additionally, another acquisition agreement contains contingent consideration whereby the seller is precluded from competing with the Company for a period of three years. The Company recorded $2.5 million as the estimated fair value of this contingent consideration. Goodwill represents the excess of the purchase price over the fair value of tangible and identifiable intangible assets acquired and relates to the Company’s strategic growth into servicing shale or “unconventional” oil and gas exploration and
F-17
Table of Contents
the economies of scale expected from the acquisitions. Goodwill of $28.9 million and other intangible assets of $9.3 million are expected to be deductible for tax purposes.
Due to the immediate integration of the assets and operations of Bear Creek Services, LLC and Sand Hill Foundation, LLC it is not possible to separately determine the revenues and net income of those operations for the twelve months ended December 31, 2011. The amount of revenue and net income attributable to the remaining three acquisitions that is included in the Company’s consolidated financial statements from the respective date of the acquisition to the period ended December 31, 2011 are approximately $50.6 million and approximately $3.8 million, respectively.
Pro forma Financial Information
The following unaudited pro forma results of operations for the years ended December 31, 2011 and 2010, respectively, assumes that the acquisitions were completed at the beginning of the periods presented. The pro forma results include adjustments to reflect additional amortization of intangibles associated with the acquisitions, and other costs deemed to be non-recurring in nature.
| 2011 | 2010 | |||||||
| Pro forma revenues |
$ | 183,278 | $ | 92,337 | ||||
| Pro forma net income (loss) from continuing operations |
617 | (7,948 | ) | |||||
| Pro forma net income (loss) per share from continuing operations: |
||||||||
| Basic and Diluted |
$ | 0.01 | $ | (0.07 | ) | |||
The pro forma financial information presented above is not necessarily indicative of either the results of operations that would have occurred had the acquisitions been effective as of January 1 of the respective years, or of future operations of the Company.
Acquisition of Complete Vacuum and Rental, Inc. (“CVR”)
On November 30, 2010 (the “Closing Date”), the Company purchased 100% of the outstanding equity interests of CVR, a company that operates an oilfield waste transportation and disposal business with a fleet of vacuum trucks, winch trucks and frac tanks operating from terminals in east Texas, northwest Louisiana and central Arkansas and a network of six deep injection disposal wells located in east Texas.
The initial purchase price was $47.0 million consisting of cash in the amount of $29.6 million, the issuance of 2,008,562 shares of the Company’s common stock (valued at approximately $7.8 million based on the market price of the Company’s common stock as of the Closing Date) and contingent consideration valued at approximately $9.6 million. The stock portion of the purchase price issued to CVR’s former stockholders and certain employees were issued pursuant to the exemption from registration provided by Section 4(2) of the United States Securities Act of 1933, as amended. There were no underwriters employed in connection with the issuance of these securities.
F-18
Table of Contents
The allocation of the purchase price was based on determination of the fair value of tangible and intangible assets acquired and liabilities assumed as of the Closing Date. The following table summarizes the allocation of the purchase price:
| Cash |
$ | 1,024 | ||
| Accounts receivable |
12,283 | |||
| Other assets |
1,132 | |||
| Fixed assets |
44,976 | |||
| Customer relationships |
2,610 | |||
| Disposal permits |
137 | |||
| Goodwill |
33,751 | |||
|
|
|
|||
| Total assets |
$ | 95,913 | ||
|
|
|
|||
| Accounts payable and accrued liabilities |
$ | (9,991 | ) | |
| Deferred income tax liabilities |
(9,316 | ) | ||
| Other liabilities |
(29,590 | ) | ||
|
|
|
|||
| Total liabilities assumed |
(48,897 | ) | ||
|
|
|
|||
| Total purchase price |
$ | 47,016 | ||
|
|
|
Goodwill represents the excess of the purchase price over the fair value of tangible and identifiable intangible assets acquired and relates to the economies of scale expected from the acquisition. Of the $33.8 million recorded as goodwill, none is expected to be deductible for tax purposes.
In addition to the initial purchase price, the Company may make additional payments to CVR’s former shareholders upon the achievement of an EBITDA target of $20.0 million for each of the fiscal years 2011, 2012 and 2013. The Company is to pay CVR’s former shareholders an additional $2.0 million plus one-half of the amount by which EBITDA exceeds $20.0 million for the relevant fiscal year (the “Earn-Out Payments”). The Earn-Out Payments are to be paid in a combination of 70% cash and 30% of the Company’s common stock, up to an aggregate maximum amount equal to $12.0 million in total. The specific number of shares of the Company’s common stock to be included in each Earn-Out Payment shall be computed as the average of the closing sales price of the Company’s common stock on the New York Stock Exchange for the 10 trading days immediately prior to the issuance of the shares.
The fair value of the contingent consideration at the Closing Date was determined to be approximately $9.6 million using a probability-weighted discounted cash flow model. In accordance with the authoritative guidance for business combinations, the contingent consideration is considered to be a liability and accordingly will be subject to further valuation and remeasurement at interim reporting dates with any changes recognized in earnings. The Company recorded a decrease to non-operating income of approximately $0.8 million, net of interest expense accretion, during the year ended December 31, 2011 as a result of the change in the fair value of the contingent consideration relating to the earn-out.
Acquisition of Charis Partners, LLC, Greer Exploration Corporation, and Silversword Partnerships
On July 1, 2009, the Company, through HWR, completed the purchase of all the limited liability company interests of Charis Partners, LLC and all of the assets of Greer Exploration Corporation and Silversword Partnerships. The aggregate purchase price of approximately $23 million consisted of cash totaling $17 million and the issuance of 1,576,577 shares of its common stock (valued at approximately $6.1 million based on the market price of the Company’s common stock as of July 1, 2009). These assets underlie a multi-modal saltwater disposal, treatment and pipeline transportation business in Texas and Louisiana serving customers seeking to dispose of saltwater and frac fluid generated in their oil and gas operations. The goodwill related to the acquisition was approximately $7.2 million as of December 31, 2009. Goodwill represents the excess of the
F-19
Table of Contents
purchase price over the fair value of tangible and identifiable intangible assets acquired and relates to the economies of scale expected from the acquisition. Of the $7.2 million recorded as goodwill, all of which is expected to be deductible for tax purposes.
In addition to the initial purchase price, the Company makes quarterly cash payments of $175,000 from July 2009 through April 2012 (totaling $2,100,000) in accordance with the transaction documents. The Company was obligated to make an additional payment of $5 million upon the achievement of certain financial performance targets in 2010 and 2011. As a result of the significant costs incurred during the quarter ended June 30, 2010 for pipeline start-up, commissioning, and pipeline integrity testing, which continued into the first half of 2011, management determined that the contingent consideration obligation related to the profitability targets for 2011 and 2010 would not be met. The Company recorded an increase to non-operating income of approximately $4.1 million and $3.9 million, net of interest expense accretion, during the years ended December 31, 2011 and 2010, respectively, as a result of the change in the fair value of the contingent consideration relating to the earn-outs.
Purchase Price
The acquisition of the assets was recorded using the acquisition method of accounting in accordance with the authoritative guidance for business combinations.
The purchase price is determined as follows:
| Cash paid to sellers |
$ | 16,566 | ||
| Market value of Heckmann’s common stock issued on Closing Date |
6,101 | |||
| Cash to be paid to sellers in quarterly installments |
1,784 | |||
| Acquisition consideration payable |
900 | |||
| Contingent consideration, due on achieving milestone |
7,887 | |||
|
|
|
|||
| Total purchase price |
$ | 33,238 | ||
|
|
|
The allocation of the purchase price was based on the determination of the fair value of tangible and intangible assets acquired and liabilities assumed as of the Closing Date. The following table summarizes the allocation of the purchase price:
| Inventory |
$ | 1,102 | ||
| Fixed Assets |
6,106 | |||
| Customer relationships |
1,741 | |||
| Customer contracts |
17,352 | |||
| Disposal permits |
110 | |||
| Goodwill |
7,259 | |||
| Deferred income tax liabilities |
(432 | ) | ||
|
|
|
|||
| Total |
$ | 33,238 | ||
|
|
|
The goodwill related to the acquisition was approximately $7.3 million as of December 31, 2009. Goodwill represents the excess of the purchase price over the fair value of tangible and identifiable intangible assets acquired and relates to the economies of scale expected from the acquisition. Of the $7.3 million recorded as goodwill, none is expected to be deductible for tax purposes.
F-20
Table of Contents
Note 4—Investments
The amortized cost, gross unrealized holding gains and losses, and fair value of held-to-maturity and available-for sale securities as of December 31, 2011 and 2010 are as follows:
| Contractual Maturity (in years) |
Amortized Cost |
Gross Unrealized Holding | Fair Value |
|||||||||||||||||
| Gains | Losses | |||||||||||||||||||
| December 31, 2011 |
||||||||||||||||||||
| Available-for-sale: |
||||||||||||||||||||
| Current: |
||||||||||||||||||||
| Corporate Notes |
1 | $ | 5,161 | $ | 8 | $ | — | $ | 5,169 | |||||||||||
|
|
|
|
|
|
|
|
|
|||||||||||||
| December 31, 2010 |
||||||||||||||||||||
| Held-to-maturity: |
||||||||||||||||||||
| Certificates of deposit |
1 | $ | 11,830 | $ | — | $ | — | $ | 11,830 | |||||||||||
|
|
|
|
|
|
|
|
|
|||||||||||||
| Available-for-sale: |
||||||||||||||||||||
| Current: |
||||||||||||||||||||
| U.S. Government Agencies |
1 | $ | 13,026 | $ | 14 | $ | — | $ | 13,040 | |||||||||||
| U.S. Government Securities |
1 | 16,168 | 10 | 5 | 16,173 | |||||||||||||||
| Corporate Notes |
1 | 46,178 | 169 | 6 | 46,341 | |||||||||||||||
|
|
|
|
|
|
|
|
|
|||||||||||||
| 75,372 | 193 | 11 | 75,554 | |||||||||||||||||
|
|
|
|
|
|
|
|
|
|||||||||||||
| Noncurrent: |
||||||||||||||||||||
| U.S. Government Agencies |
2-3 | 1,035 | 30 | — | 1,065 | |||||||||||||||
| U.S. Government Securities |
2-3 | 2,925 | — | 11 | 2,914 | |||||||||||||||
| Corporate Notes |
2-3 | 10,537 | 123 | 20 | 10,640 | |||||||||||||||
|
|
|
|
|
|
|
|
|
|||||||||||||
| 14,497 | 153 | 31 | 14,619 | |||||||||||||||||
|
|
|
|
|
|
|
|
|
|||||||||||||
| $ | 89,869 | $ | 346 | $ | 42 | $ | 90,173 | |||||||||||||
|
|
|
|
|
|
|
|
|
|||||||||||||
Available-for-sale and held to maturity securities as of December 31, 2011 with an amortized cost and fair value of $5,161 and $5,169, respectively, mature in 2012.
Investment in Underground Solutions, Inc.
On May 6, 2009, the Company purchased approximately 7% of the equity of Underground Solutions, Inc. (“UGSI”), a water infrastructure and pipeline supplier located in Poway, California for approximately $6.8 million in cash. On December 10, 2009, the Company purchased 1.0 million preferred shares of UGSI for approximately $0.4 million in cash. Equity investments in companies over which the Company has no ability to exercise significant influence are accounted for under the cost method. Accordingly, this investment is accounted for under the cost method. The Chief Executive Officer of UGSI serves as a member of the Board of Directors of the Company.
Investment in Energy Transfer Water Solutions, JV LLC
The Company formed a joint venture with Energy Transfer Partners, L.P. (NYSE: ETP) (“ETP”) in 2010. The joint venture with ETP was a 50/50 partnership that was primarily designed to develop water pipeline infrastructure and treatment solutions for oil and gas producers in the Marcellus Shale area in Pennsylvania, and in the Haynesville Shale areas in Louisiana and Texas, and potentially other areas. On July 8, 2011, the joint venture was formally terminated and dissolved by the parties. During the years ended December 31, 2011 and 2010, the Company recorded losses of $462,000 and $689,000 on this equity investment.
F-21
Table of Contents
Note 5—Fair Value Measurements
The Company measures certain assets and liabilities pursuant to accounting guidance which establishes a three-tier fair value hierarchy and prioritizes the inputs used in measuring fair value. Theses tiers include:
| • | Level 1: Quoted prices (unadjusted) in active markets that are accessible at the measurement date for identical assets or liabilities. |
| • | Level 2: Observable prices that are based on inputs not quoted on active markets, but corroborated by market data. |
| • | Level 3: Unobservable inputs are used when little or no market data is available. |
The following table presents information about the Company’s financial assets and liabilities that are measured at fair value on a recurring basis as of December 31, 2011 and 2010, and indicates the fair value hierarchy of the valuation techniques the Company utilized to determine such fair value:
| December 31, 2011 |
Significant Other Observable Inputs (Level 1) |
Significant Other Observable Inputs (Level 2) |
Significant Unobservable Inputs (Level 3) |
|||||||||||||
| Assets: |
||||||||||||||||
| Corporate Notes |
$ | 5,169 | $ | 5,169 | $ | — | $ | — | ||||||||
|
|
|
|
|
|
|
|
|
|||||||||
| Liabilities: |
||||||||||||||||
| Contingent consideration |
$ | 13,597 | $ | — | $ | — | $ | 13,597 | ||||||||
|
|
|
|
|
|
|
|
|
|||||||||
| December 31, 2010 |
Significant Other Observable Inputs (Level 1) |
Significant Other Observable Inputs (Level 2) |
Significant Unobservable Inputs (Level 3) |
|||||||||||||
| Assets: |
||||||||||||||||
| Certificates of deposit |
$ | 11,830 | $ | 11,830 | $ | — | $ | — | ||||||||
| U.S. Government Agencies |
14,105 | 14,105 | — | — | ||||||||||||
| Corporate Notes |
56,981 | 56,981 | — | — | ||||||||||||
| U.S. Government Securities |
19,087 | 19,087 | — | — | ||||||||||||
|
|
|
|
|
|
|
|
|
|||||||||
| Total |
$ | 102,003 | $ | 102,003 | $ | — | $ | — | ||||||||
|
|
|
|
|
|
|
|
|
|||||||||
| Liabilities: |
||||||||||||||||
| Contingent consideration |
$ | 13,701 | $ | — | $ | — | $ | 13,701 | ||||||||
|
|
|
|
|
|
|
|
|
|||||||||
F-22
Table of Contents
The fair value of the contingent consideration was determined using a probability-weighted income approach at the acquisition date and is revalued at each reporting date or more frequently if circumstances dictate based on changes in the discount periods and rates, changes in the timing and amount of the revenue estimates and changes in probability assumptions with respect to the likelihood of achieving the obligations. Contingent consideration is included within “Accrued expenses” and “Other long-term liabilities” in the Company’s consolidated balance sheet. Changes in the fair value of these obligations are recorded as income or expense within the line item “Other income (expense), net” in the Company’s consolidated statements of operations. Accretion expense related to the increase in the net present value of the contingent liabilities is included in interest expense for the period. The fair value measurement is based on significant inputs not observable in the market, which are referred to as Level 3 inputs. Changes in the fair value of the Level 3 liabilities for the year ended December 31, 2011 and 2010 are as follows:
| 2011 | 2010 | |||||||
| Balance at beginning of period |
$ | 13,701 | $ | 7,887 | ||||
| Additions (Note 3) |
5,000 | 9,584 | ||||||
| Change in accretion |
1,173 | 462 | ||||||
| Payments |
(500 | ) | — | |||||
| Change in fair value of contingent consideration |
(5,777 | ) | (4,232 | ) | ||||
|
|
|
|
|
|||||
| Balance at end of period |
$ | 13,597 | $ | 13,701 | ||||
|
|
|
|
|
|||||
In addition to the Company’s assets and liabilities that are measured at fair value on a recurring basis, the Company is required, by generally accepted accounting principles in the United States, to record certain assets and liabilities at fair value on a nonrecurring basis. Generally, assets are recorded at fair value on a nonrecurring basis as a result of impairment charges. During the year ended December 31, 2010, the Company recorded an impairment charge of approximately $3.4 million related to its 48% equity interest in China Bottles, as the decrease in fair value of the investment was deemed to be other than temporary. This expense is included in discontinued operations in the consolidated statements of operations for the year ended December 31, 2010. Equity method investments are measured at fair value on a nonrecurring basis when deemed necessary, using observable inputs such as trading prices of the stock as well as using discounted cash flows, incorporating adjusted available market discount rate information and the Company’s estimates for liquidity risk.
The Company recognized a non-cash charge of approximately $357.5 million during the year ended December 31, 2009 related to the impairment of goodwill applicable to the acquisition of China Water, which is included in discontinued operations. The carrying value of the asset prior to the impairment was approximately $363.9 million (including purchase price adjustments of approximately $54 million). The estimated fair value of the asset at December 31, 2009 is approximately $6.3 million and was based on Level 3 inputs. The fair value of the China Water assets was estimated using a discounted cash flow model, considering future anticipated revenues, operating costs, a risk adjusted discount rate, and other factors.
The Company recognized an other-than-temporary decline of $1.2 million related to the retained noncontrolling interest in ShenYang. Subsequent to the deconsolidation of ShenYang, management determined that the retained noncontrolling interest was of no value and accordingly fully-impaired this asset as of September 30, 2009. This expense is included in discontinued operations for the twelve month period ended December 31, 2009.
The Company also recognized an impairment charge of $6.8 million relating primarily to construction in process of $3.8 million and property, plant and equipment associated with exiting China Waters Beijing facility of $2.4 million. Management determined that the carrying amount of these assets could not be recovered as of September 30, 2009 and in management’s judgment these assets were fully-impaired. This expense is included in discontinued operations for the twelve month period ended December 31, 2009.
F-23
Table of Contents
Note 6—Property, Plant and Equipment, net
Property, plant and equipment consist of the following:
| December 31, | ||||||||
| 2011 | 2010 | |||||||
| Land |
$ | 2,254 | $ | — | ||||
| Buildings |
5,090 | 4,356 | ||||||
| Pipelines |
61,374 | 31,265 | ||||||
| Disposal wells |
48,623 | 17,381 | ||||||
| Machinery and equipment |
69,616 | 19,316 | ||||||
| Motor vehicles |
74,028 | 12,801 | ||||||
| Office equipment |
1,301 | 345 | ||||||
|
|
|
|
|
|||||
| 262,286 | 85,464 | |||||||
|
|
|
|
|
|||||
| Accumulated depreciation |
(25,128 | ) | (3,850 | ) | ||||
|
|
|
|
|
|||||
| Construction in process |
32,896 | 4,082 | ||||||
|
|
|
|
|
|||||
| Property, Plant and equipment, net of accumulated depreciation |
$ | 270,054 | $ | 85,696 | ||||
|
|
|
|
|
|||||
Depreciation expense for the years ended December 31, 2011, 2010 and 2009 was approximately $21.4 million, $3.4 million and $0.6 million respectively. All of the depreciation expense was recorded in cost of sales.
Note 7—Goodwill and Intangible Assets
Goodwill
Goodwill activity for 2011 and 2010 is as follows:
| Net Book Value at December 31, 2010 |
Additions | Other Adjustments |
Net Book Value at December 31, 2011 |
|||||||||||
| $41,008 | $ | 50,289 | $ | (1,289 | ) | $ | 90,008 | |||||||
|
|
|
|
|
|
|
|
||||||||
| Net Book Value at December 31, 2009 |
Additions | Other Adjustments |
Net Book Value at December 31, 2010 |
|||||||||||
| $ 7,257 | $ | 33,751 | $ | — | $ | 41,008 | ||||||||
|
|
|
|
|
|
|
|
||||||||
During the second quarter of 2011, the Company recorded additions to goodwill of $50.3 million in connection with five acquisitions completed during the quarter (Note 3). The Company also recorded a reduction to goodwill of $1.3 million related to other purchase accounting adjustments during the year ended December 31, 2011. During the fourth quarter of 2010, the Company recorded additions to goodwill of $33.8 million in connection with the acquisition of CVR (Note 3).
F-24
Table of Contents
Intangible Assets
Intangible assets consisted of the following:
| Weighted- Average Amortization (in years) |
Gross Carrying Amount |
Accumulated Amortization |
Intangible Assets, net |
|||||||||||||
| As of December 31, 2011: |
||||||||||||||||
| Customer relationships |
8 | 14,767 | (2,994 | ) | 11,773 | |||||||||||
| Disposal permits |
10 | 2,585 | (180 | ) | 2,405 | |||||||||||
| Customer contracts |
15-17 | 17,352 | (2,041 | ) | 15,311 | |||||||||||
|
|
|
|
|
|
|
|
|
|||||||||
| 11 | $ | 34,704 | $ | (5,215 | ) | $ | 29,489 | |||||||||
|
|
|
|
|
|
|
|
|
|||||||||
| As of December 31, 2010: |
||||||||||||||||
| Customer relationships |
7-8 | 4,352 | (318 | ) | 4,034 | |||||||||||
| Disposal permits |
10 | 248 | (22 | ) | 226 | |||||||||||
| Customer contracts |
15-17 | 17,352 | (1,007 | ) | 16,345 | |||||||||||
|
|
|
|
|
|
|
|
|
|||||||||
| 14 | $ | 21,952 | $ | (1,347 | ) | $ | 20,605 | |||||||||
|
|
|
|
|
|
|
|
|
|||||||||
Estimated amortization expense of the next five years and thereafter is as follows:
| 2012 |
$ | 4,765 | ||
| 2013 |
3,934 | |||
| 2014 |
3,306 | |||
| 2015 |
2,844 | |||
| 2016 |
2,458 | |||
| Thereafter |
12,182 | |||
|
|
|
|||
| Total |
$ | 29,489 | ||
|
|
|
Amortization expense, included in general and administrative expense, for years ended December 31, 2011, 2010 and 2009 was $3.9 million, $1.2 million and $0.1 million, respectively.
Note 8—Equity and Stock-Based Compensation
Founders’ Units
On June 21, 2007, the Company sold 14,375,000 units for an aggregate purchase at a price of $71,875 or $0.005 per unit, to the Company’s founders. Each unit consisted of one share of the Company’s common stock and one warrant to purchase one share of the Company’s common stock. Upon the consummation of the Company’s initial public offering and the partial exercise of the over-allotment option by the underwriters, 845,000 units were redeemed for $4,225. Of the remaining founders’ units and net of redemption, 13,152,746 founders’ units were issued to Heckmann Acquisition, LLC.
Initial Public Offering
On November 16, 2007, the Company sold 54,116,800 units (“Units”) in its initial public offering at a price of $8.00 per Unit and received proceeds of $428,071,040, net of underwriting discounts and commissions of $10,823,360 (including $19,482,048 of deferred underwriting discounts and commissions placed in the trust account pending completion of a business combination). Each Unit consisted of one share of the Company’s common stock, $.001 par value, and one redeemable common stock purchase warrant. Each warrant entitled the holder to purchase from the Company one share of common stock at an exercise price of $6.00 per share commencing on November 9, 2008. The warrants expired on November 9, 2011. In connection with the explanation of the warrants, the Units were terminated. The shares of the Company’s common stock that were issued as part of the Units remain outstanding.
F-25
Table of Contents
Sponsors’ Warrants
Immediately prior to the Company’s initial public offering, the initial stockholders of the Company purchased an aggregate of 7,000,000 warrants at $1.00 per warrant from the Company in a private placement offering. The warrants sold in the private placement were identical to the warrants sold in the Company’s initial public offering except that the initial stockholders’ warrants are not redeemable by the Company as long as they are held by the initial stockholders. The initial stockholders’ warrants are entitled to registration rights and the Company has satisfied its obligations with respect thereto. These warrants expired on November 9, 2011.
Preferred Stock
The Company is authorized to issue 1,000,000 shares of preferred stock with such designations, voting and other rights and preferences as may be determined from time to time by the Board of Directors. At December 31, 2011, 2010 or 2009, no shares of preferred stock were outstanding.
Expiration and Cancellation of Listed Units and Warrants
Prior to their expiration on November 9, 2011 described below, we had outstanding publicly-issued Units, each consisting of one share of our common stock and a warrant entitling the holder to purchase from us one share of our common stock at an exercise price of $6.00. The Company also had outstanding publicly-issued warrants entitling the holder to purchase from us one share of our common stock at an exercise price of $6.00. The Units and the warrants were listed on the New York Stock Exchange, or NYSE. On November 9, 2011, all of the then-outstanding unexercised listed warrants, including the warrants issued with the Units, expired at 5 p.m. Eastern time and were cancelled. Prior to their expiration, 7,985,209 of the listed warrants were exercised for $47.9 million in cash. During the fourth quarter of 2011 and upon expiration, the remaining publicly listed warrants and units were delisted from the NYSE. The shares of our common stock that were issued as part of the Units remain outstanding and are listed and trade with our shares of common stock on the NYSE under the symbol “HEK.” Subsequent to the cancellation and expiration of the warrants and the Units, we have remaining outstanding approximately 1.56 million privately-issued warrants, of which approximately 0.94 million are exercisable at $6.38 per share and expire on January 24, 2013, and approximately 0.62 million are exercisable at $2.02 per share and expire on August 22, 2012. The privately-issued warrants are not listed on any exchange.
Stock Options
The Company grants stock options, stock appreciation rights, restricted common stock and restricted stock units, performance shares and units, other stock-based awards and cash-based awards to employees, directors, consultants and advisors of the Company in accordance with the Heckmann Corporation 2009 Equity Incentive Plan (the “2009 Plan”). The 2009 Plan authorizes the issuance of up to 5,000,000 shares of common stock through the issuance of stock-based awards. The Company has 963,393 shares of common stock available for awards under the 2009 Plan as of December 31, 2011.
The Company has granted a total of 2,817,500 common stock options under the terms of the 2009 Plan. Stock options generally vest over a three year period. The exercise price for options is generally equal to the market price of the Company’s common stock at the grant dates. The maximum contractual term of stock options
is 10 years. The Company estimates the fair value of stock options granted to employees using a Black-Scholes option-pricing model. The assumptions used to estimate the fair value of stock awards granted in the years ended December 31, 2011, 2010 and 2009 are as follows:
| Year ended December 31, | ||||||||||||
| 2011 | 2010 | 2009 | ||||||||||
| Volatility |
34.6 | % | 34.8 | % | 33.9 | % | ||||||
| Expected term (years) |
10 | 10 | 10 | |||||||||
| Risk free interest rate |
2.7 | % | 3.6 | % | 3.5 | % | ||||||
| Expected dividend yield |
0 | % | 0 | % | 0 | % | ||||||
F-26
Table of Contents
The expected term of stock options represents the period of time that the stock options granted are expected to be outstanding taking into consideration the contractual term of the options and post-vesting termination and option exercise behaviors of the Company’s employees. The expected volatility is based on the historical price volatility of the Company’s common stock. The risk-free interest rate represents the U.S. Treasury bill rate for the expected term of the related stock options. The dividend yield represents the Company’s anticipated cash dividend over the expected term of the stock options.
Stock-based compensation expense for stock options is included in general and administrative expense in the statements of operations on a straight line basis, over the applicable vesting period, and totaled approximately $1,405,200, $536,900 and $136,200 for the years ended December 31, 2011, 2010, and 2009, respectively. In addition, approximately $461,600 of stock-based compensation cost was included in the results from discontinued operations for the year ended December 31, 2011. Included in this cost is expense recorded in conjunction with vesting approximately 333,500 stock options previously granted to employees in the PRC which were accelerated upon closing of the share purchase agreement (Note 12).
As of December 31, 2011, there was approximately $3.9 million of unrecognized compensation expense for stock options, which is expected to be recognized over a weighted-average period of approximately 1.7 years.
Following is a summary of stock option activity as of December 31, 2011, and changes during the year then ended:
| Underlying Shares |
Weighted Avg. Exercise Price |
Weighted-Average Remaining Contractual Term (Years) |
Aggregate Intrinsic Value as of December 31, 2011 |
|||||||||||||
| (In thousands, except per share data) | ||||||||||||||||
| Outstanding at January 1, 2011 |
1,685 | $ | 3.96 | |||||||||||||
| Granted |
998 | 5.86 | ||||||||||||||
| Exercised |
— | — | ||||||||||||||
| Forfeited or expired |
(22 | ) | 4.36 | |||||||||||||
|
|
|
|
|
|||||||||||||
| Outstanding at December 31, 2011 |
2,661 | $ | 4.67 | 8.89 | $ | 5,273 | ||||||||||
|
|
|
|
|
|
|
|
|
|||||||||
| Exercisable at December 31, 2011 |
886 | $ | 3.96 | 8.31 | $ | 2,331 | ||||||||||
|
|
|
|
|
|
|
|
|
|||||||||
| Vested and expected to vest at December 31, 2011 |
2,661 | $ | 4.67 | 8.89 | $ | 5,273 | ||||||||||
|
|
|
|
|
|
|
|
|
|||||||||
The weighted-average grant-date fair value of options granted during the years ended December 31, 2011, 2010 and 2009 was $2.89, $3.96 and $2.04, respectively.
The total intrinsic value of options exercised during the year ended December 31, 2010 was approximately $72,700. There were no options exercised during the years ended December 31, 2011 or 2009. The total intrinsic value of options as of December 31, 2011 is based on the difference between the weighted average exercise price and the Company’s closing stock price on December 30, 2011 (the last business day of 2011) of $6.65.
F-27
Table of Contents
Restricted Common Stock
The Company has granted a total of 1,320,478 shares of restricted common stock under the terms of the 2009 Plan. Shares of restricted common stock generally vest over a two or three year period and are valued at an amount equal to the market price of the Company’s common stock at the grant dates. The weighted-average grant-date fair value of restricted common stock granted during the years ended December 31, 2011, 2010 and 2009 was $5.99, $3.90 and $4.20, respectively.
Following is a summary of the status of the Company’s non-vested shares of restricted common stock as of December 31, 2011 and 2010 and changes during the years then ended:
| 2011 | 2010 | |||||||||||||||
| Underlying Shares |
Weighted Avg. Grant Date Fair Value |
Underlying Shares |
Weighted Avg. Grant Date Fair Value |
|||||||||||||
| Non-vested at January 1 |
204 | $ | 3.97 | 187 | $ | 4.20 | ||||||||||
| Granted |
489 | 5.99 | 191 | 3.90 | ||||||||||||
| Vested |
(126 | ) | 4.02 | (174 | ) | 4.13 | ||||||||||
| Forfeited |
— | — | — | — | ||||||||||||
|
|
|
|
|
|
|
|
|
|||||||||
| Non-vested at December 31 |
567 | $ | 5.70 | 204 | $ | 3.97 | ||||||||||
|
|
|
|
|
|
|
|
|
|||||||||
Stock-based compensation expense for restricted common stock is included in general and administrative expense in the statements of operations and totaled approximately $936,000, $427,400 and $1,925,600, for the years ended December 31, 2011, 2010 and 2009, respectively. The total income tax benefit recognized in the statements of operations for restricted common stock totaled approximately $192,900, $36,100 and $171,400 for 2011, 2010 and 2009, respectively.
As of December 31, 2011, there was approximately $2.8 million of unrecognized compensation expense for restricted common stock, which is expected to be recognized over a weighted-average period of approximately 1.7 years. The total fair value of shares vested during the years ended December 31, 2011, 2010 and 2009 was approximately $839,200, $875,500 and $1,887,900, respectively.
Approximately 71,000 shares of restricted common stock were issued in connection with the acquisition of CVR in 2010 and the related compensation cost was capitalized as part of the purchase price.
Note 9—Income Taxes
The Company’s provision for income taxes consists of:
| Year ended December 31, | ||||||||||||
| 2011 | 2010 | 2009 | ||||||||||
| Current income tax expense (benefit): |
||||||||||||
| Federal |
$ | — | $ | (2,746 | ) | $ | 649 | |||||
| State |
500 | 61 | 25 | |||||||||
|
|
|
|
|
|
|
|||||||
| Total current |
500 | (2,685 | ) | 674 | ||||||||
|
|
|
|
|
|
|
|||||||
| Deferred income tax benefit: |
||||||||||||
| Federal |
(4,277 | ) | (719 | ) | (754 | ) | ||||||
|
|
|
|
|
|
|
|||||||
| Total income tax benefit |
$ | (3,777 | ) | $ | (3,404 | ) | $ | (80 | ) | |||
|
|
|
|
|
|
|
|||||||
F-28
Table of Contents
The difference between the actual income tax expense and that computed by applying the United States federal income tax rate of 35% to pretax income (loss) from continuing operations is summarized below:
| Year ended December 31, | ||||||||||||
| 2011 | 2010 | 2009 | ||||||||||
| U.S. federal income tax benefit |
35.0 | % | 35.0 | % | 35.0 | % | ||||||
| U.S. personal holding company tax |
0.0 | 2.2 | 0.0 | |||||||||
| State and local income taxes net of federal benefit |
-8.4 | 3.9 | 5.2 | |||||||||
| Compensation |
-3.7 | -1.1 | 0.0 | |||||||||
| Transaction costs |
-10.2 | -1.1 | -0.1 | |||||||||
| Change in fair value of contingent consideration |
6.7 | 8.6 | 0.0 | |||||||||
| Loss on Disposal of China Water |
976.9 | 0.0 | 0.0 | |||||||||
| Valuation allowance |
-909.5 | -26.0 | -37.0 | |||||||||
| Other |
10.4 | 3.4 | -0.8 | |||||||||
|
|
|
|
|
|
|
|||||||
| Effective tax benefit rate |
97.2 | % | 24.9 | % | 2.3 | % | ||||||
|
|
|
|
|
|
|
|||||||
Significant components of the Company’s deferred tax assets and liabilities as of December 31,2011 and 2010 are as follows:
| 2011 | 2010 | |||||||
| Deferred tax assets |
||||||||
| Other |
$ | 2,528 | $ | 3,154 | ||||
| Reserves |
1,593 | — | ||||||
| Net operating losses |
97,733 | 12,223 | ||||||
|
|
|
|
|
|||||
| Total |
101,854 | 15,377 | ||||||
| Valuation allowance |
(40,188 | ) | (4,854 | ) | ||||
|
|
|
|
|
|||||
| Total deferred tax assets |
61,666 | 10,523 | ||||||
|
|
|
|
|
|||||
| Deferred tax liabilities |
||||||||
| Fixed assets and intangibles |
$ | (68,467 | ) | $ | (18,646 | ) | ||
| Other |
(79 | ) | (650 | ) | ||||
|
|
|
|
|
|||||
| Total deferred tax liabilities |
(68,546 | ) | (19,296 | ) | ||||
|
|
|
|
|
|||||
| Net deferred tax liability |
$ | (6,880 | ) | $ | (8,773 | ) | ||
|
|
|
|
|
|||||
A reconciliation of the beginning and ending amounts of the Company’s valuation allowance on deferred tax assets for the years ended December 31, 2011, 2010 and 2009 are as follows:
| 2011 | 2010 | 2009 | ||||||||||
| Balance at beginning of the year |
$ | 4,854 | $ | 1,256 | $ | — | ||||||
| Additions to valuation allowance |
35,334 | 3,598 | 1,256 | |||||||||
|
|
|
|
|
|
|
|||||||
| Balance at end of the year |
$ | 40,188 | $ | 4,854 | $ | 1,256 | ||||||
|
|
|
|
|
|
|
|||||||
The Company has domestic net operating loss carryfowards that were generated in the years ended December 31, 2011, 2010 and 2009. The net operating loss carry forwards are recorded as a deferred tax asset of approximately $98 million. The deferred tax asset relates to net operating losses that can be carried forward to December 31, 2031. Deferred tax assets are reduced by a valuation allowance if it is more likely than not some portion or all of the deferred tax asset will not be realized. During the year ended December 31, 2011 the Company increased its valuation allowance by $35.3 million, in recognition of the future realizability of this portion of the deferred tax assets.
F-29
Table of Contents
Note 10—Debt
On September 7, 2011, we entered into a $160 million senior secured credit agreement (the “New Credit Facility”), comprising a $70 million term loan facility and a $90 million revolving credit facility, with Regions Bank, as administrative and collateral agent, RBS Citizens Bank, N.A. and First National Bank of Pennsylvania, as co-syndication agents, and the lenders party thereto (the “Lenders”). The New Credit Facility also has an uncommitted “accordion” feature that permits us to increase borrowings under the revolving credit facility by up to an additional $40 million. As required under our New Credit Facility, we have entered into a floating-to-fixed interest swap agreement with a notional value of $35 million. The Company has elected not to use hedge accounting for the interest swap agreement. The financial impact of the interest swap agreement was immaterial to the consolidated financial statements at December 31, 2011. Each of the term loan and revolving credit facilities matures on September 7, 2015. The term loan bears interest at the 30 day LIBOR Index Rate plus an applicable margin as determined by certain levels of a consolidated leverage ratio. At December 31, 2011 the margin was 4.0% and the interest rate applicable to the term loan was approximately 4.3%. The term loan requires scheduled quarterly principal payments of approximately $2.6 million through June 30, 2015 following which the outstanding principal balance becomes due. The revolving credit facility bears interest in a manner similar to the term loan. At December 31, 2011 the margin for the revolving credit facility was 4.0% and the applicable interest rate was approximately 4.4%.
Our obligations under the New Credit Facility are secured by all of our present and future property and assets, real and personal (with the exception of certain specified equipment), as well as a pledge of all of the capital stock or ownership interests in our current and future domestic subsidiaries and up to 65% of the equity interests in our non-U.S. subsidiaries (other than China Water and its subsidiaries). The terms of the Credit Agreement require the Company to comply, on a quarterly basis, with certain financial covenants, including a consolidated net leverage ratio, consolidated funded debt to total capitalization ratio, consolidated fixed charge coverage ratio and consolidated adjusted EBITDA, as defined. The Company met its financial covenants in the fourth quarter of 2011. The Company must also maintain a minimum balance of cash and cash equivalents of $20 million.
In conjunction with closing the New Credit Facility the Company repaid $67,236 million of existing debt with proceeds from the term loan. In 2011, the Company also drew $72,799 million under the revolving credit facility.
Total debt is comprised of the following at December 31, 2011 and 2010:
| 2011 | 2010 | |||||||
| Revolving credit facility |
$ | 72,799 | $ | — | ||||
| Term loan due through 2015 |
67,375 | — | ||||||
| CVR credit facilities |
— | 31,335 | ||||||
| Other vehicle financings payable due through 2015 |
3,896 | 360 | ||||||
|
|
|
|
|
|||||
| Total debt |
144,070 | 31,695 | ||||||
| Less: current portion |
(11,914 | ) | (11,221 | ) | ||||
|
|
|
|
|
|||||
| Total long-term debt |
$ | 132,156 | $ | 20,474 | ||||
|
|
|
|
|
|||||
F-30
Table of Contents
The aggregate debt maturities at December 31, 2011 were as follows:
| 2012 |
$ | 11,914 | ||
| 2013 |
11,776 | |||
| 2014 |
11,373 | |||
| 2015 |
109,007 | |||
|
|
|
|||
| Total obligations and commitments |
$ | 144,070 | ||
|
|
|
Note 11—Commitments and Contingencies
Leases
Future minimum lease payments (including interest) for continuing operations under non-cancelable operating leases and capital leases at December 31, 2011 were as follows:
Certain facilities and equipment are leased under operating leases expiring at various dates. Most of the operating leases contain renewal options. Certain vehicles are leased under capital leases that expire in 2013. Total expense for all operating leases was $0.6 million, $0.2 million and $0.2 million for the years ended December 31, 2011, 2010 and 2009, respectively.
| Operating Leases |
Capital Leases |
|||||||
| 2012 |
$ | 790 | $ | 467 | ||||
| 2013 |
697 | 312 | ||||||
| 2014 |
532 | — | ||||||
| 2015 |
357 | — | ||||||
| 2016 |
214 | — | ||||||
| Thereafter |
201 | — | ||||||
|
|
|
|
|
|||||
| Total minimum lease payments |
$ | 2,791 | $ | 779 | ||||
| Less amounts representing interest |
(46 | ) | ||||||
|
|
|
|||||||
| Present value of minimum lease payments |
$ | 733 | ||||||
| Less current portion |
430 | |||||||
|
|
|
|||||||
| Non-current portion |
$ | 303 | ||||||
|
|
|
|||||||
Environmental Liabilities
The Company complies with the environmental protection laws and regulatory framework of the United States and the individual states where it operates water gathering pipelines and salt water disposal wells. The Company has installed safety, monitoring and environmental protection equipment such as pressure sensors and relief valves, and has established reporting and responsibility protocols for environmental protection and reporting to relevant local environmental protection departments. In Texas and Louisiana, the Company is subject to rules and regulations promulgated by the Texas Railroad Commission, the Texas Commission on Environmental Quality and the Louisiana Department of Environmental Quality, all of which are designed to protect the environment and monitor compliance with water quality. Management believes the Company is in material compliance with all applicable environmental protection laws and regulations in the United States, Texas and Louisiana.
Litigation
We are party to various litigation matters, including regulatory and administrative proceedings arising out of the normal course of business, the more significant of which are summarized below. The ultimate outcome of
F-31
Table of Contents
each of these matters cannot presently be determined, nor can the liability that could potentially result from a negative outcome be reasonably estimated presently for every case. The liability we may ultimately incur with respect to any one of these matters in the event of a negative outcome may be in excess of amounts currently accrued with respect to such matters and, as a result of these matters, may potentially be material to our financial position or results of operations. We review our litigation activities and determine if an unfavorable outcome to us is considered “remote,” “reasonably possible” or “probable” as defined by U.S. GAAP. Where we have determined an unfavorable outcome is probable and is reasonably estimable, we have accrued for potential litigation losses. In addition to the matters described below, we are involved in various other claims and legal actions, including regulatory and administrative proceedings arising out of the normal course of our business. We do not expect that the outcome of such other claims and legal actions will have a material adverse effect on our financial position or results of operations.
Class Action. On May 21, 2010, Richard P. Gielata, an individual purporting to act on behalf of stockholders, served a class action lawsuit filed May 6, 2010 against the Company and various directors and officers in the United States District Court for the District of Delaware captioned In re Heckmann Corporation Securities Class Action (C.A. No. 10-378-LPS-MPT) (the “Class Action”). The Class Action alleges violations of federal securities laws in connection with the acquisition of China Water. The Company responded by filing a motion to transfer the Class Action to California and a motion to dismiss the case. On October 6, 2010, the Magistrate Judge issued a report and recommendation to the District Court Judge to deny the motion to transfer. On October 8, 2010, the court-appointed lead plaintiff, Matthew Haberkorn, filed an Amended Class Action Complaint that adds China Water as a defendant. On October 25, 2010, the Company filed objections to the Magistrate Judge’s report and recommendation on the motion to transfer. The court adopted the report and recommendation on the motion to transfer on March 31, 2011. The Company filed a motion to dismiss the Amended Class Action Complaint and a reply to lead plaintiff’s opposition to the motion to dismiss. On June 16, 2011, the Magistrate Judge issued a report and recommendation to the District Court Judge to deny the motion to dismiss. The Company filed objections to the Magistrate Judge’s report and recommendation on the motion to dismiss. Plaintiff has filed a response to the Company’s objections. On October 25, 2011, the court heard oral argument on the Company’s objections to the report and recommendation on the motion to dismiss. The court has not yet ruled on the objections. On February 2, 2012, Plaintiff filed motion to modify the automatic discovery stay in place pursuant to the Private Securities Litigation Reform Act. The Company filed an opposition on February 13, 2012. On February 15, 2012, the Magistrate Judge entered an order modifying the discovery stay and requiring the Company to produce documents to plaintiff that have been produced in the Derivative Action described below.
Derivative Action. On November 18, 2010, Melissa Hess filed a stockholder derivative complaint, purportedly on behalf of the Company, against various officers and directors in the Superior Court of California, County of Riverside [captioned Hess v. Heckmann, et al.] (the “Derivative Action”). The Derivative Action alleges claims for breach of fiduciary duty, waste of corporate assets, and unjust enrichment in connection with the acquisition of China Water. The Company responded to the Derivative Action on February 1, 2011 by filing a motion to stay the case until the Class Action is resolved and a demurrer seeking to dismiss the case. The Company filed a reply to Plaintiff’s opposition to the motion to stay and demurrer on May 25, 2011. The court held a hearing on the demurrer and motion to stay on June 21, 2011. On July 20, 2011, the court issued orders overruling the Company’s demurrer and denying its motion to stay the Derivative Action. On August 24, 2011, the Company’s board of directors formed a special litigation committee and delegated to the special litigation committee the Board’s full power and authority to investigate the Derivative Action to determine whether it is in the best interests of the Company to allow the Derivative Action to proceed on behalf of the Company. On September 2, 2011, the Company filed a motion to stay the Derivative Action pending completion of the special litigation committee’s investigation and determination. On September 26, 2011, the Court held a hearing on the Company’s motion to stay. On October 3, 2011, the court issued an order denying the Company’s motion to stay without prejudice and a separate order requiring Defendants to respond to plaintiff’s request for production of documents within thirty days. On October 28, 2011, the special litigation committee filed a motion to stay the Derivative Action pending completion of its investigation and determination. After meeting and conferring on
F-32
Table of Contents
discovery matters, on December 2, 2011, the special litigation committee, plaintiff and defendants entered into a stipulation and proposed order to vacate the motion to stay filed by the special litigation committee, and, on December 5, 2011, the Court entered the order.
The outcome of the Class Action and Derivative Action could have a material adverse effect on our consolidated financial statements.
On June 10, 2011, we received a subpoena from the Denver Regional Office of the SEC seeking information and documents concerning the Company’s acquisition of China Water in 2008. The Company is cooperating fully with the SEC with respect to its requests.
Note 12—Discontinued Operations
On September 30, 2011, the Company, through its wholly-owned subsidiary, China Water, entered into a Share Purchase Agreement (the “SPA”) by and among Pacific Water & Drinks (HK) Group Limited (f/k/a Sino Bloom Investments Limited), a Hong Kong company (“Buyer”), China Water, as Seller, and China Water Drinks (H.K.) Holdings Limited, a Hong Kong company (“Target”), pursuant to which China Water agreed to sell 100% of the equity interests in Target to Buyer in exchange for shares in Buyer equal to ten percent of the Buyer’s outstanding equity. Upon completion of the sale, the Company abandoned the remaining non-U.S. legal entities that were part of its original acquisition of China Water.
The following table details selected financial information of discontinued operations:
| December 31, | ||||||||||||
| 2011 | 2010 | 2009 | ||||||||||
| Revenue |
$ | 20,560 | $ | 30,483 | $ | 32,155 | ||||||
| Pretax loss from operations |
(4,881 | ) | (4,048 | ) | (392,000 | ) | ||||||
| Income tax expense |
(100 | ) | (345 | ) | (78 | ) | ||||||
|
|
|
|
|
|
|
|||||||
| Loss from operations |
(4,981 | ) | (4,393 | ) | (392,078 | ) | ||||||
| Loss from disposal, net of tax of $0 |
(17,917 | ) | — | — | ||||||||
|
|
|
|
|
|
|
|||||||
| Loss from discontinued operations |
$ | (22,898 | ) | $ | (4,393 | ) | $ | (392,078 | ) | |||
|
|
|
|
|
|
|
|||||||
The Company has presented those assets and liabilities related to the discontinued operations separately on the balance sheet as of December 31, 2010. The carrying value of the assets and liabilities of discontinued operations as of December 31, 2010, were as follows:
| Assets: |
||||
| Cash |
$ | 10,460 | ||
| Accounts receivable |
4,133 | |||
| Inventory |
1,726 | |||
| Other current assets |
899 | |||
| Property plant and equipment |
17,922 | |||
| Intangible assets |
10,263 | |||
| Other non-current assets |
179 | |||
|
|
|
|||
| Assets held for sale |
$ | 45,582 | ||
|
|
|
|||
| Liabilities: |
||||
| Accounts payable |
$ | 13,723 | ||
| Accrued expenses |
10,100 | |||
| Other non-current liabilities |
1,673 | |||
|
|
|
|||
| Liabilities held for sale |
$ | 25,496 | ||
|
|
|
F-33
Table of Contents
Note 13—Summarized Quarterly Data (unaudited)
Following is a summary of the quarterly results of operations for the years ended December 31, 2011 and 2010.
| Three Months Ended | ||||||||||||||||
| March 31, 2011 | June 30, 2011 | September 30, 2011 | December 31, 2011 | |||||||||||||
| Revenue |
$ | 18,231 | $ | 39,167 | $ | 47,768 | $ | 51,671 | ||||||||
| Gross profit |
4,410 | 10,112 | 11,978 | 6,828 | ||||||||||||
| Income (loss) from continuing operations |
(539 | ) | 317 | 2,594 | (2,480 | ) | ||||||||||
| Income (loss) from discontinued operations |
904 | (134 | ) | (23,668 | ) | — | ||||||||||
| Net income (loss) attributable to common stockholders |
$ | 365 | $ | 183 | $ | (21,074 | ) | $ | (2,480 | ) | ||||||
| Income (loss) per share from continuing operations: |
||||||||||||||||
| Basic |
$ | * | $ | * | $ | 0.02 | $ | (0.02 | ) | |||||||
| Diluted |
* | * | 0.02 | (0.02 | ) | |||||||||||
| Income (loss) per share from discontinued operations: (1) |
||||||||||||||||
| Basic |
$ | 0.01 | $ | * | $ | (0.21 | ) | $ | * | |||||||
| Diluted |
0.01 | * | (0.21 | ) | * | |||||||||||
| Total: (1) |
||||||||||||||||
| Basic |
$ | * | $ | * | $ | (0.19 | ) | $ | (0.02 | ) | ||||||
| Diluted |
* | * | (0.19 | ) | (0.02 | ) | ||||||||||
| * | Amount is less than $0.01. |
| Three Months Ended | ||||||||||||||||
| March 31, 2010 | June 30, 2010 | September 30, 2010 | December 31, 2010 | |||||||||||||
| Revenue |
$ | 2,095 | $ | 2,473 | $ | 1,939 | $ | 8,701 | ||||||||
| Gross profit |
445 | 710 | 190 | 2,526 | ||||||||||||
| Income (loss) from continuing operations |
186 | (6,979 | ) | (2,217 | ) | (1,290 | ) | |||||||||
| Income (loss) from discontinued operations |
(414 | ) | (5,860 | ) | 312 | 1,569 | ||||||||||
| Net income (loss) attributable to common stockholders |
$ | (228 | ) | $ | (12,839 | ) | $ | (1,905 | ) | $ | 279 | |||||
| Income (loss) per share from continuing operations: |
||||||||||||||||
| Basic |
$ | * | $ | (0.06 | ) | $ | (0.02 | ) | $ | (0.02 | ) | |||||
| Diluted |
* | (0.06 | ) | (0.02 | ) | (0.02 | ) | |||||||||
| Income (loss) per share from discontinued operations: (1) |
||||||||||||||||
| Basic |
$ | * | $ | (0.06 | ) | $ | * | $ | 0.02 | |||||||
| Diluted |
* | (0.06 | ) | * | 0.02 | |||||||||||
| Total: (1) |
||||||||||||||||
| Basic |
$ | * | $ | (0.12 | ) | $ | (0.02 | ) | $ | * | ||||||
| Diluted |
* | (0.12 | ) | (0.02 | ) | * | ||||||||||
| * | Amount is less than $0.01. |
| (1) | Totals may not equal corresponding amounts on the Consolidated Statements of Operations due to rounding. |
Note 14—Subsequent Events
On March 8, 2012, the Company entered into a definitive Stock Purchase Agreement pursuant to which the Company would acquire all of the outstanding shares of TFI Holdings, Inc. (“TFI”) for $245 million. Headquartered in Scottsdale, Arizona, through its wholly-owned operating subsidiary, Thermo Fluids, Inc., TFI provides route-based environmental services and waste recycling solutions.
F-34
Table of Contents
| Exhibit Number |
||
| 2.1 | Stock Purchase Agreement, dated as of November 8, 2010, by and among Heckmann Corporation, Complete Vacuum and Rental, Inc., Steven W. Kent, II and Jana S. Kent (incorporated herein by reference to Exhibit 2.10 to Heckmann Corporation’s Current Report on Form 8-K filed November 9, 2010). | |
| 2.2 | Share Purchase Agreement by and among Pacific Water & Drinks (HK) Group Limited (f/k/a Sino Bloom Investments Limited), China Water & Drinks (BVI) Inc., and China Water Drinks (H.K.) Holdings Limited, dated as of September 30, 2011 (incorporated herein by reference to Exhibit 10.1 to Heckmann Corporation’s Current Report on Form 8-K filed October 5, 2011). | |
| 3.1 | Amended and Restated Certificate of Incorporation (incorporated herein by reference to Exhibit 3.1 to Amendment No. 2 to Heckmann Corporation’s Registration Statement on Form S-1 filed September 4, 2007). | |
| 3.1A | Certificate of Amendment to Amended and Restated Certificate of Incorporation (incorporated herein by reference to Exhibit 3.1 to Heckmann Corporation’s Current Report on Form 8-K filed November 5, 2008). | |
| 3.1B | Second Certificate of Amendment of Amended and Restated Certificate of Incorporation (incorporated herein by reference to Exhibit 3.1B to Heckmann Corporation’s Annual Report on Form 10-K for the year ended December 31, 2010, filed March 14, 2011). | |
| 3.2 | Amended and Restated Bylaws (incorporated herein by reference to Amendment No. 4 to Heckmann Corporation’s Registration Statement on Form S-1 filed October 26, 2007). | |
| 4.1 | Specimen Common Stock Certificate (incorporated herein by reference to Exhibit 4.2 to Heckmann Corporation’s Registration Statement on Form S-1 filed June 26, 2007) | |
| 10.1 | Credit Agreement dated September 7, 2011, by and among Heckmann Corporation, Heckmann Water Resources Corporation, Heckmann Water Resources (CVR), Inc., HEK Water Solutions, LLC, 1960 Well Services, LLC, Heckmann Water Resources (Excalibur), Inc., as borrowers, Regions Bank, as administrative and collateral agent, RBS Citizens Bank, N.A., and First National Bank of Pennsylvania, as co-syndication agents, Wells Fargo Bank, National Association, as documentation agent, Regions Capital Markets and RBS Citizens Bank, N.A. as joint lead arrangers and joint bood managers and certain other lenders party thereto (incorporated herein by reference to Exhibit 10.1 to Heckmann Corporation’s Current Report on Form 8-K filed September 8, 2011). | |
| 10.2 | Novation Agreement by and between China Water and Drinks, Inc. and China Water & Drinks (BVI), Inc., dated as of September 30, 2011 (incorporated herein by reference to Exhibit 10.2 to Heckmann Corporation’s Current Report on Form 8-K filed October 5, 2011). | |
| 10.3** | Heckmann Corporation 2009 Equity Incentive Plan (incorporated herein by reference to Appendix A to the Registrant’s Definitive Proxy Statement on Schedule 14A filed April 2, 2009). | |
| 10.4** | Executive Employment Agreement, dated November 9, 2011, by and between Heckmann Corporation and W. Christopher Chisholm (incorporated herein by reference to Exhibit 10.1 to Heckmann Corporation’s Current Report on Form 8-K filed November 9, 2011). | |
| 10.5** | Amended and Restated Executive Employment Agreement, dated December 30, 2010, by and between Heckmann Corporation and Brian R. Anderson (incorporated herein by reference to Exhibit 10.27 to Heckmann Corporation’s Annual Report on Form 10-K for the fiscal year ended December 31, 2010, filed March 14, 2011). | |
| 10.5A** | Second Amended and Restated Executive Employment Agreement, dated November 9, 2011, by and between Heckmann Corporation and Brian R. Anderson (incorporated herein by reference to Exhibit 10.2 to Heckmann Corporation’s Current Report on Form 8-K filed November 9, 2011). | |
Table of Contents
| Exhibit Number |
||
| 10.6** | Amended and Restated Executive Employment Agreement, dated December 30, 2010, by and between Heckmann Corporation and Charles R. Gordon (incorporated herein by reference to Exhibit 10.28 to Heckmann Corporation’s Annual Report on Form 10-K for the fiscal year ended December 31, 2010, filed March 14, 2011). | |
| 10.7** | Executive Employment Agreement, dated December 30, 2010, by and between Heckmann Corporation and Damian C. Georgino (incorporated herein by reference to Exhibit 10.29 to Heckmann Corporation’s Annual Report on Form 10-K for the fiscal year ended December 31, 2010, filed March 14, 2011). | |
| 14.1 | Code of Ethics (incorporated herein by reference to Exhibit 14.1 to Amendment No. 2 to Heckmann Corporation’s Current Report on Form 8-K filed June 21, 2011). | |
| 21.1* | Subsidiaries of Heckmann Corporation. | |
| 23.1* | Consent of KPMG LLP, Independent Registered Public Accounting Firm. | |
| 23.2* | Consent of GHP Horwath, P.C., Independent Registered Public Accounting Firm. | |
| 31.1* | Certification of Chief Executive Officer Pursuant to 18 U.S.C. Section 1350, as adopted pursuant to Section 302 of the Sarbanes-Oxley Act of 2002. | |
| 31.2* | Certification of Chief Financial Officer Pursuant to 18 U.S.C. Section 1350, as adopted pursuant to Section 302 of the Sarbanes-Oxley Act of 2002. | |
| 32.1* | Certification of CEO and CFO Pursuant to 18 U.S.C. Section 1350, as adopted pursuant to Section 906 of the Sarbanes-Oxley Act of 2002. | |
| 101.INS*** | XBRL Instance Document. | |
| 101.SCH*** | XBRL Taxonomy Extension Schema Document. | |
| 101.CAL*** | XBRL Taxonomy Extension Calculation Linkbase Document. | |
| 101.DEF*** | XBRL Taxonomy Extension Definition Linkbase Document | |
| 101.LAB*** | XBRL Taxonomy Extension Label Linkbase Document. | |
| 101.PRE*** | XBRL Taxonomy Extension Presentation Linkbase Document. | |
| * | Filed herewith. |
| ** | Compensatory plan, contract or arrangement in which directors or executive officers may participate. |
| *** | XBRL (eXtensible Business Reporting Language) information is furnished and not filed herewith, is not part of a registration statement or prospectus for purposes of sections 11 or 12 of the Securities Act of 1933, is deemed not filed for purposes of section 18 of the Securities Exchange Act of 1934, and otherwise is not subject to the liability under these sections. |
| † | Certain portions of this exhibit have been omitted pursuant to a confidential treatment request filed separately with the Securities and Exchange Commission. |