Attached files
| file | filename |
|---|---|
| 8-K - 8-K - REX ENERGY CORP | d628004d8k.htm |
 Rex Energy Corporation | 366 Walker Drive | State College, PA 16801
P: (814) 278-7267 | F: (814) 278-7286
E: InvestorRelations@RexEnergyCorp.com
www.rexenergy.com
Responsible Development of America’s Energy Resources
Rex Energy
SunTrust 5
th
Annual Utica Shale Mini-Conference
November 14, 2013
Exhibit 99.1 |
 Except
for
historical
information,
statements
made
in
this
presentation,
including
those
relating
to
significant
potential
opportunities,
future
earnings,
resource
potential,
cash
flow,
capital
expenditures,
production
growth,
planned
number
of
wells
(as
well
as
the
timing
of
rig
operations,
natural
gas
processing
plant
commissioning
and
operations,
fracture
stimulation
activities
and
the
completion
of
wells
and
the
expected
dates
that
wells
are
producing
hydrocarbons
that
are
sold)
and
potential
ethane
sales
pipeline
projects
are
forward-looking
statements
within
the
meaning
of
Section
27A
of
the
Securities
Act
of
1933,
as
amended,
and
Section
21E
of
the
Securities
Exchange
Act
of
1934,
as
amended.
These
forward-looking
statements
are
indicated
by
words
such
as
“expected”,
“expects”,
“assumes”,
“anticipates”
and
similar
words.
These
statements
are
based
on
assumptions
and
estimates
that
management
believes
are
reasonable
based
on
currently
available
information;
however,
management's
assumptions
and
the
company's
future
performance
are
subject
to
a
wide
range
of
business
risks
and
uncertainties,
and
there
is
no
assurance
that
these
goals
and
projections
can
or
will
be
met.
Any
number
of
factors
could
cause
actual
results
to
differ
materially
from
those
in
the
forward-looking
statements,
including
(without
limitation)
the
following:
The
company
undertakes
no
obligation
to
publicly
update
or
revise
any
forward-looking
statements.
Further
information
on
the
company’s
risks
and
uncertainties
is
available
in
the
company's
filings
with
the
Securities
and
Exchange
Commission.
The
company's
internal
estimates
of
reserves
may
be
subject
to
revision
and
may
be
different
from
estimates
by
the
company's
external
reservoir
engineers
at
year
end.
Although
the
company
believes
the
expectations
and
forecasts
reflected
in
these
and
other
forward-looking
statements
are
reasonable,
it
can
give
no
assurance
they
will
prove
to
have
been
correct.
They
can
be
affected
by
inaccurate
assumptions
or
by
known
or
unknown
risks
and
uncertainties.
2
Forward Looking Statements & Estimates
Hydrocarbon Volumes
The
SEC
permits
publicly-reporting
oil
and
gas
companies
to
disclose
“proved
reserves”
in
their
filings
with
the
SEC.
“Proved
reserves”
are
estimates
that
geological
and
engineering
data
demonstrate
with
reasonable
certainty
to
be
recoverable
in
future
years
from
known
reservoirs
under
existing
economic
and
operating
conditions.
SEC
rules
also
permit
the
disclosure
of
“probable”
and
possible”
reserves.
Rex
Energy
discloses
proved
reserves
but
does
not
disclose
probable
or
possible
reserves.
We
may
use
certain
broader
terms
such
as
“resource
potential,”
“EUR”
(estimated
ultimate
recovery
of
resources,
defined
below)
and
other
descriptions
of
volumes
of
potentially
recoverable
hydrocarbon
resources
throughout
this
presentation.
These
broader
classifications
do
not
constitute
“reserves”
as
defined
by
the
SEC
and
we
do
not
attempt
to
distinguish
these
classifications
from
probable
or
possible
reserves
as
defined
by
SEC guidelines.
The
company
defines
EUR
as
the
cumulative
oil
and
gas
production
expected
to
be
economically
recovered
from
a
reservoir
or
individual
well
from
initial
production
until
the
end
of
its
useful
life.
Our
estimates
of
EURs
and
resource
potential
have
been
prepared
internally
by
our
engineers
and
management
without
review
by
independent
engineers.
These
estimates
are
by
their
nature
more
speculative
than
estimates
of
proved,
probable
and
possible
reserves
and
accordingly
are
subject
to
substantially
greater
risk
of
being
actually
realized.
We
include
these
estimates
to
demonstrate
what
we
believe
to
be
the
potential
for
future
drilling
and
production
by
the
company.
Ultimate
recoveries
will
be
dependent
upon
numerous
factors
including
actual
encountered
geological
conditions,
the
impact
of
future
oil
and
gas
pricing,
exploration
and
development
costs,
and
our
future
drilling
decisions
and
budgets
based
upon
our
future
evaluation
of
risk,
returns
and
the
availability
of
capital
and,
in
many
areas, the
outcome
of
negotiation
of
drilling
arrangements
with
holders
of
adjacent
or
fractional
interest
leases.
Estimates
of
resource
potential
and
other
figures
may
change
significantly
as
development
of
ourresource
plays
provide
additional
data
and
therefore actual quantities that may ultimately be recovered will likely differ from these
estimates. Potential Drilling Locations
Our
estimates
of
potential
drilling
locations
are
prepared
internally
by
our
engineers
and
management
and
are
based
upon
a
number
of
assumptions
inherent
in
the
estimate
process.
Management,
with
the
assistance
of
engineers
and
other
professionals,
as
necessary,
conducts
a
topographical
analysis
of
our
unproved
prospective
acreage
to
identify
potential
well
pad
locations
using
operationally
approved
designs
and
considering
several
factors,
which
may
include
but
are
not
limited
to
access
roads,
terrain,
well
azimuths,
and
well
pad
sizes.
For
our
operations
in
Pennsylvania,
we
then
calculate
the
number
of
horizontal
well
bores
for
which
the
company
appears
to
control
sufficient
acreage
to
drill
the
lateral
wells
from
each
potential
well
pad
location
to
arrive
at
an
estimated
number
of
net
potential
drilling
locations.
For
our
operations
in
Ohio,
we
calculate
the
number
of
horizontal
well
bores
that
may
be
drilled
from
the
potential
well
pad
and
multiply
this
by
the
company’s
net
working
interest
percentage
of
the
proposed
unit
to
arrive
at
an
estimated
number
of
net
potential
drilling
locations.
In
both
cases,
we
then
divide
the
unproved
prospective
acreage
by
the
number
of
net
potential
drilling
locations
to
arrive
at
an
average
well
spacing.
Management
uses
these
estimates
to,
among
other
things,
evaluate
our
acreage
holdings
and
to
formulate
plans
for
drilling.
Any
number
of
factors
could
cause
the
number
of
wells
we
actually
drill
to
vary
significantly
from
these
estimates,
including:
the
availability
of
capital,
drilling
and
productioncosts,
commodity
prices,
availability
of
drilling
services
and
equipment,
lease
expirations,
regulatory
approvals
and
other
factors.
•
economic
conditions
in
the
United
States
and
globally;
the
difficult
and
adverse
conditions
in
the
domestic
and
global
capital
and
credit
markets;
domestic
and
global
demand
for
oil
and
natural
gas;
sustained
or
further
declines
in
the
prices
the
company
receives
for
oil
and
natural
gas;
the
effects
of
government
regulation,
permitting
and
other
legal
requirements;
the
geologic
quality
of
the
company’s
properties
with
regard
to,
among
other
things,
the
existence
of
hydrocarbons
in
economic
quantities;
uncertainties
about
the
estimates
of
the
company’s
oil
and
natural
gas
reserves;
the
company’s
ability
to
increase
production
and
oil
and
natural
gas
income
through
exploration
and
development;
the
company’s
ability
to
successfully
apply
horizontal
drilling
techniques
and
tertiary
recovery
methods;
the
number
of
well
locations
to
be
drilled,
the
cost
to
drill
and
the
time
frame
within
which
they
will
be
drilled;
the
effects
of
adverse
weather
on
operations;
drilling
and
operating
risks;
the
ability
of
contractors
to
timely
and
adequately
perform
their
drilling,
construction,
well
stimulation,
completion
and
production
services;
the
availability
of
equipment,
such
as
drilling
rigs
and
transportation
pipelines;
changes
in
the
company’s
drilling
plans
and
related
budgets;
the
adequacy
of
capital
resources
and
liquidity
including
(without
limitation)
access
to
additional
borrowing
capacity;
uncertainties
relating
to
the
potential
divestiture
of
the
Niobrara
assets,
including
the
ability
to
reach
an
agreement
with
a
potential
purchaser
on
terms
acceptable
to
the
company;
and
uncertainties
associated
with
our
legal
proceedings
and
the
outcome. |
 Warrior
Prospects – Status Update
3
Area
Pad
Well
Lateral
Length
Status
Warrior North
Brace
Brace 1H
4,170 ft.
•
Placed into sales in September 2012
Warrior North
Graham
Graham 1H
3,973 ft.
•
Placed into sales in June 2013
Graham 2H
3,572 ft.
Warrior North
Brace West
Brace West 1H
4,178 ft.
•
Placed into sales in July 2013
Brace West 2H
4,658 ft.
Warrior North
Ocel
Ocel 1H
4,449 ft.
•
Expected to begin completion operations in 1Q14
Ocel 2H
4,350 ft.
Ocel 3H
4,340 ft.
Warrior North
Grunder
Grunder SW 1H
4,717 ft.
•
Completed drilling of first well on pad
•
One more well on Grunder pad expected to be drilled in 2013
•
Remaining three wells on pad will be drilled in 2014
Grunder SW 3H
4,585 ft.
Grunder SW 5H
5,012 ft.
Grunder SE 7H
5,013 ft.
Grunder SE 9H
4,914ft.
Warrior South
Guernsey/Noble
Guernsey 1H
3,587 ft.
•
Placed into sales in June 2013
Guernsey 2H
3,640 ft.
Noble 1H
3,378 ft.
Warrior South
J. Anderson
J. Anderson 1H
3,222 ft.
•
J. Anderson 1H & 2H placed into sales on November 11, 2013
•
Remaining
three
wells
will
be
placed
into
sales
on
December
1,
2013
J. Anderson 2H
4,133 ft.
J. Anderson 3H
3,874 ft.
J. Anderson 4H
4,339 ft.
J. Anderson 5H
5,162 ft. |
 Ohio Utica
Midstream Providers 4
REXX Warrior
South Acreage
Blue Racer –
Hastings Plant
Blue Racer –
Natrium Plant
EPD ATEX Express
Pipeline
REXX Carroll
County Acreage
Mariner West
Pipeline
Blue Racer East
Ohio Pipeline
Currently in Service
Under Construction
Source: Publicly available press releases or presentations
MWE Seneca
Processing
Complex
MWE Cadiz
Processing
Complex
MarkWest Energy -
Cadiz Processing Complex
Interim Refrigeration
60 MMcf/d
In Service
Cadiz I
125 MMcf/d
In Service
Cadiz II
200 MMcf/d
3Q14
De-ethanization
40,000 Bbl/d
1Q14
MarkWest Energy -
Seneca Processing Complex
Interim Refrigeration
45 MMcf/d
In Service
Seneca I
200 MMcf/d
In Service
Seneca II
200 MMcf/d
In Service
Seneca III
200 MMcf/d
2Q14
De-ethanization
38,000 Bbl/d
4Q14
Blue Racer Facilities
Hastings
180 MMcf/d
In Service
Natrium
200 MMcf/d
In Service
Natrium Fractionation
36,000 Bbls/d
In Service
Pipeline to ATEX
27,000 Bbls/d
2Q14 |
 Ohio Utica
– Warrior North Prospect
5
1.
Assumes full ethane recovery
Warrior North Drilling Program
Year
Wells Drilled
Fracture
Stimulated
Placed in
Sales
Awaiting
Completion
YTD
6
4
4
3
2013E
8
4
4
3
Warrior North Prospect
5-Day Sales Rate (Average Per Well)¹
Natural
Gas
Condensate
NGLs
Total
%
Liquids
Total
(Ethane
Rejection)
G. Graham 1H
513
497
701
1,710
70%
1,417
Brace West 1H
459
296
709
1,464
69%
1,164
Brace West 2H
323
448
488
1,260
74%
1,045
•
~16,800 gross / ~16,500 net acres in Carroll County, OH
•
~115 potential gross drilling locations (pro forma for acreage trade)
•
Completed drilling three-well Ocel pad; expected to be completed
in 1Q14
•
Reduced two-pad drilling costs for 4,500’
lateral from $8.8 million at
end of last year to current $8.1 million
•
Plan to average 5-6 wells per pad with laterals averaging 5,000’
going forward
•
Average lateral length of ~ 4,400 feet
•
First wells drilled without intermediate casing to kick-off point;
expected to be next step in reducing drilling costs |
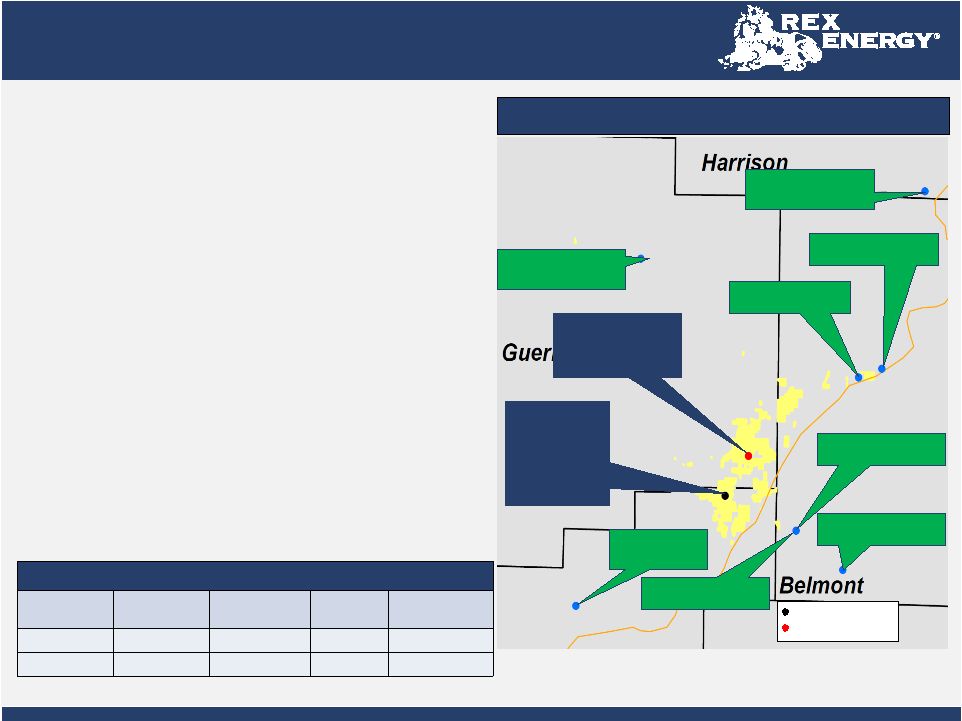 Ohio Utica
– Warrior South Prospect
•
~7,000 gross / ~4,300 net acres in Guernsey, Noble and
Belmont Counties, OH (63% WI)
•
~ 38 potential gross drilling locations
2
•
Completed 5-well J. Anderson pad
•
J. Anderson 1H & 2H placed into sales
•
Remaining three wells expected to be placed
into sales on December 1, 2013
•
Three-well Guernsey / Noble pad:
•
Average lateral length of 3,535 feet
•
Completed utilizing “Super Frac”
design
•
5-day avg. sales rate –
1.7 Mboe/d
1
•
1,237 BTU; 57% liquids
•
30-day avg. sales rate –
1.6 Mboe/d
1
•
1,237 BTU; 55% liquids
6
Warrior South Drilling Program³
Year
Wells Drilled
Fracture
Stimulated
Placed in
Sales
Awaiting
Completion
YTD
5
5
3
0
2013E
5
5
8
0
Warrior South Prospect
REXX –
Completed
Three-well
Guernsey/Noble
pad –
Avg. 24 Hour
Sales Rate:
3.1 Mboe/d¹
Antero Miley Pad:
Avg. 3.6 Mboe/d
GPOR –
Groh 1-12H:
5,414’
lateral 1.9 Mboe/d
GPOR –
Shugert 1-1H:
5,758’
lateral; 4.9 Mboe/d
Completed Pads
Potential Pad Location
1.
Assumes full ethane recovery
2.
See note on Potential Drilling Locations on page 3
3.
Well information in gross
GPOR –
Shugert 1-12H:
7.5 Mboe/d
GPOR –
Stutzman 1-14H:
8,634’
lateral; 4.1 Mboe/d
REXX –
Five-well J.
Anderson Pad; Avg.
Lateral Length of ~4,250’
GPOR –
McCourt 1-28H:
7,501’
lateral; 2.2 Mboe/d
GPOR –
Wagner 3-28H:
6,867’
lateral; 2.6 Mboe/d
GPOR –
McCourt 2-28H:
9,489’
lateral; 2.7 Mboe/d |
 Warrior
South Industry Results Comparison 7
> 65% Liquids
Company
Well Name
Lateral
(feet)
BTU
Shrink %
Gas (Mcf/d)
Oil (Bbls/d)
NGL (Bbls/d)
Boe/d (Full Ethane
Recovery)
% Liquids
Boe/d assuming 3,500’
Lateral*
GPOR
Lyons 2-27H
7,100
1,320
23%
1,386
1,373
155
1,759
87%
867
GPOR
Lyons 1-27H
6,694
1,271
21%
1,975
1,087
137
1,553
79%
812
PDCE
Onega Commissioners 14-
25H
3,950
1,254
20%
~1,891
~841
~345
1,501
79%
1,330
GPOR
Boy Scout 5-33H
6,029
1,259
22%
2,262
902
383
1,662
77%
965
PDCE
Detweiler 42-3H
3,868
1,263
21%
~3,059
~999
~530
2,039
75%
1,845
GPOR
Boy Scout 1-33H
7,974
1,310
25%
5,325
1,560
1,008
3,456
74%
1,517
GPOR
Clay 1-14H
7,372
1,258
27%
4,307
747
761
2,226
68%
1,057
GPOR
BK Stephens 1-16H
5,276
1,207
11%
6,141
1,224
759
3,007
66%
1,994
Average
6,034
1,268
21%
3,293
1,092
510
2,150
76%
1,298
50% -
65% Liquids
REXX
Guernsey 2H
3,640
1,207
20%
8,082
564
1,200
3,111
57%
2,991
REXX
Guernsey 1H
3,587
1,216
20%
7,603
549
1,152
2,968
57%
2,896
REXX
Noble 1H
3,378
1,216
20%
8,004
392
1,212
2,938
55%
3,044
Average
3,535
1,213
20%
7,896
502
1,188
3,006
56%
2,977
< 50% Liquids
GPOR
Wagner 1-28H
8,143
1,214
18%
14,022
432
1,881
4,650
50%
1,999
GPOR
Stutzman 1-14H
8,634
1,078
11%
18,690
0
945
4,060
23%
1,646
Average
8,389
1,146
15%
16,356
216
1,413
4,355
37%
1,823
Source: Publicly available press releases announcing well test results
*Internal calculation based upon
lateral lengths shown in table
Other Recent Results
•
MHR Farley well –
6,500’
lateral; produced at a test rate of 3.0 MMcfe/d assuming full ethane rejection
•
PDCE Garvin 1H –
1,530 Boe/d; 54% liquids |