Attached files
| file | filename |
|---|---|
| 8-K - FORM 8-K - PACKAGING CORP OF AMERICA | d611750d8k.htm |
| EX-99.1 - EX-99.1 - PACKAGING CORP OF AMERICA | d611750dex991.htm |
| EX-23.1 - EX-23.1 - PACKAGING CORP OF AMERICA | d611750dex231.htm |
| EX-99.2 - EX-99.2 - PACKAGING CORP OF AMERICA | d611750dex992.htm |
Exhibit 99.3
Boise Inc.
Consolidated Statements of Operations
(unaudited, dollars and shares in thousands, except per-share data)
| Three Months Ended June 30 |
Six Months Ended June 30 |
|||||||||||||||
| 2013 | 2012 | 2013 | 2012 | |||||||||||||
| Sales |
||||||||||||||||
| Trade |
$ | 604,821 | $ | 618,585 | $ | 1,196,142 | $ | 1,252,113 | ||||||||
| Related party |
16,843 | 19,255 | 32,540 | 30,573 | ||||||||||||
|
|
|
|
|
|
|
|
|
|||||||||
| 621,664 | 637,840 | 1,228,682 | 1,282,686 | |||||||||||||
|
|
|
|
|
|
|
|
|
|||||||||
| Costs and expenses |
||||||||||||||||
| Materials, labor, and other operating expenses (excluding depreciation) |
495,689 | 507,343 | 991,958 | 1,009,642 | ||||||||||||
| Fiber costs from related party |
5,319 | 4,466 | 11,465 | 9,412 | ||||||||||||
| Depreciation, amortization, and depletion |
43,891 | 37,303 | 87,319 | 74,859 | ||||||||||||
| Selling and distribution expenses |
33,764 | 30,568 | 62,613 | 61,210 | ||||||||||||
| General and administrative expenses |
19,693 | 20,035 | 38,616 | 40,043 | ||||||||||||
| Restructuring costs |
9,011 | — | 9,474 | — | ||||||||||||
| Other (income) expense, net |
1,930 | 381 | 1,798 | 81 | ||||||||||||
|
|
|
|
|
|
|
|
|
|||||||||
| 609,297 | 600,096 | 1,203,243 | 1,195,247 | |||||||||||||
|
|
|
|
|
|
|
|
|
|||||||||
| Income from operations |
12,367 | 37,744 | 25,439 | 87,439 | ||||||||||||
|
|
|
|
|
|
|
|
|
|||||||||
| Foreign exchange gain (loss) |
(415 | ) | 102 | (756 | ) | 259 | ||||||||||
| Interest expense |
(15,456 | ) | (15,433 | ) | (30,875 | ) | (30,798 | ) | ||||||||
| Interest income |
7 | 54 | 34 | 98 | ||||||||||||
|
|
|
|
|
|
|
|
|
|||||||||
| (15,864 | ) | (15,277 | ) | (31,597 | ) | (30,441 | ) | |||||||||
|
|
|
|
|
|
|
|
|
|||||||||
| Income (loss) before income taxes |
(3,497 | ) | 22,467 | (6,158 | ) | 56,998 | ||||||||||
| Income tax (provision) benefit |
1,289 | (8,805 | ) | 2,725 | (21,998 | ) | ||||||||||
|
|
|
|
|
|
|
|
|
|||||||||
| Net income (loss) |
$ | (2,208 | ) | $ | 13,662 | $ | (3,433 | ) | $ | 35,000 | ||||||
|
|
|
|
|
|
|
|
|
|||||||||
| Weighted average common shares outstanding: |
||||||||||||||||
| Basic |
100,531 | 100,116 | 100,387 | 99,584 | ||||||||||||
| Diluted |
100,531 | 101,008 | 100,387 | 101,182 | ||||||||||||
| Net income (loss) per common share: |
||||||||||||||||
| Basic |
$ | (0.02 | ) | $ | 0.14 | $ | (0.03 | ) | $ | 0.35 | ||||||
| Diluted |
$ | (0.02 | ) | $ | 0.14 | $ | (0.03 | ) | $ | 0.35 | ||||||
See accompanying condensed notes to unaudited quarterly consolidated financial statements.
1
Boise Inc.
Consolidated Statements of Comprehensive Income
(unaudited, dollars in thousands)
| Three Months Ended June 30 |
Six Months Ended June 30 |
|||||||||||||||
| 2013 | 2012 | 2013 | 2012 | |||||||||||||
| Net income (loss) |
$ | (2,208 | ) | $ | 13,662 | $ | (3,433 | ) | $ | 35,000 | ||||||
| Other comprehensive income (loss), net of tax |
||||||||||||||||
| Foreign currency translation adjustment, net of tax of $69, $0, $29, and $0, respectively |
(195 | ) | (2,307 | ) | (423 | ) | (1,452 | ) | ||||||||
| Cash flow hedges: |
||||||||||||||||
| Change in fair value, net of tax of ($671), $913, $367, and ($475), respectively |
(1,069 | ) | 1,459 | 587 | (756 | ) | ||||||||||
| (Gain) loss included in net income, net of tax of $64, $380, $2, and $891, respectively |
101 | 604 | 3 | 1,421 | ||||||||||||
| Amortization of actuarial loss and prior service cost for defined benefit pension plans, net of tax of $845, $993, $1,670, and $2,012, respectively |
1,349 | 1,585 | 2,665 | 3,210 | ||||||||||||
| Other, net of tax of ($14), ($2), ($29), and ($6), respectively |
(24 | ) | (5 | ) | (48 | ) | (10 | ) | ||||||||
|
|
|
|
|
|
|
|
|
|||||||||
| 162 | 1,336 | 2,784 | 2,413 | |||||||||||||
|
|
|
|
|
|
|
|
|
|||||||||
| Comprehensive income (loss) |
$ | (2,046 | ) | $ | 14,998 | $ | (649 | ) | $ | 37,413 | ||||||
|
|
|
|
|
|
|
|
|
|||||||||
See accompanying condensed notes to unaudited quarterly consolidated financial statements.
2
Boise Inc.
Consolidated Balance Sheets
(unaudited, dollars in thousands)
| June 30, 2013 | December 31, 2012 | |||||||
| ASSETS |
||||||||
| Current |
||||||||
| Cash and cash equivalents |
$ | 61,086 | $ | 49,707 | ||||
| Receivables |
||||||||
| Trade, less allowances of $1,349 and $1,382 |
254,348 | 240,459 | ||||||
| Other |
9,861 | 8,267 | ||||||
| Inventories |
288,707 | 294,484 | ||||||
| Deferred income taxes |
10,068 | 17,955 | ||||||
| Prepaid and other |
14,139 | 8,828 | ||||||
|
|
|
|
|
|||||
| 638,209 | 619,700 | |||||||
|
|
|
|
|
|||||
| Property |
||||||||
| Property and equipment, net |
1,212,663 | 1,223,001 | ||||||
| Fiber farms |
25,113 | 24,311 | ||||||
|
|
|
|
|
|||||
| 1,237,776 | 1,247,312 | |||||||
|
|
|
|
|
|||||
| Deferred financing costs |
24,380 | 26,677 | ||||||
| Goodwill |
160,132 | 160,130 | ||||||
| Intangible assets, net |
142,018 | 147,564 | ||||||
| Other assets |
6,629 | 7,029 | ||||||
|
|
|
|
|
|||||
| Total assets |
$ | 2,209,144 | $ | 2,208,412 | ||||
|
|
|
|
|
|||||
See accompanying condensed notes to unaudited quarterly consolidated financial statements.
3
Boise Inc.
Consolidated Balance Sheets (continued)
(unaudited, dollars and shares in thousands, except per-share data)
| June 30, 2013 | December 31, 2012 | |||||||
| LIABILITIES AND STOCKHOLDERS’ EQUITY |
||||||||
| Current |
||||||||
| Current portion of long-term debt |
$ | 15,000 | $ | 10,000 | ||||
| Accounts payable |
203,202 | 185,078 | ||||||
| Accrued liabilities |
||||||||
| Compensation and benefits |
65,386 | 70,950 | ||||||
| Interest payable |
10,529 | 10,516 | ||||||
| Other |
25,158 | 20,528 | ||||||
|
|
|
|
|
|||||
| 319,275 | 297,072 | |||||||
|
|
|
|
|
|||||
| Debt |
||||||||
| Long-term debt, less current portion |
760,000 | 770,000 | ||||||
|
|
|
|
|
|||||
| Other |
||||||||
| Deferred income taxes |
189,918 | 198,370 | ||||||
| Compensation and benefits |
116,153 | 121,682 | ||||||
| Other long-term liabilities |
73,990 | 73,102 | ||||||
|
|
|
|
|
|||||
| 380,061 | 393,154 | |||||||
|
|
|
|
|
|||||
| Commitments and contingent liabilities |
||||||||
| Stockholders’ equity |
||||||||
| Preferred stock, $0.0001 par value per share: 1,000 shares authorized; none issued |
— | — | ||||||
| Common stock, $0.0001 par value per share: 250,000 shares authorized; 100,884 and 100,503 shares issued and outstanding |
12 | 12 | ||||||
| Treasury stock, 21,151 shares held |
(121,423 | ) | (121,423 | ) | ||||
| Additional paid-in capital |
871,065 | 868,840 | ||||||
| Accumulated other comprehensive income (loss) |
(98,520 | ) | (101,304 | ) | ||||
| Retained earnings |
98,674 | 102,061 | ||||||
|
|
|
|
|
|||||
| Total stockholders’ equity |
749,808 | 748,186 | ||||||
|
|
|
|
|
|||||
| Total liabilities and stockholders’ equity |
$ | 2,209,144 | $ | 2,208,412 | ||||
|
|
|
|
|
|||||
See accompanying condensed notes to unaudited quarterly consolidated financial statements.
4
Boise Inc.
Consolidated Statements of Cash Flows
(unaudited, dollars in thousands)
| Six Months Ended June 30 |
||||||||
| 2013 | 2012 | |||||||
| Cash provided by (used for) operations |
||||||||
| Net income (loss) |
$ | (3,433 | ) | $ | 35,000 | |||
| Items in net income (loss) not using (providing) cash |
||||||||
| Depreciation, depletion, and amortization of deferred financing costs and other |
89,793 | 77,190 | ||||||
| Share-based compensation expense |
3,076 | 2,729 | ||||||
| Pension expense |
3,020 | 5,474 | ||||||
| Deferred income taxes |
(2,624 | ) | 12,610 | |||||
| Restructuring costs |
9,992 | — | ||||||
| Other |
1,400 | (43 | ) | |||||
| Decrease (increase) in working capital |
||||||||
| Receivables |
(15,731 | ) | (12,050 | ) | ||||
| Inventories |
2,566 | (20,224 | ) | |||||
| Prepaid expenses |
(2,127 | ) | (4,869 | ) | ||||
| Accounts payable and accrued liabilities |
1,040 | (14,061 | ) | |||||
| Current and deferred income taxes |
(689 | ) | 7,452 | |||||
| Pension payments |
(5,091 | ) | (18,191 | ) | ||||
| Other |
404 | 2,110 | ||||||
|
|
|
|
|
|||||
| Cash provided by operations |
81,596 | 73,127 | ||||||
|
|
|
|
|
|||||
| Cash provided by (used for) investment |
||||||||
| Expenditures for property and equipment |
(64,595 | ) | (52,457 | ) | ||||
| Other |
690 | 586 | ||||||
|
|
|
|
|
|||||
| Cash used for investment |
(63,905 | ) | (51,871 | ) | ||||
|
|
|
|
|
|||||
| Cash provided by (used for) financing |
||||||||
| Payments of long-term debt |
(5,000 | ) | (5,000 | ) | ||||
| Payments of special dividend |
— | (47,483 | ) | |||||
| Other |
(1,312 | ) | (6,267 | ) | ||||
|
|
|
|
|
|||||
| Cash used for financing |
(6,312 | ) | (58,750 | ) | ||||
|
|
|
|
|
|||||
| Increase (decrease) in cash and cash equivalents |
11,379 | (37,494 | ) | |||||
| Balance at beginning of the period |
49,707 | 96,996 | ||||||
|
|
|
|
|
|||||
| Balance at end of the period |
$ | 61,086 | $ | 59,502 | ||||
|
|
|
|
|
|||||
See accompanying condensed notes to unaudited quarterly consolidated financial statements.
5
BZ Intermediate Holdings LLC
Consolidated Statements of Operations
(unaudited, dollars in thousands)
| Three Months Ended June 30 |
Six Months Ended June 30 |
|||||||||||||||
| 2013 | 2012 | 2013 | 2012 | |||||||||||||
| Sales |
||||||||||||||||
| Trade |
$ | 604,821 | $ | 618,585 | $ | 1,196,142 | $ | 1,252,113 | ||||||||
| Related party |
16,843 | 19,255 | 32,540 | 30,573 | ||||||||||||
|
|
|
|
|
|
|
|
|
|||||||||
| 621,664 | 637,840 | 1,228,682 | 1,282,686 | |||||||||||||
|
|
|
|
|
|
|
|
|
|||||||||
| Costs and expenses |
||||||||||||||||
| Materials, labor, and other operating expenses (excluding depreciation) |
495,689 | 507,343 | 991,958 | 1,009,642 | ||||||||||||
| Fiber costs from related party |
5,319 | 4,466 | 11,465 | 9,412 | ||||||||||||
| Depreciation, amortization, and depletion |
43,891 | 37,303 | 87,319 | 74,859 | ||||||||||||
| Selling and distribution expenses |
33,764 | 30,568 | 62,613 | 61,210 | ||||||||||||
| General and administrative expenses |
19,693 | 20,035 | 38,616 | 40,043 | ||||||||||||
| Restructuring costs |
9,011 | — | 9,474 | — | ||||||||||||
| Other (income) expense, net |
1,930 | 381 | 1,798 | 81 | ||||||||||||
|
|
|
|
|
|
|
|
|
|||||||||
| 609,297 | 600,096 | 1,203,243 | 1,195,247 | |||||||||||||
|
|
|
|
|
|
|
|
|
|||||||||
| Income from operations |
12,367 | 37,744 | 25,439 | 87,439 | ||||||||||||
|
|
|
|
|
|
|
|
|
|||||||||
| Foreign exchange gain (loss) |
(415 | ) | 102 | (756 | ) | 259 | ||||||||||
| Interest expense |
(15,456 | ) | (15,433 | ) | (30,875 | ) | (30,798 | ) | ||||||||
| Interest income |
7 | 54 | 34 | 98 | ||||||||||||
|
|
|
|
|
|
|
|
|
|||||||||
| (15,864 | ) | (15,277 | ) | (31,597 | ) | (30,441 | ) | |||||||||
|
|
|
|
|
|
|
|
|
|||||||||
| Income (loss) before income taxes |
(3,497 | ) | 22,467 | (6,158 | ) | 56,998 | ||||||||||
| Income tax (provision) benefit |
1,289 | (8,805 | ) | 2,725 | (21,998 | ) | ||||||||||
|
|
|
|
|
|
|
|
|
|||||||||
| Net income (loss) |
$ | (2,208 | ) | $ | 13,662 | $ | (3,433 | ) | $ | 35,000 | ||||||
|
|
|
|
|
|
|
|
|
|||||||||
See accompanying condensed notes to unaudited quarterly consolidated financial statements.
6
BZ Intermediate Holdings LLC
Consolidated Statements of Comprehensive Income
(unaudited, dollars in thousands)
| Three Months Ended June 30 |
Six Months Ended June 30 |
|||||||||||||||
| 2013 | 2012 | 2013 | 2012 | |||||||||||||
| Net income (loss) |
$ | (2,208 | ) | $ | 13,662 | $ | (3,433 | ) | $ | 35,000 | ||||||
| Other comprehensive income (loss), net of tax |
||||||||||||||||
| Foreign currency translation adjustment, net of tax of $69, $0, $29, and $0, respectively |
(195 | ) | (2,307 | ) | (423 | ) | (1,452 | ) | ||||||||
| Cash flow hedges: |
||||||||||||||||
| Change in fair value, net of tax of ($671), $913, $367, and ($475), respectively |
(1,069 | ) | 1,459 | 587 | (756 | ) | ||||||||||
| (Gain) loss included in net income, net of tax of $64, $380, $2, and $891, respectively |
101 | 604 | 3 | 1,421 | ||||||||||||
| Amortization of actuarial loss and prior service cost for defined benefit pension plans, net of tax of $845, $993, $1,670, and $2,012, respectively |
1,349 | 1,585 | 2,665 | 3,210 | ||||||||||||
| Other, net of tax of ($14), ($2), ($29), and ($6), respectively |
(24 | ) | (5 | ) | (48 | ) | (10 | ) | ||||||||
|
|
|
|
|
|
|
|
|
|||||||||
| 162 | 1,336 | 2,784 | 2,413 | |||||||||||||
|
|
|
|
|
|
|
|
|
|||||||||
| Comprehensive income (loss) |
$ | (2,046 | ) | $ | 14,998 | $ | (649 | ) | $ | 37,413 | ||||||
|
|
|
|
|
|
|
|
|
|||||||||
See accompanying condensed notes to unaudited quarterly consolidated financial statements.
7
BZ Intermediate Holdings LLC
Consolidated Balance Sheets
(unaudited, dollars in thousands)
| June 30, 2013 | December 31, 2012 | |||||||
| ASSETS |
||||||||
| Current |
||||||||
| Cash and cash equivalents |
$ | 61,086 | $ | 49,707 | ||||
| Receivables |
||||||||
| Trade, less allowances of $1,349 and $1,382 |
254,348 | 240,459 | ||||||
| Other |
9,861 | 8,267 | ||||||
| Inventories |
288,707 | 294,484 | ||||||
| Deferred income taxes |
11,997 | 17,955 | ||||||
| Prepaid and other |
14,139 | 8,828 | ||||||
|
|
|
|
|
|||||
| 640,138 | 619,700 | |||||||
|
|
|
|
|
|||||
| Property |
||||||||
| Property and equipment, net |
1,212,663 | 1,223,001 | ||||||
| Fiber farms |
25,113 | 24,311 | ||||||
|
|
|
|
|
|||||
| 1,237,776 | 1,247,312 | |||||||
|
|
|
|
|
|||||
| Deferred financing costs |
24,380 | 26,677 | ||||||
| Goodwill |
160,132 | 160,130 | ||||||
| Intangible assets, net |
142,018 | 147,564 | ||||||
| Other assets |
6,629 | 7,029 | ||||||
|
|
|
|
|
|||||
| Total assets |
$ | 2,211,073 | $ | 2,208,412 | ||||
|
|
|
|
|
|||||
See accompanying condensed notes to unaudited quarterly consolidated financial statements.
8
BZ Intermediate Holdings LLC
Consolidated Balance Sheets (continued)
(unaudited, dollars in thousands)
| June 30, 2013 | December 31, 2012 | |||||||
| LIABILITIES AND CAPITAL |
||||||||
| Current |
||||||||
| Current portion of long-term debt |
$ | 15,000 | $ | 10,000 | ||||
| Accounts payable |
203,202 | 185,078 | ||||||
| Accrued liabilities |
||||||||
| Compensation and benefits |
65,386 | 70,950 | ||||||
| Interest payable |
10,529 | 10,516 | ||||||
| Other |
25,158 | 20,528 | ||||||
|
|
|
|
|
|||||
| 319,275 | 297,072 | |||||||
|
|
|
|
|
|||||
| Debt |
||||||||
| Long-term debt, less current portion |
760,000 | 770,000 | ||||||
|
|
|
|
|
|||||
| Other |
||||||||
| Deferred income taxes |
183,300 | 189,823 | ||||||
| Compensation and benefits |
116,153 | 121,682 | ||||||
| Other long-term liabilities |
74,040 | 73,152 | ||||||
|
|
|
|
|
|||||
| 373,493 | 384,657 | |||||||
|
|
|
|
|
|||||
| Commitments and contingent liabilities |
||||||||
| Capital |
||||||||
| Business unit equity |
856,825 | 857,987 | ||||||
| Accumulated other comprehensive income (loss) |
(98,520 | ) | (101,304 | ) | ||||
|
|
|
|
|
|||||
| 758,305 | 756,683 | |||||||
|
|
|
|
|
|||||
| Total liabilities and capital |
$ | 2,211,073 | $ | 2,208,412 | ||||
|
|
|
|
|
|||||
See accompanying condensed notes to unaudited quarterly consolidated financial statements.
9
BZ Intermediate Holdings LLC
Consolidated Statements of Cash Flows
(unaudited, dollars in thousands)
| Six Months Ended June 30 |
||||||||
| 2013 | 2012 | |||||||
| Cash provided by (used for) operations |
||||||||
| Net income (loss) |
$ | (3,433 | ) | $ | 35,000 | |||
| Items in net income (loss) not using (providing) cash |
||||||||
| Depreciation, depletion, and amortization of deferred financing costs and other |
89,793 | 77,190 | ||||||
| Share-based compensation expense |
3,076 | 2,729 | ||||||
| Pension expense |
3,020 | 5,474 | ||||||
| Deferred income taxes |
(2,624 | ) | 12,610 | |||||
| Restructuring costs |
9,992 | — | ||||||
| Other |
1,400 | (43 | ) | |||||
| Decrease (increase) in working capital |
||||||||
| Receivables |
(15,731 | ) | (12,050 | ) | ||||
| Inventories |
2,566 | (20,224 | ) | |||||
| Prepaid expenses |
(2,127 | ) | (4,869 | ) | ||||
| Accounts payable and accrued liabilities |
1,040 | (14,061 | ) | |||||
| Current and deferred income taxes |
(689 | ) | 7,452 | |||||
| Pension payments |
(5,091 | ) | (18,191 | ) | ||||
| Other |
404 | 2,110 | ||||||
|
|
|
|
|
|||||
| Cash provided by operations |
81,596 | 73,127 | ||||||
|
|
|
|
|
|||||
| Cash provided by (used for) investment |
||||||||
| Expenditures for property and equipment |
(64,595 | ) | (52,457 | ) | ||||
| Other |
690 | 586 | ||||||
|
|
|
|
|
|||||
| Cash used for investment |
(63,905 | ) | (51,871 | ) | ||||
|
|
|
|
|
|||||
| Cash provided by (used for) financing |
||||||||
| Payments of long-term debt |
(5,000 | ) | (5,000 | ) | ||||
| Payments (to) from Boise Inc., net |
(1,100 | ) | (52,440 | ) | ||||
| Other |
(212 | ) | (1,310 | ) | ||||
|
|
|
|
|
|||||
| Cash used for financing |
(6,312 | ) | (58,750 | ) | ||||
|
|
|
|
|
|||||
| Increase (decrease) in cash and cash equivalents |
11,379 | (37,494 | ) | |||||
| Balance at beginning of the period |
49,707 | 96,996 | ||||||
|
|
|
|
|
|||||
| Balance at end of the period |
$ | 61,086 | $ | 59,502 | ||||
|
|
|
|
|
|||||
See accompanying condensed notes to unaudited quarterly consolidated financial statements.
10
Condensed Notes to Unaudited Quarterly Consolidated Financial Statements
1. Nature of Operations and Basis of Presentation
Boise Inc. is a large, diverse manufacturer and seller of packaging and paper products. Our operations began in February 2008. We are headquartered in Boise, Idaho, and we operate largely in the United States but also have operations in Europe, Mexico, and Canada. We manufacture and sell corrugated containers and sheets, protective packaging products and papers associated with packaging, such as label and release papers, and newsprint. We manufacture linerboard, which when combined with corrugating medium is used in the manufacture of corrugated sheets and containers. The term containerboard is used to describe linerboard, corrugating medium, or a combination of the two. We also manufacture communication papers such as office papers, commercial printing papers, envelopes, and forms.
Our organizational structure is noted below:
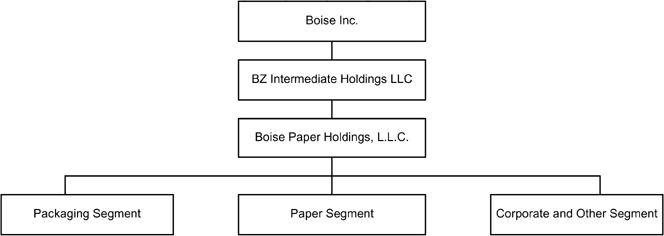
See Note 16, Segment Information, for additional information about our three reportable segments, Packaging, Paper, and Corporate and Other (support services).
The unaudited quarterly consolidated financial statements included herein are those of the following:
| • | Boise Inc. and its wholly owned subsidiaries, including BZ Intermediate Holdings LLC (BZ Intermediate). |
| • | BZ Intermediate and its wholly owned subsidiaries, including Boise Paper Holdings, L.L.C. (Boise Paper Holdings). |
In these unaudited quarterly consolidated financial statements, unless the context indicates otherwise, the terms “the Company,” “we,” “us,” “our,” or “Boise” refer to Boise Inc. and its consolidated subsidiaries, including BZ Intermediate. There are no significant differences between the results of operations, financial condition, and cash flows of Boise Inc. and those of BZ Intermediate other than income taxes and common stock activity. Some amounts in prior periods’ consolidated financial statements have been reclassified to conform with the current period’s presentation, none of which were considered material.
The quarterly consolidated financial statements presented have not been audited by an independent registered public accounting firm but, in the opinion of management, include all adjustments, consisting of normal, recurring adjustments, necessary to present fairly the results for the periods presented. The preparation of the consolidated financial statements involves the use of estimates and accruals. Actual results may vary from those estimates. Quarterly results are not necessarily indicative of results that may be expected for the full year. These condensed notes to unaudited quarterly consolidated financial statements should be read in conjunction with our 2012 Annual Report on Form 10-K, our Quarterly Reports on Form 10-Q, and the other reports we file with the Securities and Exchange Commission (SEC).
11
2. Restructuring Costs
2013 Restructuring Costs
In May 2013, we announced our decision to shut down two paper machines and an off-machine coater at our mill in International Falls, Minnesota. These closures, which we expect to occur in early fourth quarter 2013, will reduce our annual uncoated freesheet capacity by approximately 115,000 tons, or 9%. This decision will result in the loss of approximately 300 jobs. During the three months ended June 30, 2013, we recorded $13.3 million of pretax restructuring costs, of which $12.3 million was recorded in our Paper segment and related primarily to this decision. We recorded $1.0 million of costs in our Packaging segment related to restructuring activities in connection with our recently announced project to convert a machine at our DeRidder, Louisiana, mill to produce lightweight linerboard and corrugating medium. In addition to the amounts recorded in “Restructuring costs” on our Consolidated Statements of Operations, we recorded $4.0 million of other restructuring costs that related primarily to inventory write-downs in “Materials, labor, and other operating expenses (excluding depreciation)”, during the three and six months ended June 30, 2013.
During the three and six months ended June 30, 2013, we recognized $5.5 million and $10.8 million, respectively, of incremental depreciation expense related to shortening the useful lives of some of our assets, primarily at International Falls, Minnesota.
An analysis of the restructuring costs for the three and six months ended June 30, 2013, is as follows (in thousands):
| Noncash | Cash (a) | Total Costs | ||||||||||
| Employee-related and other costs |
$ | — | $ | 7,023 | $ | 7,023 | ||||||
| Inventory write-down |
3,960 | — | 3,960 | |||||||||
| Asset write-down |
2,016 | — | 2,016 | |||||||||
| Pension curtailment loss |
271 | — | 271 | |||||||||
|
|
|
|
|
|
|
|||||||
| $ | 6,247 | $ | 7,023 | $ | 13,270 | |||||||
|
|
|
|
|
|
|
|||||||
| (a) | These costs were recorded in “Accrued liabilities, Compensation and benefits” on our Consolidated Balance Sheet. We expect to pay most of these costs in the second half of 2013 and the remainder in the first half of 2014. In addition to the restructuring costs, above, we expect to incur approximately $0.9 million of additional employee-related and other costs in 2013 and 2014 that will be recognized as a period expense when incurred. |
2012 Restructuring Costs
In December 2012, we ceased paper production on our one remaining paper machine at our St. Helens, Oregon, paper mill. This reduced our annual uncoated freesheet capacity by almost 60,000 tons and resulted in the loss of approximately 100 jobs, primarily at the mill. During the three and six months ended June 30, 2012, St. Helens sales were $17.5 million and $35.6 million, respectively. The St. Helens operations had an insignificant impact on income during those periods. Accrued severance costs at January 1, 2013, were approximately $5.1 million, and we have paid all but an insignificant amount as of June 30, 2013. For more information, see Note 3, St. Helens Charges, of the Notes to Consolidated Financial Statements in “Part II, Item 8. Financial Statements and Supplementary Data” in our 2012 Form 10-K.
12
3. Net Income (Loss) Per Common Share
Net income (loss) per common share is computed by dividing net income (loss) by the weighted average number of shares of common stock outstanding during the period. Net income (loss) per common share is not applicable to BZ Intermediate because it does not have common shares. Boise Inc.’s basic and diluted net income (loss) per share is calculated as follows (dollars and shares in thousands, except per-share data):
| Three Months Ended June 30 |
Six Months Ended June 30 |
|||||||||||||||
| 2013 | 2012 | 2013 | 2012 | |||||||||||||
| Net income (loss) |
$ | (2,208 | ) | $ | 13,662 | $ | (3,433 | ) | $ | 35,000 | ||||||
| Weighted average number of common shares for basic net income (loss) per common share |
100,531 | 100,116 | 100,387 | 99,584 | ||||||||||||
| Incremental effect of dilutive common stock equivalents (a): |
||||||||||||||||
| Restricted stock and restricted stock units |
— | 680 | — | 1,362 | ||||||||||||
| RONOA performance awards |
— | 211 | — | 235 | ||||||||||||
| Total Stockholder Return (TSR) market-condition awards |
— | — | — | — | ||||||||||||
| Stock options |
— | 1 | — | 1 | ||||||||||||
|
|
|
|
|
|
|
|
|
|||||||||
| Weighted average number of common shares for diluted net income (loss) per common share |
100,531 | 101,008 | 100,387 | 101,182 | ||||||||||||
|
|
|
|
|
|
|
|
|
|||||||||
| Net income (loss) per common share: |
||||||||||||||||
| Basic |
$ | (0.02 | ) | $ | 0.14 | $ | (0.03 | ) | $ | 0.35 | ||||||
|
|
|
|
|
|
|
|
|
|||||||||
| Diluted |
$ | (0.02 | ) | $ | 0.14 | $ | (0.03 | ) | $ | 0.35 | ||||||
|
|
|
|
|
|
|
|
|
|||||||||
| (a) | During the three and six months ended June 30, 2013, we excluded a weighted average 0.8 million and 1.0 million potentially dilutive shares, respectively, from the diluted net income (loss) per share calculation as they would have been antidilutive or were out-of-the-money. During the three and six months ended June 30, 2012, we excluded 0.8 million and 0.3 million potentially dilutive shares, respectively, as they would have been antidilutive or were out-of-the-money. |
4. Income Taxes
For the three and six months ended June 30, 2013, we recorded $1.3 million and $2.7 million of income tax benefit and had an effective tax rate of 36.9% and 44.3%, respectively. During the three and six months ended June 30, 2013, the primary reason for the difference from the federal statutory income tax rate of 35% was the effect of lower income from operations, discrete items, and the effect of state taxes.
For the three and six months ended June 30, 2012, we recorded $8.8 million and $22.0 million of income tax expense and had an effective tax rate of 39.2% and 38.6%, respectively. During the three and six months ended June 30, 2012, the primary reason for the difference from the federal statutory income tax rate of 35% was the effect of state taxes.
Uncertain Income Tax Positions
We recognize tax liabilities and adjust these liabilities when our judgment changes as a result of the evaluation of new information not previously available or as new uncertainties occur. We recognize interest and penalties related to uncertain tax positions as income tax expense in the Consolidated Statements of Operations. Interest expense and penalties relating to uncertain tax positions were nominal for all periods presented. During the three and six months ended June 30, 2013, there were no significant changes to our uncertain tax positions. For more information, see Note 6, Income Taxes, of the Notes to Consolidated Financial Statements in “Part II, Item 8. Financial Statements and Supplementary Data” in our 2012 Form 10-K.
As of June 30, 2013, we had not recognized U.S. deferred income taxes on our cumulative total of undistributed earnings for non-U.S. subsidiaries. Determining the unrecognized deferred tax liability related to investments in these non-U.S. subsidiaries that are indefinitely reinvested is not practicable. We currently intend to indefinitely reinvest those earnings in operations outside the United States.
13
During the six months ended June 30, 2013, cash paid for taxes, net of refunds received, was $0.2 million. Refunds received, net of cash paid for taxes, were $0.7 million during the six months ended June 30, 2012.
5. Goodwill and Intangible Assets
Goodwill
Goodwill represents the excess of the cost of an acquired business over the fair value of the identifiable tangible and intangible assets acquired and liabilities assumed in a business combination. All of our goodwill is recorded in our Packaging segment. At both June 30, 2013, and December 31, 2012, the carrying amount of goodwill was $160.1 million. Goodwill is affected by foreign currency translation.
Intangible Assets
Intangible assets consist of customer relationships, trademarks and trade names, technology, and noncompete agreements. We had $142.0 million and $147.6 million of intangible assets at June 30, 2013, and December 31, 2012, net of $30.8 million and $26.3 million of accumulated amortization, respectively. During the three months ended June 30, 2013 and 2012, we recorded intangible asset amortization of $2.5 million and $3.0 million, respectively. During the six months ended June 30, 2013 and 2012, we recorded intangible asset amortization of $5.3 million and $6.3 million, respectively. Foreign intangible assets are affected by foreign currency translation.
6. Debt
At June 30, 2013, and December 31, 2012, our long-term debt and the interest rates on that debt were as follows (dollars in thousands):
| June 30, 2013 | December 31, 2012 | |||||||||||||||
| Amount | Interest Rate | Amount | Interest Rate | |||||||||||||
| Revolving credit facility, due 2016 |
$ | — | — | % | $ | 5,000 | 2.21 | % | ||||||||
| Tranche A term loan, due 2016 |
175,000 | 2.20 | 175,000 | 2.22 | ||||||||||||
| 9% senior notes, due 2017 |
300,000 | 9.00 | 300,000 | 9.00 | ||||||||||||
| 8% senior notes, due 2020 |
300,000 | 8.00 | 300,000 | 8.00 | ||||||||||||
|
|
|
|
|
|||||||||||||
| Long-term debt |
775,000 | 7.08 | 780,000 | 7.05 | ||||||||||||
| Current portion of long-term debt |
(15,000 | ) | 2.20 | (10,000 | ) | 2.22 | ||||||||||
|
|
|
|
|
|||||||||||||
| Long-term debt, less current portion |
$ | 760,000 | 7.17 | % | $ | 770,000 | 7.11 | % | ||||||||
|
|
|
|
|
|||||||||||||
As of June 30, 2013, our debt consisted of the following:
| • | The Revolving Credit Facility: A five-year nonamortizing $500 million senior secured revolving credit facility with variable annual interest. In addition to paying interest, we pay an annual commitment fee for undrawn amounts at a rate of either 0.35% or 0.50% depending on our total leverage ratio. |
| • | The Tranche A Term Loan Facility (Term Loan Facility): A five-year amortizing $200 million senior secured loan facility with variable annual interest. |
| • | The 9% Senior Notes: An eight-year nonamortizing $300 million senior unsecured debt obligation with fixed annual interest of 9%. |
| • | The 8% Senior Notes: A ten-year nonamortizing $300 million senior unsecured debt obligation with fixed annual interest of 8%. |
Under our Credit Facilities (the Revolving Credit Facility together with the Term Loan Facility) we elect whether interest on our Term Loan and, separately, interest under any Revolving Credit Facility is based on an alternative base rate or the London Interbank Offered Rate (LIBOR), plus an applicable spread based on our total leverage ratio. Our total leverage ratio is essentially our total net debt divided by our trailing four quarters of Adjusted Consolidated EBITDA (as defined in the Credit Agreement). Based on our current one-month LIBOR election, at June 30, 2013, the interest rate on our Credit Facilities was LIBOR plus 200 basis points, and we pay interest on the Credit Facilities monthly in arrears.
14
At June 30, 2013, we had no borrowings outstanding under our Revolving Credit Facility and had availability of $493.0 million, which is net of outstanding letters of credit of $7.0 million. The maximum borrowings under our Revolving Credit Facility for the six months ended June 30, 2013, was $5.0 million, and the weighted average was $0.7 million. For the six months ended June 30, 2013, the average interest rate for our outstanding borrowings under our Revolving Credit Facility was 2.21%.
The Credit Facilities and Senior Note indentures contain certain restrictions relating to dividend payments, capital expenditures, financial ratios, guarantees, and the incurrence of additional indebtedness, which are discussed in Note 8, Debt, of the Notes to Consolidated Financial Statements in “Part II, Item 8. Financial Statements and Supplementary Data” in our 2012 Form 10-K. Under our Credit Facilities and the indentures governing our Senior Notes, a dividend may be paid if it does not exceed our permitted restricted payment amount, which is calculated as the sum of 50% of our net income for distributions, together with other amounts as specified in the Credit Facilities and indentures. At June 30, 2013, the available restricted payment amount under our 8% Senior Notes indenture, which is more restrictive than our Credit Agreement and our 9% Senior Notes indenture, was approximately $108.3 million. To the extent we do not have adequate surplus or net profits, or available restricted payment amounts, we will be prohibited from paying dividends.
The Credit Facilities require the proceeds from asset sales, subject to specified exceptions and casualty insurance, be used to pay down outstanding borrowings.
As of June 30, 2013, required debt principal repayments were as follows (dollars in thousands):
| Remaining | ||||||||||||||||||||||||
| 2013 | 2014 | 2015 | 2016 | 2017 | Thereafter | |||||||||||||||||||
| Required debt principal repayments |
$ | 5,000 | $ | 20,000 | $ | 30,000 | $ | 120,000 | $ | 300,000 | $ | 300,000 | ||||||||||||
For the six months ended June 30, 2013 and 2012, cash payments for interest were $28.4 million and $28.7 million, respectively.
With the exception of the Credit Facilities, our debt is fixed-rate debt. At June 30, 2013, the book value of our fixed-rate debt was $600.0 million, and the fair value was estimated to be $637.9 million. The difference between the book value and fair value is due to the difference between the period-end market interest rate and the stated rate of our fixed-rate, long-term debt. We estimated the fair value of our fixed-rate debt using quoted market prices (Level 1 inputs), discussed further in Note 7, Financial Instruments.
7. Financial Instruments
Our primary objective in holding derivative financial instruments is to manage cash flow risk. We do not use derivative instruments for speculative purposes.
We enter into transactions to hedge the variable cash flow risk of natural gas purchases. At June 30, 2013, these derivatives included caps and call spreads, which we account for as economic hedges, and swaps, which are designated and accounted for as cash flow hedges. As of June 30, 2013, we had entered into derivative instruments related to the following approximate percentages of our forecasted natural gas purchases:
| July 2013 Through October 2013 |
November 2013 Through March 2014 |
April 2014 Through October 2014 |
November 2014 Through March 2015 |
April 2015 Through October 2015 |
November 2015 Through March 2016 |
April 2016 Through October 2016 |
||||||||||||||||||||||
| Approximate percent hedged |
79 | % | 58 | % | 50 | % | 43 | % | 37 | % | 15 | % | 21 | % | ||||||||||||||
15
Economic Hedges
For derivative instruments that are not designated as cash flow hedges for accounting purposes, the gain or loss on the derivatives is recognized in “Materials, labor, and other operating expenses (excluding depreciation)” in the Consolidated Statements of Operations. During the three and six months ended June 30, 2013 and 2012, we recognized an insignificant amount of expense and/or income related to natural gas contracts we account for as economic hedges.
Cash Flow Hedges
For derivative instruments that are designated and qualify as cash flow hedges, the effective portion of the gain or loss on the derivative is reported as a component of “Accumulated other comprehensive income (loss)” on our Consolidated Balance Sheets and is recognized in “Materials, labor, and other operating expenses (excluding depreciation)” in our Consolidated Statements of Operations in the period in which the hedged transaction affects earnings. Financial instruments designated as cash flow hedges are assessed both at inception and quarterly thereafter to ensure they are effective in offsetting changes in the cash flows of the related underlying exposures. The fair value of the instruments is reclassified out of accumulated other comprehensive income (loss) to earnings if the hedge ceases to be highly effective or if the hedged transaction is no longer probable. At June 30, 2013, and December 31, 2012, we had $0.6 million and $1.2 million of losses, respectively, net of tax, recorded in “Accumulated other comprehensive income (loss)” on our Consolidated Balance Sheets related to our natural gas contracts.
The effects of our cash flow hedging instruments on our Consolidated Balance Sheets and Consolidated Statements of Operations were as follows (dollars in thousands):
| (Gain) Loss Recognized in Accumulated Other Comprehensive Income |
Loss Reclassified From Accumulated Other Comprehensive Income Into Earnings |
|||||||||||||||||||||||||||||||
| Three Months Ended June 30 |
Six Months Ended June 30 |
Three Months Ended June 30 |
Six Months Ended June 30 |
|||||||||||||||||||||||||||||
| 2013 (a) | 2012 | 2013 | 2012 | 2013 | 2012 | 2013 | 2012 | |||||||||||||||||||||||||
| Natural gas contracts |
$ | 1,740 | $ | (2,372 | ) | $ | (954 | ) | $ | 1,231 | $ | 165 | $ | 984 | $ | 5 | $ | 2,312 | ||||||||||||||
| (a) | Based on June 30, 2013, pricing, the estimated income, net of tax, to be recognized in earnings during the next 12 months is $0.6 million. |
Fair Value Measurements
The Financial Accounting Standards Board (FASB) Accounting Standards Codification (ASC) establishes a fair value hierarchy, which prioritizes the inputs of valuation techniques used to measure fair value into three levels. The fair value hierarchy gives the highest priority to quoted market prices (Level 1) and the lowest priority to unobservable inputs (Level 3). Where applicable, we use quoted prices in active markets for identical assets or liabilities to determine fair value (Level 1). If quoted prices in active markets for identical assets or liabilities are not available to determine fair value, we use quoted prices for similar assets and liabilities or inputs that are observable either directly or indirectly (Level 2). If quoted prices for identical or similar assets are not available or are unobservable, we may use internally developed valuation models, whose inputs include bid prices and third-party valuations utilizing underlying asset assumptions (Level 3). Outstanding financial derivative instruments expose us to credit loss in the event of nonperformance by the counterparties to the agreements. We monitor credit ratings of counterparties to the agreements, which are large financial institutions, to consider the impact, if any, on the determination of fair value. No significant adjustments were made in any periods presented.
Fair Values of Derivative Instruments
At June 30, 2013, and December 31, 2012, the fair value of our financial instruments was determined based on New York Mercantile Exchange (NYMEX) price quotations under the terms of the contracts, using current market information as of the reporting date. The derivatives were valued by us using third-party valuations based on quoted prices for similar assets and liabilities. Accordingly, all of our fair value measurements use Level 2 inputs.
16
We offset asset and liability balances, by counterparty, where legal right of offset exists. Our derivative contracts provide for netting of like transactions in the event a counterparty defaults or upon termination. No collateral was received or pledged in connection with these agreements. The following table presents the fair value of these instruments at June 30, 2013, and December 31, 2012 (dollars in thousands):
| Gross Amounts of Recognized Liabilities |
Gross Amounts Offset in the Consolidated Balance Sheets |
Net Amounts of Liabilities Presented in the Consolidated Balance Sheets |
||||||||||
| June 30, 2013 | ||||||||||||
| Instruments in a net liability position, by counterparty (a) |
||||||||||||
| Cash flow hedges |
$ | (1,510 | ) | $ | 103 | $ | (1,407 | ) | ||||
| Economic hedges |
(2,457 | ) | 352 | (2,105 | ) | |||||||
|
|
|
|
|
|
|
|||||||
| Total |
$ | (3,967 | ) | $ | 455 | $ | (3,512 | ) | ||||
|
|
|
|
|
|
|
|||||||
| December 31, 2012 | ||||||||||||
| Instruments in a net liability position, by counterparty (a) |
||||||||||||
| Cash flow hedges |
$ | (2,568 | ) | $ | 203 | $ | (2,365 | ) | ||||
| Economic hedges |
(2,582 | ) | 385 | (2,197 | ) | |||||||
|
|
|
|
|
|
|
|||||||
| Total |
$ | (5,150 | ) | $ | 588 | $ | (4,562 | ) | ||||
|
|
|
|
|
|
|
|||||||
| (a) | At June 30, 2013, $1.9 million was recorded in “Accrued liabilities, Other” and $1.6 million was recorded in “Other long-term liabilities.” At December 31, 2012, amounts were $4.1 million and $0.5 million, respectively. |
8. Retirement and Benefit Plans
The components of net periodic benefit cost are as follows (dollars in thousands):
| Three Months Ended June 30 |
Six Months Ended June 30 |
|||||||||||||||
| 2013 | 2012 | 2013 | 2012 | |||||||||||||
| Service cost |
$ | 558 | $ | 705 | $ | 1,131 | $ | 1,440 | ||||||||
| Interest cost |
5,957 | 6,157 | 11,936 | 12,325 | ||||||||||||
| Expected return on plan assets |
(7,308 | ) | (6,803 | ) | (14,653 | ) | (13,579 | ) | ||||||||
| Amortization of actuarial loss |
2,194 | 2,576 | 4,335 | 5,217 | ||||||||||||
| Amortization of prior service costs and other |
— | 2 | — | 5 | ||||||||||||
| Curtailment loss |
271 | 66 | 271 | 66 | ||||||||||||
|
|
|
|
|
|
|
|
|
|||||||||
| Net periodic benefit cost |
$ | 1,672 | $ | 2,703 | $ | 3,020 | $ | 5,474 | ||||||||
|
|
|
|
|
|
|
|
|
|||||||||
Our funding practice for our pension plans is to contribute amounts sufficient to meet legal funding requirements, plus any additional amounts that we determine to be appropriate considering the funded status of the plans, tax deductibility, our cash flows from operations, and other factors.
9. Share-Based Compensation
Our shareholders have approved the Boise Inc. Incentive and Performance Plan (the Plan), which authorizes awards of share-based compensation, such as restricted stock, restricted stock units, performance units payable in stock, and stock options. These awards are at the discretion of the Compensation Committee of our board of directors, and they vest and expire in accordance with terms established at the time of grant. Most awards under the Plan are eligible to participate in dividend or dividend equivalent payments, if any, which we accrue to be paid when the awards vest.
Shares issued pursuant to awards under the Plan are from our authorized but unissued shares or from treasury shares. The maximum number of shares approved for grant under the Plan is 17.2 million shares. As of June 30, 2013, 7.8 million shares remained available for future issuance under the Plan. Share-based compensation costs in BZ Intermediate’s financial statements represent expenses for restricted stock, restricted
17
stock units, stock options, and performance units of Boise Inc., which have been pushed down to BZ Intermediate for accounting purposes. Additional information regarding the Plan and awards can be found in Note 11, Share-Based Compensation, of the Notes to Consolidated Financial Statements in “Part II, Item 8. Financial Statements and Supplementary Data” in our 2012 Form 10-K.
Restricted Stock and Performance Units
Members of management and our directors have been granted restricted stock and restricted stock units (collectively restricted stock), the majority of which are subject to an EBITDA (earnings before interest, taxes, and depreciation, amortization, and depletion) goal and all of which are subject to service-based vesting restrictions. These awards generally vest over a three-year period. The fair values of our restricted stock awards were based on the closing market price of our common stock on the date of grant, and compensation expense is recorded over the awards’ vesting period.
Members of management have been granted performance units, with some measured based on our return on net operating assets (RONOA) and others based on our comparative total stockholder return (TSR awards). The number of RONOA performance units awarded is subject to adjustment based on the two-year average RONOA. Because the RONOA component contains a performance condition, we record compensation expense, net of estimated forfeitures, over the requisite service period based on the most probable number of awards expected to vest. Any shares not vested are forfeited. The fair values of the RONOA performance units were based on the closing market price of our common stock on the date of grant, and compensation expense is recorded over the awards’ vesting period.
Market-condition awards, or TSR awards, have been granted to members of management. Each TSR award reflects a target number of shares that may be issued to the award recipient. The actual number of shares the recipient receives is determined at the end of a three-year performance period based on total stockholder return relative to a set of comparator companies. Market-condition awards represent a more difficult threshold to meet before payout, with greater uncertainty that the market condition will be satisfied; therefore, these awards have a lower fair value than those that vest based primarily on the passage of time. Compensation expense is required to be recognized for these awards regardless of when, if ever, the market condition is satisfied. Compensation expense is recorded over the awards’ vesting period.
The following table presents the range of assumptions used to calculate, using a Monte Carlo simulation, the fair value of the TSR awards granted during the six months ended June 30, 2013:
| Expected volatility |
43.79% - 44.62% | |||
| Stock price on grant date |
$8.63 - $8.87 | |||
| Risk-free interest rate |
0.37% - 0.39% | |||
| Expected term (years) |
2.5 - 2.8 | |||
| Expected dividend yield |
—% - —% |
18
The following table presents restricted stock, RONOA performance award, and TSR award activity for the six months ended June 30, 2013 (shares in thousands):
| Restricted Stock | RONOA Performance Awards |
TSR Market-Condition Awards |
||||||||||||||||||||||
| Nonvested Shares |
Weighted Average Grant-Date Fair Value |
Nonvested Shares |
Weighted Average Grant-Date Fair Value |
Nonvested Shares |
Weighted Average Grant-Date Fair Value |
|||||||||||||||||||
| Outstanding at December 31, 2012 (a) |
636 | $ | 6.66 | 489 | $ | 7.90 | — | $ | — | |||||||||||||||
| Granted |
422 | 8.61 | 264 | 8.69 | 236 | 8.54 | ||||||||||||||||||
| Vested |
(231 | ) | 8.52 | (93 | ) | 8.53 | — | — | ||||||||||||||||
| Forfeited |
(8 | ) | 8.48 | (4 | ) | 8.50 | — | — | ||||||||||||||||
|
|
|
|
|
|
|
|
|
|
|
|
|
|||||||||||||
| Outstanding at June 30, 2013 (a) |
819 | $ | 7.12 | 656 | $ | 8.13 | 236 | $ | 8.54 | |||||||||||||||
|
|
|
|
|
|
|
|
|
|
|
|
|
|||||||||||||
| (a) | Outstanding awards include all nonvested and nonforfeited awards. |
Stock Options
In 2012 and 2011, we granted nonqualified stock options to members of management. The stock options generally vest and become exercisable over three years. Our stock options generally have a contractual term of ten years, meaning the option must be exercised by the holder before the tenth anniversary of the grant date. No options were granted during the six months ended June 30, 2013.
The following is a summary of our stock option activity (number of options and aggregate intrinsic value in thousands):
| Options | Weighted Average Exercise Price |
Weighted Average Remaining Life (in years) |
Aggregate Intrinsic Value |
|||||||||||||
| Outstanding at December 31, 2012 |
841 | $ | 8.34 | |||||||||||||
| Exercised |
— | — | ||||||||||||||
| Forfeited |
— | — | ||||||||||||||
|
|
|
|
|
|
|
|
|
|||||||||
| Outstanding at June 30, 2013 |
841 | $ | 8.34 | 8.3 | $ | 169 | ||||||||||
|
|
|
|
|
|
|
|
|
|||||||||
| Exercisable at June 30, 2013 |
335 | $ | 8.37 | 8.2 | $ | 57 | ||||||||||
|
|
|
|
|
|
|
|
|
|||||||||
| Vested and expected to vest at June 30, 2013 |
825 | $ | 8.34 | 8.3 | $ | 165 | ||||||||||
|
|
|
|
|
|
|
|
|
|||||||||
Compensation Expense
Most of our share-based compensation expense was recorded in “General and administrative expenses” in our Consolidated Statements of Operations. Total recognized share-based compensation expense, net of estimated forfeitures, is as follows (dollars in thousands):
| Three Months Ended June 30 |
Six Months Ended June 30 |
|||||||||||||||
| 2013 | 2012 | 2013 | 2012 | |||||||||||||
| Restricted stock |
$ | 828 | $ | 771 | $ | 1,277 | $ | 1,604 | ||||||||
| RONOA performance awards |
500 | 462 | 972 | 705 | ||||||||||||
| TSR market-condition awards |
153 | — | 180 | — | ||||||||||||
| Stock options |
271 | 262 | 647 | 420 | ||||||||||||
|
|
|
|
|
|
|
|
|
|||||||||
| Total share-based compensation expense |
$ | 1,752 | $ | 1,495 | $ | 3,076 | $ | 2,729 | ||||||||
|
|
|
|
|
|
|
|
|
|||||||||
19
The unrecognized compensation expense for all share-based awards at June 30, 2013, is as follows (dollars in thousands):
| Unrecognized Compensation Expense |
Remaining Weighted Average Recognition Period (in years) |
|||||||
| Restricted stock |
$ | 4,306 | 2.0 | |||||
| RONOA performance awards |
3,140 | 1.8 | ||||||
| TSR market-condition awards |
1,685 | 2.7 | ||||||
| Stock options |
1,394 | 1.5 | ||||||
|
|
|
|||||||
| Total unrecognized share-based compensation expense |
$ | 10,525 | 2.0 | |||||
|
|
|
|||||||
10. Stockholders’ Equity
The following tables detail the changes in accumulated other comprehensive income (loss), net of tax, for the three and six months ended June 30, 2013 and 2012, respectively.
20
| Changes in Accumulated Other Comprehensive Income (Loss) | ||||||||||||||||||||
| Three Months Ended June 30, 2013 | ||||||||||||||||||||
| Foreign Currency Translation Adjustments |
Effective Portion of Cash Flow Hedges |
Pension Benefits | Other | Total | ||||||||||||||||
| Beginning balance |
$ | (530 | ) | $ | 328 | $ | (98,792 | ) | $ | 312 | $ | (98,682 | ) | |||||||
| Other comprehensive income (loss) before reclassification, net of tax |
(195 | ) | (1,069 | ) | — | — | (1,264 | ) | ||||||||||||
| Amounts reclassified from accumulated other comprehensive income, net of tax |
— | 101 | 1,349 | (24 | ) | 1,426 | ||||||||||||||
|
|
|
|
|
|
|
|
|
|
|
|||||||||||
| Ending balance |
$ | (725 | ) | $ | (640 | ) | $ | (97,443 | ) | $ | 288 | $ | (98,520 | ) | ||||||
|
|
|
|
|
|
|
|
|
|
|
|||||||||||
| Changes in Accumulated Other Comprehensive Income (Loss) | ||||||||||||||||||||
| Three Months Ended June 30, 2012 | ||||||||||||||||||||
| Foreign Currency Translation Adjustments |
Effective Portion of Cash Flow Hedges |
Pension Benefits | Other | Total | ||||||||||||||||
| Beginning balance |
$ | 503 | $ | (5,100 | ) | $ | (116,516 | ) | $ | 228 | $ | (120,885 | ) | |||||||
| Other comprehensive income (loss) before reclassification, net of tax |
(2,307 | ) | 1,459 | — | — | (848 | ) | |||||||||||||
| Amounts reclassified from accumulated other comprehensive income, net of tax |
— | 604 | 1,585 | (5 | ) | 2,184 | ||||||||||||||
|
|
|
|
|
|
|
|
|
|
|
|||||||||||
| Ending balance |
$ | (1,804 | ) | $ | (3,037 | ) | $ | (114,931 | ) | $ | 223 | $ | (119,549 | ) | ||||||
|
|
|
|
|
|
|
|
|
|
|
|||||||||||
| Changes in Accumulated Other Comprehensive Income (Loss) | ||||||||||||||||||||
| Six Months Ended June 30, 2013 | ||||||||||||||||||||
| Foreign Currency Translation Adjustments |
Effective Portion of Cash Flow Hedges |
Pension Benefits | Other | Total | ||||||||||||||||
| Beginning balance |
$ | (302 | ) | $ | (1,230 | ) | $ | (100,108 | ) | $ | 336 | $ | (101,304 | ) | ||||||
| Other comprehensive income (loss) before reclassification, net of tax |
(423 | ) | 587 | — | — | 164 | ||||||||||||||
| Amounts reclassified from accumulated other comprehensive income, net of tax |
— | 3 | 2,665 | (48 | ) | 2,620 | ||||||||||||||
|
|
|
|
|
|
|
|
|
|
|
|||||||||||
| Ending balance |
$ | (725 | ) | $ | (640 | ) | $ | (97,443 | ) | $ | 288 | $ | (98,520 | ) | ||||||
|
|
|
|
|
|
|
|
|
|
|
|||||||||||
| Changes in Accumulated Other Comprehensive Income (Loss) | ||||||||||||||||||||
| Six Months Ended June 30, 2012 | ||||||||||||||||||||
| Foreign Currency Translation Adjustments |
Effective Portion of Cash Flow Hedges |
Pension Benefits | Other | Total | ||||||||||||||||
| Beginning balance |
$ | (352 | ) | $ | (3,702 | ) | $ | (118,141 | ) | $ | 233 | $ | (121,962 | ) | ||||||
| Other comprehensive income (loss) before reclassification, net of tax |
(1,452 | ) | (756 | ) | — | — | (2,208 | ) | ||||||||||||
| Amounts reclassified from accumulated other comprehensive income, net of tax |
— | 1,421 | 3,210 | (10 | ) | 4,621 | ||||||||||||||
|
|
|
|
|
|
|
|
|
|
|
|||||||||||
| Ending balance |
$ | (1,804 | ) | $ | (3,037 | ) | $ | (114,931 | ) | $ | 223 | $ | (119,549 | ) | ||||||
|
|
|
|
|
|
|
|
|
|
|
|||||||||||
21
| Reclassifications Out of Accumulated Other Comprehensive Income |
||||||||||||||||
| Three Months Ended June 30 |
Six Months Ended June 30 |
|||||||||||||||
| 2013 | 2012 | 2013 | 2012 | |||||||||||||
| (Gains) losses on cash flow hedges |
||||||||||||||||
| Natural gas contracts (a) |
$ | 165 | $ | 984 | $ | 5 | $ | 2,312 | ||||||||
| Tax benefit |
(64 | ) | (380 | ) | (2 | ) | (891 | ) | ||||||||
|
|
|
|
|
|
|
|
|
|||||||||
| Net of tax |
$ | 101 | $ | 604 | $ | 3 | $ | 1,421 | ||||||||
|
|
|
|
|
|
|
|
|
|||||||||
| Pension benefits |
||||||||||||||||
| Amortization of prior service cost |
$ | — | $ | 2 | $ | — | $ | 5 | ||||||||
| Amortization of actuarial loss |
2,194 | 2,576 | 4,335 | 5,217 | ||||||||||||
|
|
|
|
|
|
|
|
|
|||||||||
| Total before tax (b) |
2,194 | 2,578 | 4,335 | 5,222 | ||||||||||||
| Tax benefit |
(845 | ) | (993 | ) | (1,670 | ) | (2,012 | ) | ||||||||
|
|
|
|
|
|
|
|
|
|||||||||
| Net of tax |
$ | 1,349 | $ | 1,585 | $ | 2,665 | $ | 3,210 | ||||||||
|
|
|
|
|
|
|
|
|
|||||||||
| Other |
$ | (38 | ) | $ | (7 | ) | $ | (77 | ) | $ | (16 | ) | ||||
| Tax expense |
14 | 2 | 29 | 6 | ||||||||||||
|
|
|
|
|
|
|
|
|
|||||||||
| Net of tax |
$ | (24 | ) | $ | (5 | ) | $ | (48 | ) | $ | (10 | ) | ||||
|
|
|
|
|
|
|
|
|
|||||||||
| (a) | Amounts are recorded in “Materials, labor and other operating expenses (excluding depreciation)” in our Consolidated Statements of Operations. |
| (b) | Amounts are included in the computation of net periodic pension cost. For additional information, see Note 8, Retirement and Benefit Plans. |
11. Inventories
The majority of our inventories are valued at the lower of cost or market, where cost is based on the average cost method of inventory valuation. Manufactured inventories include costs for materials, labor, and factory overhead. Other inventories are valued at the lower of either standard cost, which approximates cost based on the actual first-in, first-out usage pattern, or market.
Inventories included the following (dollars in thousands):
| June 30, 2013 | December 31, 2012 | |||||||
| Finished goods |
$ | 152,829 | $ | 150,496 | ||||
| Work in process |
43,096 | 41,575 | ||||||
| Fiber |
27,600 | 35,840 | ||||||
| Other raw materials and supplies |
65,182 | 66,573 | ||||||
|
|
|
|
|
|||||
| $ | 288,707 | $ | 294,484 | |||||
|
|
|
|
|
|||||
22
12. Property and Equipment
Property and equipment consisted of the following asset classes (dollars in thousands):
| June 30, 2013 | December 31, 2012 | |||||||
| Land |
$ | 28,842 | $ | 28,899 | ||||
| Buildings and improvements |
266,628 | 260,607 | ||||||
| Machinery and equipment |
1,515,468 | 1,479,212 | ||||||
| Construction in progress |
68,430 | 46,538 | ||||||
|
|
|
|
|
|||||
| 1,879,368 | 1,815,256 | |||||||
| Less accumulated depreciation |
(666,705 | ) | (592,255 | ) | ||||
|
|
|
|
|
|||||
| $ | 1,212,663 | $ | 1,223,001 | |||||
|
|
|
|
|
|||||
Depreciation expense for the three months ended June 30, 2013 and 2012, was $39.5 million and $32.8 million, respectively. During the six months ended June 30, 2013 and 2012, depreciation expense was $78.1 million and $65.4 million, respectively. We periodically assess the estimated useful lives of our assets. Changes in circumstances, such as changes to our operational or capital strategy, changes in regulations, or technological advances, may result in the actual useful lives differing from our estimates. Revisions to the estimated useful lives of assets requires judgment and constitutes a change in accounting estimate, which is accounted for prospectively by adjusting or accelerating depreciation and amortization rates. During the three and six months ended June 30, 2013, we recognized $5.5 million and $10.8 million, respectively, of incremental depreciation expense related to shortening the useful lives of some of our assets, primarily at International Falls, Minnesota. See Note 2, Restructuring Costs, for more information.
At June 30, 2013 and December 31, 2012, purchases of property and equipment included in accounts payable were $20.2 million and $10.8 million, respectively.
13. Leases
We lease some of our facilities, as well as other property and equipment, under operating leases. For purposes of determining straight-line rent expense, the lease term is calculated from the date of possession of the facility, including any periods of free rent and any renewal option periods that are reasonably assured of being exercised. Straight-line rent expense is also adjusted to reflect any allowances or reimbursements provided by the lessor. Rental expense for operating leases was $7.3 million and $7.7 million for the three months ended June 30, 2013 and 2012, respectively. During the six months ended June 30, 2013 and 2012, rental expense was $14.2 million and $14.7 million, respectively. Sublease rental income was not material in any of the periods presented.
14. Concentrations of Risk
Business
Our largest customer is OfficeMax Incorporated (OfficeMax). Although we expect our long-term business relationship with OfficeMax to continue, the relationship exposes us to a significant concentration of business and financial risk. Sales to OfficeMax were $117.3 million and $121.9 million, respectively, during the three months ended June 30, 2013 and 2012, representing 19% of total sales for both periods. Sales to OfficeMax were $235.1 million and $251.9 million, respectively, during the six months ended June 30, 2013 and 2012, representing 19% and 20% of total sales for those periods. At June 30, 2013, and December 31, 2012, we had $38.8 million and $39.5 million, respectively, of accounts receivable due from OfficeMax, which represented 15% and 16%, respectively, of our total company receivables.
In July 2013, OfficeMax and Office Depot shareholders voted in favor of merging the two companies. Our paper purchase agreement with OfficeMax provides that it would survive the merger with respect to the office paper requirements of the legacy OfficeMax business. We cannot predict how the merger, if finalized, would affect the financial condition of the combined company, the paper requirements of the legacy OfficeMax business, or the effects the combined company would have on the pricing and competition for office papers. Significant reductions in paper purchases from OfficeMax (or the post-merger entity) would cause us to expand our customer base and could potentially decrease our profitability if new customer sales required either a decrease in our pricing and/or an increase in our cost of sales. Any significant deterioration in the financial condition of OfficeMax (or the post-merger entity) affecting the ability to pay or causing a significant change in the willingness to purchase our products or a significant deterioration in the financial condition of OfficeMax that affects their ability to pay could have a material adverse effect on our business, financial condition, results of operations, and liquidity.
23
Labor
At June 30, 2013, we had approximately 5,200 employees, and approximately 50% of these employees worked pursuant to collective bargaining agreements. Approximately 1% of our employees work pursuant to collective bargaining agreements that will expire within the next 12 months.
15. Transactions With Related Party
Related-Party Sales
Louisiana Timber Procurement Company, L.L.C. (LTP) is a variable-interest entity that is 50% owned by Boise Inc. and 50% owned by Boise Cascade Holdings, L.L.C. (Boise Cascade). LTP procures sawtimber, pulpwood, residual chips, and other residual wood fiber to meet the wood and fiber requirements of Boise Inc. and Boise Cascade in Louisiana. We are the primary beneficiary of LTP, as we have the power to direct the activities that most significantly affect the economic performance of LTP. Therefore, we consolidate LTP in our financial statements in our Packaging segment. The carrying amounts of LTP’s assets and liabilities (which relate primarily to noninventory working capital items) on our Consolidated Balance Sheets were $3.9 million and $4.0 million at June 30, 2013, and December 31, 2012, respectively. During the three months ended June 30, 2013 and 2012, we recorded $16.8 million and $19.3 million, respectively, and during the six months ended June 30, 2013 and 2012, we recorded $32.5 million and $30.6 million, respectively, of LTP sales to Boise Cascade in “Sales, Related party” in the Consolidated Statements of Operations and approximately the same amount of expenses in “Materials, labor, and other operating expenses (excluding depreciation).” The sales were at prices designed to approximate market prices.
Related-Party Costs and Expenses
During the three months ended June 30, 2013 and 2012, fiber purchases from a related party were $5.3 million and $4.5 million, respectively, and during the six months ended June 30, 2013 and 2012, fiber purchases from a related party were $11.5 million and $9.4 million, respectively. Most of these purchases related to log and chip purchases by LTP from Boise Cascade’s wood products business. Costs associated with these purchases were recorded as “Fiber costs from related party” in the Consolidated Statements of Operations.
16. Segment Information
We operate and report our business in three reportable segments: Packaging, Paper, and Corporate and Other (support services). These segments represent distinct businesses that are managed separately because of differing products and services. Each of these businesses requires distinct operating and marketing strategies. Management reviews the performance of the Company based on these segments. There are no differences in our basis of segmentation or in our basis of measurement of segment profit or loss from those disclosed in Note 17, Segment Information, of the Notes to Consolidated Financial Statements in “Part II, Item 8. Financial Statements and Supplementary Data” in our 2012 Form 10-K.
24
An analysis of operations by segment is as follows (dollars in millions):
| Sales | Income (Loss) Before Income Taxes |
Depreciation, Amortization, and Depletion (c) |
EBITDA (d) |
|||||||||||||||||||||||||
| Three Months Ended June 30, 2013 |
Trade | Related Party |
Inter- segment |
Total | ||||||||||||||||||||||||
| Packaging (a) |
$ | 283.0 | $ | 16.8 | $ | 0.8 | $ | 300.6 | $ | 31.3 | $ | 16.8 | $ | 48.1 | ||||||||||||||
| Paper (a) |
313.8 | — | 21.0 | 334.8 | (9.9 | ) | 25.9 | 15.9 | ||||||||||||||||||||
| Corporate and Other (b) |
8.1 | — | 7.7 | 15.7 | (9.4 | ) | 1.2 | (8.1 | ) | |||||||||||||||||||
| Intersegment eliminations |
— | — | (29.5 | ) | (29.5 | ) | — | — | — | |||||||||||||||||||
|
|
|
|
|
|
|
|
|
|
|
|
|
|
|
|||||||||||||||
| $ | 604.8 | $ | 16.8 | $ | — | $ | 621.7 | 12.0 | $ | 43.9 | $ | 55.8 | ||||||||||||||||
|
|
|
|
|
|
|
|
|
|
|
|
|
|
|
|||||||||||||||
| Interest expense |
(15.5 | ) | ||||||||||||||||||||||||||
| Interest income |
— | |||||||||||||||||||||||||||
|
|
|
|||||||||||||||||||||||||||
| $ | (3.5 | ) | ||||||||||||||||||||||||||
|
|
|
|||||||||||||||||||||||||||
| Sales | Income (Loss) Before Income Taxes |
Depreciation, Amortization, and Depletion |
EBITDA (d) |
|||||||||||||||||||||||||
| Three Months Ended June 30, 2012 |
Trade | Related Party |
Inter- segment |
Total | ||||||||||||||||||||||||
| Packaging |
$ | 264.9 | $ | 19.3 | $ | 0.6 | $ | 284.8 | $ | 24.8 | $ | 15.1 | $ | 40.0 | ||||||||||||||
| Paper |
345.5 | — | 17.7 | 363.3 | 19.6 | 21.3 | 40.9 | |||||||||||||||||||||
| Corporate and Other |
8.2 | — | 9.0 | 17.2 | (6.6 | ) | 0.8 | (5.7 | ) | |||||||||||||||||||
| Intersegment eliminations |
— | — | (27.4 | ) | (27.4 | ) | — | — | — | |||||||||||||||||||
|
|
|
|
|
|
|
|
|
|
|
|
|
|
|
|||||||||||||||
| $ | 618.6 | $ | 19.3 | $ | — | $ | 637.8 | 37.8 | $ | 37.3 | $ | 75.1 | ||||||||||||||||
|
|
|
|
|
|
|
|
|
|
|
|
|
|
|
|||||||||||||||
| Interest expense |
(15.4 | ) | ||||||||||||||||||||||||||
| Interest income |
0.1 | |||||||||||||||||||||||||||
|
|
|
|||||||||||||||||||||||||||
| $ | 22.5 | |||||||||||||||||||||||||||
|
|
|
|||||||||||||||||||||||||||
| Sales | Income (Loss) Before Income Taxes |
Depreciation, Amortization, and Depletion (c) |
EBITDA (d) |
|||||||||||||||||||||||||
| Six Months Ended June 30, 2013 |
Trade | Related Party |
Inter- segment |
Total | ||||||||||||||||||||||||
| Packaging (a) |
$ | 553.6 | $ | 32.5 | $ | 1.4 | $ | 587.6 | $ | 32.2 | $ | 33.1 | $ | 65.3 | ||||||||||||||
| Paper (a) |
626.7 | — | 40.9 | 667.6 | 9.7 | 51.8 | 61.5 | |||||||||||||||||||||
| Corporate and Other (b) |
15.8 | — | 16.2 | 32.0 | (17.2 | ) | 2.4 | (14.8 | ) | |||||||||||||||||||
| Intersegment eliminations |
— | — | (58.5 | ) | (58.5 | ) | — | — | — | |||||||||||||||||||
|
|
|
|
|
|
|
|
|
|
|
|
|
|
|
|||||||||||||||
| $ | 1,196.1 | $ | 32.5 | $ | — | $ | 1,228.7 | 24.7 | $ | 87.3 | $ | 112.0 | ||||||||||||||||
|
|
|
|
|
|
|
|
|
|
|
|
|
|
|
|||||||||||||||
| Interest expense |
(30.9 | ) | ||||||||||||||||||||||||||
| Interest income |
— | |||||||||||||||||||||||||||
|
|
|
|||||||||||||||||||||||||||
| $ | (6.2 | ) | ||||||||||||||||||||||||||
|
|
|
|||||||||||||||||||||||||||
| Sales | Income (Loss) Before Income Taxes |
Depreciation, Amortization, and Depletion |
EBITDA (d) |
|||||||||||||||||||||||||
| Six Months Ended June 30, 2012 |
Trade | Related Party |
Inter- segment |
Total | ||||||||||||||||||||||||
| Packaging |
$ | 525.1 | $ | 30.6 | $ | 1.4 | $ | 557.1 | $ | 47.3 | $ | 30.6 | $ | 77.9 | ||||||||||||||
| Paper |
711.1 | — | 34.6 | 745.7 | 53.5 | 42.5 | 96.0 | |||||||||||||||||||||
| Corporate and Other |
15.9 | — | 19.5 | 35.3 | (13.1 | ) | 1.7 | (11.4 | ) | |||||||||||||||||||
| Intersegment eliminations |
— | — | (55.4 | ) | (55.4 | ) | — | — | — | |||||||||||||||||||
|
|
|
|
|
|
|
|
|
|
|
|
|
|
|
|||||||||||||||
| $ | 1,252.1 | $ | 30.6 | $ | — | $ | 1,282.7 | 87.7 | $ | 74.9 | $ | 162.6 | ||||||||||||||||
|
|
|
|
|
|
|
|
|
|
|
|
|
|
|
|||||||||||||||
| Interest expense |
(30.8 | ) | ||||||||||||||||||||||||||
| Interest income |
0.1 | |||||||||||||||||||||||||||
|
|
|
|||||||||||||||||||||||||||
| $ | 57.0 | |||||||||||||||||||||||||||
|
|
|
|||||||||||||||||||||||||||
| (a) | During the three months ended June 30, 2013, we recorded $13.3 million of pretax restructuring costs, of which $12.3 million was recorded in our Paper segment, and related primarily to our plan to shut down two paper machines and an off-machine coater at our mill in International Falls, Minnesota, in early fourth quarter 2013. We recorded $1.0 million of costs in our Packaging segment related to restructuring activities due to the conversion of a machine at our mill in DeRidder, Louisiana. |
25
| (b) | During the three months ended June 30, 2013, we recorded $2.0 million of transaction-related costs in our Corporate and Other segment. Transaction-related costs include expenses associated with transactions, whether consummated or not. We explore strategic transactions to the extent we believe they may improve our competitive position or enhance shareholder value. |
| (c) | During the three and six months ended June 30, 2013, we recognized $5.5 million and $10.8 million, respectively, of incremental depreciation expense related to shortening the useful lives of some of our assets, primarily at International Falls, Minnesota. We recognized $3.8 million and $7.6 million of incremental depreciation expense in our Paper segment during the three and six months ended June 30, 2013, respectively, and $1.7 million and $3.2 million of incremental depreciation expense, respectively, in our Packaging segment. |
| (d) | EBITDA represents income (loss) before interest (interest expense and interest income), income tax provision (benefit), and depreciation, amortization, and depletion. EBITDA is the primary measure used by our chief operating decision maker to evaluate segment operating performance and to decide how to allocate resources to segments. We believe EBITDA is useful to investors because it provides a means to evaluate the operating performance of our segments and our company on an ongoing basis using criteria that are used by our internal decision makers and because it is frequently used by investors and other interested parties in the evaluation of companies. We believe EBITDA is a meaningful measure because it presents a transparent view of our recurring operating performance and allows management to readily view operating trends, perform analytical comparisons, and identify strategies to improve operating performance. For example, we believe that the inclusion of items such as taxes, interest expense, and interest income distorts management’s ability to assess and view the core operating trends in our segments. EBITDA, however, is not a measure of our liquidity or financial performance under generally accepted accounting principles (GAAP) and should not be considered as an alternative to net income, income from operations, or any other performance measure derived in accordance with GAAP or as an alternative to cash flow from operating activities as a measure of our liquidity. The use of EBITDA instead of net income (loss) or segment income (loss) has limitations as an analytical tool, including the inability to determine profitability; the exclusion of interest expense, interest income, and associated significant cash requirements; and the exclusion of depreciation, amortization, and depletion, which represent significant and unavoidable operating costs given the capital expenditures needed to maintain our businesses. Management compensates for these limitations by relying on our GAAP results. Our measures of EBITDA are not necessarily comparable to other similarly titled captions of other companies due to potential inconsistencies in the methods of calculation. |
The following is a reconciliation of net income (loss) to EBITDA for Boise Inc. and BZ Intermediate (dollars in millions):
| Three Months Ended June 30 |
Six Months Ended June 30 |
|||||||||||||||
| 2013 | 2012 | 2013 | 2012 | |||||||||||||
| Net income (loss) |
$ | (2.2 | ) | $ | 13.7 | $ | (3.4 | ) | $ | 35.0 | ||||||
| Interest expense |
15.5 | 15.4 | 30.9 | 30.8 | ||||||||||||
| Interest income |
— | (0.1 | ) | — | (0.1 | ) | ||||||||||
| Income tax provision (benefit) |
(1.3 | ) | 8.8 | (2.7 | ) | 22.0 | ||||||||||
| Depreciation, amortization, and depletion (c) |
43.9 | 37.3 | 87.3 | 74.9 | ||||||||||||
|
|
|
|
|
|
|
|
|
|||||||||
| EBITDA |
$ | 55.8 | $ | 75.1 | $ | 112.0 | $ | 162.6 | ||||||||
|
|
|
|
|
|
|
|
|
|||||||||
17. New and Recently Adopted Accounting Standards
In July 2013, the FASB issued Accounting Standards Update (ASU) 2013-11, Presentation of an Unrecognized Tax Benefit When a Net Operating Loss Carryforward, a Similar Tax Loss, or a Tax Credit Carryforward Exists (Topic 740). This ASU requires that liabilities related to unrecognized tax benefits offset deferred tax assets for net operating loss carry forwards, a similar tax loss or a tax credit carry forward (Carryforward), if such settlement is required or expected in the event the uncertain tax position is disallowed. In situations in which a Carryforward cannot be used or the deferred tax asset is not intended to be used for such purpose, the unrecognized tax benefit should be recorded as a liability and should not offset deferred tax assets. We plan to adopt this ASU in our financial statements for the year ended December 31, 2013. We continue to evaluate the impact of the ASU, but expect the adoption to decrease “Other long-term liabilities” and increase the “Deferred income taxes” liability recorded on our Consolidated Balance Sheets. This ASU will have no effect on our financial position and results of operations.
In February 2013, the FASB issued Accounting Standards Update (ASU) 2013-02, Comprehensive Income (Topic 220): Reporting of Amounts Reclassified Out of Accumulated Other Comprehensive Income. This ASU requires entities to disclose additional information about changes in and significant items reclassified out of accumulated other comprehensive income. We have adopted the provisions of this guidance, and it had no effect on our financial position and results of operations. See Note 10, Stockholders’ Equity, for the additional required disclosures.
In July 2012, the FASB issued Accounting Standards Update (ASU) 2012-02, Intangibles — Goodwill and Other (Topic 350): Testing Indefinite-Lived Intangible Assets for Impairment. This ASU gives entities testing indefinite-lived intangible assets for impairment the option first to assess qualitative factors to determine whether the existence of events and circumstances indicates that it is more likely than not that the indefinite-lived intangible asset is impaired. If, after assessing the totality of events and circumstances, an entity concludes that it is not more
26
likely than not that the indefinite-lived intangible asset is impaired, the entity is not required to take further action. However, if an entity concludes otherwise, a quantitative impairment test is required. We will consider the provisions of this guidance when we test our indefinite-lived intangible assets for impairment in the fourth quarter. This ASU will have no effect on our financial position and results of operations.
In December 2011, the FASB issued ASU 2011-11, Balance Sheet (Topic 210): Disclosures about Offsetting Assets and Liabilities. This ASU improves reporting and transparency of offsetting (netting) assets and liabilities and the related effects on the financial statements. In January 2013, the FASB issued ASU 2013-01, Balance Sheet (Topic 210): Clarifying the Scope of Disclosures about Offsetting Assets and Liabilities. This ASU clarifies which instruments and transactions are subject to the offsetting disclosure requirements established by ASU 2011-11. We adopted the provisions of this guidance on January 1, 2013, and it had no effect on our financial position and results of operations. See Note 7, Financial Instruments, for the additional required disclosures.
There were no other accounting standards recently issued that had or are expected to have a material impact on our financial position or results of operations.
18. Commitments, Guarantees, Indemnifications, and Legal Proceedings
Commitments
We have financial commitments and obligations that arise in the ordinary course of our business. These include long-term debt, lease payments, derivative instruments, and obligations to purchase goods and services that are discussed in Note 8, Debt; Note 9, Financial Instruments; Note 14, Leases; and Note 18, Commitments, Guarantees, Indemnifications, and Legal Proceedings, of the Notes to Consolidated Financial Statements in “Part II, Item 8. Financial Statements and Supplementary Data” in our 2012 Form 10-K. At June 30, 2013, there have been no material changes to commitments outside the normal course of business.
Guarantees and Indemnifications
We provide guarantees, indemnifications, and other assurances to third parties in the normal course of our business. These include tort indemnifications, environmental assurances, and representations and warranties in merger and acquisition agreements. At June 30, 2013, we are not aware of any material liabilities arising from any guarantee, indemnification, or financial assurance we have provided. If we determined such liability was probable and subject to reasonable determination, we would accrue for it at that time.
Legal Proceedings
We are a party to routine proceedings that arise in the course of our business; however, we are not currently a party to any legal proceedings or environmental claims we believe would have a material adverse effect on our financial position, results of operations, or liquidity, either individually or in the aggregate.
19. Consolidating Guarantor and Nonguarantor Financial Information
Our 9% and 8% Senior Notes were issued by Boise Paper Holdings and co-issuers Boise Co-Issuer Company and Boise Finance Company, respectively. The Senior Notes are jointly and severally guaranteed on a senior unsecured basis by BZ Intermediate and each of its existing and, to the extent they become guarantors under the Credit Facilities, future subsidiaries other than: (i) Boise Paper Holdings and the co-issuers; (ii) Louisiana Timber Procurement Company, L.L.C.; and (iii) our foreign subsidiaries, including those acquired as part of the Hexacomb Acquisition. Each of the co-issuers of the Senior Notes and each of the subsidiaries of BZ Intermediate that is a guarantor thereof is 100% owned, directly or indirectly, by Boise Paper Holdings.
The following consolidating financial statements present the results of operations, comprehensive income, financial position, and cash flows of (i) BZ Intermediate Holdings LLC (parent); (ii) Boise Paper Holdings and co-issuers; (iii) guarantor subsidiaries; (iv) nonguarantor subsidiaries; and (v) eliminations to arrive at the information on a consolidated basis. Other than these consolidated financial statements and footnotes for Boise Inc. and BZ Intermediate, financial statements and other disclosures concerning the guarantors have not been presented. Management believes that such information is not material to investors and because the cancellation provisions of the guarantor subsidiaries’ guarantees are customary and do not permit a guarantor subsidiary to opt out of the obligation prior to or during the term of the debt. Under these cancellation provisions, each guarantor subsidiary is automatically released from its obligations as a guarantor upon the sale of the subsidiary or substantially all of its assets to a third party, the designation of the subsidiary as an unrestricted subsidiary for the purposes of the covenants included in the Senior Notes indentures, the release of the indebtedness under the indentures, or if the issuers exercise their legal defeasance option or discharge their obligations in accordance with the indentures.
27
In the following consolidating financial statements, the reclassifications to net income (loss) from accumulated other comprehensive income are recorded primarily in our guarantor subsidiaries. See Note 10, Stockholders’ Equity, for additional information related to reclassifications out of accumulated other comprehensive income.
28
BZ Intermediate Holdings LLC and Subsidiaries
Consolidating Statements of Operations
For the Three Months Ended June 30, 2013
(unaudited, dollars in thousands)
| BZ Intermediate Holdings LLC (Parent) |
Boise Paper Holdings and Co- issuers |
Guarantor Subsidiaries |
Nonguarantor Subsidiaries |
Eliminations | Consolidated | |||||||||||||||||||
| Sales |
||||||||||||||||||||||||
| Trade |
$ | — | $ | 3,998 | $ | 588,133 | $ | 12,690 | $ | — | $ | 604,821 | ||||||||||||
| Intercompany |
— | — | 2,319 | 27,417 | (29,736 | ) | — | |||||||||||||||||
| Related party |
— | — | — | 16,843 | — | 16,843 | ||||||||||||||||||
|
|
|
|
|
|
|
|
|
|
|
|
|
|||||||||||||
| — | 3,998 | 590,452 | 56,950 | (29,736 | ) | 621,664 | ||||||||||||||||||
|
|
|
|
|
|
|
|
|
|
|
|
|
|||||||||||||
| Costs and expenses |
||||||||||||||||||||||||
| Materials, labor, and other operating expenses (excluding depreciation) |
— | 3,751 | 472,833 | 48,841 | (29,736 | ) | 495,689 | |||||||||||||||||
| Fiber costs from related party |
— | — | — | 5,319 | — | 5,319 | ||||||||||||||||||
| Depreciation, amortization, and depletion |
— | 1,030 | 42,176 | 685 | — | 43,891 | ||||||||||||||||||
| Selling and distribution expenses |
— | — | 33,179 | 585 | — | 33,764 | ||||||||||||||||||
| General and administrative expenses |
— | 6,780 | 11,620 | 1,293 | — | 19,693 | ||||||||||||||||||
| Restructuring costs |
— | — | 9,011 | — | — | 9,011 | ||||||||||||||||||
| Other (income) expense, net |
— | 2,046 | (246 | ) | 130 | — | 1,930 | |||||||||||||||||
|
|
|
|
|
|
|
|
|
|
|
|
|
|||||||||||||
| — | 13,607 | 568,573 | 56,853 | (29,736 | ) | 609,297 | ||||||||||||||||||
|
|
|
|
|
|
|
|
|
|
|
|
|
|||||||||||||
| Income (loss) from operations |
— | (9,609 | ) | 21,879 | 97 | — | 12,367 | |||||||||||||||||
|
|
|
|
|
|
|
|
|
|
|
|
|
|||||||||||||
| Foreign exchange loss |
— | (270 | ) | (32 | ) | (113 | ) | — | (415 | ) | ||||||||||||||
| Interest expense |
— | (15,435 | ) | — | (21 | ) | — | (15,456 | ) | |||||||||||||||
| Interest expense—intercompany |
— | (56 | ) | — | (20 | ) | 76 | — | ||||||||||||||||
| Interest income |
— | 1 | 6 | — | — | 7 | ||||||||||||||||||
| Interest income—intercompany |
— | 13 | 63 | — | (76 | ) | — | |||||||||||||||||
|
|
|
|
|
|
|
|
|
|
|
|
|
|||||||||||||
| — | (15,747 | ) | 37 | (154 | ) | — | (15,864 | ) | ||||||||||||||||
|
|
|
|
|
|
|
|
|
|
|
|
|
|||||||||||||
| Income (loss) before income taxes and equity in net income (loss) of affiliates |
— | (25,356 | ) | 21,916 | (57 | ) | — | (3,497 | ) | |||||||||||||||
| Income tax (provision) benefit |
— | 1,313 | (5 | ) | (19 | ) | — | 1,289 | ||||||||||||||||
|
|
|
|
|
|
|
|
|
|
|
|
|
|||||||||||||
| Income (loss) before equity in net income (loss) of affiliates |
— | (24,043 | ) | 21,911 | (76 | ) | — | (2,208 | ) | |||||||||||||||
| Equity in net income (loss) of affiliates |
(2,208 | ) | 21,835 | — | — | (19,627 | ) | — | ||||||||||||||||
|
|
|
|
|
|
|
|
|
|
|
|
|
|||||||||||||
| Net income (loss) |
$ | (2,208 | ) | $ | (2,208 | ) | $ | 21,911 | $ | (76 | ) | $ | (19,627 | ) | $ | (2,208 | ) | |||||||
|
|
|
|
|
|
|
|
|
|
|
|
|
|||||||||||||
29
BZ Intermediate Holdings LLC and Subsidiaries
Consolidating Statements of Operations
For the Three Months Ended June 30, 2012
(unaudited, dollars in thousands)
| BZ Intermediate Holdings LLC (Parent) |
Boise Paper Holdings and Co- issuers |
Guarantor Subsidiaries |
Nonguarantor Subsidiaries |
Eliminations | Consolidated | |||||||||||||||||||
| Sales |
||||||||||||||||||||||||
| Trade |
$ | — | $ | 3,629 | $ | 602,193 | $ | 12,763 | $ | — | $ | 618,585 | ||||||||||||
| Intercompany |
— | — | 749 | 26,293 | (27,042 | ) | — | |||||||||||||||||
| Related party |
— | — | — | 19,255 | — | 19,255 | ||||||||||||||||||
|
|
|
|
|
|
|
|
|
|
|
|
|
|||||||||||||
| — | 3,629 | 602,942 | 58,311 | (27,042 | ) | 637,840 | ||||||||||||||||||
|
|
|
|
|
|
|
|
|
|
|
|
|
|||||||||||||
| Costs and expenses |
||||||||||||||||||||||||
| Materials, labor, and other operating expenses (excluding depreciation) |
— | 3,544 | 479,689 | 51,152 | (27,042 | ) | 507,343 | |||||||||||||||||
| Fiber costs from related party |
— | — | — | 4,466 | — | 4,466 | ||||||||||||||||||
| Depreciation, amortization, and depletion |
— | 659 | 35,976 | 668 | — | 37,303 | ||||||||||||||||||
| Selling and distribution expenses |
— | — | 30,627 | (59 | ) | — | 30,568 | |||||||||||||||||
| General and administrative expenses |
— | 6,955 | 11,423 | 1,657 | — | 20,035 | ||||||||||||||||||
| Other (income) expense, net |
— | 98 | 349 | (66 | ) | — | 381 | |||||||||||||||||
|
|
|
|
|
|
|
|
|
|
|
|
|
|||||||||||||
| — | 11,256 | 558,064 | 57,818 | (27,042 | ) | 600,096 | ||||||||||||||||||
|
|
|
|
|
|
|
|
|
|
|
|
|
|||||||||||||
| Income (loss) from operations |
— | (7,627 | ) | 44,878 | 493 | — | 37,744 | |||||||||||||||||
|
|
|
|
|
|
|
|
|
|
|
|
|
|||||||||||||
| Foreign exchange gain (loss) |
— | (186 | ) | 33 | 255 | — | 102 | |||||||||||||||||
| Interest expense |
— | (15,440 | ) | — | 7 | — | (15,433 | ) | ||||||||||||||||
| Interest expense—intercompany |
— | (48 | ) | — | (14 | ) | 62 | — | ||||||||||||||||
| Interest income |
— | 14 | 40 | — | — | 54 | ||||||||||||||||||
| Interest income—intercompany |
— | 14 | 48 | — | (62 | ) | — | |||||||||||||||||
|
|
|
|
|
|
|
|
|
|
|
|
|
|||||||||||||
| — | (15,646 | ) | 121 | 248 | — | (15,277 | ) | |||||||||||||||||
|
|
|
|
|
|
|
|
|
|
|
|
|
|||||||||||||
| Income (loss) before income taxes and equity in net income (loss) of affiliates |
— | (23,273 | ) | 44,999 | 741 | — | 22,467 | |||||||||||||||||
| Income tax provision |
— | (8,488 | ) | 9 | (326 | ) | — | (8,805 | ) | |||||||||||||||
|
|
|
|
|
|
|
|
|
|
|
|
|
|||||||||||||
| Income (loss) before equity in net income (loss) of affiliates |
— | (31,761 | ) | 45,008 | 415 | — | 13,662 | |||||||||||||||||
| Equity in net income of affiliates |
13,662 | 45,423 | — | — | (59,085 | ) | — | |||||||||||||||||
|
|
|
|
|
|
|
|
|
|
|
|
|
|||||||||||||
| Net income |
$ | 13,662 | $ | 13,662 | $ | 45,008 | $ | 415 | $ | (59,085 | ) | $ | 13,662 | |||||||||||
|
|
|
|
|
|
|
|
|
|
|
|
|
|||||||||||||
30
BZ Intermediate Holdings LLC and Subsidiaries
Consolidating Statements of Operations
For the Six Months Ended June 30, 2013
(unaudited, dollars in thousands)
| BZ Intermediate Holdings LLC (Parent) |
Boise Paper Holdings and Co- issuers |
Guarantor Subsidiaries |
Nonguarantor Subsidiaries |
Eliminations | Consolidated | |||||||||||||||||||
| Sales |
||||||||||||||||||||||||
| Trade |
$ | — | $ | 7,864 | $ | 1,162,844 | $ | 25,434 | $ | — | $ | 1,196,142 | ||||||||||||
| Intercompany |
— | — | 4,712 | 55,407 | (60,119 | ) | — | |||||||||||||||||
| Related party |
— | — | — | 32,540 | — | 32,540 | ||||||||||||||||||
|
|
|
|
|
|
|
|
|
|
|
|
|
|||||||||||||
| — | 7,864 | 1,167,556 | 113,381 | (60,119 | ) | 1,228,682 | ||||||||||||||||||
|
|
|
|
|
|
|
|
|
|
|
|
|
|||||||||||||
| Costs and expenses |
||||||||||||||||||||||||
| Materials, labor, and other operating expenses (excluding depreciation) |
— | 7,487 | 948,153 | 96,437 | (60,119 | ) | 991,958 | |||||||||||||||||
| Fiber costs from related party |
— | — | — | 11,465 | — | 11,465 | ||||||||||||||||||
| Depreciation, amortization, and depletion |
— | 1,980 | 83,993 | 1,346 | — | 87,319 | ||||||||||||||||||
| Selling and distribution expenses |
— | — | 61,775 | 838 | — | 62,613 | ||||||||||||||||||
| General and administrative expenses |
— | 13,994 | 22,044 | 2,578 | — | 38,616 | ||||||||||||||||||
| Restructuring costs |
— | — | 9,474 | — | — | 9,474 | ||||||||||||||||||
| Other (income) expense, net |
— | 2,076 | (318 | ) | 40 | — | 1,798 | |||||||||||||||||
|
|
|
|
|
|
|
|
|
|
|
|
|
|||||||||||||
| — | 25,537 | 1,125,121 | 112,704 | (60,119 | ) | 1,203,243 | ||||||||||||||||||
|
|
|
|
|
|
|
|
|
|
|
|
|
|||||||||||||
| Income (loss) from operations |
— | (17,673 | ) | 42,435 | 677 | — | 25,439 | |||||||||||||||||
|
|
|
|
|
|
|
|
|
|
|
|
|
|||||||||||||
| Foreign exchange loss |
— | (434 | ) | (48 | ) | (274 | ) | — | (756 | ) | ||||||||||||||
| Interest expense |
— | (30,862 | ) | — | (13 | ) | — | (30,875 | ) | |||||||||||||||
| Interest expense—intercompany |
— | (103 | ) | — | (39 | ) | 142 | — | ||||||||||||||||
| Interest income |
— | 1 | 13 | 20 | — | 34 | ||||||||||||||||||
| Interest income—intercompany |
— | 27 | 115 | — | (142 | ) | — | |||||||||||||||||
|
|
|
|
|
|
|
|
|
|
|
|
|
|||||||||||||
| — | (31,371 | ) | 80 | (306 | ) | — | (31,597 | ) | ||||||||||||||||
|
|
|
|
|
|
|
|
|
|
|
|
|
|||||||||||||
| Income (loss) before income taxes and equity in net income (loss) of affiliates |
— | (49,044 | ) | 42,515 | 371 | — | (6,158 | ) | ||||||||||||||||
| Income tax (provision) benefit |
— | 2,947 | (33 | ) | (189 | ) | — | 2,725 | ||||||||||||||||
|
|
|
|
|
|
|
|
|
|
|
|
|
|||||||||||||
| Income (loss) before equity in net income (loss) of affiliates |
— | (46,097 | ) | 42,482 | 182 | — | (3,433 | ) | ||||||||||||||||
| Equity in net income (loss) of affiliates |
(3,433 | ) | 42,664 | — | — | (39,231 | ) | — | ||||||||||||||||
|
|
|
|
|
|
|
|
|
|
|
|
|
|||||||||||||
| Net income (loss) |
$ | (3,433 | ) | $ | (3,433 | ) | $ | 42,482 | $ | 182 | $ | (39,231 | ) | $ | (3,433 | ) | ||||||||
|
|
|
|
|
|
|
|
|
|
|
|
|
|||||||||||||
31
BZ Intermediate Holdings LLC and Subsidiaries
Consolidating Statements of Operations
For the Six Months Ended June 30, 2012
(unaudited, dollars in thousands)
| BZ Intermediate Holdings LLC (Parent) |
Boise Paper Holdings and Co- issuers |
Guarantor Subsidiaries |
Nonguarantor Subsidiaries |
Eliminations | Consolidated | |||||||||||||||||||
| Sales |
||||||||||||||||||||||||
| Trade |
$ | — | $ | 7,300 | $ | 1,220,608 | $ | 24,205 | $ | — | $ | 1,252,113 | ||||||||||||
| Intercompany |
— | — | 976 | 52,034 | (53,010 | ) | — | |||||||||||||||||
| Related party |
— | — | — | 30,573 | — | 30,573 | ||||||||||||||||||
|
|
|
|
|
|
|
|
|
|
|
|
|
|||||||||||||
| — | 7,300 | 1,221,584 | 106,812 | (53,010 | ) | 1,282,686 | ||||||||||||||||||
|
|
|
|
|
|
|
|
|
|
|
|
|
|||||||||||||
| Costs and expenses |
||||||||||||||||||||||||
| Materials, labor, and other operating expenses (excluding depreciation) |
— | 7,057 | 963,719 | 91,876 | (53,010 | ) | 1,009,642 | |||||||||||||||||
| Fiber costs from related party |
— | — | — | 9,412 | — | 9,412 | ||||||||||||||||||
| Depreciation, amortization, and depletion |
— | 1,322 | 72,159 | 1,378 | — | 74,859 | ||||||||||||||||||
| Selling and distribution expenses |
— | — | 60,847 | 363 | — | 61,210 | ||||||||||||||||||
| General and administrative expenses |
— | 14,241 | 22,777 | 3,025 | — | 40,043 | ||||||||||||||||||
| Other (income) expense, net |
— | 152 | 189 | (260 | ) | — | 81 | |||||||||||||||||
|
|
|
|
|
|
|
|
|
|
|
|
|
|||||||||||||
| — | 22,772 | 1,119,691 | 105,794 | (53,010 | ) | 1,195,247 | ||||||||||||||||||
|
|
|
|
|
|
|
|
|
|
|
|
|
|||||||||||||
| Income (loss) from operations |
— | (15,472 | ) | 101,893 | 1,018 | — | 87,439 | |||||||||||||||||
|
|
|
|
|
|
|
|
|
|
|
|
|
|||||||||||||
| Foreign exchange gain (loss) |
— | 3 | 76 | 180 | — | 259 | ||||||||||||||||||
| Interest expense |
— | (30,798 | ) | — | — | — | (30,798 | ) | ||||||||||||||||
| Interest expense—intercompany |
— | (95 | ) | — | (28 | ) | 123 | — | ||||||||||||||||
| Interest income |
— | 48 | 50 | — | — | 98 | ||||||||||||||||||
| Interest income—intercompany |
— | 28 | 95 | — | (123 | ) | — | |||||||||||||||||
|
|
|
|
|
|
|
|
|
|
|
|
|
|||||||||||||
| — | (30,814 | ) | 221 | 152 | — | (30,441 | ) | |||||||||||||||||
|
|
|
|
|
|
|
|
|
|
|
|
|
|||||||||||||
| Income (loss) before income taxes and equity in net income (loss) of affiliates |
— | (46,286 | ) | 102,114 | 1,170 | — | 56,998 | |||||||||||||||||
| Income tax provision |
— | (21,629 | ) | (23 | ) | (346 | ) | — | (21,998 | ) | ||||||||||||||
|
|
|
|
|
|
|
|
|
|
|
|
|
|||||||||||||
| Income (loss) before equity in net income (loss) of affiliates |
— | (67,915 | ) | 102,091 | 824 | — | 35,000 | |||||||||||||||||
| Equity in net income of affiliates |
35,000 | 102,915 | — | — | (137,915 | ) | — | |||||||||||||||||
|
|
|
|
|
|
|
|
|
|
|
|
|
|||||||||||||
| Net income |
$ | 35,000 | $ | 35,000 | $ | 102,091 | $ | 824 | $ | (137,915 | ) | $ | 35,000 | |||||||||||
|
|
|
|
|
|
|
|
|
|
|
|
|
|||||||||||||
32
BZ Intermediate Holdings LLC and Subsidiaries
Consolidating Statements of Comprehensive Income
For the Three Months Ended June 30, 2013
(unaudited, dollars in thousands)
| BZ Intermediate Holdings LLC (Parent) |
Boise Paper Holdings and Co- issuers |
Guarantor Subsidiaries |
Nonguarantor Subsidiaries |
Eliminations | Consolidated | |||||||||||||||||||
| Net income (loss) |
$ | (2,208 | ) | $ | (2,208 | ) | $ | 21,911 | $ | (76 | ) | $ | (19,627 | ) | $ | (2,208 | ) | |||||||
| Other comprehensive income (loss), net of tax |
||||||||||||||||||||||||
| Foreign currency translation adjustment |
— | — | — | (195 | ) | — | (195 | ) | ||||||||||||||||
| Cash flow hedges: |
||||||||||||||||||||||||
| Change in fair value |
— | (1,069 | ) | — | — | — | (1,069 | ) | ||||||||||||||||
| Loss included in net income |
— | 101 | — | — | — | 101 | ||||||||||||||||||
| Amortization of actuarial loss and prior service cost for defined benefit pension plans |
— | 1,349 | — | — | — | 1,349 | ||||||||||||||||||
| Other |
— | (24 | ) | — | — | — | (24 | ) | ||||||||||||||||
| Equity in other comprehensive income of affiliates |
162 | (195 | ) | — | — | 33 | — | |||||||||||||||||
|
|
|
|
|
|
|
|
|
|
|
|
|
|||||||||||||
| 162 | 162 | — | (195 | ) | 33 | 162 | ||||||||||||||||||
|
|
|
|
|
|
|
|
|
|
|
|
|
|||||||||||||
| Comprehensive income (loss) |
$ | (2,046 | ) | $ | (2,046 | ) | $ | 21,911 | $ | (271 | ) | $ | (19,594 | ) | $ | (2,046 | ) | |||||||
|
|
|
|
|
|
|
|
|
|
|
|
|
|||||||||||||
BZ Intermediate Holdings LLC and Subsidiaries
Consolidating Statements of Comprehensive Income
For the Three Months Ended June 30, 2012
(unaudited, dollars in thousands)
| BZ Intermediate Holdings LLC (Parent) |
Boise Paper Holdings and Co- issuers |
Guarantor Subsidiaries |
Nonguarantor Subsidiaries |
Eliminations | Consolidated | |||||||||||||||||||
| Net income |
$ | 13,662 | $ | 13,662 | $ | 45,008 | $ | 415 | $ | (59,085 | ) | $ | 13,662 | |||||||||||
| Other comprehensive income (loss), net of tax |
||||||||||||||||||||||||
| Foreign currency translation adjustment |
— | — | — | (2,307 | ) | — | (2,307 | ) | ||||||||||||||||
| Cash flow hedges: |
||||||||||||||||||||||||
| Change in fair value |
— | 1,459 | — | — | — | 1,459 | ||||||||||||||||||
| Loss included in net income |
— | 604 | — | — | — | 604 | ||||||||||||||||||
| Amortization of actuarial loss and prior service cost for defined benefit pension plans |
— | 1,585 | — | — | — | 1,585 | ||||||||||||||||||
| Other |
— | (5 | ) | — | — | — | (5 | ) | ||||||||||||||||
| Equity in other comprehensive income of affiliates |
1,336 | (2,307 | ) | — | — | 971 | — | |||||||||||||||||
|
|
|
|
|
|
|
|
|
|
|
|
|
|||||||||||||
| 1,336 | 1,336 | — | (2,307 | ) | 971 | 1,336 | ||||||||||||||||||
|
|
|
|
|
|
|
|
|
|
|
|
|
|||||||||||||
| Comprehensive income (loss) |
$ | 14,998 | $ | 14,998 | $ | 45,008 | $ | (1,892 | ) | $ | (58,114 | ) | $ | 14,998 | ||||||||||
|
|
|
|
|
|
|
|
|
|
|
|
|
|||||||||||||
33
BZ Intermediate Holdings LLC and Subsidiaries
Consolidating Statements of Comprehensive Income
For the Six Months Ended June 30, 2013
(unaudited, dollars in thousands)
| BZ Intermediate Holdings LLC (Parent) |
Boise Paper Holdings and Co- issuers |
Guarantor Subsidiaries |
Nonguarantor Subsidiaries |
Eliminations | Consolidated | |||||||||||||||||||
| Net income (loss) |
$ | (3,433 | ) | $ | (3,433 | ) | $ | 42,482 | $ | 182 | $ | (39,231 | ) | $ | (3,433 | ) | ||||||||
| Other comprehensive income (loss), net of tax |
||||||||||||||||||||||||
| Foreign currency translation adjustment |
— | — | — | (423 | ) | — | (423 | ) | ||||||||||||||||
| Cash flow hedges: |
||||||||||||||||||||||||
| Change in fair value |
— | 587 | — | — | — | 587 | ||||||||||||||||||
| Loss included in net income |
— | 3 | — | — | — | 3 | ||||||||||||||||||
| Amortization of actuarial loss and prior service cost for defined benefit pension plans |
— | 2,665 | — | — | — | 2,665 | ||||||||||||||||||
| Other |
— | (48 | ) | — | — | — | (48 | ) | ||||||||||||||||
| Equity in other comprehensive income of affiliates |
2,784 | (423 | ) | — | — | (2,361 | ) | — | ||||||||||||||||
|
|
|
|
|
|
|
|
|
|
|
|
|
|||||||||||||
| 2,784 | 2,784 | — | (423 | ) | (2,361 | ) | 2,784 | |||||||||||||||||
|
|
|
|
|
|
|
|
|
|
|
|
|
|||||||||||||
| Comprehensive income (loss) |
$ | (649 | ) | $ | (649 | ) | $ | 42,482 | $ | (241 | ) | $ | (41,592 | ) | $ | (649 | ) | |||||||
|
|
|
|
|
|
|
|
|
|
|
|
|
|||||||||||||
BZ Intermediate Holdings LLC and Subsidiaries
Consolidating Statements of Comprehensive Income
For the Six Months Ended June 30, 2012
(unaudited, dollars in thousands)
| BZ Intermediate Holdings LLC (Parent) |
Boise Paper Holdings and Co- issuers |
Guarantor Subsidiaries |
Nonguarantor Subsidiaries |
Eliminations | Consolidated | |||||||||||||||||||
| Net income |
$ | 35,000 | $ | 35,000 | $ | 102,091 | $ | 824 | $ | (137,915 | ) | $ | 35,000 | |||||||||||
| Other comprehensive income (loss), net of tax |
||||||||||||||||||||||||
| Foreign currency translation adjustment |
— | — | — | (1,452 | ) | — | (1,452 | ) | ||||||||||||||||
| Cash flow hedges: |
||||||||||||||||||||||||
| Change in fair value |
— | (756 | ) | — | — | — | (756 | ) | ||||||||||||||||
| Loss included in net income |
— | 1,421 | — | — | — | 1,421 | ||||||||||||||||||
| Amortization of actuarial loss and prior service cost for defined benefit pension plans |
— | 3,210 | — | — | — | 3,210 | ||||||||||||||||||
| Other |
— | (10 | ) | — | — | — | (10 | ) | ||||||||||||||||
| Equity in other comprehensive income of affiliates |
2,413 | (1,452 | ) | — | — | (961 | ) | — | ||||||||||||||||
|
|
|
|
|
|
|
|
|
|
|
|
|
|||||||||||||
| 2,413 | 2,413 | — | (1,452 | ) | (961 | ) | 2,413 | |||||||||||||||||
|
|
|
|
|
|
|
|
|
|
|
|
|
|||||||||||||
| Comprehensive income (loss) |
$ | 37,413 | $ | 37,413 | $ | 102,091 | $ | (628 | ) | $ | (138,876 | ) | $ | 37,413 | ||||||||||
|
|
|
|
|
|
|
|
|
|
|
|
|
|||||||||||||
34
BZ Intermediate Holdings LLC and Subsidiaries
Consolidating Balance Sheets at June 30, 2013
(unaudited, dollars in thousands)
| BZ Intermediate Holdings LLC (Parent) |
Boise Paper Holdings and Co- issuers |
Guarantor Subsidiaries |
Nonguarantor Subsidiaries |
Eliminations | Consolidated | |||||||||||||||||||
| ASSETS |
||||||||||||||||||||||||
| Current |
||||||||||||||||||||||||
| Cash and cash equivalents |
$ | — | $ | 54,280 | $ | 177 | $ | 6,629 | $ | — | $ | 61,086 | ||||||||||||
| Receivables |
||||||||||||||||||||||||
| Trade, less allowances |
— | 1,316 | 243,151 | 9,881 | — | 254,348 | ||||||||||||||||||
| Intercompany |
— | 3,265 | 330 | 2,149 | (5,744 | ) | — | |||||||||||||||||
| Other |
— | 2,785 | 4,439 | 2,637 | — | 9,861 | ||||||||||||||||||
| Inventories |
— | 4 | 284,254 | 4,449 | — | 288,707 | ||||||||||||||||||
| Deferred income taxes |
— | 11,997 | — | — | — | 11,997 | ||||||||||||||||||
| Prepaid and other |
— | 9,144 | 4,311 | 684 | — | 14,139 | ||||||||||||||||||
|
|
|
|
|
|
|
|
|
|
|
|
|
|||||||||||||
| — | 82,791 | 536,662 | 26,429 | (5,744 | ) | 640,138 | ||||||||||||||||||
|
|
|
|
|
|
|
|
|
|
|
|
|
|||||||||||||
| Property |
||||||||||||||||||||||||
| Property and equipment, net |
— | 9,238 | 1,192,225 | 11,200 | — | 1,212,663 | ||||||||||||||||||
| Fiber farms |
— | — | 25,113 | — | — | 25,113 | ||||||||||||||||||
|
|
|
|
|
|
|
|
|
|
|
|
|
|||||||||||||
| — | 9,238 | 1,217,338 | 11,200 | — | 1,237,776 | |||||||||||||||||||
|
|
|
|
|
|
|
|
|
|
|
|
|
|||||||||||||
| Deferred financing costs |
— | 24,380 | — | — | — | 24,380 | ||||||||||||||||||
| Goodwill |
— | — | 153,576 | 6,556 | — | 160,132 | ||||||||||||||||||
| Intangible assets, net |
— | — | 128,319 | 13,699 | — | 142,018 | ||||||||||||||||||
| Investments in affiliates |
758,305 | 1,744,654 | — | — | (2,502,959 | ) | — | |||||||||||||||||
| Intercompany notes receivable |
— | 3,400 | 1,524 | — | (4,924 | ) | — | |||||||||||||||||
| Other assets |
— | 5,945 | 499 | 185 | — | 6,629 | ||||||||||||||||||
|
|
|
|
|
|
|
|
|
|
|
|
|
|||||||||||||
| Total assets |
$ | 758,305 | $ | 1,870,408 | $ | 2,037,918 | $ | 58,069 | $ | (2,513,627 | ) | $ | 2,211,073 | |||||||||||
|
|
|
|
|
|
|
|
|
|
|
|
|
|||||||||||||
35
BZ Intermediate Holdings LLC and Subsidiaries
Consolidating Balance Sheets at June 30, 2013 (continued)
(unaudited, dollars in thousands)
| BZ Intermediate Holdings LLC (Parent) |
Boise Paper Holdings and Co- issuers |
Guarantor Subsidiaries |
Nonguarantor Subsidiaries |
Eliminations | Consolidated | |||||||||||||||||||
| LIABILITIES AND CAPITAL |
||||||||||||||||||||||||
| Current |
||||||||||||||||||||||||
| Current portion of long-term debt |
$ | — | $ | 15,000 | $ | — | $ | — | $ | — | $ | 15,000 | ||||||||||||
| Accounts payable |
||||||||||||||||||||||||
| Trade |
— | 11,423 | 186,106 | 5,673 | — | 203,202 | ||||||||||||||||||
| Intercompany |
— | 210 | 1,934 | 3,569 | (5,713 | ) | — | |||||||||||||||||
| Accrued liabilities |
||||||||||||||||||||||||
| Compensation and benefits |
— | 20,817 | 43,162 | 1,407 | — | 65,386 | ||||||||||||||||||
| Interest payable |
— | 10,529 | — | — | — | 10,529 | ||||||||||||||||||
| Other |
— | 3,859 | 17,832 | 3,498 | (31 | ) | 25,158 | |||||||||||||||||
|
|
|
|
|
|
|
|
|
|
|
|
|
|||||||||||||
| — | 61,838 | 249,034 | 14,147 | (5,744 | ) | 319,275 | ||||||||||||||||||
|
|
|
|
|
|
|
|
|
|
|
|
|
|||||||||||||
| Debt |
||||||||||||||||||||||||
| Long-term debt, less current portion |
— | 760,000 | — | — | — | 760,000 | ||||||||||||||||||
| Intercompany notes payable |
— | — | — | 4,924 | (4,924 | ) | — | |||||||||||||||||
|
|
|
|
|
|
|
|
|
|
|
|
|
|||||||||||||
| — | 760,000 | — | 4,924 | (4,924 | ) | 760,000 | ||||||||||||||||||
|
|
|
|
|
|
|
|
|
|
|
|
|
|||||||||||||
| Other |
||||||||||||||||||||||||
| Deferred income taxes |
— | 126,476 | 53,497 | 3,327 | — | 183,300 | ||||||||||||||||||
| Compensation and benefits |
— | 116,077 | 76 | — | — | 116,153 | ||||||||||||||||||
| Other long-term liabilities |
— | 47,712 | 26,102 | 226 | — | 74,040 | ||||||||||||||||||
|
|
|
|
|
|
|
|
|
|
|
|
|
|||||||||||||
| — | 290,265 | 79,675 | 3,553 | — | 373,493 | |||||||||||||||||||
|
|
|
|
|
|
|
|
|
|
|
|
|
|||||||||||||
| Commitments and contingent liabilities |
||||||||||||||||||||||||
| Capital |
||||||||||||||||||||||||
| Business unit equity |
856,825 | 856,825 | 1,709,209 | 36,171 | (2,602,205 | ) | 856,825 | |||||||||||||||||
| Accumulated other comprehensive loss |
(98,520 | ) | (98,520 | ) | — | (726 | ) | 99,246 | (98,520 | ) | ||||||||||||||
|
|
|
|
|
|
|
|
|
|
|
|
|
|||||||||||||
| 758,305 | 758,305 | 1,709,209 | 35,445 | (2,502,959 | ) | 758,305 | ||||||||||||||||||
|
|
|
|
|
|
|
|
|
|
|
|
|
|||||||||||||
| Total liabilities and capital |
$ | 758,305 | $ | 1,870,408 | $ | 2,037,918 | $ | 58,069 | $ | (2,513,627 | ) | $ | 2,211,073 | |||||||||||
|
|
|
|
|
|
|
|
|
|
|
|
|
|||||||||||||
36
BZ Intermediate Holdings LLC and Subsidiaries
Consolidating Balance Sheets at December 31, 2012
(unaudited, dollars in thousands)
| BZ Intermediate Holdings LLC (Parent) |
Boise Paper Holdings and Co- issuers |
Guarantor Subsidiaries |
Nonguarantor Subsidiaries |
Eliminations | Consolidated | |||||||||||||||||||
| ASSETS |
||||||||||||||||||||||||
| Current |
||||||||||||||||||||||||
| Cash and cash equivalents |
$ | — | $ | 40,801 | $ | 516 | $ | 8,390 | $ | — | $ | 49,707 | ||||||||||||
| Receivables |
||||||||||||||||||||||||
| Trade, less allowances |
— | 1,458 | 230,178 | 8,823 | — | 240,459 | ||||||||||||||||||
| Intercompany |
— | 2,234 | 1,580 | 2,670 | (6,484 | ) | — | |||||||||||||||||
| Other |
— | 2,880 | 4,266 | 1,121 | — | 8,267 | ||||||||||||||||||
| Inventories |
— | 3 | 291,065 | 3,416 | — | 294,484 | ||||||||||||||||||
| Deferred income taxes |
— | 17,955 | — | — | — | 17,955 | ||||||||||||||||||
| Prepaid and other |
— | 6,952 | 1,021 | 855 | — | 8,828 | ||||||||||||||||||
|
|
|
|
|
|
|
|
|
|
|
|
|
|||||||||||||
| — | 72,283 | 528,626 | 25,275 | (6,484 | ) | 619,700 | ||||||||||||||||||
|
|
|
|
|
|
|
|
|
|
|
|
|
|||||||||||||
| Property |
||||||||||||||||||||||||
| Property and equipment, net |
— | 7,930 | 1,203,384 | 11,687 | — | 1,223,001 | ||||||||||||||||||
| Fiber farms |
— | — | 24,311 | — | — | 24,311 | ||||||||||||||||||
|
|
|
|
|
|
|
|
|
|
|
|
|
|||||||||||||
| — | 7,930 | 1,227,695 | 11,687 | — | 1,247,312 | |||||||||||||||||||
|
|
|
|
|
|
|
|
|
|
|
|
|
|||||||||||||
| Deferred financing costs |
— | 26,677 | — | — | — | 26,677 | ||||||||||||||||||
| Goodwill |
— | — | 153,576 | 6,554 | — | 160,130 | ||||||||||||||||||
| Intangible assets, net |
— | — | 133,115 | 14,449 | — | 147,564 | ||||||||||||||||||
| Investments in affiliates |
756,683 | 1,778,531 | — | — | (2,535,214 | ) | — | |||||||||||||||||
| Intercompany notes receivable |
— | 3,400 | 1,524 | — | (4,924 | ) | — | |||||||||||||||||
| Other assets |
— | 5,992 | 902 | 135 | — | 7,029 | ||||||||||||||||||
|
|
|
|
|
|
|
|
|
|
|
|
|
|||||||||||||
| Total assets |
$ | 756,683 | $ | 1,894,813 | $ | 2,045,438 | $ | 58,100 | $ | (2,546,622 | ) | $ | 2,208,412 | |||||||||||
|
|
|
|
|
|
|
|
|
|
|
|
|
|||||||||||||
37
BZ Intermediate Holdings LLC and Subsidiaries
Consolidating Balance Sheets at December 31, 2012 (continued)
(unaudited, dollars in thousands)
| BZ Intermediate Holdings LLC (Parent) |
Boise Paper Holdings and Co- issuers |
Guarantor Subsidiaries |
Nonguarantor Subsidiaries |
Eliminations | Consolidated | |||||||||||||||||||
| LIABILITIES AND CAPITAL |
||||||||||||||||||||||||
| Current |
||||||||||||||||||||||||
| Current portion of long-term debt |
$ | — | $ | 10,000 | $ | — | $ | — | $ | — | $ | 10,000 | ||||||||||||
| Accounts payable |
||||||||||||||||||||||||
| Trade |
— | 18,547 | 160,152 | 6,379 | — | 185,078 | ||||||||||||||||||
| Intercompany |
— | 571 | 2,090 | 3,842 | (6,503 | ) | — | |||||||||||||||||
| Accrued liabilities |
||||||||||||||||||||||||
| Compensation and benefits |
— | 22,206 | 47,605 | 1,139 | — | 70,950 | ||||||||||||||||||
| Interest payable |
— | 10,516 | — | — | — | 10,516 | ||||||||||||||||||
| Other |
— | 3,773 | 14,033 | 2,703 | 19 | 20,528 | ||||||||||||||||||
|
|
|
|
|
|
|
|
|
|
|
|
|
|||||||||||||
| — | 65,613 | 223,880 | 14,063 | (6,484 | ) | 297,072 | ||||||||||||||||||
|
|
|
|
|
|
|
|
|
|
|
|
|
|||||||||||||
| Debt |
||||||||||||||||||||||||
| Long-term debt, less current portion |
— | 770,000 | — | — | — | 770,000 | ||||||||||||||||||
| Intercompany notes payable |
— | — | — | 4,924 | (4,924 | ) | — | |||||||||||||||||
|
|
|
|
|
|
|
|
|
|
|
|
|
|||||||||||||
| — | 770,000 | — | 4,924 | (4,924 | ) | 770,000 | ||||||||||||||||||
|
|
|
|
|
|
|
|
|
|
|
|
|
|||||||||||||
| Other |
||||||||||||||||||||||||
| Deferred income taxes |
— | 132,841 | 53,497 | 3,485 | — | 189,823 | ||||||||||||||||||
| Compensation and benefits |
— | 121,606 | 76 | — | — | 121,682 | ||||||||||||||||||
| Other long-term liabilities |
— | 48,070 | 24,932 | 150 | — | 73,152 | ||||||||||||||||||
|
|
|
|
|
|
|
|
|
|
|
|
|
|||||||||||||
| — | 302,517 | 78,505 | 3,635 | — | 384,657 | |||||||||||||||||||
|
|
|
|
|
|
|
|
|
|
|
|
|
|||||||||||||
| Commitments and contingent liabilities |
||||||||||||||||||||||||
| Capital |
||||||||||||||||||||||||
| Business unit equity |
857,987 | 857,987 | 1,743,053 | 35,779 | (2,636,819 | ) | 857,987 | |||||||||||||||||
| Accumulated other comprehensive loss |
(101,304 | ) | (101,304 | ) | — | (301 | ) | 101,605 | (101,304 | ) | ||||||||||||||
|
|
|
|
|
|
|
|
|
|
|
|
|
|||||||||||||
| 756,683 | 756,683 | 1,743,053 | 35,478 | (2,535,214 | ) | 756,683 | ||||||||||||||||||
|
|
|
|
|
|
|
|
|
|
|
|
|
|||||||||||||
| Total liabilities and capital |
$ | 756,683 | $ | 1,894,813 | $ | 2,045,438 | $ | 58,100 | $ | (2,546,622 | ) | $ | 2,208,412 | |||||||||||
|
|
|
|
|
|
|
|
|
|
|
|
|
|||||||||||||
38
BZ Intermediate Holdings LLC and Subsidiaries
Consolidating Statements of Cash Flows
For the Six Months Ended June 30, 2013
(unaudited, dollars in thousands)
| BZ Intermediate Holdings LLC (Parent) |
Boise Paper Holdings and Co- issuers |
Guarantor Subsidiaries |
Nonguarantor Subsidiaries |
Eliminations | Consolidated | |||||||||||||||||||
| Cash provided by (used for) operations |
||||||||||||||||||||||||
| Net income (loss) |
$ | (3,433 | ) | $ | (3,433 | ) | $ | 42,482 | $ | 182 | $ | (39,231 | ) | $ | (3,433 | ) | ||||||||
| Items in net income (loss) not using (providing) cash |
||||||||||||||||||||||||
| Equity in net income of affiliates |
3,433 | (42,664 | ) | — | — | 39,231 | — | |||||||||||||||||
| Depreciation, depletion, and amortization of deferred financing costs and other |
— | 4,454 | 83,993 | 1,346 | — | 89,793 | ||||||||||||||||||
| Share-based compensation expense |
— | 3,076 | — | — | — | 3,076 | ||||||||||||||||||
| Pension expense |
— | 3,020 | — | — | — | 3,020 | ||||||||||||||||||
| Deferred income taxes |
— | (2,501 | ) | — | (123 | ) | — | (2,624 | ) | |||||||||||||||
| Restructuring costs |
— | — | 9,992 | — | — | 9,992 | ||||||||||||||||||
| Other |
— | 434 | 676 | 290 | — | 1,400 | ||||||||||||||||||
| Decrease (increase) in working capital |
||||||||||||||||||||||||
| Receivables |
— | (682 | ) | (12,076 | ) | (2,233 | ) | (740 | ) | (15,731 | ) | |||||||||||||
| Inventories |
— | (1 | ) | 3,691 | (1,124 | ) | — | 2,566 | ||||||||||||||||
| Prepaid expenses |
— | 990 | (3,290 | ) | 173 | — | (2,127 | ) | ||||||||||||||||
| Accounts payable and accrued liabilities |
— | (10,294 | ) | 9,935 | 659 | 740 | 1,040 | |||||||||||||||||
| Current and deferred income taxes |
— | (893 | ) | 1 | 203 | — | (689 | ) | ||||||||||||||||
| Pension payments |
— | (5,091 | ) | — | — | — | (5,091 | ) | ||||||||||||||||
| Other |
— | 720 | (338 | ) | 22 | — | 404 | |||||||||||||||||
|
|
|
|
|
|
|
|
|
|
|
|
|
|||||||||||||
| Cash provided by (used for) operations |
— | (52,865 | ) | 135,066 | (605 | ) | — | 81,596 | ||||||||||||||||
|
|
|
|
|
|
|
|
|
|
|
|
|
|||||||||||||
| Cash provided by (used for) investment |
||||||||||||||||||||||||
| Expenditures for property and equipment |
— | (3,240 | ) | (60,481 | ) | (874 | ) | — | (64,595 | ) | ||||||||||||||
| Other |
— | (434 | ) | 1,402 | (278 | ) | — | 690 | ||||||||||||||||
|
|
|
|
|
|
|
|
|
|
|
|
|
|||||||||||||
| Cash used for investment |
— | (3,674 | ) | (59,079 | ) | (1,152 | ) | — | (63,905 | ) | ||||||||||||||
|
|
|
|
|
|
|
|
|
|
|
|
|
|||||||||||||
| Cash provided by (used for) financing |
||||||||||||||||||||||||
| Payments of long-term debt |
— | (5,000 | ) | — | — | — | (5,000 | ) | ||||||||||||||||
| Payments (to) from Boise Inc., net |
(1,100 | ) | — | — | — | — | (1,100 | ) | ||||||||||||||||
| Due to (from) affiliates |
1,100 | 75,018 | (76,326 | ) | 208 | — | — | |||||||||||||||||
| Other |
— | — | — | (212 | ) | — | (212 | ) | ||||||||||||||||
|
|
|
|
|
|
|
|
|
|
|
|
|
|||||||||||||
| Cash provided by (used for) financing |
— | 70,018 | (76,326 | ) | (4 | ) | — | (6,312 | ) | |||||||||||||||
|
|
|
|
|
|
|
|
|
|
|
|
|
|||||||||||||
| Increase (decrease) in cash and cash equivalents |
— | 13,479 | (339 | ) | (1,761 | ) | — | 11,379 | ||||||||||||||||
| Balance at beginning of the period |
— | 40,801 | 516 | 8,390 | — | 49,707 | ||||||||||||||||||
|
|
|
|
|
|
|
|
|
|
|
|
|
|||||||||||||
| Balance at end of the period |
$ | — | $ | 54,280 | $ | 177 | $ | 6,629 | $ | — | $ | 61,086 | ||||||||||||
|
|
|
|
|
|
|
|
|
|
|
|
|
|||||||||||||
39
BZ Intermediate Holdings LLC and Subsidiaries
Consolidating Statements of Cash Flows
For the Six Months Ended June 30, 2012
(unaudited, dollars in thousands)
| BZ Intermediate Holdings LLC (Parent) |
Boise Paper Holdings and Co- issuers |
Guarantor Subsidiaries |
Nonguarantor Subsidiaries |
Eliminations | Consolidated | |||||||||||||||||||
| Cash provided by (used for) operations |
||||||||||||||||||||||||
| Net income |
$ | 35,000 | $ | 35,000 | $ | 102,091 | $ | 824 | $ | (137,915 | ) | $ | 35,000 | |||||||||||
| Items in net income not using (providing) cash |
||||||||||||||||||||||||
| Equity in net income of affiliates |
(35,000 | ) | (102,915 | ) | — | — | 137,915 | — | ||||||||||||||||
| Depreciation, depletion, and amortization of deferred financing costs and other |
— | 3,653 | 72,159 | 1,378 | — | 77,190 | ||||||||||||||||||
| Share-based compensation expense |
— | 2,729 | — | — | — | 2,729 | ||||||||||||||||||
| Pension expense |
— | 5,474 | — | — | — | 5,474 | ||||||||||||||||||
| Deferred income taxes |
— | 12,750 | — | (140 | ) | — | 12,610 | |||||||||||||||||
| Other |
— | 1 | 136 | (180 | ) | — | (43 | ) | ||||||||||||||||
| Decrease (increase) in working capital |
||||||||||||||||||||||||
| Receivables |
— | (1,518 | ) | (6,988 | ) | (4,389 | ) | 845 | (12,050 | ) | ||||||||||||||
| Inventories |
— | — | (19,888 | ) | (336 | ) | — | (20,224 | ) | |||||||||||||||
| Prepaid expenses |
— | 188 | (4,350 | ) | (707 | ) | — | (4,869 | ) | |||||||||||||||
| Accounts payable and accrued liabilities |
— | (16,116 | ) | (1,025 | ) | 3,925 | (845 | ) | (14,061 | ) | ||||||||||||||
| Current and deferred income taxes |
— | 7,221 | 1 | 230 | — | 7,452 | ||||||||||||||||||
| Pension payments |
— | (18,191 | ) | — | — | — | (18,191 | ) | ||||||||||||||||
| Other |
— | 2,638 | (708 | ) | 180 | — | 2,110 | |||||||||||||||||
|
|
|
|
|
|
|
|
|
|
|
|
|
|||||||||||||
| Cash provided by (used for) operations |
— | (69,086 | ) | 141,428 | 785 | — | 73,127 | |||||||||||||||||
|
|
|
|
|
|
|
|
|
|
|
|
|
|||||||||||||
| Cash provided by (used for) investment |
||||||||||||||||||||||||
| Expenditures for property and equipment |
— | (2,404 | ) | (49,741 | ) | (312 | ) | — | (52,457 | ) | ||||||||||||||
| Other |
— | 3 | 140 | 443 | — | 586 | ||||||||||||||||||
|
|
|
|
|
|
|
|
|
|
|
|
|
|||||||||||||
| Cash provided by (used for) investment |
— | (2,401 | ) | (49,601 | ) | 131 | — | (51,871 | ) | |||||||||||||||
|
|
|
|
|
|
|
|
|
|
|
|
|
|||||||||||||
| Cash provided by (used for) financing |
||||||||||||||||||||||||
| Payments of long-term debt |
— | (5,000 | ) | — | — | — | (5,000 | ) | ||||||||||||||||
| Payments (to) from Boise Inc., net |
(52,440 | ) | — | — | — | — | (52,440 | ) | ||||||||||||||||
| Due to (from) affiliates |
52,440 | 46,164 | (100,312 | ) | 1,708 | — | — | |||||||||||||||||
| Other |
— | (247 | ) | — | (1,063 | ) | — | (1,310 | ) | |||||||||||||||
|
|
|
|
|
|
|
|
|
|
|
|
|
|||||||||||||
| Cash provided by (used for) financing |
— | 40,917 | (100,312 | ) | 645 | — | (58,750 | ) | ||||||||||||||||
|
|
|
|
|
|
|
|
|
|
|
|
|
|||||||||||||
| Increase (decrease) in cash and cash equivalents |
— | (30,570 | ) | (8,485 | ) | 1,561 | — | (37,494 | ) | |||||||||||||||
| Balance at beginning of the period |
— | 82,532 | 9,737 | 4,727 | — | 96,996 | ||||||||||||||||||
|
|
|
|
|
|
|
|
|
|
|
|
|
|||||||||||||
| Balance at end of the period |
$ | — | $ | 51,962 | $ | 1,252 | $ | 6,288 | $ | — | $ | 59,502 | ||||||||||||
|
|
|
|
|
|
|
|
|
|
|
|
|
|||||||||||||
40