Attached files
| file | filename |
|---|---|
| 8-K - FORM 8-K - PACKAGING CORP OF AMERICA | d611750d8k.htm |
| EX-99.1 - EX-99.1 - PACKAGING CORP OF AMERICA | d611750dex991.htm |
| EX-99.3 - EX-99.3 - PACKAGING CORP OF AMERICA | d611750dex993.htm |
| EX-23.1 - EX-23.1 - PACKAGING CORP OF AMERICA | d611750dex231.htm |
Exhibit 99.2
Report of Independent Registered Public Accounting Firm
The Board of Directors and Stockholders
Boise Inc.:
We have audited the accompanying consolidated balance sheets of Boise Inc. and subsidiaries (the Company) as of December 31, 2012 and 2011, and the related consolidated statements of income, comprehensive income, stockholders’ equity, and cash flows for each of the years in the three-year period ended December 31, 2012. These consolidated financial statements are the responsibility of the Company’s management. Our responsibility is to express an opinion on these consolidated financial statements based on our audits.
We conducted our audits in accordance with the standards of the Public Company Accounting Oversight Board (United States). Those standards require that we plan and perform the audit to obtain reasonable assurance about whether the financial statements are free of material misstatement. An audit includes examining, on a test basis, evidence supporting the amounts and disclosures in the financial statements. An audit also includes assessing the accounting principles used and significant estimates made by management, as well as evaluating the overall financial statement presentation. We believe that our audits provide a reasonable basis for our opinion.
In our opinion, the consolidated financial statements referred to above present fairly, in all material respects, the financial position of Boise Inc. and subsidiaries as of December 31, 2012 and 2011, and the results of their operations and their cash flows for each of the years in the three-year period ended December 31, 2012, in conformity with U.S. generally accepted accounting principles.
/s/ KPMG LLP
Boise, Idaho
February 26, 2013
1
Report of Independent Registered Public Accounting Firm
The Board of Directors
Boise Inc.:
We have audited the accompanying consolidated balance sheets of BZ Intermediate Holdings LLC and subsidiaries (the Company) as of December 31, 2012 and 2011, and the related consolidated statements of income, comprehensive income, capital, and cash flows for each of the years in the three-year period ended December 31, 2012. These consolidated financial statements are the responsibility of the Company’s management. Our responsibility is to express an opinion on these consolidated financial statements based on our audits.
We conducted our audits in accordance with the standards of the Public Company Accounting Oversight Board (United States). Those standards require that we plan and perform the audit to obtain reasonable assurance about whether the financial statements are free of material misstatement. An audit includes examining, on a test basis, evidence supporting the amounts and disclosures in the financial statements. An audit also includes assessing the accounting principles used and significant estimates made by management, as well as evaluating the overall financial statement presentation. We believe that our audits provide a reasonable basis for our opinion.
In our opinion, the consolidated financial statements referred to above present fairly, in all material respects, the financial position of BZ Intermediate Holdings LLC and subsidiaries as of December 31, 2012 and 2011, and the results of their operations and their cash flows for each of the years in the three-year period ended December 31, 2012, in conformity with U.S. generally accepted accounting principles.
/s/ KPMG LLP
Boise, Idaho
February 26, 2013
2
Boise Inc.
Consolidated Statements of Income
(dollars and shares in thousands, except per-share data)
| Year Ended December 31 | ||||||||||||
| 2012 | 2011 | 2010 | ||||||||||
| Sales |
||||||||||||
| Trade |
$ | 2,495,092 | $ | 2,364,024 | $ | 2,058,132 | ||||||
| Related parties |
60,271 | 40,057 | 35,645 | |||||||||
|
|
|
|
|
|
|
|||||||
| 2,555,363 | 2,404,081 | 2,093,777 | ||||||||||
|
|
|
|
|
|
|
|||||||
| Costs and expenses |
||||||||||||
| Materials, labor, and other operating expenses (excluding depreciation) |
2,004,044 | 1,880,271 | 1,634,039 | |||||||||
| Fiber costs from related parties |
19,772 | 18,763 | 25,259 | |||||||||
| Depreciation, amortization, and depletion |
152,306 | 143,758 | 129,926 | |||||||||
| Selling and distribution expenses |
121,827 | 107,654 | 58,107 | |||||||||
| General and administrative expenses |
79,748 | 60,587 | 52,273 | |||||||||
| St. Helens charges |
27,559 | — | — | |||||||||
| Other (income) expense, net |
2,572 | 1,994 | 213 | |||||||||
|
|
|
|
|
|
|
|||||||
| 2,407,828 | 2,213,027 | 1,899,817 | ||||||||||
|
|
|
|
|
|
|
|||||||
| Income from operations |
147,535 | 191,054 | 193,960 | |||||||||
|
|
|
|
|
|
|
|||||||
| Foreign exchange gain |
179 | 135 | 890 | |||||||||
| Loss on extinguishment of debt |
— | (2,300 | ) | (22,225 | ) | |||||||
| Interest expense |
(61,740 | ) | (63,817 | ) | (64,825 | ) | ||||||
| Interest income |
160 | 269 | 306 | |||||||||
|
|
|
|
|
|
|
|||||||
| (61,401 | ) | (65,713 | ) | (85,854 | ) | |||||||
|
|
|
|
|
|
|
|||||||
| Income before income taxes |
86,134 | 125,341 | 108,106 | |||||||||
| Income tax provision |
(33,984 | ) | (50,131 | ) | (45,372 | ) | ||||||
|
|
|
|
|
|
|
|||||||
| Net income |
$ | 52,150 | $ | 75,210 | $ | 62,734 | ||||||
|
|
|
|
|
|
|
|||||||
| Weighted average common shares outstanding: |
||||||||||||
| Basic |
99,872 | 101,941 | 80,461 | |||||||||
| Diluted |
101,143 | 106,746 | 84,131 | |||||||||
| Net income per common share: |
||||||||||||
| Basic |
$ | 0.52 | $ | 0.74 | $ | 0.78 | ||||||
| Diluted |
$ | 0.52 | $ | 0.70 | $ | 0.75 | ||||||
See accompanying notes to consolidated financial statements.
1
Boise Inc.
Consolidated Statements of Comprehensive Income
(dollars in thousands)
| Year Ended December 31 | ||||||||||||
| 2012 | 2011 | 2010 | ||||||||||
| Net income |
$ | 52,150 | $ | 75,210 | $ | 62,734 | ||||||
| Other comprehensive income (loss), net of tax |
||||||||||||
| Foreign currency translation adjustment, net of tax of $76, $0, and $0, respectively |
50 | (352 | ) | — | ||||||||
| Cash flow hedges: |
||||||||||||
| Change in fair value, net of tax of $534, ($2,611), and $0, respectively |
850 | (4,165 | ) | — | ||||||||
| Loss included in net income, net of tax of $1,015, $291, and $131, respectively |
1,622 | 463 | 553 | |||||||||
| Actuarial gain (loss) and prior service cost (including related amortization) for defined benefit pension plans, net of tax of $11,303, ($24,540), and ($4,892), respectively |
18,033 | (39,149 | ) | (7,744 | ) | |||||||
| Other, net of tax of ($13), ($10), and ($53), respectively |
103 | 63 | (78 | ) | ||||||||
|
|
|
|
|
|
|
|||||||
| 20,658 | (43,140 | ) | (7,269 | ) | ||||||||
|
|
|
|
|
|
|
|||||||
| Comprehensive income |
$ | 72,808 | $ | 32,070 | $ | 55,465 | ||||||
|
|
|
|
|
|
|
|||||||
See accompanying notes to consolidated financial statements.
2
Boise Inc.
Consolidated Balance Sheets
(dollars in thousands)
| December 31 | ||||||||
| 2012 | 2011 | |||||||
| ASSETS |
||||||||
| Current |
||||||||
| Cash and cash equivalents |
$ | 49,707 | $ | 96,996 | ||||
| Receivables |
||||||||
| Trade, less allowances of $1,382 and $1,343 |
240,459 | 228,838 | ||||||
| Other |
8,267 | 7,622 | ||||||
| Inventories |
294,484 | 307,305 | ||||||
| Deferred income taxes |
17,955 | 20,379 | ||||||
| Prepaid and other |
8,828 | 6,944 | ||||||
|
|
|
|
|
|||||
| 619,700 | 668,084 | |||||||
|
|
|
|
|
|||||
| Property |
||||||||
| Property and equipment, net |
1,223,001 | 1,235,269 | ||||||
| Fiber farms |
24,311 | 21,193 | ||||||
|
|
|
|
|
|||||
| 1,247,312 | 1,256,462 | |||||||
|
|
|
|
|
|||||
| Deferred financing costs |
26,677 | 30,956 | ||||||
| Goodwill |
160,130 | 161,691 | ||||||
| Intangible assets, net |
147,564 | 159,120 | ||||||
| Other assets |
7,029 | 9,757 | ||||||
|
|
|
|
|
|||||
| Total assets |
$ | 2,208,412 | $ | 2,286,070 | ||||
|
|
|
|
|
|||||
See accompanying notes to consolidated financial statements.
3
Boise Inc.
Consolidated Balance Sheets (continued)
(dollars and shares in thousands, except per-share data)
| December 31 | ||||||||
| 2012 | 2011 | |||||||
| LIABILITIES AND STOCKHOLDERS’ EQUITY |
||||||||
| Current |
||||||||
| Current portion of long-term debt |
$ | 10,000 | $ | 10,000 | ||||
| Accounts payable |
185,078 | 202,584 | ||||||
| Accrued liabilities |
||||||||
| Compensation and benefits |
70,950 | 64,907 | ||||||
| Interest payable |
10,516 | 10,528 | ||||||
| Other |
20,528 | 22,540 | ||||||
|
|
|
|
|
|||||
| 297,072 | 310,559 | |||||||
|
|
|
|
|
|||||
| Debt |
||||||||
| Long-term debt, less current portion |
770,000 | 790,000 | ||||||
|
|
|
|
|
|||||
| Other |
||||||||
| Deferred income taxes |
198,370 | 161,260 | ||||||
| Compensation and benefits |
121,682 | 172,394 | ||||||
| Other long-term liabilities |
73,102 | 57,010 | ||||||
|
|
|
|
|
|||||
| 393,154 | 390,664 | |||||||
|
|
|
|
|
|||||
| Commitments and contingent liabilities |
||||||||
| Stockholders’ equity |
||||||||
| Preferred stock, $0.0001 par value per share: 1,000 shares authorized; none issued |
— | — | ||||||
| Common stock, $0.0001 par value per share: 250,000 shares authorized; 100,503 and 100,272 shares issued and outstanding |
12 | 12 | ||||||
| Treasury stock, 21,151 shares held |
(121,423 | ) | (121,421 | ) | ||||
| Additional paid-in capital |
868,840 | 866,901 | ||||||
| Accumulated other comprehensive income (loss) |
(101,304 | ) | (121,962 | ) | ||||
| Retained earnings |
102,061 | 171,317 | ||||||
|
|
|
|
|
|||||
| Total stockholders’ equity |
748,186 | 794,847 | ||||||
|
|
|
|
|
|||||
| Total liabilities and stockholders’ equity |
$ | 2,208,412 | $ | 2,286,070 | ||||
|
|
|
|
|
|||||
See accompanying notes to consolidated financial statements.
4
Boise Inc.
Consolidated Statements of Cash Flows
(dollars in thousands)
| Year Ended December 31 | ||||||||||||
| 2012 | 2011 | 2010 | ||||||||||
| Cash provided by (used for) operations |
||||||||||||
| Net income |
$ | 52,150 | $ | 75,210 | $ | 62,734 | ||||||
| Items in net income not using (providing) cash |
||||||||||||
| Depreciation, depletion, and amortization of deferred financing costs and other |
157,040 | 149,715 | 137,495 | |||||||||
| Share-based compensation expense |
5,983 | 3,695 | 3,733 | |||||||||
| Pension expense |
11,279 | 10,916 | 9,241 | |||||||||
| Deferred income taxes |
33,684 | 44,301 | 38,884 | |||||||||
| St. Helens charges |
28,481 | — | — | |||||||||
| Other |
1,868 | 1,878 | 95 | |||||||||
| Loss on extinguishment of debt |
— | 2,300 | 22,225 | |||||||||
| Decrease (increase) in working capital, net of acquisitions |
||||||||||||
| Receivables |
(9,803 | ) | 1,624 | 57,255 | ||||||||
| Inventories |
8,136 | (22,237 | ) | (17,120 | ) | |||||||
| Prepaid expenses |
(814 | ) | (275 | ) | 4,690 | |||||||
| Accounts payable and accrued liabilities |
(16,505 | ) | 3,803 | (6,690 | ) | |||||||
| Current and deferred income taxes |
(1,938 | ) | 4,632 | 5,585 | ||||||||
| Pension payments |
(35,205 | ) | (25,414 | ) | (25,174 | ) | ||||||
| Other |
674 | 43 | (3,172 | ) | ||||||||
|
|
|
|
|
|
|
|||||||
| Cash provided by operations |
235,030 | 250,191 | 289,781 | |||||||||
|
|
|
|
|
|
|
|||||||
| Cash provided by (used for) investment |
||||||||||||
| Acquisition of businesses and facilities, net of cash acquired |
— | (326,223 | ) | — | ||||||||
| Expenditures for property and equipment |
(137,642 | ) | (128,762 | ) | (111,619 | ) | ||||||
| Purchases of short-term investments |
— | (3,494 | ) | (25,336 | ) | |||||||
| Maturities of short-term investments |
— | 14,114 | 24,744 | |||||||||
| Other |
1,393 | 1,048 | 2,941 | |||||||||
|
|
|
|
|
|
|
|||||||
| Cash used for investment |
(136,249 | ) | (443,317 | ) | (109,270 | ) | ||||||
|
|
|
|
|
|
|
|||||||
| Cash provided by (used for) financing |
||||||||||||
| Issuances of long-term debt |
5,000 | 275,000 | 300,000 | |||||||||
| Payments of long-term debt |
(25,000 | ) | (256,831 | ) | (334,096 | ) | ||||||
| Payments of financing costs |
(188 | ) | (8,613 | ) | (12,003 | ) | ||||||
| Repurchases of common stock |
(2 | ) | (121,421 | ) | — | |||||||
| Proceeds from exercise of warrants |
— | 284,785 | 638 | |||||||||
| Payments of special dividends |
(119,653 | ) | (47,916 | ) | (32,276 | ) | ||||||
| Tax withholdings on net settlements of share-based awards |
(5,833 | ) | (2,775 | ) | (1,629 | ) | ||||||
| Other |
(394 | ) | 1,060 | (3,705 | ) | |||||||
|
|
|
|
|
|
|
|||||||
| Cash provided by (used for) financing |
(146,070 | ) | 123,289 | (83,071 | ) | |||||||
|
|
|
|
|
|
|
|||||||
| Increase (decrease) in cash and cash equivalents |
(47,289 | ) | (69,837 | ) | 97,440 | |||||||
| Balance at beginning of the period |
96,996 | 166,833 | 69,393 | |||||||||
|
|
|
|
|
|
|
|||||||
| Balance at end of the period |
$ | 49,707 | $ | 96,996 | $ | 166,833 | ||||||
|
|
|
|
|
|
|
|||||||
See accompanying notes to consolidated financial statements.
5
Boise Inc.
Consolidated Statements of Stockholders’ Equity
(dollars and shares in thousands)
| Stockholders’ Equity | ||||||||||||||||||||||||||||||||||||
| Preferred Stock |
Common Stock | Treasury Stock | Additional Paid-In |
Accumulated Other Comprehensive |
Retained | |||||||||||||||||||||||||||||||
| Shares | Amount | Shares | Amount | Capital | Income (Loss) | Earnings | Total | |||||||||||||||||||||||||||||
| Balance at December 31, 2009 |
$ | — | 84,419 | $ | 8 | — | $ | — | $ | 578,669 | $ | (71,553 | ) | $ | 113,811 | $ | 620,935 | |||||||||||||||||||
|
|
|
|
|
|
|
|
|
|
|
|
|
|
|
|
|
|
|
|||||||||||||||||||
| Net income |
62,734 | 62,734 | ||||||||||||||||||||||||||||||||||
| Other comprehensive loss, net of tax |
(7,269 | ) | (7,269 | ) | ||||||||||||||||||||||||||||||||
| Dividends declared |
(32,338 | ) | (32,338 | ) | ||||||||||||||||||||||||||||||||
| Warrants exercised |
85 | — | 638 | 638 | ||||||||||||||||||||||||||||||||
| Share-based compensation awards |
562 | — | 3,733 | 3,733 | ||||||||||||||||||||||||||||||||
| Restricted stock withheld for taxes |
(221 | ) | — | (1,629 | ) | (1,629 | ) | |||||||||||||||||||||||||||||
| Other |
31 | 31 | ||||||||||||||||||||||||||||||||||
|
|
|
|
|
|
|
|
|
|
|
|
|
|
|
|
|
|
|
|||||||||||||||||||
| Balance at December 31, 2010 |
$ | — | 84,845 | $ | 8 | — | $ | — | $ | 581,442 | $ | (78,822 | ) | $ | 144,207 | $ | 646,835 | |||||||||||||||||||
|
|
|
|
|
|
|
|
|
|
|
|
|
|
|
|
|
|
|
|||||||||||||||||||
| Net income |
75,210 | 75,210 | ||||||||||||||||||||||||||||||||||
| Other comprehensive loss, net of tax |
(43,140 | ) | (43,140 | ) | ||||||||||||||||||||||||||||||||
| Dividends declared |
(48,100 | ) | (48,100 | ) | ||||||||||||||||||||||||||||||||
| Warrants exercised |
38,407 | 4 | 284,781 | 284,785 | ||||||||||||||||||||||||||||||||
| Repurchases of common stock |
(21,151 | ) | — | 21,151 | (121,421 | ) | (121,421 | ) | ||||||||||||||||||||||||||||
| Share-based compensation awards |
(1,579 | ) | — | 3,695 | 3,695 | |||||||||||||||||||||||||||||||
| Restricted stock withheld for taxes |
(250 | ) | — | (2,775 | ) | (2,775 | ) | |||||||||||||||||||||||||||||
| Other |
(242 | ) | (242 | ) | ||||||||||||||||||||||||||||||||
|
|
|
|
|
|
|
|
|
|
|
|
|
|
|
|
|
|
|
|||||||||||||||||||
| Balance at December 31, 2011 |
$ | — | 100,272 | $ | 12 | 21,151 | $ | (121,421 | ) | $ | 866,901 | $ | (121,962 | ) | $ | 171,317 | $ | 794,847 | ||||||||||||||||||
|
|
|
|
|
|
|
|
|
|
|
|
|
|
|
|
|
|
|
|||||||||||||||||||
| Net income |
52,150 | 52,150 | ||||||||||||||||||||||||||||||||||
| Other comprehensive income, net of tax |
20,658 | 20,658 | ||||||||||||||||||||||||||||||||||
| Dividends declared |
(121,406 | ) | (121,406 | ) | ||||||||||||||||||||||||||||||||
| Repurchases of common stock |
— | — | — | (2 | ) | (2 | ) | |||||||||||||||||||||||||||||
| Share-based compensation awards |
695 | — | 5,983 | 5,983 | ||||||||||||||||||||||||||||||||
| Restricted stock withheld for taxes |
(464 | ) | — | (5,833 | ) | (5,833 | ) | |||||||||||||||||||||||||||||
| Dividends accrued on share-based awards |
1,125 | 1,125 | ||||||||||||||||||||||||||||||||||
| Other |
664 | 664 | ||||||||||||||||||||||||||||||||||
|
|
|
|
|
|
|
|
|
|
|
|
|
|
|
|
|
|
|
|||||||||||||||||||
| Balance at December 31, 2012 |
$ | — | 100,503 | $ | 12 | 21,151 | $ | (121,423 | ) | $ | 868,840 | $ | (101,304 | ) | $ | 102,061 | $ | 748,186 | ||||||||||||||||||
|
|
|
|
|
|
|
|
|
|
|
|
|
|
|
|
|
|
|
|||||||||||||||||||
See accompanying notes to consolidated financial statements.
6
BZ Intermediate Holdings LLC
Consolidated Statements of Income
(dollars in thousands)
| Year Ended December 31 | ||||||||||||
| 2012 | 2011 | 2010 | ||||||||||
| Sales |
||||||||||||
| Trade |
$ | 2,495,092 | $ | 2,364,024 | $ | 2,058,132 | ||||||
| Related parties |
60,271 | 40,057 | 35,645 | |||||||||
|
|
|
|
|
|
|
|||||||
| 2,555,363 | 2,404,081 | 2,093,777 | ||||||||||
|
|
|
|
|
|
|
|||||||
| Costs and expenses |
||||||||||||
| Materials, labor, and other operating expenses (excluding depreciation) |
2,004,044 | 1,880,271 | 1,634,039 | |||||||||
| Fiber costs from related parties |
19,772 | 18,763 | 25,259 | |||||||||
| Depreciation, amortization, and depletion |
152,306 | 143,758 | 129,926 | |||||||||
| Selling and distribution expenses |
121,827 | 107,654 | 58,107 | |||||||||
| General and administrative expenses |
79,748 | 60,587 | 52,273 | |||||||||
| St. Helens charges |
27,559 | — | — | |||||||||
| Other (income) expense, net |
2,572 | 1,994 | 213 | |||||||||
|
|
|
|
|
|
|
|||||||
| 2,407,828 | 2,213,027 | 1,899,817 | ||||||||||
|
|
|
|
|
|
|
|||||||
| Income from operations |
147,535 | 191,054 | 193,960 | |||||||||
|
|
|
|
|
|
|
|||||||
| Foreign exchange gain |
179 | 135 | 890 | |||||||||
| Loss on extinguishment of debt |
— | (2,300 | ) | (22,225 | ) | |||||||
| Interest expense |
(61,740 | ) | (63,817 | ) | (64,825 | ) | ||||||
| Interest income |
160 | 269 | 306 | |||||||||
|
|
|
|
|
|
|
|||||||
| (61,401 | ) | (65,713 | ) | (85,854 | ) | |||||||
|
|
|
|
|
|
|
|||||||
| Income before income taxes |
86,134 | 125,341 | 108,106 | |||||||||
| Income tax provision |
(33,984 | ) | (50,131 | ) | (44,529 | ) | ||||||
|
|
|
|
|
|
|
|||||||
| Net income |
$ | 52,150 | $ | 75,210 | $ | 63,577 | ||||||
|
|
|
|
|
|
|
|||||||
See accompanying notes to consolidated financial statements.
7
BZ Intermediate Holdings LLC
Consolidated Statements of Comprehensive Income
(dollars in thousands)
| Year Ended December 31 | ||||||||||||
| 2012 | 2011 | 2010 | ||||||||||
| Net income |
$ | 52,150 | $ | 75,210 | $ | 63,577 | ||||||
| Other comprehensive income (loss), net of tax |
||||||||||||
| Foreign currency translation adjustment, net of tax of $76, $0, and $0, respectively |
50 | (352 | ) | — | ||||||||
| Cash flow hedges: |
||||||||||||
| Change in fair value, net of tax of $534, ($2,611), and $0, respectively |
850 | (4,165 | ) | — | ||||||||
| Loss included in net income, net of tax of $1,015, $291, and $131, respectively |
1,622 | 463 | 553 | |||||||||
| Actuarial gain (loss) and prior service cost (including related amortization) for defined benefit pension plans, net of tax of $11,303, ($24,540), and ($4,892), respectively |
18,033 | (39,149 | ) | (7,744 | ) | |||||||
| Other, net of tax of ($13), ($10), and ($53), respectively |
103 | 63 | (78 | ) | ||||||||
|
|
|
|
|
|
|
|||||||
| 20,658 | (43,140 | ) | (7,269 | ) | ||||||||
|
|
|
|
|
|
|
|||||||
| Comprehensive income |
$ | 72,808 | $ | 32,070 | $ | 56,308 | ||||||
|
|
|
|
|
|
|
|||||||
See accompanying notes to consolidated financial statements.
8
BZ Intermediate Holdings LLC
Consolidated Balance Sheets
(dollars in thousands)
| December 31 | ||||||||
| 2012 | 2011 | |||||||
| ASSETS |
||||||||
| Current |
||||||||
| Cash and cash equivalents |
$ | 49,707 | $ | 96,996 | ||||
| Receivables |
||||||||
| Trade, less allowances of $1,382 and $1,343 |
240,459 | 228,838 | ||||||
| Other |
8,267 | 7,622 | ||||||
| Inventories |
294,484 | 307,305 | ||||||
| Deferred income taxes |
17,955 | 20,379 | ||||||
| Prepaid and other |
8,828 | 6,944 | ||||||
|
|
|
|
|
|||||
| 619,700 | 668,084 | |||||||
|
|
|
|
|
|||||
| Property |
||||||||
| Property and equipment, net |
1,223,001 | 1,235,269 | ||||||
| Fiber farms |
24,311 | 21,193 | ||||||
|
|
|
|
|
|||||
| 1,247,312 | 1,256,462 | |||||||
|
|
|
|
|
|||||
| Deferred financing costs |
26,677 | 30,956 | ||||||
| Goodwill |
160,130 | 161,691 | ||||||
| Intangible assets, net |
147,564 | 159,120 | ||||||
| Other assets |
7,029 | 9,757 | ||||||
|
|
|
|
|
|||||
| Total assets |
$ | 2,208,412 | $ | 2,286,070 | ||||
|
|
|
|
|
|||||
See accompanying notes to consolidated financial statements.
9
BZ Intermediate Holdings LLC
Consolidated Balance Sheets (continued)
(dollars in thousands)
| December 31 | ||||||||
| 2012 | 2011 | |||||||
| LIABILITIES AND CAPITAL |
||||||||
| Current |
||||||||
| Current portion of long-term debt |
$ | 10,000 | $ | 10,000 | ||||
| Accounts payable |
185,078 | 202,584 | ||||||
| Accrued liabilities |
||||||||
| Compensation and benefits |
70,950 | 64,907 | ||||||
| Interest payable |
10,516 | 10,528 | ||||||
| Other |
20,528 | 22,540 | ||||||
|
|
|
|
|
|||||
| 297,072 | 310,559 | |||||||
|
|
|
|
|
|||||
| Debt |
||||||||
| Long-term debt, less current portion |
770,000 | 790,000 | ||||||
|
|
|
|
|
|||||
| Other |
||||||||
| Deferred income taxes |
189,823 | 152,712 | ||||||
| Compensation and benefits |
121,682 | 172,394 | ||||||
| Other long-term liabilities |
73,152 | 57,061 | ||||||
|
|
|
|
|
|||||
| 384,657 | 382,167 | |||||||
|
|
|
|
|
|||||
| Commitments and contingent liabilities |
||||||||
| Capital |
||||||||
| Business unit equity |
857,987 | 925,306 | ||||||
| Accumulated other comprehensive income (loss) |
(101,304 | ) | (121,962 | ) | ||||
|
|
|
|
|
|||||
| 756,683 | 803,344 | |||||||
|
|
|
|
|
|||||
| Total liabilities and capital |
$ | 2,208,412 | $ | 2,286,070 | ||||
|
|
|
|
|
|||||
See accompanying notes to consolidated financial statements.
10
BZ Intermediate Holdings LLC
Consolidated Statements of Cash Flows
(dollars in thousands)
| Year Ended December 31 | ||||||||||||
| 2012 | 2011 | 2010 | ||||||||||
| Cash provided by (used for) operations |
||||||||||||
| Net income |
$ | 52,150 | $ | 75,210 | $ | 63,577 | ||||||
| Items in net income not using (providing) cash |
||||||||||||
| Depreciation, depletion, and amortization of deferred financing costs and other |
157,040 | 149,715 | 137,495 | |||||||||
| Share-based compensation expense |
5,983 | 3,695 | 3,733 | |||||||||
| Pension expense |
11,279 | 10,916 | 9,241 | |||||||||
| Deferred income taxes |
33,684 | 44,446 | 37,882 | |||||||||
| St. Helens charges |
28,481 | — | — | |||||||||
| Other |
1,868 | 1,878 | 95 | |||||||||
| Loss on extinguishment of debt |
— | 2,300 | 22,225 | |||||||||
| Decrease (increase) in working capital, net of acquisitions |
||||||||||||
| Receivables |
(9,803 | ) | 1,624 | 57,255 | ||||||||
| Inventories |
8,136 | (22,237 | ) | (17,120 | ) | |||||||
| Prepaid expenses |
(814 | ) | (275 | ) | 4,690 | |||||||
| Accounts payable and accrued liabilities |
(16,505 | ) | 3,803 | (6,690 | ) | |||||||
| Current and deferred income taxes |
(1,938 | ) | 4,487 | 5,744 | ||||||||
| Pension payments |
(35,205 | ) | (25,414 | ) | (25,174 | ) | ||||||
| Other |
674 | 43 | (3,172 | ) | ||||||||
|
|
|
|
|
|
|
|||||||
| Cash provided by operations |
235,030 | 250,191 | 289,781 | |||||||||
|
|
|
|
|
|
|
|||||||
| Cash provided by (used for) investment |
||||||||||||
| Acquisition of businesses and facilities, net of cash acquired |
— | (326,223 | ) | — | ||||||||
| Expenditures for property and equipment |
(137,642 | ) | (128,762 | ) | (111,619 | ) | ||||||
| Purchases of short-term investments |
— | (3,494 | ) | (25,336 | ) | |||||||
| Maturities of short-term investments |
— | 14,114 | 24,744 | |||||||||
| Other |
1,393 | 1,048 | 2,941 | |||||||||
|
|
|
|
|
|
|
|||||||
| Cash used for investment |
(136,249 | ) | (443,317 | ) | (109,270 | ) | ||||||
|
|
|
|
|
|
|
|||||||
| Cash provided by (used for) financing |
||||||||||||
| Issuances of long-term debt |
5,000 | 275,000 | 300,000 | |||||||||
| Payments of long-term debt |
(25,000 | ) | (256,831 | ) | (334,096 | ) | ||||||
| Payments of financing costs |
(188 | ) | (8,613 | ) | (12,003 | ) | ||||||
| Payments (to) from Boise Inc., net |
(124,824 | ) | 115,196 | (31,639 | ) | |||||||
| Other |
(1,058 | ) | (1,463 | ) | (5,333 | ) | ||||||
|
|
|
|
|
|
|
|||||||
| Cash provided by (used for) financing |
(146,070 | ) | 123,289 | (83,071 | ) | |||||||
|
|
|
|
|
|
|
|||||||
| Increase (decrease) in cash and cash equivalents |
(47,289 | ) | (69,837 | ) | 97,440 | |||||||
| Balance at beginning of the period |
96,996 | 166,833 | 69,393 | |||||||||
|
|
|
|
|
|
|
|||||||
| Balance at end of the period |
$ | 49,707 | $ | 96,996 | $ | 166,833 | ||||||
|
|
|
|
|
|
|
|||||||
See accompanying notes to consolidated financial statements.
11
BZ Intermediate Holdings LLC
Consolidated Statements of Capital
(dollars in thousands)
| Capital | ||||||||||||
| Business Unit Equity |
Accumulated Other Comprehensive Income (Loss) |
Total | ||||||||||
| Balance at December 31, 2009 |
$ | 700,143 | $ | (71,553 | ) | $ | 628,590 | |||||
|
|
|
|
|
|
|
|||||||
| Net income |
63,577 | 63,577 | ||||||||||
| Other comprehensive loss, net of tax |
(7,269 | ) | (7,269 | ) | ||||||||
| Net equity transactions with Boise Inc. |
(29,566 | ) | (29,566 | ) | ||||||||
|
|
|
|
|
|
|
|||||||
| Balance at December 31, 2010 |
$ | 734,154 | $ | (78,822 | ) | $ | 655,332 | |||||
|
|
|
|
|
|
|
|||||||
| Net income |
75,210 | 75,210 | ||||||||||
| Other comprehensive loss, net of tax |
(43,140 | ) | (43,140 | ) | ||||||||
| Net equity transactions with Boise Inc. |
115,942 | 115,942 | ||||||||||
|
|
|
|
|
|
|
|||||||
| Balance at December 31, 2011 |
$ | 925,306 | $ | (121,962 | ) | $ | 803,344 | |||||
|
|
|
|
|
|
|
|||||||
| Net income |
52,150 | 52,150 | ||||||||||
| Other comprehensive income, net of tax |
20,658 | 20,658 | ||||||||||
| Net equity transactions with Boise Inc. |
(119,469 | ) | (119,469 | ) | ||||||||
|
|
|
|
|
|
|
|||||||
| Balance at December 31, 2012 |
$ | 857,987 | $ | (101,304 | ) | $ | 756,683 | |||||
|
|
|
|
|
|
|
|||||||
See accompanying notes to consolidated financial statements.
12
Notes to Consolidated Financial Statements
1. Nature of Operations and Basis of Presentation
Boise Inc. is a large, diverse manufacturer and seller of packaging and paper products. Our operations began on February 22, 2008, when we acquired the packaging and paper assets of Boise Cascade Holdings, L.L.C. (Boise Cascade). We are headquartered in Boise, Idaho, and we operate largely in the United States but also have operations in Europe, Mexico, and Canada. We manufacture and sell corrugated containers and sheets, protective packaging products and papers associated with packaging, such as label and release papers, and newsprint. Additionally, we manufacture linerboard, which when combined with corrugating medium is used in the manufacture of corrugated sheets and containers. The term containerboard is used to describe linerboard, corrugating medium, or a combination of the two.
Our organizational structure is noted below:
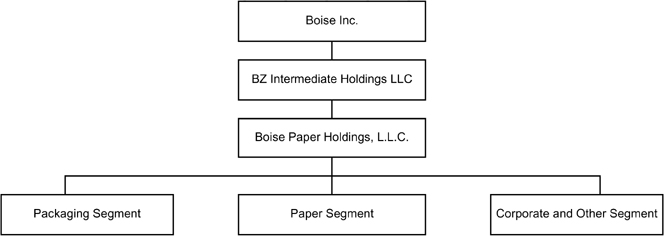
See Note 17, Segment Information, for additional information about our three reportable segments, Packaging, Paper, and Corporate and Other (support services).
The consolidated financial statements included herein are those of the following:
| • | Boise Inc. and its wholly owned subsidiaries, including BZ Intermediate Holdings LLC (BZ Intermediate). |
| • | BZ Intermediate and its wholly owned subsidiaries, including Boise Paper Holdings, L.L.C. (Boise Paper Holdings). |
In these consolidated financial statements, unless the context indicates otherwise, the terms “the Company,” “we,” “us,” “our,” or “Boise” refer to Boise Inc. and its consolidated subsidiaries, including BZ Intermediate. There are no significant differences between the results of operations, financial condition, and cash flows of Boise Inc. and those of BZ Intermediate other than income taxes and common stock activity. Some amounts in prior periods’ consolidated financial statements have been reclassified to conform with the current period’s presentation, none of which were considered material.
2. Summary of Significant Accounting Policies
Consolidation and Use of Estimates
The consolidated financial statements include the accounts of Boise Inc. and its subsidiaries after elimination of intercompany balances and transactions. The preparation of financial statements in conformity with accounting principles generally accepted in the United States of America requires management to make estimates and assumptions about future events. These estimates and the underlying assumptions affect the amounts of assets and liabilities reported, disclosures about contingent assets and liabilities, and reported amounts of revenues and expenses. Such estimates include the valuation of accounts receivable, inventories, goodwill, intangible assets, and asset retirement obligations; assumptions used in retirement benefit obligations; the recognition, measurement, and valuation of income taxes; the determination and allocation of the fair values of assets acquired and liabilities assumed in acquisitions; and assessment of the recoverability of long-lived assets. These estimates and
13
assumptions are based on management’s best estimates and judgment. Management evaluates its estimates and assumptions on an ongoing basis using historical experience and other factors, including the current economic environment, which management believes to be reasonable under the circumstances. We adjust such estimates and assumptions when facts and circumstances dictate. As future events and their effects cannot be determined with precision, actual results could differ significantly from these estimates. Changes in these estimates resulting from continuing changes in the economic environment will be reflected in the consolidated financial statements in future periods.
Revenue Recognition
We recognize revenue when the following criteria are met: persuasive evidence of an agreement exists, delivery has occurred or services have been rendered, our price to the buyer is fixed or determinable, and collectibility is reasonably assured. Delivery is not considered to have occurred until the customer takes title and assumes the risks and rewards of ownership. The timing of revenue recognition is dependent on shipping terms. Revenue is recorded at the time of shipment for terms designated freight on board (FOB) shipping point. For sales transactions designated FOB destination, revenue is recorded when the product is delivered to the customer’s delivery site. Fees for shipping and handling charged to customers for sales transactions are included in “Sales”. Costs related to shipping and handling are included in “Materials, labor, and other operating expenses (excluding depreciation)”. We present taxes collected from customers and remitted to governmental authorities on a net basis in our Consolidated Statements of Income.
Share-Based Compensation
We recognize compensation expense for awards granted under the Boise Inc. Incentive and Performance Plan (the Plan) based on the fair value on the grant date. We recognize the cost of the equity awards over the period the awards vest. See Note 11, Share-Based Compensation, for more information.
Advertising Costs
We expense advertising costs as incurred. These expenses are generally recorded in “Selling and distribution expenses” in our Consolidated Statements of Income. For the years ended December 31, 2012 and 2011, advertising costs were $3.8 million in both periods, compared with $3.0 million in 2010.
Foreign Currency
Local currencies are the functional currencies for our operations outside the United States. Assets and liabilities are remeasured into U.S. dollars using the exchange rates as of the Consolidated Balance Sheet date. Revenue and expense items are remeasured into U.S. dollars using an average exchange rate prevailing during the period. Any resulting translation adjustments are recorded in the Consolidated Statements of Comprehensive Income. The foreign exchange gain (loss) reported in the Consolidated Statements of Income resulted from remeasuring transactions into the functional currencies.
Cash and Cash Equivalents
We consider all highly liquid interest-earning investments, including time deposits and certificates of deposit, with a maturity of three months or less at the date of purchase to be cash equivalents. The fair value of these investments approximates their carrying value. Cash totaled $44.9 million and $21.9 million at December 31, 2012 and 2011, respectively. Included in the December 31, 2012 and 2011, amounts were $8.0 million and $4.3 million, respectively, of cash at our operations outside the United States. Cash equivalents totaled $4.8 million and $75.1 million, respectively, at December 31, 2012 and 2011.
Trade Accounts Receivable and Allowance for Doubtful Accounts
Trade accounts receivable are stated at the amount we expect to collect. Trade accounts receivable do not bear interest. The allowance for doubtful accounts is our best estimate of the losses we expect will result from the inability of our customers to make required payments. We determine the allowance based on a combination of actual historical loss experience and an analysis of specific customer accounts. We periodically review our allowance for doubtful accounts and adjustments to the valuation allowance are charged to income. Trade accounts receivable balances that remain outstanding after we have used reasonable collection efforts are written off through a charge to the valuation allowance and a credit to accounts receivable. We may, at times, insure or arrange for guarantees on our receivables.
14
Financial Instruments
Our financial instruments include cash and cash equivalents, short-term investments, accounts receivable, accounts payable, long-term debt, and energy hedges. The recorded values of cash and cash equivalents, short-term investments, accounts receivable, and accounts payable approximate fair values based on their short-term nature. Our long-term debt is recorded at the face value of those obligations. Our energy hedges are recorded at fair value.
We are exposed to market risks, including changes in interest rates, energy prices, and foreign currency exchange rates. We employ a variety of practices to manage these risks, including operating and financing activities and, where deemed appropriate, the use of derivative instruments. Derivative instruments are used only for risk management purposes and not for speculation or trading. Derivatives are such that a specific debt instrument, contract, or anticipated purchase determines the amount, maturity, and other specifics of the hedge. If a derivative contract is entered into, we either determine that it is an economic hedge or we designate the derivative as a cash flow or fair value hedge. We formally document all relationships between hedging instruments and the hedged items, as well as our risk management objectives and strategies for undertaking various hedged transactions. For those derivatives that are not designated as economic hedges, such as cash flow or fair value hedges, we formally assess, both at the derivatives’ inception and on an ongoing basis, whether the derivatives that are used in hedging transactions are highly effective in offsetting changes in the hedged items. Any ineffective portion of hedging transactions is recognized in income (loss).
We record all derivative instruments as assets or liabilities on our Consolidated Balance Sheets at fair value. The fair value of these instruments is determined by us using third-party valuations based on quoted prices for similar assets and liabilities. Changes in the fair value of derivatives are recorded in either “Net income (loss)” or “Other comprehensive income (loss)” as appropriate. The gain or loss on derivatives designated as cash flow hedges is included in “Other comprehensive income (loss)” in the period in which changes in fair value occur and is reclassified to income (loss) in the period in which the hedged item affects income (loss), and any ineffectiveness is recognized currently in “Net income (loss)”. The gain or loss on derivatives that have not been designated as hedging instruments is included in income (loss) in the period in which changes in fair value occur.
Fair Value Measurements
The Fair Value Measurements and Disclosures Topic of the Financial Accounting Standards Board (FASB) Accounting Standards Codification (ASC) establishes a fair value hierarchy, which prioritizes the inputs of valuation techniques used to measure fair value into three levels. The fair value hierarchy gives the highest priority to quoted market prices (Level 1) and the lowest priority to unobservable inputs (Level 3). Where applicable, we use quoted prices in active markets for identical assets or liabilities to determine fair value (Level 1). If quoted prices in active markets for identical assets or liabilities are not available to determine fair value, we use quoted prices for similar assets and liabilities or inputs that are observable either directly or indirectly (Level 2). If quoted prices for identical or similar assets are not available or are unobservable, we may use internally developed valuation models, whose inputs include bid prices and third-party valuations utilizing underlying asset assumptions (Level 3). Outstanding financial derivative instruments expose us to credit loss in the event of nonperformance by the counterparties to the agreements. We monitor credit ratings of counterparties to the agreements, which are large financial institutions, to consider the impact, if any, on the determination of fair value. No significant adjustments were made in any periods presented.
Customer Rebates and Allowances
We provide rebates to our customers based on the volume of their purchases. We provide the rebates to increase the sell-through of our products. The rebates are recorded as a decrease in “Sales, Trade” in our Consolidated Statements of Income. At December 31, 2012 and 2011, we had $20.8 million and $14.5 million, respectively, of rebates payable recorded in “Accounts payable” on our Consolidated Balance Sheets.
15
Inventory Valuation
The majority of our inventories are valued at the lower of cost or market, where cost is based on the average cost method of inventory valuation. Manufactured inventories include costs for materials, labor, and factory overhead. Other inventories are valued at the lower of either standard cost, which approximates cost based on the actual first-in, first-out usage pattern, or market.
Inventories include the following (dollars in thousands):
| December 31 | ||||||||
| 2012 | 2011 | |||||||
| Finished goods |
$ | 150,496 | $ | 155,588 | ||||
| Work in process |
41,575 | 41,172 | ||||||
| Fiber |
35,840 | 38,469 | ||||||
| Other raw materials and supplies |
66,573 | 72,076 | ||||||
|
|
|
|
|
|||||
| $ | 294,484 | $ | 307,305 | |||||
|
|
|
|
|
|||||
Property and Equipment
Property and equipment are recorded at cost. Cost includes expenditures for major improvements and replacements and the amount of interest cost associated with significant capital additions. For the years ended December 31, 2012, 2011, and 2010, capitalized interest, if any, was immaterial. Repairs and maintenance costs are expensed as incurred. When property and equipment are retired, sold, or otherwise disposed of, the asset’s carrying amount and related accumulated depreciation are removed from the accounts and any gain or loss is included in “Net income (loss)”. In all periods presented, we used the straight-line method of depreciation. We periodically assess the estimated useful lives of our assets. Changes in circumstances, such as changes to our operational or capital strategy, changes in regulation, or technological advances, may result in the actual useful lives differing from our estimates. Revisions to the estimated useful lives of assets requires judgment and constitutes a change in accounting estimate, which is accounted for prospectively by adjusting or accelerating depreciation and amortization rates.
Property and equipment consisted of the following asset classes and the following general range of estimated useful lives (dollars in thousands):
| December 31 | General Range of Estimated Useful |
|||||||||||
| 2012 | 2011 | Lives in Years | ||||||||||
| Land |
$ | 28,899 | $ | 34,735 | ||||||||
| Buildings and improvements |
260,607 | 248,174 | 9 - 40 | |||||||||
| Machinery and equipment |
1,479,212 | 1,375,069 | 3 - 20 | |||||||||
| Construction in progress |
46,538 | 44,563 | ||||||||||
|
|
|
|
|
|||||||||
| 1,815,256 | 1,702,541 | |||||||||||
| Less accumulated depreciation |
(592,255 | ) | (467,272 | ) | ||||||||
|
|
|
|
|
|||||||||
| $ | 1,223,001 | $ | 1,235,269 | |||||||||
|
|
|
|
|
|||||||||
Weighted average useful lives are approximately 27 years for buildings and improvements and 13 years for machinery and equipment. Machinery and equipment consists of the following categories of assets and the following estimated useful lives:
| Computer hardware and software |
3 - 10 | |||
| Furniture and fixtures |
3 - 10 | |||
| Vehicles |
3 - 7 | |||
| Packaging and papermaking equipment |
9 - 20 |
16
Depreciation expense for the years ended December 31, 2012, 2011, and 2010, was $134.0 million, $129.8 million, and $120.5 million, respectively.
Leases
We assess lease classification as either capital or operating at lease inception or upon modification. We lease some of our locations, as well as other property and equipment, under operating leases. For purposes of determining straight-line rent expense, the lease term is calculated from the date of possession of the facility, including any periods of free rent and any renewal option periods that are reasonably assured of being exercised.
Fiber Farms
Costs for activities related to the establishment of a new crop of trees, including planting, thinning, fertilization, pest control, herbicide application, irrigation, and land lease costs, are capitalized. The capitalized costs are accumulated by specifically identifiable farm or irrigation blocks. We charge capitalized costs, excluding land, to “Depreciation, amortization, and depletion” in the accompanying Consolidated Statements of Income at the time of harvest based on actual accumulated costs associated with the fiber cut. Costs for administration, harvesting, insurance, and property taxes are recognized in “Materials, labor and other operating expenses (excluding depreciation)” in the accompanying Consolidated Statements of Income at the time the associated fiber is utilized.
Long-Lived Asset Impairment
An impairment of long-lived assets exists when the carrying value of an asset is not recoverable through future undiscounted cash flows from operations and when the carrying value of an asset exceeds its fair value. We review the carrying value of long-lived assets for impairment when events or changes in circumstances indicate that the carrying amount of assets may not be recoverable.
Goodwill and Intangible Assets
We maintain two reporting units for purposes of our goodwill and intangible asset impairment testing, Packaging and Paper, which are the same as our operating segments discussed in Note 17, Segment Information. We test goodwill, recorded in our Packaging segment, and indefinite-lived intangible assets, recorded in our Paper segment, for impairment annually in the fourth quarter or sooner if events or changes in circumstances indicate that the carrying value of the asset may exceed fair value. Additionally, we evaluate the remaining useful lives of our finite-lived purchased intangible assets to determine whether any adjustments to the useful lives are necessary. See Note 7, Goodwill and Intangible Assets, for additional information.
Deferred Software Costs
Internal-use software is software that is developed internally, developed or modified solely to meet our needs, and for which, during the software’s development or modification, a plan does not exist to market the software externally. We defer internal-use software costs that benefit future years. These costs are amortized using the straight-line method over the expected life of the software, typically three to five years. “Other assets” in the Consolidated Balance Sheets include $6.4 million of deferred software costs at both December 31, 2012 and 2011, respectively. We amortized $1.6 million, $0.9 million, and $0.8 million of deferred software costs for the years ended December 31, 2012, 2011, and 2010, respectively.
Pension Benefits
Several estimates and assumptions are required to record pension costs and liabilities, including discount rate, return on assets, and longevity and service lives of employees. We review and update these assumptions annually unless a plan curtailment or other event occurs, requiring we update the estimates on an interim basis. While we believe the assumptions used to measure our pension obligations are reasonable, differences in actual experience or changes in assumptions may materially affect our pension obligations and future expense.
New and Recently Adopted Accounting Standards
In February 2013, the FASB issued Accounting Standards Update (ASU) 2013-02, Comprehensive Income (Topic 220): Reporting of Amounts Reclassified Out of Accumulated Other Comprehensive Income. This ASU requires entities to disclose additional information about changes in and significant items reclassified out of accumulated other comprehensive income. The guidance is effective for annual and interim reporting periods beginning after January 1, 2013. We do not believe the adoption of this update will have a material effect on our financial position and results of operations.
17
In January 2013, the FASB issued ASU 2013-01, Balance Sheet (Topic 210): Clarifying the Scope of Disclosures about Offsetting Assets and Liabilities. This ASU clarifies which instruments and transactions are subject to the offsetting disclosure requirements established by ASU 2011-11. This guidance is effective for annual and interim reporting periods beginning January 1, 2013. We do not believe the adoption of this update will have a material effect on our financial position and results of operations.
In July 2012, the FASB issued ASU 2012-02, Intangibles — Goodwill and Other (Topic 350): Testing Indefinite-Lived Intangible Assets for Impairment. This ASU gives entities testing indefinite-lived intangible assets for impairment the option first to assess qualitative factors to determine whether the existence of events and circumstances indicates that it is more likely than not that the indefinite-lived intangible asset is impaired. If, after assessing the totality of events and circumstances, an entity concludes that it is not more likely than not that the indefinite-lived intangible asset is impaired, the entity is not required to take further action. However, if an entity concludes otherwise, a quantitative impairment test is required. This guidance is effective for our annual and interim impairment tests beginning January 1, 2013, with early adoption permitted. We do not believe the adoption of this update will have a material effect on our financial position and results of operations.
In December 2011, the FASB issued ASU 2011-11, Balance Sheet (Topic 210): Disclosures about Offsetting Assets and Liabilities. This ASU improves reporting and transparency of offsetting (netting) assets and liabilities and the related effects on the financial statements. This guidance is effective for annual and interim reporting periods beginning January 1, 2013. We do not believe the adoption of this update will have a material effect on our financial position and results of operations.
In September 2011, the FASB issued ASU 2011-08, Intangibles — Goodwill and Other (Topic 350): Testing Goodwill for Impairment. This ASU gives entities testing goodwill for impairment the option of performing a qualitative assessment before calculating the fair value of a reporting unit in step 1 of the goodwill impairment test. If entities determine, on the basis of qualitative factors, that the fair value of a reporting unit is more likely than not less than the carrying amount, the two-step impairment test would be required. Otherwise, further testing would not be needed. We adopted the provisions of this guidance on January 1, 2012, and it had no effect on our financial position and results of operations.
In June 2011, the FASB issued ASU 2011-05, Comprehensive Income (Topic 220): Presentation of Comprehensive Income. This ASU increases the prominence of other comprehensive income in financial statements. Under this ASU, we have the option to present the components of net income and comprehensive income in either one or two consecutive financial statements. The ASU eliminates the option to present the components of other comprehensive income as part of the statement of equity. We adopted the provisions of ASU 2011-05 on January 1, 2012. The adoption of this guidance resulted in adding the Consolidated Statements of Comprehensive Income to our Consolidated Financial Statements.
In May 2011, the FASB issued ASU 2011-04, Fair Value Measurement (Topic 820): Amendments to Achieve Common Fair Value Measurement and Disclosure Requirements in U.S. GAAP and International Financial Reporting Standards (IFRS). This ASU was issued to provide largely identical guidance about fair value measurement and disclosure requirements for entities that disclose the fair value of an asset, a liability, or an instrument classified in shareholders’ equity in their consolidated financial statements as that provided in the International Accounting Standards Board’s new IFRS 13, Fair Value Measurement. This ASU does not extend the use of fair value but, rather, provides guidance about how fair value should be applied where it already is required or permitted under U.S. generally accepted accounting principles (GAAP). We adopted the provisions of ASU 2011-04 on January 1, 2012. The adoption of this guidance did not have a material effect on our financial statement disclosures.
There were no other accounting standards recently issued that had or are expected to have a material impact on our financial position or results of operations.
18
3. St. Helens Charges
In December 2012, we ceased paper production on our one remaining paper machine at our St. Helens, Oregon, paper mill. The cessation is a result of the machine’s inability to compete in the marketplace over the long-term, due primarily to high fiber costs and declining product demand. This reduces our annual uncoated freesheet capacity by almost 60,000 tons and results in the loss of approximately 100 jobs, primarily at the mill. The remaining machine, which is owned by Cascades Tissue Group (Cascades), continues to operate on the site, and we continue to lease Cascades supporting assets.
During the year ended December 31, 2012, we recorded $31.7 million of pretax costs in our Paper segment, related primarily to ceasing paper production at the mill. In our Consolidated Statements of Income, we recorded $27.6 million of shutdown costs in “St. Helens charges” and $4.1 million in “Materials, labor, and other operating expenses (excluding depreciation)” related to inventory write-downs and other one-time costs incurred. At December 31, 2012, $4.3 million of costs were recorded in “Accrued liabilities, Compensation and benefits”, $0.7 million in “Accrued liabilities, Other”, and $10.3 million in “Other long-term liabilities” on our Consolidated Balance Sheet.
An analysis of the St. Helens costs is as follows (in thousands):
| Noncash | Cash (a) | Total Costs | ||||||||||||
| Asset write-down |
$ | 11,144 | (b) | $ | — | $ | 11,144 | |||||||
| Inventory write-down |
1,982 | — | 1,982 | |||||||||||
| Employee-related costs |
— | 4,334 | 4,334 | |||||||||||
| Pension curtailment loss |
1,060 | — | 1,060 | |||||||||||
| Increase in asset retirement obligations (Note 15) |
— | 10,256 | 10,256 | |||||||||||
| Other |
— | 2,969 | 2,969 | |||||||||||
|
|
|
|
|
|
|
|||||||||
| $ | 14,186 | $ | 17,559 | $ | 31,745 | |||||||||
|
|
|
|
|
|
|
|||||||||
| (a) | We expect to pay approximately $7.3 million of the $17.6 million of cash costs in early 2013 and the remaining cash costs over a longer term. |
| (b) | During third quarter 2012, we assessed the St. Helens long-lived assets for impairment. Our assessment was based upon, among other things, our estimates of the amount of future net cash flows to be generated by the long-lived assets and our estimates of the current fair value of the assets (Level 3 inputs). Considerable management judgment is necessary to evaluate estimated future cash flows. The assumptions used in our impairment evaluations are consistent with our operating plans. |
4. Acquisitions
On March 1, 2011, we acquired Tharco Packaging, Inc. and its subsidiaries (Tharco) for $201.3 million (Tharco Acquisition), and on December 1, 2011, we acquired Hexacomb Corporation and its affiliated companies and all of the honeycomb packaging-related assets of Pregis Mexico (Hexacomb) for $124.9 million (Hexacomb Acquisition). We acquired 100% of the outstanding stock and voting equity interests of both Tharco and Hexacomb. The financial results for Tharco and Hexacomb are included in our Packaging segment.
During the year ended December 31, 2012, we recorded approximately $1.8 million of purchase price adjustments that decreased goodwill. These adjustments related primarily to changes in deferred tax liabilities that resulted from further analysis of the tax basis of acquired assets and liabilities and other tax adjustments.
19
5. Net Income Per Common Share
Net income per common share is computed by dividing net income by the weighted average number of shares of common stock outstanding during the period. Net income per common share is not applicable to BZ Intermediate because it does not have common shares. Boise Inc.’s basic and diluted net income per share is calculated as follows (dollars and shares in thousands, except per-share data):
| Year Ended December 31 | ||||||||||||
| 2012 | 2011 | 2010 | ||||||||||
| Net income |
$ | 52,150 | $ | 75,210 | $ | 62,734 | ||||||
| Weighted average number of common shares for basic net income per common share (a) |
99,872 | 101,941 | 80,461 | |||||||||
| Incremental effect of dilutive common stock equivalents: |
||||||||||||
| Restricted stock and restricted stock units |
999 | 2,502 | 3,670 | |||||||||
| Performance units |
268 | 87 | — | |||||||||
| Common stock warrants (b) |
— | 2,214 | — | |||||||||
| Stock options (c) |
4 | 2 | — | |||||||||
|
|
|
|
|
|
|
|||||||
| Weighted average number of common shares for diluted net income per common share |
101,143 | 106,746 | 84,131 | |||||||||
|
|
|
|
|
|
|
|||||||
| Net income per common share: |
||||||||||||
| Basic |
$ | 0.52 | $ | 0.74 | $ | 0.78 | ||||||
|
|
|
|
|
|
|
|||||||
| Diluted |
$ | 0.52 | $ | 0.70 | $ | 0.75 | ||||||
|
|
|
|
|
|
|
|||||||
| (a) | During the year ended December 31, 2011, 40.3 million warrants were exercised, resulting in the issuance of 38.4 million additional common shares. For the year ended December 31, 2011, the exercise added 25.7 million to the number of weighted average shares included in basic net income per share. |
During the year ended December 31, 2011, 21.2 million common shares were repurchased, resulting in a 5.1 million decrease in the number of weighted average shares included in basic and diluted net income per share.
| (b) | For the year ended December 31, 2010, the warrants were not included in the computation of diluted net income per share because the exercise price exceeded the average market price of our common stock. The warrants were accounted for under the treasury stock method. |
| (c) | We excluded 0.8 million and 0.3 million of stock options from the computation of diluted net income per common share because they were antidilutive for the years ended December 31, 2012 and 2011, respectively. We had no stock options outstanding during 2010. |
20
6. Income Taxes
A reconciliation of the statutory U.S. federal tax provision and the reported tax provision is as follows (dollars in thousands):
| Boise Inc. | BZ Intermediate | |||||||||||||||||||||||
| Year Ended December 31 | ||||||||||||||||||||||||
| 2012 | 2011 | 2010 | 2012 | 2011 | 2010 | |||||||||||||||||||
| Income before income taxes |
$ | 86,134 | $ | 125,341 | $ | 108,106 | $ | 86,134 | $ | 125,341 | $ | 108,106 | ||||||||||||
| Statutory U.S. income tax rate |
35.0 | % | 35.0 | % | 35.0 | % | 35.0 | % | 35.0 | % | 35.0 | % | ||||||||||||
| Statutory tax provision |
$ | 30,147 | $ | 43,870 | $ | 37,837 | $ | 30,147 | $ | 43,870 | $ | 37,837 | ||||||||||||
| Foreign rate differential |
(165 | ) | 3 | — | (165 | ) | 3 | — | ||||||||||||||||
| State taxes |
3,340 | 4,839 | 4,120 | 3,340 | 4,839 | 4,120 | ||||||||||||||||||
| Valuation allowance |
225 | 146 | 307 | 225 | 146 | 307 | ||||||||||||||||||
| Nondeductible costs |
985 | 1,476 | 652 | 985 | 1,476 | 652 | ||||||||||||||||||
| Other |
(548 | ) | (203 | ) | 2,456 | (548 | ) | (203 | ) | 1,613 | ||||||||||||||
|
|
|
|
|
|
|
|
|
|
|
|
|
|||||||||||||
| Income tax provision |
$ | 33,984 | $ | 50,131 | $ | 45,372 | $ | 33,984 | $ | 50,131 | $ | 44,529 | ||||||||||||
|
|
|
|
|
|
|
|
|
|
|
|
|
|||||||||||||
| Effective income tax provision rate |
39.5 | % | 40.0 | % | 42.0 | % | 39.5 | % | 40.0 | % | 41.2 | % | ||||||||||||
|
|
|
|
|
|
|
|
|
|
|
|
|
|||||||||||||
The income tax provision shown in the Consolidated Statements of Income includes the following (dollars in thousands):
| Boise Inc. | BZ Intermediate | |||||||||||||||||||||||
| Year Ended December 31 | ||||||||||||||||||||||||
| 2012 | 2011 | 2010 | 2012 | 2011 | 2010 | |||||||||||||||||||
| Current income tax provision (benefit) |
||||||||||||||||||||||||
| Federal |
$ | (599 | ) | $ | 2,249 | $ | 4,253 | $ | (599 | ) | $ | 2,047 | $ | 4,454 | ||||||||||
| State |
832 | 3,472 | 2,236 | 832 | 3,529 | 2,194 | ||||||||||||||||||
| Foreign |
67 | 109 | (1 | ) | 67 | 109 | (1 | ) | ||||||||||||||||
|
|
|
|
|
|
|
|
|
|
|
|
|
|||||||||||||
| Total current |
$ | 300 | $ | 5,830 | $ | 6,488 | $ | 300 | $ | 5,685 | $ | 6,647 | ||||||||||||
|
|
|
|
|
|
|
|
|
|
|
|
|
|||||||||||||
| Deferred income tax provision (benefit) |
||||||||||||||||||||||||
| Federal |
$ | 29,985 | $ | 40,778 | $ | 34,061 | $ | 29,985 | $ | 40,980 | $ | 33,151 | ||||||||||||
| State |
3,705 | 3,524 | 4,831 | 3,705 | 3,467 | 4,739 | ||||||||||||||||||
| Foreign |
(6 | ) | (1 | ) | (8 | ) | (6 | ) | (1 | ) | (8 | ) | ||||||||||||
|
|
|
|
|
|
|
|
|
|
|
|
|
|||||||||||||
| Total deferred |
$ | 33,684 | $ | 44,301 | $ | 38,884 | $ | 33,684 | $ | 44,446 | $ | 37,882 | ||||||||||||
|
|
|
|
|
|
|
|
|
|
|
|
|
|||||||||||||
| Income tax provision (a) |
$ | 33,984 | $ | 50,131 | $ | 45,372 | $ | 33,984 | $ | 50,131 | $ | 44,529 | ||||||||||||
|
|
|
|
|
|
|
|
|
|
|
|
|
|||||||||||||
| (a) | In January 2013, the U.S. President signed into law the American Taxpayer Relief Act of 2012, which extended many tax provisions that would have otherwise expired in 2012. Our income tax provision at December 31, 2012, does not include the effect of this law; however, the effect, if any, would not be significant. We will record the effect, if any, of the extended tax provisions in first quarter 2013. |
During the year ended December 31, 2012, refunds received, net of cash paid for taxes, was $0.5 million. During the years ended December 31, 2011 and 2010, cash paid for taxes, net of refunds received, was $1.9 million and $0.7 million, respectively.
21
The following details the scheduled expiration dates of our tax effected net operating loss (NOL) and tax credit carryforwards at December 31, 2012 (dollars in thousands):
| Boise Inc. | BZ Intermediate | |||||||||||||||||||||||||||||||
| 2013 Through 2022 |
2023 Through 2032 |
Indefinite | Total | 2013 Through 2022 |
2023 Through 2032 |
Indefinite | Total | |||||||||||||||||||||||||
| U.S. federal and non-U.S. NOLs |
$ | 4,432 | $ | 35,820 | $ | — | $ | 40,252 | $ | 4,432 | $ | 35,920 | $ | — | $ | 40,352 | ||||||||||||||||
| State taxing jurisdiction NOLs |
351 | 3,380 | — | 3,731 | 351 | 3,380 | — | 3,731 | ||||||||||||||||||||||||
| U.S. federal, non-U.S., and state tax credit carryforwards |
196 | 589 | 4,053 | 4,838 | 196 | 589 | 4,053 | 4,838 | ||||||||||||||||||||||||
| U.S. federal capital loss carryforwards |
1,232 | — | — | 1,232 | 1,232 | — | — | 1,232 | ||||||||||||||||||||||||
|
|
|
|
|
|
|
|
|
|
|
|
|
|
|
|
|
|||||||||||||||||
| Total |
$ | 6,211 | $ | 39,789 | $ | 4,053 | $ | 50,053 | $ | 6,211 | $ | 39,889 | $ | 4,053 | $ | 50,153 | ||||||||||||||||
|
|
|
|
|
|
|
|
|
|
|
|
|
|
|
|
|
|||||||||||||||||
Internal Revenue Code Section 382 imposes limitations on our ability to use net operating losses if we experience “ownership changes.” In general terms, ownership change may result from transactions increasing the ownership of specified shareholders by greater than 50 percentage points over a three year period. We cannot give any assurance we will not undergo any ownership change at a time when these limitations would have a significant effect. To the extent we are not able to use net operating losses in any given year, the unused limitation amount may be carried over to later years. We believe it is more likely than not that our net operating losses will be fully realized before they expire.
22
Deferred income taxes reflect the net tax effects of temporary differences between the carrying amounts of assets and liabilities for financial reporting purposes and the amounts for income tax purposes. The components of our net deferred tax assets and liabilities at December 31, 2012 and 2011, in the Consolidated Balance Sheets are as follows (dollars in thousands):
| Boise Inc. | BZ Intermediate | |||||||||||||||
| December 31 | ||||||||||||||||
| 2012 | 2011 | 2012 | 2011 | |||||||||||||
| Deferred tax assets |
||||||||||||||||
| Employee benefits (a) |
$ | 68,375 | $ | 84,453 | $ | 68,375 | $ | 84,453 | ||||||||
| Deferred financing costs |
1,584 | 1,593 | 1,584 | 1,593 | ||||||||||||
| Intangible assets and other |
310 | 122 | 310 | 122 | ||||||||||||
| Net operating loss carryforwards (b) |
61,106 | 61,262 | 60,999 | 61,155 | ||||||||||||
| Alternative minimum tax |
4,053 | 4,877 | 4,053 | 4,877 | ||||||||||||
| Asset retirement obligations |
8,025 | 3,933 | 8,025 | 3,933 | ||||||||||||
| Inventories |
7,752 | 11,875 | 7,752 | 11,875 | ||||||||||||
| State income tax adjustments |
4,894 | 4,701 | 4,894 | 4,701 | ||||||||||||
| Other |
9,130 | 10,000 | 9,130 | 10,000 | ||||||||||||
|
|
|
|
|
|
|
|
|
|||||||||
| Gross deferred tax assets |
165,229 | 182,816 | 165,122 | 182,709 | ||||||||||||
| Valuation allowance (c) |
(5,296 | ) | (5,340 | ) | (5,296 | ) | (5,340 | ) | ||||||||
|
|
|
|
|
|
|
|
|
|||||||||
| Net deferred tax assets |
$ | 159,933 | $ | 177,476 | $ | 159,826 | $ | 177,369 | ||||||||
|
|
|
|
|
|
|
|
|
|||||||||
| Deferred tax liabilities |
||||||||||||||||
| Property and equipment |
$ | 266,120 | $ | 244,230 | $ | 266,120 | $ | 244,230 | ||||||||
| Intangible assets and other |
60,195 | 61,416 | 60,195 | 61,416 | ||||||||||||
| Deferred income |
9,647 | 9,647 | 908 | 908 | ||||||||||||
| Other |
4,386 | 3,064 | 4,471 | 3,148 | ||||||||||||
|
|
|
|
|
|
|
|
|
|||||||||
| Deferred tax liabilities |
$ | 340,348 | $ | 318,357 | $ | 331,694 | $ | 309,702 | ||||||||
|
|
|
|
|
|
|
|
|
|||||||||
| As reported on our Consolidated Balance Sheets |
||||||||||||||||
| Current deferred tax assets, net |
$ | 17,955 | $ | 20,379 | $ | 17,955 | $ | 20,379 | ||||||||
| Noncurrent deferred tax liabilities |
198,370 | 161,260 | 189,823 | 152,712 | ||||||||||||
|
|
|
|
|
|
|
|
|
|||||||||
| Total deferred tax liabilities, net (d) |
$ | 180,415 | $ | 140,881 | $ | 171,868 | $ | 132,333 | ||||||||
|
|
|
|
|
|
|
|
|
|||||||||
| (a) | The decrease relates to the tax effect of changes in recorded pension liabilities. See Note 10, Retirement and Benefit Plans, for more information. |
| (b) | At December 31, 2012 and 2011, net operating losses exclude $9.8 million and $4.4 million, respectively, of tax benefits that arose directly from tax deductions related to equity compensation in excess of compensation recognized for financial reporting. To the extent such net operating losses are utilized, stockholders’ equity will be increased. |
| (c) | Deferred tax assets are reduced by a valuation allowance when it is more likely than not that some portion of the deferred tax assets will not be realized. In 2012 and 2011, we recorded a $5.3 million valuation allowance. In 2012, $4.1 million of the valuation allowance relates to foreign net operating loss carryforwards, and the remaining $1.2 million relates to a valuation allowance recorded in full on deferred tax assets relating to capital losses. In 2011, $4.3 million of the valuation allowance relates to foreign net operating loss carryforwards and credits acquired as part of the Hexacomb acquisition. The remaining $1.0 million valuation allowance recorded during 2011 relates to a valuation allowance recorded in full on deferred tax assets relating to capital losses. We do not expect to generate capital gains before the losses expire. If or when recognized, the tax benefits relating to the reversal of any of or all of the valuation allowance will be recognized as a reduction of income tax expense. |
| (d) | As of December 31, 2012, we had not recognized U.S. deferred income taxes on our cumulative total of undistributed earnings for non-U.S. subsidiaries. Determining the unrecognized deferred tax liability related to investments in these non-U.S. subsidiaries that are indefinitely reinvested is not practicable. We currently intend to indefinitely reinvest those earnings in operations outside the United States. |
23
Pretax income from domestic and foreign sources is as follows (dollars in thousands):
| Boise Inc. | BZ Intermediate | |||||||||||||||||||||||
| Year Ended December 31 | ||||||||||||||||||||||||
| 2012 | 2011 | 2010 | 2012 | 2011 | 2010 | |||||||||||||||||||
| Domestic |
$ | 85,287 | $ | 125,072 | $ | 108,095 | $ | 85,287 | $ | 125,072 | $ | 108,095 | ||||||||||||
| Foreign |
847 | 269 | 11 | 847 | 269 | 11 | ||||||||||||||||||
|
|
|
|
|
|
|
|
|
|
|
|
|
|||||||||||||
| Income before income taxes |
$ | 86,134 | $ | 125,341 | $ | 108,106 | $ | 86,134 | $ | 125,341 | $ | 108,106 | ||||||||||||
|
|
|
|
|
|
|
|
|
|
|
|
|
|||||||||||||
Uncertain Income Tax Positions
A reconciliation of the unrecognized tax benefits is as follows (dollars in thousands):
| Boise Inc. | BZ Intermediate | |||||||||||||||||||||||
| 2012 | 2011 | 2010 | 2012 | 2011 | 2010 | |||||||||||||||||||
| Beginning balance |
$ | 90,989 | $ | 87,585 | $ | 87,838 | $ | 90,968 | $ | 87,564 | $ | 87,820 | ||||||||||||
| Gross increases related to prior-period tax positions |
189 | 409 | 169 | 189 | 409 | 166 | ||||||||||||||||||
| Gross decreases related to prior-period tax positions |
(2,284 | ) | (228 | ) | (529 | ) | (2,284 | ) | (228 | ) | (529 | ) | ||||||||||||
| Gross increases related to current-period tax positions |
— | 3,223 | 107 | — | 3,223 | 107 | ||||||||||||||||||
| Settlements |
— | — | — | — | — | — | ||||||||||||||||||
|
|
|
|
|
|
|
|
|
|
|
|
|
|||||||||||||
| Ending balance (a) |
$ | 88,894 | $ | 90,989 | $ | 87,585 | $ | 88,873 | $ | 90,968 | $ | 87,564 | ||||||||||||
|
|
|
|
|
|
|
|
|
|
|
|
|
|||||||||||||
| (a) | The unrecognized tax benefit, net of federal benefit for state taxes of $4.1 million, was $84.8 million at December 31, 2012. If that amount were recognized it would decrease our annual effective tax rate. Of this amount, $56.6 million ($56.5 million for BZ Intermediate) is recorded as a credit to long-term deferred taxes to eliminate the benefit associated with the uncertain tax position. The remaining $28.3 million ($28.4 million for BZ Intermediate) is recorded in “Other long-term liabilities” on our Consolidated Balance Sheets. Included in the $84.8 million is a credit related to our use of alternative fuel mixture to produce energy to operate our business of $83.2 million. Additional information relating to the inclusion of the alternative fuel mixture credits in taxable income may become available in the next 12 months, which could cause us to change our unrecognized tax benefits from the amounts currently recorded. It is not reasonably possible to know to what extent the total amounts of unrecognized benefits will increase or decrease within the next 12 months. |
We recognize tax liabilities and adjust these liabilities when our judgment changes as a result of the evaluation of new information not previously available or as new uncertainties occur. We recognize interest and penalties related to uncertain tax positions as income tax expense in the Consolidated Statements of Income. Interest expense and penalties relating to uncertain tax positions were nominal for the years ended December 31, 2012, 2011, and 2010.
BZ Intermediate is a wholly owned, consolidated entity of Boise Inc., and its tax return is filed under the consolidated tax return of Boise Inc. We file federal income tax returns in the U.S., state income tax returns in various state jurisdictions, and foreign income tax returns in various foreign jurisdictions. In the normal course of business, we are subject to examination by taxing authorities. Tax years beginning in 2009 are subject to examination by taxing authorities, although net operating loss and credit carryforwards from all years are subject to examinations and adjustments for at least three years following the year in which utilized. Some foreign tax jurisdictions are open for the 2008 tax year.
24
7. Goodwill and Intangible Assets
Goodwill
Goodwill represents the excess of the cost of an acquired business over the fair value of the identifiable tangible and intangible assets acquired and liabilities assumed in a business combination. At December 31, 2012, we had $160.1 million of goodwill recorded on our Consolidated Balance Sheet in our Packaging segment.
Changes in the carrying amount of our goodwill are as follows (dollars in thousands):
| Goodwill | ||||
| Balance at January 1, 2011 |
$ | — | ||
| Goodwill acquired |
162,169 | |||
| Foreign currency translation adjustments |
(478 | ) | ||
|
|
|
|||
| Balance at December 31, 2011 |
161,691 | |||
| Additions (reductions) (a) |
(1,799 | ) | ||
| Foreign currency translation adjustments |
238 | |||
|
|
|
|||
| Balance at December 31, 2012 |
$ | 160,130 | ||
|
|
|
|||
| (a) | Represents purchase price adjustments related to the Tharco and Hexacomb acquisitions. |
Intangible Assets
Intangible assets are comprised of customer relationships, trademarks and trade names, technology, and noncompete agreements. At December 31, 2012, the net carrying amount of intangible assets with indefinite lives, which represents trade names and trademarks, was $16.8 million, all of which is recorded in our Paper segment. All of our other intangible assets amortize based on their estimated useful lives. Foreign intangible assets are affected by foreign currency translation.
25
The gross carrying amount, accumulated amortization, net carrying amount, and weighted average useful life of our intangible assets were as follows (dollars in thousands):
| As of December 31, 2012 | ||||||||||||||||
| Gross Carrying Amount |
Accumulated Amortization |
Net Carrying Amount |
Weighted Average Useful Life (in Years) |
|||||||||||||
| Customer relationships |
$ | 120,077 | $ | (16,485 | ) | $ | 103,592 | 15 | ||||||||
| Trademarks and trade names |
28,400 | (2,634 | ) | 25,766 | 15 | |||||||||||
| Technology and other |
7,760 | (6,771 | ) | 989 | 5 | |||||||||||
| Noncompete agreements |
835 | (418 | ) | 417 | 3 | |||||||||||
|
|
|
|
|
|
|
|||||||||||
| Total finite-lived intangible assets |
$ | 157,072 | $ | (26,308 | ) | 130,764 | 13 | |||||||||
|
|
|
|
|
|
|
|||||||||||
| Indefinite-lived trademarks and trade names |
16,800 | |||||||||||||||
|
|
|
|||||||||||||||
| Total intangible assets (excluding goodwill) |
$ | 147,564 | ||||||||||||||
|
|
|
|||||||||||||||
| As of December 31, 2011 | ||||||||||||||||
| Gross Carrying Amount |
Accumulated Amortization |
Net Carrying Amount |
Weighted Average Useful Life (in Years) |
|||||||||||||
| Customer relationships |
$ | 119,646 | $ | (8,275 | ) | $ | 111,371 | 15 | ||||||||
| Trademarks and trade names |
28,400 | (623 | ) | 27,777 | 15 | |||||||||||
| Technology and other |
7,760 | (5,265 | ) | 2,495 | 5 | |||||||||||
| Noncompete agreements |
835 | (158 | ) | 677 | 3 | |||||||||||
|
|
|
|
|
|
|
|||||||||||
| Total finite-lived intangible assets |
$ | 156,641 | $ | (14,321 | ) | 142,320 | 13 | |||||||||
|
|
|
|
|
|
|
|||||||||||
| Indefinite-lived trademarks and trade names |
16,800 | |||||||||||||||
|
|
|
|||||||||||||||
| Total intangible assets (excluding goodwill) |
$ | 159,120 | ||||||||||||||
|
|
|
|||||||||||||||
The following table sets forth our intangible asset amortization (dollars in thousands):
| Year Ended December 31 | ||||||||||||
| 2012 | 2011 | 2010 | ||||||||||
| Intangible asset amortization |
$ | 11,952 | $ | 6,533 | $ | 2,754 | ||||||
Based on current intangibles subject to amortization, our estimated future intangible asset amortization expense is as follows (dollars in thousands):
| 2013 | 2014 | 2015 | 2016 | 2017 | 2018 and After |
|||||||||||||||||||
| Amortization expense |
$ | 10,375 | $ | 10,122 | $ | 10,122 | $ | 10,113 | $ | 10,021 | $ | 80,011 | ||||||||||||
Impairment Testing
We maintain two reporting units for purposes of our goodwill and intangible asset impairment testing, Packaging and Paper, which are the same as our operating segments discussed in Note 17, Segment Information. We test the goodwill, recorded in our Packaging segment, and the indefinite-lived intangible assets, recorded in our Paper segment, for impairment annually in the fourth quarter or sooner if events or changes in circumstances indicate that the carrying value of the asset may exceed fair value. Additionally, we evaluate the remaining useful lives of our finite-lived purchased intangible assets to determine whether any adjustments to the useful lives are necessary. We completed our test in fourth quarter, and there is no indication of goodwill or intangible asset impairment.
26
8. Debt
At December 31, 2012 and 2011, our long-term debt and the interest rates on that debt were as follows (dollars in thousands):
| December 31, 2012 | December 31, 2011 | |||||||||||||||
| Amount | Interest Rate | Amount | Interest Rate | |||||||||||||
| Revolving credit facility, due 2016 |
$ | 5,000 | 2.21 | % | $ | — | — | % | ||||||||
| Tranche A term loan, due 2016 |
175,000 | 2.22 | 200,000 | 2.30 | ||||||||||||
| 9% senior notes, due 2017 |
300,000 | 9.00 | 300,000 | 9.00 | ||||||||||||
| 8% senior notes, due 2020 |
300,000 | 8.00 | 300,000 | 8.00 | ||||||||||||
|
|
|
|
|
|||||||||||||
| Long-term debt |
780,000 | 7.05 | 800,000 | 6.95 | ||||||||||||
| Current portion of long-term debt |
(10,000 | ) | 2.22 | (10,000 | ) | 2.30 | ||||||||||
|
|
|
|
|
|||||||||||||
| Long-term debt, less current portion |
$ | 770,000 | 7.11 | % | $ | 790,000 | 7.01 | % | ||||||||
|
|
|
|
|
|||||||||||||
In 2011, Boise Paper Holdings, as borrower, and BZ Intermediate, as guarantor, entered into a $700 million five-year senior secured credit agreement (Credit Agreement) with a syndicate of lenders. The Credit Agreement consists of a five-year amortizing $200 million Tranche A term loan facility (the Term Loan Facility) and a five-year nonamortizing $500 million revolving credit facility (the Revolving Credit Facility and, together with the Term Loan Facility, the Credit Facilities).
As of December 31, 2012, our debt consisted of the following:
| • | The Revolving Credit Facility: A five-year nonamortizing $500 million senior secured revolving credit facility with variable annual interest. In addition to paying interest, we pay an annual commitment fee for undrawn amounts at a rate of either 0.35% or 0.50% depending on our total leverage ratio. |
| • | The Tranche A Term Loan Facility: A five-year amortizing $200 million senior secured loan facility with variable annual interest. |
| • | The 9% Senior Notes: An eight-year nonamortizing $300 million senior unsecured debt obligation with fixed annual interest of 9%. |
| • | The 8% Senior Notes: A ten-year nonamortizing $300 million senior unsecured debt obligation with fixed annual interest of 8%. |
Credit Facilities
Under our Credit Facilities we elect whether interest on our Term Loan and, separately, interest under any Revolving Credit Facility is based on an alternative base rate or the London Interbank Offered Rate (LIBOR), plus an applicable spread based on our total leverage ratio. Our total leverage ratio is essentially our total net debt divided by our four trailing quarters of Adjusted Consolidated EBITDA (as defined in the Credit Agreement). Based on our current one-month LIBOR election, at December 31, 2012, the interest rate on our Credit Facilities was LIBOR plus 200 basis points and we pay interest on the Credit Facilities monthly in arrears.
At December 31, 2012, we had $5.0 million of borrowings outstanding under our Revolving Credit Facility. No amounts were outstanding at December 31, 2011. During 2012, the maximum borrowings under the Revolving Credit Facility were $5.0 million, and the weighted average amount of borrowings outstanding during the year was $0.1 million. At December 31, 2012, we had availability of $487.7 million, which is net of outstanding letters of credit of $7.3 million. At December 31, 2012, the average interest rate for our outstanding borrowings under our Revolving Credit Facility was 2.21%.
We are required to maintain the following financial covenant ratios under the Credit Agreement:
| • | Interest expense coverage ratio must be 2.50 or more based on four consecutive fiscal quarters. |
| • | Senior secured leverage ratio must be 2.75 or less as of the end of any fiscal quarter. |
| • | Total leverage ratio must be 4.50 or less as of the end of any fiscal quarter. |
The Credit Facilities also contain representations and warranties, affirmative and negative covenants, events of default, and indemnifications customary for loan agreements for similar secured financings, including limits on the ability of Boise Paper Holdings and its subsidiaries to make restricted payments, acquisitions, and capital expenditures.
27
In the event of default, the lenders could terminate their commitments, declare the Credit Facilities, including interest and fees, due and payable, or enforce liens and security interests to collect outstanding amounts due under the Credit Facilities. In addition, the Credit Facilities require the proceeds from asset sales, subject to specified exceptions and casualty insurance, be used to pay down outstanding borrowings. At December 31, 2012, we were in compliance with these covenants. In third quarter 2012, we made $25.0 million of long-term debt payments on our Tranche A Term Loan Facility, $17.5 million of which were voluntary and eliminate our required principal payment obligations until December 31, 2013.
The obligations of Boise Paper Holdings under our Credit Facilities are guaranteed by each of BZ Intermediate’s and Boise Paper Holdings’ existing and subsequently acquired domestic and foreign subsidiaries, subject to materiality limitations (collectively, the Credit Facility Guarantors). The Credit Facilities are secured by all intercompany debt and a first-priority security interest in substantially all of the real, personal, and mixed property of Boise Paper Holdings and the Credit Facility Guarantors, including a first-priority security interest in 100% of the equity interests of Boise Paper Holdings and each domestic subsidiary of Boise Paper Holdings and, if requested by the administrative agent, 65% of the equity interests of our foreign subsidiaries.
8% and 9% Senior Notes
The 8% and 9% Senior Notes (together, the Senior Notes) are senior unsecured obligations and rank equally with all of our present and future senior indebtedness, senior to all of our future subordinated indebtedness and effectively subordinated to all of our present and future senior secured indebtedness (including all borrowings with respect to the Credit Facilities to the extent of the value of the assets securing such indebtedness). Interest on the Senior Notes is due semiannually.
The Senior Notes indenture agreements contain covenants which, subject to exceptions, limit the ability of the Senior Notes issuers and guarantors to, among other things, incur additional indebtedness, engage in some asset sales, make specified types of restricted payments, engage in transactions with affiliates, and create liens on assets of the Senior Notes issuers or guarantors. Upon a change of control, the Senior Notes issuers must offer to repurchase the Senior Notes at 101% of the principal amount, plus accrued and unpaid interest. If the Senior Notes issuers sell specified types of assets and do not use the proceeds from such sales for specified purposes, they must offer to repurchase the Senior Notes at 100% of the principal amount, plus accrued and unpaid interest.
Our 9% Senior Notes are callable at any time on or after November 1, 2013, at 104.5% of the principal amount, decreasing to par by November 1, 2015, plus accrued and unpaid interest.
Our 8% Senior Notes are callable at any time on or after April 1, 2015, at 104% of the principal amount, decreasing to par by April 1, 2018, plus accrued and unpaid interest.
The Senior Notes are jointly and severally guaranteed on a senior unsecured basis by BZ Intermediate and each existing and future subsidiary of BZ Intermediate (other than their respective issuers). The Senior Notes Guarantors do not include Louisiana Timber Procurement Company, L.L.C., or our foreign subsidiaries.
Other
As of December 31, 2012, required debt principal repayments were as follows (dollars in thousands):
| 2013 | 2014 | 2015 | 2016 | 2017 | Thereafter | |||||||||||||||||||
| Required debt principal repayments (a) |
$ | 10,000 | $ | 20,000 | $ | 30,000 | $ | 120,000 | $ | 300,000 | $ | 300,000 | ||||||||||||
| (a) | Debt maturities in 2013 include repayment of $5.0 million of borrowings under our Revolving Credit Facility based on our intent to repay in 2013. |
28
At December 31, 2012 and 2011, we had $26.7 million and $31.0 million, respectively, of costs recorded in “Deferred financing costs” on our Consolidated Balance Sheet. When we entered into the Credit Agreement in November 2011, we capitalized $7.9 million of financing costs, which we recorded in “Deferred financing costs” on our Consolidated Balance Sheets. We record the amortization of deferred financing costs in interest expense using the effective interest method over the life of the loans. For the years ended December 31, 2012, 2011, and 2010, we recorded $4.5 million, $5.8 million, and $6.8 million, respectively, of amortization expense in “Interest expense” in our Consolidated Statements of Income.
During 2011 and 2010, we substantially modified our debt structures, and as a result, we expensed $2.3 million in 2011 and $22.2 million in 2010 in “Loss on extinguishment of debt” in our Consolidated Statements of Income.
For the years ended December 31, 2012, 2011, and 2010, cash payments for interest were $57.3 million, $58.1 million, and $51.6 million, respectively.
With the exception of the Credit Facilities, our debt is fixed-rate debt. At December 31, 2012, the book value of our fixed-rate debt was $600.0 million, and the fair value was estimated to be $660.5 million. The difference between the book value and fair value is due to the difference between the period-end market interest rate and the stated rate of our fixed-rate, long-term debt. We estimated the fair value of our fixed-rate debt using quoted market prices (Level 1 inputs), discussed further in Note 2, Summary of Significant Accounting Policies.
9. Financial Instruments
Our primary objective in holding derivative financial instruments is to manage cash flow risk. We do not use derivative instruments for speculative purposes.
Energy Risk
We enter into transactions to hedge the variable cash flow risk of natural gas purchases. At December 31, 2012, these derivatives included caps and call spreads, which we account for as economic hedges, and swaps, which are designated and accounted for as cash flow hedges. As of December 31, 2012, we had entered into derivative instruments related to the following approximate percentages of our forecasted natural gas purchases:
| January 2013 Through March 2013 |
April 2013 Through October 2013 |
November 2013 Through March 2014 |
April 2014 Through October 2014 |
November 2014 Through March 2015 |
April 2015 Through October 2015 |
November 2015 Through March 2016 |
||||||||||||||||||||||
| Approximate percent hedged |
87 | % | 75 | % | 53 | % | 48 | % | 43 | % | 37 | % | 13 | % | ||||||||||||||
Economic Hedges
For derivative instruments that are not designated as hedges for accounting purposes, the gain or loss on the derivatives is recognized in “Materials, labor, and other operating expenses (excluding depreciation)” in the Consolidated Statements of Income. During the years ended December 31, 2012, 2011 and 2010, we recognized an insignificant amount of expense and/or income related to natural gas contracts we account for as economic hedges.
Cash Flow Hedges
For derivative instruments that are designated and qualify as cash flow hedges, the effective portion of the gain or loss on the derivative is reported as a component of “Accumulated other comprehensive income (loss)” on our Consolidated Balance Sheets and is recognized in “Materials, labor, and other operating expenses (excluding depreciation)” or “Interest expense” in our Consolidated Statements of Income in the period in which the hedged transaction affects earnings. Financial instruments designated as cash flow hedges are assessed both at inception and quarterly thereafter to ensure they are effective in offsetting changes in the cash flows of the related underlying exposures. The fair value of the instruments is reclassified out of accumulated other comprehensive income (loss) to earnings if the hedge ceases to be highly effective or if the hedged transaction is no longer probable. At December 31, 2012 and 2011, we had $1.2 million and $3.7 million of losses, respectively, net of tax recorded in “Accumulated other comprehensive income (loss)” on our Consolidated Balance Sheets related to our natural gas contracts.
29
The effects of our cash flow hedging instruments on our Consolidated Balance Sheets and Consolidated Statements of Income were as follows (dollars in thousands):
| (Gain) Loss Recognized in Accumulated Other Comprehensive Income |
Loss Reclassified From Accumulated Other Comprehensive Income Into Earnings |
|||||||||||||||||||||||
| Year Ended December 31 | ||||||||||||||||||||||||
| 2012 (a) | 2011 | 2010 | 2012 | 2011 | 2010 | |||||||||||||||||||
| Natural gas contracts |
$ | (1,384 | ) | $ | 6,776 | $ | — | $ | 2,637 | $ | 754 | $ | — | |||||||||||
| Interest rate contracts |
— | — | — | — | — | 422 | ||||||||||||||||||
|
|
|
|
|
|
|
|
|
|
|
|
|
|||||||||||||
| Total |
$ | (1,384 | ) | $ | 6,776 | $ | — | $ | 2,637 | $ | 754 | $ | 422 | |||||||||||
|
|
|
|
|
|
|
|
|
|
|
|
|
|||||||||||||
| (a) | Based on December 31, 2012, pricing, the estimated loss, net of tax, to be recognized in earnings during the next 12 months is $1.2 million. |
Fair Values of Derivative Instruments
At December 31, 2012 and 2011, the fair value of our financial instruments was determined based on New York Mercantile Exchange (NYMEX) price quotations under the terms of the contracts, using current market information as of the reporting date. The derivatives were valued by us using third-party valuations based on quoted prices for similar assets and liabilities. Accordingly, all of our fair value measurements use Level 2 inputs.
All of our derivative instruments are recorded in “Accrued liabilities, Other” and “Other long-term liabilities” on our Consolidated Balance Sheets. We offset asset and liability balances, by counterparty, where legal right of offset exists. The following table presents the fair value of these instruments (dollars in thousands):
| Level 2: Significant Other Observable Inputs | ||||||||
| December 31 | ||||||||
| 2012 | 2011 | |||||||
| Natural gas contracts |
||||||||
| Cash flow hedges |
$ | 2,365 | $ | 6,022 | ||||
| Economic hedges |
2,197 | 2,370 | ||||||
|
|
|
|
|
|||||
| Total |
$ | 4,562 | $ | 8,392 | ||||
|
|
|
|
|
|||||
Derivative instruments in an asset position at December 31, 2012, were not material. We did not have any derivative instruments in an asset position at December 31, 2011.
10. Retirement and Benefit Plans
Some of our employees participate in noncontributory defined benefit pension plans, contributory defined contribution savings plans, and deferred compensation plans.
Defined Benefit Plans
The majority of our pension benefit plans are frozen; however, approximately 400 hourly employees continue to accrue benefits under our defined benefit pension plans. When frozen, the pension benefit for salaried employees was based primarily on the employees’ years of service and highest five-year average compensation. The benefit for hourly employees is generally based on a fixed amount per year of service. Expenses attributable to participation in noncontributory defined benefit plans for the years ended December 31, 2012, 2011, and 2010, were $11.3 million, $10.9 million, and $9.2 million, respectively.
30
Defined Contribution Plans
Some of our employees participate in contributory defined contribution savings plans, which cover most of our salaried and hourly employees. Expenses related to matching contributions attributable to participation in contributory defined contribution savings plans for the years ended December 31, 2012, 2011, and 2010, were $17.7 million, $14.3 million, and $12.0 million, respectively. The company contributions for eligible salaried employees consist of a nondiscretionary, nonmatching base contribution, plus a matching contribution. We may also make additional discretionary matching and/or nonmatching contributions each year. The company contribution structure for hourly employees varies according to location and union arrangements.
Deferred Compensation Plans
Some of our employees participate in deferred compensation plans, in which key managers and nonaffiliated directors may irrevocably elect to defer a portion of their base salary and bonus or director’s fees until termination of employment or beyond. Participants other than directors may elect to receive their company contributions in the deferred compensation plan in lieu of any company contribution in the defined contribution savings plan. The deferred compensation plans are unfunded; therefore, benefits are paid from our general assets. At December 31, 2012 and 2011, we had $5.9 million and $3.7 million, respectively, of liabilities attributable to participation in our deferred compensation plan on our Consolidated Balance Sheets.
31
Obligations and Funded Status of Defined Benefit Pension Plans
The funded status of our plans change from year to year based on the plan asset investment return, contributions, benefit payments, and the discount rate used to measure the liability. The following table, which includes only company-sponsored defined benefit plans, reconciles the beginning and ending balances of the projected benefit obligation and the fair value of plan assets. We recognize the unfunded status of our defined benefit pension plans on our Consolidated Balance Sheets, and we recognize changes in funded status in the year changes occur through our Consolidated Statements of Comprehensive Income (dollars in thousands):
| December 31 | ||||||||
| 2012 | 2011 | |||||||
| Projected benefit obligation at beginning of year |
$ | 558,416 | $ | 475,044 | ||||
| Service cost |
2,732 | 3,969 | ||||||
| Interest cost |
24,596 | 25,582 | ||||||
| Actuarial loss (a) |
14,162 | 69,768 | ||||||
| Closure and curtailment loss |
1,060 | — | ||||||
| Benefits paid and settlements |
(26,965 | ) | (15,947 | ) | ||||
|
|
|
|
|
|||||
| Projected benefit obligation at end of year |
$ | 574,001 | $ | 558,416 | ||||
|
|
|
|
|
|||||
| Change in fair value of plan assets |
||||||||
| Fair value of plan assets at beginning of year |
$ | 390,082 | $ | 355,901 | ||||
| Actual return on plan assets |
60,613 | 24,714 | ||||||
| Employer contributions |
35,205 | 25,414 | ||||||
| Benefits paid |
(18,551 | ) | (15,947 | ) | ||||
| Settlements |
(8,414 | ) | — | |||||
|
|
|
|
|
|||||
| Fair value of plan assets at end of year |
$ | 458,935 | $ | 390,082 | ||||
|
|
|
|
|
|||||
| Underfunded status |
$ | 115,066 | $ | 168,334 | ||||
|
|
|
|
|
|||||
| Amounts recognized on our consolidated balance sheets |
||||||||
| Current liabilities |
$ | 309 | $ | 294 | ||||
| Noncurrent liabilities |
114,757 | 168,040 | ||||||
|
|
|
|
|
|||||
| Net amount recognized |
$ | 115,066 | $ | 168,334 | ||||
|
|
|
|
|
|||||
| Amounts recognized in accumulated other comprehensive income (loss) |
||||||||
| Actuarial net loss |
$ | 109,796 | $ | 139,061 | ||||
| Prior service cost |
— | 71 | ||||||
|
|
|
|
|
|||||
| Net loss recognized |
$ | 109,796 | $ | 139,132 | ||||
|
|
|
|
|
|||||
| (a) | The actuarial loss in 2012 is due primarily to a decrease in the weighted average discount rate from 4.50% to 4.25%, compared with a decrease from 5.50% to 4.50% in 2011. |
The accumulated benefit obligation for all defined benefit pension plans was $574.0 million and $558.4 million as of December 31, 2012 and 2011, respectively. All of our defined benefit pension plans have accumulated benefit obligations in excess of plan assets.
32
Components of Net Periodic Benefit Cost and Other Comprehensive (Income) Loss
The components of net periodic benefit cost and other comprehensive (income) loss (pretax) are as follows (dollars in thousands):
| Year Ended December 31 | ||||||||||||
| 2012 | 2011 | 2010 | ||||||||||
| Service cost |
$ | 2,732 | $ | 3,969 | $ | 5,041 | ||||||
| Interest cost |
24,596 | 25,582 | 25,272 | |||||||||
| Expected return on plan assets |
(27,286 | ) | (24,581 | ) | (23,242 | ) | ||||||
| Amortization of actuarial loss |
10,107 | 5,595 | 1,774 | |||||||||
| Amortization of prior service cost |
5 | 51 | 51 | |||||||||
| Plan settlement curtailment loss |
1,125 | 300 | 345 | |||||||||
|
|
|
|
|
|
|
|||||||
| Net periodic benefit cost |
$ | 11,279 | $ | 10,916 | $ | 9,241 | ||||||
|
|
|
|
|
|
|
|||||||
| Changes in plan assets and benefit obligations recognized in other comprehensive (income) loss |
||||||||||||
| Actuarial net (gain) loss |
$ | (19,158 | ) | $ | 69,635 | $ | 14,461 | |||||
| Prior service credit |
(66 | ) | (300 | ) | — | |||||||
| Amortization of actuarial loss |
(10,107 | ) | (5,595 | ) | (1,774 | ) | ||||||
| Amortization of prior service cost |
(5 | ) | (51 | ) | (51 | ) | ||||||
|
|
|
|
|
|
|
|||||||
| Total recognized in other comprehensive (income) loss |
(29,336 | ) | 63,689 | 12,636 | ||||||||
|
|
|
|
|
|
|
|||||||
| Total recognized in net periodic benefit cost and other comprehensive (income) loss |
$ | (18,057 | ) | $ | 74,605 | $ | 21,877 | |||||
|
|
|
|
|
|
|
|||||||
We estimate net periodic benefit cost to be recognized in 2013 will be $5.4 million.
Assumptions
The following table presents the assumptions used in the measurement of our benefits obligation:
| December 31 | ||||||||
| 2012 | 2011 | |||||||
| Weighted average: |
||||||||
| Discount rate |
4.25 | % | 4.50 | % | ||||
| Rate of compensation increase |
— | % | — | % | ||||
The following table presents the assumptions used in the measurement of net periodic benefit cost:
| Year Ended December 31 | ||||||||||||
| 2012 | 2011 | 2010 | ||||||||||
| Weighted average assumptions as of the last day in the presented period: |
||||||||||||
| Discount rate |
4.50 | % | 5.50 | % | 6.10 | % | ||||||
| Expected long-term rate of return on plan assets |
7.00 | % | 7.25 | % | 7.25 | % | ||||||
| Rate of compensation increase |
— | % | — | % | — | % | ||||||
Discount Rate Assumption. The discount rate reflects the current rate at which the pension obligations could be settled on the measurement date: December 31. At December 31, 2012, the discount rate assumption used to calculate the benefit obligation was determined using a hypothetical bond portfolio of AA-graded or better corporate bonds. At December 31, 2011, and for the periods ended December 31, 2012, 2011, and 2010, the discount rate assumption used to calculate the benefit obligation and the net periodic benefit cost was determined using a spot rate yield curve constructed to replicate Aa-graded corporate bonds. In all periods, the bonds included in the models reflect anticipated investments that would be made to match the expected monthly benefit payments over time. The plan’s projected cash flows were duration-matched to these models to develop an appropriate discount rate. The discount rate we will use in our calculation of 2013 net periodic benefit cost is 4.25%.
33
Asset Return Assumption. The expected long-term rate of return on plan assets was based on a weighted average of the expected returns for the major investment asset classes in which we invest, considering the effects of active portfolio management and expenses paid from plan assets. Expected returns for the asset classes are based on long-term historical returns, inflation expectations, forecasted gross domestic product, earnings growth, and other economic factors. The weights assigned to each asset class were based on the investment strategy. The weighted average expected return on plan assets we will use in our calculation of 2013 net periodic benefit cost is 6.75%. In 2012, plan assets performed better than the long-term return assumption due to improved equity and debt market conditions.
Rate of Compensation Increases. Pension benefits for all salaried employees and most hourly employees are frozen. There are currently no scheduled increases in pension benefit rates for hourly employees in plans that have not been frozen. The compensation increase assumption is not applicable for all plans.
Investment Policies and Strategies
At December 31, 2012, 24% of our pension plan assets were invested in U.S. equity securities, 27% were invested in international equity securities, 27% were invested in long-duration fixed-income securities, 20% were invested in intermediate-duration fixed-income securities, and 2% were invested in private equity, cash, and other. The general investment objective for all of our plan assets is to optimize growth of the pension plan trust assets, while minimizing the risk of significant losses to enable the plans to satisfy their benefit payment obligations over time. The objectives take into account the long-term nature of the benefit obligations, the liquidity needs of the plans, and the expected risk/return trade-offs of the asset classes in which the plans may choose to invest. Our Retirement Funds Investment Committee is responsible for establishing and overseeing the implementation of our investment policy. Russell Investments (Russell) oversees the active management of our pension investments to achieve broad diversification in a cost-effective manner. At December 31, 2012, our investment policy governing our relationship with Russell allocated 28% to long-duration fixed-income securities, 20% to intermediate-duration fixed-income securities, 24% to U.S. equity securities, and 28% to international equity securities. Our arrangement with Russell allows monthly rebalancing to the policy targets noted above.
Investment securities, in general, are exposed to various risks, such as interest rate, credit, and overall market volatility risk, all of which are subject to change. Due to the level of risk associated with some investment securities, it is reasonably possible that changes in the values of investment securities will occur in the near term, and such changes could materially affect the reported amounts.
Fair Value Measurements of Plan Assets
The defined benefit plans hold an interest in the Boise Paper Holdings, L.L.C., Master Pension Trust (Master Trust). The assets in the Master Trust are invested in a common and collective trust whose funds are invested in U.S. equities, international equities, and fixed-income securities managed by Russell Trust Company. The Master Trust also invests in private equity securities managed by Pantheon Ventures Inc.
34
The following tables set forth, by level within the fair value hierarchy, discussed in Note 2, Summary of Significant Accounting Policies, the pension plan assets, by major asset category, at fair value at December 31, 2012 and 2011 (dollars in thousands):
| December 31, 2012 | ||||||||||||||||
| Quoted Prices in Active Markets for Identical Assets (Level 1) |
Significant Other Observable Inputs (Level 2) (a) |
Significant Unobservable Inputs (Level 3) |
Total | |||||||||||||
| Cash equivalents |
$ | — | $ | 225 | $ | — | $ | 225 | ||||||||
| Equity securities: |
||||||||||||||||
| Large-cap U.S. equity securities (b) |
— | 90,024 | — | 90,024 | ||||||||||||
| Small- and mid-cap U.S. equity securities (c) |
— | 17,998 | — | 17,998 | ||||||||||||
| International equity securities (d) |
— | 126,010 | — | 126,010 | ||||||||||||
| Fixed-income securities (e) |
— | 217,456 | — | 217,456 | ||||||||||||
| Private equity securities (f) |
— | — | 6,346 | 6,346 | ||||||||||||
|
|
|
|
|
|
|
|
|
|||||||||
| Total securities at fair value |
— | 451,713 | 6,346 | 458,059 | ||||||||||||
|
|
|
|
|
|
|
|
|
|||||||||
| Receivables and accrued expenses |
876 | |||||||||||||||
|
|
|
|||||||||||||||
| Total fair value of plan assets |
$ | 458,935 | ||||||||||||||
|
|
|
|||||||||||||||
| December 31, 2011 | ||||||||||||||||
| Quoted Prices in Active Markets for Identical Assets (Level 1) |
Significant Other Observable Inputs (Level 2) (a) |
Significant Unobservable Inputs (Level 3) |
Total | |||||||||||||
| Equity securities: |
||||||||||||||||
| Large-cap U.S. equity securities (b) |
$ | — | $ | 112,609 | $ | — | $ | 112,609 | ||||||||
| Small- and mid-cap U.S. equity securities (c) |
— | 19,426 | — | 19,426 | ||||||||||||
| International equity securities (d) |
— | 65,265 | — | 65,265 | ||||||||||||
| Fixed-income securities (e) |
— | 188,287 | — | 188,287 | ||||||||||||
| Private equity securities (f) |
— | — | 3,531 | 3,531 | ||||||||||||
|
|
|
|
|
|
|
|
|
|||||||||
| Total securities at fair value |
— | 385,587 | 3,531 | 389,118 | ||||||||||||
|
|
|
|
|
|
|
|
|
|||||||||
| Receivables and accrued expenses |
964 | |||||||||||||||
|
|
|
|||||||||||||||
| Total fair value of plan assets |
$ | 390,082 | ||||||||||||||
|
|
|
|||||||||||||||
| (a) | Investments are mutual funds managed by Russell Trust Company. The funds are valued at the net asset value (NAV) provided by Russell Trust Company, the administrator of the funds. We use NAV as a practical expedient for fair value. The NAV is based on the value of the assets owned by the fund, less liabilities at year-end. While the underlying assets are actively traded on an exchange, the funds are not. We have the ability to redeem these funds with a one-day notice, except as disclosed below in note (e). |
| (b) | Our investments in this category are invested in the Russell Equity I Fund. The fund seeks higher long-term returns that exceed the Russell 1000 Index by investing in large-capitalization stock in the U.S. stock market. |
| (c) | Our investments in this category are invested in the Russell Equity II Fund. The fund seeks high, long-term returns that exceed the Russell 2500 Index by investing in mid- and small-capitalization stocks of the U.S. stock market. |
| (d) | At December 31, 2012 and 2011, our investments in this category included the Russell International Fund with Active Currency. The fund benchmarks against the Russell Developed ex-U.S. Large Cap Index Net and seeks favorable total returns and additional diversification through investment in non-U.S. equity securities and active currency management. The fund participates primarily in the stock markets of Europe and the Pacific Rim and seeks to opportunistically add value through active investment in foreign currencies. In addition, at December 31, 2012, our investments in this category included the Russell World Equity and the Russell Emerging Markets Funds. The Russell World Equity Fund benchmarks against the Russell Developed Large Cap Index and seeks higher returns through access to the large-cap segment of both U.S. and international developed equities. The Russell Emerging Markets Fund benchmarks against the Russell Emerging Markets Index and is designed to maintain a broadly diversified exposure to emerging market countries. |
35
| (e) | In 2012, the Russell Long Credit Fixed income Fund (Long Credit Fund) was converted to a fund of funds structure and offers six Liability Driven Investment (LDI) fixed-income funds with horizons ranging from six to 16 years. Our investments at December 31, 2012, included the six LDI funds, which are designed to reduce defined benefit plan funded status volatility by more closely matching the interest rate sensitivity of plan liabilities. At December 31, 2012 and 2011, our investments in this category included the Russell Long Duration Fixed Income Fund (Long Duration Fund), which seeks to achieve above-average consistency in performance relative to the Barclays Capital U.S. Long Government/Credit Bond Index by combining manager styles and strategies with different payoffs over various phases of an investment cycle. At December 31, 2011, our investments included the Long Credit Fund, which seeks to achieve above-average consistency in performance relative to the Barclays Capital Long Credit Index and is used with other bond funds, such as the Long Duration Fund, to gain additional credit exposure to asset portfolios. Funds in this category are designed to provide maximum total return through diversified strategies, including sector rotation, modest interest rate timing, security selection, and tactical use of high-yield and emerging markets bonds. Investments in this category may be redeemed monthly with four days’ notice. |
| (f) | Our investments in this category are invested in the Pantheon Global Secondary Fund IV, LP. The fund specializes in investments in the private equity secondary market and occasionally directly in private companies to maximize capital growth. Fund investments are carried at fair value as determined quarterly using the market approach to estimate the fair value of private investments. The market approach utilizes prices and other relevant information generated by market transactions, type of security, size of the position, degree of liquidity, restrictions on the disposition, latest round of financing data, current financial position, and operating results, among other factors. In circumstances where fair values are not provided with respect to any of the company’s fund investments, the investment advisor will seek to determine the fair value of such investments based on information provided by the general partners or managers of such funds or from other sources. Notwithstanding the above, the variety of valuation bases adopted and quality of management data of the ultimate underlying investee companies means that there are inherent difficulties in determining the value of the investments. Amounts realized on the sale of these investments may differ from the calculated values. |
The following table sets forth a summary of changes in the fair value of the pension plans’ Level 3 assets for the years ended December 31, 2012 and 2011 (dollars in thousands):
| Year Ended December 31 | ||||||||
| 2012 | 2011 | |||||||
| Balance, beginning of year |
$ | 3,531 | $ | 2,225 | ||||
| Purchases |
2,400 | 720 | ||||||
| Sales |
(375 | ) | — | |||||
| Unrealized gain |
790 | 586 | ||||||
|
|
|
|
|
|||||
| Balance, end of year |
$ | 6,346 | $ | 3,531 | ||||
|
|
|
|
|
|||||
Funding and Cash Flows
We fund our pension plans with amounts sufficient to meet legal funding requirements, plus any additional amounts we may determine to be appropriate considering the funded status of the plans, tax deductibility, cash flow from operations, and other factors. In 2012, we contributed $35.2 million to our plans, which exceeded our 2012 minimum pension contribution requirements. We have no required minimum contribution in 2013 and we will contribute at least the required minimum currently estimated to be approximately $3 million in 2014. The required minimum contribution depends on, among other things, actual returns on plan assets, changes in interest rates that affect our discount rate assumptions, changes in pension funding requirement laws, and modifications to our plans. Our estimates may change materially depending upon the effect of these and other factors. We may also elect to make additional voluntary contributions in any year, which could reduce the amount of required contributions in future years.
36
The following benefit payments reflect expected future service, as appropriate, and are expected to be paid to plan participants (dollars in thousands). Qualified pension benefit payments are paid from plan assets, while nonqualified pension benefit payments are paid by the Company.
| Pension Benefits | ||||
| 2013 |
$ | 21,787 | ||
| 2014 |
24,145 | |||
| 2015 |
26,204 | |||
| 2016 |
28,046 | |||
| 2017 |
29,998 | |||
| Years 2018-2022 |
172,273 | |||
11. Share-Based Compensation
Our shareholders have approved the Boise Inc. Incentive and Performance Plan (the Plan), which authorizes awards of share-based compensation, such as restricted stock, restricted stock units, performance units payable in stock, and stock options. These awards are at the discretion of the Compensation Committee of our board of directors, and they vest and expire in accordance with terms established at the time of grant. All awards under the Plan are eligible to participate in dividend or dividend equivalent payments, if any, which we accrue to be paid when the awards vest.
Shares issued pursuant to awards under the Plan are from our authorized but unissued shares or from treasury shares. The maximum number of shares approved for grant under the Plan is 17.2 million shares. As of December 31, 2012, 9.0 million shares remained available for future issuance under the Plan. Share-based compensation costs in BZ Intermediate’s financial statements represent expenses for restricted stock, restricted stock units, stock options, and performance units of Boise Inc., which have been pushed down to BZ Intermediate for accounting purposes.
Restricted Stock and Performance Units
Members of management and our directors have been granted restricted stock and restricted stock units (collectively restricted stock), the majority of which are subject to an EBITDA (earnings before interest, taxes, and depreciation, amortization, and depletion) goal and all of which are subject to service-based vesting restrictions. These awards generally vest over a three-year period. The fair values of our restricted stock awards were based on the closing market price of our common stock on the date of grant, and compensation expense is recorded over each award’s vesting period.
In 2012 and 2011, pursuant to the Plan, we also granted performance units to members of management. The number of performance units awarded is subject to adjustment based on the two-year average return on net operating assets (RONOA). Because the RONOA component contains a performance condition, we record compensation expense, net of estimated forfeitures, over the requisite service period based on the most probable number of shares expected to vest. Any shares not vested are forfeited. We based the fair value of these awards on the closing market price of our common stock on the grant date, and we record compensation expense over the awards’ vesting period.
37
The following summarizes the activity of our outstanding service- and market-condition restricted stock awards and performance units awarded under the Plan as of December 31, 2012, 2011, and 2010, and changes during the years ended December 31, 2012, 2011, and 2010 (number of shares in thousands):
| Service-Condition Vesting Awards (Restricted Stock Awards and Performance Units) |
Market-Condition Vesting Awards |
|||||||||||||||
| Number of Shares |
Weighted Average Grant-Date Fair Value |
Number of Shares |
Weighted Average Grant-Date Fair Value |
|||||||||||||
| Outstanding at January 1, 2010 (a) |
6,331 | $ | 0.74 | 1,884 | $ | 1.75 | ||||||||||
| Granted |
250 | 5.81 | — | — | ||||||||||||
| Vested (b) |
(3,009 | ) | 0.77 | (4 | ) | 1.75 | ||||||||||
| Forfeited |
(43 | ) | 4.26 | (2 | ) | 1.75 | ||||||||||
|
|
|
|
|
|||||||||||||
| Outstanding at December 31, 2010 (a) |
3,529 | $ | 1.04 | 1,878 | $ | 1.75 | ||||||||||
|
|
|
|
|
|||||||||||||
| Granted |
658 | 8.52 | — | — | ||||||||||||
| Vested (b) |
(1,128 | ) | 1.94 | — | — | |||||||||||
| Forfeited |
(535 | ) | 1.19 | (1,878 | ) | 1.75 | ||||||||||
|
|
|
|
|
|||||||||||||
| Outstanding at December 31, 2011 (a) |
2,524 | $ | 2.55 | — | $ | — | ||||||||||
|
|
|
|
|
|||||||||||||
| Granted |
760 | 8.04 | — | — | ||||||||||||
| Vested (b) |
(2,133 | ) | 1.46 | — | — | |||||||||||
| Forfeited |
(26 | ) | 5.51 | — | — | |||||||||||
|
|
|
|
|
|||||||||||||
| Outstanding at December 31, 2012 (a) |
1,125 | $ | 7.20 | — | $ | — | ||||||||||
|
|
|
|
|
|||||||||||||
| (a) | Outstanding awards included all nonvested and nonforfeited awards. |
| (b) | Total fair value of awards upon vesting for the years ended December 31, 2012, 2011, and 2010, was $17.5 million, $9.7 million, and $16.3 million, respectively. |
Stock Options
In 2012 and 2011, we granted approximately 508,000 and 363,000 nonqualified stock options to members of management. The stock options generally vest and become exercisable over three years. Our stock options generally have a contractual term of ten years, meaning the option must be exercised by the holder before the tenth anniversary of the grant date. No options were vested and exercisable at December 31, 2012.
The following is a summary of our stock option activity (number of options in thousands):
| Number of Options |
Weighted Average Exercise Price |
Weighted Average Remaining Life (in years) |
Aggregate Intrinsic Value |
|||||||||||||
| Outstanding at December 31, 2010 |
— | $ | — | |||||||||||||
|
|
|
|
|
|||||||||||||
| Granted |
363 | 8.53 | ||||||||||||||
| Forfeited |
(30 | ) | 8.55 | |||||||||||||
|
|
|
|
|
|||||||||||||
| Outstanding at December 31, 2011 |
333 | $ | 8.53 | 9.2 | $ | — | ||||||||||
|
|
|
|
|
|||||||||||||
| Granted |
508 | 8.22 | ||||||||||||||
| Forfeited |
— | — | ||||||||||||||
|
|
|
|
|
|||||||||||||
| Outstanding at December 31, 2012 |
841 | $ | 8.34 | 8.8 | $ | — | ||||||||||
|
|
|
|
|
|||||||||||||
The weighted average fair value of the stock options granted during 2012 and 2011 was $3.97 and $4.20, respectively. We recognize compensation expense over each award’s vesting period. We calculated the fair value using a Black-Scholes-Merton option-pricing model based on the market price of our common stock at the grant date and the assumptions specific to the underlying options. We based the expected volatility assumption on our historic stock performance and the volatility of related industry stocks. As the 2011 grants were our first issuances of stock options and our equity shares have been traded for a relatively short period of time, we did not have
38
sufficient historical data to provide a reasonable basis upon which to estimate the expected life. Therefore, we used the simplified method as allowed by the Securities and Exchange Commission (SEC). We based the risk-free interest rate upon yields of U.S. Treasury issues with terms similar to the expected life of the options.
The following table presents the range of assumptions used to calculate the fair value of stock options:
| Year Ended December 31 | ||||||||||||||||||||
| 2012 | 2011 | |||||||||||||||||||
| Black-Scholes-Merton assumptions: |
||||||||||||||||||||
| Expected volatility |
50.00 | % | - | 50.10 | % | 47.50 | % | - | 47.85 | % | ||||||||||
| Expected life (years) |
5.91 | - | 6.00 | 5.88 | - | 6.25 | ||||||||||||||
| Risk-free interest rate |
1.08 | % | - | 1.39 | % | 1.66 | % | - | 2.48 | % | ||||||||||
| Expected dividend yield |
— | — | ||||||||||||||||||
Compensation expense
Most of our share-based compensation expense was recorded in “General and administrative expenses” in our Consolidated Statements of Income. Total recognized share-based compensation expense related to restricted stock, performance units, and stock options, net of estimated forfeitures, is as follows (dollars in thousands):
| Year Ended December 31 | ||||||||||||
| 2012 | 2011 | 2010 | ||||||||||
| Service-condition restricted stock awards and performance units |
$ | 5,039 | $ | 3,415 | $ | 2,663 | ||||||
| Market-condition restricted stock awards |
— | (98 | ) | 1,070 | ||||||||
| Stock options |
944 | 378 | — | |||||||||
|
|
|
|
|
|
|
|||||||
| Total share-based compensation expense |
$ | 5,983 | $ | 3,695 | $ | 3,733 | ||||||
|
|
|
|
|
|
|
|||||||
The unrecognized compensation expense for all share-based awards is as follows (dollars in thousands):
| As of December 31, 2012 | ||||||||
| Unrecognized Compensation Expense |
Remaining Weighted Average Recognition Period (in years) |
|||||||
| Service-condition restricted stock awards and performance units |
$ | 4,528 | 1.5 | |||||
| Stock options |
1,752 | 1.9 | ||||||
|
|
|
|||||||
| Total unrecognized share-based compensation expense |
$ | 6,280 | 1.6 | |||||
|
|
|
|||||||
We evaluate share-based compensation expense for awards granted under the Plan on a quarterly basis based on our estimate of expected forfeitures, review of recent forfeiture activity, and expected future turnover. We recognize the effect of adjusting the forfeiture rate for all expense amortization in the period that we change the forfeiture estimate. The effect of forfeiture adjustments was insignificant in all periods presented.
The net income tax benefit associated with share-based payment awards was $2.6 million, $2.0 million, and $0.8 million for the years ended December 31, 2012, 2011, and 2010, respectively.
12. Stockholders’ Equity and Capital
Common Stock and Preferred Stock
We are authorized to issue 250.0 million shares of common stock, of which 100.5 million shares were issued and outstanding at December 31, 2012. At December 31, 2011, we had 100.3 million shares of common stock issued and outstanding, of which 1.5 million shares were restricted stock. The common stock outstanding does not include restricted stock units, performance units, or stock options under our share-based compensation plans. For additional information see Note 11, Share-Based Compensation.
39
We are also authorized to issue 1.0 million shares of preferred stock, with such rights and preferences as our board of directors may determine, without further shareholder action. No preferred shares were issued or outstanding at December 31, 2012 or 2011.
Share Repurchase Plan
In 2011, we announced our intent to repurchase up to $150 million of our common stock through a variety of methods, including in the open market, privately negotiated transactions, or through structured share repurchases. In 2011, we repurchased 21.2 million common shares for an average price of $5.74 per common share. We recorded the share repurchases in “Treasury stock” on Boise Inc.’s Consolidated Balance Sheets and “Repurchases of common stock” on the Consolidated Statement of Cash Flows. During the year ended December 31, 2012, we repurchased 441 common shares for an average price of $6.63 per common share. Our board of directors reserves the right, in its sole discretion, to terminate or suspend the share repurchase plan at any time.
Dividends
In 2012, 2011, and 2010, we paid special cash dividends of $1.20, $0.40, and $0.40 per common share, or total dividends of $119.7 million, $47.9 million, and $32.3 million, respectively.
Any decision to declare and pay dividends in the future will be made at the discretion of our board of directors and will depend on, among other things, our results of operations, cash requirements, financial condition, and other factors our board of directors may deem relevant. In addition, our ability to pay dividends is restricted by our Credit Facilities, the indentures governing our Senior Notes, and Delaware law and state regulatory authorities. Under Delaware law, our board of directors may not authorize payment of a dividend unless it is either paid out of our capital surplus, as calculated in accordance with Delaware General Corporation Law, or if we do not have a surplus, it is paid out of our net profits for the fiscal year in which the dividend is declared and/or the preceding fiscal year. Under our Credit Facilities and the indentures governing our Senior Notes, a dividend may be paid if it does not exceed our permitted restricted payment amount, which is calculated as the sum of 50% of our net income for distributions, together with other amounts as specified in our Credit Facilities. At December 31, 2012, the available restricted payment amount under our 8% Senior Notes indenture, which is more restrictive than our Credit Agreement and our 9% Senior Notes indenture, was approximately $106.9 million. To the extent we do not have adequate surplus or net profits, or available restricted payment amounts, we will be prohibited from paying dividends.
Warrants
In 2011, warrant holders exercised 40.3 million warrants, resulting in the issuance of 38.4 million additional common shares and cash proceeds of approximately $284.8 million. There are no further warrants outstanding or exercisable.
40
Accumulated Other Comprehensive Income (Loss)
An analysis of the changes in accumulated other comprehensive income (loss) and the related tax effects follows (dollars in thousands). See Note 9, Financial Instruments, and Note 10, Retirement and Benefit Plans, for additional information regarding the amounts recorded in accumulated other comprehensive income (loss).
| Benefit Plans | ||||||||||||||||||||||||
| Investment Gains (Losses) |
Foreign Currency Translation |
Cash Flow Hedges |
Actuarial Loss (a) |
Prior Service Cost |
Accumulated Other Comprehensive Income (Loss) |
|||||||||||||||||||
| Balance at December 31, 2009, net of taxes |
$ | (5 | ) | $ | — | $ | (553 | ) | $ | (70,578 | ) | $ | (417 | ) | $ | (71,553 | ) | |||||||
|
|
|
|
|
|
|
|
|
|
|
|
|
|||||||||||||
| Current-period changes, before taxes |
6 | — | — | (14,449 | ) | — | (14,443 | ) | ||||||||||||||||
| Reclassifications to earnings, before taxes |
— | — | 422 | 1,625 | 51 | 2,098 | ||||||||||||||||||
| Income taxes |
— | — | 131 | 4,964 | (19 | ) | 5,076 | |||||||||||||||||
|
|
|
|
|
|
|
|
|
|
|
|
|
|||||||||||||
| Balance at December 31, 2010, net of taxes |
$ | 1 | $ | — | $ | — | $ | (78,438 | ) | $ | (385 | ) | $ | (78,822 | ) | |||||||||
|
|
|
|
|
|
|
|
|
|
|
|
|
|||||||||||||
| Current-period changes, before taxes |
(1 | ) | (352 | ) | (6,776 | ) | (69,555 | ) | 300 | (76,384 | ) | |||||||||||||
| Reclassifications to earnings, before taxes |
— | — | 754 | 5,569 | 51 | 6,374 | ||||||||||||||||||
| Income taxes |
— | — | 2,320 | 24,685 | (135 | ) | 26,870 | |||||||||||||||||
|
|
|
|
|
|
|
|
|
|
|
|
|
|||||||||||||
| Balance at December 31, 2011, net of taxes |
$ | — | $ | (352 | ) | $ | (3,702 | ) | $ | (117,739 | ) | $ | (169 | ) | $ | (121,962 | ) | |||||||
|
|
|
|
|
|
|
|
|
|
|
|
|
|||||||||||||
| Current-period changes, before taxes |
— | 126 | 1,384 | 19,281 | 61 | 20,852 | ||||||||||||||||||
| Reclassifications to earnings, before taxes |
— | — | 2,637 | 10,074 | 10 | 12,721 | ||||||||||||||||||
| Income taxes |
— | (76 | ) | (1,549 | ) | (11,262 | ) | (28 | ) | (12,915 | ) | |||||||||||||
|
|
|
|
|
|
|
|
|
|
|
|
|
|||||||||||||
| Balance at December 31, 2012, net of taxes |
$ | — | $ | (302 | ) | $ | (1,230 | ) | $ | (99,646 | ) | $ | (126 | ) | $ | (101,304 | ) | |||||||
|
|
|
|
|
|
|
|
|
|
|
|
|
|||||||||||||
| (a) | Accumulated losses in excess of 10% of the greater of the projected benefit obligation or the market-related value of assets will be recognized on a straight-line basis over the average remaining service period of active employees, which is between seven to ten years, to the extent that losses are not offset by gains in subsequent years. The estimated net loss and prior service cost that will be amortized from “Accumulated other comprehensive income (loss)” into pension expense in 2013 is $8.6 million. |
BZ Intermediate Holdings LLC
BZ Intermediate has authorized 1,000 voting common units, all of which were issued and outstanding at December 31, 2012 and 2011, with a par value of $0.01. All of these units have been issued to Boise Inc. BZ Intermediate refers to its capital as “Business unit equity” on its Consolidated Balance Sheets, and this represents its equity transactions with Boise Inc., net income (loss) from the operations of its subsidiaries, the effect of changes in other comprehensive income, and stock-based compensation.
13. Concentrations of Risk
Business
Our largest customer is OfficeMax Incorporated (OfficeMax). Although we expect our long-term business relationship with OfficeMax to continue, the relationship exposes us to a significant concentration of business and financial risk. In 2012, our sales to OfficeMax were $493.9 million, which represents 19% of our total annual sales revenue and 35% of the annual sales revenue in our Paper segment. Approximately 38% of our total uncoated freesheet sales volume was purchased by OfficeMax in 2012. At December 31, 2012 and 2011, we had $39.5 million and $35.3 million, respectively, of accounts receivable due from OfficeMax, which represents 16% and 15%, respectively, of our total company receivables.
41
On February 20, 2013, OfficeMax announced it had signed a definitive merger agreement with its competitor, Office Depot. Our agreement with OfficeMax provides that it would survive the merger with respect to the office paper requirements of the legacy OfficeMax business. We cannot predict how the merger, if finalized, would affect the financial condition of the combined company, the paper requirements of the legacy OfficeMax business, or the effects the combined company would have on the pricing and competition for office papers. Significant reductions in paper purchases from OfficeMax (or the post-merger entity) would cause us to expand our customer base and could potentially decrease our profitability if new customer sales required either a decrease in our pricing and/or an increase in our cost of sales. Any significant deterioration in the financial condition of OfficeMax (or the post-merger entity) affecting the ability to pay or causing a significant change in the willingness to continue to purchase our products could have a material adverse effect on our business, financial condition, results of operations, and liquidity.
OfficeMax was our only customer that accounted for more than 10% of our total revenues, sales volumes, or accounts receivable in 2012.
Labor
At December 31, 2012, we had approximately 5,400 employees and approximately 50% of these employees worked pursuant to collective bargaining agreements. Approximately 4% of our employees work pursuant to collective bargaining agreements that will expire within the next twelve months.
14. Leases
We lease some of our locations, as well as other property and equipment, under operating leases. For purposes of determining straight-line rent expense, the lease term is calculated from the date of possession of the facility, including any periods of free rent and any renewal option periods that are reasonably assured of being exercised. Straight-line rent expense is also adjusted to reflect any allowances or reimbursements provided by the lessor. We had an insignificant amount of sublease rental income in the periods presented below. Accordingly, our future minimum lease payment requirements have not been reduced by sublease rental income. Rental expense for operating leases is as follows (dollars in thousands):
| Year Ended December 31 | ||||||||||||
| 2012 | 2011 | 2010 | ||||||||||
| Rental expense |
$ | 29,367 | $ | 23,855 | $ | 15,267 | ||||||
For noncancelable operating leases with remaining terms of more than one year, minimum lease payment requirements are as follows (dollars in thousands):
| 2013 | 2014 | 2015 | 2016 | 2017 | 2018 & Thereafter |
|||||||||||||||||||
| Minimum payment |
$ | 22,680 | $ | 21,688 | $ | 18,092 | $ | 15,037 | $ | 10,228 | $ | 11,065 | ||||||||||||
Substantially all lease agreements have fixed payment terms based on the passage of time. Some lease agreements provide us with the option to purchase the leased property. Additionally, some agreements contain renewal options averaging approximately five years, with fixed payment terms similar to those in the original lease agreements.
15. Asset Retirement Obligations
We accrue for asset retirement obligations in the period in which they are incurred if sufficient information is available to reasonably estimate the fair value of the obligation. Fair value estimates are determined using Level 3 inputs in the fair value hierarchy. The fair value of our asset retirement obligations is measured using expected future cash outflows discounted using the company’s credit-adjusted risk-free interest rate. When we record the liability, we capitalize the cost by increasing the carrying amount of the related long-lived asset. Over time, the liability is accreted to its settlement value, and the capitalized cost is depreciated over the useful life of the related asset. Occasionally, we become aware of events or circumstances that require us to revise our future estimated
42
cash flows. When revisions become necessary, we recalculate our obligation and adjust our asset and liability accounts utilizing appropriate discount rates. Upon settlement of the liability, we will recognize a gain or loss for any difference between the settlement amount and the liability recorded.
At December 31, 2012 and 2011, asset retirement obligations related predominantly to landfill closure, wastewater treatment pond dredging, and closed-site monitoring costs and were recorded primarily in “Other long-term liabilities” on the Consolidated Balance Sheets. These liabilities are based on the best estimate of costs and are updated periodically to reflect current technology, laws and regulations, inflation, and other economic factors. No assets are legally restricted for purposes of settling asset retirement obligations. The table below describes changes to the asset retirement obligations (dollars in thousands):
| Year Ended December 31 | ||||||||
| 2012 | 2011 | |||||||
| Asset retirement obligation at beginning of period |
$ | 10,041 | $ | 10,403 | ||||
| Liabilities incurred (Note 3) |
10,256 | — | ||||||
| Accretion expense |
387 | 812 | ||||||
| Payments |
(30 | ) | (29 | ) | ||||
| Revisions in estimated cash flows |
41 | (1,145 | ) | |||||
|
|
|
|
|
|||||
| Asset retirement obligation at end of period |
$ | 20,695 | $ | 10,041 | ||||
|
|
|
|
|
|||||
We have additional asset retirement obligations with indeterminate settlement dates. The fair value of these asset retirement obligations cannot be estimated due to the lack of sufficient information to estimate the settlement dates of the obligations. These asset retirement obligations include, for example, (i) removal and disposal of potentially hazardous materials related to equipment and/or an operating facility if the equipment and/or facilities were to undergo major maintenance, renovation, or demolition and (ii) storage sites or owned facilities for which removal and/or disposal of chemicals and other related materials are required if the operating facility is closed. We will recognize a liability in the period in which sufficient information becomes available to reasonably estimate the fair value of these obligations.
16. Transactions With Related Parties
For the period of February 22, 2008, through March 2010, Boise Cascade held a significant equity interest in us, and our transactions with Boise Cascade were recorded as related-party transactions. In March 2010, Boise Cascade sold all of its remaining investment in us, and accordingly, it is no longer a related party. As a result, beginning in March 2010, transactions (discussed below) of Louisiana Timber Procurement Company, L.L.C. (LTP) represent the only significant related-party activity recorded in our Consolidated Financial Statements.
Related-Party Sales
LTP is a variable-interest entity that is 50% owned by Boise Inc. and 50% owned by Boise Cascade. LTP procures sawtimber, pulpwood, residual chips, and other residual wood fiber to meet the wood and fiber requirements of Boise Inc. and Boise Cascade in Louisiana. We are the primary beneficiary of LTP, as we have the power to direct the activities that most significantly affect the economic performance of LTP. Therefore, we consolidate LTP in our financial statements in our Packaging segment. The carrying amounts of LTP’s assets and liabilities (which relate primarily to noninventory working capital items) on our Consolidated Balance Sheets were $4.0 million at December 31, 2012, and $3.3 million at December 31, 2011. During the years ended December 31, 2012, 2011, and 2010, we recorded $60.3 million, $40.1 million, and $33.0 million, respectively, of LTP sales to Boise Cascade in “Sales, Related parties” in the Consolidated Statements of Income and approximately the same amount of expenses in “Materials, labor, and other operating expenses (excluding depreciation).” The sales were at prices designed to approximate market prices.
We have an outsourcing services agreement under which we provide a number of corporate staff services to Boise Cascade at our cost. The agreement, as extended, expires on February 22, 2014. It will automatically renew for one-year terms unless either party provides notice of termination to the other party at least 12 months in advance of the expiration date. During the year ended December 31, 2010, we recorded $2.4 million of revenues in “Sales, Related parties” in our Consolidated Statements of Income. Services we provide to Boise Cascade under this agreement include transportation, information technology, accounting, and human resource services.
43
Related-Party Costs and Expenses
During the years ended December 31, 2012, 2011, and 2010, fiber purchases from related parties were $19.8 million, $18.8 million, and $25.3 million, respectively. In 2012 and 2011, most of these purchases related to chip and log purchases by LTP from Boise Cascade’s wood products business. In 2010, the purchases included both direct chip and log purchases from Boise Cascade while they were a related party and LTP’s purchases from Boise Cascade. All of the costs associated with these purchases were recorded as “Fiber costs from related parties” in the Consolidated Statements of Income. Fiber purchases from Boise Cascade subsequent to February 2010 are recorded as “Materials, labor, and other operating expenses (excluding depreciation)” in the Consolidated Statements of Income.
17. Segment Information
We operate and report our business in three reportable segments: Packaging, Paper, and Corporate and Other (support services). These segments represent distinct businesses that are managed separately because of differing products and services. Each of these businesses requires distinct operating and marketing strategies. Management reviews the performance of the Company based on these segments. The segments follow the accounting principles described in Note 2, Summary of Significant Accounting Policies.
Packaging. We manufacture and sell linerboard, corrugated containers and sheets, protective packaging products, and newsprint. We sell these products using our own sales personnel, independent brokers, and distribution partners. Our newsprint is sold primarily to newspaper publishers in the southern and southwestern U.S.
Paper. We manufacture and sell a range of papers, including communication-based papers, packaging-based papers, and market pulp. These products can be either commodity papers or papers with specialized or custom features, such as colors, coatings, high brightness, or recycled content, which make them specialty or premium products. We ship to customers both directly from our mills and through distribution centers. In 2012, approximately 38% of our uncoated freesheet paper sales volume, including approximately 63% of our office papers sales volume, was sold to OfficeMax, our largest customer.
Corporate and Other. Our Corporate and Other segment includes corporate support services, related assets and liabilities, and foreign exchange gains and losses. This segment also includes transportation assets, such as rail cars and trucks, which we use to transport our products from our manufacturing sites. We provide transportation services not only to our own facilities but also, on a limited basis, to third parties when geographic proximity and logistics are favorable. Rail cars and trucks are generally leased. Sales in this segment relate primarily to our rail and truck business.
Each segments’ profits and losses are measured on operating profits before interest expense and interest income. Specified operating expenses are accounted for in the Corporate and Other segment and are allocated to the segments. For many of these allocated expenses, the related assets and liabilities remain in the Corporate and Other segment. Segment operating results for Boise Inc. and BZ Intermediate are identical for all periods presented, except for insignificant differences in income tax provisions.
44
Segment sales to external customers by product line are as follows (dollars in millions):
| Year Ended December 31 | ||||||||||||
| 2012 | 2011 | 2010 | ||||||||||
| Packaging |
||||||||||||
| Linerboard |
$ | 76.6 | $ | 110.2 | $ | 94.2 | ||||||
| Newsprint |
134.3 | 132.7 | 121.7 | |||||||||
| Corrugated containers and sheets |
833.9 | 627.0 | 388.0 | |||||||||
| Other |
82.6 | 76.3 | 65.3 | |||||||||
|
|
|
|
|
|
|
|||||||
| 1,127.5 | 946.2 | 669.2 | ||||||||||
|
|
|
|
|
|
|
|||||||
| Paper |
||||||||||||
| Uncoated freesheet |
1,334.3 | 1,334.5 | 1,309.8 | |||||||||
| Corrugating medium |
1.0 | 0.3 | 0.1 | |||||||||
| Market pulp and other |
60.4 | 91.8 | 84.7 | |||||||||
|
|
|
|
|
|
|
|||||||
| 1,395.6 | 1,426.5 | 1,394.6 | ||||||||||
|
|
|
|
|
|
|
|||||||
| Corporate and Other |
32.3 | 31.4 | 30.0 | |||||||||
|
|
|
|
|
|
|
|||||||
| $ | 2,555.4 | $ | 2,404.1 | $ | 2,093.8 | |||||||
|
|
|
|
|
|
|
|||||||
Sales to foreign unaffiliated customers during the years ended December 31, 2012, 2011, and 2010, were $260.8 million, $242.1 million, and $212.2 million, respectively. At December 31, 2012 and 2011, the net carrying value of long-lived assets held by foreign operations were $11.7 million and $12.1 million, respectively.
An analysis of operations by segment is as follows (dollars in millions):
45
| Sales | Income (Loss) Before Income Taxes |
Depreciation, Amortization, and Depletion |
EBITDA (c) |
Capital Expenditures (d) |
Assets | |||||||||||||||||||||||||||||||
| Year Ended December 31, 2012 |
Trade | Related Parties |
Inter- segment |
Total | ||||||||||||||||||||||||||||||||
| Packaging |
$ | 1,067.2 | $ | 60.3 | $ | 2.6 | $ | 1,130.1 | $ | 101.6 | $ | 60.9 | $ | 162.5 | $ | 61.3 | $ | 958.0 | ||||||||||||||||||
| Paper |
1,395.6 | — | 72.7 | 1,468.3 | 73.9 | (a) | 87.7 | 161.6 | (a) | 71.1 | 1,144.7 | |||||||||||||||||||||||||
| Corporate and Other |
32.3 | — | 36.6 | 68.9 | (27.8 | ) | 3.7 | (24.1 | ) | 5.3 | 105.7 | |||||||||||||||||||||||||
| Intersegment eliminations |
— | — | (112.0 | ) | (112.0 | ) | — | — | — | — | — | |||||||||||||||||||||||||
|
|
|
|
|
|
|
|
|
|
|
|
|
|
|
|
|
|
|
|||||||||||||||||||
| $ | 2,495.1 | $ | 60.3 | $ | — | $ | 2,555.4 | 147.7 | $ | 152.3 | 300.0 | $ | 137.6 | $ | 2,208.4 | |||||||||||||||||||||
|
|
|
|
|
|
|
|
|
|
|
|
|
|
|
|
|
|
|
|||||||||||||||||||
| Interest expense |
(61.7 | ) | ||||||||||||||||||||||||||||||||||
| Interest income |
0.2 | |||||||||||||||||||||||||||||||||||
|
|
|
|
|
|||||||||||||||||||||||||||||||||
| $ | 86.1 | $ | 300.0 | |||||||||||||||||||||||||||||||||
|
|
|
|
|
|||||||||||||||||||||||||||||||||
| Sales | Income (Loss) Before Income Taxes |
Depreciation, Amortization, and Depletion |
EBITDA (c) |
Capital Expenditures (d) |
Assets | |||||||||||||||||||||||||||||||
| Year Ended December 31, 2011 |
Trade | Related Parties |
Inter- segment |
Total | ||||||||||||||||||||||||||||||||
| Packaging |
$ | 906.2 | $ | 40.1 | $ | 3.5 | $ | 949.7 | $ | 105.0 | (b) | $ | 50.5 | $ | 155.5 | (b) | $ | 49.2 | $ | 957.3 | ||||||||||||||||
| Paper |
1,426.5 | — | 70.0 | 1,496.5 | 112.1 | 89.5 | 201.5 | 74.2 | 1,190.9 | |||||||||||||||||||||||||||
| Corporate and Other |
31.4 | — | 36.9 | 68.3 | (25.9 | )(b) | 3.7 | (22.1 | )(b) | 5.3 | 138.0 | |||||||||||||||||||||||||
| Intersegment eliminations |
— | — | (110.4 | ) | (110.4 | ) | — | — | — | — | — | |||||||||||||||||||||||||
|
|
|
|
|
|
|
|
|
|
|
|
|
|
|
|
|
|
|
|||||||||||||||||||
| $ | 2,364.0 | $ | 40.1 | $ | — | $ | 2,404.1 | 191.2 | $ | 143.8 | 334.9 | $ | 128.8 | $ | 2,286.1 | |||||||||||||||||||||
|
|
|
|
|
|
|
|
|
|
|
|
|
|
|
|
|
|
|
|||||||||||||||||||
| Loss on extinguishment of debt |
(2.3 | ) | (2.3 | ) | ||||||||||||||||||||||||||||||||
| Interest expense |
(63.8 | ) | ||||||||||||||||||||||||||||||||||
| Interest income |
0.3 | |||||||||||||||||||||||||||||||||||
|
|
|
|
|
|||||||||||||||||||||||||||||||||
| $ | 125.3 | $ | 332.6 | |||||||||||||||||||||||||||||||||
|
|
|
|
|
|||||||||||||||||||||||||||||||||
| Sales | Income (Loss) Before Income Taxes |
Depreciation, Amortization, and Depletion |
EBITDA (c) |
Capital Expenditures (d) |
Assets | |||||||||||||||||||||||||||||||
| Year Ended December 31, 2010 |
Trade | Related Parties |
Inter- segment |
Total | ||||||||||||||||||||||||||||||||
| Packaging |
$ | 636.2 | $ | 33.0 | $ | 2.7 | $ | 671.9 | $ | 65.0 | $ | 38.6 | $ | 103.6 | $ | 38.6 | $ | 505.6 | ||||||||||||||||||
| Paper |
1,394.6 | — | 63.8 | 1,458.3 | 151.5 | 87.4 | 238.9 | 67.8 | 1,187.9 | |||||||||||||||||||||||||||
| Corporate and Other |
27.4 | 2.7 | 35.3 | 65.4 | (21.7 | ) | 4.0 | (17.7 | ) | 5.1 | 245.4 | |||||||||||||||||||||||||
| Intersegment eliminations |
— | — | (101.8 | ) | (101.8 | ) | — | — | — | — | — | |||||||||||||||||||||||||
|
|
|
|
|
|
|
|
|
|
|
|
|
|
|
|
|
|
|
|||||||||||||||||||
| $ | 2,058.1 | $ | 35.6 | $ | — | $ | 2,093.8 | 194.9 | $ | 129.9 | 324.8 | $ | 111.6 | $ | 1,939.0 | |||||||||||||||||||||
|
|
|
|
|
|
|
|
|
|
|
|
|
|
|
|
|
|
|
|||||||||||||||||||
| Loss on extinguishment of debt |
(22.2 | ) | (22.2 | ) | ||||||||||||||||||||||||||||||||
| Interest expense |
(64.8 | ) | ||||||||||||||||||||||||||||||||||
| Interest income |
0.3 | |||||||||||||||||||||||||||||||||||
|
|
|
|
|
|||||||||||||||||||||||||||||||||
| $ | 108.1 | $ | 302.6 | |||||||||||||||||||||||||||||||||
|
|
|
|
|
|||||||||||||||||||||||||||||||||
| (a) | Included $31.7 million of charges related primarily to ceasing paper production on our one remaining paper machine at our St. Helens, Oregon, paper mill. |
| (b) | Included $2.2 million of expense recorded in our Packaging segment related to the inventory purchase price adjustments. |
Included $3.1 million of transaction-related costs, of which $1.6 million was recorded in our Packaging segment and $1.5 million was recorded in our Corporate and Other segment. Transaction-related costs include expenses associated with transactions, whether consummated or not, and do not include integration costs.
| (c) | EBITDA represents income before interest (interest expense and interest income), income tax provision, and depreciation, amortization, and depletion. EBITDA is the primary measure used by our chief operating decision maker to evaluate segment operating performance and to decide how to allocate resources to segments. We believe EBITDA is useful to investors because it provides a means to evaluate the operating performance of our segments and our company on an ongoing basis using criteria that are used by our internal decision makers and because it is frequently used by investors and other interested parties in the evaluation of companies. We believe EBITDA is a meaningful measure because it presents a transparent view of our recurring operating performance and allows management to readily view operating trends, perform analytical comparisons, and identify strategies to |
46
improve operating performance. For example, we believe that the inclusion of items such as taxes, interest expense, and interest income distorts management’s ability to assess and view the core operating trends in our segments. EBITDA, however, is not a measure of our liquidity or financial performance under generally accepted accounting principles (GAAP) and should not be considered as an alternative to net income, income from operations, or any other performance measure derived in accordance with GAAP or as an alternative to cash flow from operating activities as a measure of our liquidity. The use of EBITDA instead of net income or segment income (loss) has limitations as an analytical tool, including the inability to determine profitability; the exclusion of interest expense, interest income, and associated significant cash requirements; and the exclusion of depreciation, amortization, and depletion, which represent significant and unavoidable operating costs, given the level of our indebtedness and the capital expenditures needed to maintain our businesses. Management compensates for these limitations by relying on our GAAP results. Our measures of EBITDA are not necessarily comparable to other similarly titled captions of other companies due to potential inconsistencies in the methods of calculation.
The following is a reconciliation of net income to EBITDA (dollars in millions):
| Boise Inc. | BZ Intermediate | |||||||||||||||||||||||
| Year Ended December 31 | ||||||||||||||||||||||||
| 2012 | 2011 | 2010 | 2012 | 2011 | 2010 | |||||||||||||||||||
| Net income |
$ | 52.2 | $ | 75.2 | $ | 62.7 | $ | 52.2 | $ | 75.2 | $ | 63.6 | ||||||||||||
| Interest expense |
61.7 | 63.8 | 64.8 | 61.7 | 63.8 | 64.8 | ||||||||||||||||||
| Interest income |
(0.2 | ) | (0.3 | ) | (0.3 | ) | (0.2 | ) | (0.3 | ) | (0.3 | ) | ||||||||||||
| Income tax provision |
34.0 | 50.1 | 45.4 | 34.0 | 50.1 | 44.5 | ||||||||||||||||||
| Depreciation, amortization, and depletion |
152.3 | 143.8 | 129.9 | 152.3 | 143.8 | 129.9 | ||||||||||||||||||
|
|
|
|
|
|
|
|
|
|
|
|
|
|||||||||||||
| EBITDA |
$ | 300.0 | $ | 332.6 | $ | 302.6 | $ | 300.0 | $ | 332.6 | $ | 302.6 | ||||||||||||
|
|
|
|
|
|
|
|
|
|
|
|
|
|||||||||||||
| (d) | This figure represents “Expenditures for property and equipment” and excludes cash used for “Acquisition of businesses and facilities, net of cash acquired” as reported on our Consolidated Statements of Cash Flows. |
47
18. Commitments, Guarantees, Indemnifications, and Legal Proceedings
Commitments
We have financial commitments and obligations that arise in the ordinary course of our business. These include long-term debt, lease payments, and derivative instruments (discussed in Note 8, Debt, Note 9, Financial Instruments, and Note 14, Leases) and obligations to purchase goods and services (discussed below).
We are a party to a number of long-term log and fiber supply agreements. At December 31, 2012 and 2011, our total estimated obligation for log and fiber purchases under contracts with third parties was approximately $65.6 million and $75.5 million, respectively. The estimate is based on contract terms or first quarter 2013 pricing. Purchase prices under most of these agreements are set quarterly or semiannually based on regional market prices. Except for deposits required pursuant to wood supply contracts, these obligations are not recorded in our consolidated financial statements until contract payment terms take effect. Under most of the log and fiber supply agreements, we have the right to cancel or reduce our commitments if our requirements decrease.
We have financial obligations to purchase electricity and natural gas for our manufacturing locations. These obligations include multiple-year purchase commitments and minimum annual purchase requirements. At December 31, 2012 and 2011, we had approximately $27.4 million and $26.5 million, respectively, of utility purchase commitments. These commitments were estimated at prices in effect on December 31, 2012 or 2011, respectively, or determined pursuant to contractual terms, if available.
Guarantees and Indemnifications
We provide guarantees, indemnifications, and other assurances to third parties in the normal course of our business. These include tort indemnifications, environmental assurances, and representations and warranties in merger and acquisition agreements. At December 31, 2012, we are not aware of any material liabilities arising from any guarantee, indemnification, or financial assurance we have provided. If we determined such a liability was probable and subject to reasonable determination, we would accrue for it at that time.
Legal Proceedings
We are a party to routine proceedings that arise in the course of our business; however, we are not currently a party to any legal proceedings or environmental claims we believe would have a material adverse effect on our financial position, results of operations, or liquidity, either individually or in the aggregate.
48
19. Quarterly Results of Operations (unaudited, dollars in millions, except per-share and stock price information)
| 2012 | ||||||||||||||||
| First Quarter |
Second Quarter |
Third Quarter (a) |
Fourth Quarter (a) |
|||||||||||||
| Net sales |
$ | 644.8 | $ | 637.8 | $ | 645.2 | $ | 627.5 | ||||||||
| Income from operations |
49.7 | 37.7 | 21.3 | 38.8 | ||||||||||||
| Net income |
21.3 | 13.7 | 3.6 | 13.5 | ||||||||||||
| Net income per common share: |
||||||||||||||||
| Basic |
0.22 | 0.14 | 0.04 | 0.14 | ||||||||||||
| Diluted |
0.21 | 0.14 | 0.04 | 0.13 | ||||||||||||
| Common stock dividends per share |
0.48 | — | — | 0.72 | ||||||||||||
| Common stock prices (d) |
||||||||||||||||
| High |
8.49 | 8.21 | 8.93 | 9.06 | ||||||||||||
| Low |
7.25 | 6.48 | 6.86 | 7.63 | ||||||||||||
| 2011 | ||||||||||||||||
| First Quarter (b) |
Second Quarter |
Third Quarter |
Fourth Quarter (c) |
|||||||||||||
| Net sales |
$ | 568.8 | $ | 603.1 | $ | 631.7 | $ | 600.4 | ||||||||
| Income from operations |
48.1 | 34.4 | 62.6 | 45.9 | ||||||||||||
| Net income |
18.7 | 11.9 | 28.4 | 16.3 | ||||||||||||
| Net income per common share: |
||||||||||||||||
| Basic |
0.23 | 0.11 | 0.25 | 0.16 | ||||||||||||
| Diluted |
0.21 | 0.11 | 0.24 | 0.15 | ||||||||||||
| Common stock dividends per share |
— | 0.40 | — | — | ||||||||||||
| Common stock prices (d) |
||||||||||||||||
| High |
9.55 | 9.82 | 8.12 | 7.12 | ||||||||||||
| Low |
8.10 | 6.75 | 4.42 | 4.71 | ||||||||||||
| (a) | Third quarter and fourth quarter 2012 included $31.3 million and $0.5 million, respectively, of charges related primarily to ceasing paper production on our one remaining paper machine at our St. Helens, Oregon, paper mill. |
| (b) | First quarter 2011 included $2.2 million of expense related to inventory purchase price accounting adjustments. |
| (c) | Fourth quarter 2011 included $2.3 million of expense recorded in the Corporate and Other segment associated with entering into a new credit agreement. |
Fourth quarter 2011 included $1.4 million of transaction-related costs that were recorded in our Packaging segment. Transaction-related costs include expenses associated with transactions, whether consummated or not, and do not include integration costs.
| (d) | Our common stock trades on the New York Stock Exchange under the symbol BZ. Common stock prices are based on daily closing prices. |
The net sales, income from operations, and net income for BZ Intermediate are substantially the same as the quarterly results for Boise Inc. included above.
49
20. Consolidating Guarantor and Nonguarantor Financial Information
Our 9% and 8% senior notes (Senior Notes) were issued by Boise Paper Holdings and co-issuers (Boise Co-Issuer Company and Boise Finance Company). The Senior Notes are jointly and severally guaranteed on a senior unsecured basis by BZ Intermediate and each of its existing and, to the extent they become guarantors under the Credit Facilities, future subsidiaries (other than: (i) Boise Paper Holdings and the co-issuers; (ii) Louisiana Timber Procurement Company, L.L.C.; and (iii) our foreign subsidiaries, including those acquired as part of the Hexacomb Acquisition). Each of the co-issuers of the senior subordinated notes and each of the subsidiaries of BZ Intermediate that is a guarantor thereof is 100% owned, directly or indirectly by Boise Paper Holdings.
The following consolidating financial statements present the results of operations, comprehensive income, financial position, and cash flows of (i) BZ Intermediate Holdings LLC (parent); (ii) Boise Paper Holdings and co-issuers; (iii) guarantor subsidiaries; (iv) nonguarantor subsidiaries; and (v) eliminations to arrive at the information on a consolidated basis. Other than these consolidated financial statements and footnotes for Boise Inc. and BZ Intermediate, financial statements and other disclosures concerning the guarantors have not been presented. Management believes that such information is not material to investors and because the cancellation provisions of the guarantor subsidiaries guarantees are customary and do not permit a guarantor subsidiary to opt out of the obligation prior to or during the term of the debt. Under these cancellation provisions, each guarantor subsidiary is automatically released from its obligations as a guarantor upon the sale of the subsidiary or substantially all of its assets to a third party, the designation of the subsidiary as an unrestricted subsidiary for the purposes of the covenants included in the indentures, the release of the indebtedness under the indentures, or if the issuers exercise their legal defeasance option or discharge their obligations in accordance with the indentures.
50
BZ Intermediate Holdings LLC and Subsidiaries
Consolidating Statements of Income
For the Year Ended December 31, 2012
(dollars in thousands)
| BZ Intermediate Holdings LLC (Parent) |
Boise Paper Holdings and Co- issuers |
Guarantor Subsidiaries |
Nonguarantor Subsidiaries |
Eliminations | Consolidated | |||||||||||||||||||
| Sales |
||||||||||||||||||||||||
| Trade |
$ | — | $ | 14,956 | $ | 2,431,516 | $ | 48,620 | $ | — | $ | 2,495,092 | ||||||||||||
| Intercompany |
— | — | 5,213 | 113,566 | (118,779 | ) | — | |||||||||||||||||
| Related parties |
— | — | — | 60,271 | — | 60,271 | ||||||||||||||||||
|
|
|
|
|
|
|
|
|
|
|
|
|
|||||||||||||
| — | 14,956 | 2,436,729 | 222,457 | (118,779 | ) | 2,555,363 | ||||||||||||||||||
|
|
|
|
|
|
|
|
|
|
|
|
|
|||||||||||||
| Costs and expenses |
||||||||||||||||||||||||
| Materials, labor, and other operating expenses (excluding depreciation) |
— | 13,817 | 1,916,907 | 192,099 | (118,779 | ) | 2,004,044 | |||||||||||||||||
| Fiber costs from related parties |
— | — | — | 19,772 | — | 19,772 | ||||||||||||||||||
| Depreciation, amortization, and depletion |
— | 2,978 | 146,449 | 2,879 | — | 152,306 | ||||||||||||||||||
| Selling and distribution expenses |
— | — | 120,845 | 982 | — | 121,827 | ||||||||||||||||||
| General and administrative expenses |
— | 28,313 | 45,971 | 5,464 | — | 79,748 | ||||||||||||||||||
| St. Helens charges |
— | — | 27,559 | — | — | 27,559 | ||||||||||||||||||
| Other (income) expense, net |
— | 1,136 | 1,049 | 387 | — | 2,572 | ||||||||||||||||||
|
|
|
|
|
|
|
|
|
|
|
|
|
|||||||||||||
| — | 46,244 | 2,258,780 | 221,583 | (118,779 | ) | 2,407,828 | ||||||||||||||||||
|
|
|
|
|
|
|
|
|
|
|
|
|
|||||||||||||
| Income (loss) from operations |
— | (31,288 | ) | 177,949 | 874 | — | 147,535 | |||||||||||||||||
|
|
|
|
|
|
|
|
|
|
|
|
|
|||||||||||||
| Foreign exchange gain |
— | 145 | 10 | 24 | — | 179 | ||||||||||||||||||
| Interest expense |
— | (61,693 | ) | — | (47 | ) | — | (61,740 | ) | |||||||||||||||
| Interest expense—intercompany |
— | (191 | ) | — | (55 | ) | 246 | — | ||||||||||||||||
| Interest income |
— | 48 | 60 | 52 | — | 160 | ||||||||||||||||||
| Interest income—intercompany |
— | 55 | 191 | — | (246 | ) | — | |||||||||||||||||
|
|
|
|
|
|
|
|
|
|
|
|
|
|||||||||||||
| — | (61,636 | ) | 261 | (26 | ) | — | (61,401 | ) | ||||||||||||||||
|
|
|
|
|
|
|
|
|
|
|
|
|
|||||||||||||
| Income (loss) before income taxes and equity in net income of affiliates |
— | (92,924 | ) | 178,210 | 848 | — | 86,134 | |||||||||||||||||
| Income tax provision |
— | (32,431 | ) | (1,500 | ) | (53 | ) | — | (33,984 | ) | ||||||||||||||
|
|
|
|
|
|
|
|
|
|
|
|
|
|||||||||||||
| Income (loss) before equity in net income of affiliates |
— | (125,355 | ) | 176,710 | 795 | — | 52,150 | |||||||||||||||||
| Equity in net income of affiliates |
52,150 | 177,505 | — | — | (229,655 | ) | — | |||||||||||||||||
|
|
|
|
|
|
|
|
|
|
|
|
|
|||||||||||||
| Net income |
$ | 52,150 | $ | 52,150 | $ | 176,710 | $ | 795 | $ | (229,655 | ) | $ | 52,150 | |||||||||||
|
|
|
|
|
|
|
|
|
|
|
|
|
|||||||||||||
51
BZ Intermediate Holdings LLC and Subsidiaries
Consolidating Statements of Income
For the Year Ended December 31, 2011
(dollars in thousands)
| BZ Intermediate Holdings LLC (Parent) |
Boise Paper Holdings and Co- issuers |
Guarantor Subsidiaries |
Nonguarantor Subsidiaries |
Eliminations | Consolidated | |||||||||||||||||||
| Sales |
||||||||||||||||||||||||
| Trade |
$ | — | $ | 14,657 | $ | 2,340,570 | $ | 8,797 | $ | — | $ | 2,364,024 | ||||||||||||
| Intercompany |
— | — | 40 | 100,536 | (100,576 | ) | — | |||||||||||||||||
| Related parties |
— | — | — | 40,057 | — | 40,057 | ||||||||||||||||||
|
|
|
|
|
|
|
|
|
|
|
|
|
|||||||||||||
| — | 14,657 | 2,340,610 | 149,390 | (100,576 | ) | 2,404,081 | ||||||||||||||||||
|
|
|
|
|
|
|
|
|
|
|
|
|
|||||||||||||
| Costs and expenses |
||||||||||||||||||||||||
| Materials, labor, and other operating expenses (excluding depreciation) |
— | 13,835 | 1,837,170 | 129,842 | (100,576 | ) | 1,880,271 | |||||||||||||||||
| Fiber costs from related parties |
— | — | — | 18,763 | — | 18,763 | ||||||||||||||||||
| Depreciation, amortization, and depletion |
— | 3,091 | 140,563 | 104 | — | 143,758 | ||||||||||||||||||
| Selling and distribution expenses |
— | — | 107,302 | 352 | — | 107,654 | ||||||||||||||||||
| General and administrative expenses |
— | 25,452 | 34,688 | 447 | — | 60,587 | ||||||||||||||||||
| Other (income) expense, net |
— | 1,600 | 730 | (336 | ) | — | 1,994 | |||||||||||||||||
|
|
|
|
|
|
|
|
|
|
|
|
|
|||||||||||||
| — | 43,978 | 2,120,453 | 149,172 | (100,576 | ) | 2,213,027 | ||||||||||||||||||
|
|
|
|
|
|
|
|
|
|
|
|
|
|||||||||||||
| Income (loss) from operations |
— | (29,321 | ) | 220,157 | 218 | — | 191,054 | |||||||||||||||||
|
|
|
|
|
|
|
|
|
|
|
|
|
|||||||||||||
| Foreign exchange gain (loss) |
— | (390 | ) | 453 | 72 | — | 135 | |||||||||||||||||
| Loss on extinguishment of debt |
— | (2,300 | ) | — | — | — | (2,300 | ) | ||||||||||||||||
| Interest expense |
— | (63,814 | ) | — | (6 | ) | 3 | (63,817 | ) | |||||||||||||||
| Interest expense—intercompany |
— | (188 | ) | — | (15 | ) | 203 | — | ||||||||||||||||
| Interest income |
— | 260 | 9 | — | — | 269 | ||||||||||||||||||
| Interest income—intercompany |
— | 18 | 188 | — | (206 | ) | — | |||||||||||||||||
|
|
|
|
|
|
|
|
|
|
|
|
|
|||||||||||||
| — | (66,414 | ) | 650 | 51 | — | (65,713 | ) | |||||||||||||||||
|
|
|
|
|
|
|
|
|
|
|
|
|
|||||||||||||
| Income (loss) before income taxes and equity in net income of affiliates |
— | (95,735 | ) | 220,807 | 269 | — | 125,341 | |||||||||||||||||
| Income tax provision |
— | (48,372 | ) | (1,662 | ) | (97 | ) | — | (50,131 | ) | ||||||||||||||
|
|
|
|
|
|
|
|
|
|
|
|
|
|||||||||||||
| Income (loss) before equity in net income of affiliates |
— | (144,107 | ) | 219,145 | 172 | — | 75,210 | |||||||||||||||||
| Equity in net income of affiliates |
75,210 | 219,317 | — | — | (294,527 | ) | — | |||||||||||||||||
|
|
|
|
|
|
|
|
|
|
|
|
|
|||||||||||||
| Net income |
$ | 75,210 | $ | 75,210 | $ | 219,145 | $ | 172 | $ | (294,527 | ) | $ | 75,210 | |||||||||||
|
|
|
|
|
|
|
|
|
|
|
|
|
|||||||||||||
52
BZ Intermediate Holdings LLC and Subsidiaries
Consolidating Statements of Income
For the Year Ended December 31, 2010
(dollars in thousands)
| BZ Intermediate Holdings LLC (Parent) |
Boise Paper Holdings and Co- issuers |
Guarantor Subsidiaries |
Nonguarantor Subsidiaries |
Eliminations | Consolidated | |||||||||||||||||||
| Sales |
||||||||||||||||||||||||
| Trade |
$ | — | $ | 11,994 | $ | 2,039,308 | $ | 6,830 | $ | — | $ | 2,058,132 | ||||||||||||
| Intercompany |
— | — | — | 110,619 | (110,619 | ) | — | |||||||||||||||||
| Related parties |
— | 2,364 | 333 | 32,948 | — | 35,645 | ||||||||||||||||||
|
|
|
|
|
|
|
|
|
|
|
|
|
|||||||||||||
| — | 14,358 | 2,039,641 | 150,397 | (110,619 | ) | 2,093,777 | ||||||||||||||||||
|
|
|
|
|
|
|
|
|
|
|
|
|
|||||||||||||
| Costs and expenses |
||||||||||||||||||||||||
| Materials, labor, and other operating expenses (excluding depreciation) |
— | 14,039 | 1,605,480 | 125,139 | (110,619 | ) | 1,634,039 | |||||||||||||||||
| Fiber costs from related parties |
— | — | 25,259 | — | 25,259 | |||||||||||||||||||
| Depreciation, amortization, and depletion |
— | 3,454 | 126,472 | — | — | 129,926 | ||||||||||||||||||
| Selling and distribution expenses |
— | — | 57,873 | 234 | — | 58,107 | ||||||||||||||||||
| General and administrative expenses |
— | 21,949 | 30,324 | — | — | 52,273 | ||||||||||||||||||
| Other (income) expense, net |
— | 225 | 249 | (261 | ) | — | 213 | |||||||||||||||||
|
|
|
|
|
|
|
|
|
|
|
|
|
|||||||||||||
| — | 39,667 | 1,820,398 | 150,371 | (110,619 | ) | 1,899,817 | ||||||||||||||||||
|
|
|
|
|
|
|
|
|
|
|
|
|
|||||||||||||
| Income (loss) from operations |
— | (25,309 | ) | 219,243 | 26 | — | 193,960 | |||||||||||||||||
|
|
|
|
|
|
|
|
|
|
|
|
|
|||||||||||||
| Foreign exchange gain |
— | 871 | 19 | — | — | 890 | ||||||||||||||||||
| Loss on extinguishment of debt |
— | (22,225 | ) | — | — | — | (22,225 | ) | ||||||||||||||||
| Interest expense |
— | (64,825 | ) | — | — | — | (64,825 | ) | ||||||||||||||||
| Interest expense—intercompany |
— | (212 | ) | — | (16 | ) | 228 | — | ||||||||||||||||
| Interest income |
— | 299 | 7 | — | — | 306 | ||||||||||||||||||
| Interest income—intercompany |
— | 16 | 212 | — | (228 | ) | — | |||||||||||||||||
|
|
|
|
|
|
|
|
|
|
|
|
|
|||||||||||||
| — | (86,076 | ) | 238 | (16 | ) | — | (85,854 | ) | ||||||||||||||||
|
|
|
|
|
|
|
|
|
|
|
|
|
|||||||||||||
| Income (loss) before income taxes and equity in net income of affiliates |
— | (111,385 | ) | 219,481 | 10 | — | 108,106 | |||||||||||||||||
| Income tax (provision) benefit |
— | (43,187 | ) | (1,350 | ) | 8 | — | (44,529 | ) | |||||||||||||||
|
|
|
|
|
|
|
|
|
|
|
|
|
|||||||||||||
| Income (loss) before equity in net income of affiliates |
— | (154,572 | ) | 218,131 | 18 | — | 63,577 | |||||||||||||||||
| Equity in net income of affiliates |
63,577 | 218,149 | — | — | (281,726 | ) | — | |||||||||||||||||
|
|
|
|
|
|
|
|
|
|
|
|
|
|||||||||||||
| Net income |
$ | 63,577 | $ | 63,577 | $ | 218,131 | $ | 18 | $ | (281,726 | ) | $ | 63,577 | |||||||||||
|
|
|
|
|
|
|
|
|
|
|
|
|
|||||||||||||
53
BZ Intermediate Holdings LLC and Subsidiaries
Consolidating Statements of Comprehensive Income
For the Year Ended December 31, 2012
(dollars in thousands)
| BZ Intermediate Holdings LLC (Parent) |
Boise Paper Holdings and Co- issuers |
Guarantor Subsidiaries |
Nonguarantor Subsidiaries |
Eliminations | Consolidated | |||||||||||||||||||
| Net income |
$ | 52,150 | $ | 52,150 | $ | 176,710 | $ | 795 | $ | (229,655 | ) | $ | 52,150 | |||||||||||
| Other comprehensive income (loss), net of tax |
||||||||||||||||||||||||
| Foreign currency translation adjustment |
— | — | — | 50 | — | 50 | ||||||||||||||||||
| Cash flow hedges: |
||||||||||||||||||||||||
| Change in fair value |
— | 850 | — | — | — | 850 | ||||||||||||||||||
| Loss included in net income |
— | 1,622 | — | — | — | 1,622 | ||||||||||||||||||
| Actuarial gain and prior service cost (including related amortization) for defined benefit pension plans |
— | 18,033 | — | — | — | 18,033 | ||||||||||||||||||
| Other |
— | 103 | — | — | — | 103 | ||||||||||||||||||
| Equity in other comprehensive income of affiliates |
20,658 | 50 | — | — | (20,708 | ) | — | |||||||||||||||||
|
|
|
|
|
|
|
|
|
|
|
|
|
|||||||||||||
| 20,658 | 20,658 | — | 50 | (20,708 | ) | 20,658 | ||||||||||||||||||
|
|
|
|
|
|
|
|
|
|
|
|
|
|||||||||||||
| Comprehensive income |
$ | 72,808 | $ | 72,808 | $ | 176,710 | $ | 845 | $ | (250,363 | ) | $ | 72,808 | |||||||||||
|
|
|
|
|
|
|
|
|
|
|
|
|
|||||||||||||
BZ Intermediate Holdings LLC and Subsidiaries
Consolidating Statements of Comprehensive Income
For the Year Ended December 31, 2011
(dollars in thousands)
| BZ Intermediate Holdings LLC (Parent) |
Boise Paper Holdings and Co- issuers |
Guarantor Subsidiaries |
Nonguarantor Subsidiaries |
Eliminations | Consolidated | |||||||||||||||||||
| Net income |
$ | 75,210 | $ | 75,210 | $ | 219,145 | $ | 172 | $ | (294,527 | ) | $ | 75,210 | |||||||||||
| Other comprehensive income (loss), net of tax |
||||||||||||||||||||||||
| Foreign currency translation adjustment |
— | — | — | (352 | ) | — | (352 | ) | ||||||||||||||||
| Cash flow hedges: |
||||||||||||||||||||||||
| Change in fair value |
— | (4,165 | ) | — | — | — | (4,165 | ) | ||||||||||||||||
| Loss included in net income |
— | 463 | — | — | — | 463 | ||||||||||||||||||
| Actuarial loss and prior service cost (including related amortization) for defined benefit pension plans |
— | (39,149 | ) | — | — | — | (39,149 | ) | ||||||||||||||||
| Other |
— | 63 | — | — | — | 63 | ||||||||||||||||||
| Equity in other comprehensive loss of affiliates |
(43,140 | ) | (352 | ) | — | — | 43,492 | — | ||||||||||||||||
|
|
|
|
|
|
|
|
|
|
|
|
|
|||||||||||||
| (43,140 | ) | (43,140 | ) | — | (352 | ) | 43,492 | (43,140 | ) | |||||||||||||||
|
|
|
|
|
|
|
|
|
|
|
|
|
|||||||||||||
| Comprehensive income (loss) |
$ | 32,070 | $ | 32,070 | $ | 219,145 | $ | (180 | ) | $ | (251,035 | ) | $ | 32,070 | ||||||||||
|
|
|
|
|
|
|
|
|
|
|
|
|
|||||||||||||
54
BZ Intermediate Holdings LLC and Subsidiaries
Consolidating Statements of Comprehensive Income
For the Year Ended December 31, 2010
(dollars in thousands)
| BZ Intermediate Holdings LLC (Parent) |
Boise Paper Holdings and Co- issuers |
Guarantor Subsidiaries |
Nonguarantor Subsidiaries |
Eliminations | Consolidated | |||||||||||||||||||
| Net income |
$ | 63,577 | $ | 63,577 | $ | 218,131 | $ | 18 | $ | (281,726 | ) | $ | 63,577 | |||||||||||
| Other comprehensive income (loss), net of tax |
||||||||||||||||||||||||
| Cash flow hedges: |
||||||||||||||||||||||||
| Loss included in net income |
— | 553 | — | — | — | 553 | ||||||||||||||||||
| Actuarial loss and prior service cost (including related amortization) for defined benefit pension plans |
— | (7,744 | ) | — | — | — | (7,744 | ) | ||||||||||||||||
| Other |
— | (78 | ) | — | — | — | (78 | ) | ||||||||||||||||
| Equity in other comprehensive loss of affiliates |
(7,269 | ) | — | — | — | 7,269 | — | |||||||||||||||||
|
|
|
|
|
|
|
|
|
|
|
|
|
|||||||||||||
| (7,269 | ) | (7,269 | ) | — | — | 7,269 | (7,269 | ) | ||||||||||||||||
|
|
|
|
|
|
|
|
|
|
|
|
|
|||||||||||||
| Comprehensive income |
$ | 56,308 | $ | 56,308 | $ | 218,131 | $ | 18 | $ | (274,457 | ) | $ | 56,308 | |||||||||||
|
|
|
|
|
|
|
|
|
|
|
|
|
|||||||||||||
55
BZ Intermediate Holdings LLC and Subsidiaries
Consolidating Balance Sheets at December 31, 2012
(dollars in thousands)
| BZ Intermediate Holdings LLC (Parent) |
Boise Paper Holdings and Co- issuers |
Guarantor Subsidiaries |
Nonguarantor Subsidiaries |
Eliminations | Consolidated | |||||||||||||||||||
| ASSETS |
||||||||||||||||||||||||
| Current |
||||||||||||||||||||||||
| Cash and cash equivalents |
$ | — | $ | 40,801 | $ | 516 | $ | 8,390 | $ | — | $ | 49,707 | ||||||||||||
| Receivables |
||||||||||||||||||||||||
| Trade, less allowances |
— | 1,458 | 230,178 | 8,823 | — | 240,459 | ||||||||||||||||||
| Intercompany |
— | 2,234 | 1,580 | 2,670 | (6,484 | ) | — | |||||||||||||||||
| Other |
— | 2,880 | 4,266 | 1,121 | — | 8,267 | ||||||||||||||||||
| Inventories |
— | 3 | 291,065 | 3,416 | — | 294,484 | ||||||||||||||||||
| Deferred income taxes |
— | 17,955 | — | — | — | 17,955 | ||||||||||||||||||
| Prepaid and other |
— | 6,952 | 1,021 | 855 | — | 8,828 | ||||||||||||||||||
|
|
|
|
|
|
|
|
|
|
|
|
|
|||||||||||||
| — | 72,283 | 528,626 | 25,275 | (6,484 | ) | 619,700 | ||||||||||||||||||
|
|
|
|
|
|
|
|
|
|
|
|
|
|||||||||||||
| Property |
||||||||||||||||||||||||
| Property and equipment, net |
— | 7,930 | 1,203,384 | 11,687 | — | 1,223,001 | ||||||||||||||||||
| Fiber farms |
— | — | 24,311 | — | — | 24,311 | ||||||||||||||||||
|
|
|
|
|
|
|
|
|
|
|
|
|
|||||||||||||
| — | 7,930 | 1,227,695 | 11,687 | — | 1,247,312 | |||||||||||||||||||
|
|
|
|
|
|
|
|
|
|
|
|
|
|||||||||||||
| Deferred financing costs |
— | 26,677 | — | — | — | 26,677 | ||||||||||||||||||
| Goodwill |
— | — | 153,576 | 6,554 | — | 160,130 | ||||||||||||||||||
| Intangible assets, net |
— | — | 133,115 | 14,449 | — | 147,564 | ||||||||||||||||||
| Investments in affiliates |
756,683 | 1,778,531 | — | — | (2,535,214 | ) | — | |||||||||||||||||
| Intercompany notes receivable |
— | 3,400 | 1,524 | — | (4,924 | ) | — | |||||||||||||||||
| Other assets |
— | 5,992 | 902 | 135 | — | 7,029 | ||||||||||||||||||
|
|
|
|
|
|
|
|
|
|
|
|
|
|||||||||||||
| Total assets |
$ | 756,683 | $ | 1,894,813 | $ | 2,045,438 | $ | 58,100 | $ | (2,546,622 | ) | $ | 2,208,412 | |||||||||||
|
|
|
|
|
|
|
|
|
|
|
|
|
|||||||||||||
56
BZ Intermediate Holdings LLC and Subsidiaries
Consolidating Balance Sheets at December 31, 2012 (continued)
(dollars in thousands)
| BZ Intermediate Holdings LLC (Parent) |
Boise Paper Holdings and Co- issuers |
Guarantor Subsidiaries |
Nonguarantor Subsidiaries |
Eliminations | Consolidated | |||||||||||||||||||
| LIABILITIES AND CAPITAL |
||||||||||||||||||||||||
| Current |
||||||||||||||||||||||||
| Current portion of long-term debt |
$ | — | $ | 10,000 | $ | — | $ | — | $ | — | $ | 10,000 | ||||||||||||
| Accounts payable |
||||||||||||||||||||||||
| Trade |
— | 18,547 | 160,152 | 6,379 | — | 185,078 | ||||||||||||||||||
| Intercompany |
— | 571 | 2,090 | 3,842 | (6,503 | ) | — | |||||||||||||||||
| Accrued liabilities |
||||||||||||||||||||||||
| Compensation and benefits |
— | 22,206 | 47,605 | 1,139 | — | 70,950 | ||||||||||||||||||
| Interest payable |
— | 10,516 | — | — | — | 10,516 | ||||||||||||||||||
| Other |
— | 3,773 | 14,033 | 2,703 | 19 | 20,528 | ||||||||||||||||||
|
|
|
|
|
|
|
|
|
|
|
|
|
|||||||||||||
| — | 65,613 | 223,880 | 14,063 | (6,484 | ) | 297,072 | ||||||||||||||||||
|
|
|
|
|
|
|
|
|
|
|
|
|
|||||||||||||
| Debt |
||||||||||||||||||||||||
| Long-term debt, less current portion |
— | 770,000 | — | — | — | 770,000 | ||||||||||||||||||
| Intercompany notes payable |
— | — | — | 4,924 | (4,924 | ) | — | |||||||||||||||||
|
|
|
|
|
|
|
|
|
|
|
|
|
|||||||||||||
| — | 770,000 | — | 4,924 | (4,924 | ) | 770,000 | ||||||||||||||||||
|
|
|
|
|
|
|
|
|
|
|
|
|
|||||||||||||
| Other |
||||||||||||||||||||||||
| Deferred income taxes |
— | 132,841 | 53,497 | 3,485 | — | 189,823 | ||||||||||||||||||
| Compensation and benefits |
— | 121,606 | 76 | — | — | 121,682 | ||||||||||||||||||
| Other long-term liabilities |
— | 48,070 | 24,932 | 150 | — | 73,152 | ||||||||||||||||||
|
|
|
|
|
|
|
|
|
|
|
|
|
|||||||||||||
| — | 302,517 | 78,505 | 3,635 | — | 384,657 | |||||||||||||||||||
|
|
|
|
|
|
|
|
|
|
|
|
|
|||||||||||||
| Commitments and contingent liabilities |
||||||||||||||||||||||||
| Capital |
||||||||||||||||||||||||
| Business unit equity |
857,987 | 857,987 | 1,743,053 | 35,779 | (2,636,819 | ) | 857,987 | |||||||||||||||||
| Accumulated other comprehensive loss |
(101,304 | ) | (101,304 | ) | — | (301 | ) | 101,605 | (101,304 | ) | ||||||||||||||
|
|
|
|
|
|
|
|
|
|
|
|
|
|||||||||||||
| 756,683 | 756,683 | 1,743,053 | 35,478 | (2,535,214 | ) | 756,683 | ||||||||||||||||||
|
|
|
|
|
|
|
|
|
|
|
|
|
|||||||||||||
| Total liabilities and capital |
$ | 756,683 | $ | 1,894,813 | $ | 2,045,438 | $ | 58,100 | $ | (2,546,622 | ) | $ | 2,208,412 | |||||||||||
|
|
|
|
|
|
|
|
|
|
|
|
|
|||||||||||||
57
BZ Intermediate Holdings LLC and Subsidiaries
Consolidating Balance Sheets at December 31, 2011
(dollars in thousands)
| BZ Intermediate Holdings LLC (Parent) |
Boise Paper Holdings and Co- issuers |
Guarantor Subsidiaries |
Nonguarantor Subsidiaries |
Eliminations | Consolidated | |||||||||||||||||||
| ASSETS |
||||||||||||||||||||||||
| Current |
||||||||||||||||||||||||
| Cash and cash equivalents |
$ | — | $ | 82,532 | $ | 9,737 | $ | 4,727 | $ | — | $ | 96,996 | ||||||||||||
| Receivables |
||||||||||||||||||||||||
| Trade, less allowances |
— | 1,183 | 220,621 | 7,034 | — | 228,838 | ||||||||||||||||||
| Intercompany |
— | 40 | 21 | 2,099 | (2,160 | ) | — | |||||||||||||||||
| Other |
— | 2,477 | 5,064 | 81 | — | 7,622 | ||||||||||||||||||
| Inventories |
— | 3 | 304,490 | 2,812 | — | 307,305 | ||||||||||||||||||
| Deferred income taxes |
— | 20,379 | — | — | — | 20,379 | ||||||||||||||||||
| Prepaid and other |
— | 4,467 | 2,588 | (111 | ) | — | 6,944 | |||||||||||||||||
|
|
|
|
|
|
|
|
|
|
|
|
|
|||||||||||||
| — | 111,081 | 542,521 | 16,642 | (2,160 | ) | 668,084 | ||||||||||||||||||
|
|
|
|
|
|
|
|
|
|
|
|
|
|||||||||||||
| Property |
||||||||||||||||||||||||
| Property and equipment, net |
— | 5,652 | 1,217,520 | 12,097 | — | 1,235,269 | ||||||||||||||||||
| Fiber farms |
— | — | 21,193 | — | — | 21,193 | ||||||||||||||||||
|
|
|
|
|
|
|
|
|
|
|
|
|
|||||||||||||
| — | 5,652 | 1,238,713 | 12,097 | — | 1,256,462 | |||||||||||||||||||
|
|
|
|
|
|
|
|
|
|
|
|
|
|||||||||||||
| Deferred financing costs |
— | 30,956 | — | — | — | 30,956 | ||||||||||||||||||
| Goodwill |
— | — | 156,305 | 5,386 | — | 161,691 | ||||||||||||||||||
| Intangible assets, net |
— | — | 143,986 | 15,134 | — | 159,120 | ||||||||||||||||||
| Investments in affiliates |
803,344 | 1,817,537 | — | — | (2,620,881 | ) | — | |||||||||||||||||
| Intercompany notes receivable |
— | 3,400 | — | — | (3,400 | ) | — | |||||||||||||||||
| Other assets |
— | 5,805 | 3,948 | 4 | — | 9,757 | ||||||||||||||||||
|
|
|
|
|
|
|
|
|
|
|
|
|
|||||||||||||
| Total assets |
$ | 803,344 | $ | 1,974,431 | $ | 2,085,473 | $ | 49,263 | $ | (2,626,441 | ) | $ | 2,286,070 | |||||||||||
|
|
|
|
|
|
|
|
|
|
|
|
|
|||||||||||||
58
BZ Intermediate Holdings LLC and Subsidiaries
Consolidating Balance Sheets at December 31, 2011 (continued)
(dollars in thousands)
| BZ Intermediate Holdings LLC (Parent) |
Boise Paper Holdings and Co- issuers |
Guarantor Subsidiaries |
Nonguarantor Subsidiaries |
Eliminations | Consolidated | |||||||||||||||||||
| LIABILITIES AND CAPITAL |
||||||||||||||||||||||||
| Current |
||||||||||||||||||||||||
| Current portion of long-term debt |
$ | — | $ | 10,000 | $ | — | $ | — | $ | — | $ | 10,000 | ||||||||||||
| Accounts payable |
||||||||||||||||||||||||
| Trade |
— | 19,566 | 176,575 | 6,443 | — | 202,584 | ||||||||||||||||||
| Intercompany |
— | — | 2,119 | 1 | (2,120 | ) | — | |||||||||||||||||
| Accrued liabilities |
||||||||||||||||||||||||
| Compensation and benefits |
— | 24,581 | 39,457 | 869 | — | 64,907 | ||||||||||||||||||
| Interest payable |
— | 10,528 | — | — | — | 10,528 | ||||||||||||||||||
| Other |
— | 8,626 | 13,769 | 185 | (40 | ) | 22,540 | |||||||||||||||||
|
|
|
|
|
|
|
|
|
|
|
|
|
|||||||||||||
| — | 73,301 | 231,920 | 7,498 | (2,160 | ) | 310,559 | ||||||||||||||||||
|
|
|
|
|
|
|
|
|
|
|
|
|
|||||||||||||
| Debt |
||||||||||||||||||||||||
| Long-term debt, less current portion |
— | 790,000 | — | — | — | 790,000 | ||||||||||||||||||
| Intercompany notes payable |
— | — | — | 3,400 | (3,400 | ) | — | |||||||||||||||||
|
|
|
|
|
|
|
|
|
|
|
|
|
|||||||||||||
| — | 790,000 | — | 3,400 | (3,400 | ) | 790,000 | ||||||||||||||||||
|
|
|
|
|
|
|
|
|
|
|
|
|
|||||||||||||
| Other |
||||||||||||||||||||||||
| Deferred income taxes |
— | 94,822 | 53,365 | 4,525 | — | 152,712 | ||||||||||||||||||
| Compensation and benefits |
— | 172,305 | 89 | — | — | 172,394 | ||||||||||||||||||
| Other long-term liabilities |
— | 40,659 | 16,261 | 141 | — | 57,061 | ||||||||||||||||||
|
|
|
|
|
|
|
|
|
|
|
|
|
|||||||||||||
| — | 307,786 | 69,715 | 4,666 | — | 382,167 | |||||||||||||||||||
|
|
|
|
|
|
|
|
|
|
|
|
|
|||||||||||||
| Commitments and contingent liabilities |
||||||||||||||||||||||||
| Capital |
||||||||||||||||||||||||
| Business unit equity |
925,306 | 925,306 | 1,783,838 | 34,051 | (2,743,195 | ) | 925,306 | |||||||||||||||||
| Accumulated other comprehensive loss |
(121,962 | ) | (121,962 | ) | — | (352 | ) | 122,314 | (121,962 | ) | ||||||||||||||
|
|
|
|
|
|
|
|
|
|
|
|
|
|||||||||||||
| 803,344 | 803,344 | 1,783,838 | 33,699 | (2,620,881 | ) | 803,344 | ||||||||||||||||||
|
|
|
|
|
|
|
|
|
|
|
|
|
|||||||||||||
| Total liabilities and capital |
$ | 803,344 | $ | 1,974,431 | $ | 2,085,473 | $ | 49,263 | $ | (2,626,441 | ) | $ | 2,286,070 | |||||||||||
|
|
|
|
|
|
|
|
|
|
|
|
|
|||||||||||||
59
BZ Intermediate Holdings LLC and Subsidiaries
Consolidating Statements of Cash Flows
For the Year Ended December 31, 2012
(dollars in thousands)
| BZ Intermediate Holdings LLC (Parent) |
Boise Paper Holdings and Co- issuers |
Guarantor Subsidiaries |
Nonguarantor Subsidiaries |
Eliminations | Consolidated | |||||||||||||||||||
| Cash provided by (used for) operations |
||||||||||||||||||||||||
| Net income |
$ | 52,150 | $ | 52,150 | $ | 176,710 | $ | 795 | $ | (229,655 | ) | $ | 52,150 | |||||||||||
| Items in net income not using (providing) cash |
||||||||||||||||||||||||
| Equity in net income of affiliates |
(52,150 | ) | (177,505 | ) | — | — | 229,655 | — | ||||||||||||||||
| Depreciation, depletion, and amortization of deferred financing costs and other |
— | 7,712 | 146,449 | 2,879 | — | 157,040 | ||||||||||||||||||
| Share-based compensation expense |
— | 5,983 | — | — | — | 5,983 | ||||||||||||||||||
| Pension expense |
— | 10,219 | 1,060 | — | — | 11,279 | ||||||||||||||||||
| Deferred income taxes |
— | 33,581 | 108 | (5 | ) | — | 33,684 | |||||||||||||||||
| St. Helens charges |
— | — | 28,481 | — | — | 28,481 | ||||||||||||||||||
| Other |
— | 224 | 1,640 | 4 | — | 1,868 | ||||||||||||||||||
| Decrease (increase) in working capital |
||||||||||||||||||||||||
| Receivables |
— | (1,973 | ) | (9,297 | ) | (2,857 | ) | 4,324 | (9,803 | ) | ||||||||||||||
| Inventories |
— | — | 8,896 | (760 | ) | — | 8,136 | |||||||||||||||||
| Prepaid expenses |
— | (1,966 | ) | 1,567 | (415 | ) | — | (814 | ) | |||||||||||||||
| Accounts payable and accrued liabilities |
— | (3,579 | ) | (11,964 | ) | 3,362 | (4,324 | ) | (16,505 | ) | ||||||||||||||
| Current and deferred income taxes |
— | (1,650 | ) | — | (288 | ) | — | (1,938 | ) | |||||||||||||||
| Pension payments |
— | (35,205 | ) | — | — | — | (35,205 | ) | ||||||||||||||||
| Other |
— | 3,510 | (4,368 | ) | 1,532 | — | 674 | |||||||||||||||||
|
|
|
|
|
|
|
|
|
|
|
|
|
|||||||||||||
| Cash provided by (used for) operations |
— | (108,499 | ) | 339,282 | 4,247 | — | 235,030 | |||||||||||||||||
|
|
|
|
|
|
|
|
|
|
|
|
|
|||||||||||||
| Cash provided by (used for) investment |
||||||||||||||||||||||||
| Expenditures for property and equipment |
— | (4,677 | ) | (132,190 | ) | (775 | ) | — | (137,642 | ) | ||||||||||||||
| Other |
— | 146 | 1,182 | 65 | — | 1,393 | ||||||||||||||||||
|
|
|
|
|
|
|
|
|
|
|
|
|
|||||||||||||
| Cash used for investment |
— | (4,531 | ) | (131,008 | ) | (710 | ) | — | (136,249 | ) | ||||||||||||||
|
|
|
|
|
|
|
|
|
|
|
|
|
|||||||||||||
| Cash provided by (used for) financing |
||||||||||||||||||||||||
| Issuances of long-term debt |
— | 5,000 | — | — | — | 5,000 | ||||||||||||||||||
| Payments of long-term debt |
— | (25,000 | ) | — | — | — | (25,000 | ) | ||||||||||||||||
| Payments of financing costs |
— | (188 | ) | — | — | — | (188 | ) | ||||||||||||||||
| Payments (to) from Boise Inc., net |
(124,824 | ) | — | — | — | — | (124,824 | ) | ||||||||||||||||
| Due to (from) affiliates |
124,824 | 91,737 | (217,495 | ) | 934 | — | — | |||||||||||||||||
| Other |
— | (250 | ) | — | (808 | ) | — | (1,058 | ) | |||||||||||||||
|
|
|
|
|
|
|
|
|
|
|
|
|
|||||||||||||
| Cash provided by (used for) financing |
— | 71,299 | (217,495 | ) | 126 | — | (146,070 | ) | ||||||||||||||||
|
|
|
|
|
|
|
|
|
|
|
|
|
|||||||||||||
| Increase (decrease) in cash and cash equivalents |
— | (41,731 | ) | (9,221 | ) | 3,663 | — | (47,289 | ) | |||||||||||||||
| Balance at beginning of the period |
— | 82,532 | 9,737 | 4,727 | — | 96,996 | ||||||||||||||||||
|
|
|
|
|
|
|
|
|
|
|
|
|
|||||||||||||
| Balance at end of the period |
$ | — | $ | 40,801 | $ | 516 | $ | 8,390 | $ | — | $ | 49,707 | ||||||||||||
|
|
|
|
|
|
|
|
|
|
|
|
|
|||||||||||||
60
BZ Intermediate Holdings LLC and Subsidiaries
Consolidating Statements of Cash Flows
For the Year Ended December 31, 2011
(dollars in thousands)
| BZ Intermediate Holdings LLC (Parent) |
Boise Paper Holdings and Co- issuers |
Guarantor Subsidiaries |
Nonguarantor Subsidiaries |
Eliminations | Consolidated | |||||||||||||||||||
| Cash provided by (used for) operations |
||||||||||||||||||||||||
| Net income |
$ | 75,210 | $ | 75,210 | $ | 219,145 | $ | 172 | $ | (294,527 | ) | $ | 75,210 | |||||||||||
| Items in net income not using (providing) cash |
||||||||||||||||||||||||
| Equity in net income of affiliates |
(75,210 | ) | (219,317 | ) | — | — | 294,527 | — | ||||||||||||||||
| Depreciation, depletion, and amortization of deferred financing costs and other |
— | 9,048 | 140,563 | 104 | — | 149,715 | ||||||||||||||||||
| Share-based compensation expense |
— | 3,695 | — | — | — | 3,695 | ||||||||||||||||||
| Pension expense |
— | 10,916 | — | — | — | 10,916 | ||||||||||||||||||
| Deferred income taxes |
— | 43,904 | 542 | — | — | 44,446 | ||||||||||||||||||
| Other |
— | 408 | 1,542 | (72 | ) | — | 1,878 | |||||||||||||||||
| Loss on extinguishment of debt |
— | 2,300 | — | — | — | 2,300 | ||||||||||||||||||
| Decrease (increase) in working capital, net of acquisitions |
||||||||||||||||||||||||
| Receivables |
— | (884 | ) | 3,471 | (1,487 | ) | 524 | 1,624 | ||||||||||||||||
| Inventories |
— | 12 | (22,346 | ) | 97 | — | (22,237 | ) | ||||||||||||||||
| Prepaid expenses |
— | 233 | (437 | ) | (71 | ) | — | (275 | ) | |||||||||||||||
| Accounts payable and accrued liabilities |
— | 6,724 | (3,744 | ) | 1,347 | (524 | ) | 3,803 | ||||||||||||||||
| Current and deferred income taxes |
— | 2,920 | 1,250 | 317 | — | 4,487 | ||||||||||||||||||
| Pension payments |
— | (25,414 | ) | — | — | — | (25,414 | ) | ||||||||||||||||
| Other |
— | (3,660 | ) | 281 | 3,422 | — | 43 | |||||||||||||||||
|
|
|
|
|
|
|
|
|
|
|
|
|
|||||||||||||
| Cash provided by (used for) operations |
— | (93,905 | ) | 340,267 | 3,829 | — | 250,191 | |||||||||||||||||
|
|
|
|
|
|
|
|
|
|
|
|
|
|||||||||||||
| Cash provided by (used for) investment |
||||||||||||||||||||||||
| Acquisitions of business and facilities, net of cash acquired |
— | — | (292,600 | ) | (33,623 | ) | — | (326,223 | ) | |||||||||||||||
| Expenditures for property and equipment |
— | (3,633 | ) | (125,129 | ) | — | — | (128,762 | ) | |||||||||||||||
| Purchases of short-term investments |
— | (3,494 | ) | — | — | — | (3,494 | ) | ||||||||||||||||
| Maturities of short-term investments |
— | 14,114 | — | — | — | 14,114 | ||||||||||||||||||
| Other |
— | (390 | ) | 1,743 | (305 | ) | — | 1,048 | ||||||||||||||||
|
|
|
|
|
|
|
|
|
|
|
|
|
|||||||||||||
| Cash provided by (used for) investment |
— | 6,597 | (415,986 | ) | (33,928 | ) | — | (443,317 | ) | |||||||||||||||
|
|
|
|
|
|
|
|
|
|
|
|
|
|||||||||||||
| Cash provided by (used for) financing |
||||||||||||||||||||||||
| Issuances of long-term debt |
— | 275,000 | — | — | — | 275,000 | ||||||||||||||||||
| Payments of long-term debt |
— | (256,831 | ) | — | — | — | (256,831 | ) | ||||||||||||||||
| Payments of financing costs |
— | (8,613 | ) | — | — | — | (8,613 | ) | ||||||||||||||||
| Payments (to) from Boise Inc., net |
115,196 | — | — | — | — | 115,196 | ||||||||||||||||||
| Due to (from) affiliates |
(115,196 | ) | (3,771 | ) | 85,450 | 33,517 | — | — | ||||||||||||||||
| Other |
— | (2,355 | ) | — | 892 | — | (1,463 | ) | ||||||||||||||||
|
|
|
|
|
|
|
|
|
|
|
|
|
|||||||||||||
| Cash provided by financing |
— | 3,430 | 85,450 | 34,409 | — | 123,289 | ||||||||||||||||||
|
|
|
|
|
|
|
|
|
|
|
|
|
|||||||||||||
| Increase (decrease) in cash and cash equivalents |
— | (83,878 | ) | 9,731 | 4,310 | — | (69,837 | ) | ||||||||||||||||
| Balance at beginning of the period |
— | 166,410 | 6 | 417 | — | 166,833 | ||||||||||||||||||
|
|
|
|
|
|
|
|
|
|
|
|
|
|||||||||||||
| Balance at end of the period |
$ | — | $ | 82,532 | $ | 9,737 | $ | 4,727 | $ | — | $ | 96,996 | ||||||||||||
|
|
|
|
|
|
|
|
|
|
|
|
|
|||||||||||||
61
BZ Intermediate Holdings LLC and Subsidiaries
Consolidating Statements of Cash Flows
For the Year Ended December 31, 2010
(dollars in thousands)
| BZ Intermediate Holdings LLC (Parent) |
Boise Paper Holdings and Co- issuers |
Guarantor Subsidiaries |
Nonguarantor Subsidiaries |
Eliminations | Consolidated | |||||||||||||||||||
| Cash provided by (used for) operations |
||||||||||||||||||||||||
| Net income |
$ | 63,577 | $ | 63,577 | $ | 218,131 | $ | 18 | $ | (281,726 | ) | $ | 63,577 | |||||||||||
| Items in net income not using (providing) cash |
||||||||||||||||||||||||
| Equity in net income of affiliates |
(63,577 | ) | (218,149 | ) | — | — | 281,726 | — | ||||||||||||||||
| Depreciation, depletion, and amortization of deferred financing costs and other |
— | 11,023 | 126,472 | — | — | 137,495 | ||||||||||||||||||
| Share-based compensation expense |
— | 3,733 | — | — | — | 3,733 | ||||||||||||||||||
| Pension expense |
— | 9,241 | — | — | — | 9,241 | ||||||||||||||||||
| Deferred income taxes |
— | 37,677 | 213 | (8 | ) | — | 37,882 | |||||||||||||||||
| Other |
— | (805 | ) | 900 | — | — | 95 | |||||||||||||||||
| Loss on extinguishment of debt |
— | 22,225 | — | — | — | 22,225 | ||||||||||||||||||
| Decrease (increase) in working capital |
||||||||||||||||||||||||
| Receivables |
— | 1,225 | 55,662 | (12 | ) | 380 | 57,255 | |||||||||||||||||
| Inventories |
— | 3 | (17,123 | ) | — | — | (17,120 | ) | ||||||||||||||||
| Prepaid expenses |
— | 4,437 | 253 | — | — | 4,690 | ||||||||||||||||||
| Accounts payable and accrued liabilities |
— | 6,760 | (13,208 | ) | 138 | (380 | ) | (6,690 | ) | |||||||||||||||
| Current and deferred income taxes |
— | 7,142 | (1,398 | ) | — | — | 5,744 | |||||||||||||||||
| Pension payments |
— | (25,174 | ) | — | — | — | (25,174 | ) | ||||||||||||||||
| Other |
— | (773 | ) | (2,399 | ) | — | — | (3,172 | ) | |||||||||||||||
|
|
|
|
|
|
|
|
|
|
|
|
|
|||||||||||||
| Cash provided by (used for) operations |
— | (77,858 | ) | 367,503 | 136 | — | 289,781 | |||||||||||||||||
|
|
|
|
|
|
|
|
|
|
|
|
|
|||||||||||||
| Cash provided by (used for) investment |
||||||||||||||||||||||||
| Acquisitions of businesses and facilities |
— | — | — | — | — | — | ||||||||||||||||||
| Expenditures for property and equipment |
— | (3,711 | ) | (107,908 | ) | — | — | (111,619 | ) | |||||||||||||||
| Purchases of short-term investments |
— | (25,336 | ) | — | — | — | (25,336 | ) | ||||||||||||||||
| Maturities of short-term investments |
— | 24,744 | — | — | — | 24,744 | ||||||||||||||||||
| Other |
— | 868 | 2,073 | — | — | 2,941 | ||||||||||||||||||
|
|
|
|
|
|
|
|
|
|
|
|
|
|||||||||||||
| Cash used for investment |
— | (3,435 | ) | (105,835 | ) | — | — | (109,270 | ) | |||||||||||||||
|
|
|
|
|
|
|
|
|
|
|
|
|
|||||||||||||
| Cash provided by (used for) financing |
||||||||||||||||||||||||
| Issuances of long-term debt |
— | 300,000 | — | — | — | 300,000 | ||||||||||||||||||
| Payments of long-term debt |
— | (334,096 | ) | — | — | — | (334,096 | ) | ||||||||||||||||
| Payments of financing costs |
— | (12,003 | ) | — | — | — | (12,003 | ) | ||||||||||||||||
| Payments (to) from Boise Inc., net |
(31,639 | ) | — | — | — | — | (31,639 | ) | ||||||||||||||||
| Due to (from) affiliates |
31,639 | 230,064 | (261,695 | ) | (8 | ) | — | — | ||||||||||||||||
| Other |
— | (5,333 | ) | — | — | — | (5,333 | ) | ||||||||||||||||
|
|
|
|
|
|
|
|
|
|
|
|
|
|||||||||||||
| Cash provided by (used for) financing |
— | 178,632 | (261,695 | ) | (8 | ) | — | (83,071 | ) | |||||||||||||||
|
|
|
|
|
|
|
|
|
|
|
|
|
|||||||||||||
| Increase (decrease) in cash and cash equivalents |
— | 97,339 | (27 | ) | 128 | — | 97,440 | |||||||||||||||||
| Balance at beginning of the period |
— | 69,071 | 33 | 289 | — | 69,393 | ||||||||||||||||||
|
|
|
|
|
|
|
|
|
|
|
|
|
|||||||||||||
| Balance at end of the period |
$ | — | $ | 166,410 | $ | 6 | $ | 417 | $ | — | $ | 166,833 | ||||||||||||
|
|
|
|
|
|
|
|
|
|
|
|
|
|||||||||||||
62