UNITED STATES SECURITIES AND
EXCHANGE COMMISSION
Washington, D.C.
20549
Form 10-K
ANNUAL
REPORT PURSUANT TO SECTION 13 OR 15(d)
OF THE SECURITIES EXCHANGE ACT OF 1934
For the fiscal year ended December 31,
2009
Commission file number 1-15399
PACKAGING CORPORATION OF
AMERICA
(Exact Name of Registrant as
Specified in its Charter)
| |
|
|
|
Delaware
|
|
36-4277050
|
|
(State or Other Jurisdiction
of
|
|
(I.R.S. Employer
|
|
Incorporation or
Organization)
|
|
Identification No.)
|
|
|
|
|
|
1900 West Field Court, Lake Forest, Illinois
|
|
60045
|
|
(Address of Principal Executive
Offices)
|
|
(Zip Code)
|
Registrant’s
telephone number, including area code
(847) 482-3000
Securities registered pursuant to Section 12(b) of the
Act:
| |
|
|
|
|
|
Name of Each Exchange
|
|
Title of Each Class
|
|
on Which Registered
|
|
|
|
Common Stock, $0.01 par value
|
|
New York Stock Exchange
|
Securities registered pursuant to Section 12(g) of the
Act:
None
Indicate by check mark if the Registrant is a well-known
seasoned issuer, as defined in Rule 405 of the Securities
Act. Yes þ No o
Indicate by check mark if the Registrant is not required to file
reports pursuant to Section 13 or Section 15(d) of the
Act. Yes o No þ
Indicate by check mark whether the Registrant (1) has filed
all reports required to be filed by Section 13 or 15(d) of
the Securities Exchange Act of 1934 during the preceding
12 months (or for such shorter period that the Registrant
was required to file such reports), and (2) has been
subject to such filing requirements for the past
90 days. Yes þ No o
Indicate by check mark whether the registrant has submitted
electronically and posted on its corporate Web site, if any,
every Interactive Data File required to be submitted and posted
pursuant to Rule 405 of Regulation S-T during the preceding 12
months (or for such shorter period that the registrant was
required to submit and post such files). Yes
o No o
Indicate by check mark if disclosure of delinquent filers
pursuant to Item 405 of
Regulation S-K
is not contained herein, and will not be contained, to the best
of Registrant’s knowledge, in definitive proxy or
information statements incorporated by reference in
Part III of this
Form 10-K
or any amendment to this
Form 10-K. þ
Indicate by check mark whether the registrant is a large
accelerated filer, an accelerated filer, a non-accelerated
filer, or a smaller reporting company. See the definitions of
“large accelerated filer,” “accelerated
filer” and “smaller reporting company” in Rule
12b-2 of the
Exchange Act. (Check one):
|
|
|
|
| Large
accelerated
filer þ
|
Accelerated
filer o
|
Non-accelerated
filer o
|
Smaller
reporting
company o
|
(Do not check if a smaller reporting company)
Indicate by check mark whether the Registrant is a shell company
(as defined in
Rule 12b-2
of the Exchange
Act). Yes o No þ
At June 30, 2009, the last business day of the
Registrant’s most recently completed second fiscal quarter,
the aggregate market value of the Registrant’s common
equity held by nonaffiliates was approximately $1,645,908,385
based on the closing sale price as reported on the New York
Stock Exchange. This calculation of market value has been made
for the purposes of this report only and should not be
considered as an admission or conclusion by the Registrant that
any person is in fact an affiliate of the Registrant.
On February 12, 2010, there were 103,025,739 shares of
Common Stock outstanding.
DOCUMENTS
INCORPORATED BY REFERENCE
Specified portions of the Proxy Statement for the
Registrant’s 2010 Annual Meeting of Stockholders are
incorporated by reference to the extent indicated in
Part III of this
Form 10-K.
PART I
General
Packaging Corporation of America (we, us, our, “PCA”
or the “Company”) is the fifth largest producer of
containerboard and corrugated products in the United States in
terms of production capacity. During 2009, we produced
2,258,000 million tons of containerboard at our mills, of
which about 80% was consumed in PCA’s corrugated products
manufacturing plants, 11% was sold to domestic customers and 9%
was sold in the export market. Our corrugated products
manufacturing plants sold about 28.9 billion square feet
(BSF) of corrugated products. Our net sales to third parties
totaled $2.15 billion in 2009.
Containerboard
Production and Corrugated Shipments
| |
|
|
|
|
|
|
|
|
|
|
|
|
|
|
|
|
|
|
|
|
|
|
|
|
|
|
|
|
|
|
First
|
|
|
Second
|
|
|
Third
|
|
|
Fourth
|
|
|
Full
|
|
|
|
|
|
|
|
Quarter
|
|
|
Quarter
|
|
|
Quarter
|
|
|
Quarter
|
|
|
Year
|
|
|
|
|
Containerboard Production (thousand tons)
|
|
|
2009
|
|
|
|
515
|
|
|
|
555
|
|
|
|
588
|
|
|
|
600
|
|
|
|
2,258
|
|
|
|
|
|
2008
|
|
|
|
586
|
|
|
|
613
|
|
|
|
621
|
|
|
|
533
|
|
|
|
2,353
|
|
|
|
|
|
2007
|
|
|
|
584
|
|
|
|
615
|
|
|
|
632
|
|
|
|
615
|
|
|
|
2,446
|
|
|
Corrugated Shipments (BSF)
|
|
|
2009
|
|
|
|
6.7
|
|
|
|
7.3
|
|
|
|
7.5
|
|
|
|
7.4
|
|
|
|
28.9
|
|
|
|
|
|
2008
|
|
|
|
7.6
|
|
|
|
8.0
|
|
|
|
7.8
|
|
|
|
6.9
|
|
|
|
30.3
|
|
|
|
|
|
2007
|
|
|
|
7.7
|
|
|
|
8.0
|
|
|
|
7.9
|
|
|
|
7.6
|
|
|
|
31.2
|
|
In 2009, we produced 1.4 million tons of kraft linerboard
at our mills in Counce, Tennessee and Valdosta, Georgia, and
0.9 million tons of semi-chemical corrugating medium at our
mills in Tomahawk, Wisconsin and Filer City, Michigan. We
currently lease the cutting rights to approximately
91,000 acres of timberland located near our Counce and
Valdosta mills. We also have supply agreements with third
parties on approximately 352,000 acres of timberland.
Our corrugated products manufacturing plants produce a wide
variety of corrugated packaging products, including conventional
shipping containers used to protect and transport manufactured
goods, multi-color boxes and displays with strong visual appeal
that help to merchandise the packaged product in retail
locations. In addition, we are a large producer of meat boxes
and wax-coated boxes for the agricultural industry.
Industry
Overview
According to the Fibre Box Association, the value of industry
shipments of corrugated products was $24 billion in 2009.
The primary end-use markets for corrugated products are shown
below (as reported in the most recent 2008 Fibre Box Association
annual report):
| |
|
|
|
|
|
Food, beverages and agricultural products
|
|
|
50
|
%
|
|
Paper products
|
|
|
21
|
%
|
|
Petroleum, plastic, synthetic and rubber products
|
|
|
11
|
%
|
|
Appliances, vehicles, and metal products
|
|
|
7
|
%
|
|
Miscellaneous manufacturing
|
|
|
5
|
%
|
|
Textile mill products and apparel
|
|
|
3
|
%
|
|
Other
|
|
|
3
|
%
|
Corrugated products plants tend to be located in close proximity
to customers to minimize freight costs. The U.S. corrugated
products industry consists of approximately 625 companies
and 1,340 plants.
Containerboard, which includes both linerboard and corrugating
medium, is the principal raw material used to manufacture
corrugated products. Linerboard is used as the inner and outer
facings, or liners, of corrugated products. Corrugating medium
is fluted and laminated to linerboard in corrugator plants to
produce
3
corrugated sheets. The sheets are subsequently printed, cut,
folded and glued in corrugator plants or sheet plants to produce
corrugated products.
Containerboard may be manufactured from both softwood and
hardwood fibers, as well as from recycled fibers from used
corrugated and waste from converting operations. Kraft
linerboard is made predominantly from softwoods like pine.
Semi-chemical corrugating medium is made from hardwoods such as
oak. The finished paper product is wound into large rolls, which
are slit to size as required and shipped to converters.
PCA
Operations and Products
Our two linerboard mills can manufacture a broad range of
linerboard grades ranging from 26 lb. to 96 lb. Our two
semi-chemical corrugating medium mills can manufacture grades
ranging in weight from 20 lb. to 47 lb. Mill capacities
described below are estimated based on expected mix of paper
basis weights, and production can exceed estimated capacity if a
higher-than-estimated mix of heavier grade paper is produced.
All four of our mills have completed an extensive independent
review process to become ISO 9002 certified. ISO 9002 is an
international quality certification that verifies a facility
maintains and follows stringent procedures for manufacturing,
sales and customer service.
The following four paragraphs describe our containerboard
mills’ annual practical maximum capacity, 2009 actual
production and production capabilities.
Counce. Our Counce, Tennessee mill is one of
the largest kraft linerboard mills in the United States. Its
estimated production capacity, as reported to the American
Forest and Paper Association (“AF&PA”), is
approximately 1,007,000 tons per year. In 2009, we produced
902,000 tons of kraft linerboard on two paper machines at
Counce. The mill produces a broad range of basis weights from 26
lb. to 90 lb. The mill also produces a variety of performance
and specialty grades of linerboard.
Valdosta. Our Valdosta, Georgia mill is a
kraft linerboard mill that has an estimated production capacity
of approximately 474,000 tons per year, as reported to the
AF&PA. In 2009, our single paper machine at Valdosta
produced 465,000 tons of kraft linerboard. Valdosta produces a
range of basis weights from 35 lb. to 96 lb.
Tomahawk. Our Tomahawk, Wisconsin mill is one
of the largest semi-chemical corrugating medium mills in the
United States with an estimated production capacity of 581,000
tons per year on three paper machines, as reported to the
AF&PA. In April 2005, we completed the indefinite closure
of our number three paper machine at Tomahawk and currently
operate the remaining two paper machines which have a combined
production capacity of 516,000 tons. In 2009, we produced
526,000 tons of semi-chemical corrugating medium on two paper
machines at Tomahawk. The Tomahawk mill produces a broad range
of basis weights from 23 lb. to 47 lb. and a variety of
performance and specialty grades of corrugating medium.
Filer City. Our Filer City, Michigan mill is a
semi-chemical corrugating medium mill with an estimated
production capacity of 413,000 tons on three paper machines, as
reported to the AF&PA. In 2009, we produced 365,000 tons of
corrugating medium at Filer City. Filer City produces
corrugating medium grades ranging in basis weight from 20 lb. to
47 lb.
We operate 68 corrugated manufacturing operations, a technical
and development center, six regional graphic design centers, a
rotogravure printing operation and a complement of packaging
supplies and distribution centers. Of the 68 manufacturing
facilities, 40 operate as combining operations, commonly called
corrugated plants, that manufacture corrugated sheets and
finished corrugated containers. The remaining 28 manufacturing
facilities, commonly called sheet plants, purchase combined
sheets primarily produced at PCA’s combining operations and
manufacture finished corrugated containers.
We have corrugated manufacturing operations in 26 states in
the U.S., with no manufacturing facilities outside of the
continental U.S. Each corrugated plant, for the most part,
serves a market radius that typically averages 150 miles.
Our sheet plants are generally located in close proximity to our
larger corrugated plants, which enables us to offer additional
services and converting capabilities such as small volume and
quick turnaround items.
4
We produce a wide variety of products ranging from basic
corrugated shipping containers to specialized packaging such as
wax-coated boxes for the agriculture industry. We also have
multi-color printing capabilities to make high-impact graphics
boxes and displays that offer customers more attractive
packaging.
Timberland
We currently lease the cutting rights to approximately
91,000 acres of timberland located near our Counce and
Valdosta mills. Virtually all of the acres under cutting rights
agreements are located within 100 miles of these two mills,
which results in lower wood transportation costs and provides a
secure source of wood fiber. These leased cutting rights
agreements have terms with about 15 years remaining, on
average.
During 1999 and 2000, PCA sold approximately 800,000 acres
of timberland. We currently have in place supply agreements
covering approximately 352,000 of the 800,000 acres sold.
The majority of the acreage under supply agreement is located in
close proximity to our Counce mill. We currently hold an
approximate 29% equity ownership interest in approximately
51,000 acres owned by Southern Timber Venture, LLC (STV).
This acreage is located primarily in southern Georgia and
northern Florida, near our Valdosta, Georgia mill, and includes
both timberlands and higher beneficial use properties.
Our Forest Management Assistance Program provides professional
forestry assistance to private timberland owners to improve
harvest yields and to optimize their harvest schedule. We have
managed the regeneration of approximately 125,000 acres by
supplying pine seedlings. In exchange for our expertise, we are
given the right of first refusal over timber sales from those
lands. These private lands include about 115,000 acres of
timberland.
PCA also participates in the Sustainable Forestry Initiative.
This initiative is aimed at ensuring the long-term health and
conservation of America’s forestry resources. Activities
include limiting tree harvest sizes, replanting harvest acreage,
participating in flora and fauna research and protecting water
streams.
Sales and
Marketing
Our corrugated products are sold through a direct sales and
marketing organization. We have sales representatives and a
sales manager at each corrugated manufacturing operation who
serve local and regional accounts. We also have corporate
account managers who serve large national accounts at multiple
customer locations. Additionally, our graphic design centers
maintain an
on-site
dedicated graphics sales force. In addition to direct sales and
marketing personnel, we utilize new product development
engineers and product graphics and design specialists. These
individuals are located at both the corrugated plants and the
graphic design centers. General marketing support is located at
our corporate headquarters.
Our containerboard sales group is responsible for the sale of
linerboard and corrugating medium to our corrugated plants, to
other domestic customers and to the export market. This group
handles order processing for all shipments of containerboard
from our mills to our corrugated plants. These personnel also
coordinate and execute all containerboard trade agreements with
other containerboard manufacturers.
Distribution
Containerboard produced in our mills is shipped by rail or
truck. Rail shipments represent about 50% of the tons shipped
and the remaining 50% is comprised of truck shipments. Our
individual mills do not own or maintain outside warehousing
facilities.
Our corrugated products are delivered by truck due to our large
number of customers and their demand for timely service. Our
converting operations typically service customers within a
150 miles radius. We use third-party warehouses for
short-term storage of corrugated products.
Customers
PCA’s corrugated products group sells to over 9,600
customers in over 17,500 locations. About two-thirds of our
corrugated products customers are regional and local accounts,
which are broadly diversified across
5
industries and geographic locations. The remaining one-third of
our customer base consists primarily of national accounts, or
those customers with a national presence. These customers
typically purchase corrugated products from several of our box
plants throughout the United States.
Major Raw
Materials Used
Fiber supply. Fiber is the single largest cost
in the manufacture of containerboard. PCA consumes both wood
fiber and recycled fiber in its containerboard mills. We have no
100% recycled mills, or those mills whose fiber consumption
consists solely of recycled fiber. To reduce our fiber costs, we
have invested in processes and equipment to ensure a high degree
of fiber flexibility. Our mills have the capability to shift a
portion of their fiber consumption between softwood, hardwood
and recycled sources. All of our mills, other than our Valdosta
mill, can utilize some recycled fiber in their containerboard
production. Our ability to use various types of virgin and
recycled fiber helps mitigate the impact of changes in the
prices of various fibers. Our corrugated manufacturing
operations generate recycled fiber as a by-product from the
manufacturing process, which is sold to our mills directly or
through trade agreements. During 2009, with low recycled fiber
prices, our containerboard mills consumed approximately 636,000
tons of recycled fiber, and our corrugated converting operations
generated approximately 189,000 tons of recycled fiber. As a
result, PCA was a net recycled fiber buyer of 447,000 tons, or
20% of PCA’s total fiber requirements, up from 17% in 2008.
Energy supply. Energy at the mills is obtained
through purchased electricity or through various fuels, which
are converted to steam or electricity
on-site.
Fuel sources include coal, natural gas, oil, internally produced
and purchased bark and by-products of the containerboard
manufacturing and pulping process, including black liquor. These
fuels are burned in boilers to produce steam. Steam turbine
generators are used to produce electricity. To reduce our mill
energy cost, we have invested in processes and equipment to
ensure a high level of purchased fuel flexibility. In recent
history, natural gas and fuel oil have exhibited higher costs
per thermal unit and more price volatility than coal and bark.
During 2009, 10.7 million MMBTU’s (million
BTU’s), or approximately 75% of our mills’ purchased
fuel needs, were from purchased bark and coal, historically our
two lowest cost purchased fuels. For the same period, our mills
consumed about 2.2 million MMBTU’s of natural gas (15%
of the mills’ total purchased fuels) and 0.8 million
MMBTU’s of oil (6% of the mills’ total purchased
fuels). Our two kraft linerboard mills at Counce and Valdosta
generate approximately two-thirds of their fuel requirements
from their own by-products.
PCA’s corrugated plants each have a boiler that produces
steam which is used by the corrugator. The majority of these
boilers burn natural gas, although some also have the ability to
burn fuel oil. During 2009, PCA’s corrugated products
plants consumed approximately 2.0 million MMBTU’s of
natural gas.
The following table shows PCA’s purchased fuel consumption
by fuel type for 2009:
| |
|
|
|
|
|
|
|
|
|
|
|
|
|
|
|
|
|
|
|
|
|
|
|
|
|
|
|
|
|
|
|
2009 Purchased MMBTU’s
|
|
|
|
|
|
|
|
|
|
|
|
|
|
|
|
|
|
|
|
% of Mill
|
|
|
% of PCA
|
|
|
|
|
1Q
|
|
|
2Q
|
|
|
3Q
|
|
|
4Q
|
|
|
Year
|
|
|
Total
|
|
|
Total
|
|
|
|
|
Containerboard Mills
|
|
|
|
|
|
|
|
|
|
|
|
|
|
|
|
|
|
|
|
|
|
|
|
|
|
|
|
|
|
Coal
|
|
|
2,105,746
|
|
|
|
1,423,001
|
|
|
|
1,123,587
|
|
|
|
1,385,404
|
|
|
|
6,037,738
|
|
|
|
42
|
%
|
|
|
37
|
%
|
|
Bark
|
|
|
1,016,782
|
|
|
|
899,626
|
|
|
|
1,253,766
|
|
|
|
1,461,081
|
|
|
|
4,631,255
|
|
|
|
32
|
%
|
|
|
28
|
%
|
|
Steam
|
|
|
110,684
|
|
|
|
108,654
|
|
|
|
212,314
|
|
|
|
314,195
|
|
|
|
745,847
|
|
|
|
5
|
%
|
|
|
5
|
%
|
|
|
|
|
|
|
|
|
|
|
|
|
|
|
|
|
|
|
|
|
|
|
|
|
|
|
|
|
|
|
|
Coal, Bark and Steam
|
|
|
3,233,212
|
|
|
|
2,431,281
|
|
|
|
2,589,667
|
|
|
|
3,160,680
|
|
|
|
11,414,840
|
|
|
|
79
|
%
|
|
|
70
|
%
|
|
Oil
|
|
|
136,588
|
|
|
|
253,881
|
|
|
|
203,827
|
|
|
|
228,701
|
|
|
|
822,997
|
|
|
|
6
|
%
|
|
|
5
|
%
|
|
Natural Gas
|
|
|
590,732
|
|
|
|
657,544
|
|
|
|
408,330
|
|
|
|
524,767
|
|
|
|
2,181,373
|
|
|
|
15
|
%
|
|
|
13
|
%
|
|
|
|
|
|
|
|
|
|
|
|
|
|
|
|
|
|
|
|
|
|
|
|
|
|
|
|
|
|
|
|
Total Mills Purchased Fuels
|
|
|
3,960,532
|
|
|
|
3,342,706
|
|
|
|
3,201,824
|
|
|
|
3,914,148
|
|
|
|
14,419,210
|
|
|
|
100
|
%
|
|
|
88
|
%
|
|
Corrugated Products Plants Natural Gas
|
|
|
582,929
|
|
|
|
438,940
|
|
|
|
408,395
|
|
|
|
526,133
|
|
|
|
1,956,397
|
|
|
|
|
|
|
|
12
|
%
|
|
|
|
|
|
|
|
|
|
|
|
|
|
|
|
|
|
|
|
|
|
|
|
|
|
|
|
|
|
|
|
Total Company Purchased Fuels
|
|
|
4,543,461
|
|
|
|
3,781,646
|
|
|
|
3,610,219
|
|
|
|
4,440,281
|
|
|
|
16,375,607
|
|
|
|
|
|
|
|
100
|
%
|
|
|
|
|
|
|
|
|
|
|
|
|
|
|
|
|
|
|
|
|
|
|
|
|
|
|
|
|
|
|
6
Approximately 40% of the electricity consumed by our four mills
is generated
on-site. Our
mills purchase approximately 8,907,000 CkWh (hundred kilowatt
hours) annually, or the equivalent of 3.0 million
MMBTU’s. PCA’s corrugated products plants purchase
about 2,196,000 CkWh annually, or the equivalent of
0.7 million MMBTU’s.
In October 2009, PCA announced that it will undertake major
energy optimization projects at the Counce and Valdosta
linerboard mills, which are expected to significantly reduce
fuel and electricity purchases at these mills and nearly
eliminate fossil fuel consumption at these facilities. The
projects include a new recovery boiler and turbine generator at
the Valdosta mill and a rebuild and upgrade of two existing
recovery boilers and a new turbine generator at the Counce mill.
The total capital expenditures for these projects are expected
to be about $295 million to be spent over two years, and
the projects are expected to be completed in the fourth quarter
of 2011.
Competition
According to industry sources, corrugated products are produced
by about 625 U.S. companies operating approximately 1,340
plants. Most corrugated products are manufactured to the
customer’s specifications. Corrugated producers generally
sell within a
150-mile
radius of their plants and compete with other corrugated
producers in their local market. In fact, the Fibre Box
Association tracks industry data by 47 distinct market regions.
The larger, multi-plant integrated companies may also solicit
larger, multi-plant customers who purchase for all of their
facilities on a consolidated basis. These customers are often
referred to as national or corporate accounts.
Corrugated products businesses seek to differentiate themselves
through pricing, quality, service, design and product
innovation. We compete for both local and national account
business, and we compete against producers of other types of
packaging products. On a national level, our primary competitors
include International Paper Company, Georgia-Pacific (owned by
Koch Industries, Inc.), Smurfit-Stone Container Corporation and
Temple-Inland Inc. However, with our strategic focus on local
and regional accounts, we also compete with the smaller,
independent converters.
Our principal competitors with respect to sales of our
containerboard produced but not consumed at our own corrugated
products plants are a number of large, diversified paper
companies, including International Paper Company,
Georgia-Pacific, Smurfit-Stone Container Corporation and
Temple-Inland Inc., as well as other regional manufacturers.
Containerboard is generally considered a commodity-type product
and can be purchased from numerous suppliers.
Employees
As of December 31, 2009, we had approximately
8,000 employees. Approximately 2,400 of these employees
were salaried and approximately 5,600 were hourly. Approximately
75% of our hourly employees are represented by unions. The
majority of our unionized employees are represented by the
United Steel Workers (USW), the International Brotherhood of
Teamsters (IBT) and the International Association of Machinists
(IAM).
Based on an agreement reached with the USW in August 2008, the
existing labor agreements at our containerboard mills covering
USW-represented employees (89% of mill hourly workforce) were
extended five years. With this extension, the USW contracts at
our mills are currently set to expire between September 2013 and
June 2015. Agreements with other union mill employees (11% of
mill hourly workforce) expire between June 2012 and October
2014. Based on an agreement reached with the USW in April 2009,
the labor agreement at 25 corrugated plants covering USW
represented employees was extended up to five years. Contracts
for unionized corrugated products plant employees expire between
March 2010 and December 2014. We are currently in negotiations
to renew or extend any union contracts that have recently
expired or are expiring in the near future.
During 2009, we experienced no work stoppages and have
experienced no instances of significant work stoppages in the
five years prior to 2009. We believe we have satisfactory
relations with our employees.
7
Environmental
Matters
Compliance with environmental requirements is a significant
factor in our business operations. We commit substantial
resources to maintaining environmental compliance and managing
environmental risk. We are subject to, and must comply with, a
variety of federal, state and local environmental laws,
particularly those relating to air and water quality, waste
disposal and the cleanup of contaminated soil and groundwater.
The most significant of these laws affecting us are:
1. Resource Conservation and Recovery Act (RCRA)
2. Clean Water Act (CWA)
3. Clean Air Act (CAA)
4. The Emergency Planning and Community
Right-to-Know-Act
(EPCRA)
5. Toxic Substance Control Act (TSCA)
6. Safe Drinking Water Act (SDWA)
We believe that we are currently in material compliance with
these and all applicable environmental rules and regulations.
Because environmental regulations are constantly evolving, we
have incurred, and will continue to incur, costs to maintain
compliance with these and other environmental laws. For the year
ended December 31, 2009, we spent approximately
$26.4 million to comply with the requirements of these and
other environmental laws. For the years ended December 31,
2008 and 2007, the costs of environmental compliance were
approximately $23.5 million and $19.4 million,
respectively. We work diligently to anticipate and budget for
the impact of applicable environmental regulations, and do not
currently expect that future environmental compliance
obligations will materially affect our business or financial
condition. Total capital costs for environmental matters were
$0.4 million for 2009. We currently estimate 2010
environmental capital expenditures will be $1.2 million.
As is the case with any industrial operation, we have in the
past incurred costs associated with the remediation of soil or
groundwater contamination. From 1994 through 2009, remediation
costs at our mills and converting plants totaled approximately
$3.2 million. We do not believe that any ongoing remedial
projects are material in nature. As of December 31, 2009,
we maintained an environmental reserve of $9.1 million,
which includes funds relating to
on-site
landfill and surface impoundments as well as ongoing and
anticipated remedial projects. Of the $9.1 million reserve,
$4.5 million is reserved for our landfill obligations,
which are accounted for in accordance with Accounting Standards
Codification (“ASC”) 410, “Asset Retirement and
Environmental Obligations.” We believe these reserves are
adequate.
We could also incur environmental liabilities as a result of
claims by third parties for civil damages, including liability
for personal injury or property damage, arising from releases of
hazardous substances or contamination. We are not aware of any
material claims of this type currently pending against us.
On April 12, 1999, Pactiv Corporation, formerly known as
Tenneco Packaging Inc., a wholly owned subsidiary of Tenneco
Inc., sold its containerboard and corrugated products business
to PCA, an entity formed by Madison Dearborn Partners, LLC, a
private equity investment firm. As a part of the April 12,
1999 transaction, Pactiv agreed to retain all liability for all
former facilities and all sites associated with pre-closing
offsite waste disposal. Pactiv also retained environmental
liability for a closed landfill located near the Filer City mill.
As of this filing, we believe that it is not reasonably possible
that future environmental expenditures above the
$9.1 million accrued as of December 31, 2009 will have
a material impact on our financial condition and results of
operations.
While legislation regarding the regulation of greenhouse gas
emissions has been proposed at the federal level, it is
uncertain whether such legislation will be passed and, if so,
what the breadth and scope of such legislation will be. The
result of the regulation of greenhouse gas emissions could be an
increase in our future environmental compliance costs, through
caps, taxes or additional capital expenditures to modify
facilities, which may be material. However, climate change
legislation and the resulting future energy policy could also
8
provide us with opportunities if the use of renewable energy is
encouraged. We currently generate a significant portion of our
power requirements for our mills using bark, black liquor and
biomass as fuel, which are derived from renewable resources. Our
energy optimization projects at the Counce and Valdosta
linerboard mills are expected to nearly eliminate the use of
fossil fuels at those facilities by the end of 2011, while
providing more efficient power generation at those facilities.
While we believe we are well-positioned to take advantage of any
renewable energy incentives, it is uncertain what the ultimate
costs and opportunities of any climate change legislation will
be and how our business and industry will be affected.
Available
Information
PCA’s internet website address is
www.packagingcorp.com. Our annual reports on
Form 10-K,
quarterly reports on
Form 10-Q,
current reports on
Form 8-K,
and amendments to those reports filed or furnished pursuant to
Section 13 or 15(d) of the Securities Exchange Act of 1934
are available free of charge through our website as soon as
reasonably practicable after they are electronically filed with,
or furnished to, the Securities and Exchange Commission. In
addition, our Code of Ethics may be accessed in the Investor
Relations section of PCA’s website. PCA’s website and
the information contained or incorporated therein are not
intended to be incorporated into this report.
Financial
Information About Segments
We operate as one segment and our revenues are generated
primarily in one geographic segment. See “Segment
Information” of Note 2 — Summary of
Significant Accounting Policies contained in the “Notes to
Consolidated Financial Statements.”
Some of the statements in this report and, in particular,
statements found in Management’s Discussion and Analysis of
Financial Condition and Results of Operations, that are not
historical in nature are forward-looking statements within the
meaning of the Private Securities Litigation Reform Act of 1995.
These statements are often identified by the words
“will,” “should,” “anticipate,”
“believe,” “expect,” “intend,”
“estimate,” “hope,” or similar expressions.
These statements reflect management’s current views with
respect to future events and are subject to risks and
uncertainties. There are important factors that could cause
actual results to differ materially from those in
forward-looking statements, many of which are beyond our
control. These factors, risks and uncertainties include, but are
not limited to, the factors described below.
Our actual results, performance or achievement could differ
materially from those expressed in, or implied by, these
forward-looking statements, and accordingly, we can give no
assurances that any of the events anticipated by the
forward-looking statements will transpire or occur, or if any of
them do so, what impact they will have on our results of
operations or financial condition. In view of these
uncertainties, investors are cautioned not to place undue
reliance on these forward-looking statements. We expressly
disclaim any obligation to publicly revise any forward-looking
statements that have been made to reflect the occurrence of
events after the date hereof.
Industry
Risks
Industry
Earnings Cyclicality — Imbalances of supply and demand
for containerboard could affect the price at which we can sell
containerboard and corrugated products, and as a result, could
result in lower selling prices and earnings.
The price of containerboard could fall if the supply of
containerboard available for sale in the market exceeds the
demand. The demand for containerboard is driven by market needs
for containerboard in the United States and abroad to
manufacture corrugated shipping containers. Market needs or
demand are driven by both global and U.S. business
conditions. If supply exceeds demand, prices for containerboard
and corrugated products could decline, resulting in decreased
earnings and cash generated from operations.
9
Competition —
The intensity of competition in the containerboard and
corrugated packaging industry could result in downward pressure
on pricing and volume, which could lower earnings and cash
generated from operations.
The containerboard and corrugated products industry is highly
competitive, with no single containerboard or corrugated
packaging producer having a dominant position. Containerboard
cannot generally be differentiated by producer, which tends to
intensify price competition. The corrugated packaging industry
is also sensitive to changes in economic conditions, as well as
other factors including innovation, design, quality and service.
To the extent that one or more competitors are more successful
with respect to any key competitive factor, our business could
be adversely affected. Our products also compete, to some
extent, with various other packaging materials, including
products made of paper, plastics, wood and various types of
metal. The intensity of competition could lead to a reduction in
our market share as well as lower sales prices for our products,
both of which could reduce our earnings and cash flow.
Company
Risks
Cost
of Fiber — An increase in the cost of fiber could
increase our manufacturing costs and lower our
earnings.
PCA has supply agreements at market prices for wood fiber to be
consumed at three of our four mills on approximately
352,000 acres of timberland. In addition to these supply
agreements, PCA also secures wood fiber from various other
sources at market prices.
PCA purchases recycled fiber for use at three of its four
containerboard mills. PCA currently purchases, net of recycled
fiber generated at its box plants, approximately 400,000 to
450,000 tons of recycled fiber per year. The amount of recycled
fiber purchased each year depends on the prices of both recycled
fiber and wood fiber as the company attempts to minimize total
fiber costs.
The market price of wood fiber varies based upon availability
and source. In addition, the increase in demand of products
manufactured, in whole or in part, from recycled fiber, on a
global basis, has caused an occasional tightening in the supply
of recycled fiber. These periods of supply and demand imbalance
have tended to create significant price volatility. Periods of
above average fiber costs and unusual price volatility have
occurred in the past and may occur again in the future, which
could result in lower or volatile earnings.
Cost
of Purchased Energy and Chemicals — An increase in the
cost of purchased energy and chemicals could lead to higher
manufacturing costs, resulting in reduced
earnings.
PCA has the capability to use various types of purchased fuels
in its manufacturing operations, including coal, bark, natural
gas and oil. Energy prices, in particular prices for oil and
natural gas, have fluctuated dramatically in the past and have
risen substantially in recent years. In addition, costs for key
chemicals used in our manufacturing have risen. These
fluctuations impact our manufacturing costs and result in
earnings volatility. If energy and chemical prices rise, our
production costs will increase, which will lead to higher
manufacturing costs and reduced earnings.
Material
Disruption of Manufacturing — A material disruption at
one of our manufacturing facilities could prevent us from
meeting customer demand, reduce our sales and/or negatively
impact our results of operation and financial
condition.
Our business depends on continuous operation of our facilities,
particularly at our mills. Any of our manufacturing facilities,
or any of our machines within such facilities, could cease
operations unexpectedly for a long period of time due to a
number of events, including unscheduled maintenance outages;
prolonged power failures; an equipment failure; explosion of a
boiler; labor difficulties; natural catastrophes; terrorism;
governmental regulations; and other operational problems. These
events could lead to higher costs and reduced earnings.
10
Environmental
Matters — PCA may incur significant environmental
liabilities with respect to both past and future
operations.
We are subject to, and must comply with, a variety of federal,
state and local environmental laws, particularly those relating
to air and water quality, waste disposal and the cleanup of
contaminated soil and groundwater. Because environmental
regulations are constantly evolving, we have incurred, and will
continue to incur, costs to maintain compliance with those laws.
See Item 1. “Business — Environmental
Matters” for certain estimates of expenditures we expect to
make for environmental compliance in the next few years.
Although we have established reserves to provide for known
environmental liabilities as of the date of this filing, these
reserves may change over time due to the enactment of new
environmental laws or regulations or changes in existing laws or
regulations, which might require additional significant
environmental expenditures.
Investment
Risks
Market
Price of our Common Stock — The market price of our
common stock may be volatile, which could cause the value of
your investment to decline.
Securities markets worldwide periodically experience significant
price declines and volume fluctuations. This market volatility,
as well as general economic, market or political conditions,
could reduce the market price of our common stock in spite of
our operating performance. In addition, our operating results
could be below the expectations of public market analysts and
investors, and in response, the market price of our common stock
could decrease significantly.
General
Risks
Economic
Conditions — Our earnings and cash generated from
operations could be significantly lower if a severe downturn in
the U.S. economy occurs.
Our operations and financial performance are directly impacted
by changes in the U.S. economy, and to a lesser extent, by
global economic conditions. The significant downturn in the
U.S. economy began to impact our industry and PCA in the
fourth quarter of 2008 and continued in 2009, lowering the
demand for our products and our mill production. This lower
demand and production reduced our revenues, increased our unit
production costs, and lowered our earnings and our cash
generated from operations. Demand for our products and
PCA’s mill production improved during the second half of
2009, but it is uncertain if economic conditions will again
deteriorate or continue to improve. In the event that economic
conditions deteriorate, our operating and financial performance
will be adversely impacted. Lower earnings and reduced cash flow
could impact our ability to fund operations, capital
requirements, and common stock dividend payments, and a
prolonged and severe downturn could possibly impact our ability
to comply with our debt covenants.
|
|
|
Item 1B.
|
UNRESOLVED
STAFF COMMENTS
|
None.
The table below provides a summary of our containerboard mills,
the principal products produced and each mill’s annual
practical maximum capacity based upon all of our paper
machines’ production capabilities, as reported to the
AF&PA:
| |
|
|
|
|
|
|
|
Location
|
|
Function
|
|
Capacity (tons)
|
|
|
|
|
Counce, TN
|
|
Kraft linerboard mill
|
|
|
1,007,000
|
|
|
Valdosta, GA
|
|
Kraft linerboard mill
|
|
|
474,000
|
|
|
Tomahawk, WI
|
|
Semi-chemical medium mill
|
|
|
581,000
|
*
|
|
Filer City, MI
|
|
Semi-chemical medium mill
|
|
|
413,000
|
|
|
|
|
|
|
|
|
|
|
Total
|
|
|
|
|
2,475,000
|
*
|
|
|
|
|
|
|
|
|
11
|
|
|
|
* |
|
In April, 2005, we shut down the number three paper machine at
our Tomahawk mill after resuming operations on the number one
paper machine at our Filer City mill. Shutting down the number
three machine (out of 3 total paper machines) at Tomahawk
reduces our total productive capacity by 65,000 tons at Tomahawk
from 581,000 tons to 516,000 tons and reduces our total
containerboard mill system capacity from 2,475,000 tons to
2,410,000 tons. This action was based on market conditions and
productivity and could change if market conditions or
productivity levels change going forward. |
We currently own our four containerboard mills and 44 of our
corrugated manufacturing operations (37 corrugated plants and
seven sheet plants). We also own one sawmill, an air-drying
yard, one warehouse and miscellaneous other property, which
includes sales offices and woodlands forest management offices.
These sales offices and woodlands forest management offices
generally have one to four employees and serve as administrative
offices. PCA leases the space for three corrugated plants, 21
sheet plants, six regional design centers, and numerous other
distribution centers, warehouses and facilities. The equipment
in these leased facilities is, in virtually all cases, owned by
PCA, except for forklifts and other rolling stock which are
generally leased.
We lease the cutting rights to approximately 91,000 acres
of timberland located near our Valdosta mill (80,000 acres)
and our Counce mill (11,000 acres). On average, these
cutting rights agreements have terms with approximately
15 years remaining.
We currently lease space for our corporate headquarters in Lake
Forest, Illinois. The lease for the Lake Forest, Illinois
facility is a short term, facility use agreement lease with
automatic renewal rights. Specifically, this lease is a
continuous
month-to-month
lease with unlimited automatic renewals entitling either party
the right to terminate the lease with at least 8 months
notice.
We currently believe that our owned and leased space for
facilities and properties are sufficient to meet our operating
requirements for the foreseeable future.
|
|
|
Item 3.
|
LEGAL
PROCEEDINGS
|
PCA is a party to various legal actions arising in the ordinary
course of our business. These legal actions cover a broad
variety of claims spanning our entire business. As of the date
of this filing, we believe it is not reasonably possible that
the resolution of these legal actions will, individually or in
the aggregate, have a material adverse effect on our financial
condition, results of operations or cash flows.
|
|
|
Item 4.
|
SUBMISSION
OF MATTERS TO A VOTE OF SECURITY HOLDERS
|
No matters were submitted to a vote of security holders in the
fourth quarter of 2009.
|
|
|
Item 4.1
|
EXECUTIVE
OFFICERS OF THE REGISTRANT
|
Brief statements setting forth the age at February 17,
2010, the principal occupation, employment during the past five
years, the year in which such person first became an officer of
PCA, and other information concerning each of our executive
officers appears below.
Paul T. Stecko is 65 years old and has served as
Chief Executive Officer of PCA since January 1999 and as
Chairman of PCA since March 1999. From November 1998 to April
1999, Mr. Stecko served as President and Chief Operating
Officer of Tenneco Inc. From January 1997 to November 1998,
Mr. Stecko served as Chief Operating Officer of Tenneco.
From December 1993 through January 1997, Mr. Stecko served
as President and Chief Executive Officer of Tenneco Packaging
Inc. Prior to joining Tenneco Packaging, Mr. Stecko spent
16 years with International Paper Company. Mr. Stecko
is a member of the board of directors of Tenneco Inc., Smurfit
Kappa Group Limited, State Farm Mutual Insurance Company and
American Forest and Paper Association.
Thomas A. Hassfurther is 54 years old and has served
as Executive Vice President — Corrugated Products of
PCA since September 2009 and as Senior Vice President, Sales and
Marketing, Corrugated Products from February 2005 to September
2009. Mr. Hassfurther served as Vice President, Sales and
Marketing, Corrugated
12
Products from March 1998 to February 2005. Prior to
this he held various senior-level management and sales positions
at Tenneco Packaging Inc. Mr. Hassfurther joined Tenneco
Packaging in 1977. He currently serves as chairman of the Fibre
Box Association.
Mark W. Kowlzan is 54 years old and has served as
Senior Vice President — Containerboard of PCA since
March 2002 and as Vice President from April 1999 to March 2002.
From 1998 to April 1999, Tenneco Packaging Inc. employed
Mr. Kowlzan as Vice President and General
Manager — Containerboard and from May 1996 to 1998, as
Operations Manager and Mill Manager of the Counce mill. Prior to
joining Tenneco Packaging, Mr. Kowlzan spent 15 years
at International Paper Company, where he held a series of
operational positions within its mill organization.
Richard B. West is 57 years old and has served as
Chief Financial Officer of PCA since March 1999 and as Senior
Vice President since March 2002. From April 1999 to June 2007,
Mr. West served as our Corporate Secretary. From April 1999
to March 2002, Mr. West served as Vice President and from
March 1999 to June 1999, Mr. West also served as Treasurer
of PCA. Mr. West served as Vice President of
Finance — Paperboard Packaging of Tenneco Packaging
Inc. from 1995 to April 1999. Prior to joining Tenneco
Packaging, Mr. West spent 20 years with International
Paper Company where he served as an Internal Auditor, Internal
Audit Manager and Manufacturing Controller for the Printing
Papers Group and Director/Business Process Redesign.
Thomas W.H. Walton is 50 years old and has served as
Senior Vice President — Sales and Marketing,
Corrugated Products since October 2009. Mr. Walton served
as a Vice President and Area General Manager within the
Corrugated Products Group since 1998, and prior to that time,
has also held plant positions in production, sales and general
management since 1981 when he joined Tenneco Packaging.
Stephen T. Calhoun is 64 years old and has served as
Vice President, Human Resources of PCA since November 2002. From
July 1997 to October 2002, Mr. Calhoun served as Director,
Human Resources of Corporate and Containerboard Division. From
April 1989 to July 1997, Mr. Calhoun was employed
principally by Tenneco Packaging Inc. where he held the
positions of Area Employee Relations Manager and Human Resources
Manager. Prior to joining Tenneco Packaging in 1989,
Mr. Calhoun spent 15 years with American Can Company
where he held several human resources and manufacturing
positions.
PART II
|
|
|
Item 5.
|
MARKET
FOR THE REGISTRANT’S COMMON EQUITY, RELATED STOCKHOLDER
MATTERS AND ISSUER PURCHASES OF EQUITY SECURITIES
|
Market
Information
PCA’s common stock is listed on the New York Stock Exchange
under the symbol “PKG”. The following table sets forth
the high and low sale prices and dividends as reported by the
New York Stock Exchange during the last two years.
| |
|
|
|
|
|
|
|
|
|
|
|
|
|
|
|
|
|
|
|
|
|
|
|
|
|
|
|
2009
|
|
|
2008
|
|
|
|
|
Sales Price
|
|
|
Dividends
|
|
|
Sales Price
|
|
|
Dividends
|
|
|
Quarter Ended
|
|
High
|
|
|
Low
|
|
|
Declared
|
|
|
High
|
|
|
Low
|
|
|
Declared
|
|
|
|
|
March 31
|
|
$
|
15.49
|
|
|
$
|
9.66
|
|
|
$
|
0.15
|
|
|
$
|
28.74
|
|
|
$
|
19.84
|
|
|
$
|
0.30
|
|
|
June 30
|
|
|
17.24
|
|
|
|
12.43
|
|
|
|
0.15
|
|
|
|
26.47
|
|
|
|
20.46
|
|
|
|
0.30
|
|
|
September 30
|
|
|
21.99
|
|
|
|
15.19
|
|
|
|
0.15
|
|
|
|
26.99
|
|
|
|
20.93
|
|
|
|
0.30
|
|
|
December 31
|
|
|
24.18
|
|
|
|
18.21
|
|
|
|
0.15
|
|
|
|
23.60
|
|
|
|
10.95
|
|
|
|
0.30
|
|
Stockholders
As of February 12, 2010, there were 97 holders of record of
our common stock.
13
Dividend
Policy
PCA expects to continue to pay regular cash dividends, although
there is no assurance as to the timing or level of future
dividend payments because they depend on future earnings,
capital requirements and financial condition.
Sales of
Unregistered Securities
No equity securities of PCA were sold by PCA during fiscal year
2009 which were not registered under the Securities Act of 1933.
Purchases
of Equity Securities
Stock
Repurchase Programs
On October 17, 2007, PCA announced that its Board of
Directors had authorized a $150.0 million common stock
repurchase program. There is no expiration date for the common
stock repurchase program. Through December 31, 2009, the
Company repurchased 3,818,729 shares of common stock for
$85.0 million, which have been retired. No shares were
repurchased during 2009.
Performance
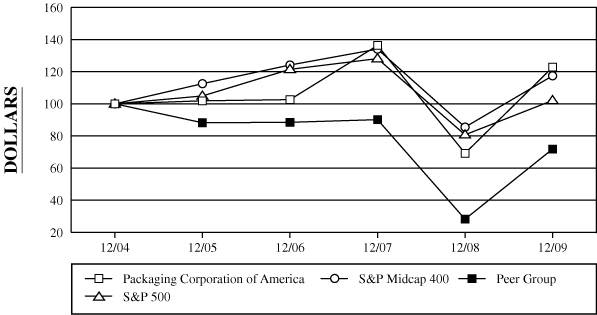
Graph
The graph below compares PCA’s cumulative
5-year total
shareholder return on common stock with the cumulative total
returns of the S&P 500 index; the S&P Midcap 400
index; and a customized peer group that includes three
publicly-traded companies, which PCA competed with the entire
five year period. These companies are International Paper
Company, Smurfit-Stone Container Corp. and Temple Inland Inc.
The graph tracks the performance of a $100 investment in our
common stock, in each index, and in the peer group (including
the reinvestment of all dividends) from December 31, 2004
through December 31, 2009. The stock price performance
included in this graph is not necessarily indicative of future
stock price performance.
COMPARISON
OF 5 YEAR CUMULATIVE TOTAL RETURN*
Among Packaging Corporation of America, The S&P 500
Index,
The S&P Midcap 400 Index And A Peer Group
*$100 invested on 12/31/04 in stock or index, including
reinvestment of dividends.
14
Fiscal year ending December 31.
Copyright©
2010 S&P, a division of The McGraw-Hill Companies Inc. All
rights reserved.
| |
|
|
|
|
|
|
|
|
|
|
|
|
|
|
|
|
|
|
|
|
|
|
|
|
|
|
|
Cumulative Total Return
|
|
|
|
12/04
|
|
12/05
|
|
12/06
|
|
12/07
|
|
12/08
|
|
12/09
|
|
Packaging Corporation of America
|
|
|
100.00
|
|
|
|
101.89
|
|
|
|
102.63
|
|
|
|
136.35
|
|
|
|
69.23
|
|
|
|
122.80
|
|
|
S & P 500
|
|
|
100.00
|
|
|
|
104.91
|
|
|
|
121.48
|
|
|
|
128.16
|
|
|
|
80.74
|
|
|
|
102.11
|
|
|
S & P Midcap 400
|
|
|
100.00
|
|
|
|
112.55
|
|
|
|
124.17
|
|
|
|
134.08
|
|
|
|
85.50
|
|
|
|
117.46
|
|
|
Peer Group
|
|
|
100.00
|
|
|
|
88.23
|
|
|
|
88.52
|
|
|
|
90.16
|
|
|
|
28.22
|
|
|
|
71.86
|
|
The information in the graph and table above is not deemed
“filed” with the Securities and Exchange Commission
and is not to be incorporated by reference in any of PCA’s
filings under the Securities Act of 1933 or the Securities
Exchange Act of 1934, whether made before or after the date of
this Annual Report on
Form 10-K,
except to the extent that PCA specifically incorporates such
information by reference.
|
|
|
Item 6.
|
SELECTED
FINANCIAL DATA
|
The following table sets forth the selected historical financial
data of PCA. The information contained in the table should be
read in conjunction with “Management’s Discussion and
Analysis of Financial Condition and Results of Operations”
and the historical consolidated financial statements of PCA,
including the notes thereto, contained elsewhere in this report.
| |
|
|
|
|
|
|
|
|
|
|
|
|
|
|
|
|
|
|
|
|
|
|
|
For the Year Ended December 31,
|
|
|
|
|
2009
|
|
|
2008
|
|
|
2007
|
|
|
2006
|
|
|
2005
|
|
|
|
|
(In thousands, except per share data)
|
|
|
|
|
Statement of Income Data:
|
|
|
|
|
|
|
|
|
|
|
|
|
|
|
|
|
|
|
|
|
|
Net sales
|
|
$
|
2,147,589
|
|
|
$
|
2,360,493
|
|
|
$
|
2,316,006
|
|
|
$
|
2,187,046
|
|
|
$
|
1,993,658
|
|
|
Net income
|
|
|
265,895
|
|
|
|
135,609
|
|
|
|
170,066
|
|
|
|
125,032
|
|
|
|
52,604
|
|
|
Net income per common share:
|
|
|
|
|
|
|
|
|
|
|
|
|
|
|
|
|
|
|
|
|
|
— basic
|
|
|
2.62
|
|
|
|
1.32
|
|
|
|
1.63
|
|
|
|
1.21
|
|
|
|
0.49
|
|
|
— diluted
|
|
|
2.60
|
|
|
|
1.31
|
|
|
|
1.61
|
|
|
|
1.20
|
|
|
|
0.49
|
|
|
Weighted average common shares outstanding:
|
|
|
|
|
|
|
|
|
|
|
|
|
|
|
|
|
|
|
|
|
|
— basic
|
|
|
101,577
|
|
|
|
102,753
|
|
|
|
104,483
|
|
|
|
103,599
|
|
|
|
107,334
|
|
|
— diluted
|
|
|
102,358
|
|
|
|
103,593
|
|
|
|
105,459
|
|
|
|
104,485
|
|
|
|
108,098
|
|
|
Cash dividends declared per common share
|
|
|
0.60
|
|
|
|
1.20
|
|
|
|
1.05
|
|
|
|
1.00
|
|
|
|
1.00
|
|
|
Balance Sheet Data:
|
|
|
|
|
|
|
|
|
|
|
|
|
|
|
|
|
|
|
|
|
|
Total assets
|
|
$
|
2,152,840
|
|
|
$
|
1,939,741
|
|
|
$
|
2,035,857
|
|
|
$
|
1,986,976
|
|
|
$
|
1,973,298
|
|
|
Total debt obligations(1)
|
|
|
680,878
|
|
|
|
681,135
|
|
|
|
677,248
|
|
|
|
686,917
|
|
|
|
695,203
|
|
|
Stockholders’ equity
|
|
|
898,845
|
|
|
|
683,949
|
|
|
|
760,861
|
|
|
|
691,771
|
|
|
|
681,420
|
|
|
|
|
|
(1) |
|
Total debt obligations include long-term debt, capital lease
obligations, short-term debt and current maturities of long-term
debt and capital lease obligations. |
|
|
|
Item 7.
|
MANAGEMENT’S
DISCUSSION AND ANALYSIS OF FINANCIAL CONDITION AND RESULTS OF
OPERATIONS
|
The following discussion of historical results of operations and
financial condition should be read in conjunction with the
audited financial statements and the notes thereto which appear
elsewhere in this report.
Overview
PCA is the fifth largest producer of containerboard and
corrugated products in the United States, based on production
capacity. We operate four containerboard mills and 68 corrugated
products manufacturing plants
15
throughout the United States. Approximately 80% of the
containerboard tons produced at our mills are consumed in our
corrugated products manufacturing plants. The remaining 20% is
sold to domestic customers or the export market. We produce a
wide variety of corrugated products ranging from basic
corrugated shipping containers to specialized packaging such as
wax-coated boxes for the agriculture industry. We also have
multi-color printing capabilities to make high-impact graphics
boxes and displays that offer our customers more attractive
packaging.
In analyzing our operating performance, we focus on the
following factors that affect our business and are important to
consider when reviewing our financial and operating results:
|
|
|
| |
•
|
containerboard and corrugated products demand;
|
| |
| |
•
|
corrugated products and containerboard pricing and mix;
|
| |
| |
•
|
cost trends and volatility for our major costs, including wood
and recycled fiber, purchased fuels, electricity, labor and
fringe benefits and transportation costs; and
|
| |
| |
•
|
cash flow from operations and capital expenditures.
|
Historically, supply and demand, as well as industry-wide
inventory levels, have influenced prices of containerboard and
corrugated products. In addition to U.S. shipments,
approximately 10% of domestically produced containerboard has
been exported for use in other countries.
The market for containerboard and corrugated products is
generally subject to changes in the U.S. economy. The
severe downturn in the economy began to significantly impact
demand in the fourth quarter of 2008 and continued in 2009, with
industry-wide corrugated products shipments down 7.7% in 2009
compared to 2008. The industry, as well as PCA, began to see
some improvement in demand as the economy improved. For the
year, our corrugated products shipments were down only 4.6%
compared to 2008 and steadily improved beginning in the second
quarter of 2009. PCA mills ran to demand during the year at 94%
of capacity after taking over 150,000 tons of downtime, both
market and maintenance related. Compared to 2008, our mill
production was down almost 100,000 tons. Industry supply and
demand for containerboard was in balance, and industry
containerboard inventories at the end of December 2009 were
2,139,000 tons, the lowest December inventory level since 1980.
Prices for containerboard and corrugated products were lower
during 2009 compared to 2008, with industry published prices for
containerboard dropping $70 per ton. From January 2009 through
May 2009, prices dropped $60 per ton, and prices dropped an
additional $10 per ton in September 2009. Containerboard prices
subsequently increased in January 2010, with industry published
prices up $50 per ton, except for West coast shipments which
increased $70 per ton.
Lower pricing as well as lower demand resulting from the
economic downturn negatively impacted PCA’s 2009 earnings
but these factors were partially offset by lower energy,
transportation and input costs. Our costs for purchased fuels
averaged approximately 22% lower for the full year 2009 compared
to 2008, while transportation costs decreased 12% from prior
year levels. Electricity costs, which typically lag fuel cost
changes, rose slightly on average in 2009 as producers tried to
recoup 2008 fuel cost increases in the beginning of 2009. By the
fourth quarter of 2009, electricity costs were below the prior
year levels. Published recycled fiber costs decreased, on
average, 44% compared to 2008. Since the end of the year,
however, recycled fiber costs have rebounded sharply, and have
more than doubled from the 2009 average. Wood fiber costs in
2009 were lower than they were in 2008 on average; however, in
the fourth quarter poor weather conditions in the Southern U.S.
made it difficult to access wood fiber, driving wood costs to
higher levels. Average chemical costs for full year 2009 were
comparable to 2008 with costs being higher than the previous
year in the first half of 2009 and lower in the second half of
2009.
Our earnings for 2009 also benefitted from alternative fuel
mixture tax credits, which are fully described in Note 15
to the consolidated financial statements. The alternative fuel
mixture tax credit expired on December 31, 2009.
16
In the first quarter of 2010, we expect higher containerboard
and box prices from announced price increases, but most of the
earnings benefit will not be realized until the second quarter
when the price increase has been passed through to box
customers. We expect mill downtime and higher operating costs
from our annual maintenance outage at Counce and our Valdosta
mill outage for work related to our energy optimization project.
Much higher recycled fiber costs, higher energy costs associated
with colder weather, a higher effective tax rate and higher
timing-related benefit costs are also expected in the first
quarter. Considering all these items, we estimate our first
quarter earnings will be lower than our fourth quarter earnings
of $16 million, which excludes net income of
$44 million from alternative fuel mixture tax credits and a
$1 million after tax charge from asset disposals related to
the energy optimization projects.
Results
of Operations
Year
Ended December 31, 2009 Compared to Year Ended
December 31, 2008
The historical results of operations of PCA for the years ended
December 31, 2009 and 2008 are set forth below:
| |
|
|
|
|
|
|
|
|
|
|
|
|
|
|
|
For the Year Ended
|
|
|
|
|
|
|
|
December 31,
|
|
|
|
|
|
|
|
2009
|
|
|
2008
|
|
|
Change
|
|
|
|
|
(In millions)
|
|
|
|
|
Net sales
|
|
$
|
2,147.6
|
|
|
$
|
2,360.5
|
|
|
$
|
(212.9
|
)
|
|
|
|
|
|
|
|
|
|
|
|
|
|
|
|
Income from operations
|
|
$
|
352.5
|
|
|
$
|
241.8
|
|
|
$
|
110.7
|
|
|
Interest expense, net
|
|
|
(35.5
|
)
|
|
|
(31.7
|
)
|
|
|
(3.8
|
)
|
|
|
|
|
|
|
|
|
|
|
|
|
|
|
|
Income before taxes
|
|
|
317.0
|
|
|
|
210.1
|
|
|
|
106.9
|
|
|
Provision for income taxes
|
|
|
(51.1
|
)
|
|
|
(74.5
|
)
|
|
|
23.4
|
|
|
|
|
|
|
|
|
|
|
|
|
|
|
|
|
Net income
|
|
$
|
265.9
|
|
|
$
|
135.6
|
|
|
$
|
130.3
|
|
|
|
|
|
|
|
|
|
|
|
|
|
|
|
Net
Sales
Net sales decreased by $212.9 million, or 9.0%, for the
year ended December 31, 2009 from the year ended
December 31, 2008. Net sales decreased primarily due to the
impact of lower sales volume ($145.5 million) and decreased
sales prices of corrugated products and containerboard
($67.4 million).
Total corrugated products volume sold decreased 4.6% to
28.9 billion square feet in 2009 compared to
30.3 billion square feet in 2008. On a comparable
shipment-per-workday
basis, corrugated products sales volume decreased 3.8% in 2009
from 2008.
Shipments-per-workday
is calculated by dividing our total corrugated products volume
during the year by the number of workdays within the year. The
larger percentage decrease, on a total shipments basis, was due
to the fact that 2009 had two fewer workdays (250 days),
those days not falling on a weekend or holiday, than 2008
(252 days). Containerboard sales volume to external
domestic and export customers decreased 9.9% to 431,000 tons for
the year ended December 31, 2009 from 478,000 tons in 2008.
Outside sales of both corrugated products and containerboard
began 2009 with significantly lower volumes compared to 2008 and
steadily improved throughout the year.
Income
from Operations
Income from operations increased by $110.7 million, or
45.8%, for the year ended December 31, 2009 compared to
2008 primarily attributable to the alternative fuel mixture tax
credit of $168.4 million described in Note 15 to the
consolidated financial statements. Excluding the alternative
fuel mixture tax credit, income from operations decreased
$57.8 million for full year 2009, which was primarily
attributable to decreased sales prices of corrugated products
and containerboard ($67.4 million), lower sales volume
($52.5 million) and increased labor and fringe benefit
costs ($8.0 million), partially offset by decreased costs
of energy ($24.5 million), transportation
($23.7 million), recycled fiber ($18.9 million) and
wood fiber costs ($3.5 million).
17
Gross profit decreased $64.8 million, or 13.2%, for the
year ended December 31, 2009 from the year ended
December 31, 2008. Gross profit as a percentage of net
sales decreased from 20.8% of net sales in the year ended
December 31, 2008 to 19.9% of net sales in the year ended
December 31, 2009 primarily due to the decreases of sales
prices and volume described previously.
Selling and administrative expenses were essentially unchanged,
up 0.1%, for the year ended December 31, 2009 from the year
ended December 31, 2008.
Corporate overhead for the year ended December 31, 2009
decreased $6.5 million, or 10.6%, from the year ended
December 31, 2008. The decrease was primarily attributable
to lower salary and fringe benefit expenses ($5.9 million)
and other items which were individually insignificant.
Other expense, net, decreased $0.7 million, or 4.7% for the
year ended December 31, 2009 compared to the year ended
December 31, 2008. The decrease was primarily due to lower
legal related costs ($1.6 million), partially offset by
increased fixed asset disposal costs ($0.8 million).
Interest
Expense, Net and Income Taxes
Interest expense, net of interest income, increased by
$3.8 million, or 12.0%, for the year ended
December 31, 2009 compared to the year ended
December 31, 2008, due to lower interest rates on our
investments, which reduced interest income by $5.0 million
in 2009 compared to 2008.
PCA’s total effective tax rate was 16.1% for the year ended
December 31, 2009 and 35.5% for the year ended
December 31, 2008. The effective tax rate in 2009 varies
from the U.S. federal statutory tax rate of 35.0%
principally due to the impact of the alternative fuel mixture
tax credit, state and local income taxes and the domestic
manufacturers’ deduction. PCA had no material changes to
its uncertain tax positions under ASC 740, “Income
Taxes,” in 2009.
Year
Ended December 31, 2008 Compared to Year Ended
December 31, 2007
The historical results of operations of PCA for the years ended
December 31, 2008 and 2007 are set forth below:
| |
|
|
|
|
|
|
|
|
|
|
|
|
|
|
|
For the Year Ended
|
|
|
|
|
|
|
|
December 31,
|
|
|
|
|
|
|
|
2008
|
|
|
2007
|
|
|
Change
|
|
|
|
|
(In millions)
|
|
|
|
|
Net sales
|
|
$
|
2,360.5
|
|
|
$
|
2,316.0
|
|
|
$
|
44.5
|
|
|
|
|
|
|
|
|
|
|
|
|
|
|
|
|
Income from operations
|
|
$
|
241.8
|
|
|
$
|
293.5
|
|
|
$
|
(51.7
|
)
|
|
Interest expense, net
|
|
|
(31.7
|
)
|
|
|
(25.6
|
)
|
|
|
(6.1
|
)
|
|
|
|
|
|
|
|
|
|
|
|
|
|
|
|
Income before taxes
|
|
|
210.1
|
|
|
|
267.9
|
|
|
|
(57.8
|
)
|
|
Provision for income taxes
|
|
|
(74.5
|
)
|
|
|
(97.8
|
)
|
|
|
23.3
|
|
|
|
|
|
|
|
|
|
|
|
|
|
|
|
|
Net income
|
|
$
|
135.6
|
|
|
$
|
170.1
|
|
|
$
|
(34.5
|
)
|
|
|
|
|
|
|
|
|
|
|
|
|
|
|
Net
Sales
Net sales increased by $44.5 million, or 1.9%, for the year
ended December 31, 2008 from the year ended
December 31, 2007. Net sales increased primarily due to
increased sales prices of corrugated products and containerboard
($111.0 million), partially offset by the impact of lower
sales volume ($66.5 million).
Total corrugated products volume sold decreased 2.9% to
30.3 billion square feet in 2008 compared to
31.2 billion square feet in 2007. On a comparable
shipment-per-workday
basis, corrugated products sales volume decreased 3.3% in 2008
from 2007.
Shipments-per-workday
is calculated by dividing our total corrugated products volume
during the year by the number of workdays within the year. The
larger percentage decrease on a
shipment-per-workday
basis was due to the fact that 2008 had one more workday
(252 days), those days not falling on a weekend or holiday,
than 2007 (251 days). Containerboard sales volume to
external
18
domestic and export customers decreased 11.7% to 478,000 tons
for the year ended December 31, 2008 from 541,000 tons in
2007.
Income
from Operations
Income from operations decreased by $51.7 million, or
17.6%, for the year ended December 31, 2008 compared to
2007. The decrease in income from operations was primarily
attributable to increased energy and energy related costs
including transportation ($56.2 million), lower sales
volume ($44.4 million), increased costs for wood fiber
($25.1 million), labor ($17.6 million), medical
($8.9 million), bad debts ($4.1 million), legal
matters ($3.4 million),
start-up
costs of two major mill projects ($3.2 million) and fixed
asset disposals ($3.1 million). The impact of higher costs
and lower volume was partially offset by increased sales prices
($111.0 million) and lower recycled fiber costs
($3.6 million).
Gross profit decreased $33.3 million, or 6.3%, for the year
ended December 31, 2008 from the year ended
December 31, 2007. Gross profit as a percentage of net
sales decreased from 22.7% of net sales in the year ended
December 31, 2007 to 20.8% of net sales in the year ended
December 31, 2008 primarily due to the cost increases and
reduced sales volume described previously.
Selling and administrative expenses increased $3.8 million,
or 2.2%, for the year ended December 31, 2008 from the year
ended December 31, 2007. The increase was primarily the
result of higher expenses related to labor and fringe benefit
costs ($1.5 million), warehousing costs due to customer
requirements ($1.5 million) and travel, meeting and
entertainment expenses ($0.5 million).
Corporate overhead for the year ended December 31, 2008
increased $4.8 million, or 8.6%, from the year ended
December 31, 2007. The increase was primarily attributable
to increased salary and fringe benefit expenses
($4.5 million).
Other expense, net, increased $8.8 million, or 134.5% for
the year ended December 31, 2008 compared to the year ended
December 31, 2007. The increase was primarily due to higher
legal related costs ($3.4 million), fixed asset disposal
costs ($3.1 million), storm damage to our facilities
($1.0 million) and a gain on sale of land occurring in 2007
($0.8 million).
Interest
Expense, Net and Income Taxes
Interest expense, net of interest income, increased by
$6.1 million, or 23.8%, for the year ended
December 31, 2008 compared to the full year 2007, primarily
as a result of lower interest income ($6.2 million) earned
on PCA’s cash equivalents and partially offset by lower
interest expense ($0.1 million) related to PCA’s
outstanding debt balances. The $6.2 million decrease in
interest income was due both to lower interest income rates and
lower cash balances during 2008 compared to 2007. The
$0.1 million decrease in interest expense was due to a
$2.4 million decrease in interest expense related to the
Company’s receivables credit facility due to lower interest
rates and a $1.4 million decrease in term loan interest
expense as a result of the repayment of the term loan in March
2008. This was almost completely offset by a $3.7 million
increase in interest expense related to PCA’s senior notes
as a result of the issuance in March 2008 of the
61/2% notes
due 2018, the proceeds of which were used to repay the
43/8% notes
due August 2008.
PCA’s effective tax rate was 35.5% for the year ended
December 31, 2008 and 36.5% for the year ended
December 31, 2007. The effective tax rate varies from the
U.S. federal statutory tax rate of 35.0% principally due to
the impact of state and local income taxes offset by the
domestic manufacturers’ deduction. The Company had no
material changes to its uncertain tax positions under ASC 740,
“Income Taxes,” in 2008.
19
Liquidity
and Capital Resources
| |
|
|
|
|
|
|
|
|
|
|
|
|
|
|
|
For the Year Ended December 31,
|
|
|
|
|
2009
|
|
|
2008
|
|
|
2007
|
|
|
|
|
(In millions)
|
|
|
|
|
Net cash provided by (used for):
|
|
|
|
|
|
|
|
|
|
|
|
|
|
Operating activities
|
|
$
|
306.1
|
|
|
$
|
269.3
|
|
|
$
|
300.1
|
|
|
Investing activities
|
|
|
(119.3
|
)
|
|
|
(134.5
|
)
|
|
|
(113.2
|
)
|
|
Financing activities
|
|
|
(75.5
|
)
|
|
|
(213.5
|
)
|
|
|
(120.6
|
)
|
|
|
|
|
|
|
|
|
|
|
|
|
|
|
|
Net increase (decrease) in cash
|
|
$
|
111.3
|
|
|
$
|
(78.7
|
)
|
|
$
|
66.3
|
|
|
|
|
|
|
|
|
|
|
|
|
|
|
|
Operating
Activities
Net cash provided by operating activities increased
$36.8 million, or 13.7%, to $306.1 million for the
year ended December 31, 2009 compared to the year ended
December 31, 2008. Net income, excluding income from
alternative fuel mixture tax credits (described in Note 15
to the financial statements included in this report), was
$94.6 million for 2009 compared to $135.6 million for
2008, a decrease of $41.0 million that reduced net cash
provided by operating activities by the same amount. This
decrease, however, was more than offset by reduced operating
cash requirements, including a $48.4 million net reduction
in federal tax payments after applying alternative fuel mixture
tax credits. During 2009, PCA’s cash taxes paid for both
federal and state income taxes were $22.3 million.
Additionally, requirements for operating assets and liabilities
were lower by $33.9 million in 2009 compared to 2008,
driven for the most part by receivables and payables levels,
both of which were impacted by the economic downturn. This was
partially offset by higher pension contributions in 2009. Cash
requirements for operating activities are subject to PCA’s
operating needs, the timing of collection of receivables and
payments of payables and expenses, and seasonal fluctuations in
the Company’s operations.
Net cash provided by operating activities decreased
$30.8 million, or 10.3% to $269.3 million for the year
ended December 31, 2008 compared to the year ended
December 31, 2007. The decrease in net cash provided by
operating activities was primarily the result of lower net
income in 2008 of $34.5 million, partially offset by lower
requirements for operating assets and liabilities of
$1.5 million. Changes in balances of operating assets and
liabilities reflected the ordinary course of operation of
PCA’s business during 2008. Requirements for operating
assets and liabilities are subject to PCA’s operating
needs, the timing of collection of receivables and the payments
of payables and expenses, and to seasonal fluctuations in
PCA’s operations. Working capital requirements were
affected by the weak business conditions and significantly lower
than expected demand for containerboard and corrugated products
during the fourth quarter of 2008, resulting in a net increase
in the requirements for accounts payable, accrued liabilities
and accounts receivable of $32.6 million for the three
months ended December 31, 2008 compared to the same period
in 2007. During 2008, PCA’s cash taxes paid for both
federal and state income taxes were $89.4 million.
Investing
Activities
Net cash used for investing activities decreased
$15.2 million, or 11.3%, to $119.3 million for the
year ended December 31, 2009 compared to the year ended
December 31, 2008. The decrease was due to lower additions
to property, plant and equipment of $18.8 million in 2009
compared to 2008, which was partially offset by a
$3.1 million acquisition completed during the third quarter
of 2009 as described in Note 17 to the financial statements.
Net cash used for investing activities increased by
$21.3 million, or 18.8%, to $134.5 million for the
year ended December 31, 2008 compared to the year ended
December 31, 2007. The increase was primarily related to
higher additions to property, plant and equipment of
$19.5 million and higher additions to other long term
assets of $1.4 million in the year ended December 31,
2008 compared to the year ended December 31, 2007.
As of December 31, 2009, PCA had commitments for general
purpose capital expenditures of $198.1 million for 2010,
including $156.3 million for the major energy projects at
its Counce and Valdosta
20
mills. PCA believes that
cash-on-hand
combined with cash flow from operations and alternative fuel
mixture credits receivable will be sufficient to fund these
commitments.
Financing
Activities
Net cash used for financing activities totaled
$75.5 million for the year ended December 31, 2009, a
decrease of $138.0 million, or 64.7%, compared to the same
period in 2008. The difference was primarily attributable to
lower debt payments of $169.7 million in 2009, partially
offset by $145.2 million in net proceeds received from
PCA’s notes offering in 2008 described below. Additionally,
PCA made no common stock repurchases in 2009 compared to
$65.7 million in repurchases of PCA common stock during
2008, and lower common stock dividends of $76.9 million
paid in 2009 compared to $125.1 million paid in 2008.
Net cash used for financing activities totaled
$213.5 million for the year ended December 31, 2008,
an increase of $92.9 million, or 77.0%, from the year ended
December 31, 2007. The increase was primarily attributable
to higher debt payments of $160.2 million, higher
repurchases of PCA common stock of $35.1 million,
$20.0 million in additional dividends paid on PCA’s
common stock and lower proceeds from the issuance of common
stock upon exercise of stock options of $21.9 million
during 2008 compared to 2007, partially offset by
$145.2 million in net proceeds received from PCA’s
notes offering .
In connection with the senior notes offering in March of 2008,
PCA received proceeds, net of discount, of $149.9 million
and paid $4.4 million for settlement of a treasury lock
that it entered into to protect against increases in the
ten-year U.S. Treasury rate, which served as a reference in
determining the interest rate applicable to the notes. PCA also
incurred financing costs in the amount of $0.3 million in
connection with the senior notes offering. PCA used the proceeds
of this offering, together with cash on hand, to repay all of
the $150.0 million of outstanding
43/8% senior
notes that were due on August 1, 2008.
PCA holds an approximate 29% equity ownership interest in STV.
PCA did not receive any dividends from STV in 2009, 2008 or 2007.
On November 29, 2000, PCA established an on-balance sheet
securitization program for its trade accounts receivable. To
effectuate this program, PCA formed a wholly-owned limited
purpose subsidiary, Packaging Credit Company, LLC, or PCC, which
in turn formed a wholly-owned, bankruptcy-remote,
special-purpose subsidiary, Packaging Receivables Company, LLC,
or PRC, for the purpose of acquiring receivables from PCC. Both
of these entities are included in the consolidated financial
statements of PCA. Under this program, PCC purchases on an
ongoing basis substantially all of the receivables of PCA and
sells such receivables to PRC. PRC and lenders established a
$150.0 million receivables-backed revolving credit facility
through which PRC obtains funds to purchase receivables from
PCC. The receivables purchased by PRC are and will be solely the
property of PRC. In the event of a liquidation of PRC, the
creditors of PRC would be entitled to satisfy their claims from
PRC’s assets prior to any distribution to PCC or PCA.
Credit available under the receivables credit facility is on a
borrowing-base formula. As a result, the full amount of the
facility may not be available at all times. On April 15,
2009, PCA extended its receivables credit facility through
April 14, 2010. As of December 31, 2009,
$109.0 million was outstanding. The highest outstanding
principal balance under the receivables credit facility during
fiscal 2009 was $109.0 million.
On July 21, 2003, PCA closed its offering and private
placement of $150.0 million of
43/8% senior
notes due August 1, 2008 and $400.0 million of
53/4% senior
notes due August 1, 2013. On March 25, 2008, PCA
issued $150.0 million of
61/2% senior
notes due March 15, 2018 through a registered public
offering. The proceeds of this offering, together with cash on
hand, were used to repay all of the $150.0 million of
43/8% senior
notes which matured on August 1, 2008.
On March 31, 2008, PCA repaid all borrowings under its old
senior credit facility. This facility was replaced with a senior
credit facility that provides a new $150.0 million
revolving credit facility, including a $35.0 million
subfacility for letters of credit. The new senior credit
facility closed on April 15, 2008. The new revolving credit
facility is available to fund PCA’s working capital
requirements, capital expenditures and other general corporate
purposes. The new revolving credit facility will terminate in
April 2013.
21
Off-Balance
Sheet Arrangements
The Company does not have any off-balance sheet arrangements as
of December 31, 2009 that would require disclosure under
SEC FR-67, “Disclosure in Management’s Discussion and
Analysis About Off-Balance Sheet Arrangements and Aggregate
Contractual Obligations.”
Contractual
Obligations
The following table summarizes PCA’s contractual
obligations at December 31, 2009:
| |
|
|
|
|
|
|
|
|
|
|
|
|
|
|
|
|
|
|
|
|
|
|
|
Payments Due by Period
|
|
|
|
|
|
|
|
Less Than
|
|
|
|
|
|
|
|
|
More Than
|
|
|
|
|
Total
|
|
|
1 Year
|
|
|
1-3 Years
|
|
|
3-5 Years
|
|
|
5 Years
|
|
|
|
|
(In thousands)
|
|
|
|
|
Receivables credit facility
|
|
$
|
109,000
|
|
|
$
|
109,000
|
|
|
$
|
—
|
|
|
$
|
—
|
|
|
$
|
—
|
|
|
53/4% senior
notes (due August 1, 2013)
|
|
|
400,000
|
|
|
|
—
|
|
|
|
—
|
|
|
|
400,000
|
|
|
|
—
|
|
|
61/2% senior
notes (due March 15, 2018)
|
|
|
150,000
|
|
|
|
—
|
|
|
|
—
|
|
|
|
—
|
|
|
|
150,000
|
|
|
|
|
|
|
|
|
|
|
|
|
|
|
|
|
|
|
|
|
|
|
|
|
Total short-term and long-term debt
|
|
|
659,000
|
|
|
|
109,000
|
|
|
|
—
|
|
|
|
400,000
|
|
|
|
150,000
|
|
|
Capital lease obligations
|
|
|
41,287
|
|
|
|
2,202
|
|
|
|
4,404
|
|
|
|
4,404
|
|
|
|
30,277
|
|
|
Operating leases
|
|
|
108,052
|
|
|
|
28,162
|
|
|
|
42,519
|
|
|
|
19,299
|
|
|
|
18,072
|
|
|
Capital commitments
|
|
|
198,090
|
|
|
|
198,090
|
|
|
|
—
|
|
|
|
—
|
|
|
|
—
|
|
|
Purchase commitments
|
|
|
44,572
|
|
|
|
6,951
|
|
|
|
9,601
|
|
|
|
2,972
|
|
|
|
25,048
|
|
|
Letters of credit
|
|
|
18,832
|
|
|
|
18,832
|
|
|
|
—
|
|
|
|
—
|
|
|
|
—
|
|
|
Pension contributions
|
|
|
14,000
|
|
|
|
14,000
|
|
|
|
—
|
|
|
|
—
|
|
|
|
—
|
|
|
|
|
|
|
|
|
|
|
|
|
|
|
|
|
|
|
|
|
|
|
|
|
Total contractual obligations
|
|
$
|
1,083,833
|
|
|
$
|
377,237
|
|
|
$
|
56,524
|
|
|
$
|
426,675
|
|
|
$
|
223,397
|
|
|
|
|
|
|
|
|
|
|
|
|
|
|
|
|
|
|
|
|
|
|
|
The above table excludes unamortized debt discount of
$1.3 million at December 31, 2009 and interest
payments on debt outstanding. Based on interest rates in effect
and long-term debt balances outstanding as of December 31,
2009, projected contractual interest payments would be
approximately $34.9 million in 2009 and for each future
year. For the purpose of this disclosure, PCA’s variable
and fixed rate long-term debt would be replaced at maturity with
similar long-term debt and similar interest rates. This
disclosure does not attempt to predict changes in interest
rates. See Item 7A. “Quantitative and Qualitative
Disclosures About Market Risk” for the impact of changes in
interest rates on PCA’s future cash flows.
The operating lease commitments, capital commitments, purchase
commitments and letters of credit are not reflected on
PCA’s consolidated balance sheet as of December 31,
2009. See Notes 8 and 12 to the audited consolidated
financial statements for additional information. PCA currently
does not have any projections for future pension contributions
beyond 2010. See Note 6 to the audited consolidated
financial statements for additional information.
As of December 31, 2009, the Company’s expected
payment for significant contractual obligations excludes
$9.0 million of obligations for unrecognized tax benefits
because the Company cannot make a reasonably reliable estimate
of the period of cash settlement for such liability. See
Note 14 to the audited consolidated financial statements
for additional information.
PCA’s primary sources of liquidity are net cash provided by
operating activities, borrowings under PCA’s revolving
credit facility and additional borrowings under PCA’s
receivables credit facility. As of December 31, 2009, PCA
had $172.2 million in unused borrowing capacity under its
existing credit facilities, net of the impact on this borrowing
capacity of $18.8 million of outstanding letters of credit.
Currently, PCA’s primary uses of cash are for operations,
capital expenditures, debt service and declared common stock
dividends, which it expects to be able to fund from these
sources.
22
The following table provides the outstanding balances and the
weighted average interest rates as of December 31, 2009 for
PCA’s revolving credit facility, the receivables credit
facility and the senior notes:
| |
|
|
|
|
|
|
|
|
|
|
|
|
|
|
|
Balance at
|
|
|
|
|
|
Projected Annual
|
|
|
|
|
December 31,
|
|
|
Weighted Average
|
|
|
Cash Interest
|
|
|
Borrowing Arrangement
|
|
2009
|
|
|
Interest Rate
|
|
|
Payments
|
|
|
|
|
(Dollars in thousands)
|
|
|
|
|
Revolving Credit Facility
|
|
$
|
—
|
|
|
|
N/A
|
|
|
|
N/A
|
|
|
Receivables Credit Facility
|
|
|
109,000
|
|
|
|
1.97
|
|
|
$
|
2,148
|
|
|
53/4% Senior
Notes (due August 1, 2013)
|
|
|
400,000
|
|
|
|
5.75
|
|
|
|
23,000
|
|
|
61/2% Senior
Notes (due March 15, 2018)
|
|
|
150,000
|
|
|
|
6.50
|
|
|
|
9,750
|
|
|
|
|
|
|
|
|
|
|
|
|
|
|
|
|
Total
|
|
$
|
659,000
|
|
|
|
5.30
|
%
|
|
$
|
34,898
|
|
|
|
|
|
|
|
|
|
|
|
|
|
|
|
The above table excludes unamortized debt discount of
$1.3 million at December 31, 2009. It also excludes
from the projected annual cash interest payments, the non-cash
income from the annual amortization of the $22.8 million
received in July 2003 and the non-cash expense from the annual
amortization of the $4.4 million paid in March 2008 to
settle the treasury locks related to the
53/4% senior
notes due 2013 and the
61/2% senior
notes due 2018. The amortization is being recognized over the
terms of the
53/4% senior
notes due 2013 and the
61/2% senior
notes due 2018 and is included in interest expense, net.
The instruments governing PCA’s indebtedness contain
financial and other covenants that limit, among other things,
the ability of PCA and its subsidiaries to:
|
|
|
| |
•
|
enter into sale and leaseback transactions,
|
| |
| |
•
|
incur liens,
|
| |
| |
•
|
incur indebtedness at the subsidiary level,
|
| |
| |
•
|
enter into certain transactions with affiliates, or
|
| |
| |
•
|
merge or consolidate with any other person or sell or otherwise
dispose of all or substantially all of the assets of PCA.
|
These limitations could limit corporate and operating activities.
In addition, PCA must maintain minimum net worth and maximum
debt to total capitalization and minimum interest coverage
ratios under the revolving credit facility. A failure to comply
with the restrictions contained in the revolving credit facility
could lead to an event of default, which could result in an
acceleration of any outstanding indebtedness
and/or
prohibit PCA from drawing on the revolving credit facility. Such
an acceleration may also constitute an event of default under
the senior notes indentures and the receivables credit facility.
At December 31, 2009, PCA was in compliance with these
covenants.
PCA currently expects to incur capital expenditures of
$300.0 million in 2010, including up to $200.0 million
for major energy optimization projects at its Counce and
Valdosta mills. The remaining $100.0 million in
expenditures will be used primarily for maintenance capital,
cost reduction, business growth and environmental compliance.
PCA believes that net cash generated from operating activities,
available cash reserves and alternative fuel mixture tax credit
receivable, and available borrowings under its committed credit
facilities and available capital through access to capital
markets will be adequate to meet its liquidity and capital
requirements, including payments of any declared common stock
dividends, for the foreseeable future. As its debt or credit
facilities become due, PCA will need to repay, extend or replace
such facilities, which will be subject to future economic
conditions and financial, business and other factors, many of
which are beyond PCA’s control.
23
Environmental
Matters
PCA is subject to, and must comply with, a variety of federal,
state and local environmental laws, particularly those relating
to air and water quality, waste disposal and the cleanup of
contaminated soil and groundwater. The most significant of these
laws affecting the Company are:
|
|
|
| |
•
|
Resource Conservation and Recovery Act (RCRA);
|
| |
| |
•
|
Clean Water Act (CWA);
|
| |
| |
•
|
Clean Air Act (CAA);
|
| |
| |
•
|
The Emergency Planning and Community
Right-to-Know-Act
(EPCRA);
|
| |
| |
•
|
Toxic Substance Control Act (TSCA); and
|
| |
| |
•
|
Safe Drinking Water Act (SDWA).
|
PCA believes that it is currently in material compliance with
these and all applicable environmental rules and regulations.
Because environmental regulations are constantly evolving, the
Company has incurred, and will continue to incur, costs to
maintain compliance with these and other environmental laws. The
Company works diligently to anticipate and budget for the impact
of applicable environmental regulations, and does not currently
expect that future environmental compliance obligations will
materially affect its business or financial condition. For the
year ended December 31, 2009, we spent approximately
$26.4 million to comply with the requirements of these and
other environmental laws. For the years ended December 31,
2008 and 2007, the costs of environmental compliance were
approximately $23.5 million and $19.4 million,
respectively.
As is the case with any industrial operation, PCA has, in the
past, incurred costs associated with the remediation of soil or
groundwater contamination, as required by the federal
Comprehensive Environmental Response, Compensation and Liability
Act, commonly known as the federal “Superfund” law,
and analogous state laws. Cleanup requirements arise with
respect to properties the Company currently owns or operates,
former facilities and off-site facilities where the Company has
disposed of hazardous substances. As part of the April 12,
1999 transaction, Pactiv has agreed to retain all liability for
all former facilities and all sites associated with pre-closing
off-site waste disposal. Pactiv has also retained
environmentally impaired real property in Filer City, Michigan
unrelated to current mill operations.
Because liability for remediation costs under environmental laws
is strict, meaning that liability is imposed without fault,
joint and several, meaning that liability is imposed on each
party without regard to contribution, and retroactive, PCA could
receive notifications of cleanup liability in the future and
this liability could be material. From 1994 through 2009,
remediation costs at PCA’s mills and corrugated plants
totaled approximately $3.2 million. As of December 31,
2009, PCA maintained an environmental reserve of
$9.1 million relating to
on-site
landfills and surface impoundments as well as ongoing and
anticipated remedial projects. Total capital costs for
environmental matters were $0.4 million for 2009, and the
Company currently estimates 2010 environmental capital
expenditures will be $1.2 million. As of this filing, the
Company believes that it is not reasonably possible that future
environmental expenditures above the $9.1 million accrued
as of December 31, 2009 will have a material impact on its
financial condition, results of operations and cash flows.
While legislation regarding the regulation of greenhouse gas
emissions has been proposed at the federal level, it is
uncertain whether such legislation will be passed and, if so,
what the breadth and scope of such legislation will be. The
result of the regulation of greenhouse gas emissions could be an
increase in our future environmental compliance costs, through
caps, taxes or additional capital expenditures to modify
facilities, which may be material. However, climate change
legislation and the resulting future energy policy could also
provide us with opportunities if the use of renewable energy is
encouraged. We currently generate a significant portion of our
power requirements for our mills using bark, black liquor and
biomass as fuel, which are derived from renewable resources. Our
energy optimization projects at the Counce and Valdosta
linerboard mills are expected to nearly eliminate the use of
fossil fuels at those facilities by the end of 2011, while
24
providing more efficient power generation at those facilities.
While we believe we are well-positioned to take advantage of any
renewable energy incentives, it is uncertain what the ultimate
costs and opportunities of any climate change legislation will
be and how our business and industry will be affected.
Critical
Accounting Policies
Management’s discussion and analysis of PCA’s
financial condition and results of operations are based upon the
Company’s consolidated financial statements, which have
been prepared in accordance with accounting principles generally
accepted in the United States of America. The preparation of
these financial statements requires the Company to make
estimates and judgments that affect the reported amounts of
assets, liabilities, revenues and expenses, and related
disclosures of contingent assets and liabilities. On an ongoing
basis, PCA evaluates its estimates, including those related to
bad debts, inventories, goodwill and intangible assets, pensions
and other postretirement benefits, income taxes, environmental
liabilities, stock based compensation, and contingencies and
litigation. PCA bases its estimates on historical experience and
on various other assumptions that are believed to be reasonable
under the circumstances, the results of which form the basis for
making judgments about the carrying values of assets and
liabilities that are not readily apparent from other sources.
Actual results may differ from these estimates under different
assumptions or conditions.
PCA believes the following critical accounting policies affect
its more significant judgments and estimates used in the
preparation of its consolidated financial statements. For a
further discussion on the application of these and other
accounting policies, see Note 2 to its consolidated
financial statements included elsewhere in this report.
Accounts
Receivable — Allowance for Doubtful Accounts and
Customer Deductions
PCA evaluates the collectibility of its accounts receivable
based upon a combination of factors. In circumstances where the
Company is aware of a specific customer’s inability to meet
its financial obligations (e.g., bankruptcy filings, substantial
downgrading of credit sources), PCA records a specific reserve
for bad debts against amounts due to reduce the net recorded
receivable to the amount the Company reasonably believes will be
collected. For all other customers, the Company recognizes
reserves for bad debts based on its historical collection
experience. If the Company’s collection experience
deteriorates (i.e., higher than expected defaults or an
unexpected material adverse change in a major customer’s
ability to meet its financial obligations), PCA’s estimates
of the recoverability of amounts due could be reduced by a
material amount.
The customer deductions reserve represents the estimated amount
required for customer returns, allowances and earned discounts.
Based on PCA’s experience, customer returns, allowances and
earned discounts have averaged 1.0% of its gross selling price.
Accordingly, the Company reserves 1.0% of its open customer
accounts receivable balance for these items.
As of December 31, 2009, the balance in the allowance for
doubtful accounts reserve was $3.9 million, compared to
$4.4 million at December 31, 2008. Bad debt expense in
2009 was $1.5 million, compared to $4.2 million in
2008. The decrease in bad debt expense of $2.7 million was
primarily attributable to a $1.4 million decrease in
expense related to customers who had filed for bankruptcy and a
recovery of $1.4 million from one customer that had
previously filed for bankruptcy. For the year ended
December 31, 2008, bad debt expense was $4.2 million
compared to $0.1 million in 2007. The increase in bad debt
expense of $4.1 million was primarily attributable to a
$2.7 million increase in expense related to customers who
had filed for bankruptcy and an increase of $1.1 million
reserved for specific customers at the 90% level of their
accounts receivable balance as of December 31, 2008.
Inventories
PCA records its inventories at the lower of cost or market and
includes all costs directly associated with manufacturing
products: materials, labor and manufacturing overhead. The
estimated market value is based on assumptions for future demand
and related pricing. If actual market conditions are less
favorable than those projected by management, reductions in the
carrying value of inventories may be required. Raw materials,
25
work in process and finished goods valued using the
last-in,
first-out (“LIFO”) cost method comprised 62% and 64%
of inventories at current cost at December 31, 2009 and
2008, respectively. Supplies and materials inventories are
valued using a moving average cost.
Pension
and Postretirement Benefits
The Company accounts for defined benefit pension plans and
postretirement plans in accordance with Accounting Standards
Codification (“ASC”) 715,
“Compensation — Retirement Benefits.”
One of the principal assumptions used to calculate net periodic
pension cost is the expected long-term rate of return on plan
assets. The expected long-term rate of return on plan assets may
result in recognized returns that are greater or less than the
actual returns on those plan assets in any given year. Over
time, however, the expected long-term rate of return on plan
assets is designed to approximate the actual long term returns.
The discount rate assumptions used to calculate net periodic
pension and postretirement costs reflect the rates available on
high-quality, fixed-income debt instruments on December 31.
The rate of compensation increase is another significant
assumption used to calculate net periodic pension cost and is
determined by PCA based upon annual reviews.
For postretirement health care plan accounting, PCA reviews
external data and its own historical trends for health care
costs to determine the health care cost trend rate assumption.
Environmental
Liabilities
PCA accounts for its retirement obligations related to its
landfills under ASC 410, “Asset Retirement and
Environmental Obligations,” which requires legal
obligations associated with the retirement of long-lived assets
to be recognized at their fair value at the time that the
obligations are incurred. Upon initial recognition of a
liability, that cost is capitalized as part of the related
long-lived asset and amortized to expense over the useful life
of the asset.
The potential costs for various environmental matters are
uncertain due to such factors as the unknown magnitude of
possible cleanup costs, the complexity and evolving nature of
governmental laws and regulations and their interpretations, and
the timing, varying costs and effectiveness of alternative
cleanup technologies. Liabilities recorded for environmental
contingencies are estimates of the probable costs based upon
available information and assumptions. Because of these
uncertainties, however, the Company’s estimates may change.
PCA believes that any additional costs identified as further
information becomes available would not have a material effect
on its financial statements.
In connection with the sale to PCA of the containerboard and
corrugated products business of Pactiv Corporation in April
1999, Pactiv agreed to retain all liability for all former
facilities and all sites associated with off-site waste disposal
prior to April 12, 1999. Pactiv also retained the
environmental liability for a closed landfill located near the
Filer City mill.
Revenue
Recognition
PCA recognizes revenue as title to the products is transferred
to customers. Shipping and handling costs are included in cost
of sales. Shipping and handling billings to a customer are
included in net sales. In addition, PCA offers volume rebates to
certain of its customers. The total cost of these programs is
estimated and accrued as a reduction to net sales at the time of
the respective sale.
Impairment
of Goodwill and Long-Lived Assets
Goodwill is tested for impairment annually in the fourth quarter
or sooner if events or changes in circumstances indicate that
the carrying amount may exceed fair value. Recoverability of
goodwill is determined by comparing the fair value of the
reporting unit with its carrying value, including goodwill. If
the carrying amount of the reporting unit exceeds the fair
value, the implied fair value of the reporting unit’s
26
goodwill is compared to the carrying amount of its goodwill to
determine if a write-down to fair value is necessary.
Long-lived assets other than goodwill are reviewed for
impairment whenever events or changes in circumstances indicate
that the carrying amount of any long-lived asset may not be
fully recoverable. In the event that facts and circumstances
indicate that the carrying amount of any long-lived assets may
be impaired, an evaluation of recoverability would be performed.
If an evaluation were required, the estimated future
undiscounted cash flows associated with the asset (or group of
assets) would be compared to the asset’s (or group of
assets’) carrying amount to determine if a write-down to
fair value is required.
Stock-Based
Compensation
PCA measures and records stock-based compensation cost in
accordance with ASC 718, “Compensation — Stock
Compensation.” Stock compensation cost includes:
(a) compensation cost for all share-based payments granted
prior to, but not vested as of January 1, 2006, the
effective date of ASC 718, and (b) compensation costs for
all share-based payments granted subsequent to January 1,
2006. The grant date fair value is estimated in accordance with
the provisions of ASC 718.
PCA recognizes compensation expense associated with option
awards ratably over their vesting periods. The Company uses the
Black-Scholes-Merton option-pricing model to estimate the fair
value of each option grant as of the date of grant. Expected
volatilities are based on historical volatility of the
Company’s common stock. The expected life of the option is
estimated using historical data pertaining to option exercises
and employee terminations. Separate groups of employees that
have similar historical exercise behavior are considered
separately for estimating the expected life. The risk-free
interest rate is based on U.S. Treasury yields in effect at
the time of grant.
The fair value of restricted stock awards is determined based on
the closing price of PCA’s common stock on the grant date.
The Company generally recognizes compensation expense associated
with restricted stock awards ratably over their vesting periods.
As PCA’s Board of Directors has the ability to accelerate
the vesting of restricted stock upon an employee’s
retirement, the Company accelerates the recognition of
compensation expense for certain employees approaching normal
retirement age.
Income
Taxes
PCA’s annual tax rate is determined based on income,
statutory tax rates and the tax impacts of items treated
differently for tax purposes than for financial reporting
purposes. Tax law requires some items to be included in the tax
return at different times than the items reflected in the
financial statements. As a result, the annual tax rate in the
financial statements is different than the rate reported on
PCA’s tax return. Some of these differences are permanent,
such as expenses that are not deductible in the tax return, and
some differences are temporary, reversing over time, such as
depreciation expense. These temporary differences create
deferred tax assets and liabilities.
Inherent in determining the annual tax rate are judgments
regarding business plans, planning opportunities and
expectations about future outcomes. Significant management
judgments are required for the following items:
|
|
|
| |
•
|
Management reviews PCA’s deferred tax assets for
realizability. Valuation allowances are established when
management believes that it is more likely than not that some
portion of the deferred tax assets will not be realized. Changes
in valuation allowances from period to period are included in
the tax provision.
|
| |
| |
•
|
PCA establishes accruals for uncertain tax contingencies when,
despite the belief that PCA’s tax return positions are
fully supported, PCA believes that an uncertain tax position
does not meet the recognition threshold of ASC 740, “Income
Taxes.” The tax contingency accruals are adjusted in light
of changing facts and circumstances, such as the progress of tax
audits, the expiration of the statute of limitations for the
relevant taxing authority to examine a tax return, case law and
emerging legislation. While it is difficult to predict the final
outcome or timing of resolution for any particular tax matter,
PCA believes
|
27
|
|
|
| |
|
that the accruals for uncertain tax contingencies at
December 31, 2009 reflect the likely outcome of known tax
contingencies as of such date in accordance with uncertain tax
positions under ASC 740.
|
|
|
|
Item 7A.
|
QUANTITATIVE
AND QUALITATIVE DISCLOSURES ABOUT MARKET RISK
|
PCA is exposed to the impact of interest rate changes and
changes in the market value of its financial instruments. PCA
periodically enters into derivatives in order to minimize these
risks, but not for trading purposes. For a discussion of
derivatives and hedging activities, see Note 2 to
PCA’s consolidated financial statement included elsewhere
in the report.
The interest rates on approximately 84% of PCA’s debt are
fixed. A one percent increase in interest rates related to
variable rate debt would have resulted in an increase in
interest expense and a corresponding decrease in income before
taxes of $1.1 million annually. In the event of a change in
interest rates, management could take actions to mitigate its
exposure to the change. However, due to the uncertainty of the
specific actions that would be taken and their possible effects,
the sensitivity analysis assumes no changes in PCA’s
financial structure.
|
|
|
Item 8.
|
FINANCIAL
STATEMENTS AND SUPPLEMENTARY DATA
|
The response to this item is included in a separate section of
this report beginning on
page F-1,
which is incorporated by reference herein.
|
|
|
Item 9.
|
CHANGES
IN AND DISAGREEMENTS WITH ACCOUNTANTS ON ACCOUNTING AND
FINANCIAL DISCLOSURES
|
None.
|
|
|
Item 9A.
|
CONTROLS
AND PROCEDURES
|
Controls
and Procedures
PCA maintains disclosure controls and procedures (as defined in
Rule 13a-15(e)
of the Securities Exchange Act of 1934) that are designed
to provide reasonable assurance that information required to be
disclosed in PCA’s filings under the Securities Exchange
Act is recorded, processed, summarized and reported within the
periods specified in the rules and forms of the SEC and that
such information is accumulated and communicated to PCA’s
management, including its Chief Executive Officer and Chief
Financial Officer, as appropriate, to allow timely decisions
regarding required disclosure.
Prior to filing this report, PCA completed an evaluation under
the supervision and with the participation of PCA’s
management, including PCA’s Chief Executive Officer and
Chief Financial Officer, of the effectiveness of the design and
operation of PCA’s disclosure controls and procedures as of
December 31, 2009. The evaluation of PCA’s disclosure
controls and procedures included a review of the controls’
objectives and design, PCA’s implementation of the controls
and the effect of the controls on the information generated for
use in this report. Based on this evaluation, PCA’s Chief
Executive Officer and Chief Financial Officer concluded that
PCA’s disclosure controls and procedures were effective at
the reasonable assurance level as of December 31, 2009.
During the quarter ended December 31, 2009, there were no
changes in internal controls over financial reporting that have
materially affected, or are reasonably likely to materially
affect, PCA’s internal control over financial reporting.
Management’s
Report on Internal Control Over Financial Reporting
PCA’s management is responsible for establishing and
maintaining adequate internal control over financial reporting,
as such term is defined in Exchange Act
Rule 13a-15(f).
Internal control over financial reporting is a process designed
to provide reasonable assurance regarding the reliability of
financial reporting and the preparation of financial statements
for external purposes in accordance with generally accepted
accounting
28
principles. Internal control over financial reporting includes
those policies and procedures that (1) pertain to the
maintenance of records that, in reasonable detail, accurately
and fairly reflect the transactions and dispositions of the
Company’s assets; (2) provide reasonable assurance
that transactions are recorded as necessary to permit
preparation of financial statements in accordance with generally
accepted accounting principles, and that receipts and
expenditures are being made only with proper authorizations; and
(3) provide reasonable assurance regarding prevention or
timely detection of unauthorized acquisition, use, or
disposition of the Company’s assets that could have a
material effect on the financial statements.
Because of its inherent limitations, PCA’s internal control
over financial reporting may not prevent or detect
misstatements. A control system, no matter how well conceived
and operated, can provide only reasonable, not absolute,
assurance that objectives of the control system are met. Because
of the inherent limitations in all control systems, no
evaluation of controls can provide absolute assurance that all
control issues and instances of fraud, if any, have been
detected. Also, projections of any evaluation of effectiveness
to future periods are subject to the risk that controls become
inadequate because of changes in conditions, or that the degree
of compliance with the policies and procedures may deteriorate.
PCA’s management, under the supervision of and with the
participation of the Chief Executive Officer and Chief Financial
Officer, assessed the Company’s internal control over
financial reporting as of December 31, 2009, based on
criteria for effective control over financial reporting
described in “Internal Control — Integrated
Framework” issued by the Committee of Sponsoring
Organizations of the Treadway Commission. Based on this
assessment, PCA’s management concluded that its internal
control over financial reporting was effective as of
December 31, 2009, based on the specified criteria.
Ernst & Young LLP, the independent registered public
accounting firm that audited PCA’s financial statements
included in this
Form 10-K,
has also audited the effectiveness of the Company’s
internal control over financial reporting. Their attestation
report precedes PCA’s audited financial statements included
elsewhere in this report.
|
|
|
Item 9B.
|
OTHER
INFORMATION
|
None.
PART III
|
|
|
Item 10.
|
DIRECTORS,
EXECUTIVE OFFICERS AND CORPORATE GOVERNANCE
|
Information regarding PCA’s executive officers required by
this Item 10 is set forth in Item 4.1 of Part I
of this report.
The following information required by this Item 10 will be
included in PCA’s Proxy Statement for the 2010 Annual
Meeting of Stockholders and is incorporated by reference herein:
|
|
|
| |
•
|
Information regarding PCA’s directors included under the
caption “Election of Directors”
|
| |
| |
•
|
Information regarding PCA’s Audit Committee and financial
experts included under the caption “Election of
Directors — Audit Committee”
|
| |
| |
•
|
Information regarding PCA’s code of ethics included under
the caption “Election of Directors — Code of
Ethics”
|
| |
| |
•
|
Information regarding PCA’s stockholder nominating
procedures included under the captions “Election of
Directors — Nominating and Governance Committee,”
“Other Information — Recommendations for
Board — Nominated Director Nominees,” and
“Other Information — Procedures for Nominating
Directors or Bringing Business Before the 2010 Annual
Meeting”
|
| |
| |
•
|
Information regarding compliance with Section 16(a) of the
Securities Exchange Act of 1934 included under the caption
“Section 16(a) Beneficial Ownership Reporting
Compliance”
|
29
|
|
|
Item 11.
|
EXECUTIVE
COMPENSATION
|
Information with respect to executive compensation required by
this Item 11 will be included in PCA’s Proxy Statement
under the captions “Compensation Discussion and
Analysis,” “Executive Officer and Director
Compensation” (including all subcaptions and tables
thereunder) and “Board Committees — Compensation
Committee” and is incorporated herein by reference.
|
|
|
Item 12.
|
SECURITY
OWNERSHIP OF CERTAIN BENEFICIAL OWNERS AND MANAGEMENT AND
RELATED STOCKHOLDER MATTERS
|
Information with respect to security ownership of certain
beneficial owners and management required by this Item 12
will be included in PCA’s Proxy Statement under the caption
“Ownership of Our Stock” and is incorporated herein by
reference.
Authorization of Securities under Equity Compensation
Plans. Securities authorized for issuance under
equity compensation plans at December 31, 2009 are as
follows:
| |
|
|
|
|
|
|
|
|
|
|
|
|
|
|
|
|
|
|
|
|
|
Number of
|
|
|
|
|
|
|
|
|
|
|
Securities
|
|
|
|
|
Number of
|
|
|
Weighted
|
|
|
Remaining
|
|
|
|
|
Securities to
|
|
|
Average
|
|
|
Available for
|
|
|
|
|
be Issued
|
|
|
Exercise
|
|
|
Future
|
|
|
|
|
Upon Exercise of
|
|
|
Price of
|
|
|
Issuance
|
|
|
|
|
Outstanding
|
|
|
Outstanding
|
|
|
Under Equity
|
|
|
|
|
Options and
|
|
|
Options and
|
|
|
Compensation
|
|
|
Plan Category
|
|
Rights
|
|
|
Rights
|
|
|
Plans(a)
|
|
|
|
|
Equity compensation plans approved by security holders
|
|
|
1,973,301
|
|
|
$
|
20.92
|
|
|
|
2,010,817
|
|
|
Equity compensation plans not approved by security holders
|
|
|
—
|
|
|
|
—
|
|
|
|
—
|
|
|
|
|
|
|
|
|
|
|
|
|
|
|
|
|
Total
|
|
|
1,973,301
|
|
|
$
|
20.92
|
|
|
|
2,010,817
|
|
|
|
|
|
|
|
|
|
|
|
|
|
|
|
|
|
|
|
(a) |
|
Excludes securities reflected in the first column, “Number
of securities to be issued upon exercise of outstanding options
and rights.” |
|
|
|
Item 13.
|
CERTAIN
RELATIONSHIPS AND RELATED TRANSACTIONS, AND DIRECTOR
INDEPENDENCE
|
Information with respect to certain relationships and related
transactions and director independence required by this
Item 13 will be included in PCA’s Proxy Statement
under the captions “Transactions with Related Persons”
and “Election of Directors — Determination of
Director Independence,” respectively, and is incorporated
herein by reference.
|
|
|
Item 14.
|
PRINCIPAL
ACCOUNTANT FEES AND SERVICES
|
Information with respect to fees and services of the principal
accountant required by this Item 14 will be included in
PCA’s Proxy Statement under the caption “Ratification
of Appointment of the Independent Registered Public Accounting
Firm — Fees to the Independent Registered Public
Accounting Firm” and is incorporated herein by reference.
PART IV
|
|
|
Item 15.
|
EXHIBITS,
FINANCIAL STATEMENT SCHEDULES
|
(a) The following documents are filed as a part of this
report:
(1) The financial statements listed in the “Index to
Financial Statements.”
(2) Financial Statement Schedule.
30
The following consolidated financial statement schedule of PCA
for the years ended December 31, 2009, 2008 and 2007 is
included in this report.
Schedule II — Packaging Corporation of
America — Valuation and Qualifying Accounts.
| |
|
|
|
|
|
|
|
|
|
|
|
|
|
|
|
|
|
|
|
Balance
|
|
|
|
|
|
|
|
|
Balance
|
|
|
|
|
Beginning of
|
|
|
Charged to
|
|
|
|
|
|
End of
|
|
|
Description
|
|
Year
|
|
|
Expenses
|
|
|
Deductions
|
|
|
Year
|
|
|
|
|
|
|
|
(Dollars in thousands)
|
|
|
|
|
|
|
|
Year ended December 31, 2009:
|
|
|
|
|
|
|
|
|
|
|
|
|
|
|
|
|
|
Deducted from assets accounts:
|
|
|
|
|
|
|
|
|
|
|
|
|
|
|
|
|
|
Allowance for doubtful accounts
|
|
$
|
4,355
|
|
|
$
|
1,506
|
|
|
$
|
(1,952
|
)(1)
|
|
$
|
3,909
|
|
|
Reserve for customer deductions
|
|
|
2,507
|
|
|
|
22,683
|
|
|
|
(22,751
|
)(2)
|
|
|
2,439
|
|
|
|
|
|
|
|
|
|
|
|
|
|
|
|
|
|
|
|
|
Total
|
|
$
|
6,862
|
|
|
$
|
24,189
|
|
|
$
|
(24,703
|
)
|
|
$
|
6,348
|
|
|
|
|
|
|
|
|
|
|
|
|
|
|
|
|
|
|
|
|
Year ended December 31, 2008:
|
|
|
|
|
|
|
|
|
|
|
|
|
|
|
|
|
|
Deducted from assets accounts:
|
|
|
|
|
|
|
|
|
|
|
|
|
|
|
|
|
|
Allowance for doubtful accounts
|
|
$
|
2,917
|
|
|
$
|
4,162
|
|
|
$
|
(2,724
|
)(1)
|
|
$
|
4,355
|
|
|
Reserve for customer deductions
|
|
|
2,734
|
|
|
|
23,767
|
|
|
|
(23,994
|
)(2)
|
|
|
2,507
|
|
|
|
|
|
|
|
|
|
|
|
|
|
|
|
|
|
|
|
|
Total
|
|
$
|
5,651
|
|
|
$
|
27,929
|
|
|
$
|
(26,718
|
)
|
|
$
|
6,862
|
|
|
|
|
|
|
|
|
|
|
|
|
|
|
|
|
|
|
|
|
Year ended December 31, 2007:
|
|
|
|
|
|
|
|
|
|
|
|
|
|
|
|
|
|
Deducted from assets accounts:
|
|
|
|
|
|
|
|
|
|
|
|
|
|
|
|
|
|
Allowance for doubtful accounts
|
|
$
|
3,827
|
|
|
$
|
105
|
|
|
$
|
(1,015
|
)(1)
|
|
$
|
2,917
|
|
|
Reserve for customer deductions
|
|
|
2,636
|
|
|
|
24,732
|
|
|
|
(24,634
|
)(2)
|
|
|
2,734
|
|
|
|
|
|
|
|
|
|
|
|
|
|
|
|
|
|
|
|
|
Total
|
|
$
|
6,463
|
|
|
$
|
24,837
|
|
|
$
|
(25,649
|
)
|
|
$
|
5,651
|
|
|
|
|
|
|
|
|
|
|
|
|
|
|
|
|
|
|
|
|
|
|
|
(1) |
|
Consists primarily of uncollectable accounts written off, net of
recoveries, during the year. |
| |
|
(2) |
|
Consists primarily of discounts taken by customers during the
year. |
All other schedules for which provision is made in the
applicable accounting regulations of the Securities and Exchange
Commission are not required under the related instructions, are
inapplicable or not material, or the information called for
thereby is otherwise included in the financial statements or the
accompanying notes to the financial statements and therefore,
have been omitted.
| |
|
|
|
|
Exhibit
|
|
|
|
Number
|
|
Description
|
|
|
|
|
2
|
.1
|
|
Contribution Agreement, dated as of January 25, 1999, among
Pactiv Corporation (formerly known as Tenneco Packaging Inc.)
(“Pactiv”), PCA Holdings LLC (“PCA
Holdings”) and Packaging Corporation of America
(“PCA”). (Incorporated herein by reference to
Exhibit 2.1 to PCA’s registration Statement on
Form S-4,
Registration
No. 333-79511).
|
|
|
2
|
.2
|
|
Letter Agreement Amending the Contribution Agreement, dated as
of April 12, 1999, among Pactiv, PCA Holdings and PCA.
(Incorporated herein by reference to Exhibit 2.2 to
PCA’s Registration Statement on
Form S-4,
Registration
No. 333-79511).
|
|
|
3
|
.1
|
|
Restated Certificate of Incorporation of PCA. (Incorporated
herein by reference to Exhibit 3.1 to PCA’s
Registration Statement on
Form S-4,
Registration
No. 333-79511).
|
|
|
3
|
.2
|
|
Certificate of Amendment to Restated Certificate of
Incorporation of PCA. (Incorporated herein by reference to
Exhibit 3.2 to PCA’s Registration Statement on
Form S-4,
Registration
No. 333-109437.)
|
|
|
3
|
.3
|
|
Amended and Restated By-laws of PCA. (Incorporated herein by
reference to Exhibit 3.1 to PCA’s Current Report on
Form 8-K
filed December 5, 2008, File
No. 1-15399.)
|
|
|
4
|
.1
|
|
Form of certificate representing shares of common stock.
(Incorporated herein by reference to Exhibit 4.9 to
PCA’s Registration Statement on
Form S-1,
Registration
No. 333-86963.)
|
31
| |
|
|
|
|
Exhibit
|
|
|
|
Number
|
|
Description
|
|
|
|
|
4
|
.2
|
|
Indenture, dated as of July 21, 2003, between PCA and U.S.
Bank National Association. (Incorporated herein by reference to
Exhibit 4.2 to PCA’s Quarterly Report on
Form 10-Q
for the period ended June 30, 2003, File
No. 1-15399.)
|
|
|
4
|
.3
|
|
First Supplemental Indenture, dated as of July 21, 2003,
between PCA and U.S. Bank National Association. (Incorporated
herein by reference to Exhibit 4.3 to PCA’s Quarterly
Report on
Form 10-Q
for the period ended June 30, 2003, File
No. 1-15399.)
|
|
|
4
|
.4
|
|
Form of Rule 144A Global Note. (Incorporated herein by
reference to Exhibit 4.5 to PCA’s Quarterly Report on
Form 10-Q
for the period ended June 30, 2003, File
No. 1-15399.)
|
|
|
4
|
.5
|
|
Officers’ Certificate, dated March 25, 2008, pursuant
to Section 301 of the Indenture, dated July 21, 2003,
by and between PCA and U.S. Bank National Association
(Incorporated herein by reference to Exhibit 4.1 to
PCA’s Current Report on
Form 8-K
filed March 25, 2008, File
No. 1-15399.)
|
|
|
4
|
.6
|
|
6.50% Senior Notes due 2018. (Incorporated herein by
reference to Exhibit 4.2 to PCA’s Current Report on
Form 8-K
filed March 25, 2008, File
No. 1-15399.)
|
|
|
10
|
.1
|
|
Five Year Credit Agreement, dated as of April 15, 2008, by
and among PCA and the lenders and agents named therein.
(Incorporated herein by reference to Exhibit 10.1 to
PCA’s Current Report on
Form 8-K
filed April 18, 2008, File
No. 1-15399.)
|
|
|
10
|
.2
|
|
Amended and Restated Credit and Security Agreement, dated as of
September 19, 2008, by and among PCA and the lenders and
agents named therein. (Incorporated herein by reference to
Exhibit 10.1 to PCA’s Current Report on
Form 8-K
filed September 25, 2008, File
No. 1-15399.)
|
|
|
10
|
.3
|
|
Amendment No. 1 to Amended and Restated Credit and Security
Agreement, dated as of April 14, 2009, by and among PCA and
the lenders and agents named therein. (Incorporated herein by
reference to Exhibit 10.1 to PCA’s Current Report on
Form 8-K
filed April 16, 2009, File
No. 1-15399.)
|
|
|
10
|
.4
|
|
Receivables Sale Agreement, dated as of November 29, 2000,
between PCC and PCA. (Incorporated herein by reference to
Exhibit 10.24 to PCA’s Annual Report on
Form 10-K
for the fiscal year ended December 31, 2001, File
No. 1-15399.)
|
|
|
10
|
.5
|
|
Purchase and Sale Agreement, dated as of November 29, 2000,
between PCC and PRC. (Incorporated herein by reference to
Exhibit 10.25 to PCA’s Annual Report on
Form 10-K
for the fiscal year ended December 31, 2001. File
No. 1-15399)
|
|
|
10
|
.6
|
|
Not used.
|
|
|
10
|
.7
|
|
Not used.
|
|
|
10
|
.8
|
|
Packaging Corporation of America Thrift Plan for Hourly
Employees and First Amendment of Packaging Corporation of
America Thrift Plan for Hourly Employees, effective
February 1, 2000. (Incorporated herein by reference to
Exhibit 4.5 to PCA’s Registration Statement on
Form S-8,
Registration
No. 333-33176.)*
|
|
|
10
|
.9
|
|
Packaging Corporation of America Retirement Savings Plan ,
effective February 1, 2000. (Incorporated herein by
reference to Exhibit 4.6 to PCA’s Registration
Statement on
Form S-8,
Registration
No. 333-33176.)*
|
|
|
10
|
.10
|
|
Amended and Restated 1999 Long-Term Equity Incentive Plan,
effective as of May 4, 2005. (Incorporated herein by
reference to Appendix B to PCA’s Definitive Proxy
Statement on Schedule 14A, filed with the Commission on
March 24, 2005, File
No. 1-15399.)*
|
|
|
10
|
.11
|
|
Form of Stock Option Agreement for employees under the Amended
and Restated 1999 Long-term Equity Incentive Plan. (Incorporated
herein by reference to Exhibit 10.1 to PCA’s Current
Report on
Form 8-K,
dated March 14, 2006, File
No. 1-15399.)*
|
|
|
10
|
.12
|
|
Form of Stock Option Agreement for non-employee directors under
the Amended and Restated 1999 Long-term Equity Incentive Plan.
(Incorporated herein by reference to Exhibit 10.2 to
PCA’s Current Report on
Form 8-K,
dated March 14, 2006, File
No. 1-15399.)*
|
|
|
10
|
.13
|
|
Form of Restricted Stock Award Agreement for employees and
non-employee directors under the Amended and Restated 1999
Long-term Equity Incentive Plan. (Incorporated herein by
reference to Exhibit 10.3 to PCA’s Current Report on
Form 8-K,
dated March 14, 2006, File
No. 1-15399.)*
|
32
| |
|
|
|
|
Exhibit
|
|
|
|
Number
|
|
Description
|
|
|
|
|
10
|
.14
|
|
Amended and Restated 1999 Executive Incentive Compensation Plan,
effective as of July 26, 2006. (Incorporated herein by
reference to Exhibit 10.1 to PCA’s Quarterly Report on
From 10-Q
for the period ended June 30, 2006, File
No. 1-15399.)*
|
|
|
10
|
.15
|
|
Packaging Corporation of America Supplemental Executive
Retirement Plan, as Amended and Restated Effective as of
January 1, 2005. (Incorporated herein by reference to
Exhibit 10.31 to PCA’s Annual Report on
Form 10-K
for the year ended December 31, 2006, File
No. 1-15399.)*
|
|
|
10
|
.16
|
|
Packaging Corporation of America Deferred Compensation Plan,
effective as of January 1, 2009. (Incorporated herein by
reference to Exhibit 10.15 to PCA’s Annual Report on
Form 10-K
for the year ended December 31, 2008, File
No. 1-15399.)*
|
|
|
10
|
.17
|
|
Packaging Corporation of America Amended and Restated Executive
Incentive Compensation Plan, effective as of February 28,
2007. (Incorporated herein by reference to Exhibit 10.32 to
PCA’s Annual Report on
Form 10-K
for the year ended December 31, 2006, File
No. 1-15399.)*
|
|
|
10
|
.18
|
|
First Amendment of Packaging Corporation of America Supplemental
Executive Retirement Plan, effective as of January 1, 2008.
(Incorporated herein by reference to Exhibit 10.17 to
PCA’s Annual Report on
Form 10-K
for the year ended December 31, 2008, file
No. 1-15399.)*
|
|
|
10
|
.19
|
|
Amended and Restated 1999 Long-Term Equity Incentive Plan,
effective as of May 27, 2009. (Incorporated herein by
reference to Appendix A to PCA’s Definitive Proxy
Statement on Schedule 14A, filed with the Commission on
April 21, 2009, File No 1-15399.)*
|
|
|
10
|
.20
|
|
Agreement, dated August 11, 2009, between Packaging
Corporation of America and William J. Sweeney. (Incorporated
herein by reference to Exhibit 10.1 to PCA’s Current
Report on
Form 8-K
filed August 12, 2009, File
No. 1-15399.)
|
|
|
12
|
.1
|
|
Statement Regarding Computation of Ratio of Earnings to Fixed
Charges†
|
|
|
21
|
.1
|
|
Subsidiaries of the Registrant.†
|
|
|
23
|
.1
|
|
Consent of Ernst & Young LLP.†
|
|
|
24
|
.1
|
|
Powers of Attorney.†
|
|
|
31
|
.1
|
|
Certification of Chief Executive Officer, As Adopted Pursuant to
Section 302 of the Sarbanes-Oxley Act of 2002.†
|
|
|
31
|
.2
|
|
Certification of Chief Financial Officer, As Adopted Pursuant to
Section 302 of the Sarbanes-Oxley Act of 2002.†
|
|
|
32
|
.1
|
|
Certification of Chief Executive Officer Pursuant to
18 U.S.C. §1350, As Adopted Pursuant to
Section 906 of the Sarbanes-Oxley Act of 2002.†
|
|
|
32
|
.2
|
|
Certification of Chief Financial Officer Pursuant to
18 U.S.C. §1350, As Adopted Pursuant to
Section 906 of the Sarbanes-Oxley Act of 2002.†
|
|
|
|
|
* |
|
Management contract or compensatory plan or arrangement. |
| |
|
† |
|
Filed herewith. |
33
SIGNATURES
Pursuant to the requirements of Section 13 or 15(d) of the
Securities Exchange Act of 1934, the registrant has duly caused
this report to be signed on its behalf by the undersigned,
thereunto duly authorized on February 17, 2010.
Packaging Corporation of America
Name: Paul T. Stecko
|
|
|
| |
Title:
|
Chairman and Chief Executive Officer
|
Name: Richard B. West
|
|
|
| |
Title:
|
Senior Vice President and Chief Financial Officer
|
Pursuant to the requirements of the Securities Exchange Act of
1934, this report has been signed below by the following persons
on behalf of the registrant and in the capacities indicated on
February 17, 2010.
| |
|
|
|
|
|
Signature
|
|
Title
|
|
|
|
|
|
|
|
/s/ Paul
T. Stecko
Paul
T. Stecko
|
|
Chairman of the Board and Chief Executive Officer
(Principal Executive Officer)
|
|
|
|
|
|
/s/ Richard
B. West
Richard
B. West
|
|
Senior Vice President and Chief Financial Officer
(Principal Financial and Accounting Officer)
|
|
|
|
|
|
*
Cheryl
K. Beebe
|
|
Director
|
|
|
|
|
|
*
Henry
F. Frigon
|
|
Director
|
|
|
|
|
|
*
Hasan
Jameel
|
|
Director
|
|
|
|
|
|
*
Samuel
M. Mencoff
|
|
Director
|
|
|
|
|
|
*
Roger
B. Porter
|
|
Director
|
|
|
|
|
|
*
James
D. Woodrum
|
|
Director
|
|
|
|
|
*By: /s/
Richard B. West
Richard
B. West
(Attorney-In-Fact)
|
|
|
34
REPORT OF
INDEPENDENT REGISTERED PUBLIC ACCOUNTING FIRM
Packaging Corporation of America
Board of Directors and Stockholders
We have audited the accompanying consolidated balance sheets of
Packaging Corporation of America (the “Company”) as of
December 31, 2009 and 2008, and the related consolidated
statements of income, changes in stockholders’ equity, and
cash flows for each of the three years in the period ended
December 31, 2009. Our audits also included the financial
statement schedule listed in the index at Item 15(a). These
financial statements and schedule are the responsibility of the
Company’s management. Our responsibility is to express an
opinion on these financial statements and schedule based on our
audits.
We conducted our audits in accordance with the standards of the
Public Company Accounting Oversight Board (United States). Those
standards require that we plan and perform the audit to obtain
reasonable assurance about whether the financial statements are
free of material misstatement. An audit includes examining, on a
test basis, evidence supporting the amounts and disclosures in
the financial statements. An audit also includes assessing the
accounting principles used and significant estimates made by
management, as well as evaluating the overall financial
statement presentation. We believe that our audits provide a
reasonable basis for our opinion.
In our opinion, the financial statements referred to above
present fairly, in all material respects, the consolidated
financial position of Packaging Corporation of America at
December 31, 2009 and 2008, and the consolidated results of
its operations and its cash flows for each of the three years in
the period ended December 31, 2009, in conformity with
U.S. generally accepted accounting principles. Also, in our
opinion, the related financial statement schedule, when
considered in relation to the basic financial statements taken
as a whole, presents fairly, in all material respects, the
information set forth therein.
As discussed in Note 6 to the consolidated financial
statements, the Company changed its method of accounting for
pension and postretirement benefits effective December 31,
2008, and as discussed in Note 14 to the consolidated
financial statements, the Company changed its method of
accounting for uncertainty in income taxes effective
January 1, 2007.
We also have audited, in accordance with the standards of the
Public Company Accounting Oversight Board (United States),
Packaging Corporation of America’s internal control over
financial reporting as of December 31, 2009, based on
criteria established in Internal Control — Integrated
Framework issued by the Committee of Sponsoring Organizations of
the Treadway Commission and our report dated February 17,
2010 expressed an unqualified opinion thereon.
Chicago, Illinois
February 17, 2010
F-2
REPORT OF
INDEPENDENT REGISTERED PUBLIC ACCOUNTING FIRM
Packaging Corporation of America
Board of Directors and Stockholders
We have audited Packaging Corporation of America’s internal
control over financial reporting as of December 31, 2009,
based on criteria established in Internal Control —
Integrated Framework issued by the Committee of Sponsoring
Organizations of the Treadway Commission (the COSO criteria).
Packaging Corporation of America’s management is
responsible for maintaining effective internal control over
financial reporting, and for its assessment of the effectiveness
of internal control over financial reporting included in
Management’s Report on Internal Control over Financial
Reporting. Our responsibility is to express an opinion on the
company’s internal control over financial reporting based
on our audit.
We conducted our audit in accordance with the standards of the
Public Company Accounting Oversight Board (United States). Those
standards require that we plan and perform the audit to obtain
reasonable assurance about whether effective internal control
over financial reporting was maintained in all material
respects. Our audit included obtaining an understanding of
internal control over financial reporting, evaluating
management’s assessment, testing and evaluating the design
and operating effectiveness of internal control, and performing
such other procedures as we considered necessary in the
circumstances. We believe that our audit provides a reasonable
basis for our opinion.
A company’s internal control over financial reporting is a
process designed to provide reasonable assurance regarding the
reliability of financial reporting and the preparation of
financial statements for external purposes in accordance with
generally accepted accounting principles. A company’s
internal control over financial reporting includes those
policies and procedures that (1) pertain to the maintenance
of records that, in reasonable detail, accurately and fairly
reflect the transactions and dispositions of the assets of the
company; (2) provide reasonable assurance that transactions
are recorded as necessary to permit preparation of financial
statements in accordance with generally accepted accounting
principles, and that receipts and expenditures of the company
are being made only in accordance with authorizations of
management and directors of the company; and (3) provide
reasonable assurance regarding prevention or timely detection of
unauthorized acquisition, use, or disposition of the
company’s assets that could have a material effect on the
financial statements.
Because of its inherent limitations, internal control over
financial reporting may not prevent or detect misstatements.
Also, projections of any evaluation of effectiveness to future
periods are subject to the risk that controls may become
inadequate because of changes in conditions, or that the degree
of compliance with the policies or procedures may deteriorate.
In our opinion, Packaging Corporation of America maintained, in
all material respects, effective internal control over financial
reporting as of December 31, 2009, based on the COSO
criteria.
We also have audited, in accordance with the standards of the
Public Company Accounting Oversight Board (United States), the
consolidated balance sheets of Packaging Corporation of America
as of December 31, 2009 and 2008, and the related
consolidated statements of income, changes in stockholders’
equity, and cash flows for each of the three years in the period
ended December 31, 2009, and our report dated
February 17, 2010, expressed an unqualified opinion thereon.
Chicago, Illinois
February 17, 2010
F-3
Packaging
Corporation of America
As of
December 31, 2009 and 2008
| |
|
|
|
|
|
|
|
|
|
|
|
2009
|
|
|
2008
|
|
|
|
|
(In thousands, except share and per share amounts)
|
|
|
|
|
ASSETS
|
|
Current assets:
|
|
|
|
|
|
|
|
|
|
Cash and cash equivalents
|
|
$
|
260,727
|
|
|
$
|
149,397
|
|
|
Accounts receivable, net of allowance for doubtful accounts and
customer deductions of $6,348 and $6,862 as of December 31,
2009 and 2008, respectively
|
|
|
243,403
|
|
|
|
254,898
|
|
|
Inventories
|
|
|
213,396
|
|
|
|
206,954
|
|
|
Alternative fuel mixture tax credits receivable
|
|
|
127,811
|
|
|
|
—
|
|
|
Federal and state income taxes receivable
|
|
|
4,707
|
|
|
|
—
|
|
|
Prepaid expenses and other current assets
|
|
|
13,045
|
|
|
|
6,684
|
|
|
Deferred income taxes
|
|
|
22,125
|
|
|
|
15,240
|
|
|
|
|
|
|
|
|
|
|
|
|
Total current assets
|
|
|
885,214
|
|
|
|
633,173
|
|
|
Property, plant and equipment, net
|
|
|
1,182,504
|
|
|
|
1,221,019
|
|
|
Goodwill
|
|
|
38,854
|
|
|
|
37,163
|
|
|
Other intangible assets, net
|
|
|
11,790
|
|
|
|
12,669
|
|
|
Other long-term assets
|
|
|
34,478
|
|
|
|
35,717
|
|
|
|
|
|
|
|
|
|
|
|
|
Total assets
|
|
$
|
2,152,840
|
|
|
$
|
1,939,741
|
|
|
|
|
|
|
|
|
|
|
|
|
|
|
LIABILITIES AND STOCKHOLDERS’ EQUITY
|
|
Current liabilities:
|
|
|
|
|
|
|
|
|
|
Short-term debt and current maturities of long-term debt
|
|
$
|
109,000
|
|
|
$
|
109,000
|
|
|
Capital lease obligations
|
|
|
626
|
|
|
|
606
|
|
|
Accounts payable
|
|
|
126,813
|
|
|
|
101,064
|
|
|
Dividends payable
|
|
|
15,451
|
|
|
|
30,719
|
|
|
Accrued interest
|
|
|
12,644
|
|
|
|
12,723
|
|
|
Accrued federal and state income taxes
|
|
|
—
|
|
|
|
1,282
|
|
|
Accrued liabilities
|
|
|
106,423
|
|
|
|
106,588
|
|
|
|
|
|
|
|
|
|
|
|
|
Total current liabilities
|
|
|
370,957
|
|
|
|
361,982
|
|
|
Long-term liabilities:
|
|
|
|
|
|
|
|
|
|
Long-term debt
|
|
|
548,749
|
|
|
|
548,400
|
|
|
Capital lease obligations
|
|
|
22,503
|
|
|
|
23,129
|
|
|
Deferred income taxes
|
|
|
205,227
|
|
|
|
208,879
|
|
|
Pension and postretirement benefit plans
|
|
|
78,859
|
|
|
|
85,964
|
|
|
Other long-term liabilities
|
|
|
27,700
|
|
|
|
27,438
|
|
|
|
|
|
|
|
|
|
|
|
|
Total long-term liabilities
|
|
|
883,038
|
|
|
|
893,810
|
|
|
Stockholders’ equity:
|
|
|
|
|
|
|
|
|
|
Common stock (par value $.01 per share, 300,000,000 shares
authorized, 103,018,358 and 102,397,952 shares issued as of
December 31, 2009 and 2008, respectively)
|
|
|
1,030
|
|
|
|
1,024
|
|
|
Additional paid in capital
|
|
|
387,496
|
|
|
|
379,104
|
|
|
Retained earnings
|
|
|
546,355
|
|
|
|
342,072
|
|
|
Accumulated other comprehensive income (loss):
|
|
|
|
|
|
|
|
|
|
Unrealized gain on treasury lock, net
|
|
|
4,512
|
|
|
|
6,358
|
|
|
Unfunded employee benefit obligations, net
|
|
|
(40,548
|
)
|
|
|
(44,609
|
)
|
|
|
|
|
|
|
|
|
|
|
|
Total accumulated other comprehensive loss
|
|
|
(36,036
|
)
|
|
|
(38,251
|
)
|
|
|
|
|
|
|
|
|
|
|
|
Total stockholders’ equity
|
|
|
898,845
|
|
|
|
683,949
|
|
|
|
|
|
|
|
|
|
|
|
|
Total liabilities and stockholders’ equity
|
|
$
|
2,152,840
|
|
|
$
|
1,939,741
|
|
|
|
|
|
|
|
|
|
|
|
See notes to consolidated financial statements.
F-4
Packaging
Corporation of America
| |
|
|
|
|
|
|
|
|
|
|
|
|
|
|
|
Year Ended December 31,
|
|
|
|
|
2009
|
|
|
2008
|
|
|
2007
|
|
|
|
|
(In thousands, except per share amounts)
|
|
|
|
|
Net sales
|
|
$
|
2,147,589
|
|
|
$
|
2,360,493
|
|
|
$
|
2,316,006
|
|
|
Cost of sales
|
|
|
(1,721,012
|
)
|
|
|
(1,869,135
|
)
|
|
|
(1,791,358
|
)
|
|
|
|
|
|
|
|
|
|
|
|
|
|
|
|
Gross profit
|
|
|
426,577
|
|
|
|
491,358
|
|
|
|
524,648
|
|
|
Selling and administrative expenses
|
|
|
(173,445
|
)
|
|
|
(173,257
|
)
|
|
|
(169,472
|
)
|
|
Corporate overhead
|
|
|
(54,580
|
)
|
|
|
(61,030
|
)
|
|
|
(56,217
|
)
|
|
Alternative fuel mixture tax credits
|
|
|
168,437
|
|
|
|
—
|
|
|
|
—
|
|
|
Gain on sale of investment
|
|
|
—
|
|
|
|
—
|
|
|
|
1,000
|
|
|
Other expense, net
|
|
|
(14,535
|
)
|
|
|
(15,259
|
)
|
|
|
(6,507
|
)
|
|
|
|
|
|
|
|
|
|
|
|
|
|
|
|
Income from operations
|
|
|
352,454
|
|
|
|
241,812
|
|
|
|
293,452
|
|
|
Interest expense, net
|
|
|
(35,483
|
)
|
|
|
(31,669
|
)
|
|
|
(25,584
|
)
|
|
|
|
|
|
|
|
|
|
|
|
|
|
|
|
Income before taxes
|
|
|
316,971
|
|
|
|
210,143
|
|
|
|
267,868
|
|
|
Provision for income taxes
|
|
|
(51,076
|
)
|
|
|
(74,534
|
)
|
|
|
(97,802
|
)
|
|
|
|
|
|
|
|
|
|
|
|
|
|
|
|
Net income
|
|
$
|
265,895
|
|
|
$
|
135,609
|
|
|
$
|
170,066
|
|
|
|
|
|
|
|
|
|
|
|
|
|
|
|
|
Weighted average common shares outstanding
|
|
|
|
|
|
|
|
|
|
|
|
|
|
Basic
|
|
|
101,577
|
|
|
|
102,753
|
|
|
|
104,483
|
|
|
Diluted
|
|
|
102,358
|
|
|
|
103,593
|
|
|
|
105,459
|
|
|
Net income per common share
|
|
|
|
|
|
|
|
|
|
|
|
|
|
Basic
|
|
$
|
2.62
|
|
|
$
|
1.32
|
|
|
$
|
1.63
|
|
|
|
|
|
|
|
|
|
|
|
|
|
|
|
|
Diluted
|
|
$
|
2.60
|
|
|
$
|
1.31
|
|
|
$
|
1.61
|
|
|
|
|
|
|
|
|
|
|
|
|
|
|
|
|
Dividends declared per common share
|
|
$
|
0.60
|
|
|
$
|
1.20
|
|
|
$
|
1.05
|
|
|
|
|
|
|
|
|
|
|
|
|
|
|
|
See notes to consolidated financial statements.
F-5
Packaging
Corporation of America
For the
Period January 1, 2007 through December 31,
2009
| |
|
|
|
|
|
|
|
|
|
|
|
|
|
|
|
|
|
|
|
|
|
|
|
|
|
|
|
|
|
|
|
|
|
|
|
|
|
|
|
Accumulated
|
|
|
|
|
|
|
|
|
|
|
|
|
|
Additional
|
|
|
|
|
|
Other
|
|
|
Total
|
|
|
|
|
Common Stock
|
|
|
Paid in
|
|
|
Retained
|
|
|
Comprehensive
|
|
|
Stockholders’
|
|
|
|
|
Shares
|
|
|
Amount
|
|
|
Capital
|
|
|
Earnings
|
|
|
Income (Loss)
|
|
|
Equity
|
|
|
|
|
Balance at January 1, 2007
|
|
|
104,611,181
|
|
|
$
|
1,046
|
|
|
$
|
429,508
|
|
|
$
|
269,296
|
|
|
$
|
(8,079
|
)
|
|
$
|
691,771
|
|
|
Net income
|
|
|
—
|
|
|
|
—
|
|
|
|
—
|
|
|
|
170,066
|
|
|
|
—
|
|
|
|
170,066
|
|
|
Amortization of treasury lock
|
|
|
—
|
|
|
|
—
|
|
|
|
—
|
|
|
|
—
|
|
|
|
(3,108
|
)
|
|
|
(3,108
|
)
|
|
Amortization of unfunded employee benefit obligations, net of
tax of $1.2 million
|
|
|
—
|
|
|
|
—
|
|
|
|
—
|
|
|
|
—
|
|
|
|
1,820
|
|
|
|
1,820
|
|
|
|
|
|
|
|
|
|
|
|
|
|
|
|
|
|
|
|
|
|
|
|
|
|
|
|
|
Total comprehensive income
|
|
|
|
|
|
|
|
|
|
|
|
|
|
|
|
|
|
|
|
|
|
|
168,778
|
|
|
Adoption of FIN 48
|
|
|
—
|
|
|
|
—
|
|
|
|
—
|
|
|
|
5,103
|
|
|
|
—
|
|
|
|
5,103
|
|
|
Unfunded employee benefit obligations, net of tax of
$1.4 million
|
|
|
—
|
|
|
|
—
|
|
|
|
—
|
|
|
|
—
|
|
|
|
2,202
|
|
|
|
2,202
|
|
|
Exercise of stock options
|
|
|
1,260,768
|
|
|
|
13
|
|
|
|
25,060
|
|
|
|
—
|
|
|
|
—
|
|
|
|
25,073
|
|
|
Common stock repurchases and retirements
|
|
|
(1,088,200
|
)
|
|
|
(11
|
)
|
|
|
(30,517
|
)
|
|
|
—
|
|
|
|
—
|
|
|
|
(30,528
|
)
|
|
Common stock dividends declared
|
|
|
—
|
|
|
|
—
|
|
|
|
—
|
|
|
|
(110,405
|
)
|
|
|
—
|
|
|
|
(110,405
|
)
|
|
Restricted stock grants and cancellations
|
|
|
234,930
|
|
|
|
2
|
|
|
|
447
|
|
|
|
—
|
|
|
|
—
|
|
|
|
449
|
|
|
Share-based compensation expense
|
|
|
—
|
|
|
|
—
|
|
|
|
8,418
|
|
|
|
—
|
|
|
|
—
|
|
|
|
8,418
|
|
|
|
|
|
|
|
|
|
|
|
|
|
|
|
|
|
|
|
|
|
|
|
|
|
|
|
|
Balance at December 31, 2007
|
|
|
105,018,679
|
|
|
|
1,050
|
|
|
|
432,916
|
|
|
|
334,060
|
|
|
|
(7,165
|
)
|
|
|
760,861
|
|
|
Net income
|
|
|
—
|
|
|
|
—
|
|
|
|
—
|
|
|
|
135,609
|
|
|
|
—
|
|
|
|
135,609
|
|
|
Amortization of treasury lock
|
|
|
—
|
|
|
|
—
|
|
|
|
—
|
|
|
|
—
|
|
|
|
(2,407
|
)
|
|
|
(2,407
|
)
|
|
Amortization of unfunded employee benefit obligations, net of
tax of $1.3 million
|
|
|
—
|
|
|
|
—
|
|
|
|
—
|
|
|
|
—
|
|
|
|
1,975
|
|
|
|
1,975
|
|
|
Settlement of treasury lock
|
|
|
—
|
|
|
|
—
|
|
|
|
—
|
|
|
|
—
|
|
|
|
(4,386
|
)
|
|
|
(4,386
|
)
|
|
Foreign currency translation adjustment
|
|
|
—
|
|
|
|
—
|
|
|
|
—
|
|
|
|
—
|
|
|
|
3
|
|
|
|
3
|
|
|
|
|
|
|
|
|
|
|
|
|
|
|
|
|
|
|
|
|
|
|
|
|
|
|
|
|
Total comprehensive income
|
|
|
|
|
|
|
|
|
|
|
|
|
|
|
|
|
|
|
|
|
|
|
130,794
|
|
|
Effects of changing the pension and postretirement benefit plans
measurement date pursuant to SFAS No. 158:
|
|
|
|
|
|
|
|
|
|
|
|
|
|
|
|
|
|
|
|
|
|
|
|
|
|
Service cost, interest cost and expected return on plan assets
for October 1 — December 31, 2007, net of tax of
$1.8 million
|
|
|
—
|
|
|
|
—
|
|
|
|
—
|
|
|
|
(2,884
|
)
|
|
|
—
|
|
|
|
(2,884
|
)
|
|
Amortization of prior service cost and net loss for October
1 — December 31, 2007, net of tax of
$0.3 million
|
|
|
—
|
|
|
|
—
|
|
|
|
—
|
|
|
|
(494
|
)
|
|
|
494
|
|
|
|
—
|
|
|
Unfunded employee benefit obligations, net of tax of
$17.0 million
|
|
|
—
|
|
|
|
—
|
|
|
|
—
|
|
|
|
—
|
|
|
|
(26,765
|
)
|
|
|
(26,765
|
)
|
|
Exercise of stock options
|
|
|
152,313
|
|
|
|
1
|
|
|
|
3,212
|
|
|
|
—
|
|
|
|
—
|
|
|
|
3,213
|
|
|
Common stock repurchases and retirements
|
|
|
(3,142,600
|
)
|
|
|
(31
|
)
|
|
|
(65,635
|
)
|
|
|
—
|
|
|
|
—
|
|
|
|
(65,666
|
)
|
|
Common stock dividends declared
|
|
|
—
|
|
|
|
—
|
|
|
|
—
|
|
|
|
(124,219
|
)
|
|
|
—
|
|
|
|
(124,219
|
)
|
|
Restricted stock grants and cancellations
|
|
|
369,560
|
|
|
|
4
|
|
|
|
(84
|
)
|
|
|
—
|
|
|
|
—
|
|
|
|
(80
|
)
|
|
Share-based compensation expense
|
|
|
—
|
|
|
|
—
|
|
|
|
8,695
|
|
|
|
—
|
|
|
|
—
|
|
|
|
8,695
|
|
|
|
|
|
|
|
|
|
|
|
|
|
|
|
|
|
|
|
|
|
|
|
|
|
|
|
|
Balance at December 31, 2008
|
|
|
102,397,952
|
|
|
|
1,024
|
|
|
|
379,104
|
|
|
|
342,072
|
|
|
|
(38,251
|
)
|
|
|
683,949
|
|
|
Net income
|
|
|
—
|
|
|
|
—
|
|
|
|
—
|
|
|
|
265,895
|
|
|
|
—
|
|
|
|
265,895
|
|
|
Amortization of treasury lock
|
|
|
—
|
|
|
|
—
|
|
|
|
—
|
|
|
|
—
|
|
|
|
(1,846
|
)
|
|
|
(1,846
|
)
|
|
Amortization of unfunded employee benefit obligations, net of
tax of $2.2 million
|
|
|
—
|
|
|
|
—
|
|
|
|
—
|
|
|
|
—
|
|
|
|
3,304
|
|
|
|
3,304
|
|
|
|
|
|
|
|
|
|
|
|
|
|
|
|
|
|
|
|
|
|
|
|
|
|
|
|
|
Total comprehensive income
|
|
|
|
|
|
|
|
|
|
|
|
|
|
|
|
|
|
|
|
|
|
|
267,353
|
|
|
Unfunded employee benefit obligations, net of tax of
$0.5 million
|
|
|
—
|
|
|
|
—
|
|
|
|
—
|
|
|
|
—
|
|
|
|
757
|
|
|
|
757
|
|
|
Exercise of stock options
|
|
|
185,801
|
|
|
|
2
|
|
|
|
2,243
|
|
|
|
—
|
|
|
|
—
|
|
|
|
2,245
|
|
|
Common stock dividends declared
|
|
|
—
|
|
|
|
—
|
|
|
|
—
|
|
|
|
(61,612
|
)
|
|
|
—
|
|
|
|
(61,612
|
)
|
|
Restricted stock grants and cancellations
|
|
|
434,605
|
|
|
|
4
|
|
|
|
(222
|
)
|
|
|
—
|
|
|
|
—
|
|
|
|
(218
|
)
|
|
Share-based compensation expense
|
|
|
—
|
|
|
|
—
|
|
|
|
6,371
|
|
|
|
—
|
|
|
|
—
|
|
|
|
6,371
|
|
|
|
|
|
|
|
|
|
|
|
|
|
|
|
|
|
|
|
|
|
|
|
|
|
|
|
|
Balance at December 31, 2009
|
|
|
103,018,358
|
|
|
$
|
1,030
|
|
|
$
|
387,496
|
|
|
$
|
546,355
|
|
|
$
|
(36,036
|
)
|
|
$
|
898,845
|
|
|
|
|
|
|
|
|
|
|
|
|
|
|
|
|
|
|
|
|
|
|
|
|
|
|
|
See notes to consolidated financial statements.
F-6
Packaging
Corporation of America
| |
|
|
|
|
|
|
|
|
|
|
|
|
|
|
|
Year Ended December 31,
|
|
|
|
|
2009
|
|
|
2008
|
|
|
2007
|
|
|
|
|
(In thousands)
|
|
|
|
|
Cash Flows from Operating Activities:
|
|
|
|
|
|
|
|
|
|
|
|
|
|
Net income
|
|
$
|
265,895
|
|
|
$
|
135,609
|
|
|
$
|
170,066
|
|
|
Adjustments to reconcile net income to net cash provided by
operating activities:
|
|
|
|
|
|
|
|
|
|
|
|
|
|
Depreciation, depletion and amortization
|
|
|
151,217
|
|
|
|
147,769
|
|
|
|
148,091
|
|
|
Amortization of financing costs
|
|
|
772
|
|
|
|
685
|
|
|
|
687
|
|
|
Amortization of net gain on treasury lock
|
|
|
(1,846
|
)
|
|
|
(2,407
|
)
|
|
|
(3,108
|
)
|
|
Share-based compensation expense
|
|
|
7,261
|
|
|
|
8,695
|
|
|
|
8,418
|
|
|
Deferred income tax provision
|
|
|
(13,819
|
)
|
|
|
(10,814
|
)
|
|
|
(11,024
|
)
|
|
Loss on disposals of property, plant and equipment
|
|
|
6,605
|
|
|
|
5,825
|
|
|
|
4,130
|
|
|
Excess tax benefits from share-based awards
|
|
|
—
|
|
|
|
—
|
|
|
|
412
|
|
|
Alternative fuel mixture tax credits receivable
|
|
|
(127,811
|
)
|
|
|
—
|
|
|
|
—
|
|
|
Changes in operating assets and liabilities (net of effects of
acquisitions):
|
|
|
|
|
|
|
|
|
|
|
|
|
|
(Increase) decrease in assets —
|
|
|
|
|
|
|
|
|
|
|
|
|
|
Accounts receivable
|
|
|
13,602
|
|
|
|
21,023
|
|
|
|
(12,724
|
)
|
|
Inventories
|
|
|
(5,498
|
)
|
|
|
(2,598
|
)
|
|
|
(8,494
|
)
|
|
Prepaid expenses and other current assets
|
|
|
(9,458
|
)
|
|
|
(8
|
)
|
|
|
(292
|
)
|
|
Increase (decrease) in liabilities —
|
|
|
|
|
|
|
|
|
|
|
|
|
|
Accounts payable
|
|
|
22,475
|
|
|
|
(31,133
|
)
|
|
|
12,800
|
|
|
Accrued liabilities
|
|
|
4,764
|
|
|
|
(9,855
|
)
|
|
|
691
|
|
|
Other, net
|
|
|
(8,028
|
)
|
|
|
6,531
|
|
|
|
(9,504
|
)
|
|
|
|
|
|
|
|
|
|
|
|
|
|
|
|
Net cash provided by operating activities
|
|
|
306,131
|
|
|
|
269,322
|
|
|
|
300,149
|
|
|
|
|
|
|
|
|
|
|
|
|
|
|
|
|
Cash Flows from Investing Activities:
|
|
|
|
|
|
|
|
|
|
|
|
|
|
Additions to property, plant and equipment
|
|
|
(114,197
|
)
|
|
|
(132,972
|
)
|
|
|
(113,446
|
)
|
|
Additions to other long term assets
|
|
|
(2,105
|
)
|
|
|
(3,267
|
)
|
|
|
(1,859
|
)
|
|
Acquisition of business, net of cash acquired
|
|
|
(3,136
|
)
|
|
|
—
|
|
|
|
—
|
|
|
Proceeds from disposals of property, plant and equipment
|
|
|
114
|
|
|
|
1,703
|
|
|
|
1,118
|
|
|
Proceeds from sale of investment
|
|
|
—
|
|
|
|
—
|
|
|
|
1,000
|
|
|
|
|
|
|
|
|
|
|
|
|
|
|
|
|
Net cash used for investing activities
|
|
|
(119,324
|
)
|
|
|
(134,536
|
)
|
|
|
(113,187
|
)
|
|
|
|
|
|
|
|
|
|
|
|
|
|
|
|
Cash Flows from Financing Activities:
|
|
|
|
|
|
|
|
|
|
|
|
|
|
Proceeds from long-term debt
|
|
|
—
|
|
|
|
149,939
|
|
|
|
—
|
|
|
Payments on long-term debt
|
|
|
(606
|
)
|
|
|
(170,320
|
)
|
|
|
(10,149
|
)
|
|
Financing costs paid
|
|
|
—
|
|
|
|
(1,176
|
)
|
|
|
—
|
|
|
Settlement of treasury lock
|
|
|
—
|
|
|
|
(4,386
|
)
|
|
|
—
|
|
|
Common stock dividends paid
|
|
|
(76,898
|
)
|
|
|
(125,057
|
)
|
|
|
(105,048
|
)
|
|
Repurchases of common stock
|
|
|
—
|
|
|
|
(65,666
|
)
|
|
|
(30,528
|
)
|
|
Proceeds from exercise of stock options
|
|
|
1,615
|
|
|
|
2,410
|
|
|
|
20,336
|
|
|
Excess tax benefits from share-based awards
|
|
|
412
|
|
|
|
724
|
|
|
|
4,733
|
|
|
|
|
|
|
|
|
|
|
|
|
|
|
|
|
Net cash used for financing activities
|
|
|
(75,477
|
)
|
|
|
(213,532
|
)
|
|
|
(120,656
|
)
|
|
|
|
|
|
|
|
|
|
|
|
|
|
|
|
Net increase (decrease) in cash and cash equivalents
|
|
|
111,330
|
|
|
|
(78,746
|
)
|
|
|
66,306
|
|
|
Cash and cash equivalents, beginning of year
|
|
|
149,397
|
|
|
|
228,143
|
|
|
|
161,837
|
|
|
|
|
|
|
|
|
|
|
|
|
|
|
|
|
Cash and cash equivalents, end of year
|
|
$
|
260,727
|
|
|
$
|
149,397
|
|
|
$
|
228,143
|
|
|
|
|
|
|
|
|
|
|
|
|
|
|
|
See notes to consolidated financial statements.
F-7
Packaging
Corporation of America
December 31,
2009
|
|
|
1.
|
BASIS OF
PRESENTATION AND NATURE OF BUSINESS
|
Packaging Corporation of America (“PCA” or the
“Company”) was incorporated on January 25, 1999.
On April 12, 1999, PCA acquired the containerboard and
corrugated packaging products business of Pactiv Corporation
(“Pactiv”), formerly known as Tenneco Packaging Inc.,
a wholly owned subsidiary of Tenneco Inc. PCA had no operations
from the date of incorporation on January 25, 1999 to
April 11, 1999.
The Company is comprised of mills and corrugated manufacturing
operations. The mill operations (the “Mills”) consist
of two kraft linerboard mills located in Counce, Tennessee, and
Valdosta, Georgia, and two medium mills located in Filer City,
Michigan, and Tomahawk, Wisconsin. The Company leased the
cutting rights to approximately 91,000 acres of timberland
as of December 31, 2009. The Mills transfer the majority of
their containerboard produced to PCA’s corrugated products
plants.
PCA’s corrugated manufacturing operations consist of 68
plants, with 40 operating as combining operations, or corrugated
plants, and 28 as sheet plants; a technical and development
center; six graphic design centers; a rotogravure printing
operation and a complement of packaging supplies and
distribution centers. All plants are located in the continental
United States. Corrugated plants combine linerboard and medium
into sheets that are converted into corrugated shipping
containers,
point-of-sale
graphics packaging,
point-of-purchase
displays and other specialized packaging. Sheet plants purchase
sheets primarily from PCA corrugated products plants to use in
the finished corrugated products converting process. The
corrugated manufacturing operations sell to diverse customers
primarily in North America.
As of December 31, 2009, PCA had approximately
8,000 employees. Approximately 2,400 of these employees
were salaried and approximately 5,600 were hourly. Approximately
75% of its hourly employees are represented by unions. The
majority of its unionized employees are represented primarily by
the United Steel Workers (USW), the International Brotherhood of
Teamsters (IBT), and the International Association of Machinists
(IAM).
Based on an agreement reached with the USW in August 2008, the
existing labor agreements at PCA’s containerboard mills
covering USW-represented employees (89% of mill hourly
workforce) were extended five years. With this extension, the
USW contracts at the Company’s mills are currently set to
expire between September 2013 and June 2015. Agreements with
other union mill employees (11% of mill hourly workforce) expire
between June 2012 and October 2014. Based on an agreement
reached with the USW in April 2009, the labor agreement at 25
corrugated plants covering USW represented employees was
extended up to five years. Contracts for unionized corrugated
products plant employees expire between March 2010 and December
2014. The Company is currently in negotiations to renew or
extend any union contracts that have recently expired or are
expiring in the near future.
|
|
|
2.
|
SUMMARY
OF SIGNIFICANT ACCOUNTING POLICIES
|
Basis
of Consolidation
The accompanying consolidated financial statements of PCA
include all majority-owned subsidiaries. All intercompany
transactions have been eliminated. The Company has one joint
venture that is accounted for under the equity method.
Use of
Estimates
The preparation of financial statements in conformity with
U.S. generally accepted accounting principles requires
management to make estimates and assumptions that affect the
amounts in the financial statements and the accompanying notes.
Actual results could differ from those estimates.
F-8
Packaging
Corporation of America
Notes to
Consolidated Financial Statements (Continued)
December 31,
2009
Cash
and Cash Equivalents
Cash and cash equivalents include all cash balances and highly
liquid investments with a maturity, when acquired, of three
months or less. Cash equivalents are stated at cost, which
approximates market.
Accounts
Receivable
The collectibility of PCA’s accounts receivable is based
upon a combination of factors. In circumstances where a specific
customer is unable to meet its financial obligations to PCA
(e.g., bankruptcy filings, substantial downgrading of credit
sources), a specific reserve for bad debts is recorded against
amounts due to the Company to reduce the net recorded receivable
to the amount the Company reasonably believes will be collected.
For all other customers, reserves for bad debts are recognized
based on historical collection experience. If collection
experience deteriorates (i.e., higher than expected defaults or
an unexpected material adverse change in a major customer’s
ability to meet its financial obligations to us), the estimate
of the recoverability of amounts due could be reduced by a
material amount.
The customer deductions reserve represents the estimated amount
required for customer returns, allowances and earned discounts.
Based on the Company’s experience, customer returns,
allowances and earned discounts have averaged 1.0% of gross
selling price. Accordingly, PCA reserves 1.0% of its open
customer accounts receivable balance for these items.
At December 31, 2009 and 2008, the allowance for doubtful
accounts was $3.9 million and $4.4 million,
respectively. The reserve for customer deductions of
$2.4 million and $2.5 million at December 31,
2009 and 2008, respectively, are also included as a reduction of
the accounts receivable balance.
Inventories
With the exception of inventories at PCA’s Chicago
corrugated products plants, which were acquired in 2004 and
2009, raw materials, work in process and finished goods are
valued using the
last-in,
first-out (“LIFO”) cost method. Inventories at the
Chicago plants are valued at the
first-in,
first-out (“FIFO”) cost method. Supplies and materials
are valued using a moving average cost. All inventories are
stated at the lower of cost or market and include all costs
directly associated with manufacturing products: materials,
labor and manufacturing overhead. Inventories valued using the
LIFO method totaled $169.2 million and $173.5 million,
respectively, as of December 31, 2009 and 2008, compared to
total inventory values (before the LIFO inventory reserve) of
$275.9 million and $272.8 million for the same
respective periods.
The components of inventories are as follows:
| |
|
|
|
|
|
|
|
|
|
|
|
December 31,
|
|
|
|
|
2009
|
|
|
2008
|
|
|
|
|
(In thousands)
|
|
|
|
|
Raw materials
|
|
$
|
101,429
|
|
|
$
|
106,165
|
|
|
Work in process
|
|
|
6,600
|
|
|
|
6,560
|
|
|
Finished goods
|
|
|
66,994
|
|
|
|
65,213
|
|
|
Supplies and materials
|
|
|
100,919
|
|
|
|
94,849
|
|
|
|
|
|
|
|
|
|
|
|
|
Inventories at FIFO or average cost
|
|
|
275,942
|
|
|
|
272,787
|
|
|
Excess of FIFO or average cost over LIFO cost
|
|
|
(62,546
|
)
|
|
|
(65,833
|
)
|
|
|
|
|
|
|
|
|
|
|
|
Inventories, net
|
|
$
|
213,396
|
|
|
$
|
206,954
|
|
|
|
|
|
|
|
|
|
|
|
F-9
Packaging
Corporation of America
Notes to
Consolidated Financial Statements (Continued)
December 31,
2009
Property,
Plant and Equipment
Property, plant and equipment are recorded at cost, and consist
of the following:
| |
|
|
|
|
|
|
|
|
|
|
|
December 31,
|
|
|
|
|
2009
|
|
|
2008
|
|
|
|
|
(In thousands)
|
|
|
|
|
Land and land improvements
|
|
$
|
98,066
|
|
|
$
|
98,943
|
|
|
Buildings
|
|
|
341,344
|
|
|
|
335,125
|
|
|
Machinery and equipment
|
|
|
2,665,876
|
|
|
|
2,588,996
|
|
|
Construction in progress
|
|
|
53,006
|
|
|
|
50,310
|
|
|
Other
|
|
|
25,322
|
|
|
|
26,459
|
|
|
|
|
|
|
|
|
|
|
|
|
Property, plant and equipment, at cost
|
|
|
3,183,614
|
|
|
|
3,099,833
|
|
|
Less accumulated depreciation
|
|
|
(2,001,110
|
)
|
|
|
(1,878,814
|
)
|
|
|
|
|
|
|
|
|
|
|
|
Property, plant and equipment, net
|
|
$
|
1,182,504
|
|
|
$
|
1,221,019
|
|
|
|
|
|
|
|
|
|
|
|
The amount of interest capitalized related to construction in
progress was $0.9 million, $1.3 million and
$1.0 million for the years ended December 31, 2009,
2008 and 2007, respectively.
Depreciation is computed on the straight-line basis over the
estimated useful lives of the related assets. Assets under
capital leases are depreciated on the straight-line method over
the term of the lease or the useful life, if shorter. The
following lives are used for the various categories of assets:
| |
|
|
|
|
|
Buildings and land improvements
|
|
|
5 to 40 years
|
|
|
Machinery and equipment
|
|
|
3 to 25 years
|
|
|
Trucks and automobiles
|
|
|
3 to 10 years
|
|
|
Furniture and fixtures
|
|
|
3 to 20 years
|
|
|
Computers and hardware
|
|
|
3 to 7 years
|
|
|
Leasehold improvements
|
|
|
Period of the lease or
useful life, if shorter
|
|
The amount of depreciation expense was $148.2 million,
$143.3 million and $144.6 million for the years ended
December 31, 2009, 2008 and 2007, respectively.
Expenditures for repairs and maintenance are expensed as
incurred.
Pursuant to the terms of an industrial revenue bond, title to
certain property, plant and equipment was transferred to a
municipal development authority in order to receive a property
tax abatement. The title of these assets will revert back to PCA
upon retirement or cancellation of the bond. The assets are
included in the consolidated balance sheet under the caption
“Property, plant and equipment, net” as all risks and
rewards remain with the Company.
Goodwill
and Intangible Assets
The Company has capitalized certain intangible assets, primarily
customer lists and relationships, covenants not to compete and
goodwill, based on their estimated fair value at the date of
acquisition. Amortization is provided for customer lists and
relationships on a straight-line basis over periods ranging from
six to 40 years. Covenants not to compete are amortized on
a straight-line basis over the terms of the respective
agreements. Goodwill, which amounted to $38.9 million and
$37.2 million as of December 31, 2009 and 2008,
respectively, is not being amortized but is subject to annual
impairment tests in accordance with Accounting Standards
Codification (“ASC”) 350,
“Intangibles — Goodwill and Other.” The
Company
F-10
Packaging
Corporation of America
Notes to
Consolidated Financial Statements (Continued)
December 31,
2009
performs the impairment tests in the fourth quarter or sooner if
events or changes in circumstances indicate that the carrying
amount may exceed fair value. Recoverability of goodwill is
determined by comparing the fair value of the reporting unit
with its carrying value, including goodwill. If the carrying
amount of the reporting unit exceeds the fair value, the implied
fair value of the reporting unit’s goodwill is compared to
the carrying amount of its goodwill to determine if a write-down
to fair value is necessary. The Company concluded that no
impairment of goodwill existed at the time of the annual
impairment tests in 2009, 2008 and 2007.
Other
Long-Term Assets
PCA has capitalized certain costs related to obtaining its
financing. These costs are amortized to interest expense using
the effective interest rate method over the terms of the senior
credit facilities and senior notes, which range from five to ten
years. Unamortized deferred financing costs were
$1.8 million and $2.4 million as of December 31,
2009 and 2008, respectively.
PCA leases the cutting rights to approximately 91,000 acres
of timberland and capitalizes the annual lease payments and
reforestation costs associated with these leases. These costs
are recorded as depletion when timber is harvested and used in
PCA’s business operations or sold to customers. Capitalized
long-term lease costs were $22.9 million and
$22.1 million as of December 31, 2009 and 2008,
respectively. The amount of depletion expense was
$1.2 million, $1.4 million and $1.5 million for
the years ended December 31, 2009, 2008 and 2007,
respectively.
PCA capitalizes certain costs related to the purchase and
development of software which is used in its business
operations. The costs attributable to these software systems are
amortized over their estimated useful lives based on various
factors such as the effects of obsolescence, technology and
other economic factors. Net capitalized software costs were
$1.5 million and $1.8 million as of December 31,
2009 and 2008, respectively. Software amortization expense was
$0.5 million, $0.3 million and $0.4 million for
the years ended December 31, 2009, 2008 and 2007,
respectively.
Impairment
of Long-Lived Assets
Long-lived assets other than goodwill are reviewed for
impairment in accordance with provisions of ASC 360,
“Property, Plant and Equipment.” In the event that
facts and circumstances indicate that the carrying amount of any
long-lived assets may be impaired, an evaluation of
recoverability would be performed. If an evaluation is required,
the estimated future undiscounted cash flows associated with the
asset (or group of assets) would be compared to the asset’s
(or group of assets’) carrying amount to determine if a
write-down to fair value is required. The Company concluded that
no impairment of long-lived assets existed in 2009, 2008 and
2007.
Pension
and Postretirement Benefits
One of the principal assumptions used to calculate net periodic
pension cost is the expected long-term rate of return on plan
assets. The expected long-term rate of return on plan assets may
result in recognized returns that are greater or less than the
actual returns on those plan assets in any given year. Over
time, however, the expected long-term rate of return on plan
assets is designed to approximate the actual long term returns.
The discount rate assumptions used to calculate net periodic
pension and postretirement cost reflect the rates available on
high-quality, fixed-income debt instruments on
December 31st of each year. The rate of compensation
increase is another significant assumption used to calculate net
periodic pension cost and is determined by the Company based
upon annual reviews.
F-11
Packaging
Corporation of America
Notes to
Consolidated Financial Statements (Continued)
December 31,
2009
For postretirement health care plan accounting, the Company
reviews external data and its own historical trends for health
care costs to determine the health care cost trend rate
assumption.
Environmental
Matters
Environmental expenditures related to existing conditions
resulting from past or current operations from which no current
or future benefit is discernible are expensed as incurred.
Environmental expenditures that extend the life of the related
property or mitigate or prevent future environmental
contamination are capitalized. Liabilities are recorded for
environmental contingencies when such costs are probable and
reasonably estimable. These liabilities are adjusted as further
information develops or circumstances change.
Asset
Retirement Obligations
The Company accounts for its retirement obligations related to
its landfills under ASC 410, “Asset Retirement and
Environmental Obligations,” which requires legal
obligations associated with the retirement of long-lived assets
to be recognized at their fair value at the time that the
obligations are incurred. Upon initial recognition of a
liability, that cost is capitalized as part of the related
long-lived asset and amortized to expense over the useful life
of the asset.
Income
Taxes
PCA utilizes the liability method of accounting for income taxes
whereby it recognizes deferred tax assets and liabilities for
the future tax consequences of temporary differences between the
tax basis of assets and liabilities and their reported amounts
in the financial statements. Deferred tax assets will be reduced
by a valuation allowance if, based upon management’s
estimates, it is more likely than not, that a portion of the
deferred tax assets will not be realized in a future period. The
estimates utilized in the recognition of deferred tax assets are
subject to revision in future periods based on new facts or
circumstances.
PCA’s practice is to recognize interest and penalties
related to uncertain tax positions in income tax expense.
Fair
Value of Financial Instruments
PCA measures the fair value of its financial instruments in
accordance with ASC 820, “Fair Value Measurements and
Disclosures.” The guidance defines fair value as the price
that would be received to sell an asset or paid to transfer a
liability in an orderly transaction between market participants.
It is determined based on assumptions that market participants
would use in pricing an asset or liability. As a basis for
considering such assumptions, ASC 820 establishes the following
hierarchy that prioritizes the inputs to valuation methodologies
used to measure fair value:
Level 1 — Valuations based on quoted prices for
identical assets and liabilities in active markets.
Level 2 — Valuations based on observable inputs
other than quoted prices included in Level 1, such as
quoted prices for similar assets and liabilities in active
markets, quoted prices for identical or similar assets and
liabilities in markets that are not active, or other inputs that
are observable or can be corroborated by observable market data.
Level 3 — Valuations based on unobservable inputs
in which there is little or no market data, which require the
reporting entity to develop its own assumptions.
The Company measures the fair value of money market funds based
on quoted prices in active markets for identical assets or
liabilities. See Note 6 for information about PCA’s
pension plans’ assets measured at fair value.
F-12
Packaging
Corporation of America
Notes to
Consolidated Financial Statements (Continued)
December 31,
2009
Planned
Major Maintenance Activities
The Company accounts for its planned major maintenance
activities in accordance with ASC 360, “Property, Plant,
and Equipment,” using the deferral method. All maintenance
costs incurred during the year are expensed in the fiscal year
in which the maintenance activity occurs.
Revenue
Recognition
The Company recognizes revenue as title to the products is
transferred to customers. Shipping and handling billings to a
customer are included in net sales. Shipping and handling costs
are included in cost of sales. In addition, the Company offers
volume rebates to certain of its customers. The total cost of
these programs is estimated and accrued as a reduction to net
sales at the time of the respective sale.
Research
and Development
Research and development costs are expensed as incurred. The
amount charged to expense was $9.4 million,
$8.3 million and $7.6 million for the years ended
December 31, 2009, 2008 and 2007, respectively.
Interest
Expense, Net
Interest expense, net, includes interest income of
$0.1 million, $5.2 million and $9.5 million for
the years ended December 31, 2009, 2008 and 2007,
respectively, and amortization of the net gain on treasury lock
settlements in July 2003 and March 2008 of $1.8 million,
$2.4 million and $3.1 million in 2009, 2008 and 2007,
respectively.
Industry
Agreements
PCA regularly trades containerboard with other manufacturers
primarily to reduce shipping costs. Containerboard trade
agreements are a long-standing industry practice. These
agreements are entered into on an annual basis, in which both
parties agree to ship an identical number of tons to each other
within the agreement period. These agreements minimize
transportation cost by allowing each party’s containerboard
mills to ship containerboard to the other party’s closest
corrugated products plant. PCA tracks each shipment to ensure
that the other party’s shipments to the Company match its
shipments to them during the agreement period. Such transfers
are possible because containerboard is a commodity product with
no distinguishing product characteristics. These transactions
are accounted for at carrying value, and revenue is not recorded
as the transactions do not represent the culmination of an
earnings process. The transactions are recorded into inventory
accounts, and no income is recorded until such inventory is
converted to a finished product and sold to an end-use customer.
Segment
Information
PCA is engaged in one line of business: the integrated
manufacture and sale of packaging materials, boxes and
containers for industrial and consumer markets. No single
customer accounts for more than 10% of total net sales.
Derivative
Instruments and Hedging Activities
The Company records its derivatives in accordance with ASC 815,
“Derivatives and Hedging.” The guidance requires the
Company to recognize derivative instruments as either assets or
liabilities in the balance sheet at fair value. The accounting
for changes in the fair value of a derivative depends on the
intended use and designation of the derivative instrument. For a
derivative designated as a fair value hedge, the gain or loss
F-13
Packaging
Corporation of America
Notes to
Consolidated Financial Statements (Continued)
December 31,
2009
on the derivative is recognized in earnings in the period of
change in fair value together with the offsetting gain or loss
on the hedged item. For a derivative instrument designated as a
cash flow hedge, the effective portion of the derivative’s
gain or loss is initially reported as a component of accumulated
other comprehensive income (loss) (“OCI”) and is
subsequently recognized in earnings when the hedged exposure
affects earnings. The ineffective portion of the gain or loss is
recognized in earnings.
Hedging
Strategy
PCA is exposed to certain risks relating to its ongoing
operations. When appropriate, the Company uses derivatives as a
risk management tool to mitigate the potential impact of certain
market risks. The primary risks managed by using derivative
financial instruments are interest rate and foreign currency
exchange rate risks. PCA does not enter into derivative
financial instruments for trading or speculative purposes.
Interest
Rate Risk
The Company has historically used derivative instruments to
manage interest costs and the risk associated with changing
interest rates. On June 12, 2003, in connection with a
contemplated issuance of ten-year debt securities, PCA entered
into an interest rate protection agreement with a counterparty
to protect against increases in the ten-year U.S. Treasury
Note rate. On January 17, 2008, in connection with a
contemplated issuance of ten-year debt securities, PCA entered
into an interest rate protection agreement with a counterparty
to protect against increases in the ten-year U.S. Treasury
Note rate. These treasury rates served as references in
determining the interest rates applicable to the debt securities
the Company issued in July 2003 and March 2008, respectively. As
a result of changes in the interest rates on those treasury
securities between the time PCA entered into the agreements and
the time PCA priced and issued the debt securities, the Company:
(1) received a payment of $22.8 million from the
counterparty upon settlement of the 2003 interest rate
protection agreement on July 21, 2003; and (2) made a
payment of $4.4 million to the counterparty upon settlement
of the 2008 interest rate protection agreement on March 25,
2008. The Company recorded the settlements in accumulated other
comprehensive income (loss) and is amortizing the
$22.8 million gain and the $4.4 million loss to
interest expense over the lives of the respective notes. As of
December 31, 2009, 2008 and 2007, the Company was not a
party to any interest rate derivative instruments.
Foreign
Currency Exchange Rate Risk
In connection with the energy optimization project at its
Valdosta, Georgia mill, the Company entered into foreign
currency forward contracts on December 18, 2009 to hedge
its exposure to forecasted purchases of machinery and equipment
with prices denominated in foreign currencies. The foreign
currency forward contracts were properly documented and
designated as cash flow hedges at inception. At
December 31, 2009, the change in fair value of the foreign
currency derivatives was immaterial to PCA’s financial
position or results of operations.
Recent
Accounting Pronouncements
In January 2010, the Financial Accounting Standards Board
(“FASB”) issued Accounting Standards Update
(“ASU”)
2010-06,
“Fair Value Measurements and Disclosures (Topic
820) — Improving Disclosures about Fair Value
Measurements.” This ASU requires some new disclosures and
clarifies some existing disclosure requirements about fair value
measurement as set forth in Accounting Standards Codification
(“ASC”) 820. ASU
2010-06
amends ASC 820 to now require: (1) a reporting entity
should disclose separately the amounts of significant transfers
in and out of Level 1 and Level 2 fair value
measurements and describe the reasons for the transfers; and
(2) in the reconciliation for fair value measurements using
significant unobservable inputs, a reporting entity should
present separately information about purchases, sales,
issuances,
F-14
Packaging
Corporation of America
Notes to
Consolidated Financial Statements (Continued)
December 31,
2009
and settlements. In addition, ASU
2010-06
clarifies the requirements of existing disclosures. ASU
2010-06 is
effective for interim and annual reporting periods beginning
after December 15, 2009, except for the disclosures about
purchases, sales, issuances, and settlements in the roll forward
of activity in Level 3 fair value measurements. Those
disclosures are effective for fiscal years beginning after
December 15, 2010, and for interim periods within those
fiscal years. Early application is permitted. The Company will
comply with the additional disclosures required by this guidance
upon its adoption in January 2010.
In December 2009, the FASB issued ASU
2009-16,
“Transfers and Servicing (Topic 860) — Accounting
for Transfers of Financial Assets,” which formally codifies
FASB Statement No. 166, “Accounting for Transfers of
Financial Assets,” into the FASB Accounting Standards
Codification. ASU
2009-16
revises the provisions of former FASB Statement No. 140,
“Accounting for Transfers and Servicing of Financial Assets
and Extinguishments of Liabilities,” and will require more
information about transfers of financial assets, including
securitization transactions, and where entities have continuing
exposure to the risks related to transferred financial assets.
ASU 2009-16
is effective at the start of a reporting entity’s first
fiscal year beginning after November 15, 2009. Early
application is not permitted. The Company will comply with the
additional disclosures required by this guidance upon its
adoption on January 1, 2010.
In August 2009, the FASB issued ASU
No. 2009-05,
“Fair Value Measurements and Disclosures (Topic
820) — Measuring Liabilities at Fair Value,”
related to fair value measurement of liabilities. This update
provides clarification that in circumstances in which a quoted
price in an active market for an identical liability is not
available, a reporting entity is required to measure fair value
using one or more valuation techniques. This guidance is
effective for the first reporting period beginning after
issuance. The Company adopted this guidance effective
October 1, 2009. The adoption of this guidance did not have
any impact on the Company’s financial position, cash flows
or results of operations.
In June 2009, the FASB issued guidance under ASC 105,
“Generally Accepted Accounting Principles.” This
guidance established a new hierarchy of GAAP sources for
non-governmental entities under the FASB Accounting Standards
Codification. The Codification is the sole source for
authoritative U.S. GAAP and supersedes all accounting
standards in U.S. GAAP, except for those issued by the SEC.
The guidance was effective for financial statements issued for
reporting periods ending after September 15, 2009. The
Company adopted this guidance effective July 1, 2009. The
adoption had no impact on the Company’s financial position,
cash flows or results of operations.
In May 2009, the FASB issued guidance under ASC 855,
“Subsequent Events,” which sets forth: (1) the
period after the balance sheet date during which management of a
reporting entity should evaluate events or transactions that may
occur for potential recognition or disclosure in the financial
statements, (2) the circumstances under which an entity
should recognize events or transactions occurring after the
balance sheet date in its financial statements and (3) the
disclosures that an entity should make about events or
transactions that occurred after the balance sheet date. The
guidance was effective on a prospective basis for interim or
annual financial periods ending after June 15, 2009. The
Company adopted this guidance on June 30, 2009. See
Note 19 for additional information.
In April 2009, the FASB updated its guidance under ASC 820,
“Fair Value Measurements and Disclosures,” related to
estimating fair value when the volume and level of activity for
an asset or liability have significantly decreased and
identifying circumstances that indicate a transaction is not
orderly. The guidance was effective for interim and annual
reporting periods ending after June 15, 2009 with early
adoption permitted for periods ending after March 15, 2009.
The adoption of this guidance on June 30, 2009 did not have
any impact on the Company’s results of operations.
Also in April 2009, the FASB updated its guidance under ASC 825,
“Financial Instruments,” which requires disclosures
about fair value of financial instruments for interim reporting
periods of publicly traded
F-15
Packaging
Corporation of America
Notes to
Consolidated Financial Statements (Continued)
December 31,
2009
companies as well as in annual financial statements. This
guidance also requires those disclosures in summarized financial
information at interim reporting periods. The guidance was
effective for interim reporting periods ending after
June 15, 2009 with early adoption permitted for periods
ending after March 15, 2009. The Company adopted this
guidance on June 30, 2009. For additional information, see
Note 9.
The FASB updated its guidance under ASC 805, “Business
Combinations,” in April 2009, which addresses application
issues on initial recognition and measurement, subsequent
measurement and accounting, and disclosure of assets and
liabilities arising from contingencies in a business
combination. This guidance was effective for business
combinations occurring on or after the beginning of the first
annual period on or after December 15, 2008. The Company
applied the guidance to its accounting for the sheet plant that
was acquired on July 2, 2009. See Note 17 for
additional information regarding this acquisition.
In December 2008, the FASB issued guidance under ASC 715,
“Compensation — Retirement Benefits,” which
requires detailed disclosures about employers’ plan assets,
including employers’ investment strategies, major
categories of plan assets, concentrations of risk within plan
assets, and valuation techniques used to measure the fair value
of plan assets. The disclosures required by this guidance must
be provided in financial statements for fiscal years ending
after December 15, 2009. Earlier application of the
provisions of this guidance is permitted. The Company adopted
this guidance on December 31, 2009. See Note 6 for the
required disclosures.
In June 2008, the FASB updated its guidance under ASC 260,
“Earnings Per Share.” This guidance clarified that all
unvested share-based payment awards with a right to receive
nonforfeitable dividends are participating securities and
provides guidance on how to allocate earnings to participating
securities and compute basic earnings per share using the
two-class method. This guidance was effective for fiscal years
beginning after December 15, 2008. The Company adopted this
guidance on January 1, 2009. The adoption did not have a
material impact on the Company’s earnings per share
calculations.
In March 2008, the FASB issued guidance under ASC 815,
“Derivatives and Hedging,” which changes the
disclosure requirements for derivative instruments and hedging
activities. Entities will be required to provide enhanced
disclosures about how and why an entity uses derivative
instruments, how derivative instruments and related hedged items
are accounted for, and how derivative instruments and related
items affect an entity’s financial position, operations and
cash flows. This guidance was effective as of the beginning of
an entity’s fiscal year that begins after November 15,
2008. The Company adopted this guidance on January 1, 2009.
See Note 2 for the required disclosures.
F-16
Packaging
Corporation of America
Notes to
Consolidated Financial Statements (Continued)
December 31,
2009
The following table sets forth the computation of basic and
diluted income per common share for the periods presented.
| |
|
|
|
|
|
|
|
|
|
|
|
|
|
|
|
Year Ended December 31,
|
|
|
|
|
2009
|
|
|
2008
|
|
|
2007
|
|
|
|
|
(In thousands, except per share data)
|
|
|
|
|
Numerator:
|
|
|
|
|
|
|
|
|
|
|
|
|
|
Net income
|
|
$
|
265,895
|
|
|
$
|
135,609
|
|
|
$
|
170,066
|
|
|
Denominator:
|
|
|
|
|
|
|
|
|
|
|
|
|
|
Basic common shares outstanding
|
|
|
101,577
|
|
|
|
102,753
|
|
|
|
104,483
|
|
|
Effect of dilutive securities:
|
|
|
|
|
|
|
|
|
|
|
|
|
|
Stock options
|
|
|
74
|
|
|
|
317
|
|
|
|
640
|
|
|
Unvested restricted stock
|
|
|
707
|
|
|
|
523
|
|
|
|
336
|
|
|
|
|
|
|
|
|
|
|
|
|
|
|
|
|
Dilutive common shares outstanding
|
|
|
102,358
|
|
|
|
103,593
|
|
|
|
105,459
|
|
|
|
|
|
|
|
|
|
|
|
|
|
|
|
|
Basic income per common share
|
|
$
|
2.62
|
|
|
$
|
1.32
|
|
|
$
|
1.63
|
|
|
Diluted income per common share
|
|
$
|
2.60
|
|
|
$
|
1.31
|
|
|
$
|
1.61
|
|
Options to purchase 1.8 million shares and 0.7 million
shares at December 31, 2009 and 2008, respectively, were
not included in the computation of diluted common shares
outstanding as their exercise price exceeded the average market
price of the Company’s common stock for the respective
reporting period.
|
|
|
4.
|
STOCK-BASED
COMPENSATION
|
In October 1999, the Company adopted a long-term equity
incentive plan, which provides for grants of stock options,
stock appreciation rights, restricted stock and performance
awards to directors, officers and employees of PCA, as well as
others who engage in services for PCA. Option awards granted to
directors, officers and employees have contractual lives of
seven or ten years. Options granted to officers and employees
vest ratably over a three year period, and options granted to
directors vest immediately. Restricted stock awards granted to
employees vest at the end of a four-year period, and restricted
stock awards granted to directors vest at the end of a six-month
period. The plan, which was scheduled to terminate on
October 19, 2009, was amended on May 27, 2009. The
amendment extended the plan’s term by five years to
October 19, 2014 and increased the number of shares that
may be granted under the plan by 2,000,000 shares, to a
total issuance of up to 8,550,000 shares of common stock
over the life of the plan (including prior awards). As of
December 31, 2009, options and restricted stock for
6,539,183 shares have been granted, net of forfeitures.
Forfeitures are added back to the pool of shares of common stock
available to be granted at a future date.
F-17
Packaging
Corporation of America
Notes to
Consolidated Financial Statements (Continued)
December 31,
2009
Compensation expense for both stock options and restricted stock
recognized in the consolidated statements of income for the year
ended December 31, 2009, 2008 and 2007 was as follows:
| |
|
|
|
|
|
|
|
|
|
|
|
|
|
|
|
Year Ended December 31,
|
|
|
|
|
2009
|
|
|
2008
|
|
|
2007
|
|
|
|
|
(In thousands)
|
|
|
|
|
Stock options
|
|
$
|
720
|
|
|
$
|
1,457
|
|
|
$
|
2,451
|
|
|
Restricted stock
|
|
|
6,541
|
|
|
|
7,238
|
|
|
|
5,967
|
|
|
|
|
|
|
|
|
|
|
|
|
|
|
|
|
Impact on income before income taxes
|
|
|
7,261
|
|
|
|
8,695
|
|
|
|
8,418
|
|
|
Income tax benefit
|
|
|
(2,827
|
)
|
|
|
(3,382
|
)
|
|
|
(3,271
|
)
|
|
|
|
|
|
|
|
|
|
|
|
|
|
|
|
Impact on net income
|
|
$
|
4,434
|
|
|
$
|
5,313
|
|
|
$
|
5,147
|
|
|
|
|
|
|
|
|
|
|
|
|
|
|
|
The Company uses the Black-Scholes-Merton option-pricing model
to estimate the fair value of each option grant as of the date
of grant. Expected volatilities are based on historical
volatility of the Company’s common stock. The expected life
of the option is estimated using historical data pertaining to
option exercises and employee terminations. Separate groups of
employees that have similar historical exercise behavior are
considered separately for estimating the expected life. The
risk-free interest rate is based on U.S. Treasury yields in
effect at the time of grant. The fair value of restricted stock
is determined based on the closing price of the Company’s
common stock on the grant date. There were no option grants in
2009 or 2008. The estimated weighted-average fair values of and
related assumptions for the 2007 option grants were as follows:
| |
|
|
|
|
|
|
|
Year Ended
|
|
|
|
|
December 31,
|
|
|
|
|
2007
|
|
|
|
|
Weighted-average fair value of options granted($)
|
|
|
4.90
|
|
|
Assumptions:
|
|
|
|
|
|
Dividend yield (%)
|
|
|
3.80
|
|
|
Expected volatility (%)
|
|
|
22.75
|
|
|
Risk-free interest rate (%)
|
|
|
4.96
|
|
|
Expected life of employee options (years)
|
|
|
5.33
|
|
F-18
Packaging
Corporation of America
Notes to
Consolidated Financial Statements (Continued)
December 31,
2009
A summary of the Company’s stock option activity and
related information follows:
| |
|
|
|
|
|
|
|
|
|
|
|
|
|
|
|
|
|
|
|
|
|
|
|
|
|
Weighted-
|
|
|
|
|
|
|
|
|
|
|
|
|
|
Average
|
|
|
|
|
|
|
|
|
|
|
Weighted-
|
|
|
Remaining
|
|
|
Aggregate
|
|
|
|
|
|
|
|
Average
|
|
|
Contractual
|
|
|
Intrinsic
|
|
|
|
|
Options
|
|
|
Exercise Price
|
|
|
Term (years)
|
|
|
Value
|
|
|
|
|
|
|
|
|
|
|
|
|
|
(In thousands)
|
|
|
|
|
Outstanding at December 31, 2006
|
|
|
3,451,077
|
|
|
$
|
17.96
|
|
|
|
|
|
|
|
|
|
|
Granted
|
|
|
221,267
|
|
|
|
25.82
|
|
|
|
|
|
|
|
|
|
|
Exercised
|
|
|
(1,260,768
|
)
|
|
|
16.10
|
|
|
|
|
|
|
|
|
|
|
Forfeited
|
|
|
(15,480
|
)
|
|
|
22.55
|
|
|
|
|
|
|
|
|
|
|
|
|
|
|
|
|
|
|
|
|
|
|
|
|
|
|
|
|
Outstanding at December 31, 2007
|
|
|
2,396,096
|
|
|
|
19.62
|
|
|
|
|
|
|
|
|
|
|
Exercised
|
|
|
(152,313
|
)
|
|
|
16.00
|
|
|
|
|
|
|
|
|
|
|
Forfeited
|
|
|
(16,751
|
)
|
|
|
22.38
|
|
|
|
|
|
|
|
|
|
|
|
|
|
|
|
|
|
|
|
|
|
|
|
|
|
|
|
|
Outstanding at December 31, 2008
|
|
|
2,227,032
|
|
|
|
19.85
|
|
|
|
|
|
|
|
|
|
|
Exercised
|
|
|
(185,801
|
)
|
|
|
8.69
|
|
|
|
|
|
|
|
|
|
|
Forfeited
|
|
|
(67,930
|
)
|
|
|
19.11
|
|
|
|
|
|
|
|
|
|
|
|
|
|
|
|
|
|
|
|
|
|
|
|
|
|
|
|
|
Outstanding at December 31, 2009
|
|
|
1,973,301
|
|
|
$
|
20.92
|
|
|
|
3.3
|
|
|
$
|
5,078
|
|
|
|
|
|
|
|
|
|
|
|
|
|
|
|
|
|
|
|
|
Outstanding-vested or expected to vest at December 31, 2009
|
|
|
1,973,301
|
|
|
$
|
20.92
|
|
|
|
3.3
|
|
|
$
|
5,078
|
|
|
|
|
|
|
|
|
|
|
|
|
|
|
|
|
|
|
|
|
Exercisable at December 31, 2009
|
|
|
1,905,315
|
|
|
$
|
20.75
|
|
|
|
3.2
|
|
|
$
|
5,078
|
|
|
|
|
|
|
|
|
|
|
|
|
|
|
|
|
|
|
|
The total intrinsic value of options exercised during the years
ended December 31, 2009 and 2008 was $1.7 million and
$1.4 million, respectively. As of December 31, 2009,
there was $0.2 million of total unrecognized compensation
costs related to non-vested stock option awards granted under
the Company’s equity incentive plan. That cost is expected
to be recognized over a weighted-average period of
0.5 years.
A summary of the Company’s restricted stock activity
follows:
| |
|
|
|
|
|
|
|
|
|
|
|
|
|
|
|
|
|
|
|
|
|
|
|
|
|
|
|
2009
|
|
|
2008
|
|
|
2007
|
|
|
|
|
|
|
|
Fair Market
|
|
|
|
|
|
Fair Market
|
|
|
|
|
|
Fair Market
|
|
|
|
|
|
|
|
Value at
|
|
|
|
|
|
Value at
|
|
|
|
|
|
Value at
|
|
|
|
|
|
|
|
Date of
|
|
|
|
|
|
Date of
|
|
|
|
|
|
Date of
|
|
|
|
|
Shares
|
|
|
Grant
|
|
|
Shares
|
|
|
Grant
|
|
|
Shares
|
|
|
Grant
|
|
|
|
|
(Dollars in thousands)
|
|
|
|
|
Restricted stock at January 1
|
|
|
1,038,270
|
|
|
$
|
23,023
|
|
|
|
764,705
|
|
|
$
|
17,490
|
|
|
|
610,380
|
|
|
$
|
12,964
|
|
|
Granted
|
|
|
444,985
|
|
|
|
6,995
|
|
|
|
374,455
|
|
|
|
7,947
|
|
|
|
240,920
|
|
|
|
6,210
|
|
|
Vested
|
|
|
(237,370
|
)
|
|
|
(5,079
|
)
|
|
|
(95,995
|
)
|
|
|
(2,304
|
)
|
|
|
(80,605
|
)
|
|
|
(1,549
|
)
|
|
Cancellations
|
|
|
(10,380
|
)
|
|
|
(221
|
)
|
|
|
(4,895
|
)
|
|
|
(110
|
)
|
|
|
(5,990
|
)
|
|
|
(135
|
)
|
|
|
|
|
|
|
|
|
|
|
|
|
|
|
|
|
|
|
|
|
|
|
|
|
|
|
|
Restricted stock at December 31
|
|
|
1,235,505
|
|
|
$
|
24,718
|
|
|
|
1,038,270
|
|
|
$
|
23,023
|
|
|
|
764,705
|
|
|
$
|
17,490
|
|
|
|
|
|
|
|
|
|
|
|
|
|
|
|
|
|
|
|
|
|
|
|
|
|
|
|
As of December 31, 2009, there was $9.6 million of
total unrecognized compensation costs related to the restricted
stock awards. The Company expects to recognize the cost of these
stock awards over a
weighted-average
period of 2.7 years.
F-19
Packaging
Corporation of America
Notes to
Consolidated Financial Statements (Continued)
December 31,
2009
The components of accrued liabilities are as follows:
| |
|
|
|
|
|
|
|
|
|
|
|
December 31,
|
|
|
|
|
2009
|
|
|
2008
|
|
|
|
|
(In thousands)
|
|
|
|
|
Bonuses and incentives
|
|
$
|
30,189
|
|
|
$
|
30,583
|
|
|
Customer volume discounts and rebates
|
|
|
18,367
|
|
|
|
12,735
|
|
|
Medical insurance and workers’ compensation
|
|
|
17,779
|
|
|
|
18,496
|
|
|
Vacation and holiday pay
|
|
|
15,379
|
|
|
|
15,315
|
|
|
Franchise, property, sales and use taxes
|
|
|
9,002
|
|
|
|
8,372
|
|
|
Payroll and payroll taxes
|
|
|
4,495
|
|
|
|
3,309
|
|
|
Current portion of pension and postretirement benefits
|
|
|
4,448
|
|
|
|
12,543
|
|
|
Other
|
|
|
6,764
|
|
|
|
5,235
|
|
|
|
|
|
|
|
|
|
|
|
|
Total
|
|
$
|
106,423
|
|
|
$
|
106,588
|
|
|
|
|
|
|
|
|
|
|
|
|
|
|
6.
|
EMPLOYEE
BENEFIT PLANS AND OTHER POSTRETIREMENT BENEFITS
|
In connection with the acquisition from Pactiv, PCA and Pactiv
entered into a human resources agreement which, among other
items, granted PCA employees continued participation in the
Pactiv pension plan for a period of up to five years following
the closing of the acquisition for an agreed upon fee.
Effective January 1, 2003, PCA adopted a mirror-image
pension plan for eligible hourly employees to succeed the Pactiv
pension plan in which PCA hourly employees had participated
though December 31, 2002. The PCA pension plan for hourly
employees recognizes service earned under both the PCA plan and
the prior Pactiv plan. Benefits earned under the PCA plan are
reduced by retirement benefits earned under the Pactiv plan
through December 31, 2002. All assets and liabilities
associated with benefits earned through December 31, 2002
for hourly employees and retirees of PCA were retained by the
Pactiv plan.
Effective May 1, 2004, PCA adopted a grandfathered pension
plan for eligible salaried employees who had previously
participated in the Pactiv pension plan. The benefit formula for
the new PCA pension plan for salaried employees is comparable to
that of the Pactiv plan except that the PCA plan uses career
average base pay in the benefit formula in lieu of final average
base pay. The PCA pension plan for salaried employees recognizes
service earned under both the PCA plan and the prior Pactiv
plan. Benefits earned under the PCA plan are reduced by
retirement benefits earned under the Pactiv plan through
April 30, 2004. All assets and liabilities associated with
benefits earned through April 30, 2004 for salaried
employees and retirees of PCA were retained by the Pactiv plan.
PCA maintains a supplemental executive retirement plan
(“SERP”), which augments pension benefits for eligible
executives (excluding the CEO) earned under the PCA pension plan
for salaried employees. Benefits are determined using the same
formula as the PCA pension plan but in addition to counting
career average base pay, the SERP also recognizes bonuses and
any pay earned in excess of IRS qualified plan compensation
limits. Benefits earned under the SERP are reduced by benefits
paid from the PCA salaried pension plan and any prior qualified
pension and SERP benefits earned under the Pactiv plan.
PCA previously maintained a separate SERP for its CEO which was
paid out and terminated on March 15, 2009. The terminated
plan was replaced by a lower cost deferred compensation benefit
plan.
F-20
Packaging
Corporation of America
Notes to
Consolidated Financial Statements (Continued)
December 31,
2009
PCA provides certain medical benefits for retired salaried
employees and certain medical and life insurance benefits for
certain hourly employees. For salaried employees, the plan
covers employees retiring from PCA on or after attaining
age 58 who have had at least 10 years of full-time
service with PCA after attaining age 48. For hourly
employees, the postretirement medical coverage, where
applicable, is available according to the eligibility provisions
in effect at the employee’s work location. Per the human
resources agreement referred to above, Pactiv retained the
liability relating to retiree medical and life benefits for PCA
employees who had retired on or before April 12, 1999 or
who were eligible to retire within two years of that date. On
January 1, 2003, the Company adopted a new plan design for
salaried employees incorporating annual dollar caps in
determining the maximum amount of employer contributions made
towards the total cost of postretirement medical coverage.
Adoption
of the Measurement Provisions of ASC 715
On December 31, 2008, the Company adopted the measurement
provision of ASC 715, which required the Company to measure the
fair value of plan assets and benefit obligations as of the date
of the Company’s year end. The Company had previously
measured these as of September 30th of each year. The
Company adopted the measurement provision using the transition
method based on the data as of the September 30, 2007
measurement date. As a result, the following adjustments were
made to PCA’s balance sheet as of December 31, 2008:
| |
|
|
|
|
|
|
|
|
|
|
|
|
|
|
|
Prior to
|
|
|
Effect of
|
|
|
|
|
|
|
|
Adopting
|
|
|
Adopting
|
|
|
As Reported at
|
|
|
|
|
ASC 715
|
|
|
ASC 715
|
|
|
December 31, 2008
|
|
|
|
|
(In thousands)
|
|
|
|
|
Pension and postretirement benefit plans
|
|
$
|
81,243
|
|
|
$
|
4,721
|
|
|
$
|
85,964
|
|
|
Deferred income taxes (noncurrent)
|
|
|
210,716
|
|
|
|
(1,837
|
)
|
|
|
208,879
|
|
|
Total long-term liabilities
|
|
|
890,926
|
|
|
|
2,884
|
|
|
|
893,810
|
|
|
Accumulated other comprehensive income (loss)
|
|
|
(38,745
|
)
|
|
|
494
|
|
|
|
(38,251
|
)
|
|
Retained earnings
|
|
|
345,450
|
|
|
|
(3,378
|
)
|
|
|
342,072
|
|
|
Total stockholders’ equity
|
|
|
686,833
|
|
|
|
(2,884
|
)
|
|
|
683,949
|
|
|
Total liabilities and stockholders’ equity
|
|
|
1,939,741
|
|
|
|
—
|
|
|
|
1,939,741
|
|
Included in accumulated other comprehensive income (loss) at
December 31, 2009 and 2008 are the following amounts that
have not yet been recognized in net periodic pension cost:
unrecognized prior service costs of $45.8 million
($27.9 million net of tax) and $43.1 million
($26.3 million net of tax), respectively, and unrecognized
actuarial gains (losses) of $20.8 million
($12.6 million net of tax) and $30.1 million
($18.3 million net of tax), respectively. The pre-tax
amounts of prior service cost and actuarial loss included in
accumulated other comprehensive income (loss) and recognized in
net periodic pension cost for the year ended December 31,
2009 were $4.5 million ($2.7 million net of tax) and
$1.1 million ($0.7 million net of tax), respectively.
For the year ended December 31, 2010, the Company expects
to recognize in net periodic pension cost $5.7 million
($3.5 million net of tax) and $0.2 million
($0.2 million net of tax) of prior service cost for pension
and postretirement plans, respectively, and $(0.4) million
($0.3 million net of tax) and $0.3 million
($0.2 million net of tax) of actuarial loss for pension and
postretirement plans, respectively, included in accumulated
other comprehensive income (loss) at December 31, 2009.
F-21
Packaging
Corporation of America
Notes to
Consolidated Financial Statements (Continued)
December 31,
2009
The following tables provide information related to the
Company’s pension and postretirement benefit plans.
| |
|
|
|
|
|
|
|
|
|
|
|
|
|
|
|
|
|
|
|
|
|
|
|
|
|
|
|
Pension Plans
|
|
|
Postretirement Plans
|
|
|
|
|
2009
|
|
|
2008
|
|
|
2007
|
|
|
2009
|
|
|
2008
|
|
|
2007
|
|
|
|
|
(In thousands)
|
|
|
|
|
Change in Benefit Obligation
|
|
|
|
|
|
|
|
|
|
|
|
|
|
|
|
|
|
|
|
|
|
|
|
|
|
Benefit obligation at beginning of period
|
|
$
|
178,455
|
|
|
$
|
129,913
|
|
|
$
|
108,965
|
|
|
$
|
17,300
|
|
|
$
|
13,342
|
|
|
$
|
11,288
|
|
|
Service cost(1)
|
|
|
17,955
|
|
|
|
22,224
|
|
|
|
17,973
|
|
|
|
1,341
|
|
|
|
1,334
|
|
|
|
1,003
|
|
|
Interest cost(1)
|
|
|
10,208
|
|
|
|
9,785
|
|
|
|
6,251
|
|
|
|
1,022
|
|
|
|
985
|
|
|
|
654
|
|
|
Plan amendments
|
|
|
7,168
|
|
|
|
14,570
|
|
|
|
2,686
|
|
|
|
—
|
|
|
|
616
|
|
|
|
(2
|
)
|
|
Actuarial loss (gain)
|
|
|
701
|
|
|
|
3,442
|
|
|
|
(5,273
|
)
|
|
|
987
|
|
|
|
1,877
|
|
|
|
1,120
|
|
|
Participant contributions
|
|
|
—
|
|
|
|
—
|
|
|
|
—
|
|
|
|
656
|
|
|
|
575
|
|
|
|
376
|
|
|
Benefits paid
|
|
|
(11,195
|
)
|
|
|
(1,479
|
)
|
|
|
(689
|
)
|
|
|
(1,226
|
)
|
|
|
(1,429
|
)
|
|
|
(1,097
|
)
|
|
|
|
|
|
|
|
|
|
|
|
|
|
|
|
|
|
|
|
|
|
|
|
|
|
|
|
Benefit obligation at plan year end
|
|
$
|
203,292
|
|
|
$
|
178,455
|
|
|
$
|
129,913
|
|
|
$
|
20,080
|
|
|
$
|
17,300
|
|
|
$
|
13,342
|
|
|
|
|
|
|
|
|
|
|
|
|
|
|
|
|
|
|
|
|
|
|
|
|
|
|
|
|
Accumulated benefit obligation portion of above
|
|
$
|
171,384
|
|
|
$
|
143,773
|
|
|
$
|
102,470
|
|
|
|
|
|
|
|
|
|
|
|
|
|
|
|
|
|
|
|
|
|
|
|
|
|
|
|
|
|
|
|
|
|
|
|
|
|
|
|
|
Change in Fair Value of Plan Assets
|
|
|
|
|
|
|
|
|
|
|
|
|
|
|
|
|
|
|
|
|
|
|
|
|
|
Plan assets at fair value at beginning of period
|
|
$
|
97,248
|
|
|
$
|
87,321
|
|
|
$
|
47,591
|
|
|
$
|
—
|
|
|
$
|
—
|
|
|
$
|
—
|
|
|
Actual return on plan assets
|
|
|
18,590
|
|
|
|
(16,116
|
)
|
|
|
6,919
|
|
|
|
—
|
|
|
|
—
|
|
|
|
—
|
|
|
Company contributions
|
|
|
35,422
|
|
|
|
27,522
|
|
|
|
33,500
|
|
|
|
570
|
|
|
|
854
|
|
|
|
721
|
|
|
Participant contributions
|
|
|
—
|
|
|
|
—
|
|
|
|
—
|
|
|
|
656
|
|
|
|
575
|
|
|
|
376
|
|
|
Benefits paid
|
|
|
(11,195
|
)
|
|
|
(1,479
|
)
|
|
|
(689
|
)
|
|
|
(1,226
|
)
|
|
|
(1,429
|
)
|
|
|
(1,097
|
)
|
|
|
|
|
|
|
|
|
|
|
|
|
|
|
|
|
|
|
|
|
|
|
|
|
|
|
|
Fair value of plan assets at plan year end
|
|
$
|
140,065
|
|
|
$
|
97,248
|
|
|
$
|
87,321
|
|
|
$
|
—
|
|
|
$
|
—
|
|
|
$
|
—
|
|
|
|
|
|
|
|
|
|
|
|
|
|
|
|
|
|
|
|
|
|
|
|
|
|
|
|
|
|
|
|
(1) |
|
Service cost and interest cost for 2008 include amounts for the
period October 1 — December 31, 2007. |
| |
|
|
|
|
|
|
|
|
|
|
|
|
|
|
|
|
|
|
|
Pension Plans
|
|
|
Postretirement Plans
|
|
|
|
|
December 31,
|
|
|
December 31,
|
|
|
December 31,
|
|
|
December 31,
|
|
|
|
|
2009
|
|
|
2008
|
|
|
2009
|
|
|
2008
|
|
|
|
|
(In thousands)
|
|
|
|
|
Development of Net Amount Recognized
|
|
|
|
|
|
|
|
|
|
|
|
|
|
|
|
|
|
Benefit obligation in excess of plan assets at December 31
|
|
$
|
(63,227
|
)
|
|
$
|
(81,207
|
)
|
|
$
|
(20,080
|
)
|
|
$
|
(17,300
|
)
|
|
|
|
|
|
|
|
|
|
|
|
|
|
|
|
|
|
|
|
Amounts Recognized in Statement of Financial Position
|
|
|
|
|
|
|
|
|
|
|
|
|
|
|
|
|
|
Current liabilities
|
|
$
|
(3,586
|
)
|
|
$
|
(11,900
|
)
|
|
$
|
(862
|
)
|
|
$
|
(643
|
)
|
|
Noncurrent liabilities
|
|
|
(59,641
|
)
|
|
|
(69,307
|
)
|
|
|
(19,218
|
)
|
|
|
(16,657
|
)
|
|
|
|
|
|
|
|
|
|
|
|
|
|
|
|
|
|
|
|
Accrued benefit recognized at December 31
|
|
$
|
(63,227
|
)
|
|
$
|
(81,207
|
)
|
|
$
|
(20,080
|
)
|
|
$
|
(17,300
|
)
|
|
|
|
|
|
|
|
|
|
|
|
|
|
|
|
|
|
|
|
Amounts Recognized in Accumulated Other Comprehensive Income
(Loss), Net of Tax
|
|
|
|
|
|
|
|
|
|
|
|
|
|
|
|
|
|
Prior service cost
|
|
$
|
28,897
|
|
|
$
|
27,523
|
|
|
$
|
(988
|
)
|
|
$
|
(1,241
|
)
|
|
Actuarial loss
|
|
|
8,608
|
|
|
|
14,697
|
|
|
|
4,031
|
|
|
|
3,630
|
|
|
|
|
|
|
|
|
|
|
|
|
|
|
|
|
|
|
|
|
Total
|
|
$
|
37,505
|
|
|
$
|
42,220
|
|
|
$
|
3,043
|
|
|
$
|
2,389
|
|
|
|
|
|
|
|
|
|
|
|
|
|
|
|
|
|
|
|
F-22
Packaging
Corporation of America
Notes to
Consolidated Financial Statements (Continued)
December 31,
2009
| |
|
|
|
|
|
|
|
|
|
|
|
|
|
|
|
|
|
|
|
|
|
|
|
|
|
|
|
Pension Plans
|
|
|
Postretirement Plans
|
|
|
|
|
2009
|
|
|
2008
|
|
|
2007
|
|
|
2009
|
|
|
2008
|
|
|
2007
|
|
|
|
|
(In thousands)
|
|
|
|
|
Components of Net Periodic Benefit Cost
|
|
|
|
|
|
|
|
|
|
|
|
|
|
|
|
|
|
|
|
|
|
|
|
|
|
Service cost for benefits earned during the year
|
|
$
|
17,955
|
|
|
$
|
17,779
|
|
|
$
|
17,973
|
|
|
$
|
1,341
|
|
|
$
|
1,067
|
|
|
$
|
1,003
|
|
|
Interest cost on accumulated benefit obligation
|
|
|
10,208
|
|
|
|
7,828
|
|
|
|
6,251
|
|
|
|
1,022
|
|
|
|
788
|
|
|
|
654
|
|
|
Expected return on plan assets
|
|
|
(8,573
|
)
|
|
|
(8,578
|
)
|
|
|
(4,761
|
)
|
|
|
—
|
|
|
|
—
|
|
|
|
—
|
|
|
Net amortization of unrecognized amounts
|
|
|
5,706
|
|
|
|
7,002
|
|
|
|
3,233
|
|
|
|
(88
|
)
|
|
|
(239
|
)
|
|
|
(236
|
)
|
|
Other
|
|
|
(126
|
)
|
|
|
—
|
|
|
|
—
|
|
|
|
—
|
|
|
|
—
|
|
|
|
—
|
|
|
|
|
|
|
|
|
|
|
|
|
|
|
|
|
|
|
|
|
|
|
|
|
|
|
|
|
Net periodic benefit cost
|
|
$
|
25,170
|
|
|
$
|
24,031
|
|
|
$
|
22,696
|
|
|
$
|
2,275
|
|
|
$
|
1,616
|
|
|
$
|
1,421
|
|
|
|
|
|
|
|
|
|
|
|
|
|
|
|
|
|
|
|
|
|
|
|
|
|
|
|
| |
|
|
|
|
|
|
|
|
|
|
|
|
|
|
|
|
|
|
|
|
|
|
|
|
|
|
|
Pension Plans
|
|
|
Postretirement Plans
|
|
|
|
|
2009
|
|
|
2008
|
|
|
2007
|
|
|
2009
|
|
|
2008
|
|
|
2007
|
|
|
|
|
Weighted-Average Assumptions Used to Determine Benefit
Obligations at December 31
|
|
|
|
|
|
|
|
|
|
|
|
|
|
|
|
|
|
|
|
|
|
|
|
|
|
Discount rate
|
|
|
6.00
|
%
|
|
|
6.00
|
%
|
|
|
6.00
|
%
|
|
|
5.75
|
%
|
|
|
6.00
|
%
|
|
|
6.00
|
%
|
|
Rate of compensation increase
|
|
|
4.00
|
%
|
|
|
4.00
|
%
|
|
|
4.00
|
%
|
|
|
N/A
|
|
|
|
N/A
|
|
|
|
N/A
|
|
|
Weighted-Average Assumptions Used to Determine Net Periodic
Benefit Cost for the Years Ended December 31
|
|
|
|
|
|
|
|
|
|
|
|
|
|
|
|
|
|
|
|
|
|
|
|
|
|
Discount rate
|
|
|
6.00
|
%
|
|
|
6.00
|
%
|
|
|
5.75
|
%
|
|
|
6.00
|
%
|
|
|
6.00
|
%
|
|
|
5.75
|
%
|
|
Expected return on plan assets
|
|
|
8.25
|
%
|
|
|
8.25
|
%
|
|
|
8.25
|
%
|
|
|
N/A
|
|
|
|
N/A
|
|
|
|
N/A
|
|
|
Rate of compensation increase
|
|
|
4.00
|
%
|
|
|
4.00
|
%
|
|
|
4.00
|
%
|
|
|
N/A
|
|
|
|
N/A
|
|
|
|
N/A
|
|
The expected return on pension plan assets reflects the expected
long-term rates of return for the categories of investments
currently held in the plan as well as anticipated returns for
additional contributions made in the future. The expected
long-term rate of return is adjusted when there are fundamental
changes in expected returns on the plan investments.
The discount rate assumptions used to calculate the present
value of pension and postretirement benefit obligations reflect
the rates available on high-quality, fixed-income debt
instruments on December 31st beginning in 2008. Prior
to 2008, the discount rate assumptions were based on rates as of
September 30th of each year. The rate of compensation
increase is another significant assumption used for pension
accounting and is determined by the Company based upon annual
reviews.
In determining net pension and postretirement benefit costs, the
Company elected to amortize prior service cost on a
straight-line basis over the average remaining service period of
employees expected to receive benefits under the plans. A 10%
corridor is used to determine the amount of the unrecognized net
gain or loss to be amortized. The excess, if any, of the
unrecognized net gain or loss over 10% of the greater of the
projected benefit obligation or the market-related value of plan
assets is amortized over the average remaining service period
until retirement for active participants and included in the net
periodic benefit cost.
The Company assumed health care cost trend rates for its
postretirement benefits plans were as follows:
| |
|
|
|
|
|
|
|
|
|
|
|
|
|
|
|
2009
|
|
|
2008
|
|
|
2007
|
|
|
|
|
Health care cost trend rate assumed for next year
|
|
|
7.50
|
%
|
|
|
7.50
|
%
|
|
|
7.50
|
%
|
|
Rate to which the cost rend rate is assumed to decline (the
ultimate trend rate)
|
|
|
5.00
|
%
|
|
|
5.00
|
%
|
|
|
5.00
|
%
|
|
Year that the rate reaches the ultimate trend rate
|
|
|
2015
|
|
|
|
2014
|
|
|
|
2013
|
|
F-23
Packaging
Corporation of America
Notes to
Consolidated Financial Statements (Continued)
December 31,
2009
A one-percentage point change in assumed health care cost trend
rates would have the following effects on the 2009
postretirement benefit obligation and the 2009 net post
retirement benefit cost:
| |
|
|
|
|
|
|
|
|
|
|
|
1-Percentage
|
|
1-Percentage
|
|
|
|
Point Increase
|
|
Point Decrease
|
|
|
|
(In thousands)
|
|
|
|
Effect on postretirement benefit obligation
|
|
$
|
624
|
|
|
$
|
(555
|
)
|
|
Effect on net postretirement benefit cost
|
|
|
65
|
|
|
|
(57
|
)
|
PCA has retained the services of a professional advisor to
oversee pension investments and provide recommendations
regarding investment strategy. PCA’s overall strategy and
related apportionments between equity and debt securities may
change from time to time based on market conditions, external
economic factors, and the funding status of the plans. Pension
plans’ assets were invested in the following classes of
securities at December 31, 2009 and December 31, 2008:
| |
|
|
|
|
|
|
|
|
|
|
|
Percentage
|
|
|
|
|
of Fair Value
|
|
|
|
|
2009
|
|
|
2008
|
|
|
|
|
Equity securities
|
|
|
39
|
%
|
|
|
23
|
%
|
|
Debt securities
|
|
|
60
|
%
|
|
|
74
|
%
|
|
Other
|
|
|
1
|
%
|
|
|
3
|
%
|
The fair values of PCA’s pension plans’ assets,
measured on a recurring basis, by asset category are as follows:
| |
|
|
|
|
|
|
|
|
|
|
|
|
|
|
|
|
|
|
|
Fair Value Measurements at December 31, 2009
|
|
|
|
|
|
|
|
Quoted Prices in Active
|
|
|
Significant
|
|
|
Significant
|
|
|
|
|
|
|
|
Markets for identical
|
|
|
Observable
|
|
|
Observable
|
|
|
Asset Category
|
|
Total
|
|
|
Assets (Level 1)
|
|
|
Inputs (Level 2)
|
|
|
Inputs (Level 3)
|
|
|
|
|
(In thousands)
|
|
|
|
|
Short-term investments
|
|
$
|
1,212
|
|
|
$
|
—
|
|
|
$
|
1,212
|
|
|
$
|
—
|
|
|
Equity securities:
|
|
|
|
|
|
|
|
|
|
|
|
|
|
|
|
|
|
U.S. large value
|
|
|
8,573
|
|
|
|
8,573
|
|
|
|
|
|
|
|
|
|
|
U.S. large growth
|
|
|
7,287
|
|
|
|
7,287
|
|
|
|
|
|
|
|
|
|
|
U.S. mid-cap value
|
|
|
2,948
|
|
|
|
2,948
|
|
|
|
|
|
|
|
|
|
|
U.S. mid-cap growth
|
|
|
2,994
|
|
|
|
2,994
|
|
|
|
|
|
|
|
|
|
|
U.S. small blend
|
|
|
1,519
|
|
|
|
|
|
|
|
1,519
|
|
|
|
|
|
|
Foreign large blend
|
|
|
21,310
|
|
|
|
21,310
|
|
|
|
|
|
|
|
|
|
|
Diversified emerging markets
|
|
|
5,854
|
|
|
|
5,854
|
|
|
|
|
|
|
|
|
|
|
Real estate
|
|
|
4,416
|
|
|
|
4,416
|
|
|
|
|
|
|
|
|
|
|
Debt securities:
|
|
|
|
|
|
|
|
|
|
|
|
|
|
|
|
|
|
Government bonds
|
|
|
12,761
|
|
|
|
|
|
|
|
12,761
|
|
|
|
|
|
|
Corporate bonds
|
|
|
71,191
|
|
|
|
41,161
|
|
|
|
30,030
|
|
|
|
|
|
|
|
|
|
|
|
|
|
|
|
|
|
|
|
|
|
|
|
|
Total
|
|
$
|
140,065
|
|
|
$
|
94,543
|
|
|
$
|
45,522
|
|
|
$
|
—
|
|
|
|
|
|
|
|
|
|
|
|
|
|
|
|
|
|
|
|
The Company makes pension plan contributions that are sufficient
to fund its actuarially determined costs, generally equal to the
minimum amounts required by the Employee Retirement Income
Security Act (ERISA). However, from time to time the Company may
make discretionary contributions in excess of the required
minimum amounts. PCA currently expects to make pension
contributions of $14.0 million and record pension plan
expense of $25.1 million in 2010.
F-24
Packaging
Corporation of America
Notes to
Consolidated Financial Statements (Continued)
December 31,
2009
The following are estimated benefit payments to be paid to
current plan participants by year:
| |
|
|
|
|
|
|
|
|
|
|
|
Pension Plans
|
|
|
Postretirement Plans
|
|
|
|
|
(In thousands)
|
|
|
|
|
2010
|
|
$
|
3,587
|
|
|
$
|
862
|
|
|
2011
|
|
|
4,770
|
|
|
|
1,091
|
|
|
2012
|
|
|
6,003
|
|
|
|
1,084
|
|
|
2013
|
|
|
7,305
|
|
|
|
1,219
|
|
|
2014
|
|
|
8,720
|
|
|
|
1,375
|
|
|
2015 — 2019
|
|
|
68,464
|
|
|
|
8,991
|
|
The Company has two defined contribution 401(k) benefit plans
that cover all full-time salaried employees and certain hourly
employees at several of the Company’s facilities. Employees
can make voluntary contributions in accordance with the
provisions of their respective plan. The Company made
employer-matching contributions of $9.4 million,
$9.4 million and $9.0 million during the years ended
December 31, 2009, 2008 and 2007, respectively.
Salaried employees who are not participants in the grandfathered
pension plan (generally those hired on or after April 12,
1999) receive a service-related Company retirement
contribution to their 401(k) account in addition to any employer
matching contribution. This contribution increases with years of
service and ranges from 3% to 5% of base pay. The Company
expensed $2.8 million, $2.5 million and
$2.2 million for this retirement contribution during the
years ended December 31, 2009, 2008 and 2007, respectively.
|
|
|
7.
|
OTHER
INTANGIBLE ASSETS
|
Goodwill
Changes in the carrying amount of goodwill for the period ended
December 31, 2009 are as follows:
| |
|
|
|
|
|
|
|
(In thousands)
|
|
|
|
|
Balance as of December 31, 2007 and 2008
|
|
$
|
37,163
|
|
|
Acquisition
|
|
|
1,691
|
|
|
|
|
|
|
|
|
Balance at December 31, 2009
|
|
$
|
38,854
|
|
|
|
|
|
|
|
Other
Intangible Assets
The components of other intangible assets are as follows:
| |
|
|
|
|
|
|
|
|
|
|
|
|
|
|
|
|
|
|
|
|
|
|
|
Weighted
|
|
|
|
|
|
|
|
|
|
|
|
|
|
|
|
|
Average
|
|
|
As of December 31, 2009
|
|
|
As of December 31, 2008
|
|
|
|
|
Remaining
|
|
|
Gross Carrying
|
|
|
Accumulated
|
|
|
Gross Carrying
|
|
|
Accumulated
|
|
|
|
|
Life
|
|
|
Amount
|
|
|
Amortization
|
|
|
Amount
|
|
|
Amortization
|
|
|
|
|
|
|
|
(In thousands)
|
|
|
|
|
Customer lists and relations
|
|
|
31.4 years
|
|
|
$
|
17,441
|
|
|
$
|
5,651
|
|
|
$
|
17,441
|
|
|
$
|
4,836
|
|
|
Covenants not to compete
|
|
|
—
|
|
|
|
2,292
|
|
|
|
2,292
|
|
|
|
2,292
|
|
|
|
2,228
|
|
|
|
|
|
|
|
|
|
|
|
|
|
|
|
|
|
|
|
|
|
|
|
|
Total other intangible assets
|
|
|
|
|
|
$
|
19,733
|
|
|
$
|
7,943
|
|
|
$
|
19,733
|
|
|
$
|
7,064
|
|
|
|
|
|
|
|
|
|
|
|
|
|
|
|
|
|
|
|
|
|
|
|
The amount of amortization expense was $0.9 million,
$1.1 million, and $1.1 million for the years ended
December 31, 2009, 2008 and 2007, respectively. Estimated
amortization of intangible assets over the next five years is
expected to approximate $0.8 million (2010),
$0.6 million (2011), $0.5 million (2012),
$0.4 million (2013) and $0.4 million (2014).
F-25
Packaging
Corporation of America
Notes to
Consolidated Financial Statements (Continued)
December 31,
2009
A summary of debt is set forth in the following table:
| |
|
|
|
|
|
|
|
|
|
|
|
December 31,
|
|
|
|
|
2009
|
|
|
2008
|
|
|
|
|
(In thousands)
|
|
|
|
|
Receivables credit facility, effective interest rate of 1.97%
and 3.01% as of December 31, 2009 and 2008, respectively,
due April 14, 2010
|
|
$
|
109,000
|
|
|
$
|
109,000
|
|
|
Senior notes, net of discount of $1,200 and $1,543 as of
December 31, 2009 and 2008, respectively, interest at 5.75%
payable semi-annually, due August 1, 2013
|
|
|
398,800
|
|
|
|
398,457
|
|
|
Senior notes, net of discount of $51 and $57 as of
December 31, 2009 and 2008, respectively, interest at 6.50%
payable semi-annually, due March 15, 2018
|
|
|
149,949
|
|
|
|
149,943
|
|
|
|
|
|
|
|
|
|
|
|
|
Total
|
|
|
657,749
|
|
|
|
657,400
|
|
|
Less current portion
|
|
|
109,000
|
|
|
|
109,000
|
|
|
|
|
|
|
|
|
|
|
|
|
Total long-term debt
|
|
$
|
548,749
|
|
|
$
|
548,400
|
|
|
|
|
|
|
|
|
|
|
|
On July 21, 2003, PCA closed its offering and private
placement of $150.0 million of 4.375% senior notes due
2008 and $400.0 million of 5.75% senior notes due
2013. The 4.375% senior notes due 2008 were repaid on
August 1, 2008, and the 5.75% senior notes are due
August 1, 2013.
On March 25, 2008, PCA issued $150.0 million of
6.50% senior notes due March 15, 2018 through a
registered public offering. PCA used the proceeds of this
offering, together with cash on hand, to repay all of the
$150.0 million of outstanding 4.375% senior notes on
August 1, 2008.
On April 15, 2008, PCA replaced its existing senior credit
facility that was scheduled to expire later in 2008, with a new
five-year $150.0 million senior revolving credit facility.
The Company had $18.8 million of outstanding letters of
credit under this facility, resulting in $131.2 million in
unused borrowing capacity as of December 31, 2009.
On April 15, 2009, the Company extended its
receivables-backed credit facility through April 14, 2010.
The Company had $41.0 million in additional borrowing
capacity available under this facility as of December 31,
2009.
The instruments governing PCA’s indebtedness contain
financial and other covenants that limit the ability of PCA and
its subsidiaries to enter into sale and leaseback transactions,
incur liens, incur indebtedness at the subsidiary level, enter
into certain transactions with affiliates, merge or consolidate
with any other person or sell or otherwise dispose of all or
substantially all of its assets. The senior credit facility also
requires PCA to comply with certain financial covenants,
including maintaining a minimum net worth and maximum debt to
total capitalization and minimum interest coverage ratios. A
failure to comply with these restrictions could lead to an event
of default, which could result in an acceleration of any
outstanding indebtedness
and/or
prohibit the Company from drawing on the senior credit facility.
Such an acceleration may also constitute an event of default
under the senior notes indenture and the receivables credit
facility. At December 31, 2009, the Company was in
compliance with these covenants.
F-26
Packaging
Corporation of America
Notes to
Consolidated Financial Statements (Continued)
December 31,
2009
Additional information regarding PCA’s variable rate debt
is shown below:
| |
|
|
|
|
|
|
|
|
|
|
|
|
|
|
|
|
|
|
|
Weighted-Average
|
|
|
|
|
|
Reference Interest
|
|
|
|
|
|
Rate
|
|
Applicable Margin
|
|
|
|
December 31,
|
|
December 31,
|
|
|
|
2009
|
|
2008
|
|
2009
|
|
2008
|
|
|
|
Commercial paper based debt:
|
|
|
|
|
|
|
|
|
|
|
|
|
|
|
|
|
|
Receivables credit facility
|
|
|
0.27
|
%
|
|
|
2.31
|
%
|
|
|
1.70
|
%
|
|
|
0.70
|
%
|
As of December 31, 2009, annual principal maturities for
debt, excluding unamortized debt discount, are:
$109.0 million (2010), $400.0 million (2013) and
$150.0 million (2018).
Interest payments in connection with the Company’s debt
obligations for the years ended December 31, 2009, 2008 and
2007, amounted to $35.7 million, $38.9 million, and
$38.0 million, respectively.
PCA has an on-balance sheet securitization program for its trade
accounts receivable that is accounted for as a secured borrowing
under ASC 860, “Transfers and Servicing.” To
effectuate this program, the Company formed a wholly owned
limited purpose subsidiary, Packaging Credit Company, LLC
(“PCC”), which in turn formed a wholly owned,
bankruptcy-remote, special-purpose subsidiary, Packaging
Receivables Company, LLC (“PRC”), for the purpose of
acquiring receivables from PCC. Both of these entities are
included in the consolidated financial statements of the
Company. Under this program, PCC purchases on an ongoing basis
substantially all of the receivables of the Company and sells
such receivables to PRC. PRC and lenders established a
$150.0 million receivables-backed revolving credit facility
(“Receivables Credit Facility”) through which PRC
obtains funds to purchase receivables from PCC. The receivables
purchased by PRC are solely the property of PRC. In the event of
liquidation of PRC, the creditors of PRC would be entitled to
satisfy their claims from PRC’s assets prior to any
distribution to PCC or the Company. Credit available under the
receivables credit facility is on a borrowing-base formula. As a
result, the full amount of the facility may not be available at
all times. At December 31, 2009, $109.0 million was
outstanding and included in “Short — term debt
and current maturities of long — term debt” on
the consolidated balance sheet. Approximately
$239.9 million of accounts receivable at December 31,
2009 have been sold to PRC and are included in “Accounts
receivable, net of allowance for doubtful accounts and customer
deductions” on the consolidated balance sheet. The highest
outstanding principal balance under the receivables credit
facility during 2009 was $109.0 million.
A summary of the Company’s drawings under credit
facilities, including the impact of $18.8 million of
outstanding letters of credit, as of December 31, 2009
follows:
| |
|
|
|
|
|
|
|
|
|
|
|
|
|
|
|
Commitments
|
|
|
Utilized
|
|
|
Available
|
|
|
|
|
(In thousands)
|
|
|
|
|
Receivables credit facility
|
|
$
|
150,000
|
|
|
$
|
109,000
|
|
|
$
|
41,000
|
|
|
Senior revolving credit facility
|
|
|
150,000
|
|
|
|
18,832
|
|
|
|
131,168
|
|
|
|
|
|
|
|
|
|
|
|
|
|
|
|
|
|
|
$
|
300,000
|
|
|
$
|
127,832
|
|
|
$
|
172,168
|
|
|
|
|
|
|
|
|
|
|
|
|
|
|
|
PCA is required to pay commitment fees on the unused portions of
the credit facilities. The Company’s outstanding letters of
credit of $18.8 million at December 31, 2009 are for
workers’ compensation.
F-27
Packaging
Corporation of America
Notes to
Consolidated Financial Statements (Continued)
December 31,
2009
The carrying and estimated fair values of PCA’s financial
instruments at December 31, 2009 and 2008 were as follows:
| |
|
|
|
|
|
|
|
|
|
|
|
|
|
|
|
|
|
|
|
2009
|
|
2008
|
|
|
|
Carrying
|
|
|
|
Carrying
|
|
|
|
|
|
Amount
|
|
Fair Value
|
|
Amount
|
|
Fair Value
|
|
|
|
(In thousands)
|
|
|
|
Cash and cash equivalents
|
|
$
|
260,727
|
|
|
$
|
260,727
|
|
|
$
|
149,397
|
|
|
$
|
149,397
|
|
|
Long-term debt —
|
|
|
|
|
|
|
|
|
|
|
|
|
|
|
|
|
|
5.75% senior notes
|
|
|
(398,800
|
)
|
|
|
(427,000
|
)
|
|
|
(398,457
|
)
|
|
|
(367,000
|
)
|
|
6.50% senior notes
|
|
|
(149,949
|
)
|
|
|
(163,500
|
)
|
|
|
(149,943
|
)
|
|
|
(133,500
|
)
|
|
Receivables credit facility
|
|
|
(109,000
|
)
|
|
|
(109,000
|
)
|
|
|
(109,000
|
)
|
|
|
(109,000
|
)
|
|
Capital lease obligation
|
|
|
(23,129
|
)
|
|
|
(23,129
|
)
|
|
|
(23,735
|
)
|
|
|
(23,735
|
)
|
The fair value of cash and cash equivalents approximates its
carrying amounts due to the short-term nature of these financial
instruments.
The fair value of the receivables credit facility approximates
its carrying amount due to the variable interest-rate feature of
the instruments. The fair values of the senior notes are based
on quoted market prices. The fair value of the capital lease
obligations was estimated to not be materially different from
the carrying amount.
|
|
|
10.
|
FAIR
VALUE MEASUREMENTS
|
The following presents information about PCA’s assets and
liabilities measured at fair value and the valuation techniques
used to determine those fair values. The inputs used in the
determination of fair values are categorized according to the
fair value hierarchy as being Level 1, Level 2 or
Level 3. The valuation techniques are as follows:
(a) Market approach — prices and other relevant
information generated by market transactions involving identical
or comparable assets or liabilities
(b) Cost approach — amount that would be required
to replace the service capacity of an asset (replacement cost)
(c) Income approach — techniques to convert
future amounts to a single present amount based on market
expectations (including present value techniques, option-pricing
and excess earnings models)
Assets and liabilities measured at fair value on a recurring
basis are as follows:
| |
|
|
|
|
|
|
|
|
|
|
|
|
|
|
|
|
|
Quoted Prices in
|
|
|
|
|
|
|
|
Active Markets for
|
|
|
|
|
|
|
|
Identical Assets
|
|
Valuation
|
|
|
|
Fair Value
|
|
(Level 1)
|
|
Technique
|
|
|
|
(In thousands)
|
|
|
|
December 31, 2009
|
|
|
|
|
|
|
|
|
|
|
|
|
|
Money Market Funds
|
|
$
|
260,230
|
|
|
$
|
260,230
|
|
|
|
(a
|
)
|
|
December 31, 2008
|
|
|
|
|
|
|
|
|
|
|
|
|
|
Money Market Funds
|
|
$
|
148,903
|
|
|
$
|
148,903
|
|
|
|
(a
|
)
|
The money market funds PCA invests in include funds comprised of
U.S. Treasury obligations or backed by U.S. Treasury
obligations.
F-28
Packaging
Corporation of America
Notes to
Consolidated Financial Statements (Continued)
December 31,
2009
There were no changes in the Company’s valuation techniques
used to measure fair values on a recurring basis as a result of
adopting ASC 820. PCA had no assets or liabilities that were
measured on a nonrecurring basis.
On October 17, 2007, PCA announced that its Board of
Directors authorized a $150.0 million common stock
repurchase program. There is no expiration date for the common
stock repurchase program. Through December 31, 2008, the
Company repurchased 3,818,729 shares of common stock, with
3,142,600 shares repurchased during 2008 and
676,129 shares repurchased during 2007. All repurchased
shares were retired prior to December 31, 2008. There were
no shares repurchased in 2009. As of December 31, 2009,
$65.0 million of the $150.0 million authorization
remained available for repurchase of the Company’s common
stock.
|
|
|
12.
|
COMMITMENTS
AND CONTINGENCIES
|
Capital
Commitments
The Company had authorized capital commitments of approximately
$41.7 million and $43.0 million as of
December 31, 2009 and 2008, respectively, in connection
with the expansion and replacement of existing facilities and
equipment. In addition, commitments at December 31, 2009
for the major energy optimization projects at its Counce and
Valdosta mills totaled $156.3 million.
Lease
Obligations
PCA leases space for certain of its facilities and cutting
rights to approximately 91,000 acres of timberland under
long-term leases. The Company also leases equipment, primarily
vehicles and rolling stock, and other assets under long-term
leases with a duration of two to seven years. The minimum lease
payments under non-cancelable operating leases with lease terms
in excess of one year are as follows:
| |
|
|
|
|
|
|
|
(In thousands)
|
|
|
|
|
2010
|
|
$
|
28,162
|
|
|
2011
|
|
|
25,181
|
|
|
2012
|
|
|
17,338
|
|
|
2013
|
|
|
11,557
|
|
|
2014
|
|
|
7,742
|
|
|
Thereafter
|
|
|
18,072
|
|
|
|
|
|
|
|
|
Total
|
|
$
|
108,052
|
|
|
|
|
|
|
|
Total lease expense, including base rent on all leases and
executory costs, such as insurance, taxes, and maintenance, for
the years ended December 31, 2009, 2008 and 2007 was
$41.3 million, $41.6 million and $39.8 million,
respectively. These costs are included in cost of goods sold and
selling and administrative expenses.
PCA was obligated under capital leases covering buildings and
machinery and equipment in the amount of $23.1 million and
$23.7 million at December 31, 2009 and 2008,
respectively. During the fourth quarter of 2008, the Company
entered into a capital lease relating to buildings and
machinery, totaling $23.9 million, payable over
20 years. This capital lease amount is a non-cash
transaction and, accordingly, has been excluded
F-29
Packaging
Corporation of America
Notes to
Consolidated Financial Statements (Continued)
December 31,
2009
from the consolidated statements of cash flows. Assets held
under capital lease obligations are included in property, plant
and equipment as follows:
| |
|
|
|
|
|
|
|
|
|
|
|
December 31,
|
|
|
|
|
2009
|
|
|
2008
|
|
|
|
|
(In thousands)
|
|
|
|
|
Buildings
|
|
$
|
250
|
|
|
$
|
250
|
|
|
Machinery and equipment
|
|
|
23,602
|
|
|
|
23,931
|
|
|
|
|
|
|
|
|
|
|
|
|
Total
|
|
|
23,852
|
|
|
|
24,181
|
|
|
Less accumulated amortization
|
|
|
(1,934
|
)
|
|
|
(472
|
)
|
|
|
|
|
|
|
|
|
|
|
|
Total
|
|
$
|
21,918
|
|
|
$
|
23,709
|
|
|
|
|
|
|
|
|
|
|
|
Amortization of assets under capital lease obligations is
included in depreciation expense.
The future minimum payments under capitalized leases at
December 31, 2009 are as follows:
| |
|
|
|
|
|
|
|
(In thousands)
|
|
|
|
|
2010
|
|
$
|
2,202
|
|
|
2011
|
|
|
2,202
|
|
|
2012
|
|
|
2,202
|
|
|
2013
|
|
|
2,202
|
|
|
2014
|
|
|
2,202
|
|
|
Thereafter
|
|
|
30,277
|
|
|
|
|
|
|
|
|
Total minimum capital lease payments
|
|
|
41,287
|
|
|
Less amounts representing interest
|
|
|
18,158
|
|
|
|
|
|
|
|
|
Present value of net minimum capital lease payments
|
|
|
23,129
|
|
|
Less current maturities of capital lease obligations
|
|
|
626
|
|
|
|
|
|
|
|
|
Total long-term capital lease obligations
|
|
$
|
22,503
|
|
|
|
|
|
|
|
Interest paid as part of the capital lease obligations was
$1.6 million and $0.4 million during the years ended
December 31, 2009 and 2008, respectively. Interest paid for
the year ended December 31, 2007 was immaterial.
F-30
Packaging
Corporation of America
Notes to
Consolidated Financial Statements (Continued)
December 31,
2009
Purchase
Commitments
The Company has entered into various purchase agreements for
minimum amounts of pulpwood processing and energy over periods
ranging from one to twenty years at fixed prices. Total purchase
commitments are as follows:
| |
|
|
|
|
|
|
|
(In thousands)
|
|
|
|
|
2010
|
|
$
|
6,951
|
|
|
2011
|
|
|
5,942
|
|
|
2012
|
|
|
3,659
|
|
|
2013
|
|
|
1,486
|
|
|
2014
|
|
|
1,486
|
|
|
Thereafter
|
|
|
25,048
|
|
|
|
|
|
|
|
|
Total
|
|
$
|
44,572
|
|
|
|
|
|
|
|
These purchase agreements are not marked to market. The Company
purchased $37.3 million, $29.4 million, and
$14.5 million during the years ended December 31,
2009, 2008 and 2007, respectively, under these purchase
agreements.
Litigation
PCA is a party to various legal actions arising in the ordinary
course of business. These legal actions cover a broad variety of
claims spanning our entire business. As of the date of this
filing, the Company believes it is not reasonably possible that
the resolution of these legal actions will, individually or in
the aggregate, have a material adverse effect on its financial
position, results of operations, or cash flows.
Environmental
Liabilities
The potential costs for various environmental matters are
uncertain due to such factors as the unknown magnitude of
possible cleanup costs, the complexity and evolving nature of
governmental laws and regulations and their interpretations, and
the timing, varying costs and effectiveness of alternative
cleanup technologies. From 1994 through 2009, remediation costs
at the Company’s mills and corrugated plants totaled
approximately $3.2 million. As of December 31, 2009,
the Company maintained an environmental reserve of
$9.1 million relating to
on-site
landfills (see Note 13) and surface impoundments as
well as ongoing and anticipated remedial projects. Liabilities
recorded for environmental contingencies are estimates of the
probable costs based upon available information and assumptions.
Because of these uncertainties, PCA’s estimates may change.
As of the date of this filing, the Company believes that it is
not reasonably possible that future environmental expenditures
and asset retirement obligations above the $9.1 million
accrued as of December 31, 2009, will have a material
impact on its financial condition, results of operations, or
cash flows.
In connection with the sale to PCA of its containerboard and
corrugated products business, Pactiv agreed to retain all
liability for all former facilities and all sites associated
with pre-closing off-site waste disposal and all environmental
liabilities related to a closed landfill located near the
Company’s Filer City mill.
|
|
|
13.
|
ASSET
RETIREMENT OBLIGATIONS
|
Asset retirement obligations consist primarily of landfill
capping and closure and post-closure costs. PCA is legally
required to perform capping and closure and post-closure care on
the landfills at each of the Company’s mills. In accordance
with ASC 410, “ Asset Retirement and Environmental
Obligations,” PCA recognizes the fair value of these
liabilities as an asset retirement obligation for each landfill
and capitalizes
F-31
Packaging
Corporation of America
Notes to
Consolidated Financial Statements (Continued)
December 31,
2009
that cost as part of the cost basis of the related asset. The
liability is accreted to its estimated value of the asset
retirement obligation over time, and the related assets are
depreciated on a straight-line basis over their useful lives.
Upon settlement of the liability, PCA will recognize a gain or
loss for any difference between the settlement amount and the
recorded liability.
The following table describes changes to PCA’s asset
retirement obligation liability:
| |
|
|
|
|
|
|
|
|
|
|
|
2009
|
|
|
2008
|
|
|
|
|
(In thousands)
|
|
|
|
|
Asset retirement obligation, January 1
|
|
$
|
4,188
|
|
|
$
|
4,071
|
|
|
Accretion expense
|
|
|
405
|
|
|
|
248
|
|
|
New cell additions
|
|
|
—
|
|
|
|
90
|
|
|
Payments
|
|
|
(72
|
)
|
|
|
(221
|
)
|
|
|
|
|
|
|
|
|
|
|
|
Asset retirement obligation, December 31
|
|
$
|
4,521
|
|
|
$
|
4,188
|
|
|
|
|
|
|
|
|
|
|
|
Following is an analysis of the components of the consolidated
income tax provision:
| |
|
|
|
|
|
|
|
|
|
|
|
|
|
|
|
2009
|
|
|
2008
|
|
|
2007
|
|
|
|
|
(In thousands)
|
|
|
|
|
Current —
|
|
|
|
|
|
|
|
|
|
|
|
|
|
U.S.
|
|
$
|
52,704
|
|
|
$
|
74,399
|
|
|
$
|
97,657
|
|
|
State and local
|
|
|
12,191
|
|
|
|
10,949
|
|
|
|
11,169
|
|
|
|
|
|
|
|
|
|
|
|
|
|
|
|
|
Total current provision for taxes
|
|
|
64,895
|
|
|
|
85,348
|
|
|
|
108,826
|
|
|
|
|
|
|
|
|
|
|
|
|
|
|
|
|
Deferred —
|
|
|
|
|
|
|
|
|
|
|
|
|
|
U.S.
|
|
|
(11,745
|
)
|
|
|
(10,098
|
)
|
|
|
(10,399
|
)
|
|
State and local
|
|
|
(2,074
|
)
|
|
|
(716
|
)
|
|
|
(625
|
)
|
|
|
|
|
|
|
|
|
|
|
|
|
|
|
|
Total deferred provision for taxes
|
|
|
(13,819
|
)
|
|
|
(10,814
|
)
|
|
|
(11,024
|
)
|
|
|
|
|
|
|
|
|
|
|
|
|
|
|
|
Total provision for taxes
|
|
$
|
51,076
|
|
|
$
|
74,534
|
|
|
$
|
97,802
|
|
|
|
|
|
|
|
|
|
|
|
|
|
|
|
The effective tax rate varies from the U.S. Federal
statutory tax rate principally due to the following:
| |
|
|
|
|
|
|
|
|
|
|
|
|
|
|
|
2009
|
|
|
2008
|
|
|
2007
|
|
|
|
|
(In thousands)
|
|
|
|
|
Provision computed at U.S. Federal statutory rate of 35%
|
|
$
|
110,939
|
|
|
$
|
73,550
|
|
|
$
|
93,754
|
|
|
Alternative fuel mixture credit
|
|
|
(61,673
|
)
|
|
|
—
|
|
|
|
—
|
|
|
State and local taxes, net of federal benefit
|
|
|
4,566
|
|
|
|
6,212
|
|
|
|
8,598
|
|
|
Domestic manufacturers deduction
|
|
|
(2,956
|
)
|
|
|
(4,413
|
)
|
|
|
(5,625
|
)
|
|
Other
|
|
|
200
|
|
|
|
(815
|
)
|
|
|
1,075
|
|
|
|
|
|
|
|
|
|
|
|
|
|
|
|
|
Total
|
|
$
|
51,076
|
|
|
$
|
74,534
|
|
|
$
|
97,802
|
|
|
|
|
|
|
|
|
|
|
|
|
|
|
|
F-32
Packaging
Corporation of America
Notes to
Consolidated Financial Statements (Continued)
December 31,
2009
Deferred income tax assets and liabilities at December 31 are
summarized as follows:
| |
|
|
|
|
|
|
|
|
|
|
|
December 31,
|
|
|
|
|
2009
|
|
|
2008
|
|
|
|
|
(In thousands)
|
|
|
|
|
Deferred tax assets:
|
|
|
|
|
|
|
|
|
|
Accrued liabilities
|
|
$
|
2,592
|
|
|
$
|
7,539
|
|
|
Employee benefits and compensation
|
|
|
7,502
|
|
|
|
7,818
|
|
|
Reserve for doubtful accounts
|
|
|
128
|
|
|
|
56
|
|
|
Inventories
|
|
|
13,665
|
|
|
|
3,187
|
|
|
Stock options and restricted stock
|
|
|
7,795
|
|
|
|
7,052
|
|
|
Pension and postretirement benefits
|
|
|
35,305
|
|
|
|
36,675
|
|
|
|
|
|
|
|
|
|
|
|
|
Total deferred tax assets
|
|
$
|
66,987
|
|
|
$
|
62,327
|
|
|
|
|
|
|
|
|
|
|
|
|
Deferred tax liabilities:
|
|
|
|
|
|
|
|
|
|
Property, plant and equipment
|
|
$
|
(221,559
|
)
|
|
$
|
(228,101
|
)
|
|
Investment in joint venture
|
|
|
(28,530
|
)
|
|
|
(27,865
|
)
|
|
|
|
|
|
|
|
|
|
|
|
Total deferred tax liabilities
|
|
$
|
(250,089
|
)
|
|
$
|
(255,966
|
)
|
|
|
|
|
|
|
|
|
|
|
|
Net deferred tax liabilities
|
|
$
|
(183,102
|
)
|
|
$
|
(193,639
|
)
|
|
|
|
|
|
|
|
|
|
|
The net deferred tax liabilities at December 31 are classified
in the balance sheet as follows:
| |
|
|
|
|
|
|
|
|
|
|
|
December 31,
|
|
|
|
|
2009
|
|
|
2008
|
|
|
|
|
(In thousands)
|
|
|
|
|
Current deferred tax assets
|
|
$
|
22,125
|
|
|
$
|
15,240
|
|
|
Non-current deferred tax liabilities
|
|
|
(205,227
|
)
|
|
|
(208,879
|
)
|
|
|
|
|
|
|
|
|
|
|
|
Net deferred tax liabilities
|
|
$
|
(183,102
|
)
|
|
$
|
(193,639
|
)
|
|
|
|
|
|
|
|
|
|
|
Cash payments for income taxes were $22.3 million,
$89.4 million and $105.5 million for the years ended
December 31, 2009, 2008 and 2007, respectively. In 2009,
cash payments for income taxes were lower due to the alternative
fuel mixture credit offsetting Federal income taxes payable.
The following table summarizes the changes related to PCA’s
gross unrecognized tax benefits excluding interest:
| |
|
|
|
|
|
|
|
|
|
|
|
2009
|
|
|
2008
|
|
|
|
|
(In thousands)
|
|
|
|
|
Balance as of January 1
|
|
$
|
(10,426
|
)
|
|
$
|
(9,358
|
)
|
|
(Increases) decreases related to prior years’ tax positions
|
|
|
(949
|
)
|
|
|
190
|
|
|
Increases related to current year tax positions
|
|
|
(619
|
)
|
|
|
(1,354
|
)
|
|
Settlements with taxing authorities
|
|
|
248
|
|
|
|
—
|
|
|
Expiration of the statute of limitations
|
|
|
2,705
|
|
|
|
96
|
|
|
|
|
|
|
|
|
|
|
|
|
Balance at December 31
|
|
$
|
(9,041
|
)
|
|
$
|
(10,426
|
)
|
|
|
|
|
|
|
|
|
|
|
During the third quarter of 2009, the statue of limitations for
the federal tax years of 2003 and 2005 expired. During the
fourth quarter of 2009, various state statute of limitations
expired. As a result of these events, the reserve for uncertain
tax positions was decreased by $2.7 million gross or
$2.2 million net of the
F-33
Packaging
Corporation of America
Notes to
Consolidated Financial Statements (Continued)
December 31,
2009
federal benefit for state taxes during the third and fourth
quarters of 2009. At December 31, 2009, PCA had
$9.0 million unrecognized tax benefits excluding interest.
Of the total, $6.6 million (net of the federal benefit for
state taxes) would impact the effective tax rate if recognized.
During the years ended December 31, 2009 and 2008, PCA
recorded $0.1 million gross ($0.06 million net) and
$0.1 million gross ($0.06 million net), respectively,
in its statement of income, increasing the accrual for interest
to $1.8 million gross ($1.1 million net) and
$1.7 million gross ($1.0 million, net) at
December 31, 2009 and 2008, respectively. No accrual for
penalties was made.
PCA and its subsidiaries are subject to U.S. federal income
taxes, as well as income taxes of multiple state and city
jurisdictions. A federal examination of the tax years 2002 and
2004 have been concluded. The tax years 2006 — 2009
remain open to federal examination. The tax years
2002 — 2009 remain open to state examinations. PCA
does not expect the unrecognized tax benefits to change
significantly over the next 12 months.
|
|
|
15.
|
ALTERNATIVE
FUEL MIXTURE TAX CREDITS
|
PCA generates “black liquor” as a by-product of its
pulp manufacturing process and uses it in a mixture with diesel
fuel to produce energy at its Counce, Tennessee, Valdosta,
Georgia, and Tomahawk, Wisconsin mills. Through
December 31, 2009, the U.S. Internal Revenue Code
provided a $0.50 per gallon refundable tax credit for taxpayers
who used alternative fuels in their trade or business. The
Company filed applications with the Internal Revenue Service
(the “IRS”) in December 2008 to be registered as an
alternative fuel mixer and received approval in April 2009. As a
registered alternative fuel mixer, the Company believes the use
of black liquor as an alternative fuel qualifies for this tax
credit. The laws governing this credit, as well as the
taxability of benefits received from this credit, are complex.
After December 31, 2009, the IRS no longer provides an
alternative fuel mixture credit for a mixture of black liquor
and diesel fuel used. During the year ended December 31,
2009, PCA recorded income of $171.3 million from these
credits after deducting net after-tax operating expenses of
$5.0 million. The Company applied $48.4 million of
these credits against its 2009 federal cash tax payments,
resulting in an alternative fuel mixture receivable balance at
December 31, 2009 of $127.8 million that is included
on the Company’s balance sheet at December 31, 2009.
|
|
|
16.
|
RELATED
PARTY TRANSACTIONS
|
At December 31, 2009 and 2008, PCA owned approximately 29%
of Southern Timber Venture, LLC (“STV”) and had not
guaranteed the debt of STV and has no future funding
requirements. There is no carrying value of the Company’s
investment in STV under the equity method at December 31,
2009 and 2008. PCA did not receive any dividends from STV in
2009, 2008 or 2007. STV currently owns approximately
51,000 acres of land, including timberlands and higher
beneficial use properties, located primarily in southern Georgia
and northern Florida.
Currently, PCA purchases pulpwood directly from STV for its
Valdosta mill in accordance with the terms of a fiber supply
agreement between the two companies which expires
December 31, 2017. The price of pulpwood in this agreement
is based upon the market value of pulpwood and is adjusted
annually for any changes in market value. PCA purchased
$3.4 million, $3.0 million and $3.2 million of
pulpwood for its Valdosta, Georgia mill from STV during the
years ended December 31, 2009, 2008 and 2007, respectively.
In December 2007, PCA sold a portion of its interest in STV for
$1.0 million and recognized a pre-tax gain of
$1.0 million.
F-34
Packaging
Corporation of America
Notes to
Consolidated Financial Statements (Continued)
December 31,
2009
Unaudited Financial information for STV is as follows:
| |
|
|
|
|
|
|
|
|
|
|
|
|
|
|
|
Year Ended December 31,
|
|
|
|
2009
|
|
2008
|
|
2007
|
|
|
|
(In thousands)
|
|
|
|
Net sales
|
|
$
|
5,194
|
|
|
$
|
5,910
|
|
|
$
|
6,373
|
|
|
Gross profit (loss)
|
|
|
(486
|
)
|
|
|
(632
|
)
|
|
|
(573
|
)
|
|
Gain from sale of timberlands
|
|
|
6
|
|
|
|
364
|
|
|
|
1,080
|
|
|
Net loss
|
|
|
(5,983
|
)
|
|
|
(4,947
|
)
|
|
|
(4,045
|
)
|
On July 2, 2009, the Company acquired a specialty sheet
business located in Chicago, Illinois for approximately
$3.1 million, net of cash required. The purchase method of
accounting was used to account for the acquisition. Goodwill of
$1.7 million (which is deductible for income tax purposes)
was recorded in connection with the acquisition. Sales and total
assets of the acquisition were not material to the
Company’s overall sales and total assets prior to the
acquisition. Operating results of the plant subsequent to the
date of acquisition are included in the Company’s operating
results.
|
|
|
18.
|
BUSINESS
INTERRUPTION INSURANCE RECOVERY
|
On October 24, 2007, PCA’s Counce, Tennessee
linerboard mill incurred a major, unplanned outage due to a
total mill power failure. The mill was down for
21/2 days
and experienced operational difficulties through the end of the
month. This outage resulted in about 11,000 tons of lost
production as well as significant additional operating costs of
$7.4 million ($4.7 million net of tax). In December
2007, the Company received $2.4 million ($1.5 million
net of tax) in business interruption insurance proceeds. The
amount of the loss, net of the insurance recovery, is included
in cost of sales in the statement of income for the year ended
December 31, 2007. The insurance proceeds are included in
net cash provided by operating activities in the statement of
cash flows for the year ended December 31, 2007.
The Company has evaluated subsequent events through
February 17, 2010, the filing date of this
Form 10-K,
and determined there were no events to disclose.
F-35
Packaging
Corporation of America
Notes to
Consolidated Financial Statements (Continued)
December 31,
2009
|
|
|
20.
|
QUARTERLY
FINANCIAL DATA (UNAUDITED)
|
| |
|
|
|
|
|
|
|
|
|
|
|
|
|
|
|
|
|
|
|
|
|
|
|
Fiscal Quarter
|
|
|
|
First
|
|
Second
|
|
Third
|
|
Fourth
|
|
Total
|
|
|
|
(In thousands, except per share amounts)
|
|
|
|
2009:
|
|
|
|
|
|
|
|
|
|
|
|
|
|
|
|
|
|
|
|
|
|
Net sales
|
|
$
|
512,378
|
|
|
$
|
549,381
|
|
|
$
|
553,573
|
|
|
$
|
532,257
|
|
|
$
|
2,147,589
|
|
|
Gross profit
|
|
|
110,008
|
|
|
|
118,499
|
|
|
|
110,532
|
|
|
|
87,538
|
|
|
|
426,577
|
|
|
Income from operations
|
|
|
49,607
|
|
|
|
135,717
|
|
|
|
96,331
|
|
|
|
70,799
|
|
|
|
352,454
|
|
|
Net income
|
|
|
25,676
|
|
|
|
108,881
|
|
|
|
72,655
|
|
|
|
58,683
|
|
|
|
265,895
|
|
|
Basic earnings per share
|
|
|
0.25
|
|
|
|
1.07
|
|
|
|
0.71
|
|
|
|
0.58
|
|
|
|
2.62
|
|
|
Diluted earnings per share
|
|
|
0.25
|
|
|
|
1.07
|
|
|
|
0.71
|
|
|
|
0.57
|
|
|
|
2.60
|
|
|
Stock price — high
|
|
|
15.49
|
|
|
|
17.24
|
|
|
|
21.99
|
|
|
|
24.18
|
|
|
|
24.18
|
|
|
Stock price — low
|
|
|
9.66
|
|
|
|
12.43
|
|
|
|
15.19
|
|
|
|
18.21
|
|
|
|
9.66
|
|
|
2008:
|
|
|
|
|
|
|
|
|
|
|
|
|
|
|
|
|
|
|
|
|
|
Net sales
|
|
$
|
577,474
|
|
|
$
|
616,183
|
|
|
$
|
620,785
|
|
|
$
|
546,051
|
|
|
$
|
2,360,493
|
|
|
Gross profit
|
|
|
118,161
|
|
|
|
127,196
|
|
|
|
132,051
|
|
|
|
113,950
|
|
|
|
491,358
|
|
|
Income from operations
|
|
|
57,146
|
|
|
|
64,173
|
|
|
|
68,705
|
|
|
|
51,788
|
|
|
|
241,812
|
|
|
Net income
|
|
|
32,073
|
|
|
|
35,192
|
|
|
|
38,102
|
|
|
|
30,242
|
|
|
|
135,609
|
|
|
Basic earnings per share
|
|
|
0.31
|
|
|
|
0.34
|
|
|
|
0.37
|
|
|
|
0.30
|
|
|
|
1.32
|
|
|
Diluted earnings per share
|
|
|
0.31
|
|
|
|
0.34
|
|
|
|
0.37
|
|
|
|
0.30
|
|
|
|
1.31
|
|
|
Stock price — high
|
|
|
28.74
|
|
|
|
26.47
|
|
|
|
26.99
|
|
|
|
23.60
|
|
|
|
28.74
|
|
|
Stock price — low
|
|
|
19.84
|
|
|
|
20.46
|
|
|
|
20.93
|
|
|
|
10.95
|
|
|
|
10.95
|
|
|
|
| Note: |
The sum of the quarters may not equal the total of the
respective year’s earnings per share on either a basic or
diluted basis due to changes in the weighted average shares
outstanding throughout the year.
|
For the three months ended June 30, September 30, and
December 31, 2009, net income was increased by
$80.2 million or $0.79 per share, $47.3 million of
$0.46 per share, and $43.7 million of $0.43 per share,
respectively, due to the alternative fuel mixture tax credits.
For the three months ended December 31, 2009, net income
was decreased by $1.2 million or $0.01 per share due to
asset disposals related to the major energy projects at the
Counce and Valdosta mills.
For the three months ended December 31, 2008, tax expense
was reduced by $2.9 million or $0.03 per share primarily
due to a reduction in the Company’s state tax rate.
F-36