Attached files
| file | filename |
|---|---|
| 8-K - FORM 8-K - SPARTON CORP | d598769d8k.htm |
 INVESTOR INVESTOR
PRESENTATION
PRESENTATION
NYSE: SPA
September 2013
Exhibit 99.1 |
 2
Safe Harbor Statement
Safe Harbor Statement
Certain
statements
herein
constitute
forward-looking
statements
within
the
meaning
of
the
Securities
Act
of
1933,
as
amended
and
the
Securities
Exchange
Act
of
1934,
as
amended.
When
used
herein,
words
such
as
“believe,”
“expect,”
“anticipate,”
“project,”
“plan,”
“estimate,”
“will”
or
“intend”
and
similar
words
or
expressions
as
they
relate
to
the
Company
or
its
management
constitute
forward-looking
statements.
These
forward-looking
statements
reflect
our
current
views
with
respect
to
future
events
and
are
based
on
currently
available
financial,
economic
and
competitive
data
and
our
current
business
plans.
The
Company
is
under
no
obligation
to,
and
expressly
disclaims
any
obligation
to,
update
or
alter
its
forward-looking
statements
whether
as
a
result
of
such
changes,
new
information,
subsequent
events
or
otherwise.
Actual
results
could
vary
materially
depending
on
risks
and
uncertainties
that
may
affect
our
operations,
markets,
prices
and
other
factors.
Important
factors
that
could
cause
actual
results
to
differ
materially
from
those
forward-looking
statements
include
those
contained
under
the
heading
of
risk
factors
and
in
the
management’s
discussion
and
analysis
contained
from
time-to-time
in
the
Company’s
filings
with
the
Securities
and
Exchange
Commission.
Related
to
Onyx,
adjusted
gross
profit
and
adjusted
operating
income
exclude
the
gross
profit
effect
of
capitalized
profit
in
inventory
from
acquisition
and
unusual
write-downs
of
inventory
and
accounts
receivable
related
to
an
Onyx
customer
(“Augustine”)
which
was
excluded
from
the
acquisition.
Adjusted
EBITDA
related
to
Onyx
represents
operating
income
before
depreciation
and
amortization
as
adjusted
for
the
gross
profit
effect
of
capitalized
profit
in
inventory
from
acquisition
and
unusual
write-downs
of
inventory
and
accounts
receivable
related
to
an
Onyx
customer
(“Augustine”)
which
was
excluded
from
the
acquisition. |
 3
Investment Considerations
Investment Considerations
Continued EPS
Growth
Established
Growing
Business
Expanded
Gross Margins
Solid
Balance Sheet
Repositioned the
Company for Growth
113 year old business with market leadership in defense and
medical sectors; 19% sales increase in fiscal 2013; 33% year-over-
year adjusted EBITDA increase in fiscal 2013
As of June 30, 2013, $6 million in cash, $10 million borrowed and
$55 million unused line of credit; Completing $3.0 million stock
buyback program that was initiated in FY13Q4
Fiscal 2013:
17.4%
Fiscal 2010:
15.3%
Fiscal 2012:
17.2%
Fiscal 2009:
7.2%
Fiscal 2011:
16.3%
Fiscal 2013:
$ 1.17
Fiscal 2010:
$ (0.40)
Fiscal 2012:
$ 0.91
Fiscal 2009:
$ (1.61)
Fiscal 2011:
$ 0.64
All adjusted and include dilution.
New Programs
New Customers
Potential Annualized Revenue
17.7
$
39.4
$
FY12
28
20
23.8
$
FY13
71
12
FY11
14
79 |
 4
Mission
Mission
Sparton will continue to differentiate itself as a premier supplier
of sophisticated electromechanical devices, sub-assemblies
and related services for highly regulated environments in the
Medical, Military & Aerospace, and Industrial markets by
leveraging and expanding its capabilities and offerings within
the electromechanical value stream. |
 5
•
Sparton
is
in
one
single
line
of
business
called
Electromechanical
Devices
•
Sparton
is
currently
segmented
into
three
financial
reporting
business
units
Defense & Security
Design
and
Manufacturing
(both
as
a
contractor
and
OEM)
Medical Device
Contract
Design,
Manufacturing,
and
Assembly
Complex Systems
Commonly
referred
to
within
legacy
Sparton
as
EMS,
but
currently
consists
of
circuit
card
assembly
and
box
build
(contract
manufacturing
and
assembly)
outside
of
the
medical
and
defense
markets.
In
the
future,
may
include
electro-mechanical
based
B2B
products
as
well
as
EMS
services.
•
Sparton
currently
serves
three
electronics
markets
Our Business
Our Business
–
Military
&
Aerospace
–
Medical
–
Industrial & Instrumentation |
 6
Strategically Located
Strategically Located
•
Six domestic and one low-cost country
manufacturing facilities
–
De Leon Springs, FL
(Orlando)
–
Strongsville, OH
(Cleveland)
–
Frederick, CO
(Denver)
–
Brooksville, FL
(Tampa)
–
Watertown, SD
(Sioux Falls)
–
Birdsboro, PA
(Philadelphia)
–
Ho Chi Minh City, Viet Nam
–
Sparton owns 558,000 square feet of
production facility capacity across the U.S.
and Asia
•
1,442 employees worldwide
•
100+ engineers on staff |
 7
Senior Management Team
Senior Management Team
Cary B. Wood, Chief Executive Officer
•
Appointed CEO November 2008
•
Formerly Chief Operating Officer of Citation Corporation, a private company with
foundry, machinery and assembly operations with 20+ years of experience at
GM, United Technologies & Elkay Manufacturing
•
Developed a track record with performance turn-around and growth strategies in
both private and public company settings
•
Appointed CFO in November 2012
•
Previously CFO at Paperworks Industries, Thetford Corporation, and Lake City
Industries as well as Corporate Controller for Littelfuse, Inc. and various
financial roles at Newell Company. •
30+ years experience improving manufacturing quality and productivity at companies
including Citation Corporation, Lear Corp. and United Technologies
Mike Osborne, Senior Vice President –
Corporate Development
•
Responsible for driving corporate and business unit strategic planning and
development, M&A activity, business development & customer
retention, and investor relations Steve Korwin, Senior Vice President
– Quality & Engineering
•
Extensive experience leading manufacturing operations and improving quality
processes to increase profitability and sales
Larry Brand, Vice President –
Corporate HR
•
Considerable experience providing strategic leadership and tactical direction for
the overall Human Resources function to senior management and company
leadership teams Mark
Schlei,
Chief
Financial
Officer
Gordon
Madlock,
Senior
Vice
President
–
Operations |
 8
Market Dynamics
Market Dynamics
Medical
Industrial &
Instrumentation
Military &
Aerospace
Computer
Automotive
Consumer
Communication
Electronics Market ($1.3 trillion)
Total 2010 EMS/ODM Outsourced Market:
$276 billion
2010 –
2013 Compounded Annual Growth Rate:
7.6%
Defense & Security
Navigation & Exploration
Medical
= business segment market focus
Highest growth
sector
No current
customers
Volume &
commodity pricing
resulting in low
margins
OEMs are experts
at outsourcing
High growth
High volume
production drives
lower margins
Outsourcing
mostly in low cost
country regions
Complexity is
general low
Moderate growth
High volume
production drives
lower margins
Outsourcing
mostly in low cost
country regions
OEMs are experts
at outsourcing
Moderate growth
High volume
production drives
lower margins
Outsourcing
mostly in low cost
country regions
OEMs are experts
at outsourcing
Source:
Technology Forecasters Inc, Dec. 2010
Market:
$15B
Growth:
9.3%
Market:
$6B
Growth:
6.2%
Market:
$20B
Growth:
6.6%
Market:
$10B
Growth:
12.9%
Market:
$44B
Growth:
7.8%
Market:
$84B
Growth:
6.8%
Market:
$98B
Growth:
3.1%
X
X
X
X |
 9
Vision
Vision
Sparton will become a $500 million revenue entity by
fiscal 2015 by attaining key market positions in our
primary lines of business and through complementary
and compatible acquisitions; and will consistently
rank in the top half of our peer group in return on
shareholder equity and return on net assets. |
 10
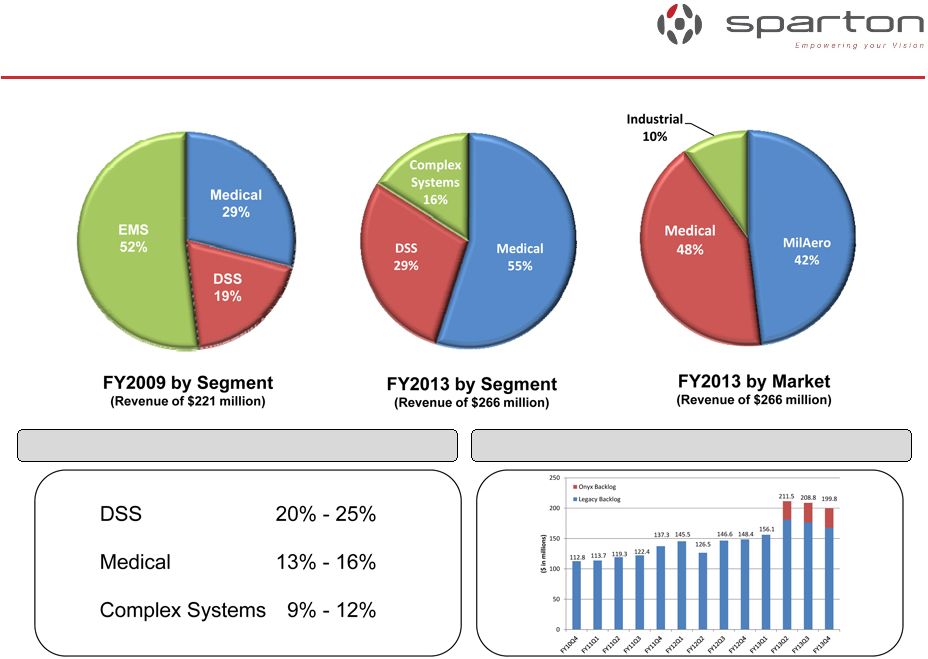
Backlog
Shifting Revenue Mix To
Shifting Revenue Mix To
Higher Margin Businesses
Higher Margin Businesses
FY2014 Target Gross Margin by Segment |
 11
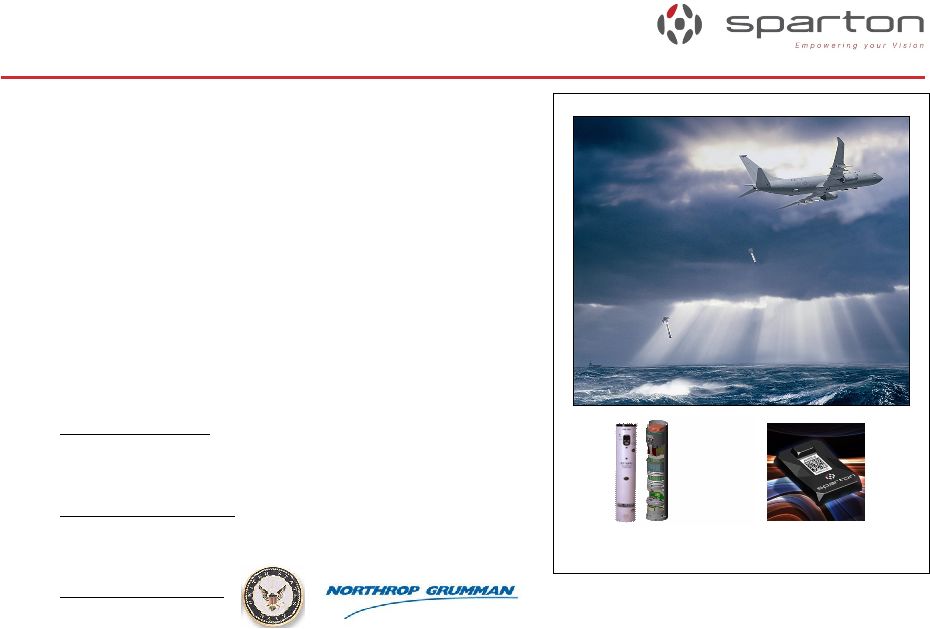
•
Develop, design, and manufacture security
products, primarily anti-submarine warfare
detection devices for the U.S. and other free-
world governments, and commercially
develop spin-off technology for existing and
alternate markets (Navigation & Exploration)
•
One of the two largest sonobuoy producers
–
Consumable device lasting approximately 8
hours used to detect submerged submarines
•
FY2013 Sales: $77 million, consistently
profitable business
•
Visible Business: $86 million in government
funded backlog as of June 30, 2013
•
Key Customers:
Defense & Security Systems
Defense & Security Systems
Sonobuoys
Navigation Sensors |
 12
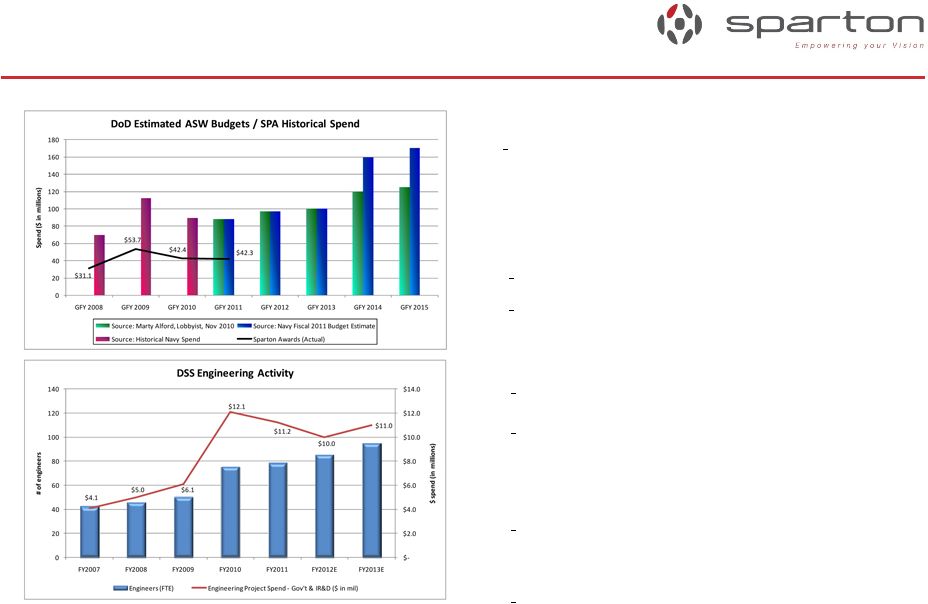
Defense & Security Systems
Defense & Security Systems
Market Outlook
Market Outlook
•
Government FY2009 production peak was realized primarily
in Sparton’s FY2011
•
Limited risk of a negative impact of sonobuoy sales to the
U.S. Navy if sequestration occurs
•
Foreign sales are still somewhat unpredictable although a
sharp increase was seen in the 2
nd
quarter of FY2010 & 1
st
nine months of FY2012
•
The Boeing P-8 Poseidon aircraft to become the new
launch vehicle for sonobuoys
Reduced U.S. Navy sonobuoy production volume in Sparton’s
FY2012 will be partially offset by the pursuit of new
developmental engineering funds from the DoD for Antisubmarine
Warfare related applications ($37 million over 5 years of
engineering funds already announced)
Anti-Submarine Warfare budget line item is less than $250
million
Budget is a small fraction of the cost of a single ship
Continued military actions taken by North Korea and China
should have an impact in the use of sonobuoys in that region
The leak of government sensitive information may also put
foreign nations on guard and require more monitoring of their
territorial waterways
U.S. Navy plans to buy 117 P-8A anti-submarine warfare, anti-
surface warfare, intelligence, surveillance and reconnaissance
aircraft to replace its existing P-3 fleet. Initial operational
capability is scheduled for 2013.
The Indian navy signed a contract for eight P-8I aircraft in
January 2009. Boeing will deliver the first P-8I within 48 months
of contract signing and the remaining seven by 2015.
|
 13
Medical
Medical
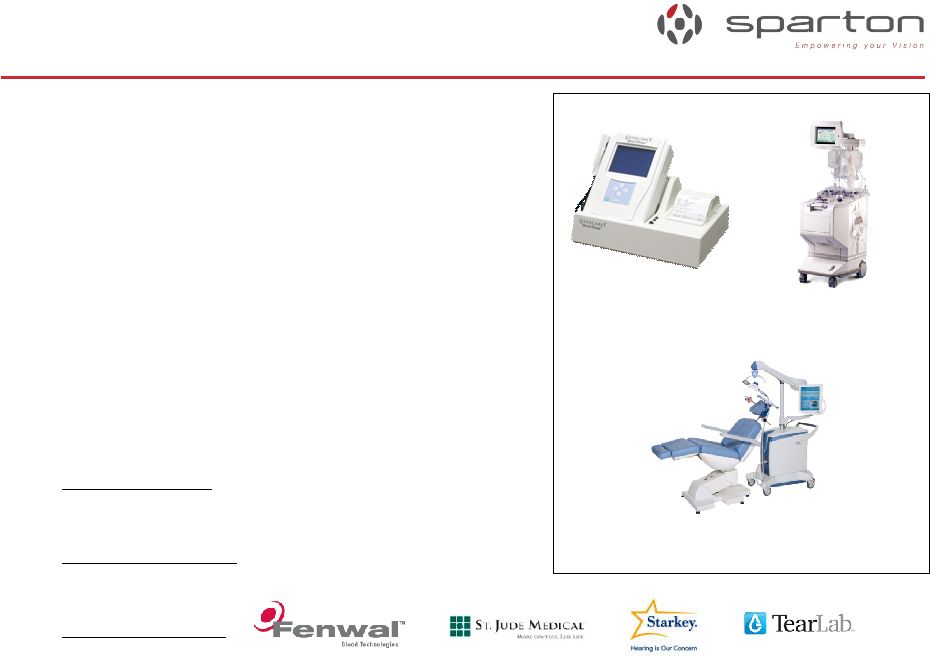
•
Design and manufacture medical devices
and instruments for the In Vitro Diagnostics
and Therapeutics Device markets
•
Work with OEMs and biomedical companies to
interface their core technology into a complex medical
laboratory instrument or point of care device
•
Manufacturer of The NeuroStar®
TMS Therapy
System, the first and only Transcranial Magnetic
Stimulation (TMS) device cleared by the FDA for the
treatment of depression
•
Recurring revenue due to highly regulated
medical industry
•
FY2013 Sales: $147 million of consistently
profitable business
•
Visible Business: $75 million of backlog as of
June 30, 2013
•
Key Customers:
Analyzers
Neurology
Blood Separation |
 14
Complex Systems
Complex Systems
•
Manufacturer of circuit card assemblies and
electronic based box build products primarily
for the military and commercial aerospace
markets
•
New prototyping capabilities to shorten
development and introduction lead times for
customers
•
Consolidated business from old and
inefficient sites to state-of-the-art and
technologically advanced facilities in Florida
and Viet Nam for improved efficiencies and
capacity utilization
•
FY2013 External Sales: $42 million
•
Visible Business: $40 million of backlog as of
June 30, 2013
•
Key Customers:
Circuit Board
Assembly
Sub Assembly
Complete System
Box Build |
 15
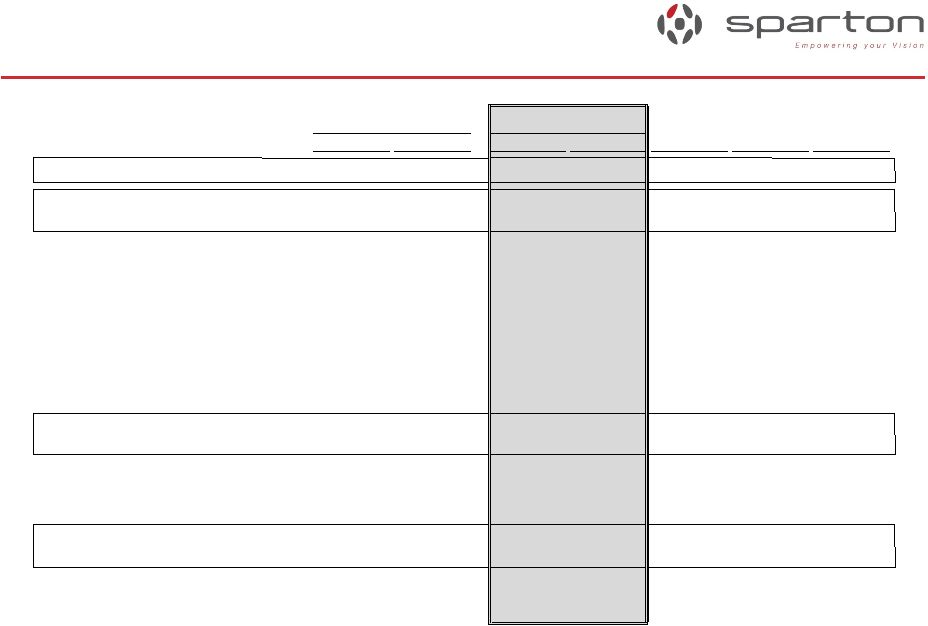
Strategic Direction
Strategic Direction
Growth Planning by Segment
Growth Planning by Segment
Vision:
Sparton will become a $500 million revenue entity with 10% EBITDA margins by fiscal
2015 by attaining key market positions in our primary lines of business and
through complementary and compatible acquisitions; and will strive to be
consistently ranked at the top of our peer group in return on shareholder
equity and return on net assets. Navigation & Exploration
Medical
Defense & Security
Complex Systems
Develop new Navigation System and
Acoustic Detection & Communication
products
for existing and new markets
such
as Defense, Port Security, Oil & Gas, and
Advanced Security Systems.
Continue to lead in Anti-Submarine Warfare
(ASW) device production and related
advanced developmental engineering
projects for the U.S. government.
Continue to make business enhancements to
improve its return on sales by engaging new
and existing customers on contract design
and manufacturing.
Improve market share within the In Vitro
Diagnostics and Therapeutic Device markets
through geographic expansion and new &
increased vertical offerings.
Pursue complementary and
compatible acquisitions
including B2B products and
other services.
Pursue complementary and
compatible acquisitions
including B2B products and
other services that do not
directly compete with our
customers. |
 16
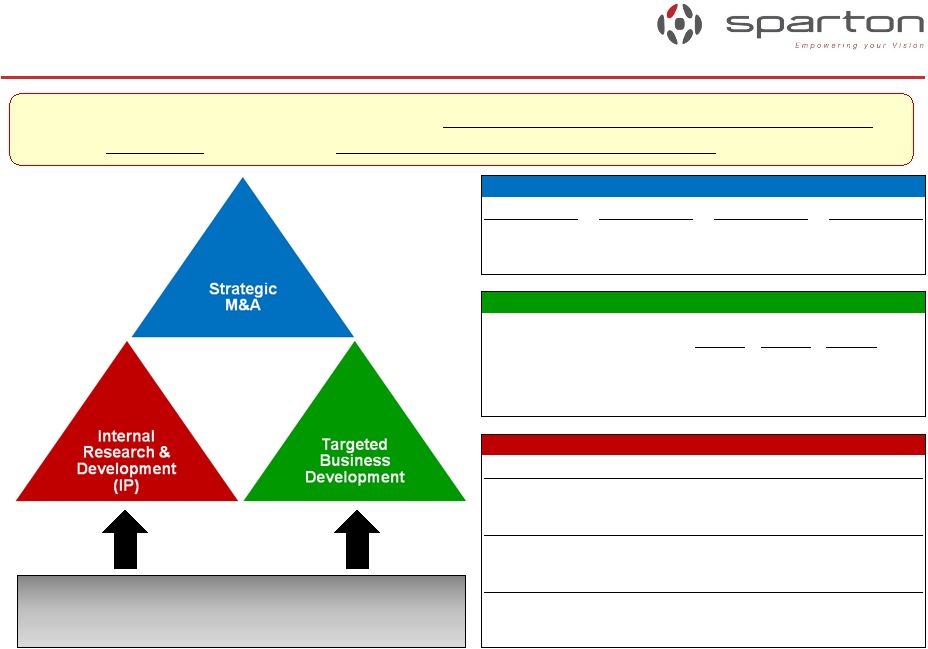
Growth Investments
Growth Investments
Summary
Summary
Focus:
Use
growth
investments
to
achieve
sustainable
year-over-year
revenue
and
profit
increases
and
to
further
place
protective
barriers
around
Sparton.
Supported by market research & go-to-
market programs
New Programs
New Customers
Potential Annualized Revenue
17.7
$
Internal Research & Development
Fiscal 2011
Gyro-enhanced digital compass
Hydrophone
Fiscal 2012
AHRS-8
Temperature compensated attitude heading reference system
Fiscal 2014
IMU-10
Harsh environment inertial sensing system
39.4
$
FY12
28
20
23.8
$
Acquisitions
New Business Awards
FY13
71
12
FY11
14
79
Fiscal 2014
Aydin Displays
Fiscal 2013
Onyx EMS
Creonix
Fiscal 2012
None
Fiscal 2011
Delphi Medical
Byers Peak
GEDC-6
PHOD-1 |
 17
•
Creonix
–
Closed transaction on June 6, 2013
–
Manufactures complex electromechanical devices and engineers and
manufactures
cables and wire harnesses for the Industrial and Military & Aerospace
markets –
$12 million of revenue
–
Purchase inventory and equipment for $2.1 million
–
Consolidating into the Brooksville location by the end of December
•
Aydin Displays
–
Closed transaction on August 30, 2013
–
Develops enhanced flat panel display and touch-screen solutions with
application- critical performance criteria for the Military &
Aerospace and Civil Marine. –
$18 million of revenue
–
$15 million purchase price plus a potential $6.6 million earnout
within 12 months
–
Financials reported within DSS segment
Acquisition Updates
Acquisition Updates |
 18
Financial Highlights
Financial Highlights |
 19
•
Awarded a total of 71 new business programs in our contract services
business with potential annualized sales of $39 million.
•
Completed the acquisition of certain assets of Creonix, LLC and Onyx
EMS, LLC. Onyx had net sales of $31.2 million, adjusted operating
income of $0.1 million and adjusted EBITDA of $3.3 million.
•
Quarter end sales backlog of approximately $200 million, including
approximately $32 million from the Company’s newly acquired business.
•
Added to the Russell 2000 Index.
•
Entered into a new five year banking agreement with BMO Harris Bank
providing $65 million of committed credit facilities.
•
Recognized a $2.1 million income tax benefit with respect to the
Company’s investments in and advances to its 100% owned Canadian
subsidiary.
Fiscal 2013 Highlights
Fiscal 2013 Highlights |
 20
Consolidated Financial Results
Consolidated Financial Results
Fiscal 2013
Fiscal 2013
(Adjusted)
(Adjusted)
(Adjusted)
2013
2012
2013
2012
Net Sales
$ 266,015
$ 223,577
$ 266,015
$ 223,577
$ 42,438
$ 31,189
$ 11,249
Gross Profit
45,602
38,502
46,168
38,396
7,772
4,381
3,391
17.1%
17.2%
17.4%
17.2%
14.0%
Selling and Administrative Expense
26,451
22,232
26,451
22,232
(4,219)
2,495
(1,724)
9.9%
9.9%
9.9%
9.9%
Internal R&D Expense
1,300
1,293
1,300
1,293
(7)
-
(7)
Amortization of intangible assets
1,575
435
1,575
435
(1,140)
1,198
58
Restructuring/impairment charges
55
(68)
-
-
-
-
-
Other operating expense, net
13
65
13
65
52
-
52
Operating Income
16,270
14,545
16,829
14,371
2,458
688
1,770
6.1%
6.5%
6.3%
6.4%
2.2%
Income Before Provision For Income Tax
16,401
14,586
16,960
14,285
2,675
688
1,987
Provision For Income Taxes
2,963
5,078
5,015
4,973
(42)
227
(269)
Net Income
$ 13,638
$ 9,508
$ 11,945
$ 9,312
$ 2,633
$ 461
$ 2,172
5.1%
4.3%
4.5%
4.2%
Income per Share (Basic)
$ 1.34
$ 0.93
$ 1.17
$ 0.92
$ 0.25
$ 0.25
Income per Share (Diluted)
$ 1.33
$ 0.93
$ 1.17
$ 0.91
$ 0.26
$ 0.26
($ in 000’s, except per share)
(adjusted removes certain gains and charges, including imputing taxes at 32%
effective rates for FY2013 and FY2012, respectively) Onyx
Legacy YoY
Variance
(Reported)
(Adjusted)
Fiscal ended June 30,
Fiscal ended June 30,
Total YoY
Variance |
 21
Consolidated Financial Results
Consolidated Financial Results
Adjusted EBITDA
Adjusted EBITDA
2013
2012
Net Income
$ 13,638
$ 9,508
$ 4,130
Interest expense
518
696
(178)
Interest income
(102)
(94)
(8)
Provision for income taxes
2,763
5,078
(2,315)
Depreciation and amortization
4,761
1,814
2,947
Restructuring/impairment charges
55
(68)
123
Gain on acquisition
(62)
- (62)
Gross profit effect of acquisition¹
566
- 566
Gross profit effect of acquisition²
- (106)
106
Gain on sale of investment
- (127)
127
Adjusted EBITDA
$ 22,137
$ 16,701
$ 5,436
8.3%
7.5%
Onyx adjusted EBITDA
$ 3,291
$ -
$ 3,291
Adjusted EBITDA without Onyx
$ 18,846
$ 16,701
$ 2,145
8.0%
7.5%
1 - Gross profit effect of capitalized profit in inventory from acquisition
2 - Gross profit effect of acquisition contingency settlement
Fiscal ended June 30,
YoY
Variance |
 22
Quarterly Adjusted EPS
Quarterly Adjusted EPS
Diluted
Diluted |
 23
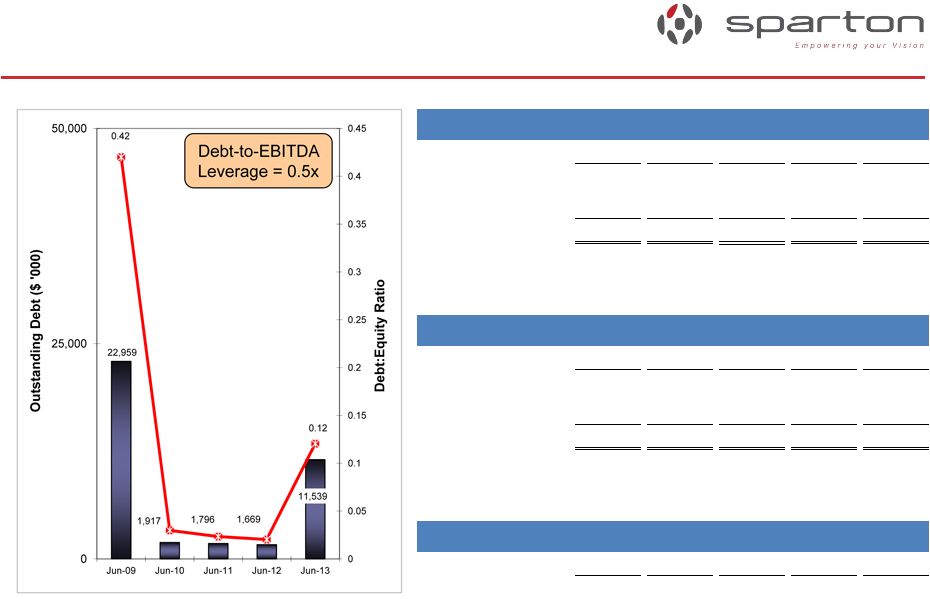
Liquidity & Capital Resources
Liquidity & Capital Resources
($ in '000)
Jun-12
Sep-12
Dec-12
Mar-13
Jun-13
Cash and equivalents
46,950
43,096
6,066
4,358
6,085
LOC Availability
16,277
16,012
51,000
52,000
55,000
Total
63,227
59,108
57,066
56,358
61,085
($ in '000)
Jun-12
Sep-12
Dec-12
Mar-13
Jun-13
Credit Revolver
-
-
14,000
13,000
10,000
IRB (Ohio)
1,669
1,637
1,604
1,572
1,539
Total
1,669
1,637
15,604
14,572
11,539
($ in '000)
Jun-12
Sep-12
Dec-12
Mar-13
Jun-13
Net Inventory
35,102
38,467
45,367
46,928
46,334
Cash Availability
Debt
Inventory |
 24
•
Implementation of the strategic growth plan
–
Continue to grow organically
–
Maintain our level of investment in internal research & development to
commercially extend our product lines
–
Continue to enable our engineering workforce to develop new and innovative
proprietary solutions for our end markets
–
Continue to seek out complementary and compatible acquisitions
–
Further leverage Viet Nam as a low cost country alternative and in-region
provider •
Focus on sustained profitability
–
Continue margin improvements across the entire company
–
Increase capacity utilization
–
Continue additional improvements in operating performance through lean and quality
efforts
•
Complete the integration of Creonix and Aydin Displays
Fiscal 2014 Outlook
Fiscal 2014 Outlook |
 25
Sparton Corporation
NYSE: SPA
Cary Wood, President & CEO
425 N. Martingale Road
Suite 2050
Schaumburg, IL 60173 |